
HISTORY OF OPPORTUNITIES
MARKET UPDATE
You can scroll to read the usual update as well. As the written version is the exact same as the video.
Timestamps for video:
Overview: 0:00min
Corn: 5:05min
Beans: 9:10min
Wheat: 14:35min
Cattle: 15:40min
Want to talk about your situation?
(605)250-3863
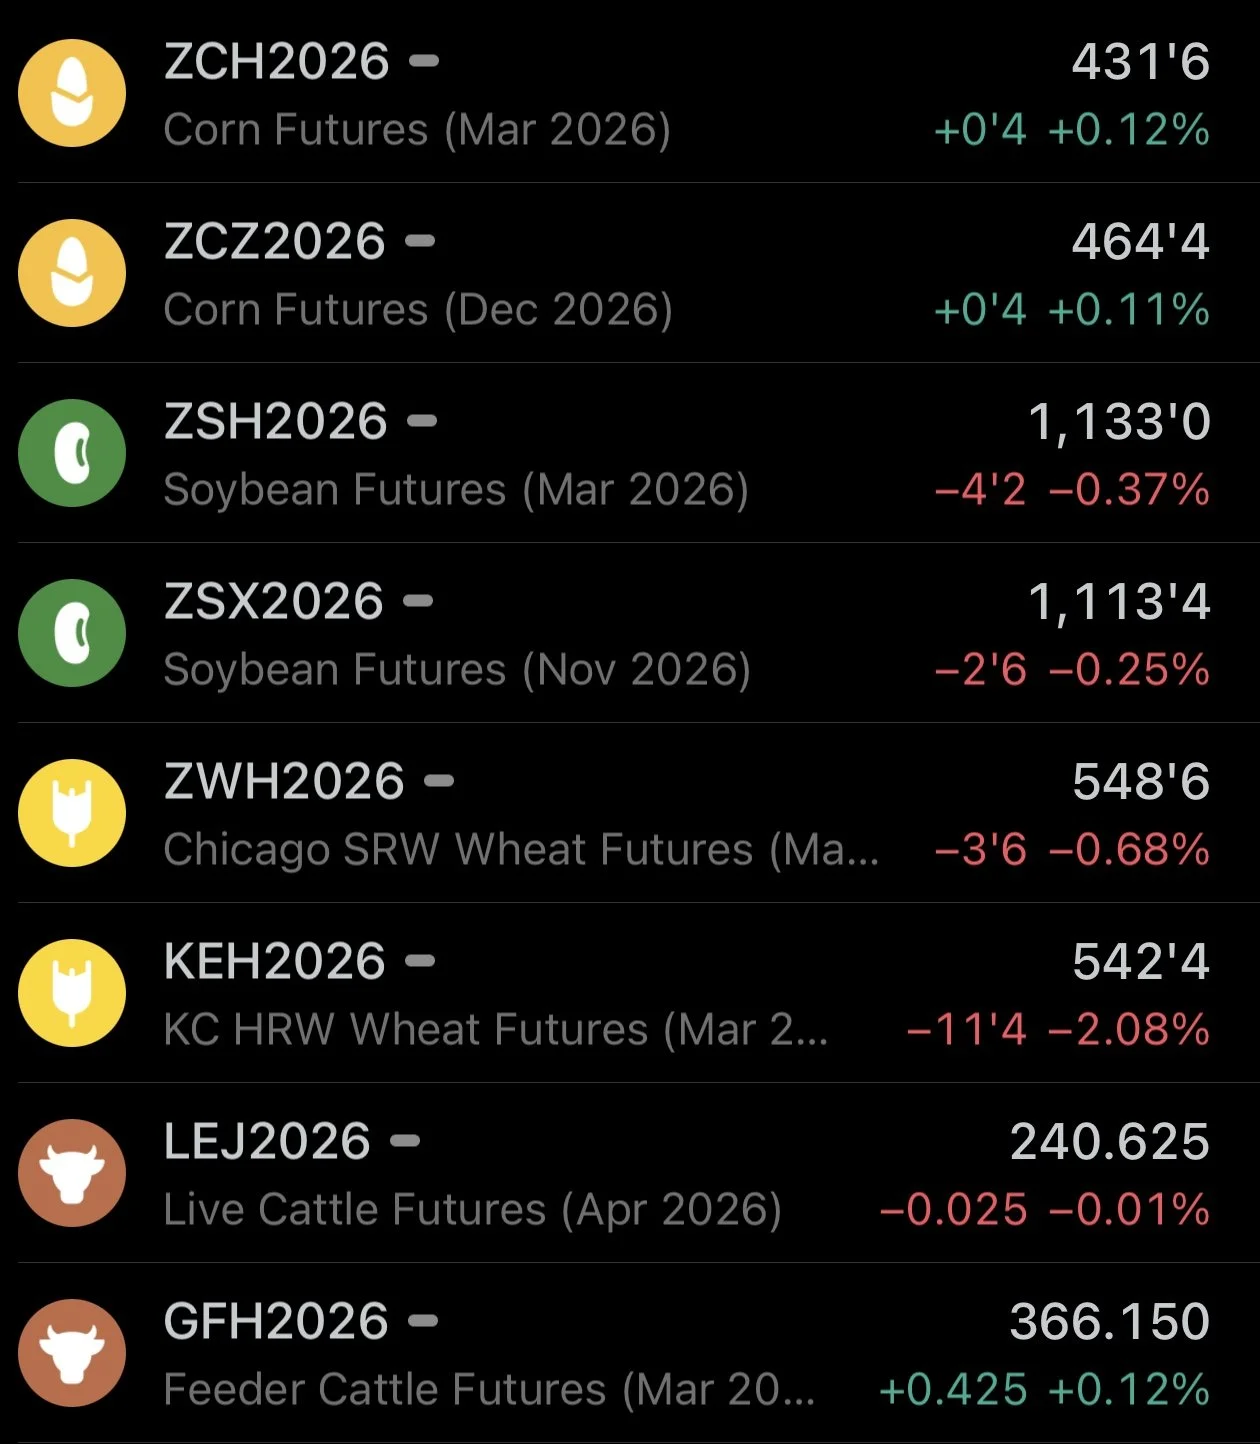
Futures Prices Close
Overview
Grains end the week on the softer side. Today's action was largely viewed as some profit-taking heading into the 3-day weekend.
It was a strong week, so seeing profit taking shouldn’t come as a surprise.
On the week:
March Corn: +1 1/2
March Beans: +17 3/4
March Wheat: +19
March KC: +11 1/4
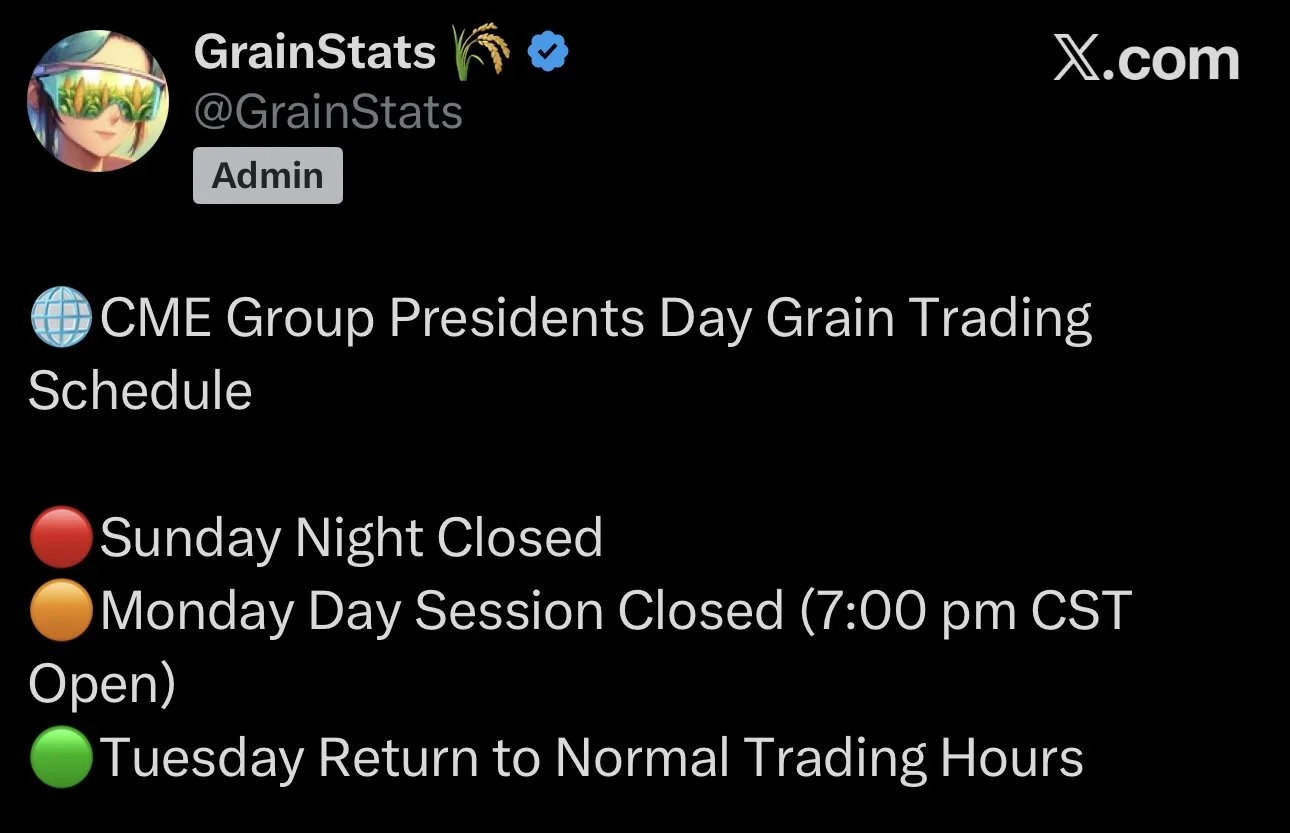
The markets will be closed on Monday for Presidents Day.
Yesterday the soybean market traded to their highest levels since November meanwhile the wheat market traded to 6-month highs.
Why?
The wheat market rally feels like it's simply been money flow and short covering. There are some slight weather stories in areas such as Russia being cold, but overall there isn’t any story that explains the size of rally we've seen. There doesn’t always have to be a fundamental reason behind a rally. If the funds want to cover, they can.
Soybeans continue to run higher with the market anticipating China buying more soybeans.
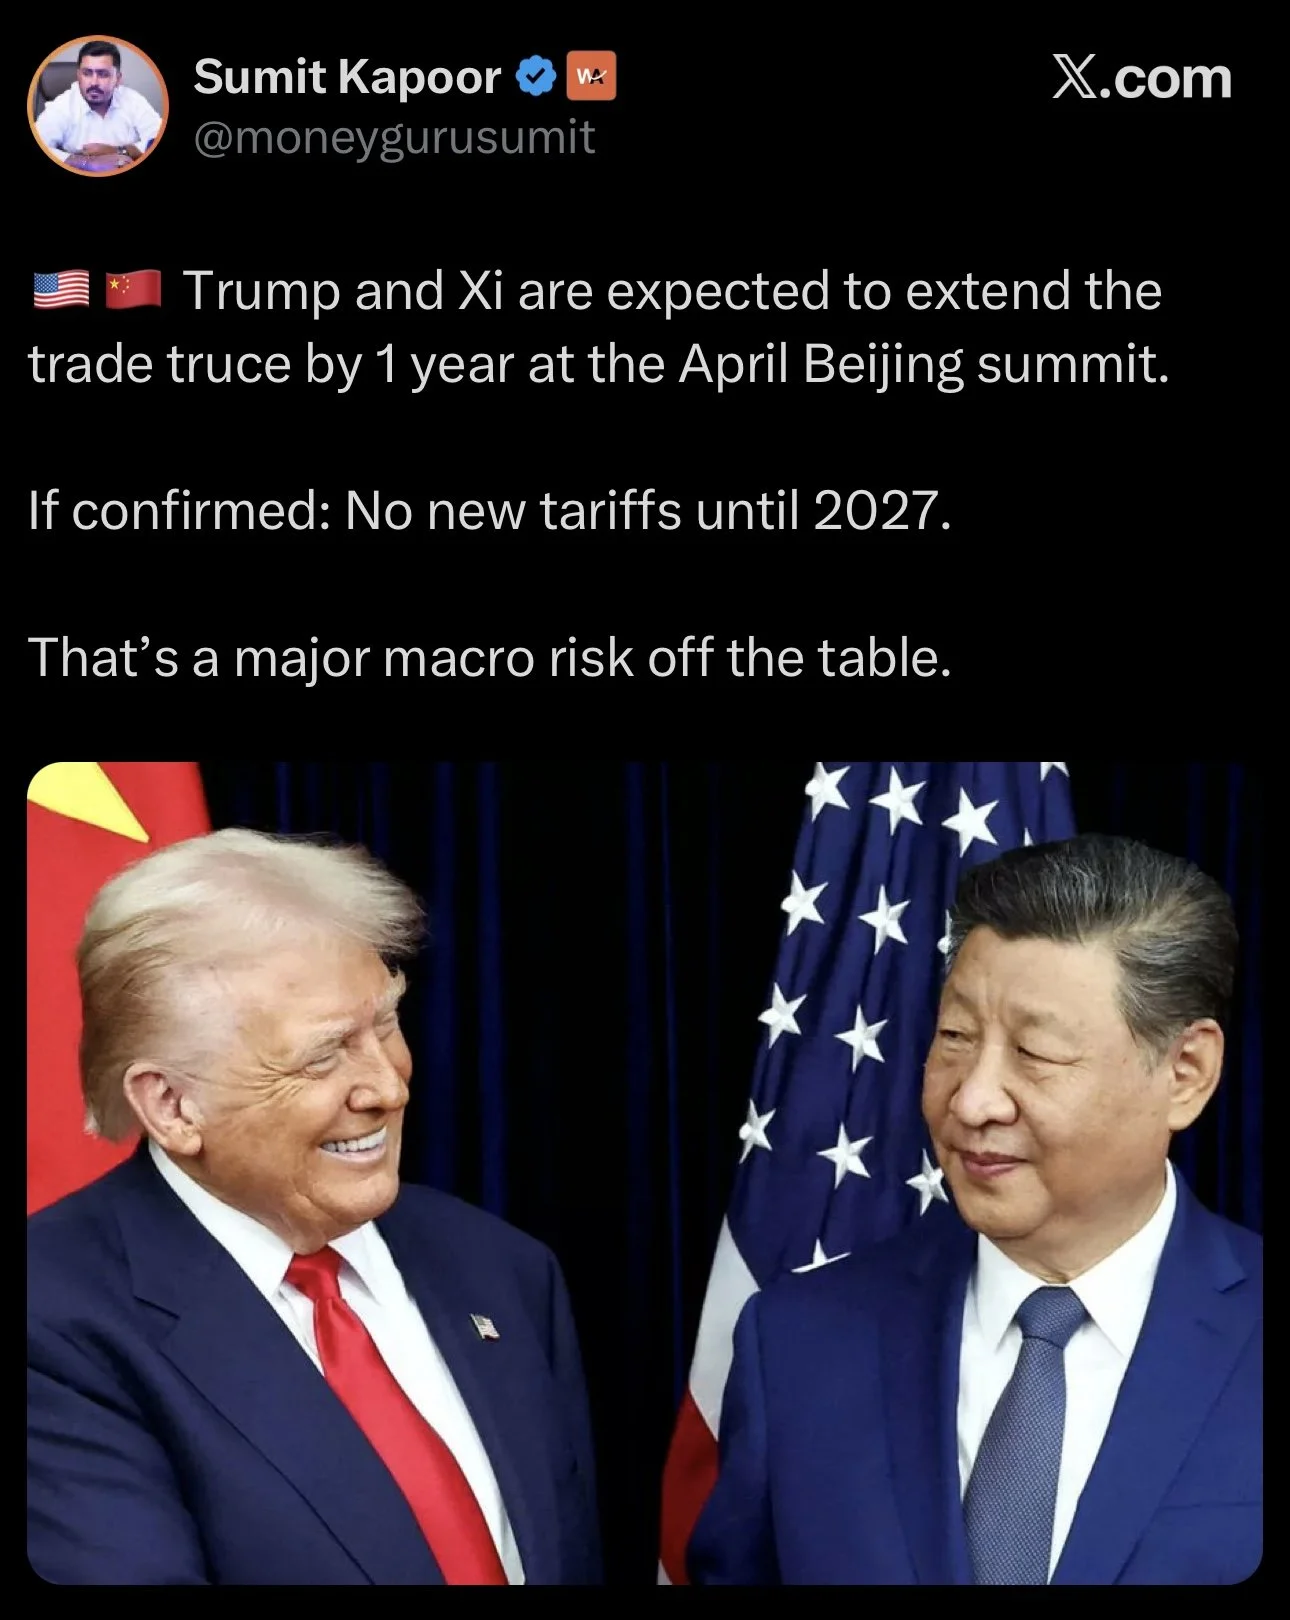
Yesterday we then received news that Trump was expected to extend his truce with China by another year when they meet in April. So this was a big part behind yesterday's strong price action.
Re-Visit Insurance Prices?
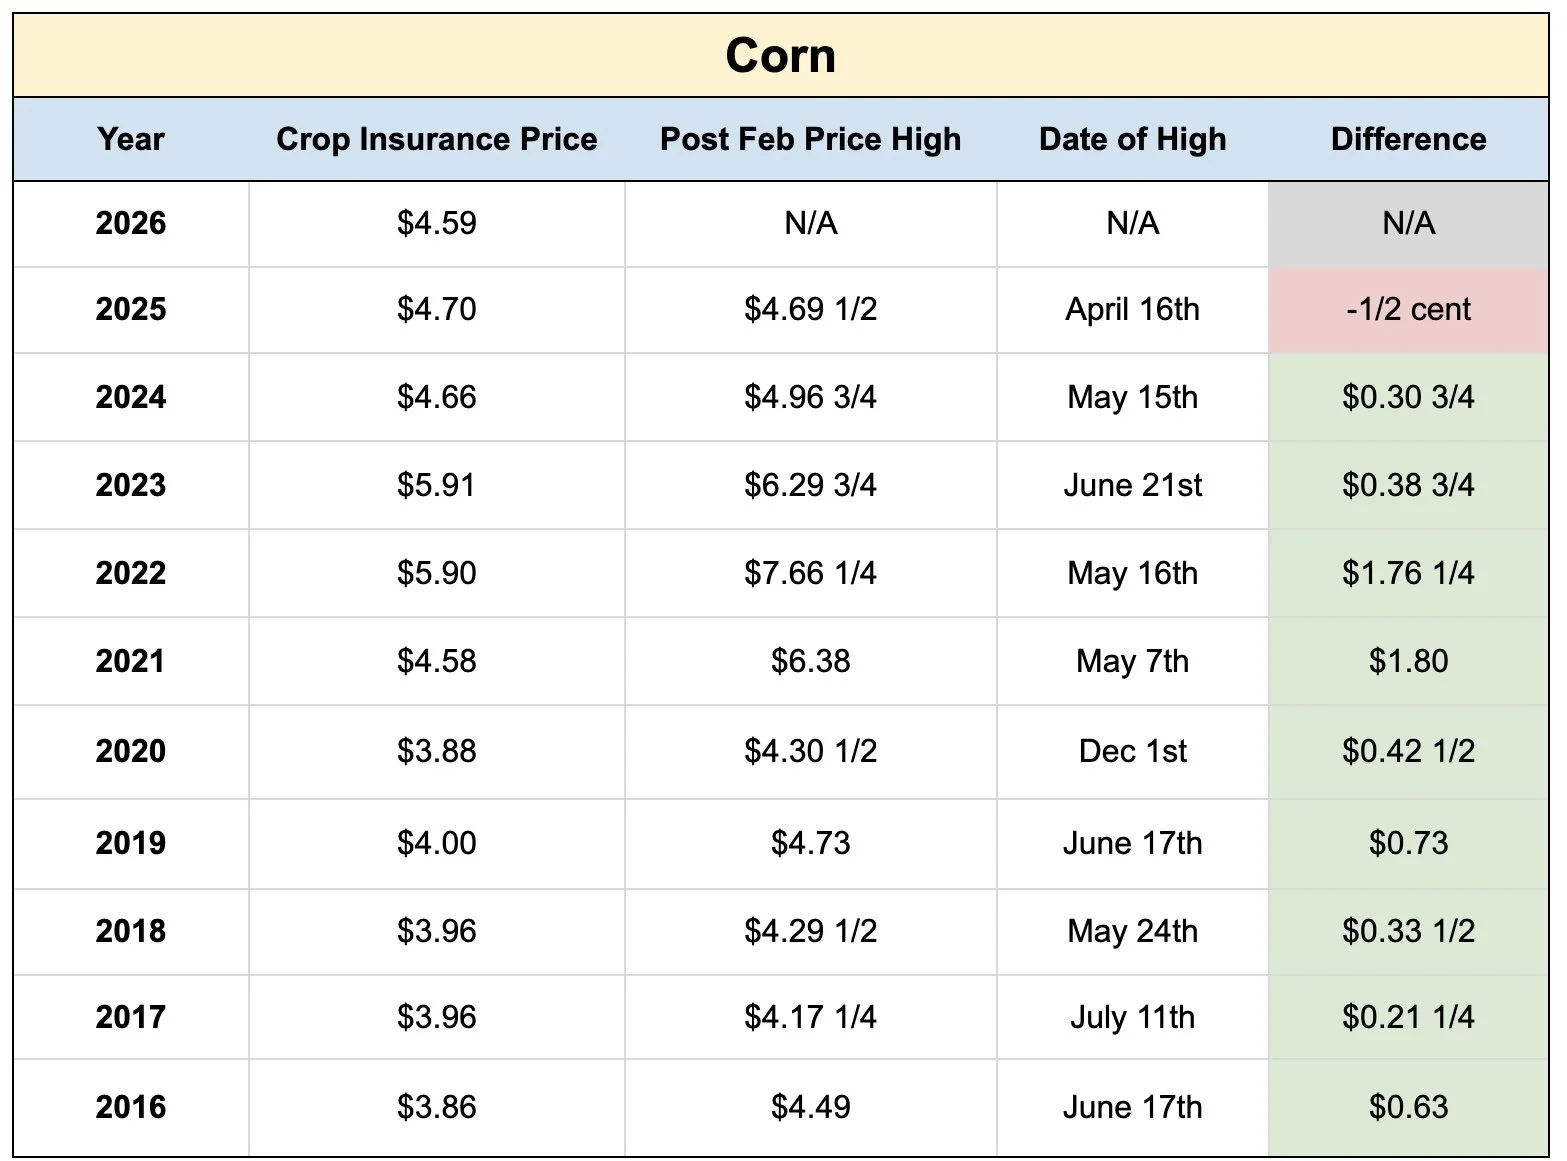
The current crop insurance prices as of today are:
Corn: $4.59
Soybeans: $10.96
(The average trade for the month of February)
How often do we revist these insurance prices at some point during the year?
Let's dive into the numbers quick.
First for corn.
In the last decade, there has only been one year where we did not eventually come back and trade that insurance price and our average price for the month of February.
That one year was last year. Where we missed the insurance price by just 1/2 a cent on that April rally.
Outside of that, every year featured a move beyond that insurance price.
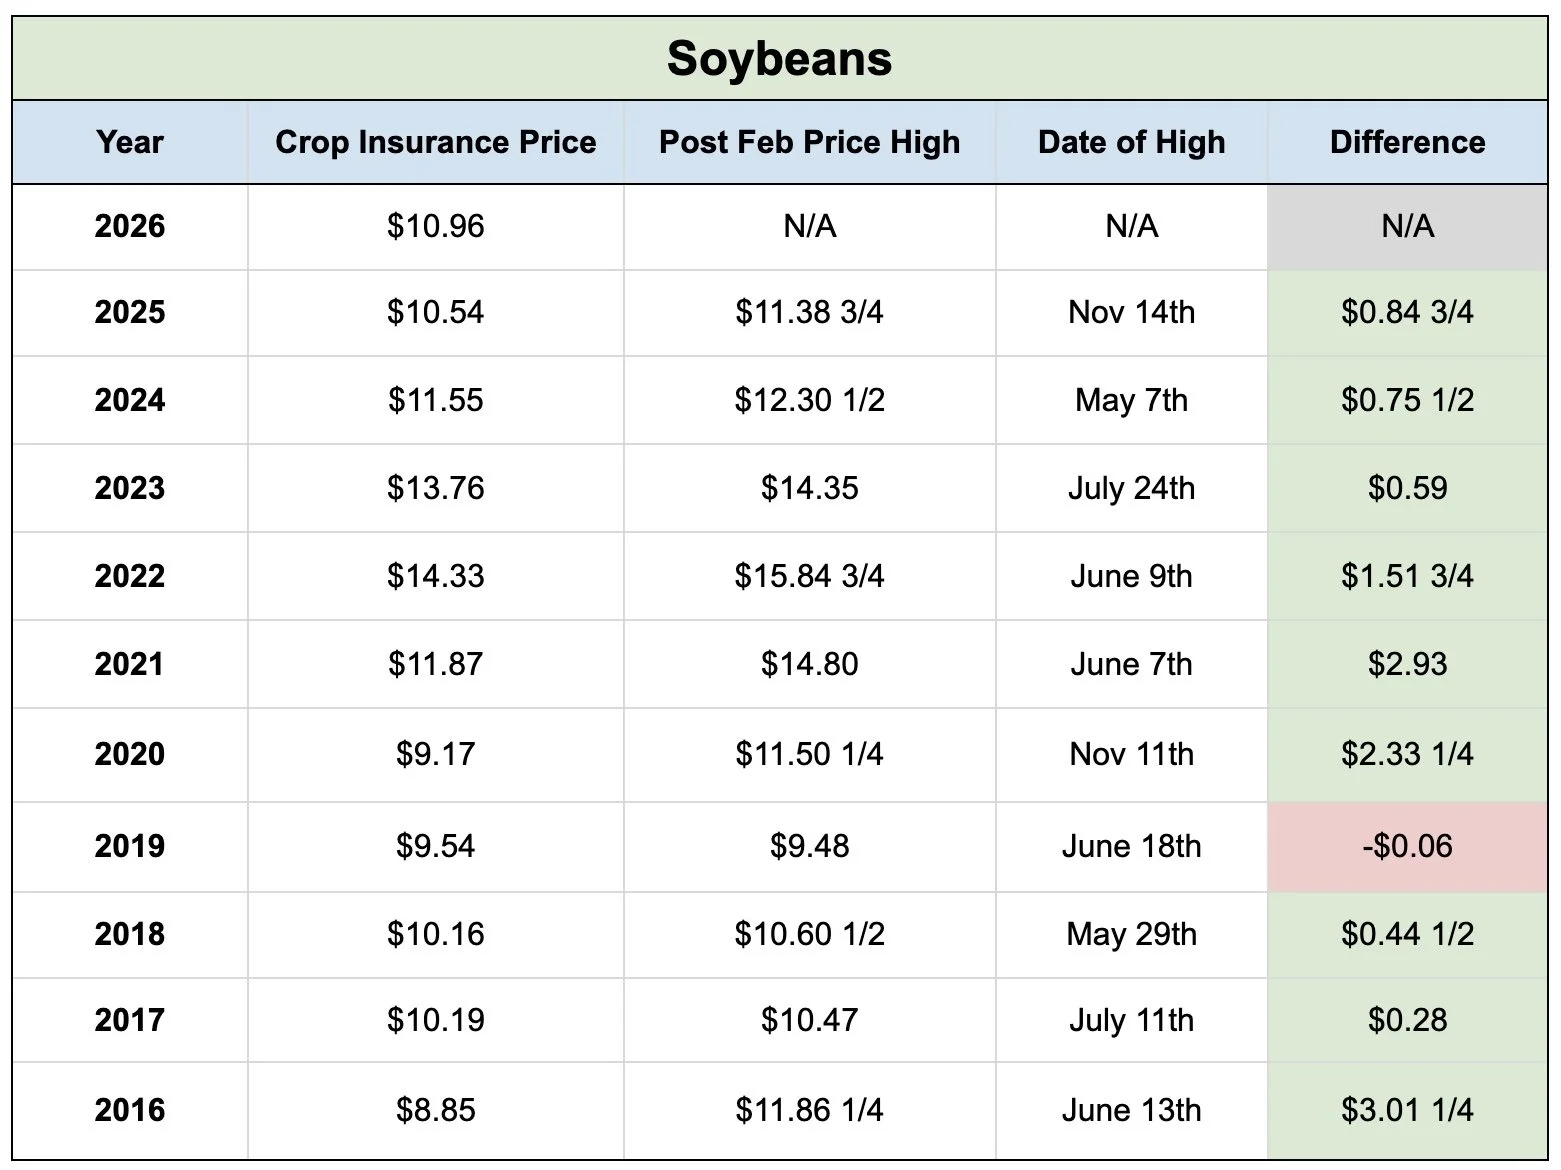
Soybeans show a similar set of data.
10 of the last 11 years resulted in us revisiting those insurance prices as well.
The only year we did not was 2019. Where we missed it by just -6 cents.
So more often than not, both corn and beans usually do revist those prices we set in February.
Highs by Month
That brings us to our next topic.
When does the market typically provide that opportunity?
This is why we do like being more patient on new crop.
We've went over this data several times in the corn and soybean market, but I threw the wheat market into this data as well.
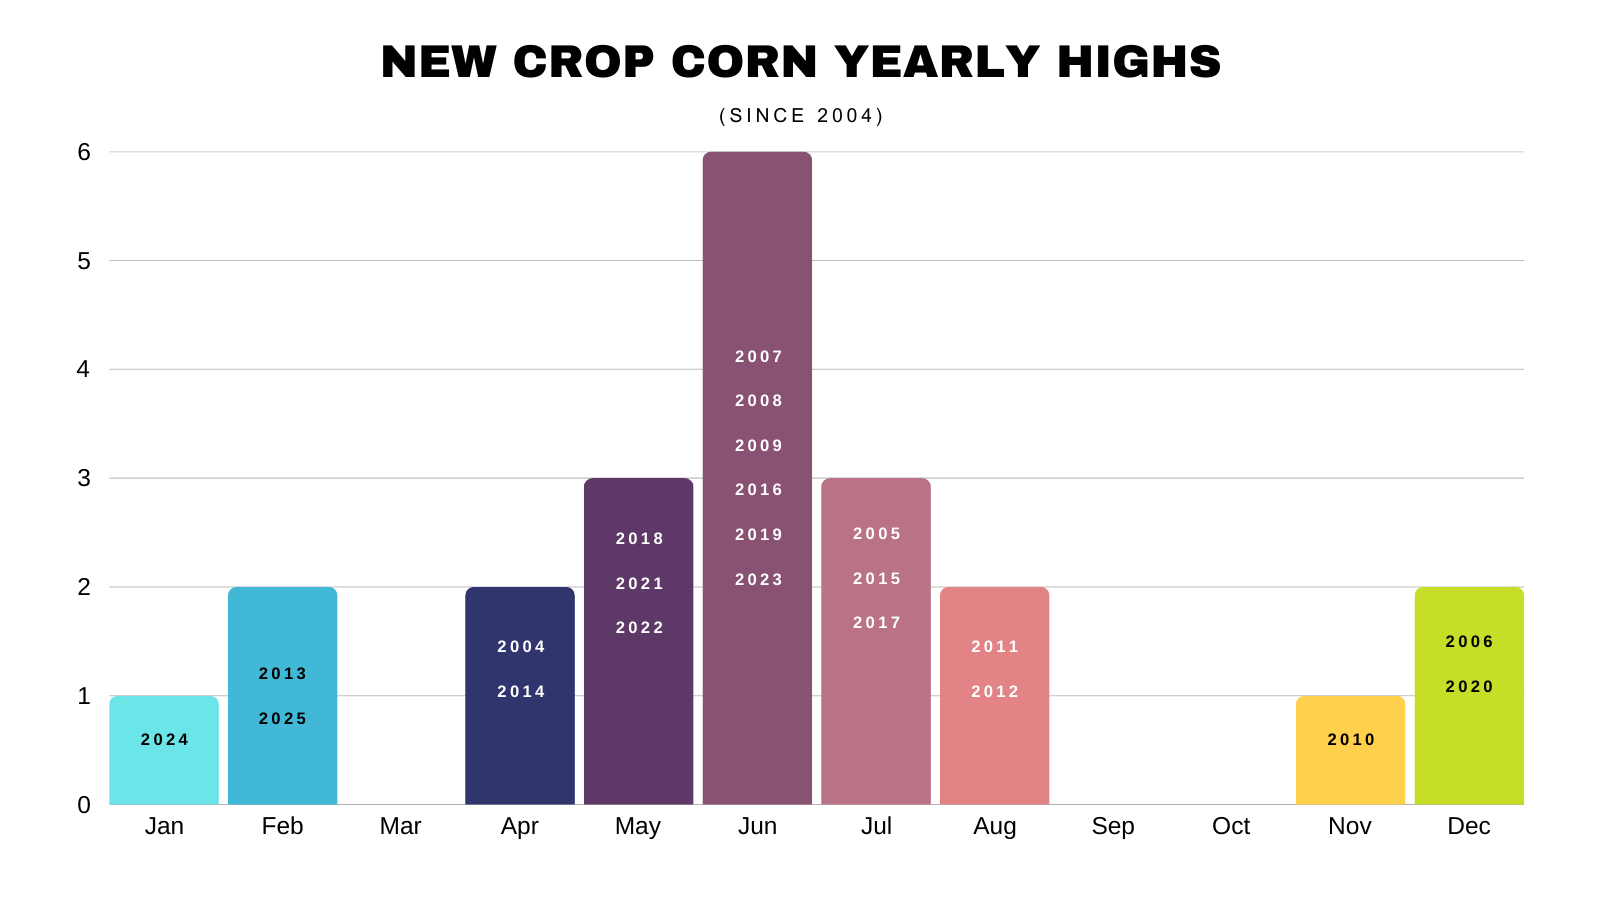
Corn has the strongest tendency to follow seasonals out of all of the grains. Since the US dominates the global market, it pretty much just revolves around our growing season.
Which is why the market often provides an opportunity during growing season, when the market is unsure of that supply.
12 of the last 22 years the high came between May and July.
The last two years were 2 of the only 3 that came before April.
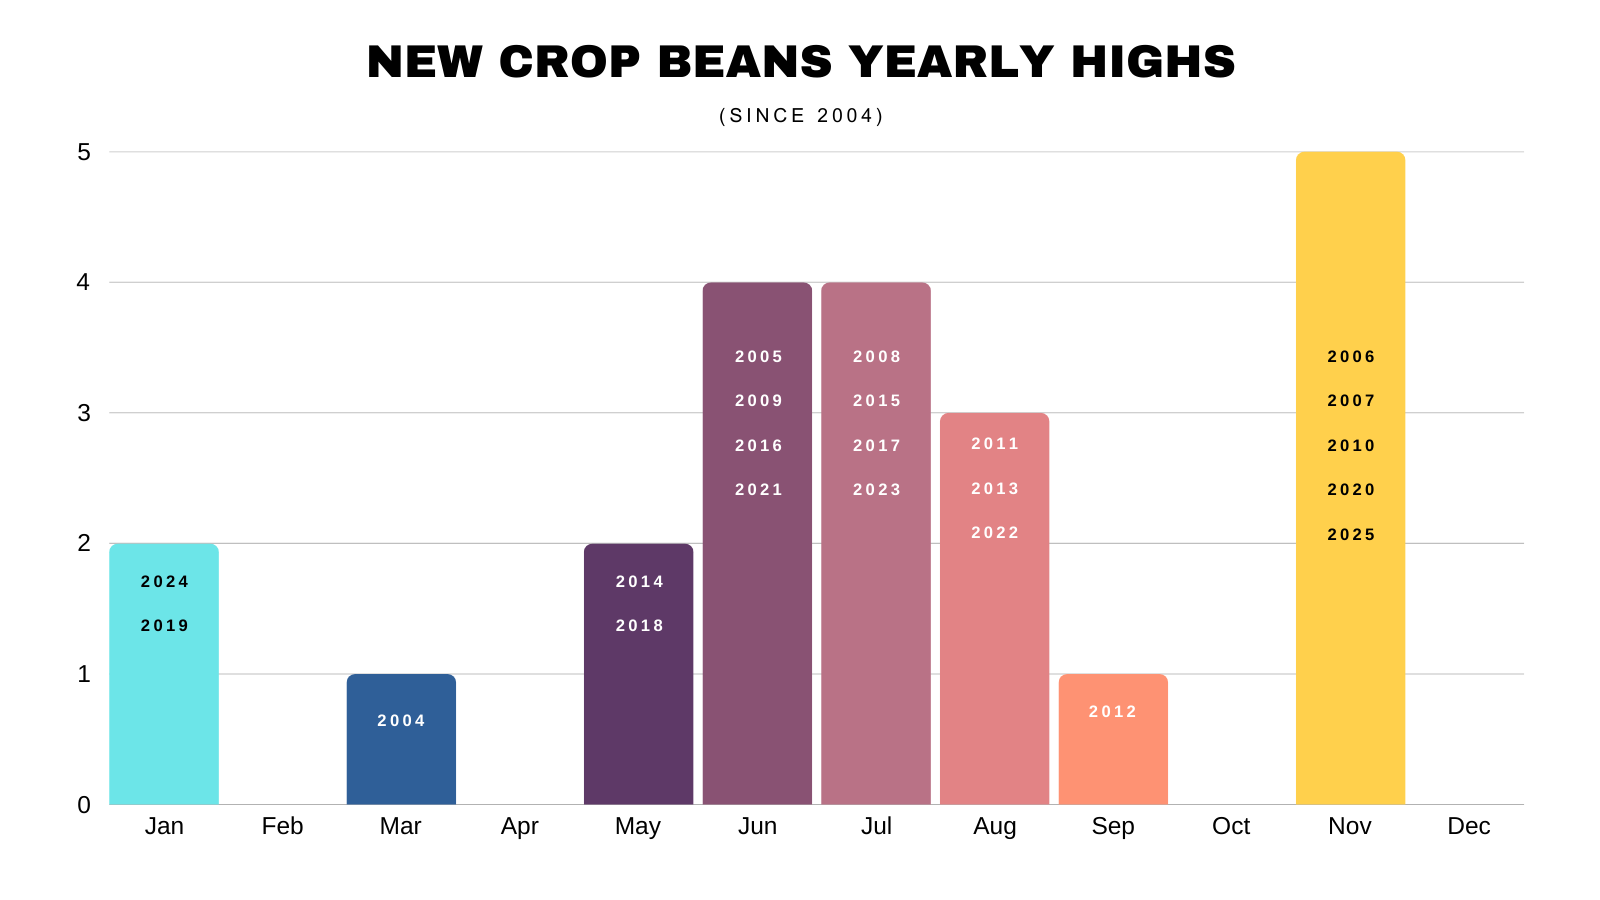
Soybeans show a strong seasonal tendency heading into the growing season as well.
Along side with some years offering the opportunity in November instead.
Which we saw last year.
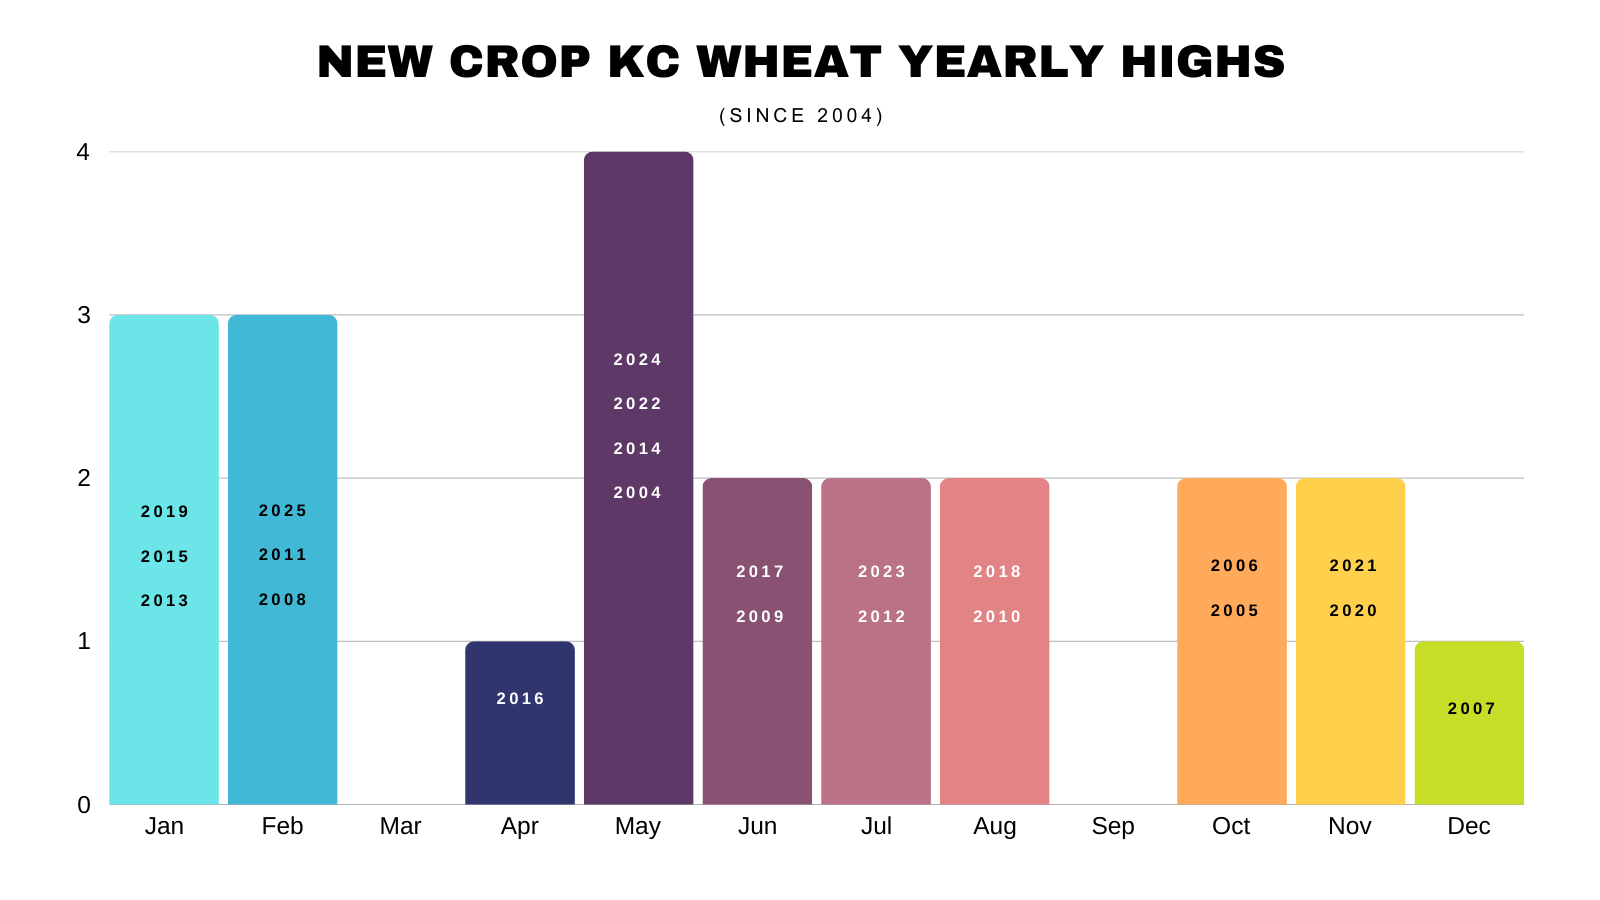
The wheat market is the market that least follows seasonal patterns.
We've posted our highs in almost every single month of the year.
Because someone around the world is always growing wheat.
May slightly edges out January and February. As there have been several years where the wheat market simply trickled lower the entire year
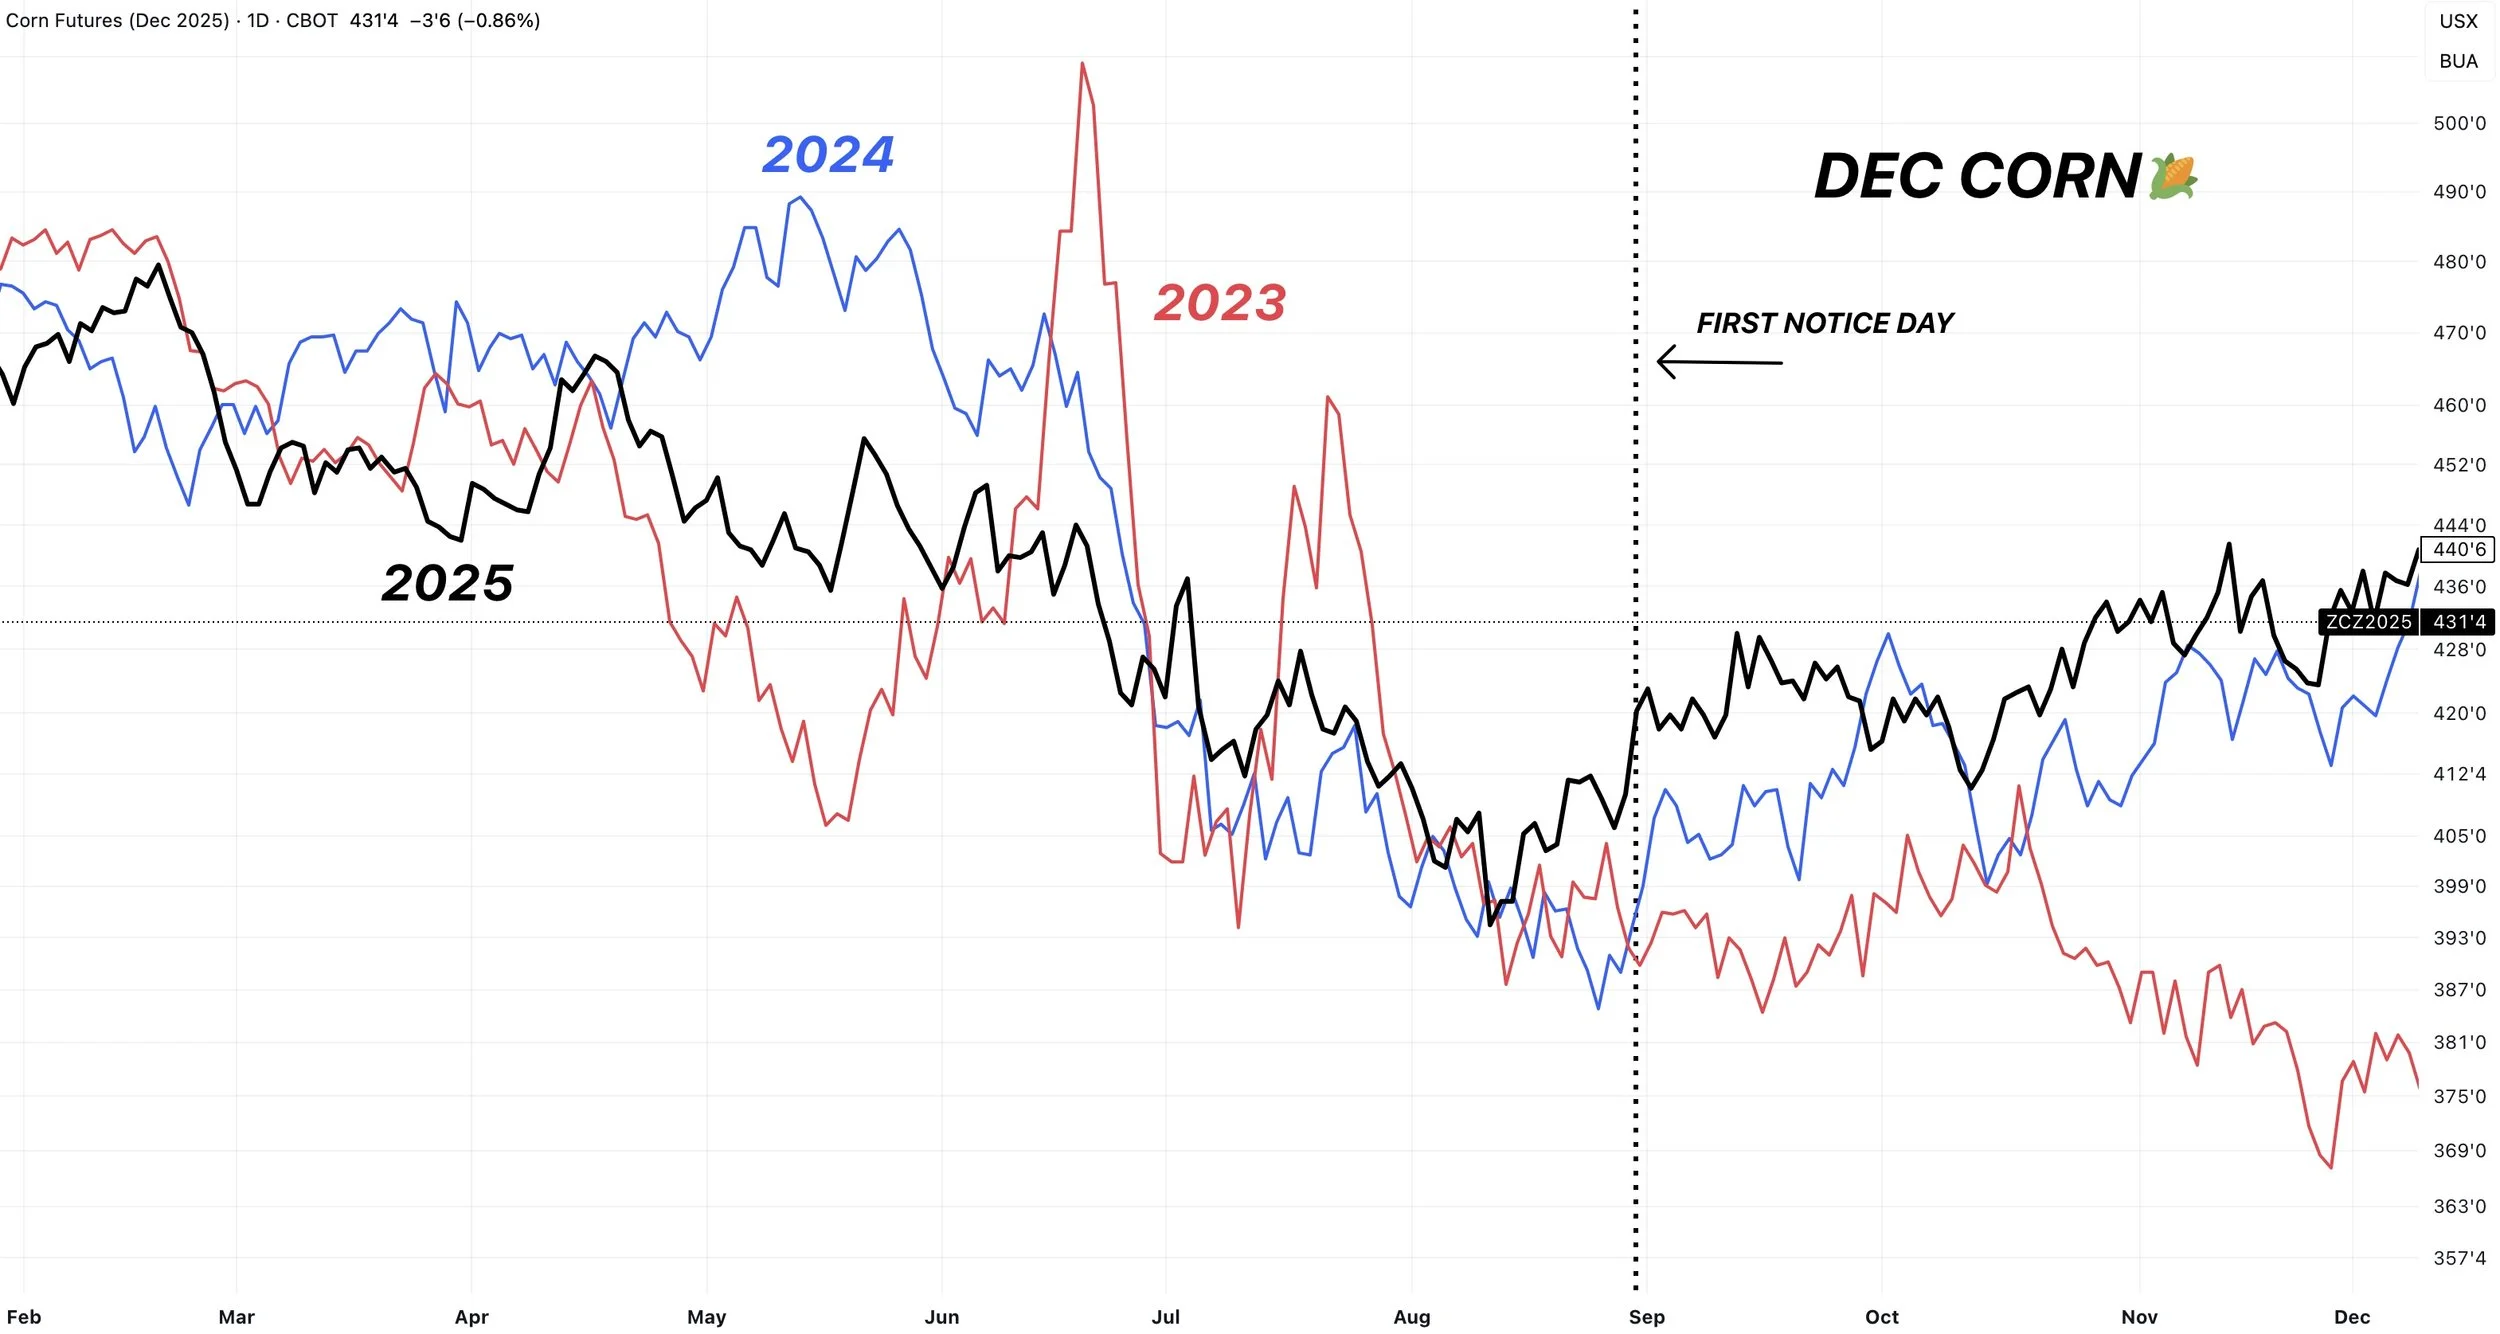
First Notice Day Pressure?
This has been a big topic of discussion from us recently.
The fact that first notice day often pressures the corn market.
For reference, here is a chart that shows September first notice day.
The last 3 years in a row, this market found a bottom right around first notice day following that sell off heading into harvest.
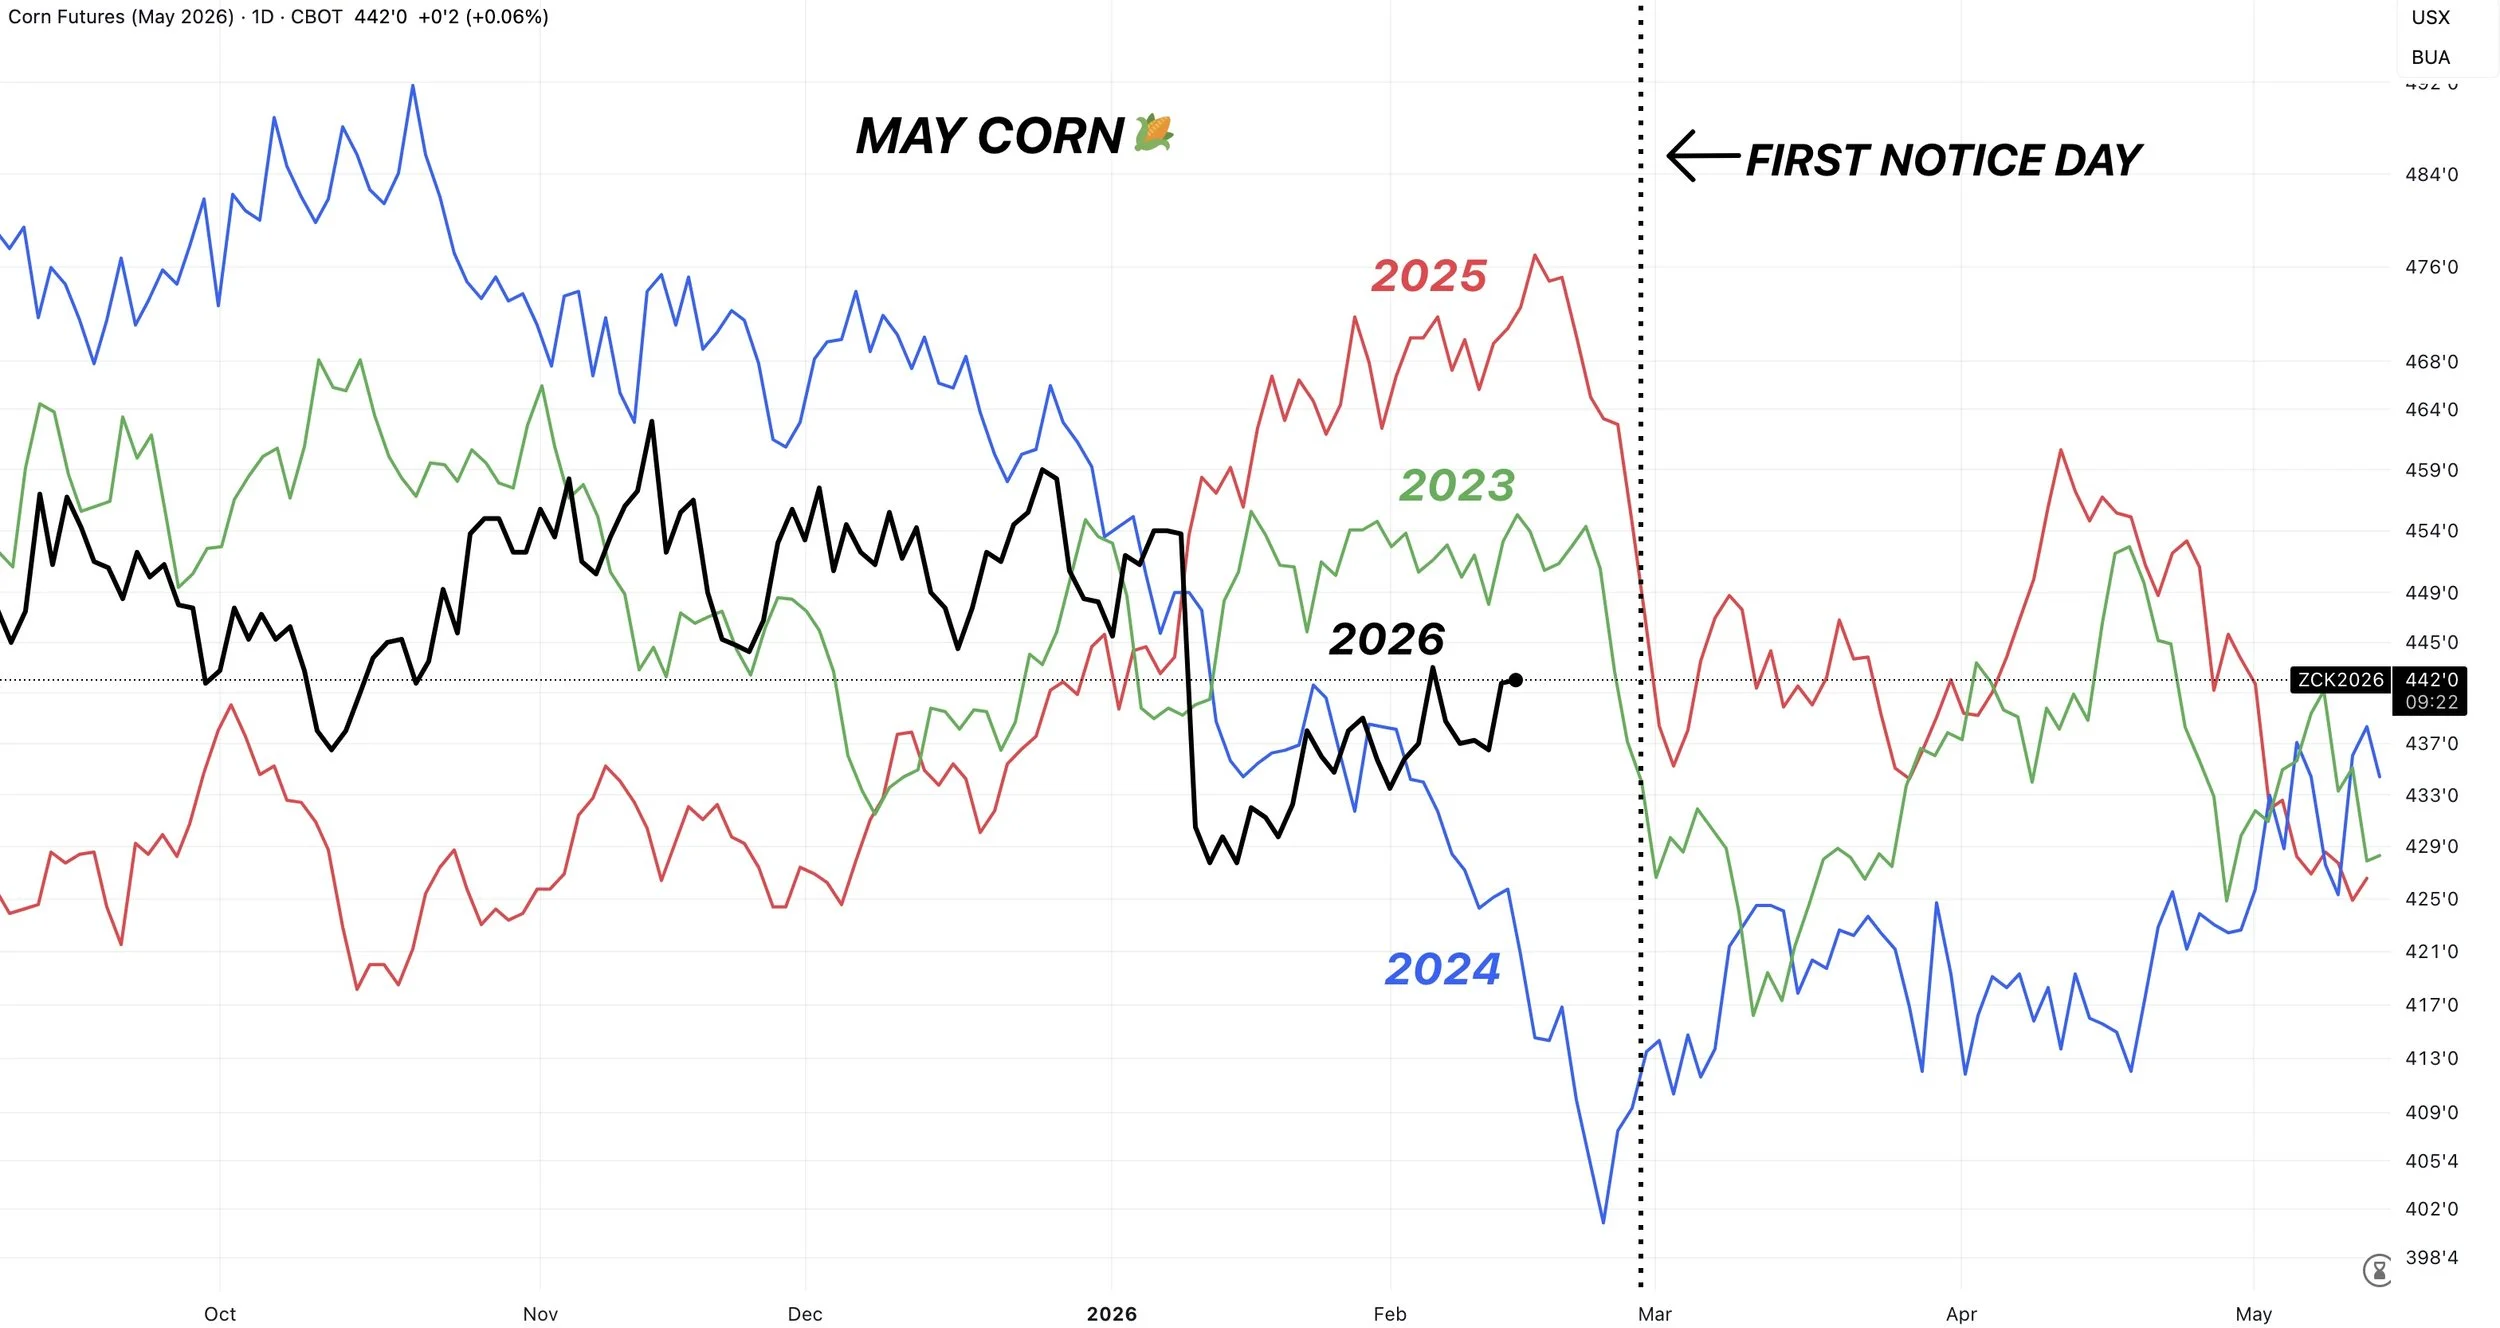
Here is the price action from the last 3 years on February first notice day.
Every year we have struggled heading into March.
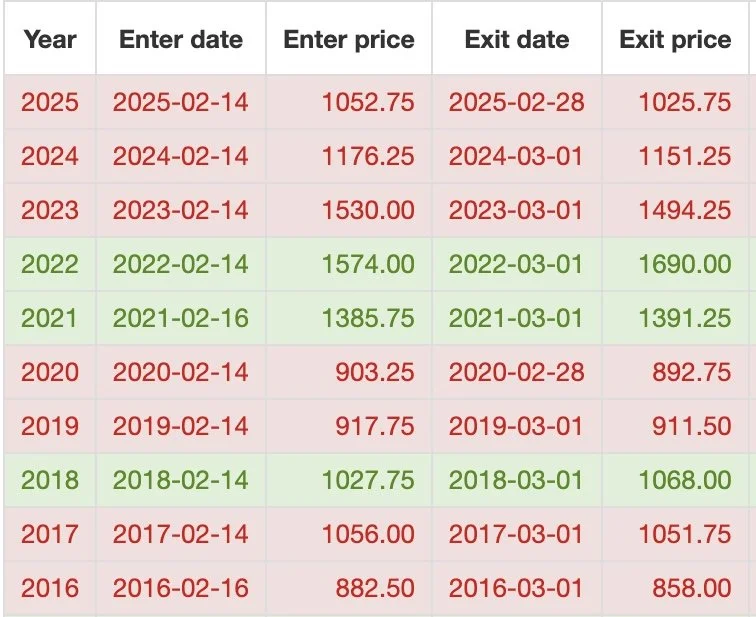
A reason to be cautious here in old crop corn the next few weeks.
I've went over the data and how corn has traded lower the last two weeks of February the last 9 of 11 years.
But what about soybeans?
Here is the data.
It doesn’t provide quiet as strong of a tendency to struggle like corn does, but the tendency for first notice day pressure is still there.
We have traded lower the last 7 of 10 years, but only lower 3 of the last 5 years.
Something to keep in mind if you have to move beans soon.
Today's Main Takeaways
Corn
Fundamentals:
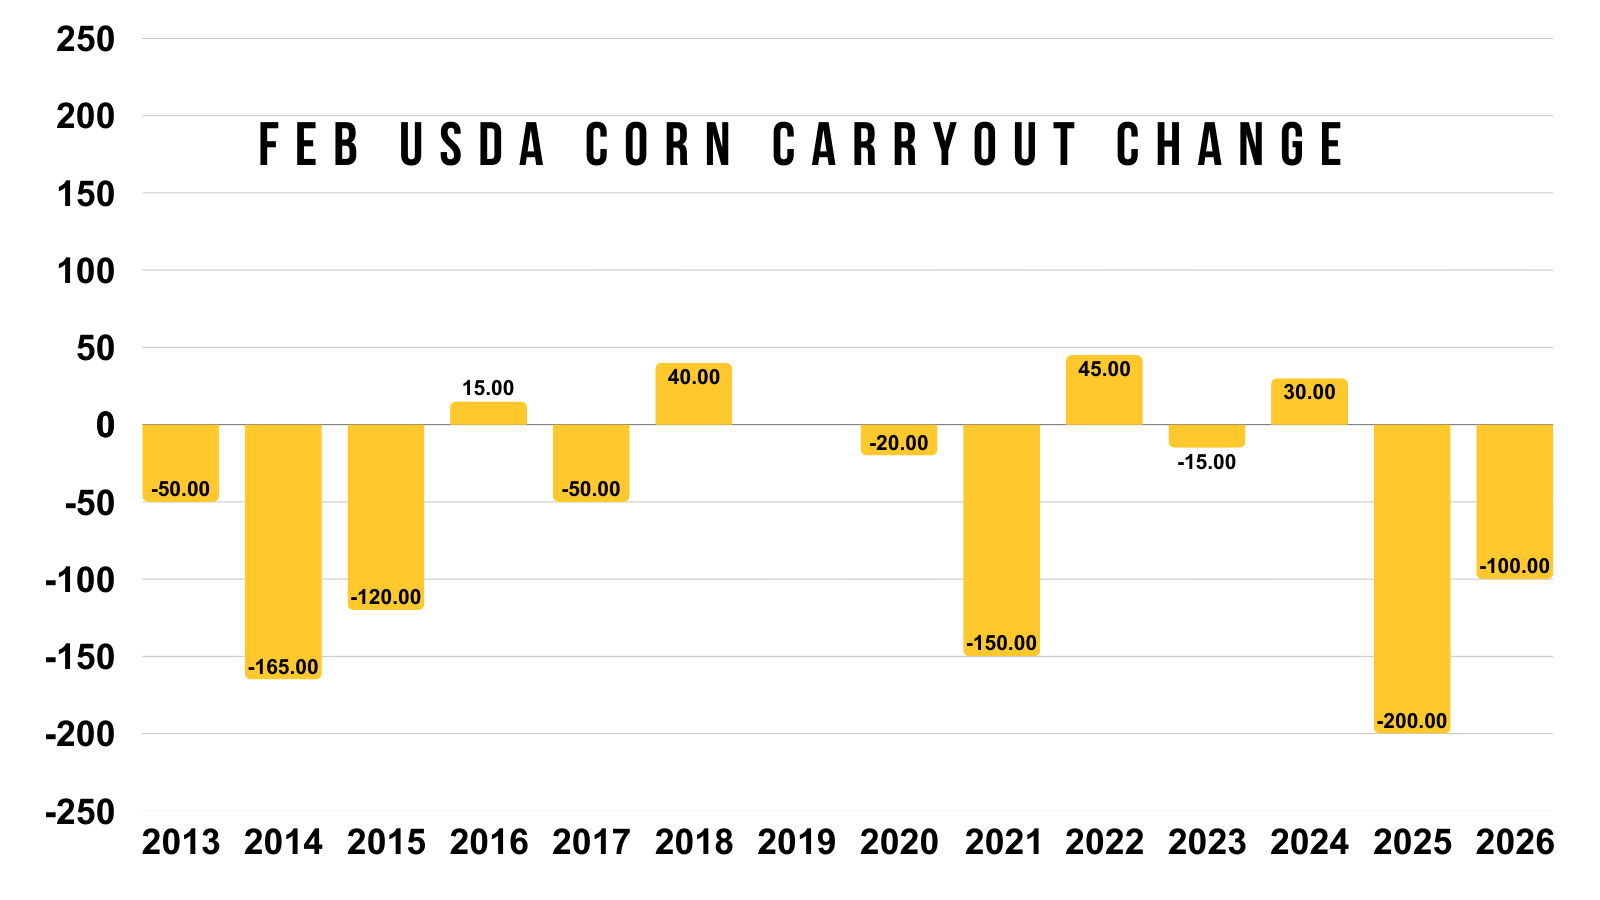
Tuesday's report featured one of the larger drops we've seen for the Feb report.
Yet we traded lower.
Short term, corn could continue to struggle. Old crop specifically.
We have first notice day which we talked about.
The farmer is sitting on a lot of corn and many are going to be needing cash.
So that is going to likely keep a lid on us short term. It's just hard to get a bullish story going in old crop when we are sitting on this record amount of supply.
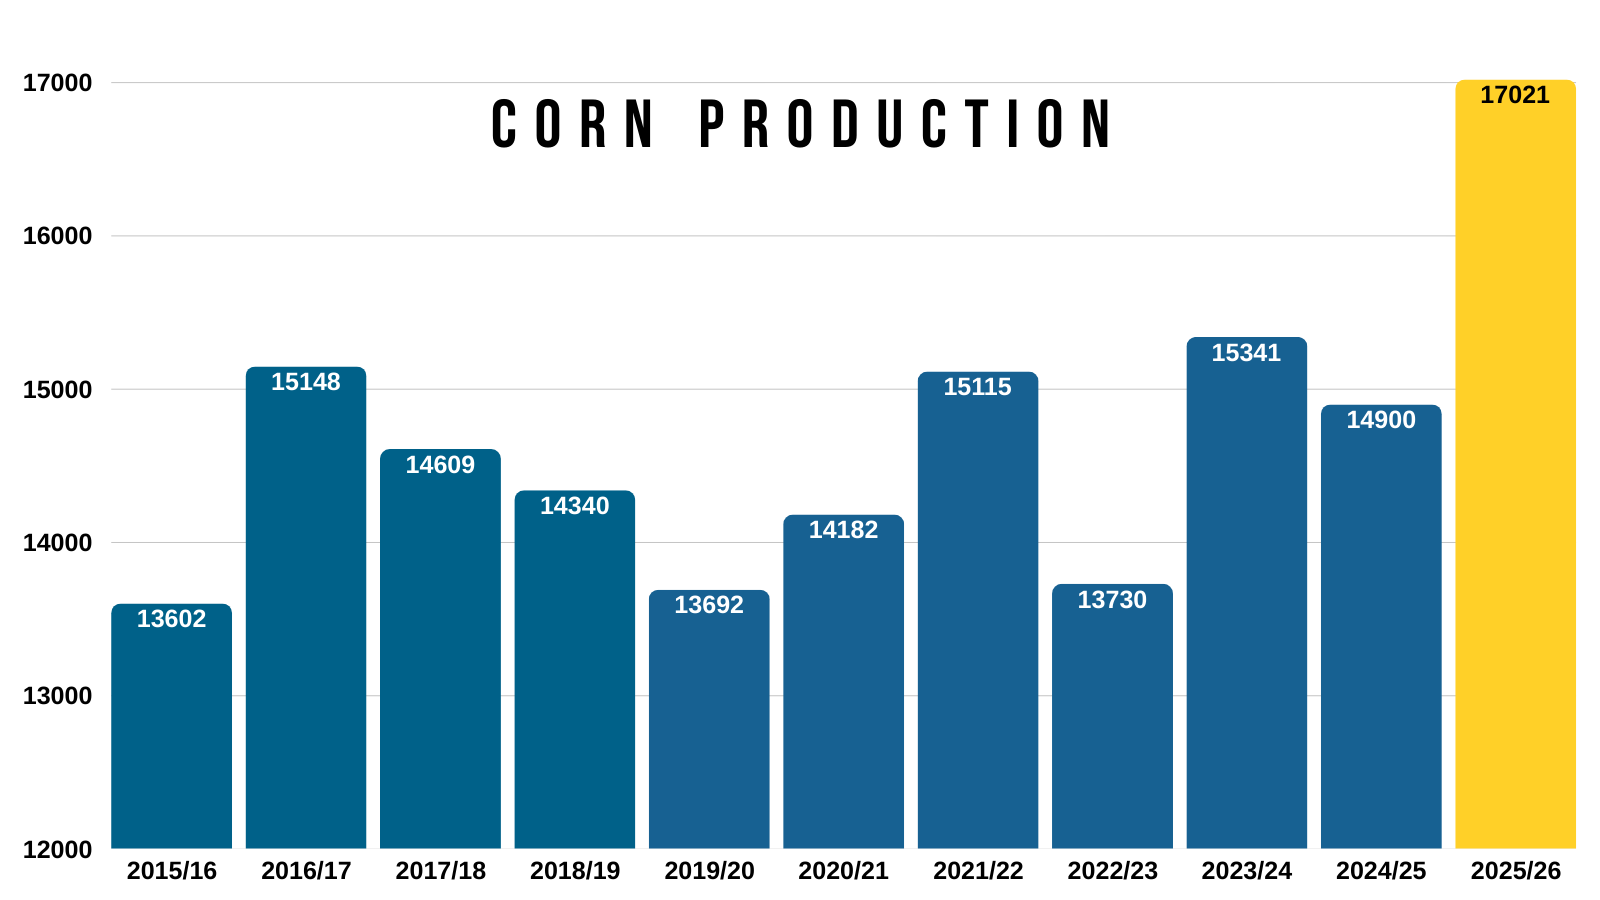
It feels like there is definitely more downside risk in old crop compared to new crop.
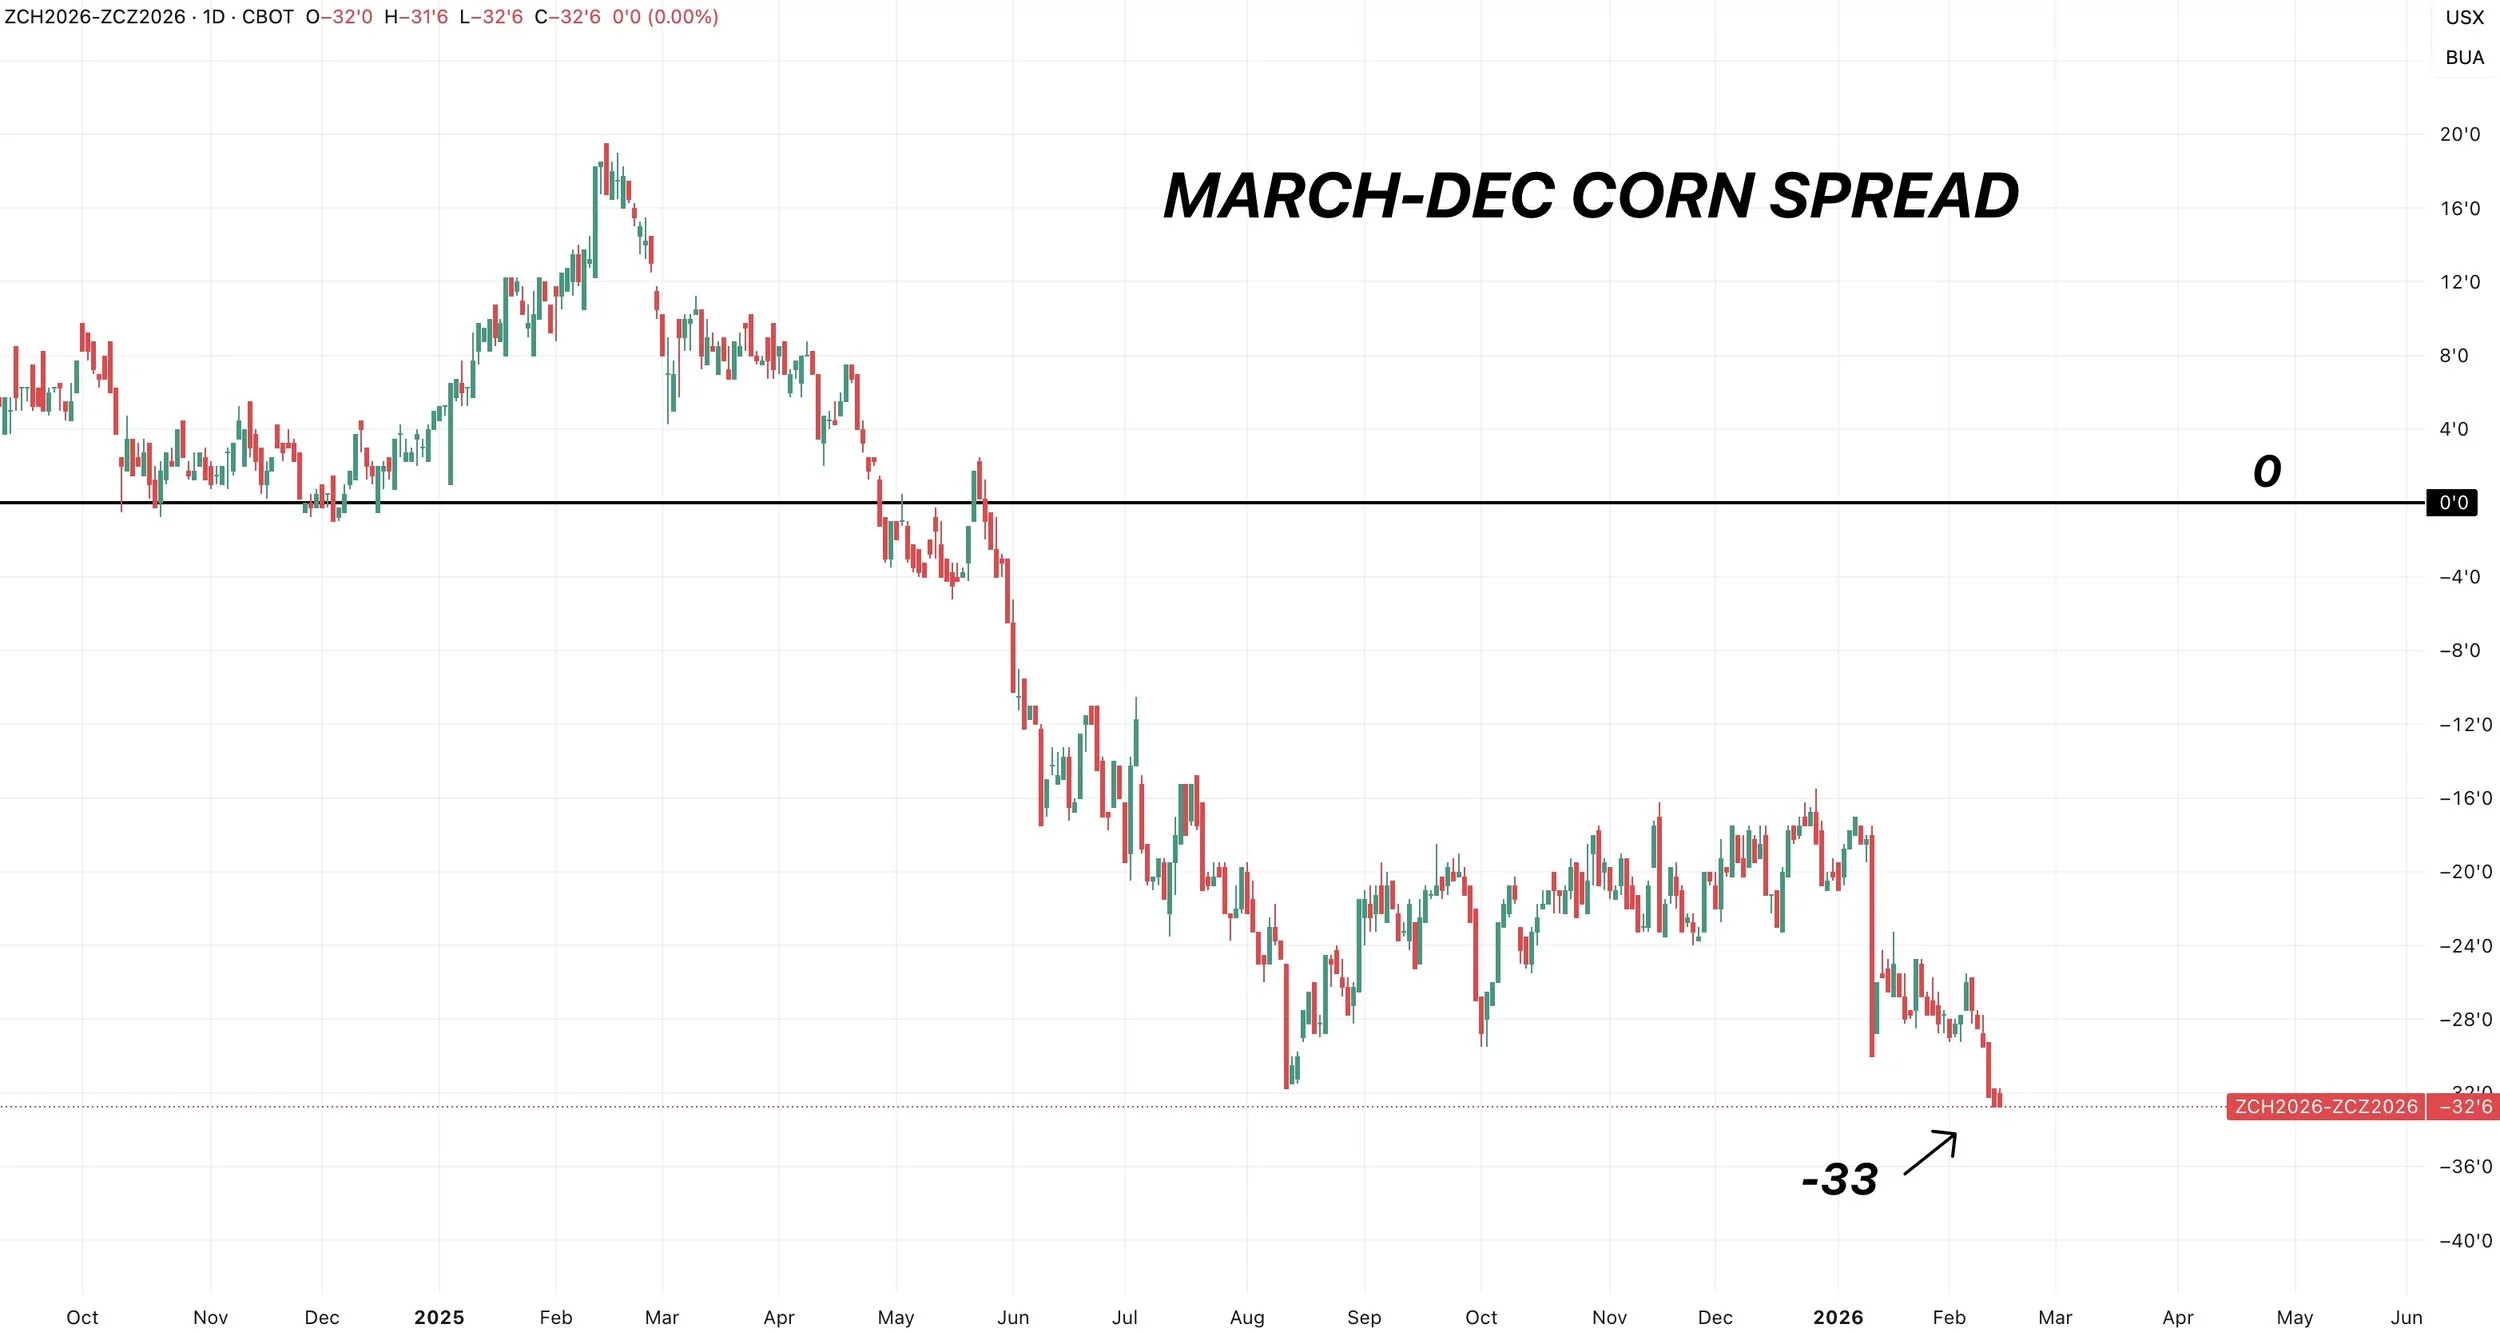
New crop corn has been a lot stronger than old crop.
The spreads have been widening, which confirms we have a lot of supply.
The market is telling us that it doesn’t need corn now, it needs it later.
Updated Soybean to Corn Ratio
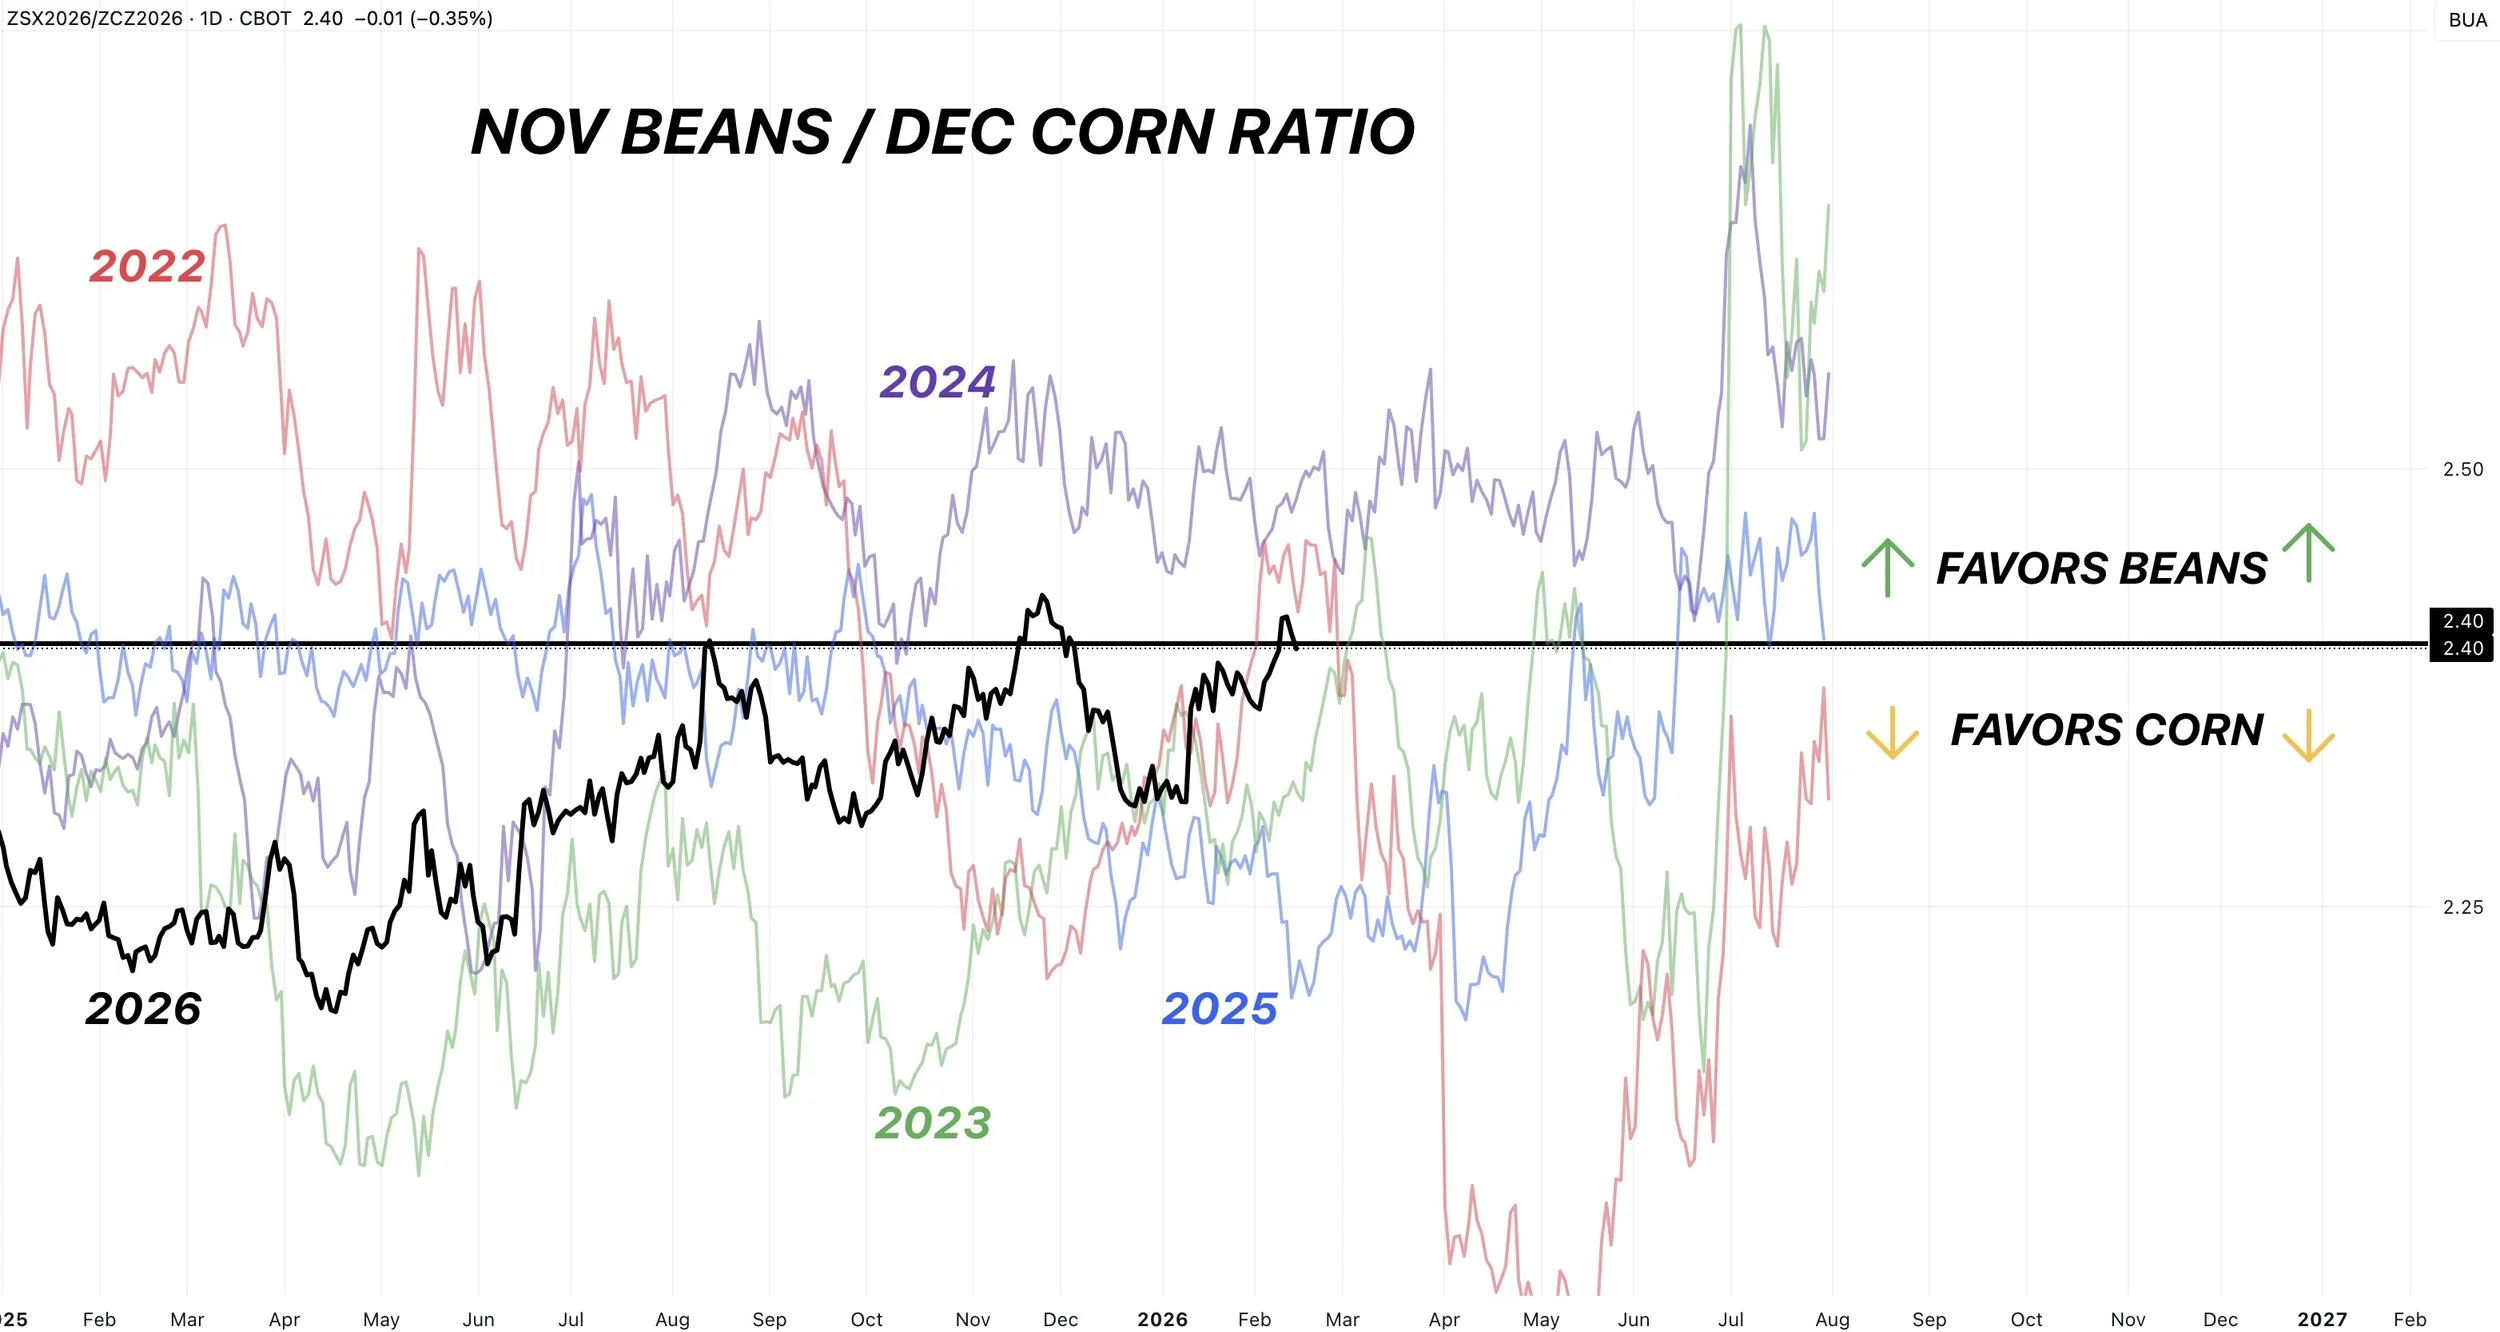
The ratio continues to slightly strengthen more towards being in favor of soybeans.
It's up to 2.40 now.
This recent spike is probably going to prevent us from planting a monster amount of corn acres, something like 98-99 million acres, similar to last year.
Naturally we are going to see a little bit of acres shift.
But it's not quite a big enough move to justify a massive amount of acres swinging from corn to beans.
For that to happen, we'd need to see this ratio get closer to 2.50 to 2.60. That is where we could start to see things swing a lot further.
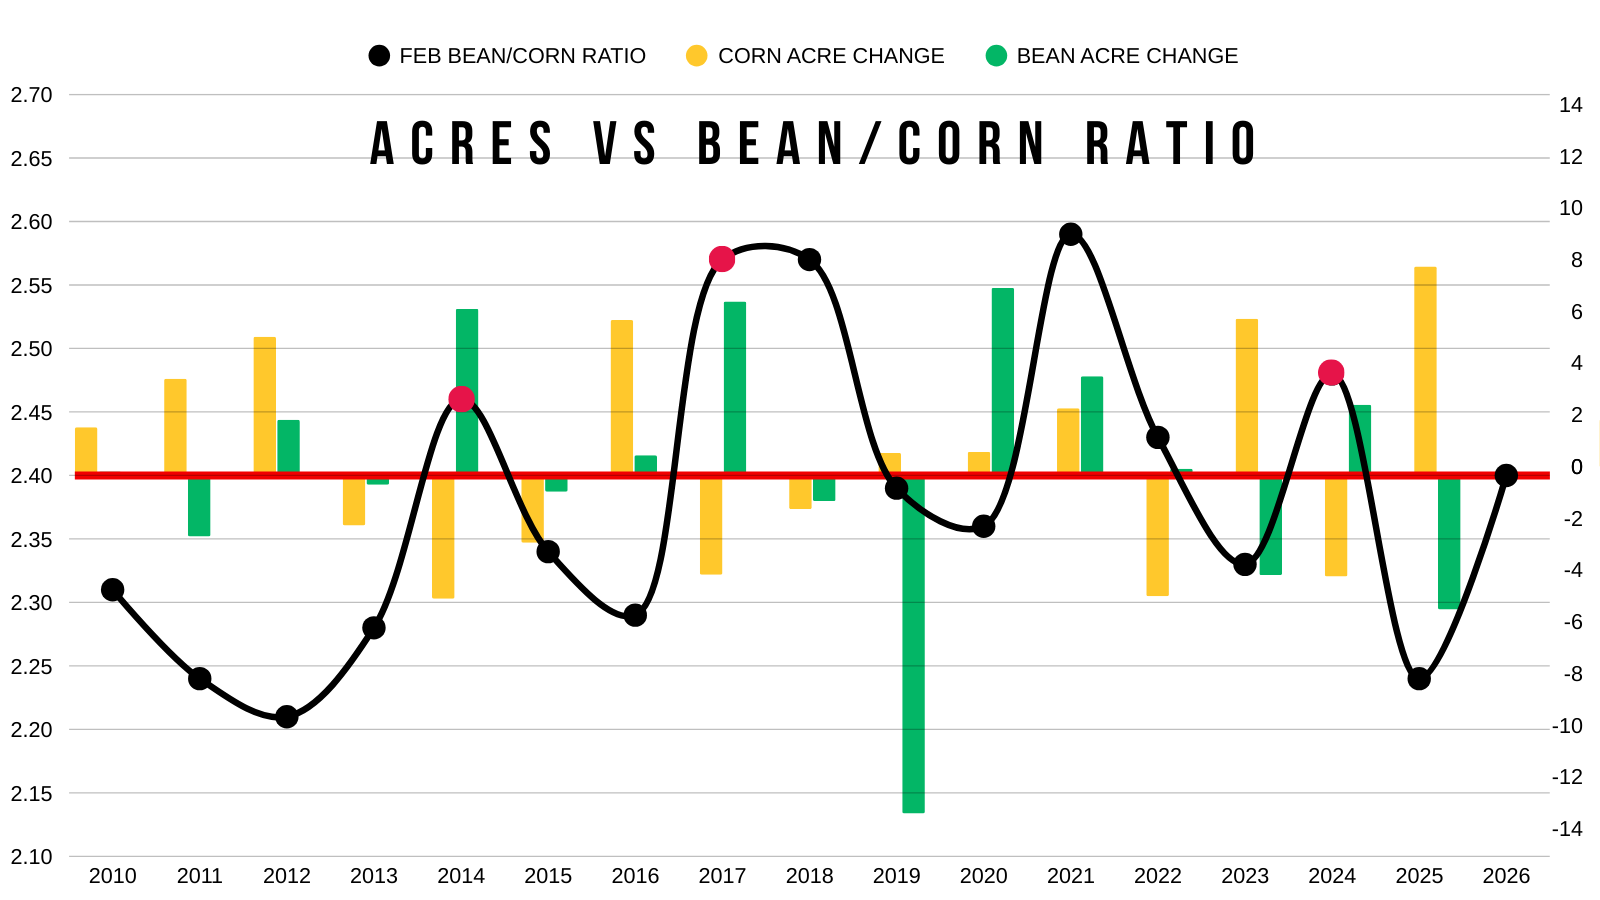
Here is the ratio overlayed on top of how corn and soybean acres have changed year over year.
I highlighted years where soybean acres increased, but corn acres decreased.
All three of them had a ratio closer to 2.50 to 2.60 vs the current 2.40
*Note About Data: (Despite the ratio favoring corn in 2020, the big jump in soybean acres in 2020 was due to the massive drop in 2019. Both corn and bean acres increased in 2020)
World vs US
Although corn may struggle to find a reason to go substantially higher short term.
You have to keep in mind we have record demand.
Despite the US situation not being bullish at all, the world situation is the tightest it's been in over a decade.
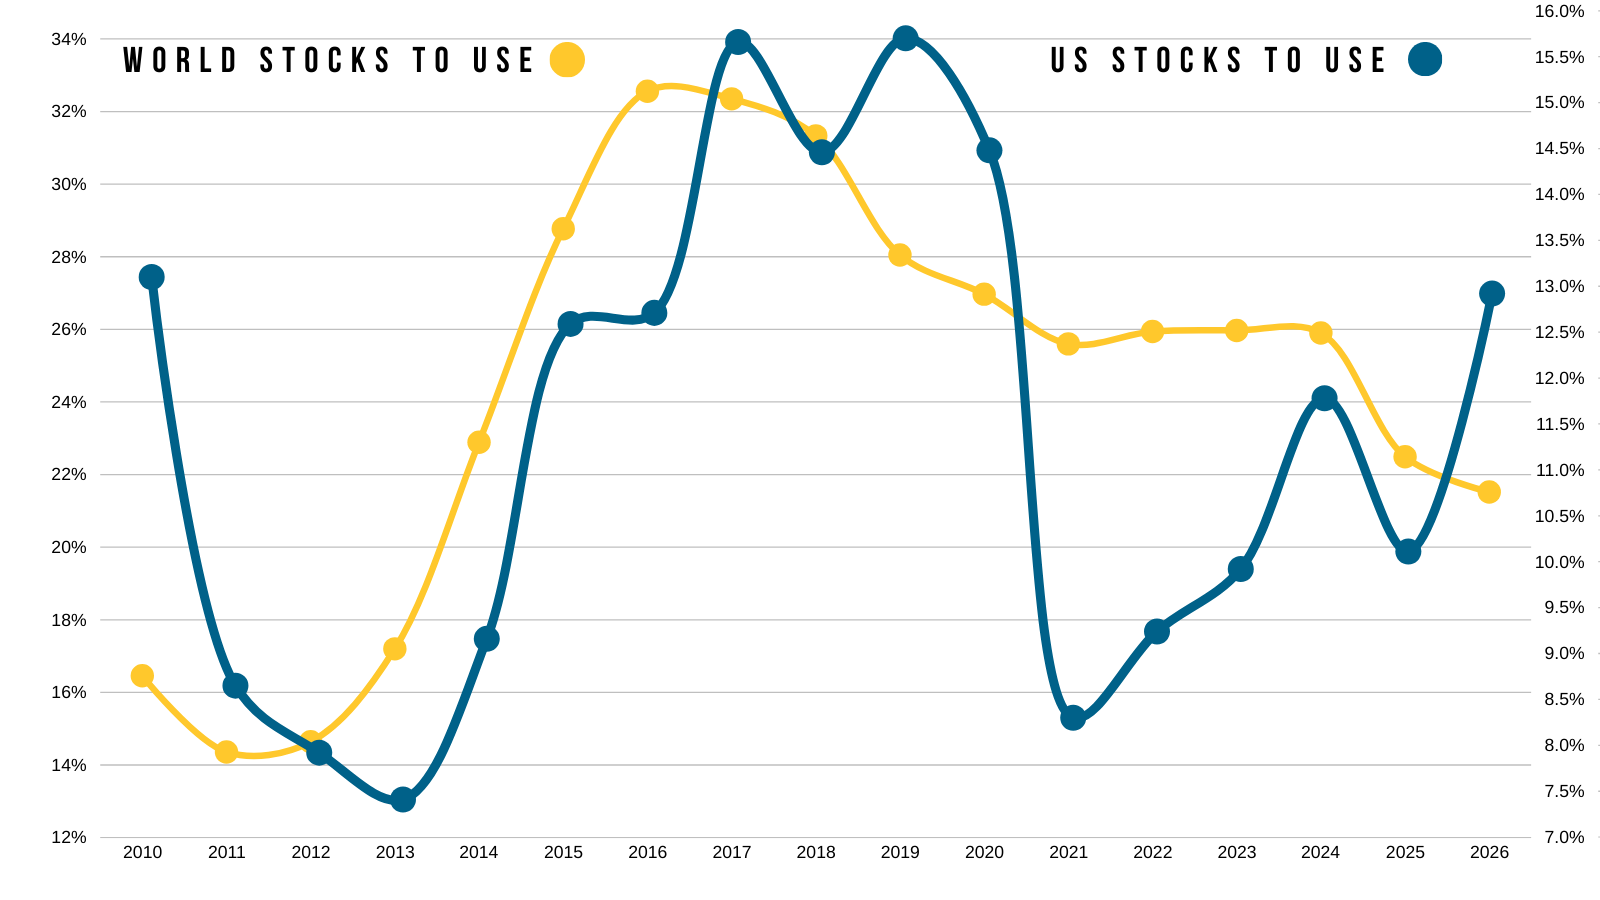
The issue is that a tight world story doesn’t correlate to higher prices like a tight US situation does.
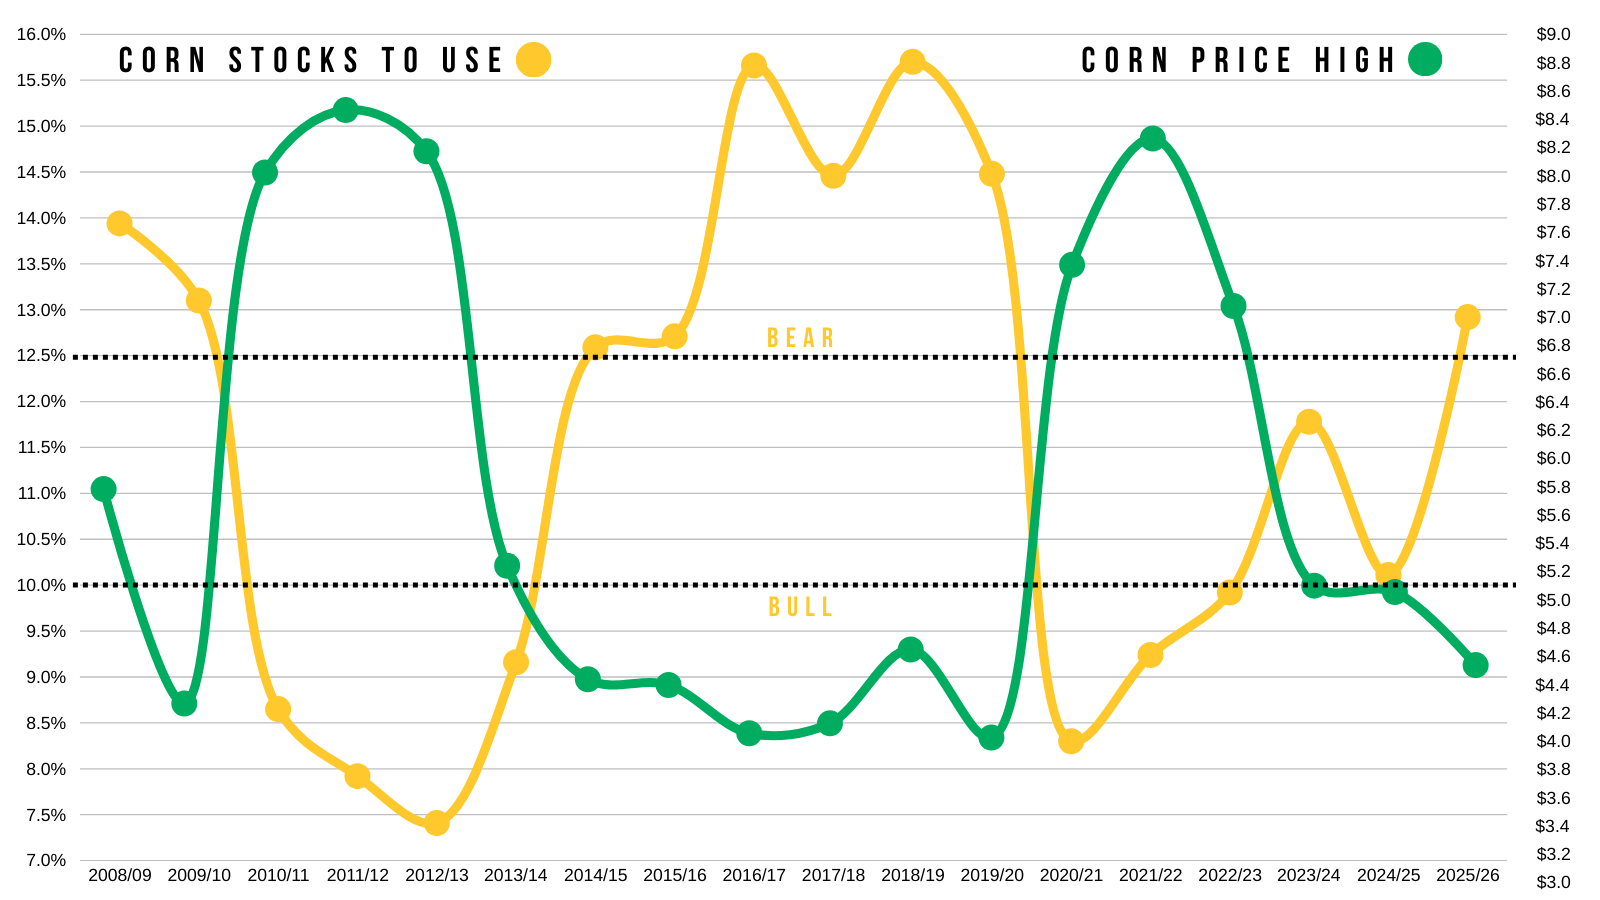
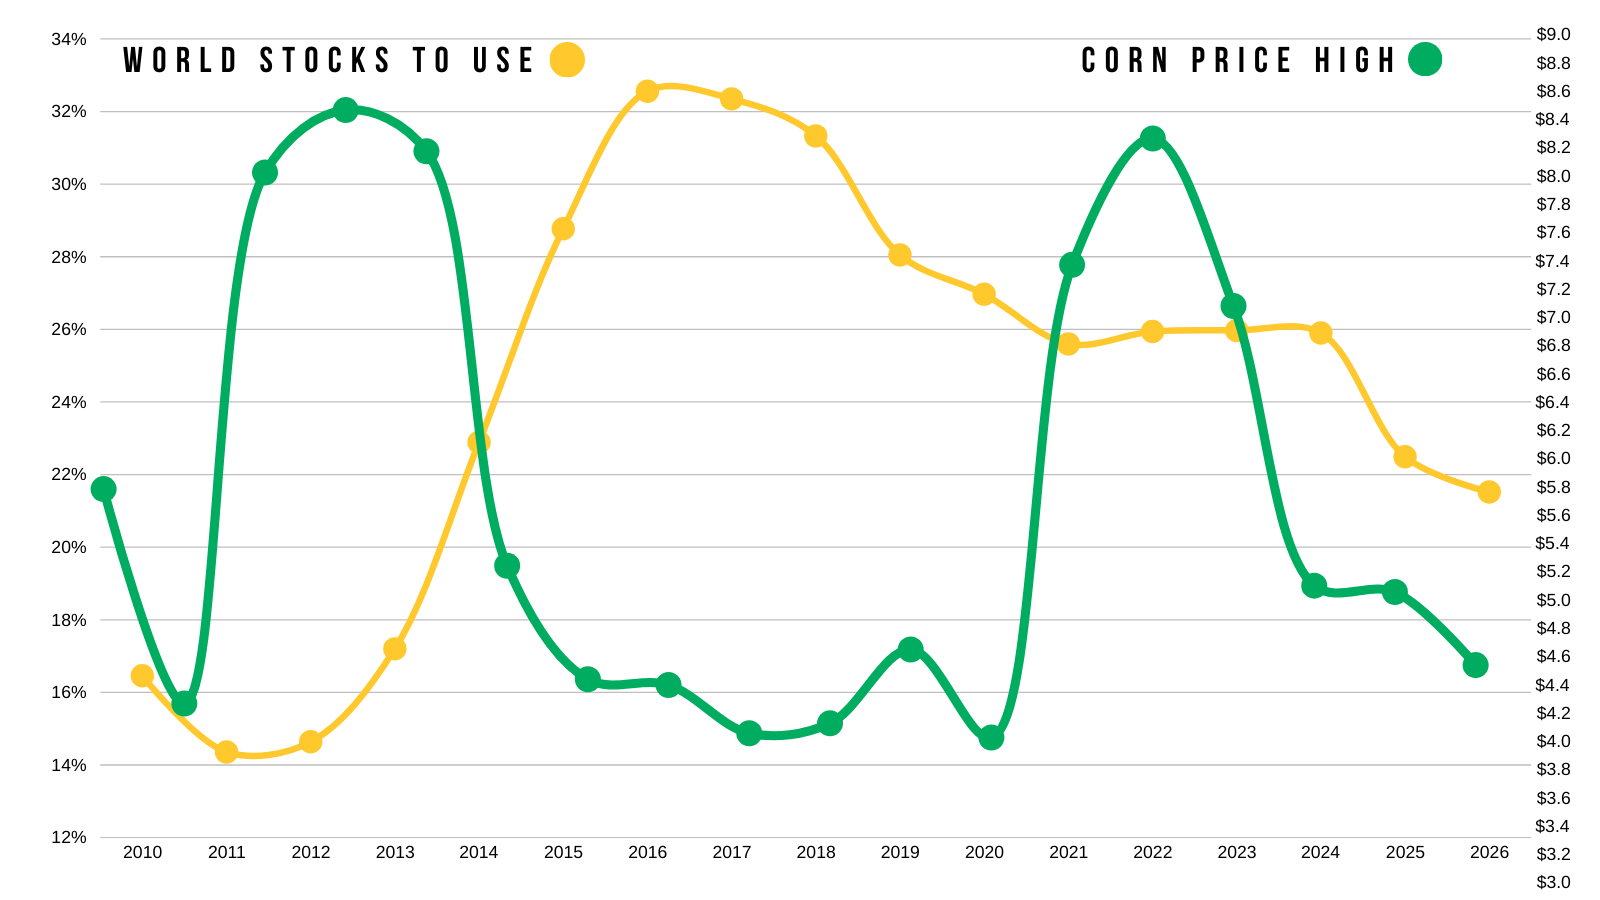
Here is corn's highest prices of the year overlayed on top of the US stocks to use ratio as well as the world stocks to use ratio.
There is a clear correlation to a tight US story and high prices.
There is not a correlation to a tight world story and high prices.
But the tight world situation essentially means the US absolutely HAS to perform.
What do you think happens if the US even has one below average crop when demand is the best it's ever been and the world outside the US is as tight as it's ever been on corn?
US Stocks to Use
World Stocks to Use
Technicals:
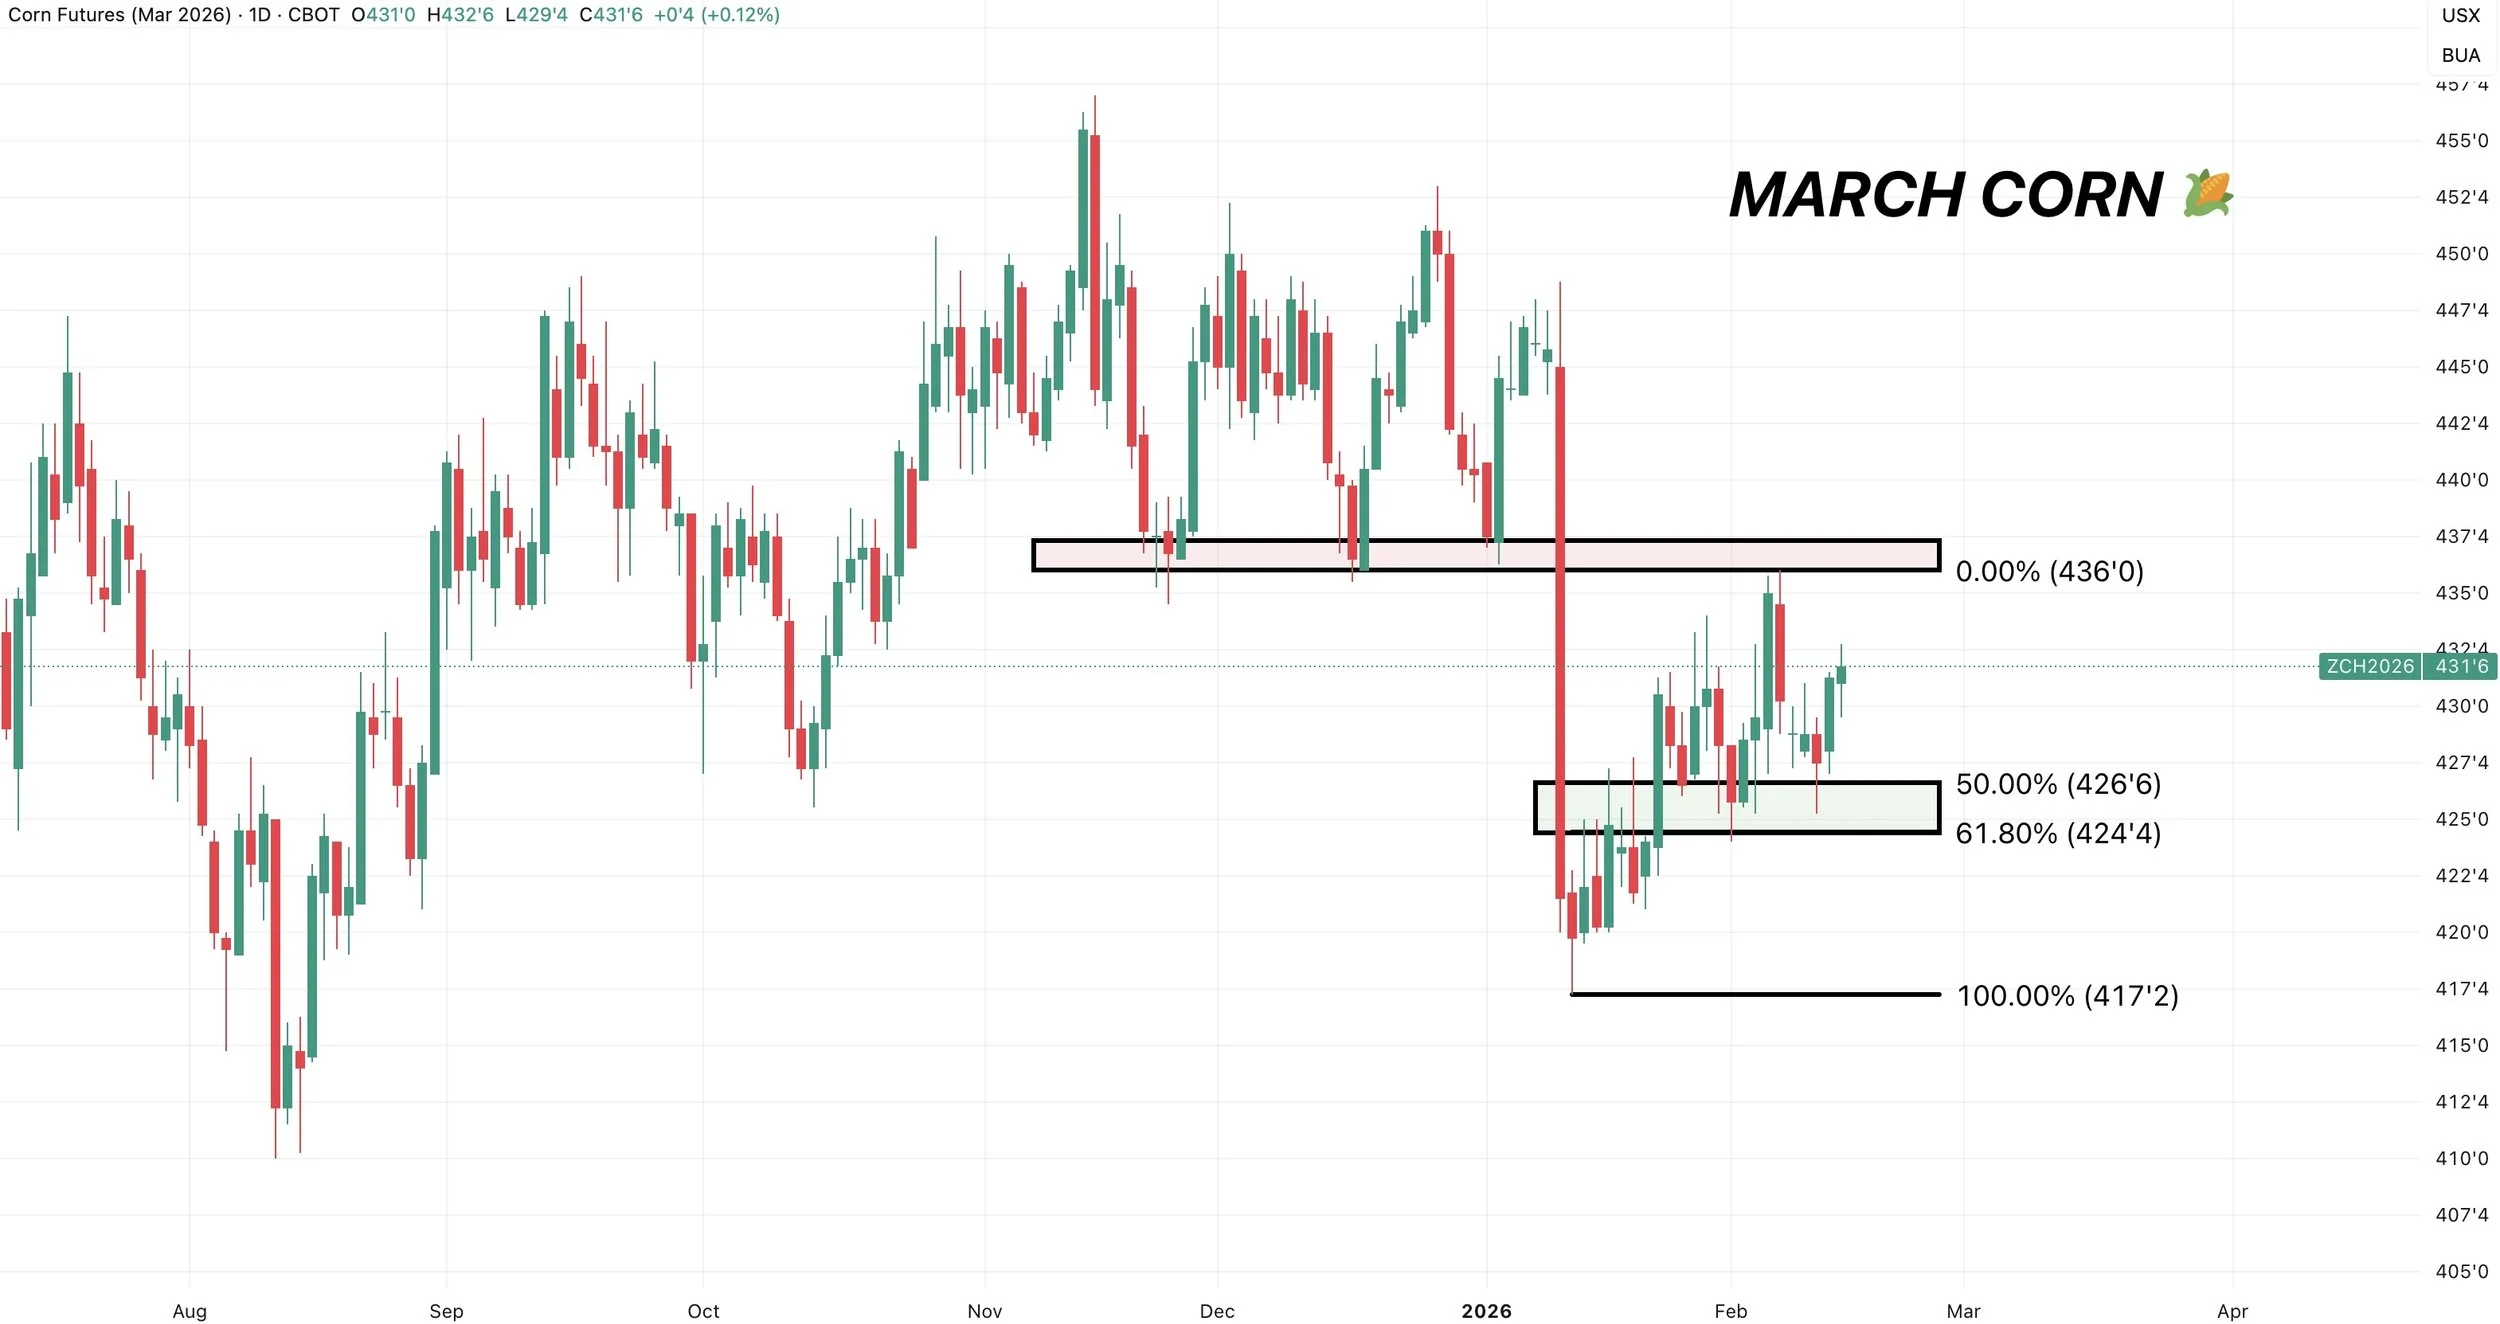
March Corn
We're struggling right at that old support.
Trapped in a new range.
Which was the reason for the sell signal last week.
I expect us to continue to be range bound.
If we break above this range, then the story would change.
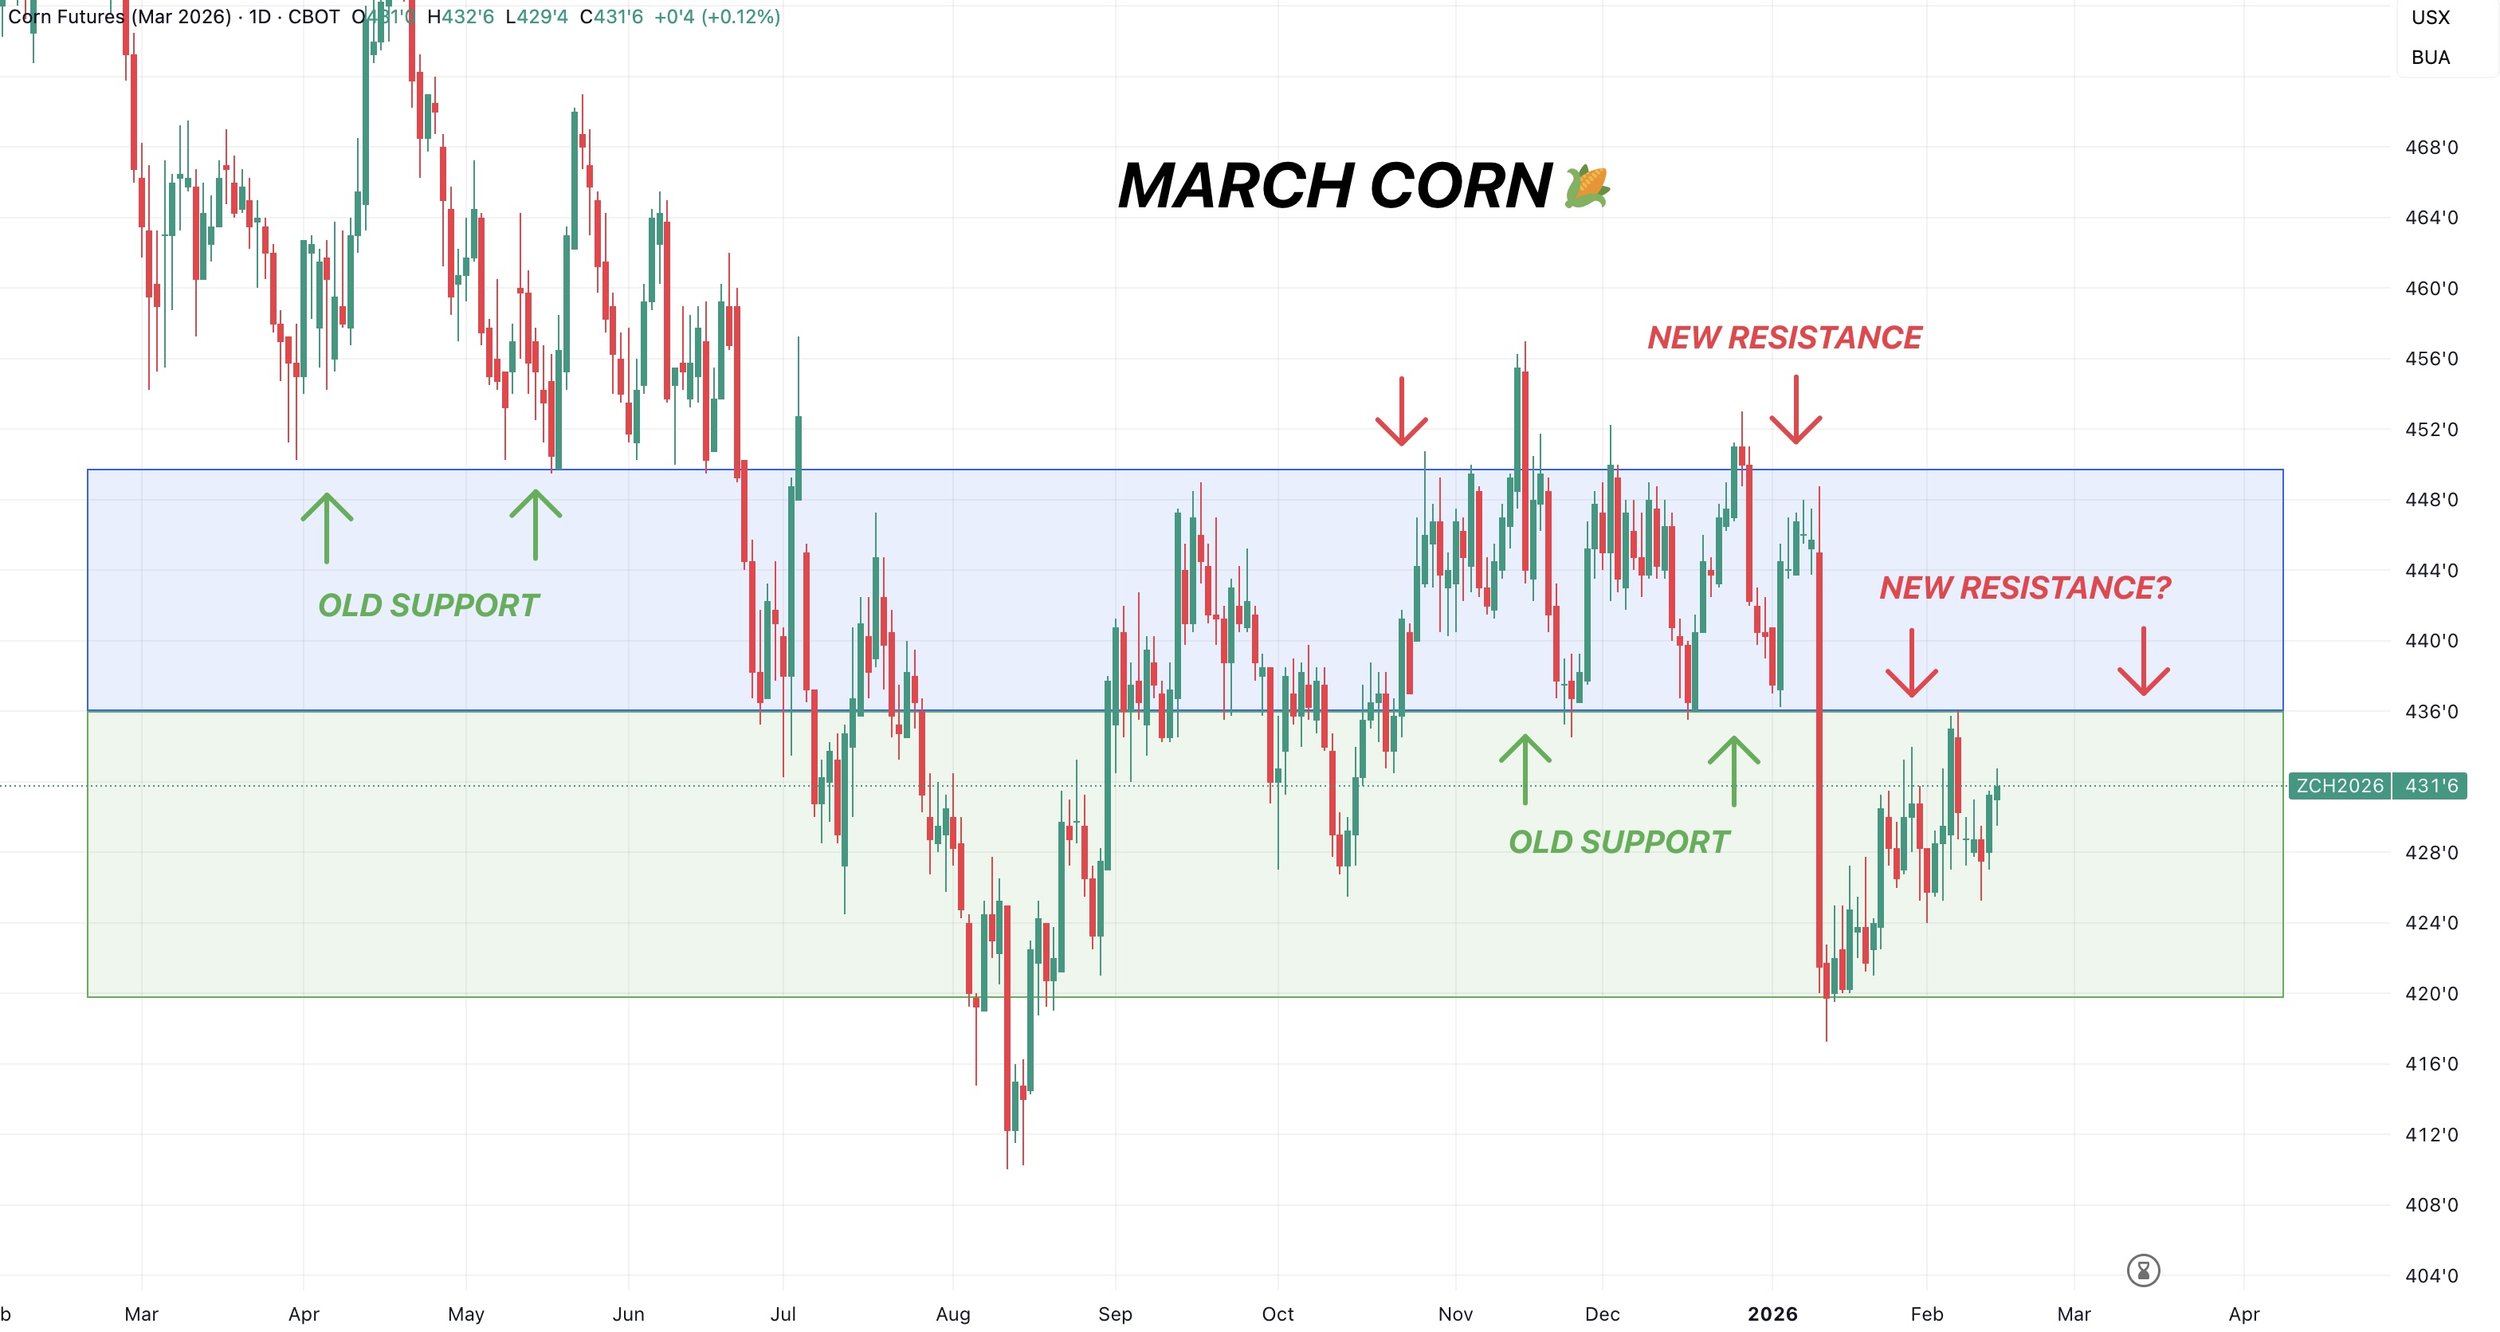
We still have a potential bear flag pattern here.
A textbook bearish pattern that adds caution.
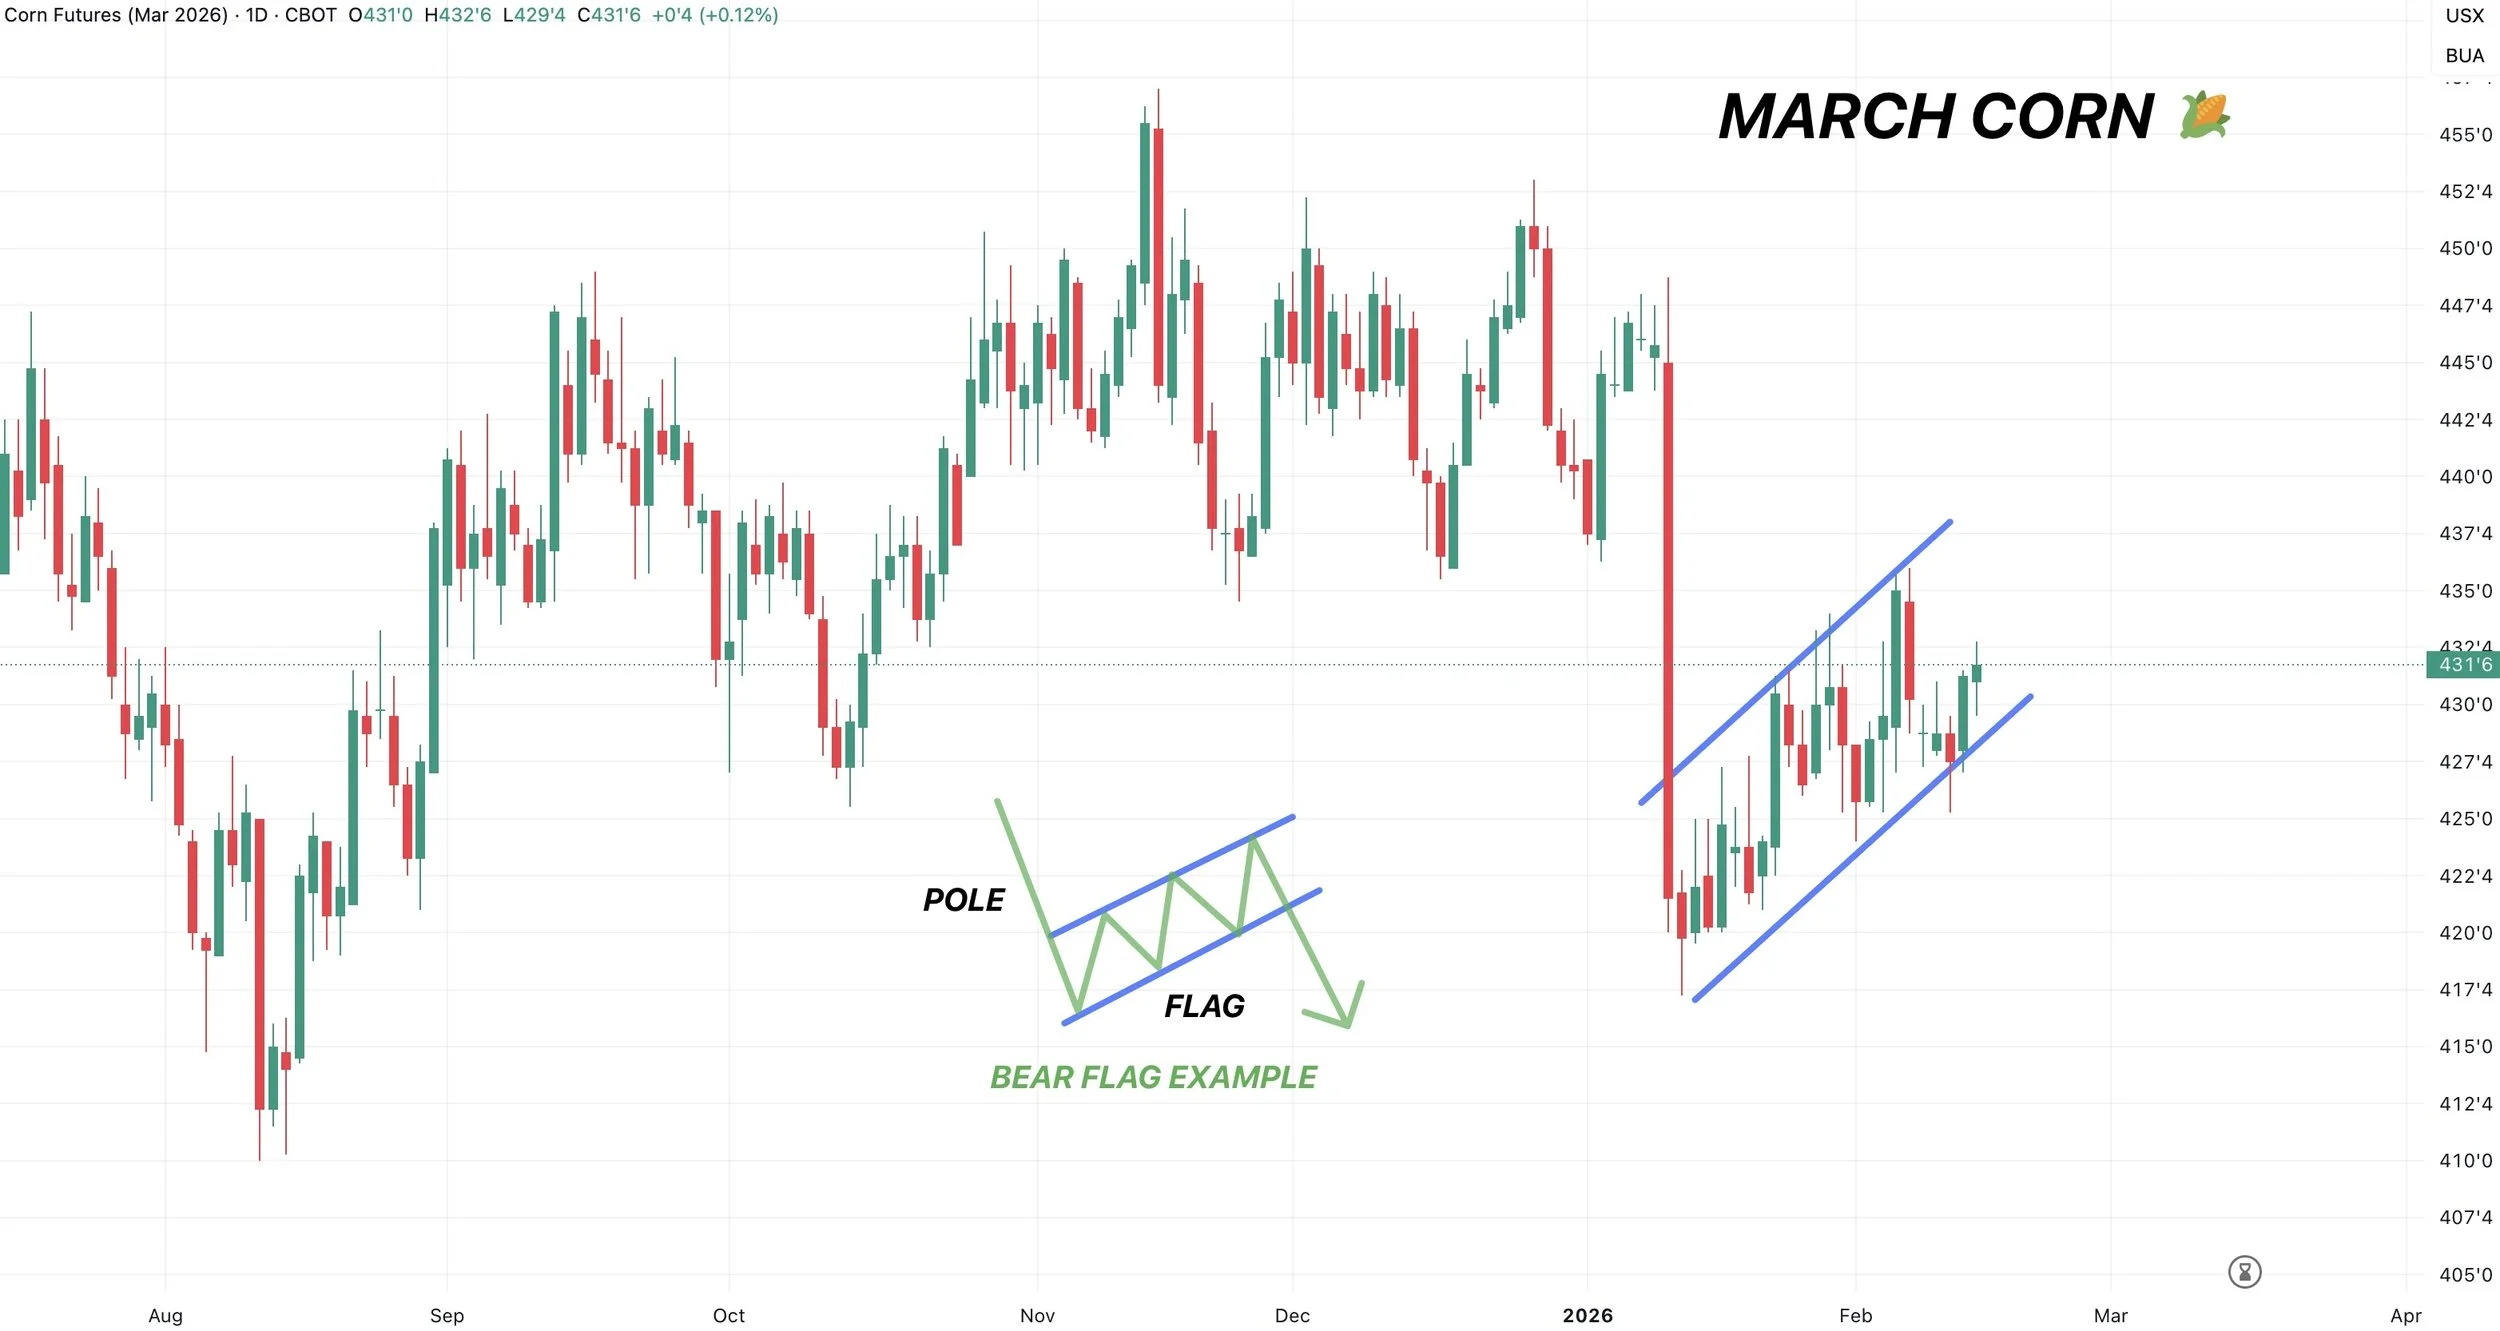
We did manage to bounce exactly where we needed to.
As we held the golden zone of this entire rally.
That is the must hold spot moving forward.
Failure to hold will tell us if corn is starting to truly roll over or not.
Soybeans
Fundamentals:
The story in soybeans is hard to navigate and guess what is going to happen.
It's complex and there are a bunch of moving parts.
Clearly, if China buys another 300 million bushels of soybeans, it could end up being extremely bullish.
Economically, it makes ZERO sense for them to do so.
If they do, it's purely a politcal play.
They are agreeing to buy because they think it'll result in Trump working on the other trade deals and tariffs. It's not because they need soybeans.
They could be willing to pay an extra $1 for our soybeans vs Brazil's. But no one else in the world is going to be buying.
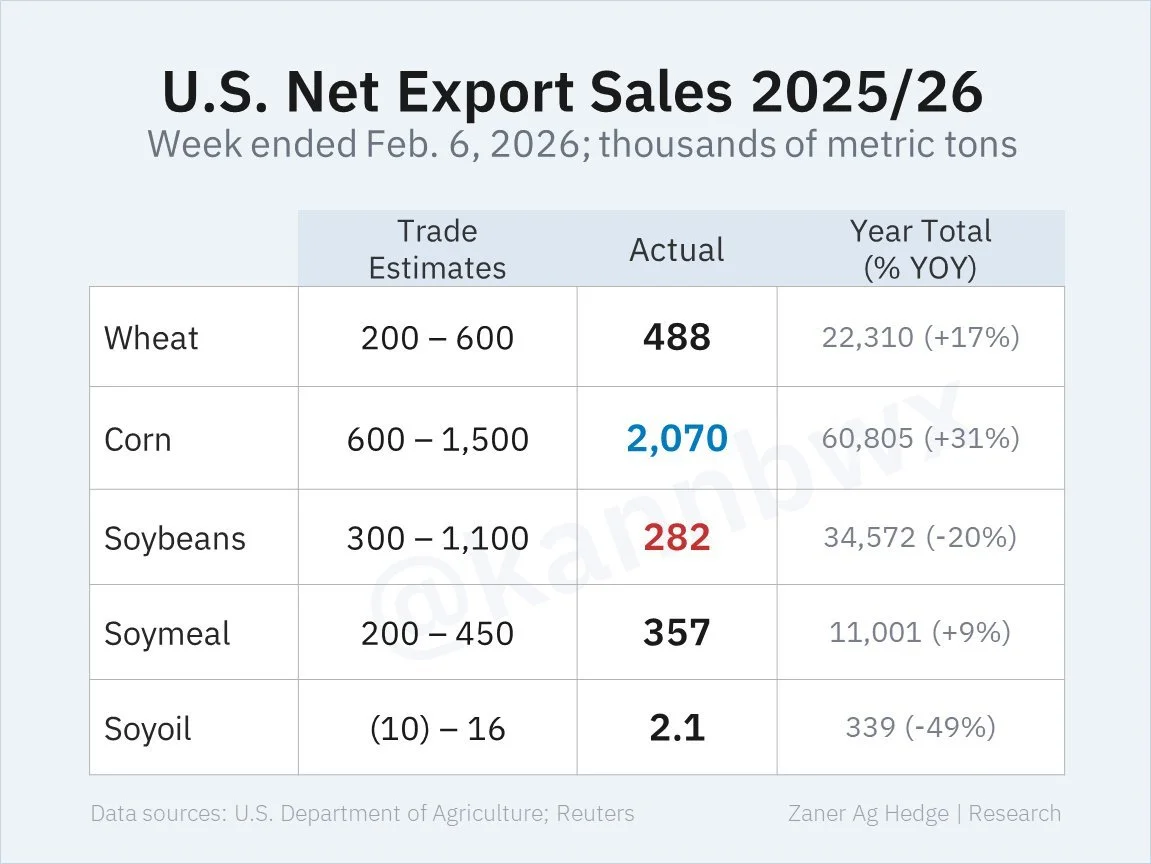
Which means we could end up losing a ton of non-China business.
We did just see a marketing year low for soybean exports.
Chart from Karen Braun
The other question is timing.
Is this really going to happen right away?
Or is it going to be closer to summer and fall?
It's a big difference. The market is acting like it thinks it's going to be right now.
Just because they are going to buy our soybeans, does that mean they won’t be buying Brazil's right now and wait to buy ours until later?
Typically, they buy from Brazil right now and not us.
Short term, we have the Chinese new year that runs from February 17th until March 3rd.
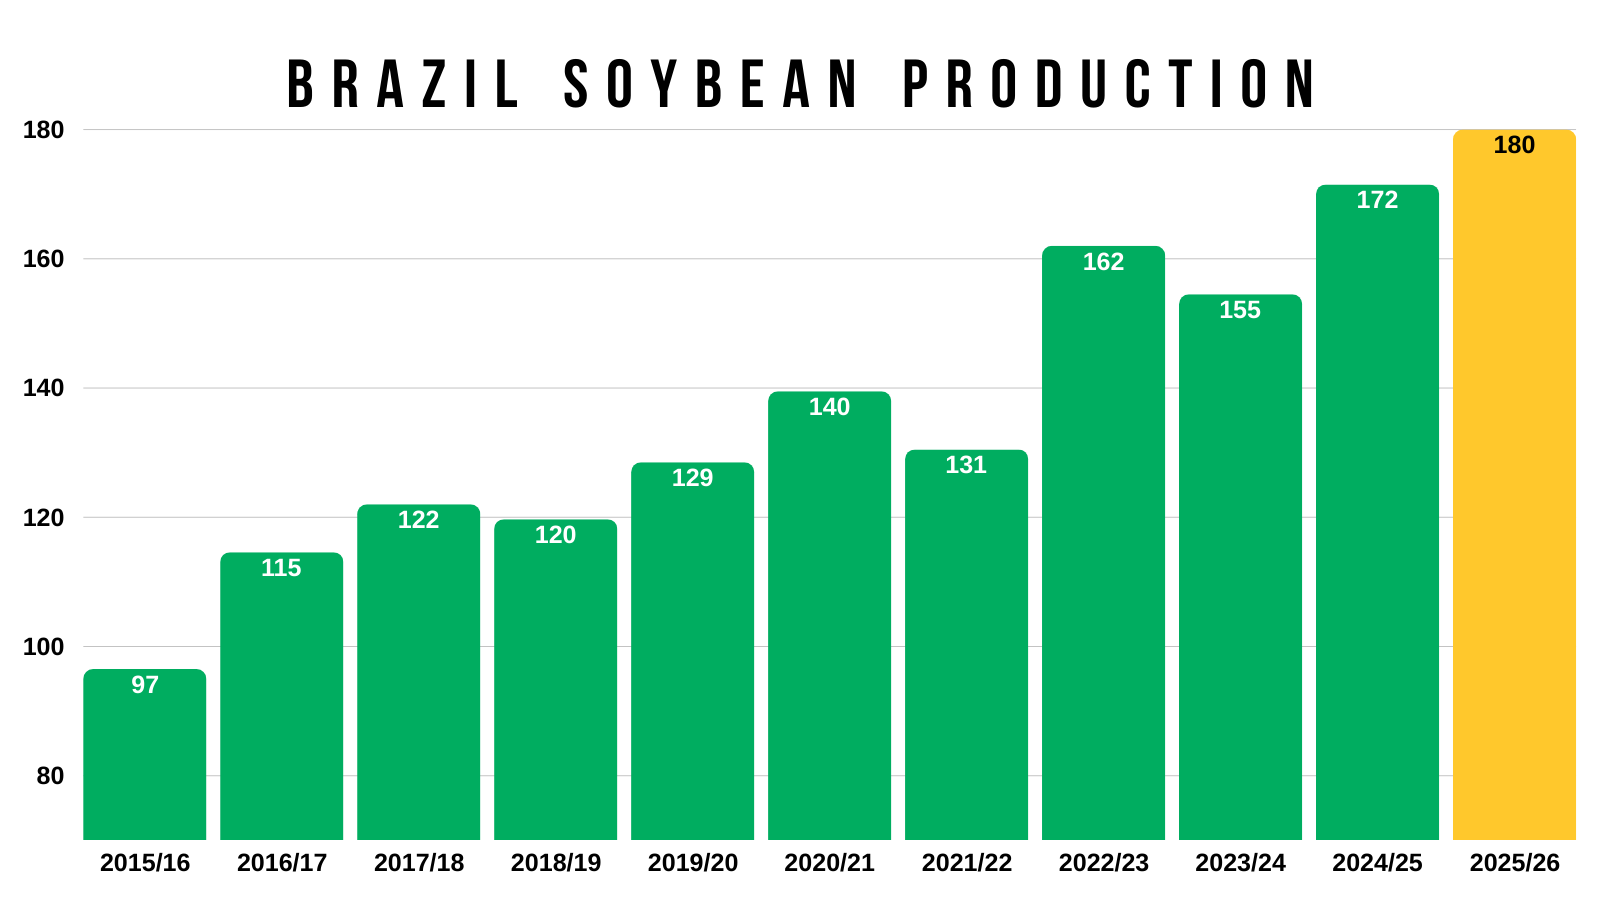
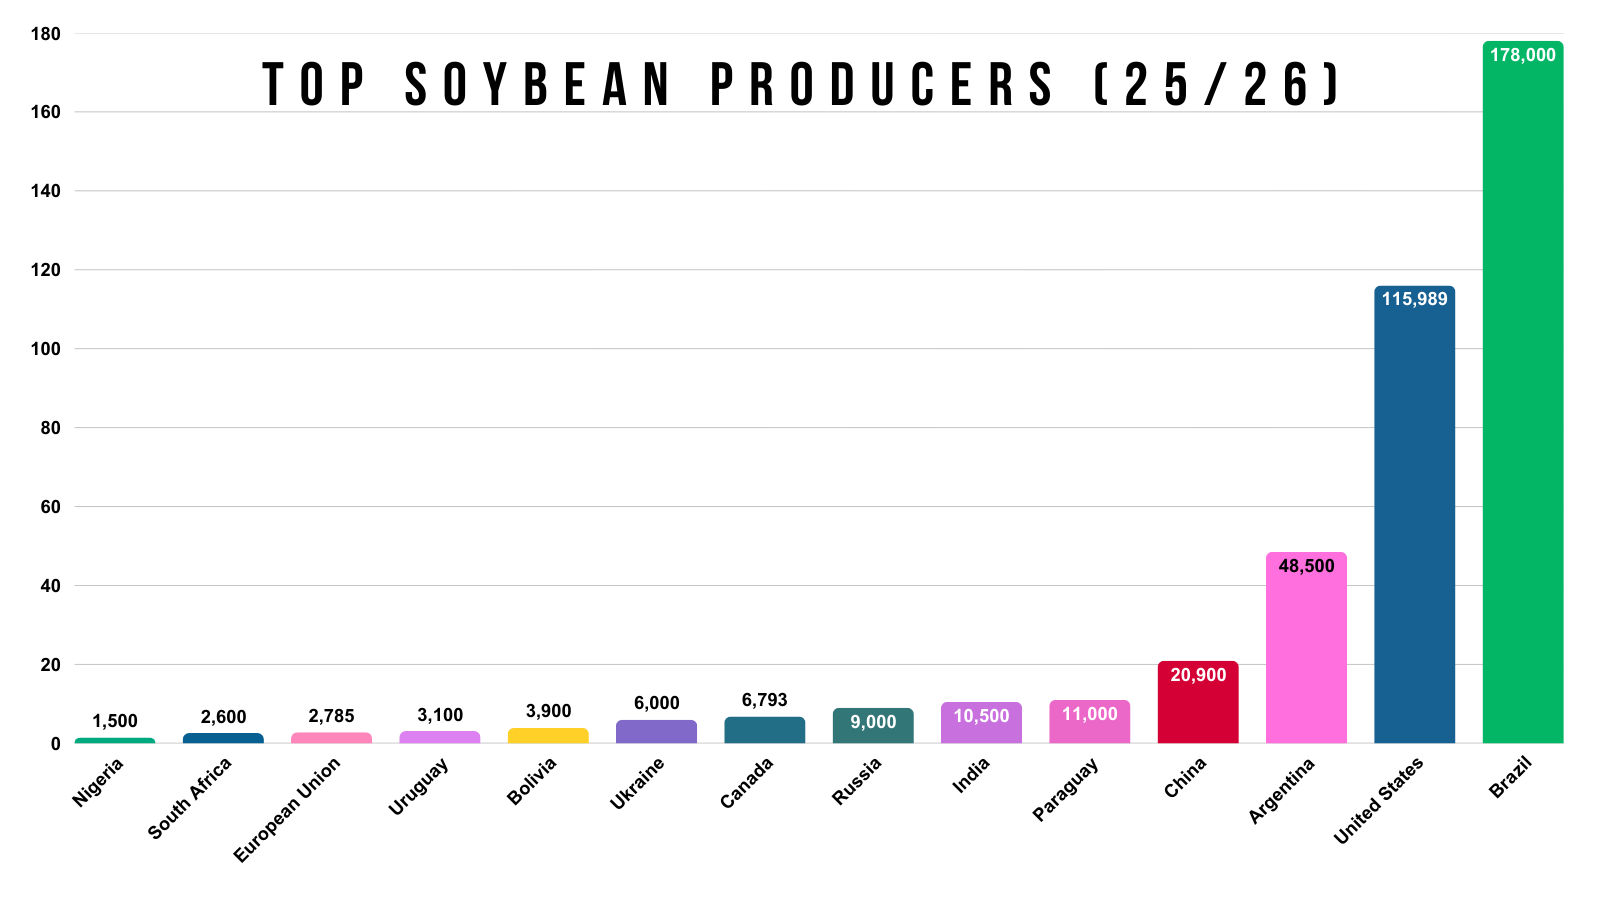
China buying doesn’t change the fact that Brazil has a monster crop coming.
It also doesn’t change the global balance sheet.
Because these soybeans aren’t disappearing, they are simply changing hands.
The world situation is still relatively loose.
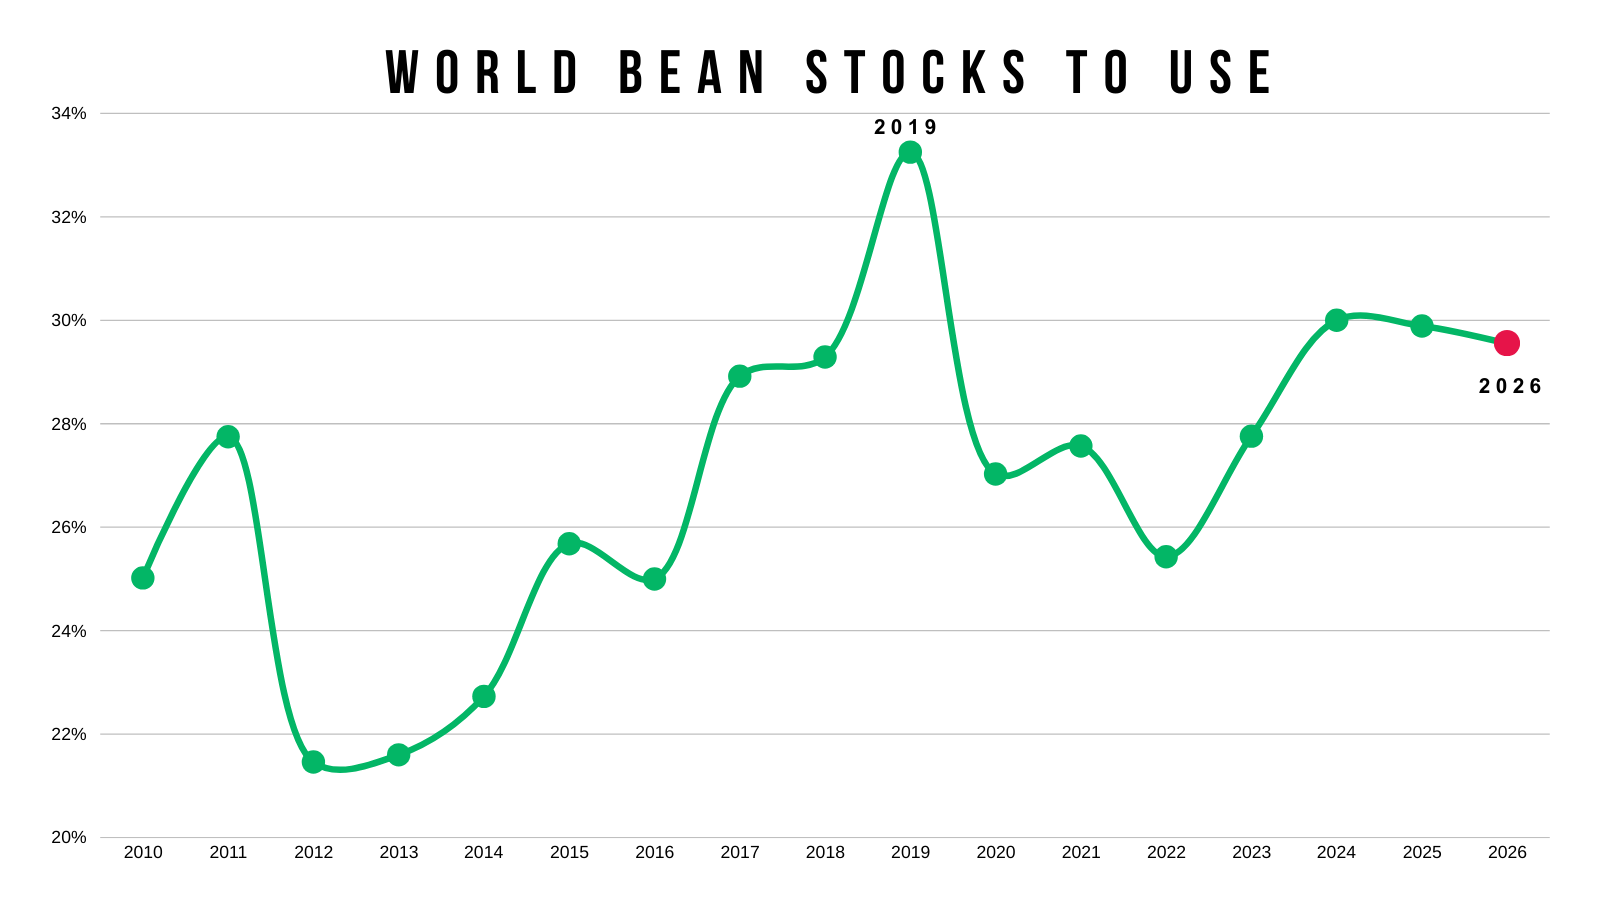
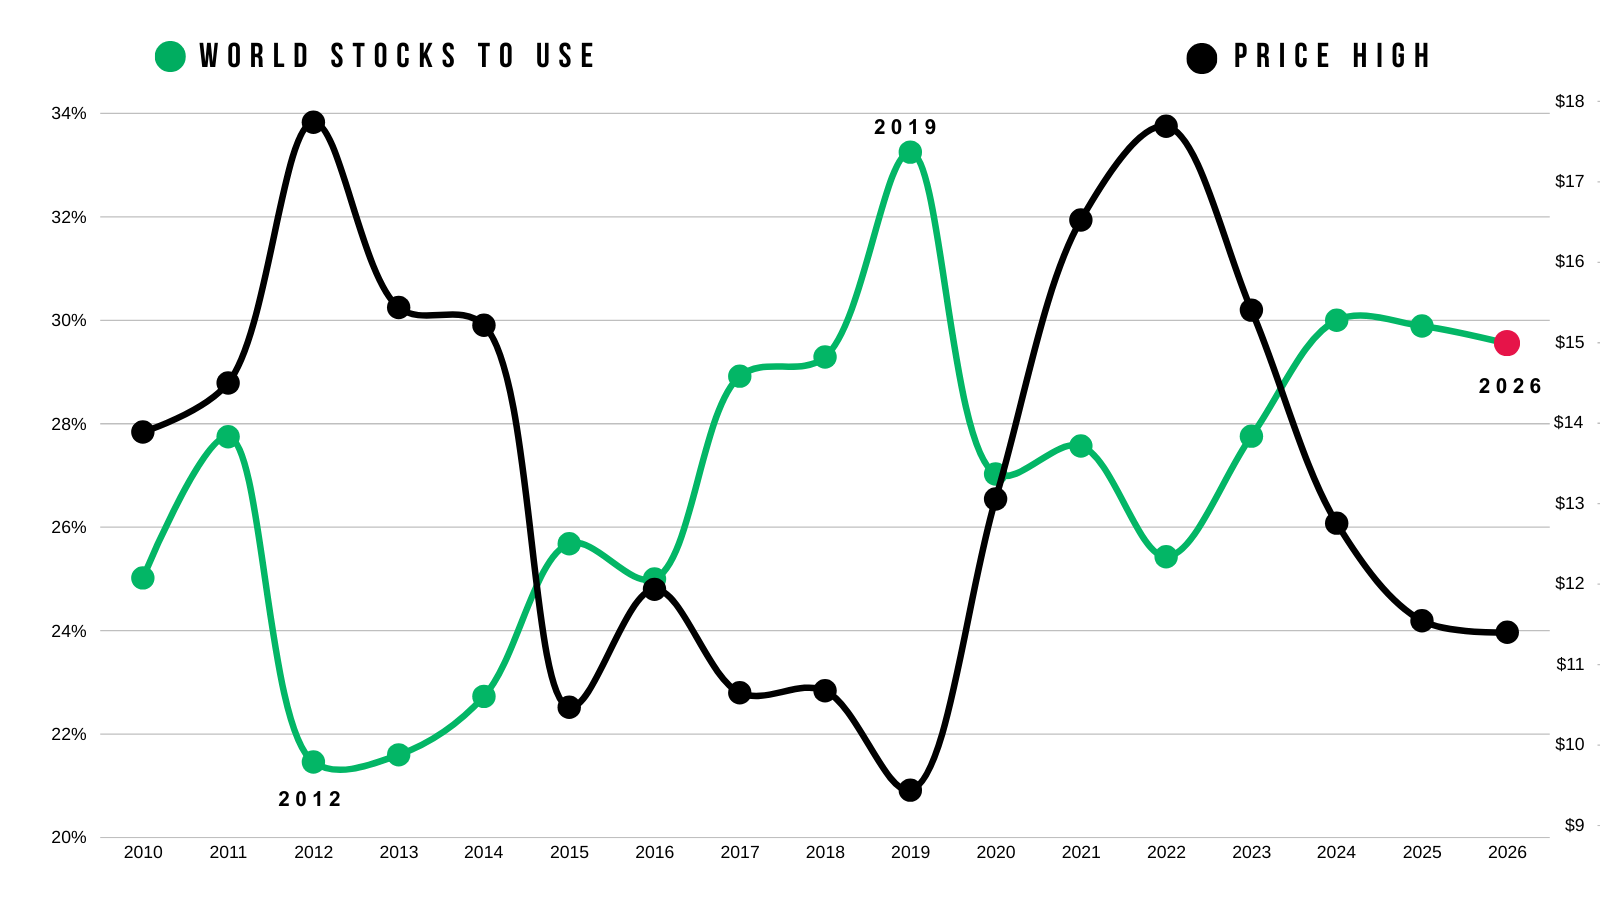
Let's look at the world sitaution and how it's correlated to prices in the past.
Here is the world stocks to use ratio overalyed on top of soybeans highest price of the year.
The two bull markets did feature a large drop in the world balance sheet.
So there is some reasons to be "skeptical" given that this entire China situation won’t impact the balance sheet on a global scale.
Brazil is the clear leader in the soybean market on the global front. It’s not even close.
It would be nice if we had the deal in writing so we knew exactly what was going to happen.
Instead, we got this handshake agreement that lacks details and leaves everyone guessing trying to put the pieces together.
It definitely has the potential to be a game changer, but you do have to have some reasons to have some doubt on the actual impact it'll have and how it'll all play out.
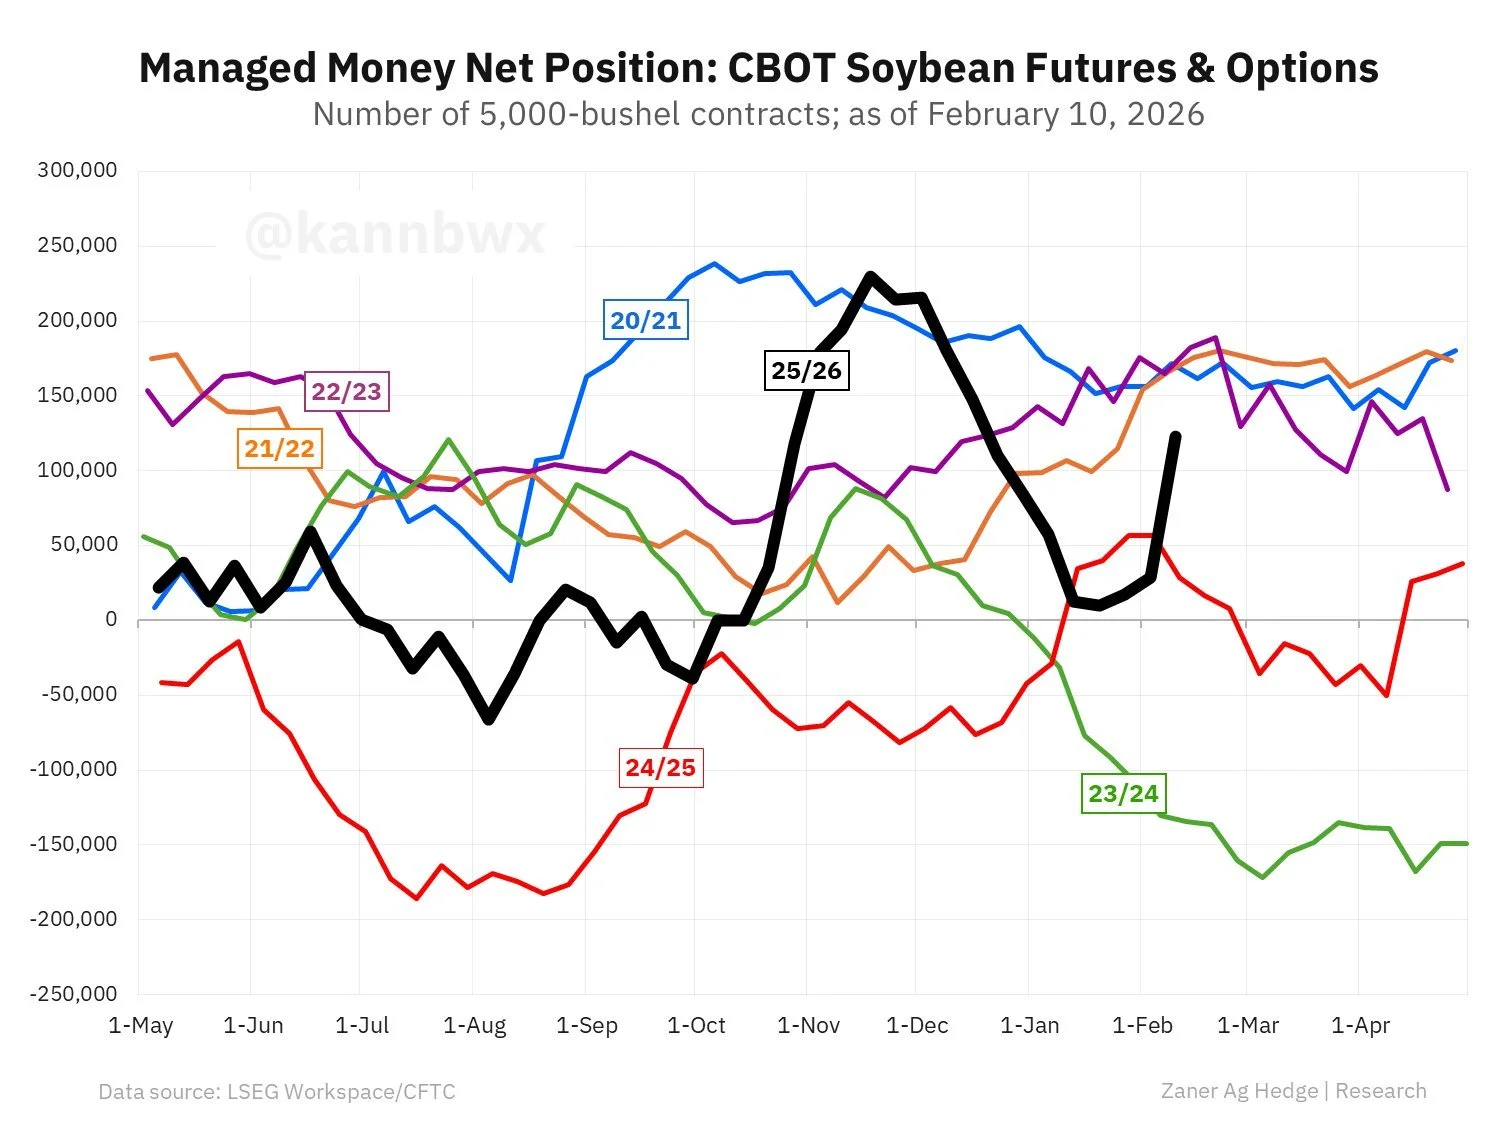
Funds Update
The CTFC data was released this afternoon.
The funds are long 123k contracts of soybeans.
A huge +94k increase from the week prior.
Their position back in November was 230k.
Last time no one was aware that they were near record long as the government was shutdown along with this data.
Chart from Karen Braun
Technicals:
May is now the leading contract with the most volume.
We are still sitting at the last retracement level up to those November highs.
Break above and the next point of interest is those highs.
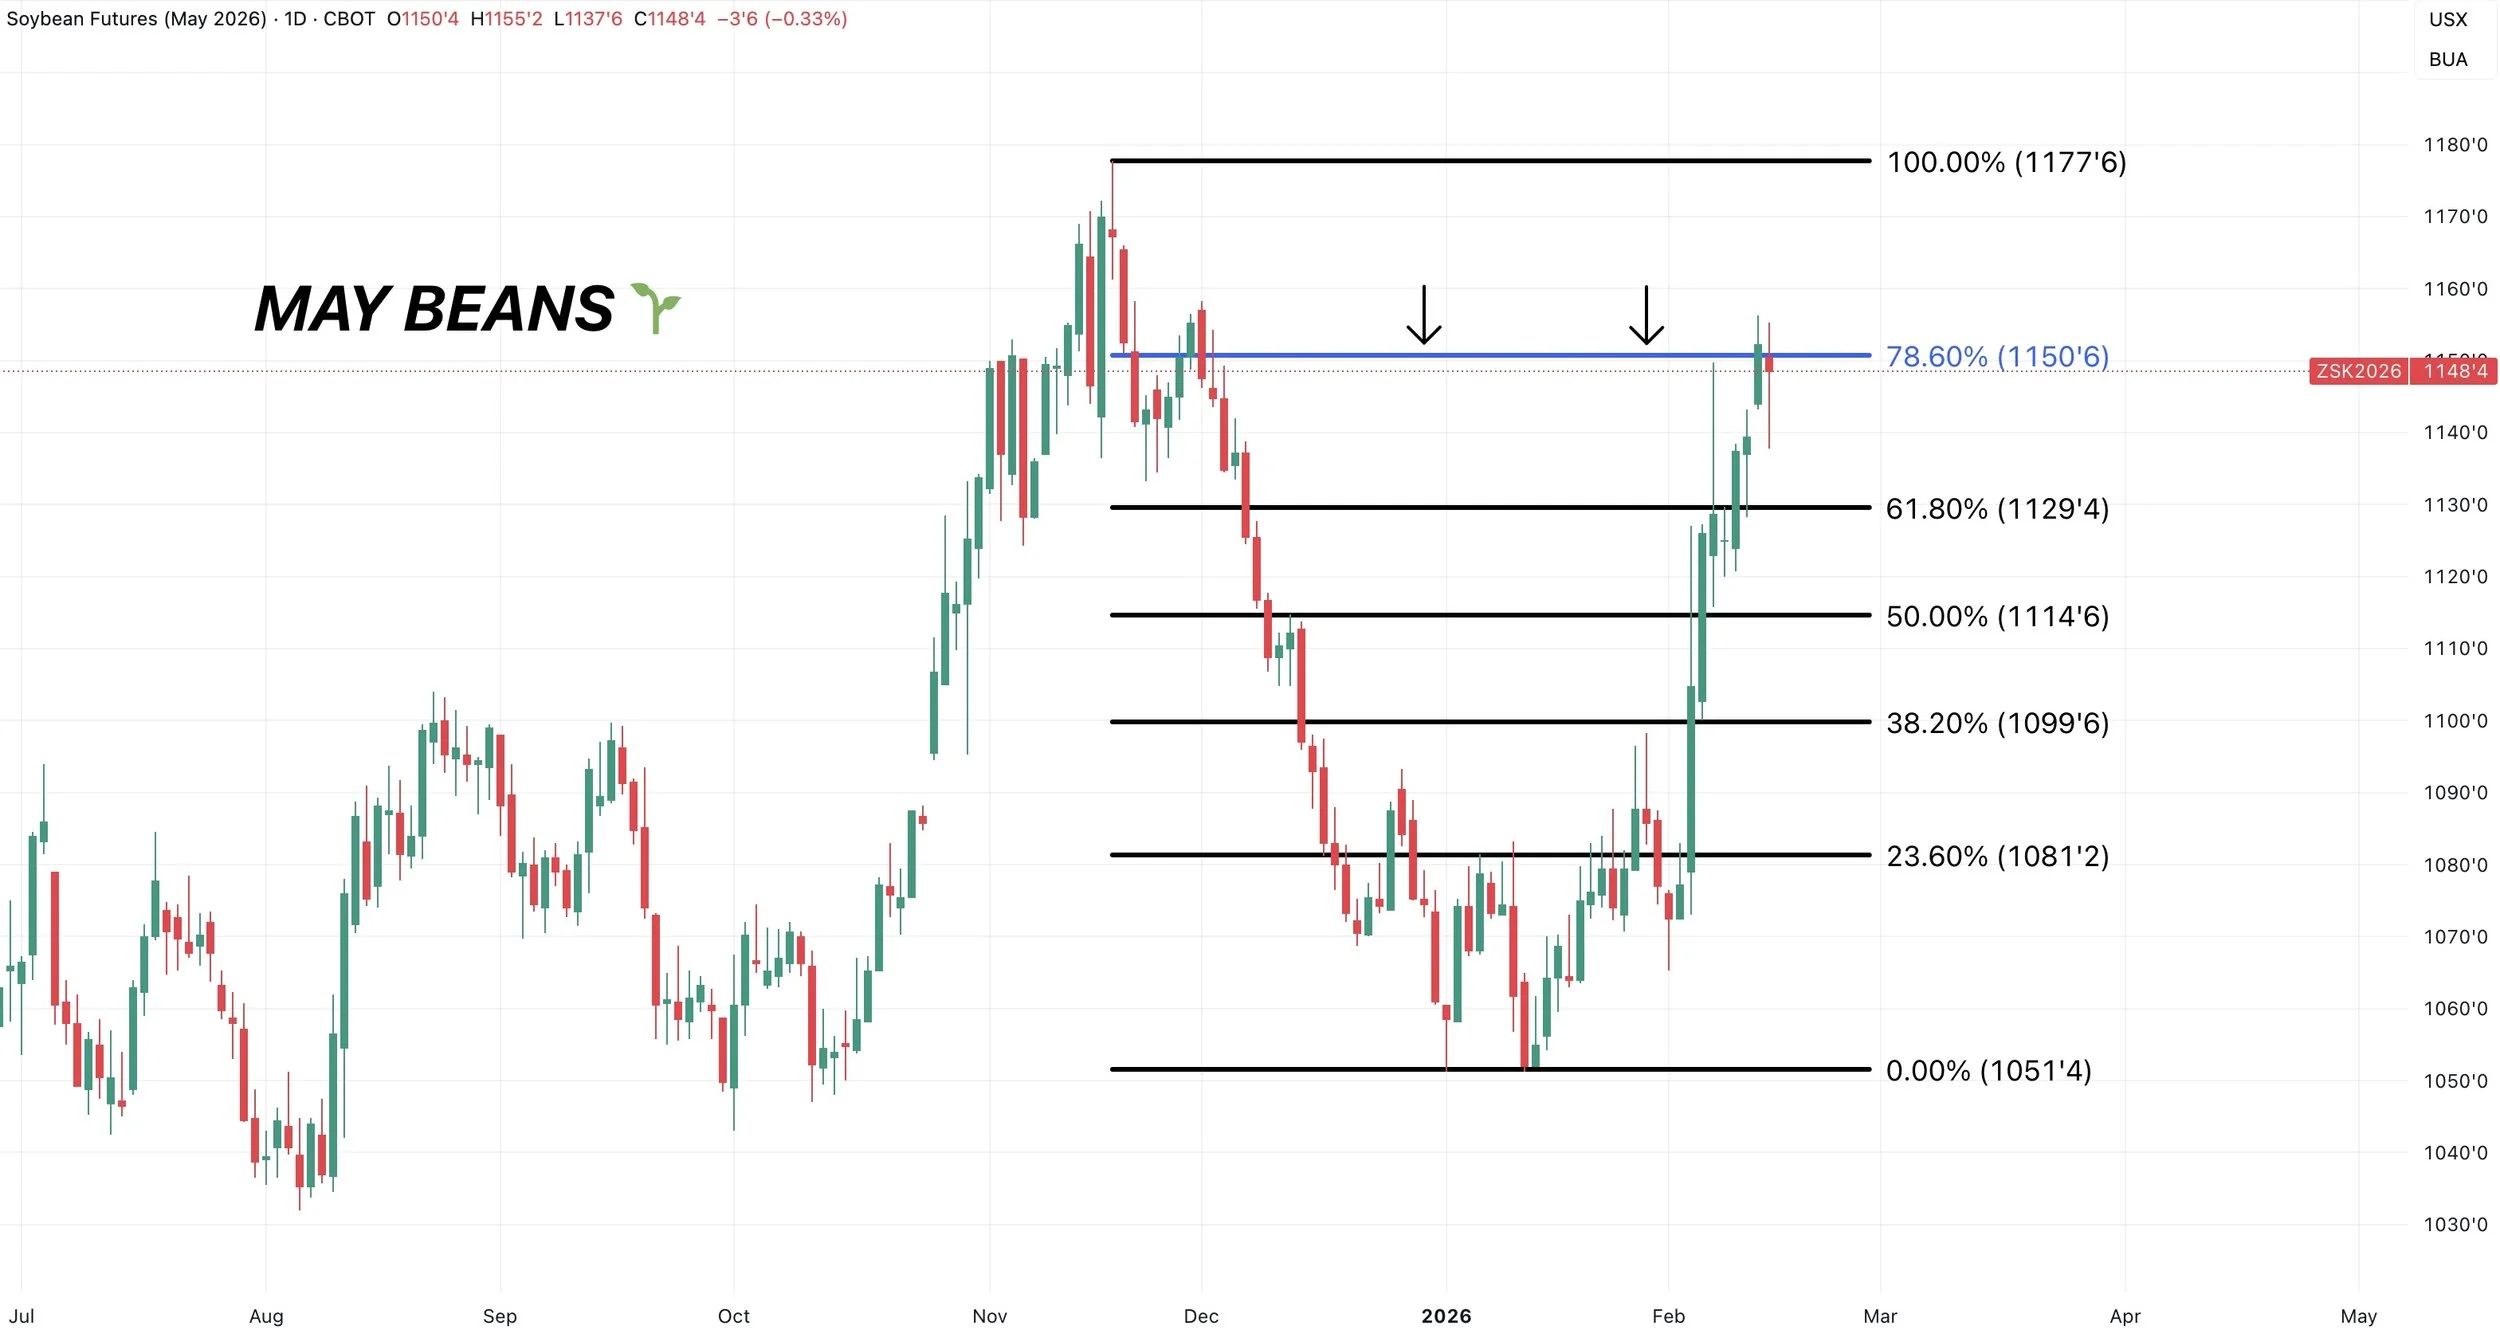
We had that old crop sell signal last week on the big pop. So I do still like taking some risk off the table if you have not done so yet.
It simply makes sense to reward this size of rally in some sort of manner. If we go higher, we'll de-risk further. But don’t do nothing on a +$1.00 rally from a tweet.
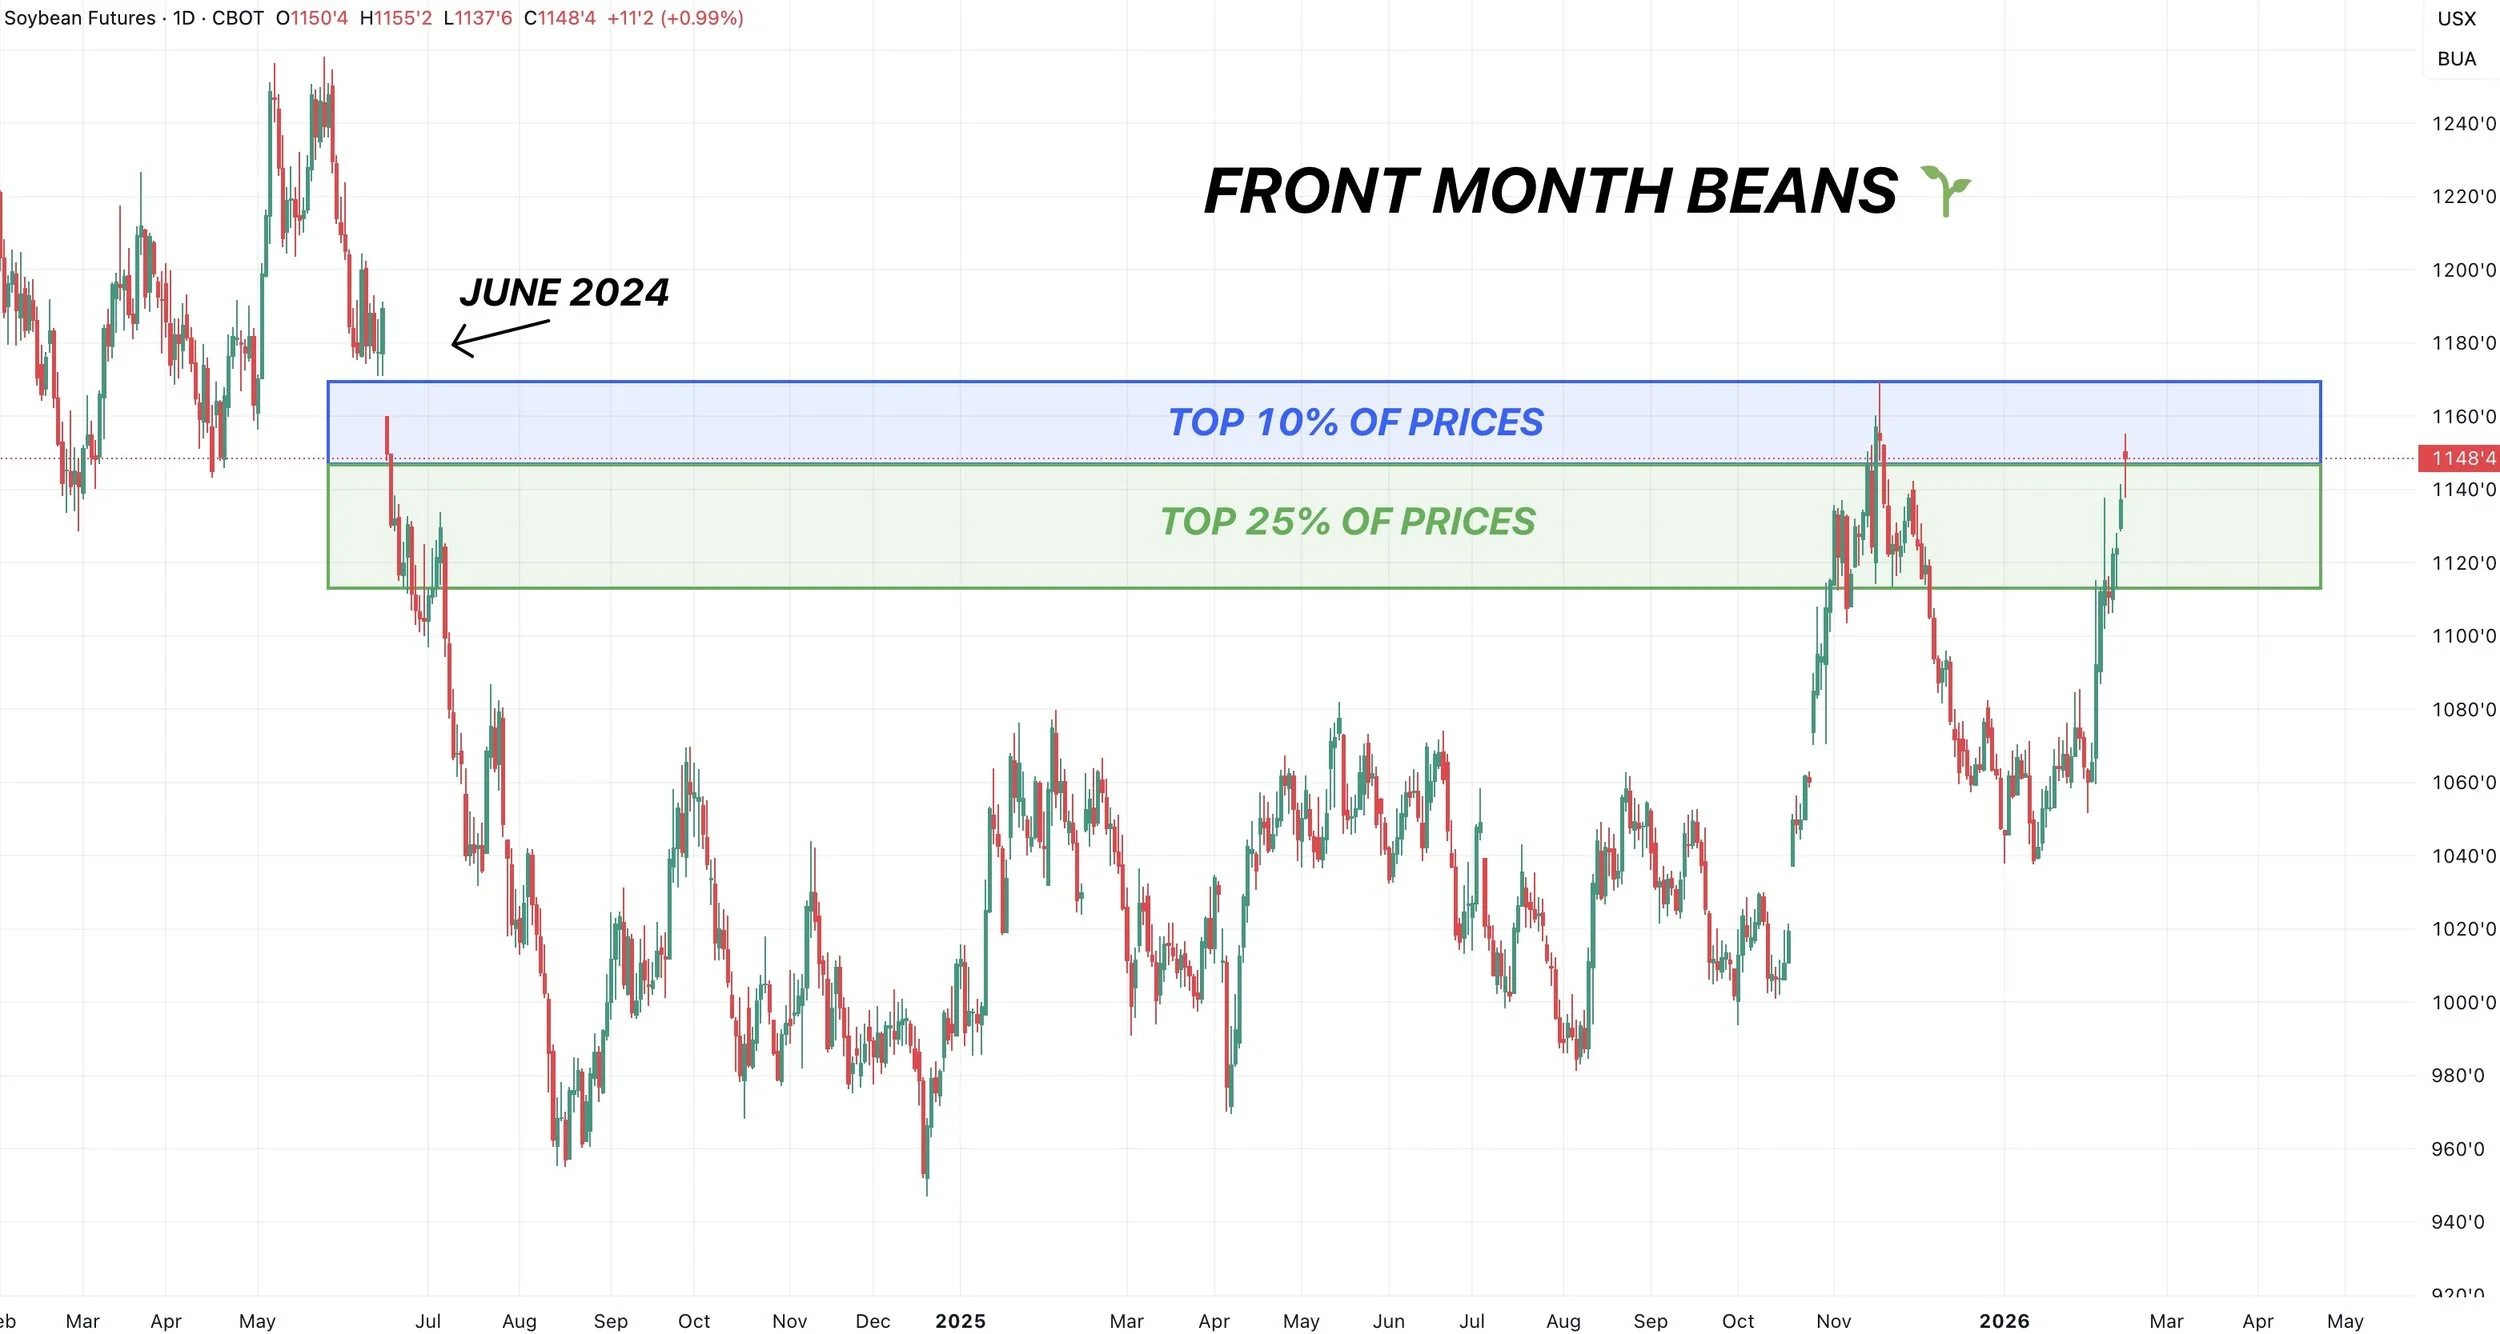
There are several saying this rally in soybeans isn’t justified fundamentally, and there are plenty of question marks.
We are in the top 10% of prices we've seen since spring of 2024.
The top 10% is never the worst spot to start taking some chips off the table.
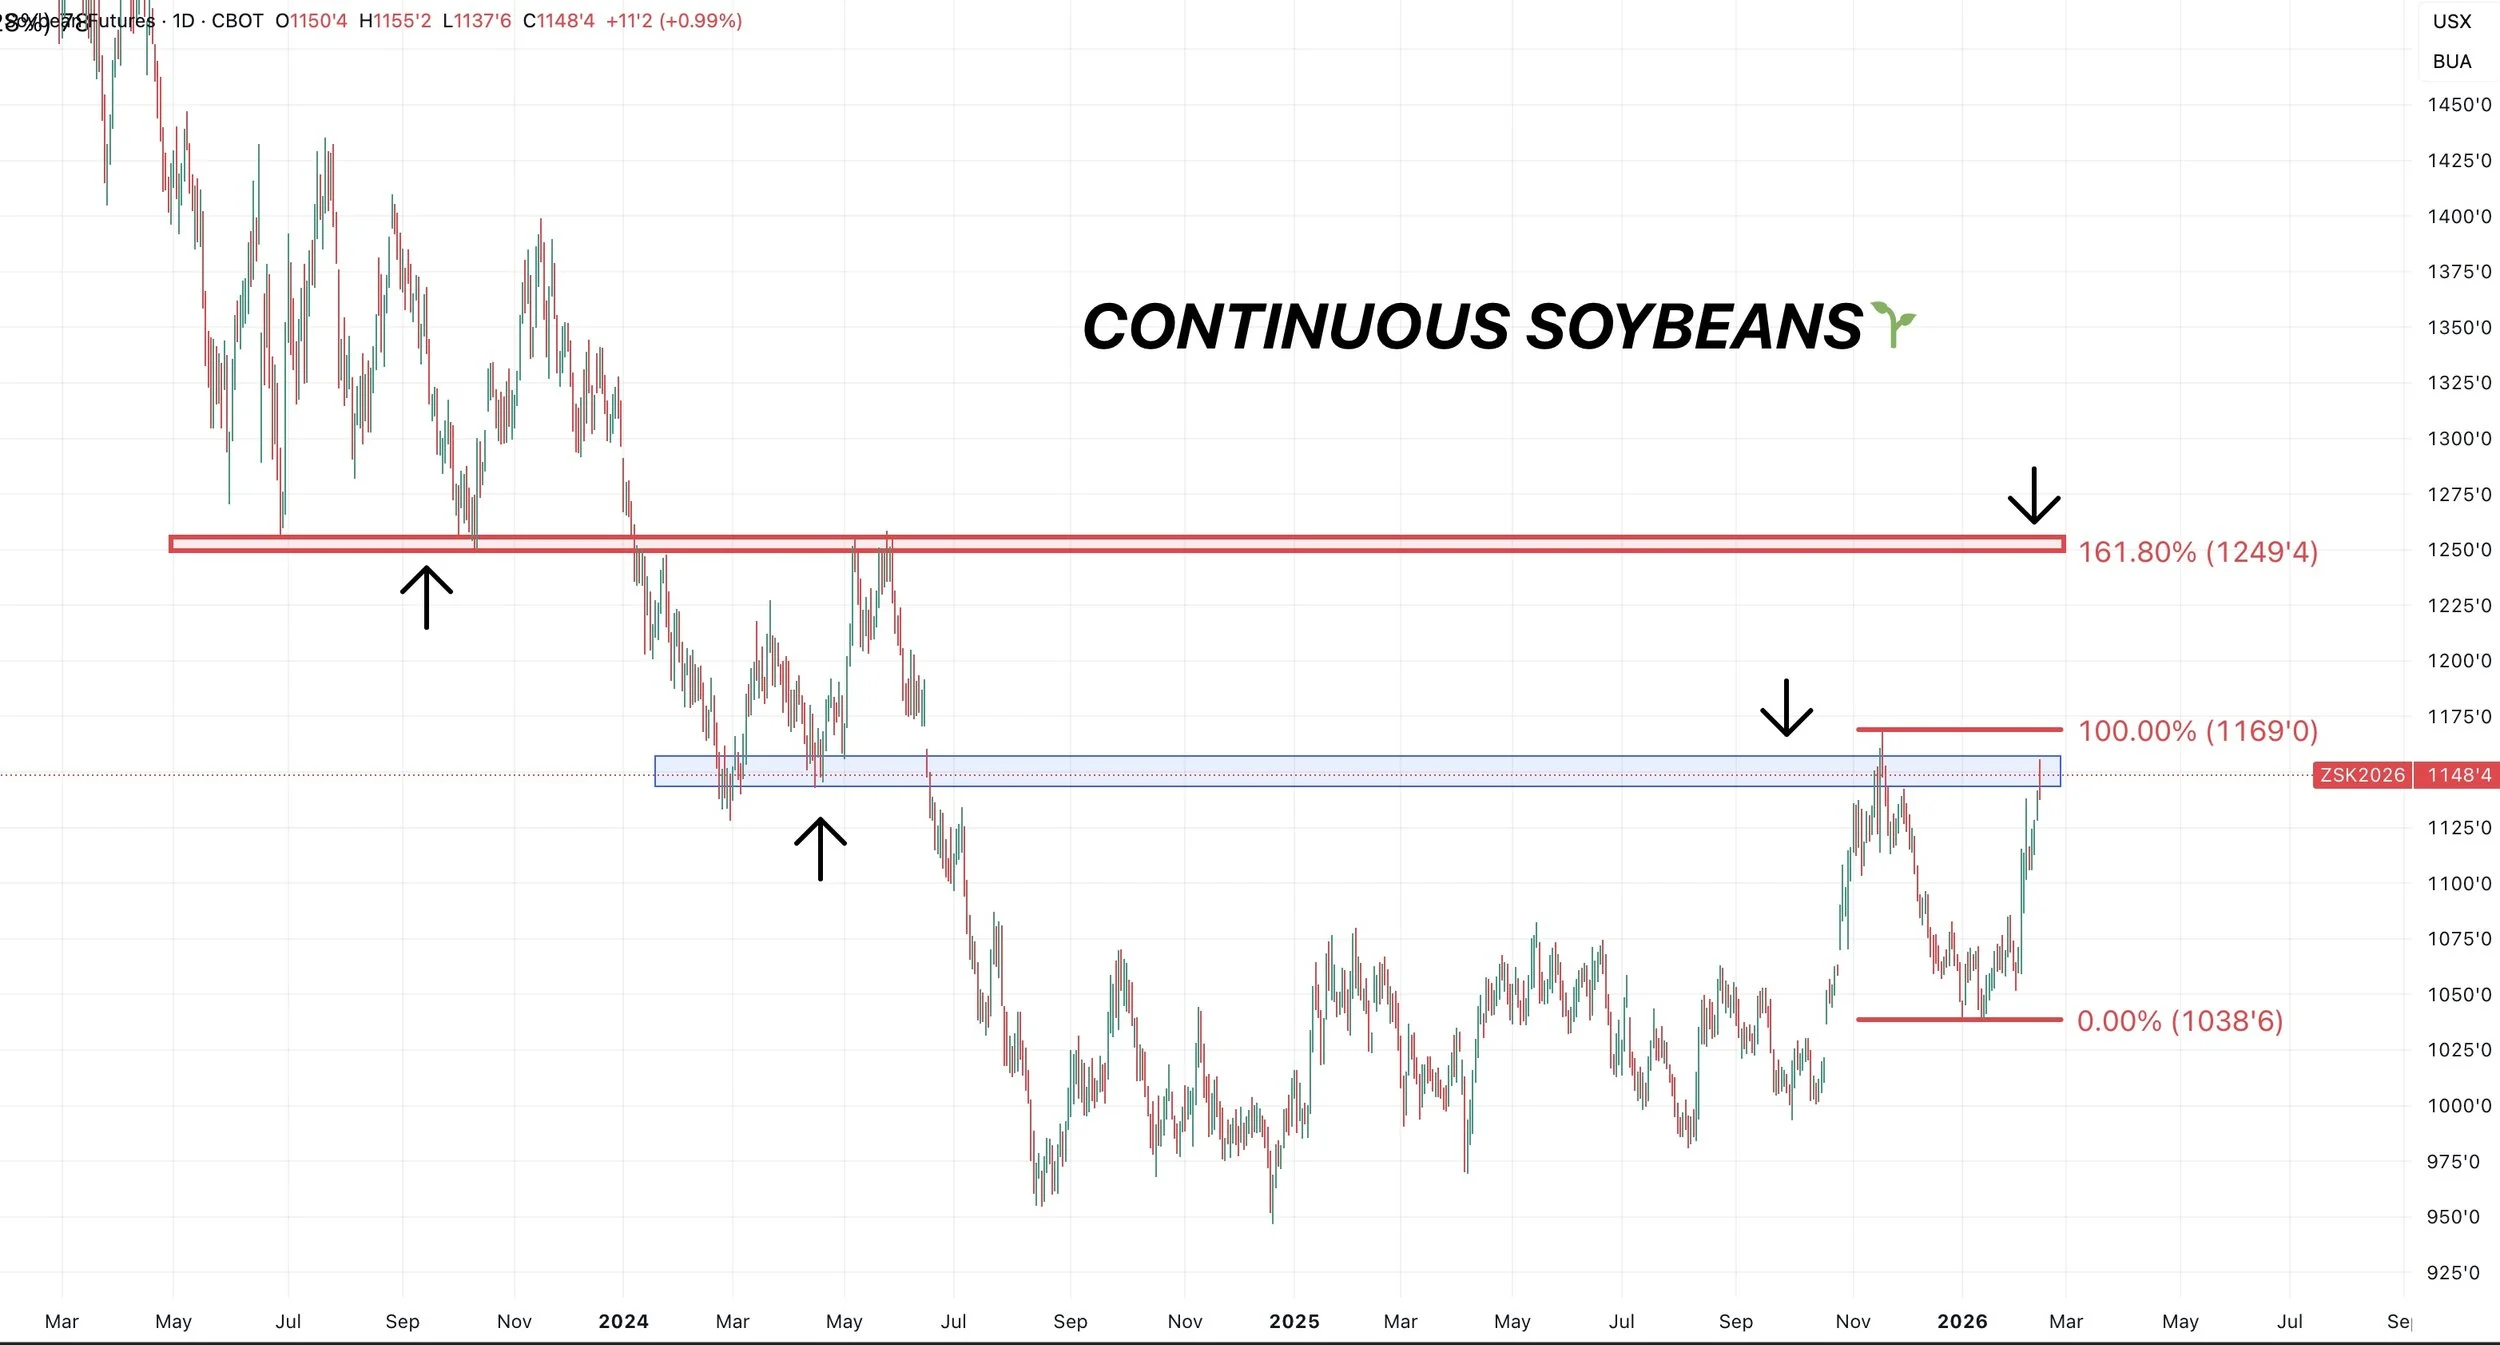
But let's just say the soybean situation does get really bullish and the rally continues.
What are some levels we should be looking at?
Here is the continuous chart.
First, you of course have the $12.00 psychological level.
If you take the recent lows up to those November highs, the 161.8% fib extension comes in around that $12.50 level.
That is called the golden fib extension.
This same level is prior support and resistance.
That would be a longer term big picture target.
However, we are currently battling a big level. Those November highs and our early 2024 lows that we need to break above first. We have some clear resistance here.
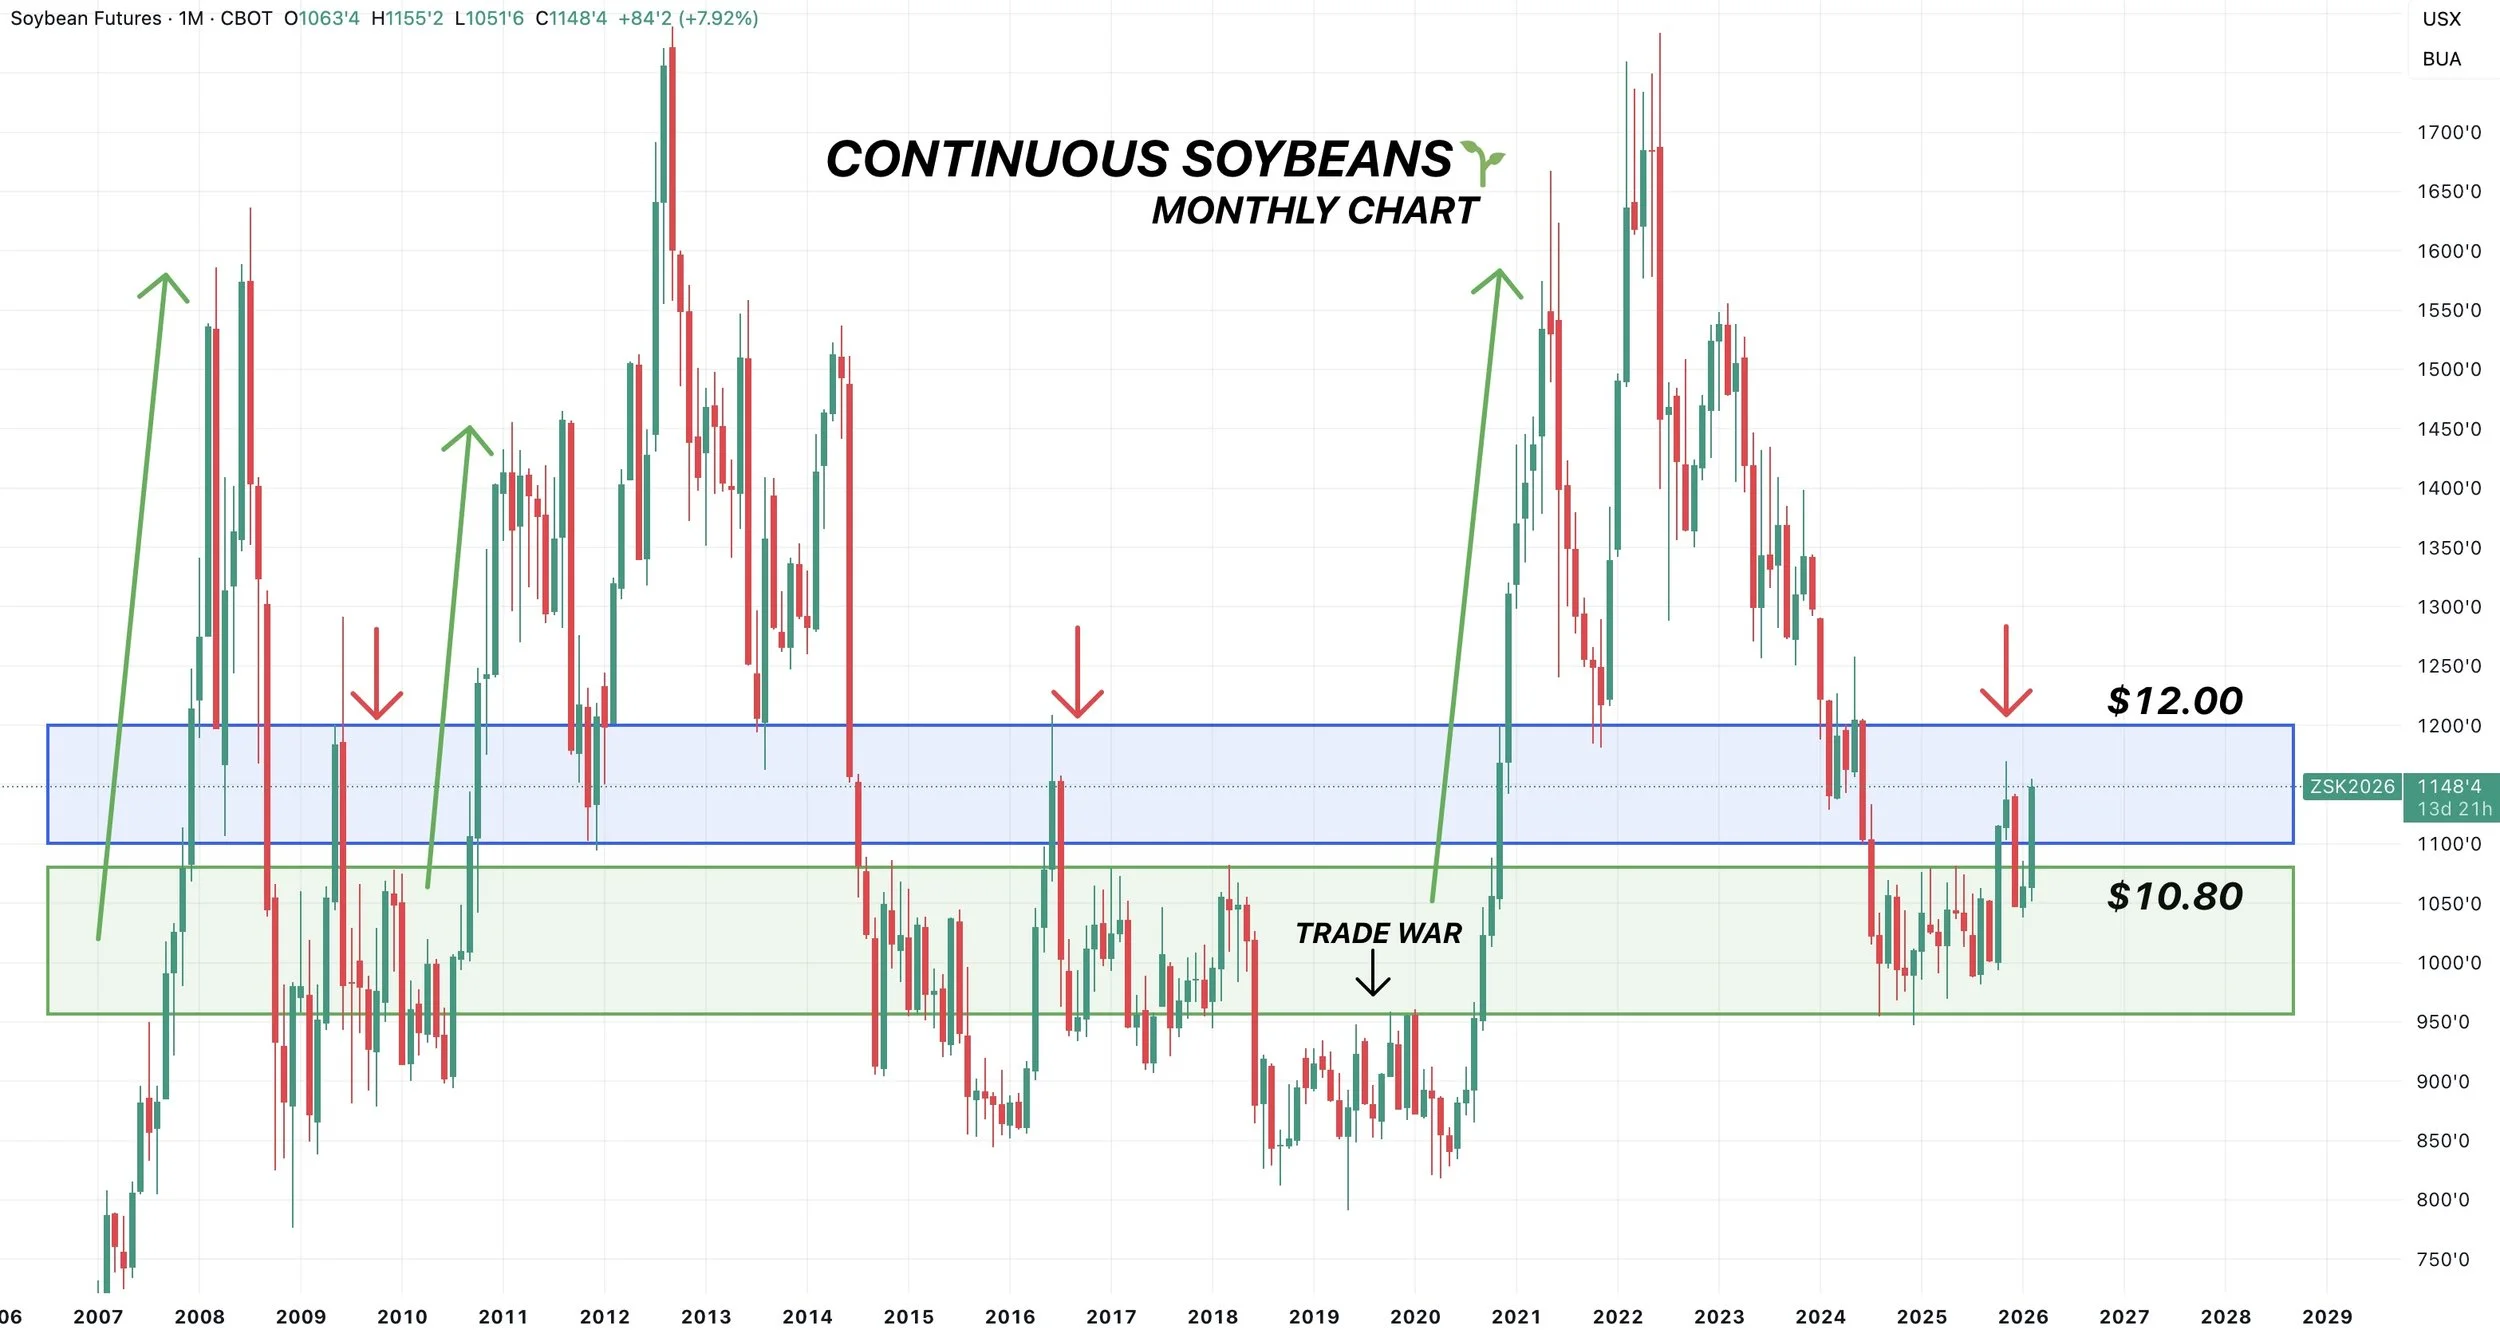
Zooming out.
This market was range bound for over a year.
Finding life at our trade war resistance.
We're now back out of that range.
You might remember us talking about this last year.
We simply rarely trade in the $11.00's.
Every single time this market has broken above $10.80 (green box) it has never stopped in the $11.00's.
It has always went to $12.00 or higher (top of blue box).
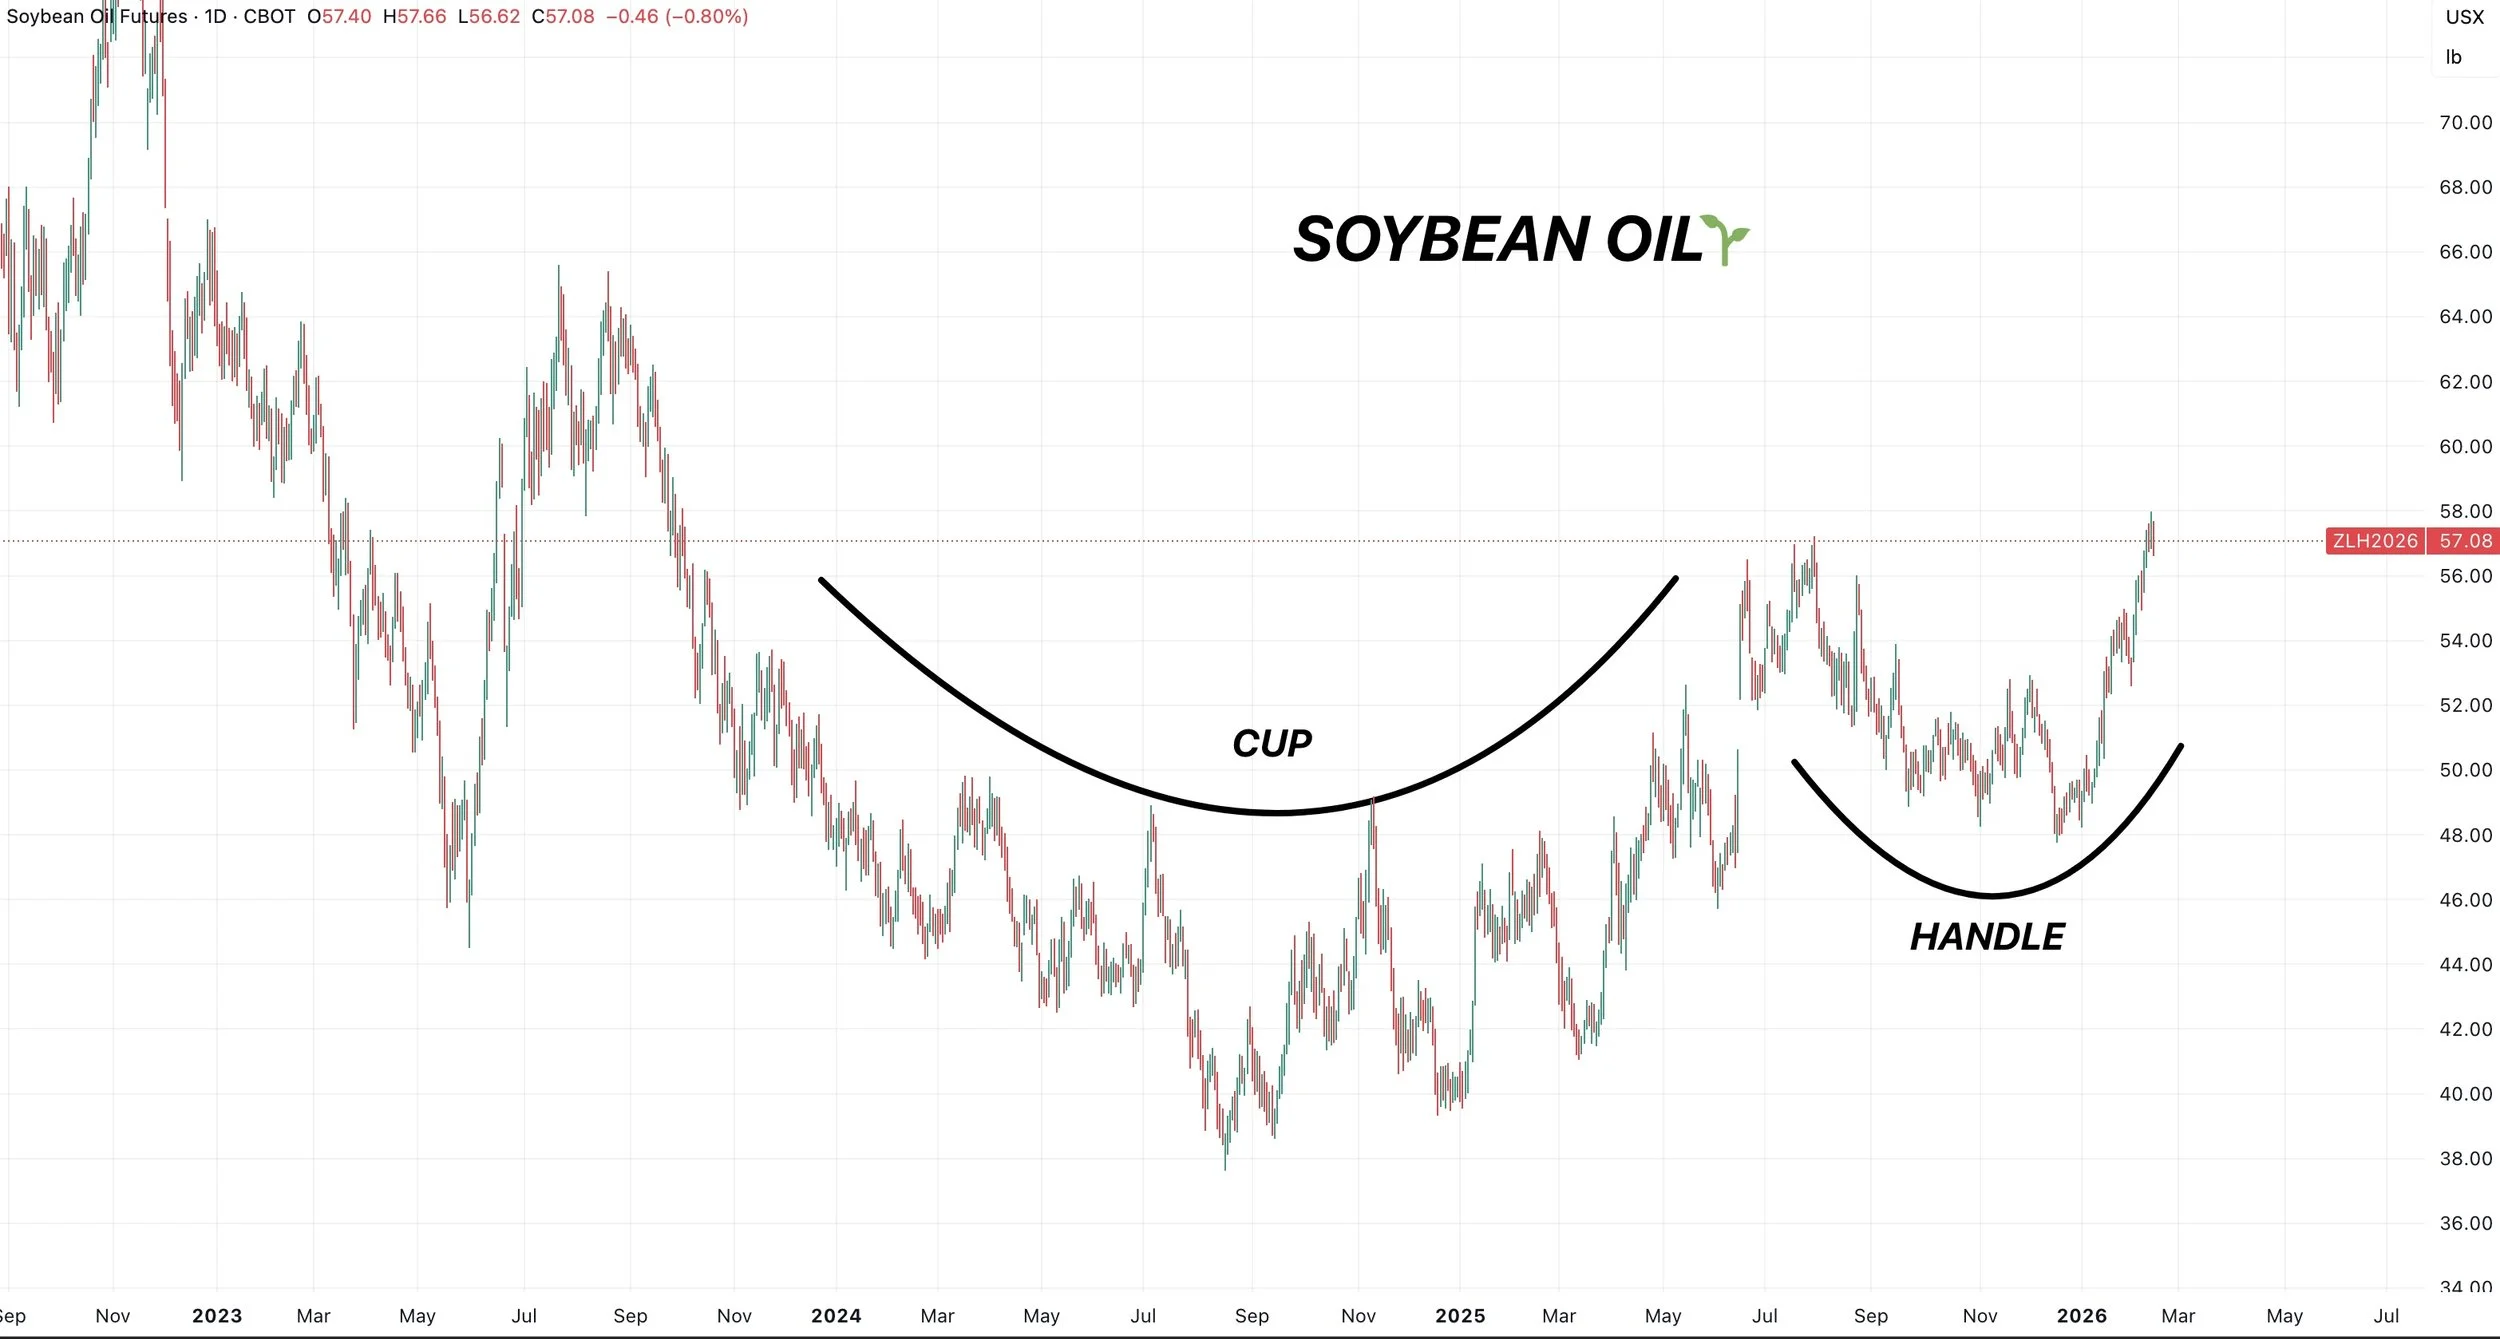
Soybean Oil: Cup & Handle?
The bean oil chart looks pretty friendly.
If it continues to run, it could continue to add some support to the soybean market.
We've got a potential cup and handle pattern which is viewed as bullish.
Wheat
Fundamentals:
The rally in wheat has mostly just been technical buying and money flow.
There hasn’t been any one factor and reason behind the rally.
Sometimes, there doesn’t have to be a reason and money flow can trump the fundamentals.
Today we are just going to be going over some targets.
Technicals:
May KC:
We are currently struggling right at those November highs.
We have a clear upward channel now in place.
I am looking to reward a move towards $5.77 to $5.92
The golden zone up to those June highs.
The most common level for prices to revert back to on a relief bounce.
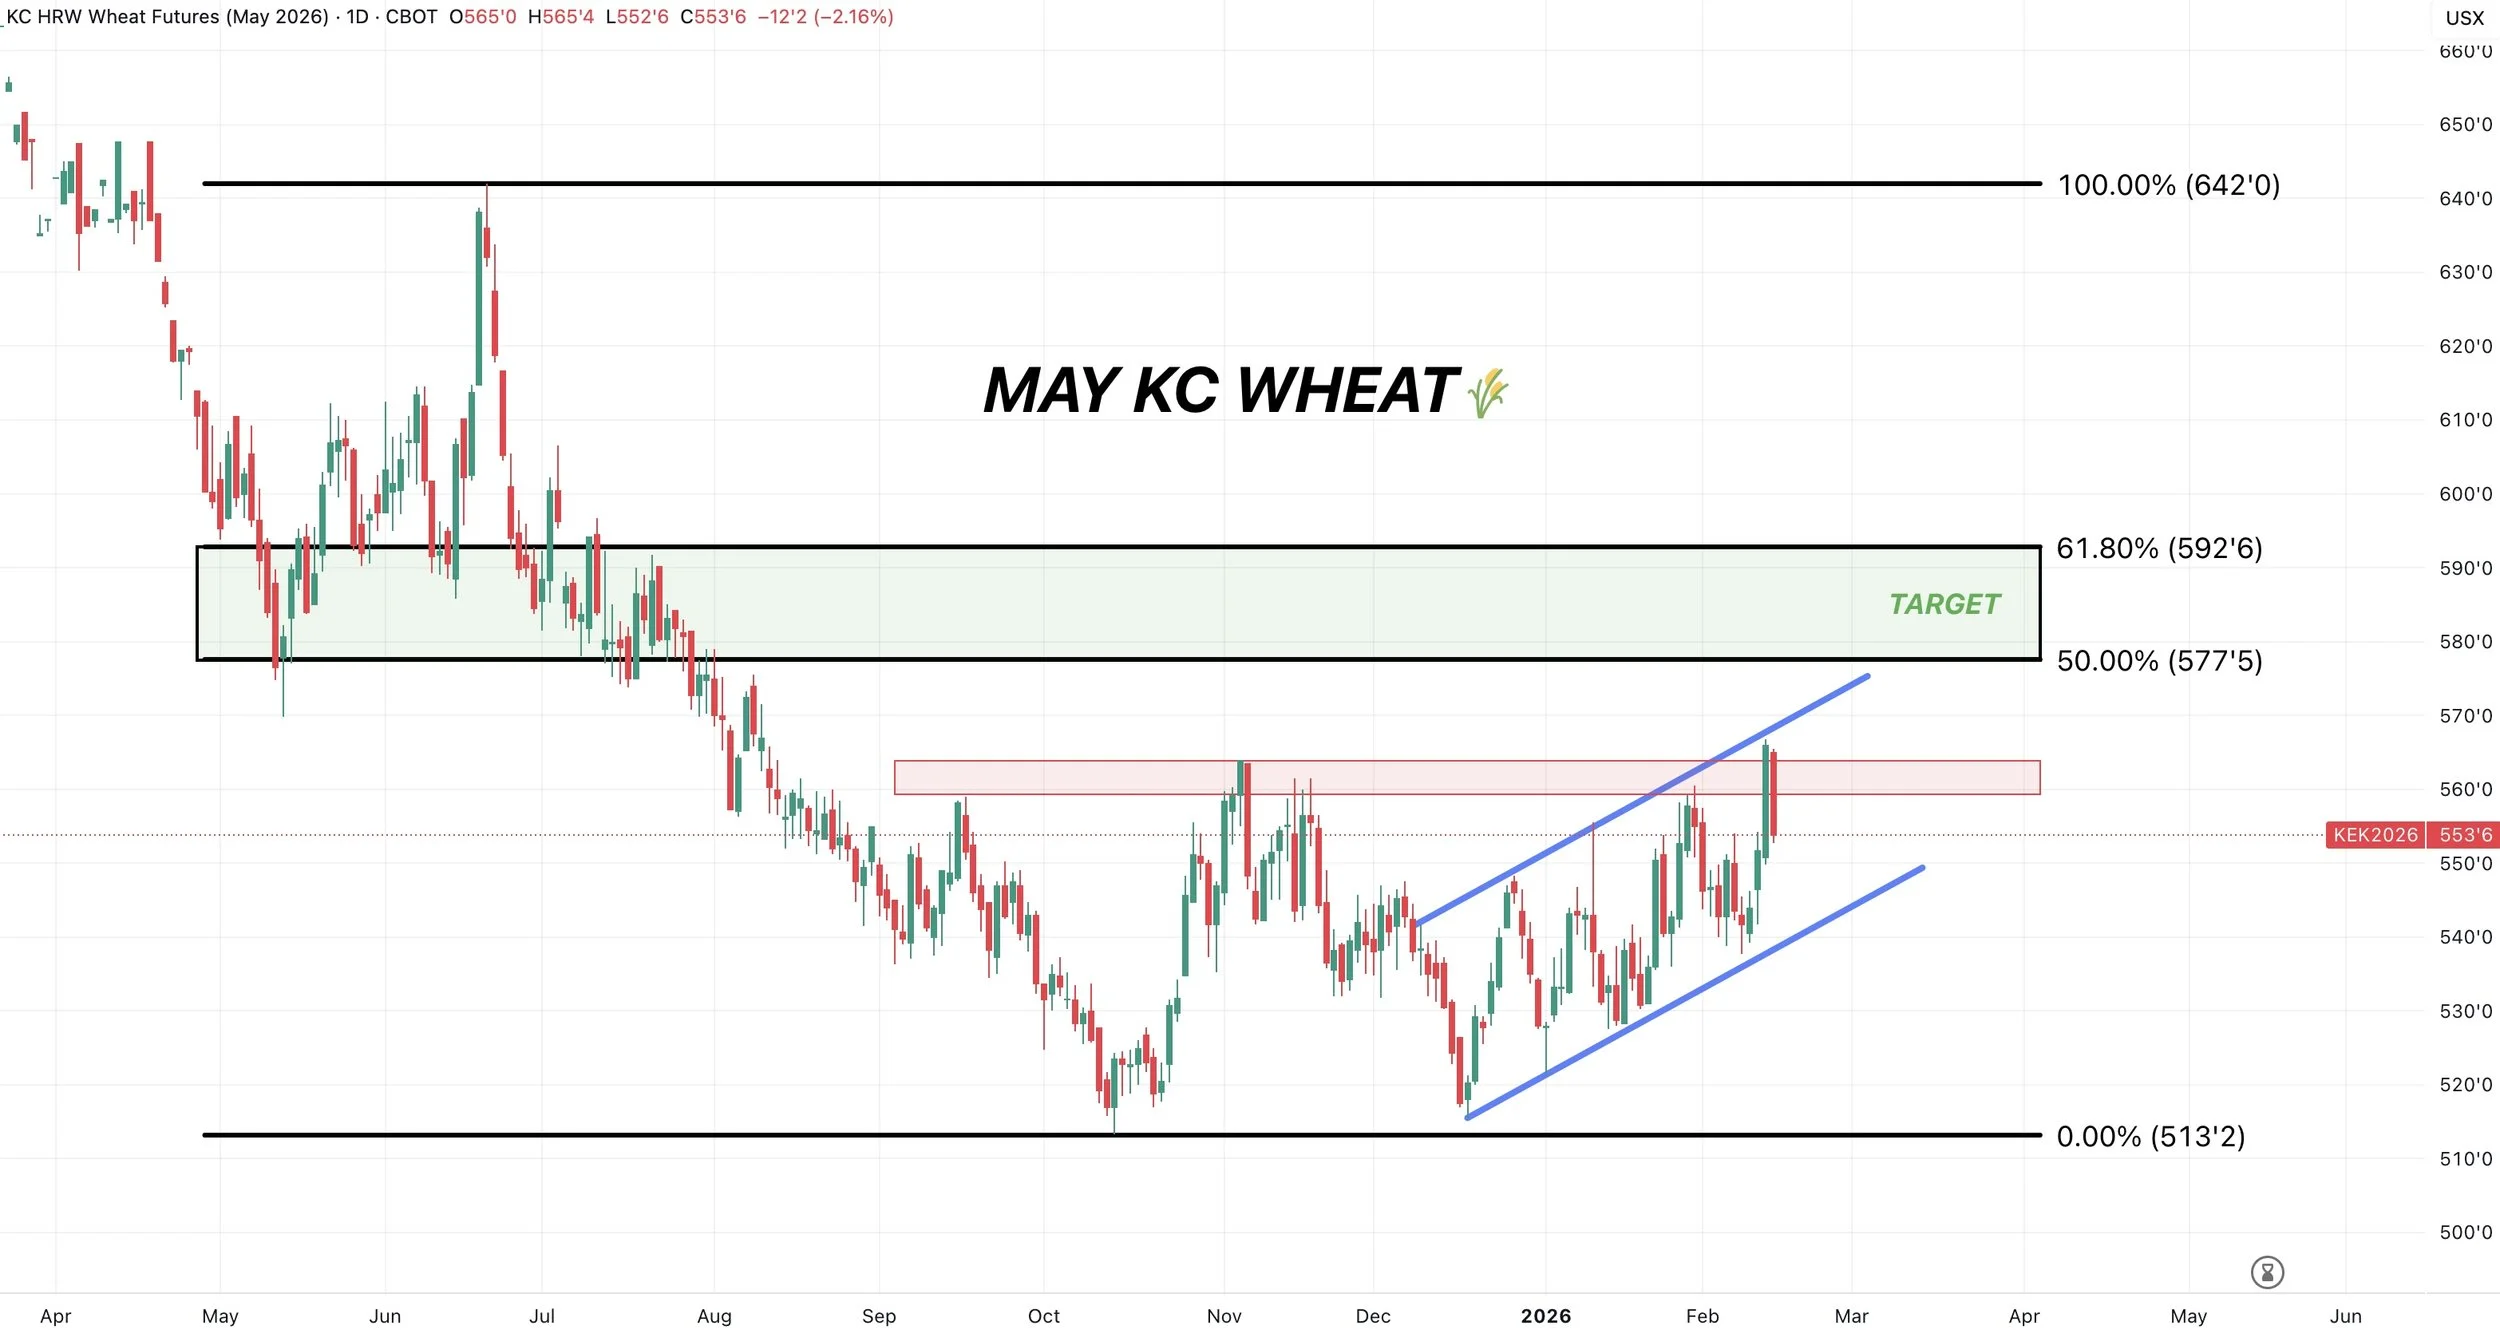
If you go back and look at that June rally, it failed after clawing back 50% of the Feb highs.
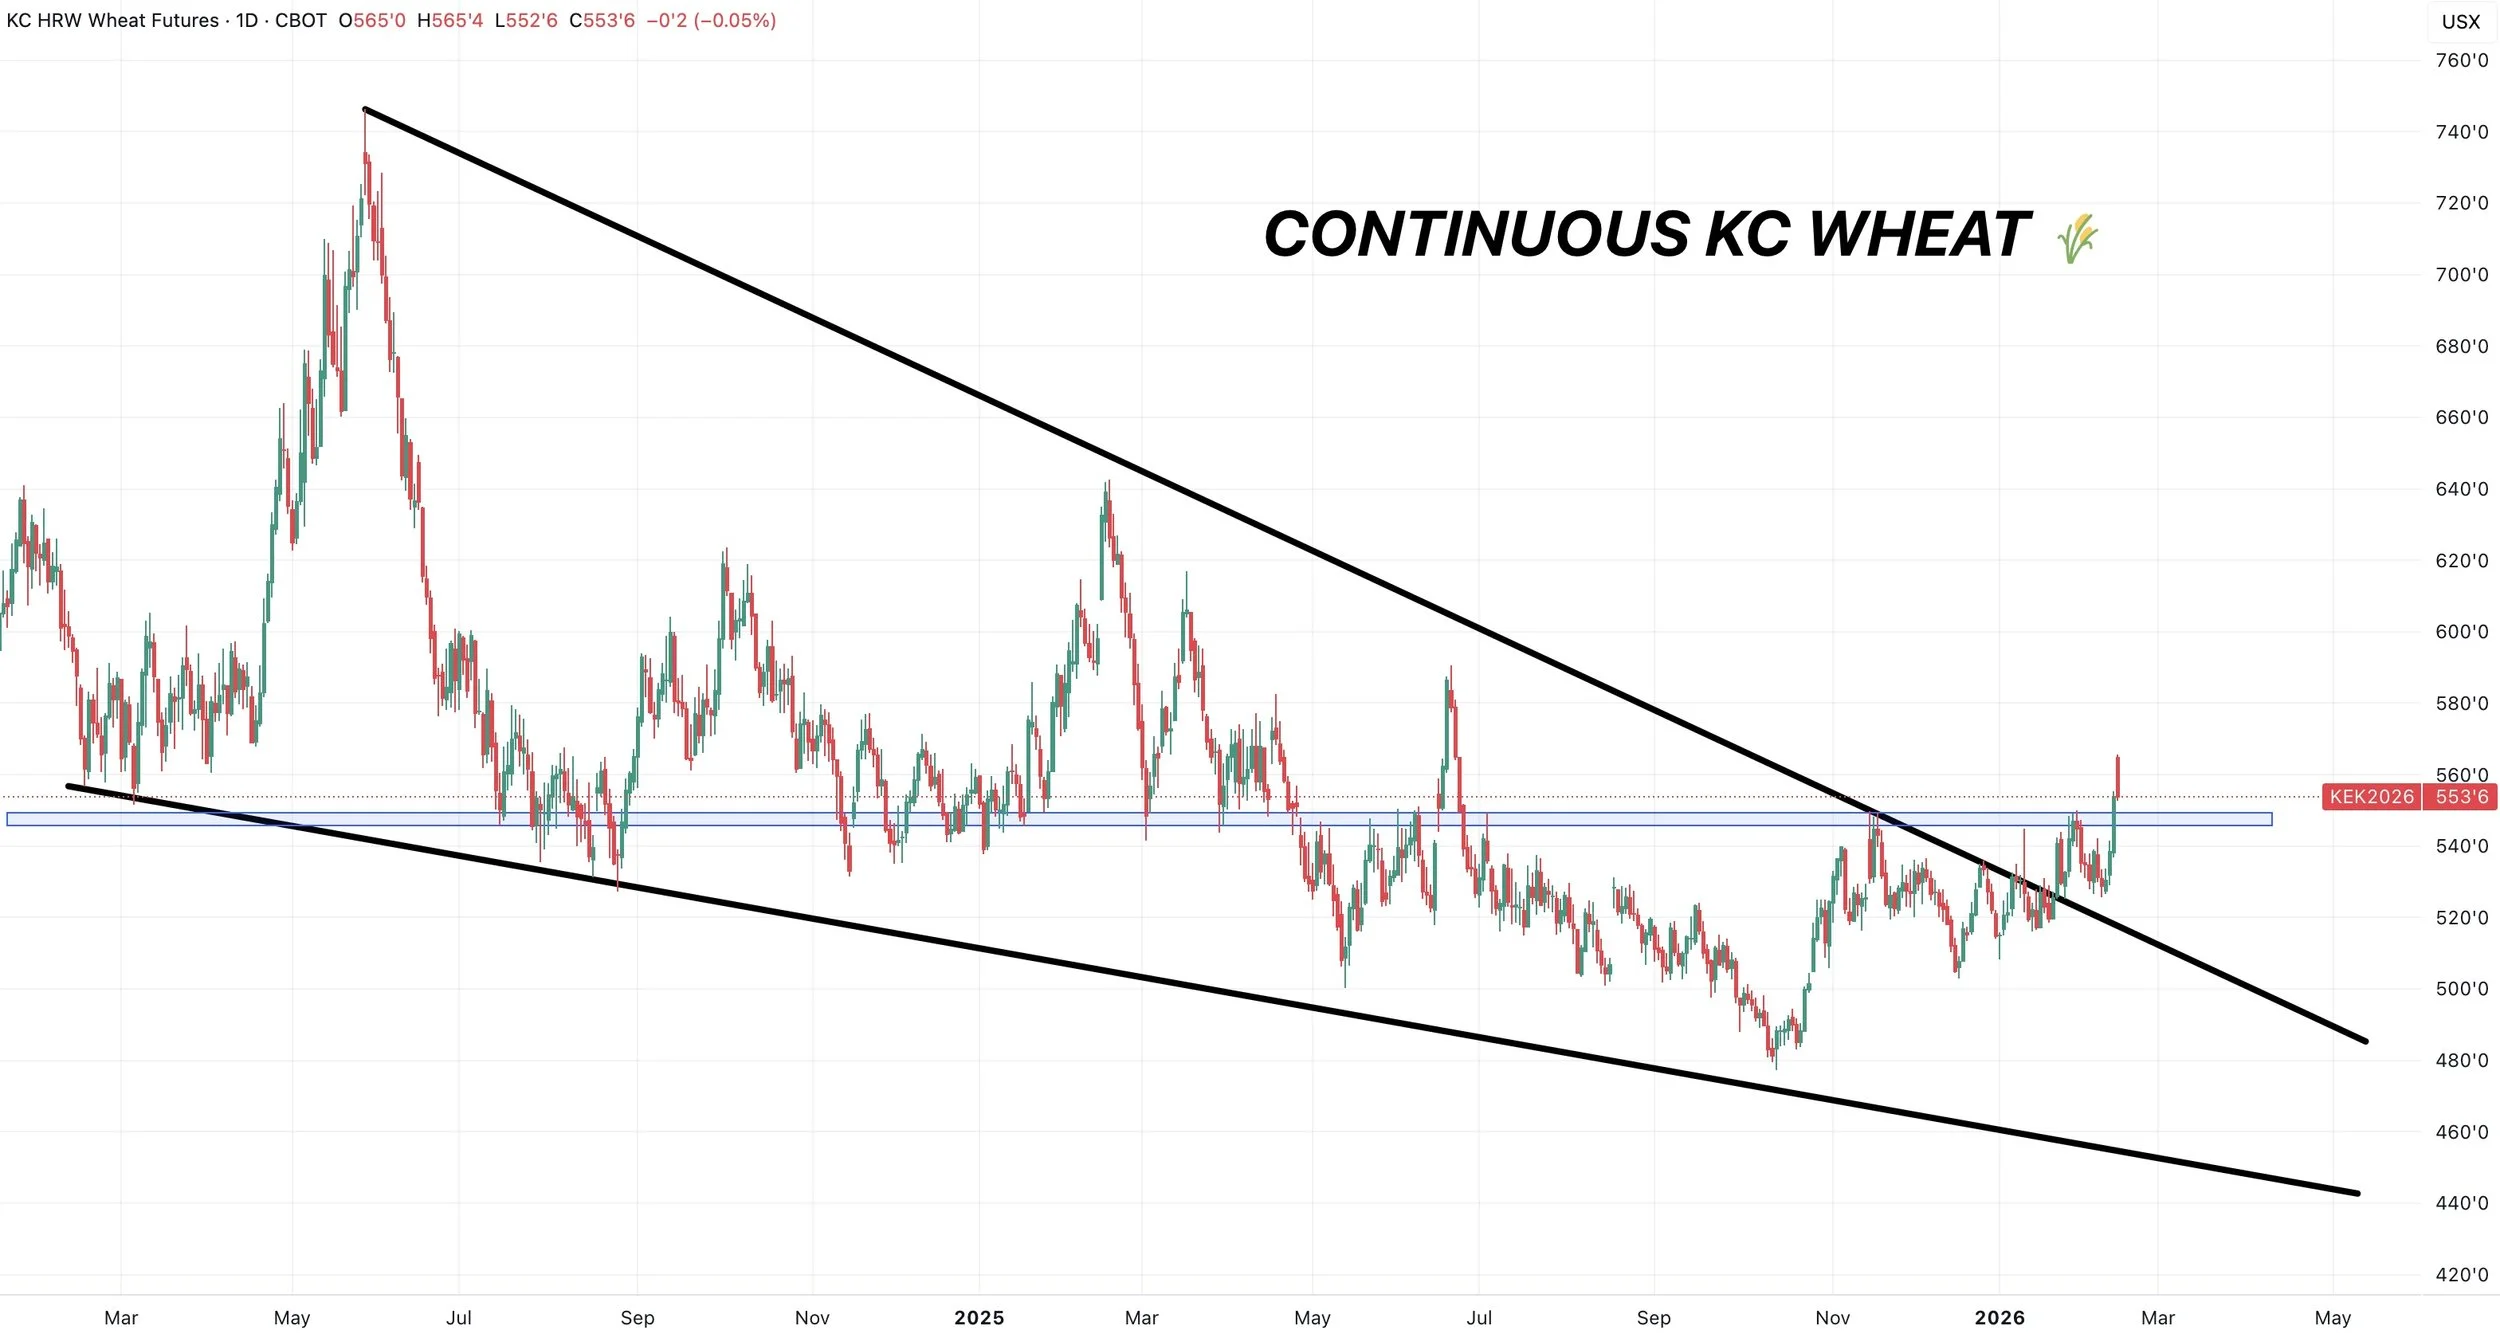
Here is the continous chart.
It looks pretty solid actually.
We broke out of a multi-year wedge pattern.
We also broke above some horizontal resistance.
Trading at it's highest level since June.
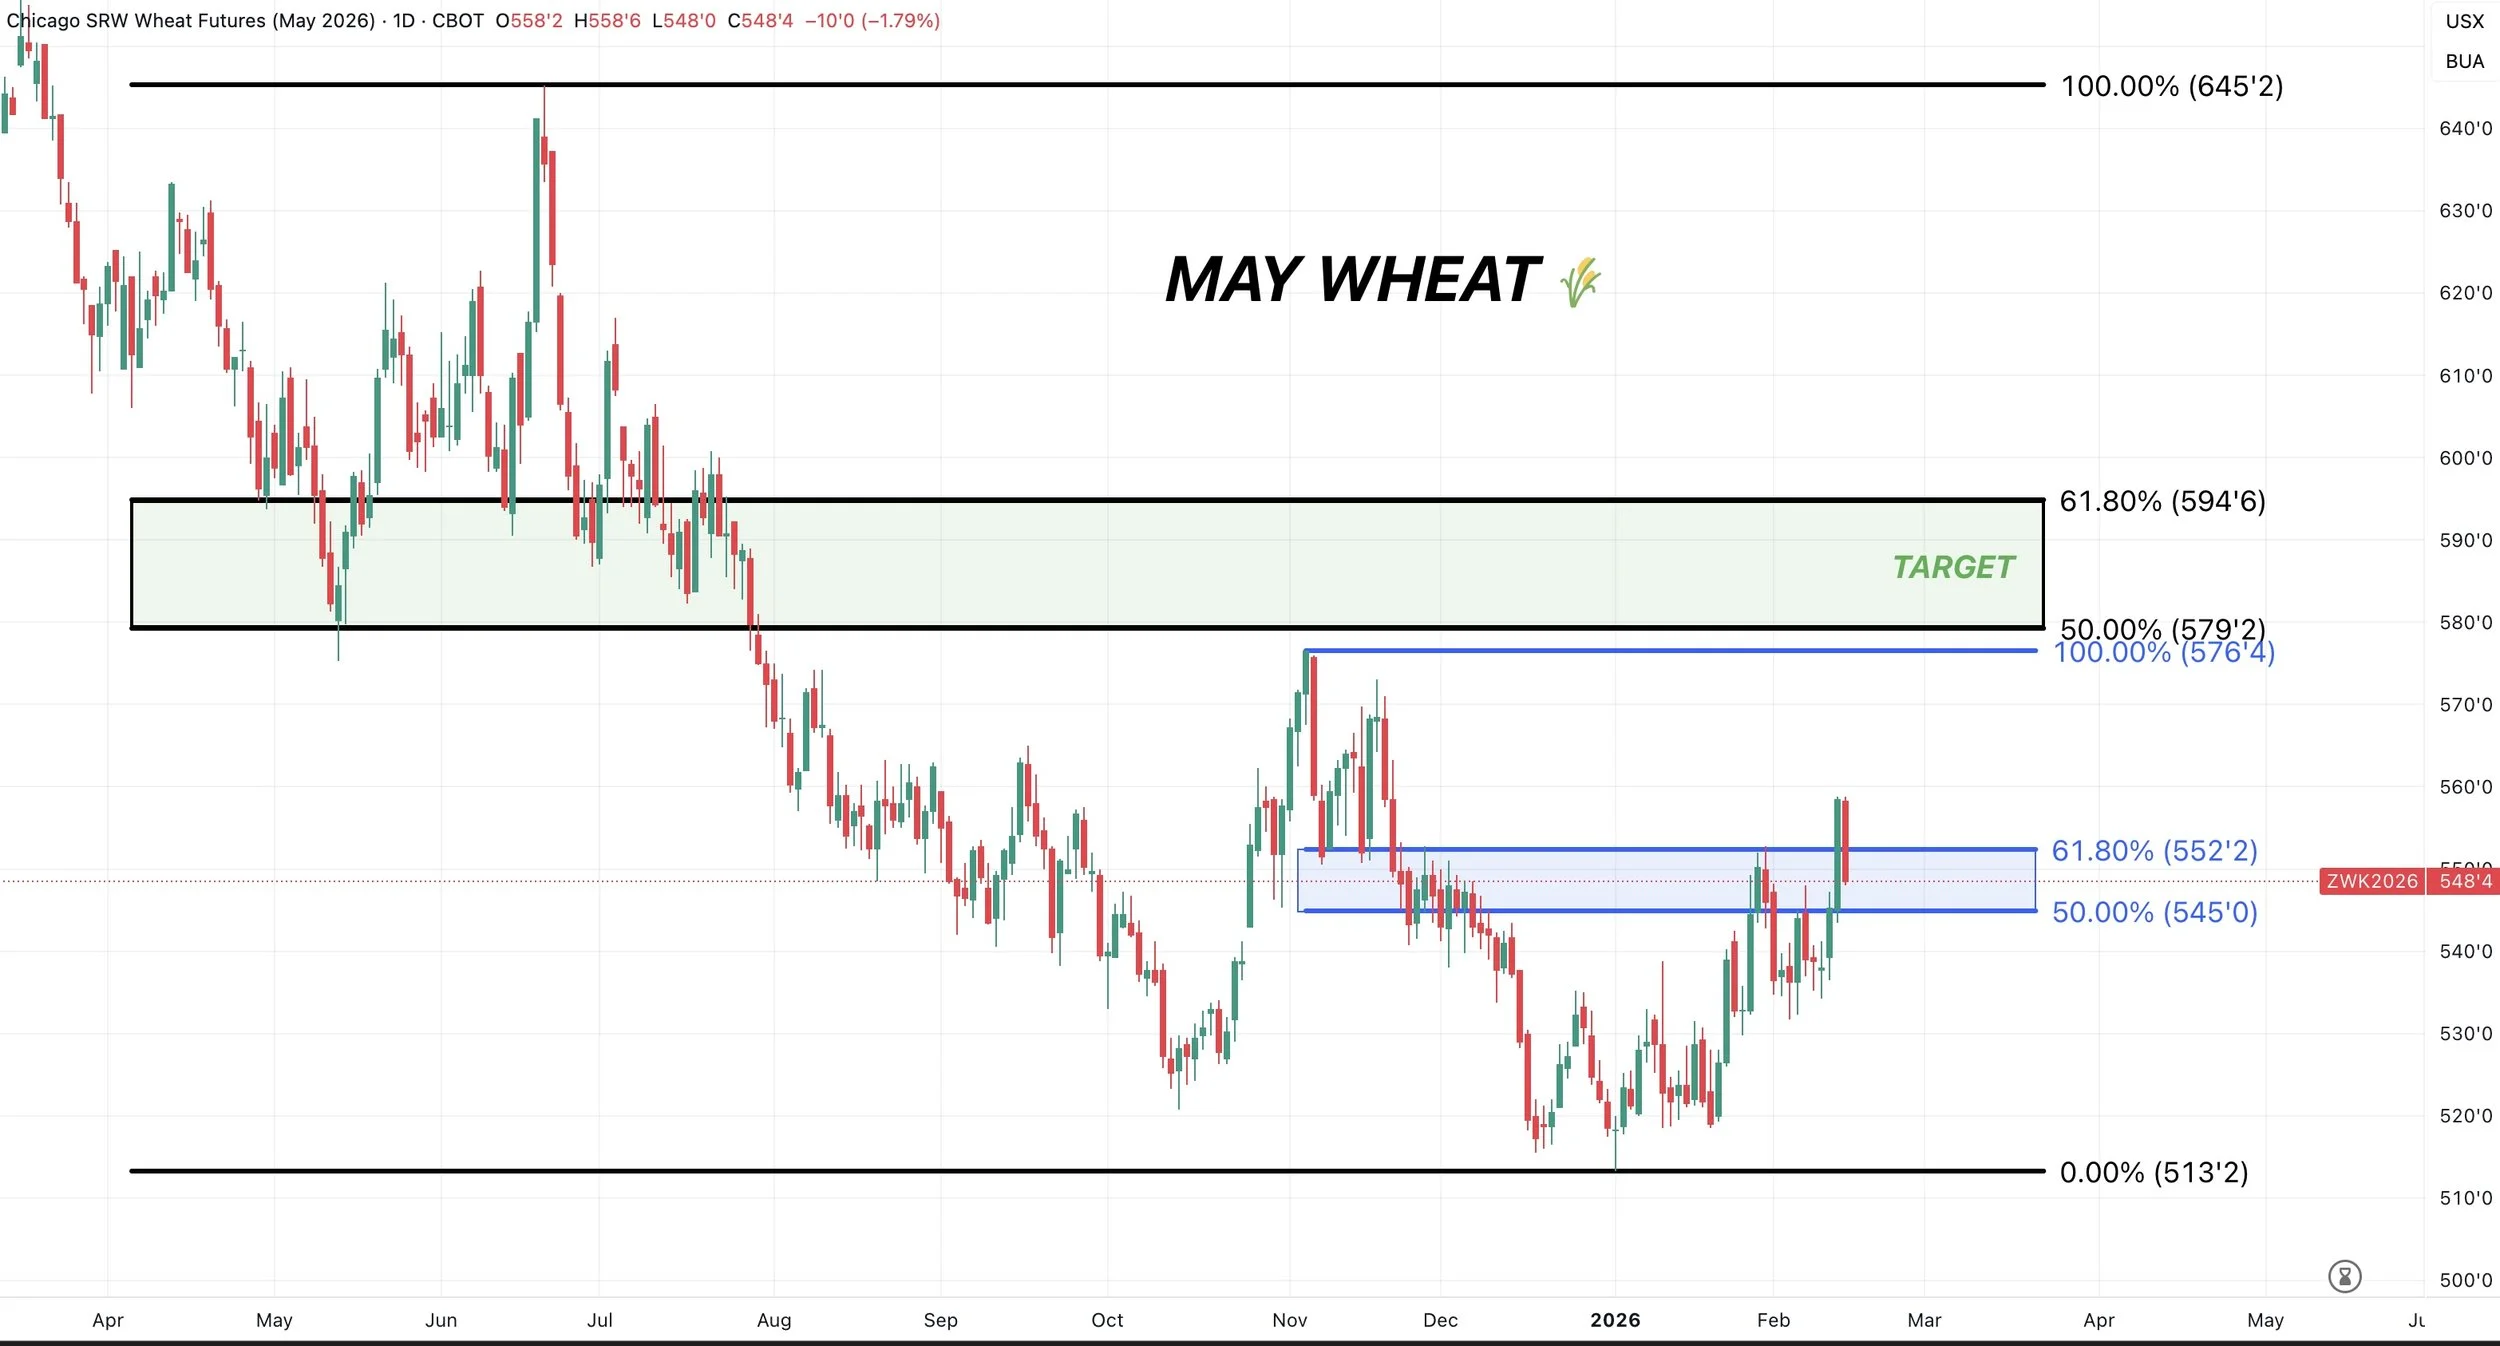
March Chicago:
Looking to reward a move towards $5.79 to $5.95 if it comes.
Cattle
Thoughts from Lauren of Texas Hedge:
"I would say that beef cutout is down on the week and packers are hesitant to pay up for cash cattle this week in front of a holiday week. No cash has traded for the week yet, but expected to be steady to higher. The board has been choppy, failing to move out of this range. Uncertainty still looks over the potential JBS Greenley strike but as of right now nothing is scheduled. That could change at any time."
Overall I am still very cautious in cattle. I'm just not sure what could drive us past those highs. It feels like we'd need an outside catalyst to do so.
If you're the funds, I am not sure how confident you'd be driving this thing up to new record highs with all of the headline risks.
The US is releasing millions of sterile male flies over South Texas and the border in an attempt to lower the population of screwworm flies.
Them doing this means they are scared it is going to show up in Texas, and it almost feels "when" not "if" it will show up.

If you missed it, early this week Lauren put together a nice video that goes over her upside and downside targets. So check that out if you haven’t:
Link to Lauren's Video
As for the charts, I don’t have much to update.
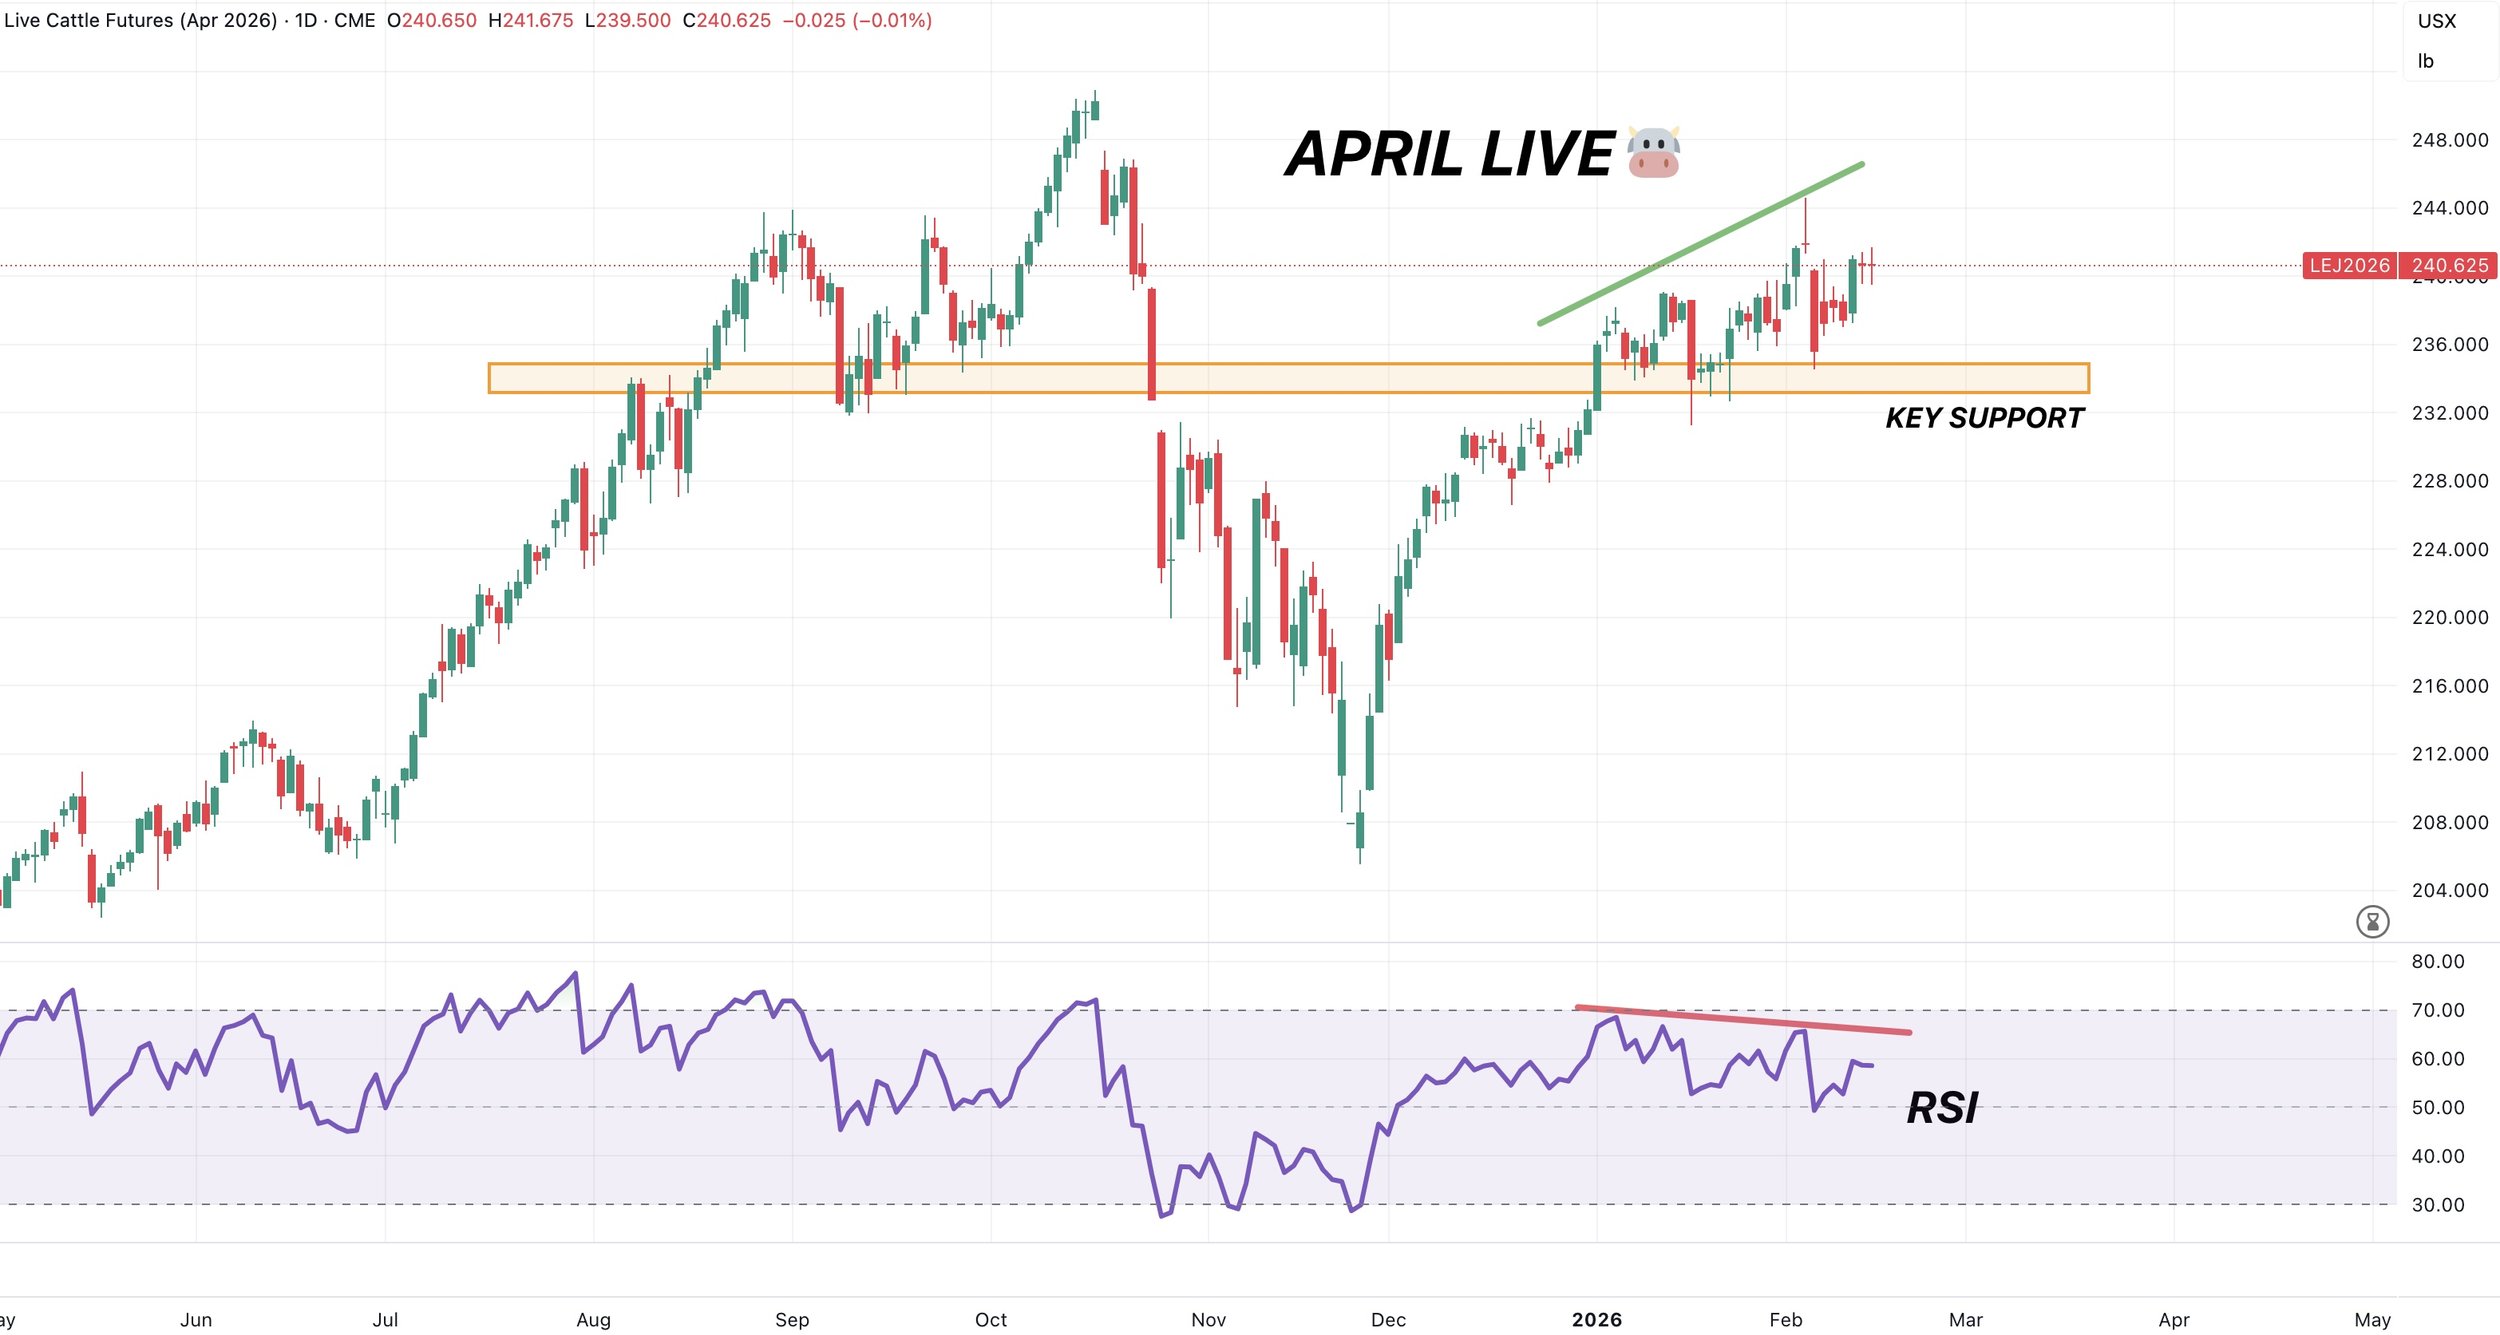
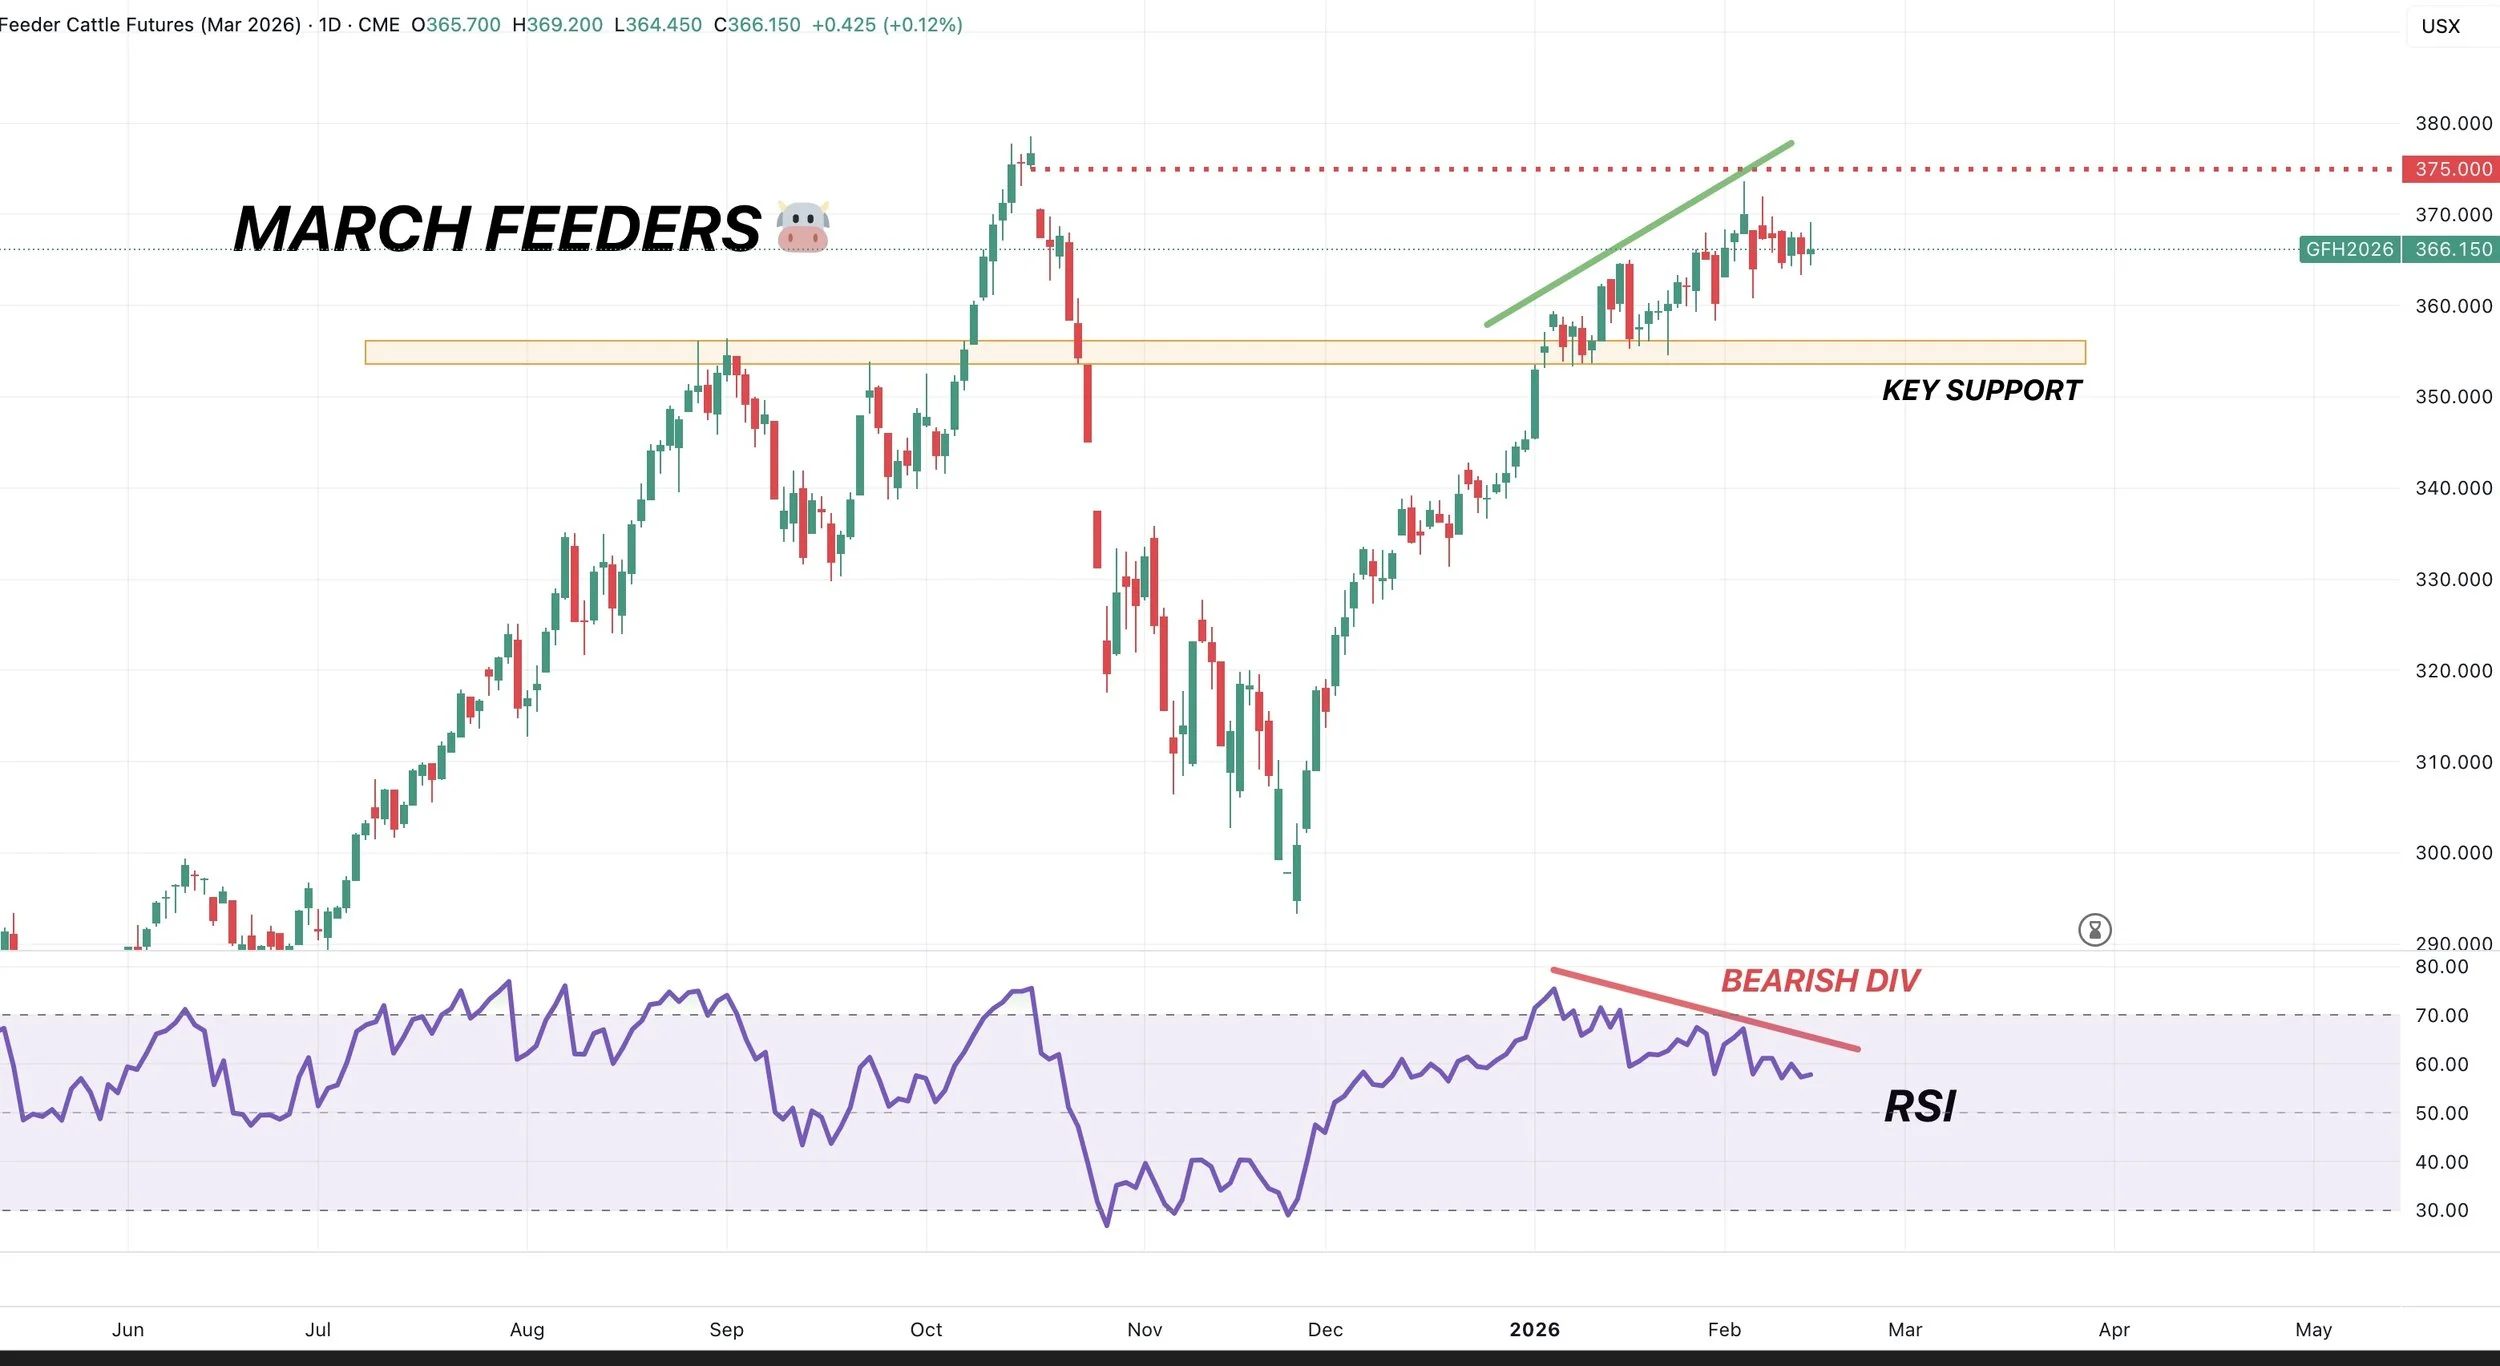
We do still feel a little top heavy, as both live and feeders continue to show some very clear signs of bearish divergence.
Which makes me think the market might be getting exhausted up here. Hence why I think it might take a new catalyst to post new highs.
April Live
March Feeders
Past Sell or Protection Signals
Feb 6th: 🌽 🌱
Corn & soybean sell signal & hedge alert.
Feb 4th: 🌱
Soybean sell signal & hedge alert.
Dec 11th: 🐮
Cattle sell signal & hedge alert.
Dec 5th: 🐮
Cattle sell signal & hedge alert.
Nov 17th: 🌱
Soybean sell signal & hedge alert.
Nov 13th: 🌽 🌱
Managing risk in corn & beans ahead of USDA report.
Oct 28th: 🌽
Corn sell signal & hedge alert.
Oct 27th: 🌱
Soybean sell signal & hedge alert.
Oct 13th: 🐮
Cattle sell signal & hedge alert.
Aug 22nd: 🌱
Soybean sell signal & hedge alert.
July 31st: 🐮
Cattle sell signal & hedge alert.
July 10th: 🐮
Cattle sell signal & hedge alert.
CLICK HERE TO VIEW
June 5th: 🐮
Cattle sell signal & hedge alert.
June 2nd: 🌾
MPLS wheat sell signal.
April 10th: 🌽
Old crop corn sell signal.
March 19th: 🐮
Cattle hedge & sell signal.
Feb 18th: 🌽 🌾
Old crop KC wheat & old crop corn signal.
Jan 23rd: 🌽 🌱
Corn & beans old crop sell signal.
CLICK HERE TO VIEW
Jan 15th: 🌽 🌱
Corn & beans hedge alert/sell signal.
Jan 2nd: 🐮
Cattle hedge alert at new all-time highs & target.
Dec 11th: 🌽
Corn sell signal at $4.51 200-day MA
CLICK HERE TO VIEW
Oct 2nd: 🌾
Wheat sell signal at $6.12 target
Sep 30th: 🌽
Corn protection signal at $4.23-26
Sep 27th: 🌱
Soybean sell & protection signal at $10.65
Sep 13th: 🌾
Wheat sell signal at $5.98
May 22nd: 🌾
Wheat sell signal when wheat traded +$7.00
Want to Talk?
Our phones are open 24/7 for you guys if you ever need anything or want to discuss your operation.
Hedge Account
Interested in a hedge account? Use the link below to set up an account or shoot Jeremey a call at (605)295-3100.