
HOW TO NAVIGATE RE-OWNERSHIP
AUDIO COMMENTARY
Soybeans at downside target (charts below)*
Cattle on feed supportive
Thin holiday markets soon
Chatter of China buying corn?
More details on our soybean buy zone alert
Should you use futures or options?
Examples of re-ownership strategies
Should you be re-owning or not?
It’s a good spot to take profits on bean short
What if we you are long and wrong?
Why buying is harder than selling
Exactly how to navigate re-owning
You shouldn’t buy if you didn’t sell at the sell signal, because you know have twice the risk
Make sure it makes sense for you to follow the buy signal
Buy signals can be double-edged swords if not utilized properly
Is wheat stabilizing? Divergence between Chicago & KC
Calls can be cheaper than storage
Establishing floors while keeping upside
Listen to today’s audio below
Want to talk? (605)250-3863
SOYBEAN CHART
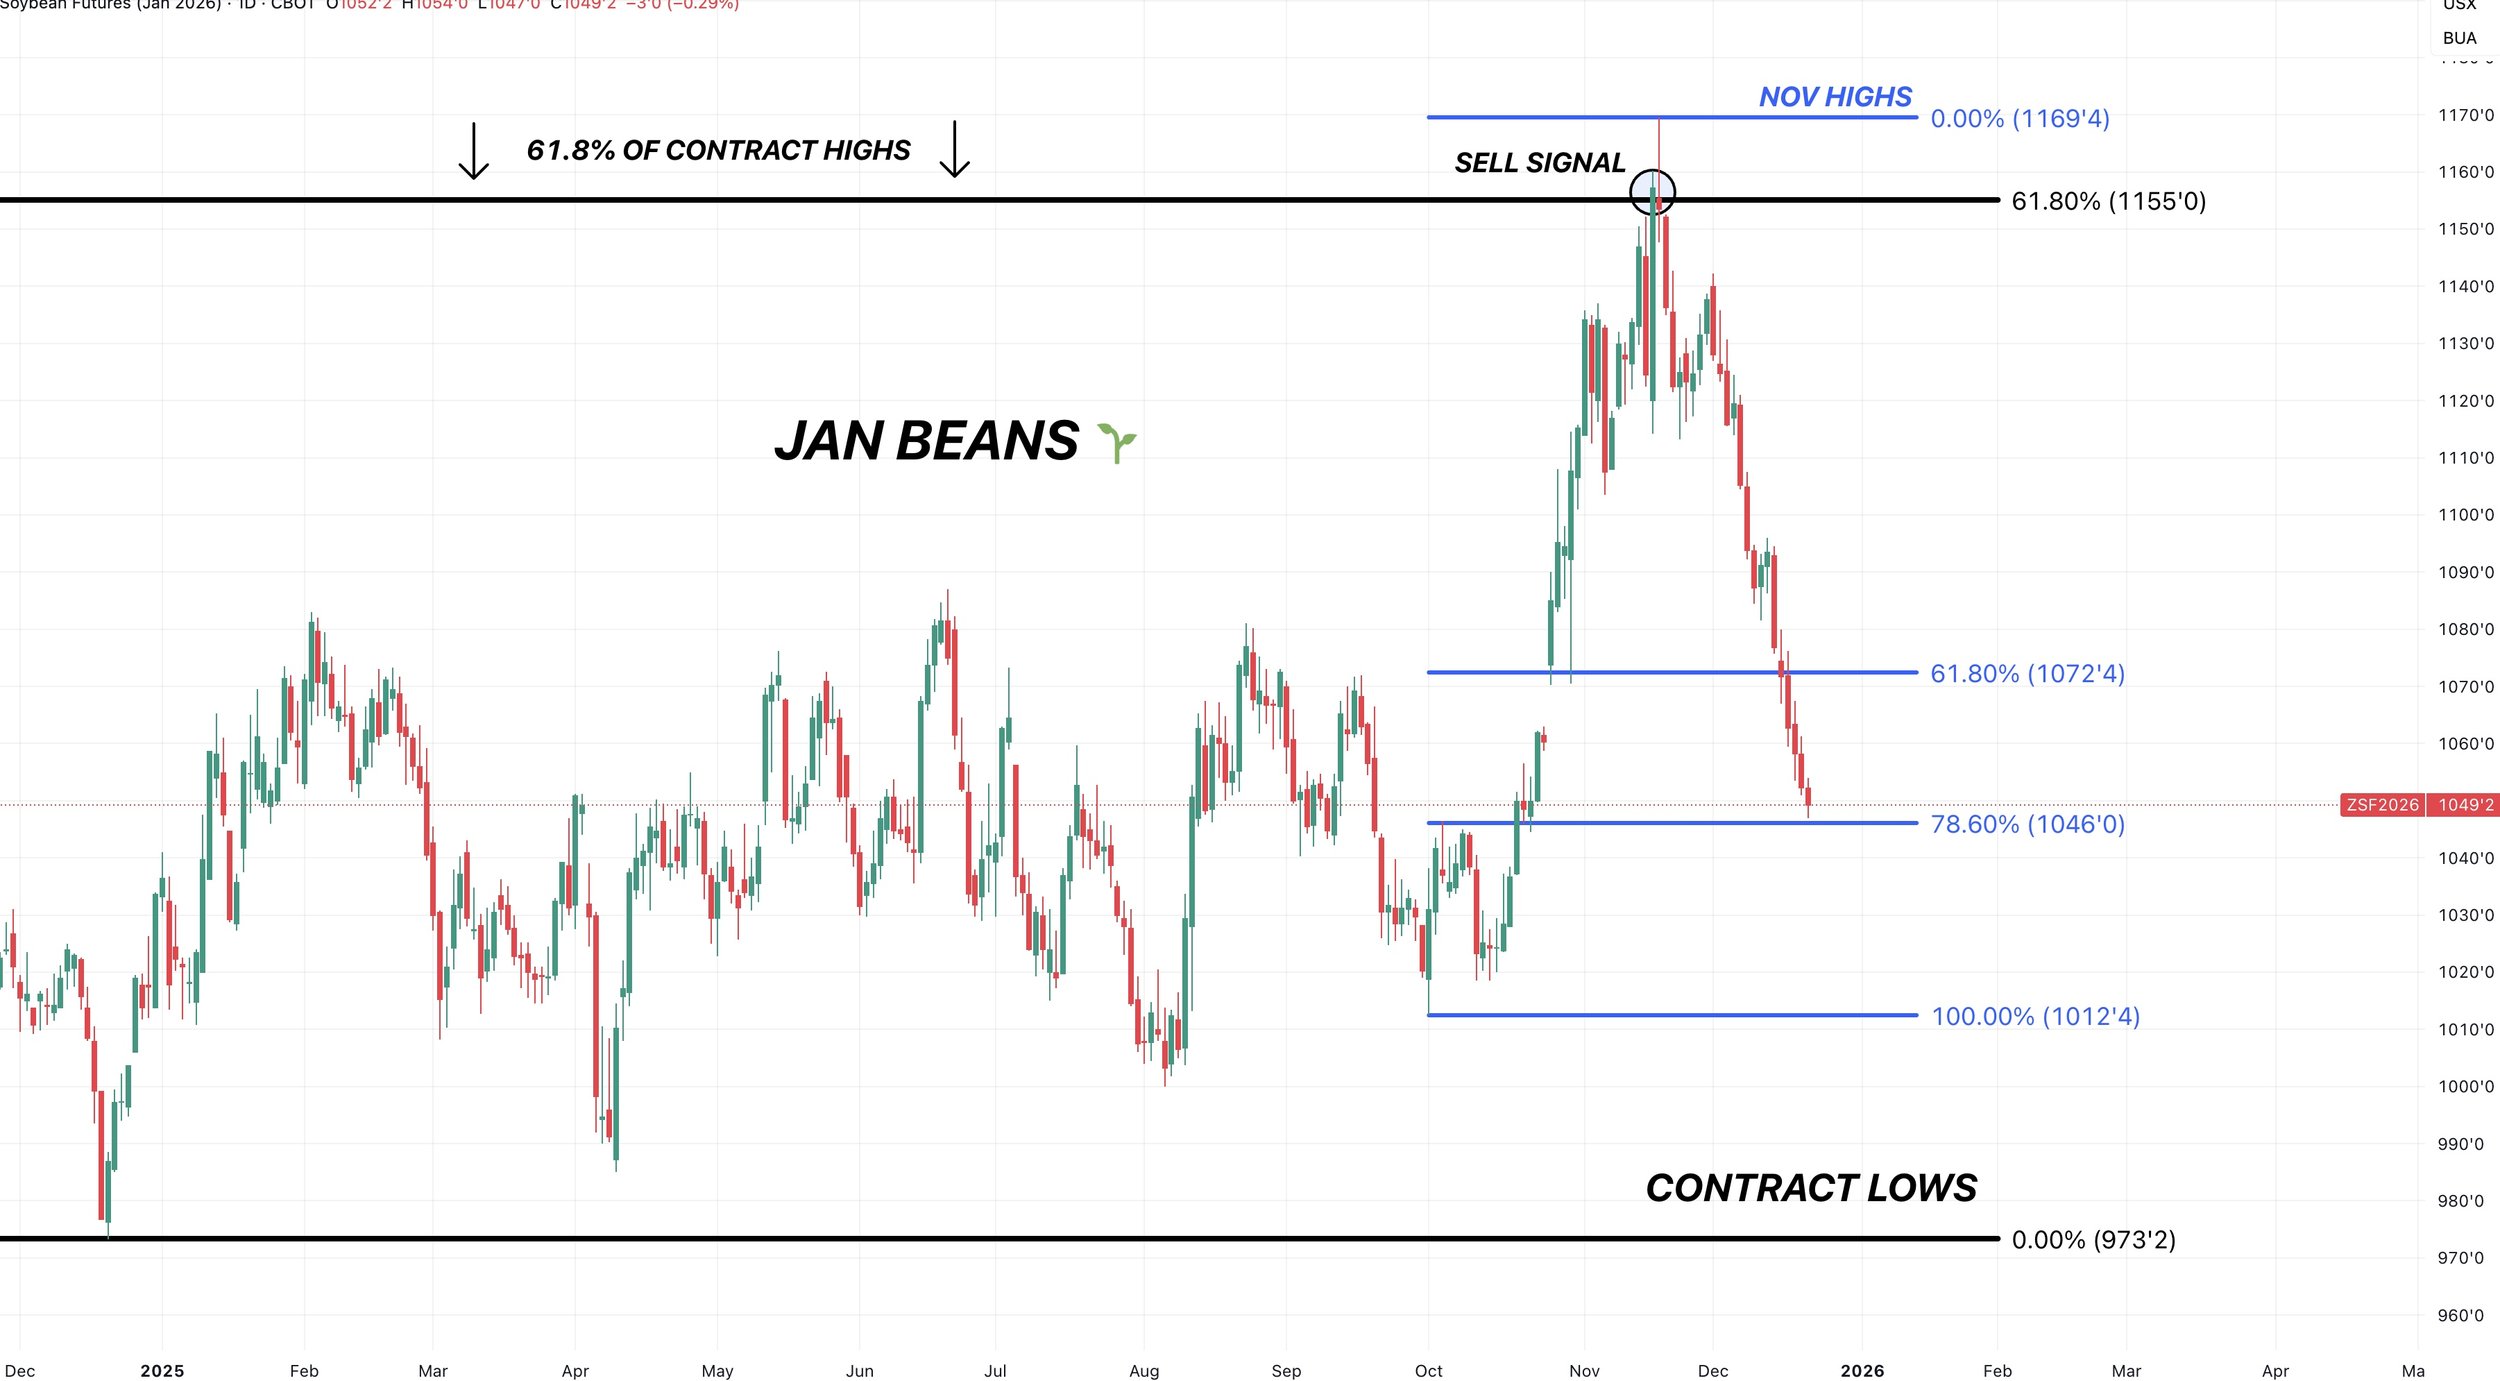
Jan Beans 🌱
I went over the charts a lot deeper in yesterdays video so check that out if you have not.
However, soybeans did officially hit those downside targets we talked about yesterday.
Jan beans have given back 61.8% of the entire rally off contract lows. The most common fib.
The top of this market came after clawing back 61.8% of the contract highs.
Pretty big spot to hold here. Which is why it’s our point of interest.
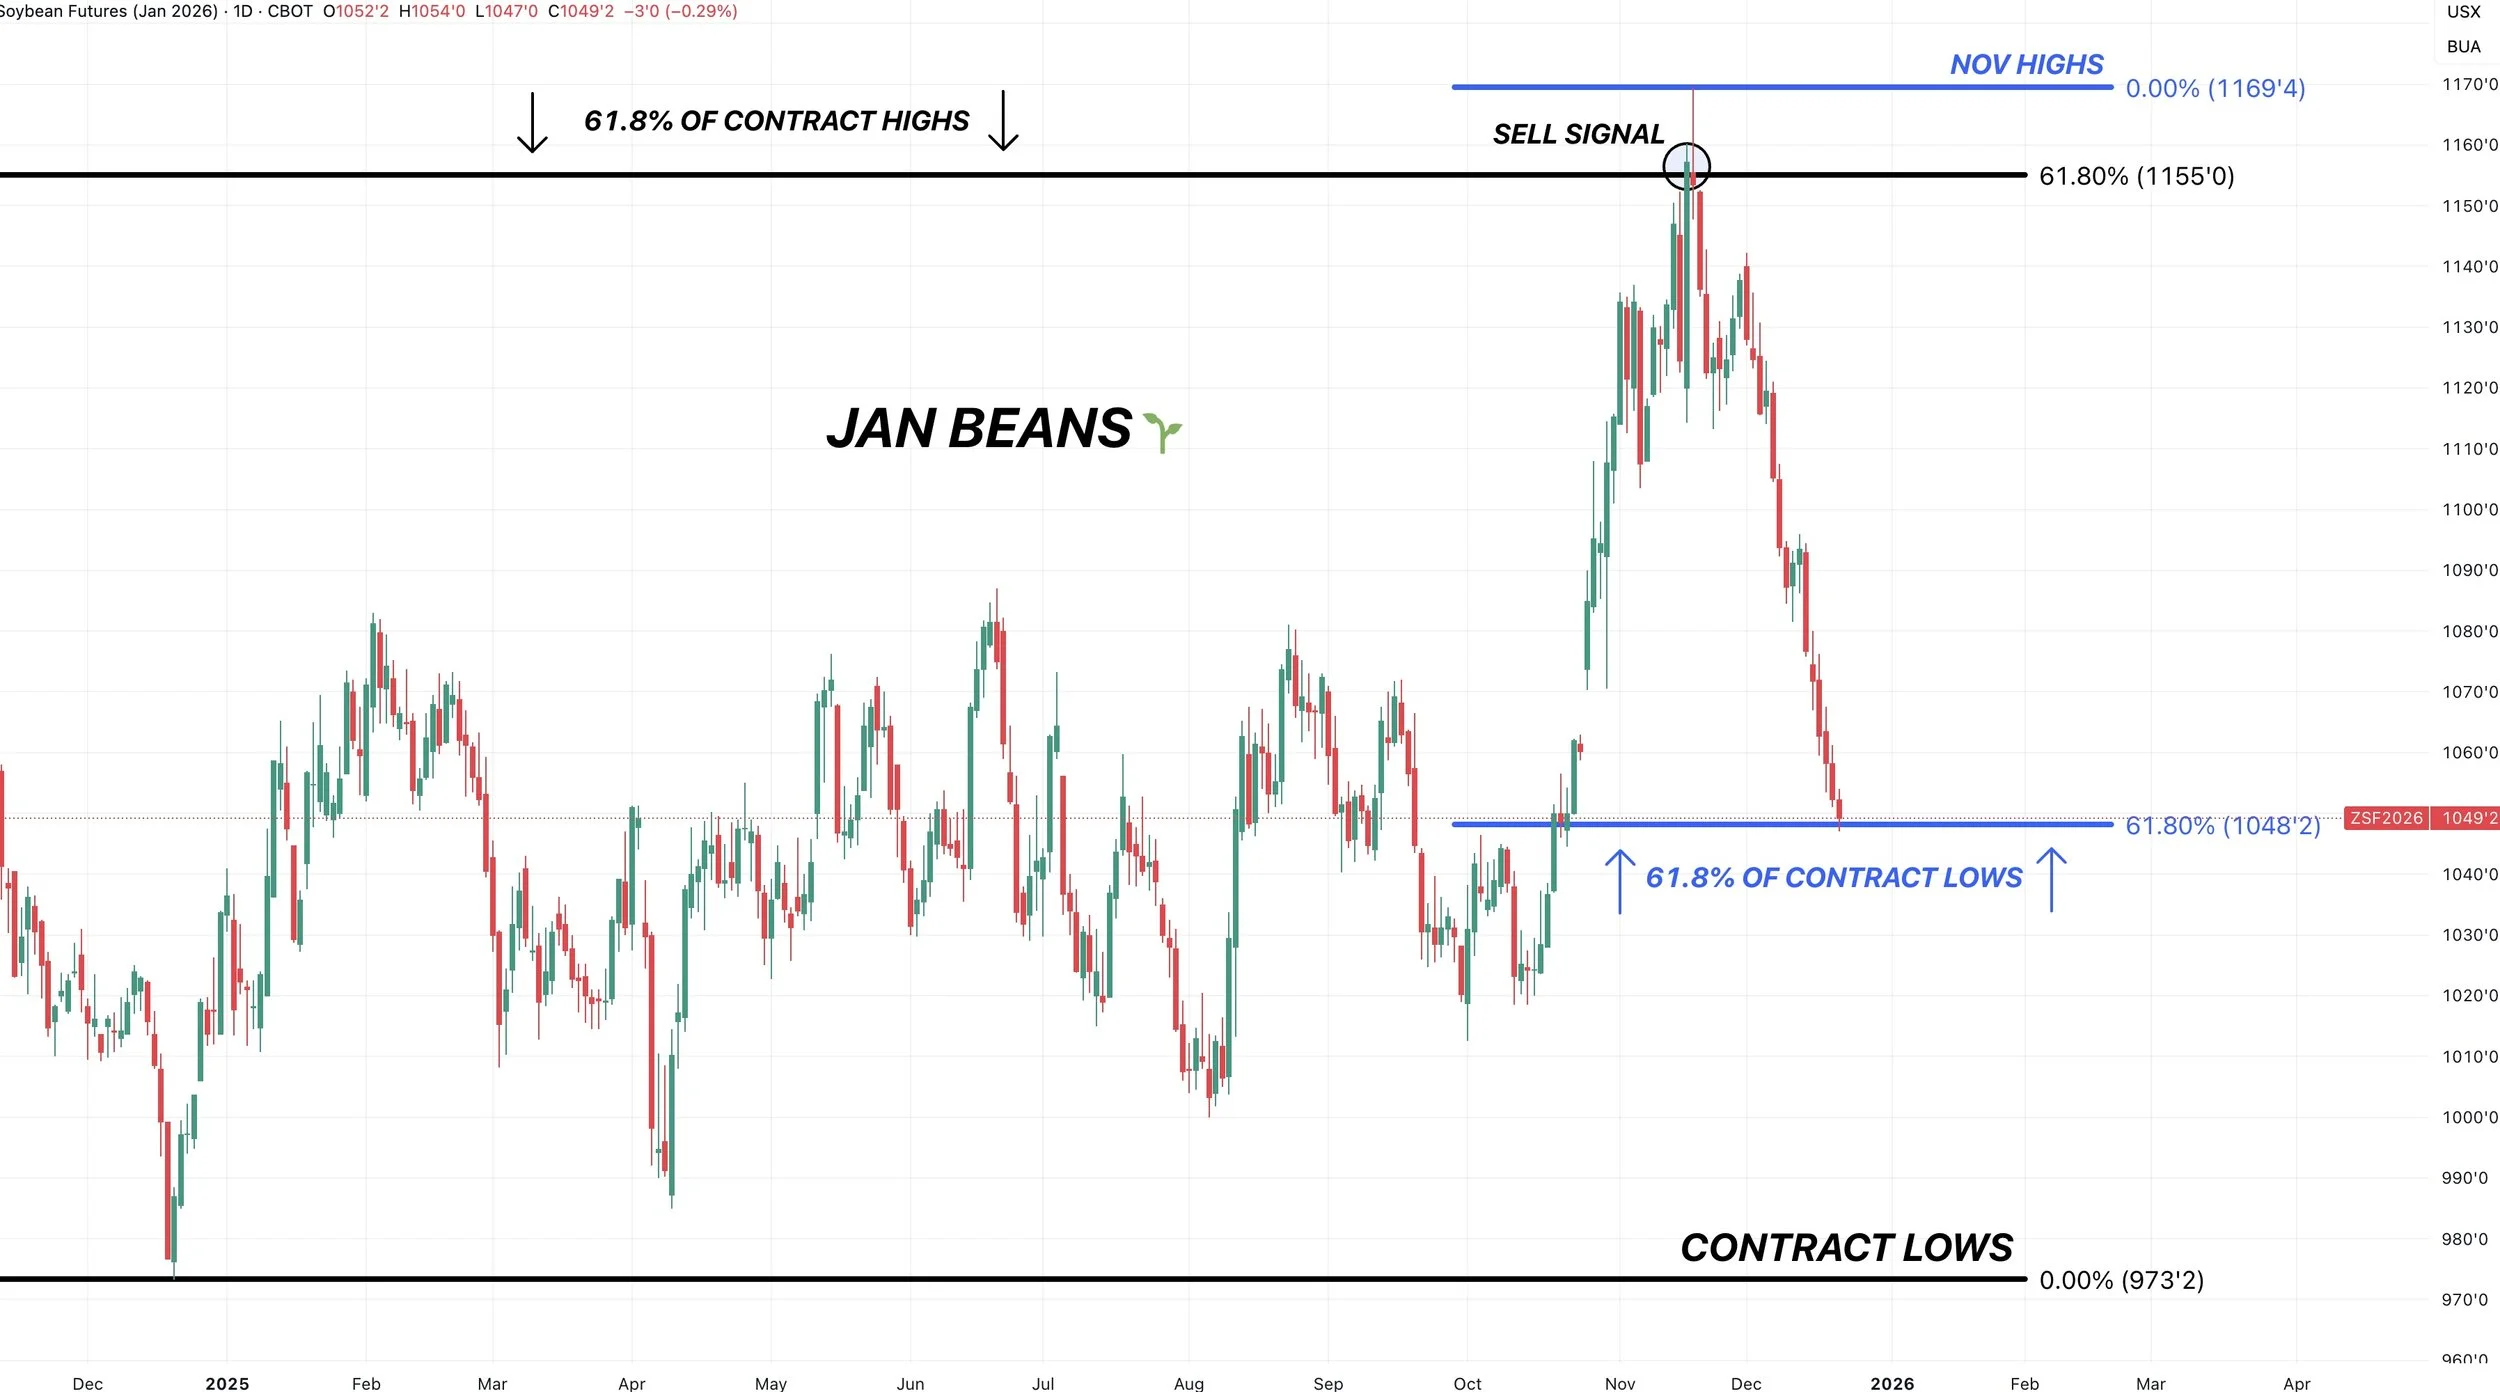
Jan beans have also given back 78.6% of the entire China-fueled rally.
March Beans 🌱
March beans hit our downside target as well at $10.59
As they gave back 78.6% of the China-driven rally after failing the 61.8% level.
(Scroll for one more bean March bean chart)
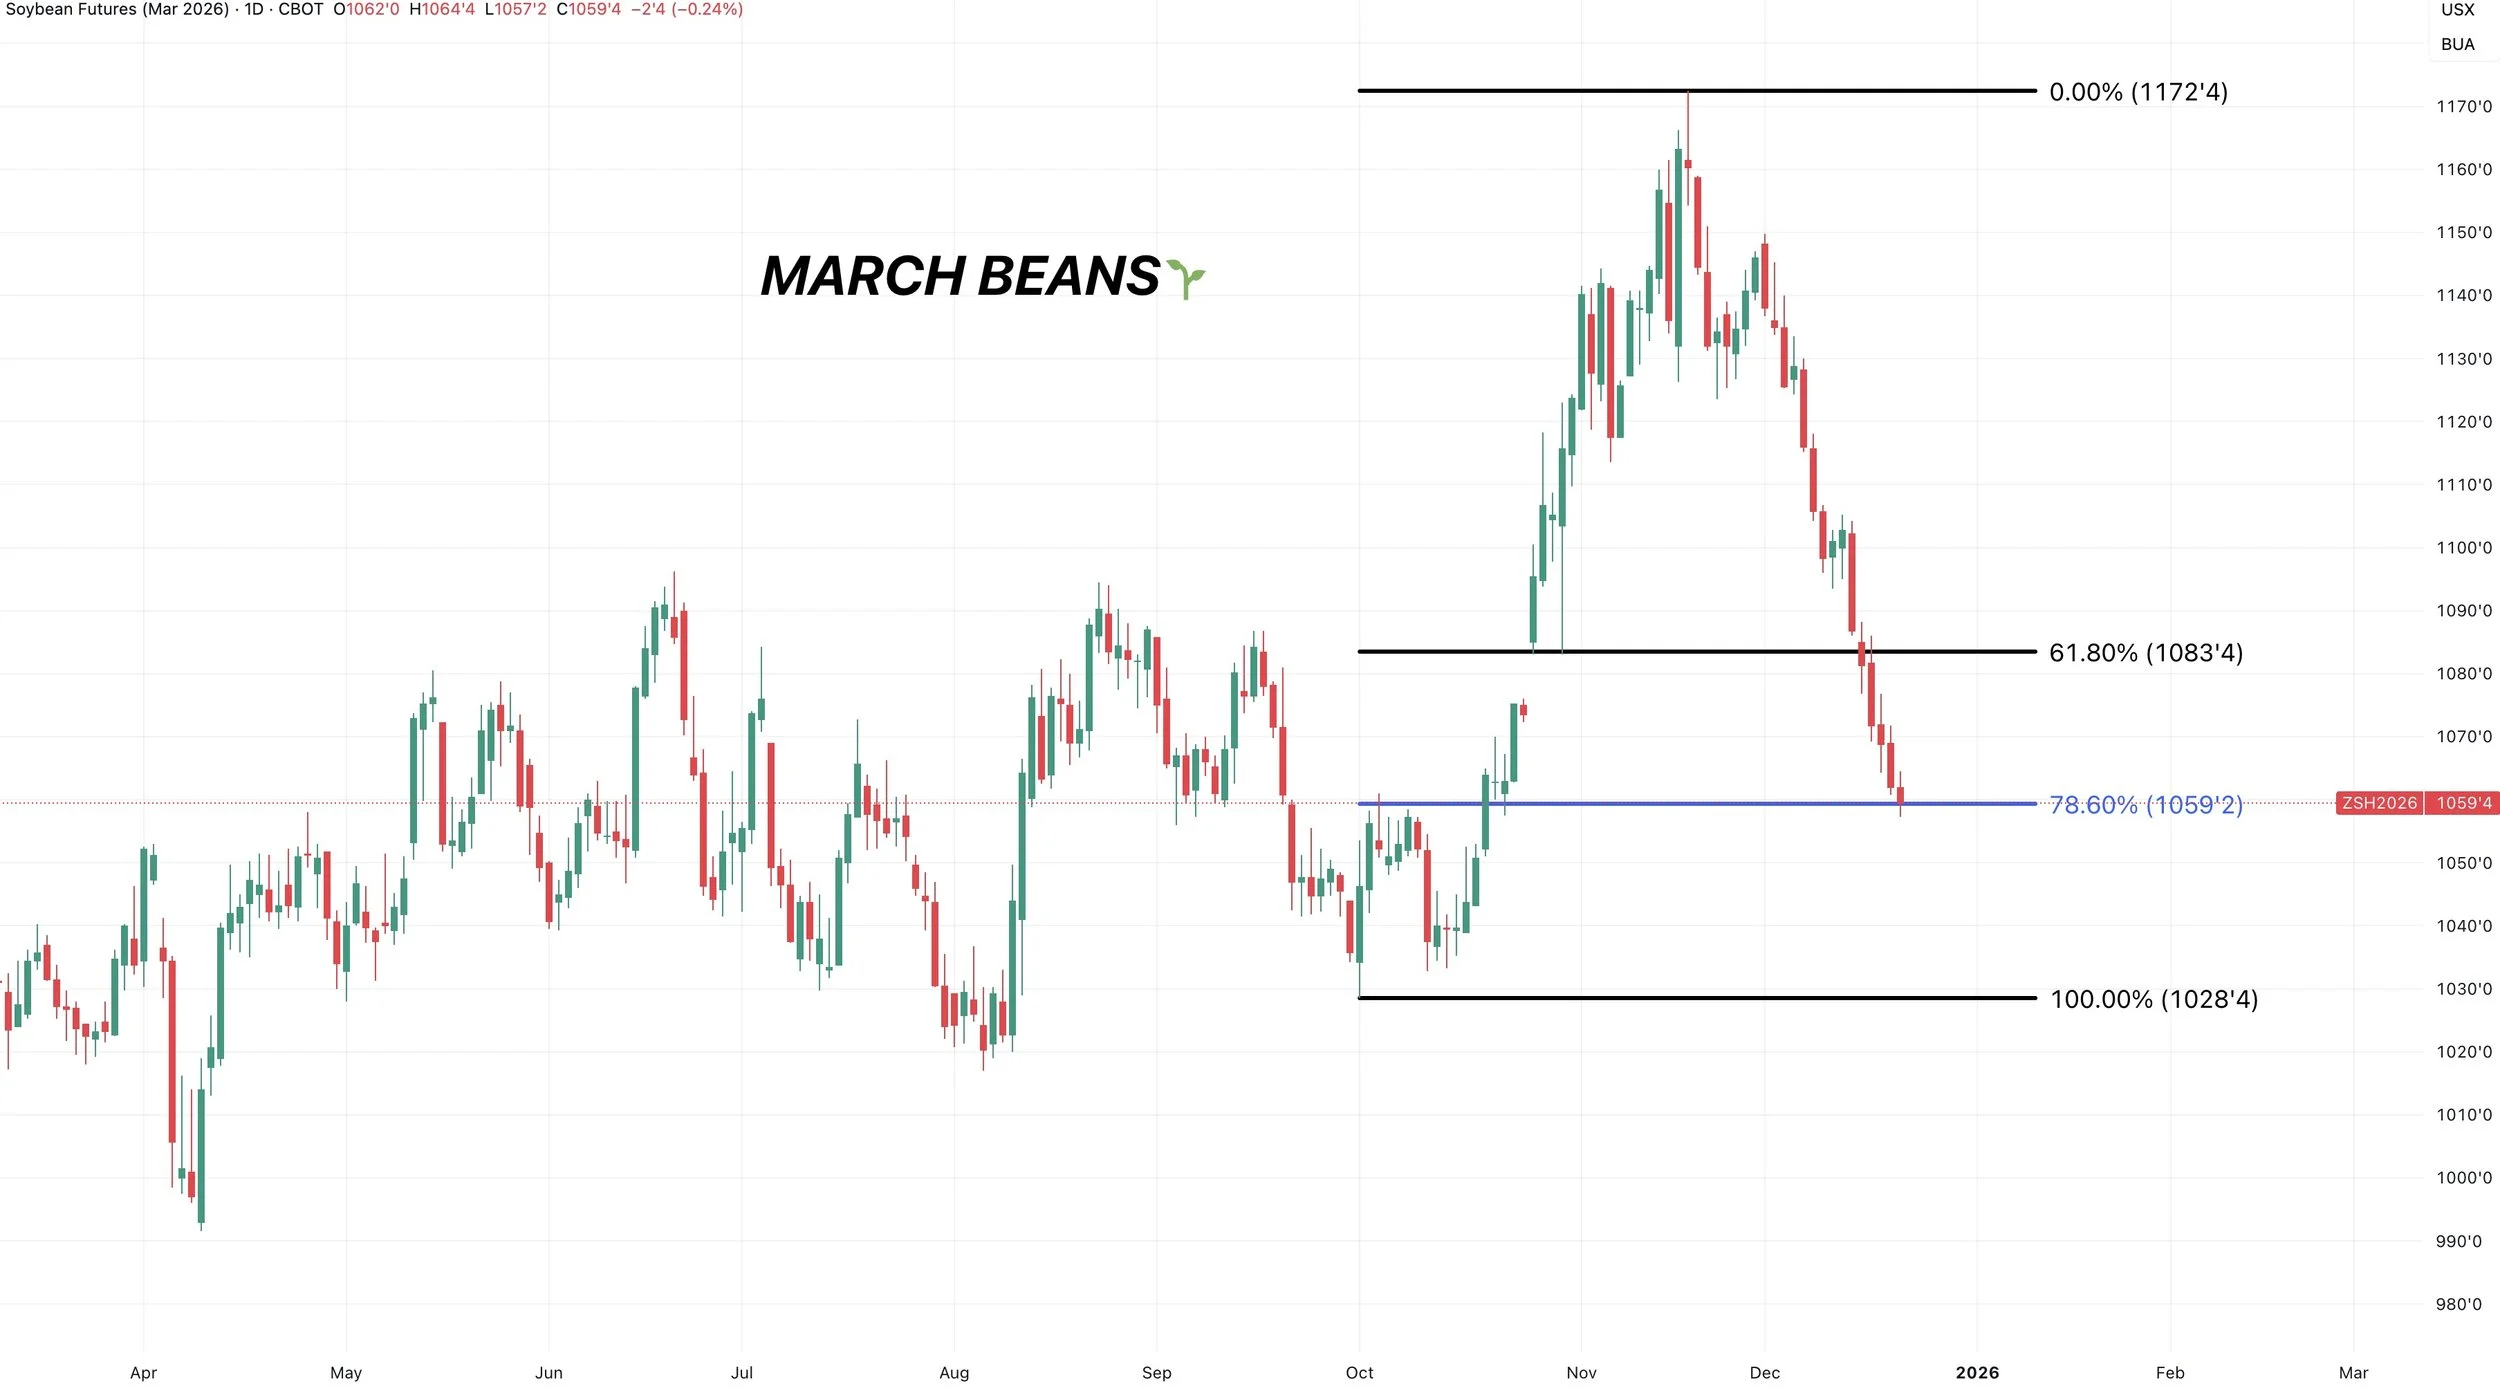
If that 78.6% level above at $10.59 does not hold.
There is one more fib level we would have our eyes on if we get there.
The 61.8% level down to contract lows at $10.52.
The same exact fib level that Jan beans are currently sitting at.
On Jan beans, the 61.8% level down to contract lows, and the 78.6% level of the China led rally sit at the exact same price.
Where as for March beans, the 61.8% level down to contract lows sits at $10.52, but the 78.6% level of this China rally sits at $10.59.
Hopefully that makes sense.
The 61.8% level down to contract lows would be seen as a make or break spot in the market if we got there.

,
Past Sell or Protection Signals
Dec 11th: 🐮
Cattle sell signal & hedge alert.
Dec 5th: 🐮
Cattle sell signal & hedge alert.
Nov 17th: 🌱
Soybean sell signal & hedge alert.
Nov 13th: 🌽 🌱
Managing risk in corn & beans ahead of USDA report.
Oct 28th: 🌽
Corn sell signal & hedge alert.
Oct 27th: 🌱
Soybean sell signal & hedge alert.
Oct 13th: 🐮
Cattle sell signal & hedge alert.
Aug 22nd: 🌱
Soybean sell signal & hedge alert.
July 31st: 🐮
Cattle sell signal & hedge alert.
July 10th: 🐮
Cattle sell signal & hedge alert.
CLICK HERE TO VIEW
June 5th: 🐮
Cattle sell signal & hedge alert.
June 2nd: 🌾
MPLS wheat sell signal.
April 10th: 🌽
Old crop corn sell signal.
March 19th: 🐮
Cattle hedge & sell signal.
Feb 18th: 🌽 🌾
Old crop KC wheat & old crop corn signal.
Jan 23rd: 🌽 🌱
Corn & beans old crop sell signal.
CLICK HERE TO VIEW
Jan 15th: 🌽 🌱
Corn & beans hedge alert/sell signal.
Jan 2nd: 🐮
Cattle hedge alert at new all-time highs & target.
Dec 11th: 🌽
Corn sell signal at $4.51 200-day MA
CLICK HERE TO VIEW
Oct 2nd: 🌾
Wheat sell signal at $6.12 target
Sep 30th: 🌽
Corn protection signal at $4.23-26
Sep 27th: 🌱
Soybean sell & protection signal at $10.65
Sep 13th: 🌾
Wheat sell signal at $5.98
May 22nd: 🌾
Wheat sell signal when wheat traded +$7.00
Want to Talk?
Our phones are open 24/7 for you guys if you ever need anything or want to discuss your operation.
Hedge Account
Interested in a hedge account? Use the link below to set up an account or shoot Jeremey a call at (605)295-3100.