
SOYBEAN SIGNAL. HOW WE IDENTIFY TARGETS
VIDEO CHART UPDATE
You can scroll to read the usual update as well. As the written version is the exact same as the video.
Timestamps for video:
Beans: 0:35min
Corn: 4:40min
Cattle: 7:30min
Wheat: 9:30min
Want to talk about your situation?
(605)250-3863
Holiday Sale
Subscribe before your trial ends so you don’t miss future signals or updates
Overview
Today's update is going to be different than usual.
Today we will only be going over some technical analysis as we do not have much fresh fundamental news, and have done plenty of fundamental deep dives in the past.
Today we did issue a soybean buy zone alert as we are approaching our downside targets following our sell signal on Nov 17th at $11.55
So we are going to go over the reasoning behind that.
I also want to give you an inside perspective as to how we actually identify some of our upside and downside targets, and kind of walk you through what goes on in my head when we issue some of our alerts.
Soybeans
Technicals:
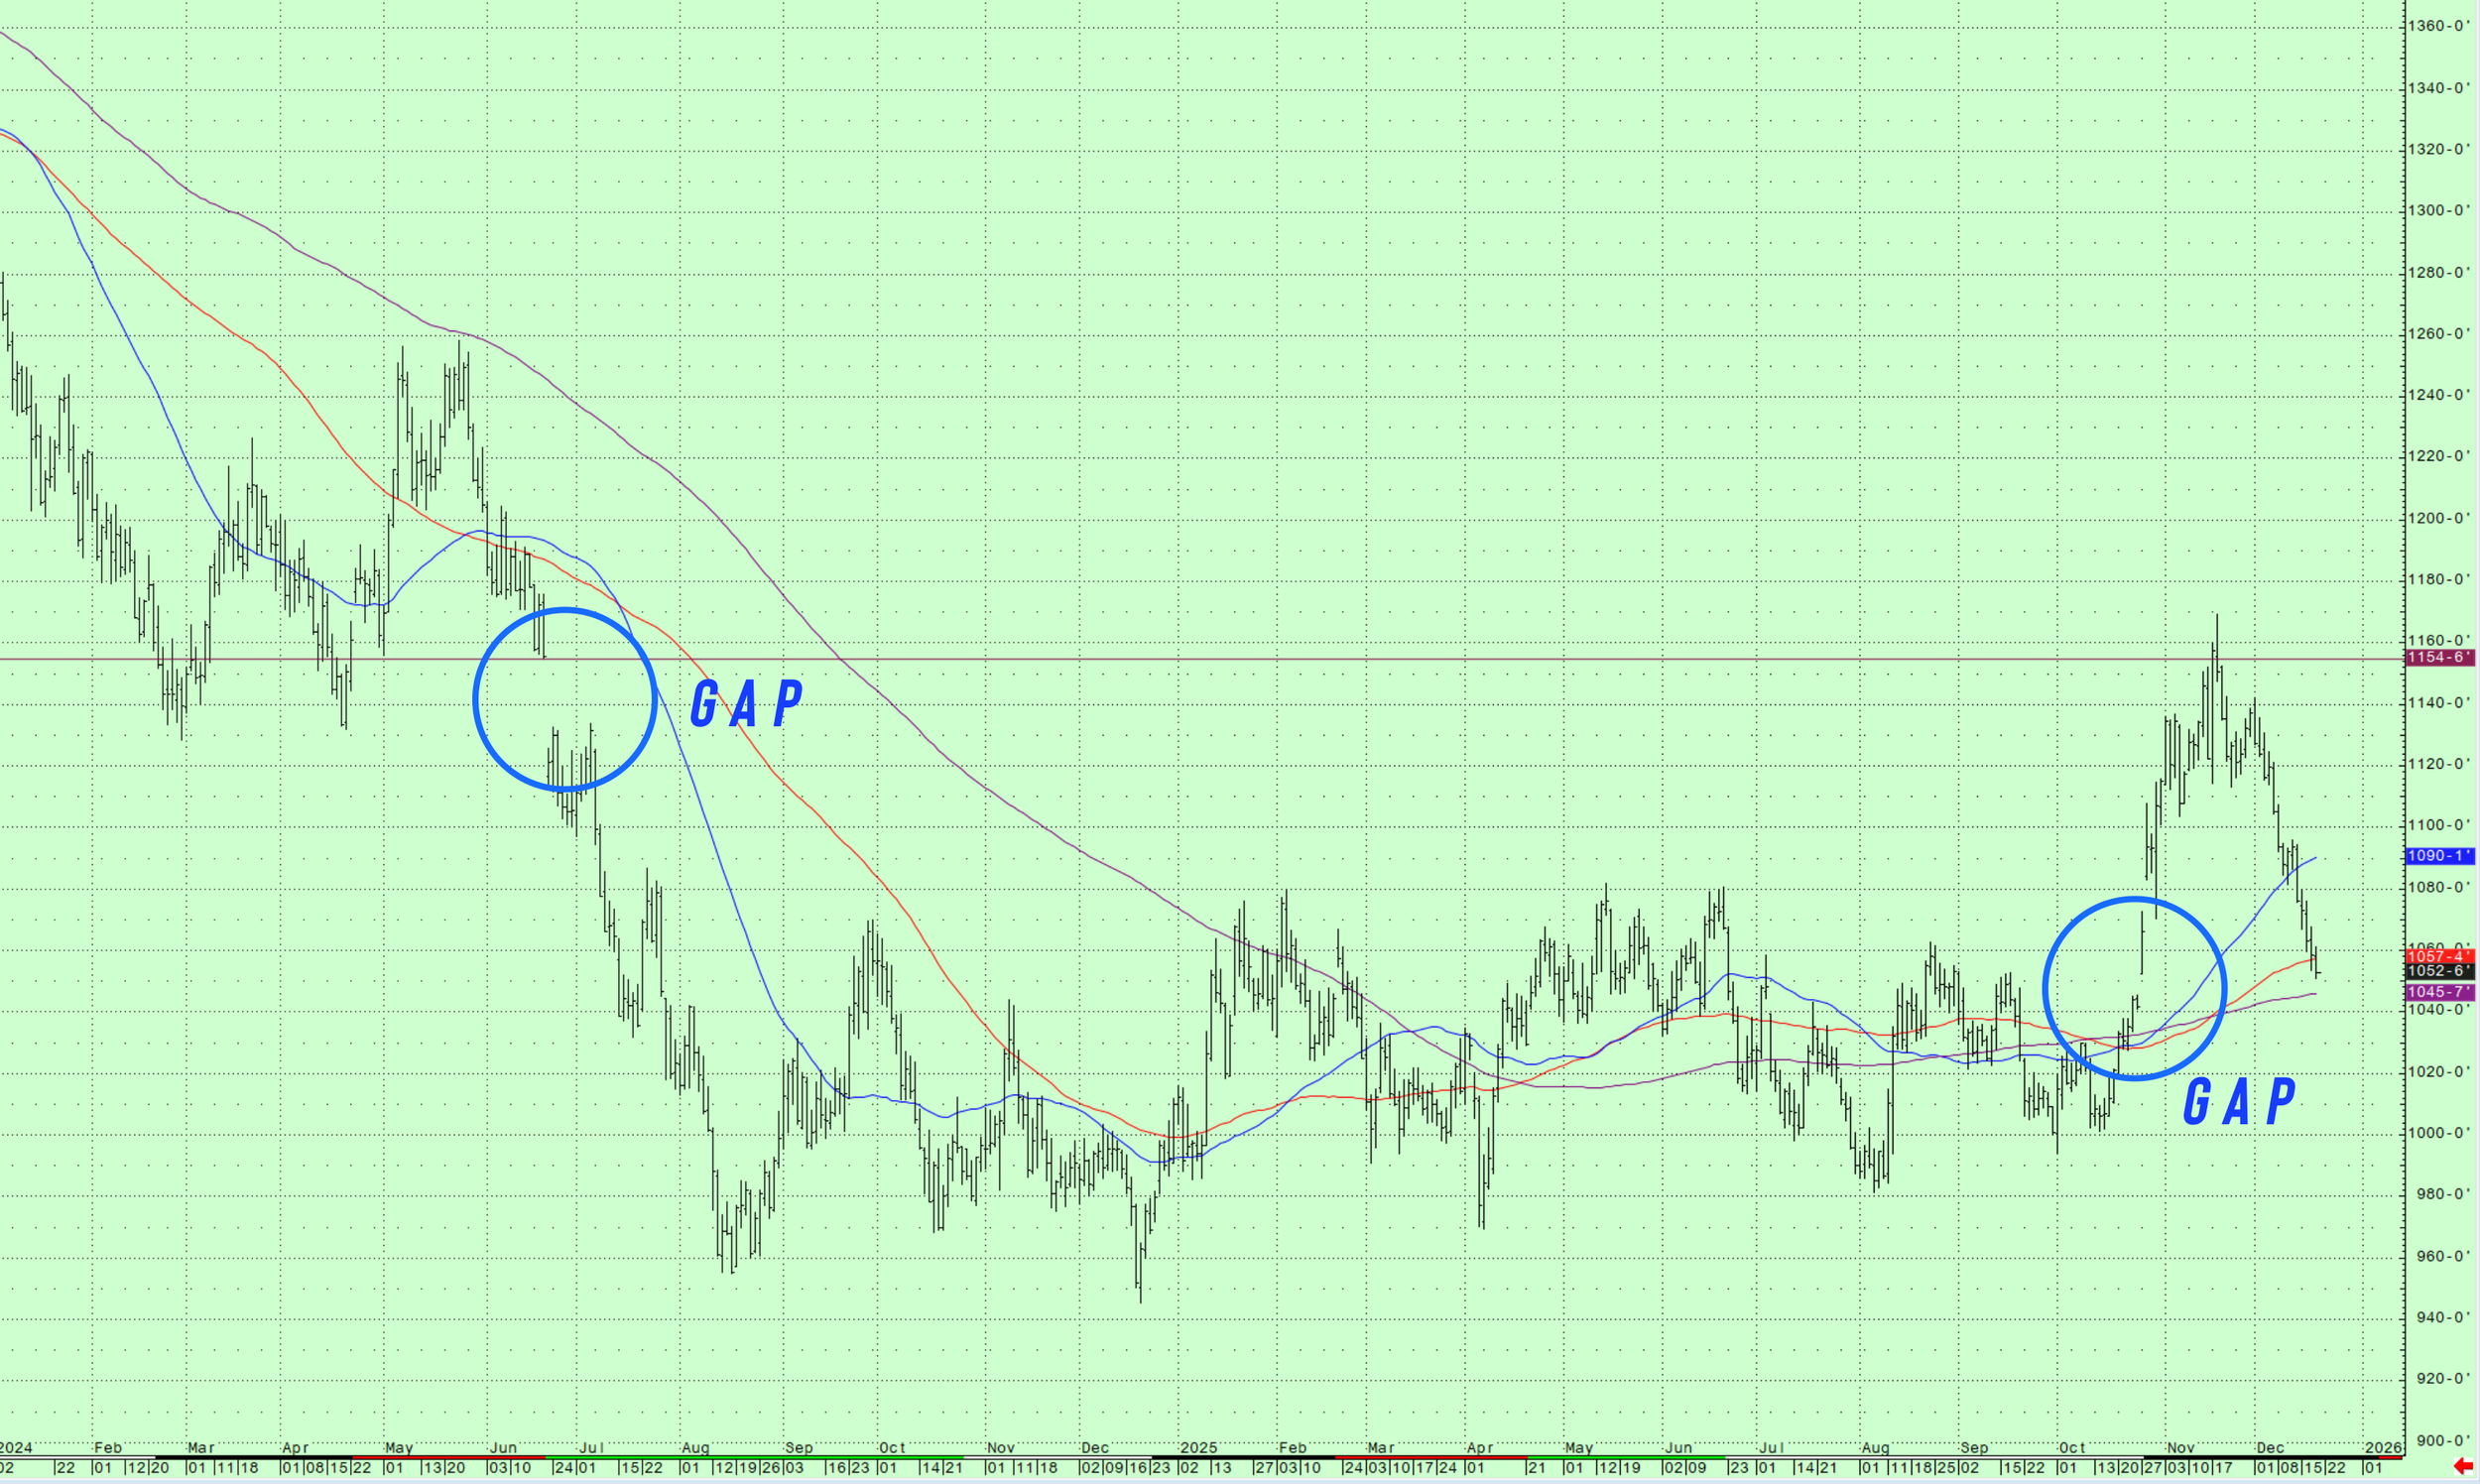
Jan Beans
Do you know what marked the highs in the soybean market?
We reclaimed 61.8% of the contract highs.
Like we always talk about, this is the most common level. It shows up all the time in markets.
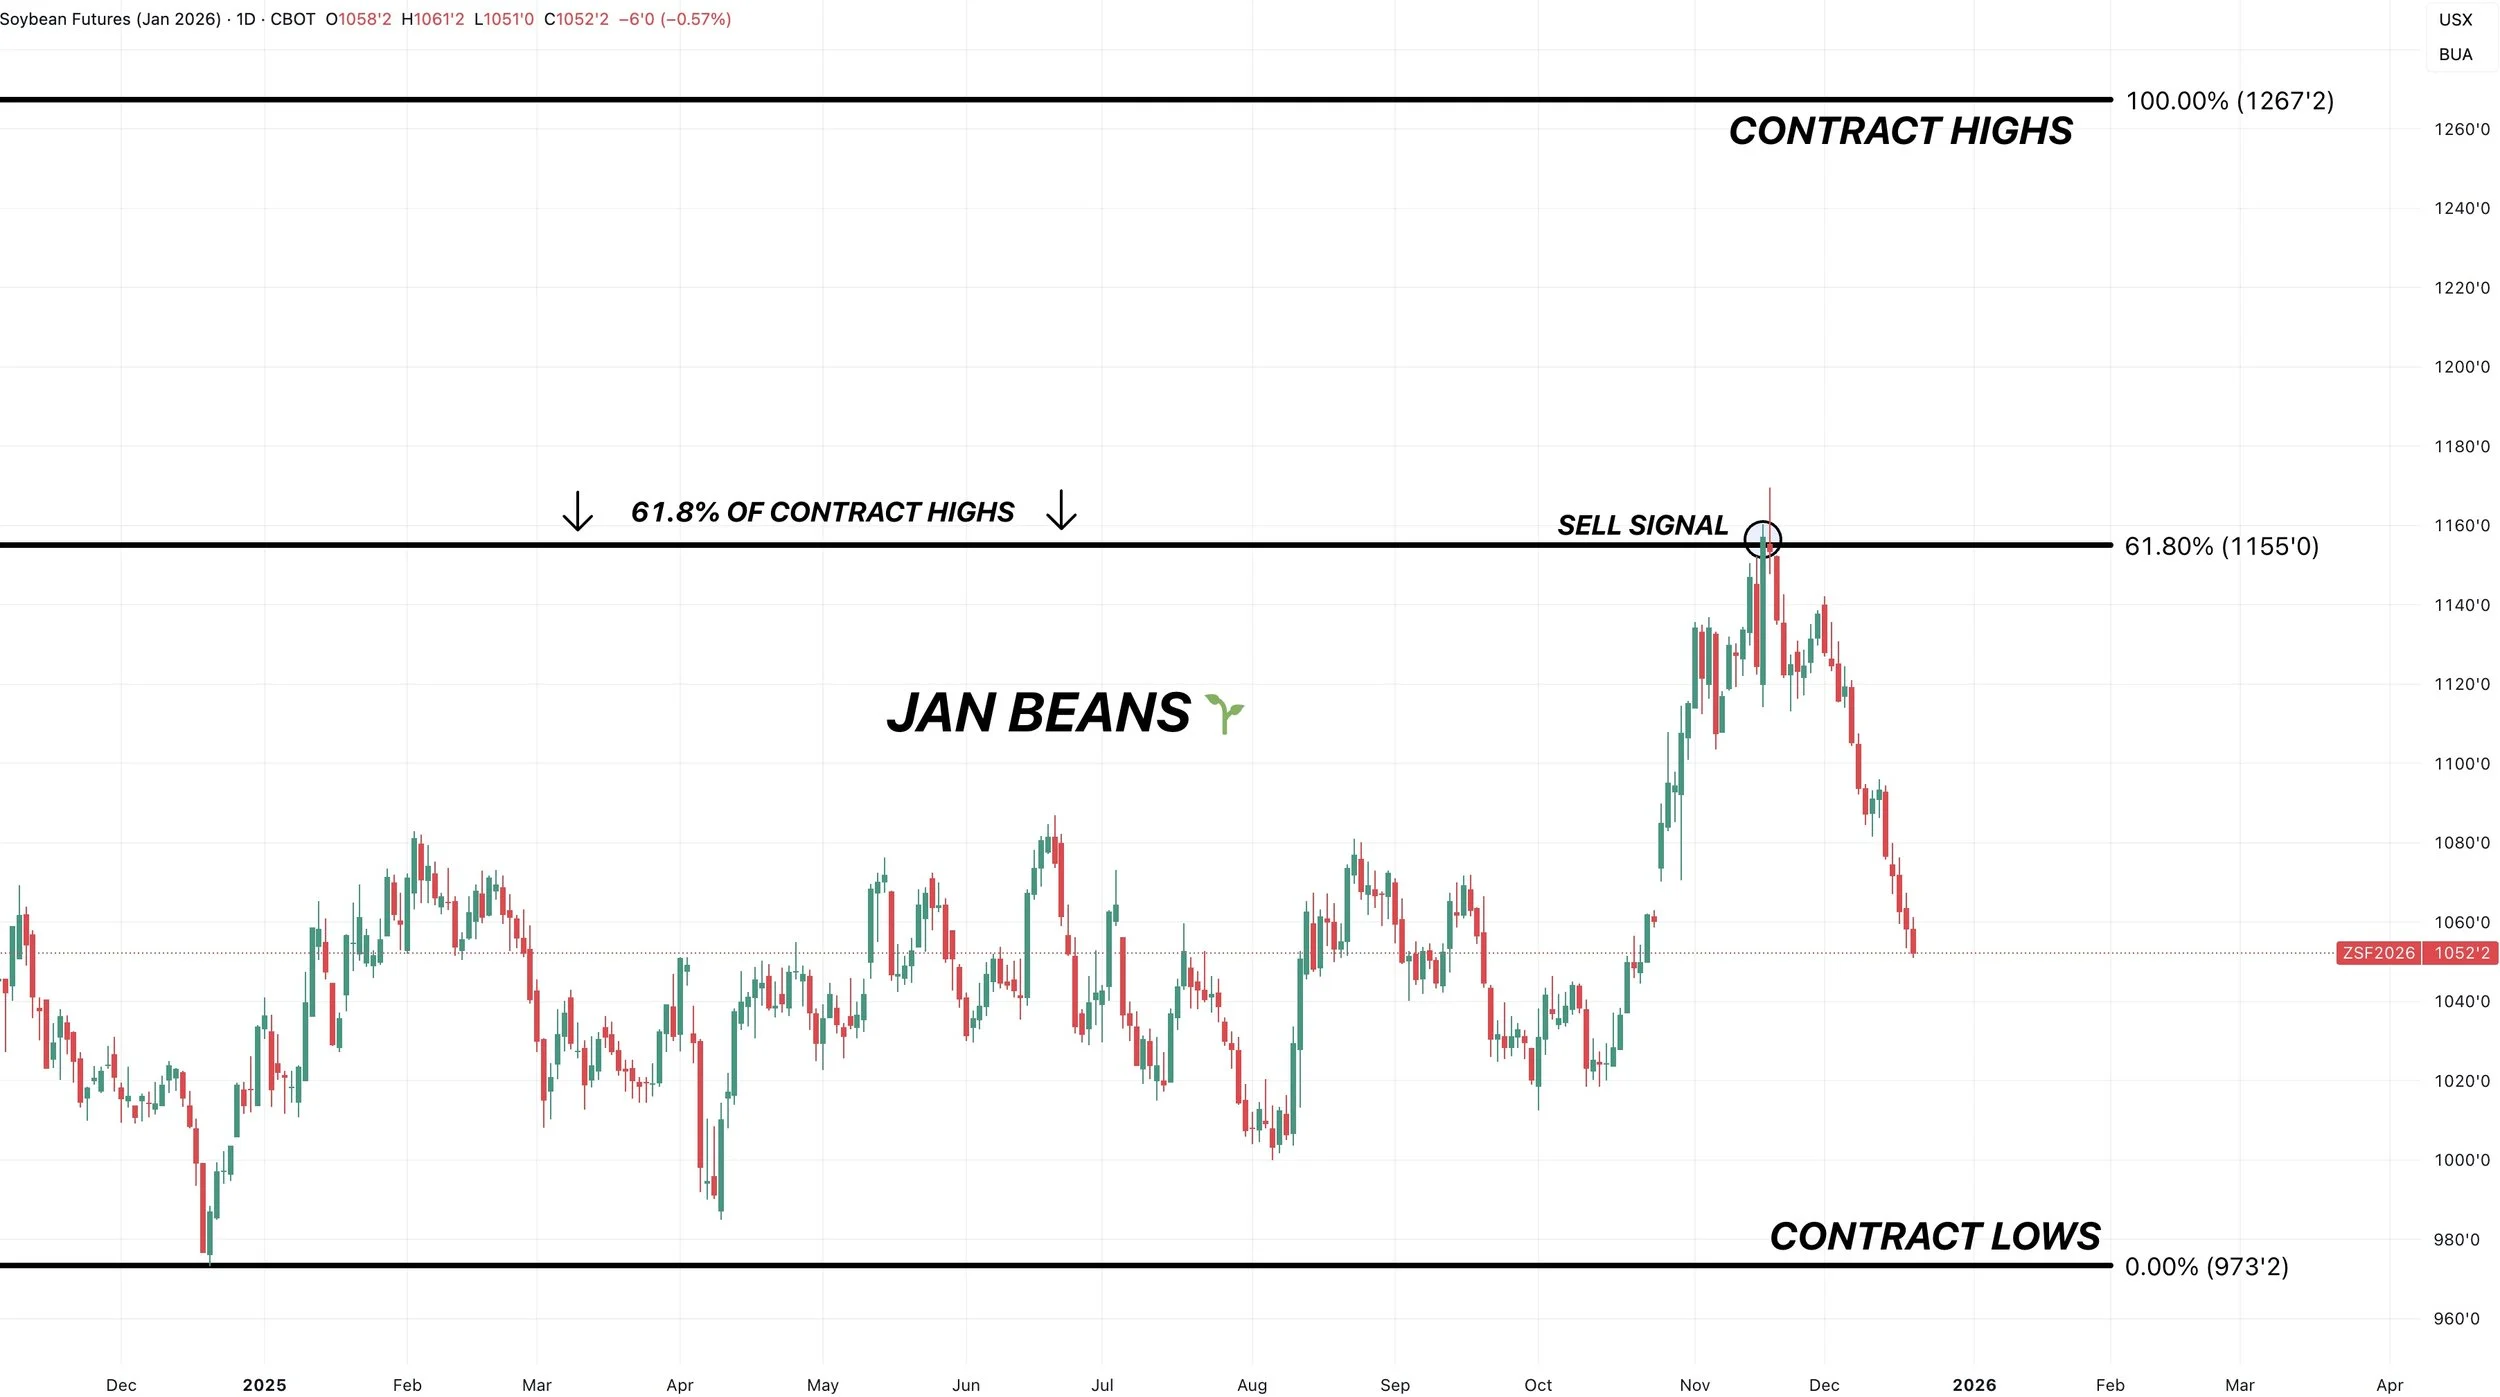
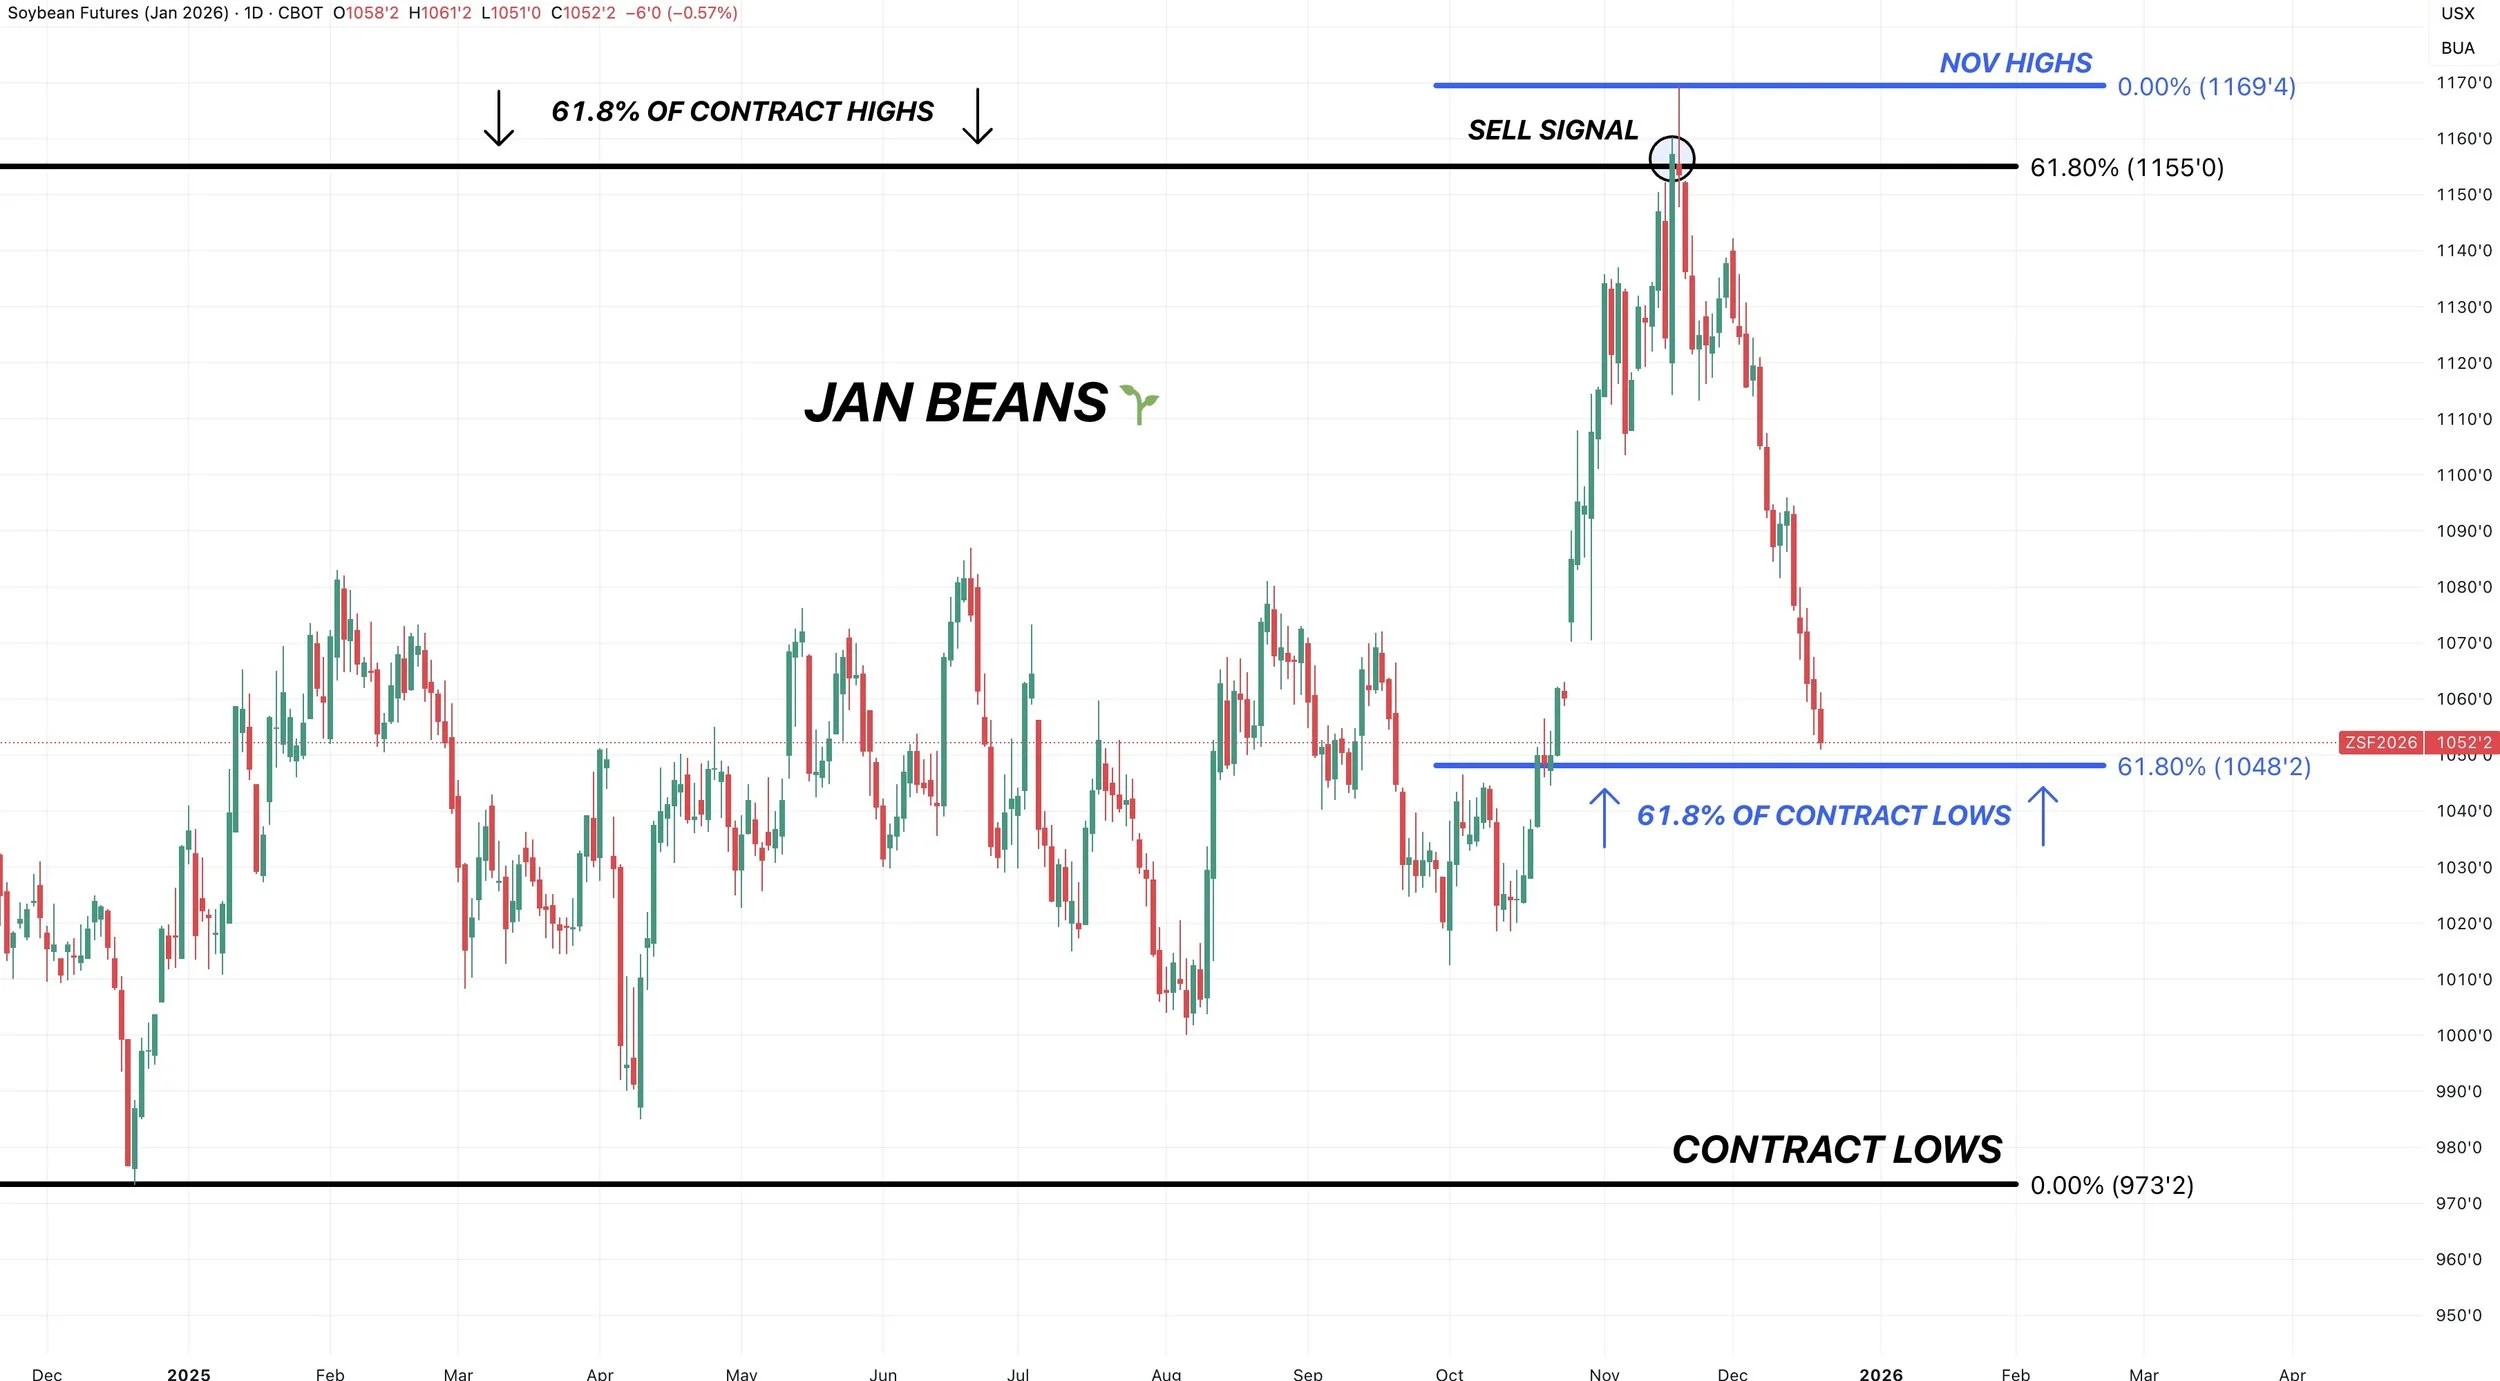
Now today we issued that soybean buy zone alert. Why?
We are approaching the 61.8% level down to contract lows.
Which sits at $10.48
Meaning we have almost given back 61.8% of those November highs down to our contract lows.
The top was marked by reclaiming 61.8% of the contract highs.
Perhaps the local bottom might be marked by reclaiming 61.8% of the contract lows.
Now we could be wrong, and not everyone should be looking to re-own soybeans.
But if you followed our sell signal at $11.55, then some sort of re-ownership strategy might make sense for you down here.
If you have short futures, short calls, or long puts from our sell signal. This is an area we'd start to look to secure some profits.
There is never anything wrong with just simply walking away from a sale that was +$1.00 higher than where we are today. But if you want to re-own, we like these levels are entering.
If you want to talk specifics or put together a strategy, feel free to reach out to Jeremey anytime:
Jeremey: (605)250-3863
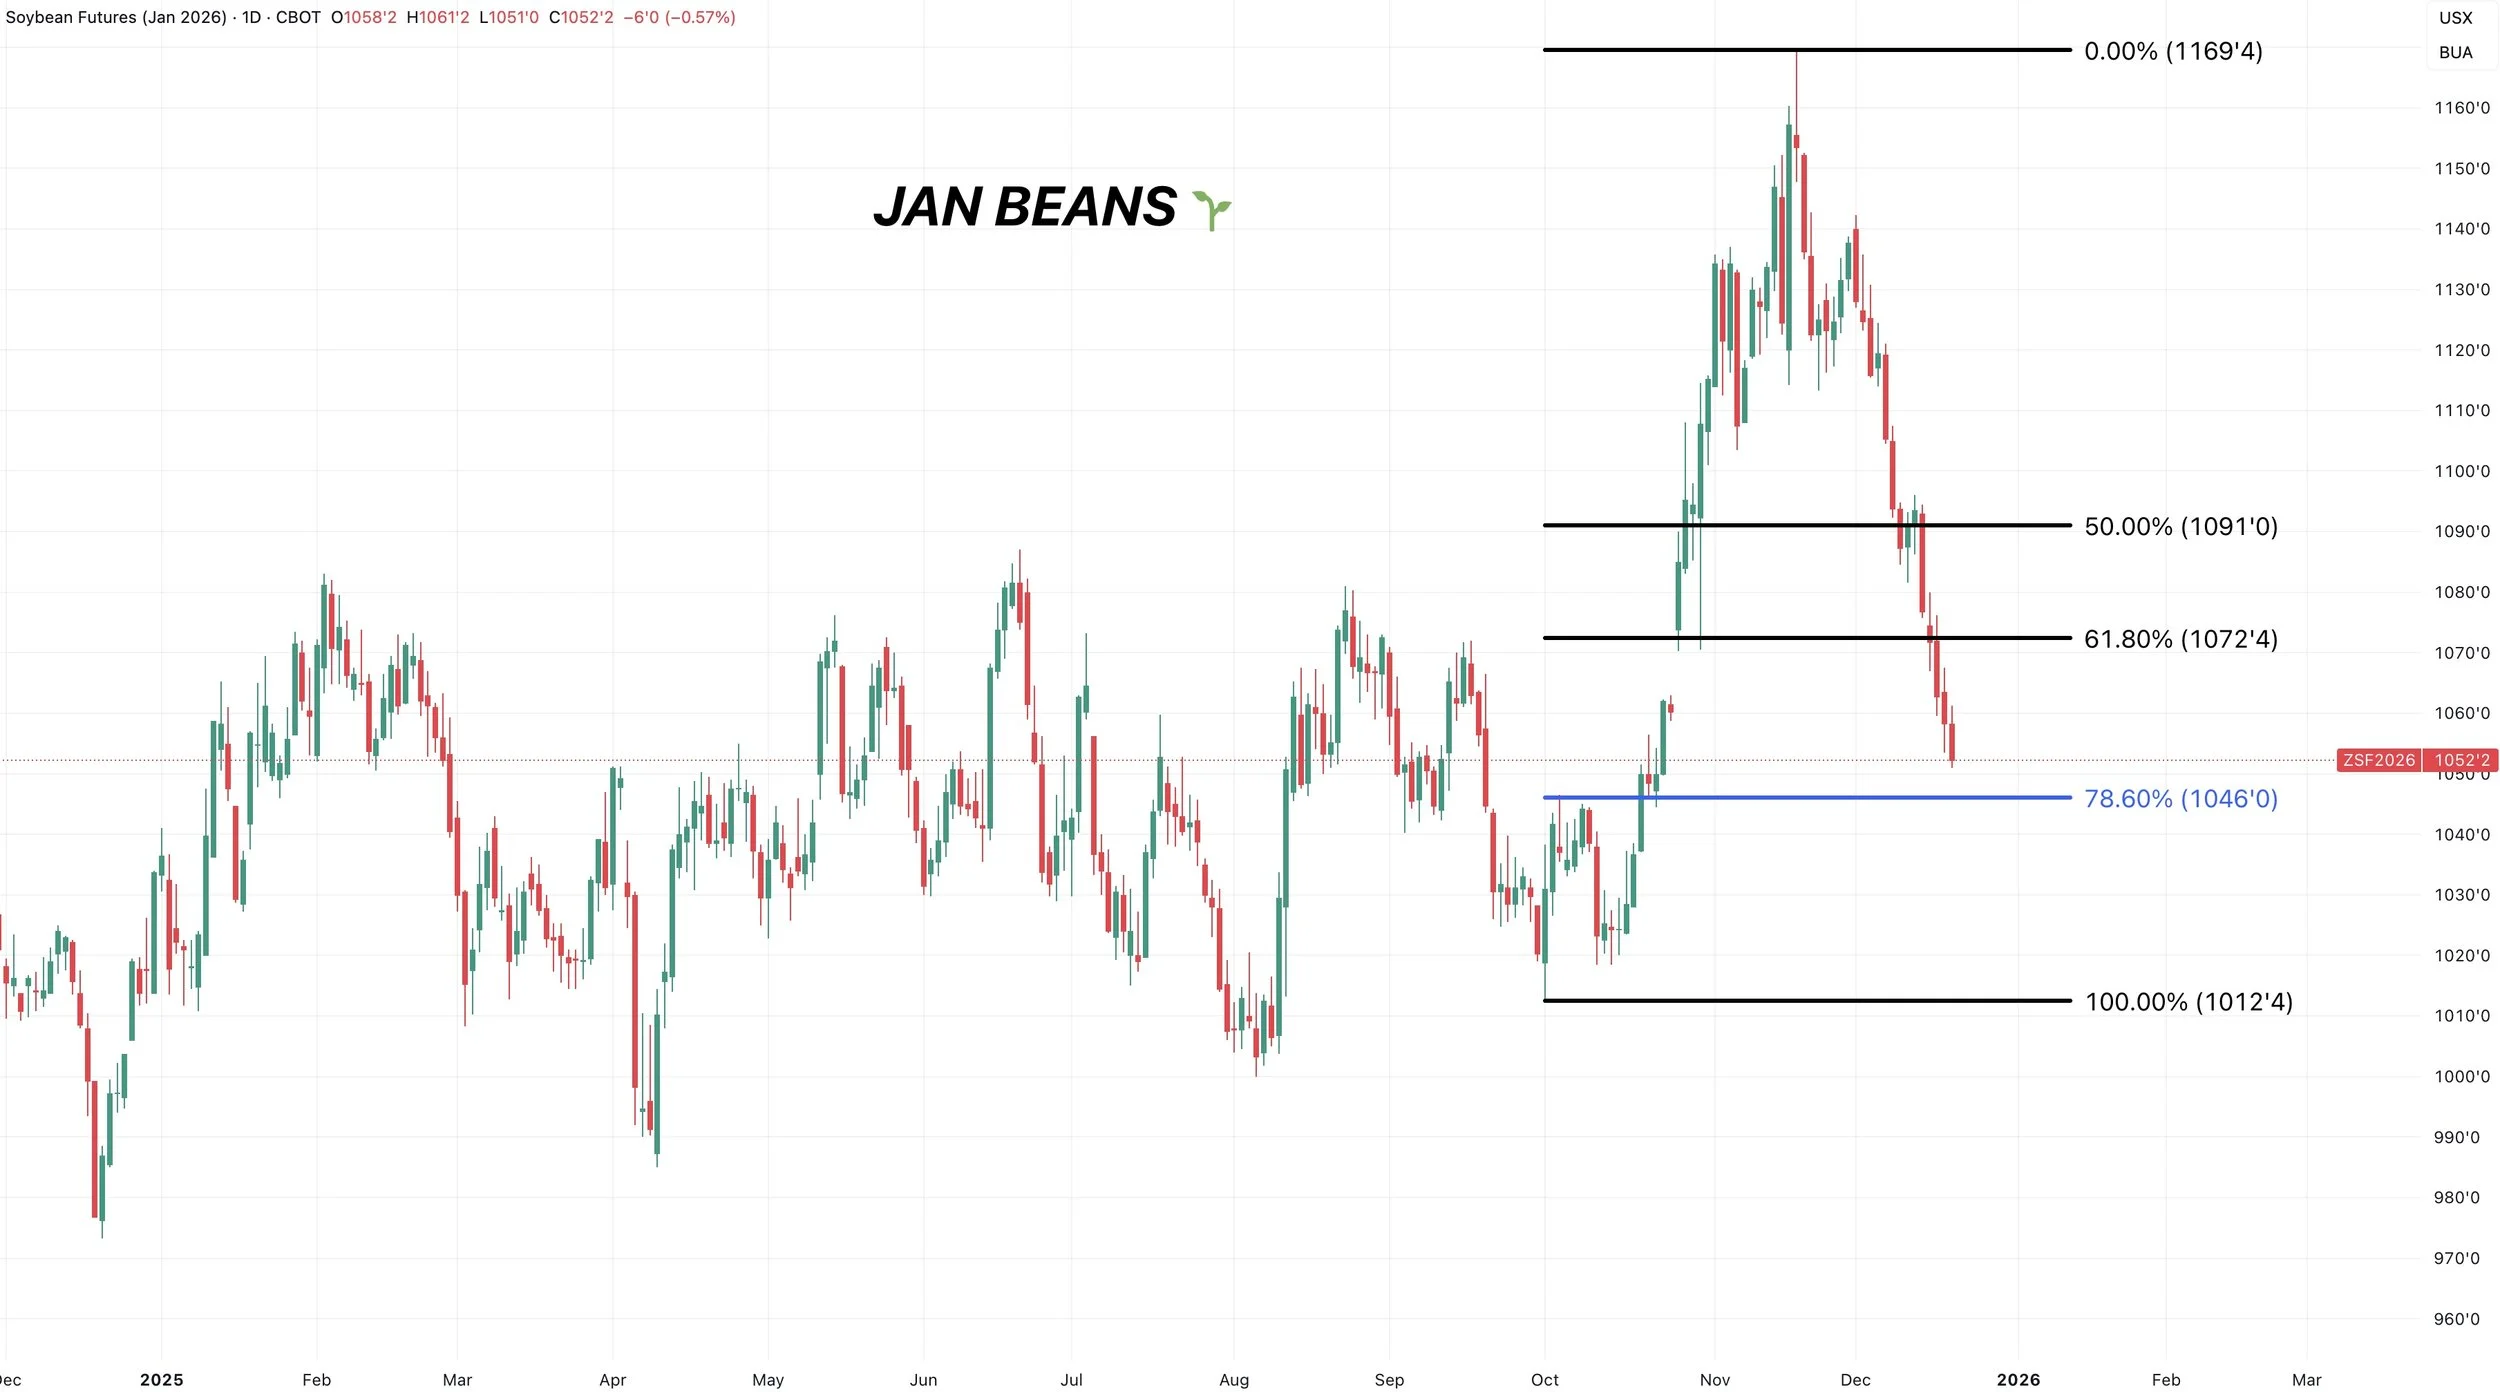
Here is another look at Jan beans.
We are approaching the 78.6% level of this entire China fueled rally after failing the 61.8% level.
That sits at $10.46 and closely aligns with our other downside targets.
So that makes this area an even bigger point of interest.
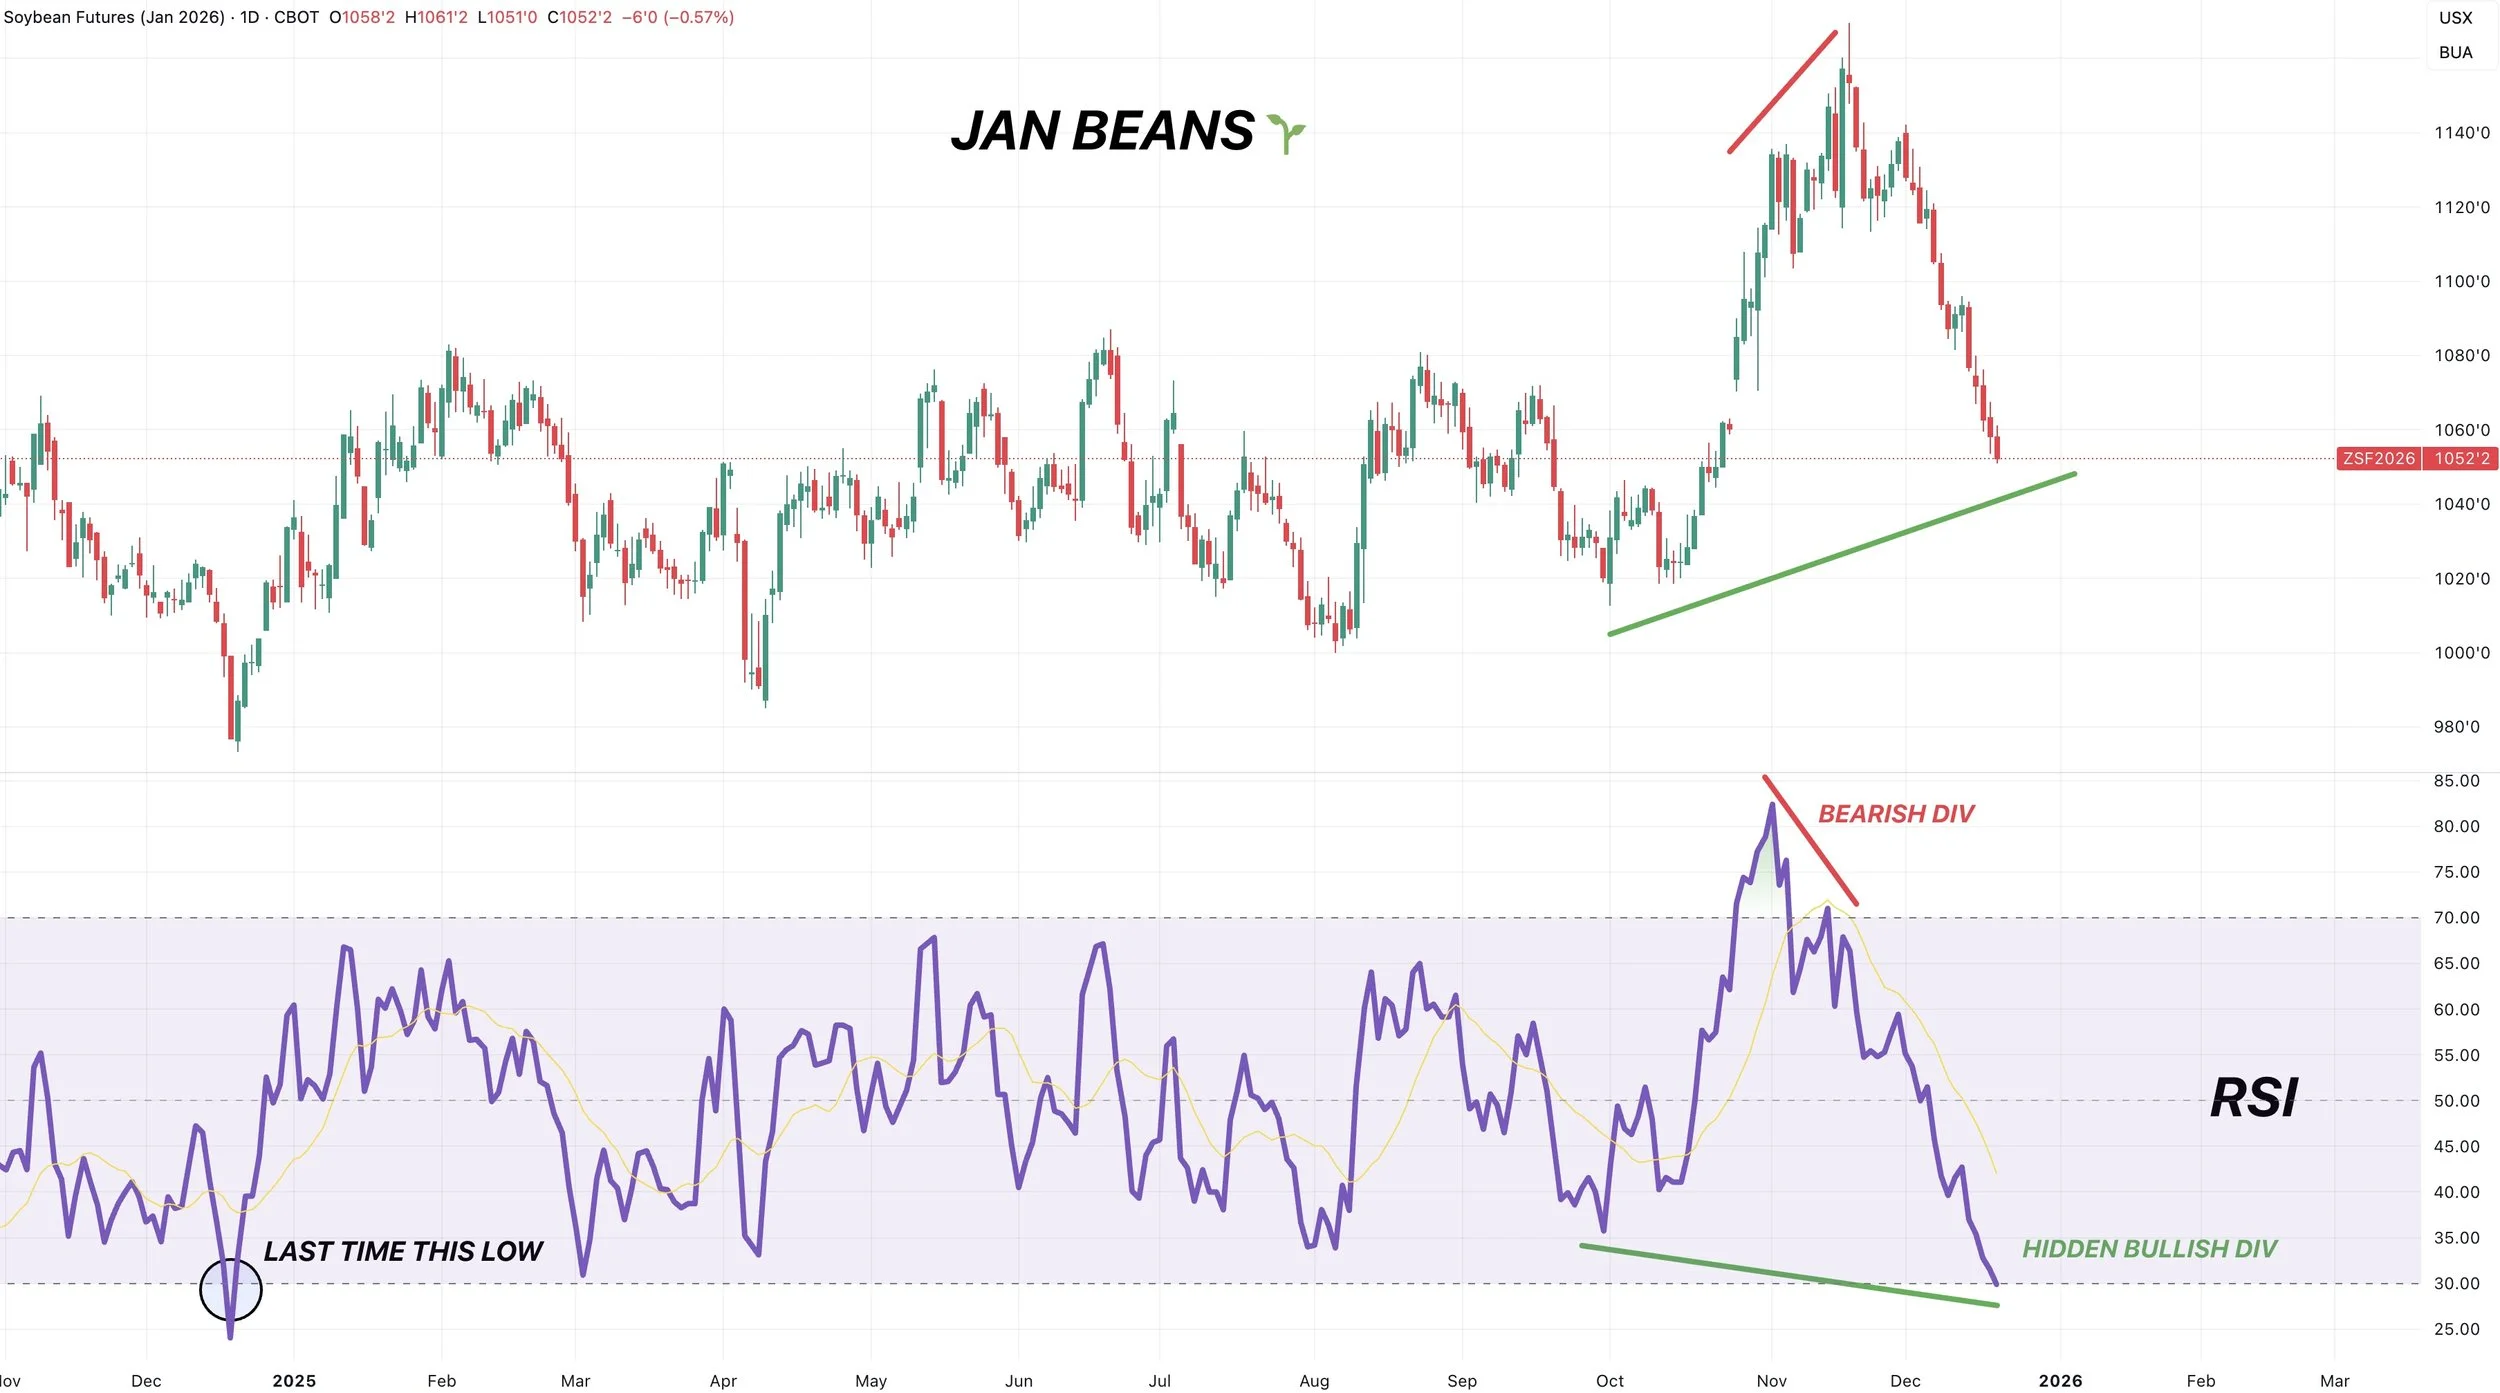
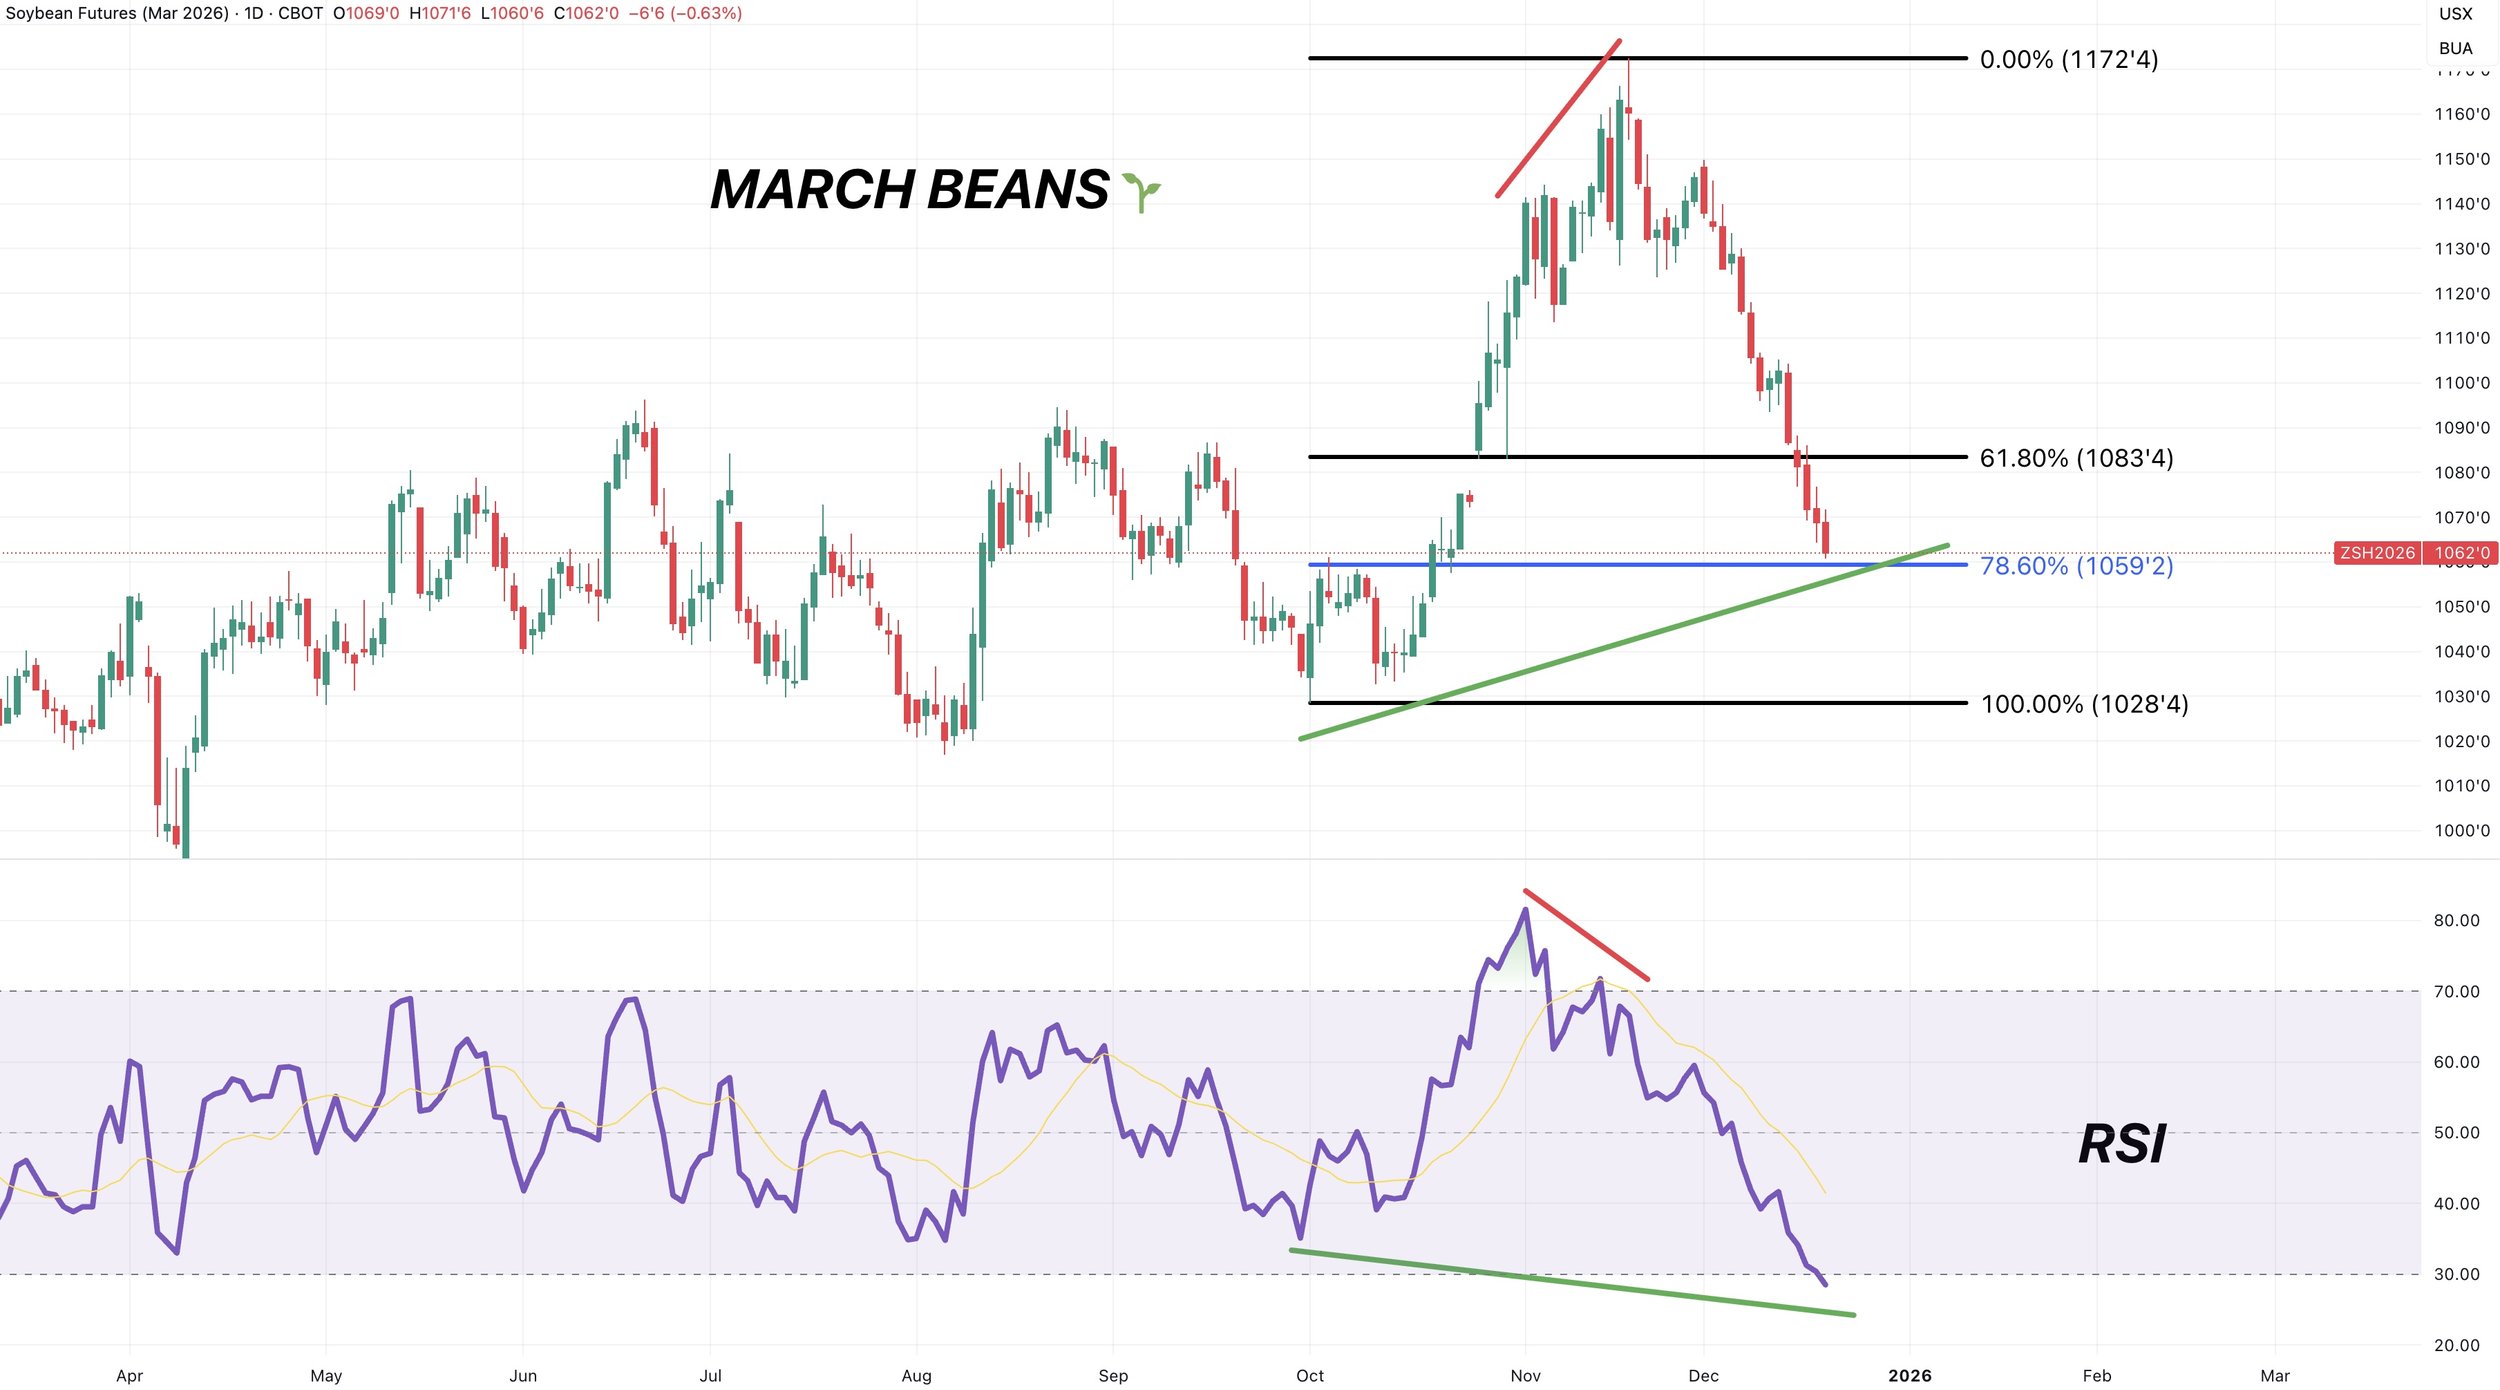
Soybeans are extremely oversold.
This is the most oversold the RSI has been since last year.
At the same time, prices are a lot higher than they were the last time the RSI was this oversold.
This is called hidden bullish divergence.
It doesn’t mean prices "have" to go higher. It is simply an indication that downside momentum might start to weaken.
Bearish divergence did actually mark the highs in the market as well. Prices were posting new highs, the RSI was not. Signaling that upside momentum was potentially getting weak.
Bullish divergence alone isn’t usually something that is enough for us to trigger a buy signal on its own, as it can become invalid and markets can stay oversold or overbought longer than you think. But when paired with important retracement levels, it adds even more interest.
For example, the reason for the sell signal back near the highs wasn’t bearish divergence. It was because we hit the 61.8% level up to contract highs.
Here is one last reason why we find this area a point of interest.
This is the active daily continuation chart, which currently shows Jan soybeans.
Back at the highs, there was an upside gap at $11.55. Which was another reason for that sell signal.
Now to the downside, we have a gap sitting at $10.45 1/2. Which lines up with our other downside targets.
March Beans
March soybeans are nearing that 78.6% level from the entire China rally as well.
That level sits at $10.59
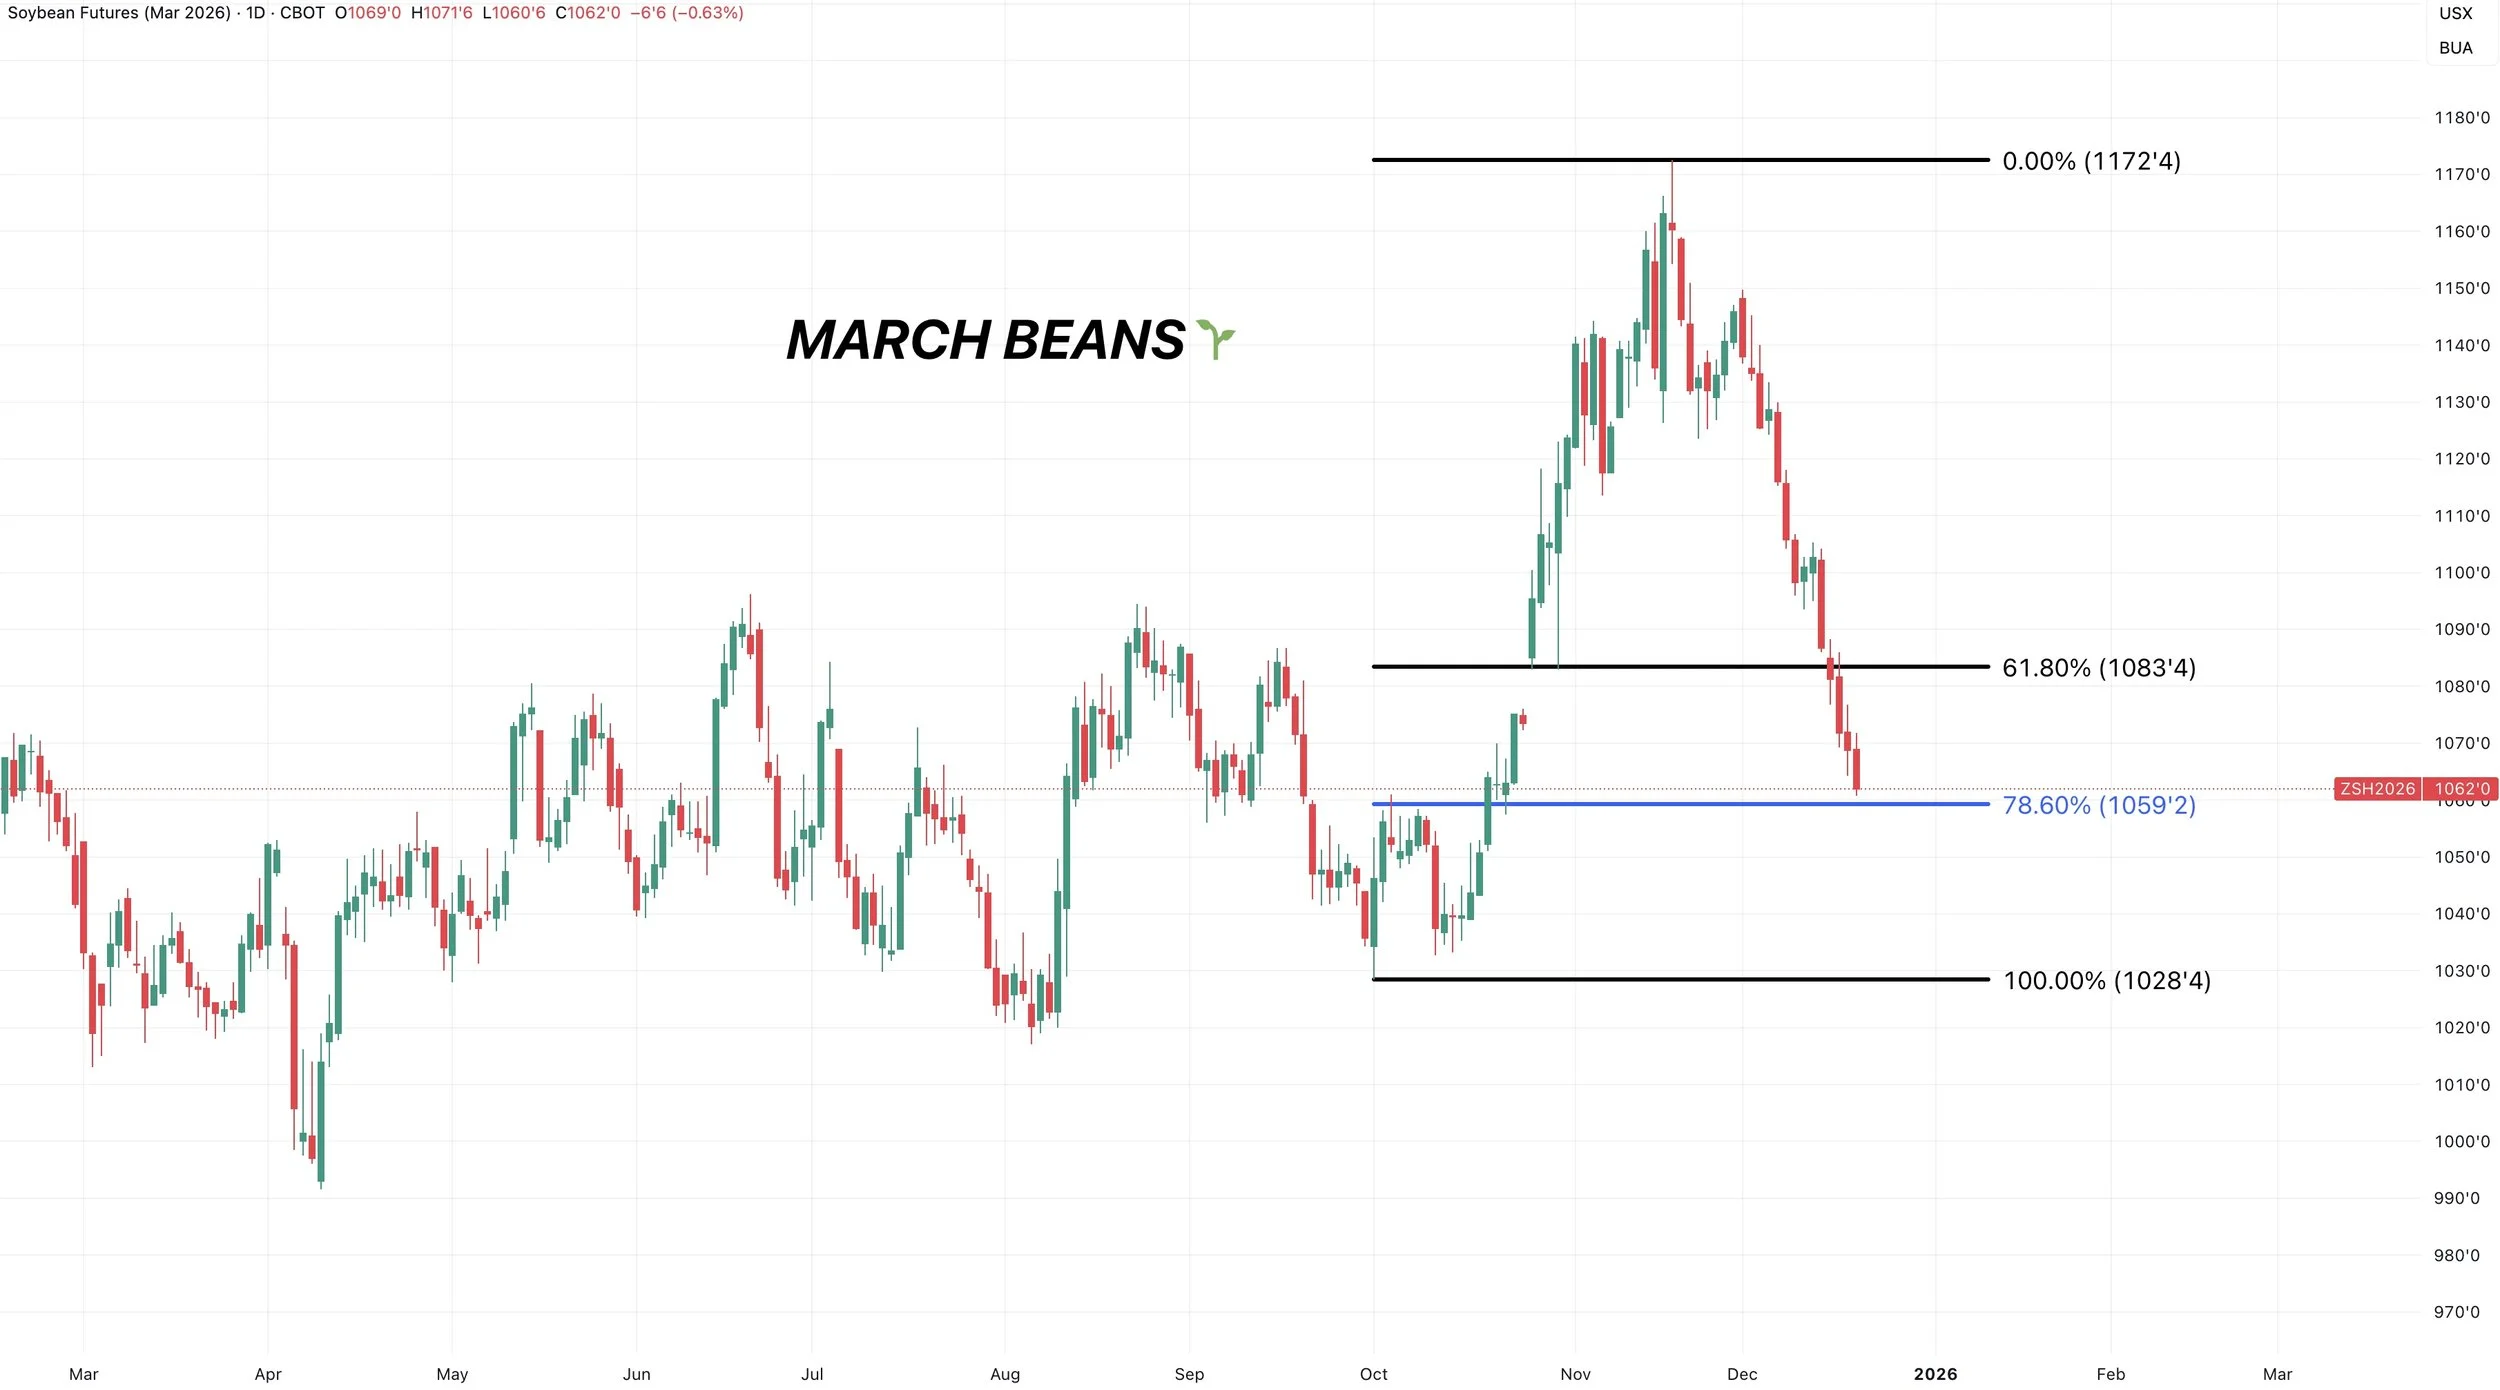
March soybeans are also showing the same hidden bullish divergence.
Sitting at their most oversold levels in a very long time.
Corn
Technicals:
March Corn
The clear level to break to the upside is $4.50
Do that and it should spark some upside.
It was key support from spring.
It reclaimed 50% of the Feb highs.
Both of those are the reasons we issued our first sell signal since April when we tagged that $4.50 resistance.
Until then, what should we expect?
(Scroll for next charts)
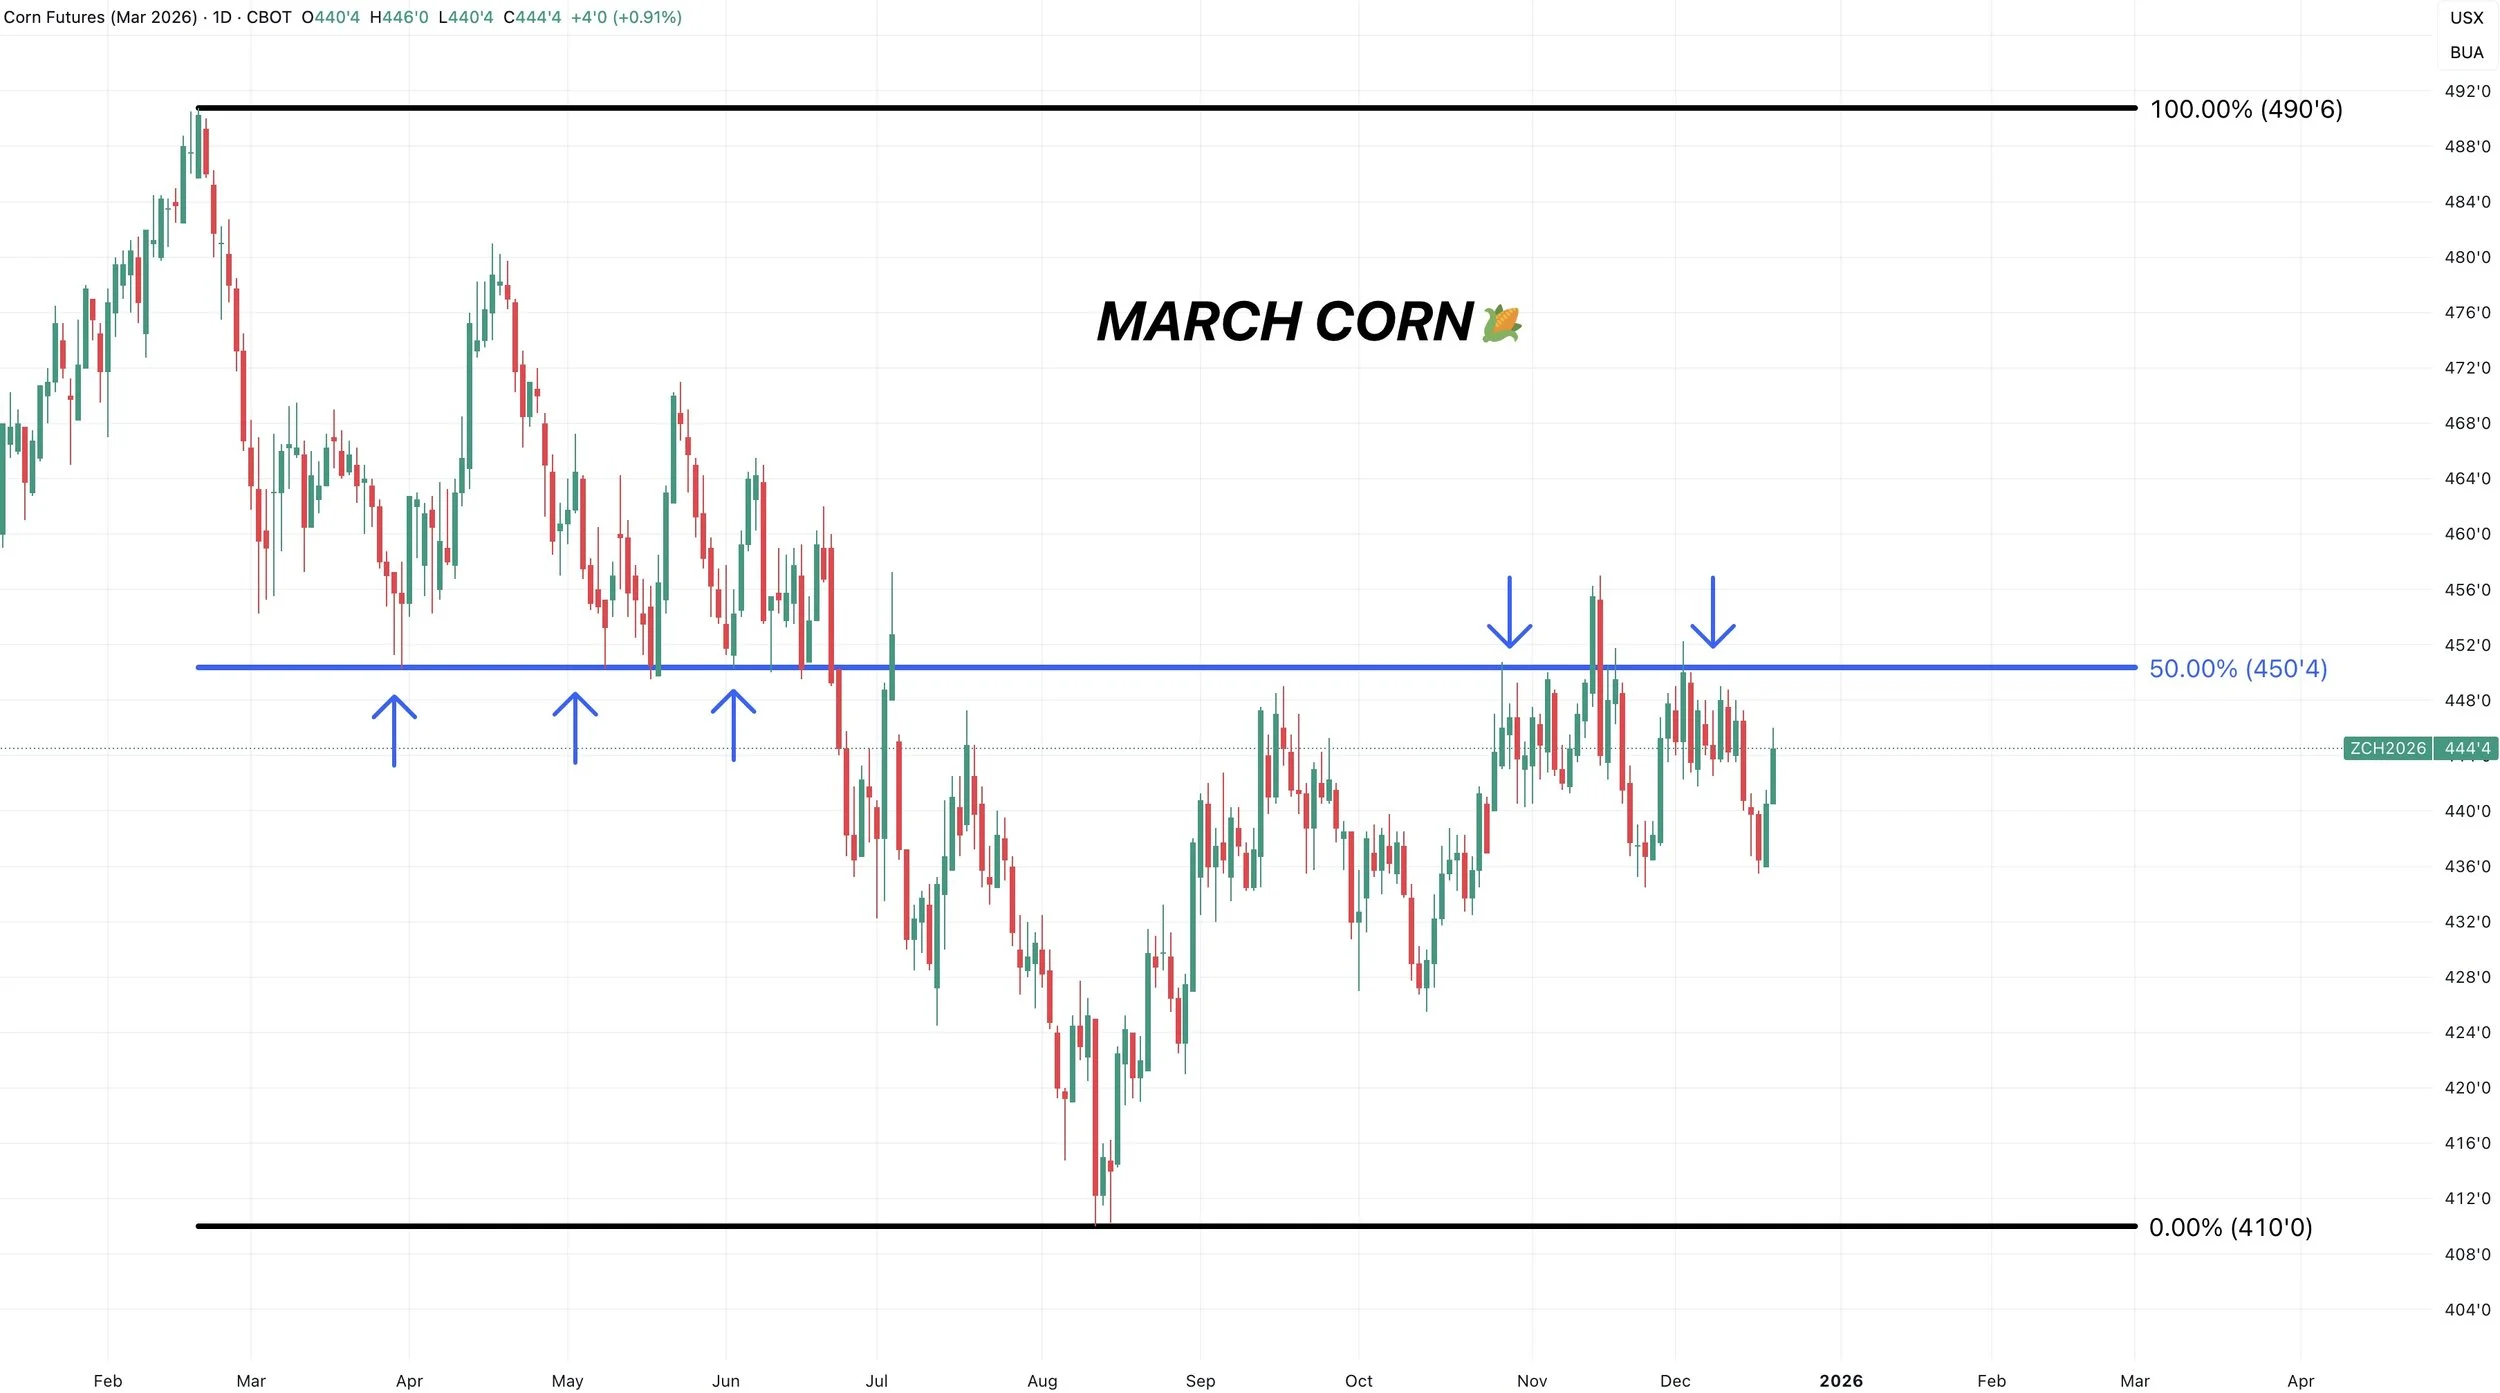
The very first sell off we experienced following that intial rally off contract lows bottomed after giving back 61.8% of the entire rally.
The most common level for a correction.
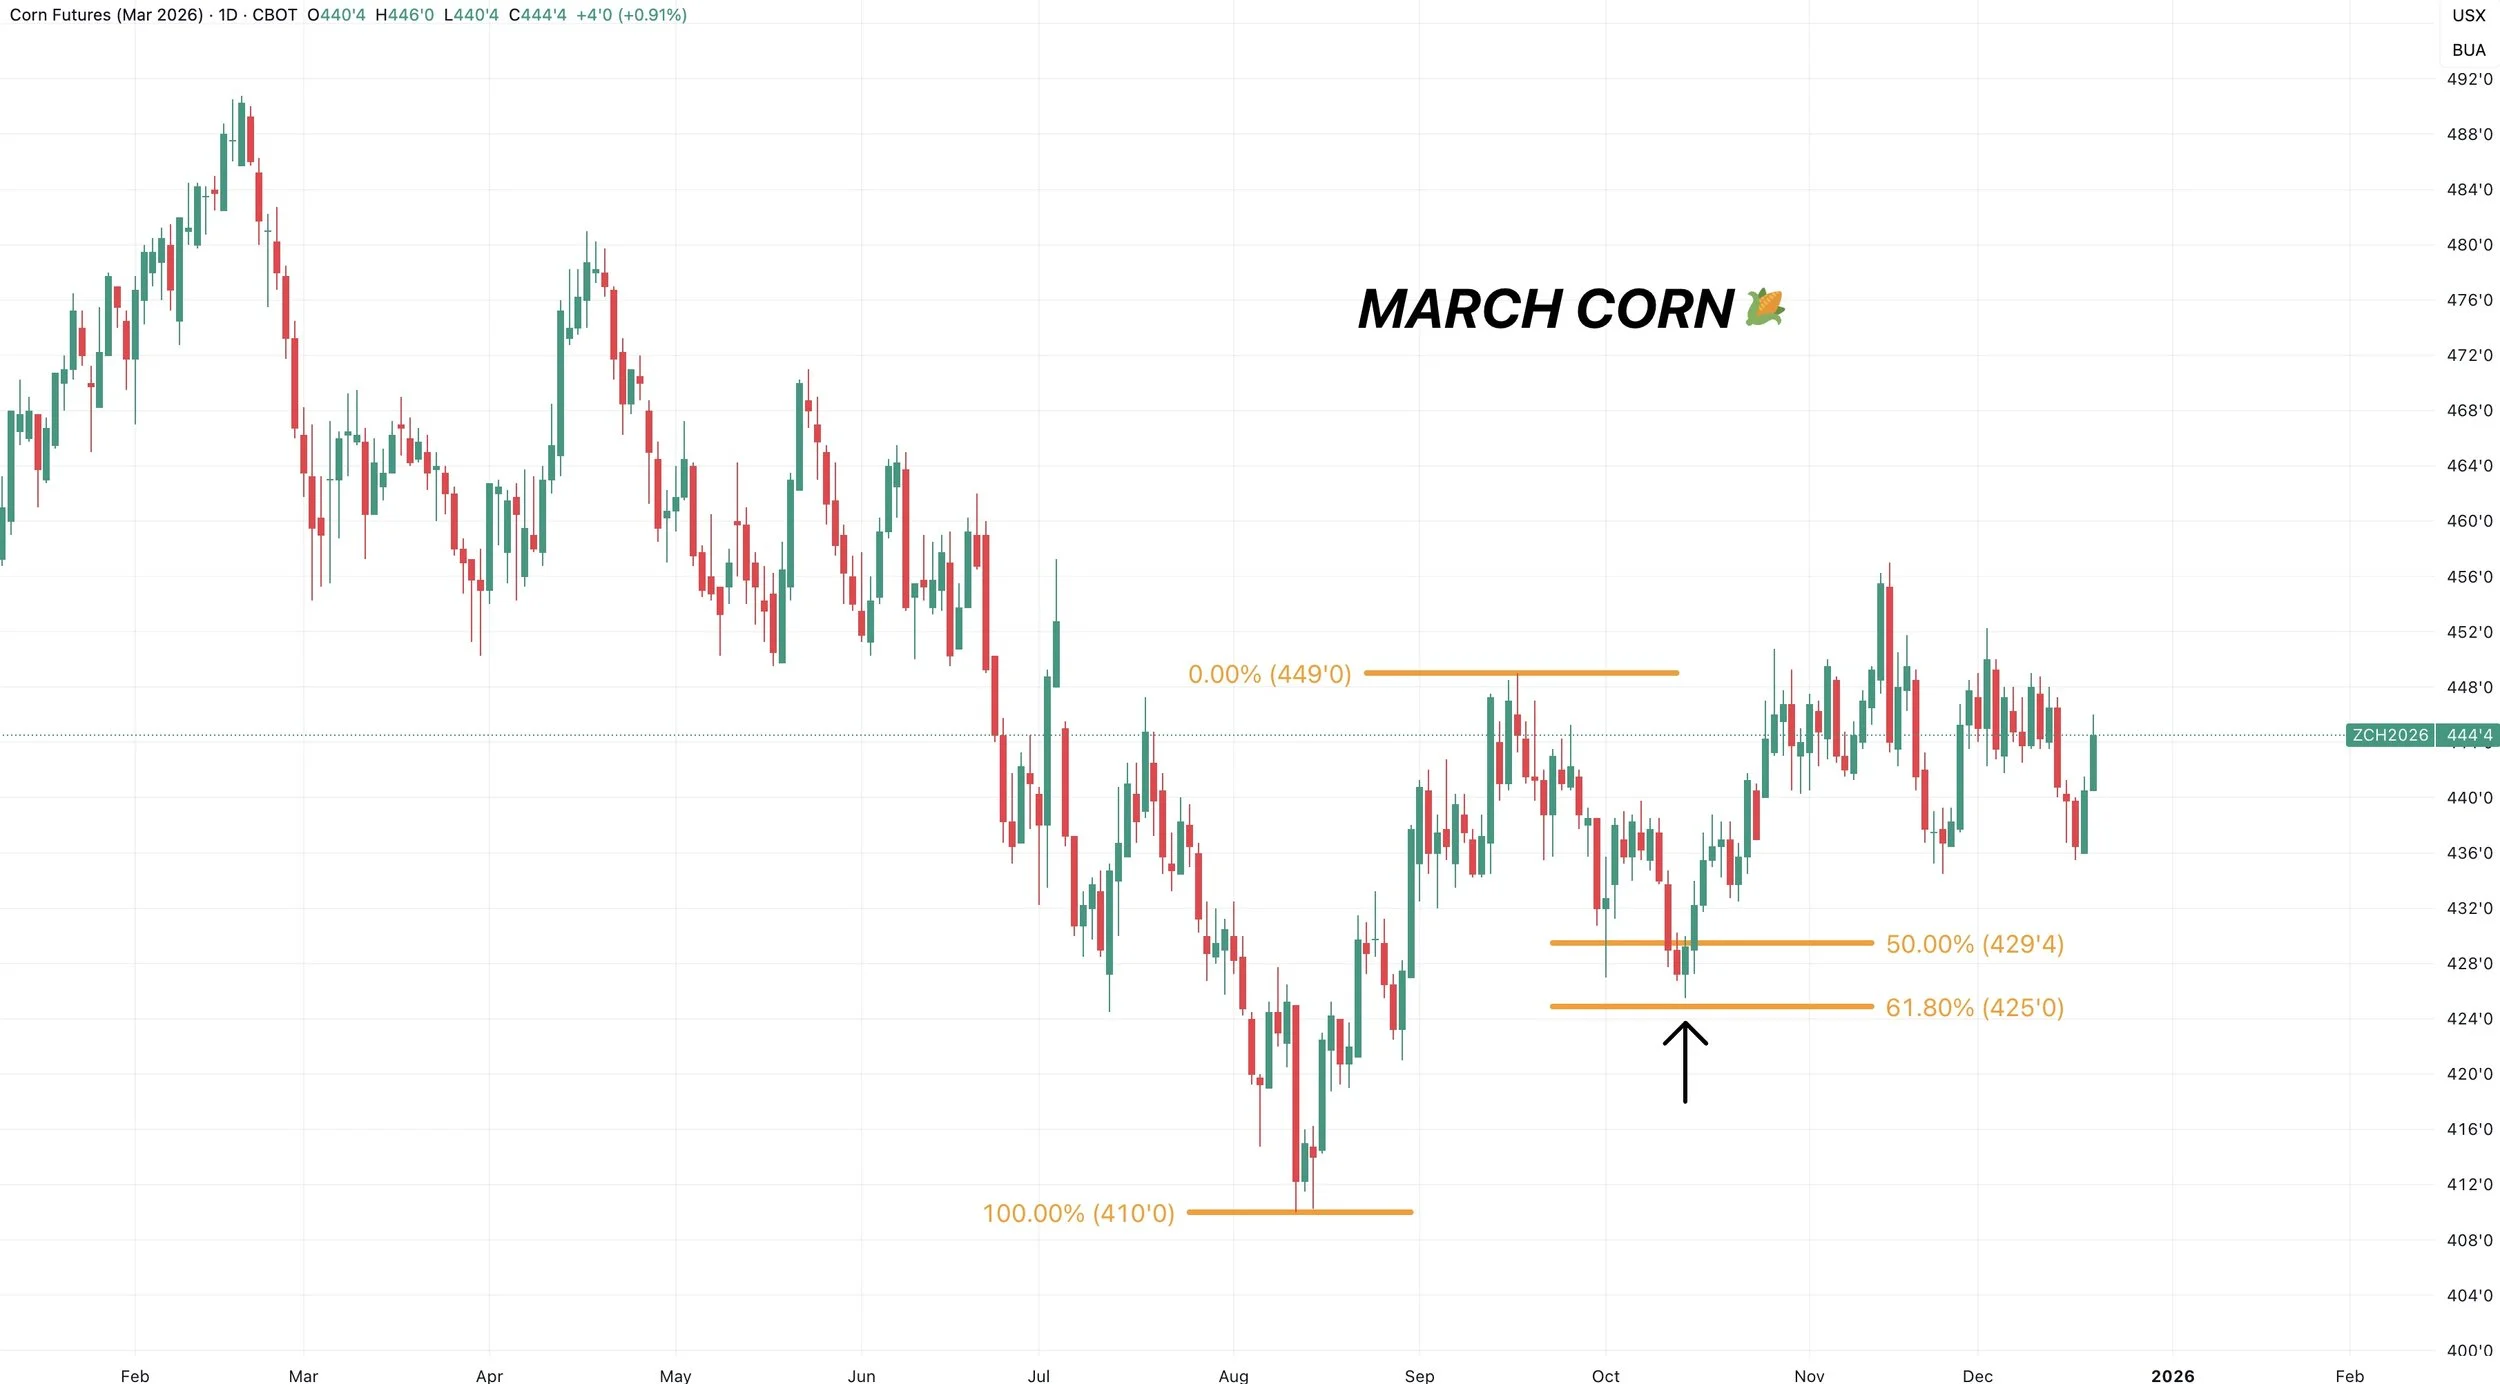
After finding a bottom in October, we then rallied and pulled back.
Falling right to that 61.8% level down to those October lows.
We are continuing to find life at that same exact level.
We "could" have a potential double bottom in place here.
However, I am not looking to re-own corn or anything here only a dime off the highs. The risk to reward just isn’t there.
The level I would look to buy is if we fell down towards $4.33 to $4.28
That gives back 50-61.8% of the entire rally off contract lows.
Which would be a standard-sized correction if it happened.
We don’t have to get down there, but if we fail this $4.37 level, that would be the next downside target and a point of interest.
Really, anything between $4.37 and $4.50 is viewed as noise.
Break above $4.50 and it should spark more upside.
The only time we broke above was the day before the USDA report in November, where they ultimately spoiled the party the next day.
Break below $4.37 and we likely get a leg lower down to that target box we talked about above.
Examples of Identifying Targets:
Now I just wanted to go over some past examples as to how these targets work, and things we've seen in the past.
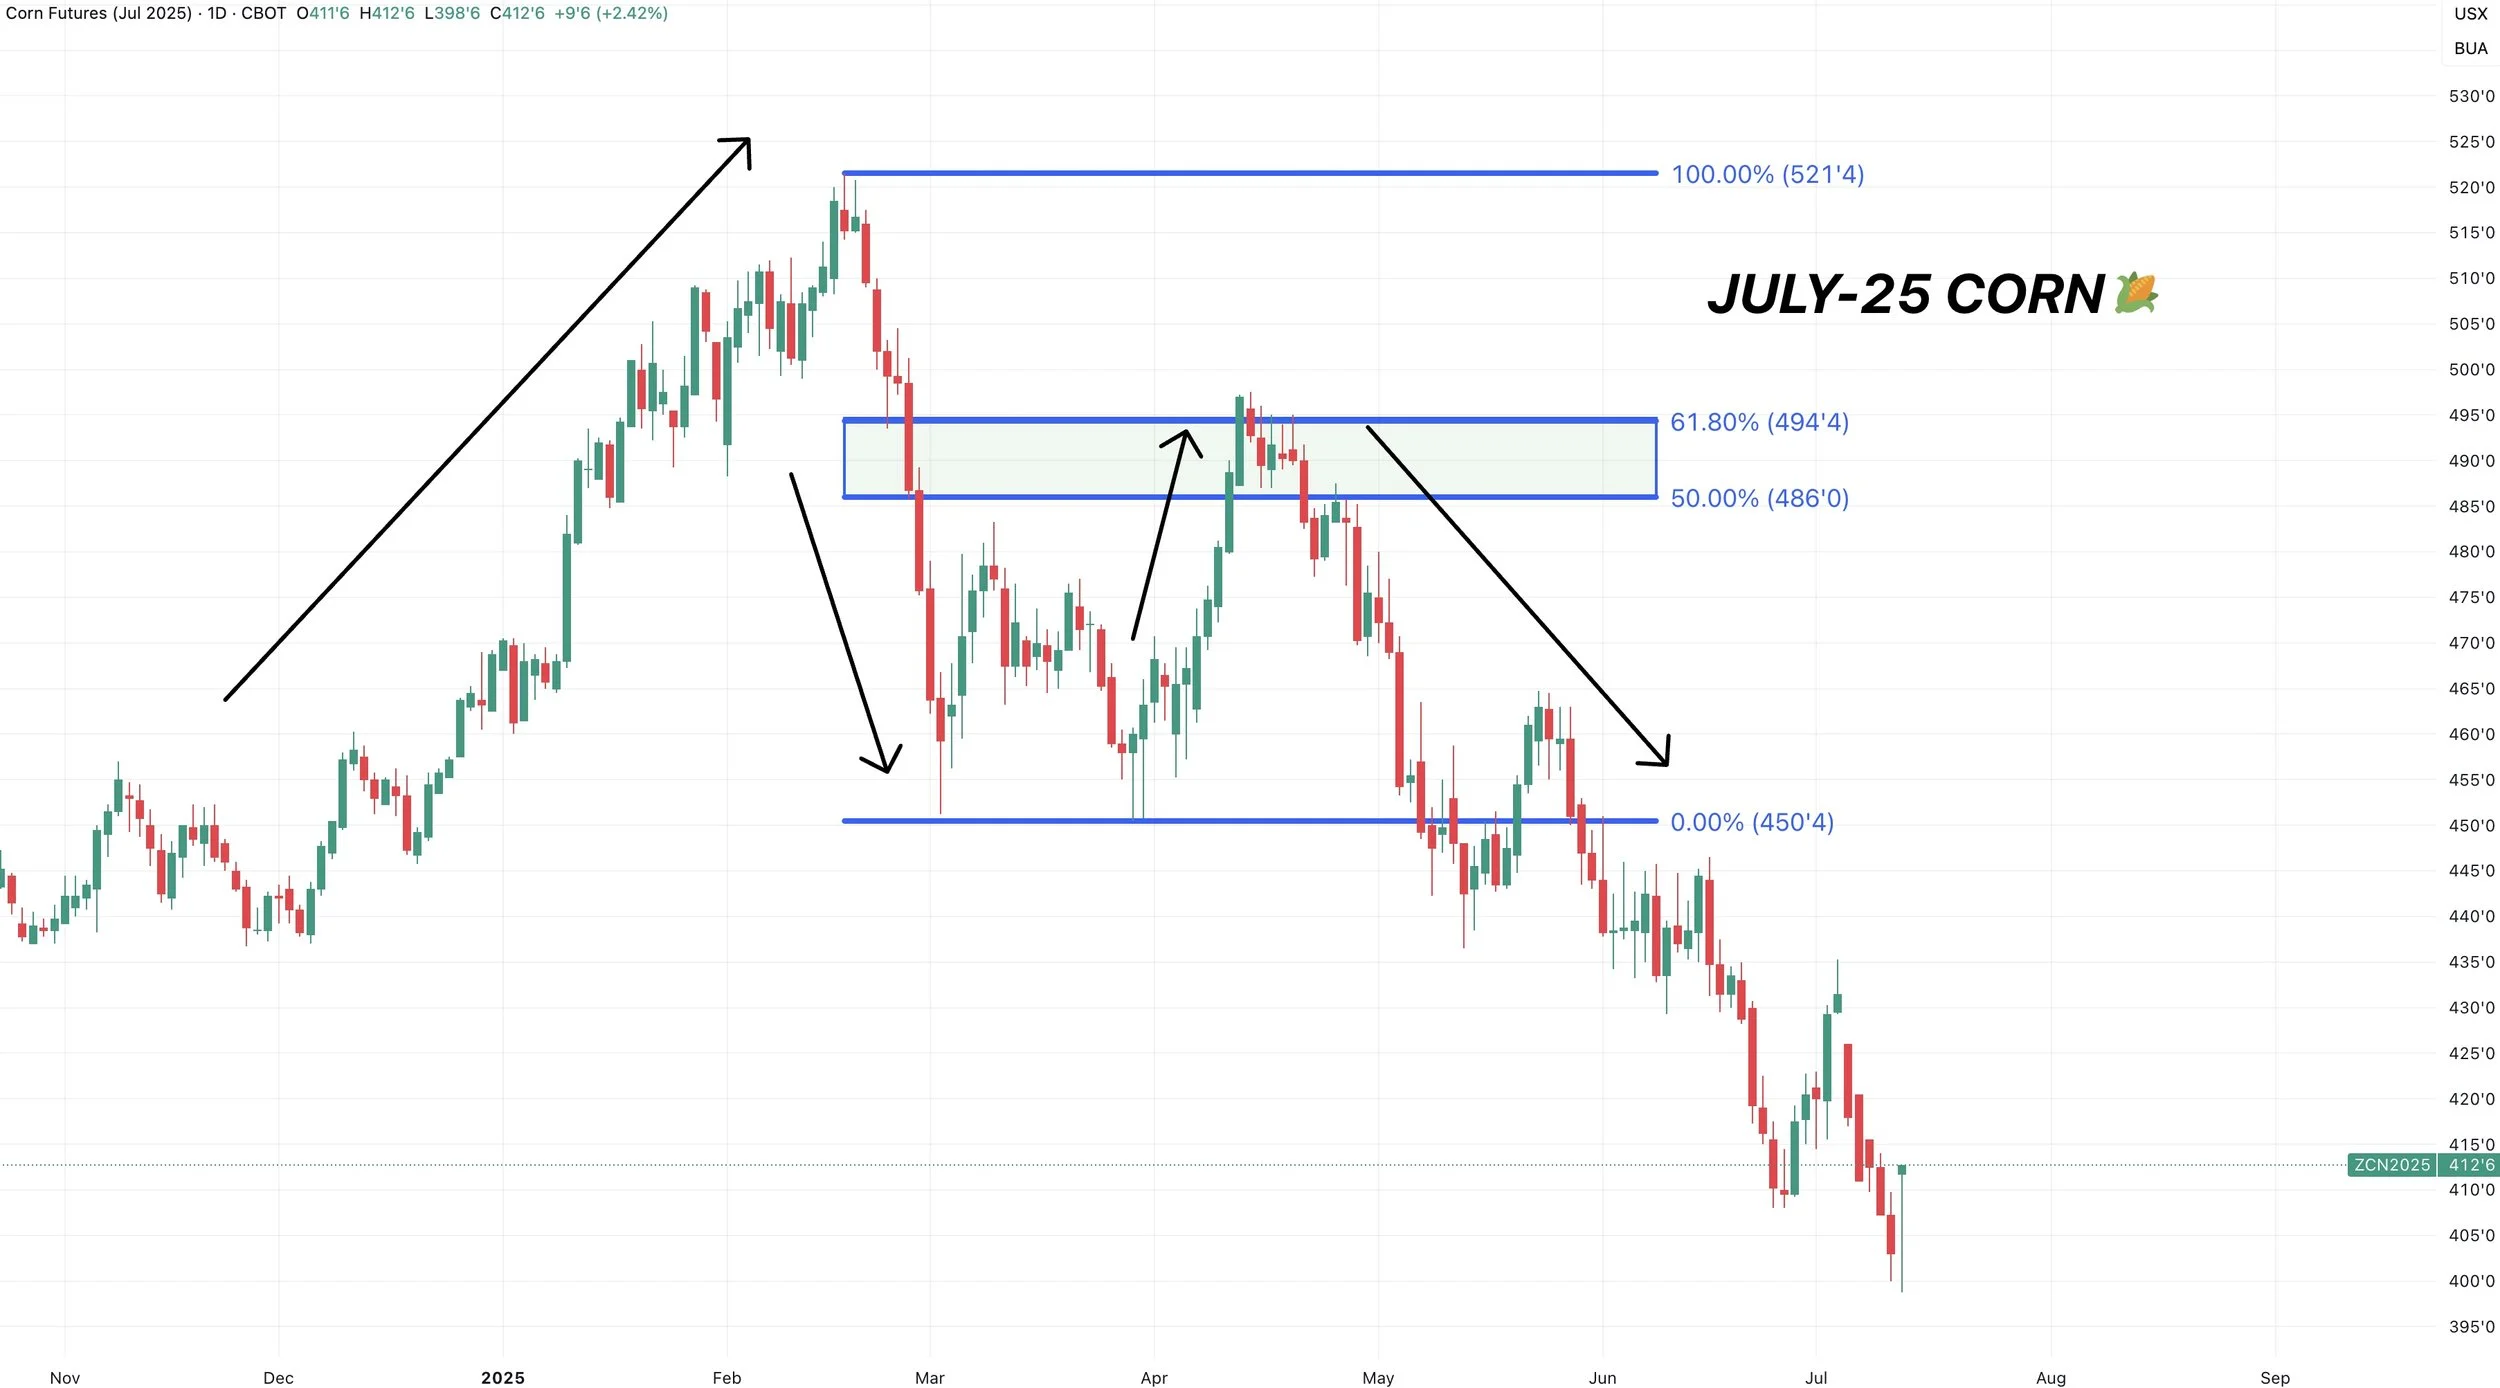
For this example, we are looking at July-25 corn from earlier this year.
All the way back in February, we issued a sell signal. Why?
We reclaimed 50% of the contract highs.
This same exact level lined up perfectly with the highs from May 2024.
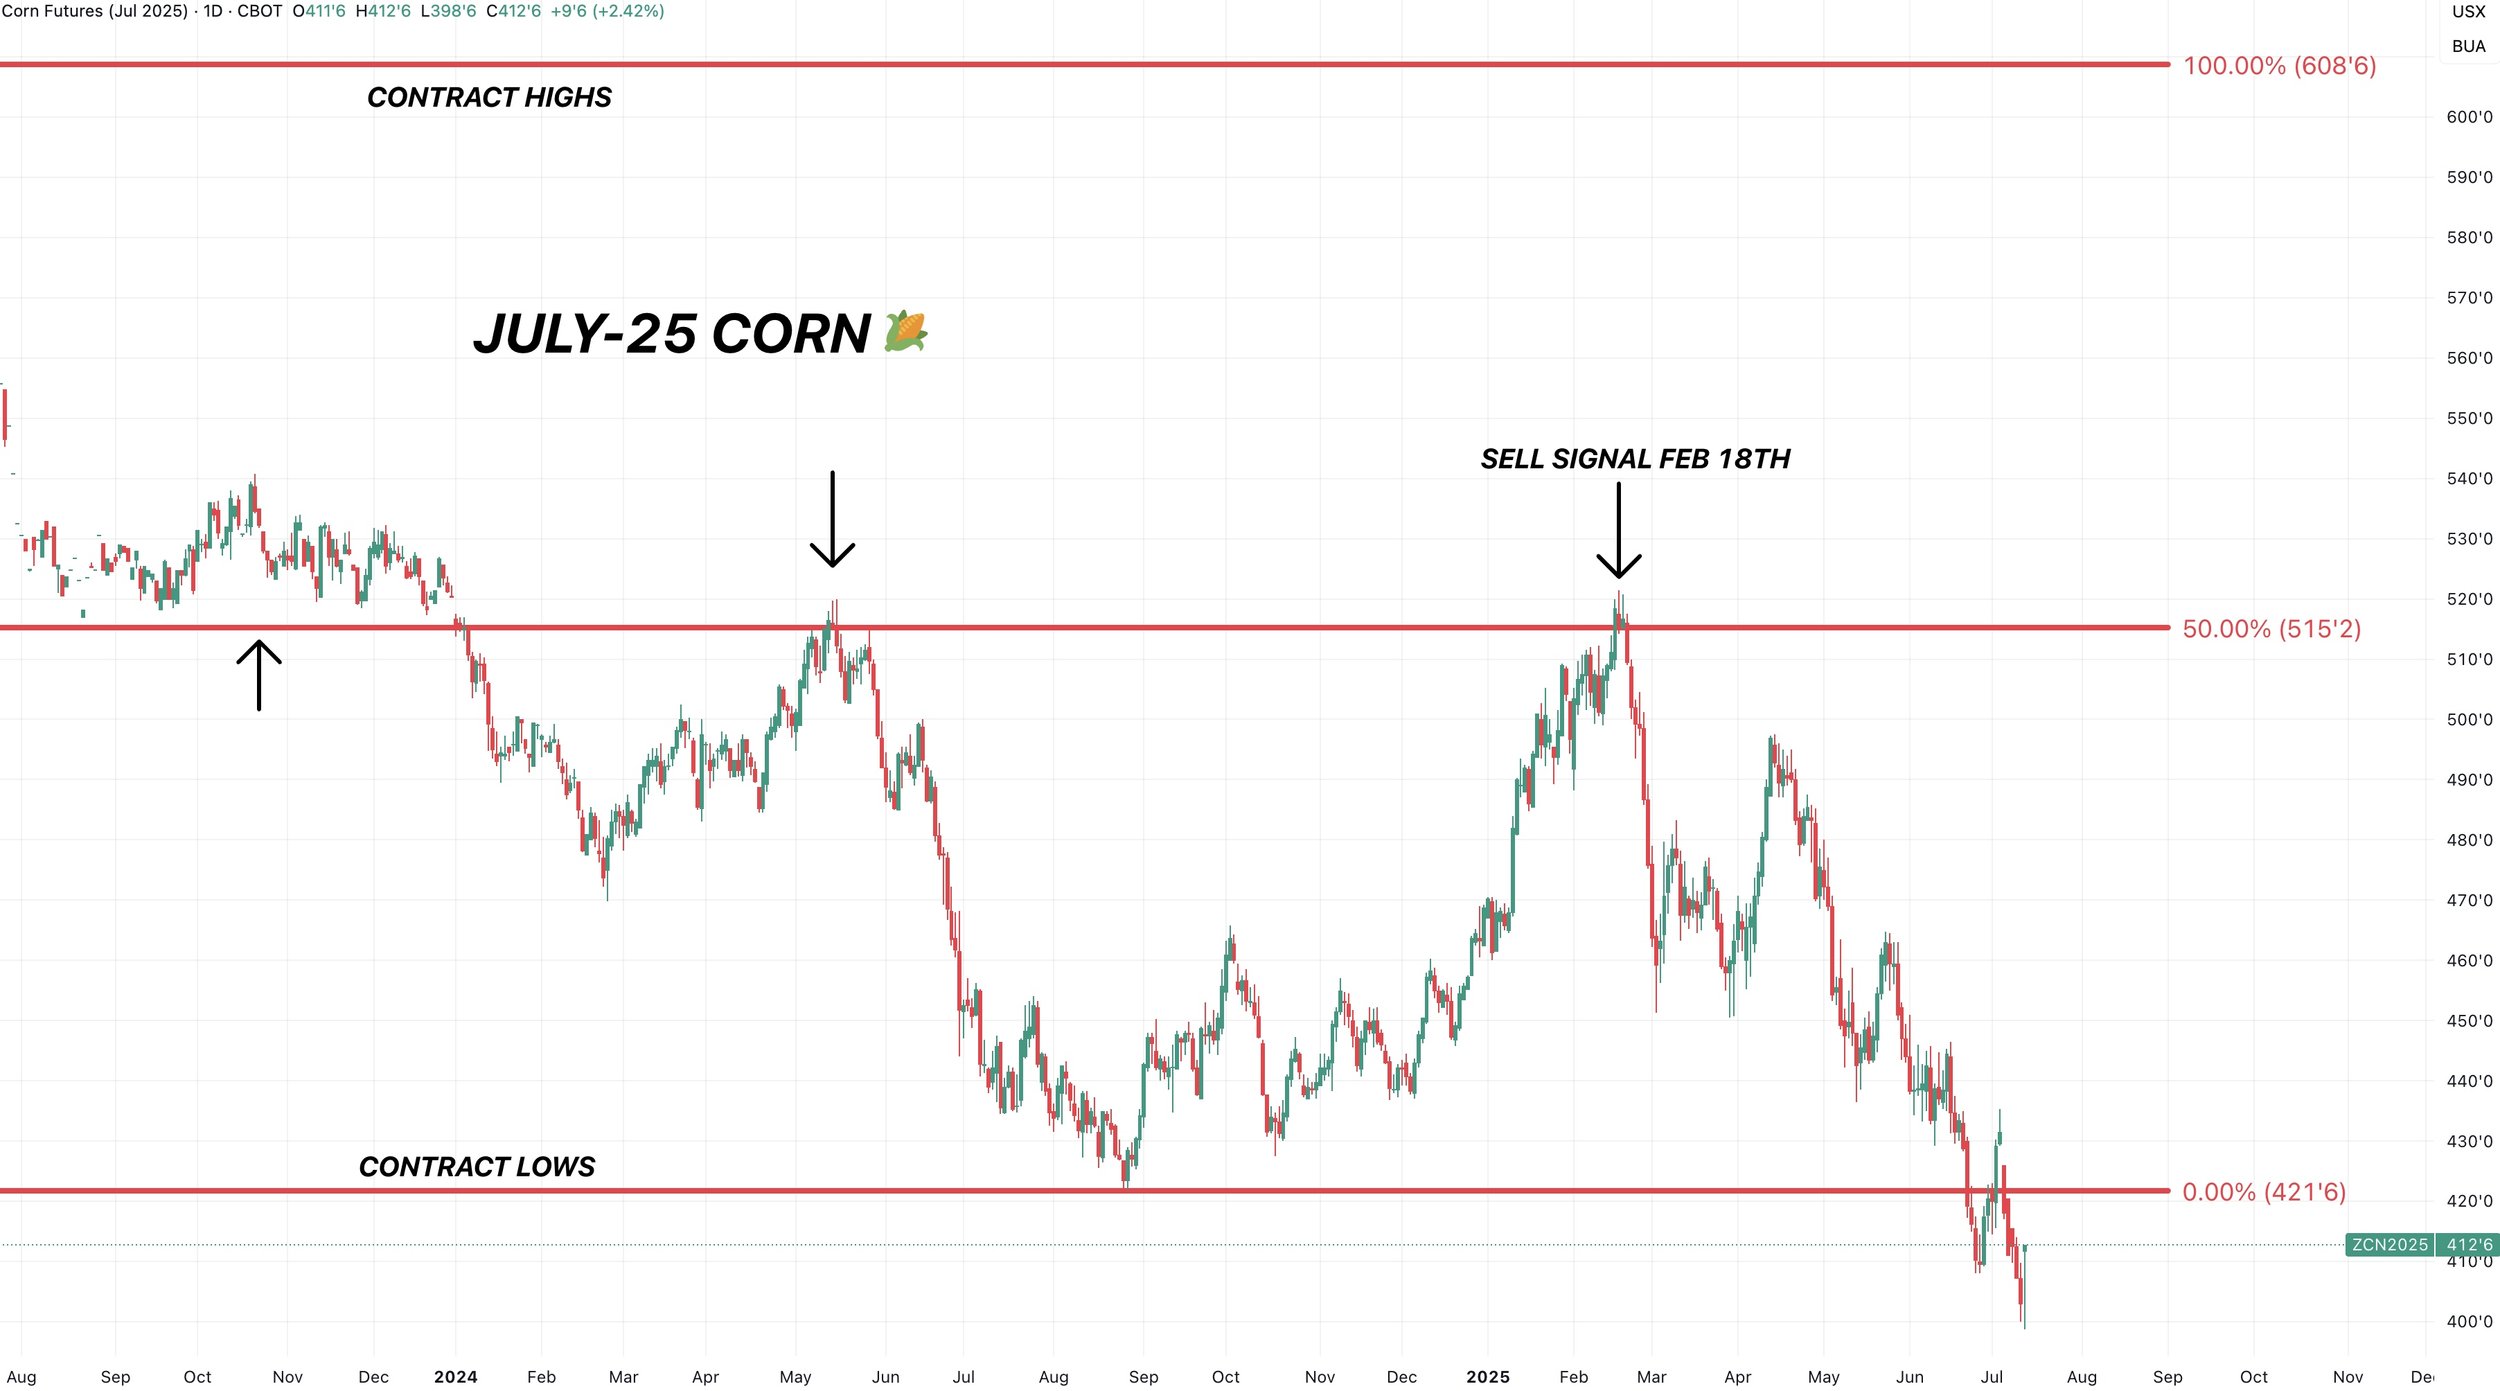
We then sold off but eventually got a relief bounce in April.
We then issued another sell signal. As that bounce clawed back 61.8% of the Feb highs before ultimately failing.
So you can see the importance behind these levels.
We will talk about this more in cattle section, and why we still like having our hedges on in that market.
Cattle
Technicals:
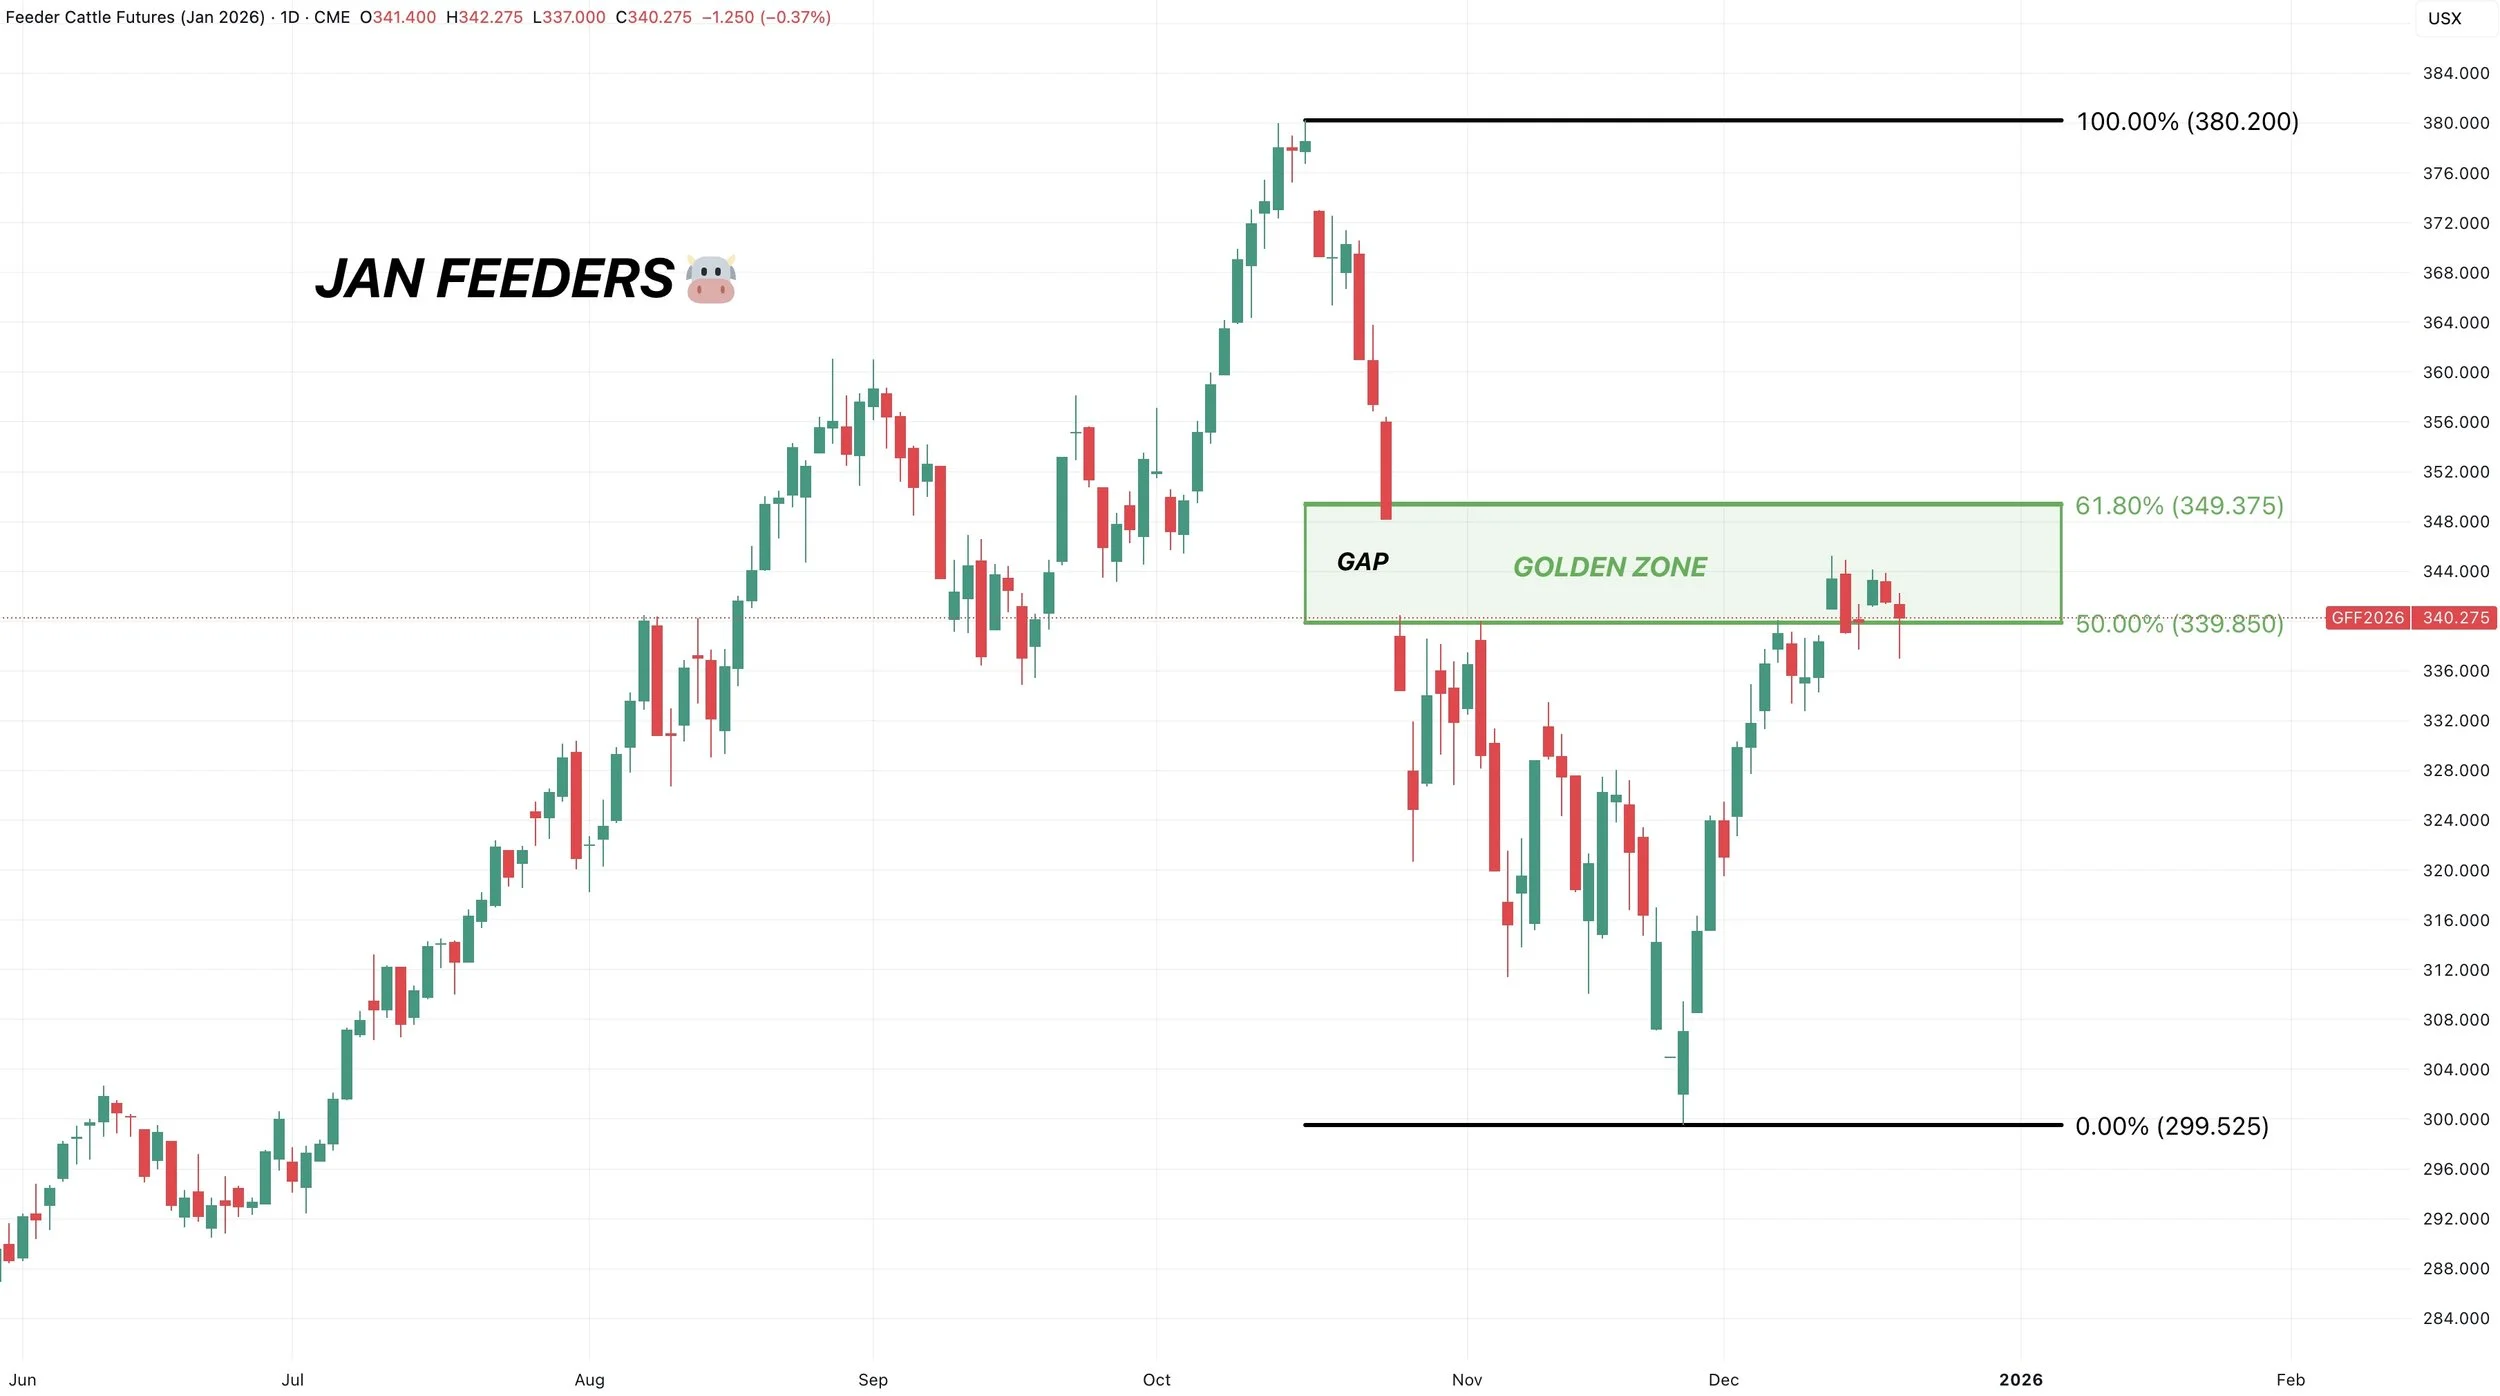
Jan Feeders
Feeders still sitting in that golden zone.
We still like having those hedges if you do not yet have any, following our sell signal a week ago.
This is the most common area for a relief bounce to fail at.
Could this be more than a simple bounce? Yes it could. But until we break above that 61.8% level, this is viewed as a relief bounce.
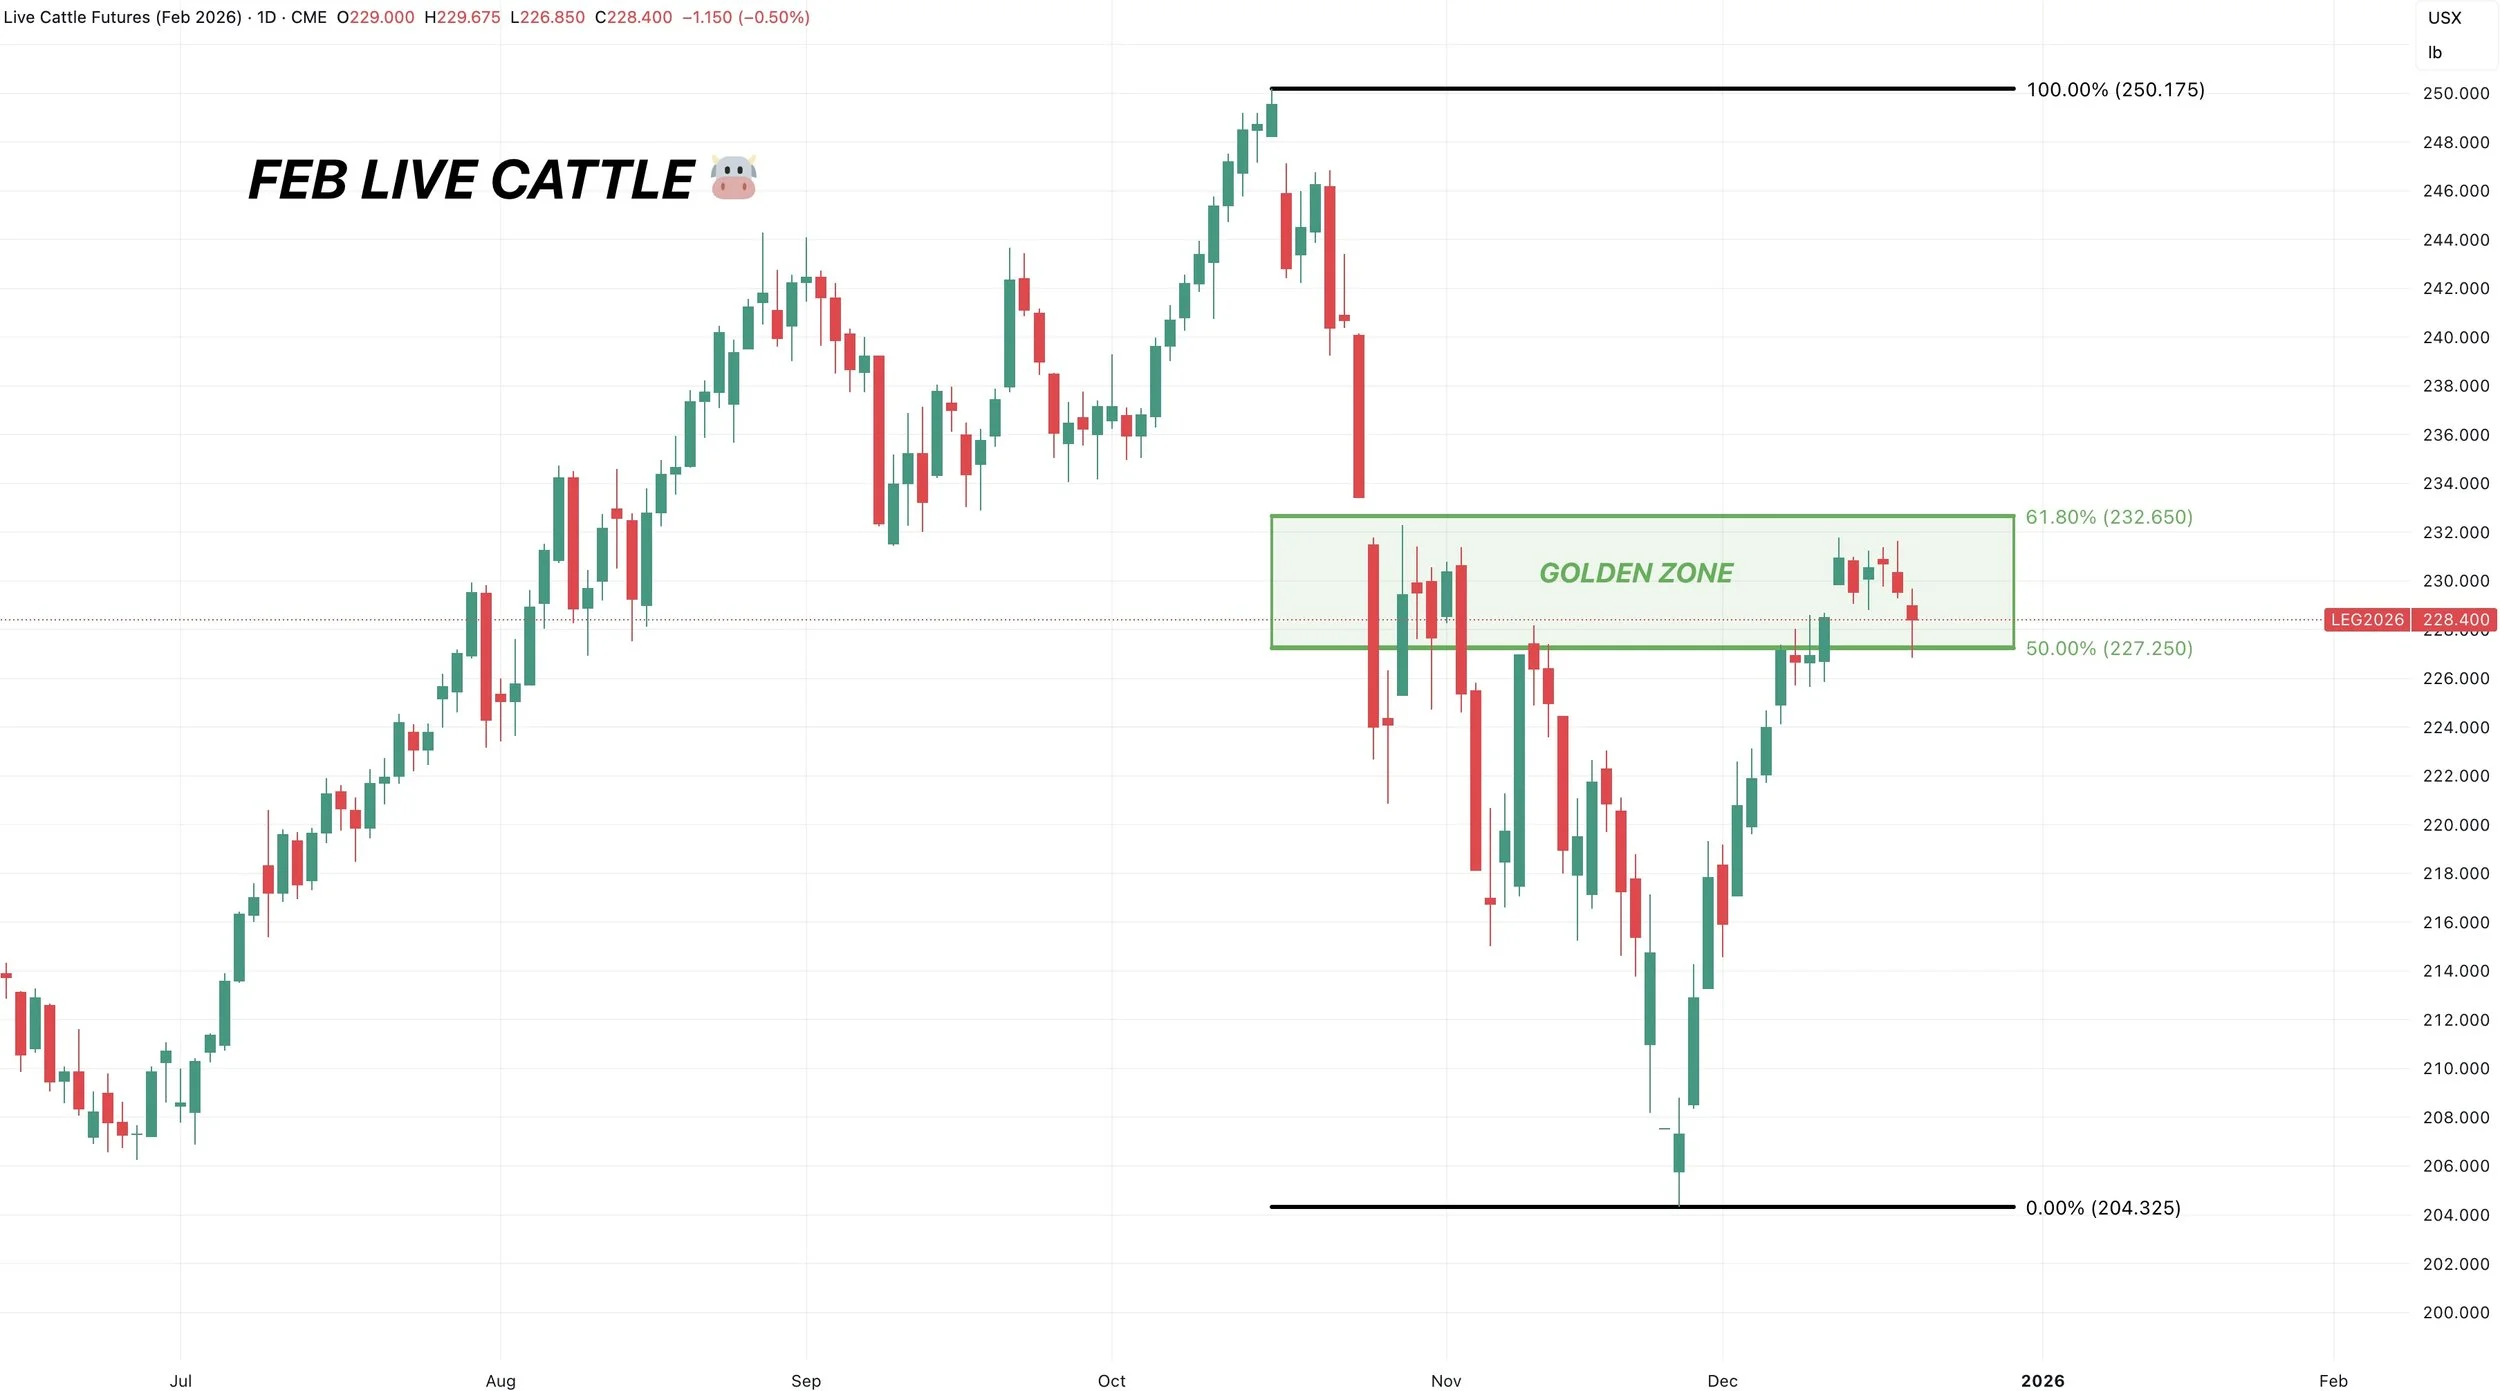
Feb Live
Same exact story in live cattle.
Still sitting in the golden zone.
Scroll to check out some past examples of relief bounces and how they often fail in the golden zone.
Examples of Relief Bounces:
Corn, wheat, and cattle are completely separate markets.
But I wanted to show you some examples of relief bounces, and why this rally in cattle should be treated with caution until we are proven wrong. Aka, breaking above that 61.8% level.
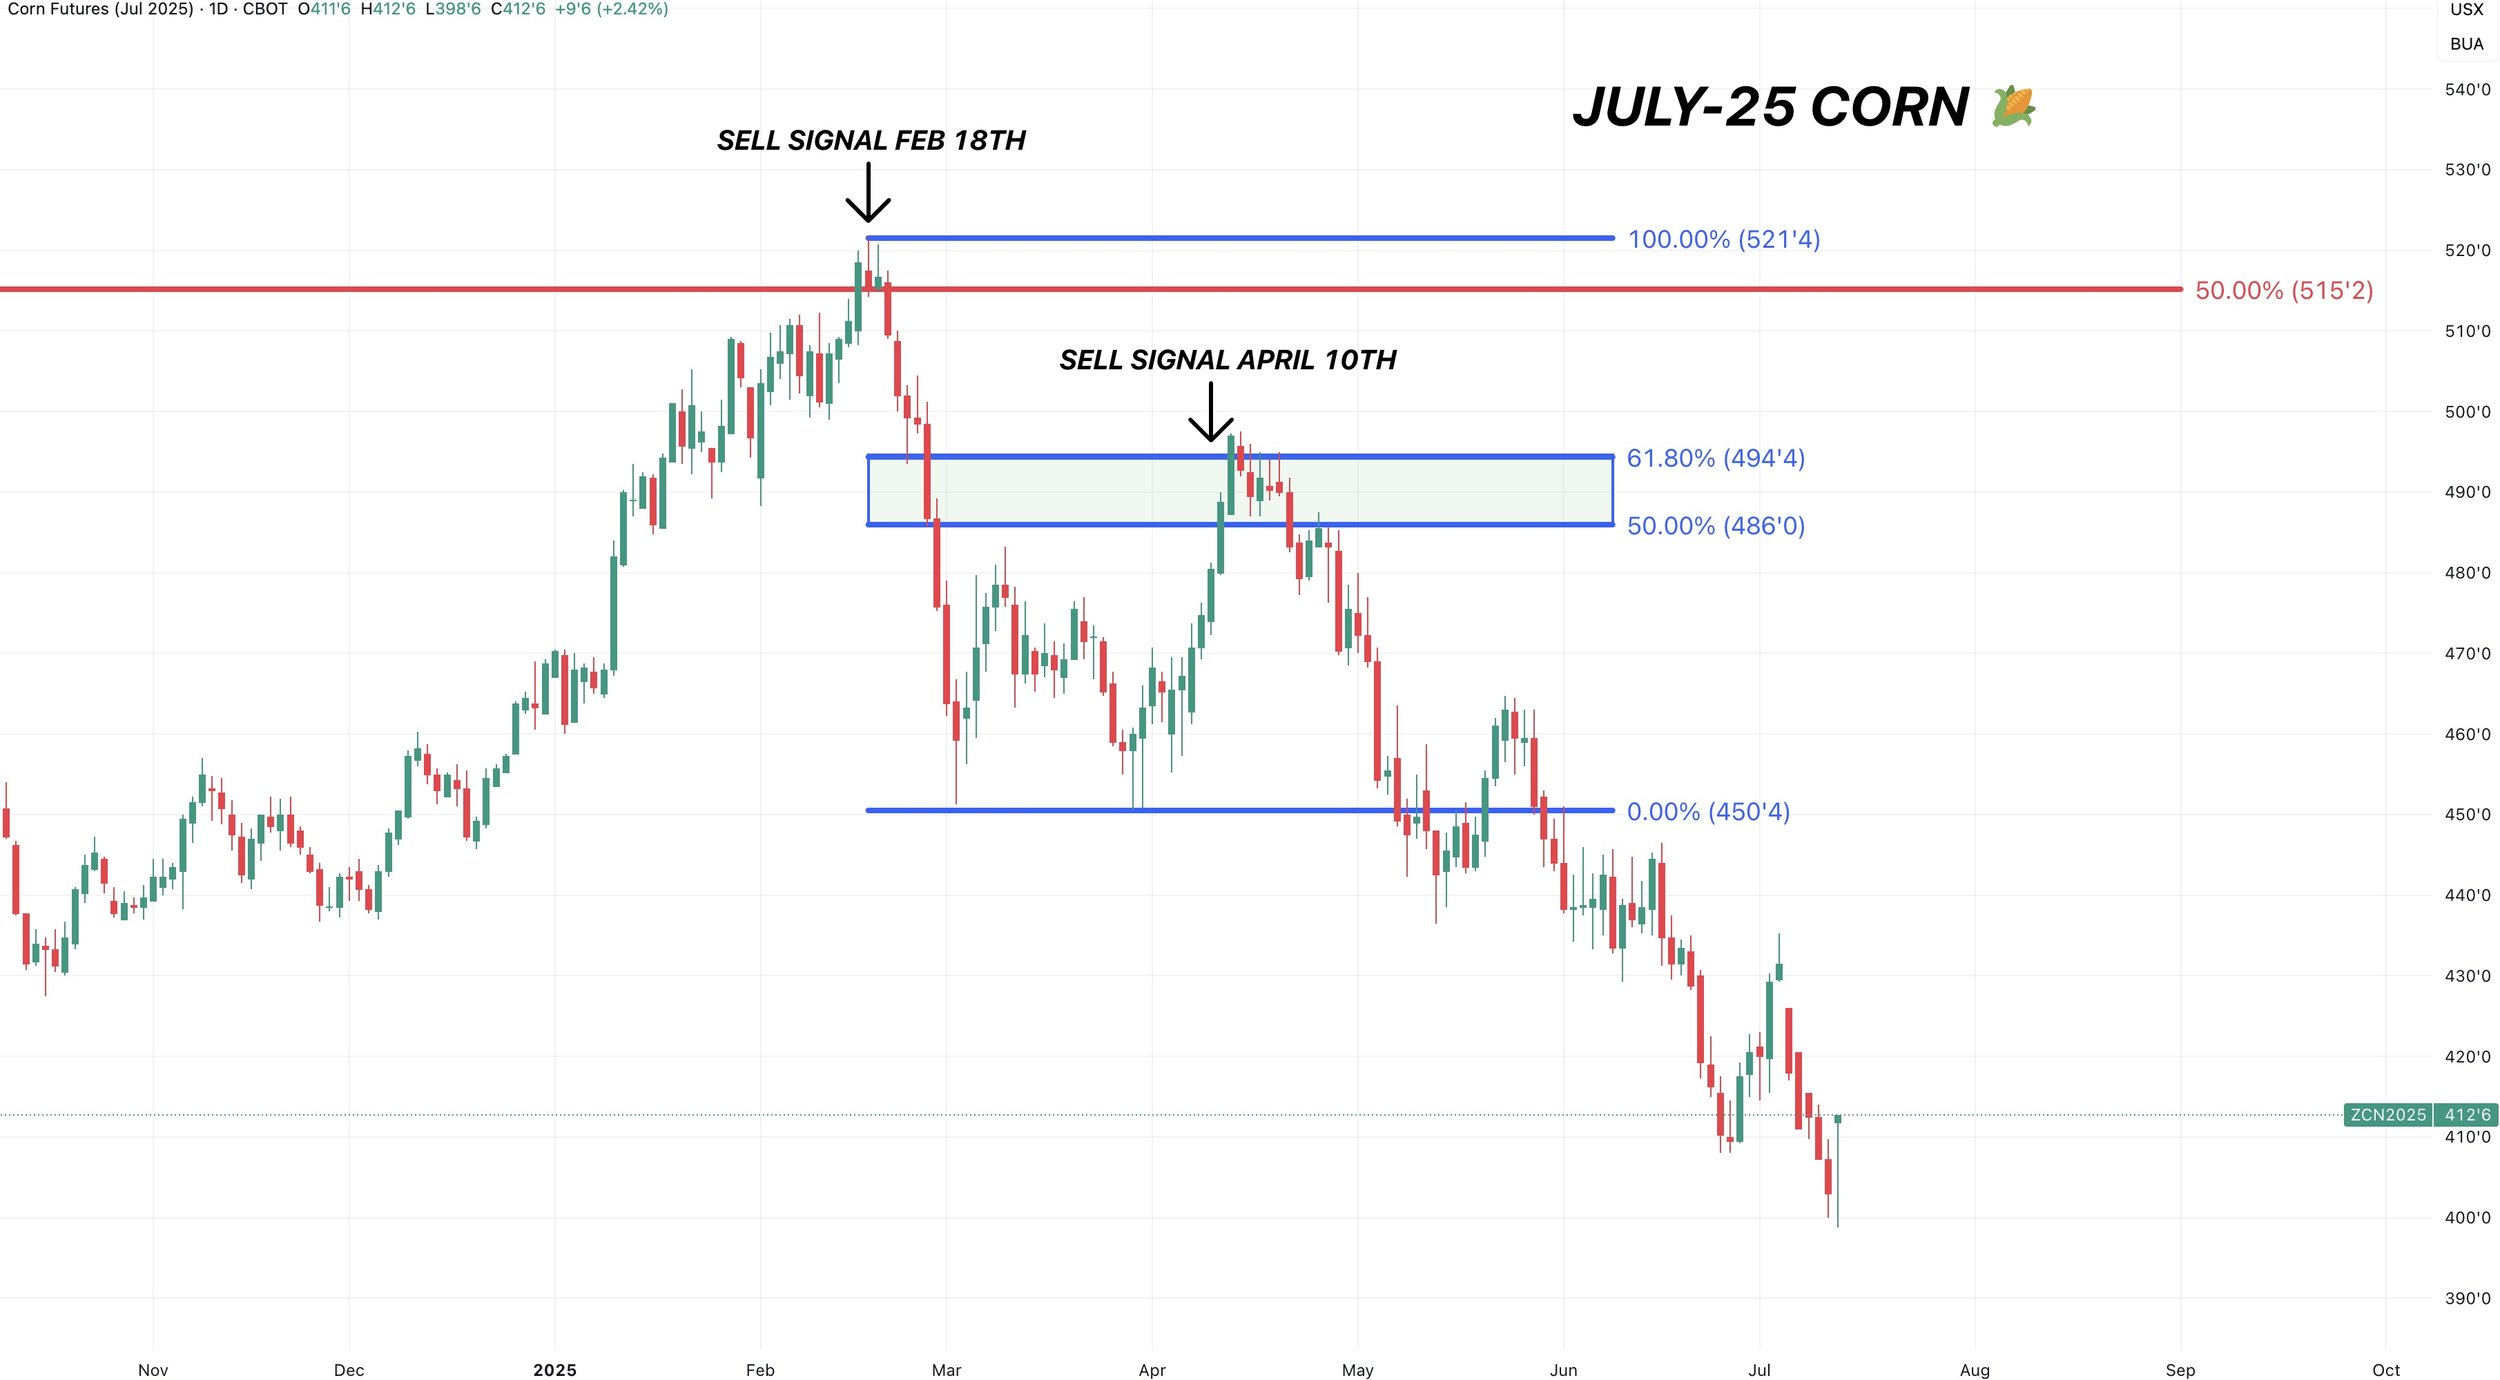
First, here is July-25 corn again like we talked about earlier.
We had a rally, a sell off, then a relief bounce. That failed right at that 61.8% level.
The same level the cattle market is currently sitting just below.
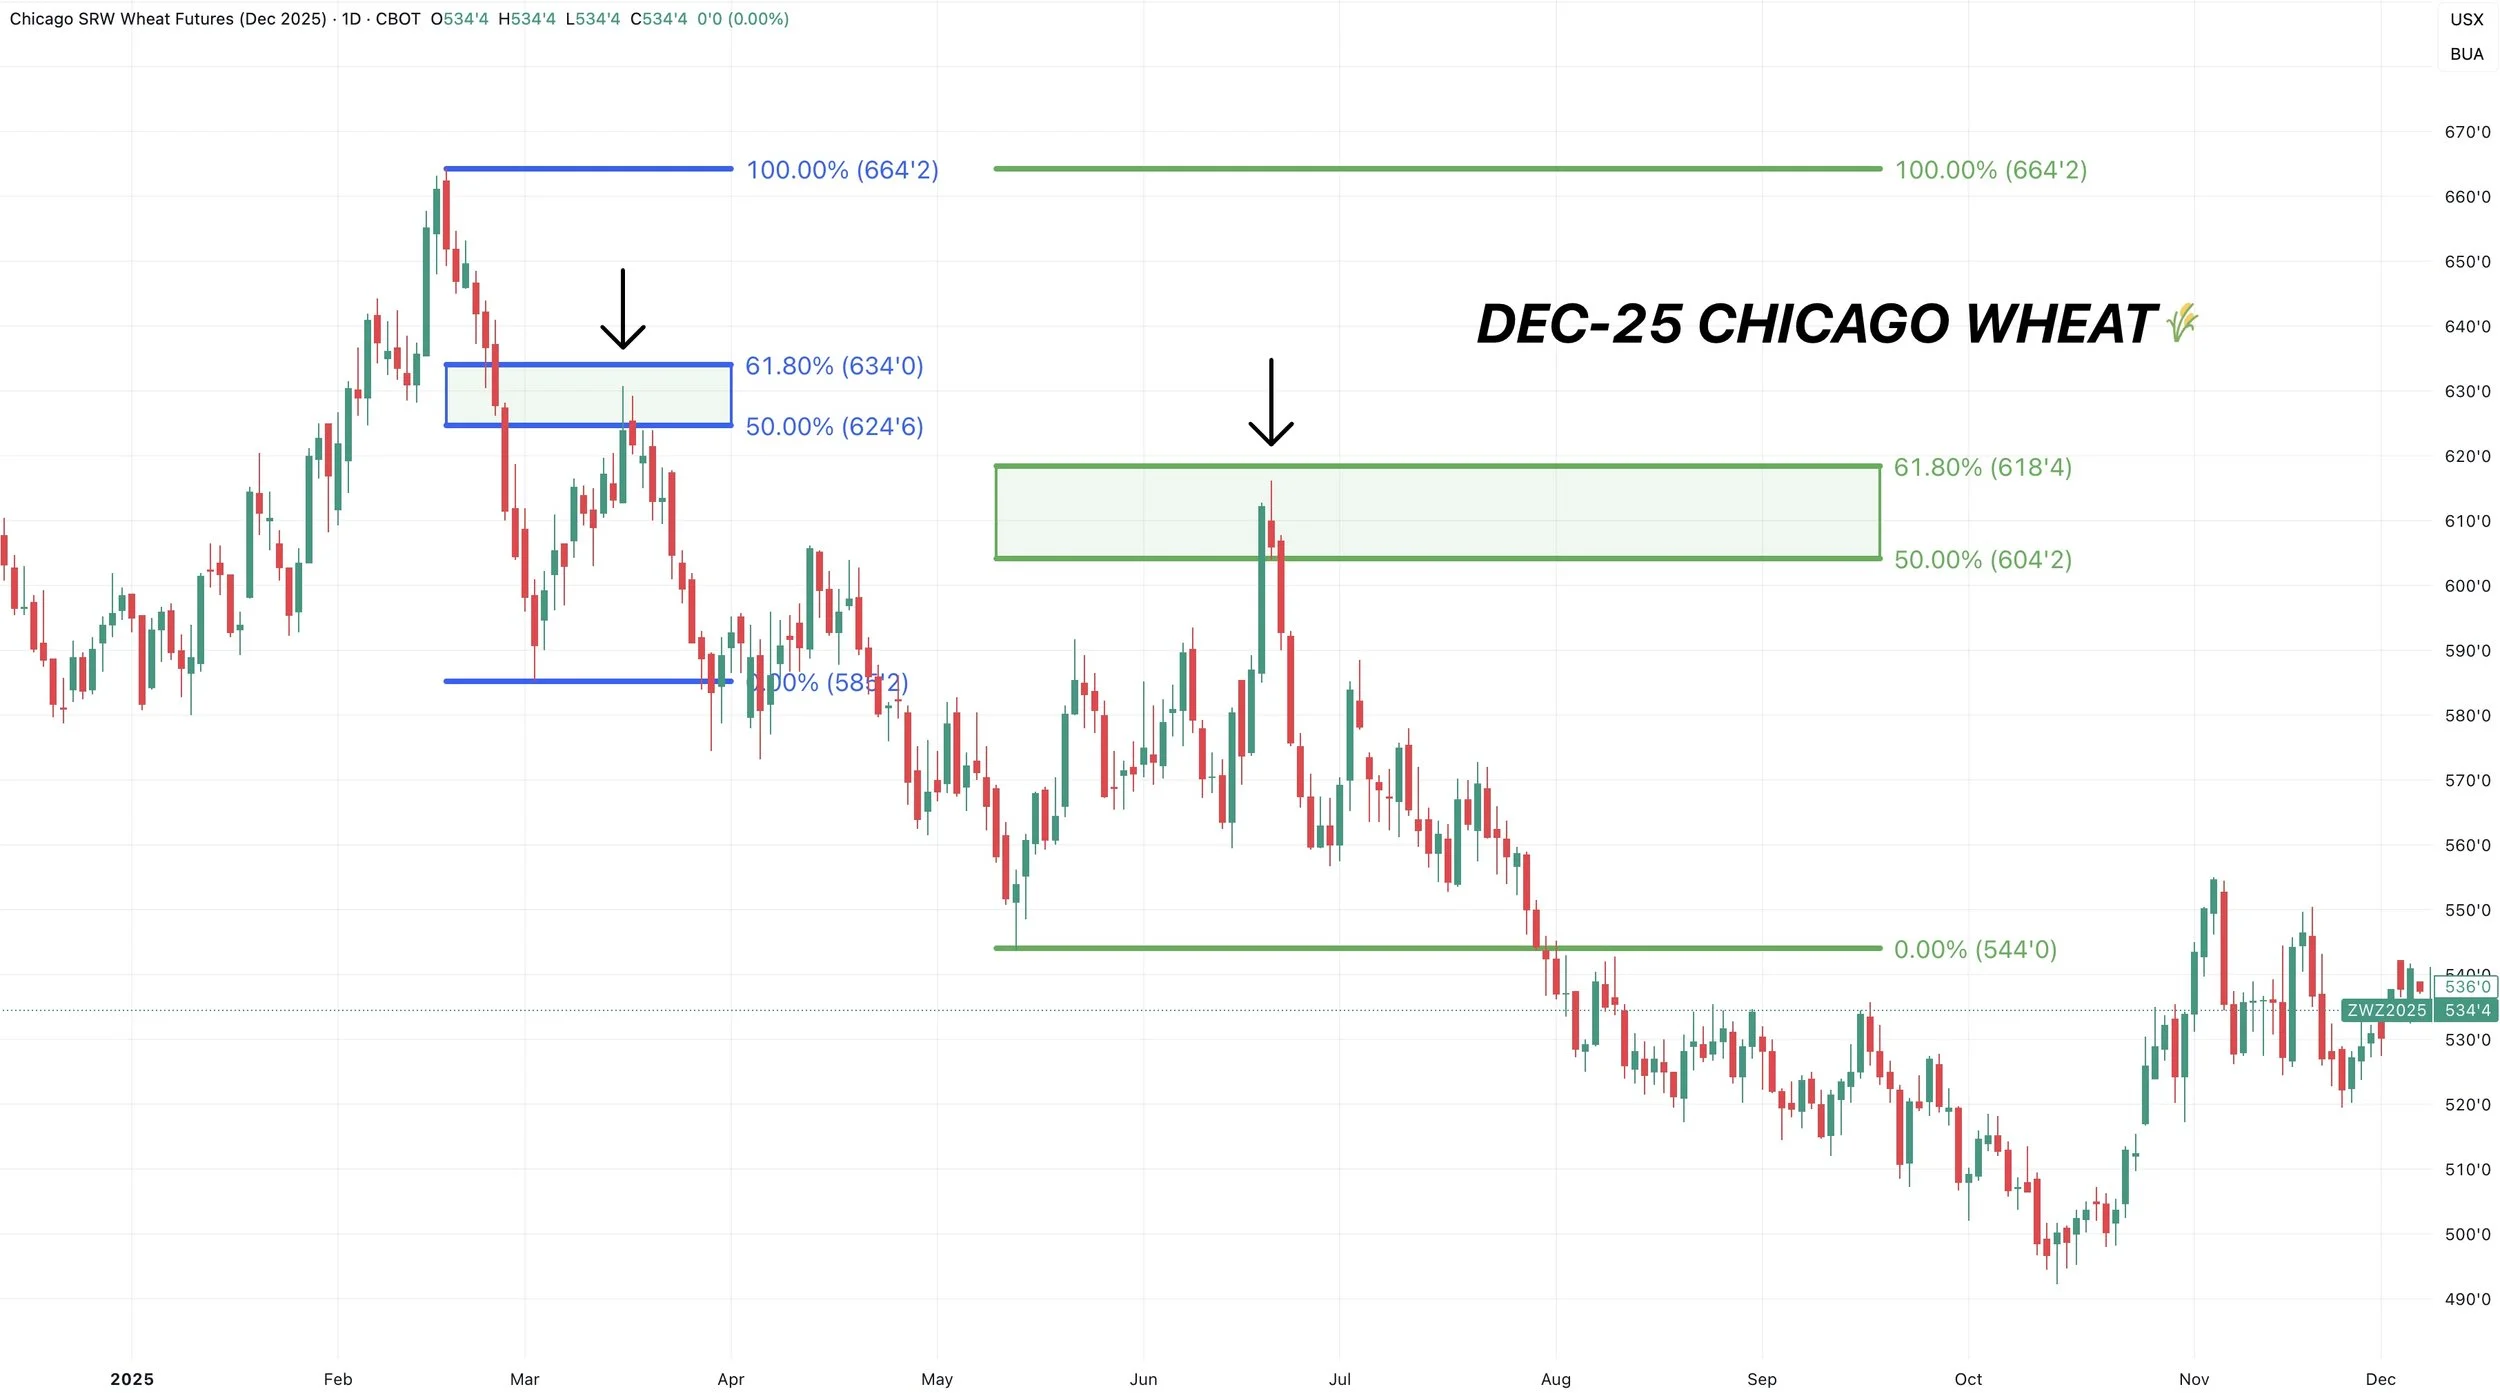
Here is another example, this time in Dec-25 Chicago wheat.
In February this market rallied. We then sold off, but got a relief bounce. That reclaimed 50% of the entire sell off before heading lower.
Then this summer, we got another rally.
That rally failed right in that golden zone as well.
The point is that relief bounces happen all the time in the markets. They tend to constantly fail at the same levels.
So until we are proven wrong, and cattle breaks above that 61.8% level. The rally in cattle should be viewed with caution.
If we break above that 61.8% level, then the story might change. But for now, that is why we still like keeping hedges in cattle.
Wheat
Technicals:
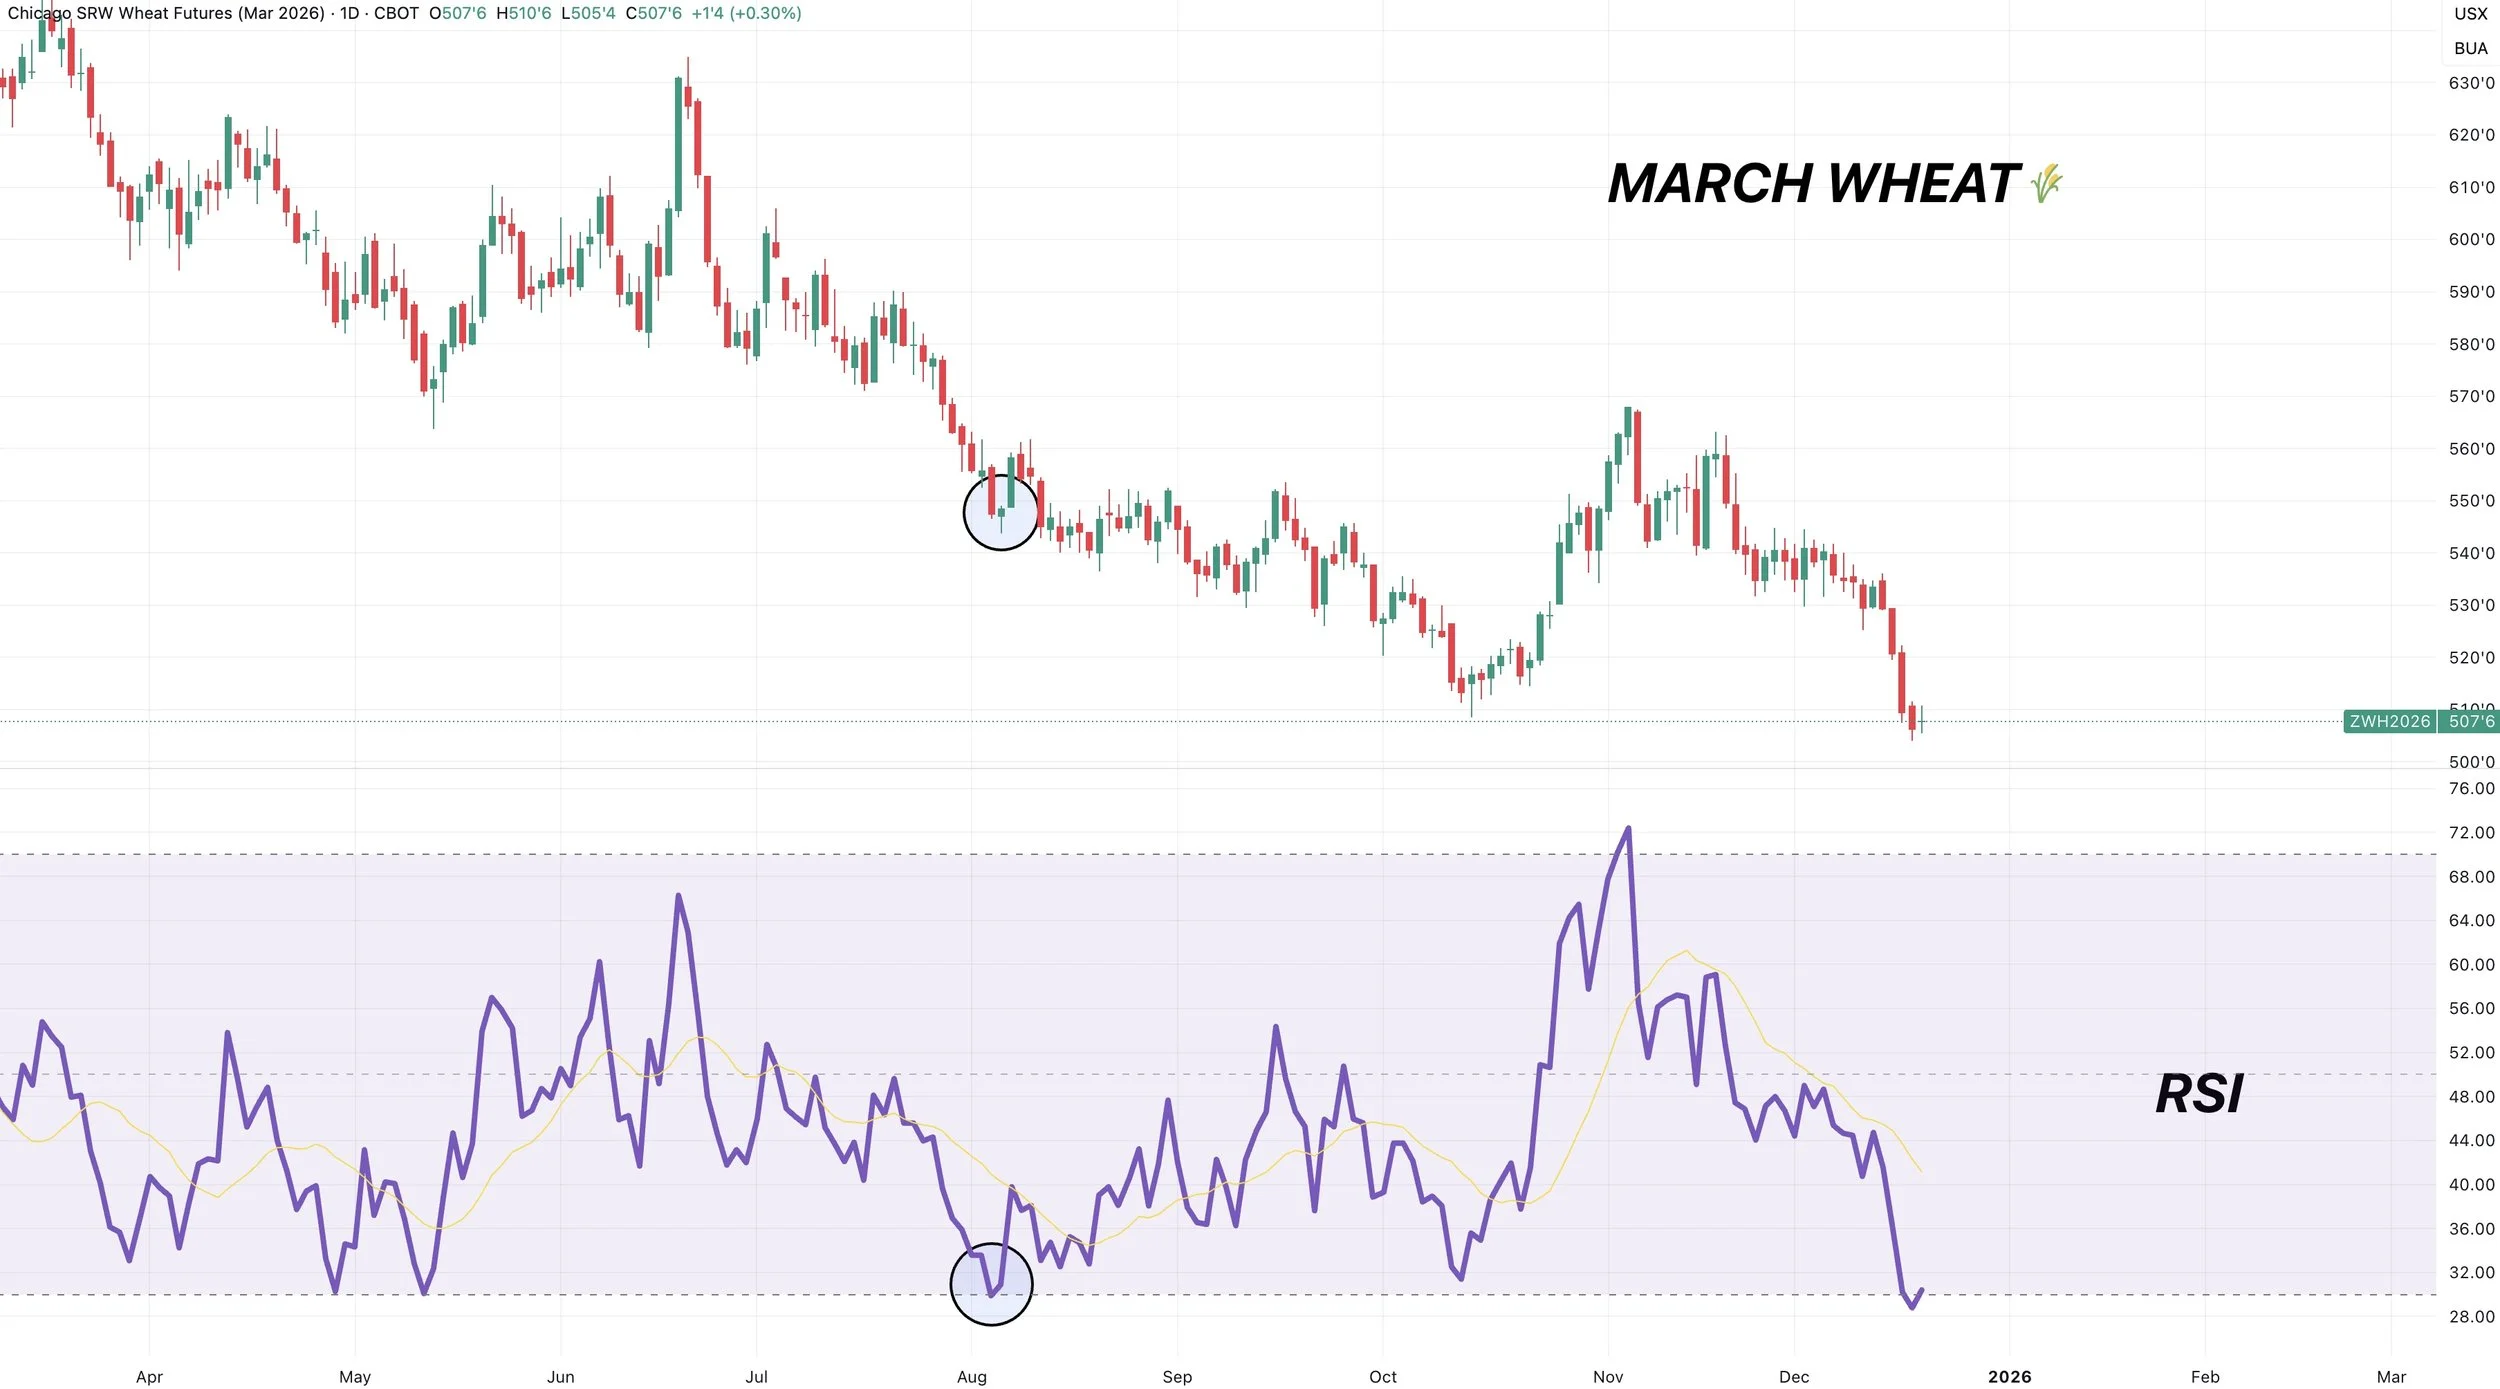
March Wheat
Wheat is the most oversold it's been in a very long time.
However, if you look at the last time wheat was this oversold.. it did not mark a bottom.
In fact we grinded lower for a while.
Being oversold alone isn’t enough of a reason for me to believe we've posted a bottom.
We have no divergence, and no support beneath contract lows.
Could we bottom here? Sure, but trying to call a bottom here would be like trying to catch a falling knife.
And I don’t currently see anything that makes me think we are at the bottom yet. But I will let you know when I feel like we have personally.
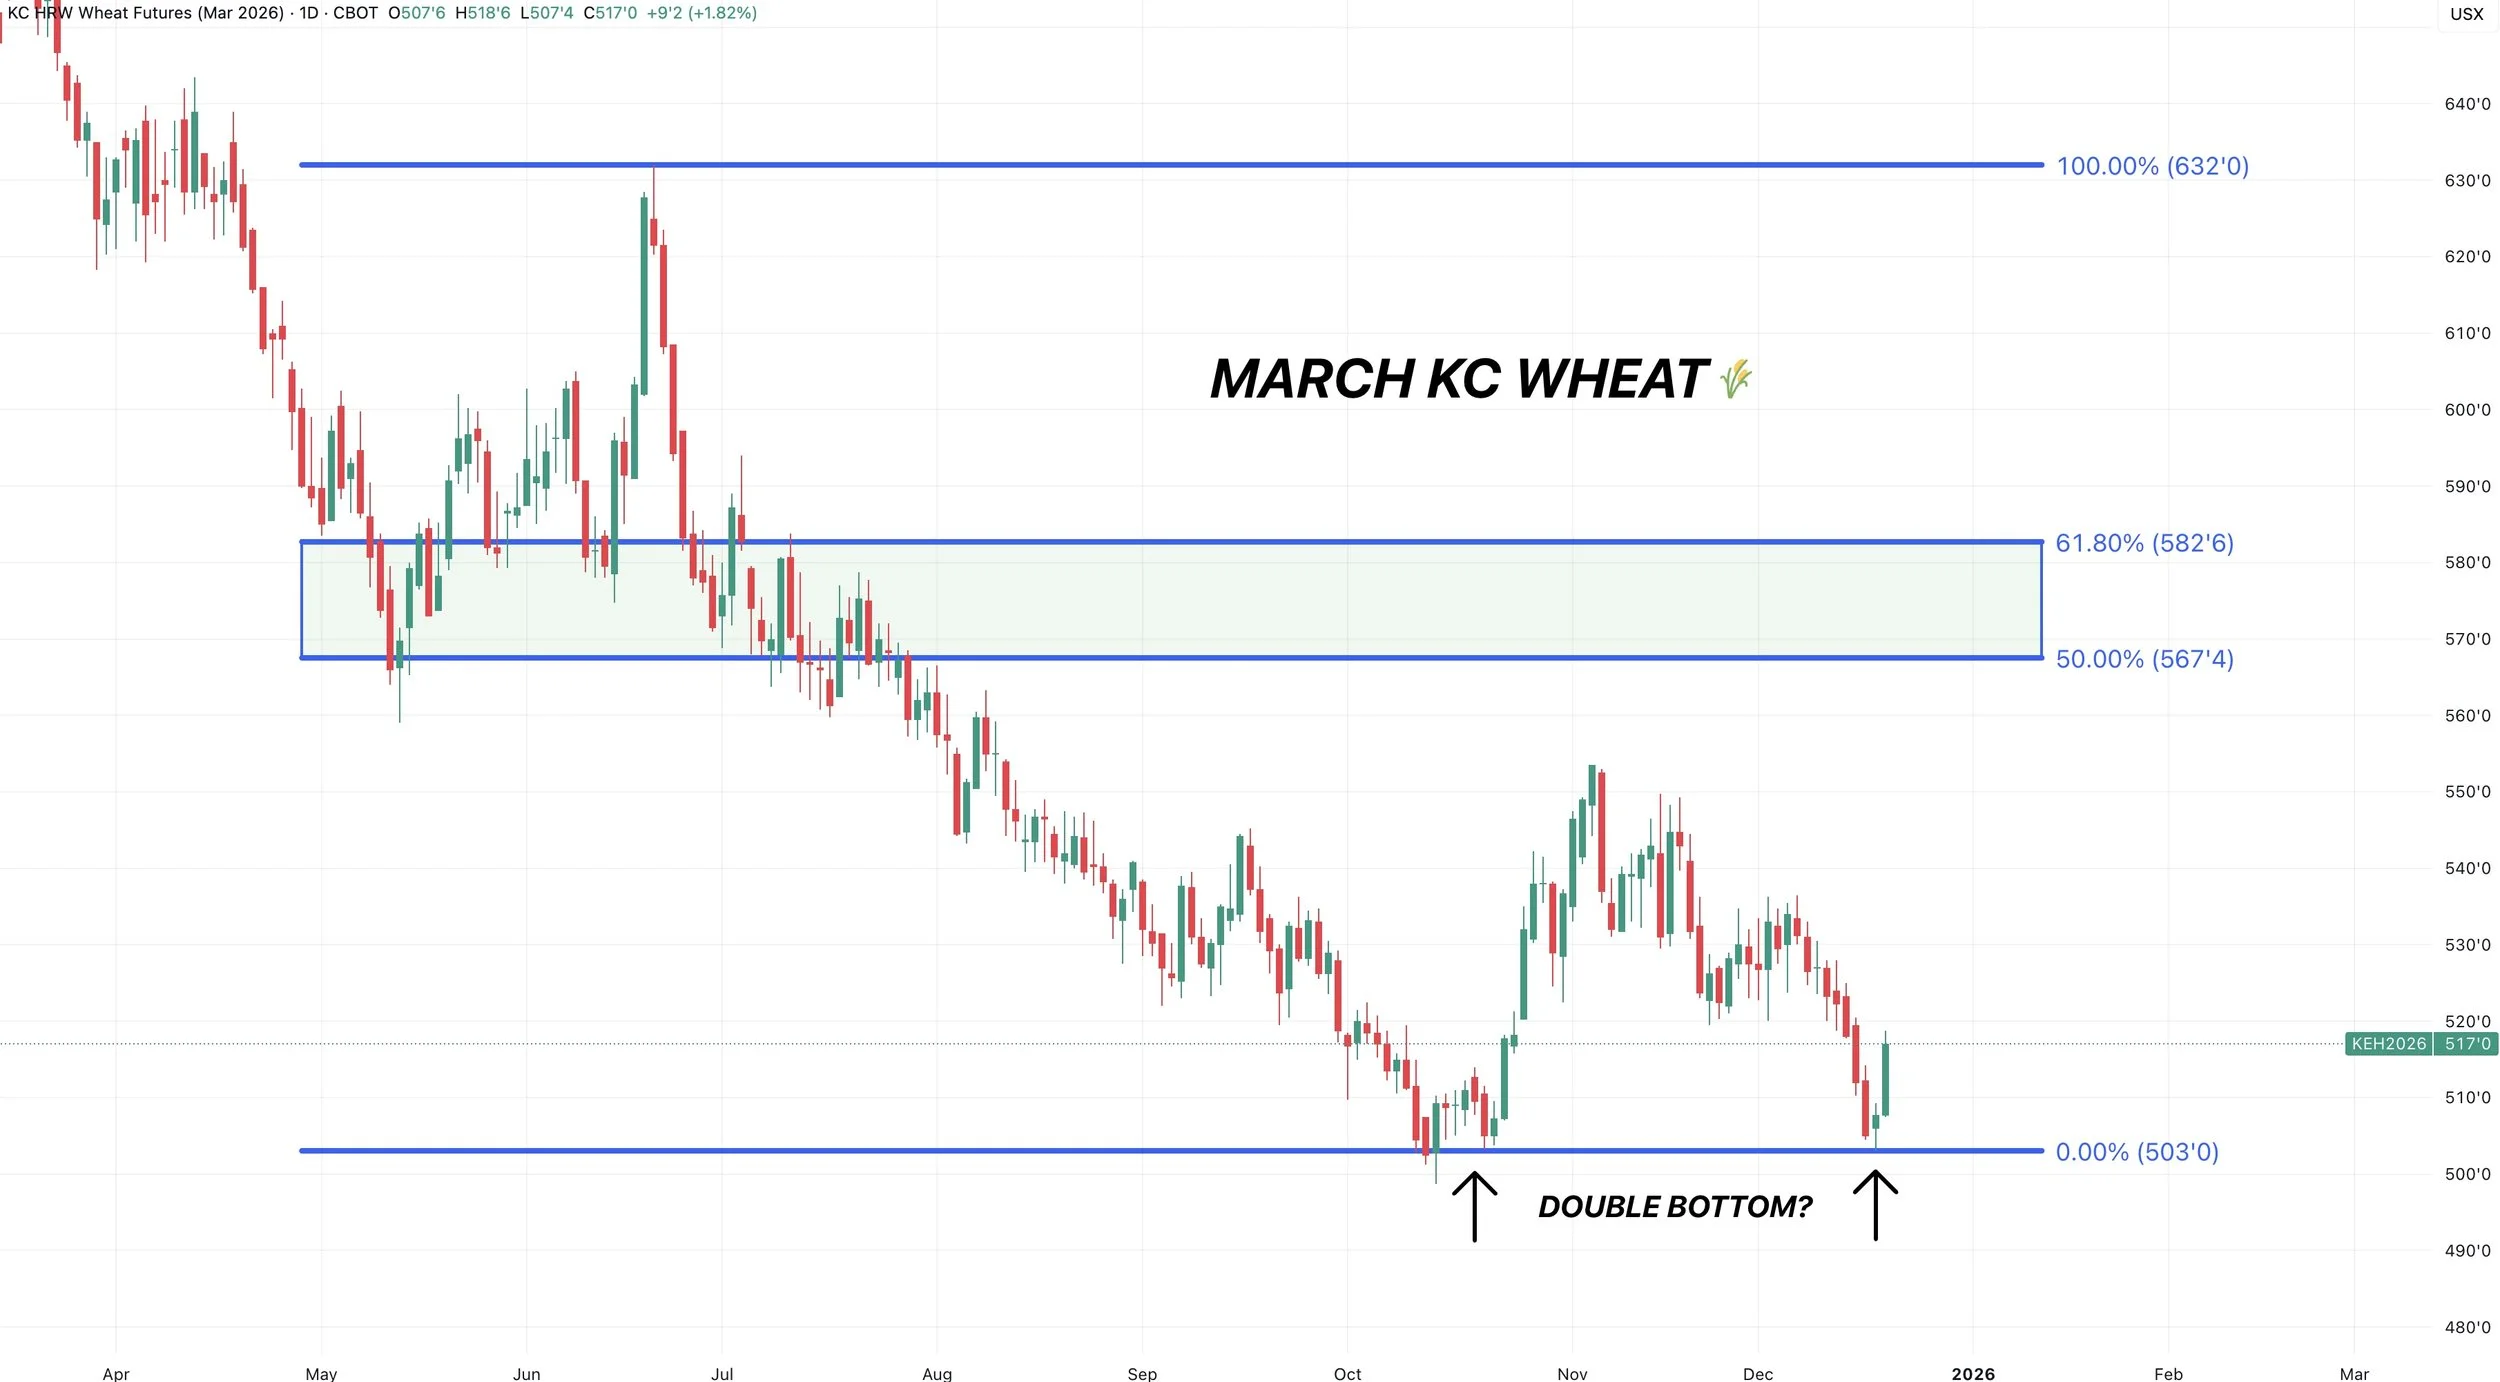
Dec KC Wheat
Now KC wheat looks completely different.
It was up +9 cents today. Chicago was only up +1 cent.
We did not make contract lows, and have a potential double bottom in place here on the charts.
So this chart doesn’t look all that bad, and this gives me a little more "optimism" in Chicago as well.
Regardless if this is the bottom yet or not, we don’t have any interest in selling wheat down here
Past Sell or Protection Signals
Dec 11th: 🐮
Cattle sell signal & hedge alert.
Dec 5th: 🐮
Cattle sell signal & hedge alert.
Nov 17th: 🌱
Soybean sell signal & hedge alert.
Nov 13th: 🌽 🌱
Managing risk in corn & beans ahead of USDA report.
Oct 28th: 🌽
Corn sell signal & hedge alert.
Oct 27th: 🌱
Soybean sell signal & hedge alert.
Oct 13th: 🐮
Cattle sell signal & hedge alert.
Aug 22nd: 🌱
Soybean sell signal & hedge alert.
July 31st: 🐮
Cattle sell signal & hedge alert.
July 10th: 🐮
Cattle sell signal & hedge alert.
CLICK HERE TO VIEW
June 5th: 🐮
Cattle sell signal & hedge alert.
June 2nd: 🌾
MPLS wheat sell signal.
April 10th: 🌽
Old crop corn sell signal.
March 19th: 🐮
Cattle hedge & sell signal.
Feb 18th: 🌽 🌾
Old crop KC wheat & old crop corn signal.
Jan 23rd: 🌽 🌱
Corn & beans old crop sell signal.
CLICK HERE TO VIEW
Jan 15th: 🌽 🌱
Corn & beans hedge alert/sell signal.
Jan 2nd: 🐮
Cattle hedge alert at new all-time highs & target.
Dec 11th: 🌽
Corn sell signal at $4.51 200-day MA
CLICK HERE TO VIEW
Oct 2nd: 🌾
Wheat sell signal at $6.12 target
Sep 30th: 🌽
Corn protection signal at $4.23-26
Sep 27th: 🌱
Soybean sell & protection signal at $10.65
Sep 13th: 🌾
Wheat sell signal at $5.98
May 22nd: 🌾
Wheat sell signal when wheat traded +$7.00
Want to Talk?
Our phones are open 24/7 for you guys if you ever need anything or want to discuss your operation.
Hedge Account
Interested in a hedge account? Use the link below to set up an account or shoot Jeremey a call at (605)295-3100.