
GRAINS TRYING TO HANG ON TO SUPPORT
MARKET UPDATE
You can scroll to read the usual update as well. As the written version is the exact same as the video.
Timestamps for video:
Overview: 0:00min
Corn: 0:30min
Beans: 11:20min
Wheat: 14:05min
Cattle: 15:55min
Want to talk?
Office: (806)484-1214
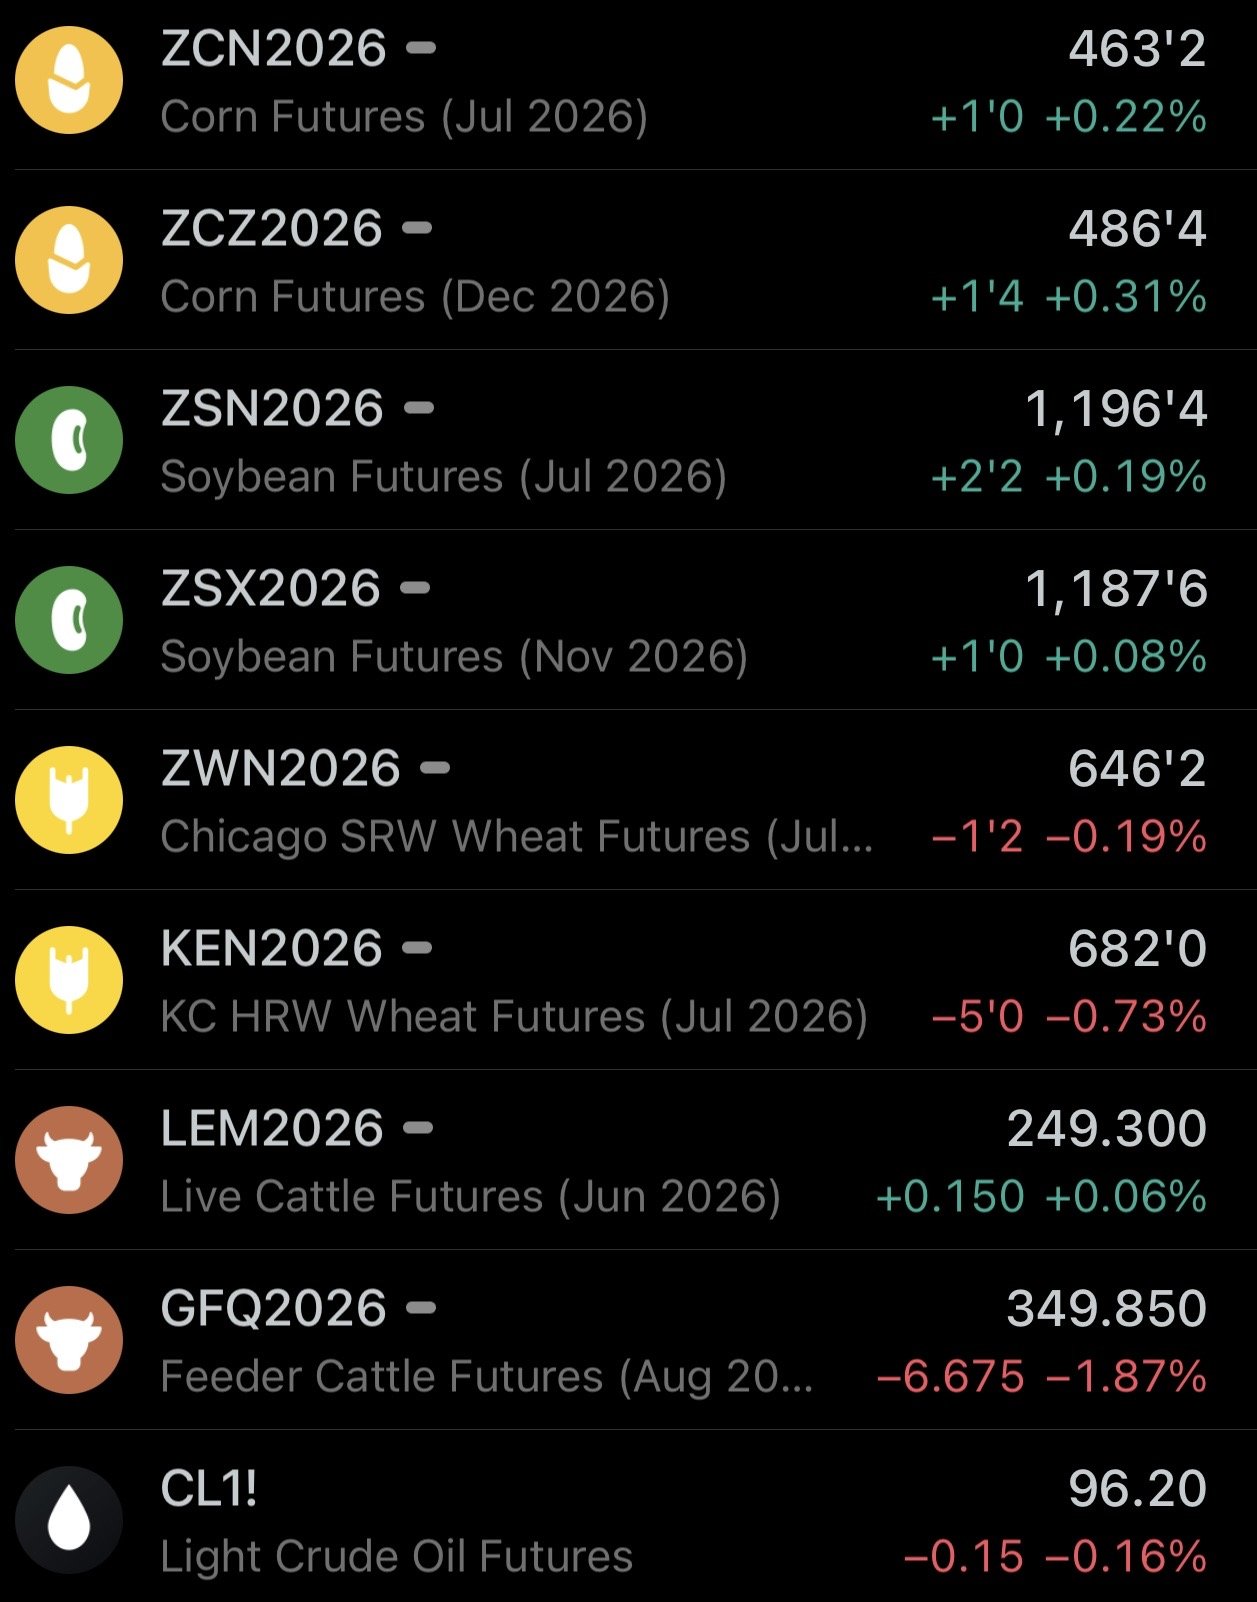
Futures Prices Close
Overview
It was an okay day for corn and soybeans as we attempt to hold support, while KC wheat continues to drift lower for the 6th time in 8 days.
Feeders got smoked again today after trading limit down yesterday. They have now broken some pretty important support on the charts.
It was a pretty quiet day for news with no fresh headlines.
The markets will be closed on Monday for Memorial Day.
Not much else for news so let's get right into today's main takeaways.
Today's Main Takeaways
Corn
Overall the market still doesn’t see any threats here. Yes there are pockets where it hasn’t been ideal, but nationally speaking we haven’t had any major issues.
Here is the last 30 days of precip vs normal.
A good chunk of the I-states have had a decent amount of rain.
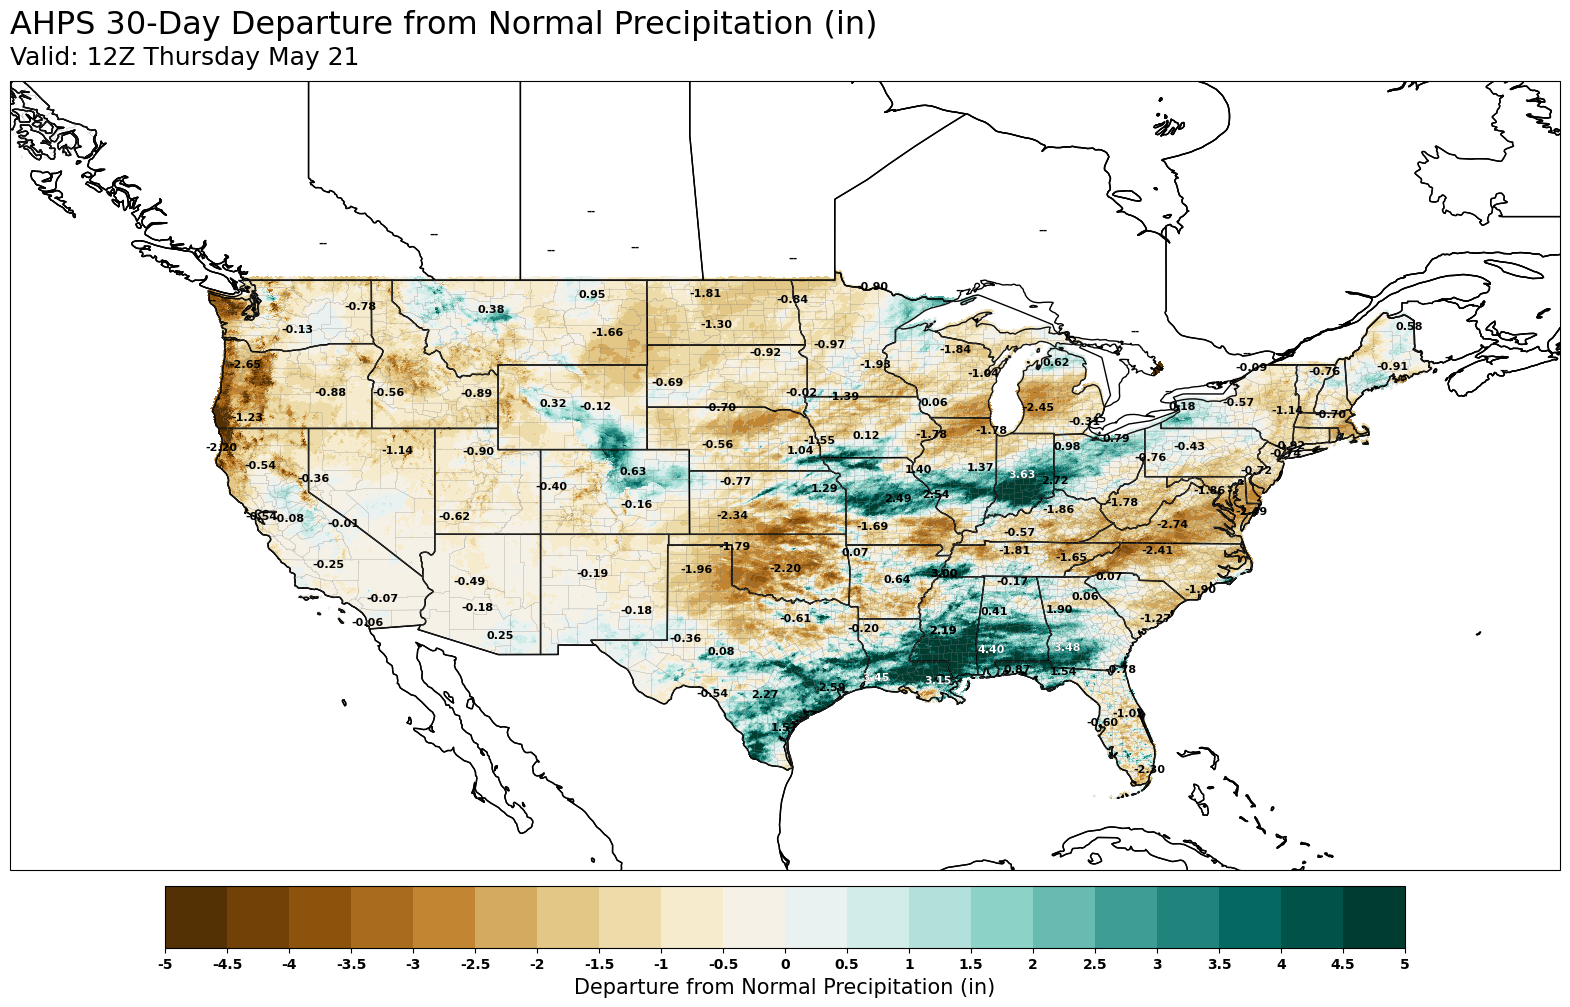
The first week of June is expected to start off dry, but we'll have to wait and see if that dryness sticks around or not.
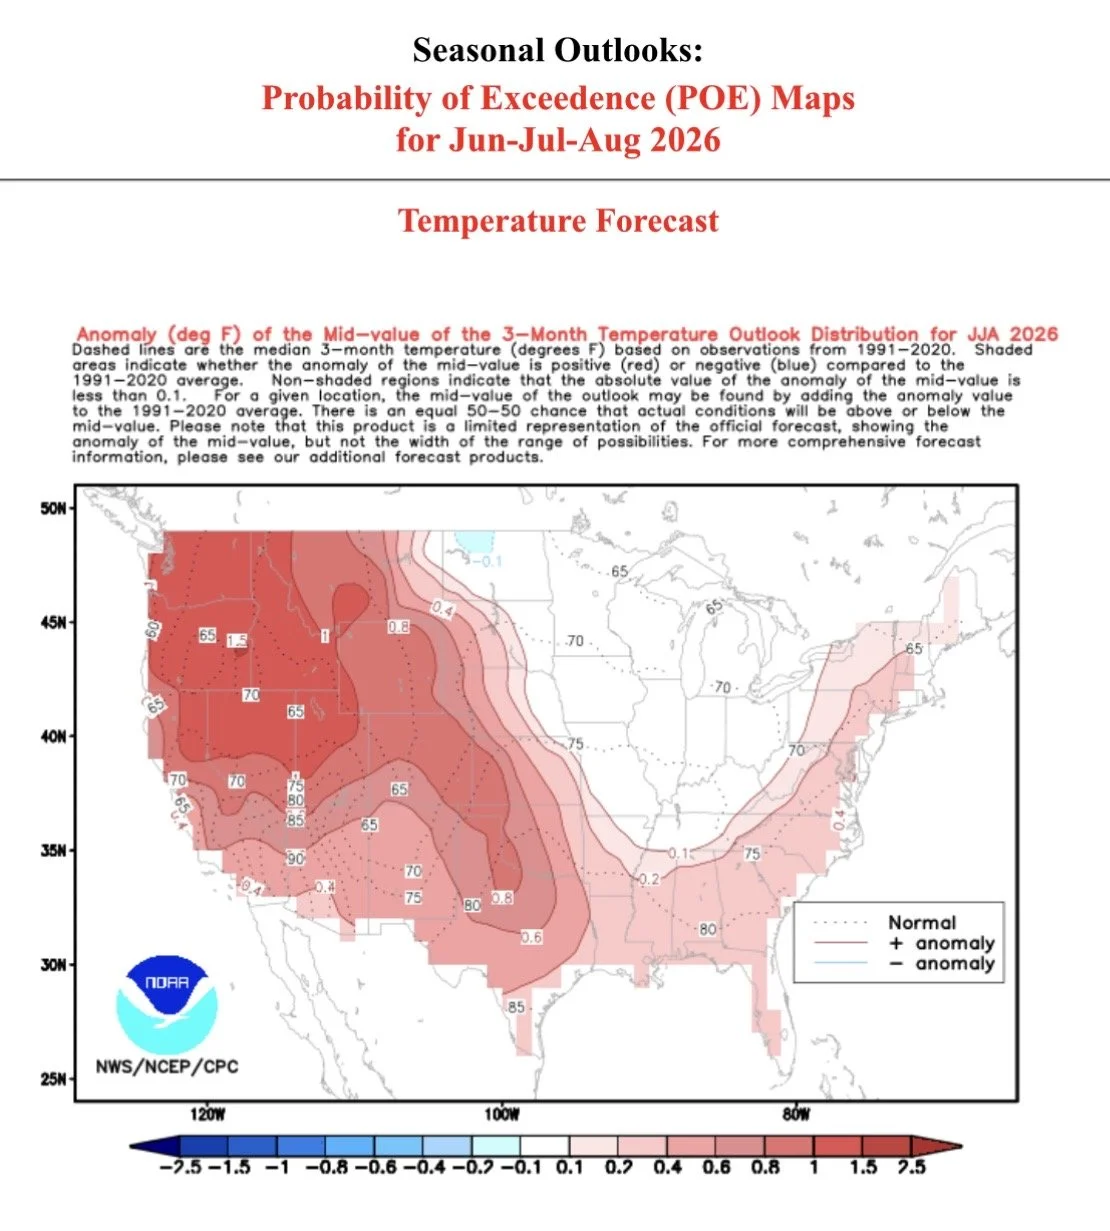
Here is the temperature outlook for June, July and August.
The I-states are expected to be pretty much the only ones with not receiving crazy hot temps.
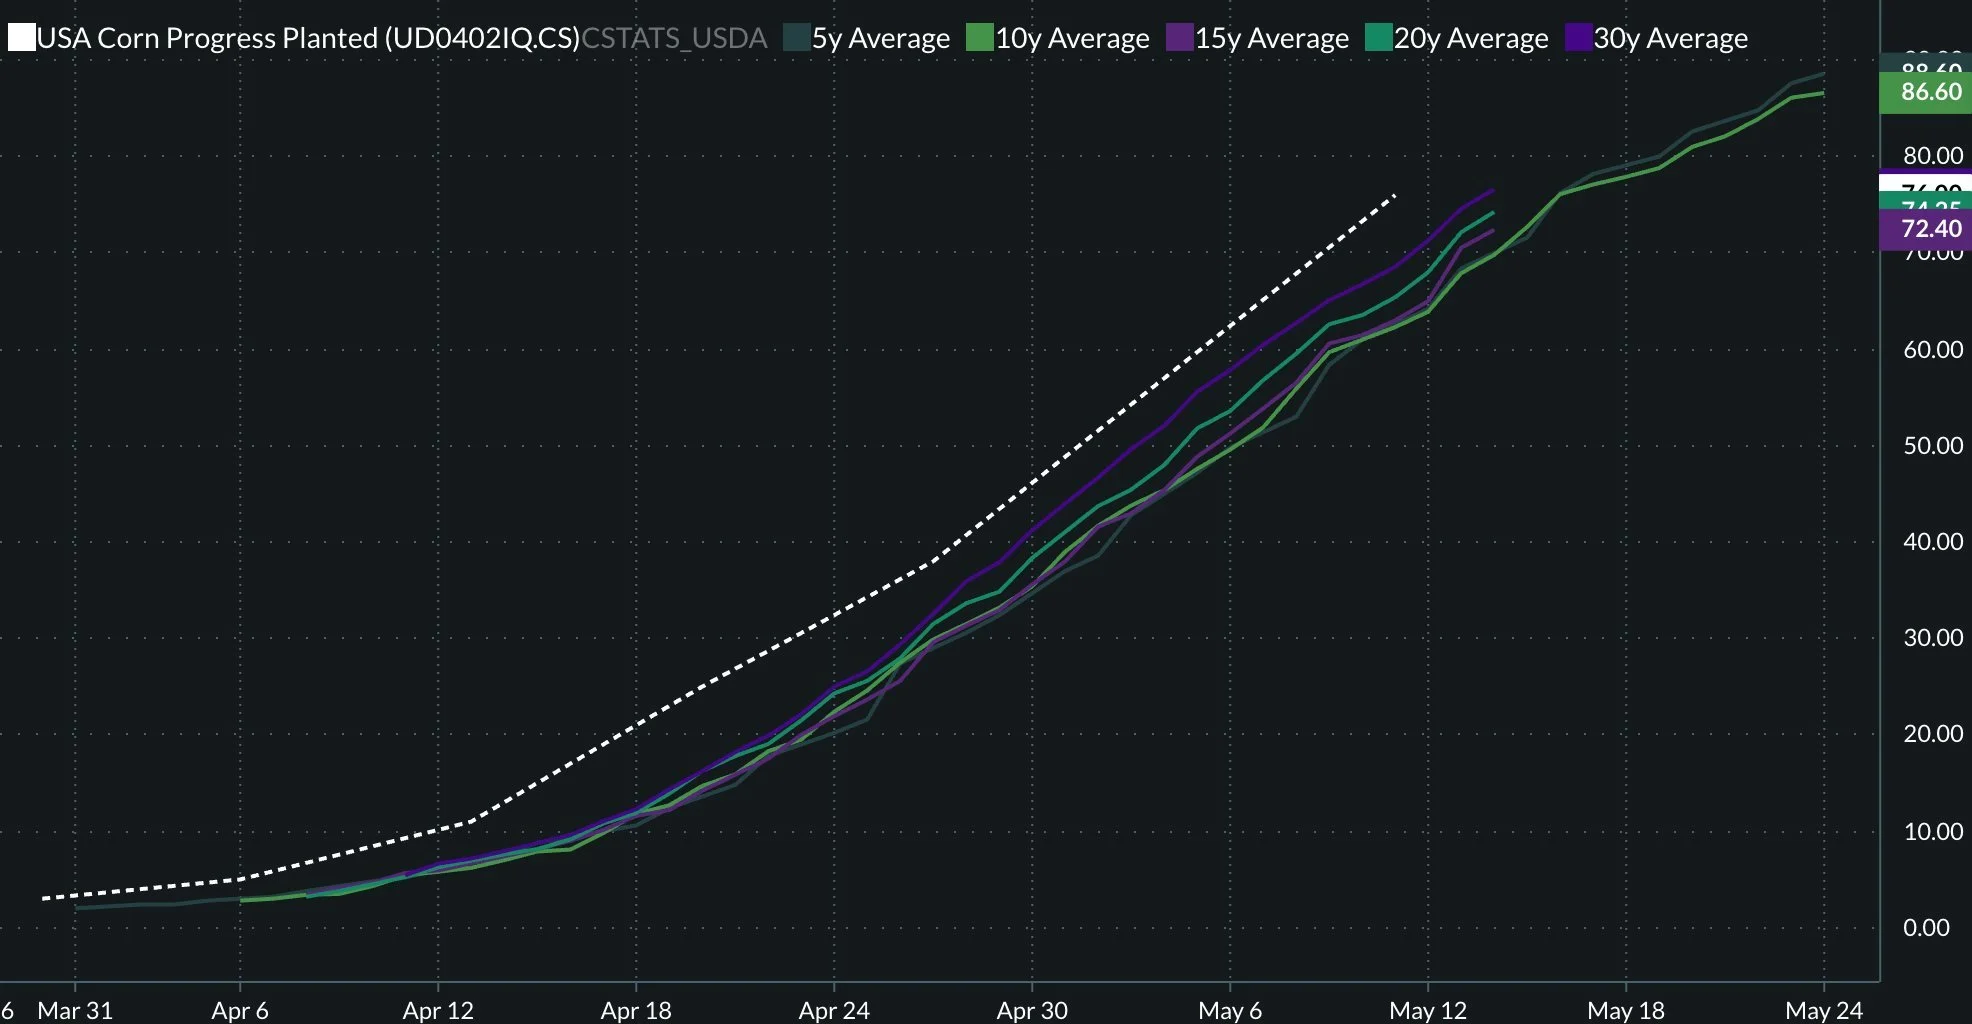
At the same time, you have planting well ahead of pace.
So the market sees zero threats, and is struggling to find that catalyst.
Chart from Darrin Fessler (@DDFalpha on X)
Corn exports were off the charts.
We just saw the biggest weekly sales since January.
Below is a great chart from David Brock of the Brock Report showcasing corn exports.
We're currently still well ahead of the USDA's pace.
But this is the time of year where we usually start to see export demand cool off until harvest.
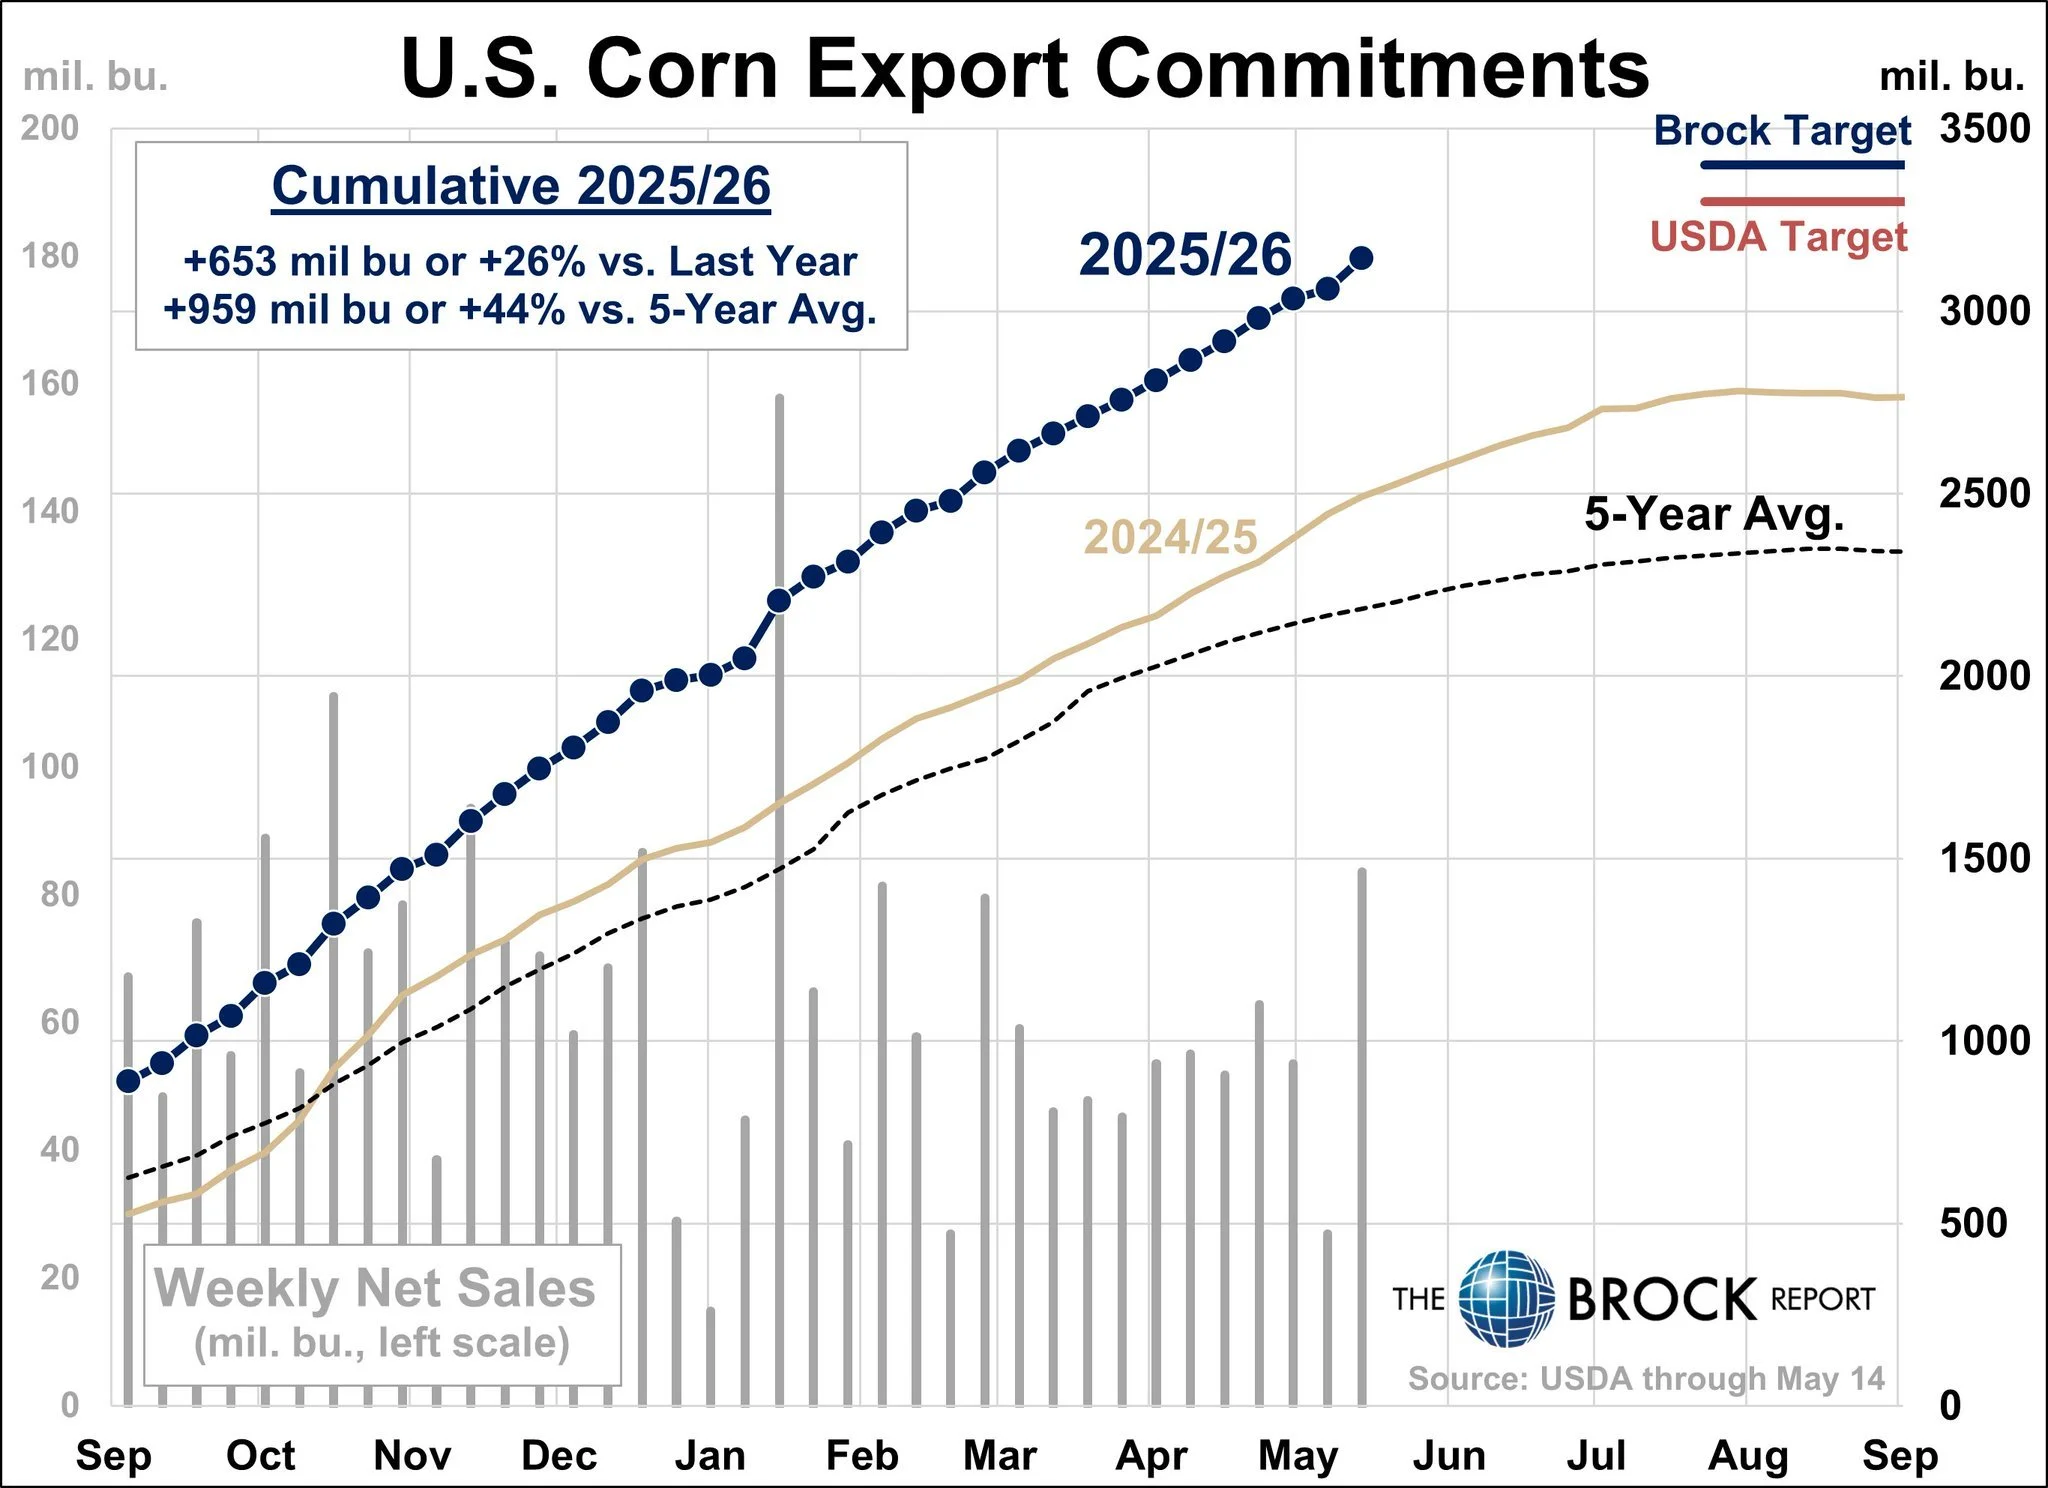
Our current export commitments are +25% better than last year.
However.. the USDA only has exports +13% better than last year in their estimates.
So you could argue they might need to bump exports once again.
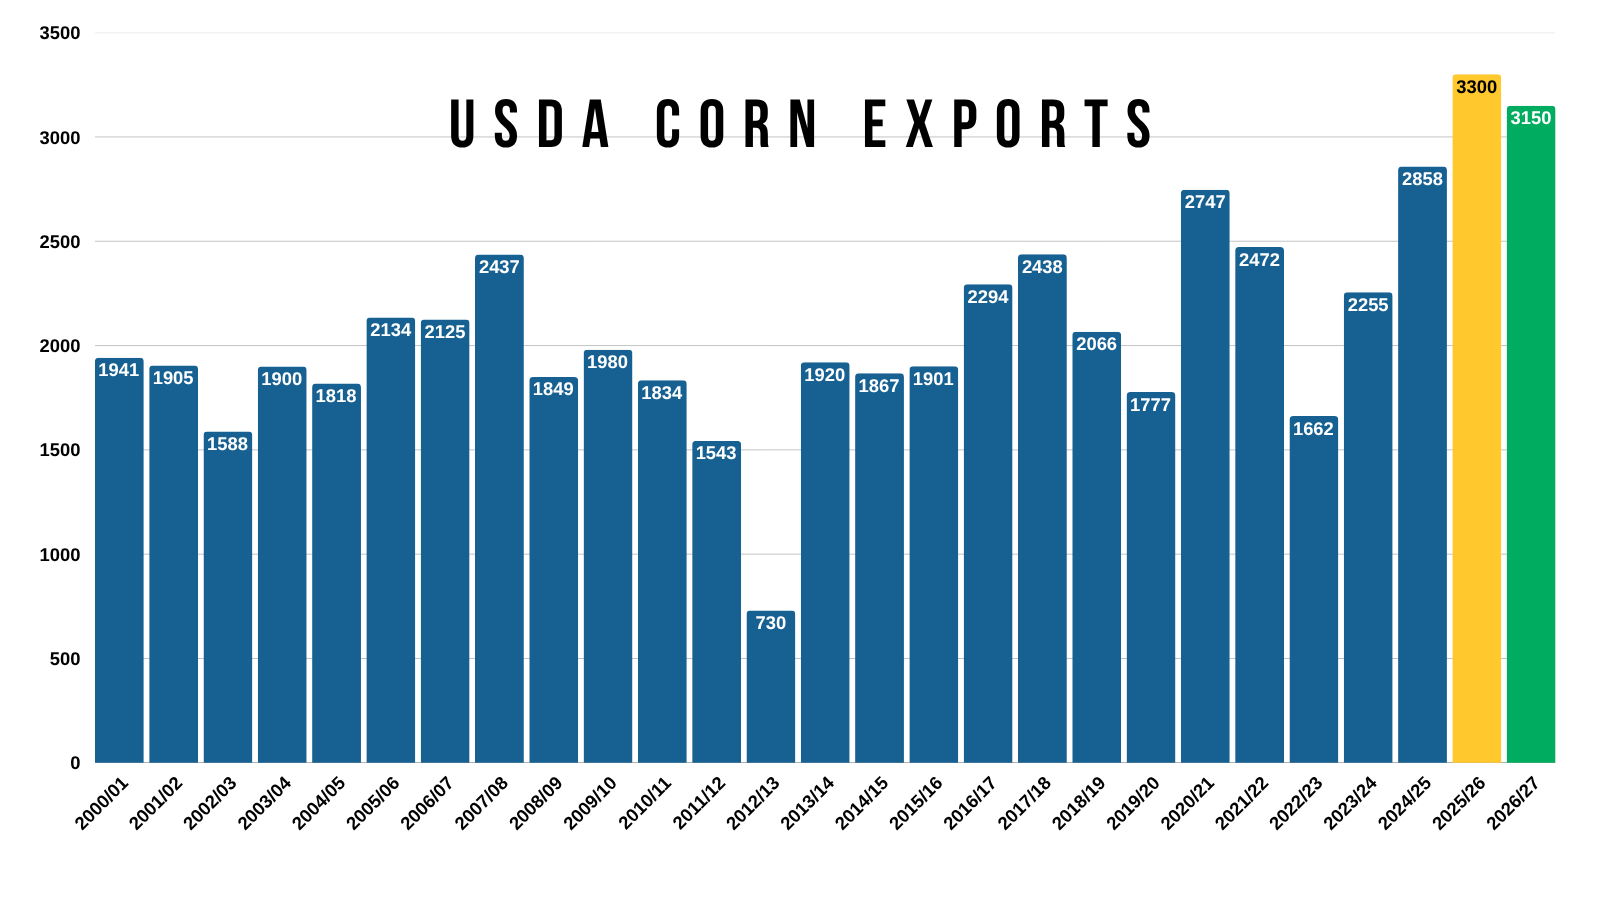
In the recent USDA report, the USDA said exports for new crop will be less than old crop.
They simply did this because they cut production. When they balance the balance sheet, they often cut demand if they cut supply.
But overall demand is still the best it has ever been.
Corn is still competitive.
I don’t see why that record demand shouldn’t continue.
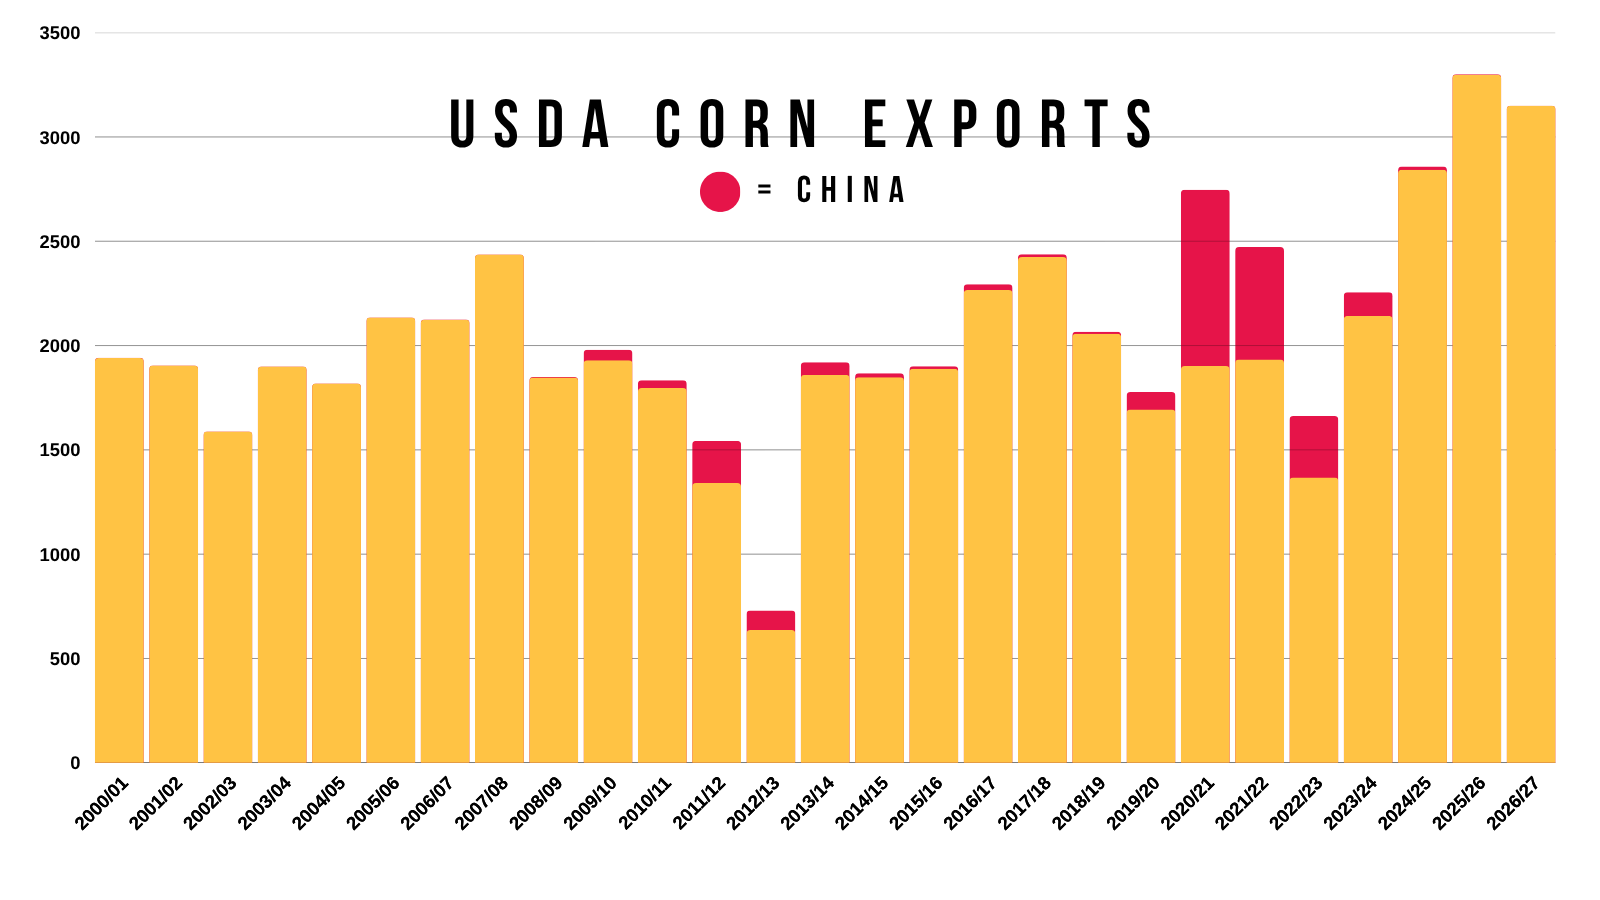
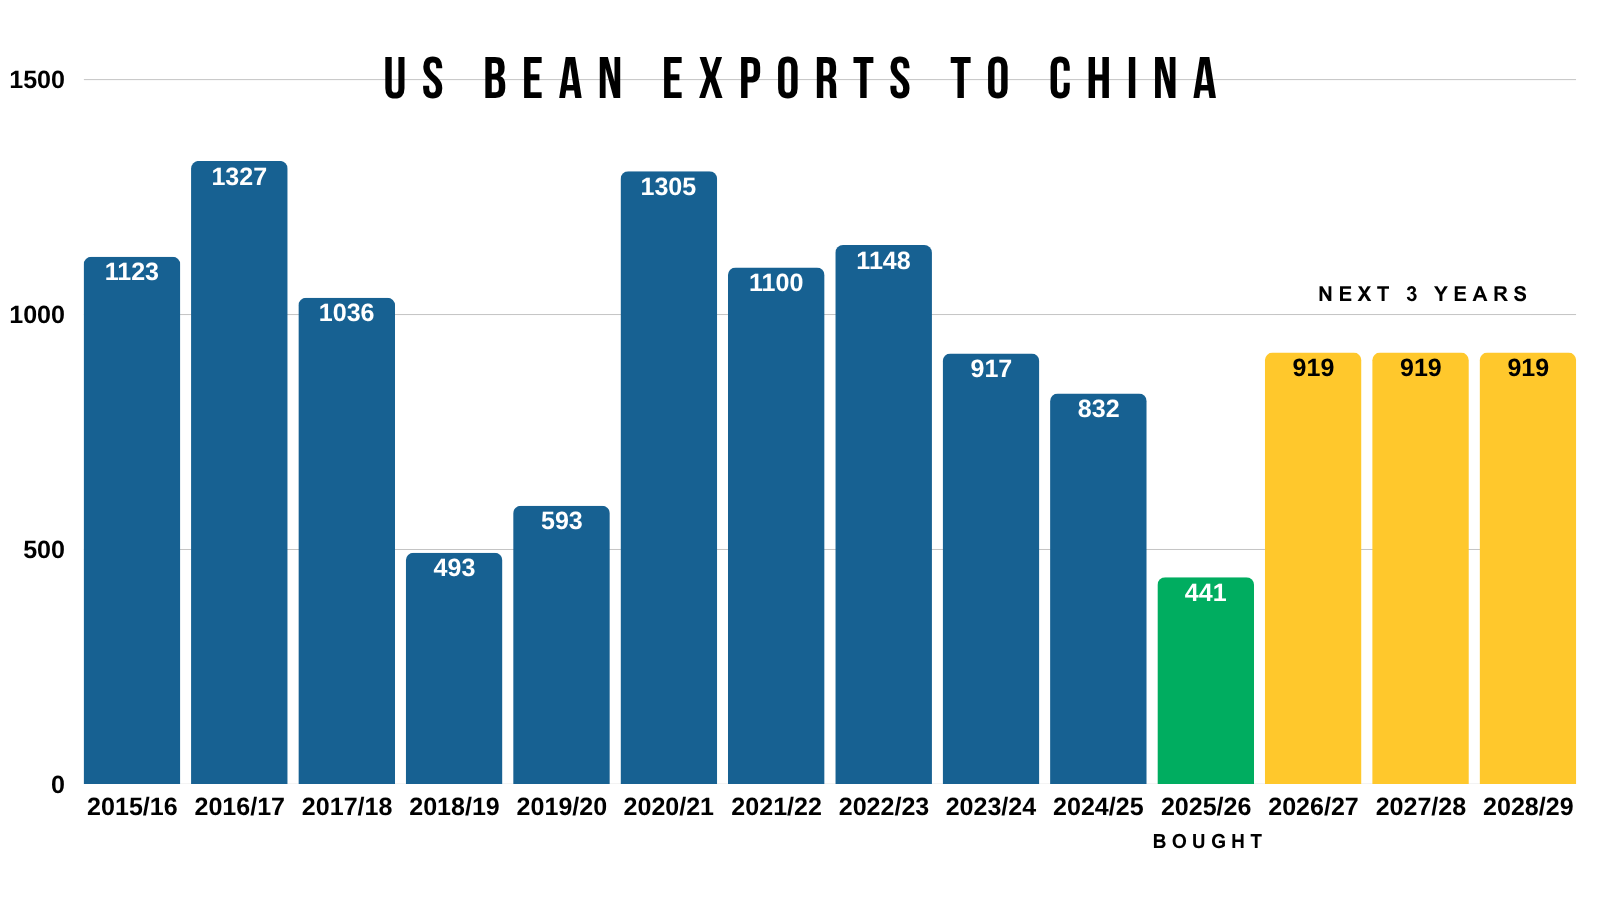
Then you also have to wonder what happens if we throw China into the mix?
Here is a chart that shows our overall export demand, along with what we sold to China.
2021 and 2022's record demand was entirely led by China.
We currently have record without China.
The yellow bars are demand without China. We're destroying every other year on that metric.
So if you throw China buying on top of what is already record demand, you could see a path where our export demand continues to chew into carryout.
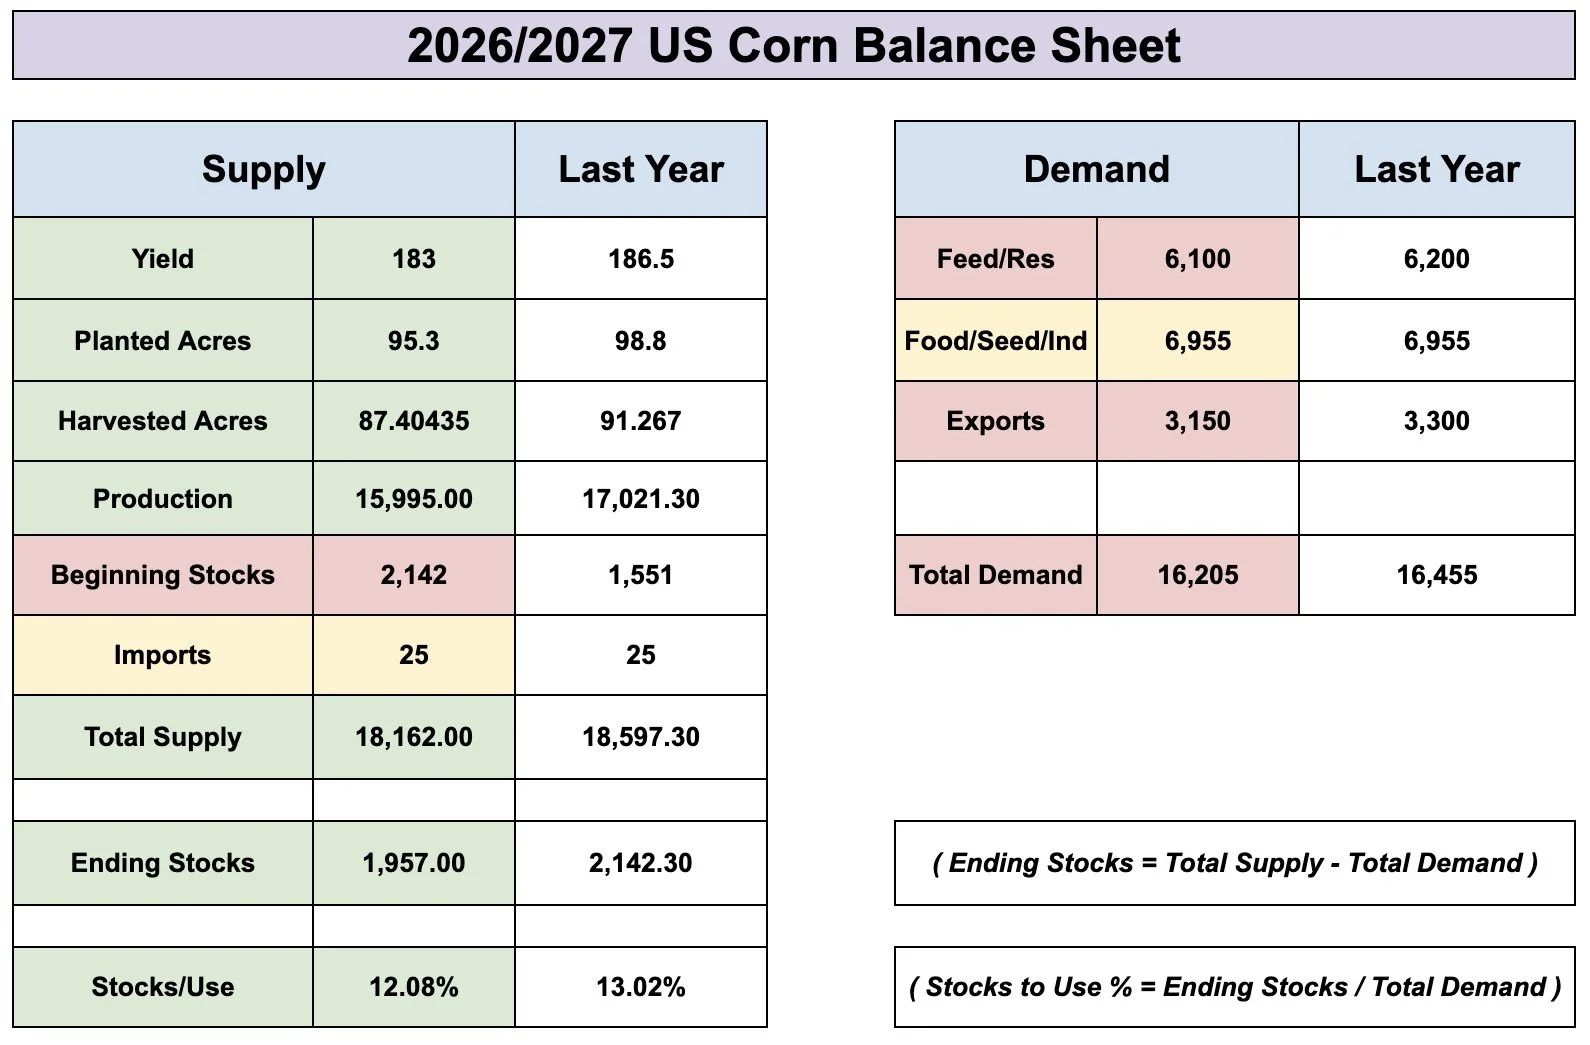
Yes, the carryout is currently large.
Both for old crop and new crop. Neither would be considered bullish on the surface.
Although we are expected to see a noticeable drop for new crop.
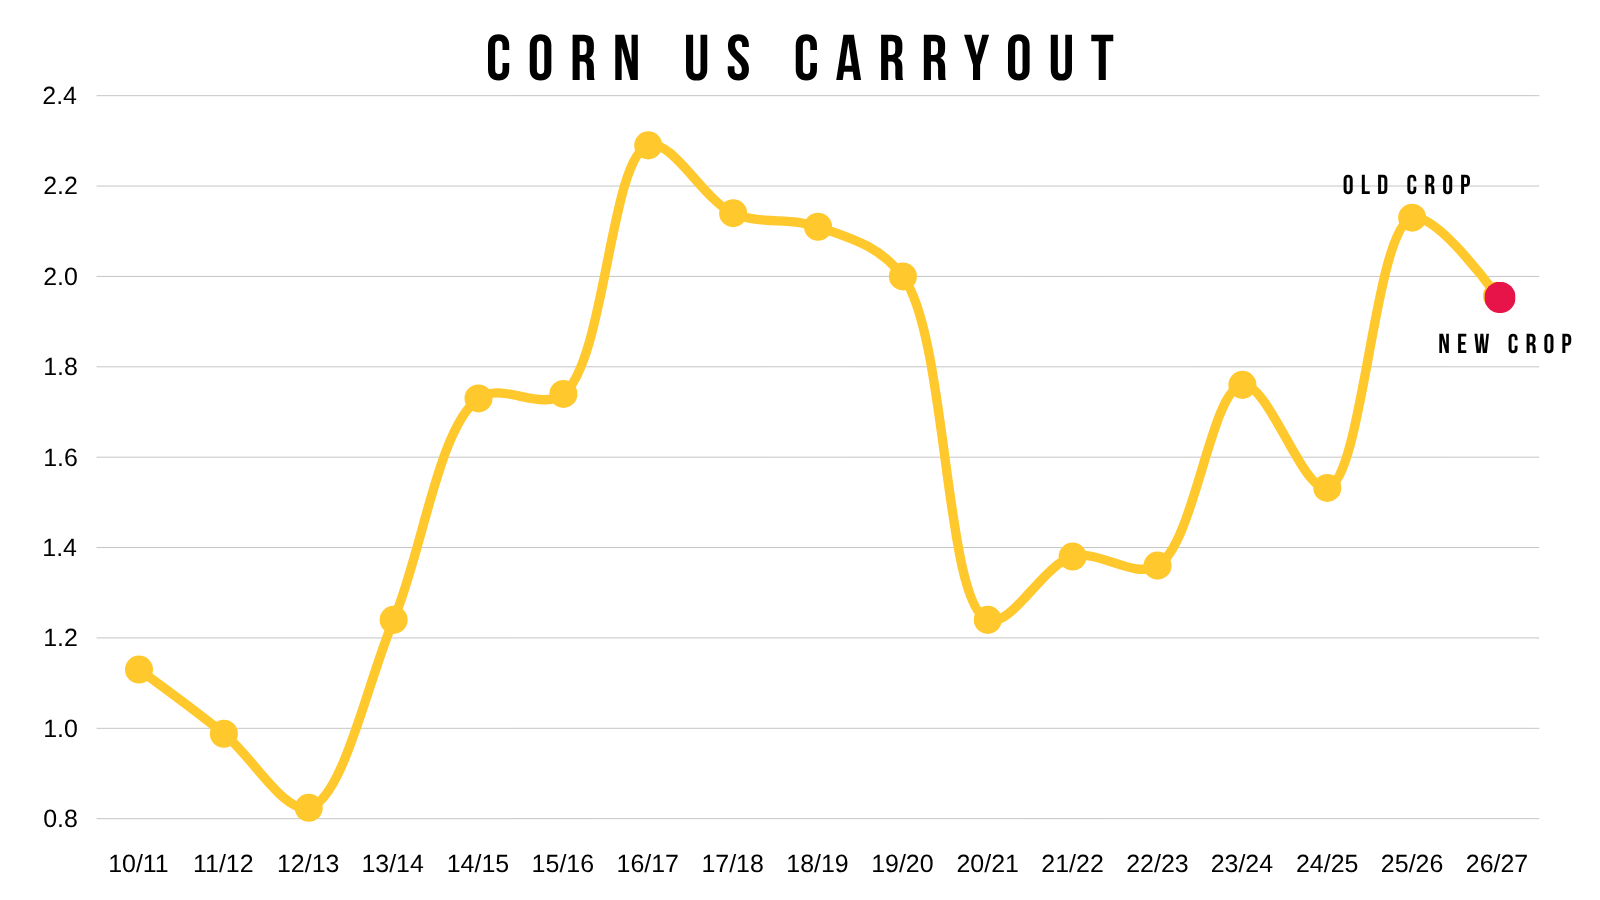
Neither of these scream "corn has to be above $5" when you compare our stocks to use ratio vs how high corn went that year.
But that story in new crop has plenty of time to change.
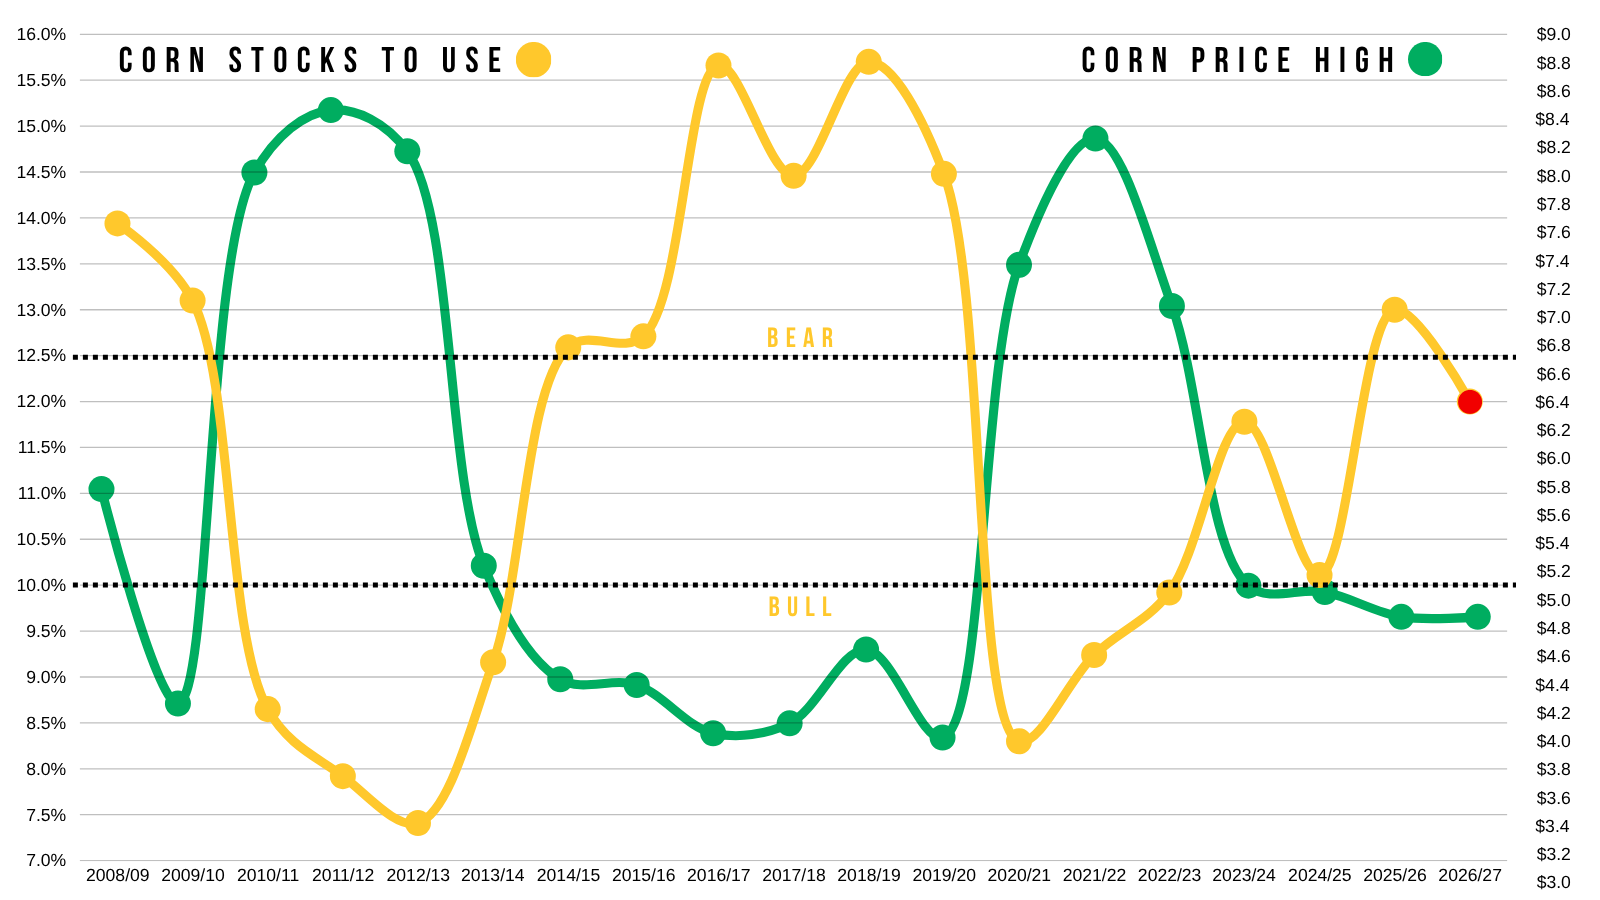
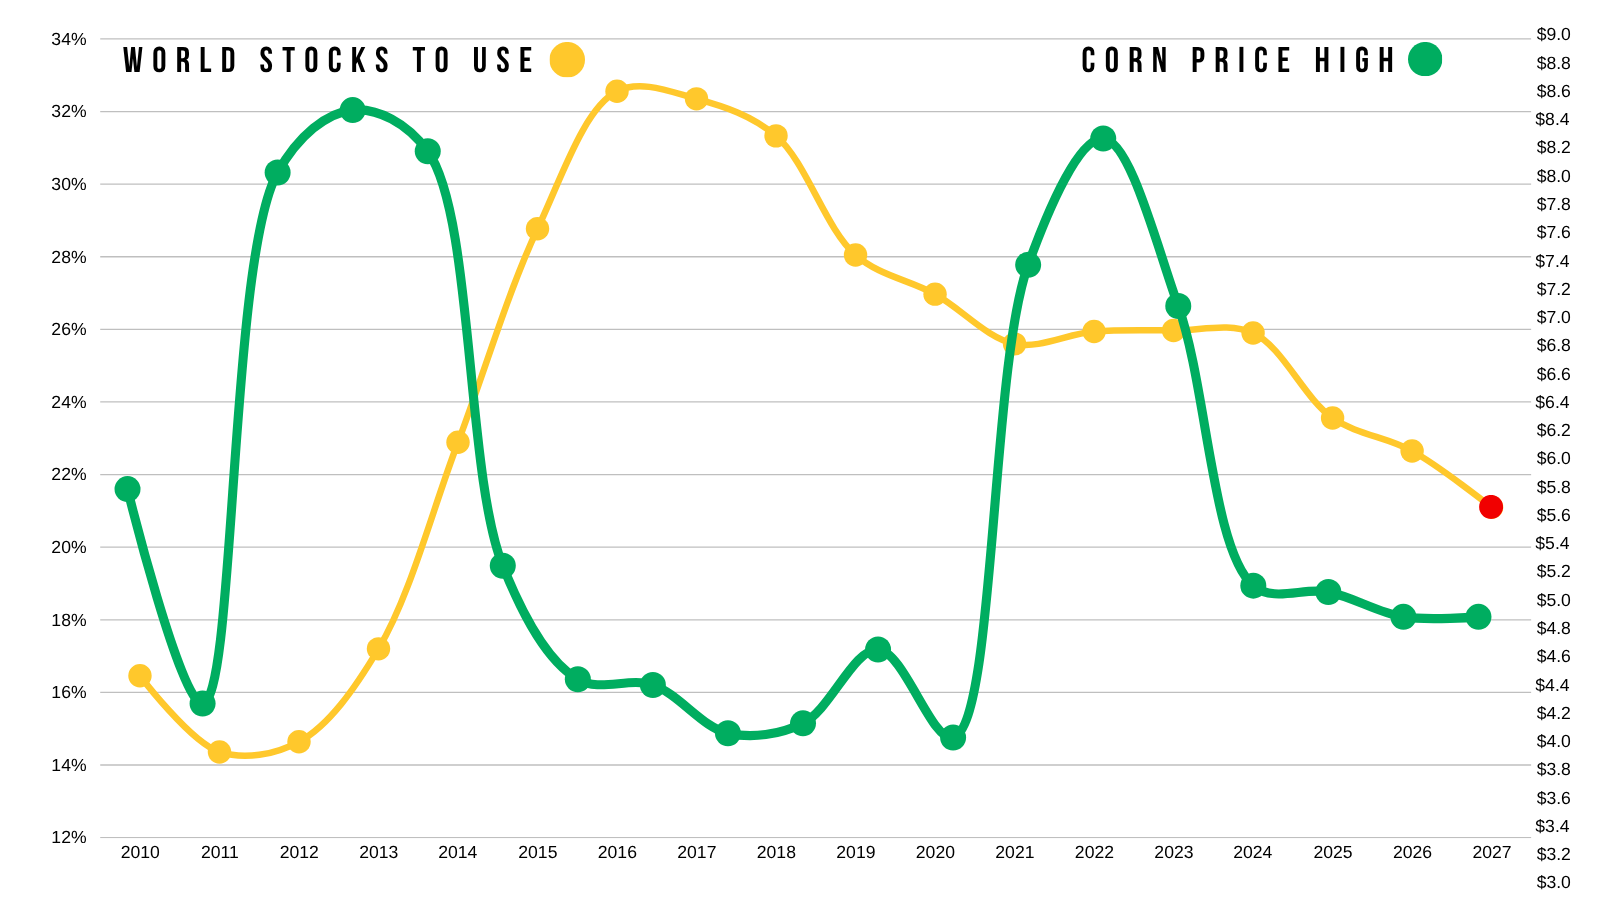
The world story is the tightest in 14 years like we've mentioned.
Here is a chart that compares world corn stocks to use vs our highest prices for the year.
As you can notice, there is no real correlation.
To get high prices, we need a tight US situation.
On hand hand you could argue it doesn’t matter if the world is tight, not if the US has a good crop.
However, this goes back to the demand arguement.
If the world is as tight as it's been on corn in over a decade, do you really think demand won’t continue? The world needs our corn.
As I've mentioned several times, the USDA's starting acres have rarely came within 1 million of the final acres over the last decade.
I mean they were off by 3.5 million acres last year.
Last year they orginally said we had 95 million acres.
They are once again starting with 95 million acres.
What happens if they miss that much to the opposite side this year?
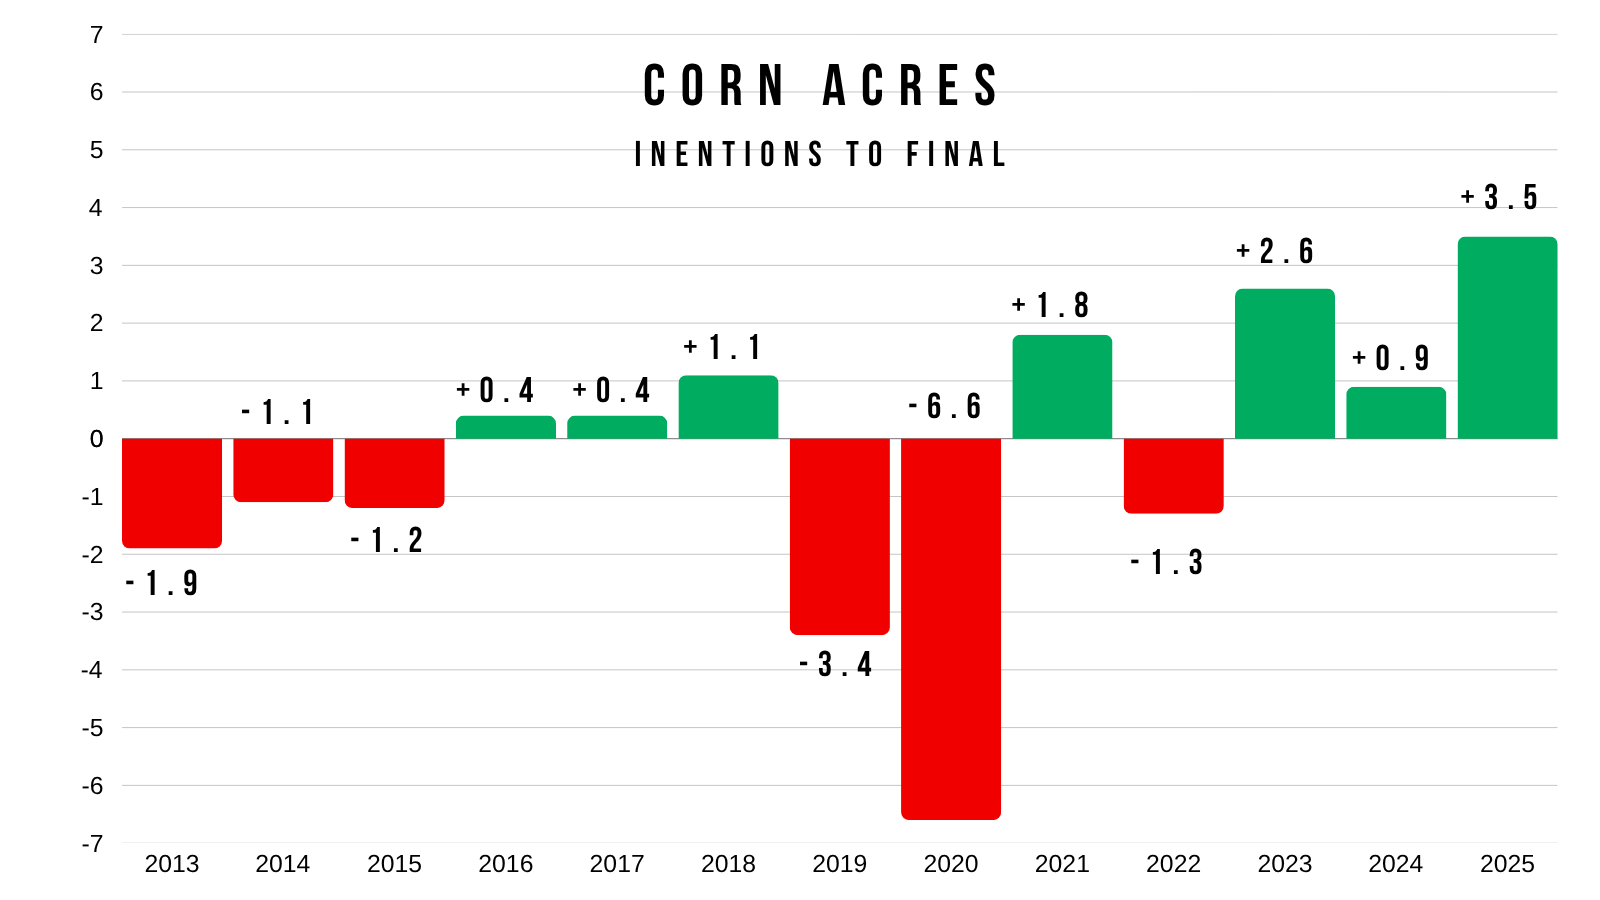
Acres are probably too high, who knows by exactly how much.
I doubt it is as large of a miss as last year, but let's just say it was.
How could that impact the balance sheet?
Before touching demand, and leaving the yield at 183, that large of a drop in acres paints a completely different story for corn.
Although, no it wouldn’t quite make this large of an impact to carryout as the USDA would of course do what they do and balance the balance sheet.
And we probably won’t see that aggressive of cut to acres to begin with. But it just goes to show how big an impact acres can have.
So a drop in acres could definitely be a story for new crop down the road even if it's just 1-2 million.
Now on the other hand, if we somehow raise 95 million acres and don’t see any sort of weather threats or another outside factor, the spring/summer highs could very possibly be in already.
Right now, this market does lack fresh bullish news.
We just lack that story saying corn has to go a ton higher right now.
If it wasn’t for the war, you could probably argue corn wouldn’t have gotten as high as it did this year.
But now, bulls need to continue to be fed.
If we don’t run into a weather scare, what is the catalyst that can send us to new highs?
The biggest wild card is China.
China is going to buy corn at some point. I am 95% certain it will happen at some point.
How much they buy and when they do so remains to be seen.
I showed these charts earlier this week.
The total projection for China purchases isn’t as much as it was back in 2021 or 2022.
$17 billlion of non-soybeans + $10.5 billion of soybeans (25 MMT) = $27.5 billion
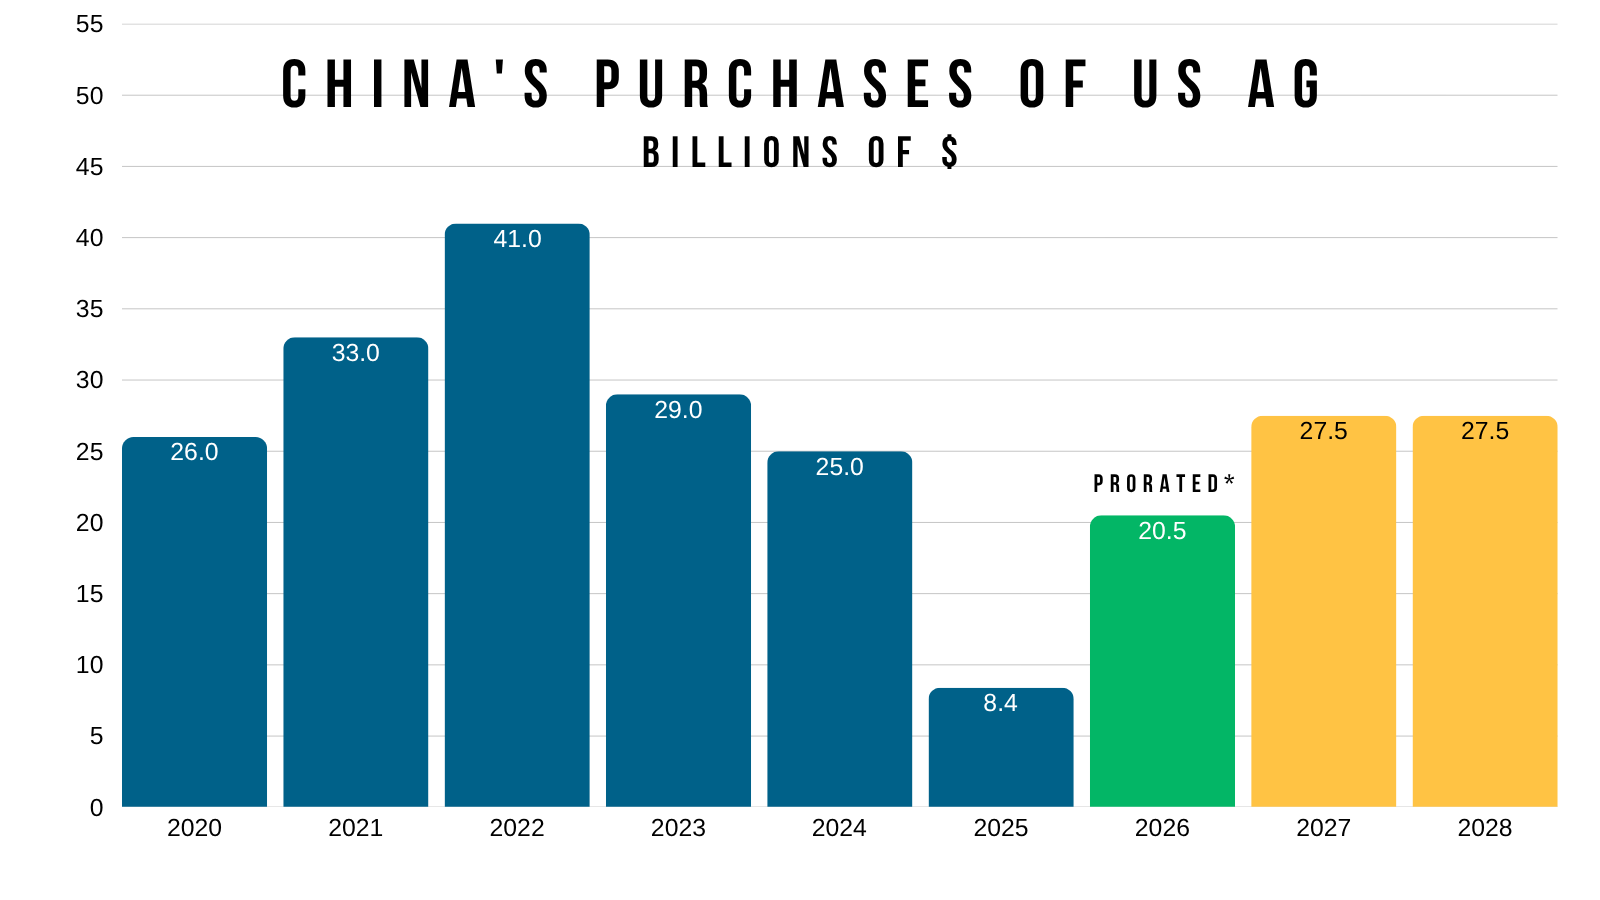
However, the $17 billion for non-soybean purchases are the largest since 2021 and 2022.
So you can’t tell me that China isn’t going to likely use some of that for corn just like they did back then.
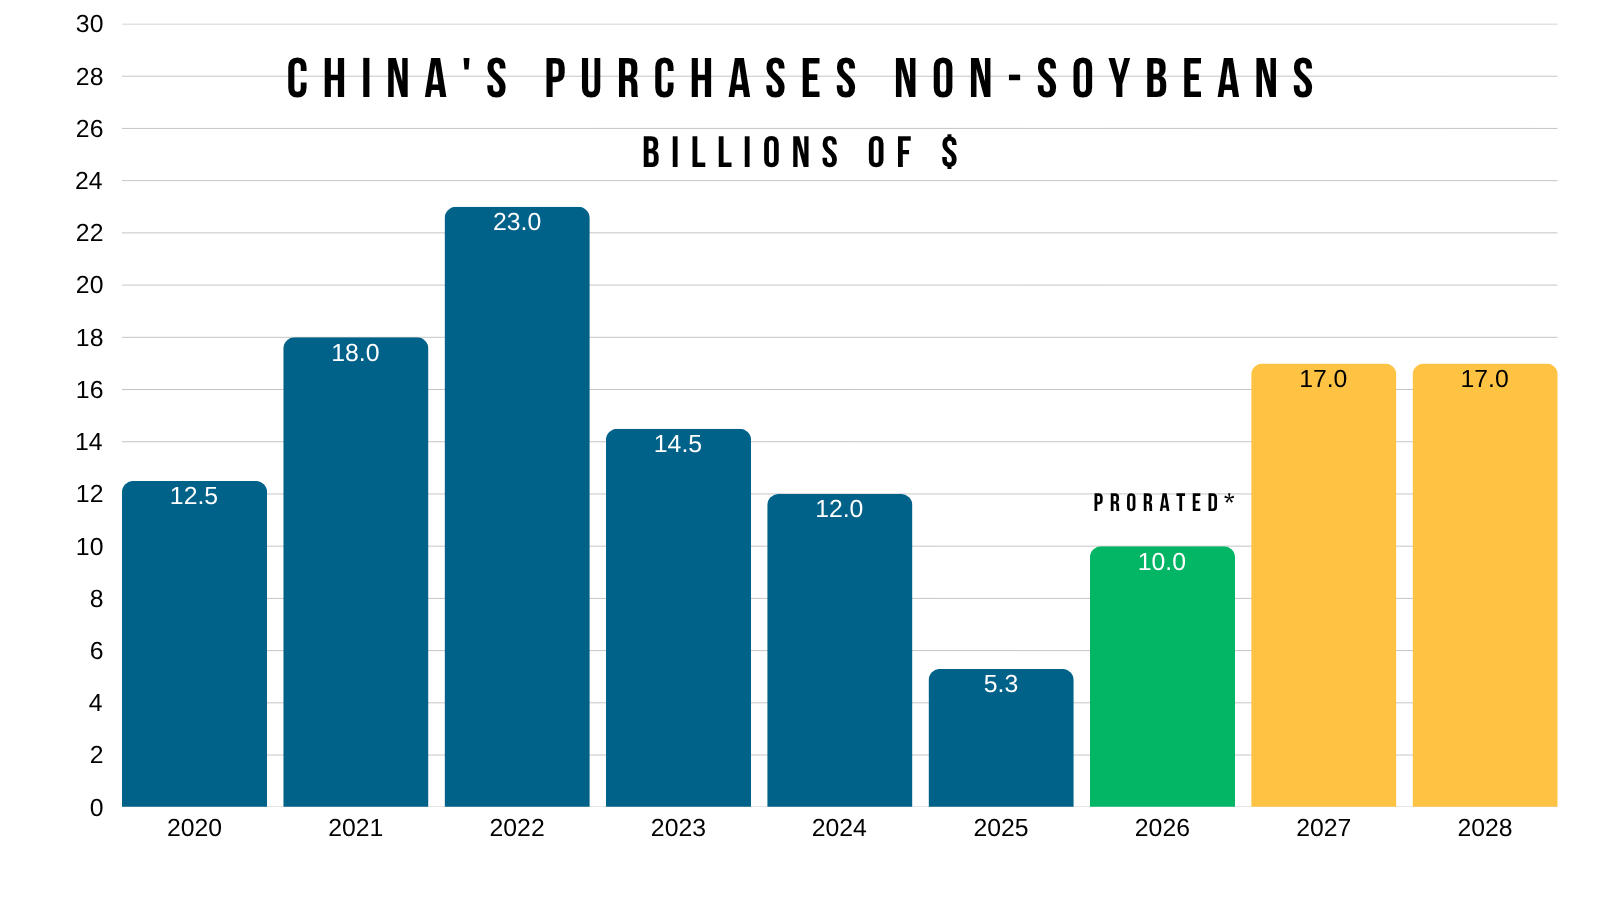
The timing of when they buy corn is going to have a massive impact on our markets.
If they buy next week, that might be the catalyst we need to go post new highs if we aren’t going to get a weather scare. Because the market will take notice if this happens.
On the other hand, if they wait until harvest, this is going to be a bigger story going into next year rather than an immediate bullish factor.
The market wants proof.
You could argue that they might wait until harvest to buy.
I mean if you were China, and wanted to get the best deal possible, it might make sense to wait until there is the most supply and when prices are historically at their lowest. You buy stuff when it's on sale.
China isn’t going to announce they are buying corn. You don’t show your hand or push the price higher before you buy it. If anything, you break the market before you buy it.
So that is a risk. We don’t see China step in until harvest. We see no weather scare. Maybe the war story dies down. And this market simply lacks a fresh set of news to drive us to new highs.
That would be the bear case scenario over the next few months.
As I've mentioned heavily the last weeks, this is the time of the year where we typically post our highs.
It's still a little too early to say we have definitively posted our highs for the year already, as this has been a crazy volatile market.
But we do know that odds are we are lower by July without a weather scare or an outside factor, regardless if we head higher first or not.
Here is the 5-year seasonal.
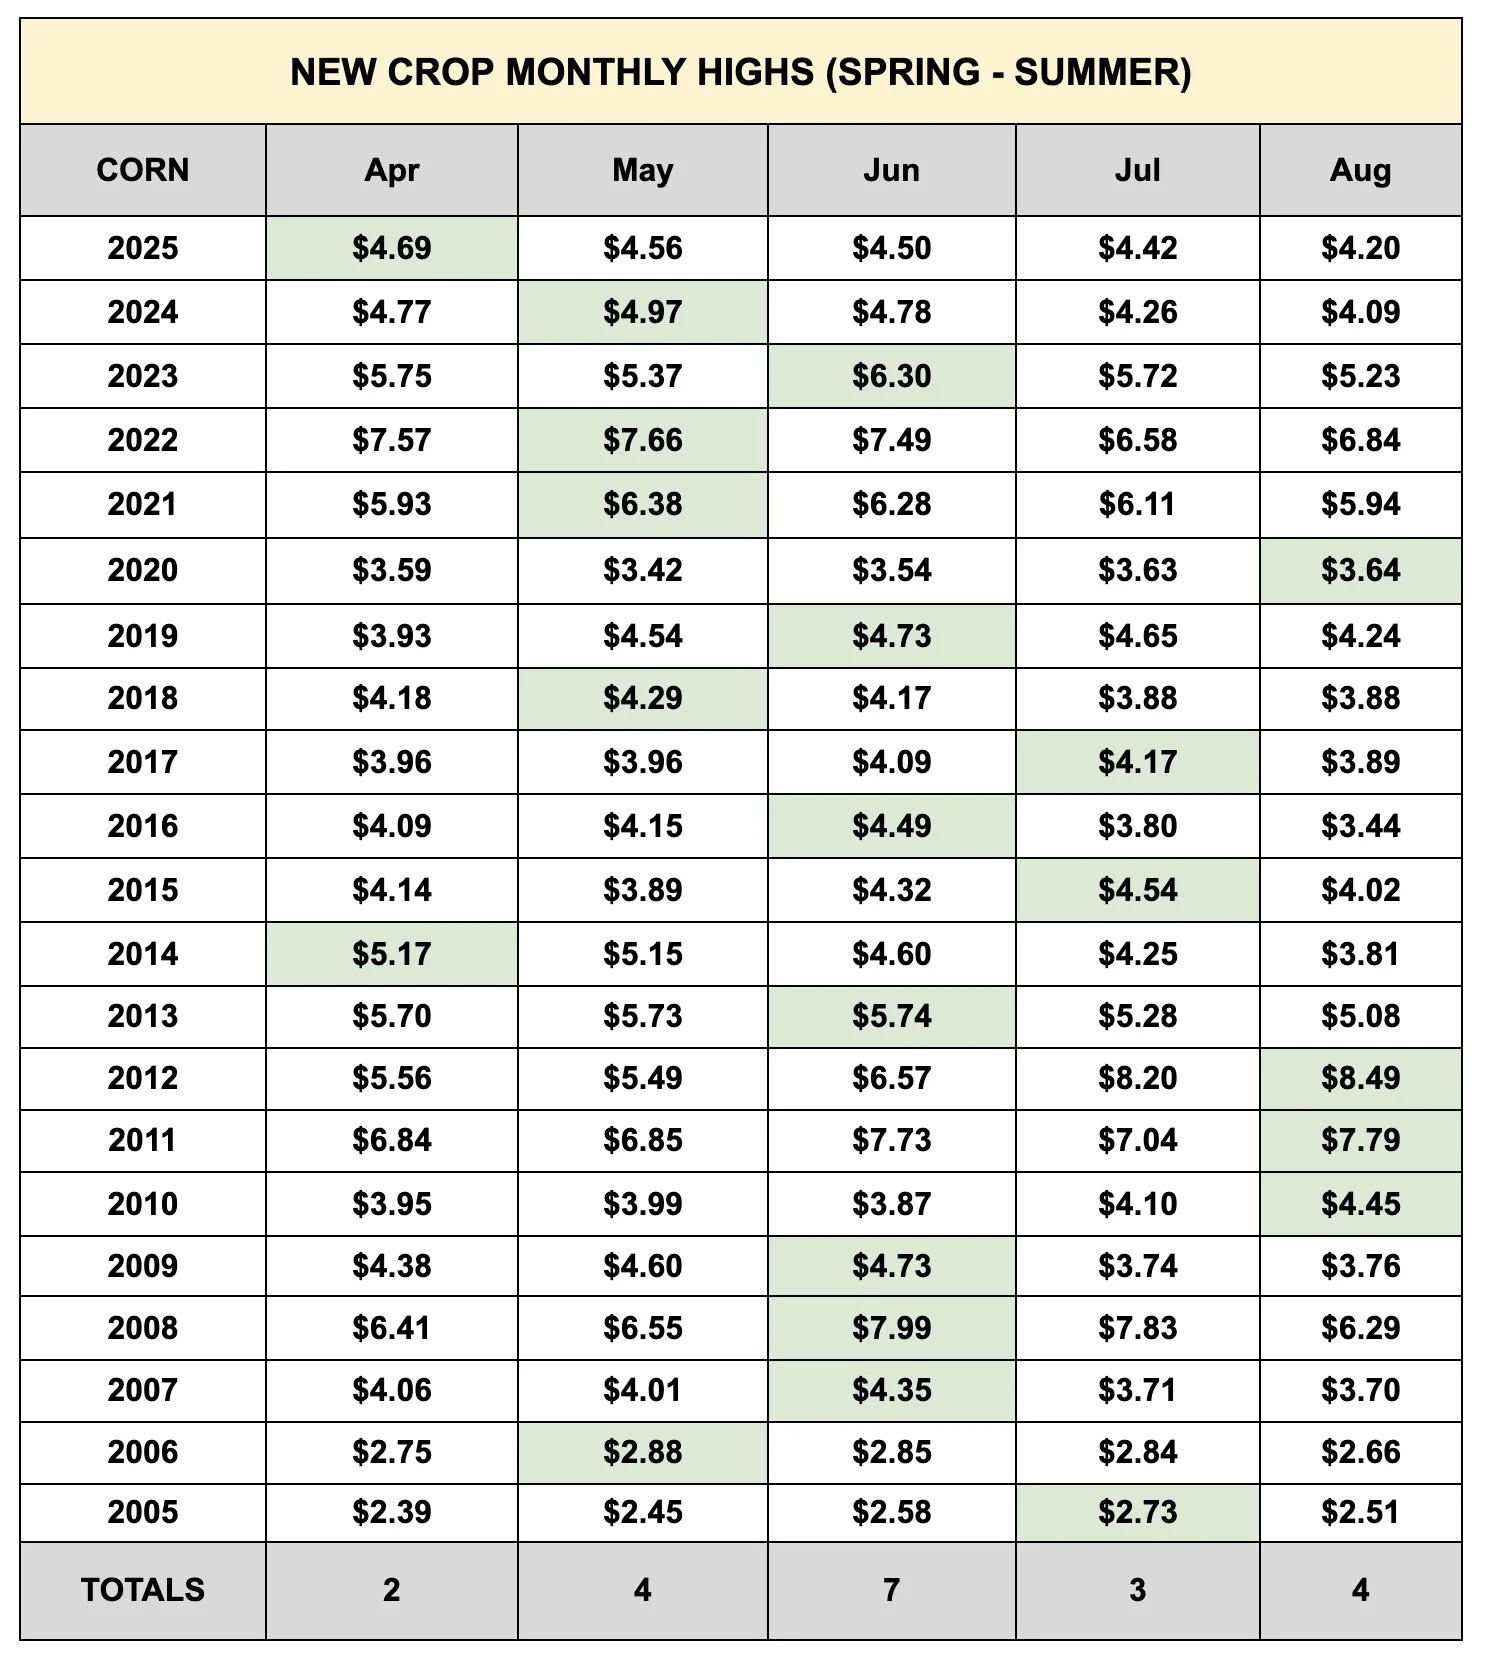
Here is some other seasonal data I showed a few weeks ago.
If we look at our spring and summer highs from April to August, May has been the most common month over the last decade, followed closely by June.
So we could possibly still post new highs in June, but rarely is it going to happen in July, barring weather gets crazy. We haven’t posted them in July since 2017.
I guess that June acre report at the end of the month could possibly come in super friendly, but by that time we'll have a good idea on how this crop looks like, so the chances for a weather scare become small.
The Argument for 2027:
I think we have plenty of potential looking towards next year.
It's too early to say the story is dead this year to begin with, as we could absolutely find that catalyst to go higher.
But next year I think offers a ton of potential.
People are already debating how many acres we are going to lose this year due to the fertilizer situation even though a large amount already had their needs booked.
What happens if this fertilizer problem isn’t fixed for a while? How do you think that impacts production next year?
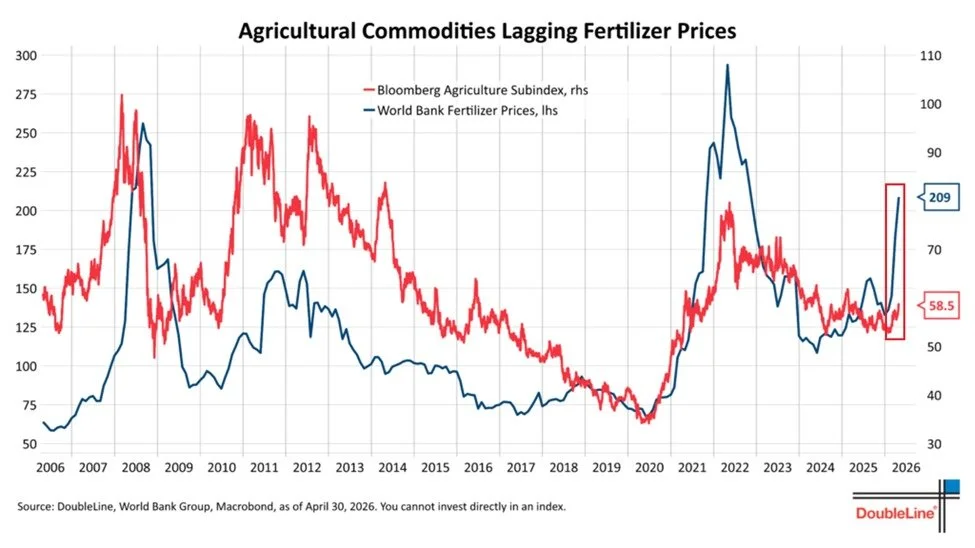
Here is a chart that shows fertilizer prices vs the ag complex.
Normally, they go pretty hand in hand. So far, we've lagged begind.
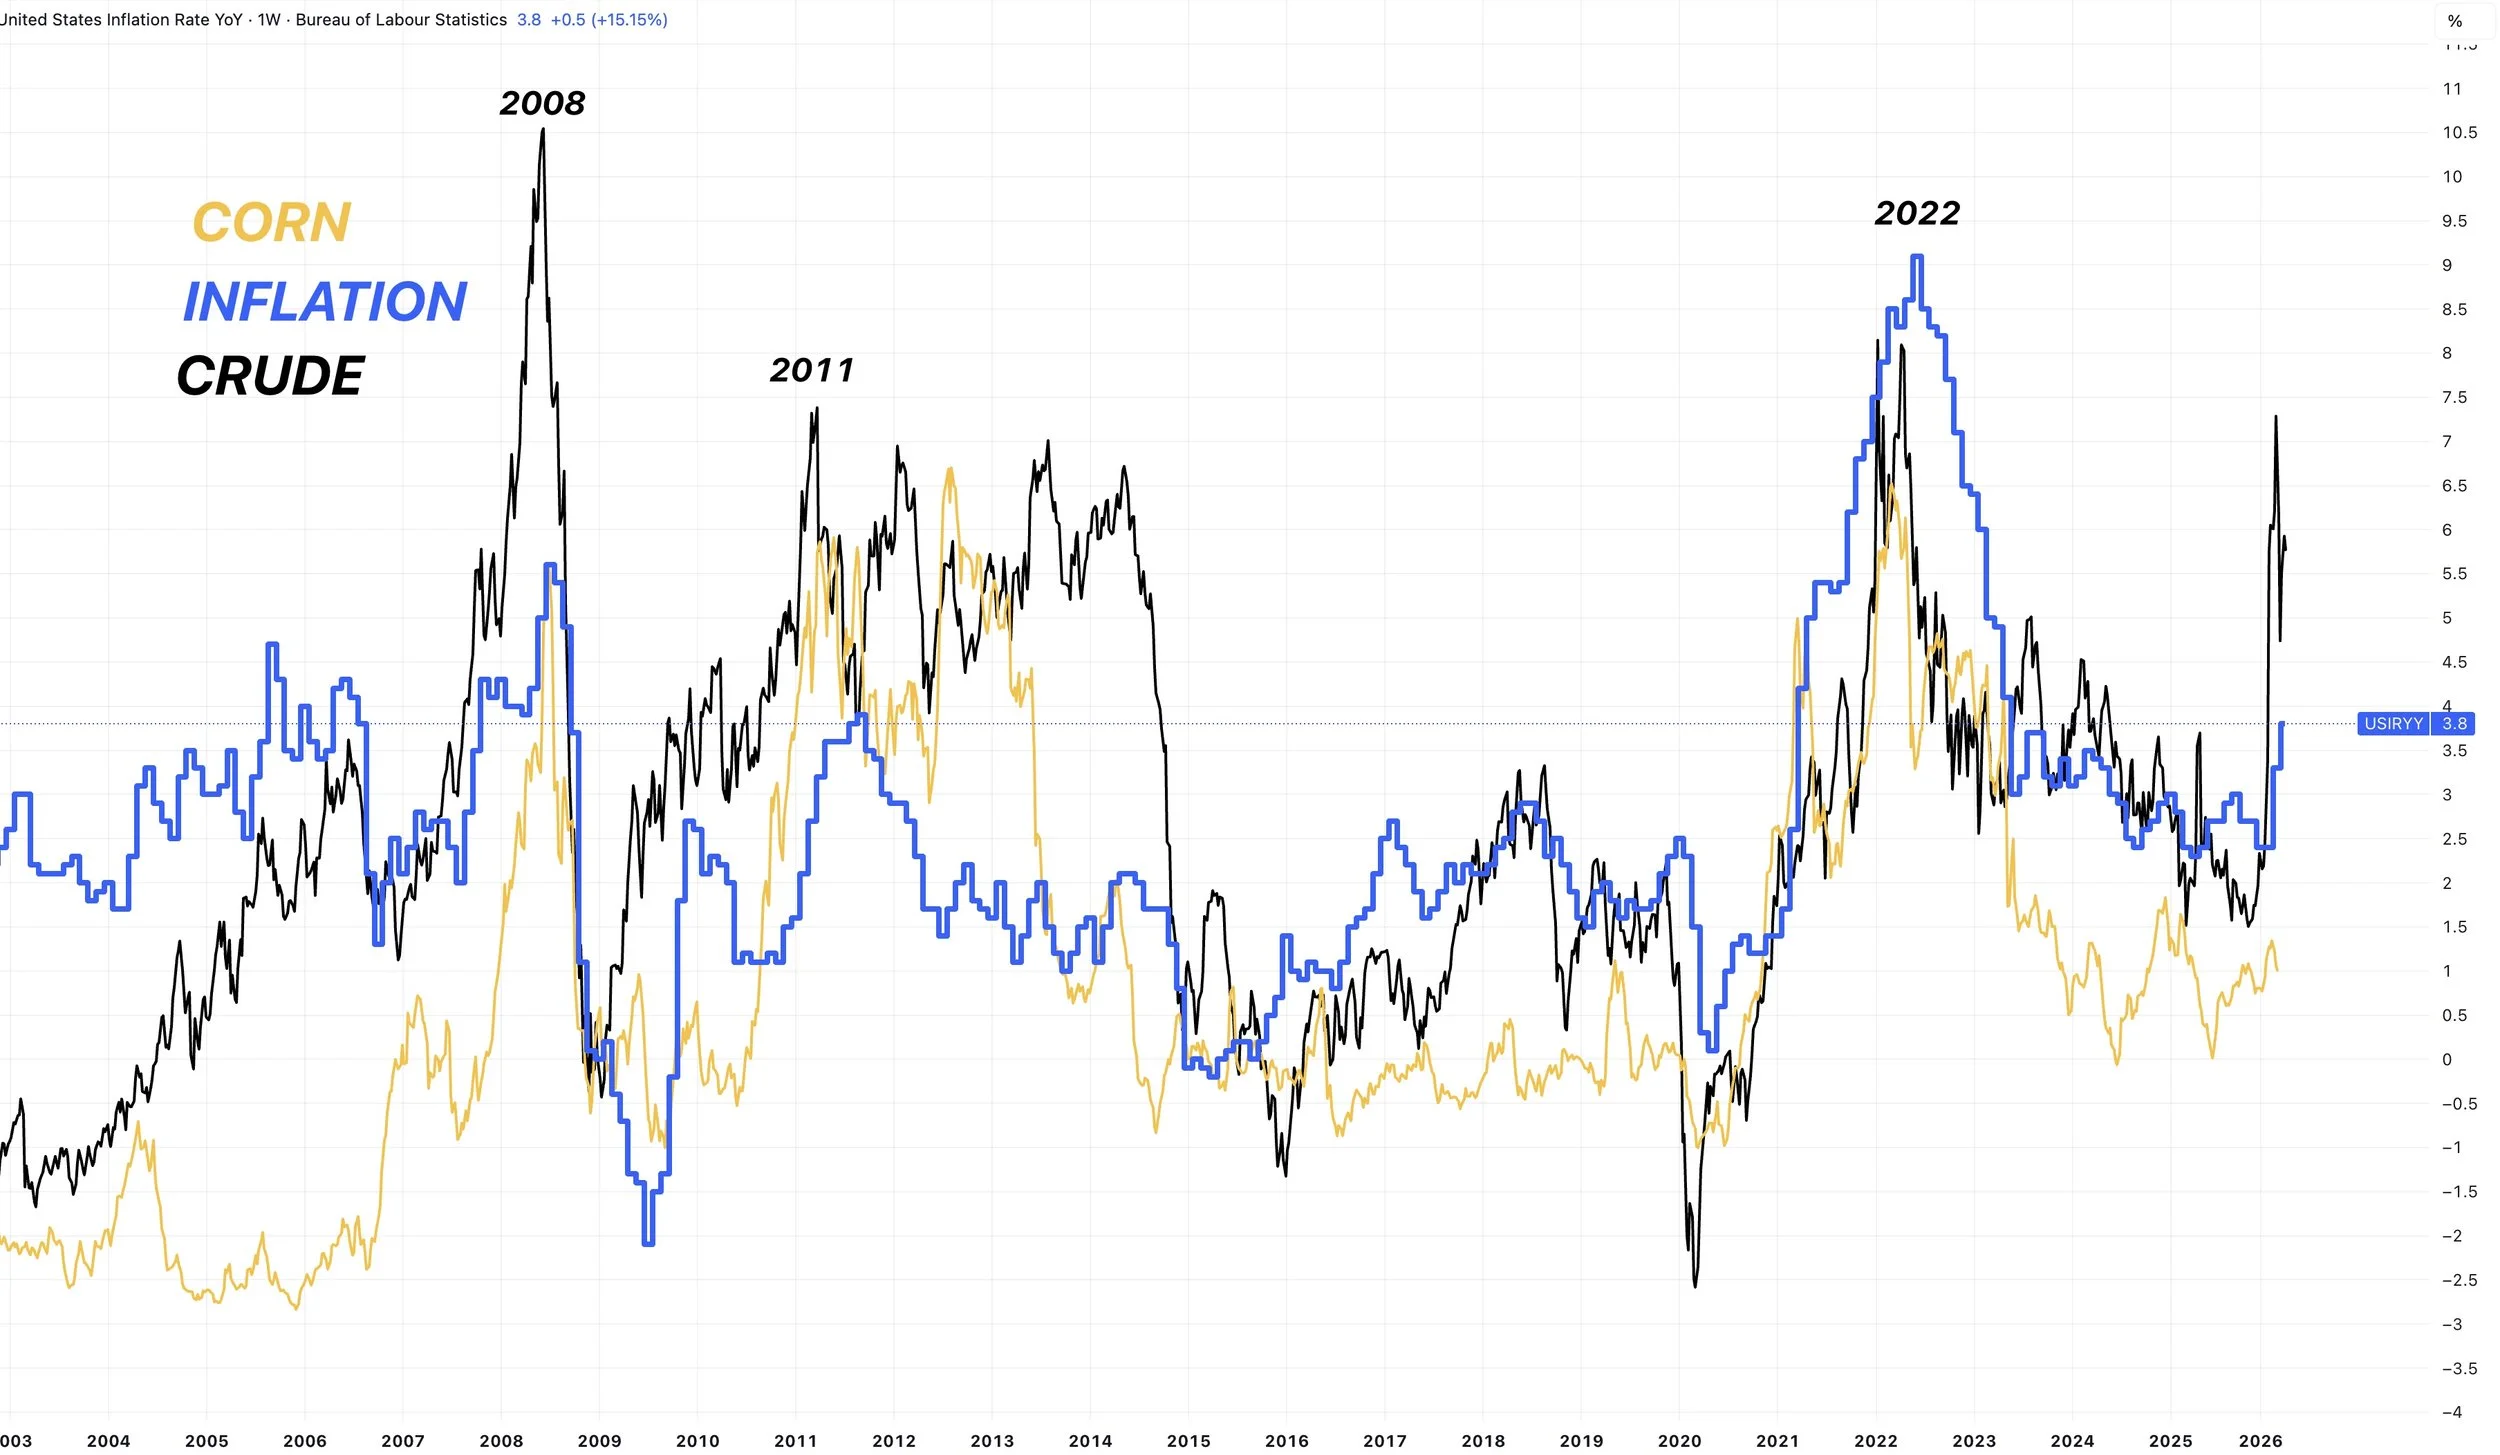
Then you have inflation.
I've been talking about how this could be a huge factor for over a year now.
I've shown this chart a thousand times.
Who knows if inflation will actually soar higher or not, but it's always a possibility. If it does, more often than not grains could follow.
At the same time, we should have China more than likely going to be back in the market for corn later this year.
So I see plenty of "potential" friendly factors long term and heading into next year.
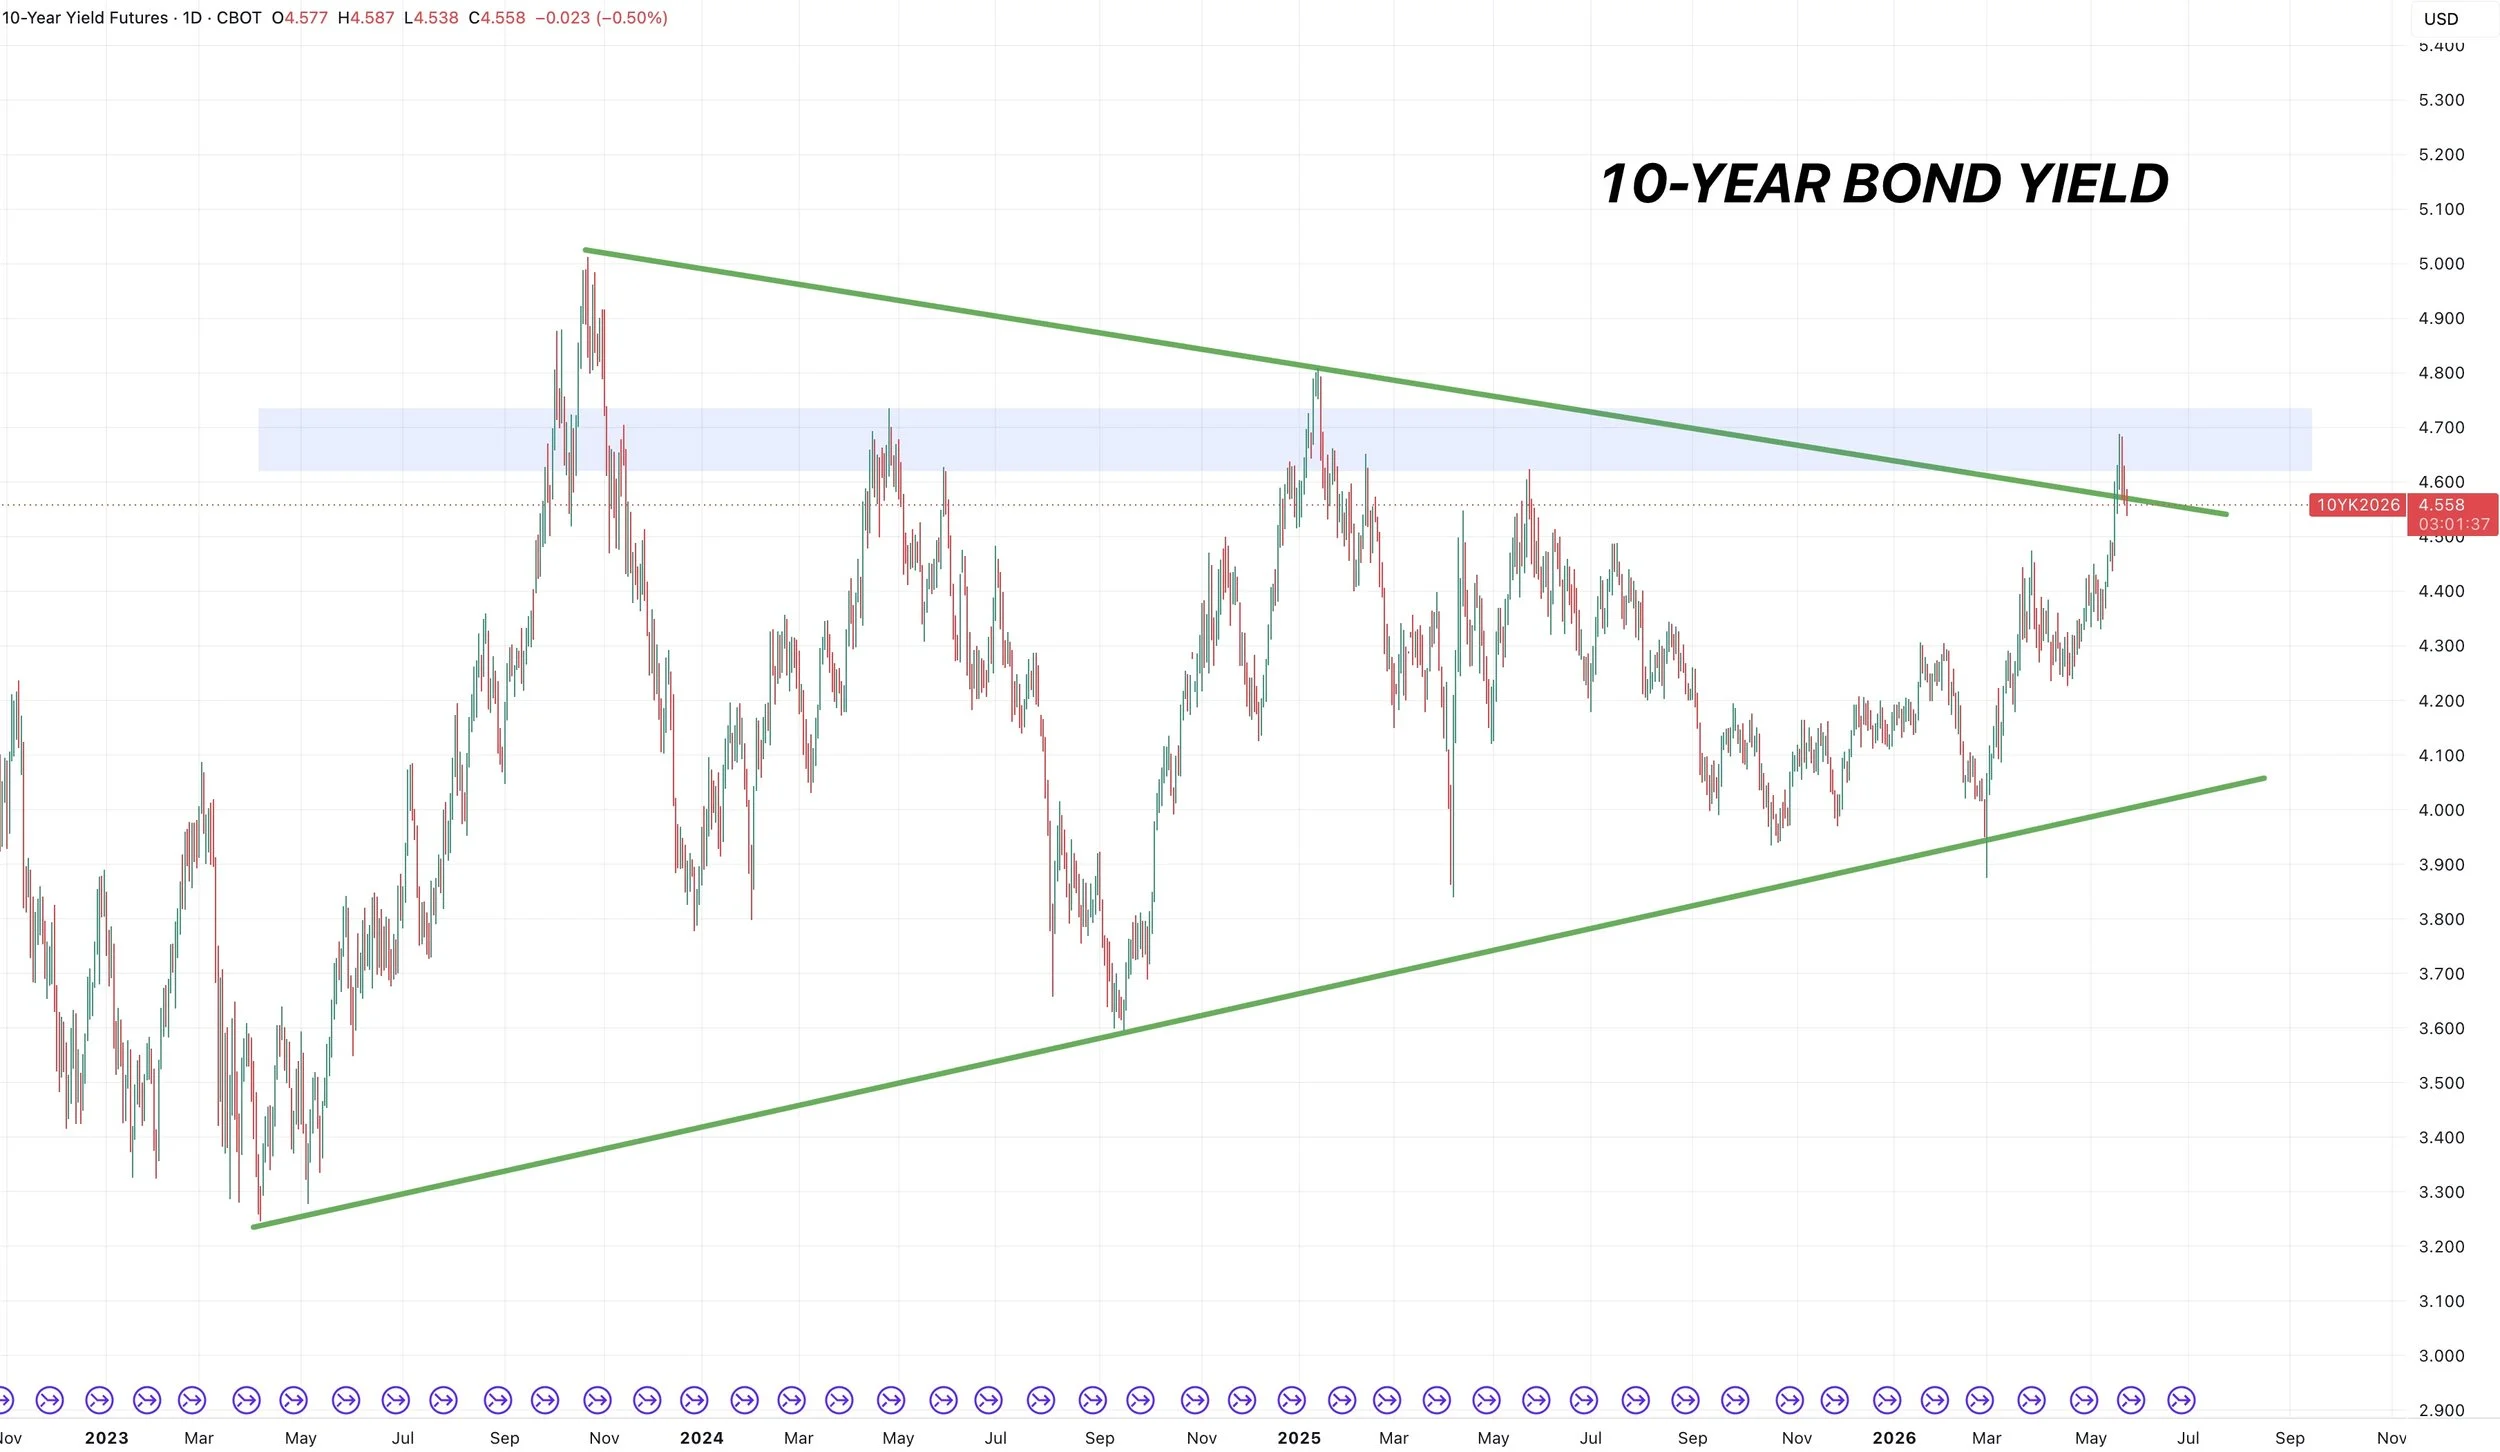
Let's take a look at bonds yields.
Nico of AIQ pointed this out the other day, so shoutout to Nico (@NicoAIQ on X).
Corn and the 10-year bond yield have tracked extremely closely over the last few years.
In fact the last several major highs in corn also happened right around when bond yields peaked.
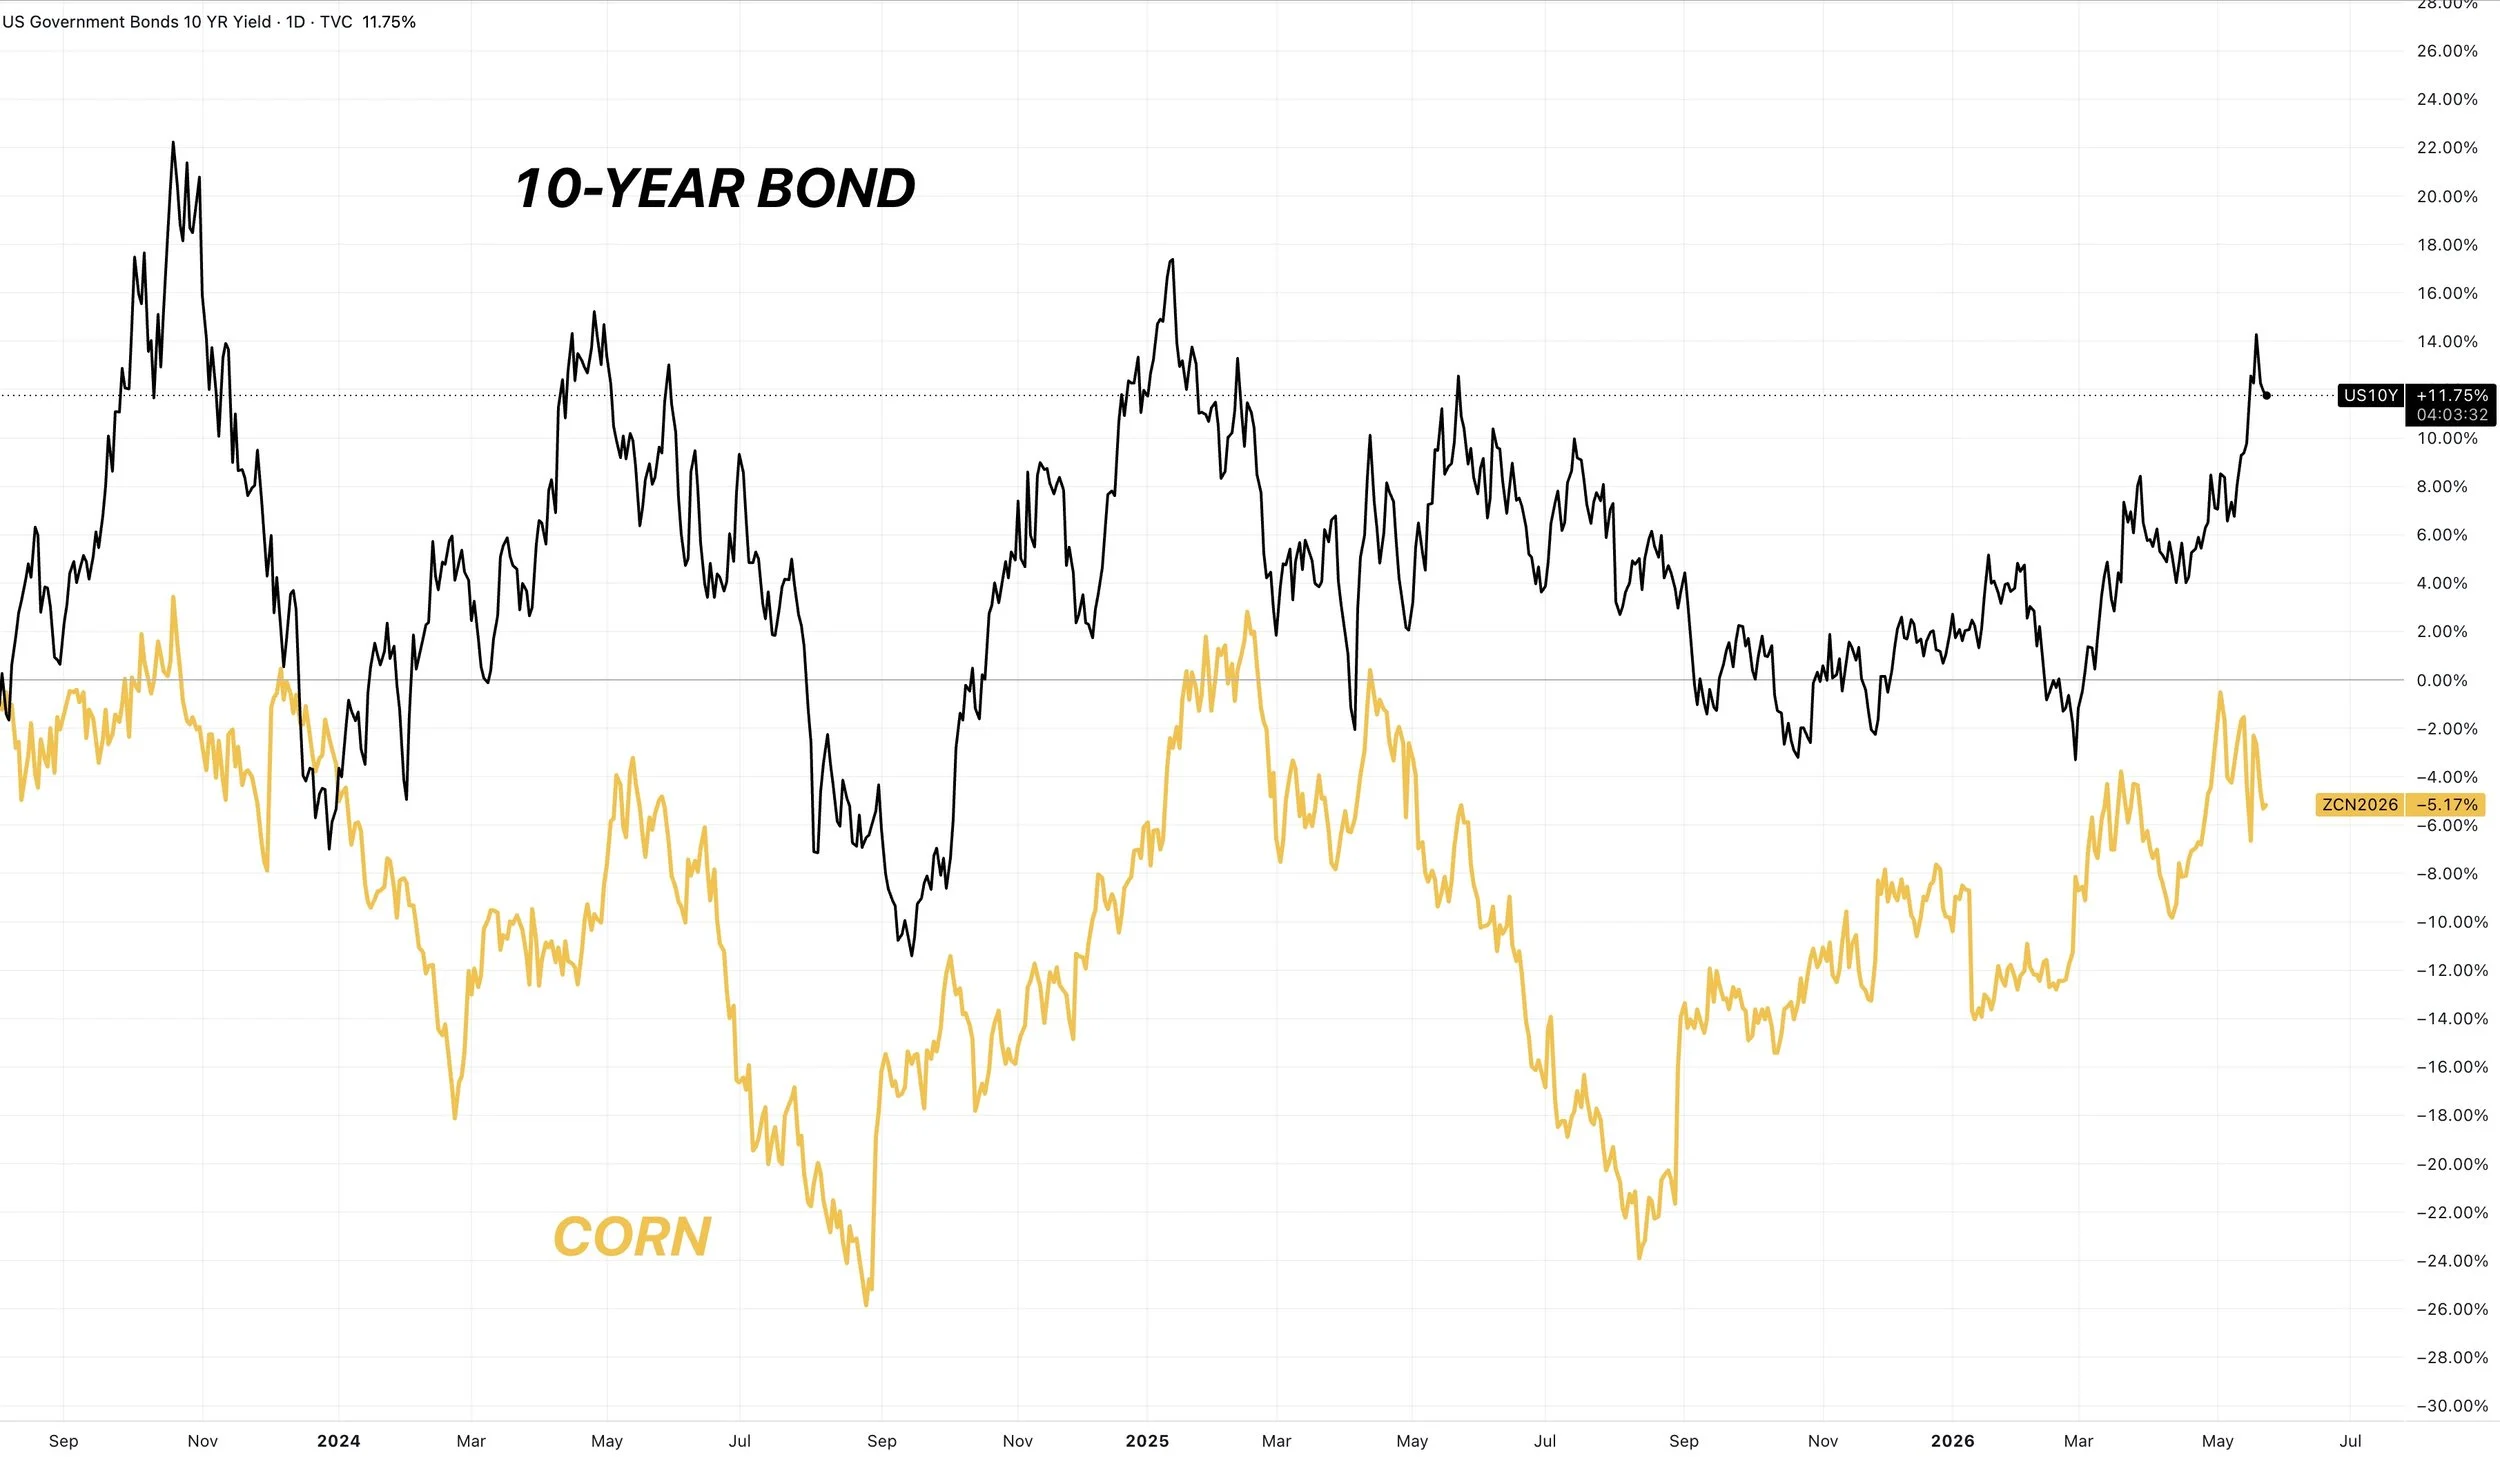
Here is the 10-year bond yield chart.
You could argue it's at resistance.
But you could also argue that if it makes another leg higher, we'd be breaking out of a multi-year range we've been in.
Higher bond yields typically suggest that inflation is sticky.
Hard assests like corn and some other commodities as often used to hedge against inflation.
Hence why a big jump in inflation usually leads to better prices for corn and the rest of the grains.
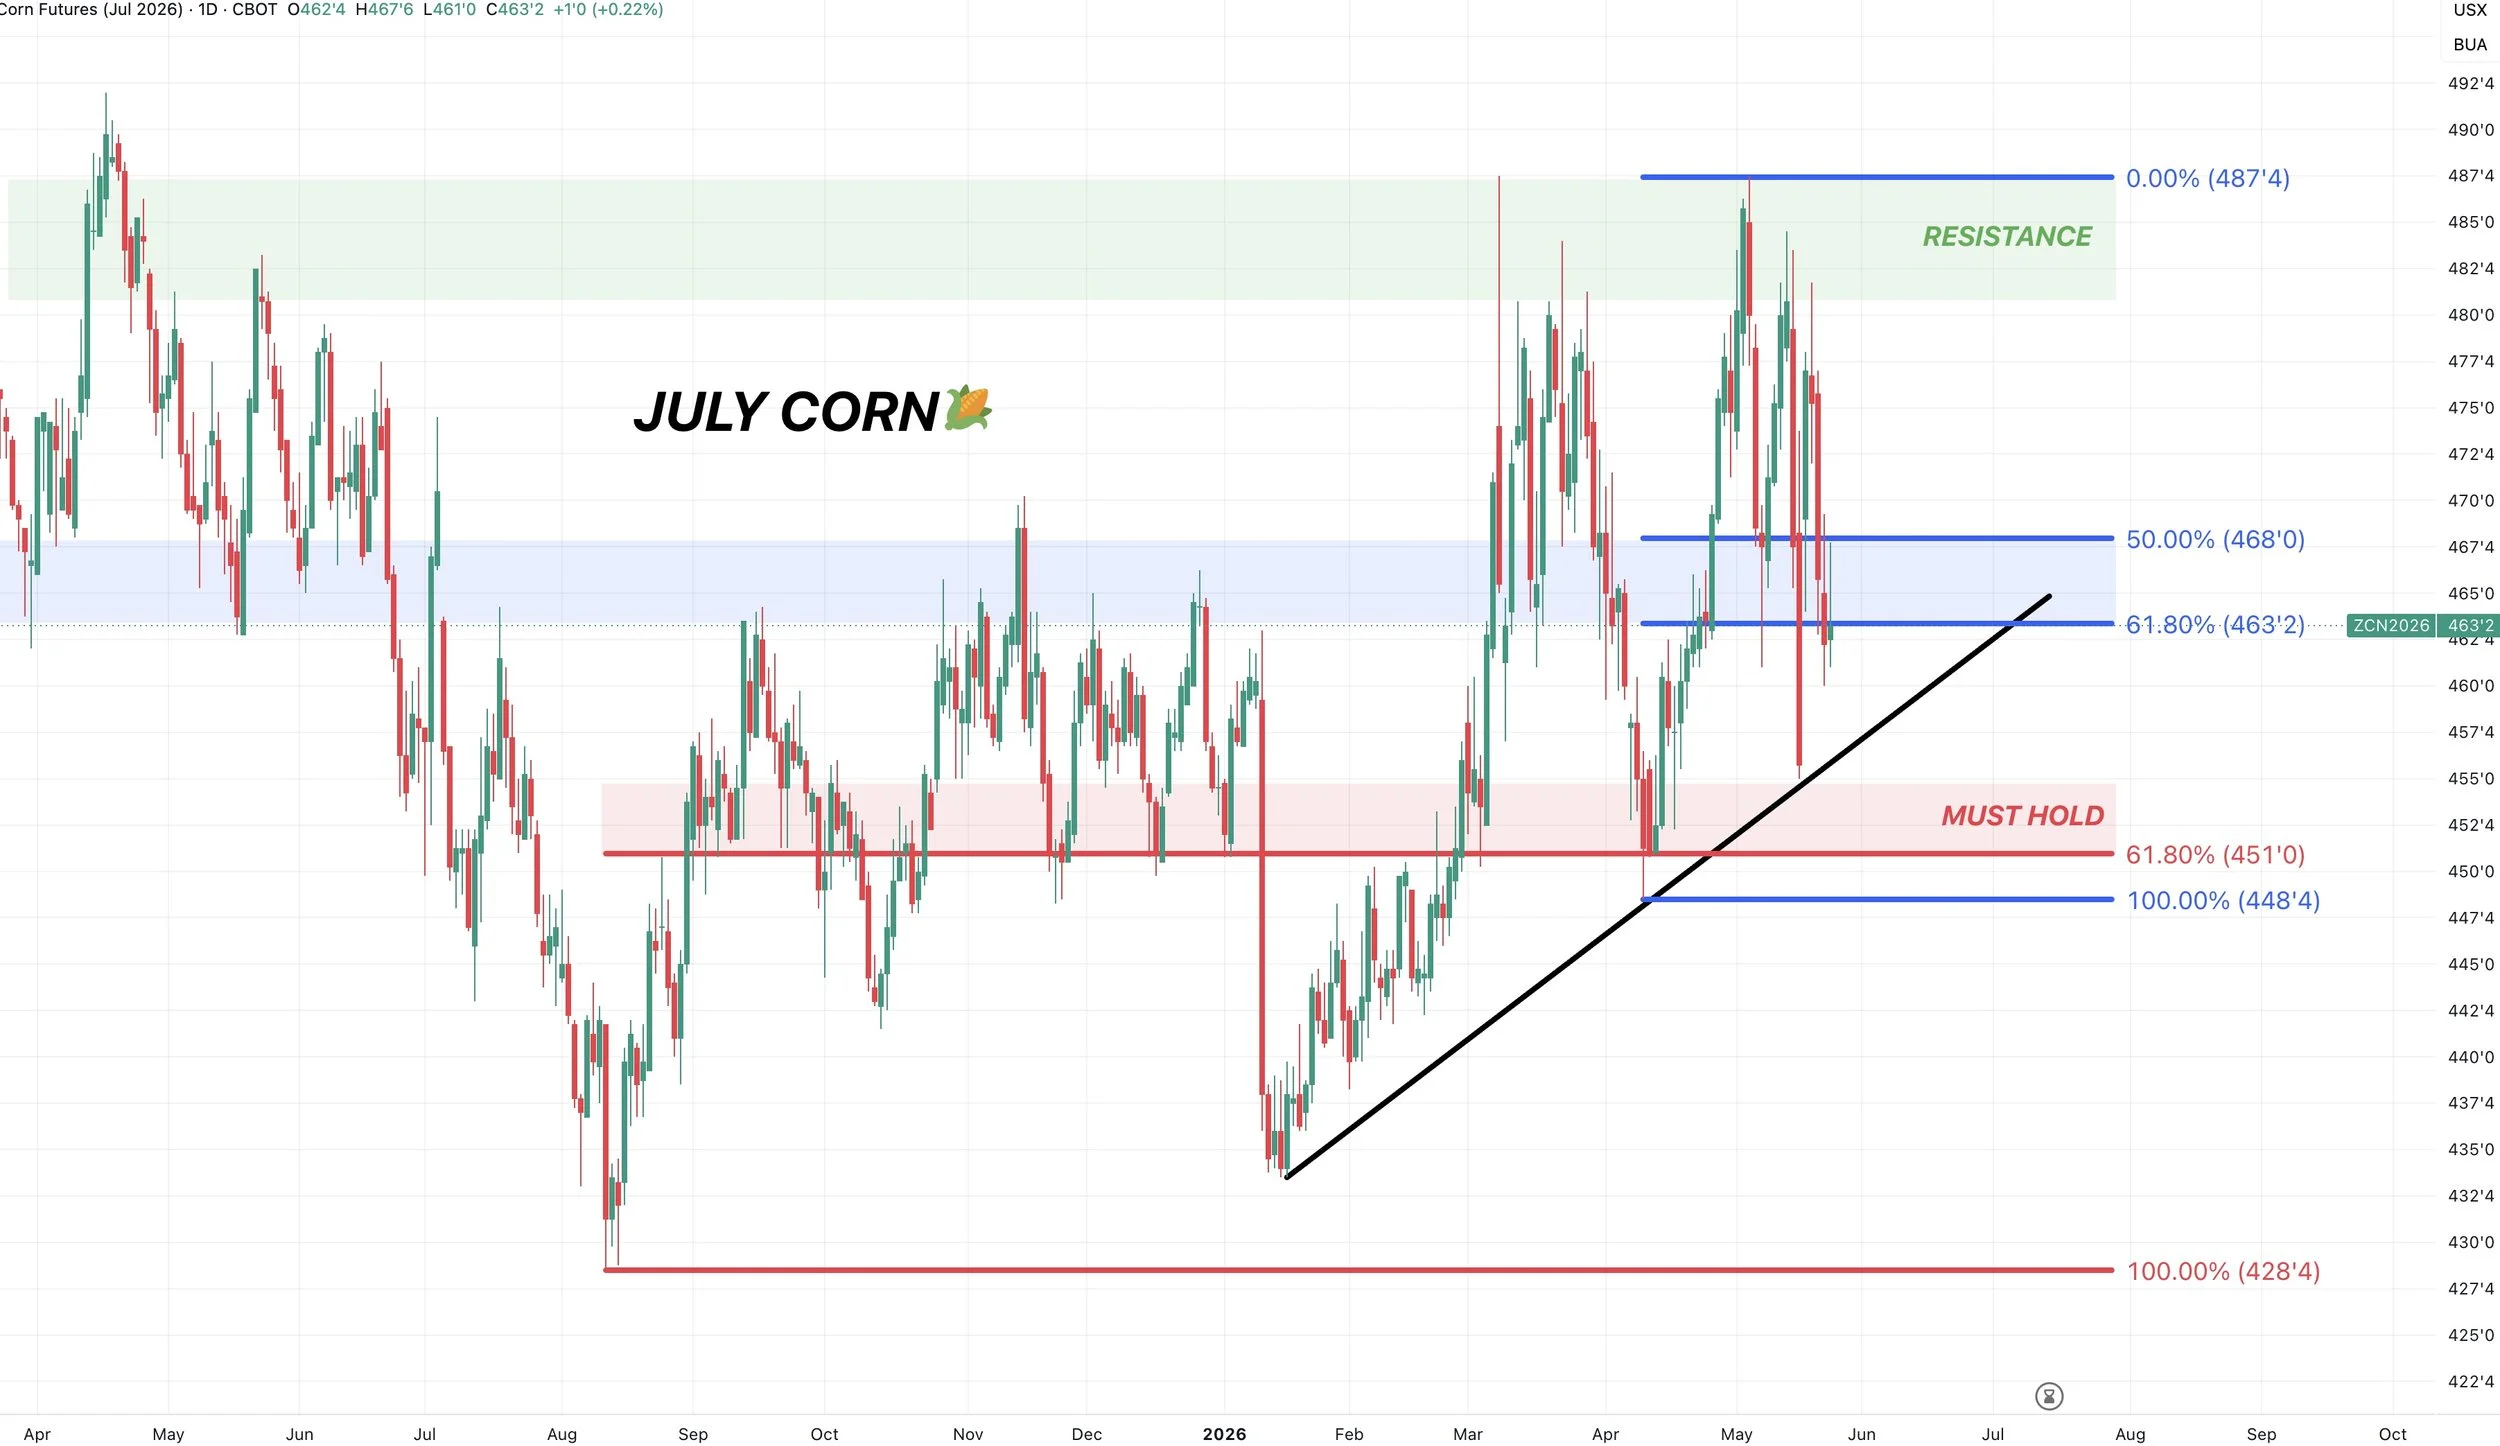
July Corn Chart:
The thing about charts in an extremely volatiles market and headline driven market is that we can get head fakes. Like we saw last week.
But right now we're still sitting at a pretty important spot on the charts here.
Still hovering right at that 61.8% retracement down to the April lows.
This same level is that resistance from the fall.
Bulls want to see us hold here or we could drop towards the red box.
The line in the same to keep the trend higher is $4.50. That gives back 61.8% of the highs all the way down to contract lows.
It's also major support from last fall.
If we fail that level it would be a bad sign and likely suggest the highs are probably in barring an unforeseen event.
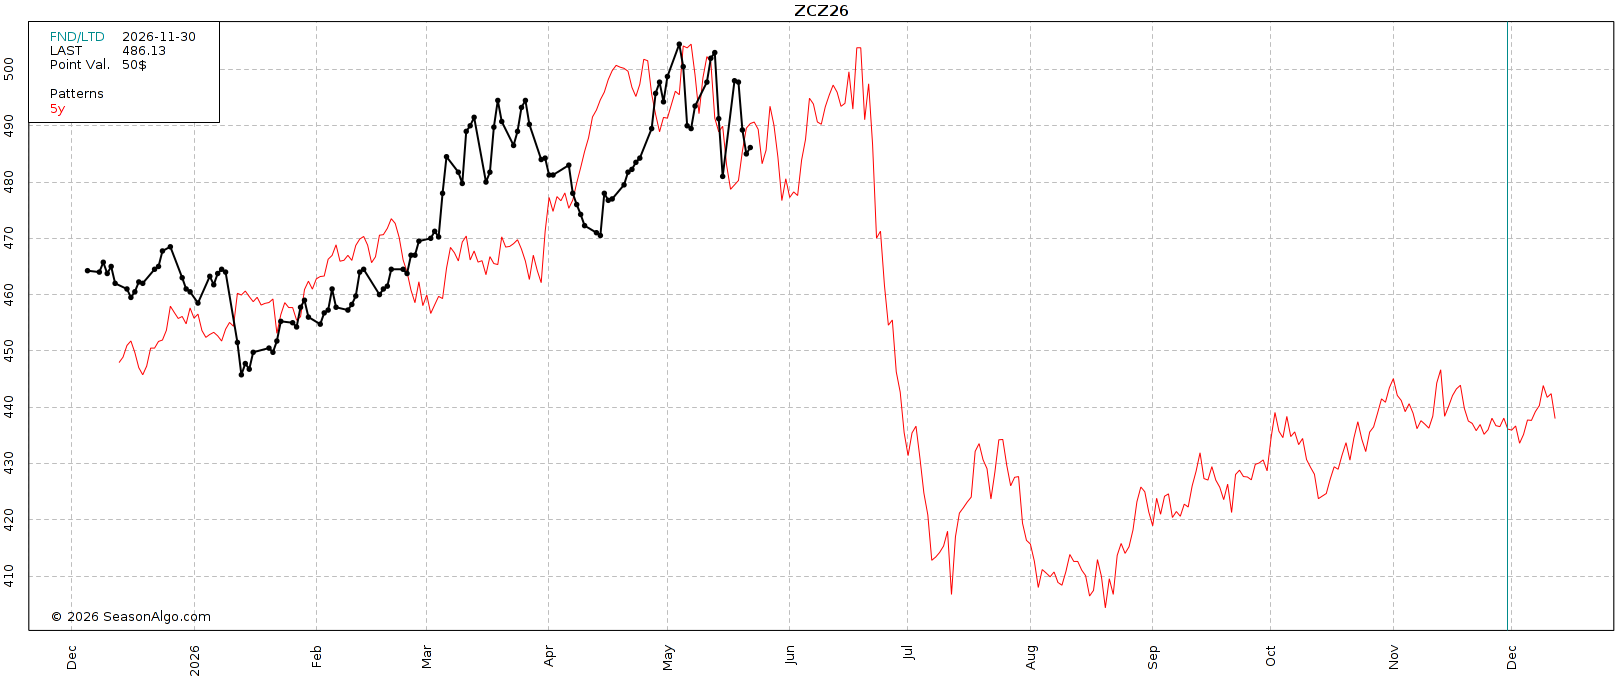
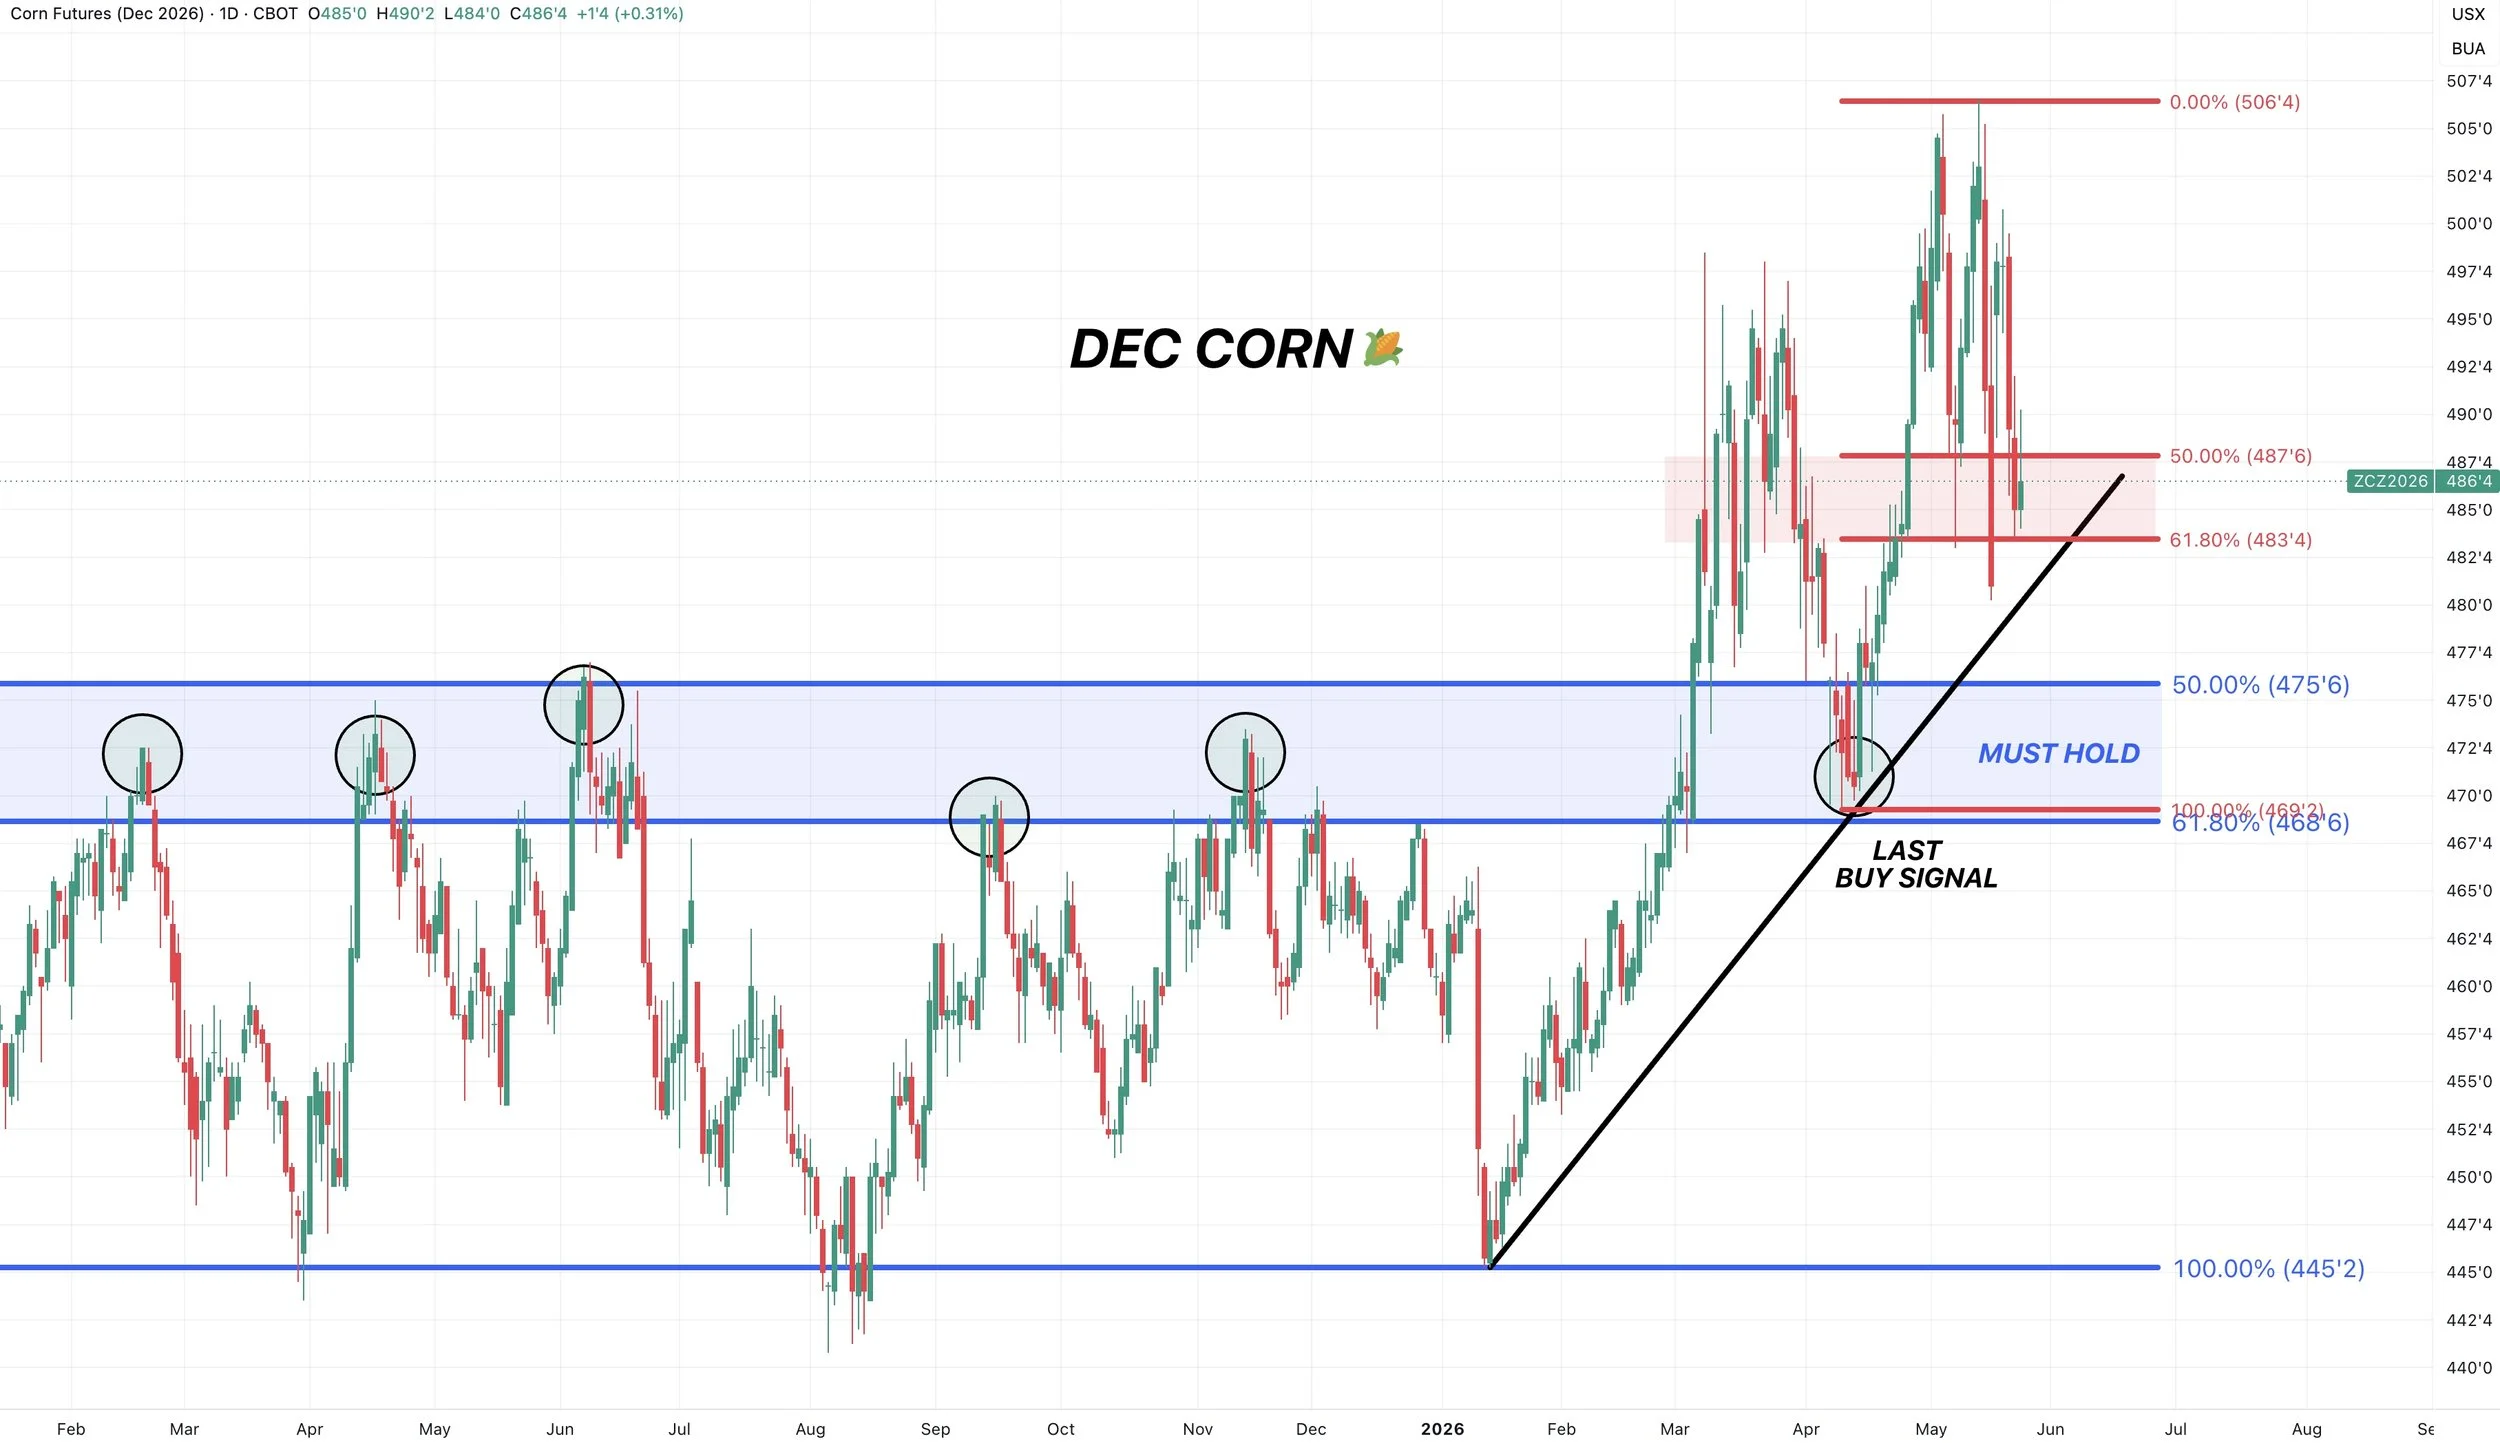
Dec Corn Chart:
Also sitting at a key level.
We've given back 61.8% of the April lows.
Also running into some trend line support.
Bulls want to hold this level or we could go down towards the blue box.
The must hold level is $4.69 which is 61.8% of the entire rally.
That is the level we need to hold to keep the long term trend still higher.
Soybeans
I'm not going to spend too much time on the soybeans or wheat today, as today was heavily focused on some corn data.
The China meeting didn’t really give us anything new to work with.
China is still going to be buying new crop beans. We'd like to see them start to step in here and buy some as we haven’t seen any purchases yet.
The story is clearly still in new crop unless something changes.
I mean the USDA is starting off with a relatively tight new crop balance sheet vs the last few years, and doesn’t offer a lot of wiggle room.
Although, if corn acres are too high, bean acres are probably too low.
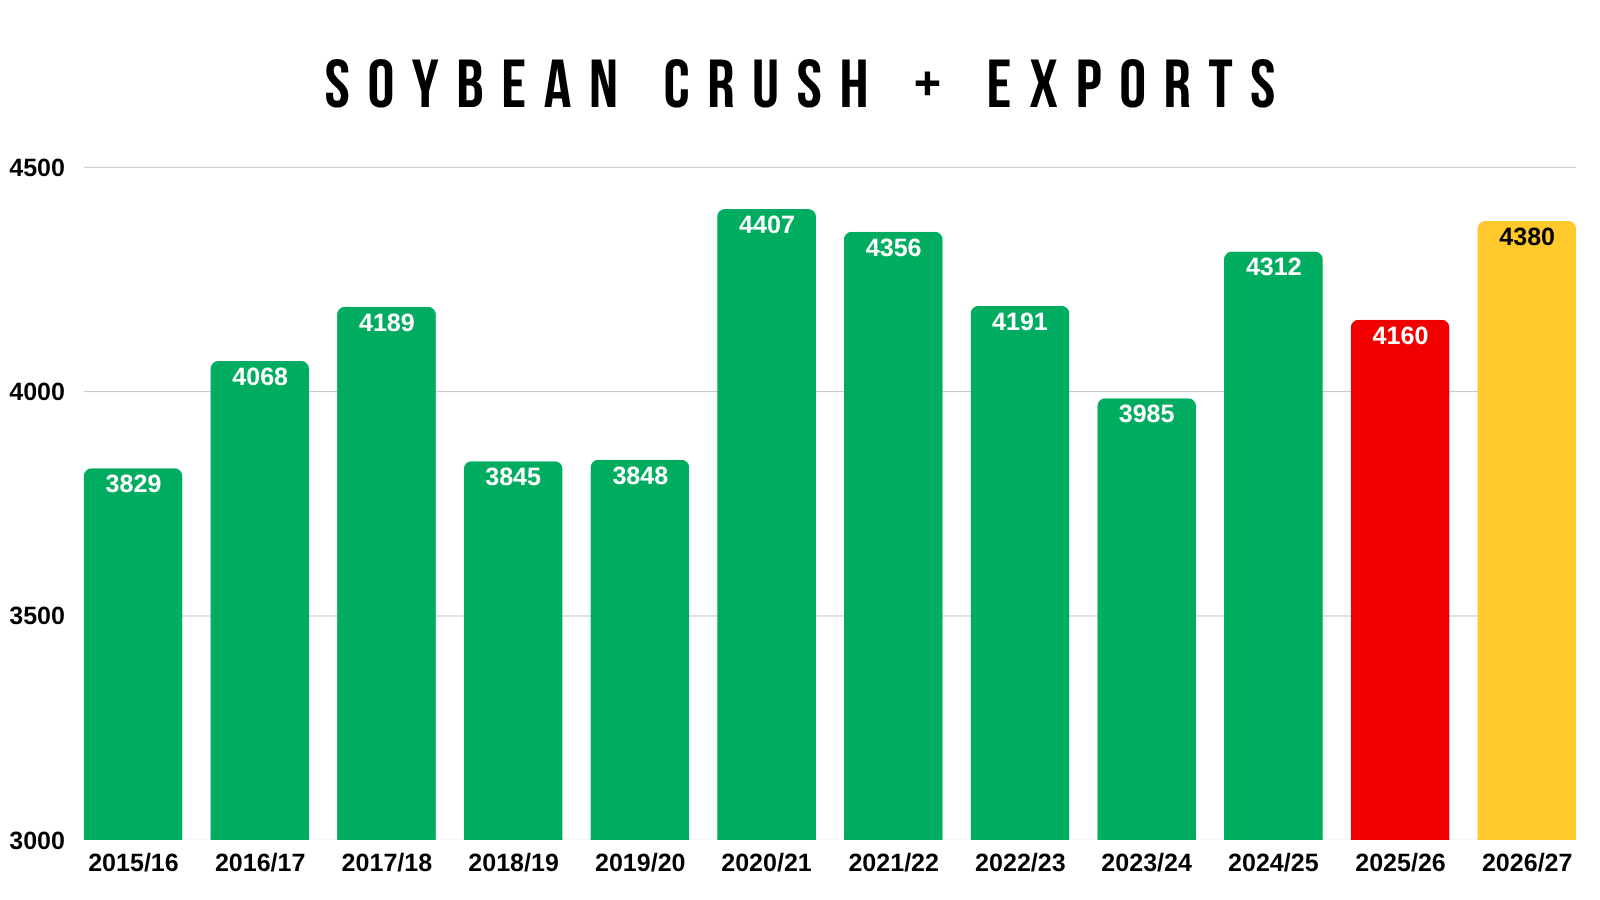
Exports still suck.
Old crop were some of the worst we've ever seen.
The USDA expects us to see a decent jump this year, by 100 million bushels.
At the same time crush demand remains phenomenal.
As it continues to ramp higher year after year.
As the USDA is expecting it to jump another 120 million bushels from last year's record.
Is the record crush demand offsetting the historically poor export demand?
To find out, here is a chart that combines crush demand and export demand.
Even though export demand is some of the worst ever, the combined demand is not due to the amazing crush demand.
If you notice, we are right on par with where we were in 2021 and 2022 when it comes to combined demand.
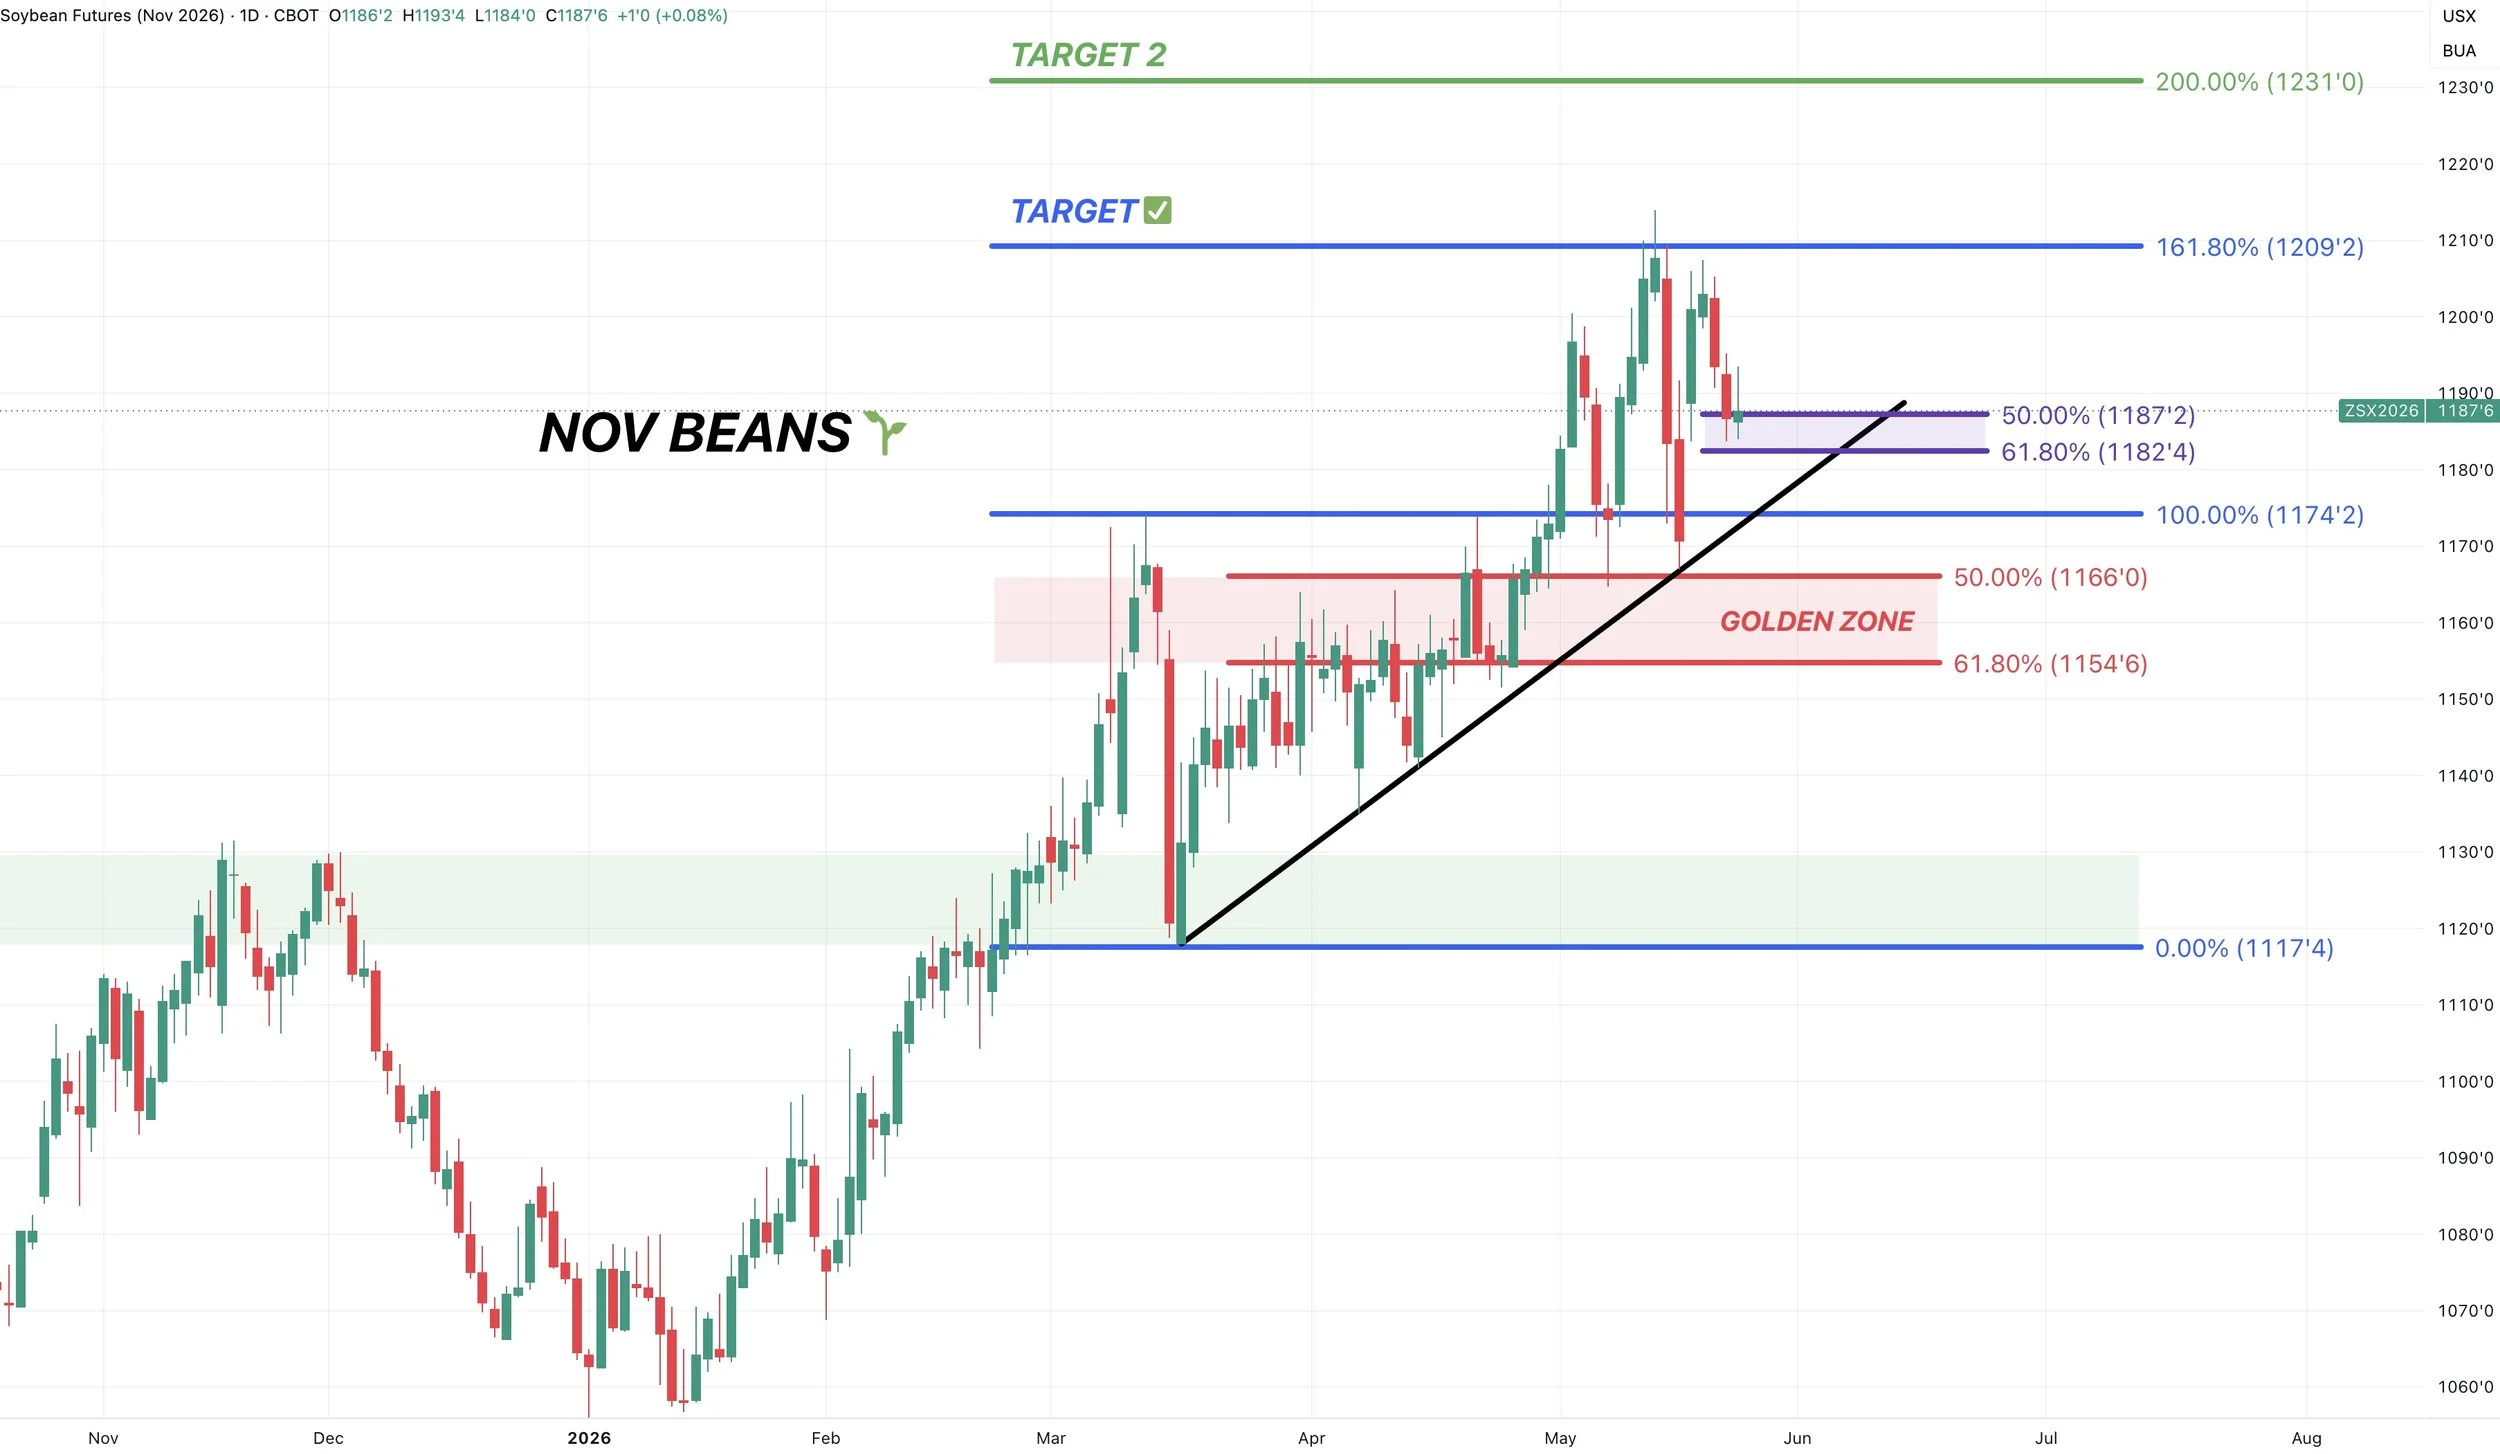
Nov Beans Chart:
Last week we flipped that March resistance into new support.
Now sitting at a key spot here short term.
Right in the golden zone down to last week's lows.
Also approaching some trendline support.
Ideally we hold this level or we could drop towards last week's lows and the red box. That red box would then be a big spot we'd want to hold.
We hit that $12.09 target last week. If we get another push higher, the secondary target is $12.30
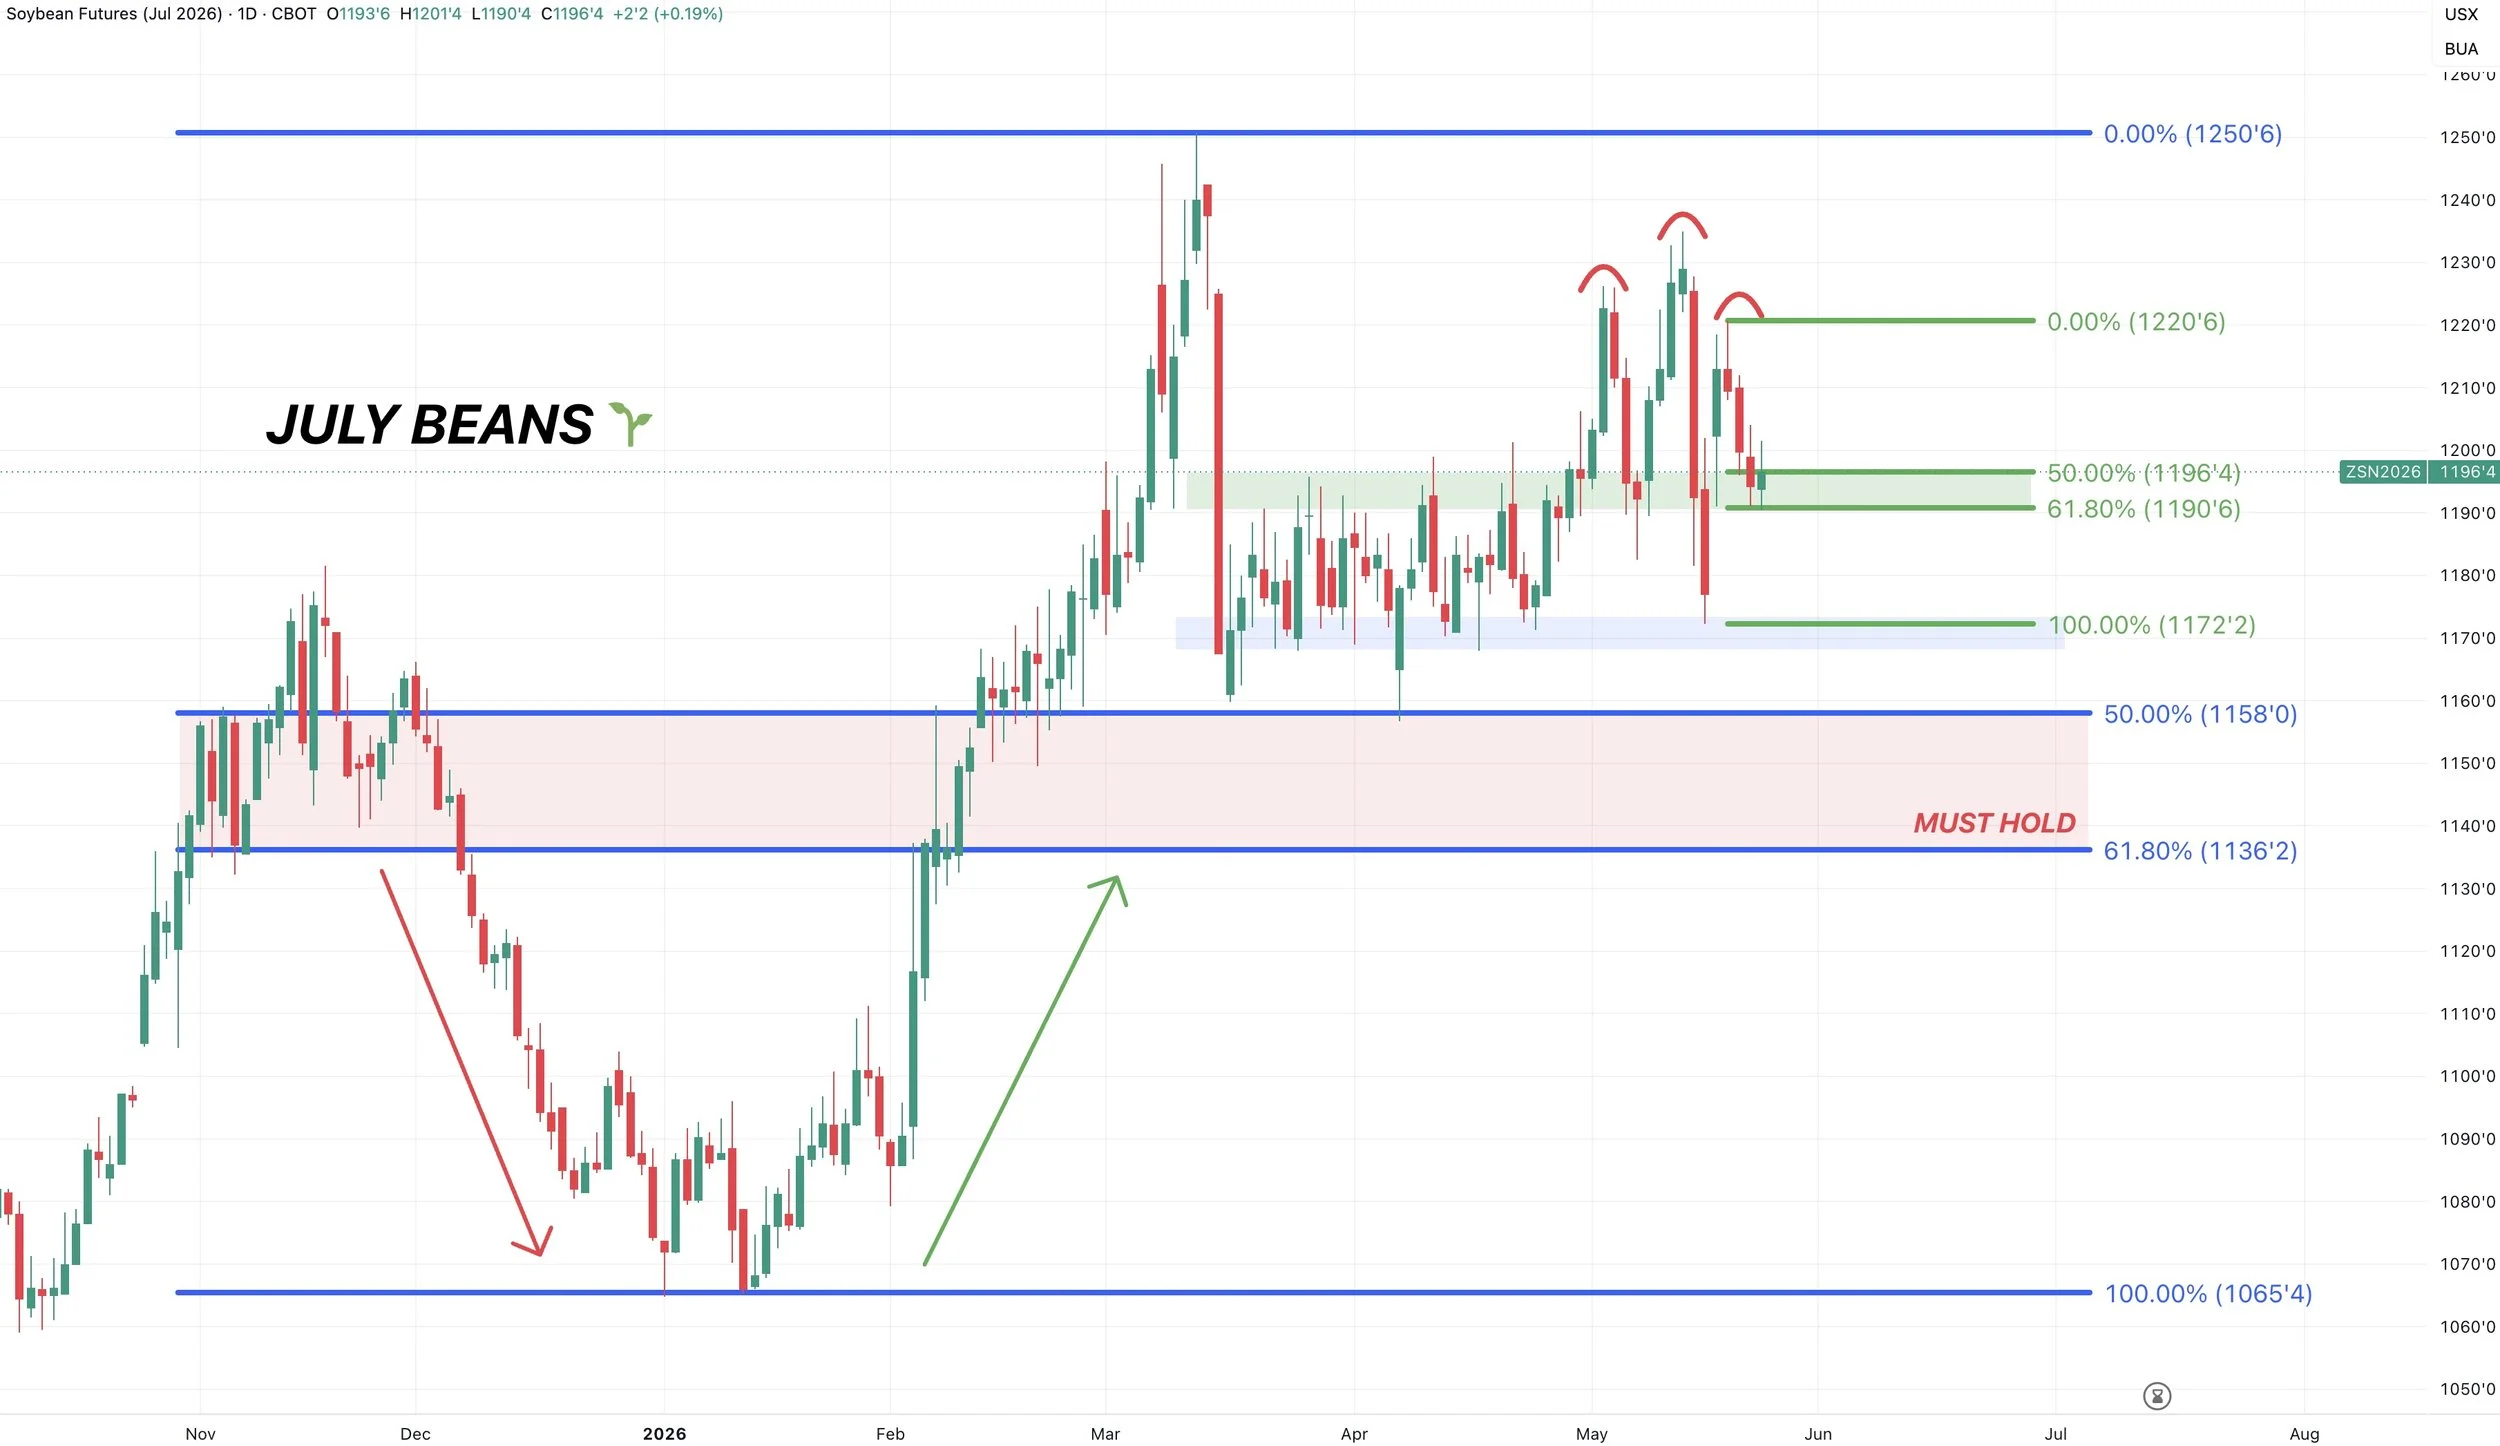
July Beans Chart:
Currently sitting in the golden zone down to last week's lows.
This same level was prior resistance from that old tight range.
Ideally we hold here, otherwise we probably make our way back towards the bottom of the old range.
We do have a potential head and shoulders pattern. It becomes invalid if we break above the shoulder.
The absolute line in the sand to keep the trend higher is $11.36
Fail that level and there is some massive air to the downside.
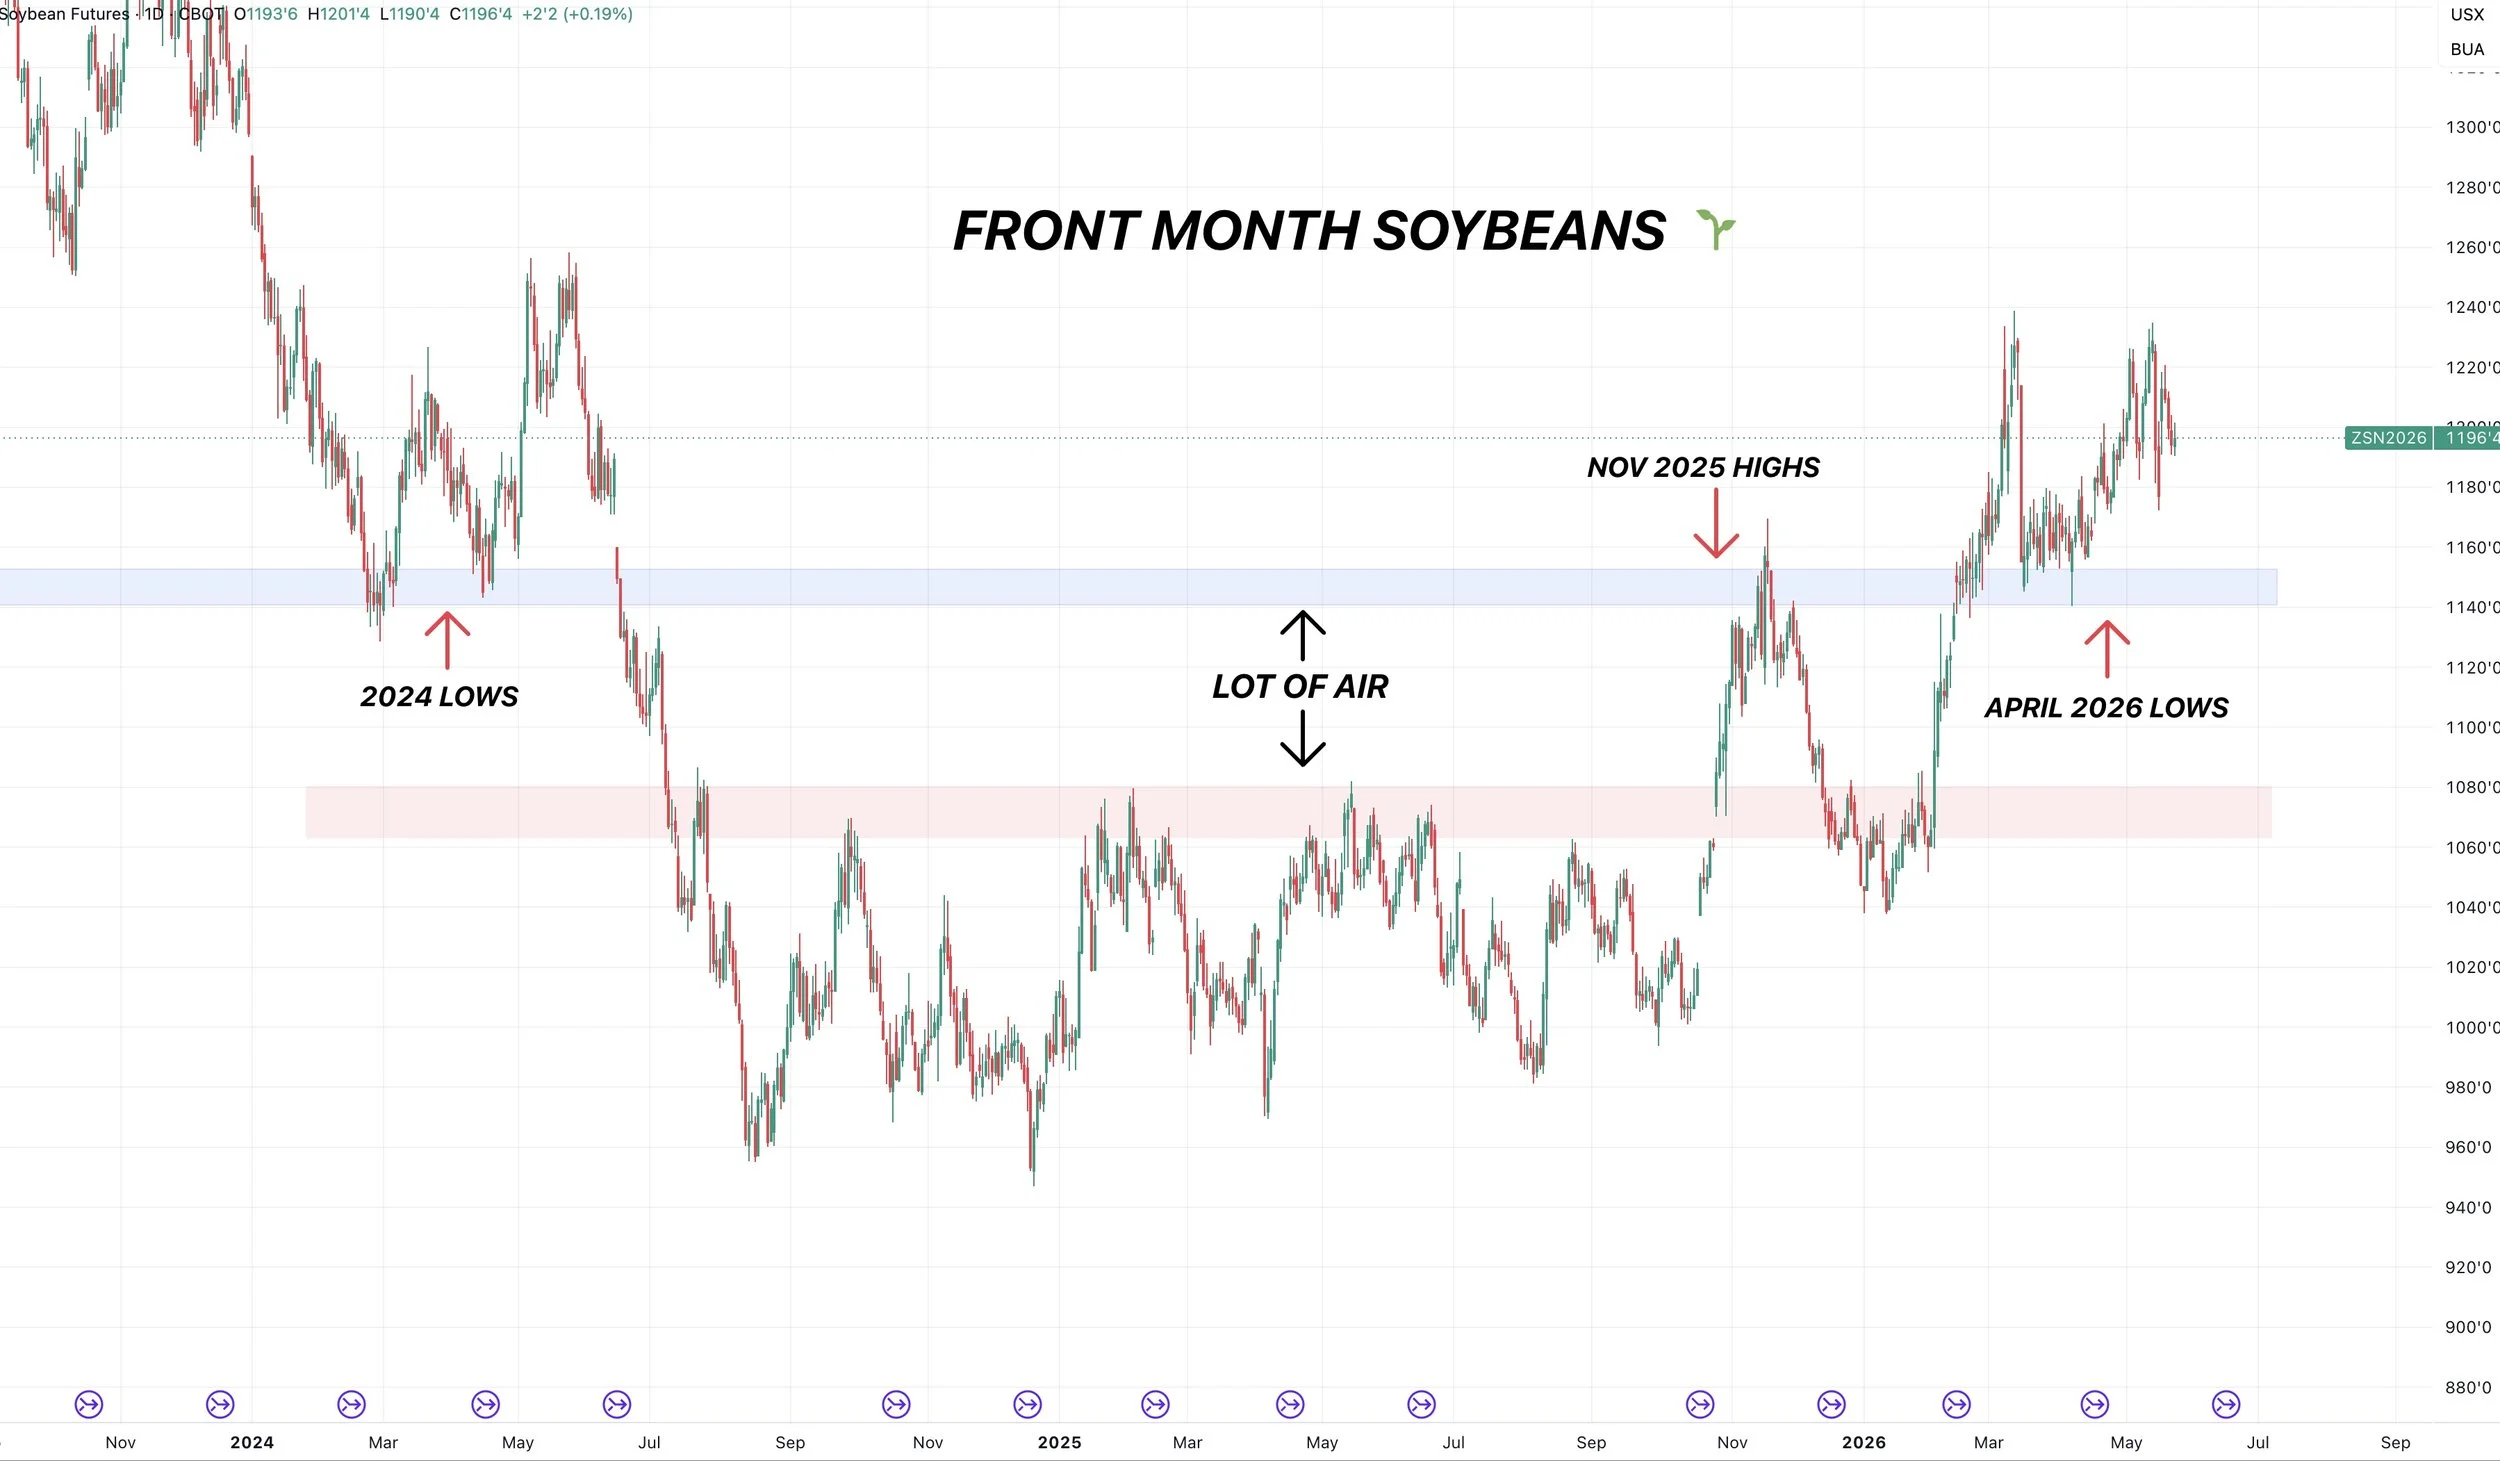
Big Picture Chart:
The same thought process with that must hold spot in July beans lines up here on the front month chart as well.
The overall long-term trend remains higher unless we break below $11.40 on the front month contract.
As there is some serious air below that level.
It was the lows twice in 2024.
It was our highs back in November.
It's right where we previously bottomed.
Wheat
You've got the worst winter wheat drought we've seen.
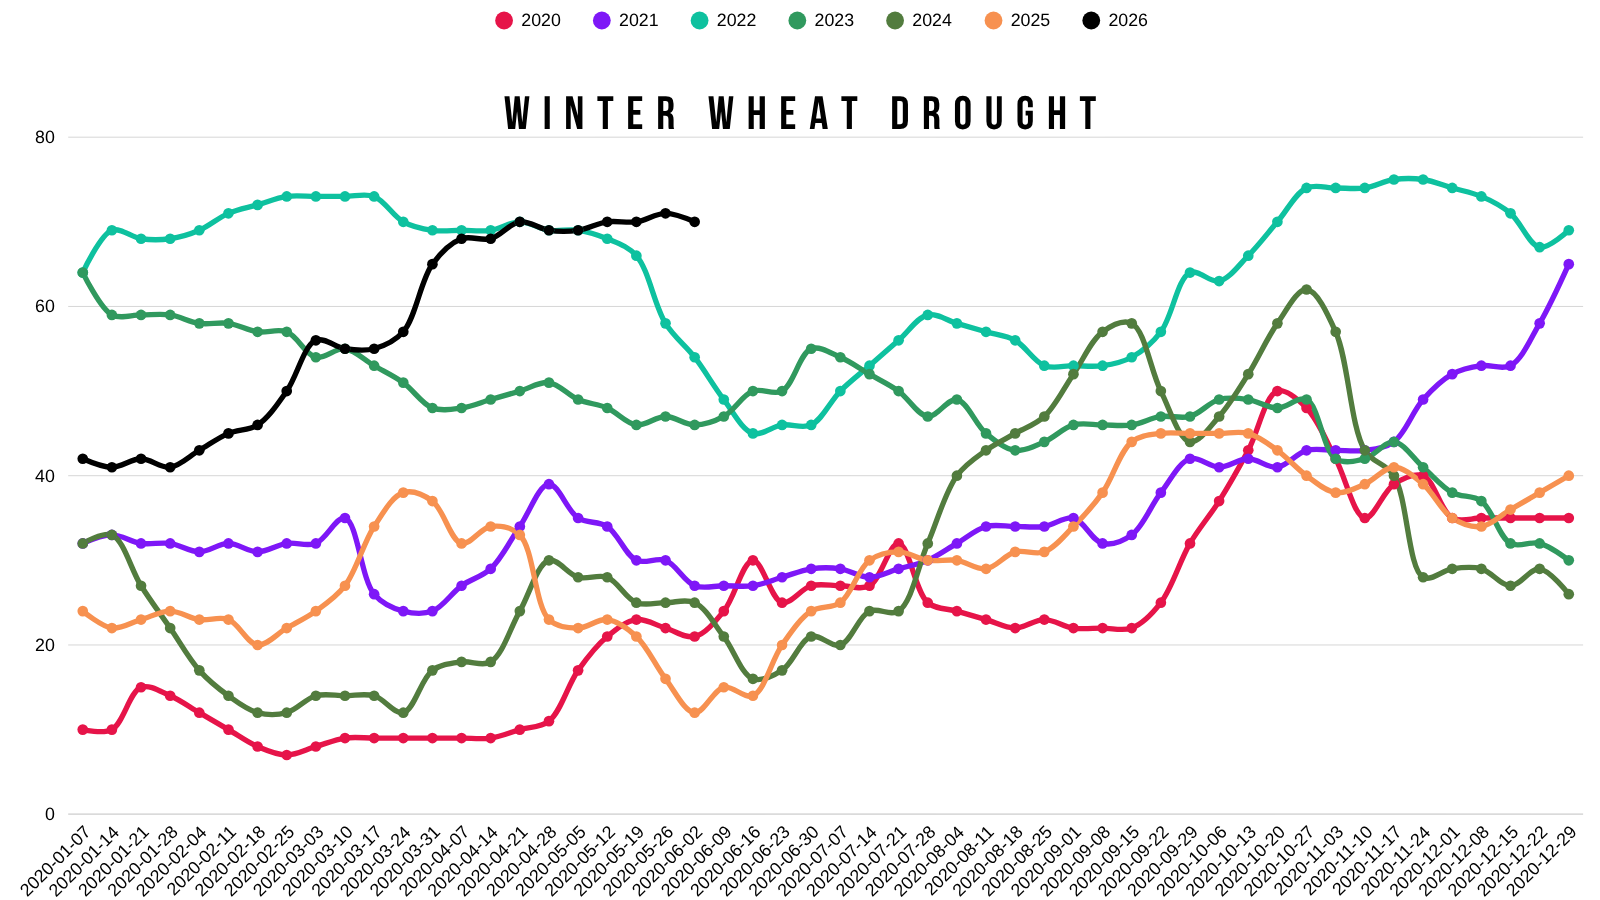
You've got the worst winter wheat crop on record.
With the smallest production pretty much of all-time.
At the same time, we are looking at record lows acres.
Plenty of bullish items.
However, most of this US winter wheat drought story has largely been priced in for now.
Unless the USDA comes out and says this crop is actually a lot worse than it's already thought to be, but the expectations are already set pretty low.
I mean there is a reason the wheat market rallied from $4.78 back in October, all the way up to $7.50 this year. We had war and drought.
At the same time, this is seasonally when the wheat market starts to see some weakness as we head into harvest.
So it shouldn’t come as a surprise if that's what we see happen.
Here is the 5-year seasonal pattern.
In this pattern, we top right about now, then that seasonal sell off lightens up in July.
Even though we could be in store for some short term weakness soon over the next month or two, I still think the wheat market has an on going story over the course of the next 6 months to year plus.
This fertilizer situation isn’t going to get fixed relatively soon, and it's going to be impacting countries everywhere given wheat is such a global crop. But that's a story that might take a while to fully effect the market.
So I definitely think wheat could be poised for some potential in 2027.
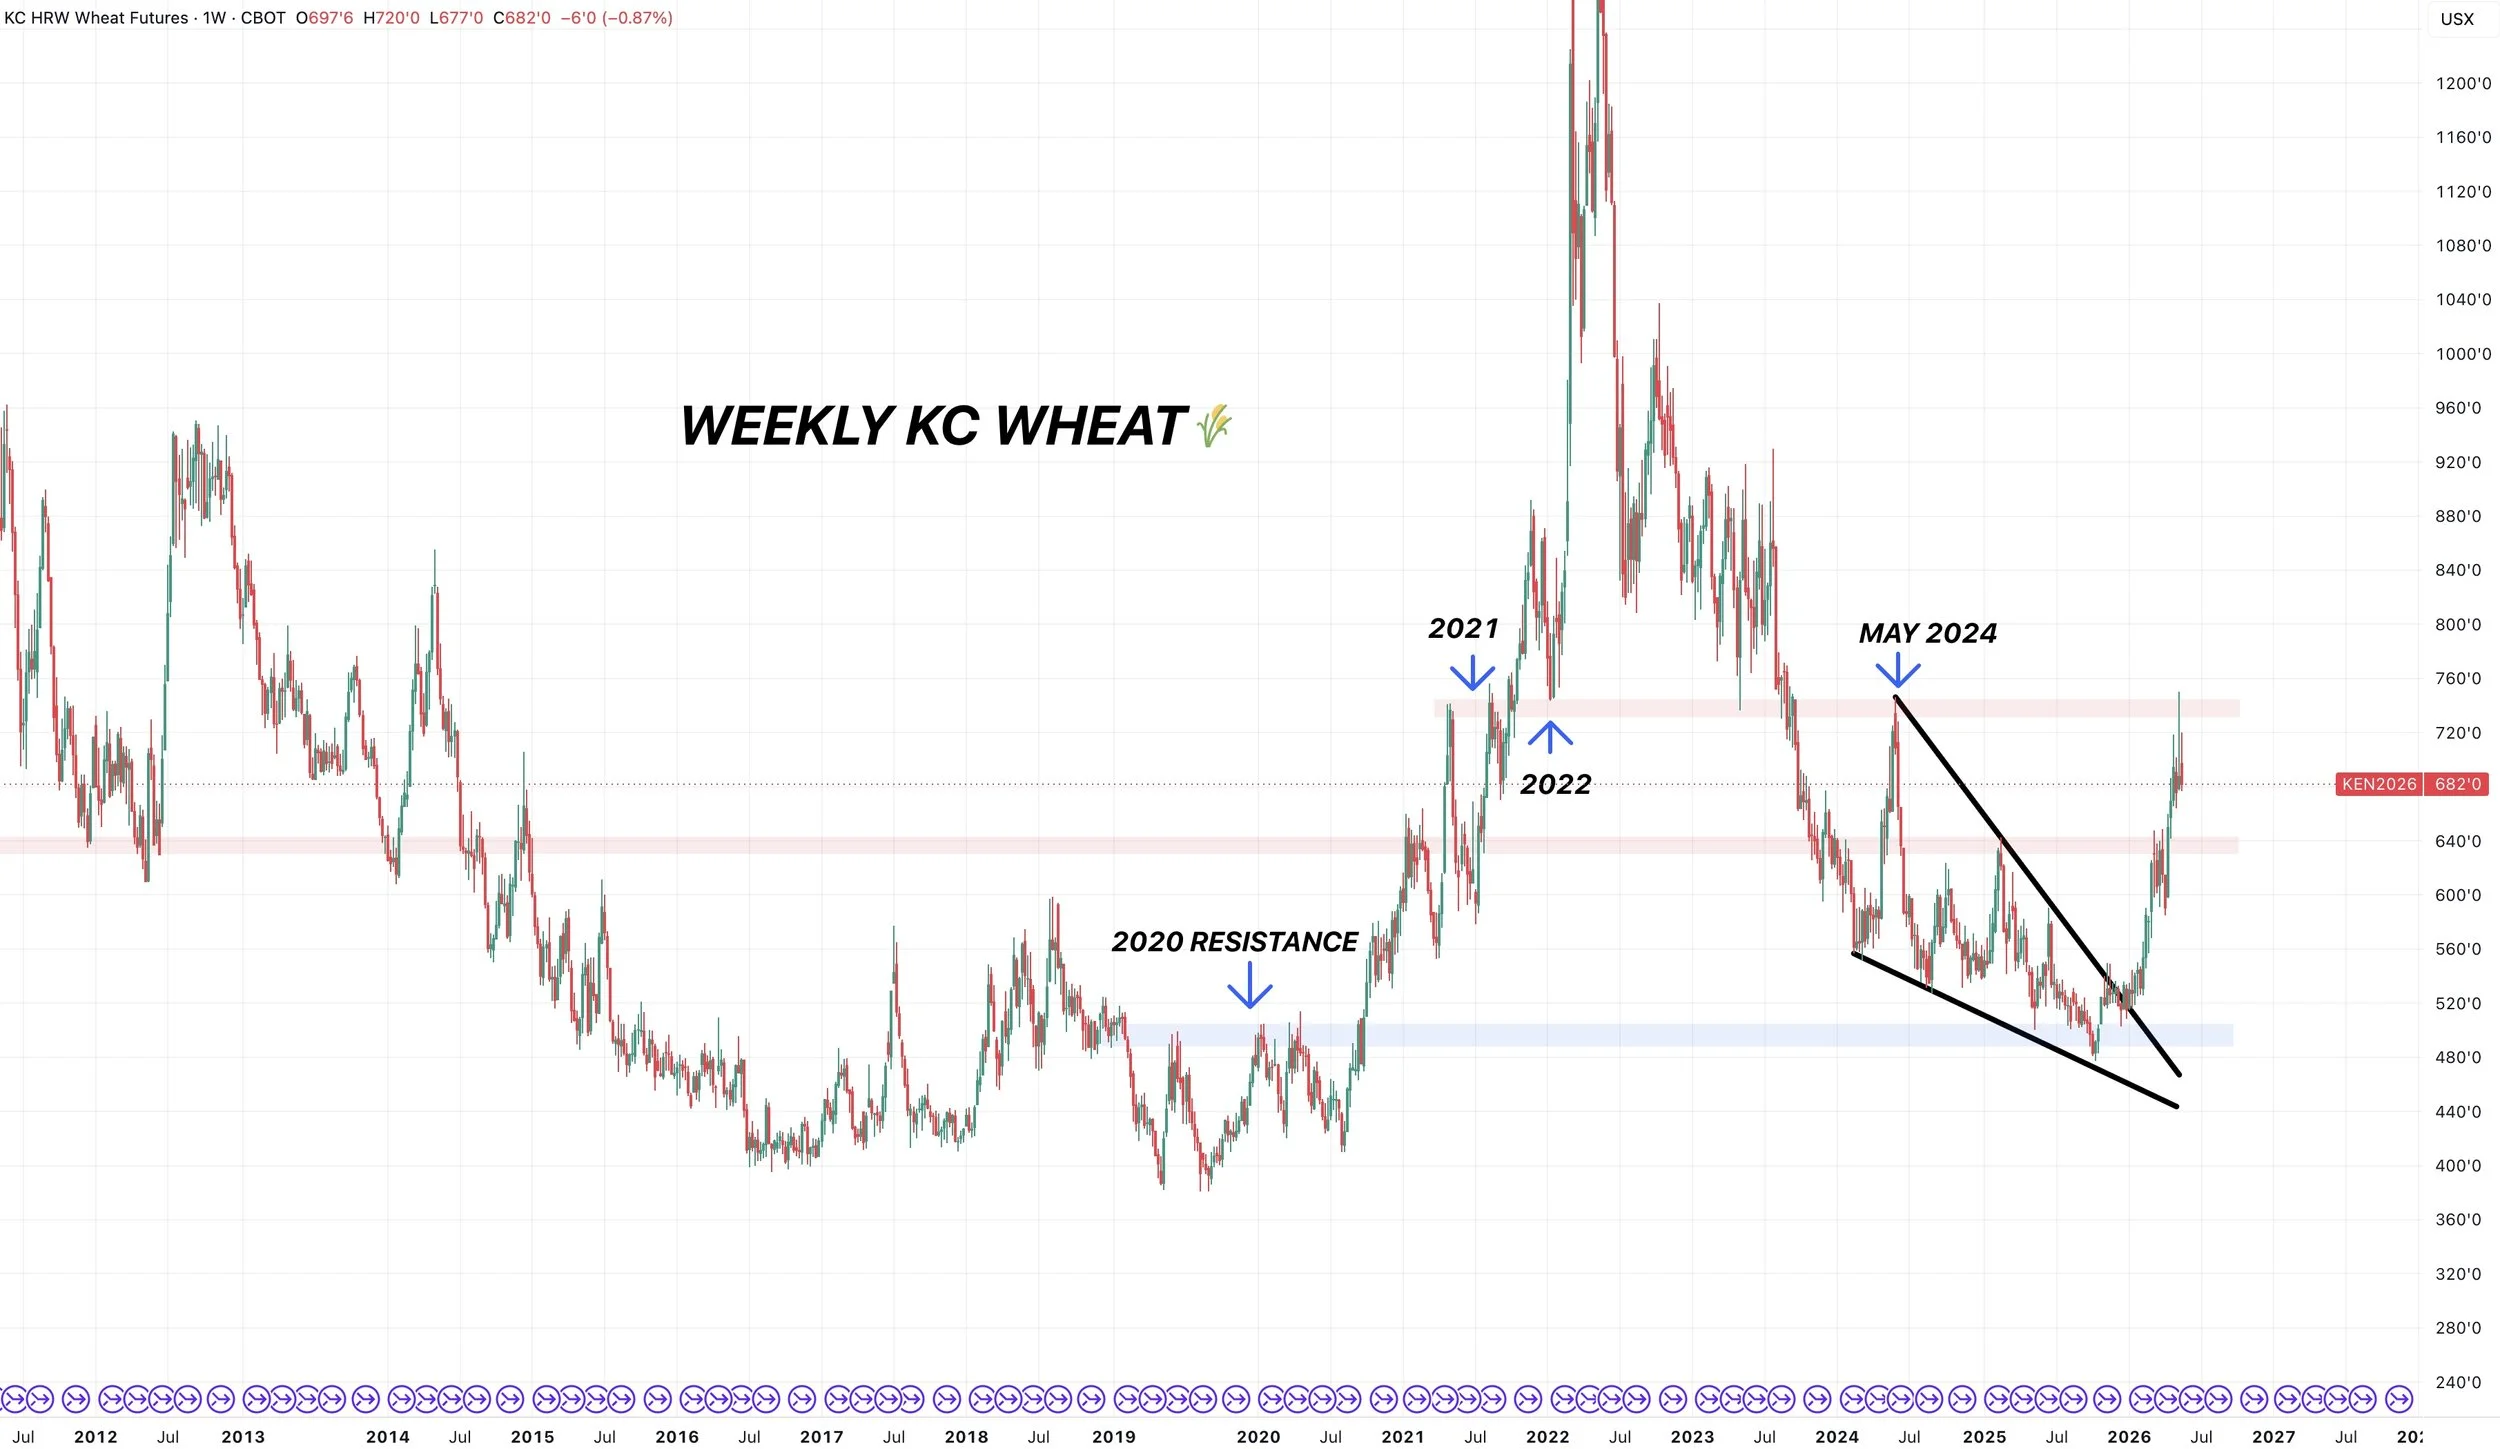
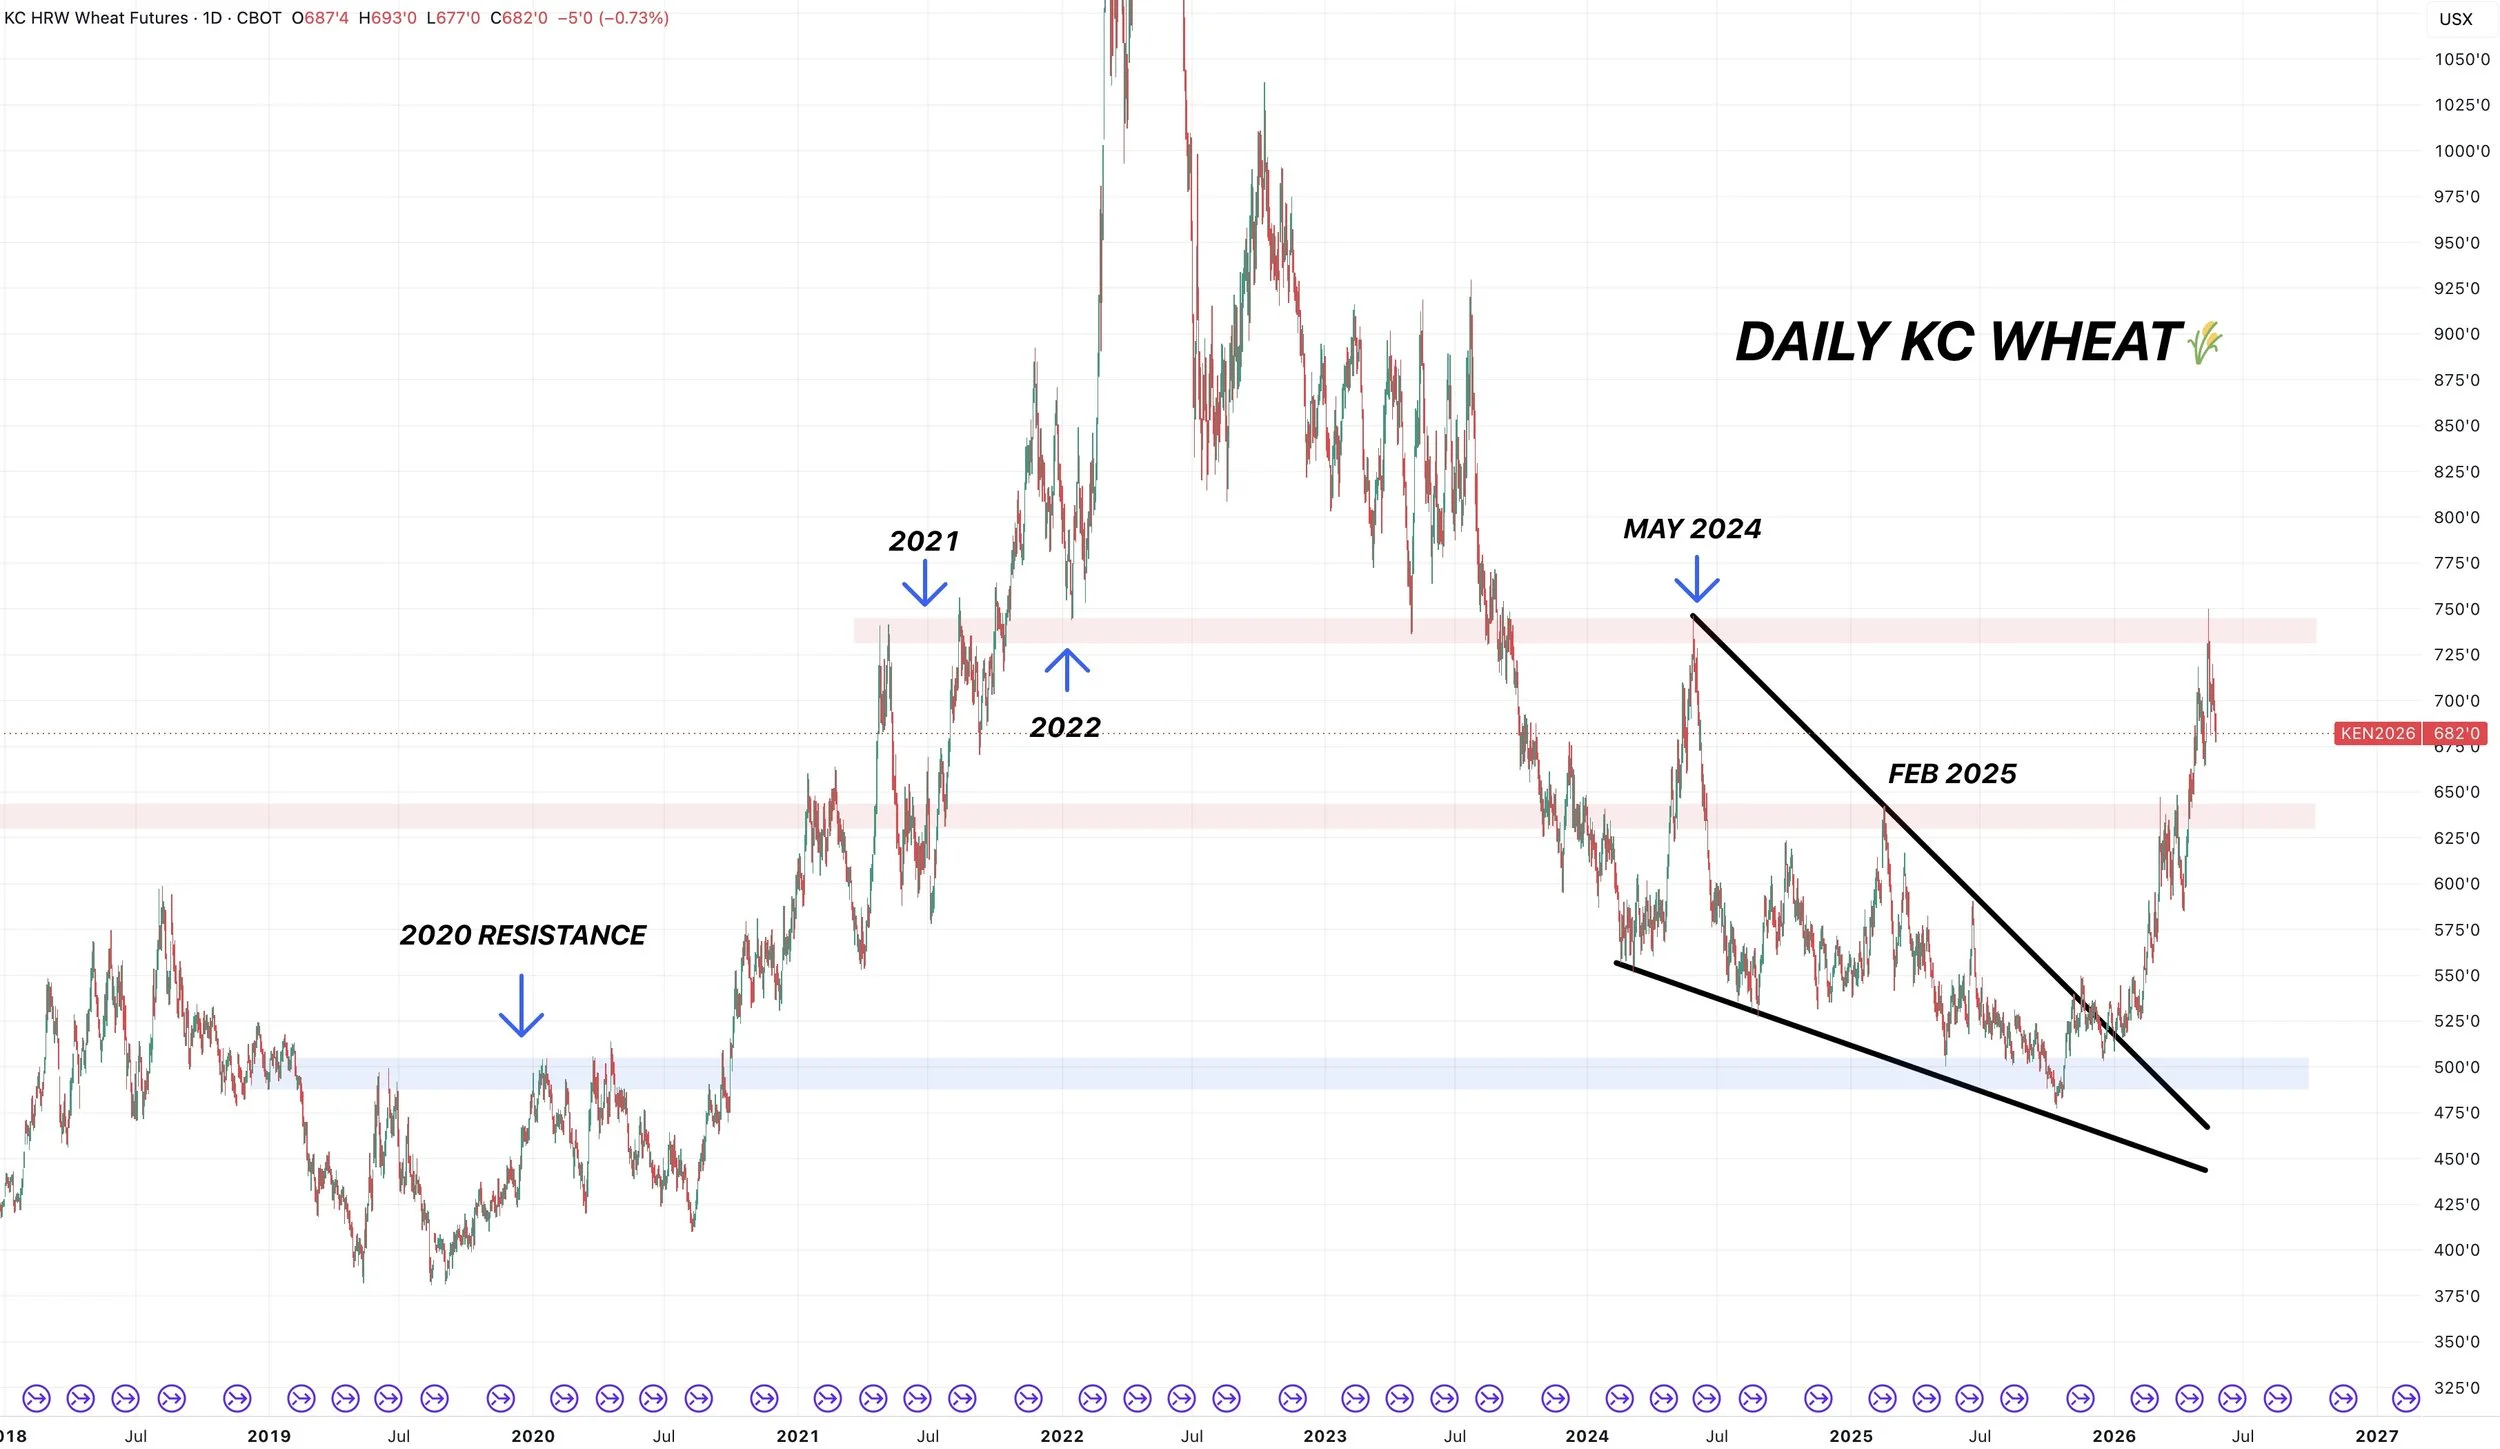
I mean take a look at the big picture chart.
We ran into some heavy resistance at that $7.50 target.
Afterall, it was major local highs or lows in 3 different years (2021, 2022, 2024).
But overall, you can’t convince me that this market hasn’t now put itself in a long-term uptrend.
Below is the weekly and daily view.
You could argue dropping down to that $6.30-40 level would be perfectly healthy for the long term trend.
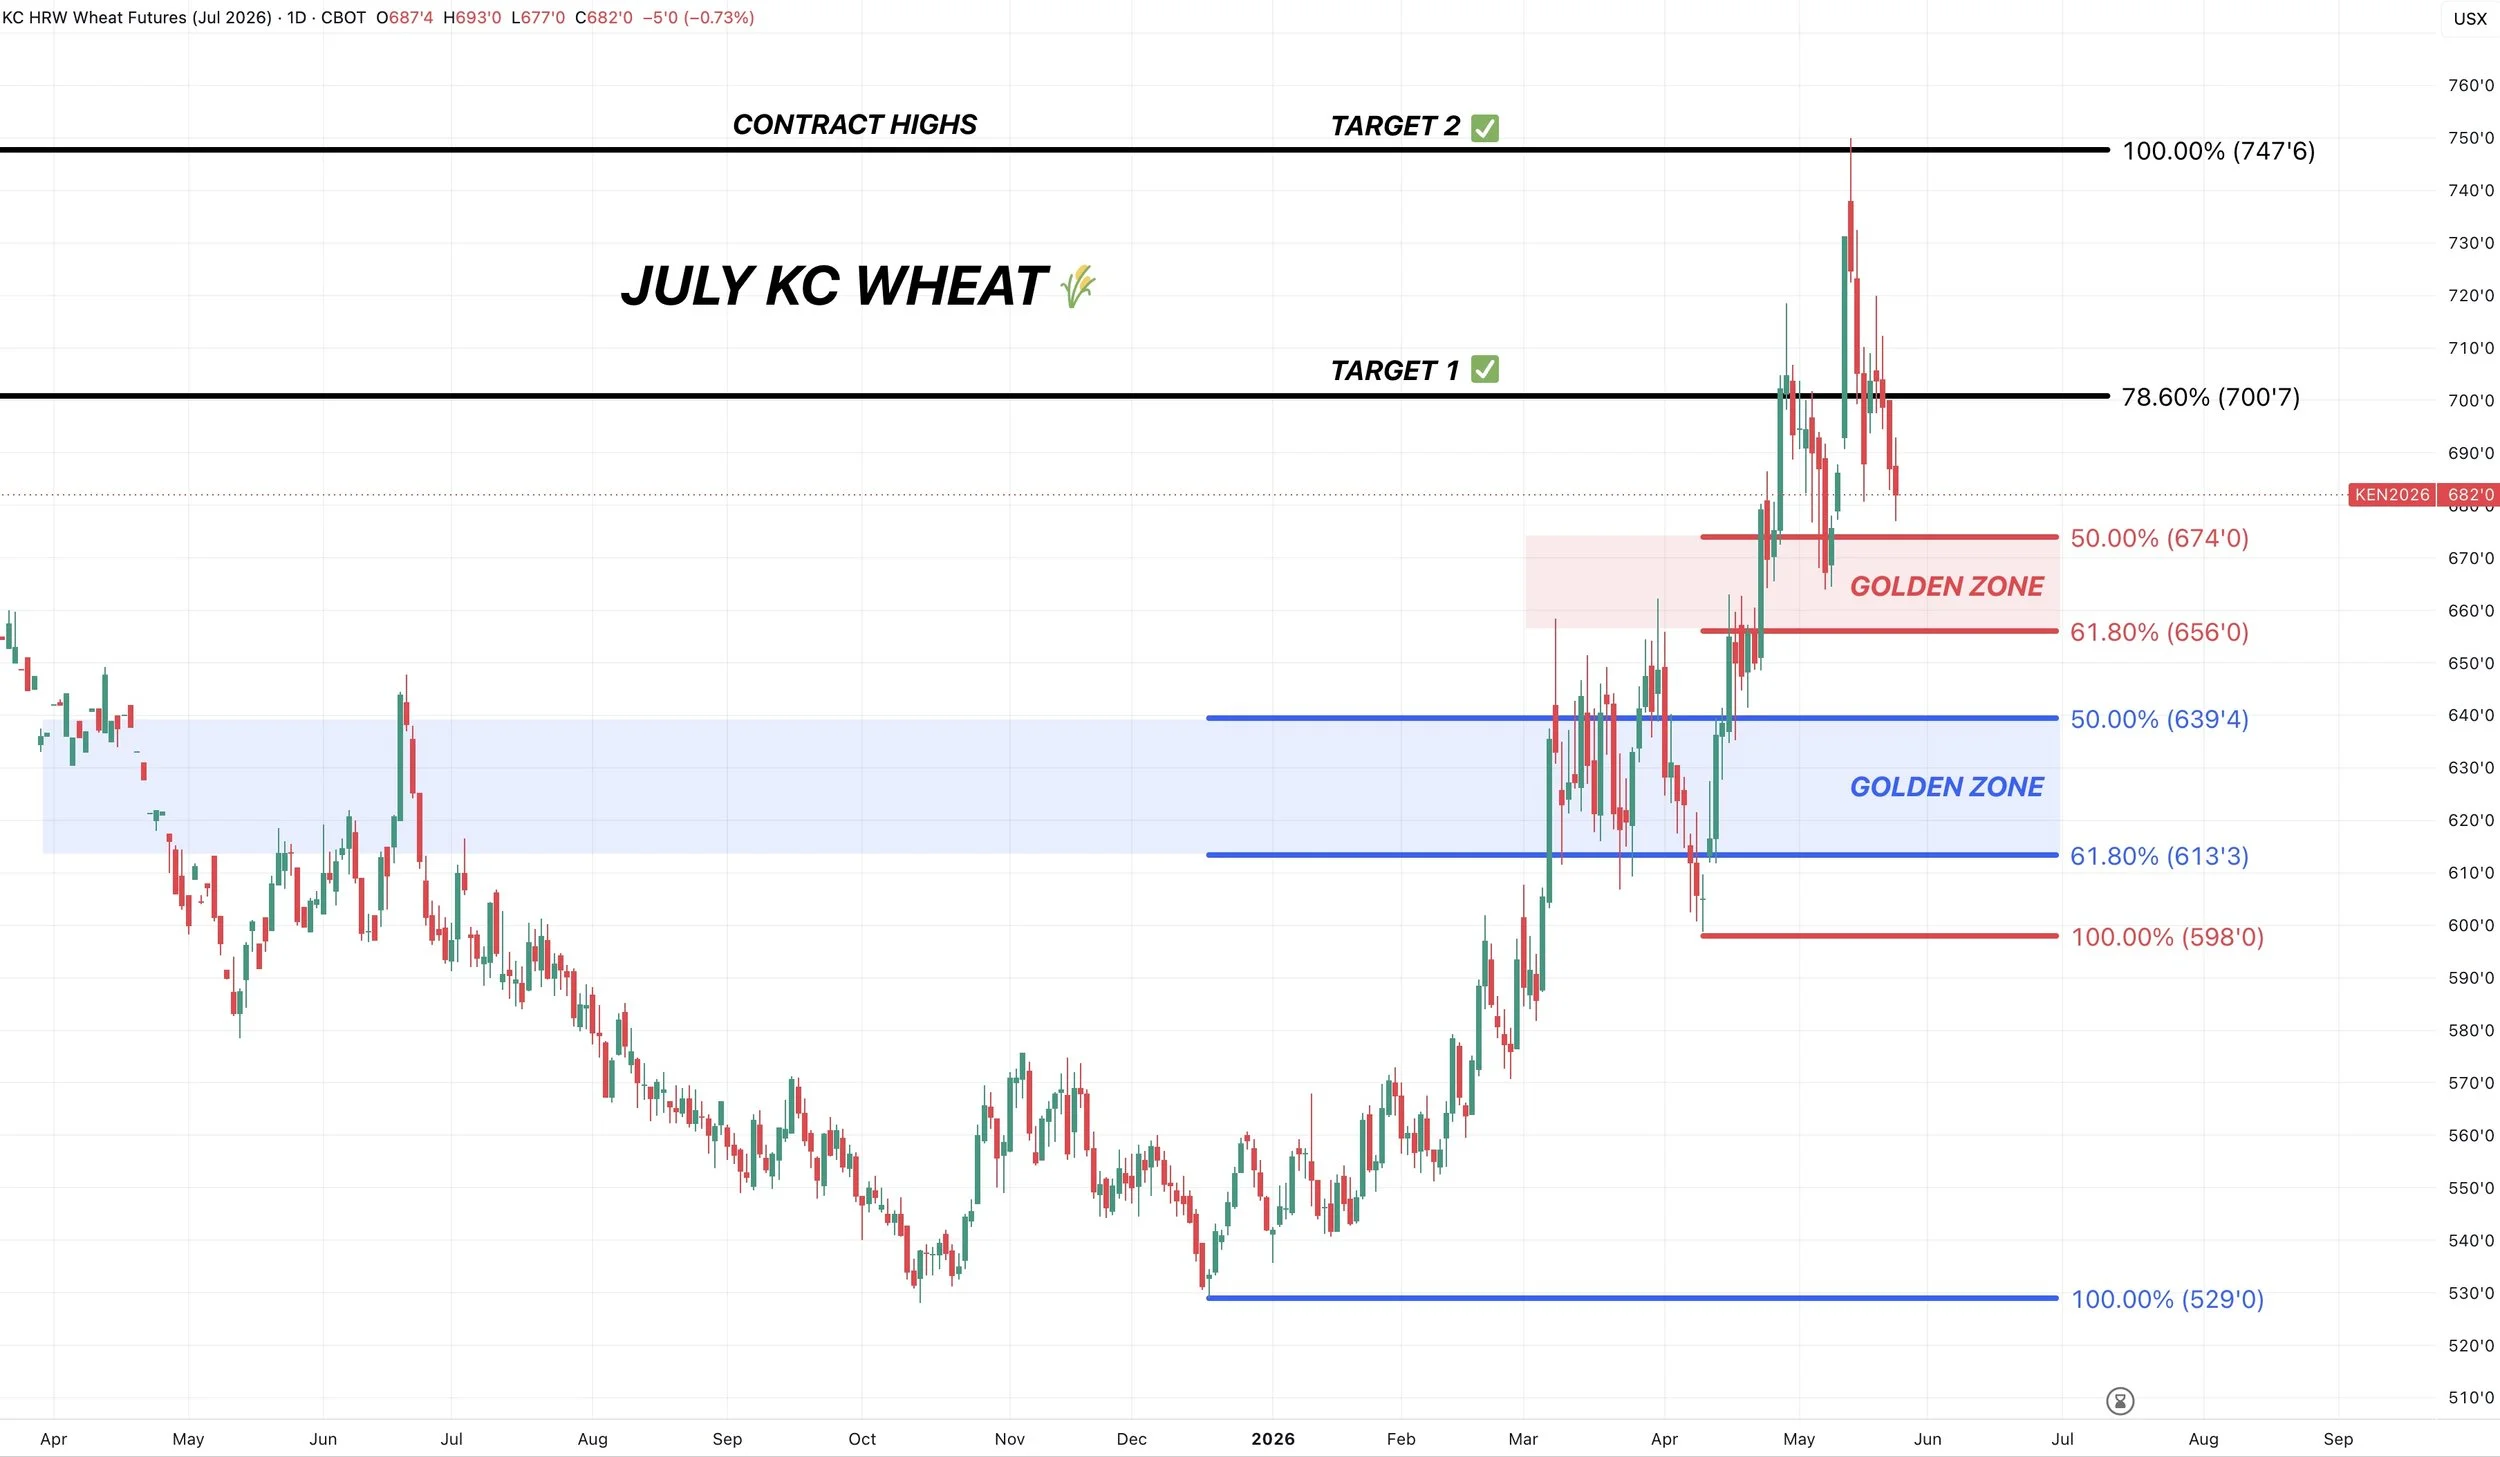
July KC Chart:
Getting close to some possible support.
As we are nearing the golden zone down to the April lows.
If we fail that level, we could make our way towards the major golden zone. Which is 50-61.8% of the entire rally from $5.29
So that 61.8% level at $6.13 is going to be the big picture must hold level to keep the trend higher.
I don’t personally think we go below that blue box. But I could see that being the area where we find some potential harvest lows if this was indeed the highs for now.
Cattle
Cattle hammered again today, altough we did close well off the lows after intially gapping open lower following yesterday's limit down move.
Why the weakness?
Well for starters, we continue to see Trump make comments about getting beef prices lower. The fear is seeing cheap imported beef coming into the market as there are rumors that the government is trying to get an order to temporarily get rid of the tariff rate quotas on beef imports.
There was also news about a Cargill in Colorado put 1,700 workers on lock out at it's beef processing plant.
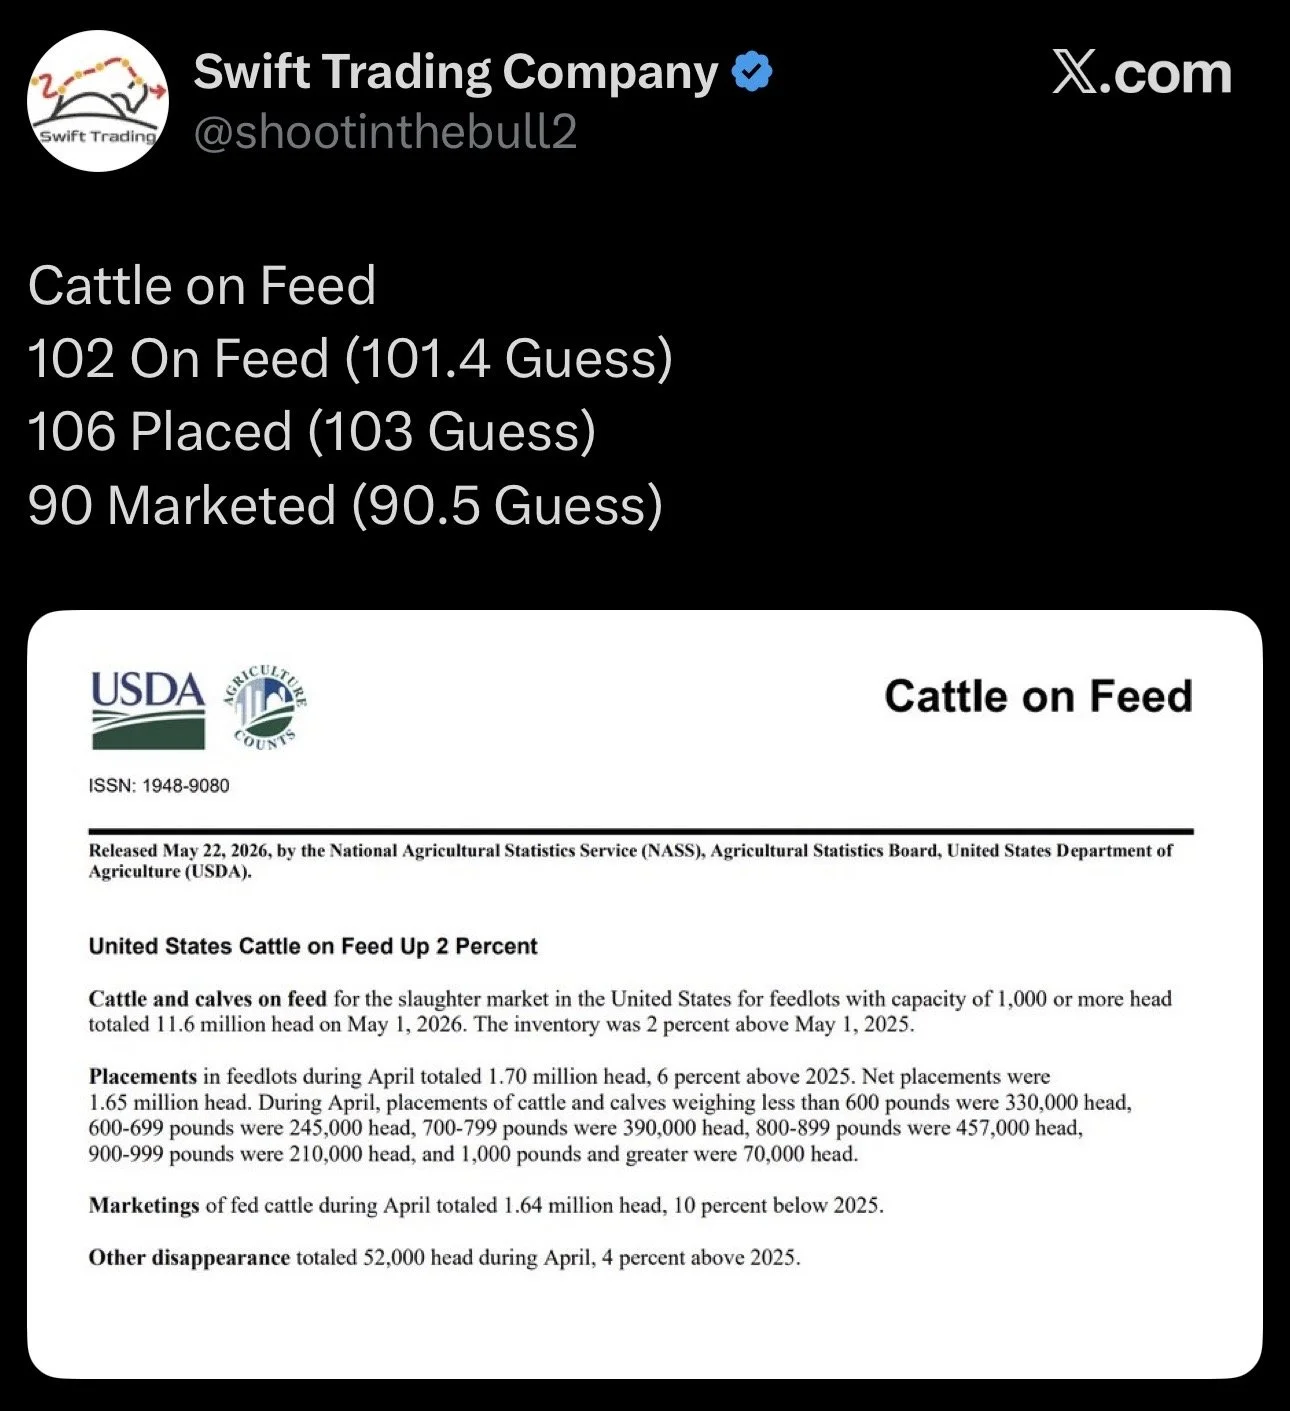
We then had the cattle on feed report out today.
All the estimates landed higher than the pre-report estimates.
Placements came in at 106% vs 103% trade estimate.
That 102% cattle on feed number marks the very first year over year inventory increase for cattle in 18 months. So that's viewed as pretty bearish.
However, the market was already expecting a bearish report.
That was all the talk yesterday, and was absolutely part of the reason for the sell off the last two days.
I'll touch on the charts here in a second, we broke some key support in feeders so we could see some further technical selling, but a lot of this report has already probably been priced in.
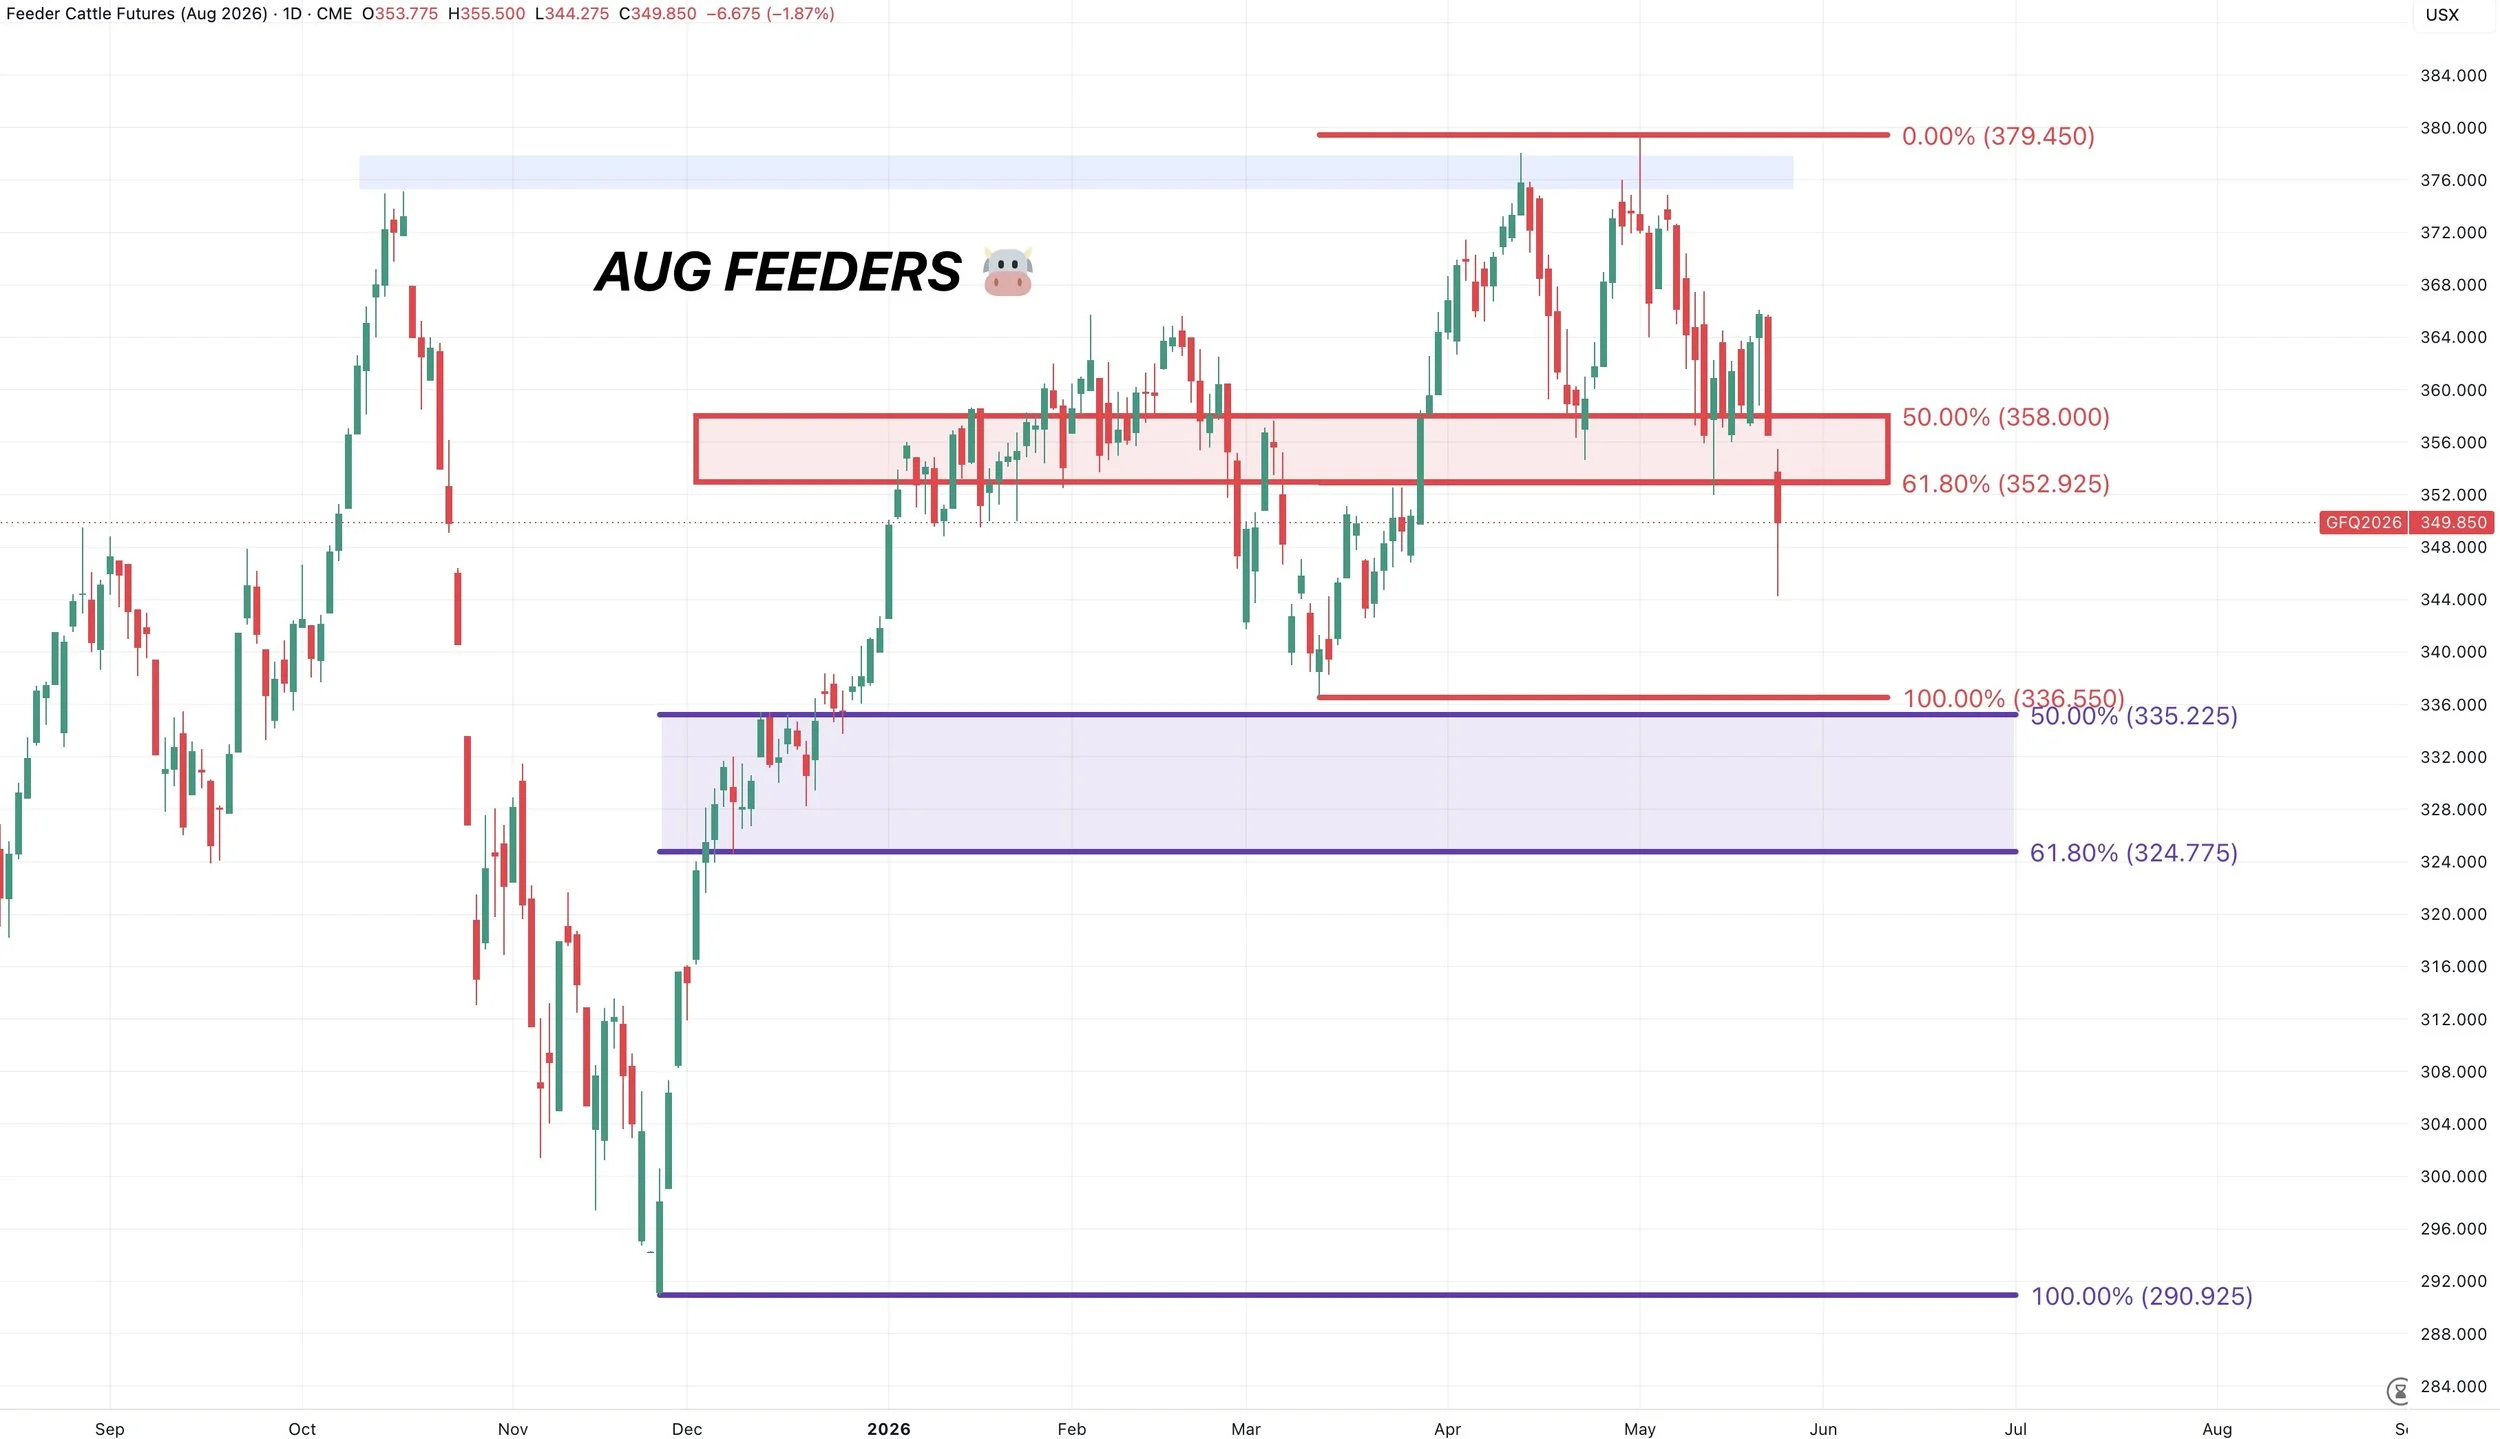
Aug Feeders Chart:
Feeders broke that key support we had been talking about, so seeing further downside from here wouldn’t be a surprise even though that report was largely priced the last few days.
This level gave back 61.8% of the highs down to the those March lows.
So it was viewed as a pretty important spot to hold that ended up failing.
If you take the highs all the way down to those lows from last year, the golden zone comes in at 325 to 335. So that could be a potential area of interest moving forward if we continue to see weakness.
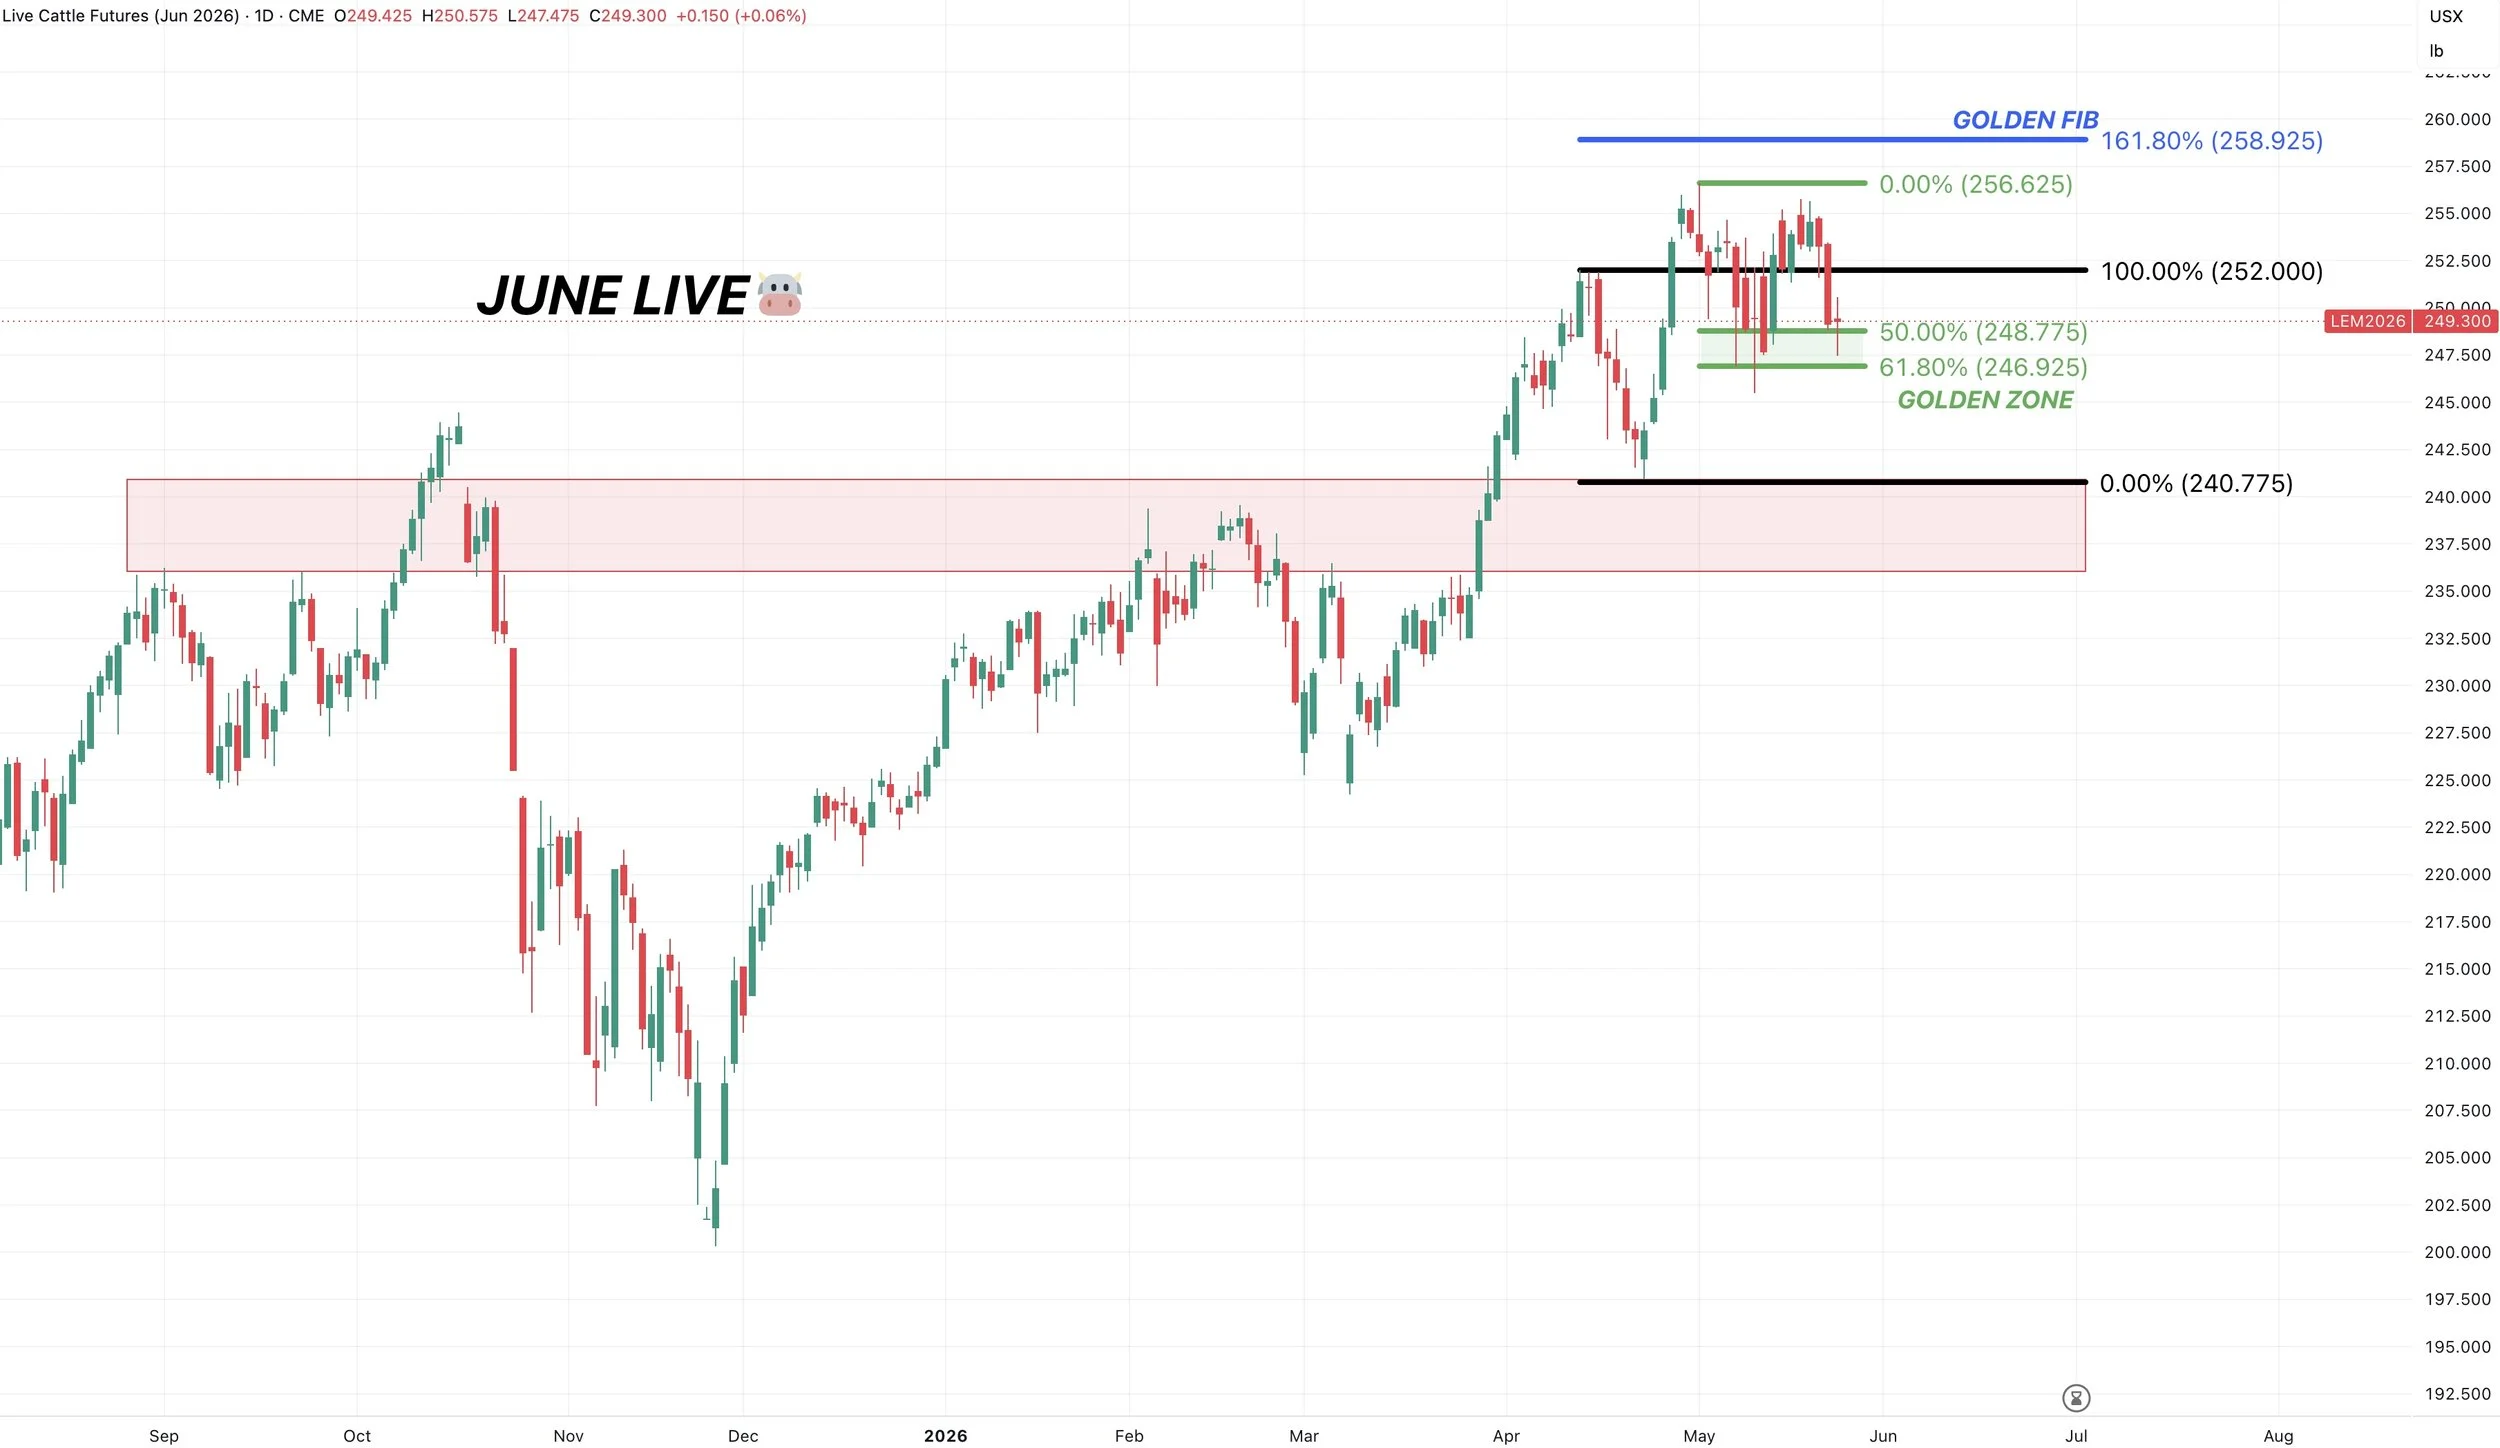
June Live Chart:
Live cattle on the other hand looks completely different on the charts.
We're still holding that intial golden zone support down to those April lows.
Failure to hold this level could result in us going to test the red box.
Want to Talk?
Our phones are open 24/7 for you guys if you ever need anything or want to discuss your operation.
Jeremey & Office: (806)484-1214
Sebastian: (605)280-1186
Email: sfrost@dailymarketminute.com
Hedge Account
Interested in a hedge account? Use the link below to set up an account or give us a call.
Recent Updates
May 21st - Audio Commentary
Market Says Show Me China
Click Here to View
May 20th - Market Update Video
Grains Follow Crude Lower
Click Here to View
May 19th - Audio Commentary
Grains Back Near Highs
Click Here to View
May 18th - Audio Commentary
China Deal Gets Teeth
Click Here to View
May 15th - Audio Commentary
China Commits but No Details
Click Here to View
May 13th - Audio Commentary
China Meeting Tonight
Click Here to View
May 12th - Market Update Video
USDA & Wheat Limit Up
Click Here to View
May 11th - Audio Commentary
All About Trump, China & USDA
Click Here to View
May 8th - Market Update Video
Grains Catch a Bid Where Needed
Click Here to View
May 7th - Audio Commentary
Grains Hold Critical Spots
Click Here to View
May 6th - Market Update Video
Grains Nearing Sink or Swim Levels
Recent Signals
May 13th, 2026: 🌱
Soybean sell signal & hedge alert.
CLICK HERE TO VIEW
April 28th, 2026: 🌾
KC wheat specific signal.
CLICK HERE TO VIEW
April 27th, 2026: 🌽
Corn catch up sell signal.
CLICK HERE TO VIEW
April 10th, 2026: 🌽
Corn buy signal.
CLICK HERE TO VIEW
March 19th, 2026: 🌱
New crop soybeans signal & hedge alert.
CLICK HERE TO VIEW
March 9th, 2026: 🌱
Soybeans signal & hedge alert. Sent via text.
CLICK HERE TO VIEW
March 6th, 2026: 🌽 🌾
Corn & wheat sell signal & hedge alert.
CLICK HERE TO VIEW
March 3rd, 2026: 🌽
Old crop & new crop corn sell signal & hedge alert.
CLICK HERE TO VIEW
Feb 26th, 2026: 🌱
Old crop & new crop beans sell signal & hedge alert.
CLICK HERE TO VIEW
Feb 19th, 2026: 🌾
KC wheat sell signal & hedge alert.
CLICK HERE TO VIEW
Feb 6th, 2026: 🌽 🌱
Old crop corn & soybean sell signal & hedge alert.
CLICK HERE TO VIEW
Feb 4th, 2026: 🌱
Soybean sell signal & hedge alert.
CLICK HERE TO VIEW
Nov 17th, 2025: 🌱
Soybean sell signal & hedge alert.