
GRAINS FOLLOW CRUDE LOWER
MARKET UPDATE
I apologize for getting this out late as we had some technical issues with the video today*
You can scroll to read the usual update as well. As the written version is the exact same as the video.
Timestamps for video:
Overview: 0:00min
Corn: 4:55min
Beans: 10:20min
Wheat: 14:10min
Cattle: 17:20min
Want to talk?
Office: (806)484-1214
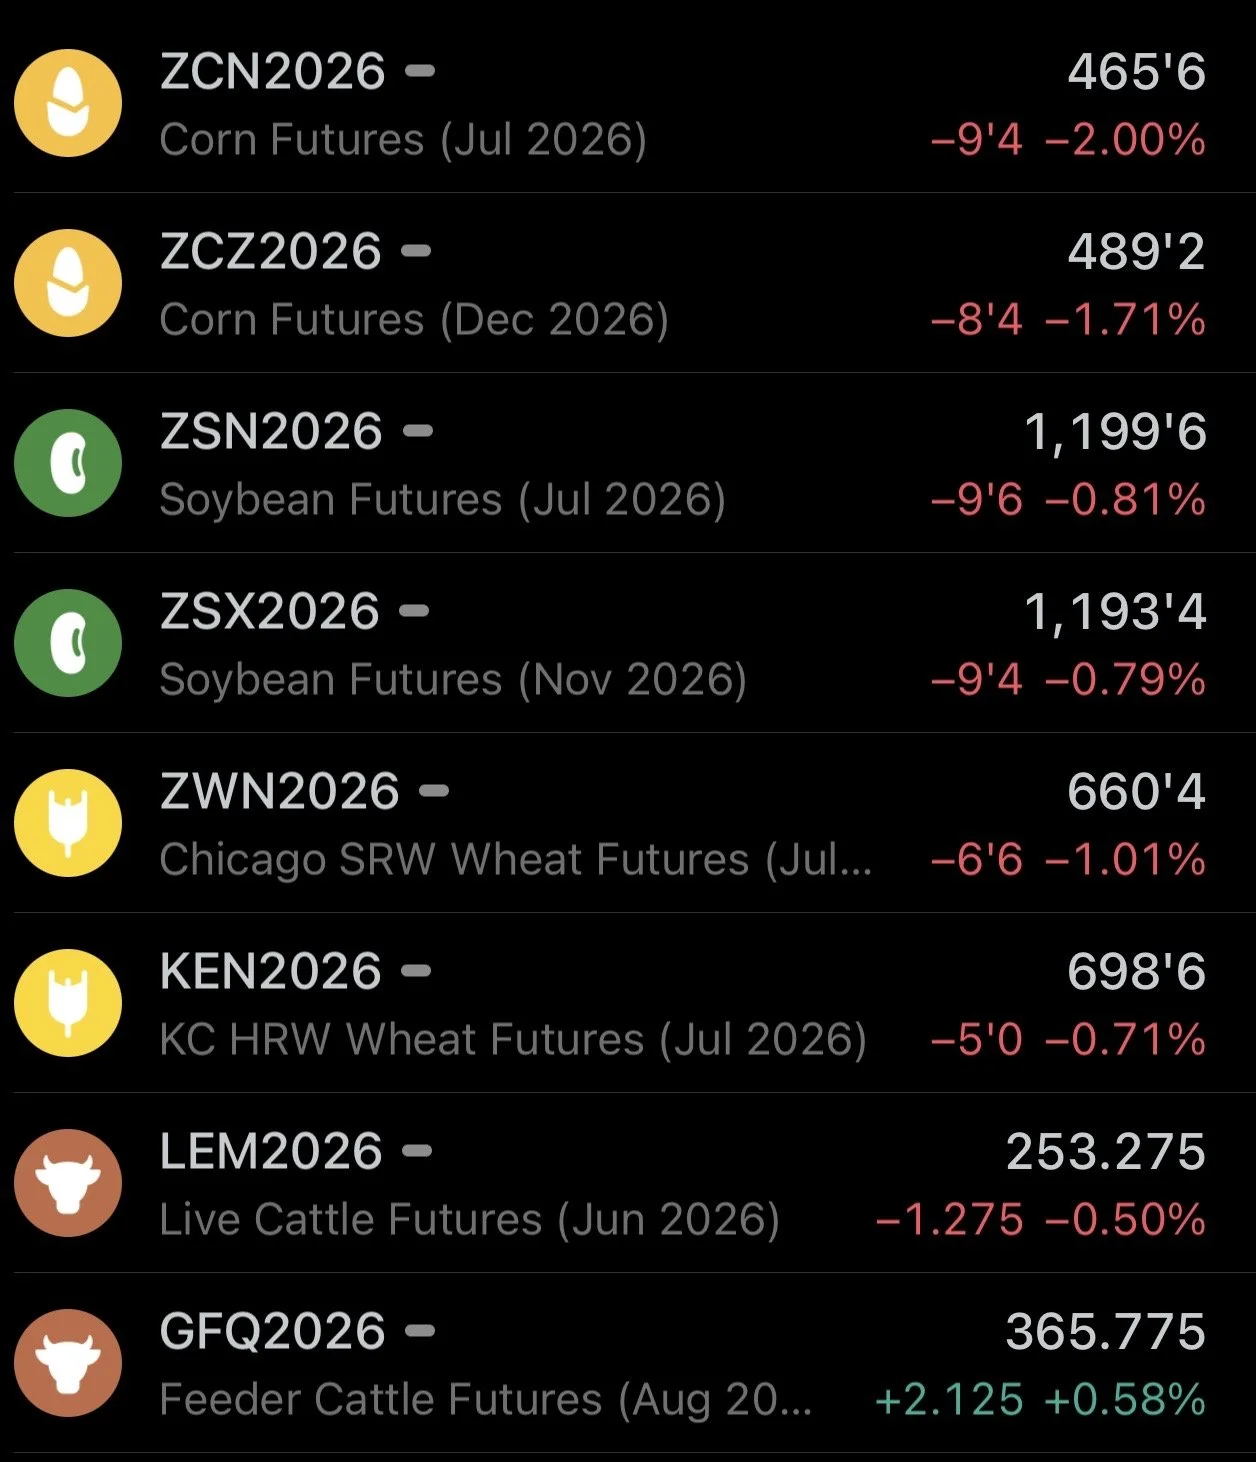
Futures Prices Close
Overview
Grains and cattle hit hard across the board, with corn actually leading the way lower.
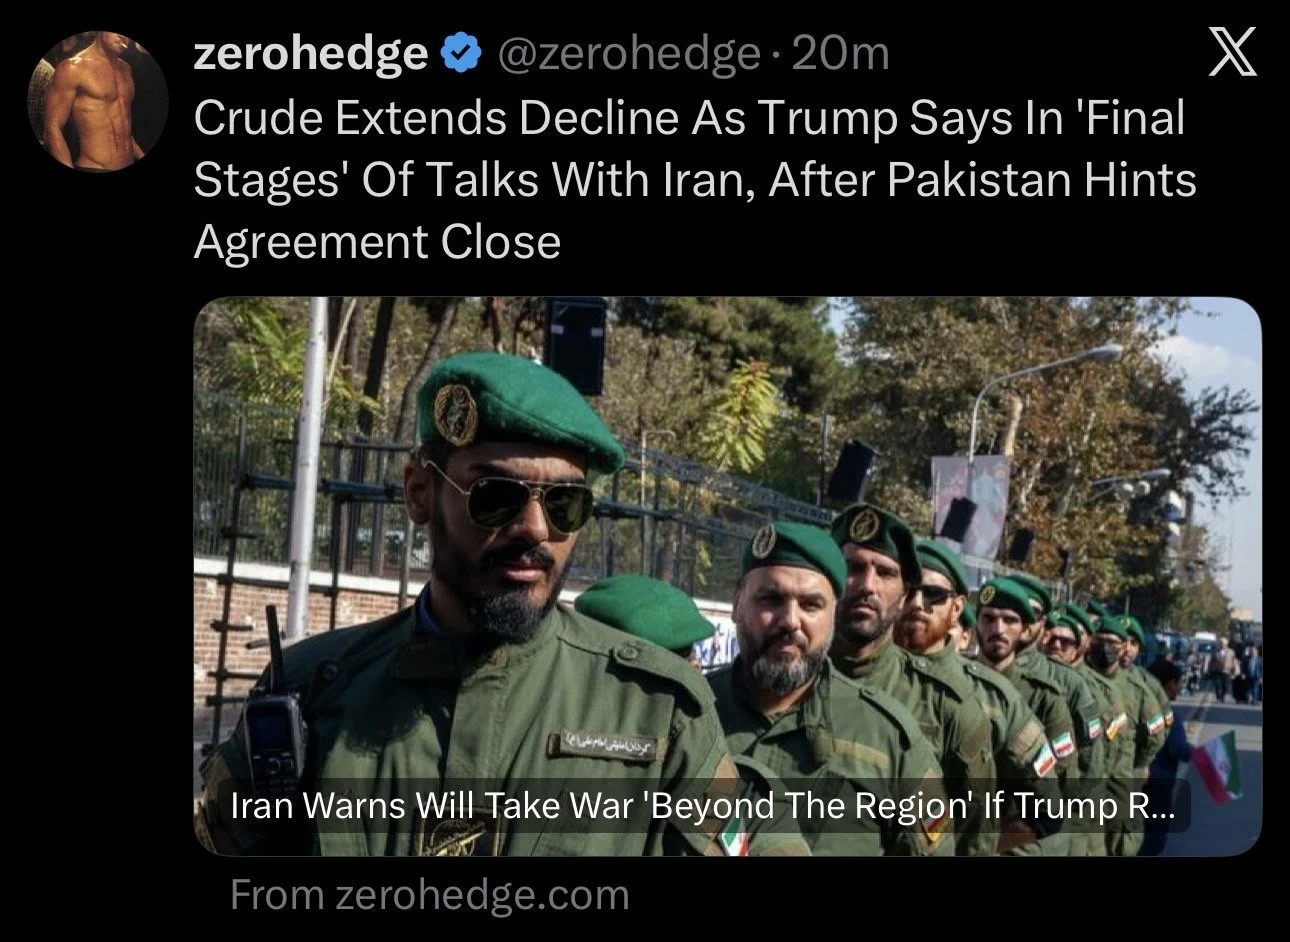
We followed crude oil lower, as it was down over $5 a barrel today, trading back under $100.
This was due to some war headlines. As Trump said that we are in the final stages of talks with Iran after Pakistan hinted that an agreement was close.
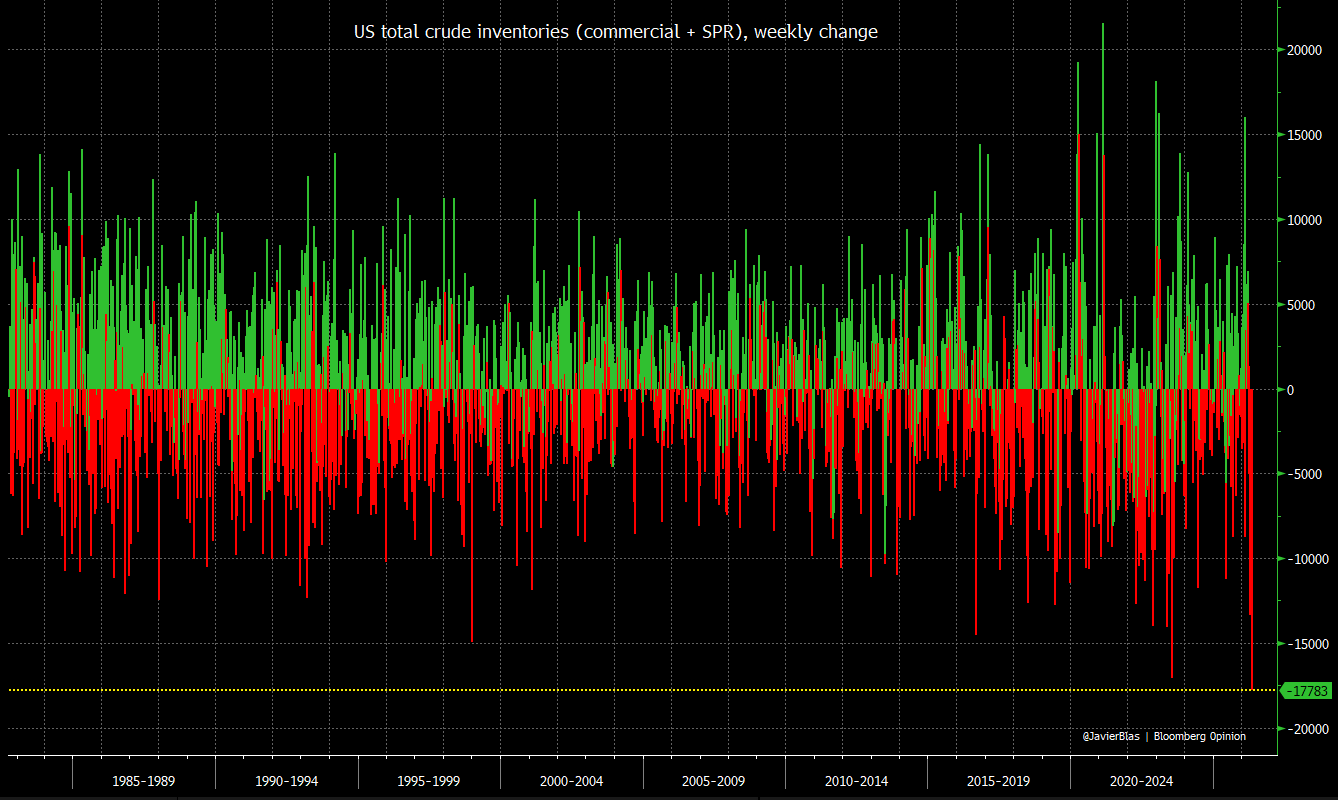
The even bigger deal was the inventory draws.
Today we saw the biggest weekly crude draw in history.
Crude Draw
Expected: -2.5 million barrels
Actual: -7.86 million barrels
Basically the government is draining the reserves to try and keep a lid on crude oil prices.
Since global supplies are tight, the government is dumping barrels into the physical market.
China Deal
Jeremey touched on this the last two days, but I wanted to jump further into the entire agreement and give you some visuals and details as to what it could possibly mean.
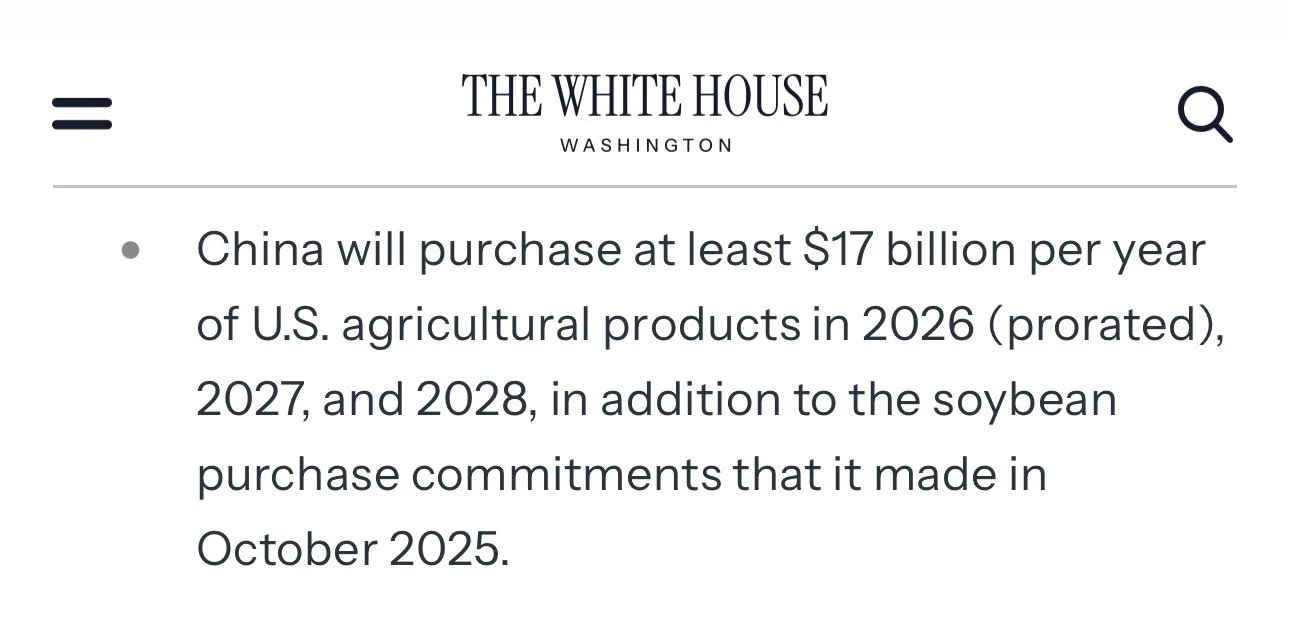
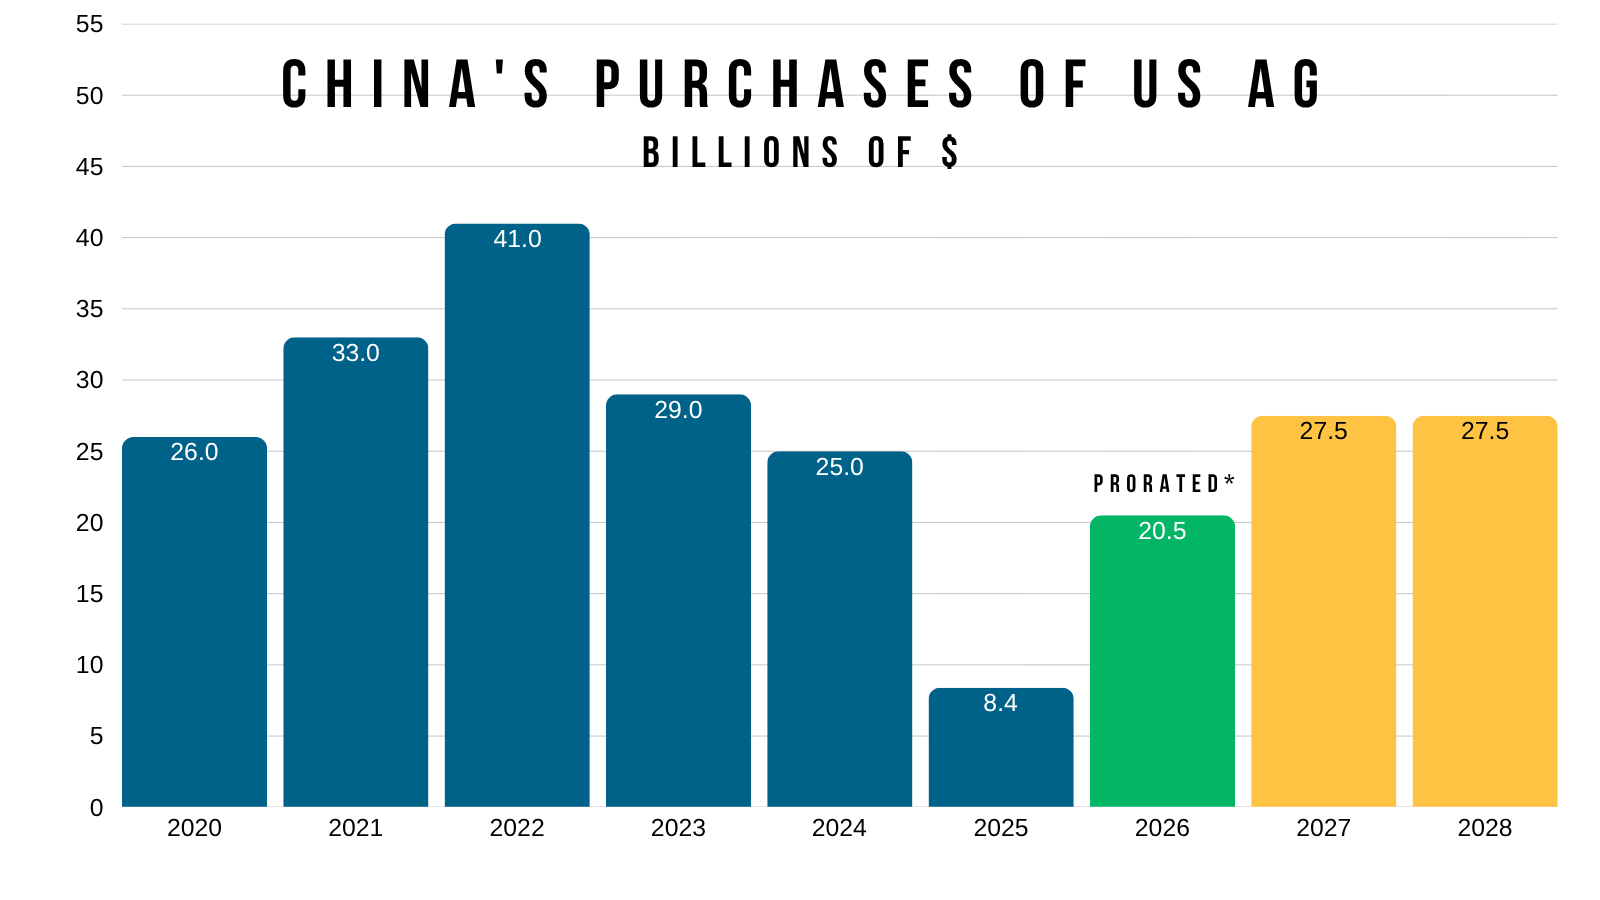
So as you know the deal is broken down like this:
$17 Billion Non-Soybeans
$10-11 Billion Soybeans (25 MMT)
Total: $27-28 billion
Although 2026 will be prorated for the non-soybean purchases.
Here is what that total looks like when compared to other years.
No, it's not as much as it was in 2021 or 2022.
It is however 3.5x more than last year's $8.4 billion.
The deal for the non-soybean business is set in dollars rather than volume like it is for the 25 MMT of soybeans.
So it does make it harder to track the progress of the deal, as we won't know exactly how much they've spent.
But another thing to point out is the price differences between now and back in 2021 and 2022.
Since the deal is in dollars, this matters.
Corn for example.
If you bought $5 billion worth of corn when corn is at $5, it's worth 1 billion bushels.
If you bought $5 billion worth of corn when corn is at $7 its only worth 700 million bushels.
So you get more volume for less price now vs then.
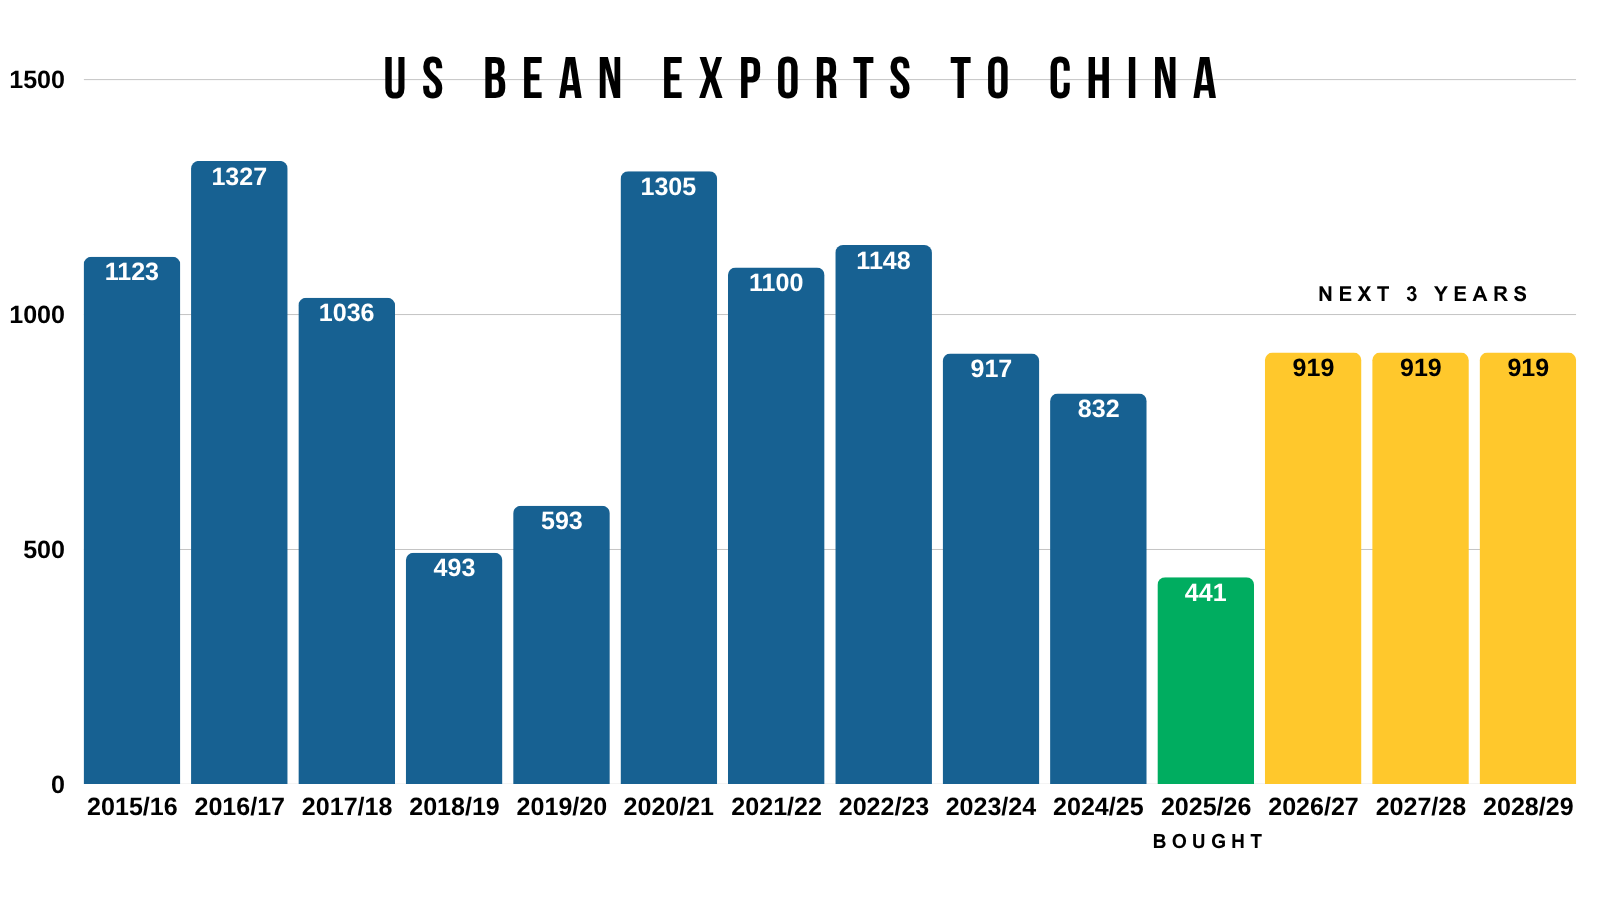
Looking at soybeans specifically.
You've probably already seen this data as we've went over it.
25 MMT is a good number and a lot better than the last few years, but right around average.
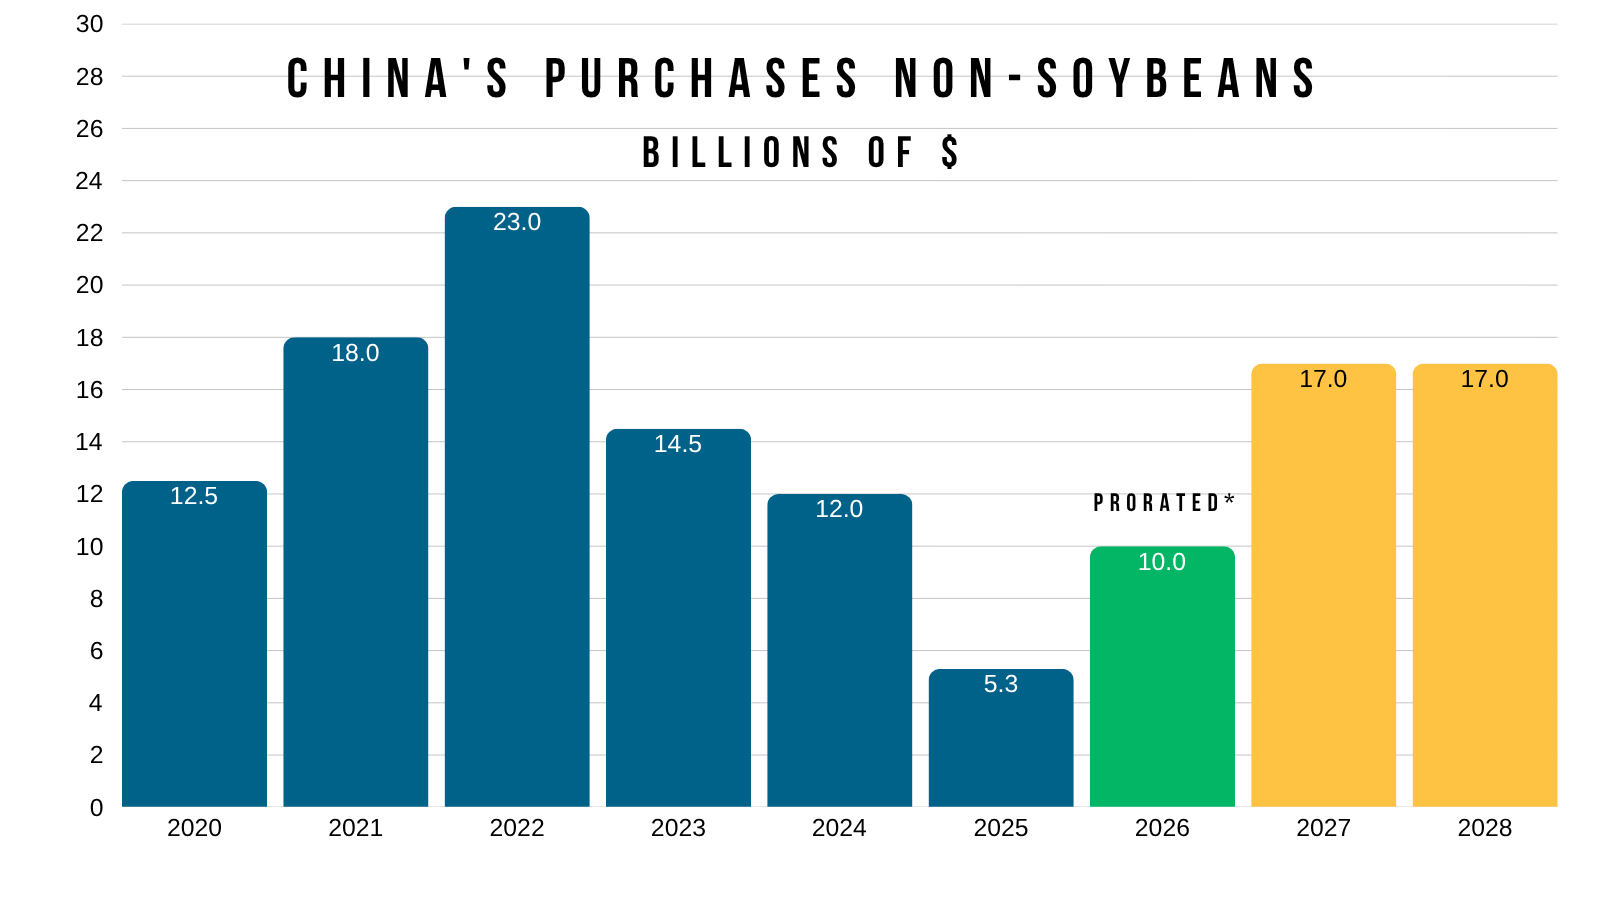
If we look at that $17 million for everything outside of soybeans and how it stacks up vs prior years.
This is somewhat interesting.
Although the total business from China isn’t on par with 2021 and 2022.
The non-soybean business isn’t that far behind. It's just behind 2021.
Who knows how the full allocation will look like.
It's probably going to be a lot of meats, but it will absolutely include some corn. Just like we saw in 2021 and 2022.
Something to note is that 2026 will be prorated, as they did not have an entire year to meet the $17 billion.
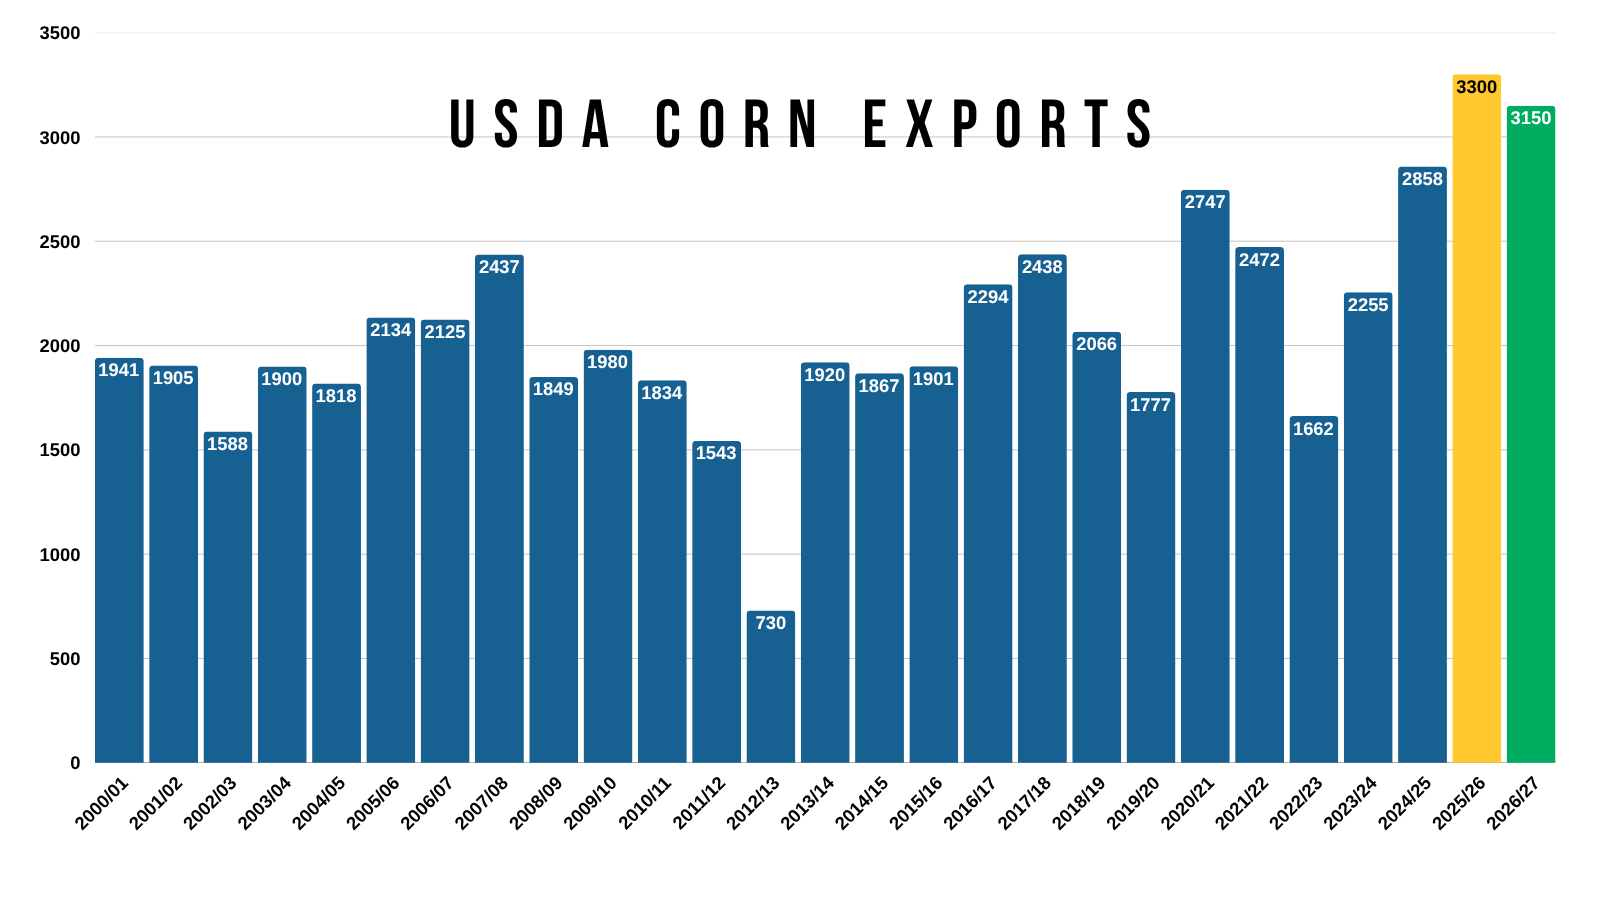
Just a reminder, corn export demand is the best it's ever been.
This is without a single dime from China.
So you do have to wonder what happens when they start to buy when demand is already shattering records.
The demand in 2021/22 was entirely led by China.
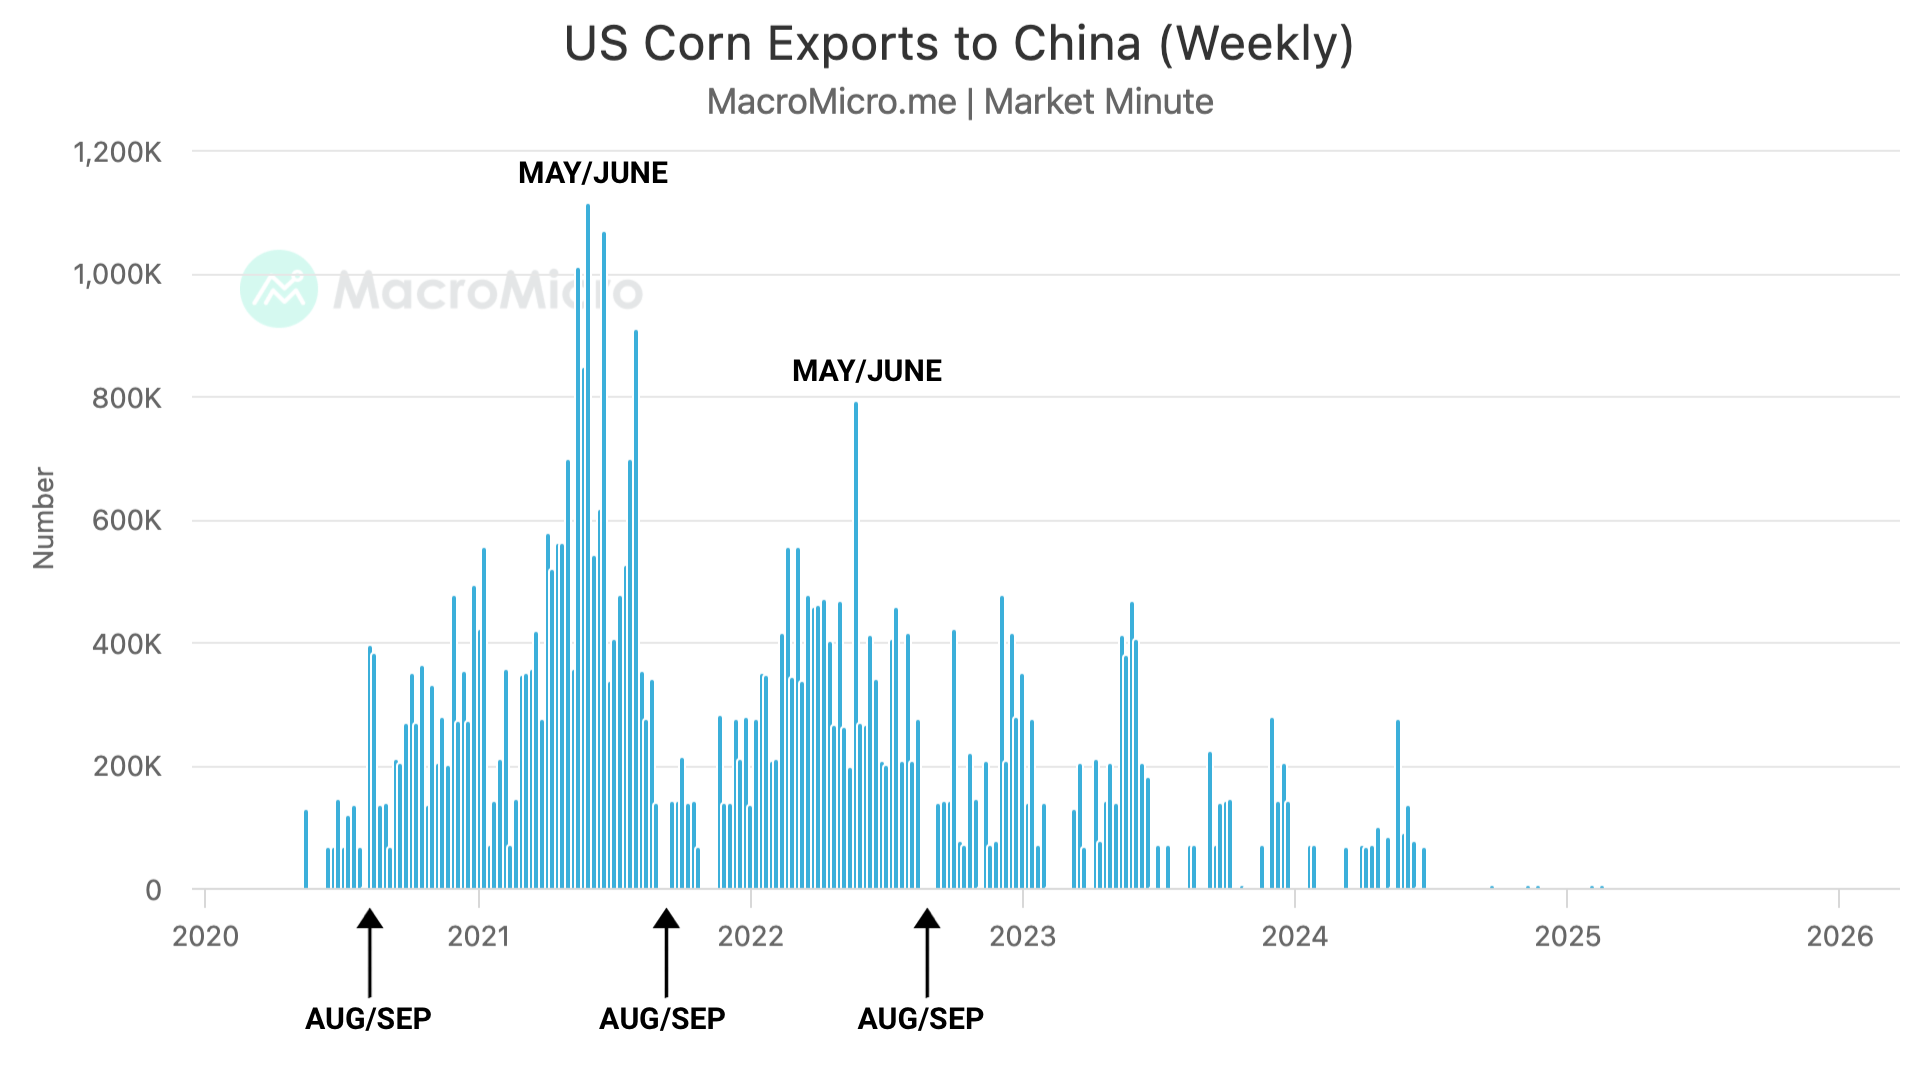
When could China buy corn?
That's the tricky part of this deal.
Corn faces a real risk of the market not pricing in the China buying until it actually sees pen on paper and gets verification that China is buying.
If we look at 2021 and 2022, the biggest weeks of buying were actually May and June, before easing until after harvest.
However, in 2020 we didn’t see them start to buy at all until really August to September even though they signed the deal in January.
Although, 2020 was a unique year due to COVID and everything else.
Regardless, this could very well end up being a much larger story late in the year and into early next year if they opt not to buy until then.
That's going to be a big factor here short term. If we get any announcements to China or if it doesn’t happen for a while or until harvest.
It'll be a positive catalyst, we just don’t know if it'll happen soon or later in the year.
Now some would argue:
"China didn’t live up to the phase one agreement, why would they live up to this one?"
It's a good question. But keep in mind, this deal is far more attainable than the phase one ever was.
These aren’t some out of the world numbers.
No, we never received actual confirmation of this deal from China. But we also did not hear a peep out of China after that deal for the 12 MMT of soybeans came out last year.
They ultimately ended up doing exactly what Trump said they would. So I don’t see why they couldn’t live up to this.
Today's Main Takeaways
Corn
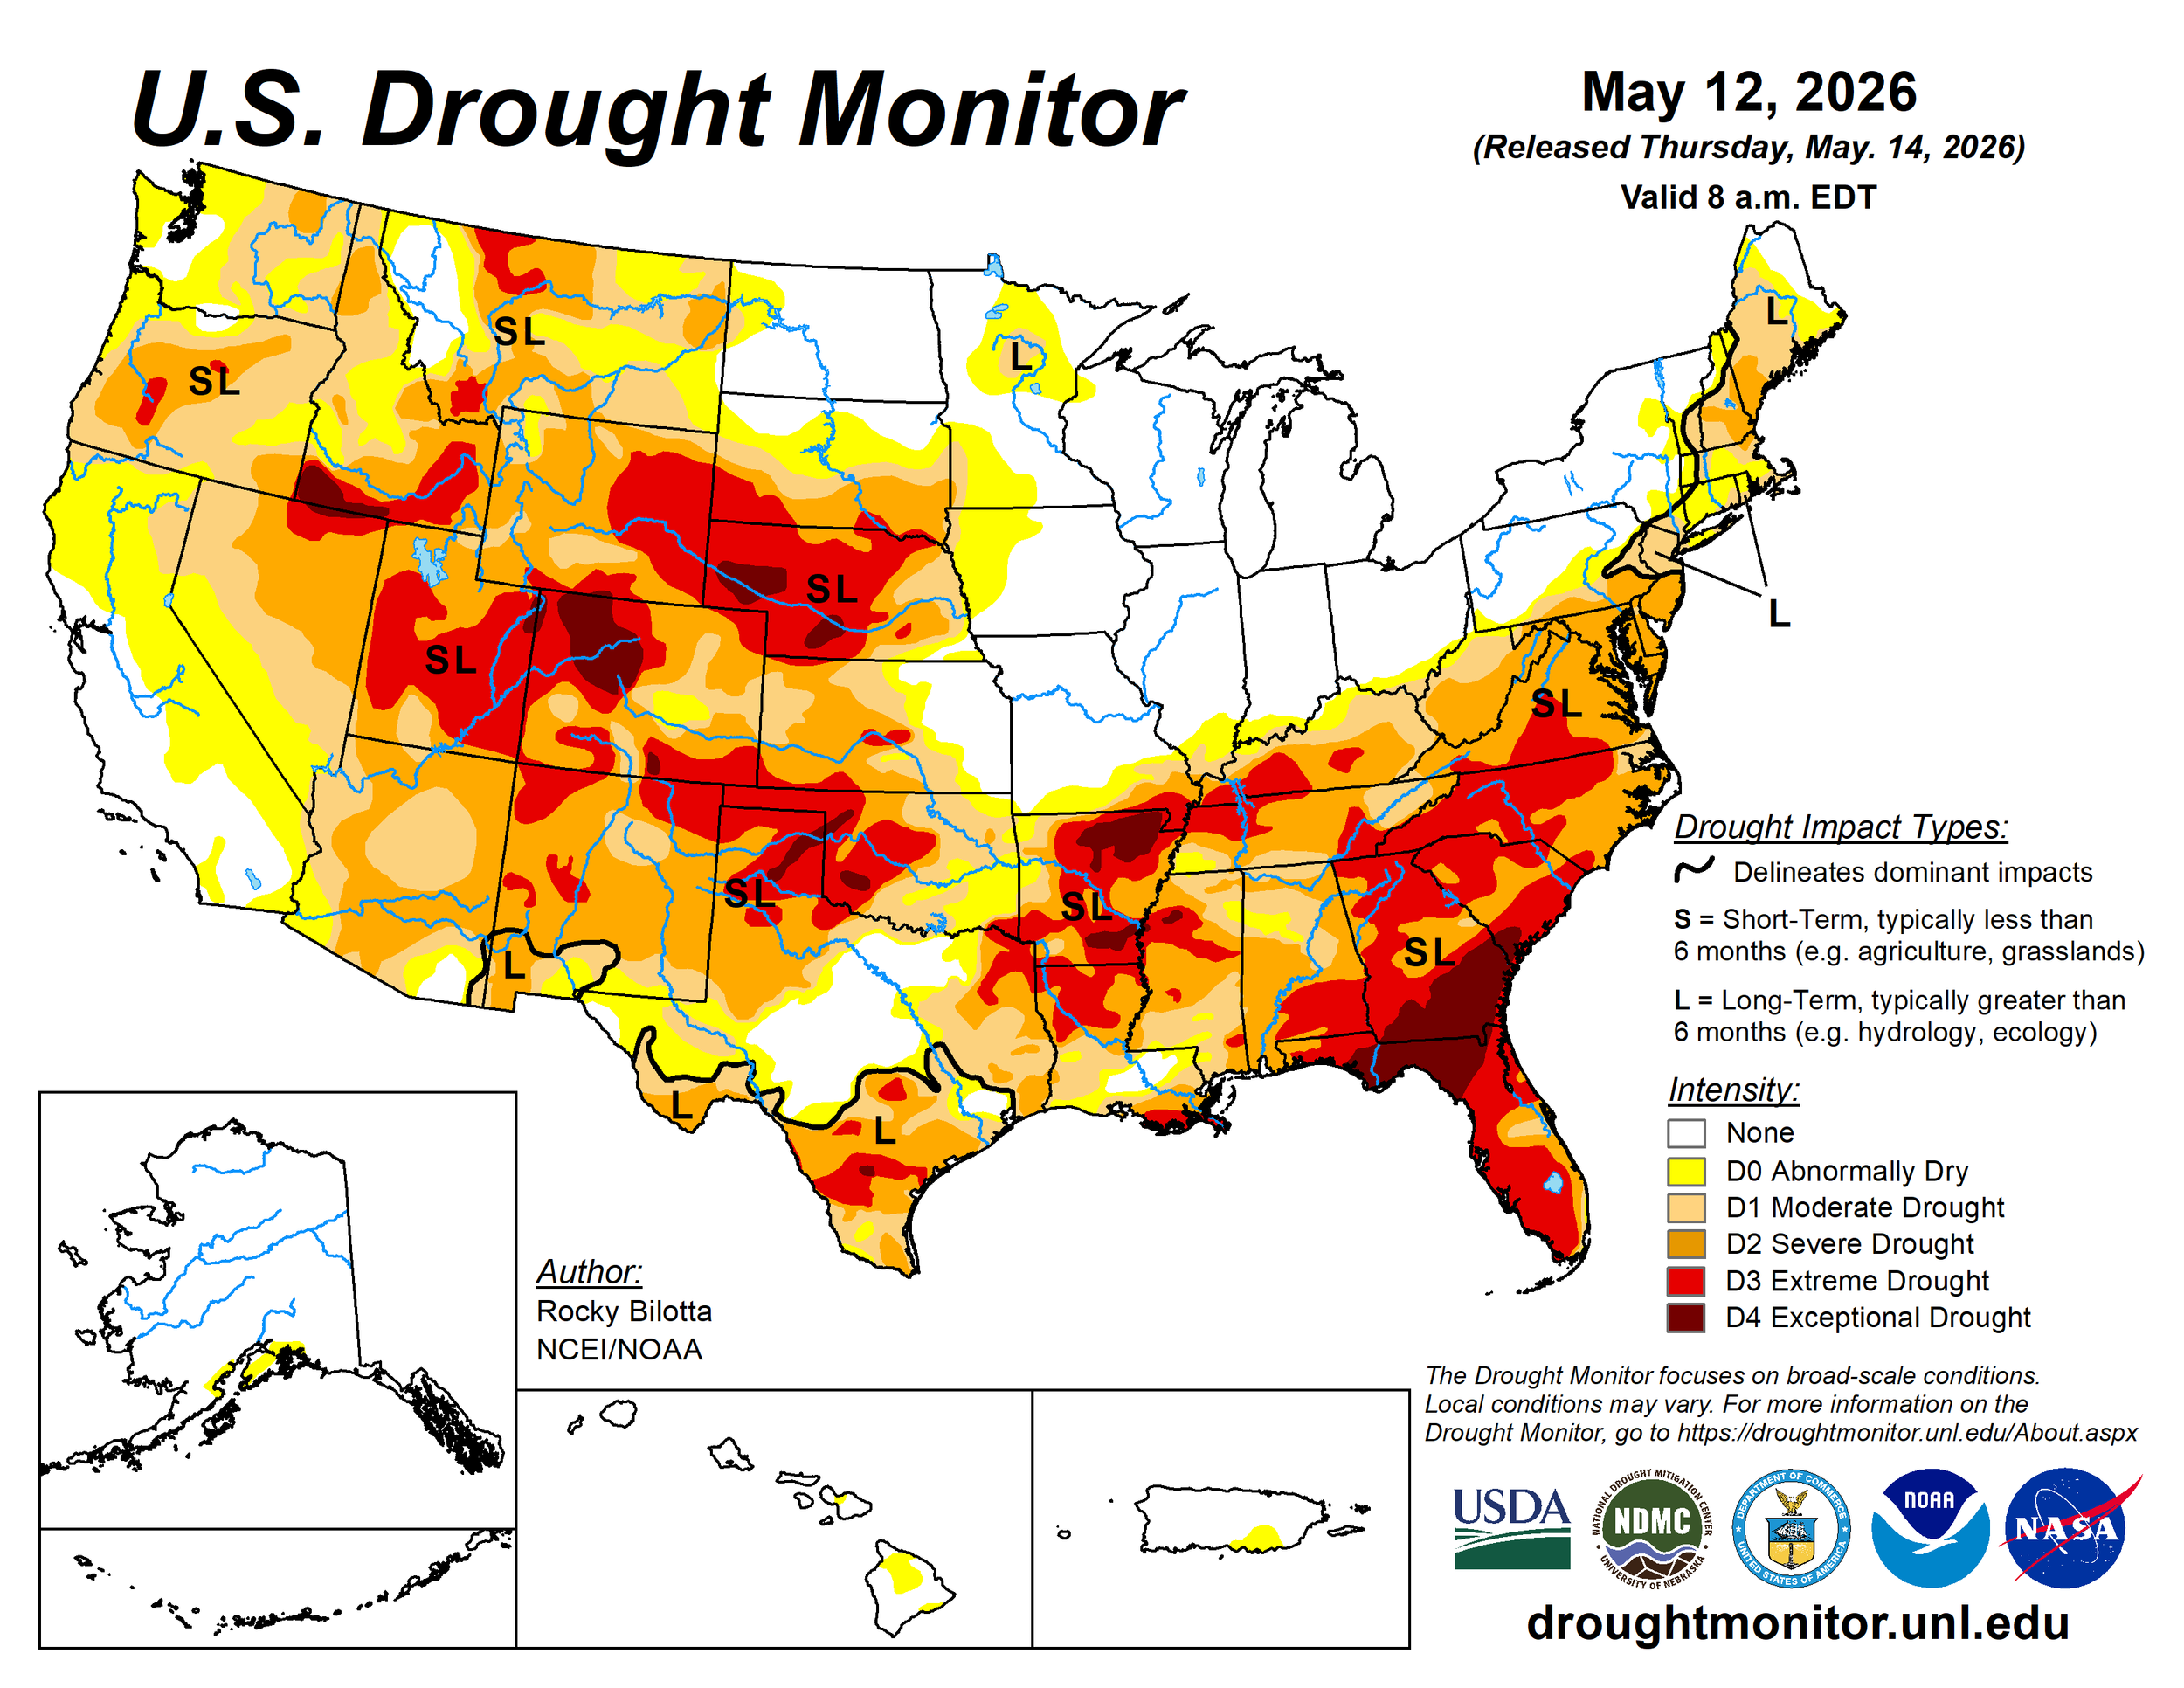
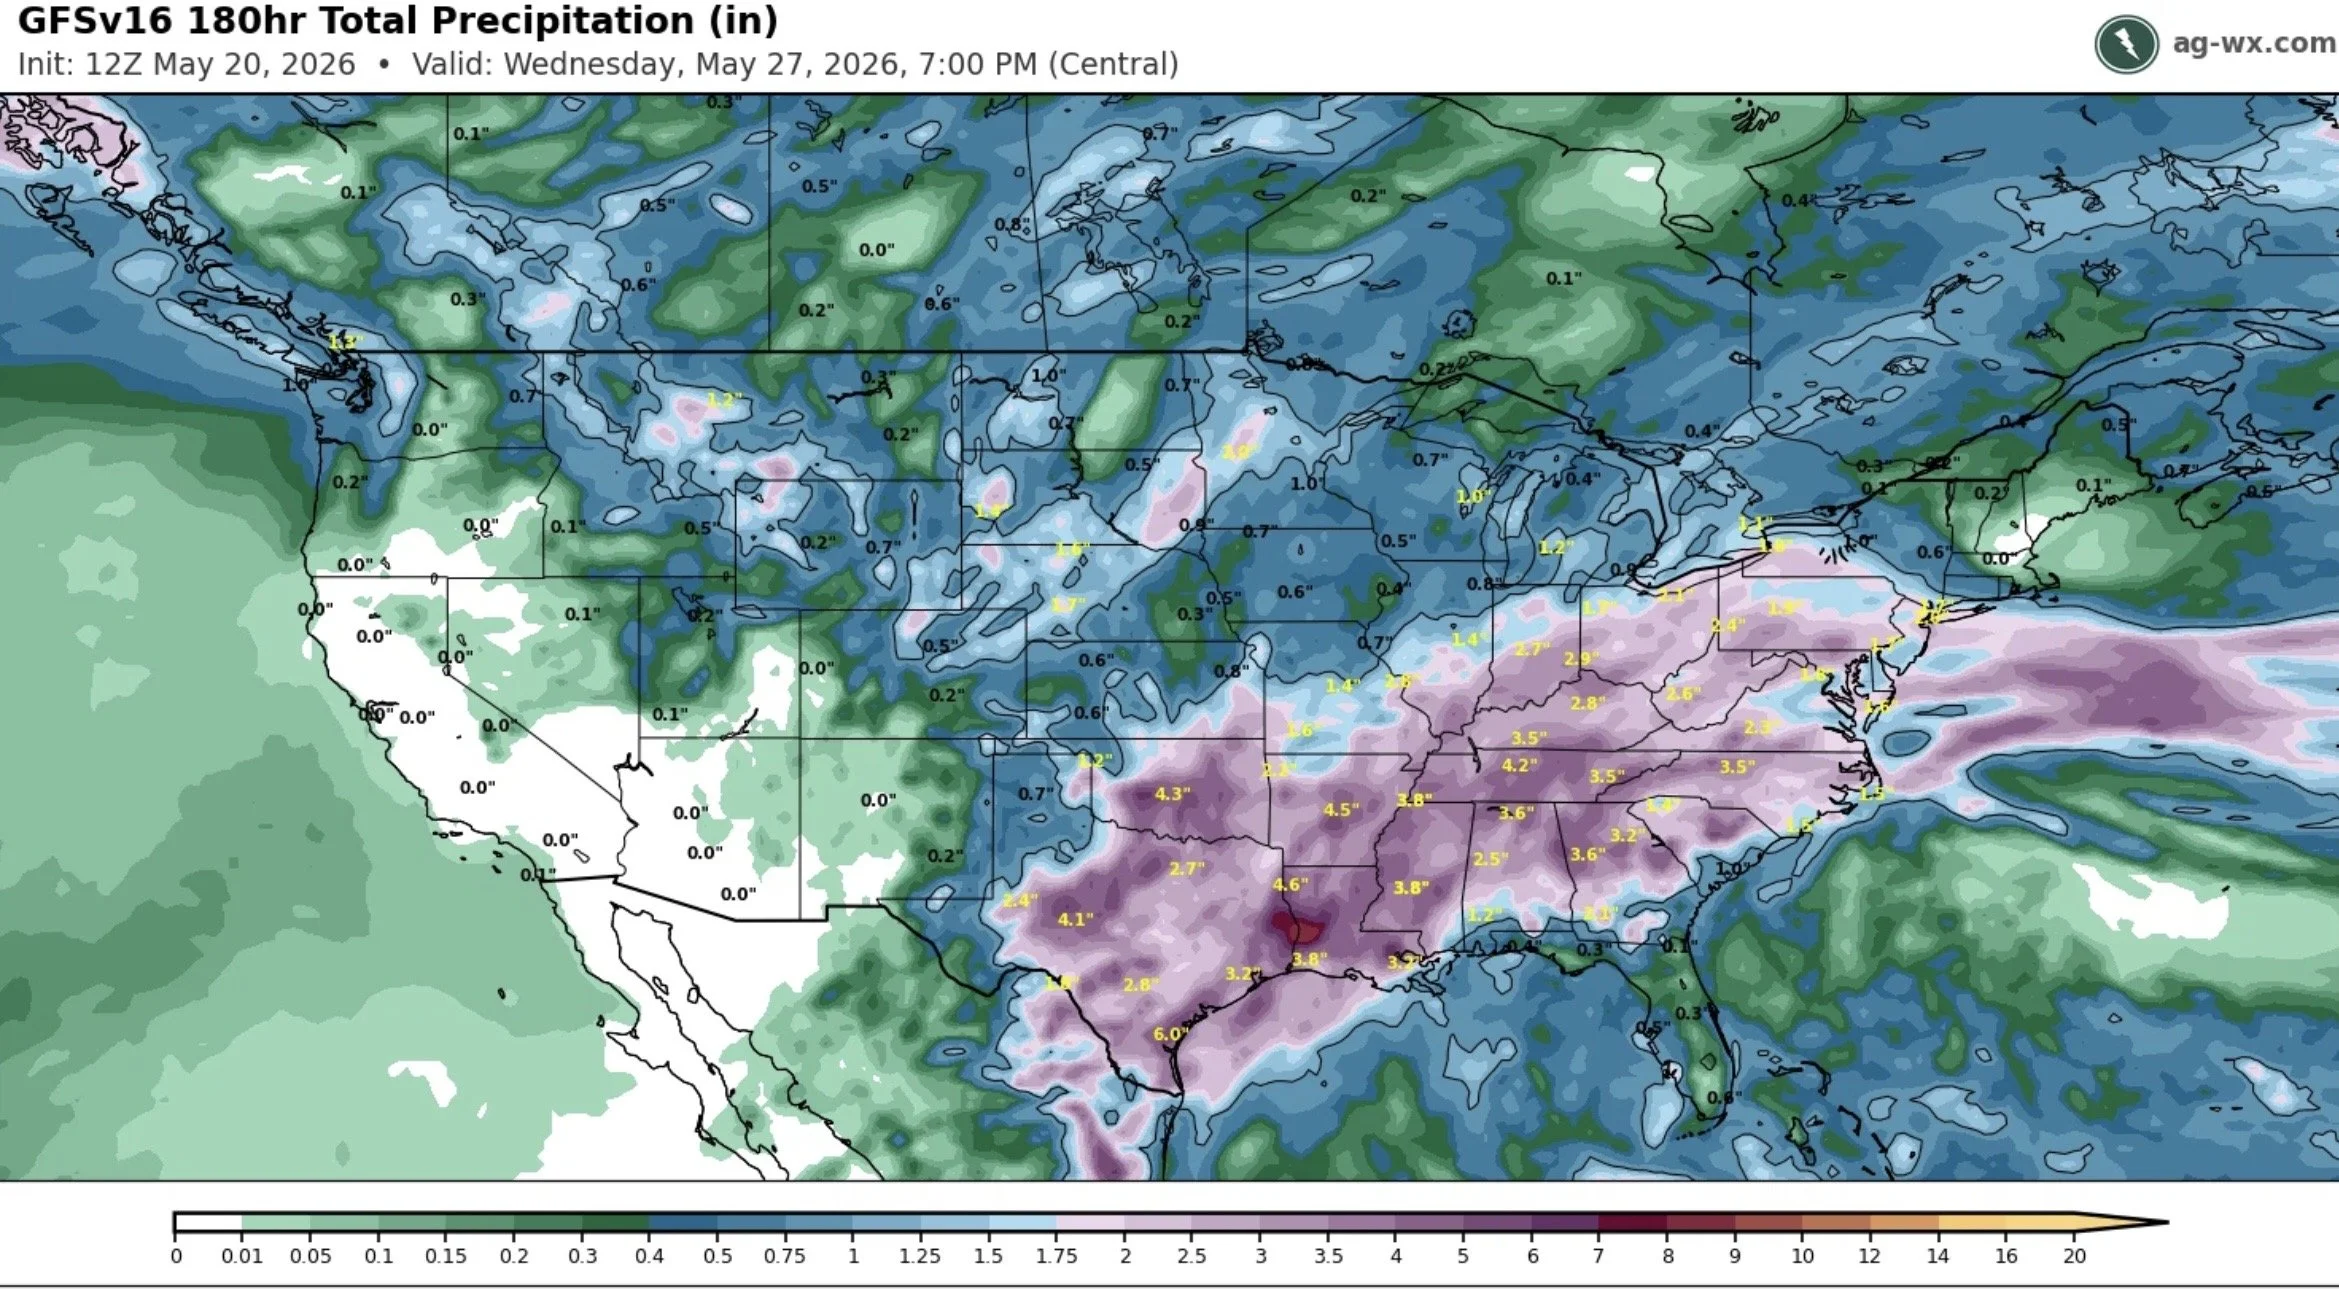
We've had a dry start to May in parts of the corn belt.
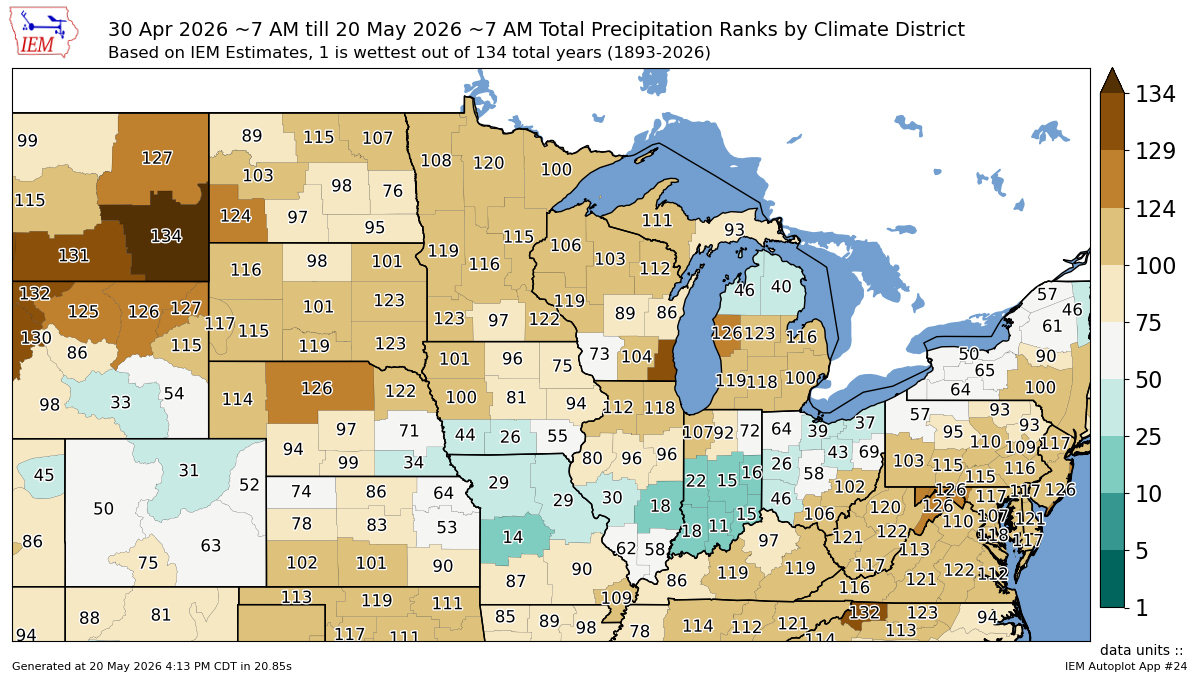
However, it doesn’t appear like we have any real weather issues for the majority of the key corn regions.
Yes, areas such as Nebraska are dry, but the rest of the big players have had plenty of moisture the past.
I mean April was one of the wettest ever.
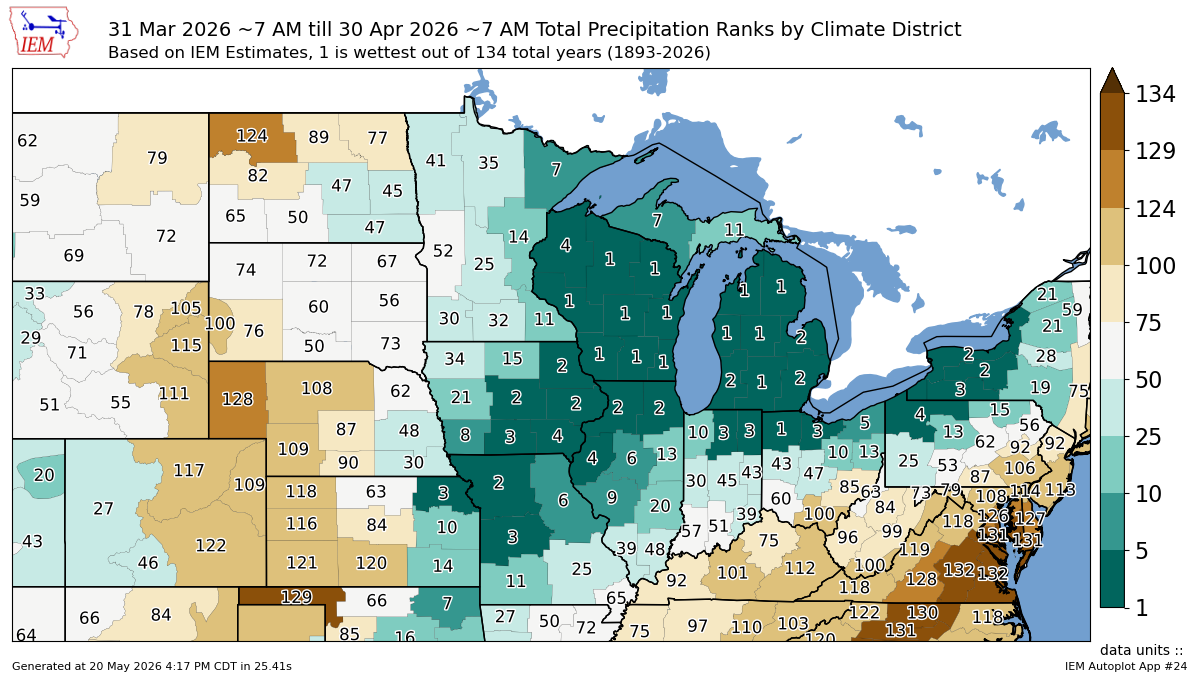
Hence why the I-states are the only ones in the US not suffering from some serious drought.
The forecasts have a decent amount of rain especially in the southern belt.
So overall, no real weather threats in corn for now.
With planting remaining well ahead of average.
At the same time, a lot of these bullish factors have been priced in.
Everything from the war premium to the record demand.
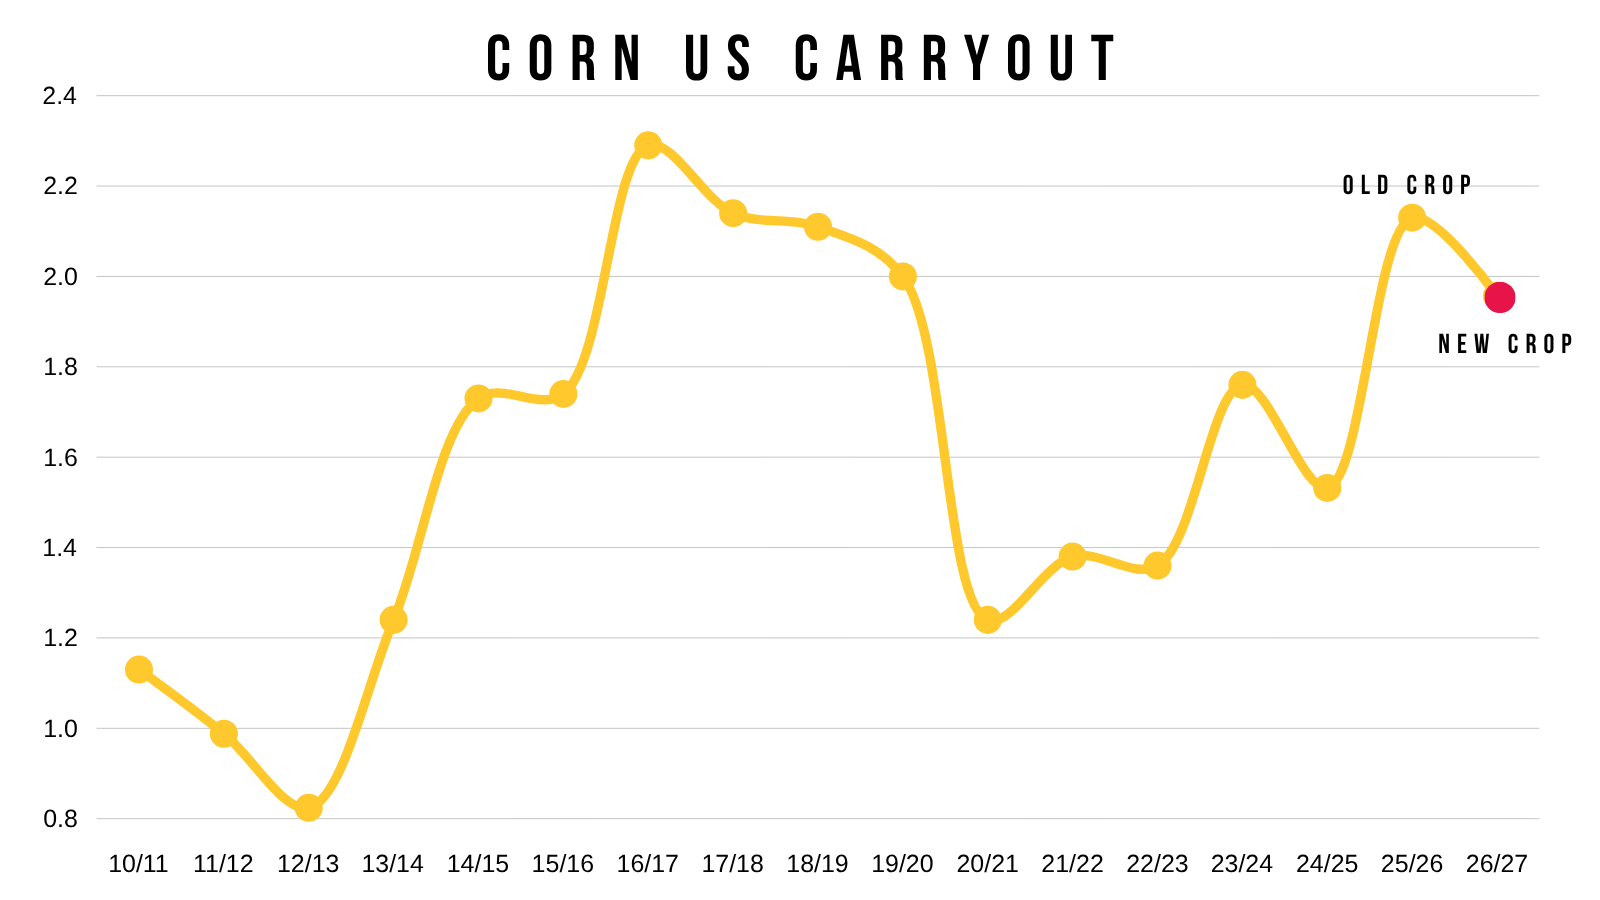
Which is why we have near $5 new crop corn with one of the more bearish old crop balance sheets we've in quiet some time.
As we haven’t really traded the balance sheets.
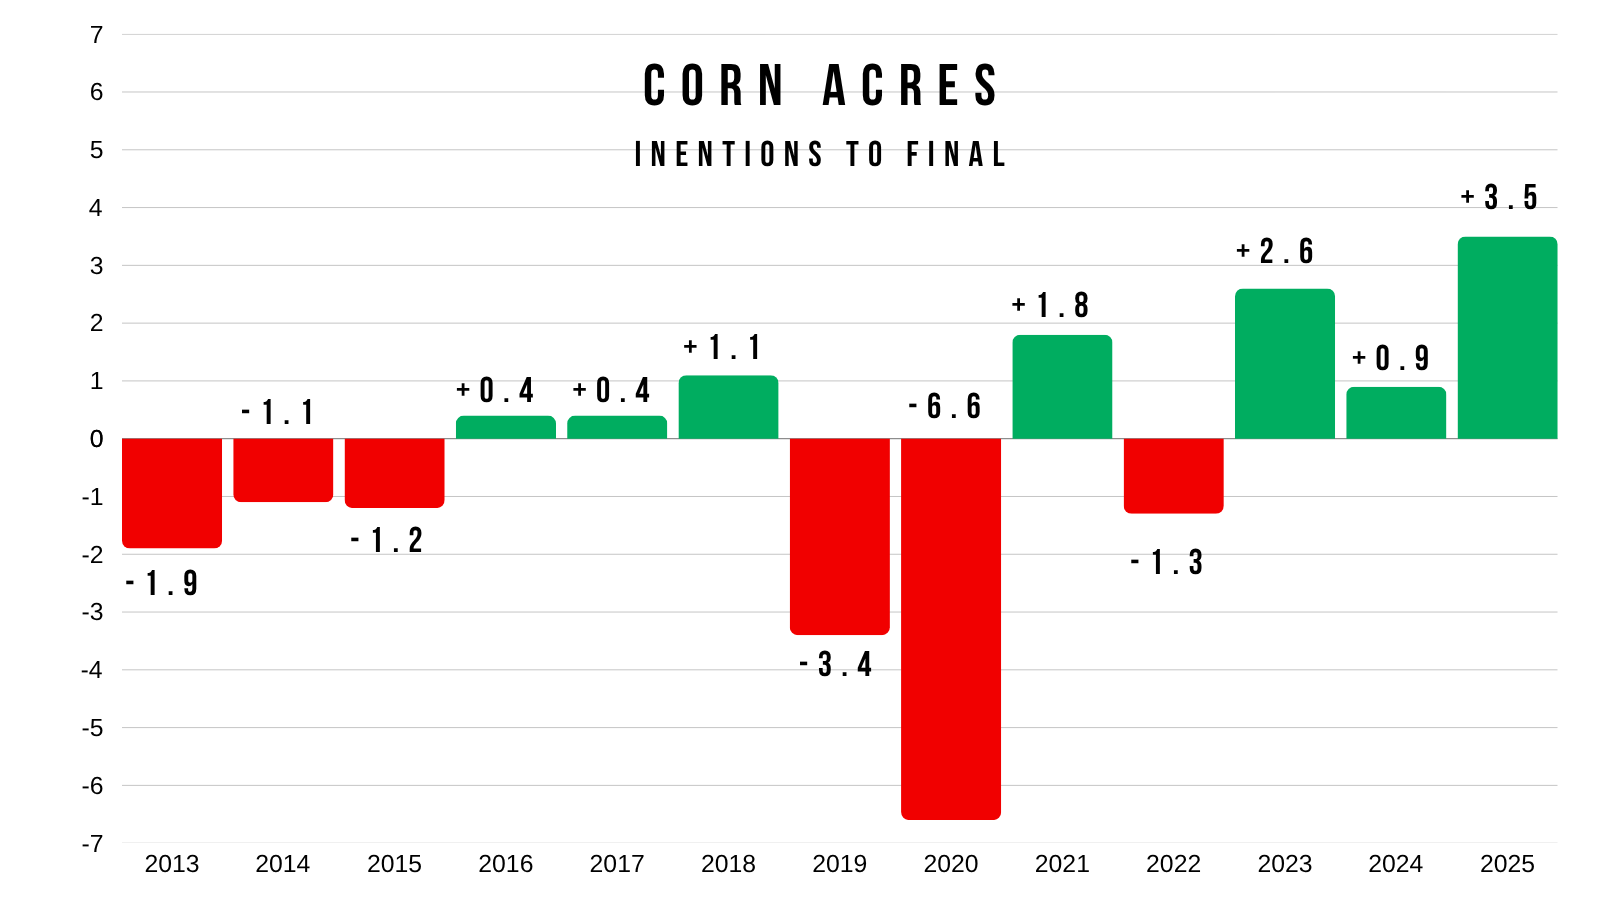
I still think acres are too high.
Not to mention the fact that the USDA's planting intentions haven’t really came within 1 million of the final acre number in a decade.
Which supports that argument even further.
But by the time we get those acres baked into the balance sheet, the weather premium in a market typically is gone.
As we usually have a good idea if the crop is going to have any issues or not by then.
Which is why we seasonally start to fall apart right around that June acre report.
Seasonally, the next 3-4 weeks is it.
That seasonal window usually doesn’t extend into July unless we run into a scare.
This is the time of year to get yourself in a comfortable position.
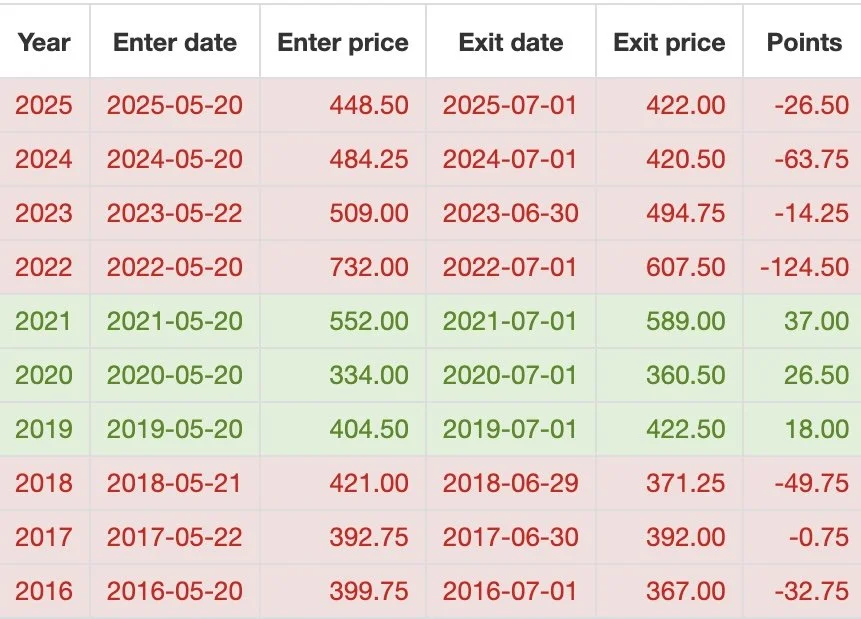
As I've talked about for the last several weeks, this is the time of year to be defensive and start doing some marketing.
As we are almost always lower by July and August.
From today by July 1st, we have been lower the last 7 of 10 years.
Again, that doesn’t mean we can’t go higher from here first. It just suggests lower by then.
If you are someone who is behind or hasn’t done much of anything, you can’t forget this is still the best prices we've seen in new crop in years.
That's not me saying to go out and sell everything, at all.
But it's hard not to do anything higher than we've been the past few years.
Short term, aside from seeing China come out and actually buying corn, a lot of the factors may be priced in for now.
If we see China step in and start buying right away, that of course can change things in a heart beat.
There is a reason we are as high as we are with zero weather threats in the prime corn belt.
Which is something Jeremey talked about in his audio a lot the last few days.
Bulls need to continue to be fed. A lack of fresh bullish news is one of the biggest risks in this market.
However, long term, I am talking late this year and early into next year I think the new crop story is still very much alive.
What happens if China starts to buy? The market will take notice.
Demand is already a record as we mentioned, even without China.
Do you think all of that demand is simply going to vanish just because China steps in? Given that the world situation is the tightest it's been in 14 years? I'd argue demand is here to stay.
Do you really think we won't see even fewer acres next year if the fertilizer situation doesn’t get resolved?
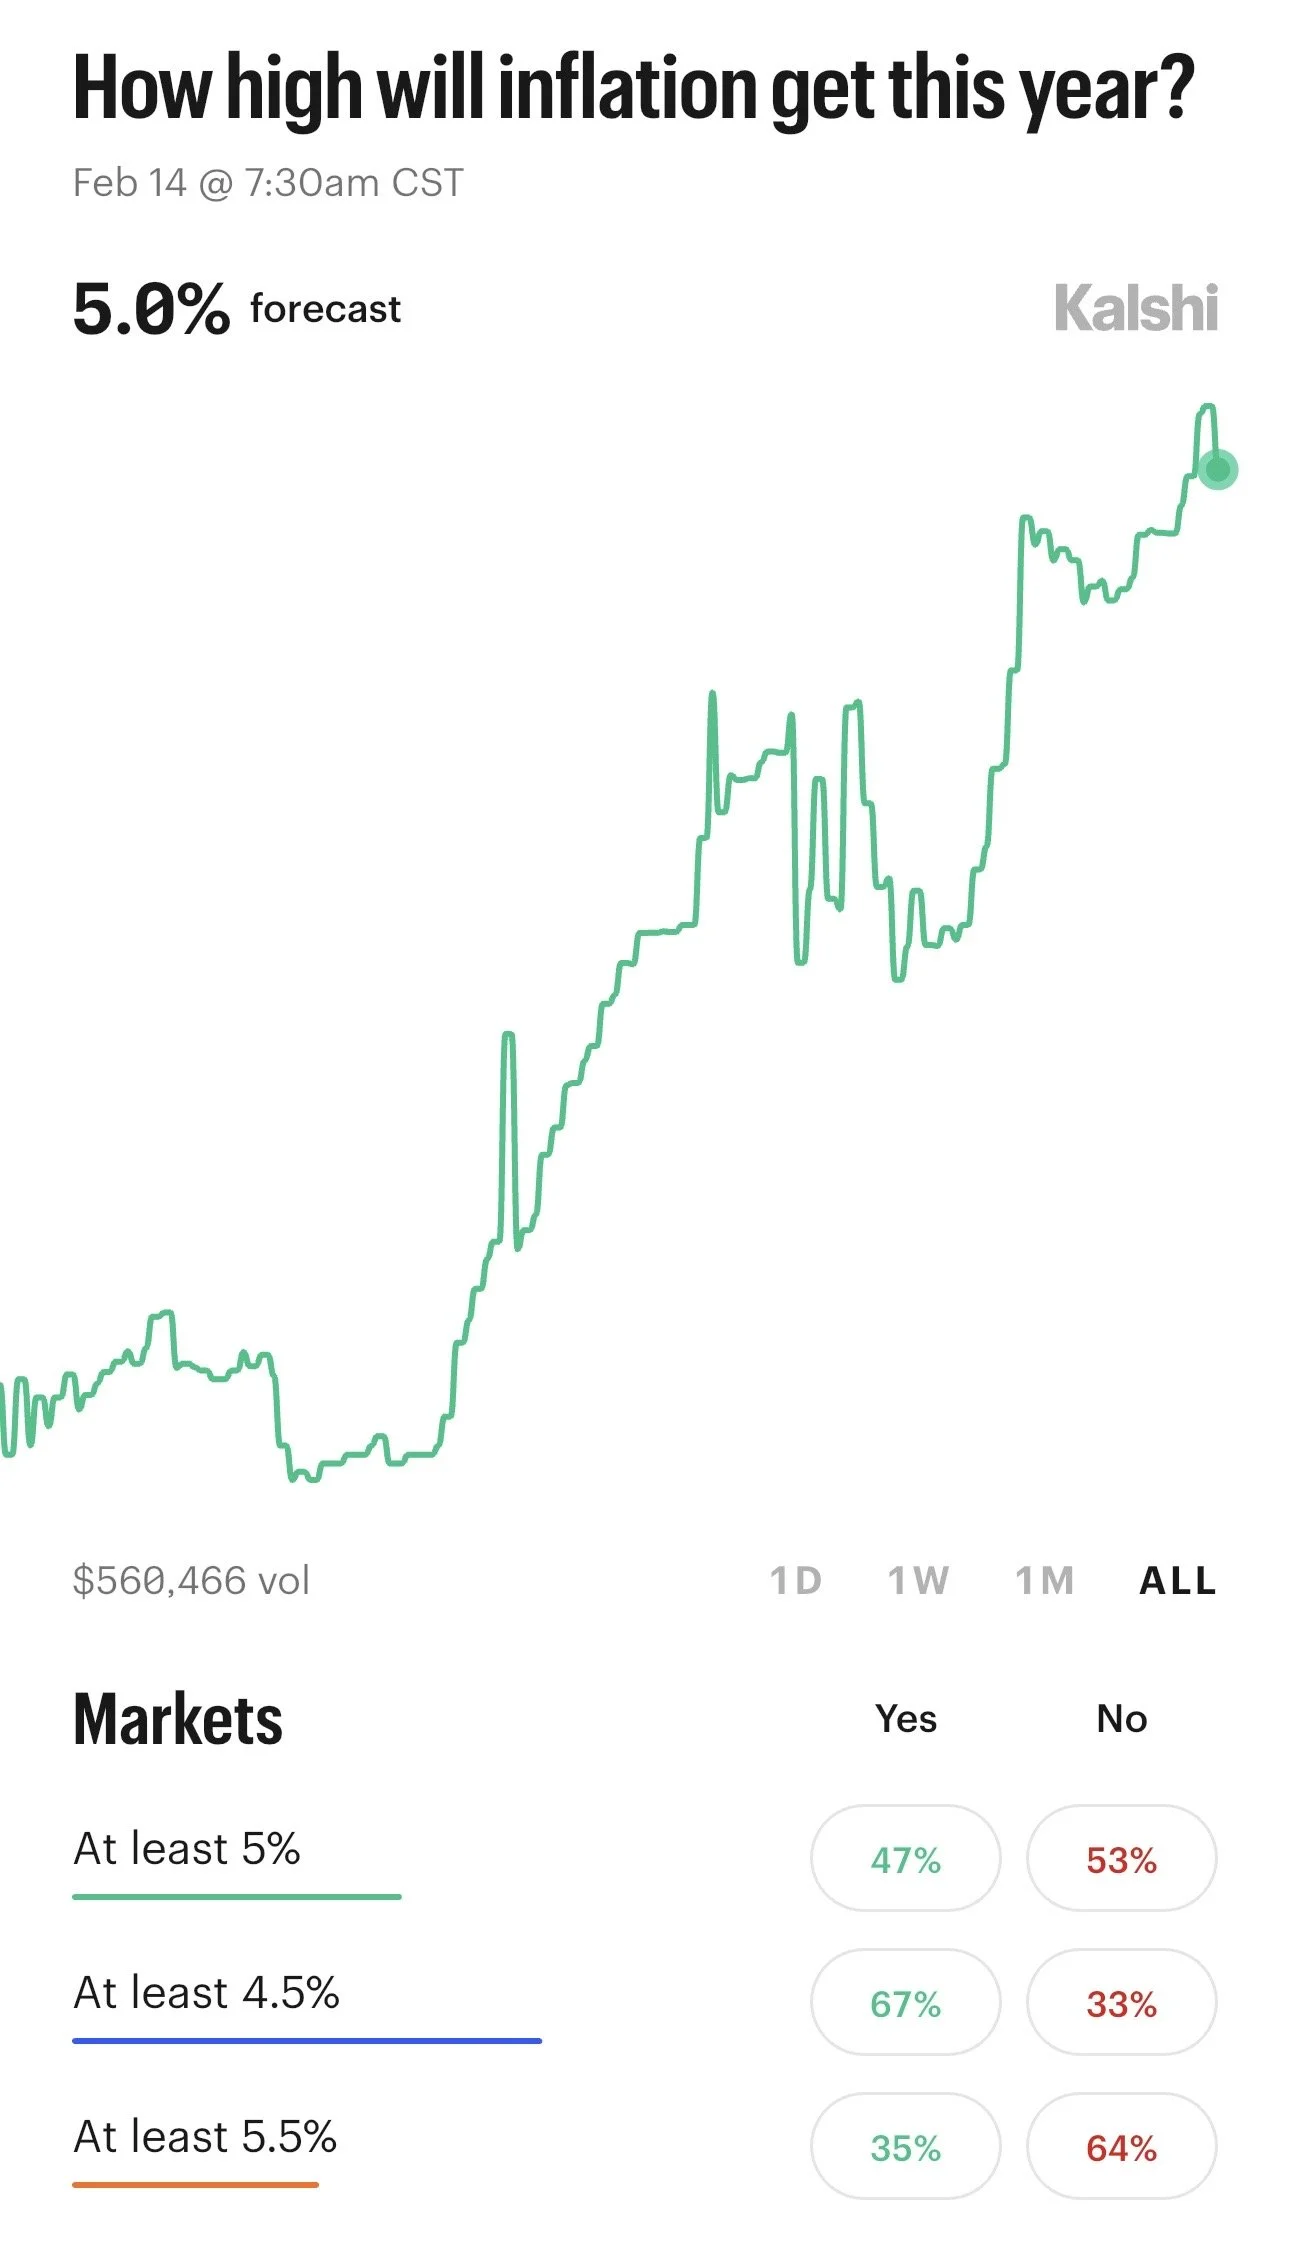
Not to mention the possible long term inflation play.
The one common theme in a bull market is high inflation and crude.
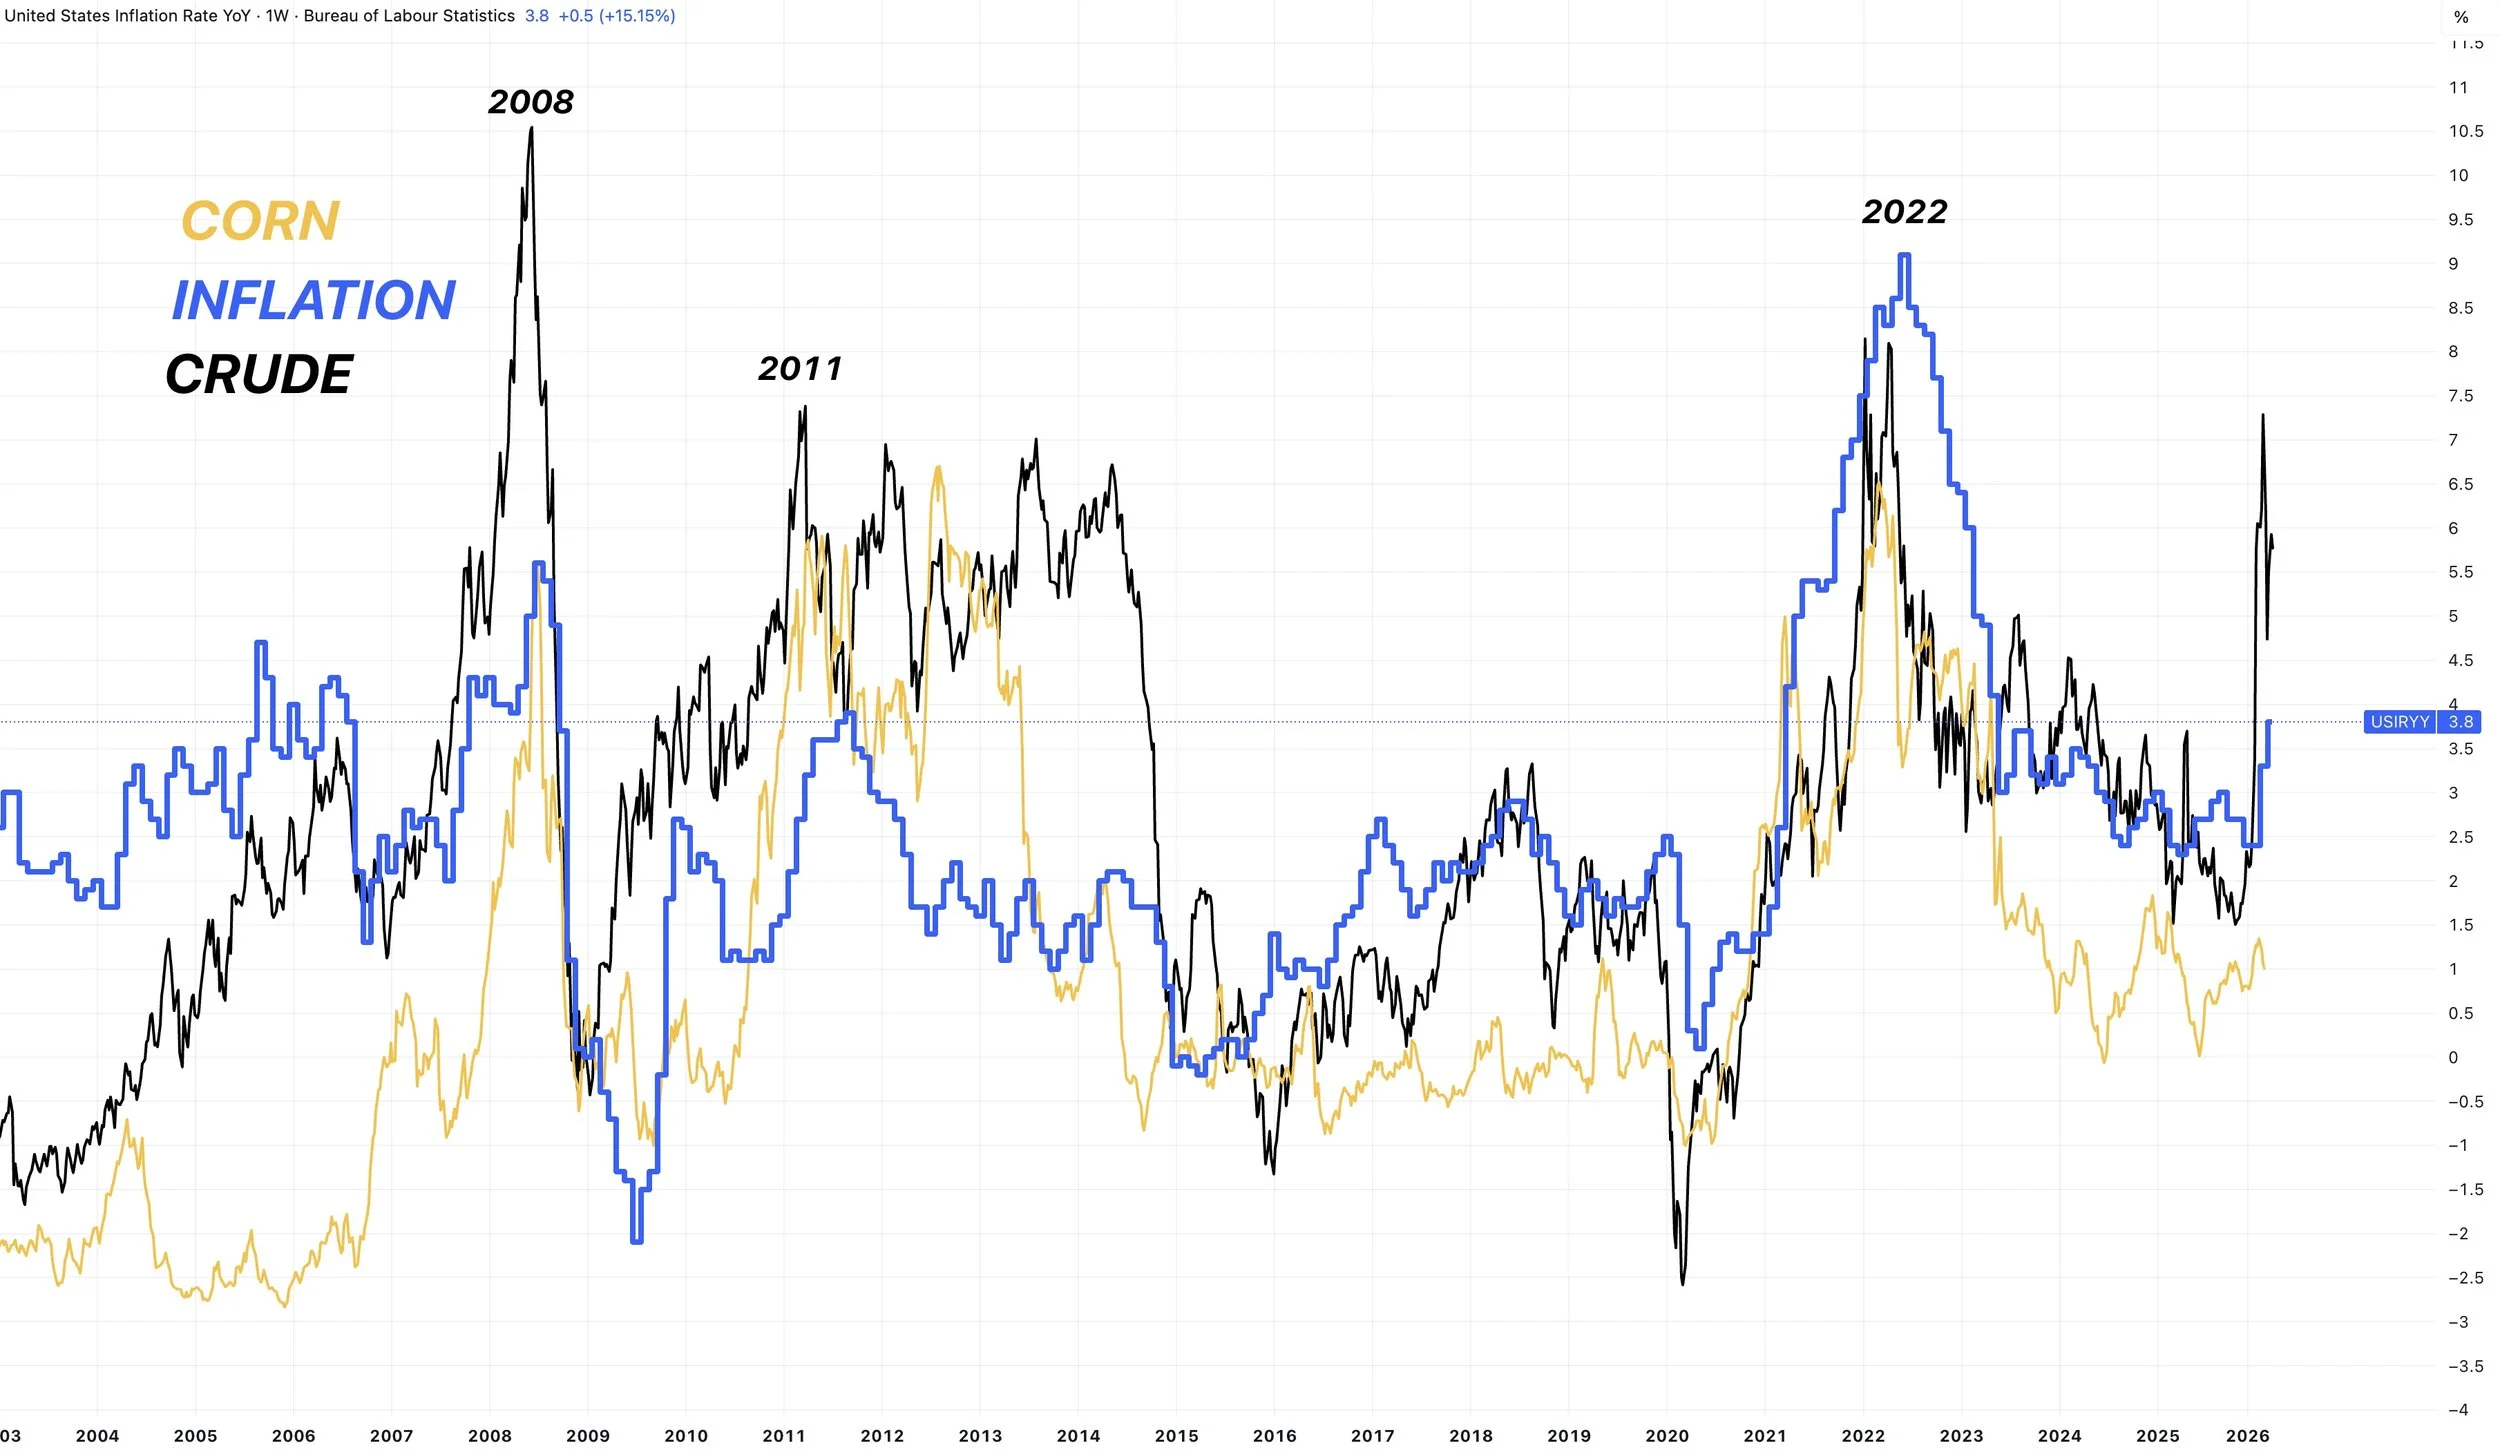
Inflation and crude don’t have to keep going higher.
However, according to the betting odds, the inflation rate is forecasted to reach 5% this year.
Up from 2.4% at the start of the year.
Bottom Line:
Short term, over the next month, there is reason for caution.
This is when we typically make our highs. It might take some outside factors to get that next leg higher. Such as China actually buying, an issue with the weather, or war escalation etc.
So if you are someone who knows you're going to have to move stuff off the combine, you especially need to be proactive at this time of the year.
Odds are we are lower by July and August. But long term, I think corn has potential. That potential doesn’t have to be realized soon if at all, but it's certainly there.
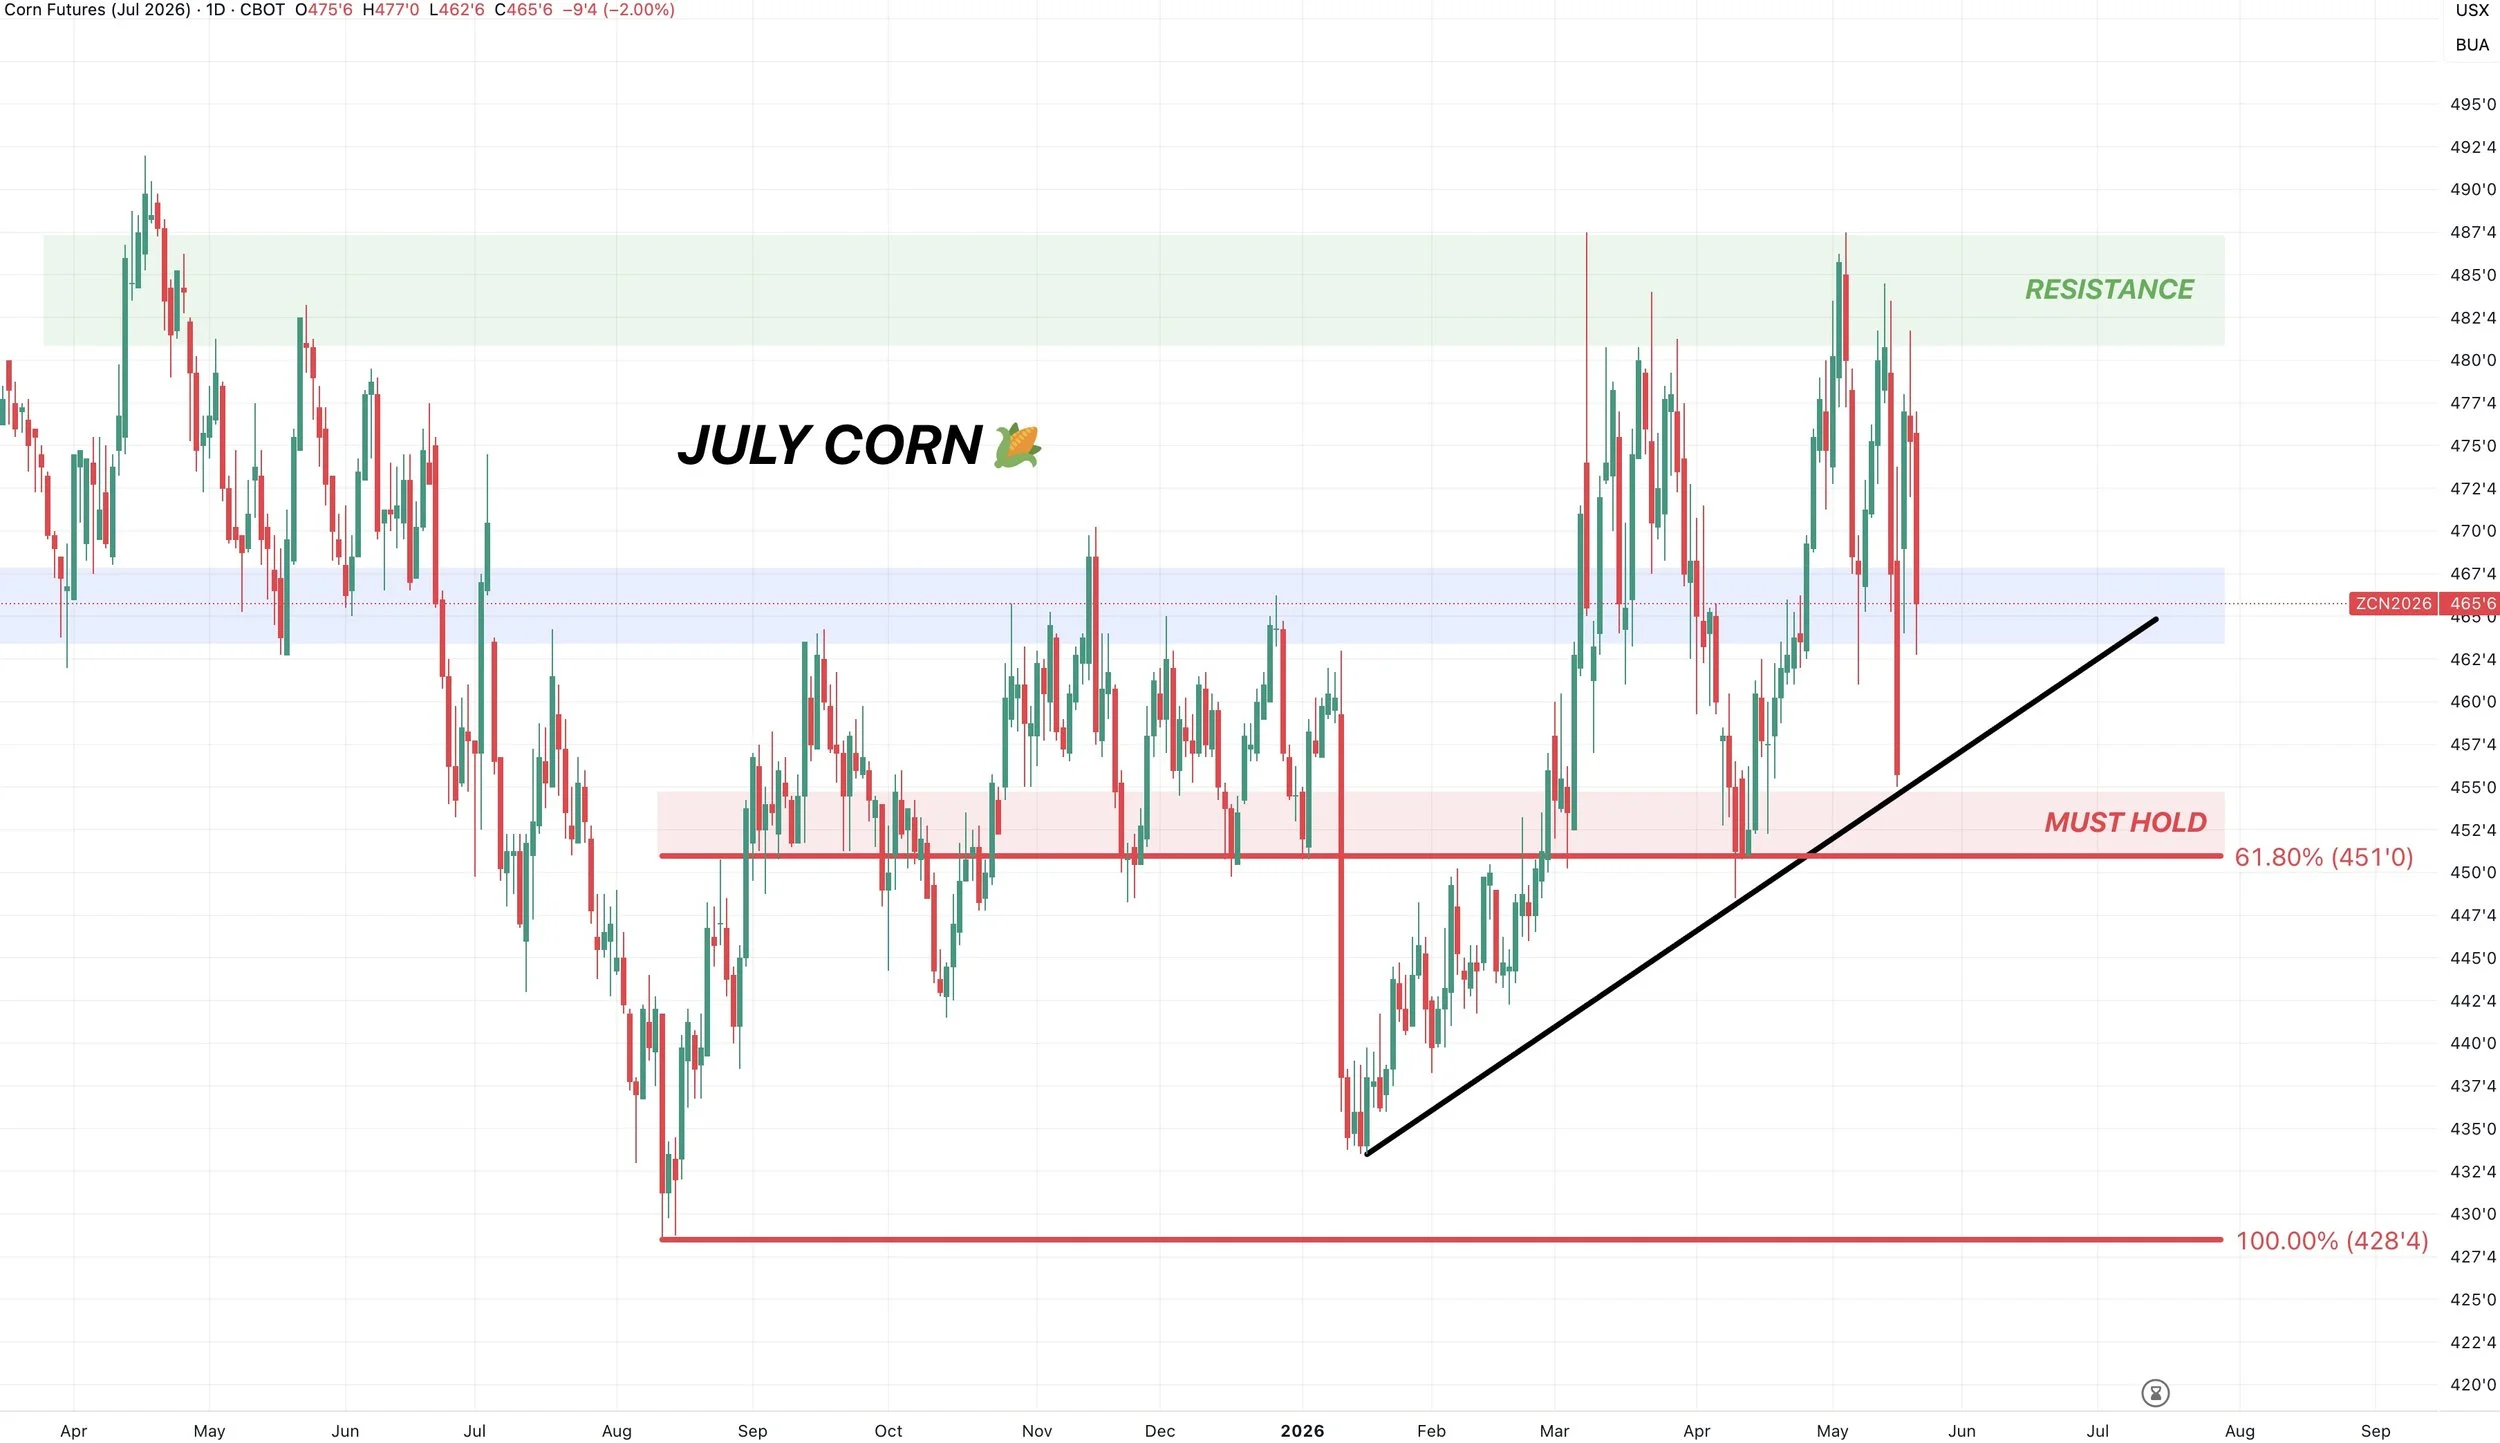
July Corn Chart:
This is some of the weirdest price action I've seen in a long time.
We drop 30 cents in 48 hours.
Monday we claw most of it back.
Today we give back half of what we clawed back.
Ideally, we hold today's lows. This is some pretty key support and resistance.
If we fail, we could drop down towards the red box.
Take out the recent highs and that big area of resistance, it opens the door higher.
We did not issue a full on sell signal, but Jeremey talked about how if you were uncomfortable last week, we were right back near those highs.
If we make our way back into that resistance, it might not be the worst spot to look to reward.
$4.50 is the line in the sand to keep the bias higher. That gives back 61.8% of the highs all the way down to contract lows. That's the very last key support.
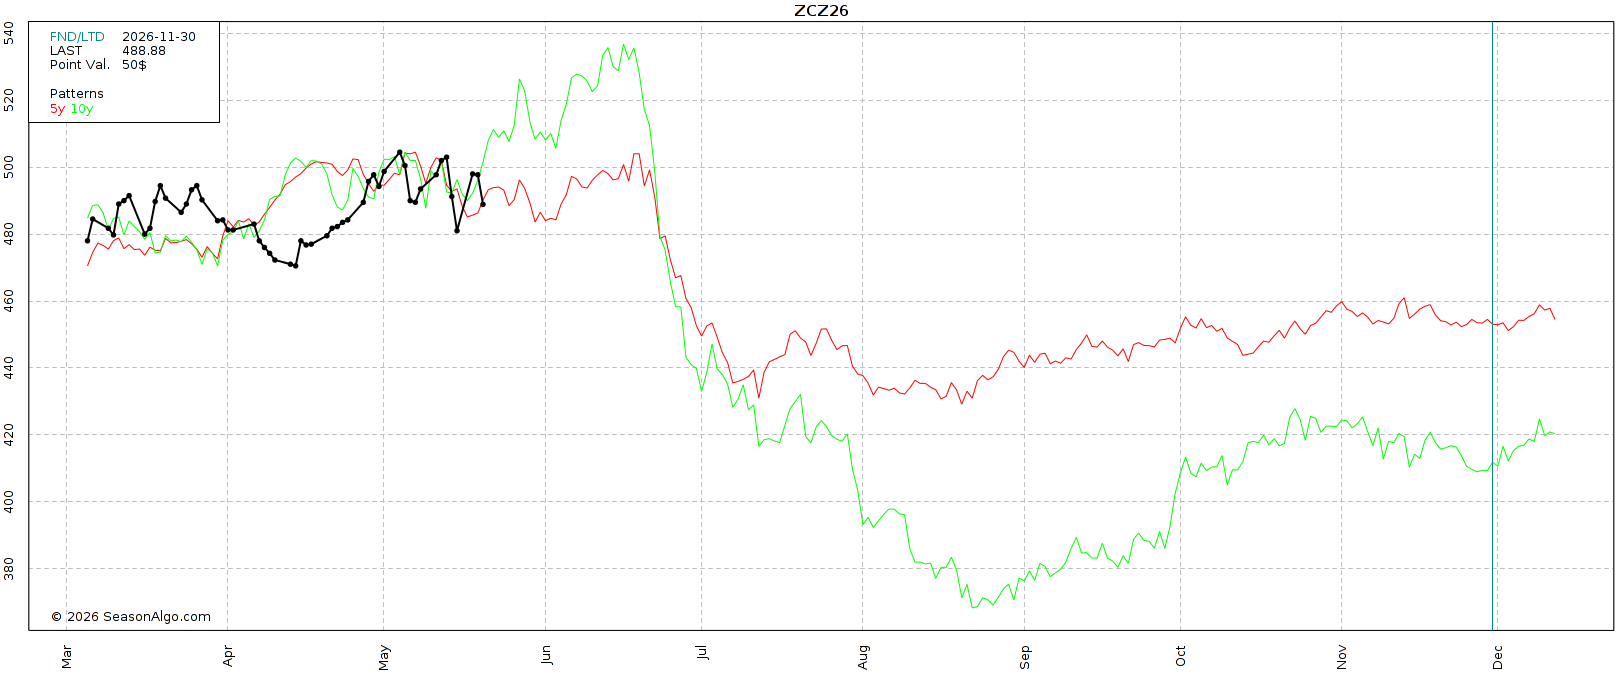
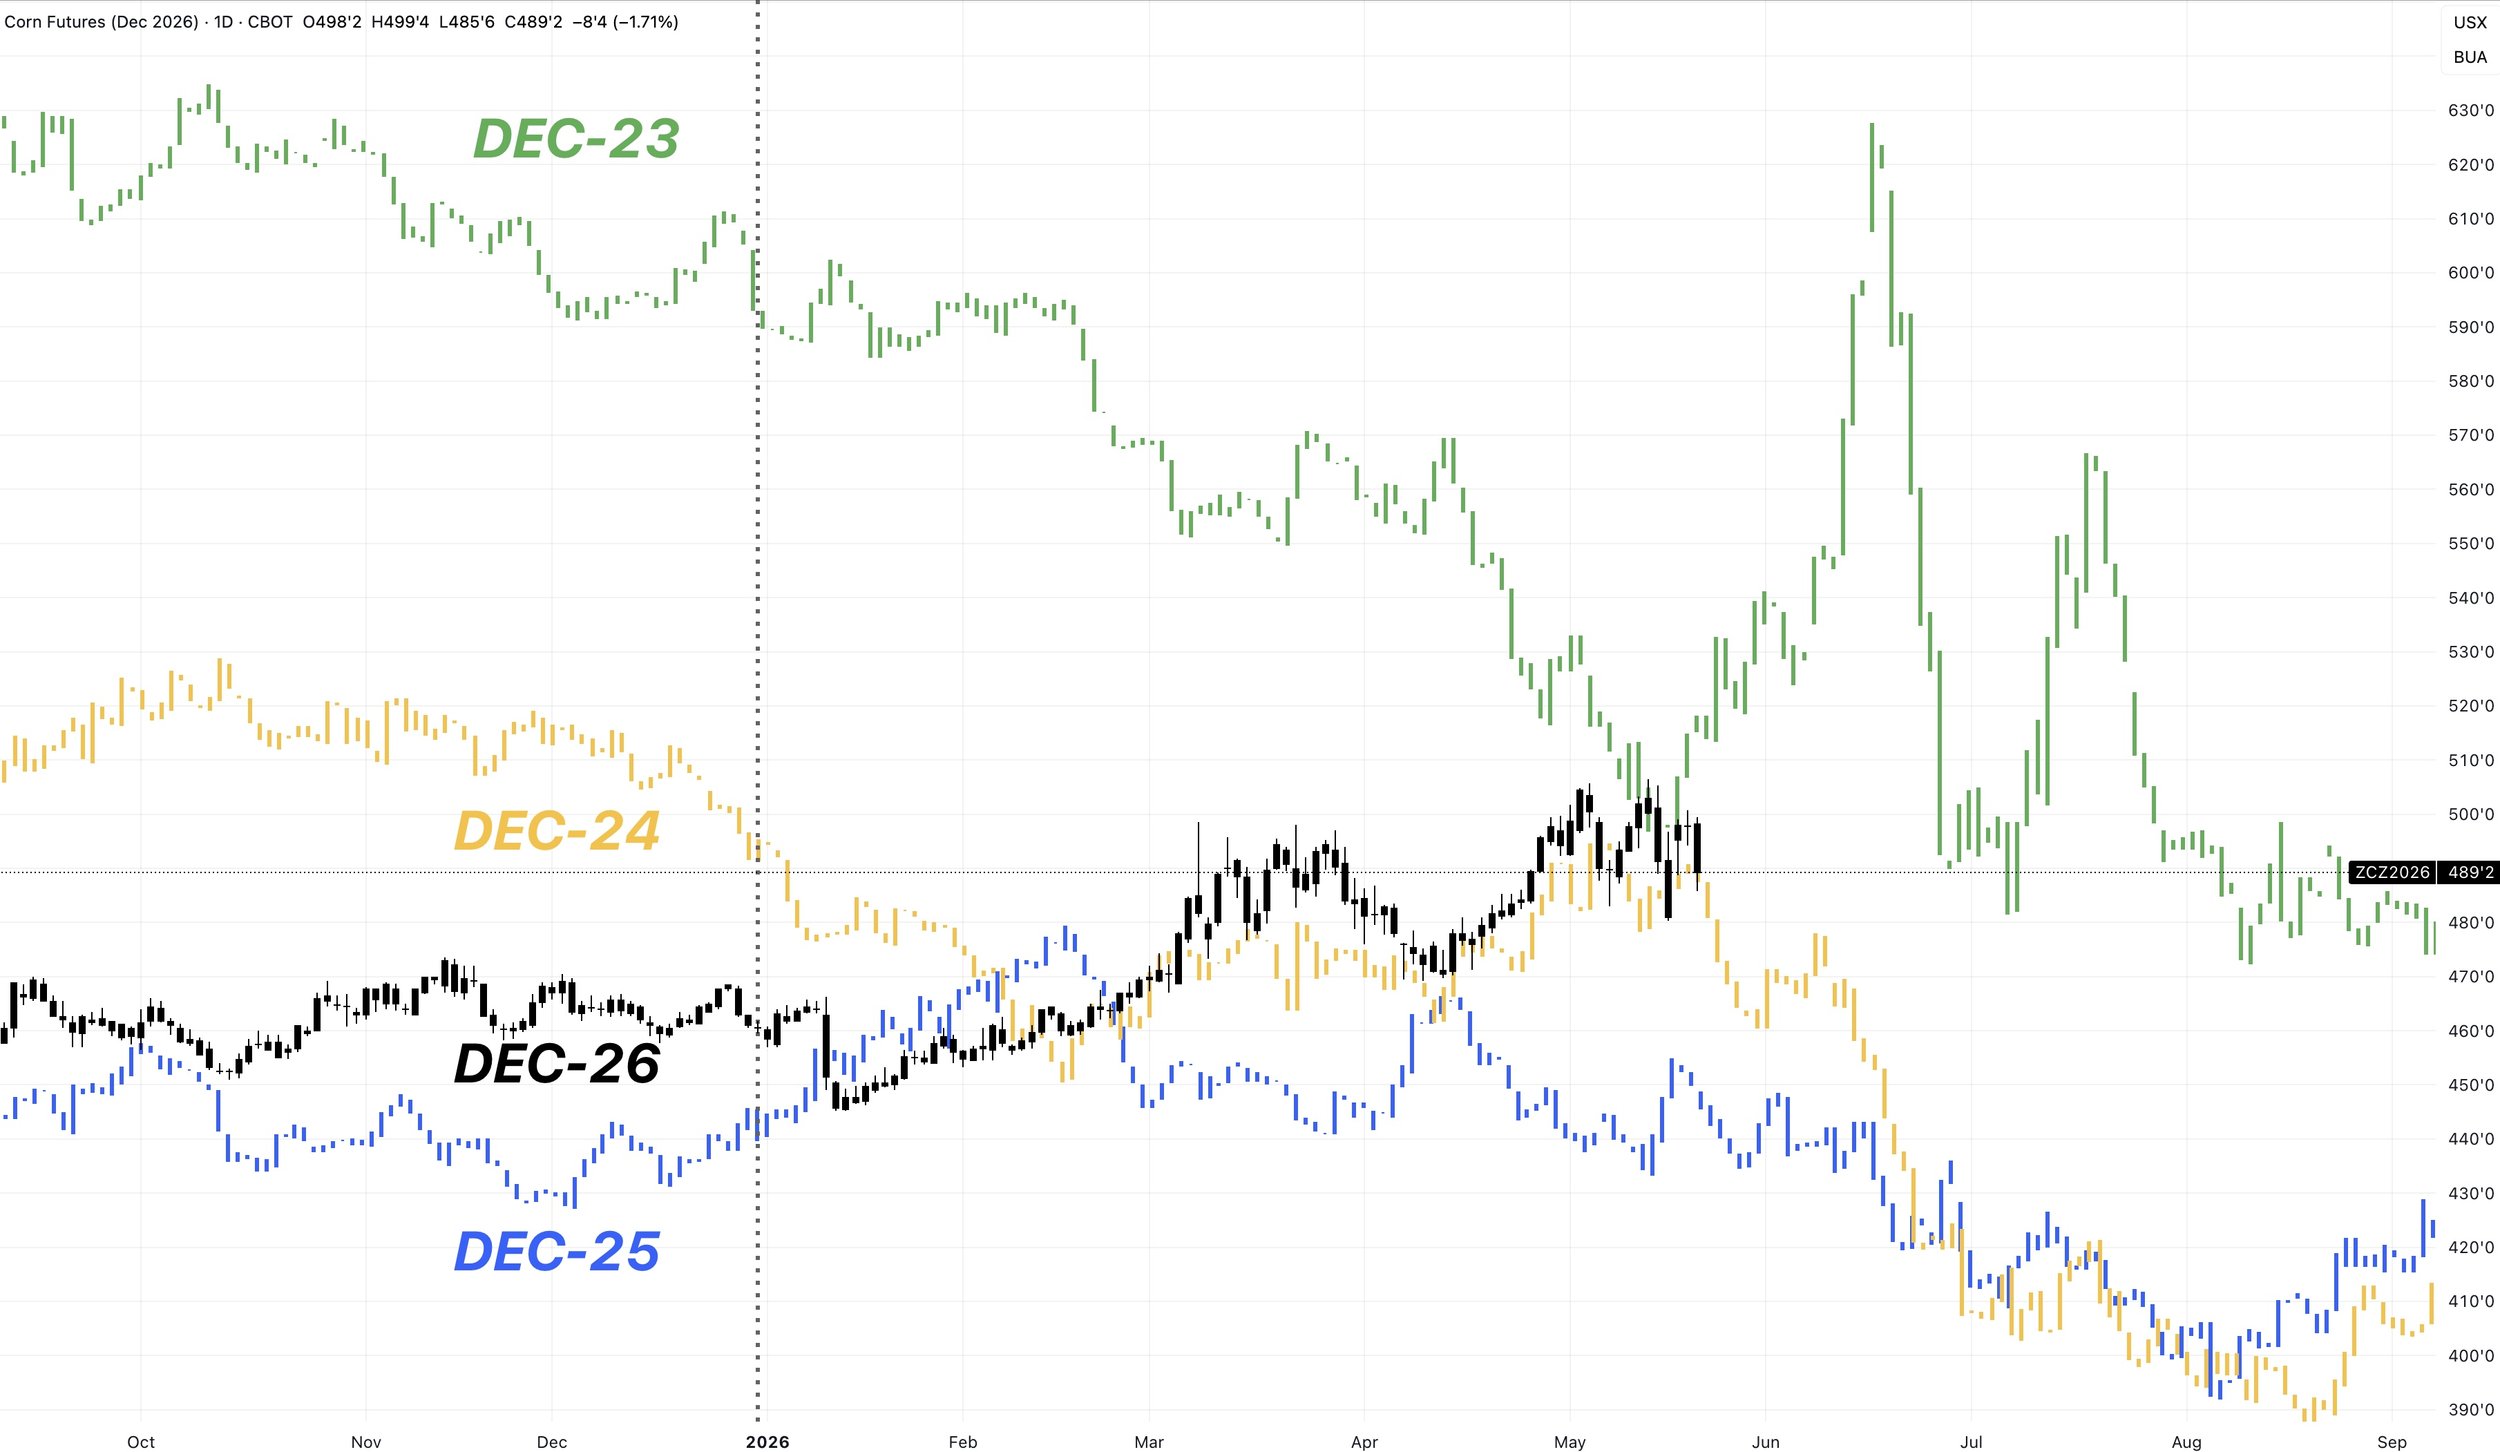
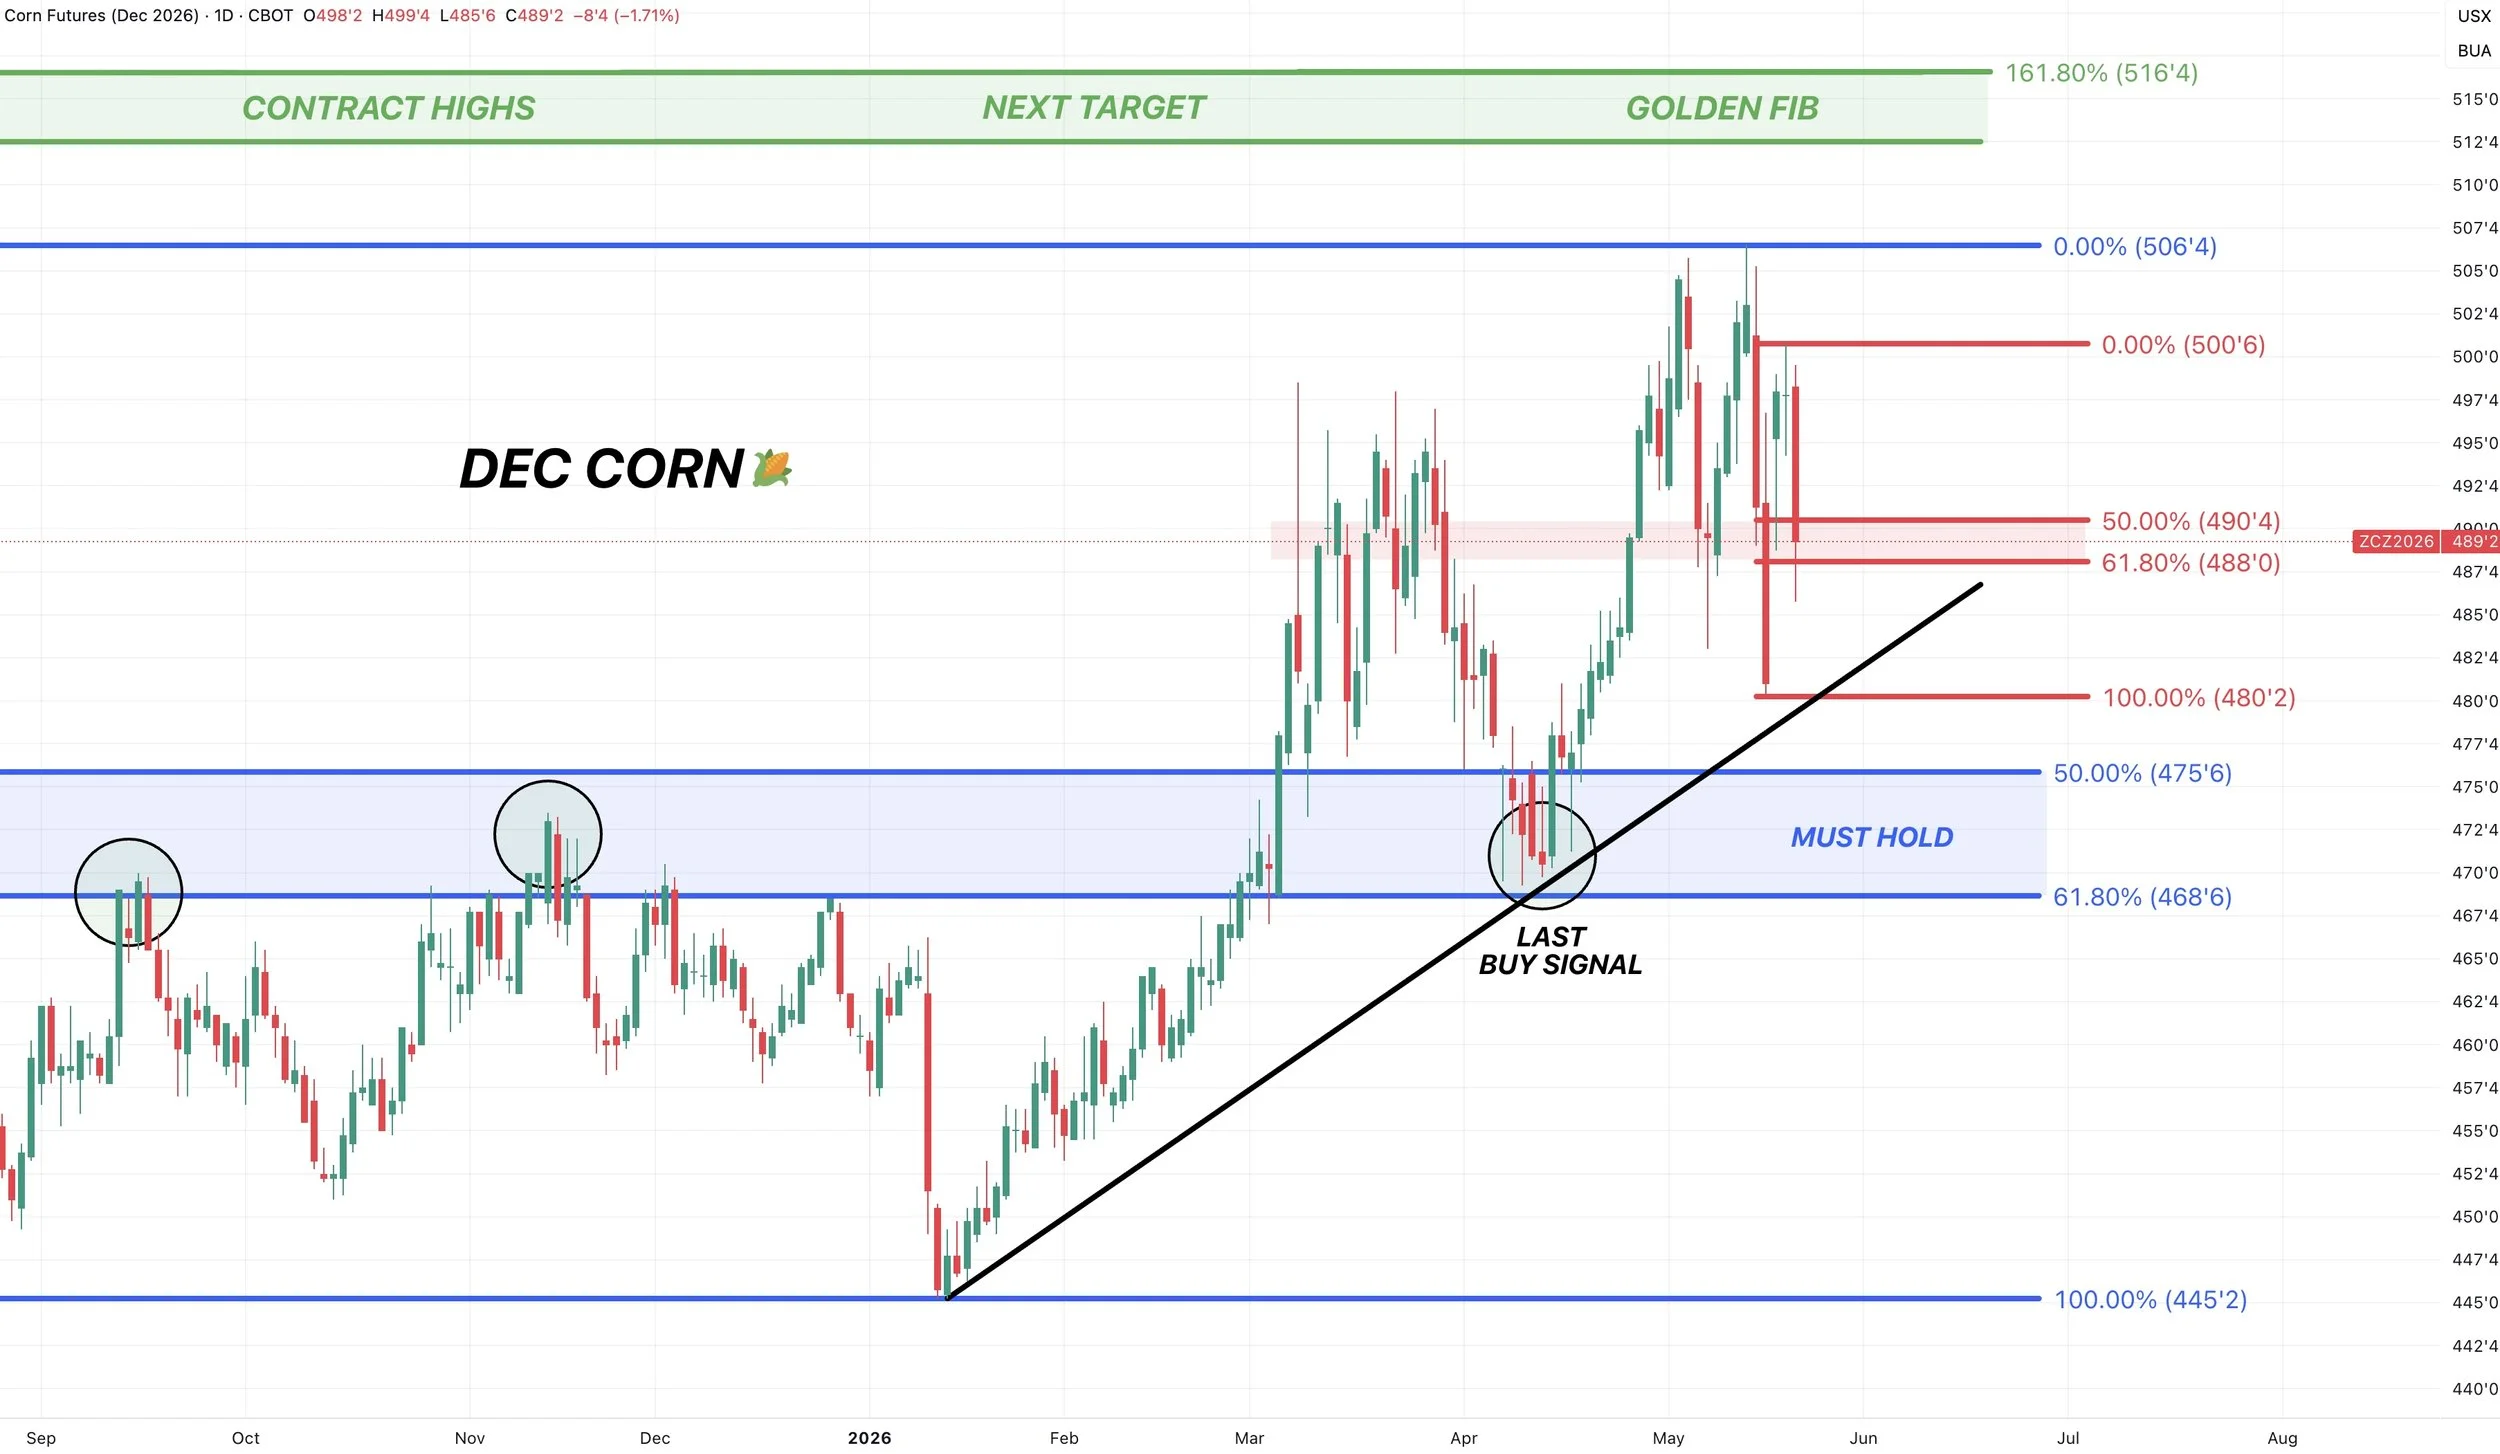
Dec Corn Chart:
We've already given back 61.8% of the recent bounce, but held the golden zone today.
That's going to be a key level we want to hold tomorrow, as if we break below it could spark a leg lower.
Chart still clearly remains in an uptrend for now. Even on last week's blood bath, we held some trendline support.
Soybeans
Let's play some devils advocate and go over the bullish and bearish factors in soybeans.
Bearish:
1) The China deal didn’t provide any more soybean purchases than the market was already aware of. As we've known that number for months. However, the deal did reaffirm to the market that China will be buying that 25 MMT.
2) Since I think corn acres are too high, it's reasonable to think that soybean acres are probably too low.
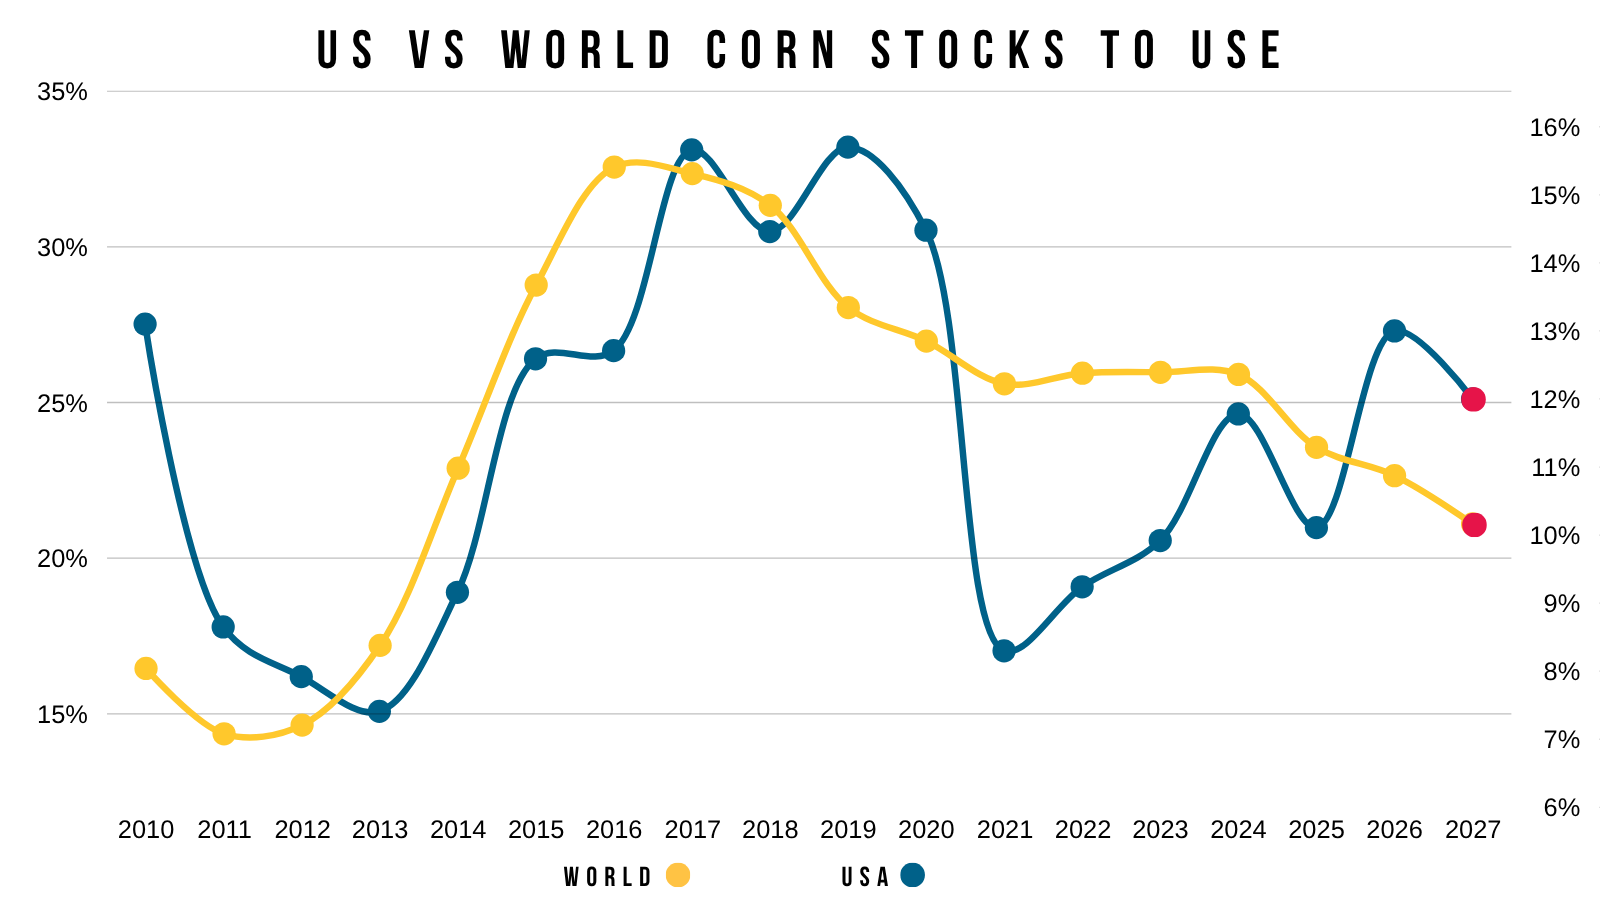
3) The world situation isn’t tight like it is in corn. It's not as tight as it was in the bull market, but it is the tightest it's been in 3 years.
Brazil's got a big crop. But the market's been well aware of this for months. That's nothing new.
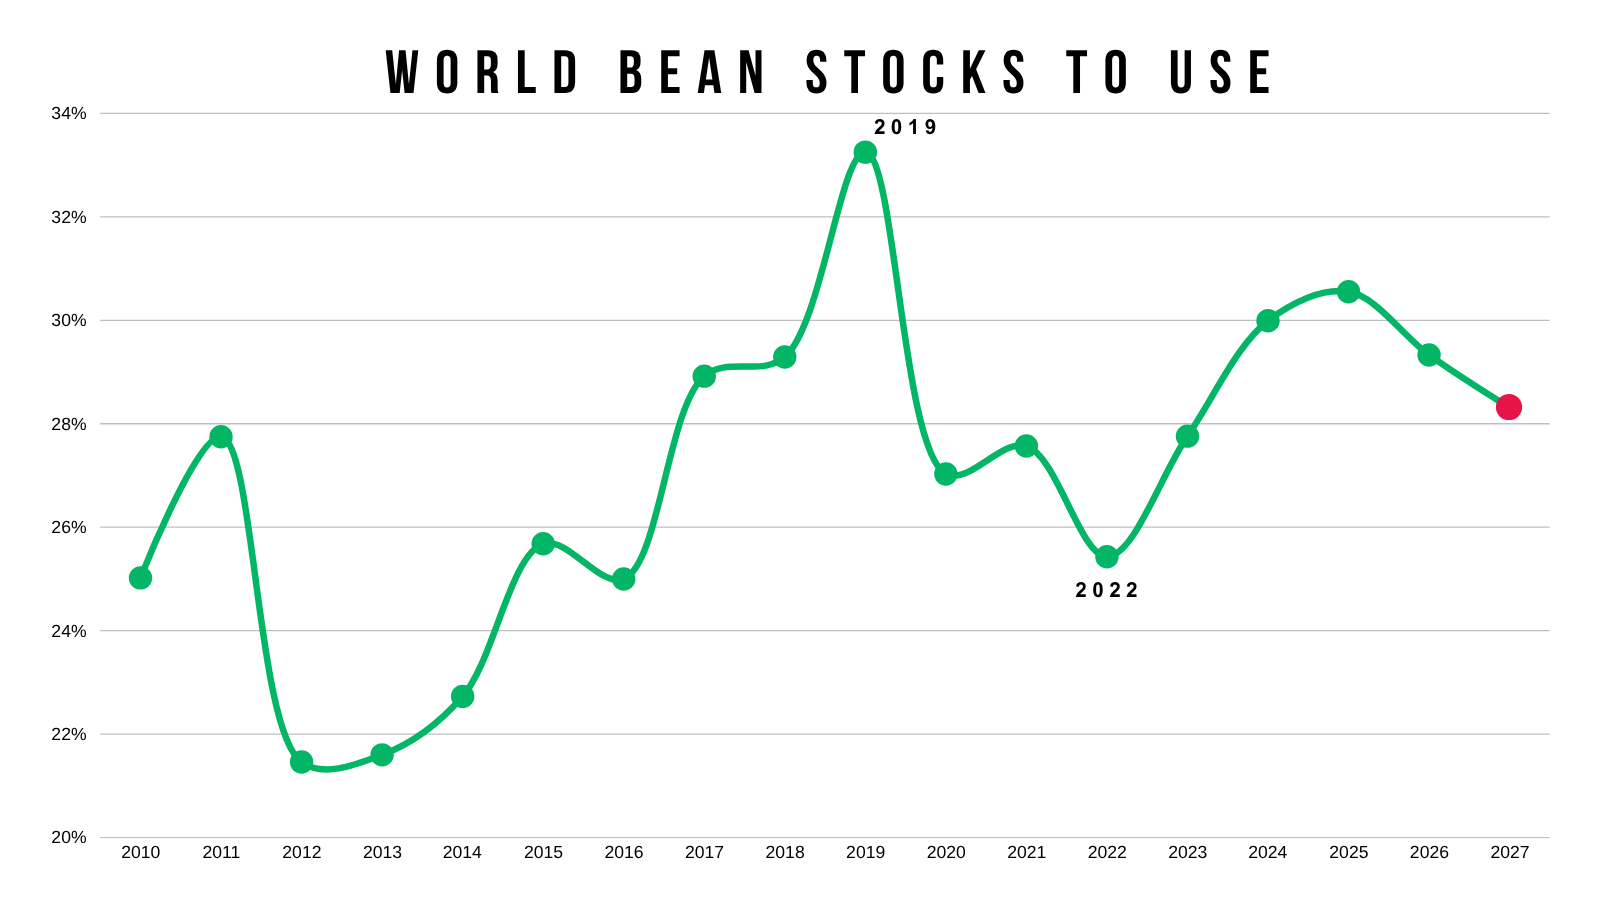
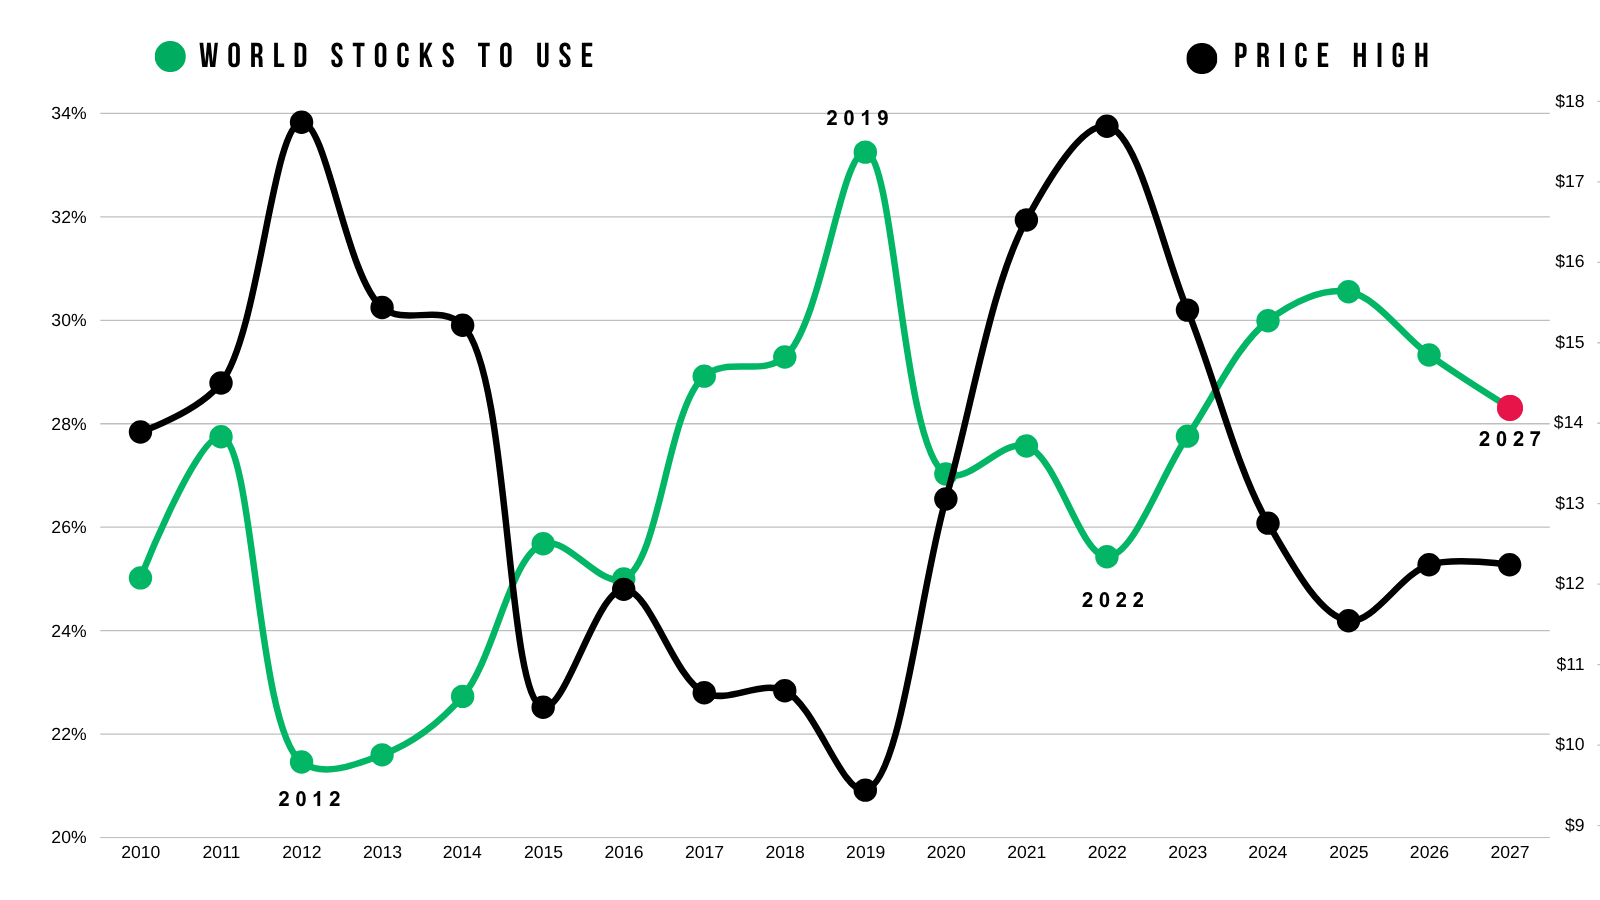
Something to note is that if you compare the world stocks to use ratio vs the highest price of the year, they do tend to have an inverse correlation.
2012 and 2022 we saw a tight world situation and high prices.
2019 we saw a lose world situation and low prices.
2025 we saw the situation loosen back up so prices struggled.
The current situation isn’t as bearish as it was the last two years, but it's not mega bullish either.
4) The key growing regions haven’t had an issue with a lack of moisture, and seasonally we do tend to fall within the next month or so if there are no issues in production.
Bullish
The story is in new crop.
1) Even though acres are probably too low, there really isn’t this massive room for error on the new crop balance sheet unless we raise yet another record yield.
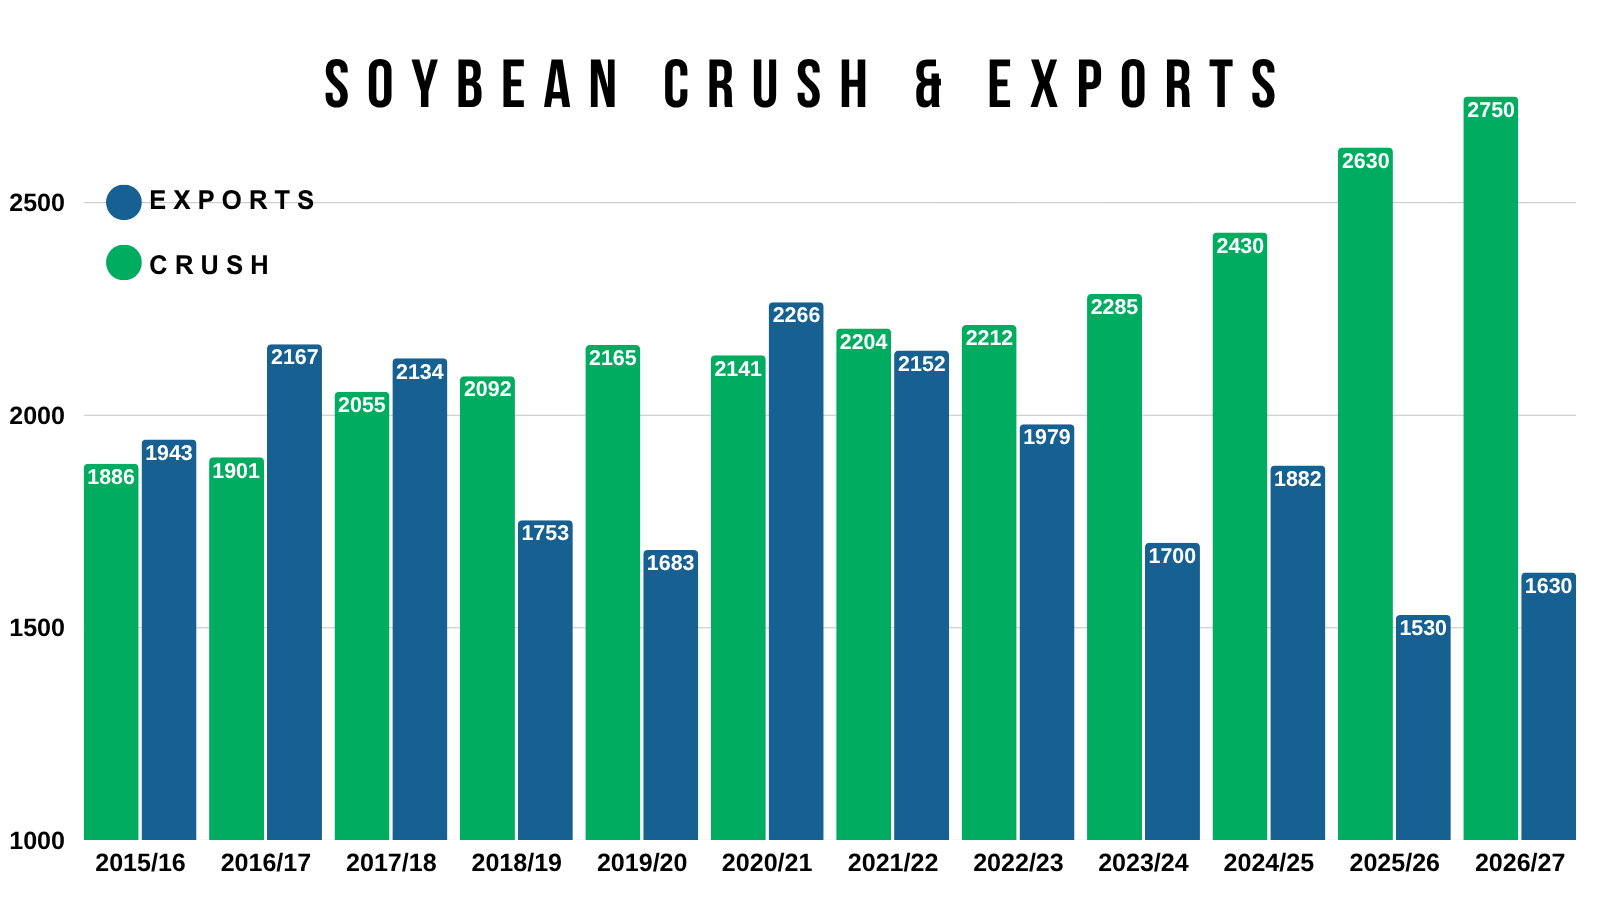
2) Crush margins certainly aren’t hurting the demand case for soybeans.
They're at an all-time high. Surpassing 2022.
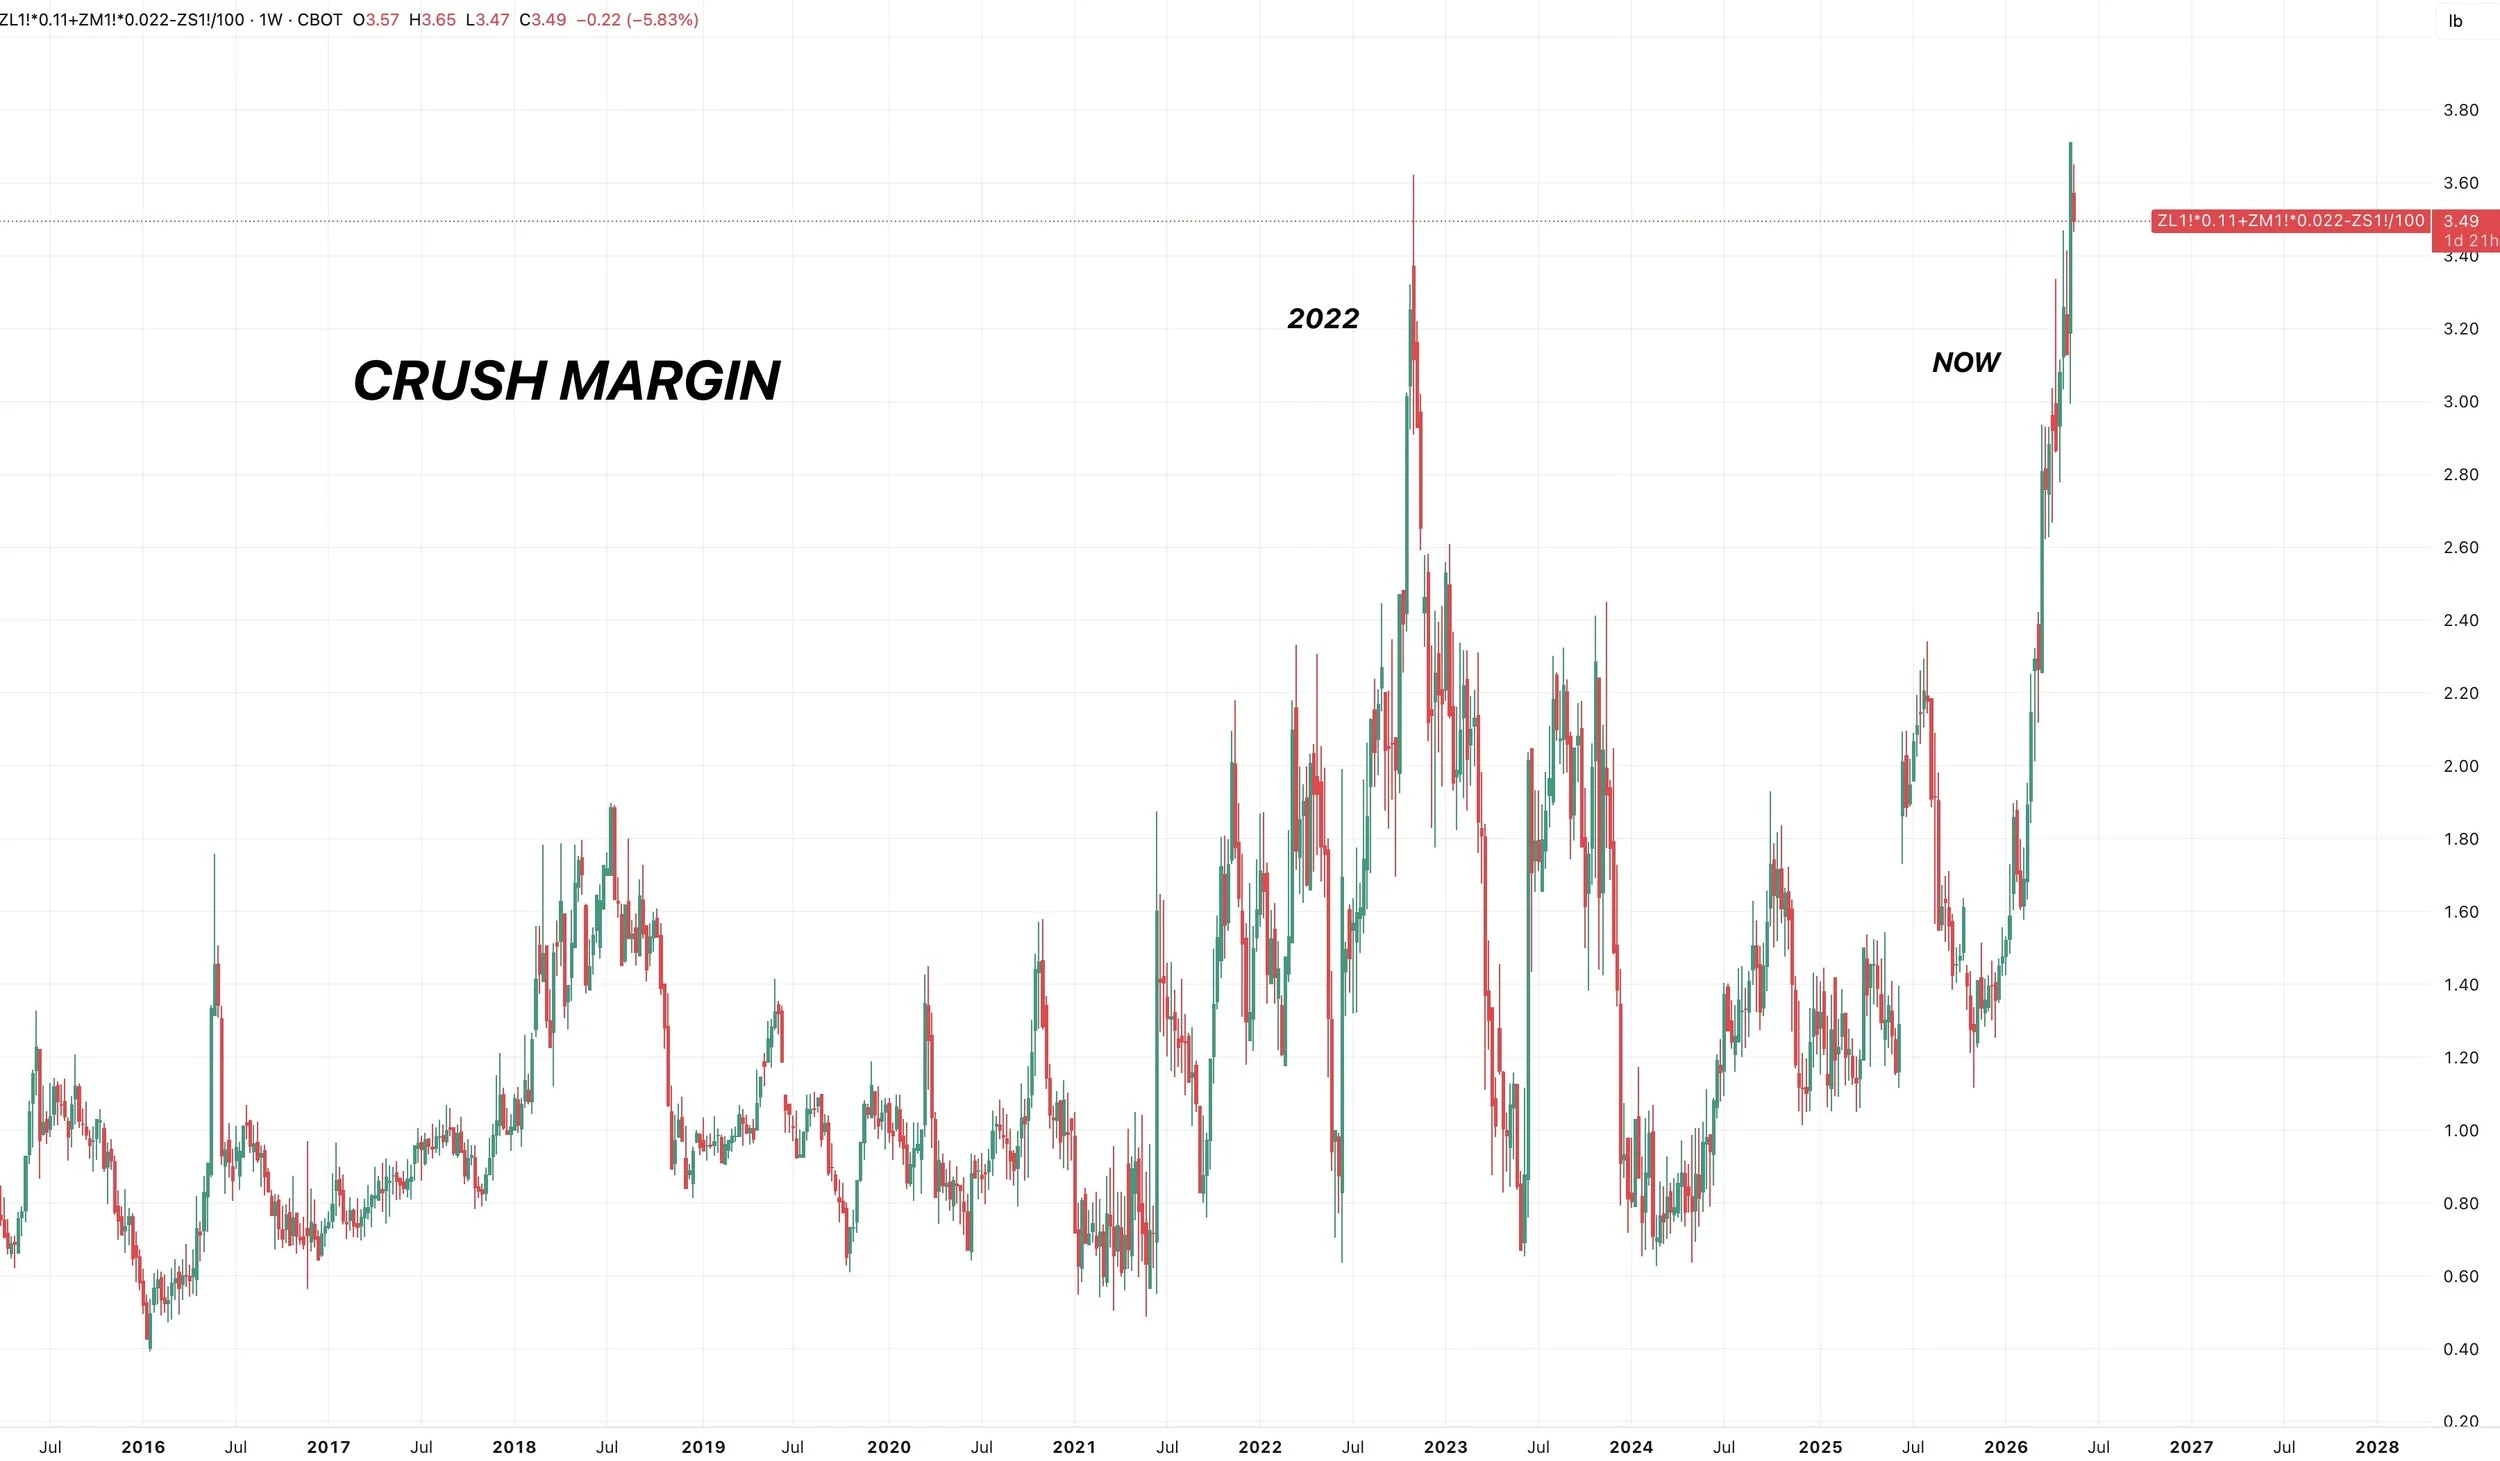
Here is a chart that compares export demand vs crush demand.
Exports have sucked no doubt, but crush has been through the roof. Helping offset that loss in export demand.
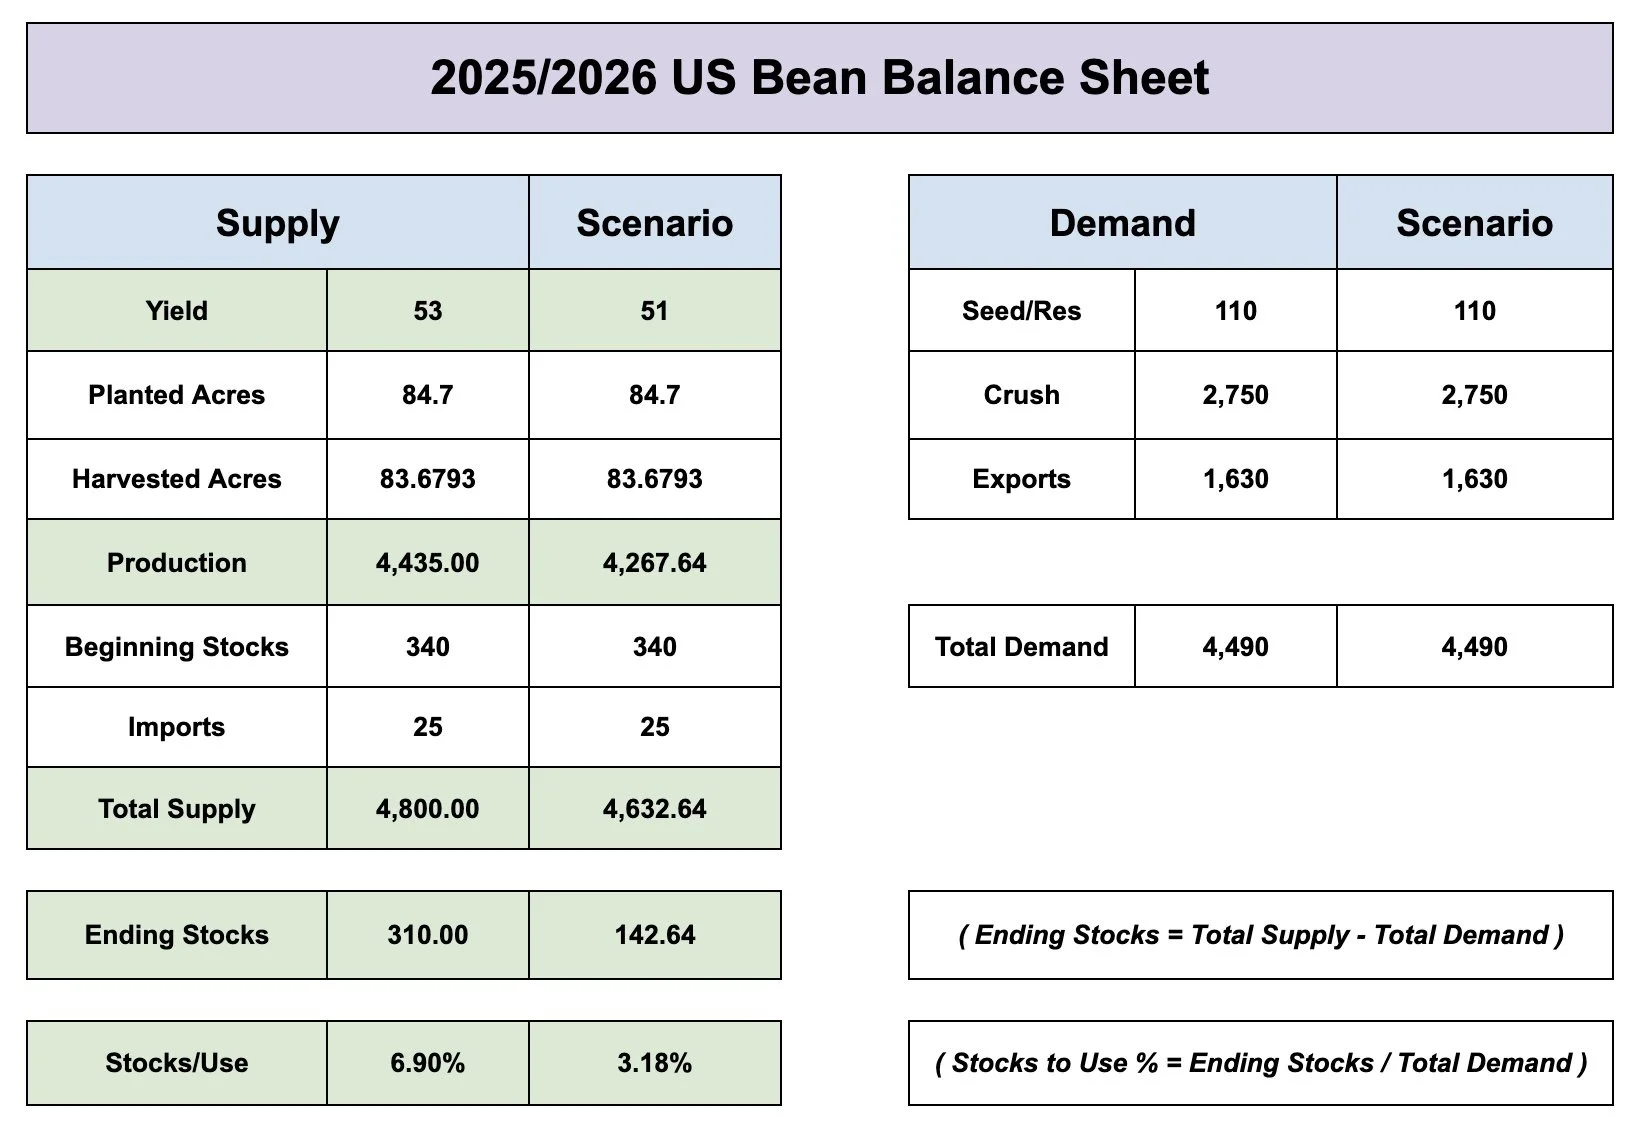
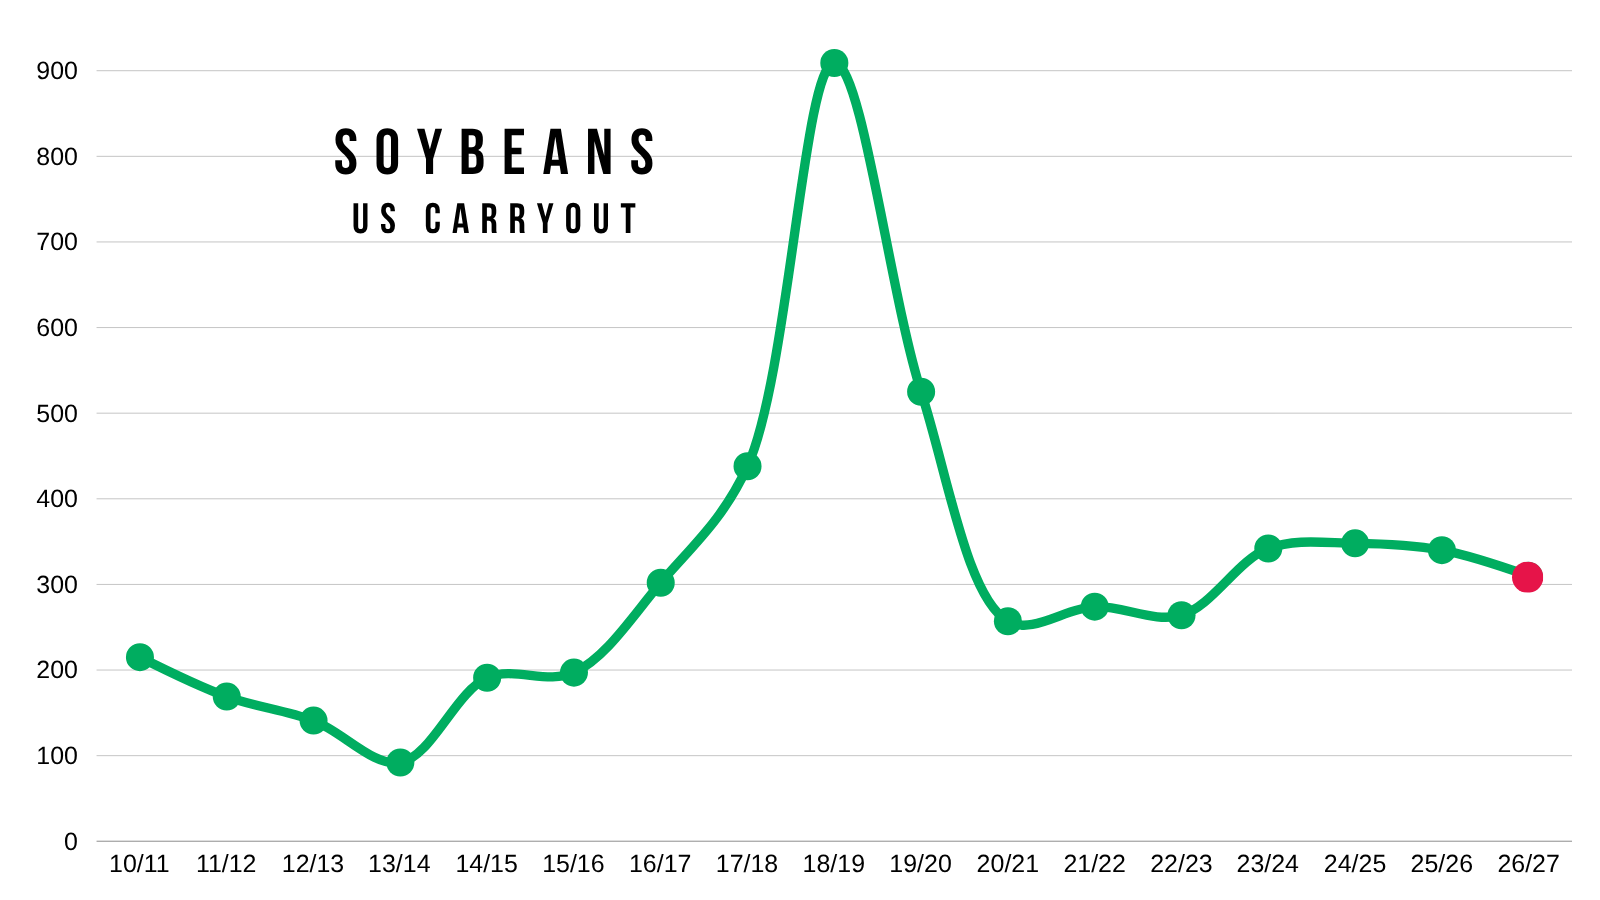
3) The new crop carryout is projected at 310 million.
Carryout had been stuck at 350 for the last 4 years in a row.
Even with the extra acres, carryout is expected to finally be tighter than it's been over the last few years.
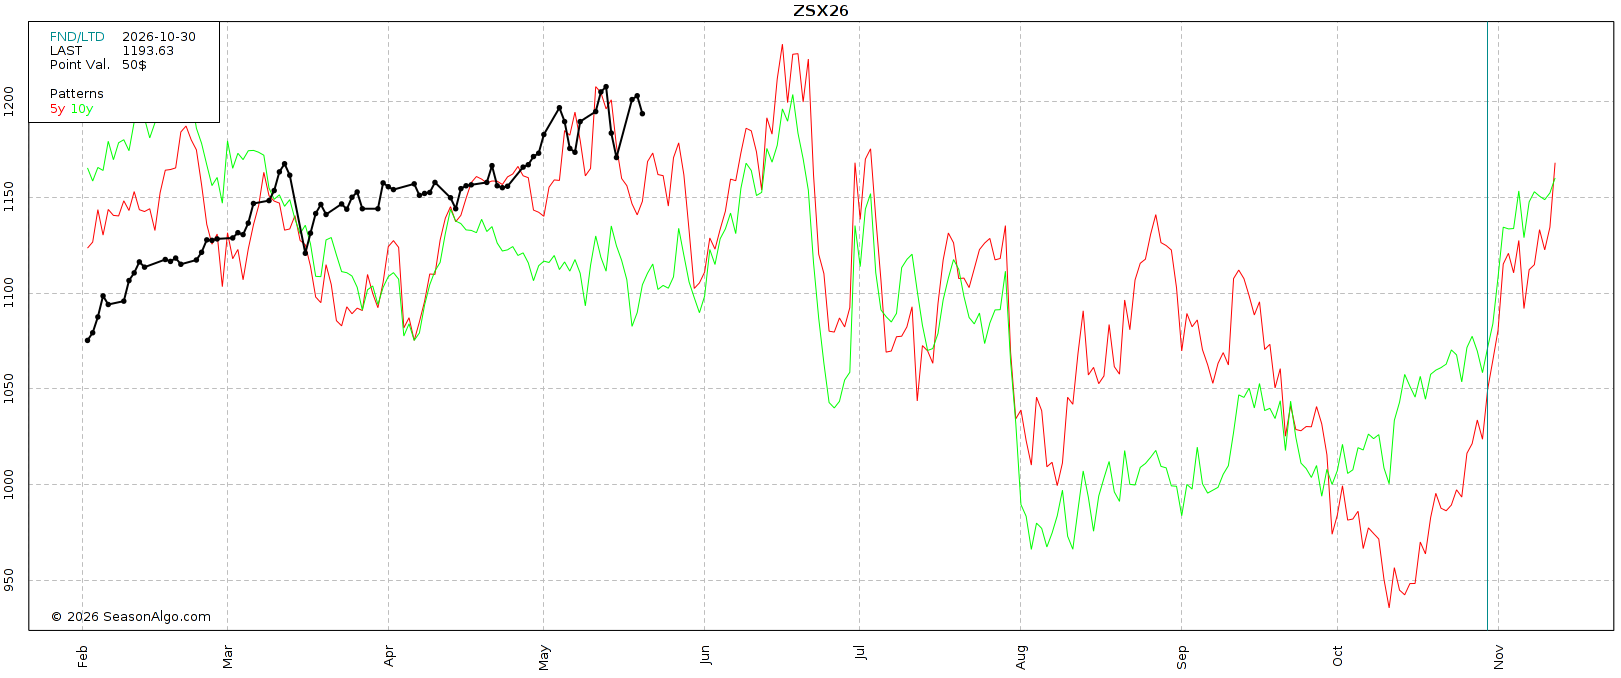
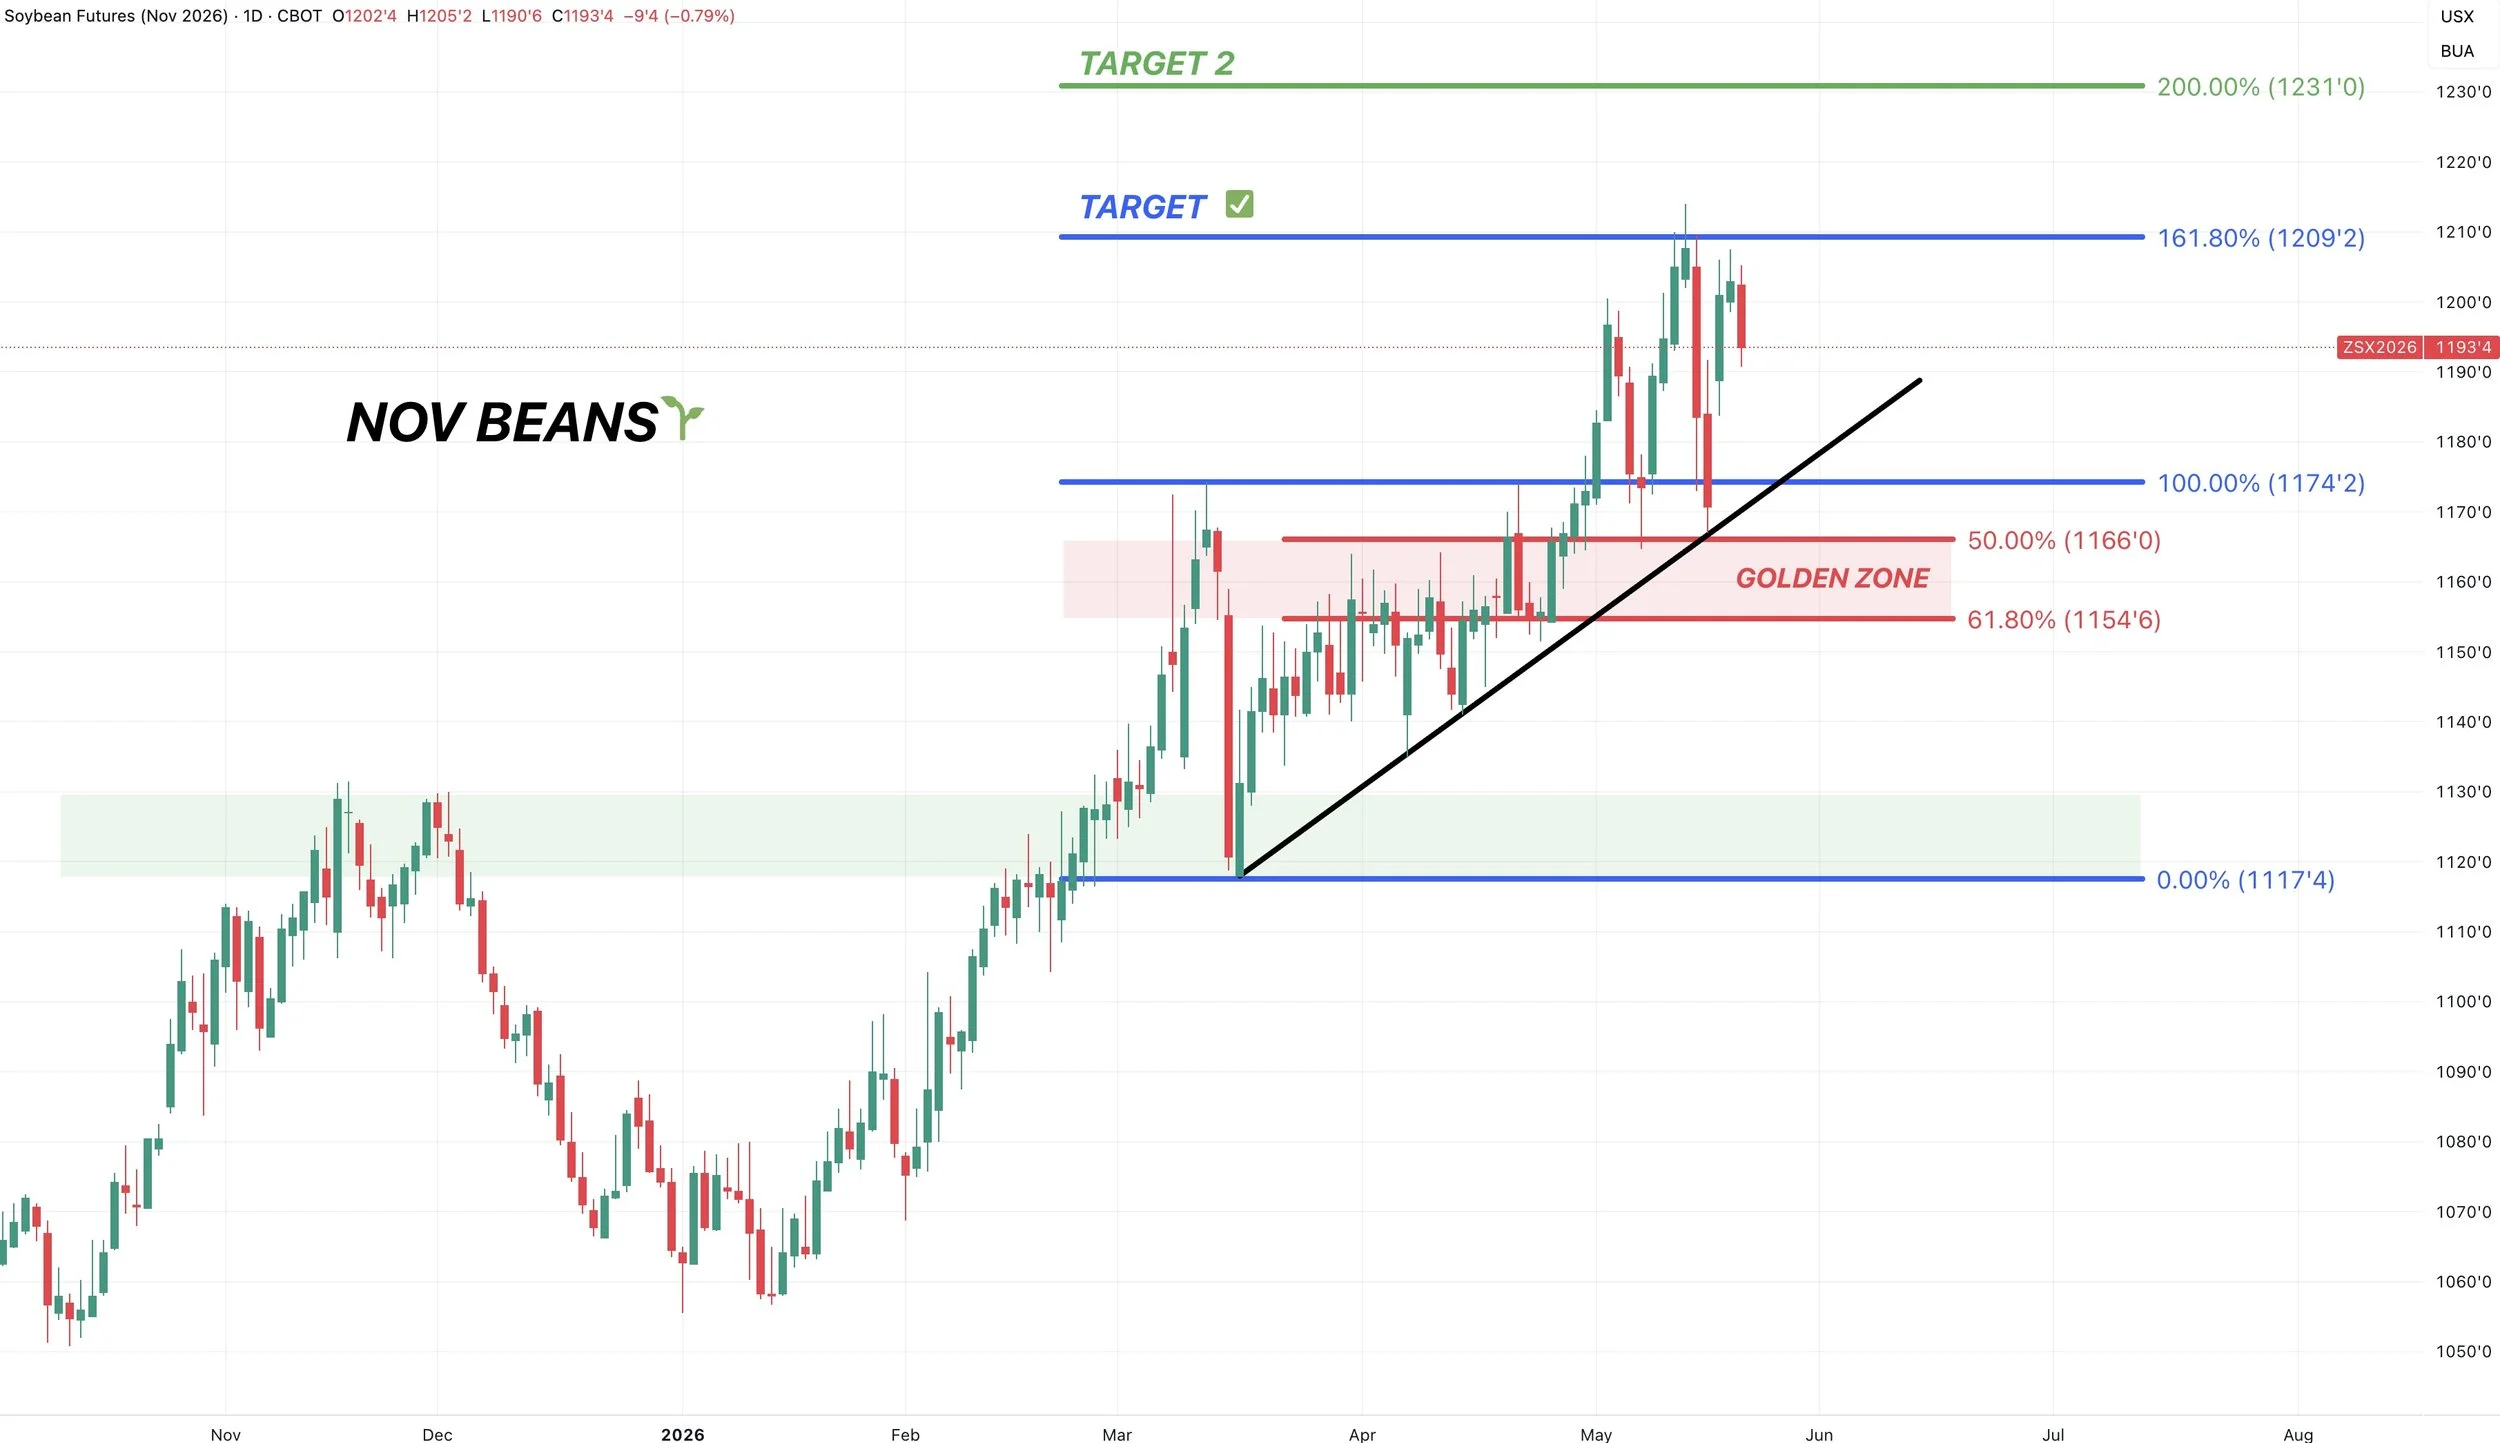
Nov Beans Chart:
We are back near that previous target at $12.09 from that sell signal last week if you missed it.
Which was the 161.8% fib from the March lows up to the March highs.
The secondary target if we get a leg higher is $12.30 and the 200% fib.
Last week we came down and perfectly turned that old resistance into new support after giving back 50% of the rally,
Overall, this chart still remains in a clear uptrend unless we break below $11.55. Which gives back 61.8% of the entire rally since March.
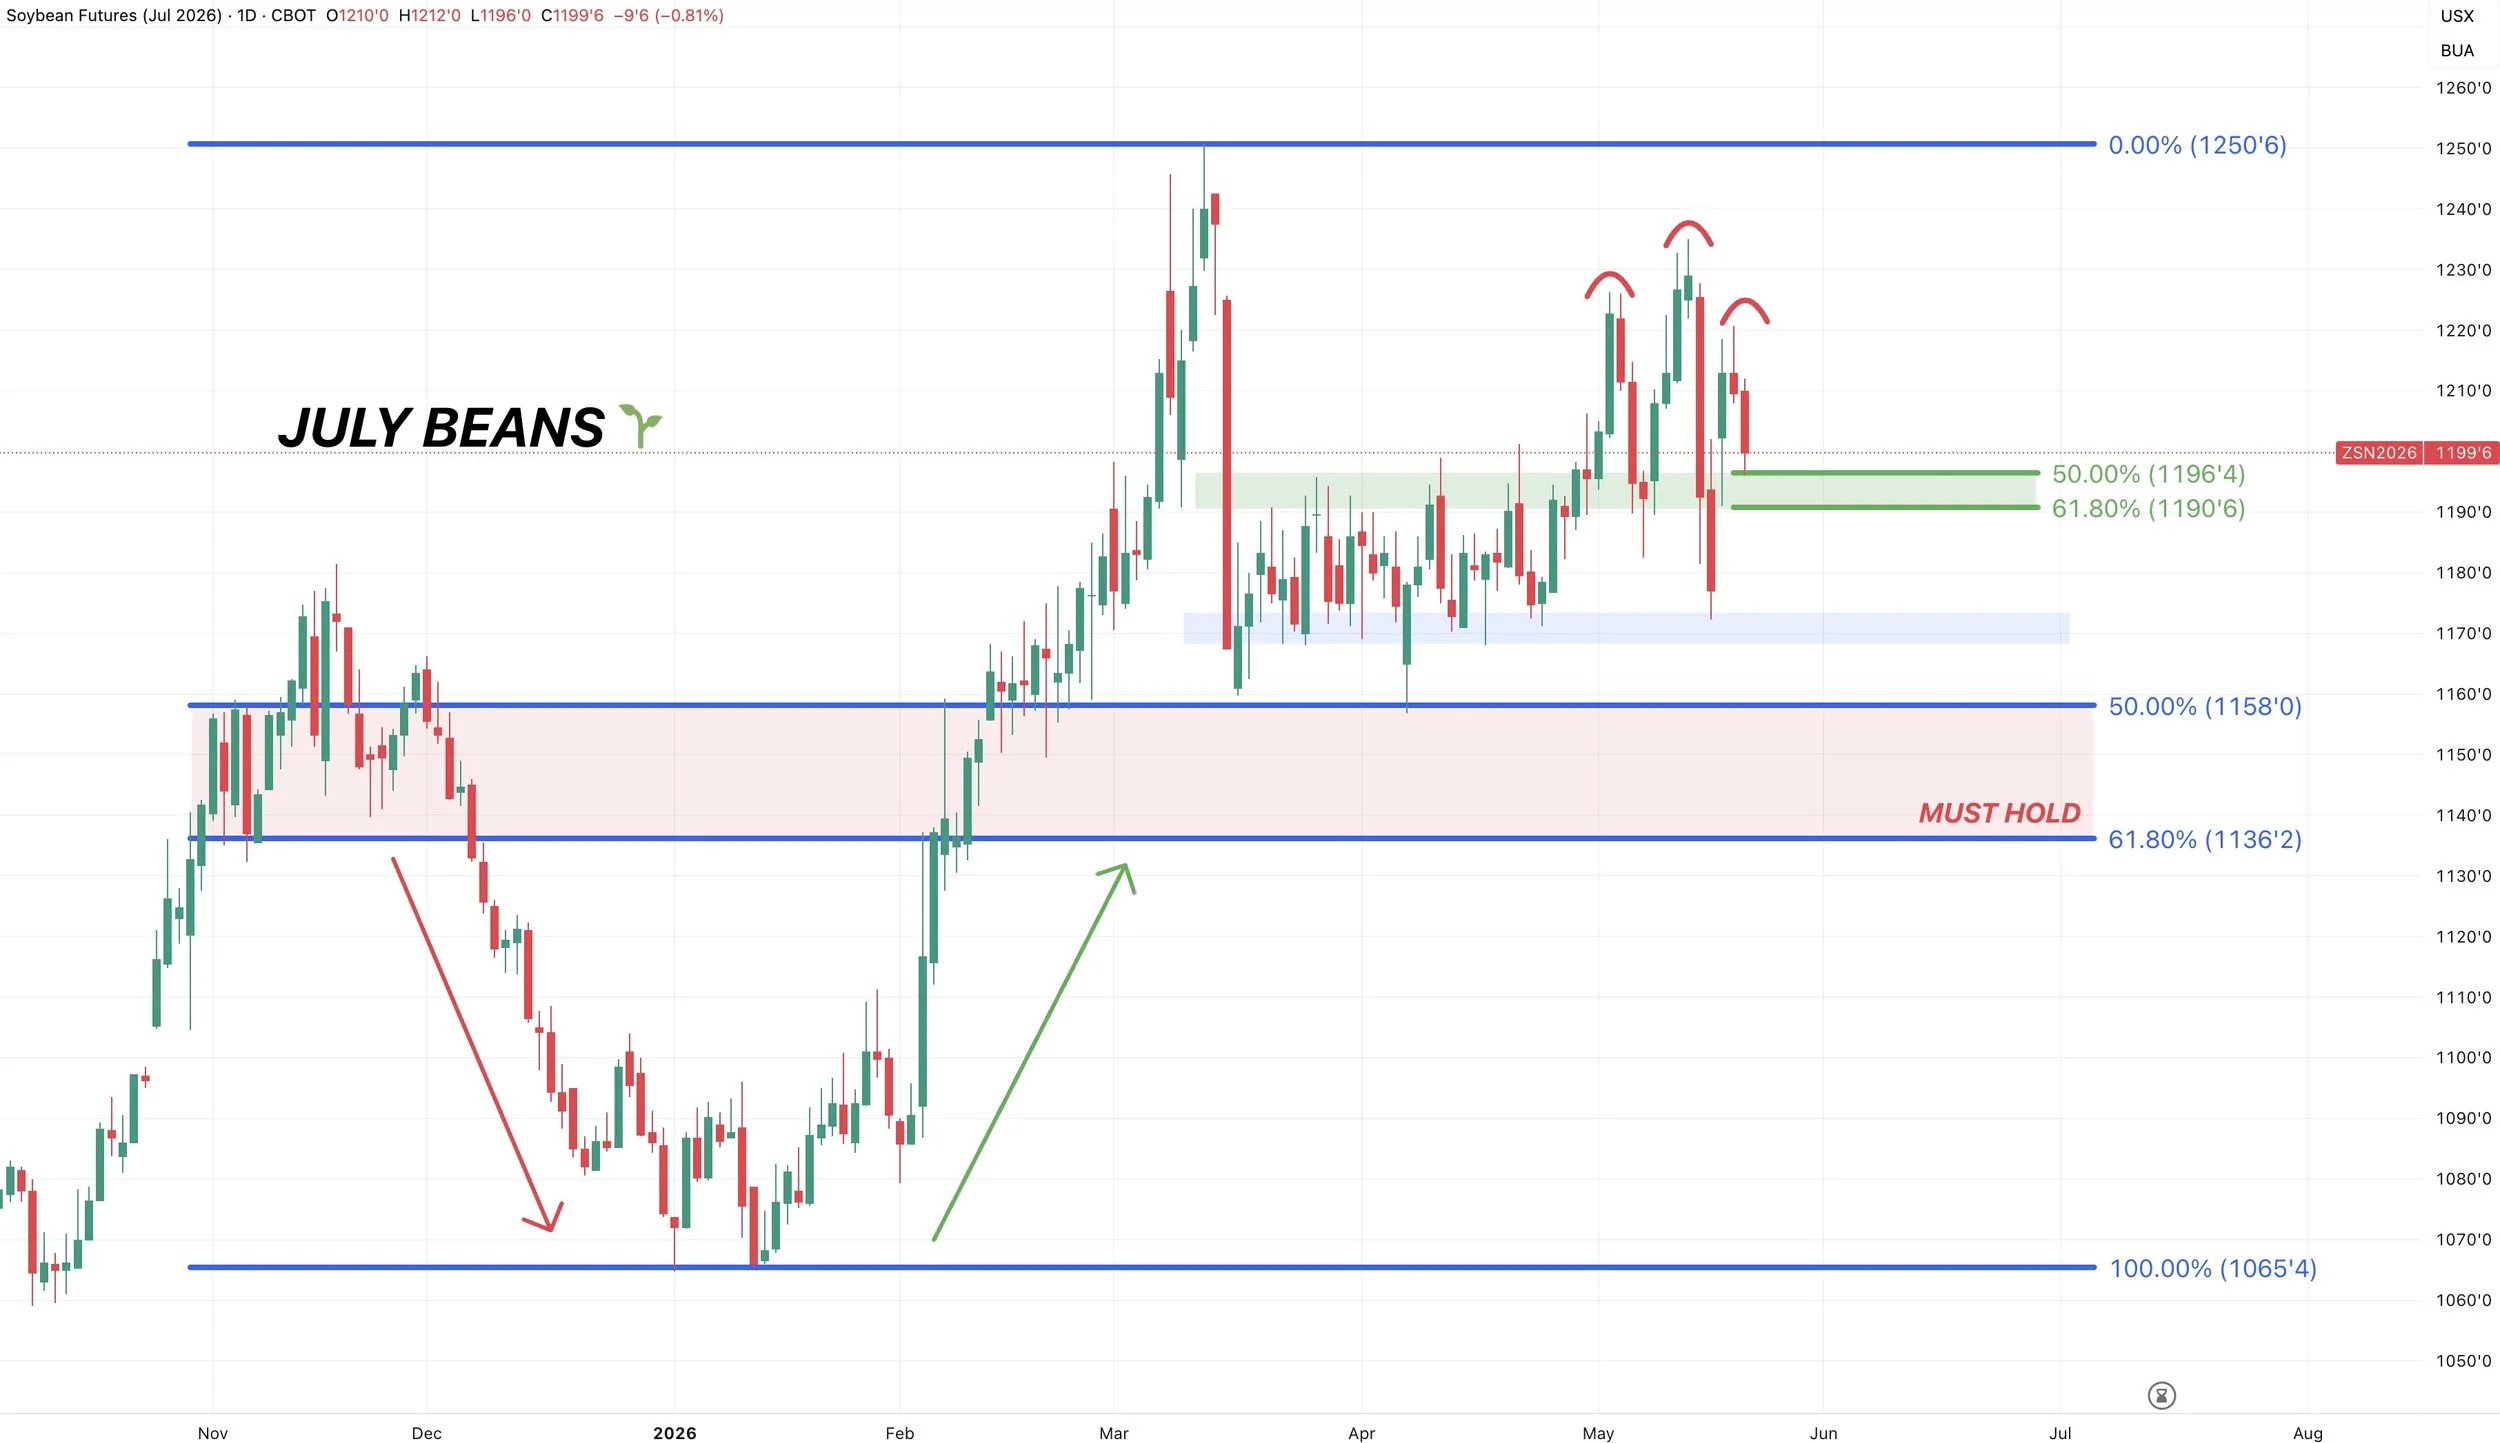
July Beans Chart:
At some support here.
Need to hold $11.90. That's prior resistance and the golden zone of the recent bounce.
Fail there and we likely test the bottom of the range and that $11.70 area.
Something to note is that we do have a potential head and shoulders pattern in place, which is viewed as a bearish pattern.
Need to hold $11.90 to prevent pattern that from playing out.
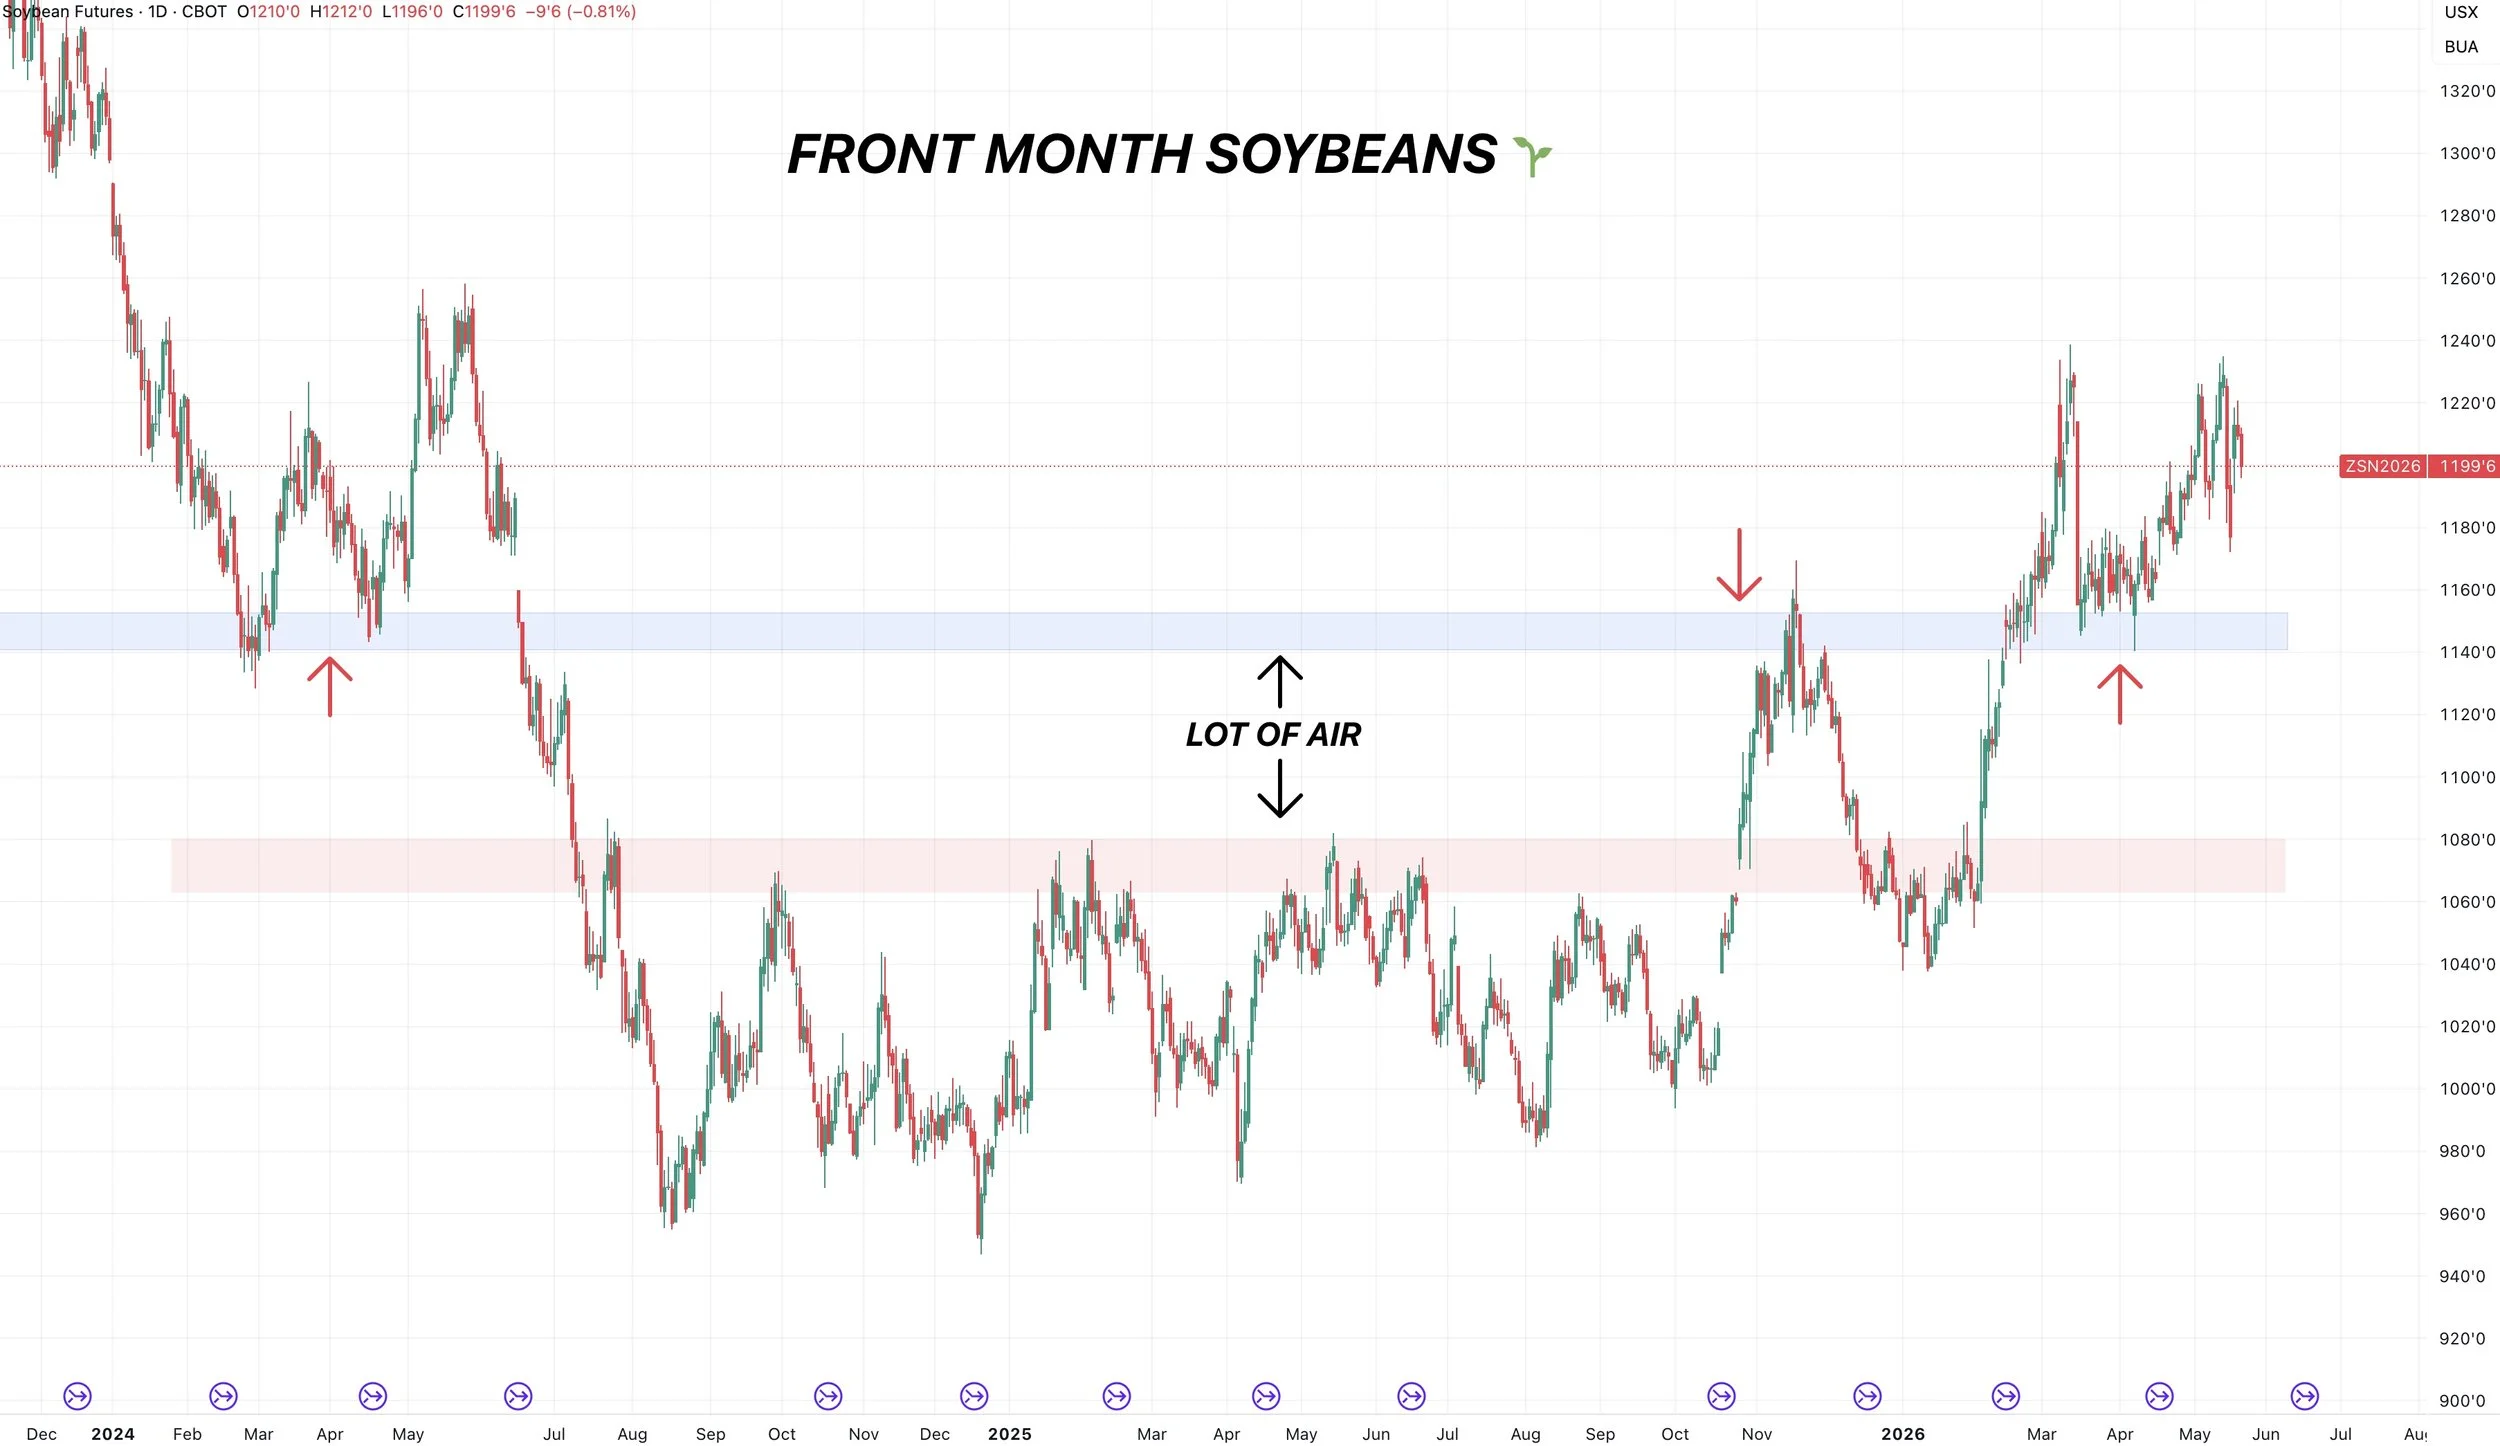
Big Picture Chart:
The overall long term trend remains higher unless we break below $11.40 on the front month contract.
As there is plenty of air below that level.
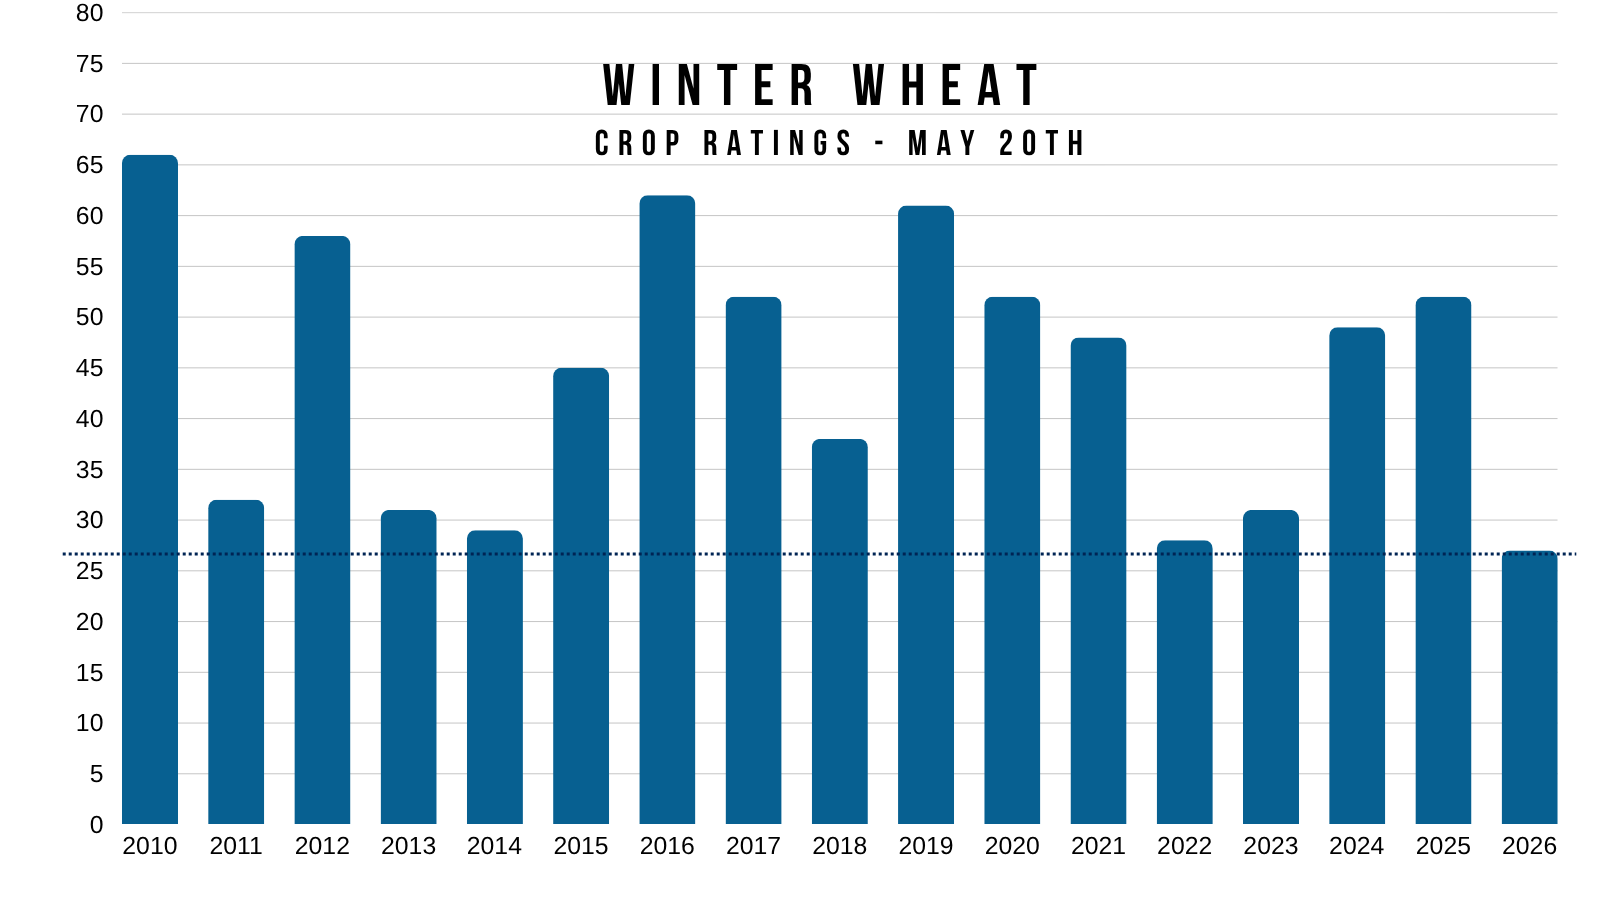
Wheat
Crop conditions once again came in at their worst levels ever.
Rated just 27% good to excellent nationally.
I've shown just how bad the good to excellent rating is for the top HRW growers countless times.
But here is their poor to very poor ratings to give you another perspective.
The average poor to very poor rating for these top 5 growers is 63% poor to very poor.
By far the worst of all time. The next closest was 2022 at 52%.
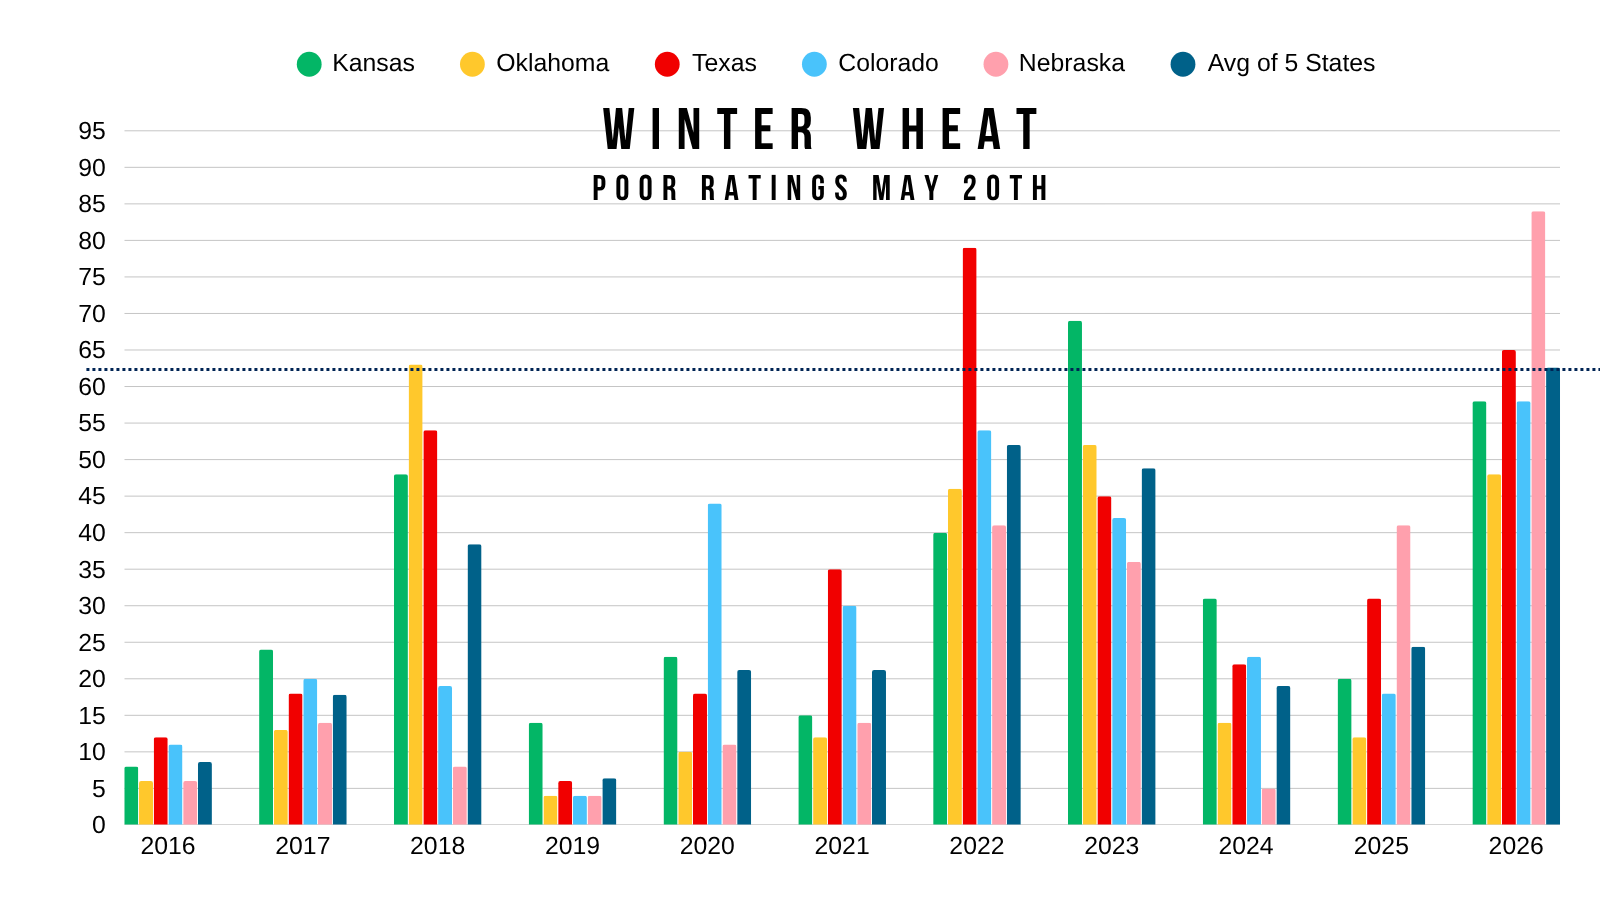
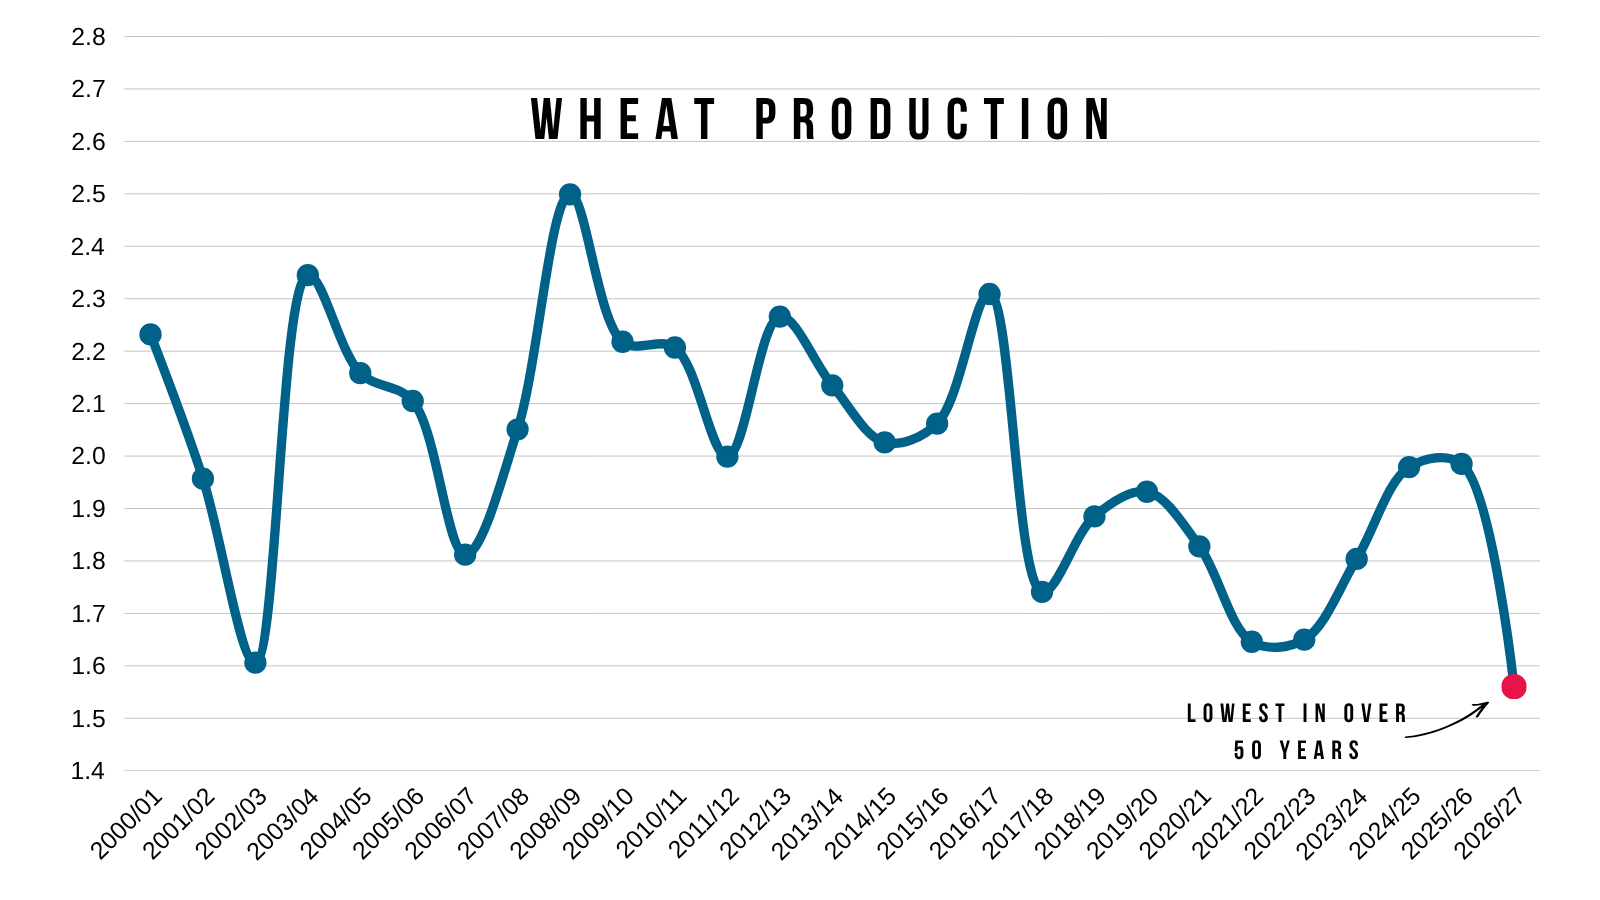
The crop is bad. Arguably the worst of all time.
Hence why US winter wheat production is forecasted to be at an all time low.
However, most of this story has largely been priced in for now.
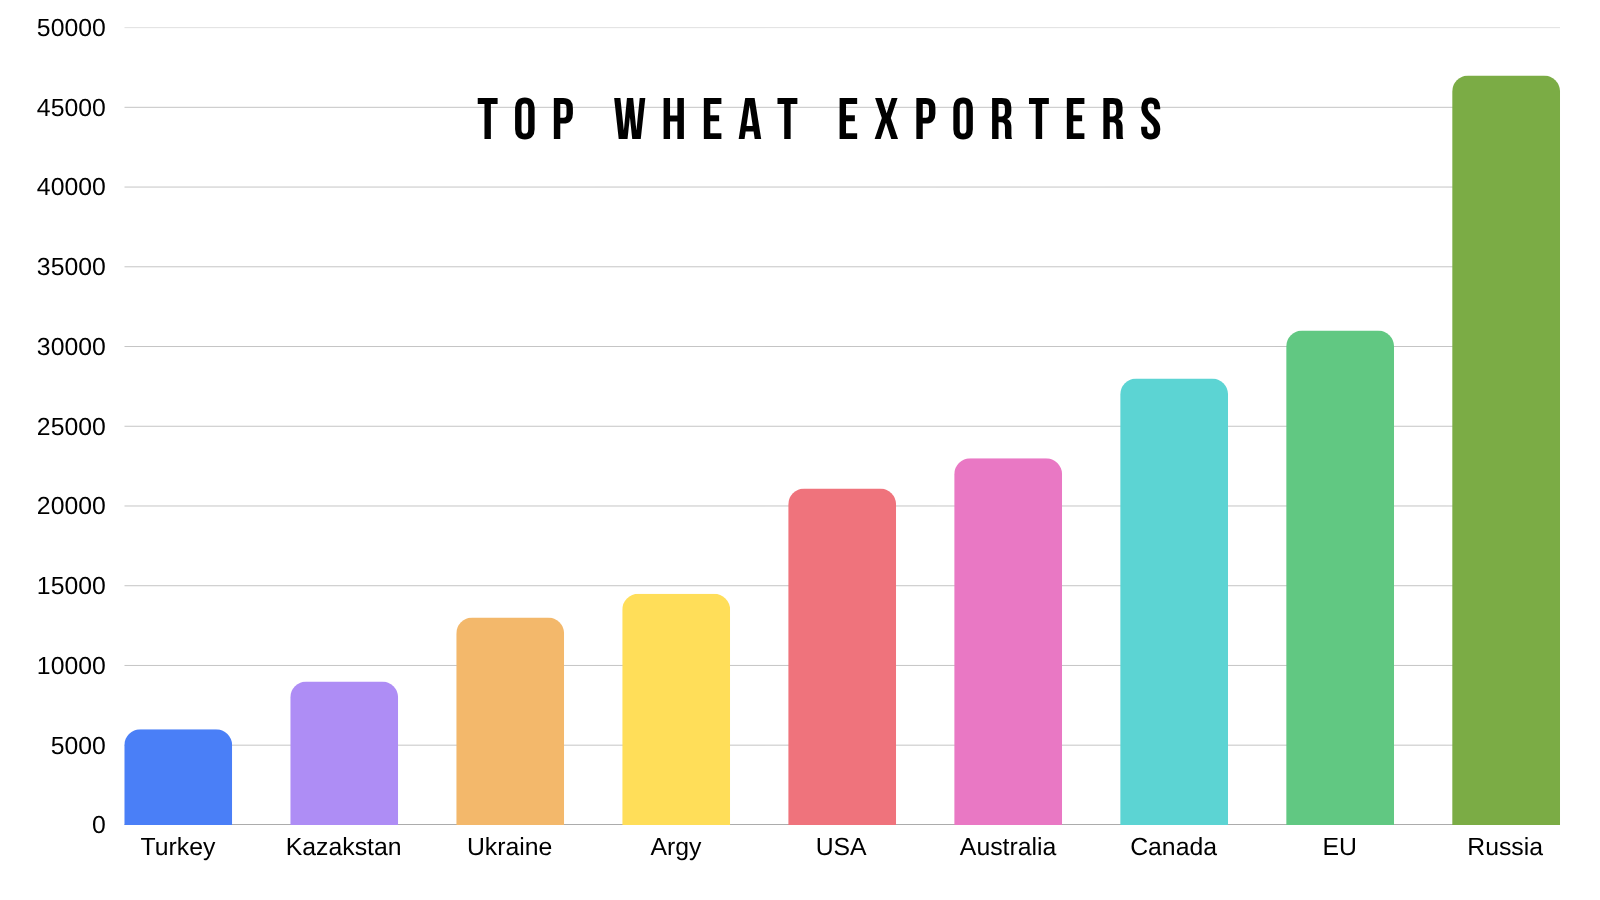
Yes, the US is relatively speaking a smaller player on the global market.
We are the 5th largest exporter of wheat.
So a problem here doesn’t impact the world as much as an issue in Russia would. As we export about half of what they do.
There is just simply wheat grown all over the world.
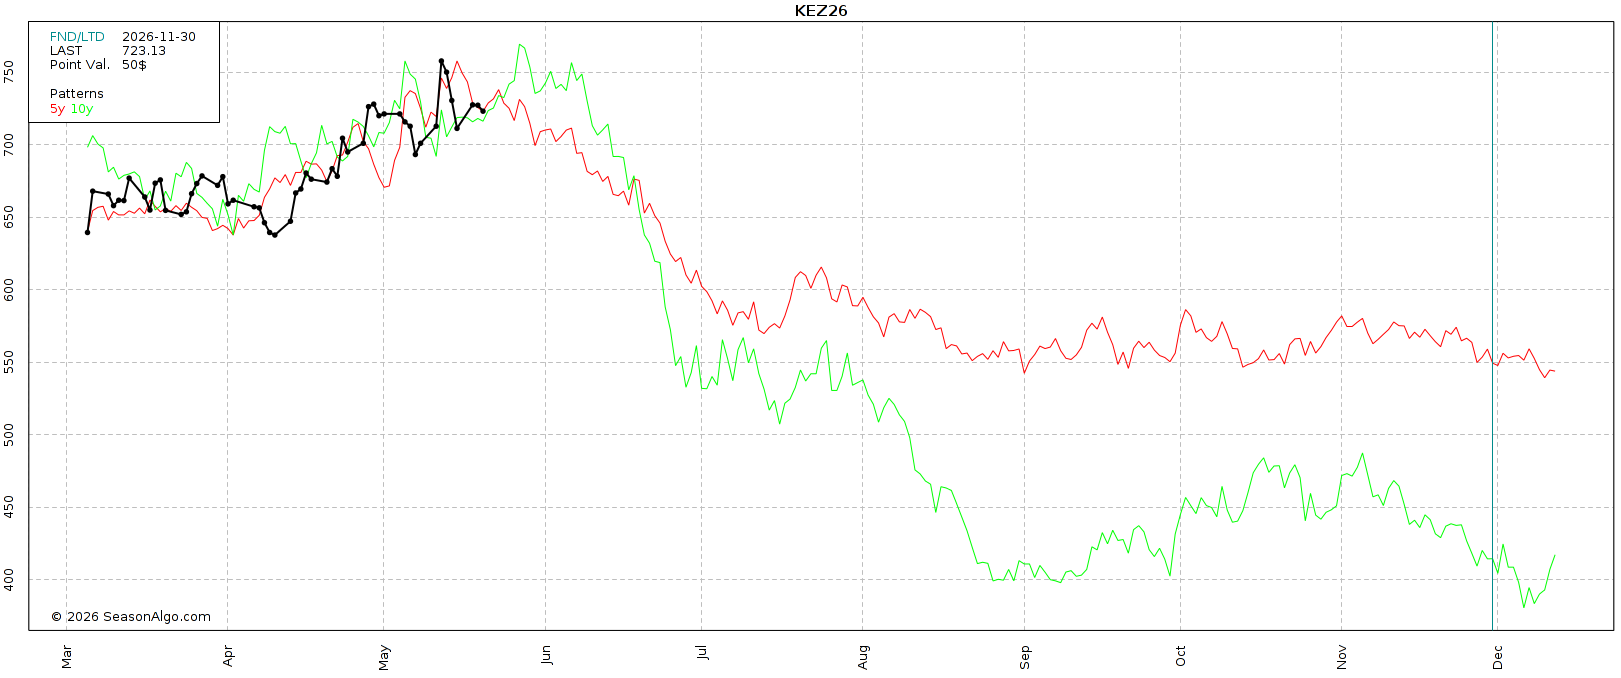
Seasonally, this is about the time of year where wheat starts to fall apart.
So if you have to move wheat off the combine or haven’t sold any at our prior targets, it probably makes sense to be defensive.
Long term, like in corn I think wheat has plenty of potential.
But short term, we've already priced in several factors. So that adds risk.
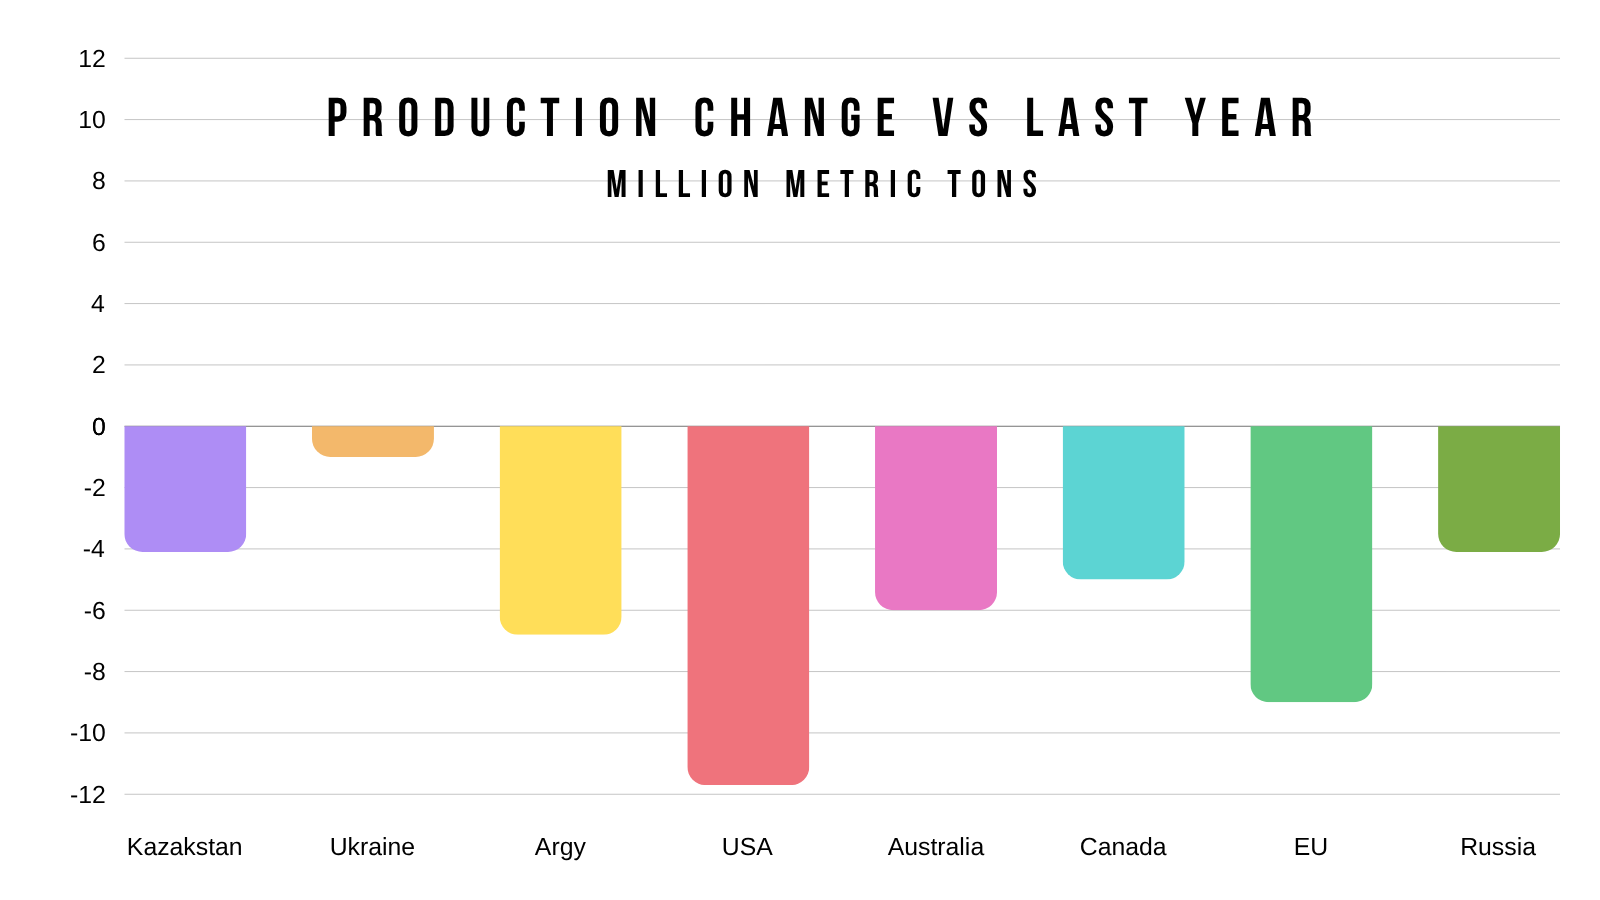
I think the world story is underrated long term.
Everyone argues that globally we have plenty of wheat.
Yet.. every single major exporter of wheat is projected to produce less wheat than they did last year.
If this fertilizer situation has an even bigger impact than realized, those numbers might have to come down even further.
There are reports of Australia alone looking to produce 40% less wheat than last year due to the fertilizer situation.
Seems like a potential big issue to me if this even remotely happens globally.
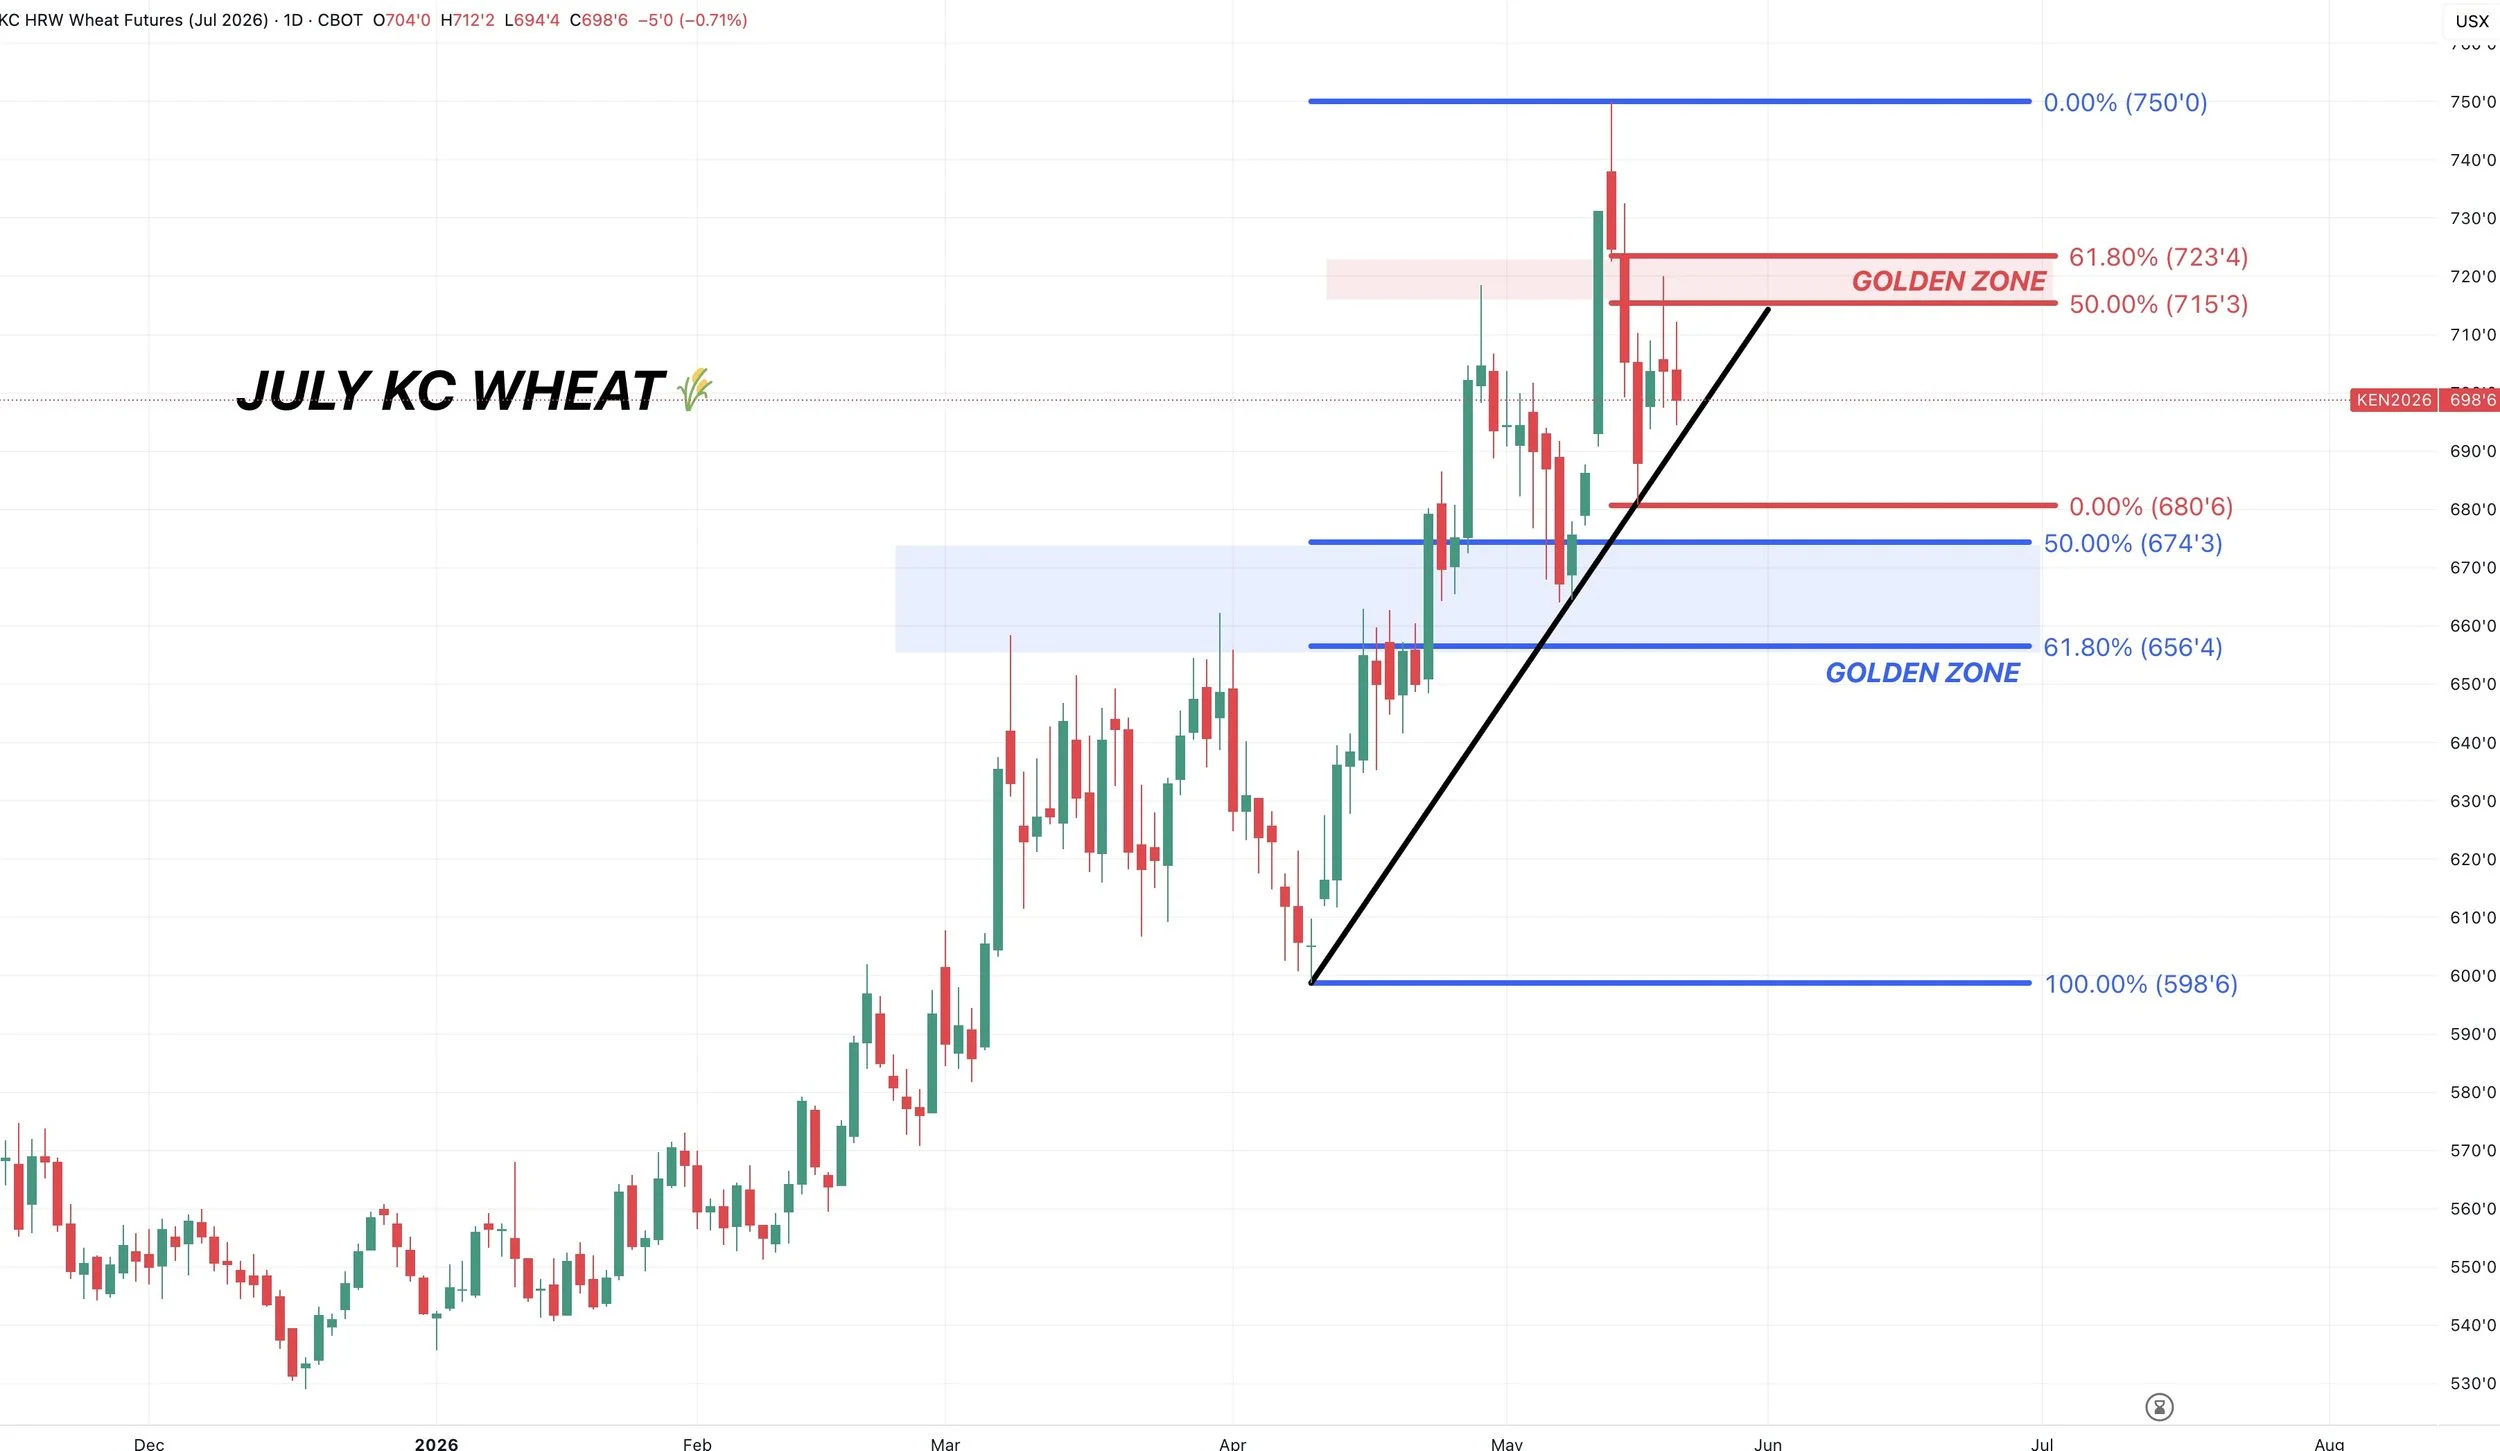
July KC Chart:
Last week on Wednesday, that $7.50 target hit.
We're still right at $7.00 for those who haven’t done anything.
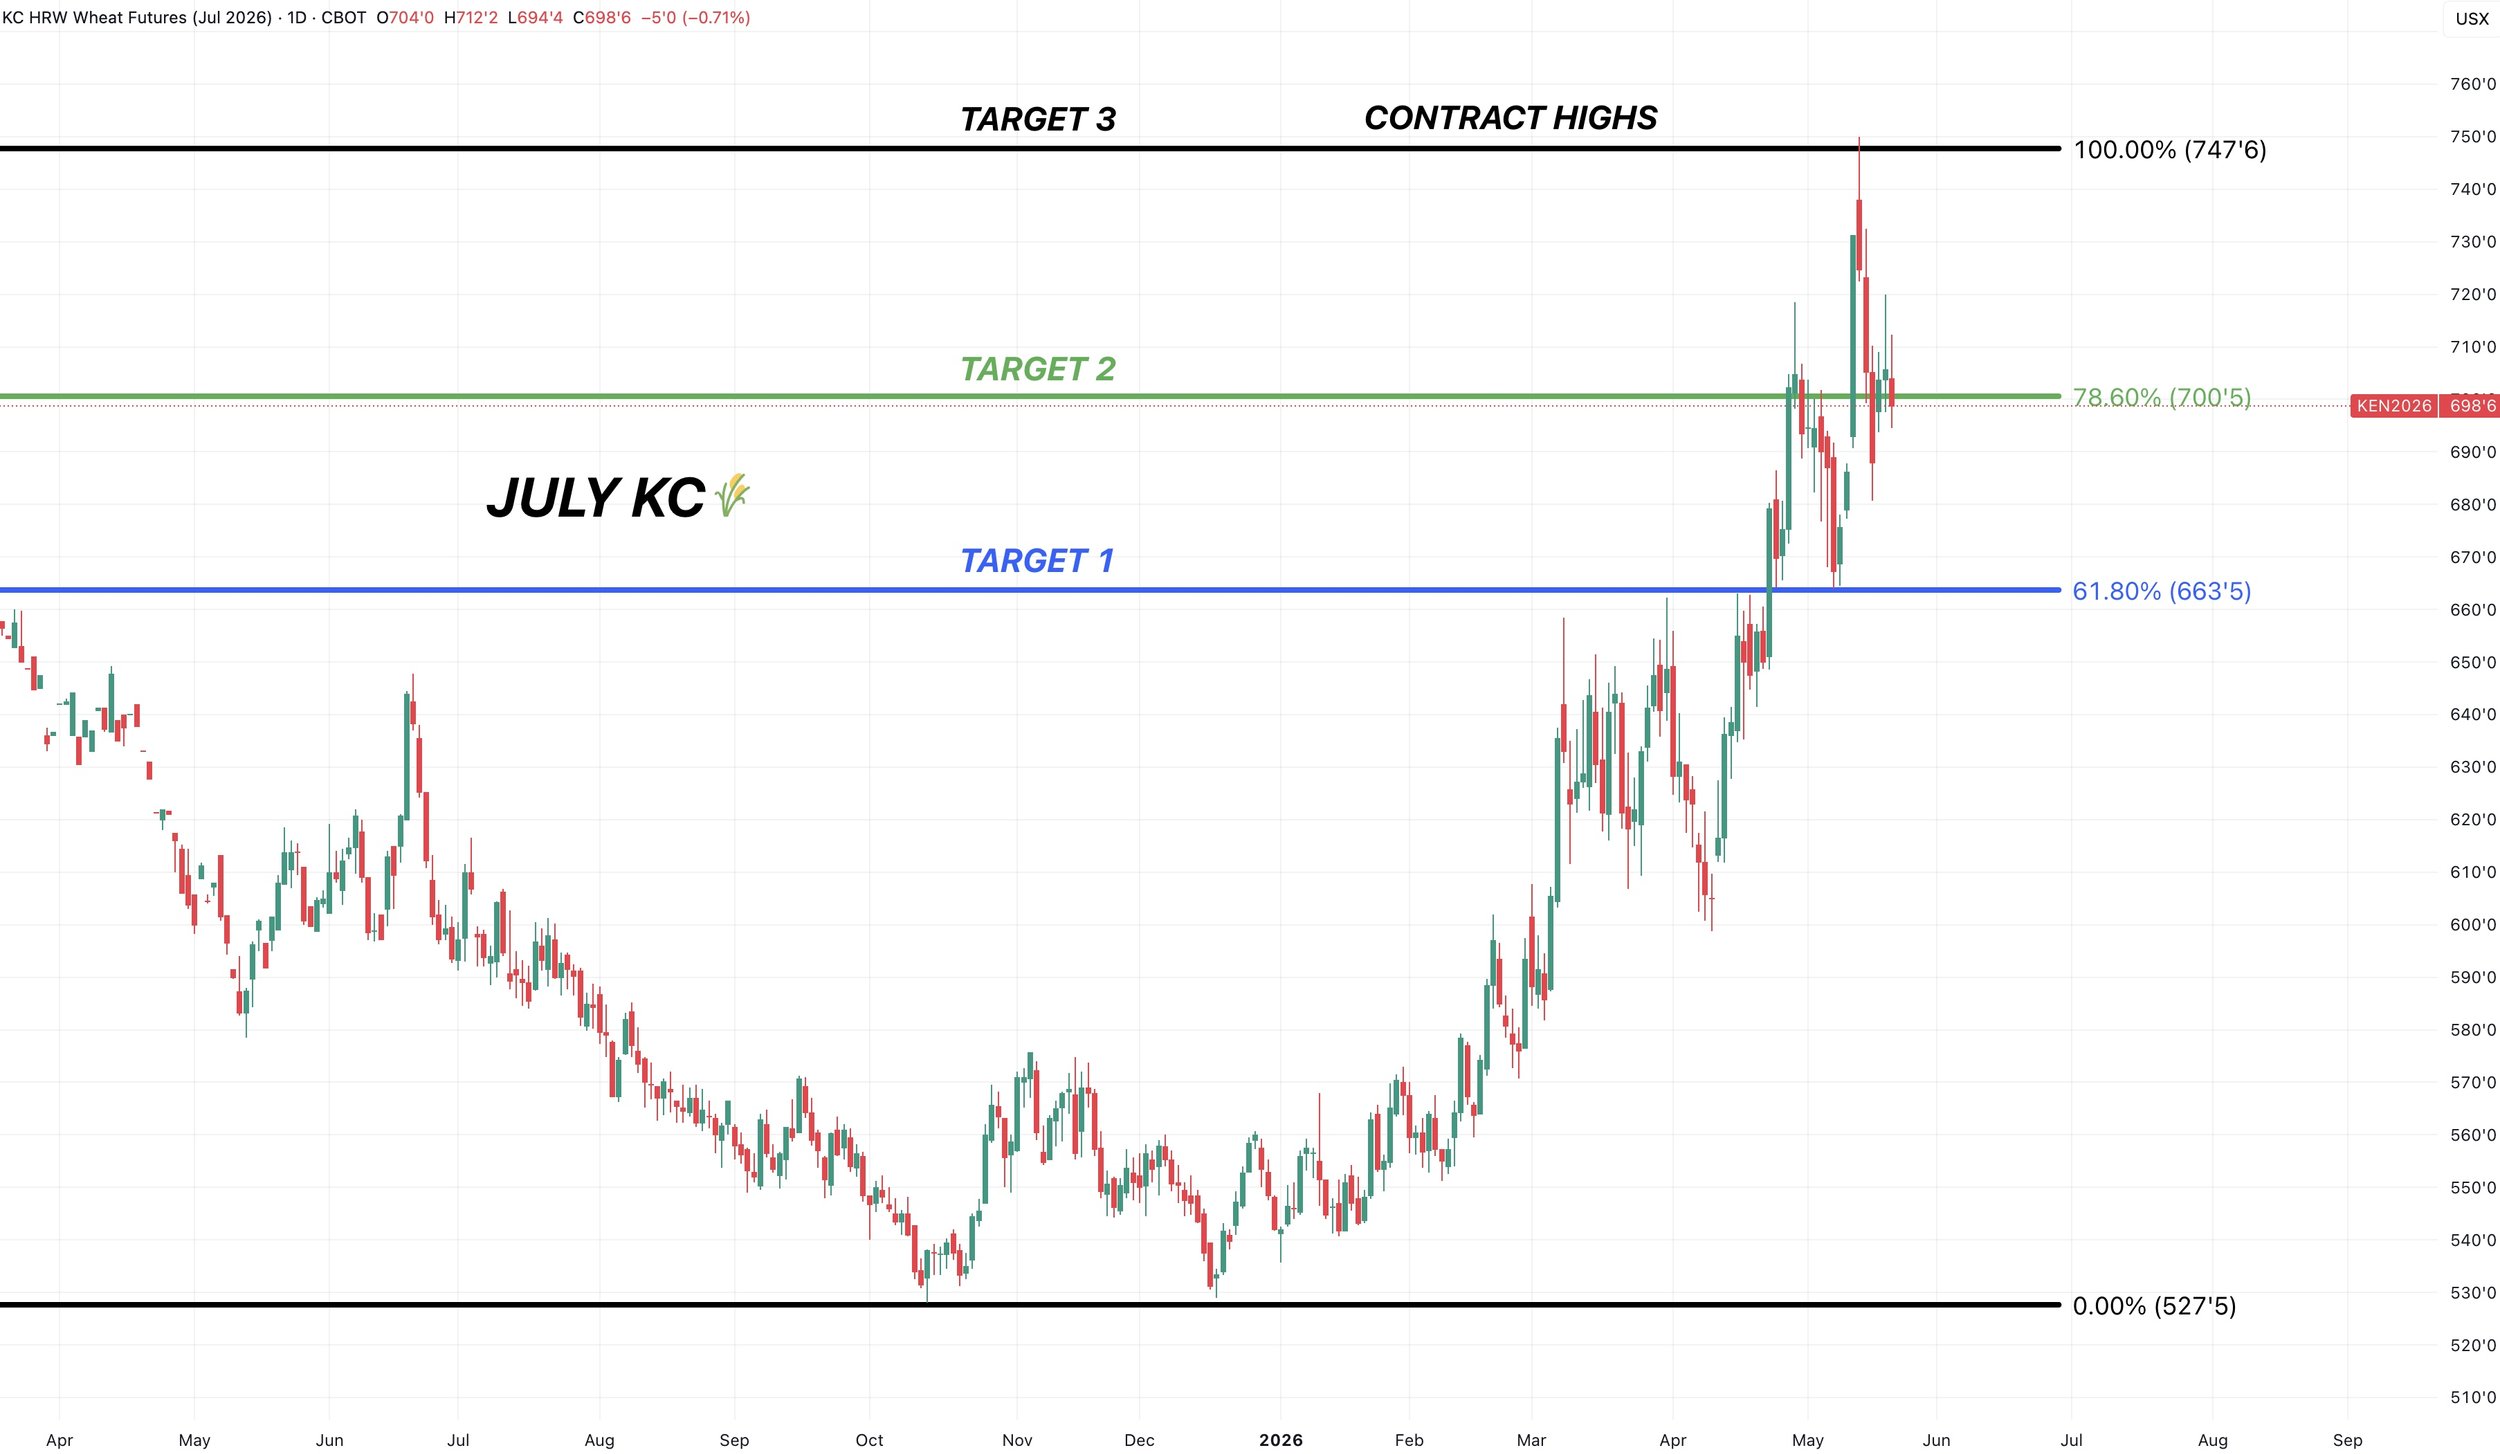
Yesterday we clawed back 61.8% of the sell off before rejecting. That's the level we need to clear to challenge the highs.
The line in the sand to keep an upward bias is $6.55. Which gives back 61.8% of the entire rally since April.
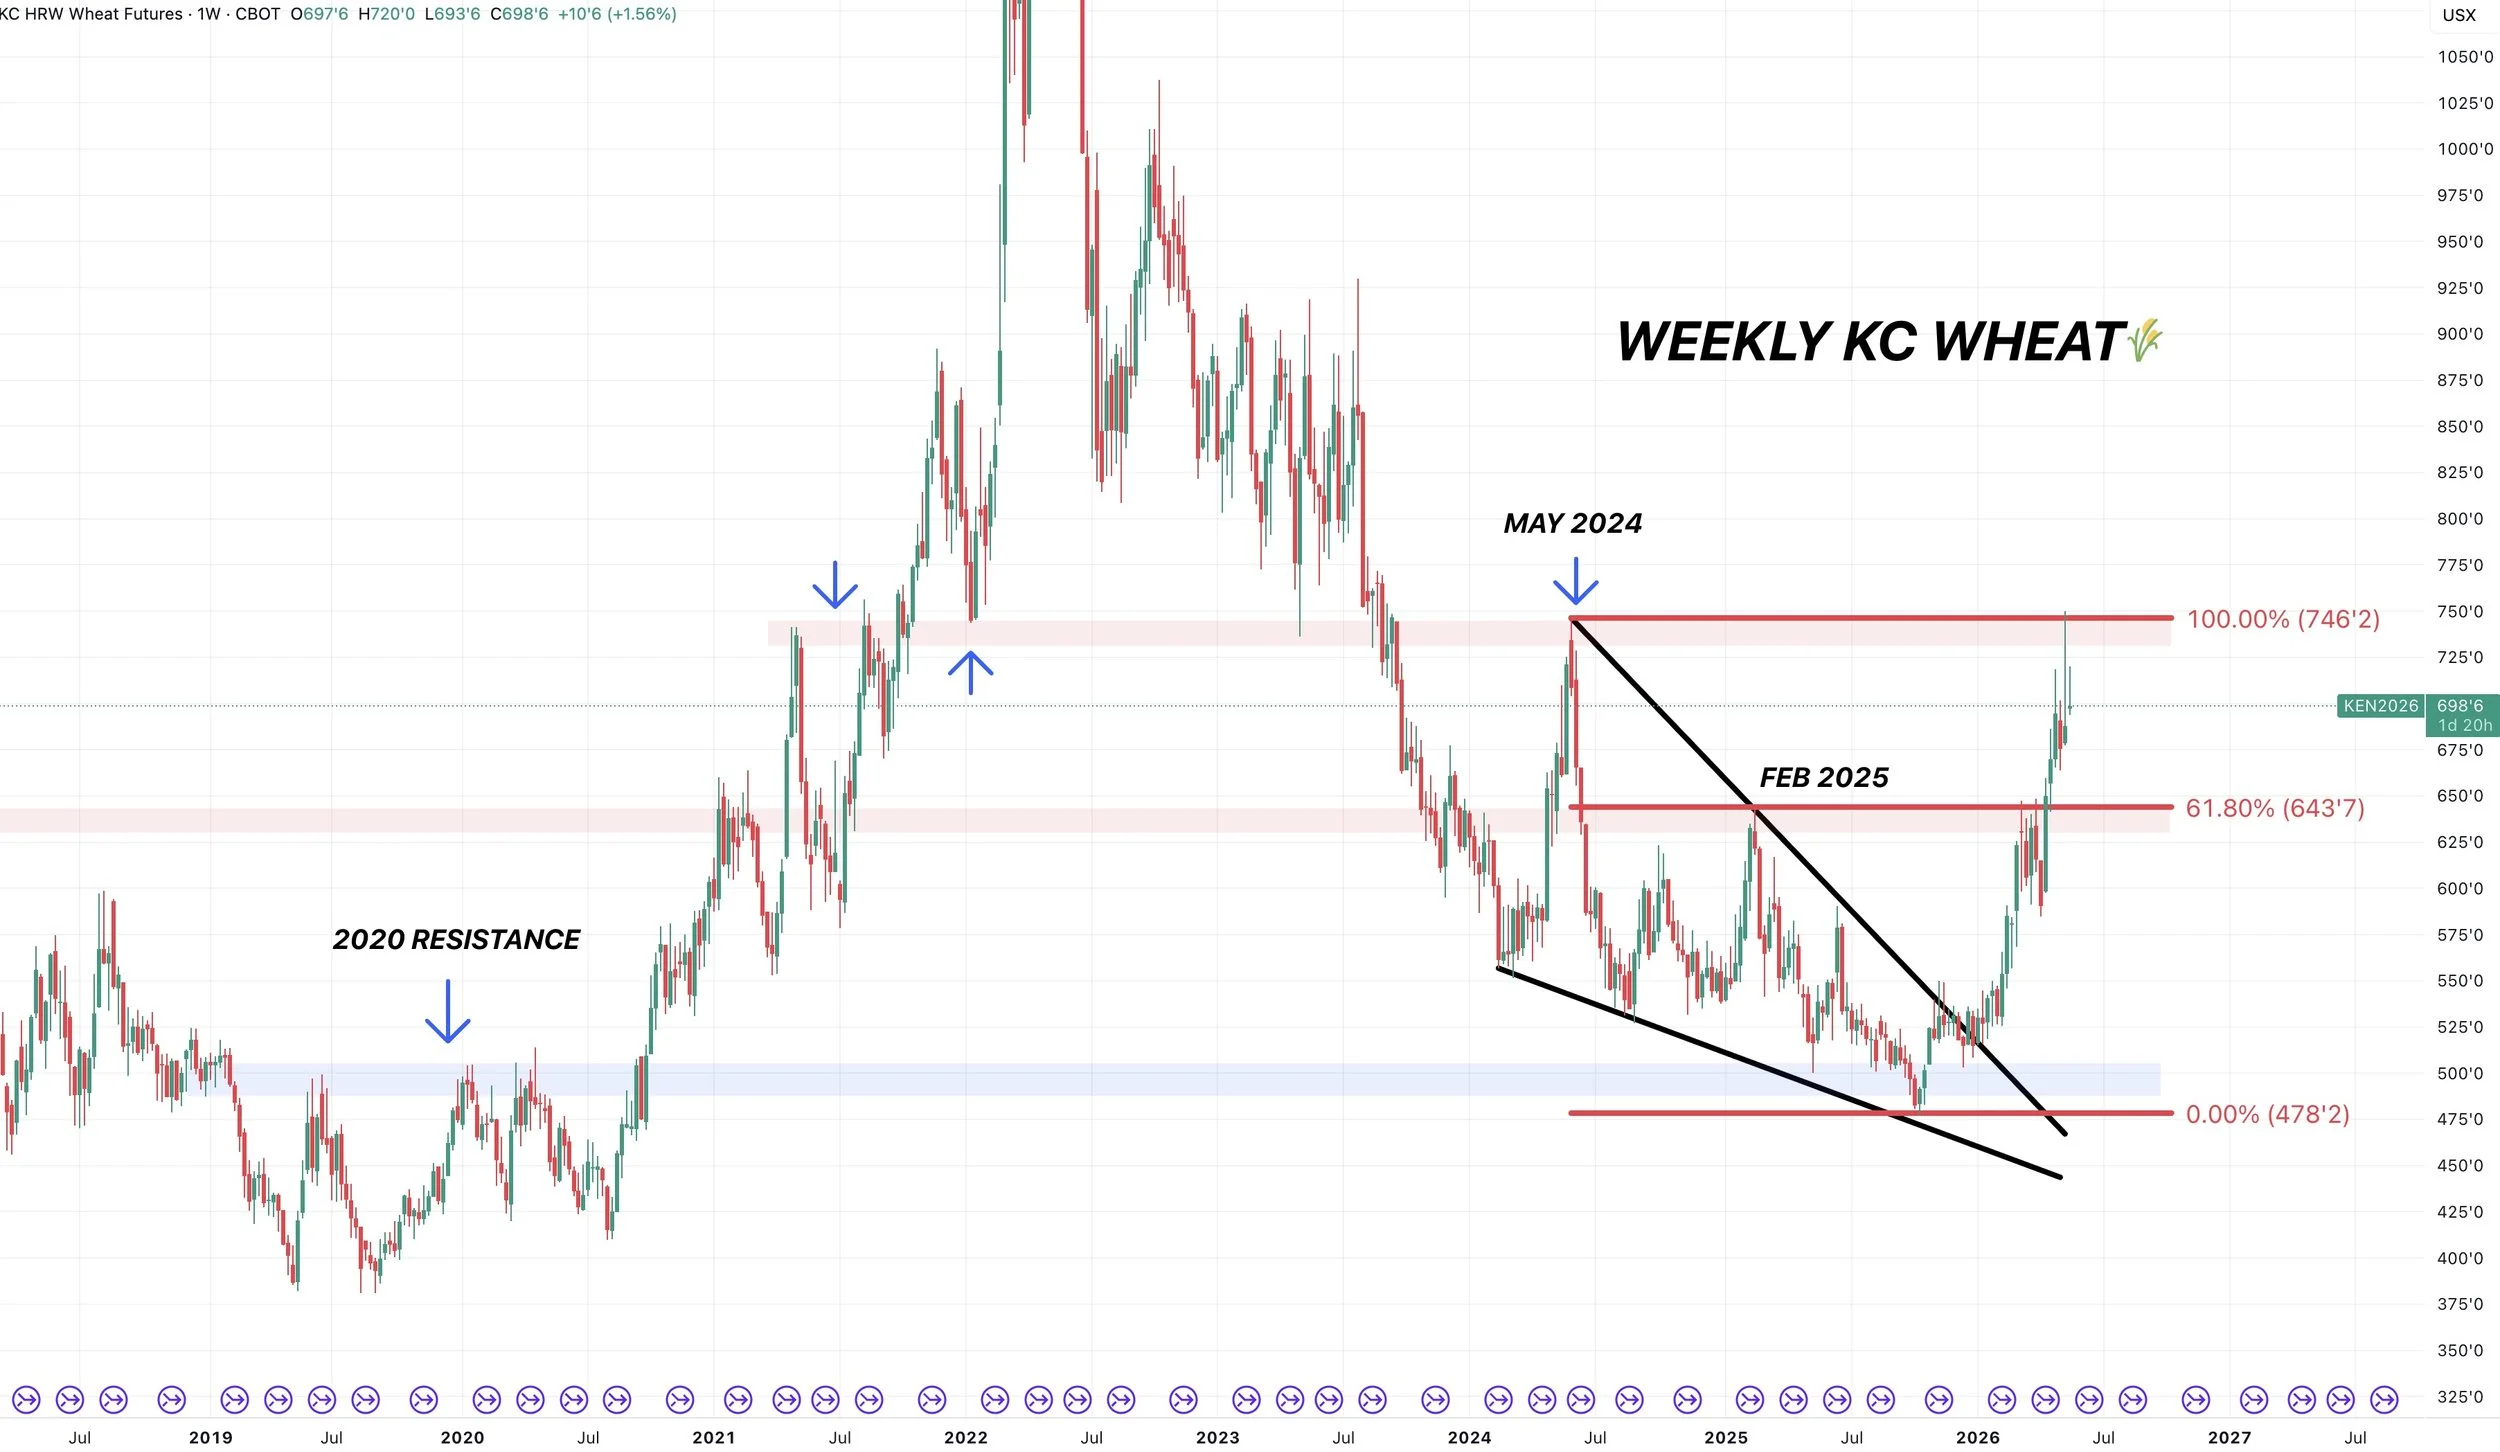
Big Picture Chart:
We failed right at those highs from May 2024, which was some major resistance. It was also the highs from 2021 and the lows from 2022.
Hence why that $7.50 level was a big target.
Regardless, I still think the wheat market has printed some multi-year lows and I believe that the long term trend has finally shifted higher for the first time in 5 years.
This wasn’t some random rally that didn’t last very long.
This was a 9-month grind higher.
We could drop a long ways and still be in a long-term uptrend.
But again.. if you have to move wheat off the combine or haven’t sold anything, you can’t forget this is some of the highest prices we've seen in years.
Cattle
LRP - What You Should Know
Lauren at Texas Hedge put together a nice article on LRP if you want to check it out. Where she goes over everything you need to know.
Click Here to Read
We do have a cattle on feed report on Friday.
Estimates:
On Feed: 102%
Placements: 103%
Marketing: 91%
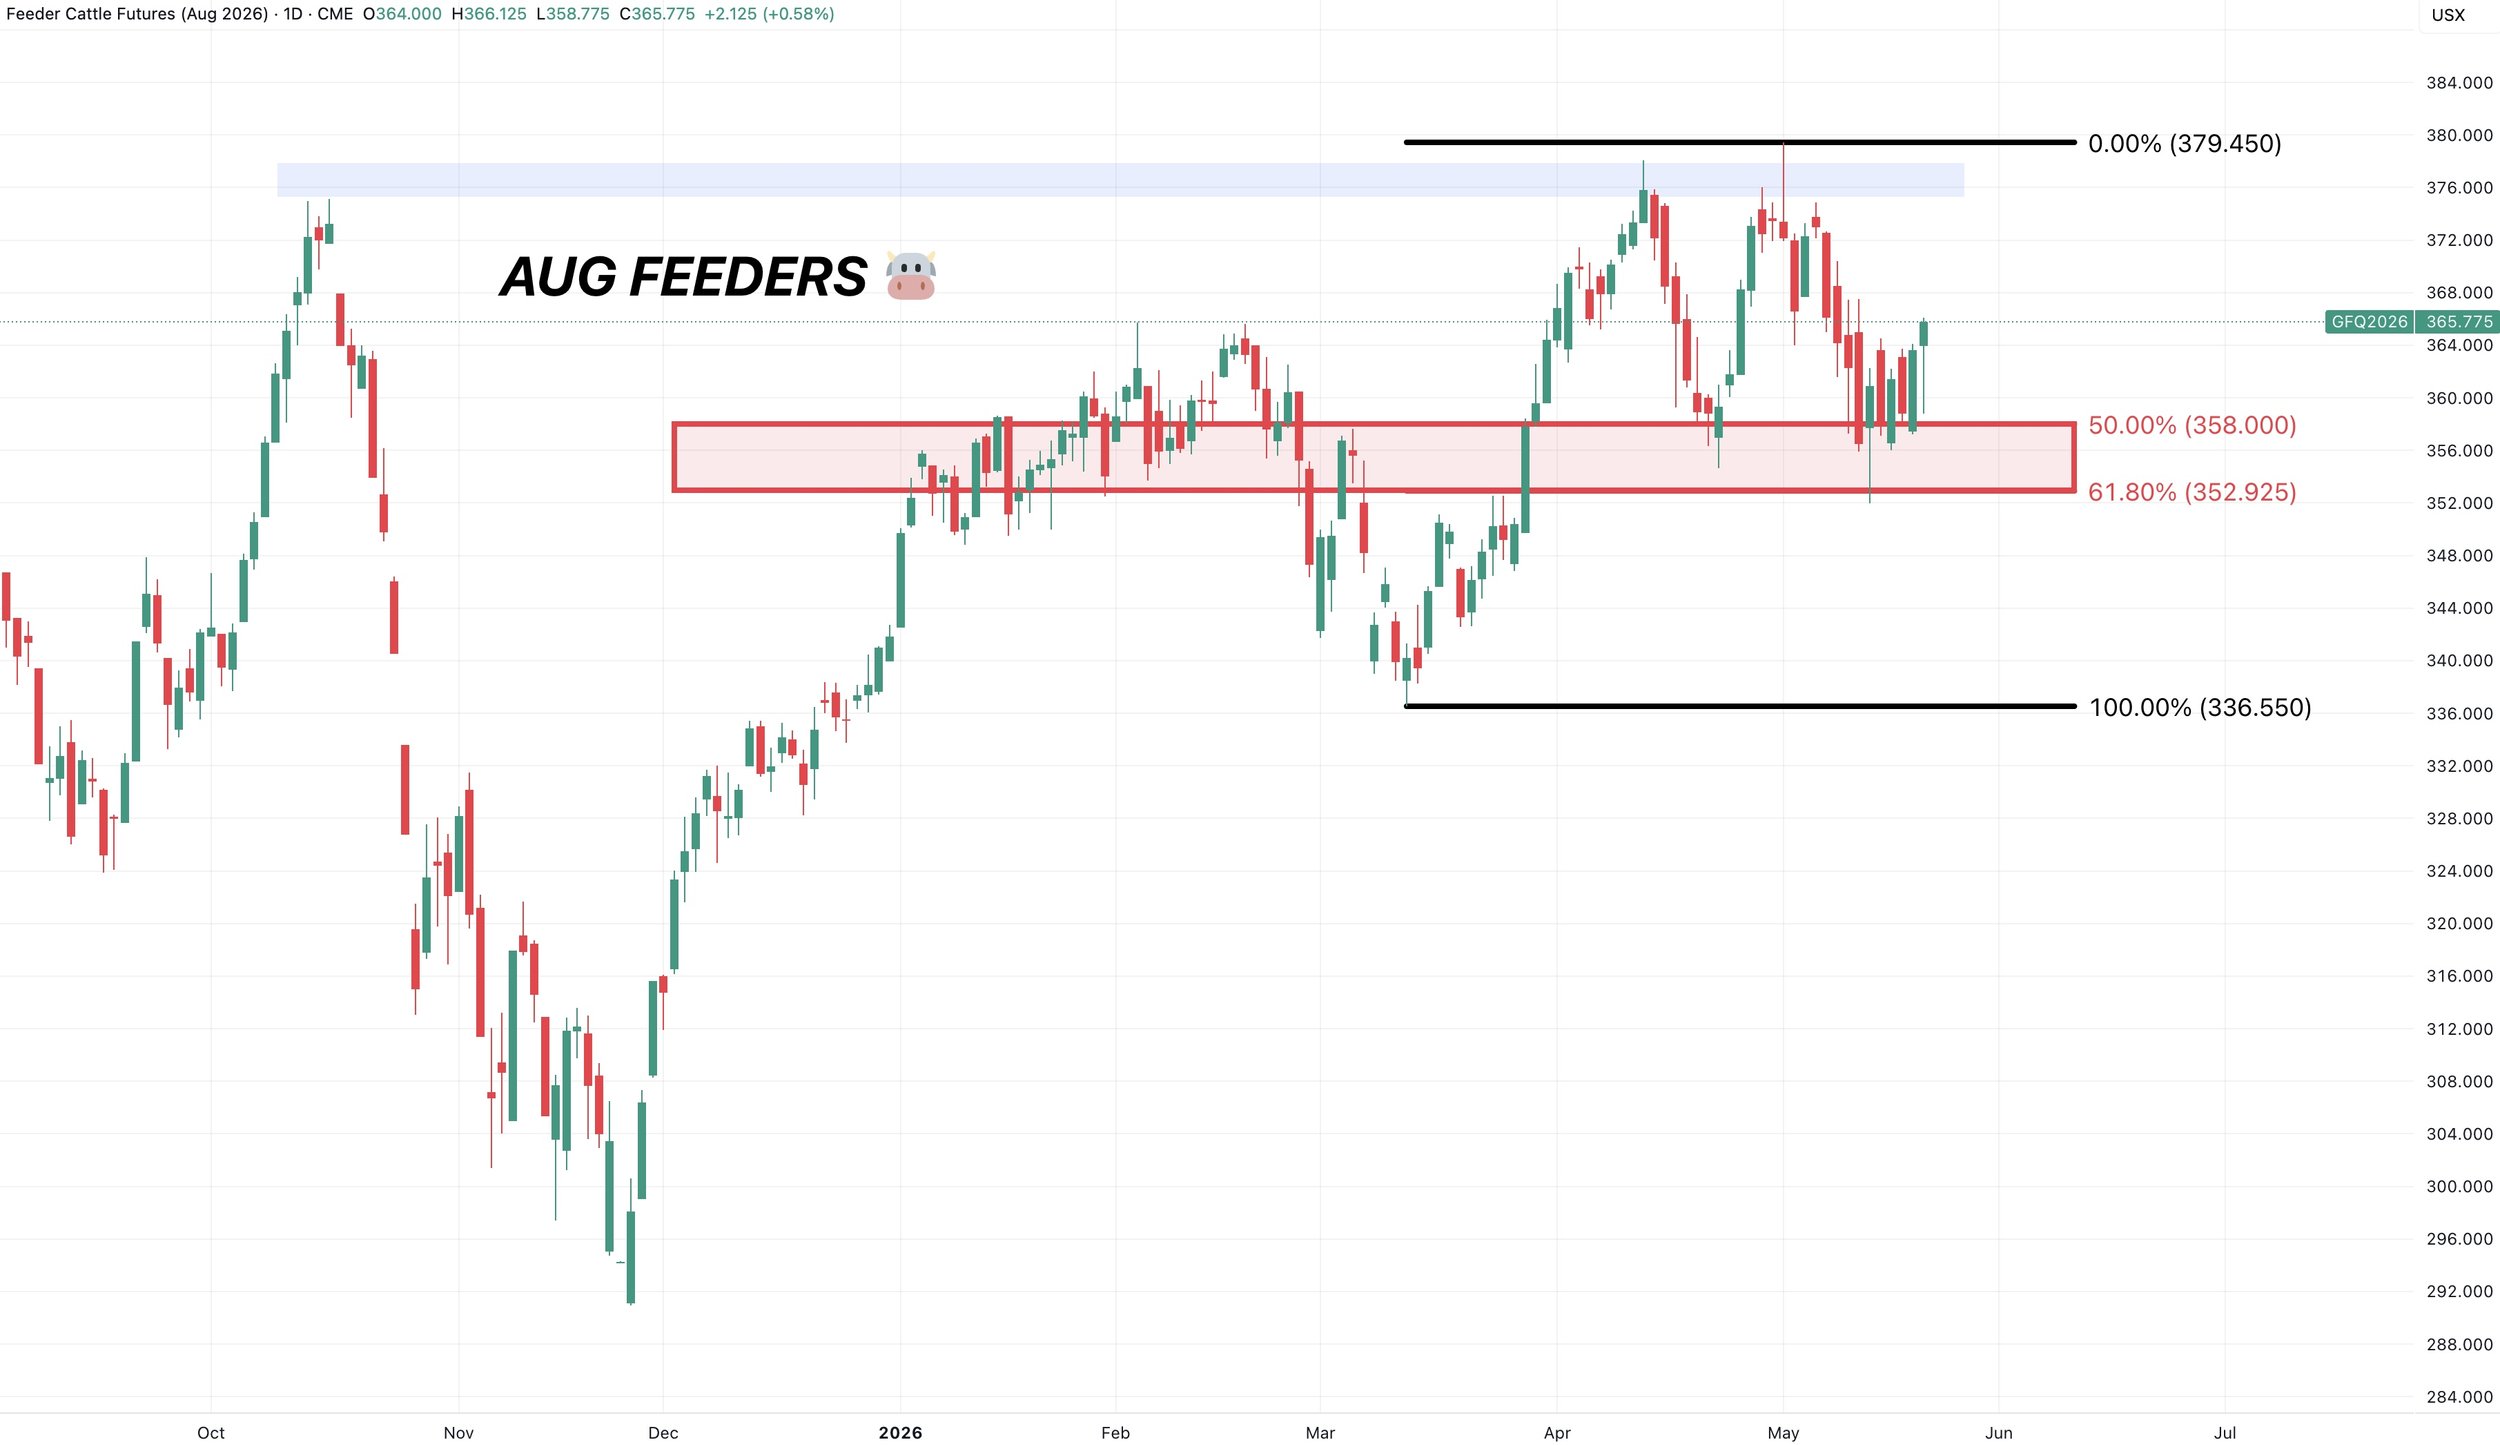
Aug Feeders Chart:
Feeders found life right where they needed, in the golden zone from those recent highs down to the March lows.
Essentially trapped between this golden zone and the highs. Simply range bound.
The red box is still the must hold level. Could argue that anything between these lows and the highs is simply noise. Then which ever level you break decides the next move.
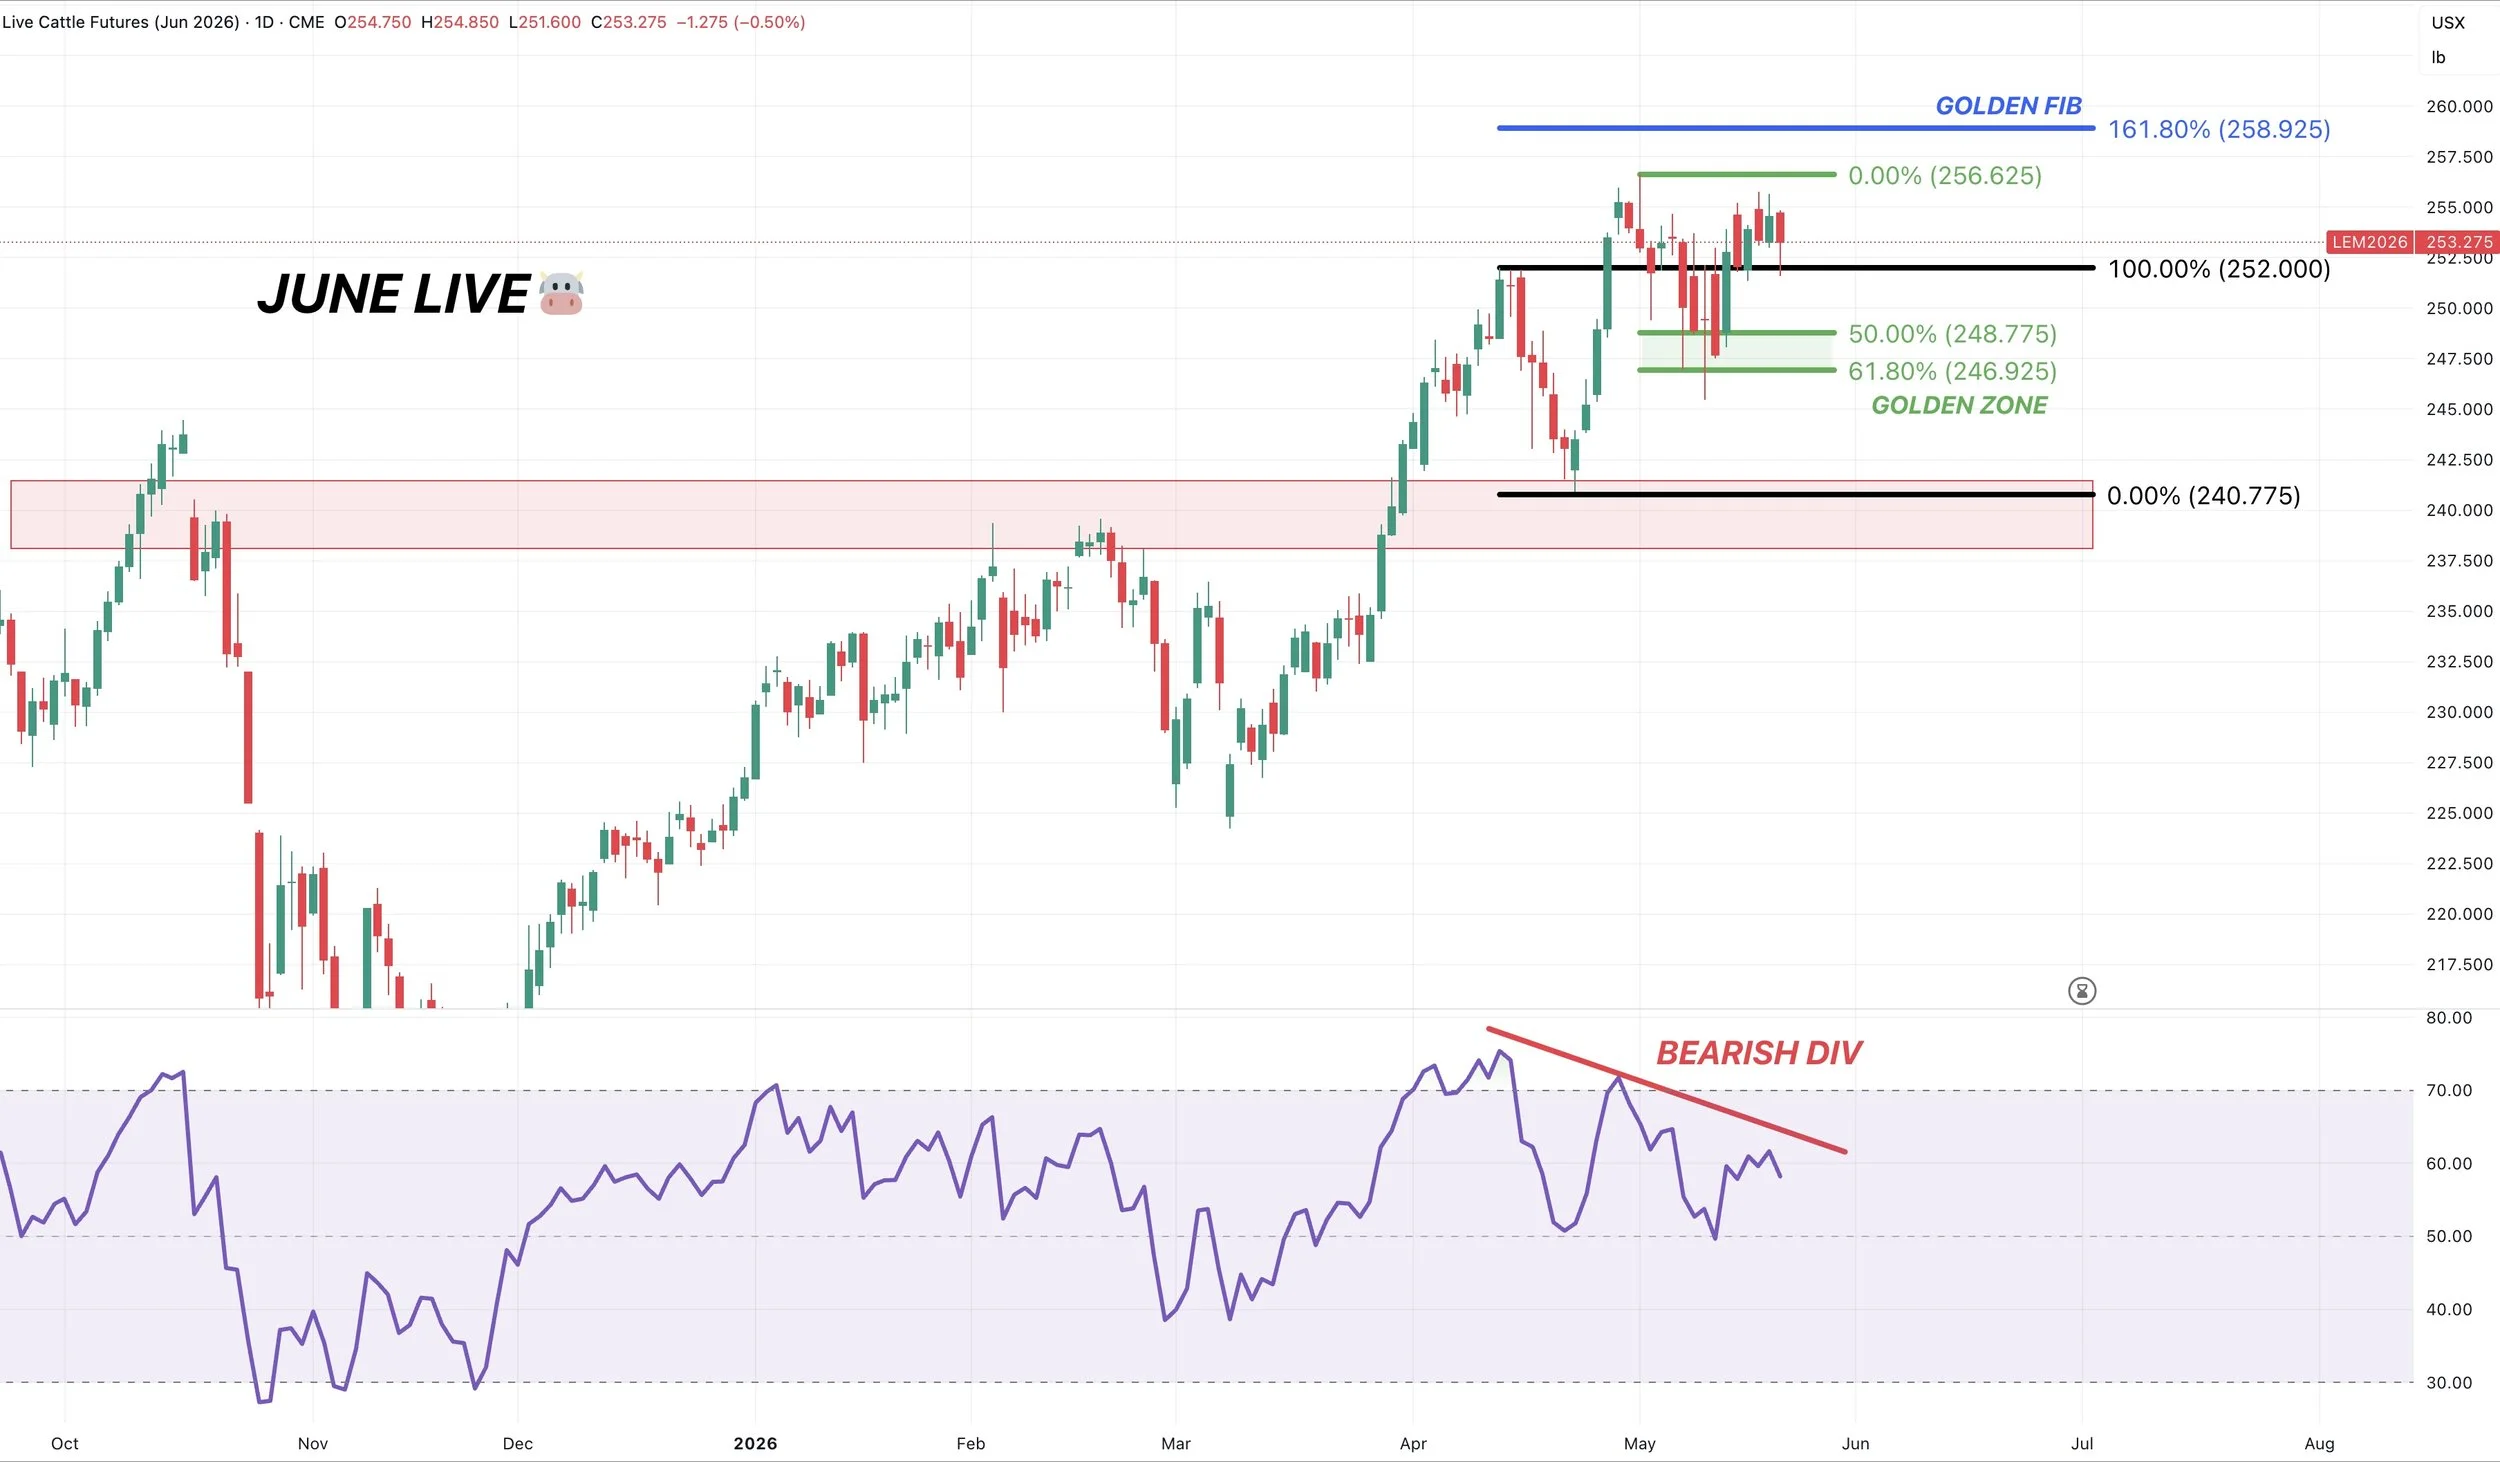
June Live Chart:
Live cattle also held where they needed to last week and have been completely sideways since.
Need to hold the green box at 247.
I still have a golden fib target just under 259.
We are showing some clear bearish divergence, so I'd be looking to defend soon, especially if we crawl up towards that golden fib.
Want to Talk?
Our phones are open 24/7 for you guys if you ever need anything or want to discuss your operation.
Jeremey & Office: (806)484-1214
Sebastian: (605)280-1186
Email: sfrost@dailymarketminute.com
Hedge Account
Interested in a hedge account? Use the link below to set up an account or give us a call.
Recent Updates
May 19th - Audio Commentary
Grains Back Near Highs
Click Here to View
May 18th - Audio Commentary
China Deal Gets Teeth
Click Here to View
May 15th - Audio Commentary
China Commits but No Details
Click Here to View
May 13th - Audio Commentary
China Meeting Tonight
Click Here to View
May 12th - Market Update Video
USDA & Wheat Limit Up
Click Here to View
May 11th - Audio Commentary
All About Trump, China & USDA
Click Here to View
May 8th - Market Update Video
Grains Catch a Bid Where Needed
Click Here to View
May 7th - Audio Commentary
Grains Hold Critical Spots
Click Here to View
May 6th - Market Update Video
Grains Nearing Sink or Swim Levels
Recent Signals
May 13th, 2026: 🌱
Soybean sell signal & hedge alert.
CLICK HERE TO VIEW
April 28th, 2026: 🌾
KC wheat specific signal.
CLICK HERE TO VIEW
April 27th, 2026: 🌽
Corn catch up sell signal.
CLICK HERE TO VIEW
April 10th, 2026: 🌽
Corn buy signal.
CLICK HERE TO VIEW
March 19th, 2026: 🌱
New crop soybeans signal & hedge alert.
CLICK HERE TO VIEW
March 9th, 2026: 🌱
Soybeans signal & hedge alert. Sent via text.
CLICK HERE TO VIEW
March 6th, 2026: 🌽 🌾
Corn & wheat sell signal & hedge alert.
CLICK HERE TO VIEW
March 3rd, 2026: 🌽
Old crop & new crop corn sell signal & hedge alert.
CLICK HERE TO VIEW
Feb 26th, 2026: 🌱
Old crop & new crop beans sell signal & hedge alert.
CLICK HERE TO VIEW
Feb 19th, 2026: 🌾
KC wheat sell signal & hedge alert.
CLICK HERE TO VIEW
Feb 6th, 2026: 🌽 🌱
Old crop corn & soybean sell signal & hedge alert.
CLICK HERE TO VIEW
Feb 4th, 2026: 🌱
Soybean sell signal & hedge alert.
CLICK HERE TO VIEW
Nov 17th, 2025: 🌱
Soybean sell signal & hedge alert.