
MARKET SAYS SHOW ME CHINA
AUDIO COMMENTARY
Grains follow crude & macros again
Trump & China want the war to end
Corn exports off the chart
The market is saying show me China
We haven’t seen China do anything at all
When would you typically buy? When there is the most supply or prices are low. So China might wait until harvest to buy
You could argue China might consider to buy corn now given there is a carry in the market
We don’t have any weather scares
There isn’t a major reason to see a big pop outside of China if the crop looks fine
Charts at some important spots to hold
I’m expecting big volatility to continue
Chart breakdowns below audio*
Listen to today’s audio below
Want to talk?
Office: (806)484-1214
CHARTS
Something to note about all of these charts is that we are in a volatile headline driven market. In markets like this we can take out key supports and get head fakes. Which is exactly what we saw last week. But this is overall what I’m watching.
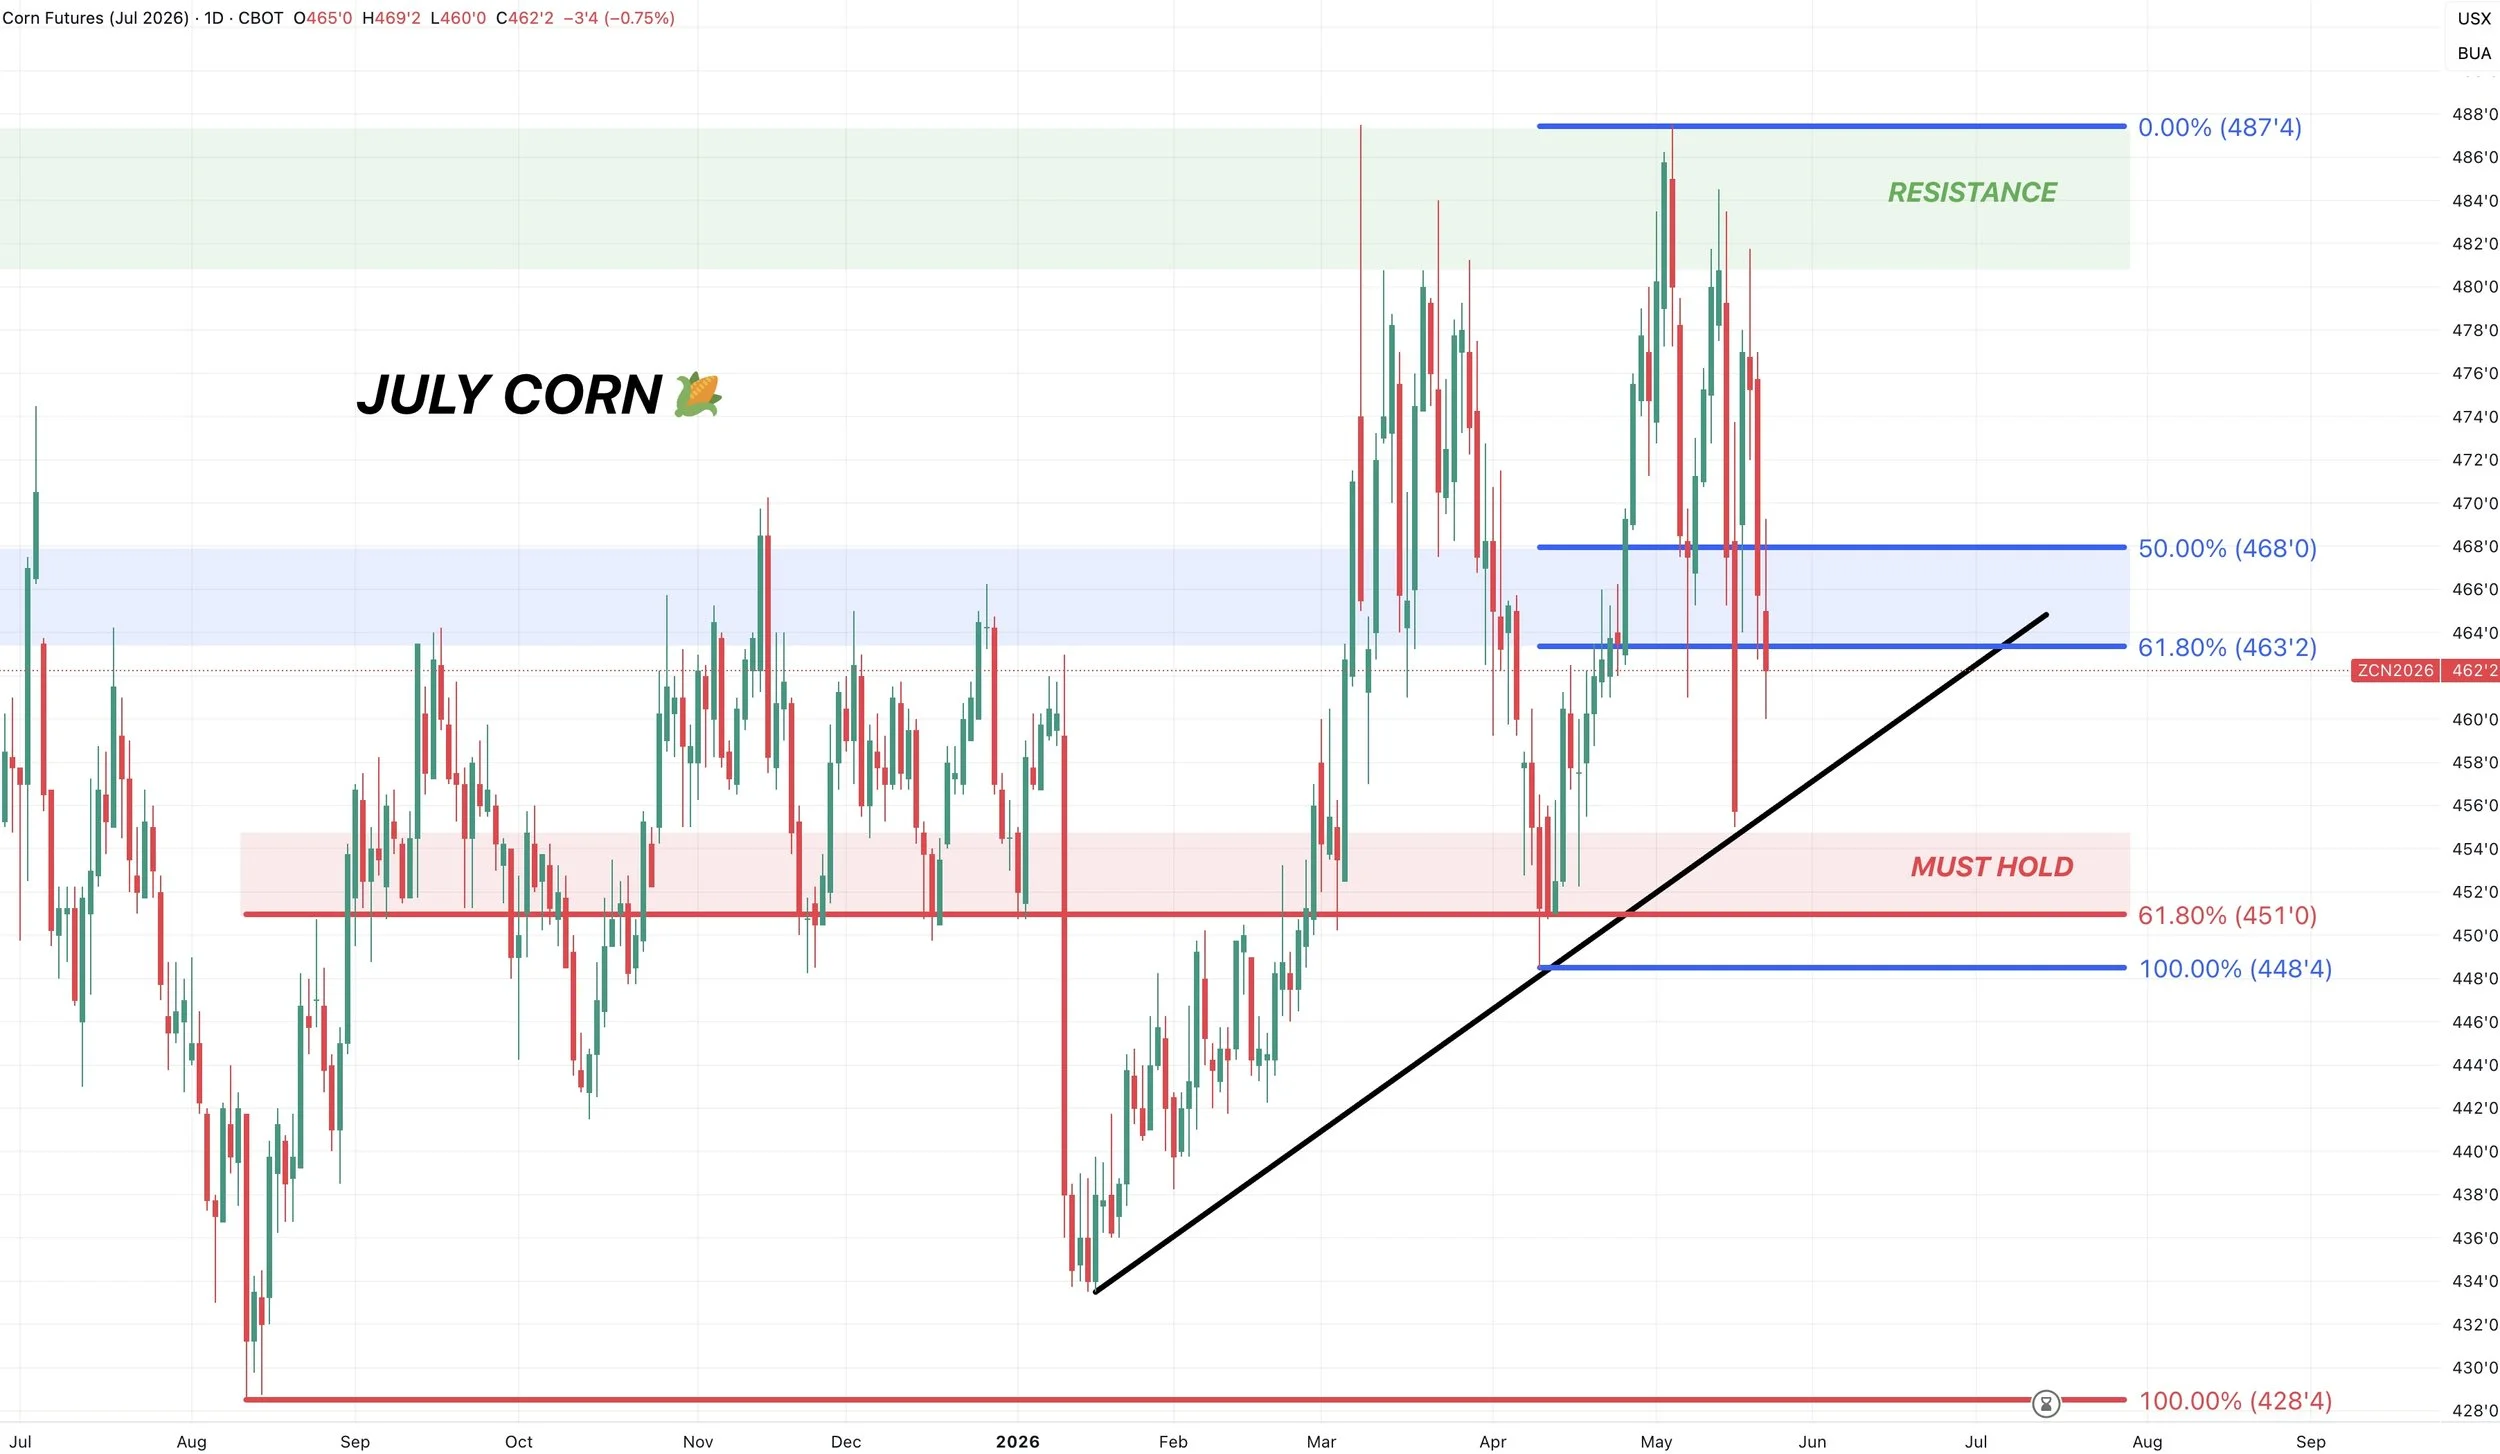
July Corn 🌽
Need to bounce pretty much right now or we open the door towards the red box and the April lows.
We closed just below the 61.8% retracement from the highs down to the April lows. I usually give it a two-day rule, so if we close below it tomorrow, it could offer further downside. This area is also resistance from fall. So bulls want to bounce now if we are going to bounce.
The absolute line in the sand to keep the trend higher is $4.50
That gives back 61.8% of the entire rally all the way down to contract lows. That’s also key support from several occasions. If you lose that level it would not be a good sign.
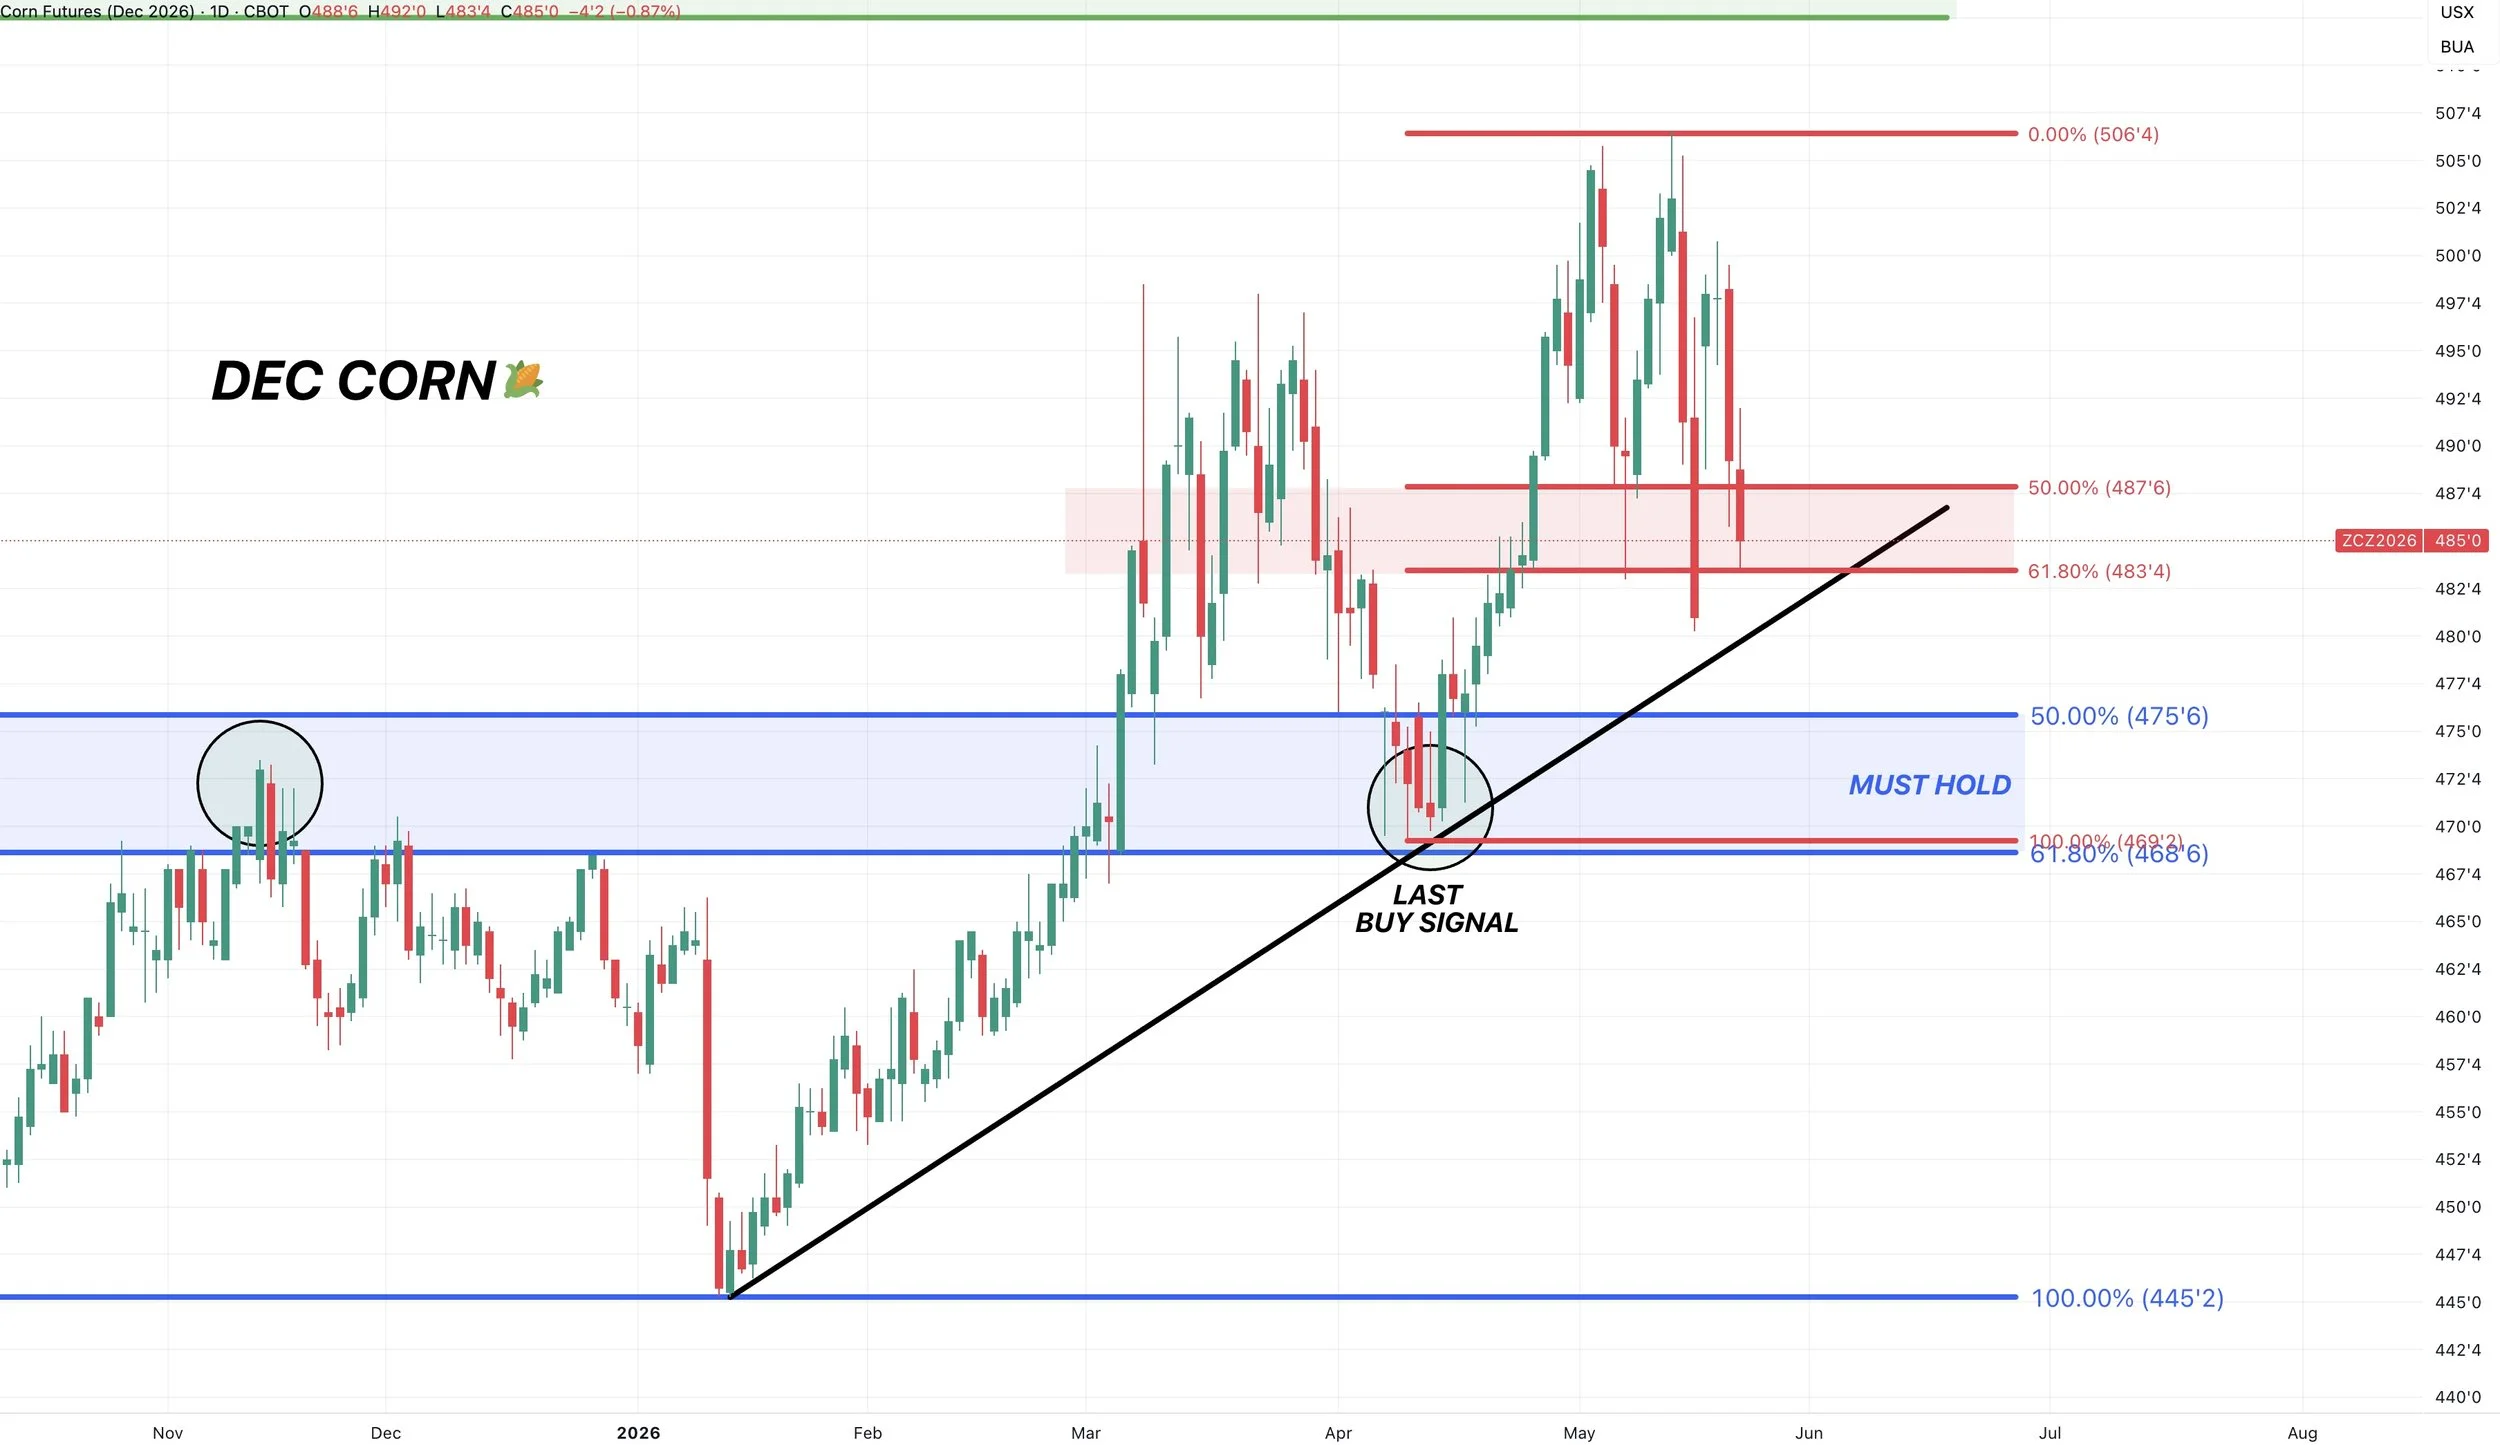
Dec Corn 🌽
At a pretty important spot here.
The 61.8% retracement from the highs down to the April lows.
Want to see us hold here or it opens the door towards those April lows.
We are also approaching some potential trendline support we’d like to see hold.
The line in the sand to keep the big picture trend higher is the April lows and $4.68
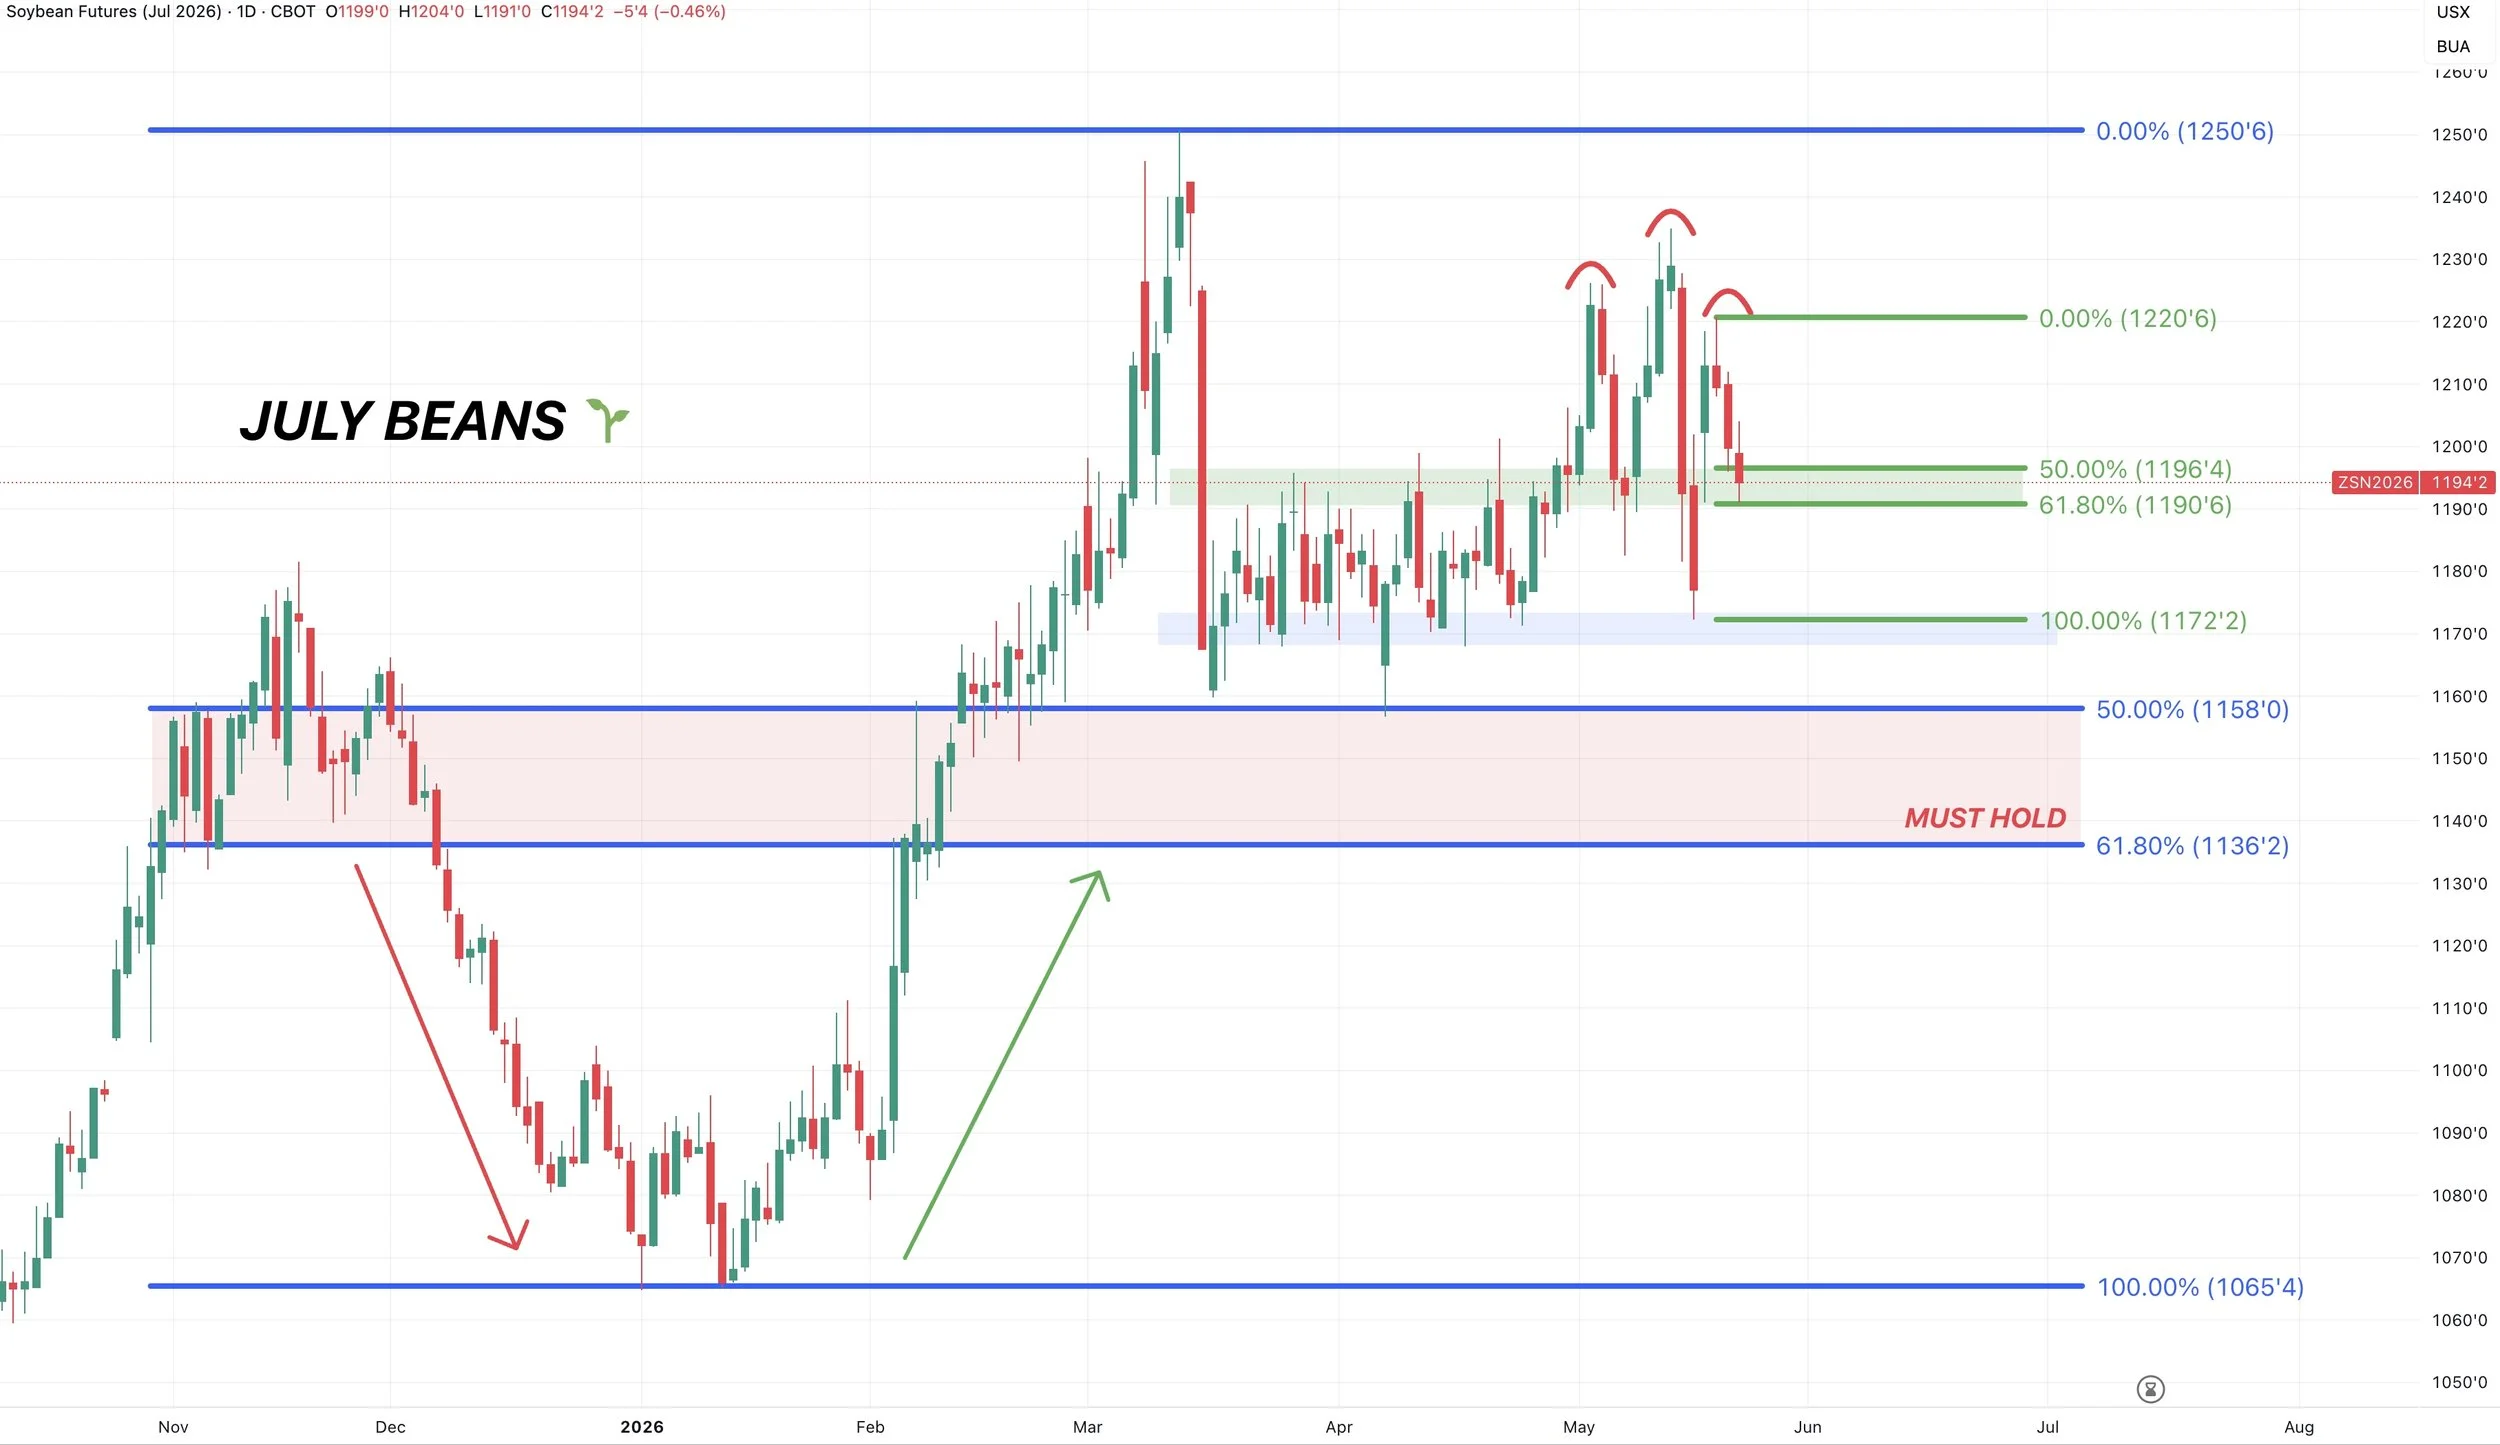
July Beans 🌱
At an important spot here.
We’ve given back 61.8% of the recent bounce.
Need to hold this level or we could head back towards the bottom of the old range around $11.70
We also have a head and shoulders pattern, which is potentially bearish. So need to hold support here. A head and shoulders becomes invalid if you break above the shoulder..
The big picture trend is still higher as long as we hold the red box. As there is some major air beneath that level.
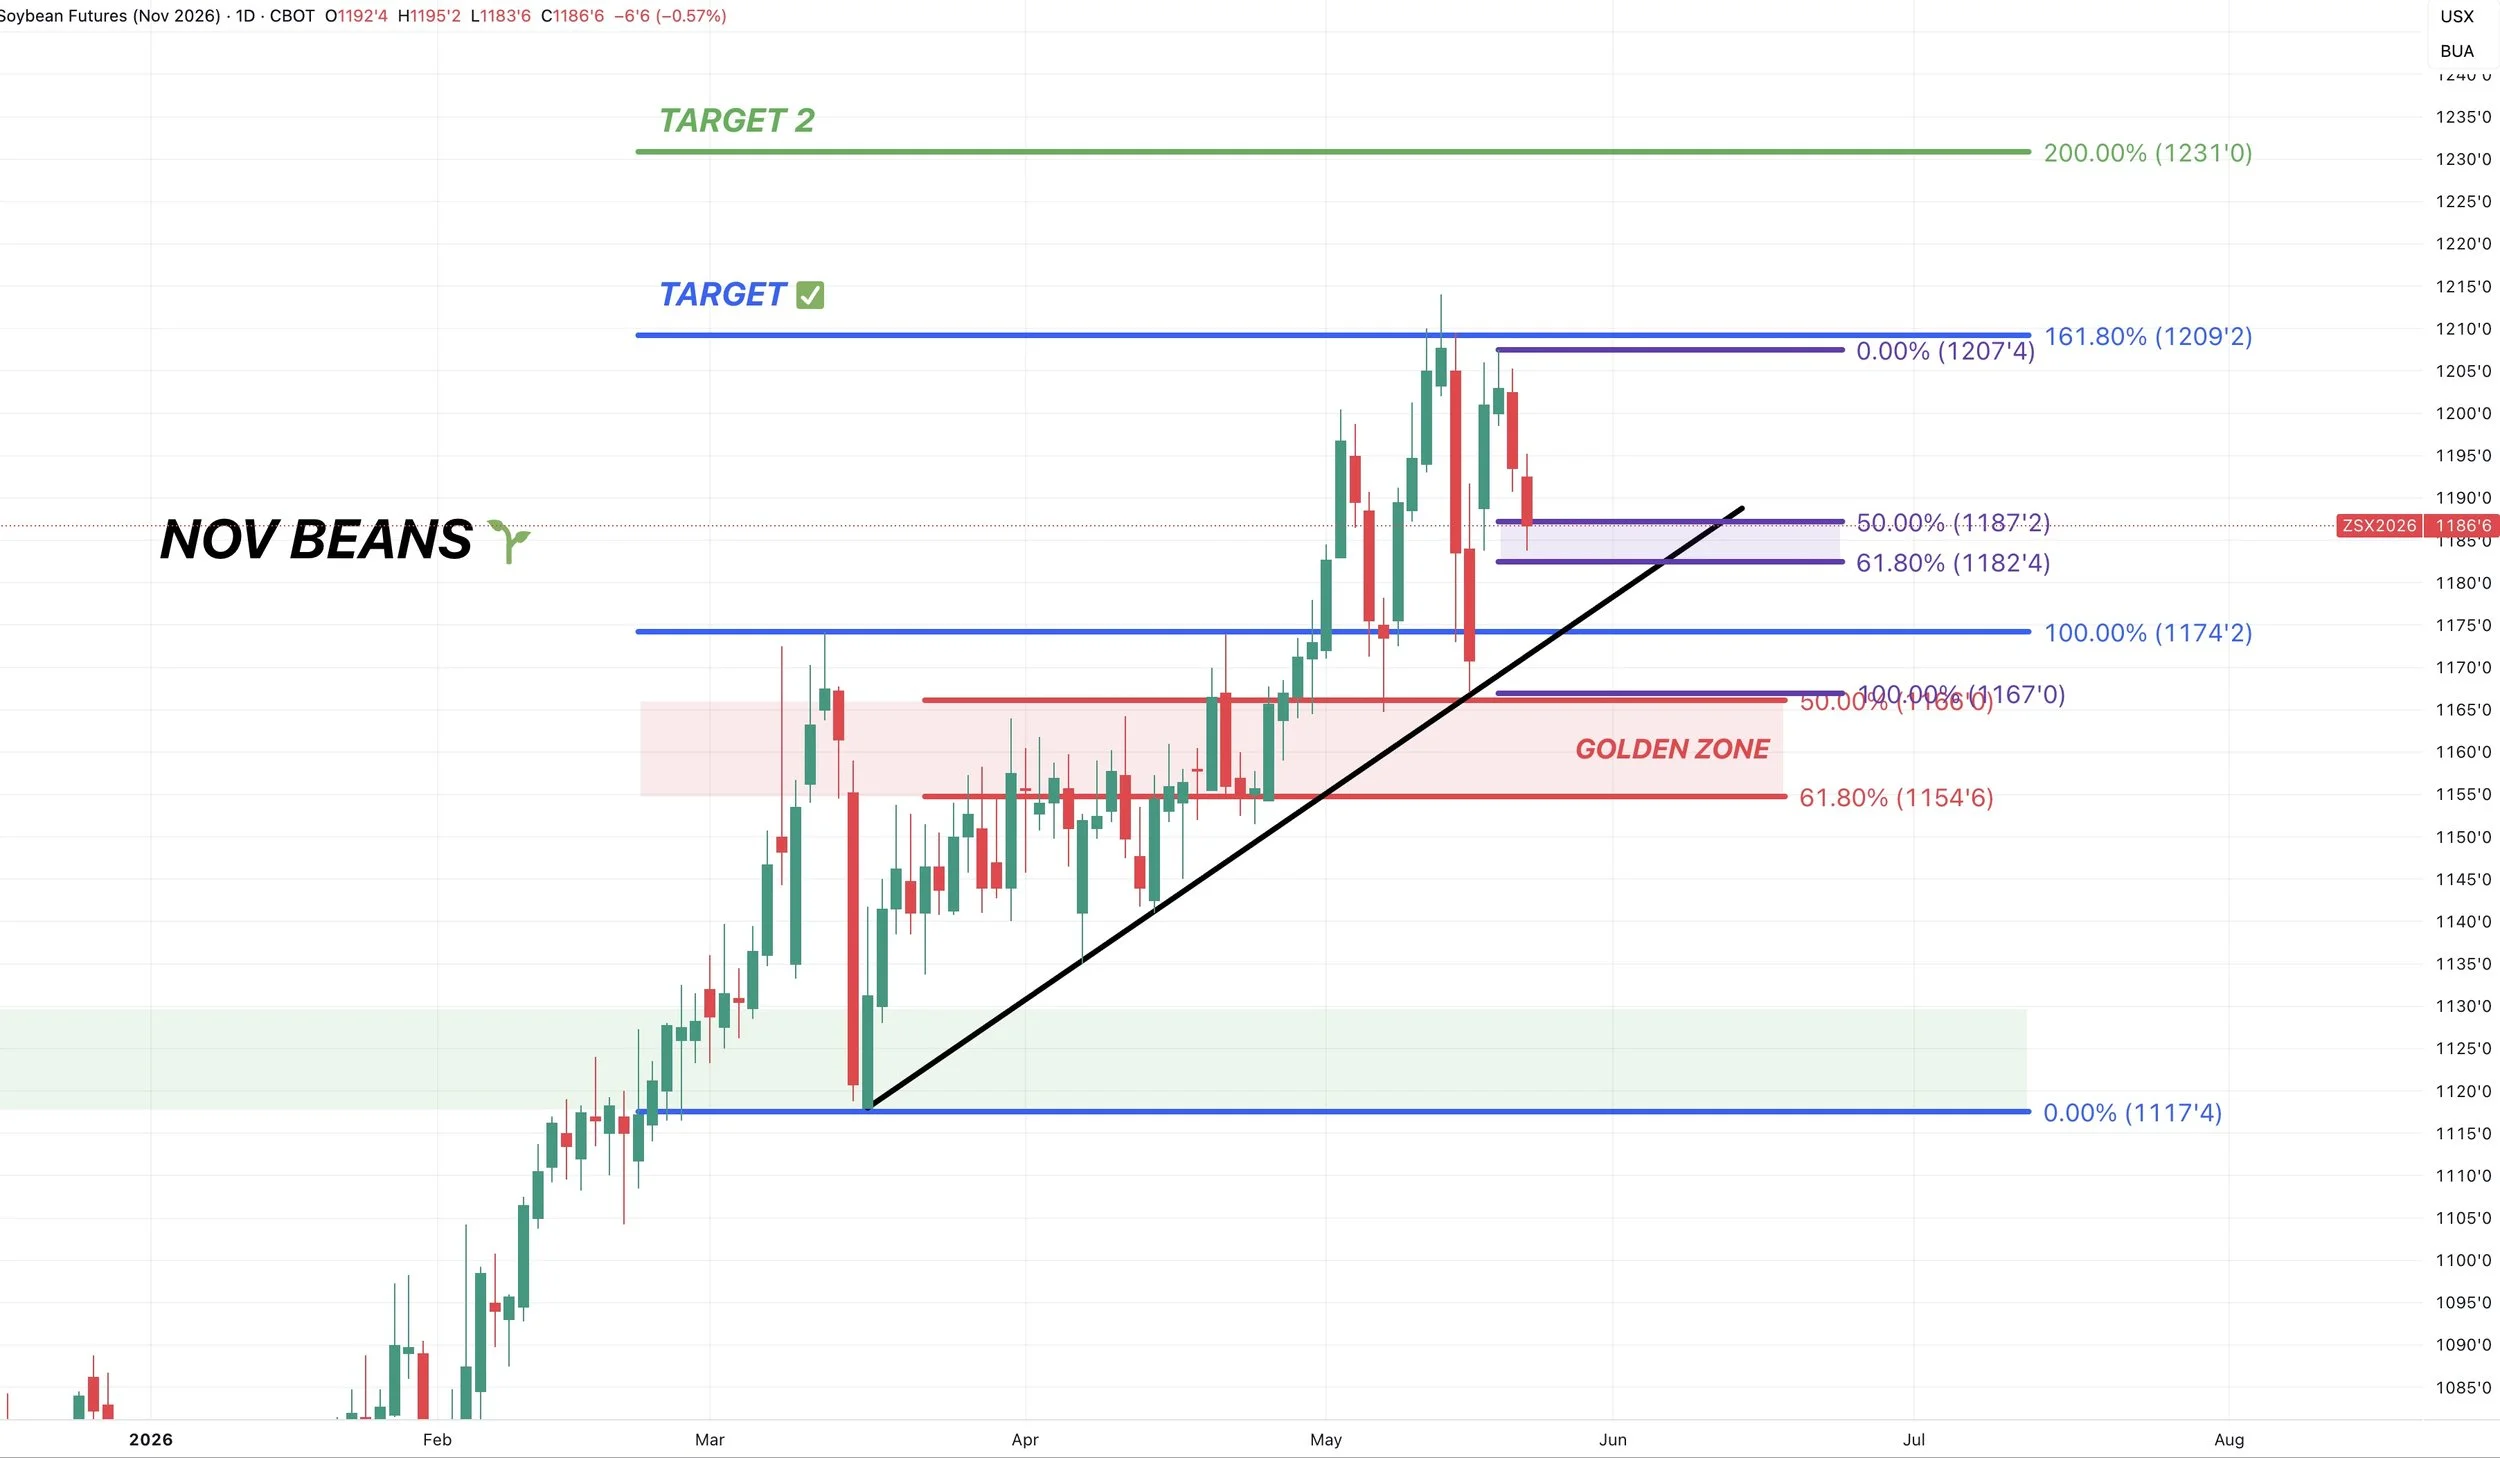
Nov Beans 🌱
Hit that $12.09 target last week.
We then came down and turned the prior resistance into new support.
Now at a key spot here as well. As we’ve also given back 61.8% of the recent bounce.
Want to hold this level, or we could work our way down towards the lows from last week and where this market has bounce the last two times.
Overall still in a clear uptrend. As this is one of the better looking charts.
The line in the sand is $11.55
That’s 61.8% of the entire rally since March.
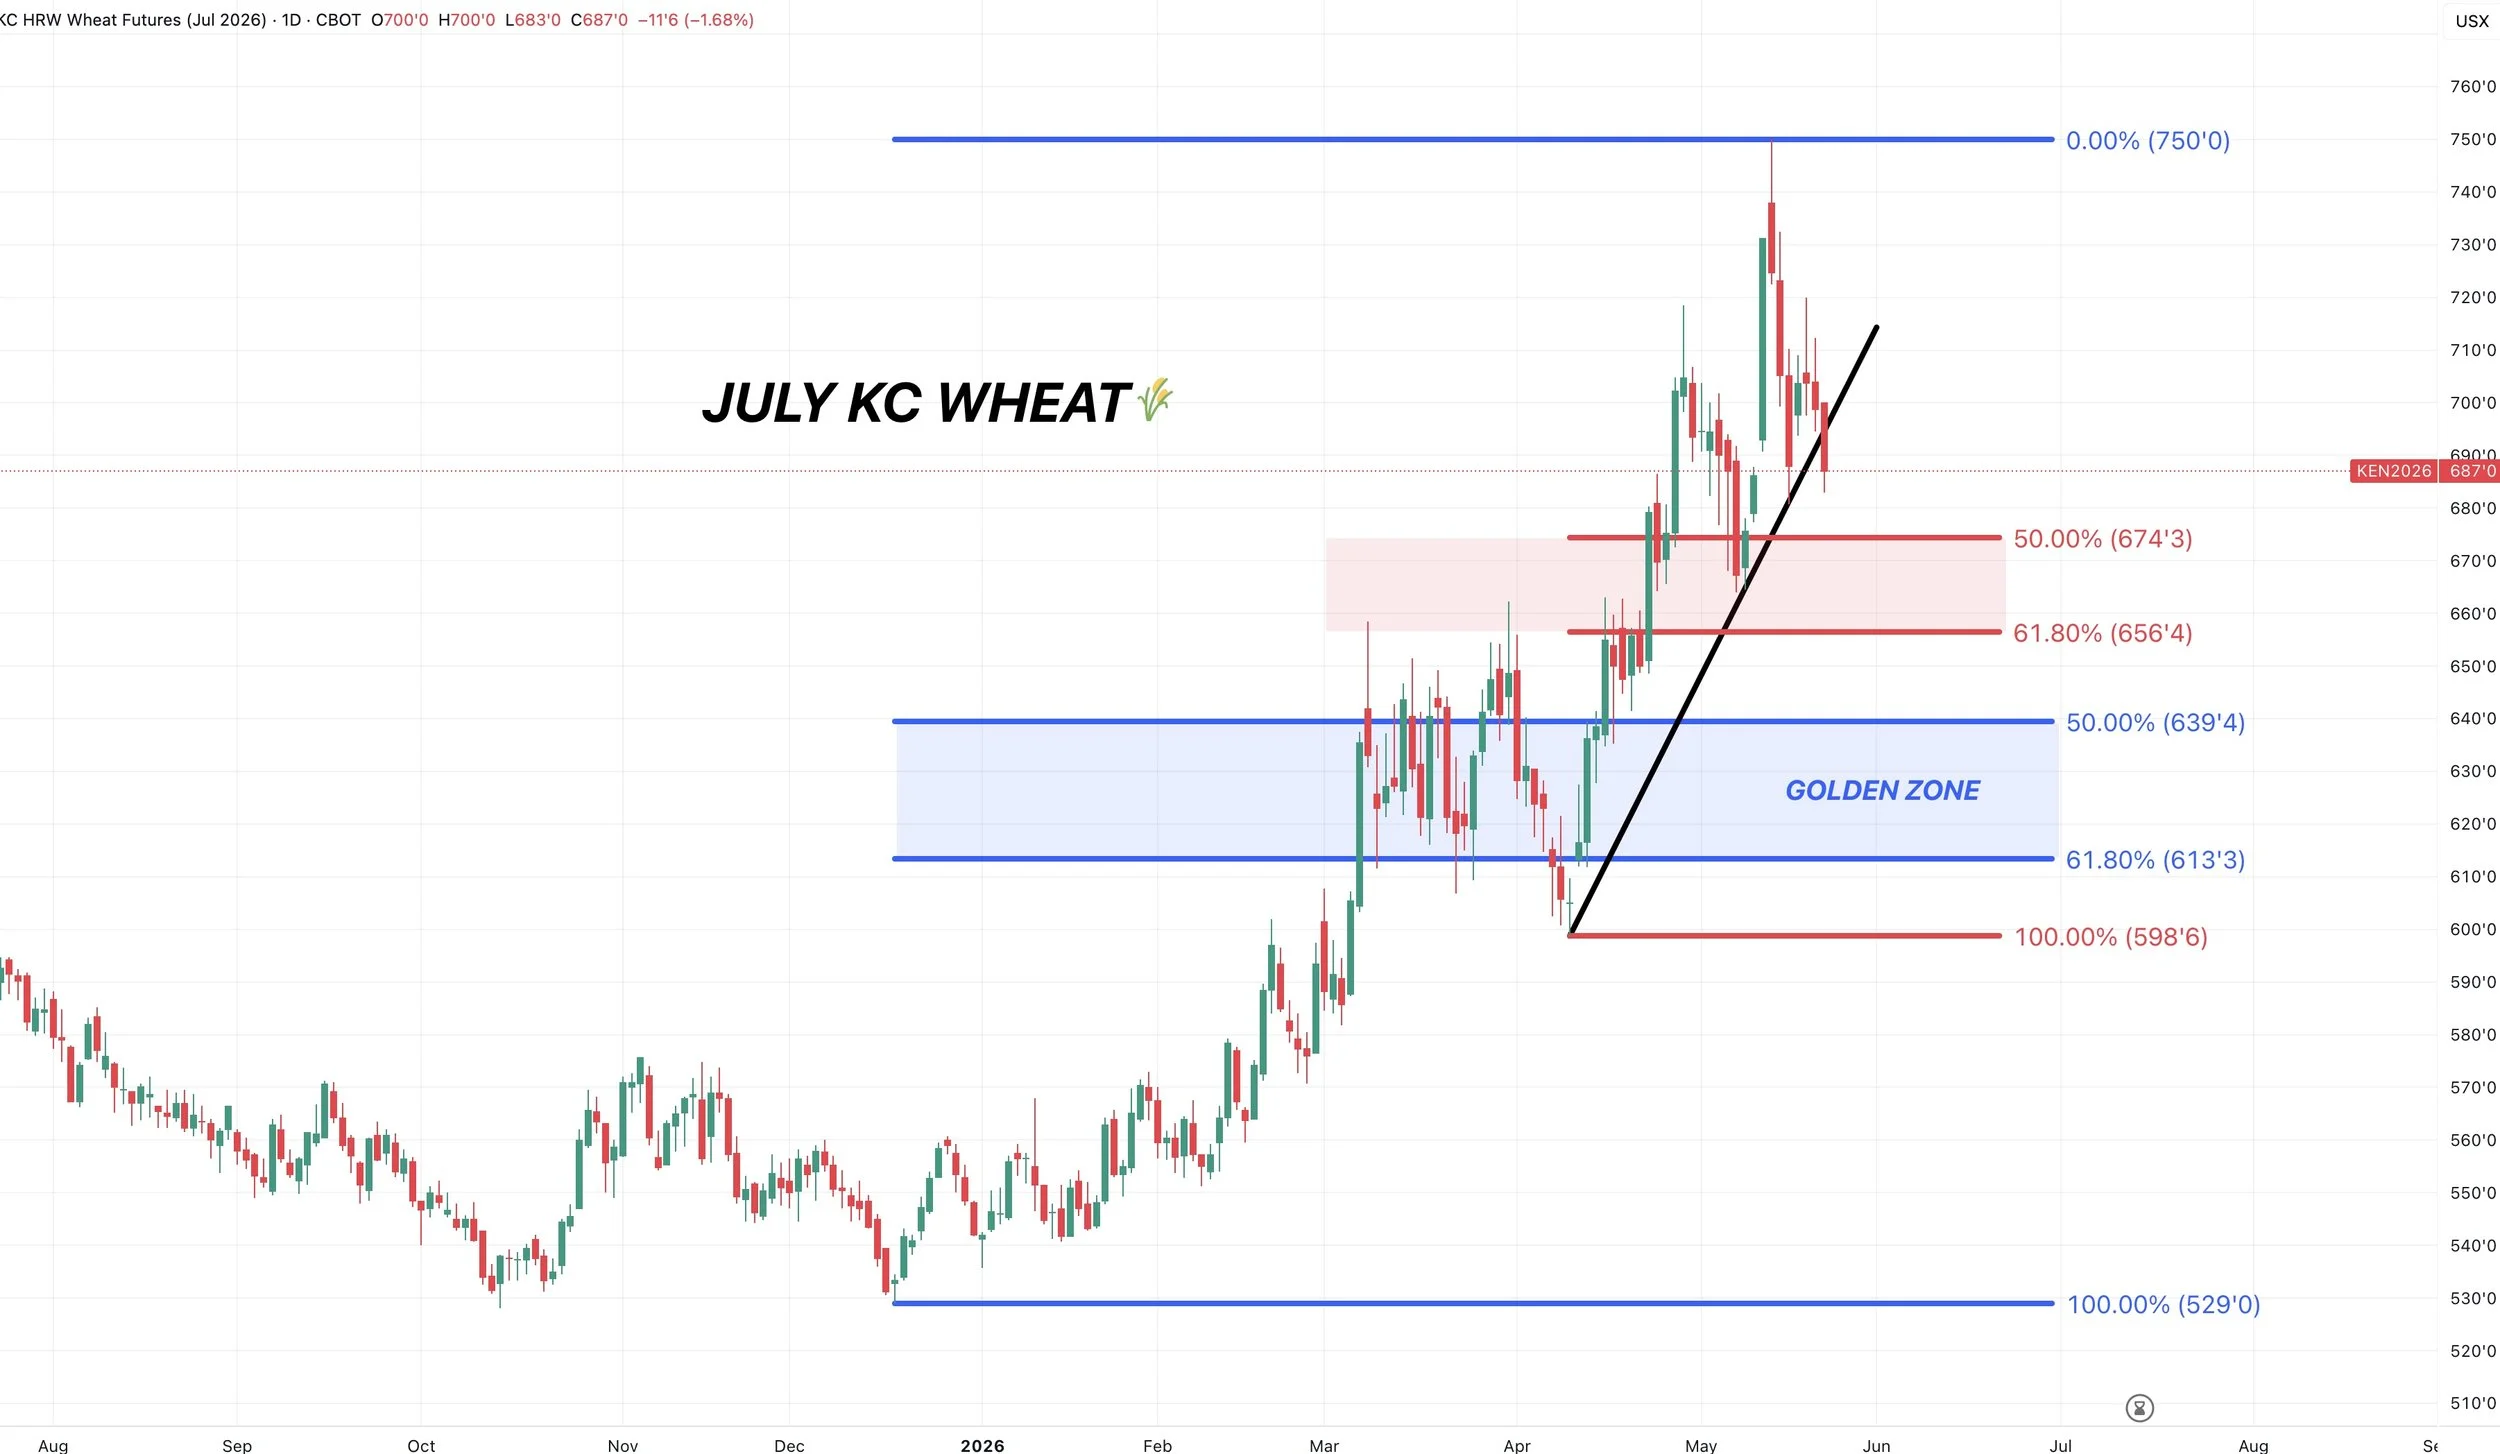
July KC 🌾
Potentially broke the short term uptrend we had, although it was a rather steep trend so it was bound to break. Chart is still in an overall uptrend for now.
The first big area of support comes in at $6.56 to $6.74. That gives back 50-61.8% of the recent highs down to those April lows at $5.99.
That same level is prior resistance.
Fail to hold that level, and we could go test the big picture golden zone. Which is 50-61.8% of the ENTIRE rally from those lows last year.
That would be considered the must hold level to keep the long term trend higher.
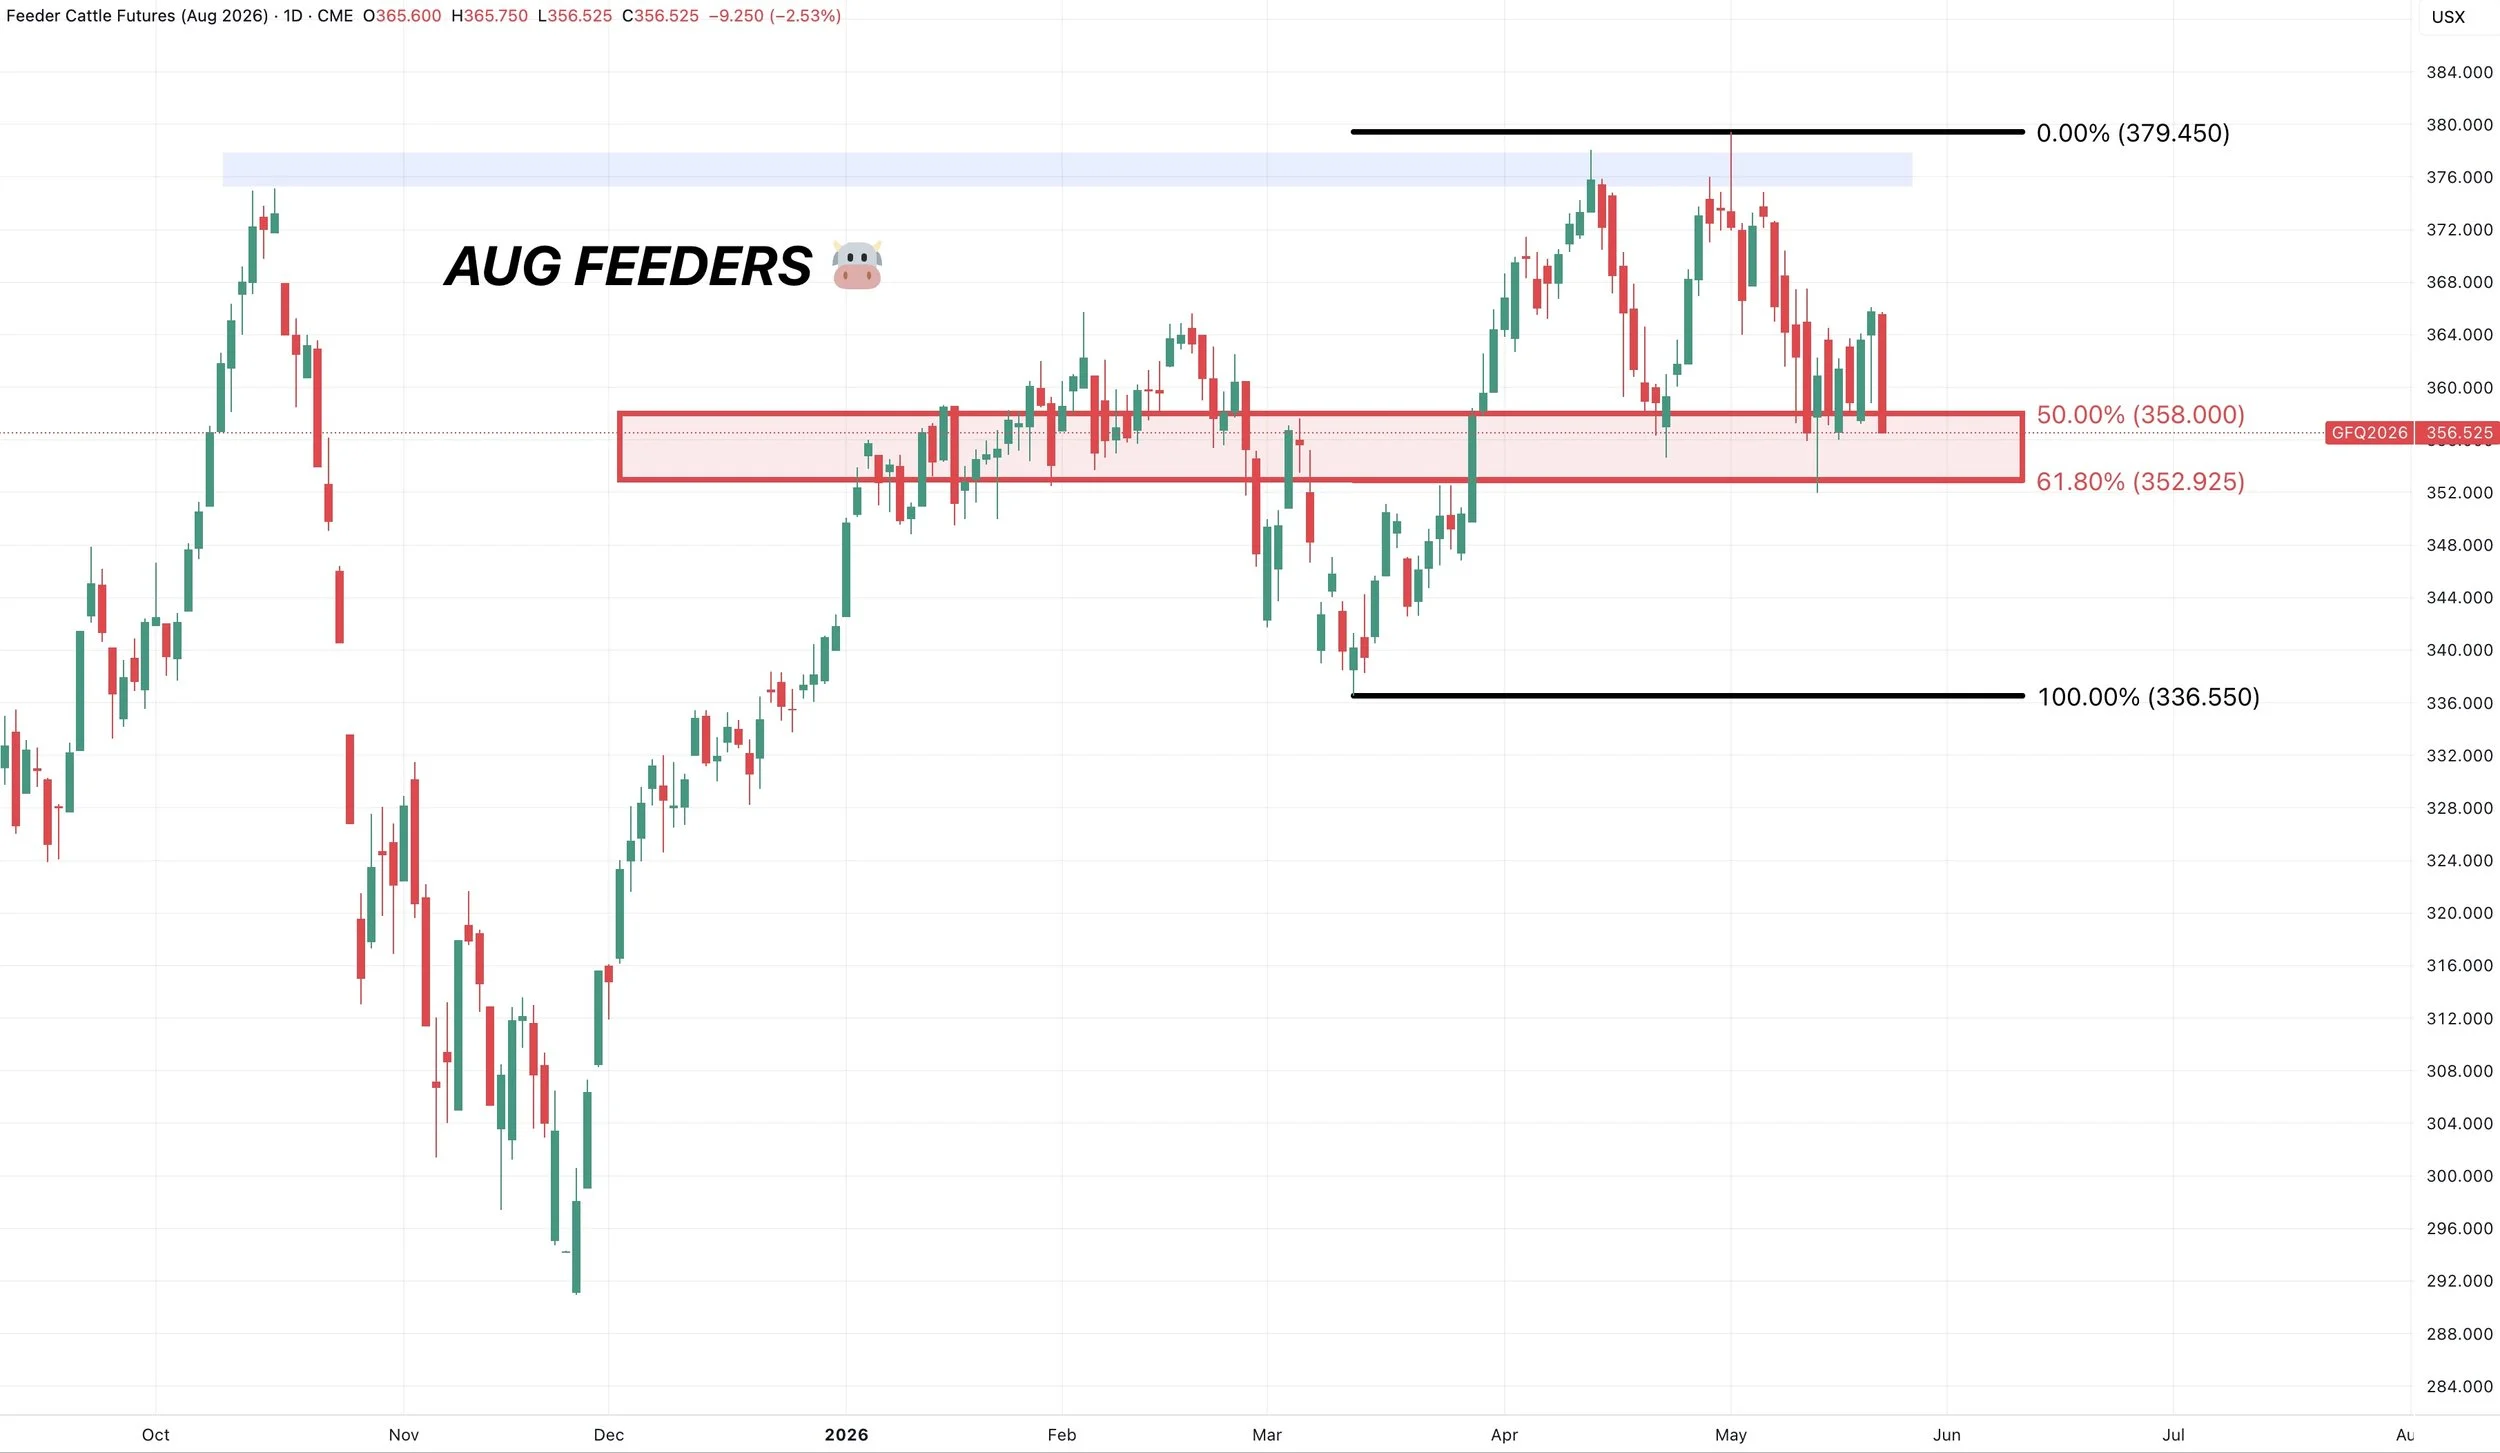
August Feeders 🐮
Limit down today.
Now right back in that must hold box.
The golden zone of the rally since those March lows.
Need to hold this box or it opens the door potentially a lot lower.
Want to Talk?
Our phones are open 24/7 for you guys if you ever need anything or want to discuss your operation.
Jeremey & Office: (806)484-1214
Sebastian: (605)280-1186
Email: sfrost@dailymarketminute.com
Hedge Account
Interested in a hedge account? Use the link below to set up an account or give us a call.
Recent Updates
May 20th - Market Update Video
Grains Follow Crude Lower
May 19th - Audio Commentary
Grains Back Near Highs
Click Here to View
May 18th - Audio Commentary
China Deal Gets Teeth
Click Here to View
May 15th - Audio Commentary
China Commits but No Details
Click Here to View
May 13th - Audio Commentary
China Meeting Tonight
Click Here to View
May 12th - Market Update Video
USDA & Wheat Limit Up
Click Here to View
May 11th - Audio Commentary
All About Trump, China & USDA
Click Here to View
May 8th - Market Update Video
Grains Catch a Bid Where Needed
Click Here to View
May 7th - Audio Commentary
Grains Hold Critical Spots
Click Here to View
May 6th - Market Update Video
Grains Nearing Sink or Swim Levels
Recent Signals
May 13th, 2026: 🌱
Soybean sell signal & hedge alert.
CLICK HERE TO VIEW
April 28th, 2026: 🌾
KC wheat specific signal.
CLICK HERE TO VIEW
April 27th, 2026: 🌽
Corn catch up sell signal.
CLICK HERE TO VIEW
April 10th, 2026: 🌽
Corn buy signal.
CLICK HERE TO VIEW
March 19th, 2026: 🌱
New crop soybeans signal & hedge alert.
CLICK HERE TO VIEW
March 9th, 2026: 🌱
Soybeans signal & hedge alert. Sent via text.
CLICK HERE TO VIEW
March 6th, 2026: 🌽 🌾
Corn & wheat sell signal & hedge alert.
CLICK HERE TO VIEW
March 3rd, 2026: 🌽
Old crop & new crop corn sell signal & hedge alert.
CLICK HERE TO VIEW
Feb 26th, 2026: 🌱
Old crop & new crop beans sell signal & hedge alert.
CLICK HERE TO VIEW
Feb 19th, 2026: 🌾
KC wheat sell signal & hedge alert.
CLICK HERE TO VIEW
Feb 6th, 2026: 🌽 🌱
Old crop corn & soybean sell signal & hedge alert.
CLICK HERE TO VIEW
Feb 4th, 2026: 🌱
Soybean sell signal & hedge alert.
CLICK HERE TO VIEW
Nov 17th, 2025: 🌱
Soybean sell signal & hedge alert.