
GRAINS HOLD CRITICAL SPOTS
AUDIO COMMENTARY
Grains under pressure but bounce
Iran denies Trump proposal
Crude and grains well off lows
Cattle holds support. Key level
Corn & beans bounce at must hold levels (charts below audio)*
What to do at support levels?
How to utilize our upside/downside targets
China meeting next week
Those that need to move stuff and or behind vs those who are not
This is the seasonal window, but this isn’t your normal type of year either
Your situation determines your marketing plan
Are your sales profitable?
Comfort is worth more than anything
Courage calls vs puts
Some rain in the forecasts
The risks in the wheat market
Finger on the trigger for sales. Be ready
All chart breakdowns below*
Listen to today’s audio below
Want to talk?
Office: (806)484-1214
CHART BREAKDOWNS
Below is a quick rundown of the charts. If you missed yesterday’s video where I went over the charts you can watch or read it here:
Click Here for Yesterdays Video
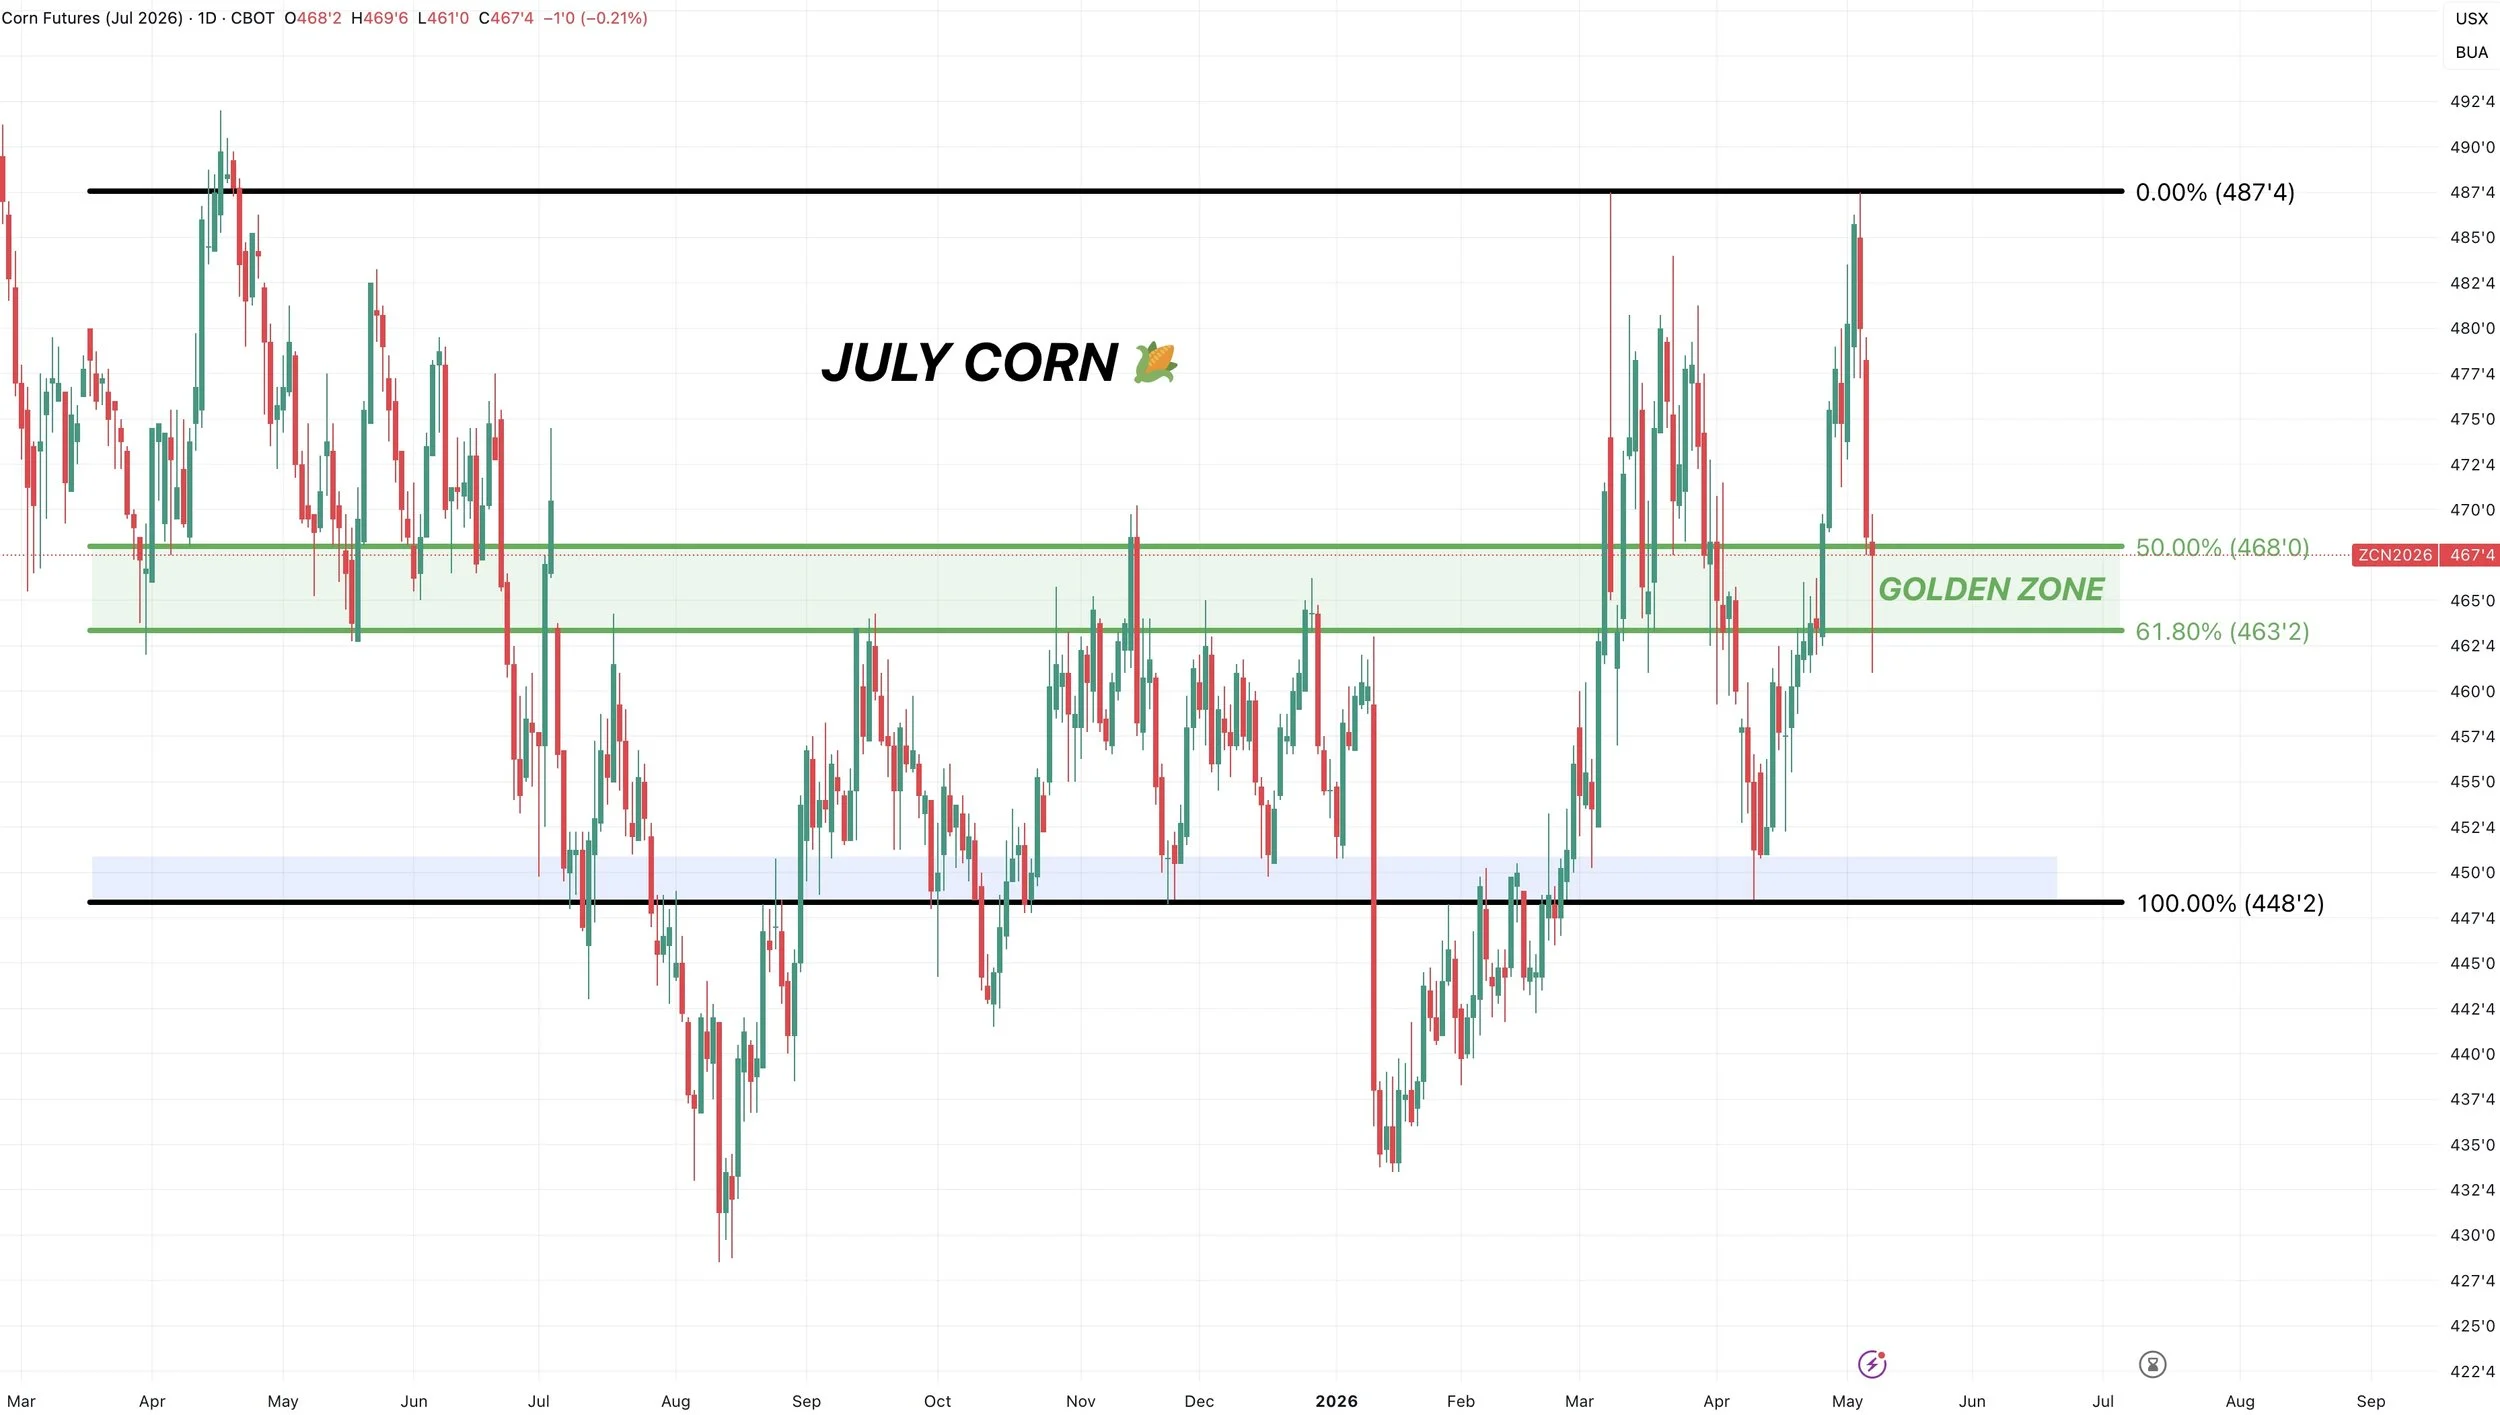
July Corn 🌽
Held that key support we talked about yesterday.
$4.63 is the 61.8% level of the rally.
It’s also old resistance from fall, where the market failed to bust through on several different attempts.
$4.63 is still the must hold level, as failure to hold could result in us going to test the prior lows and blue box.
But great reaction off the level today. As I said yesterday, if we are going to bounce, this would be the area we need to do so.
As this is where the market oftens tell us:
61.8% level holds = this is often a normal sized correction
61.8% level fails = this could be something more than your usual correction
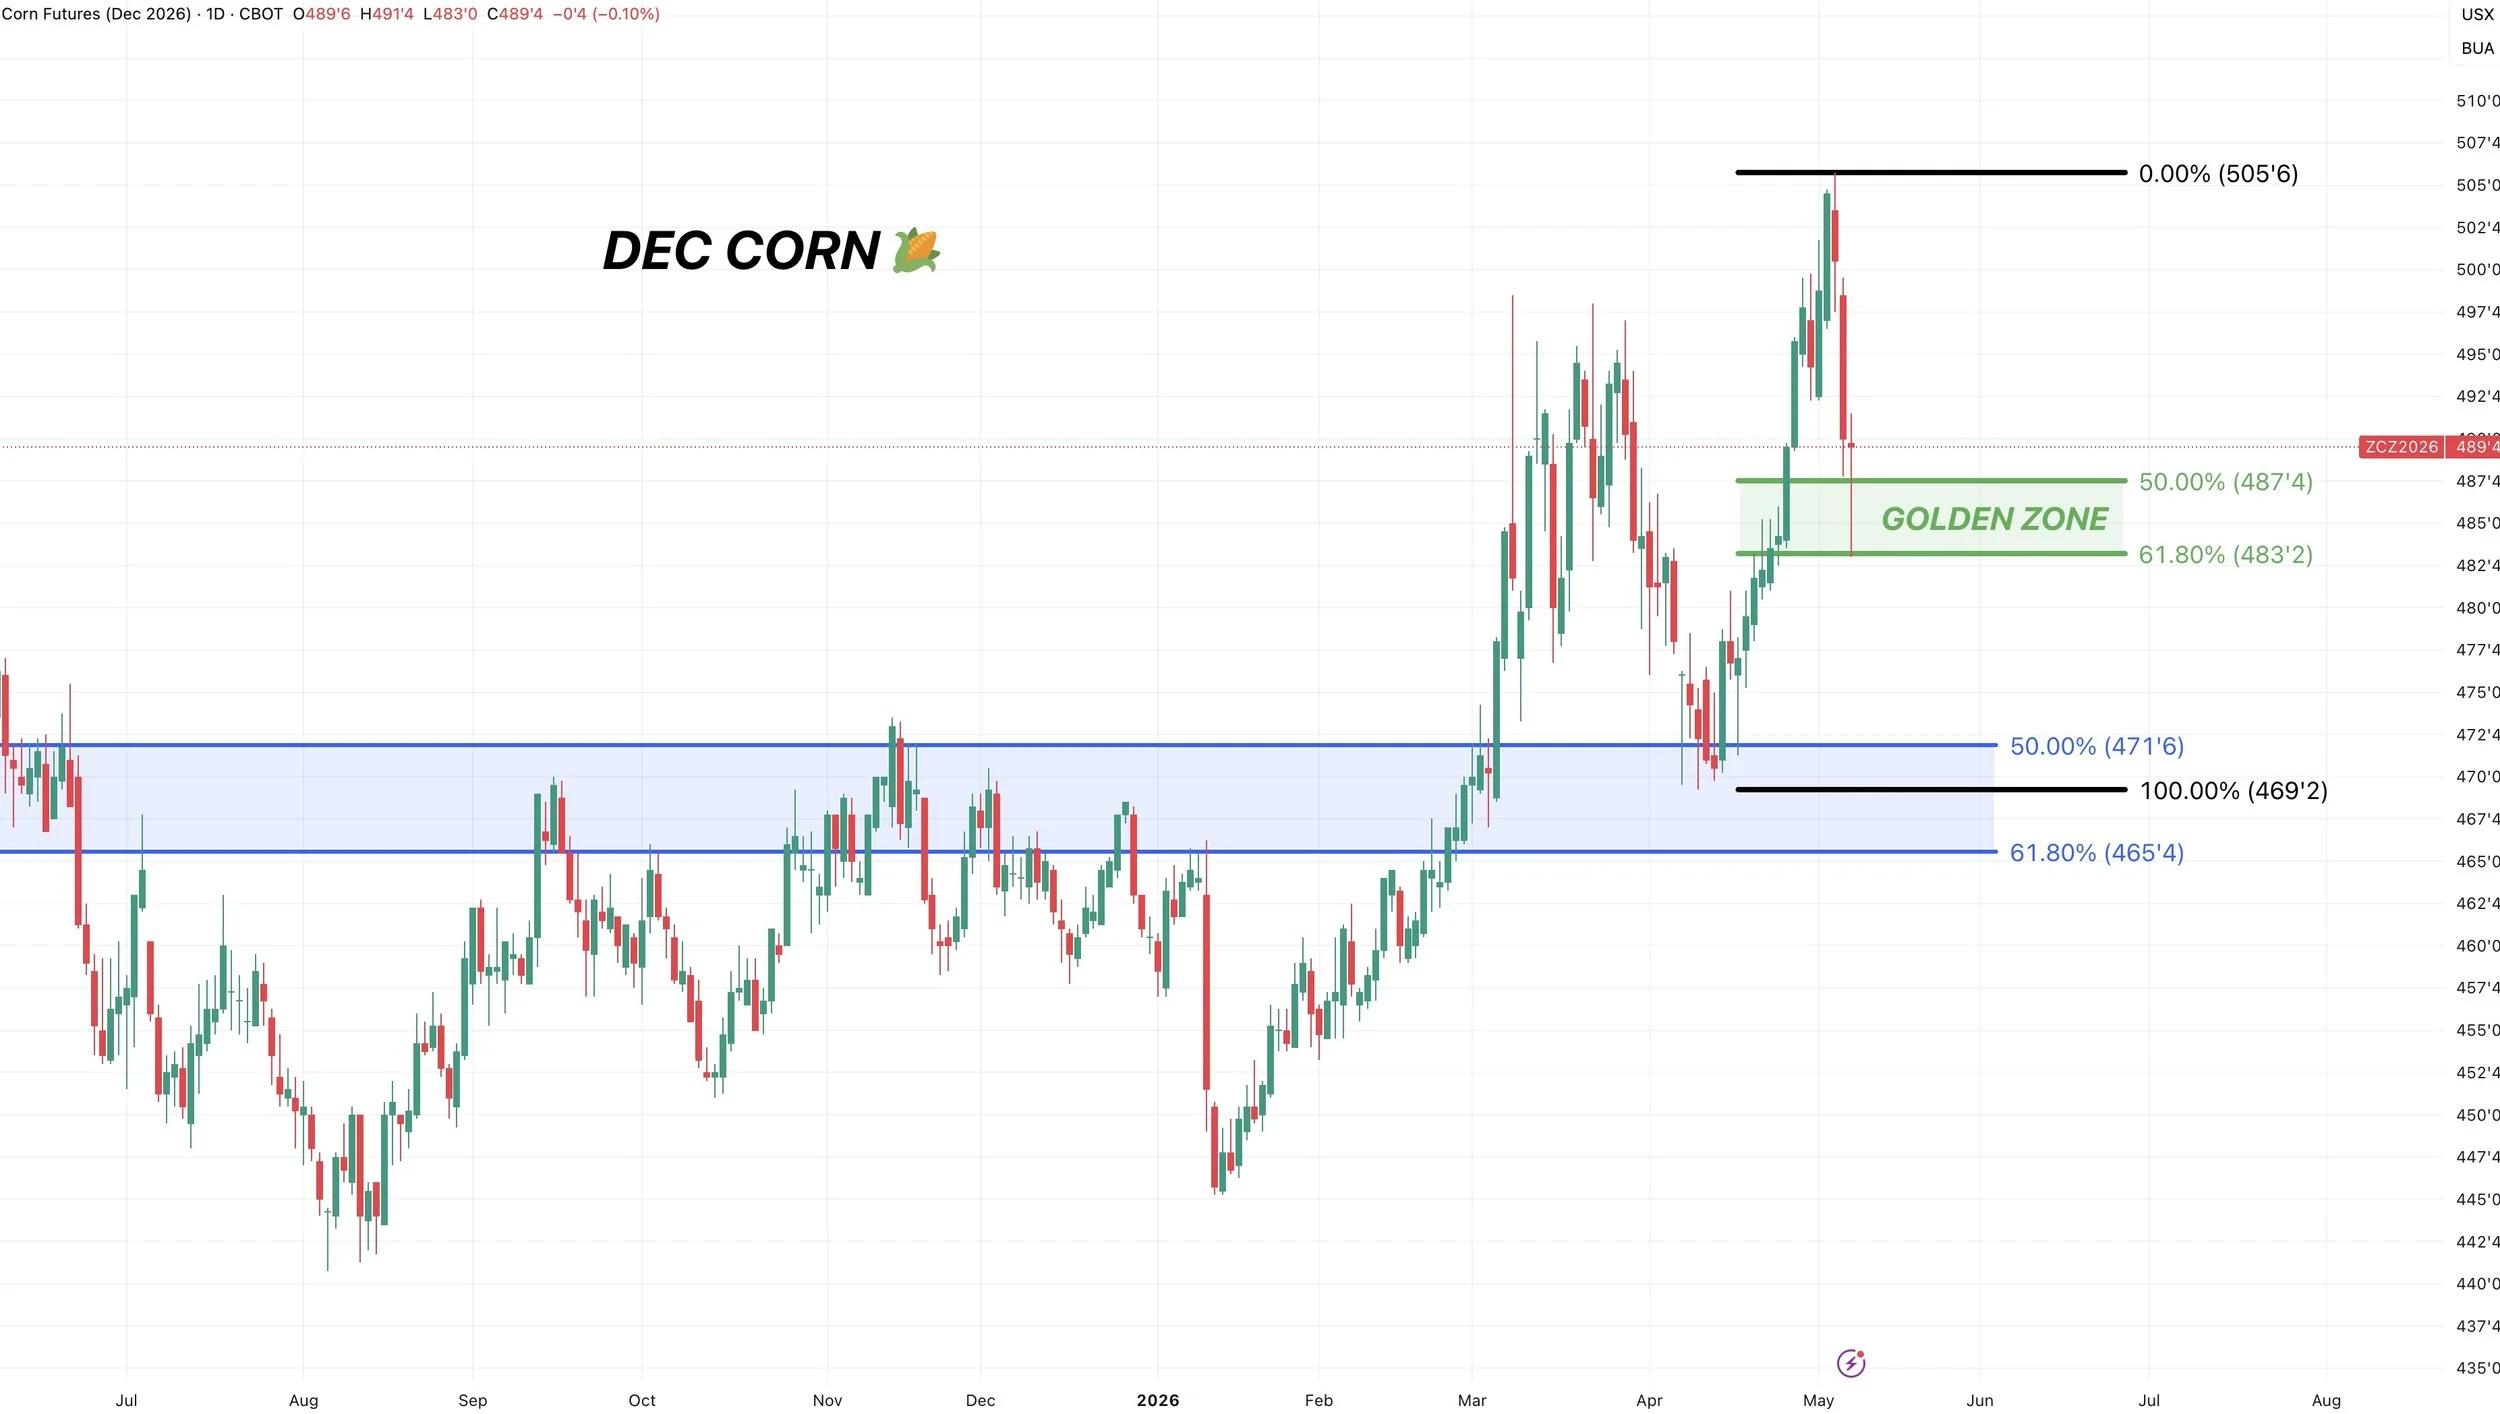
Dec Corn 🌽
Similar-ish setup here.
Held 61.8% level perfectly.
That’s the level we need to hold.
If we are going to bounce, this is the level we need to do so. Otherwise it opens the door lower potentially.
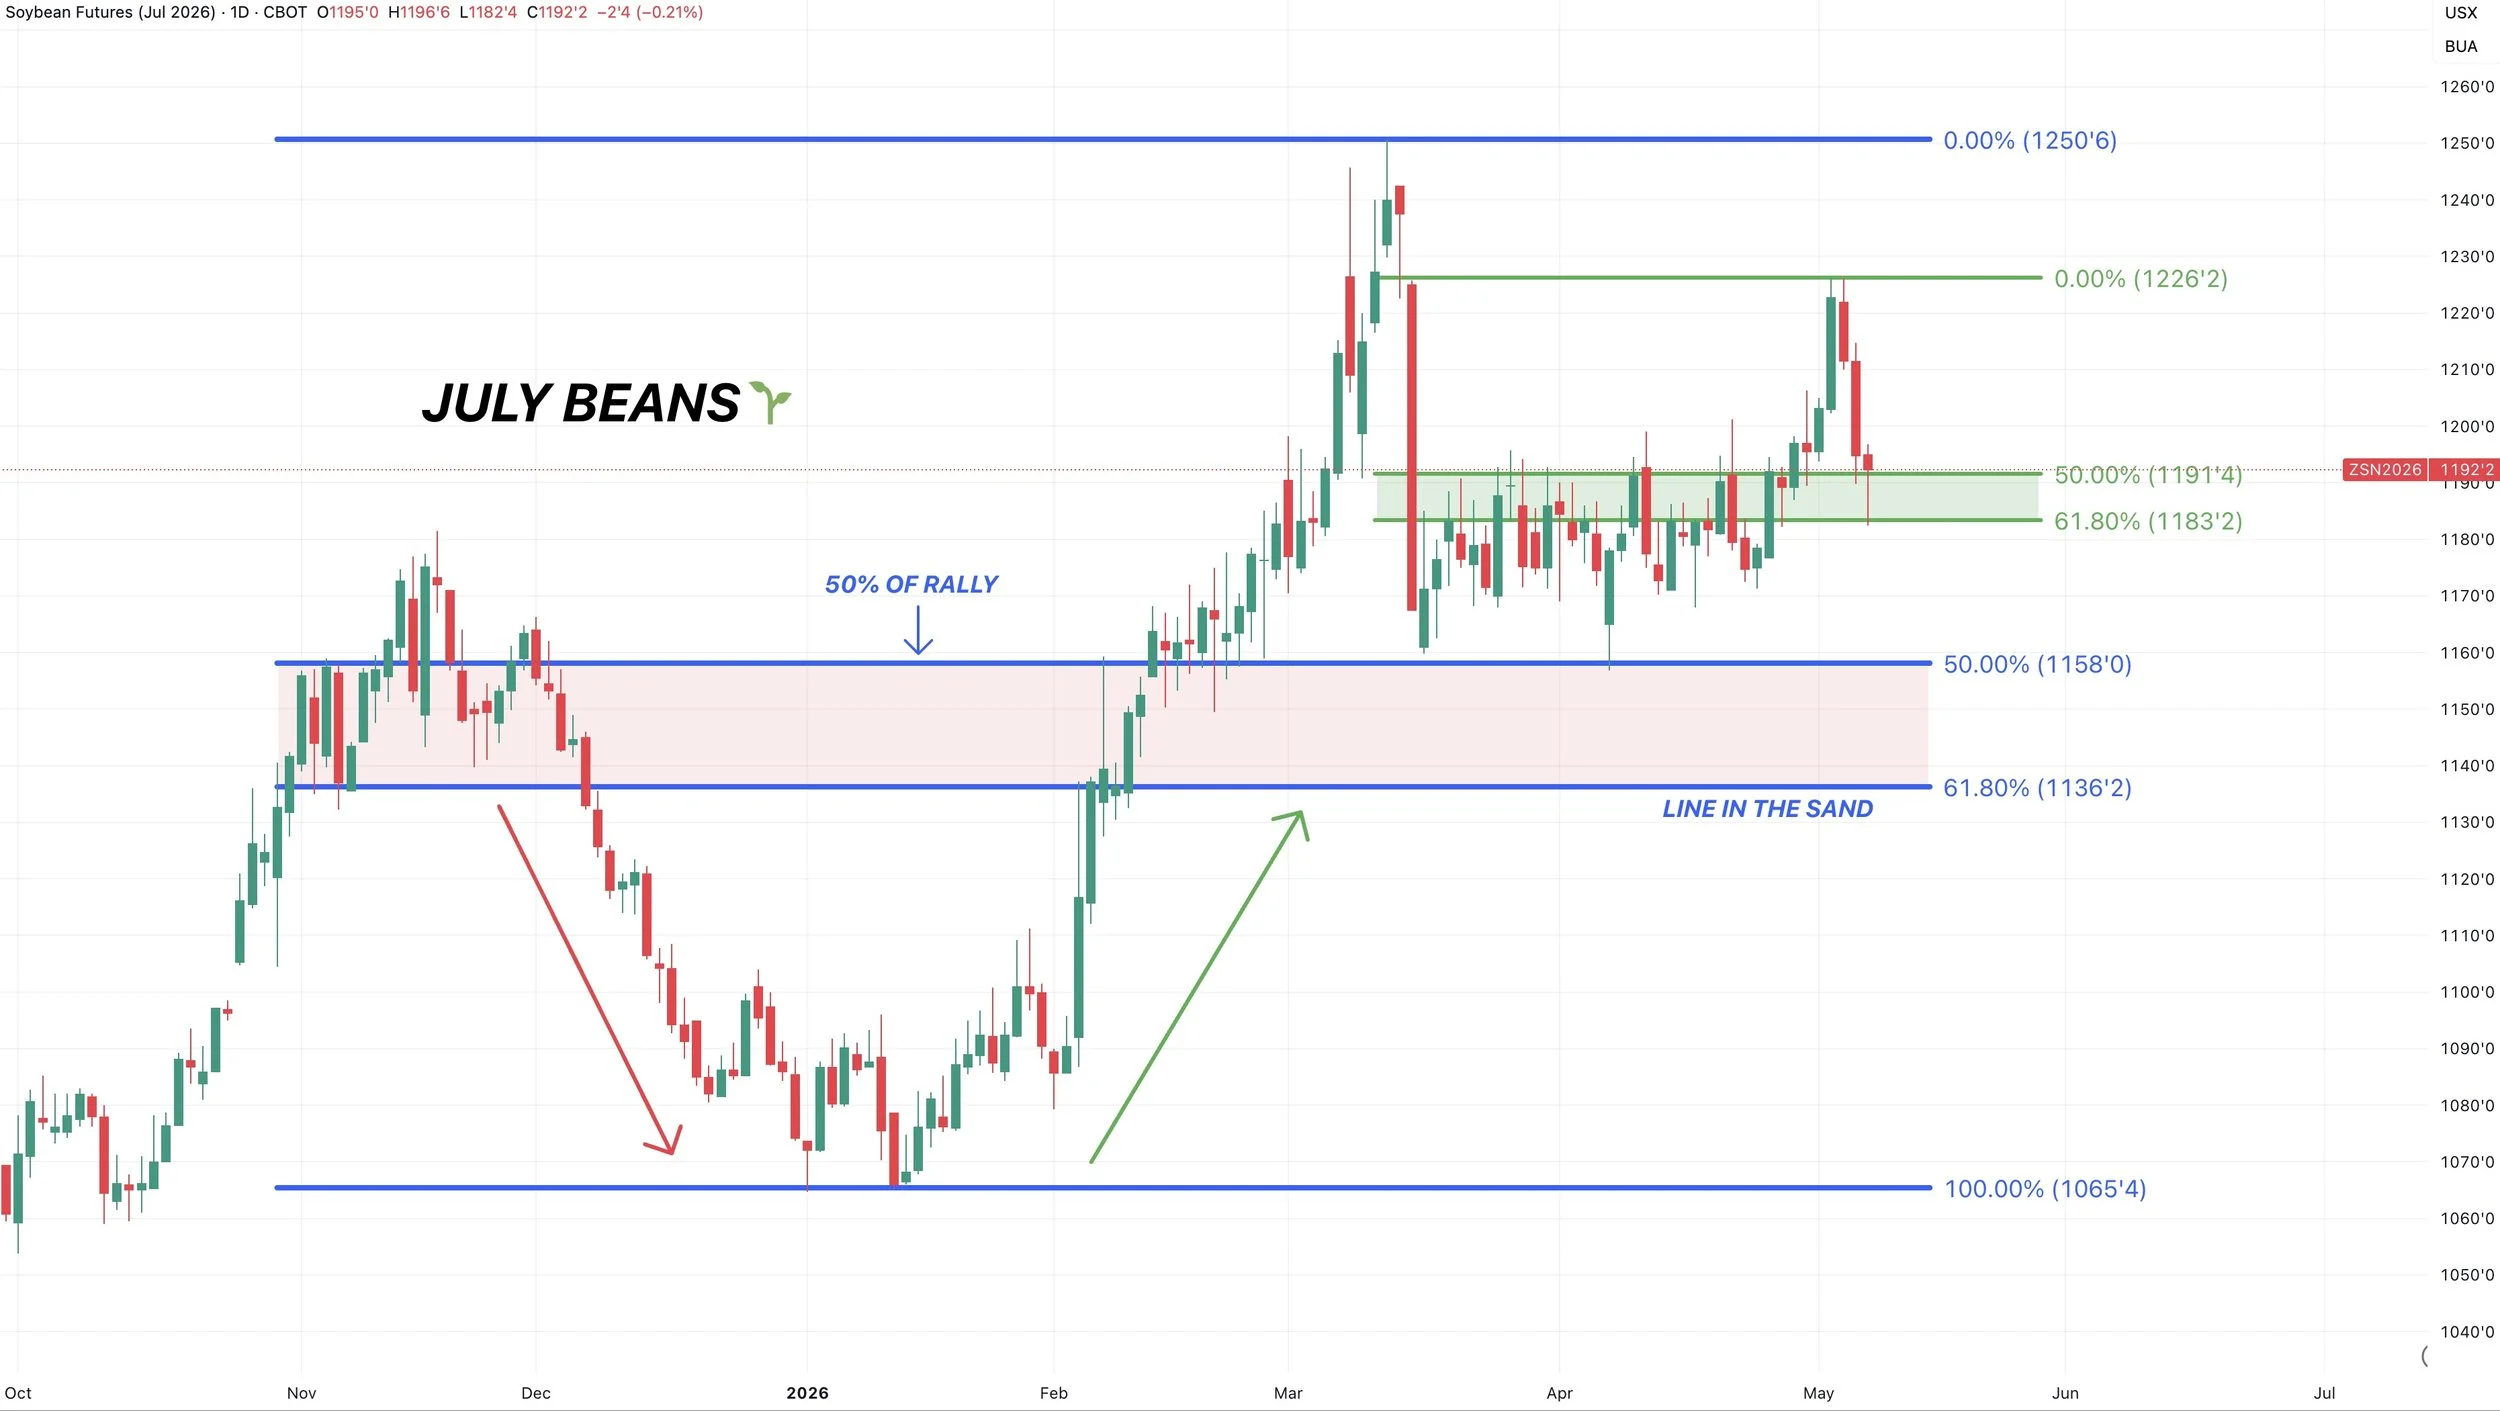
July Beans 🌱
Like corn, also held the 61.8% level perfectly.
That same level was old resistance.
We were stuck in a tight range, we broke out. That 61.8% level is the old point of break out.
This could be a simply re-test, trying to turn old resistance into new support.
So this would be the level we need to hold and where we’d expect us to bounce if we are going to bounce.
As always, this box is usually where the market decides if this is a normal correction or not.
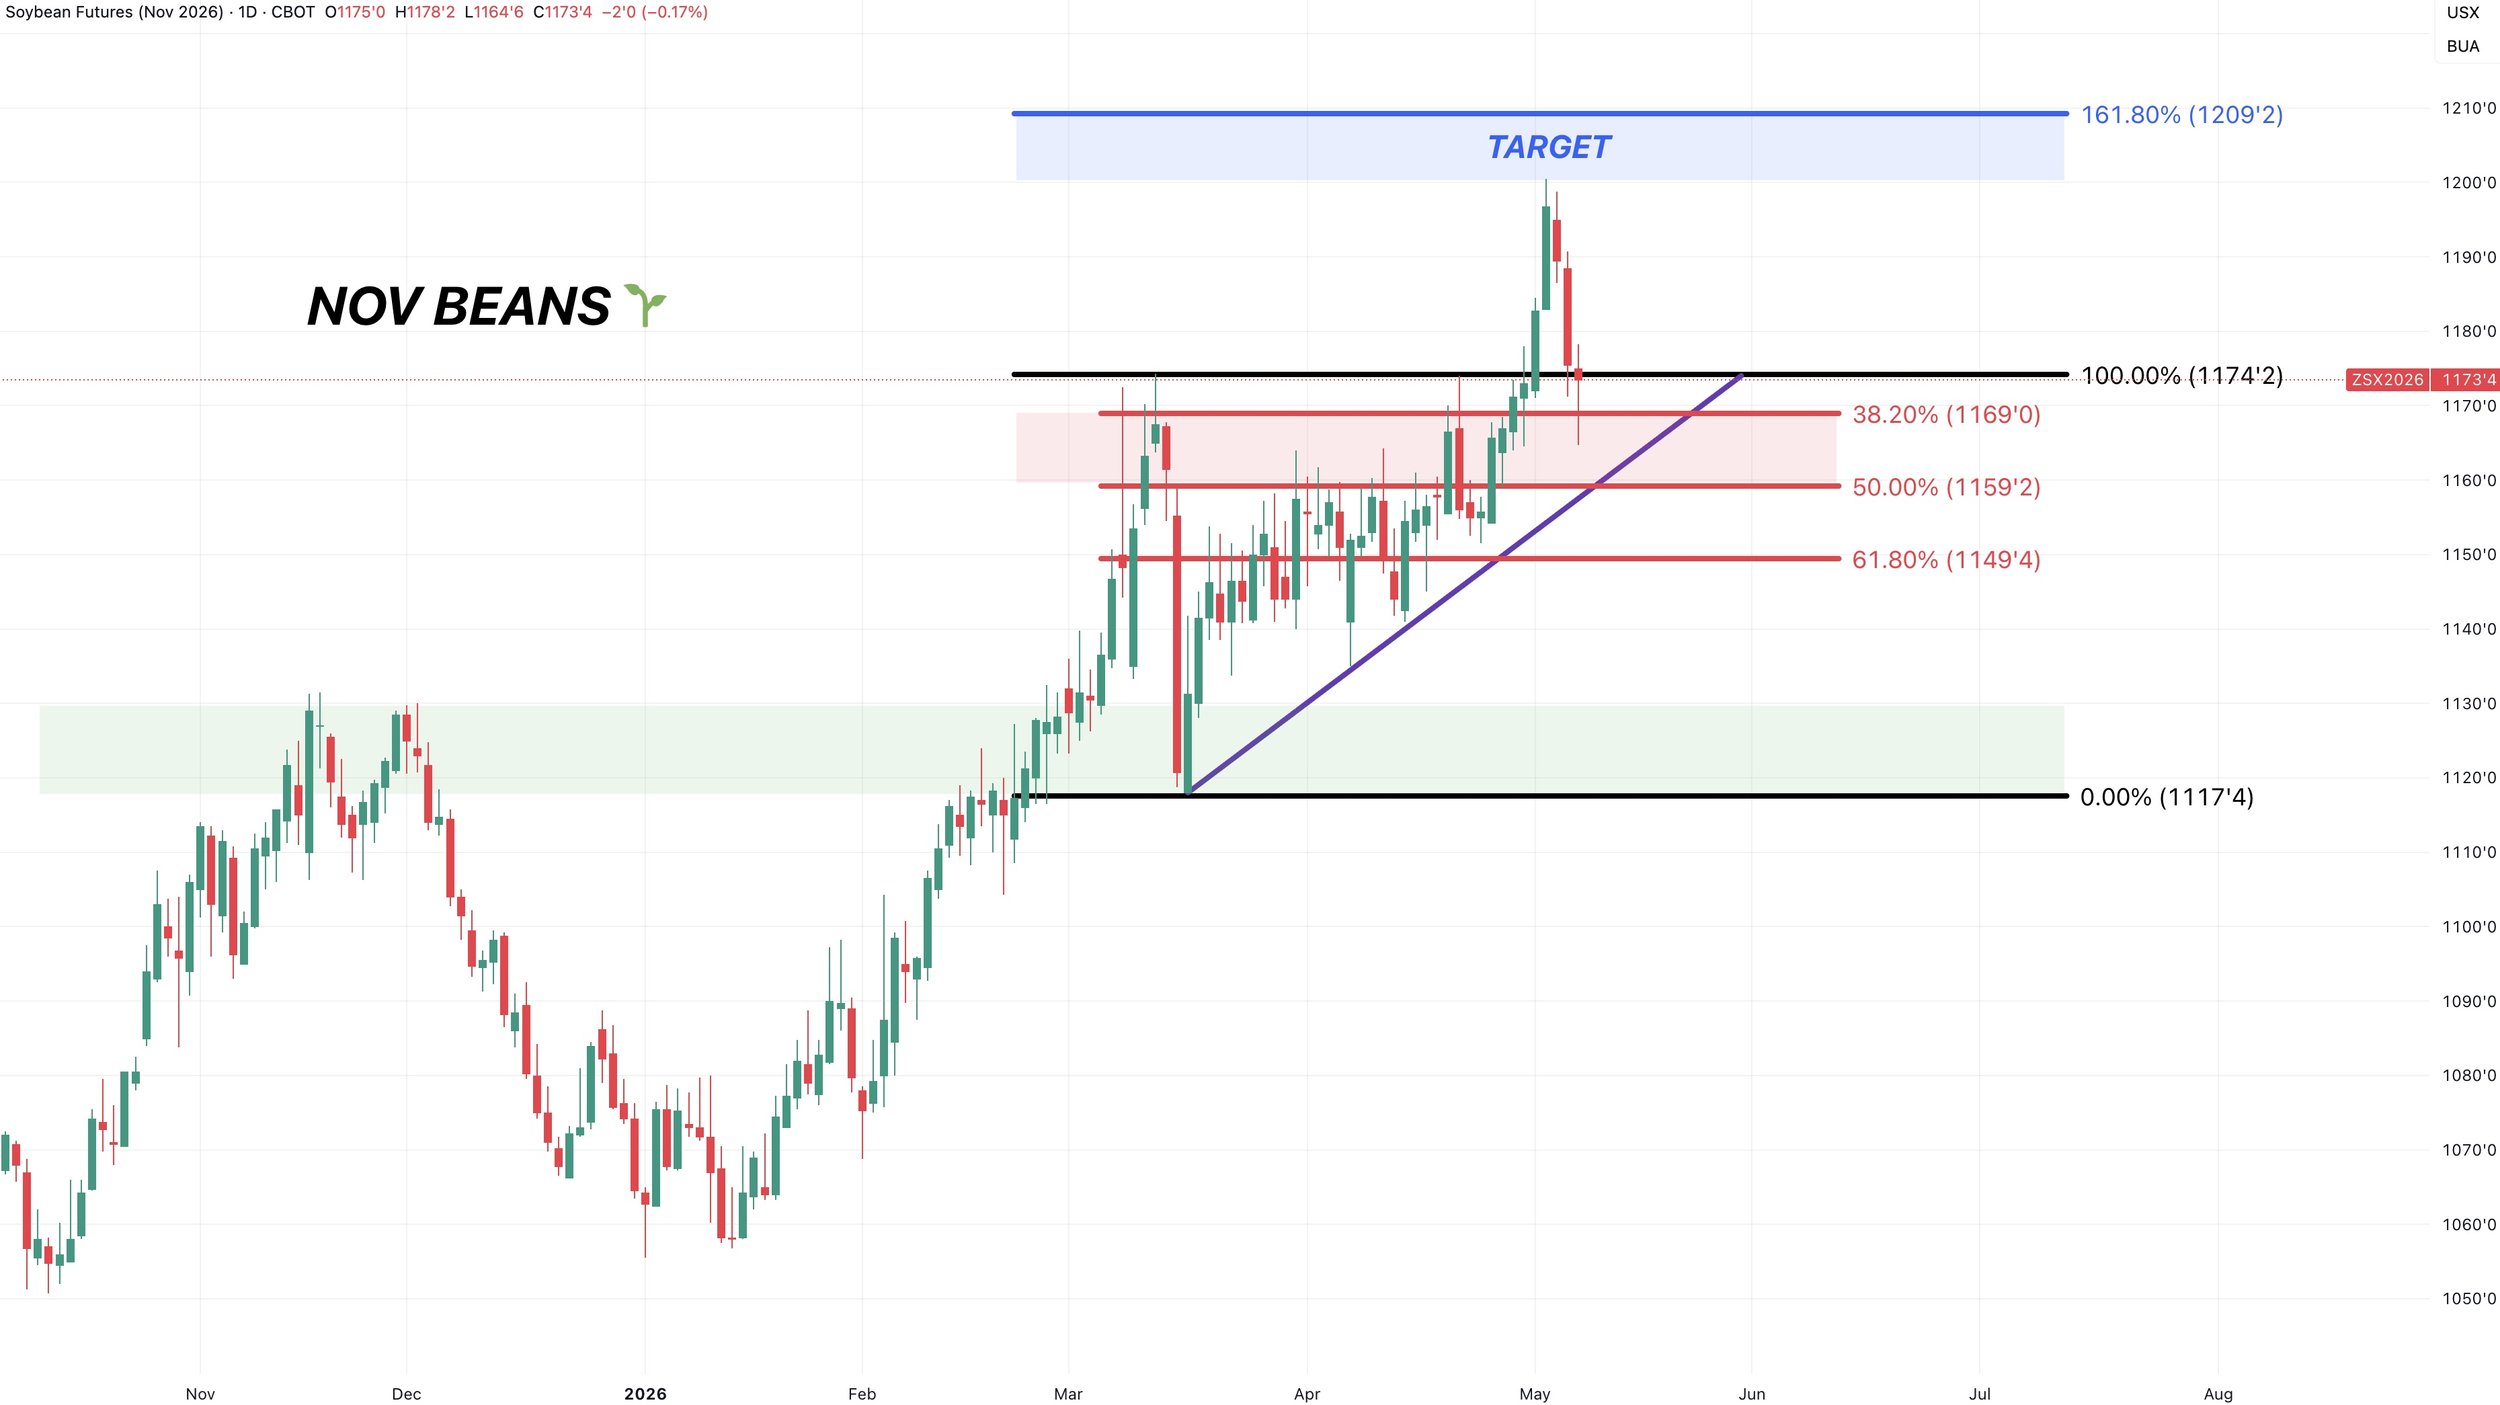
Nov Beans 🌱
We always talk about the golden zone.
However in a strong market like this one, the 38.2% to 50% level can be common, rather than the 50% to 61.8% level. Which is where we are currently finding life.
July beans are currently in the golden zone right now, so Nov finding life a set of fib levels higher might make sense as Nov has been far stronger. Hopefully that makes sense.
This same level was our prior resistance. Currently, attempting to turn that old resistance into new support.
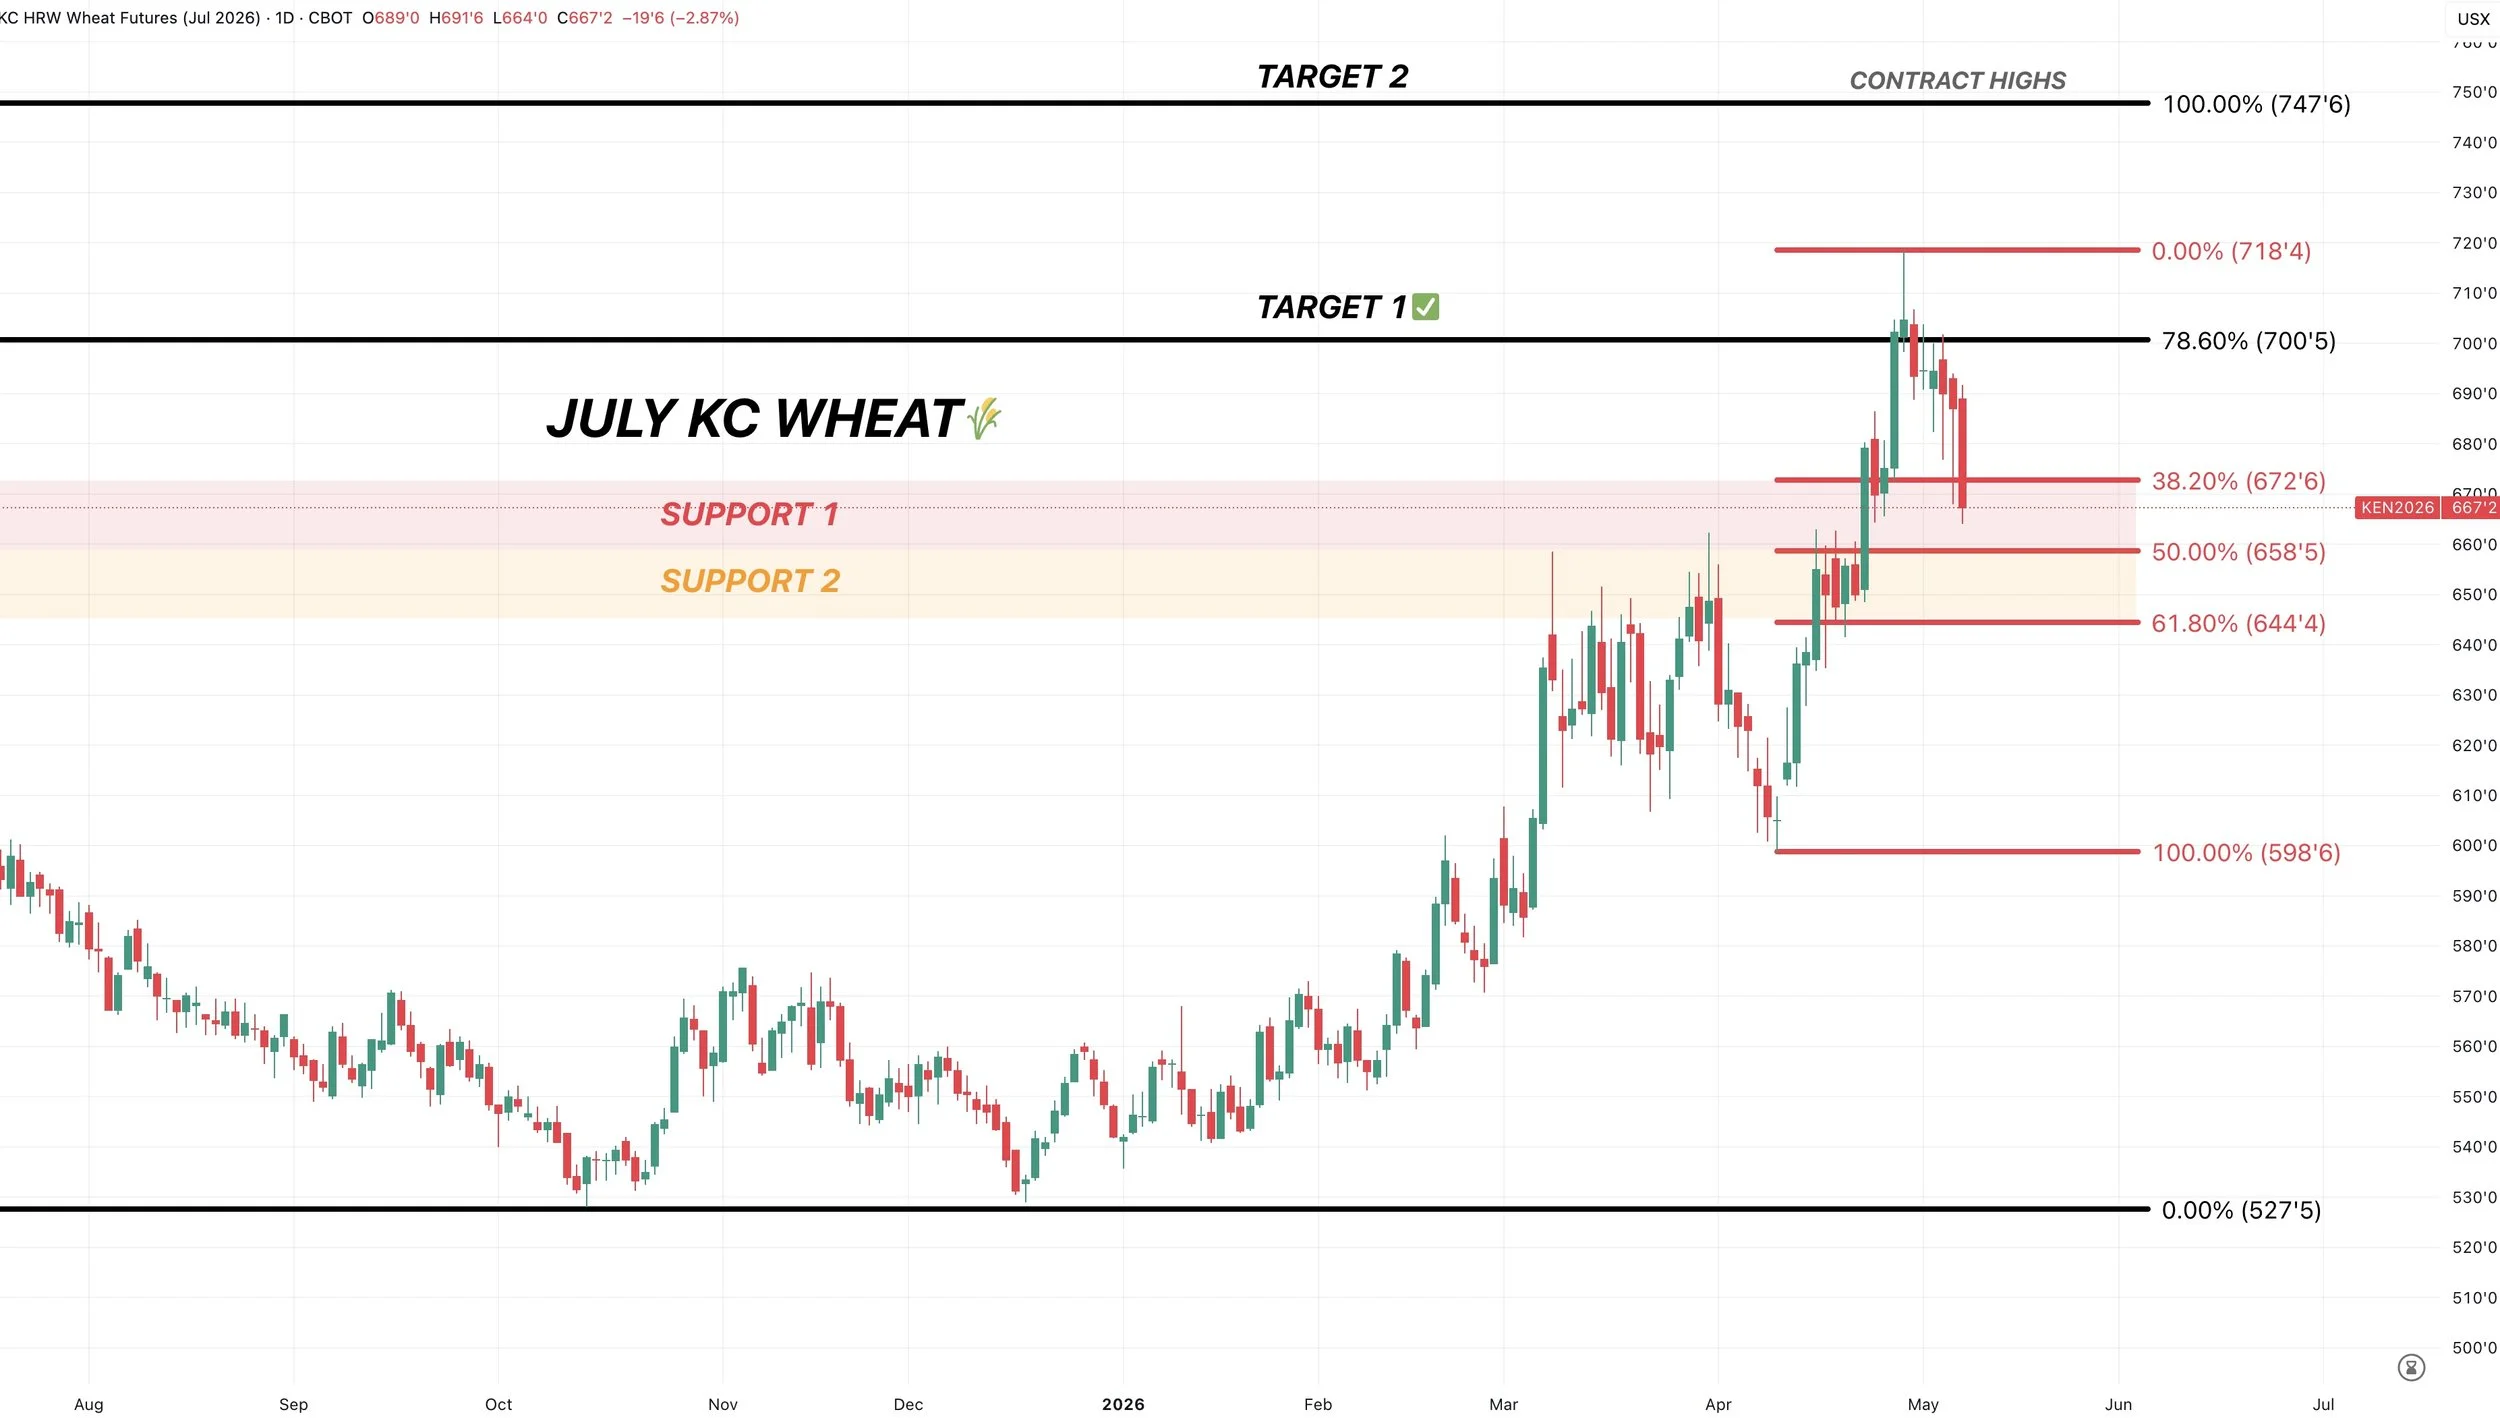
July KC 🌾
Like in Nov beans, often times a strong market only comes down to the 38.2% to 50% levels. So we could find some life in the red box.
If not, the golden zone (orange box) would be the next level.
That $6.44 and 61.8% level would then be viewed as a must hold spot.
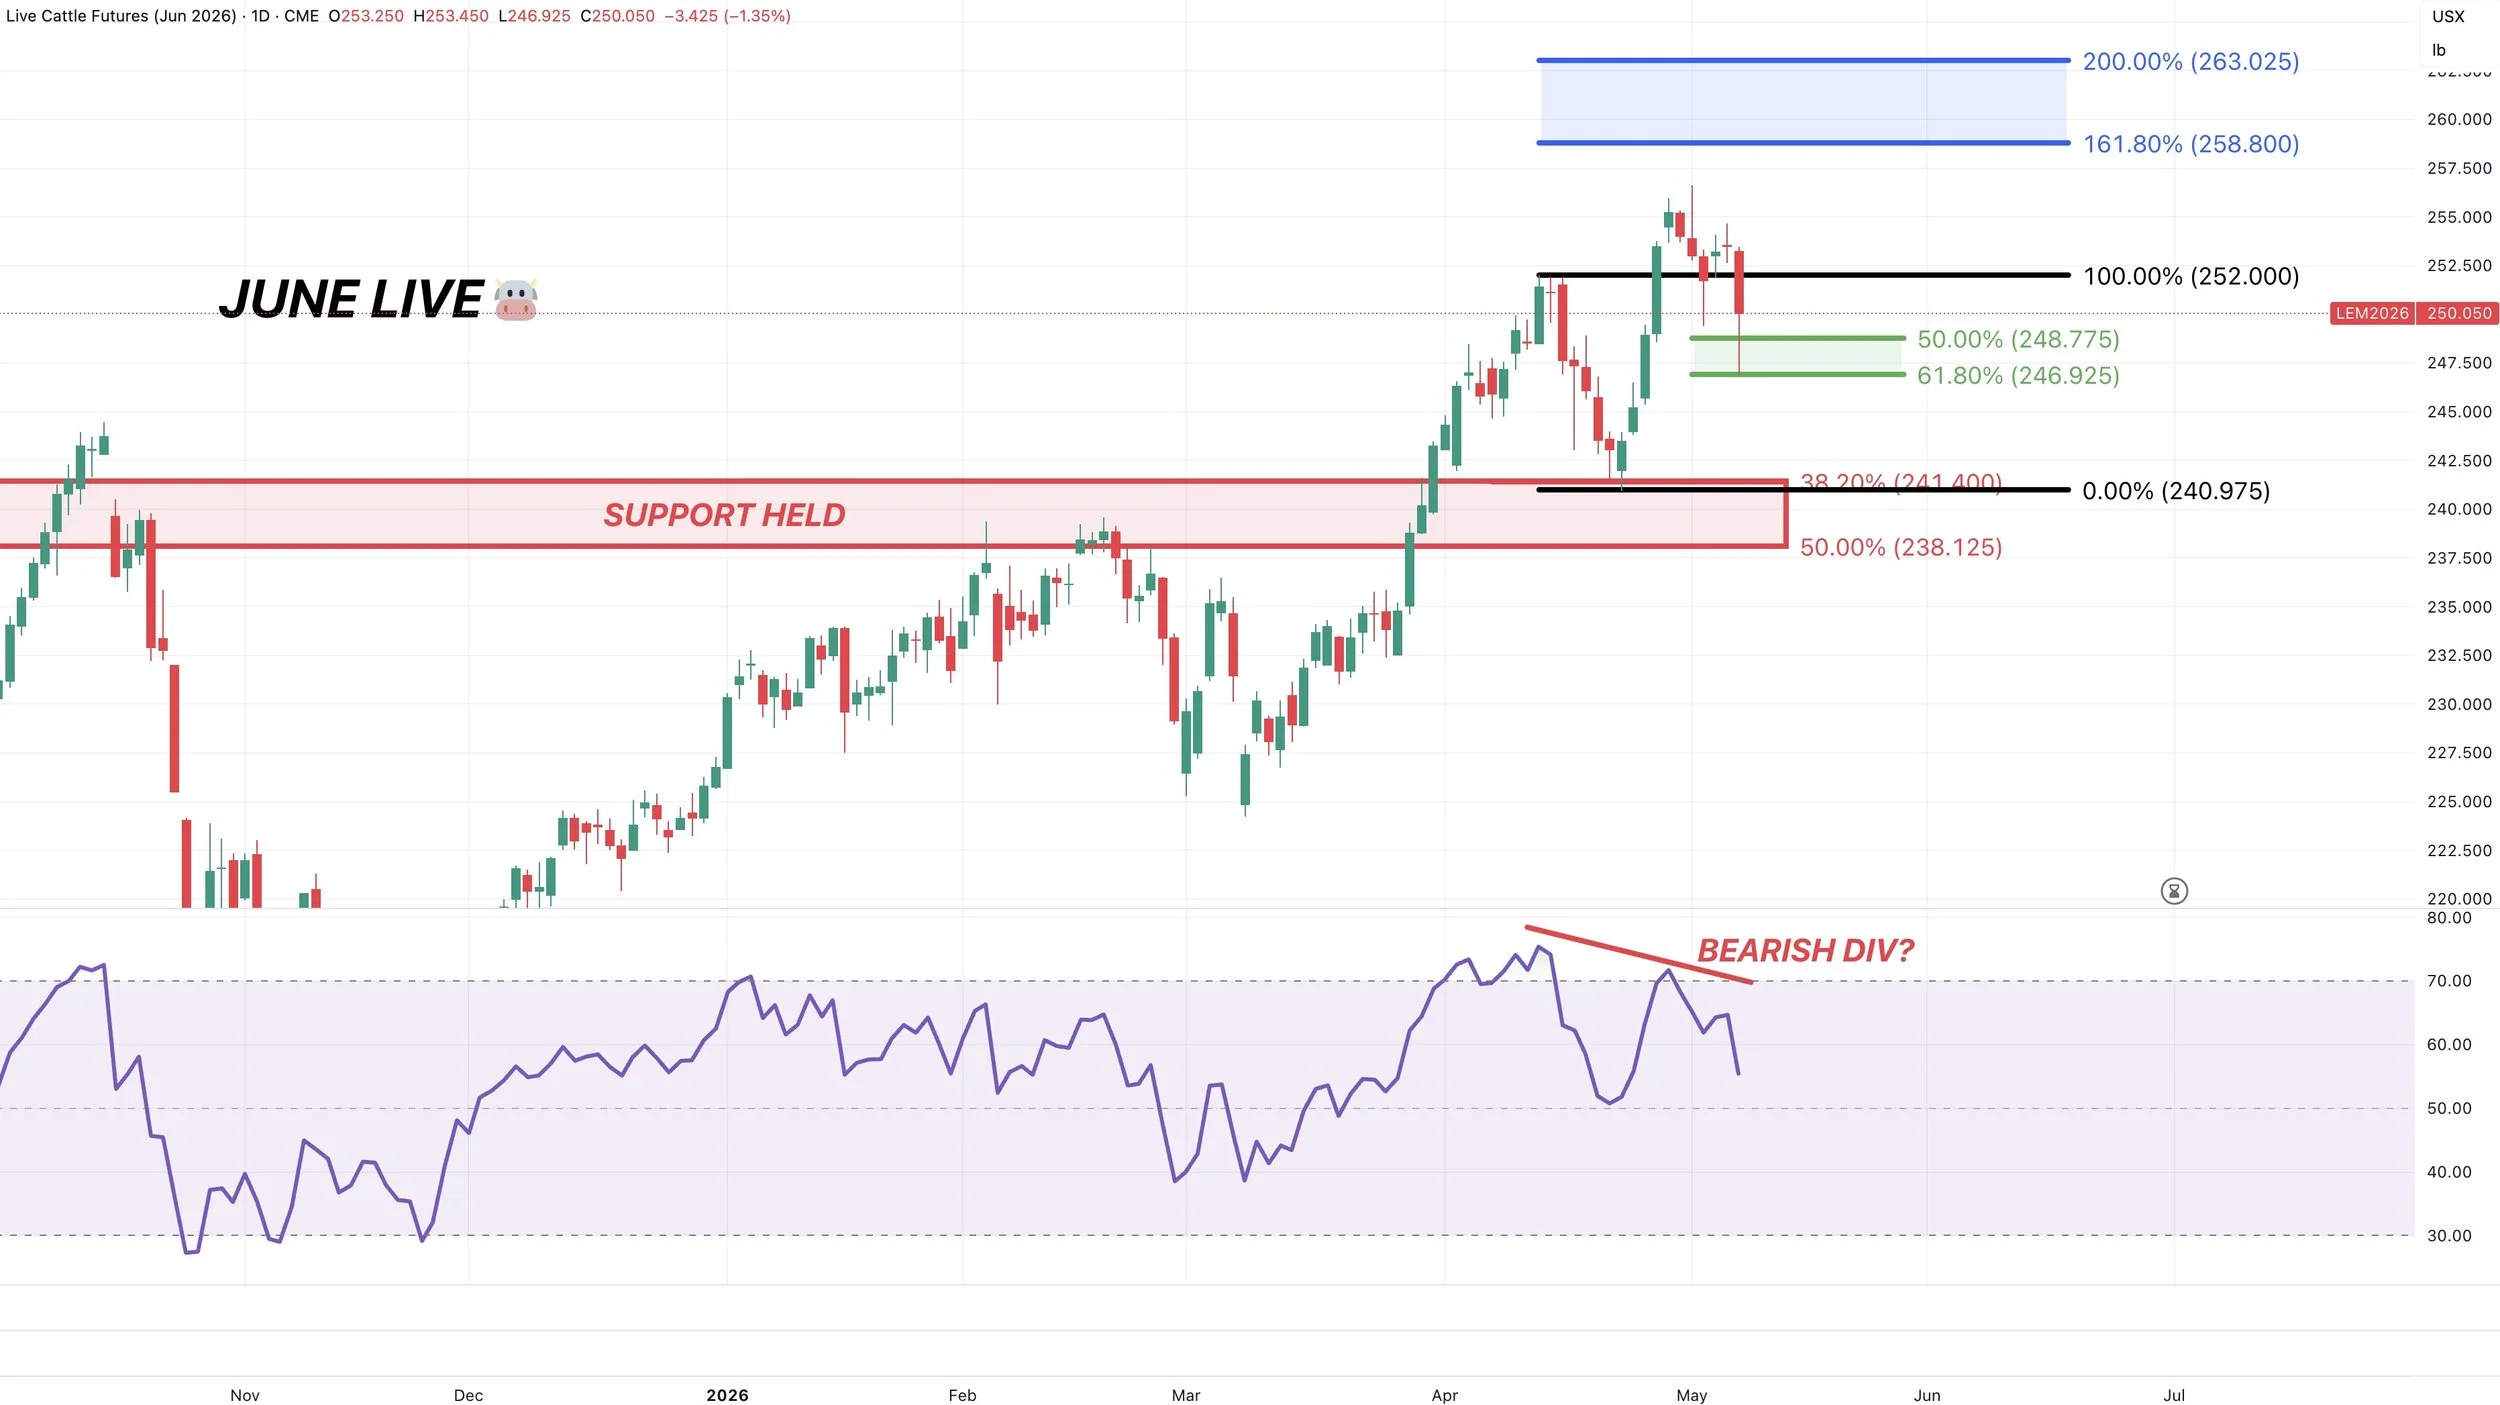
June Live 🐮
We held the golden zone.
As we gave back exactly 61.8% of the recent bounce.
That’s a big level we’d like to hold.
Failure to hold would be a possible warning sign, as we could then go test the old lows.
Something that has me slightly cautious of here is the bearish divergence on the RSI.
Prices made new highs, the RSI did not.
To the upside, the blue box would be a common continuation target if we were to break above the recent highs.
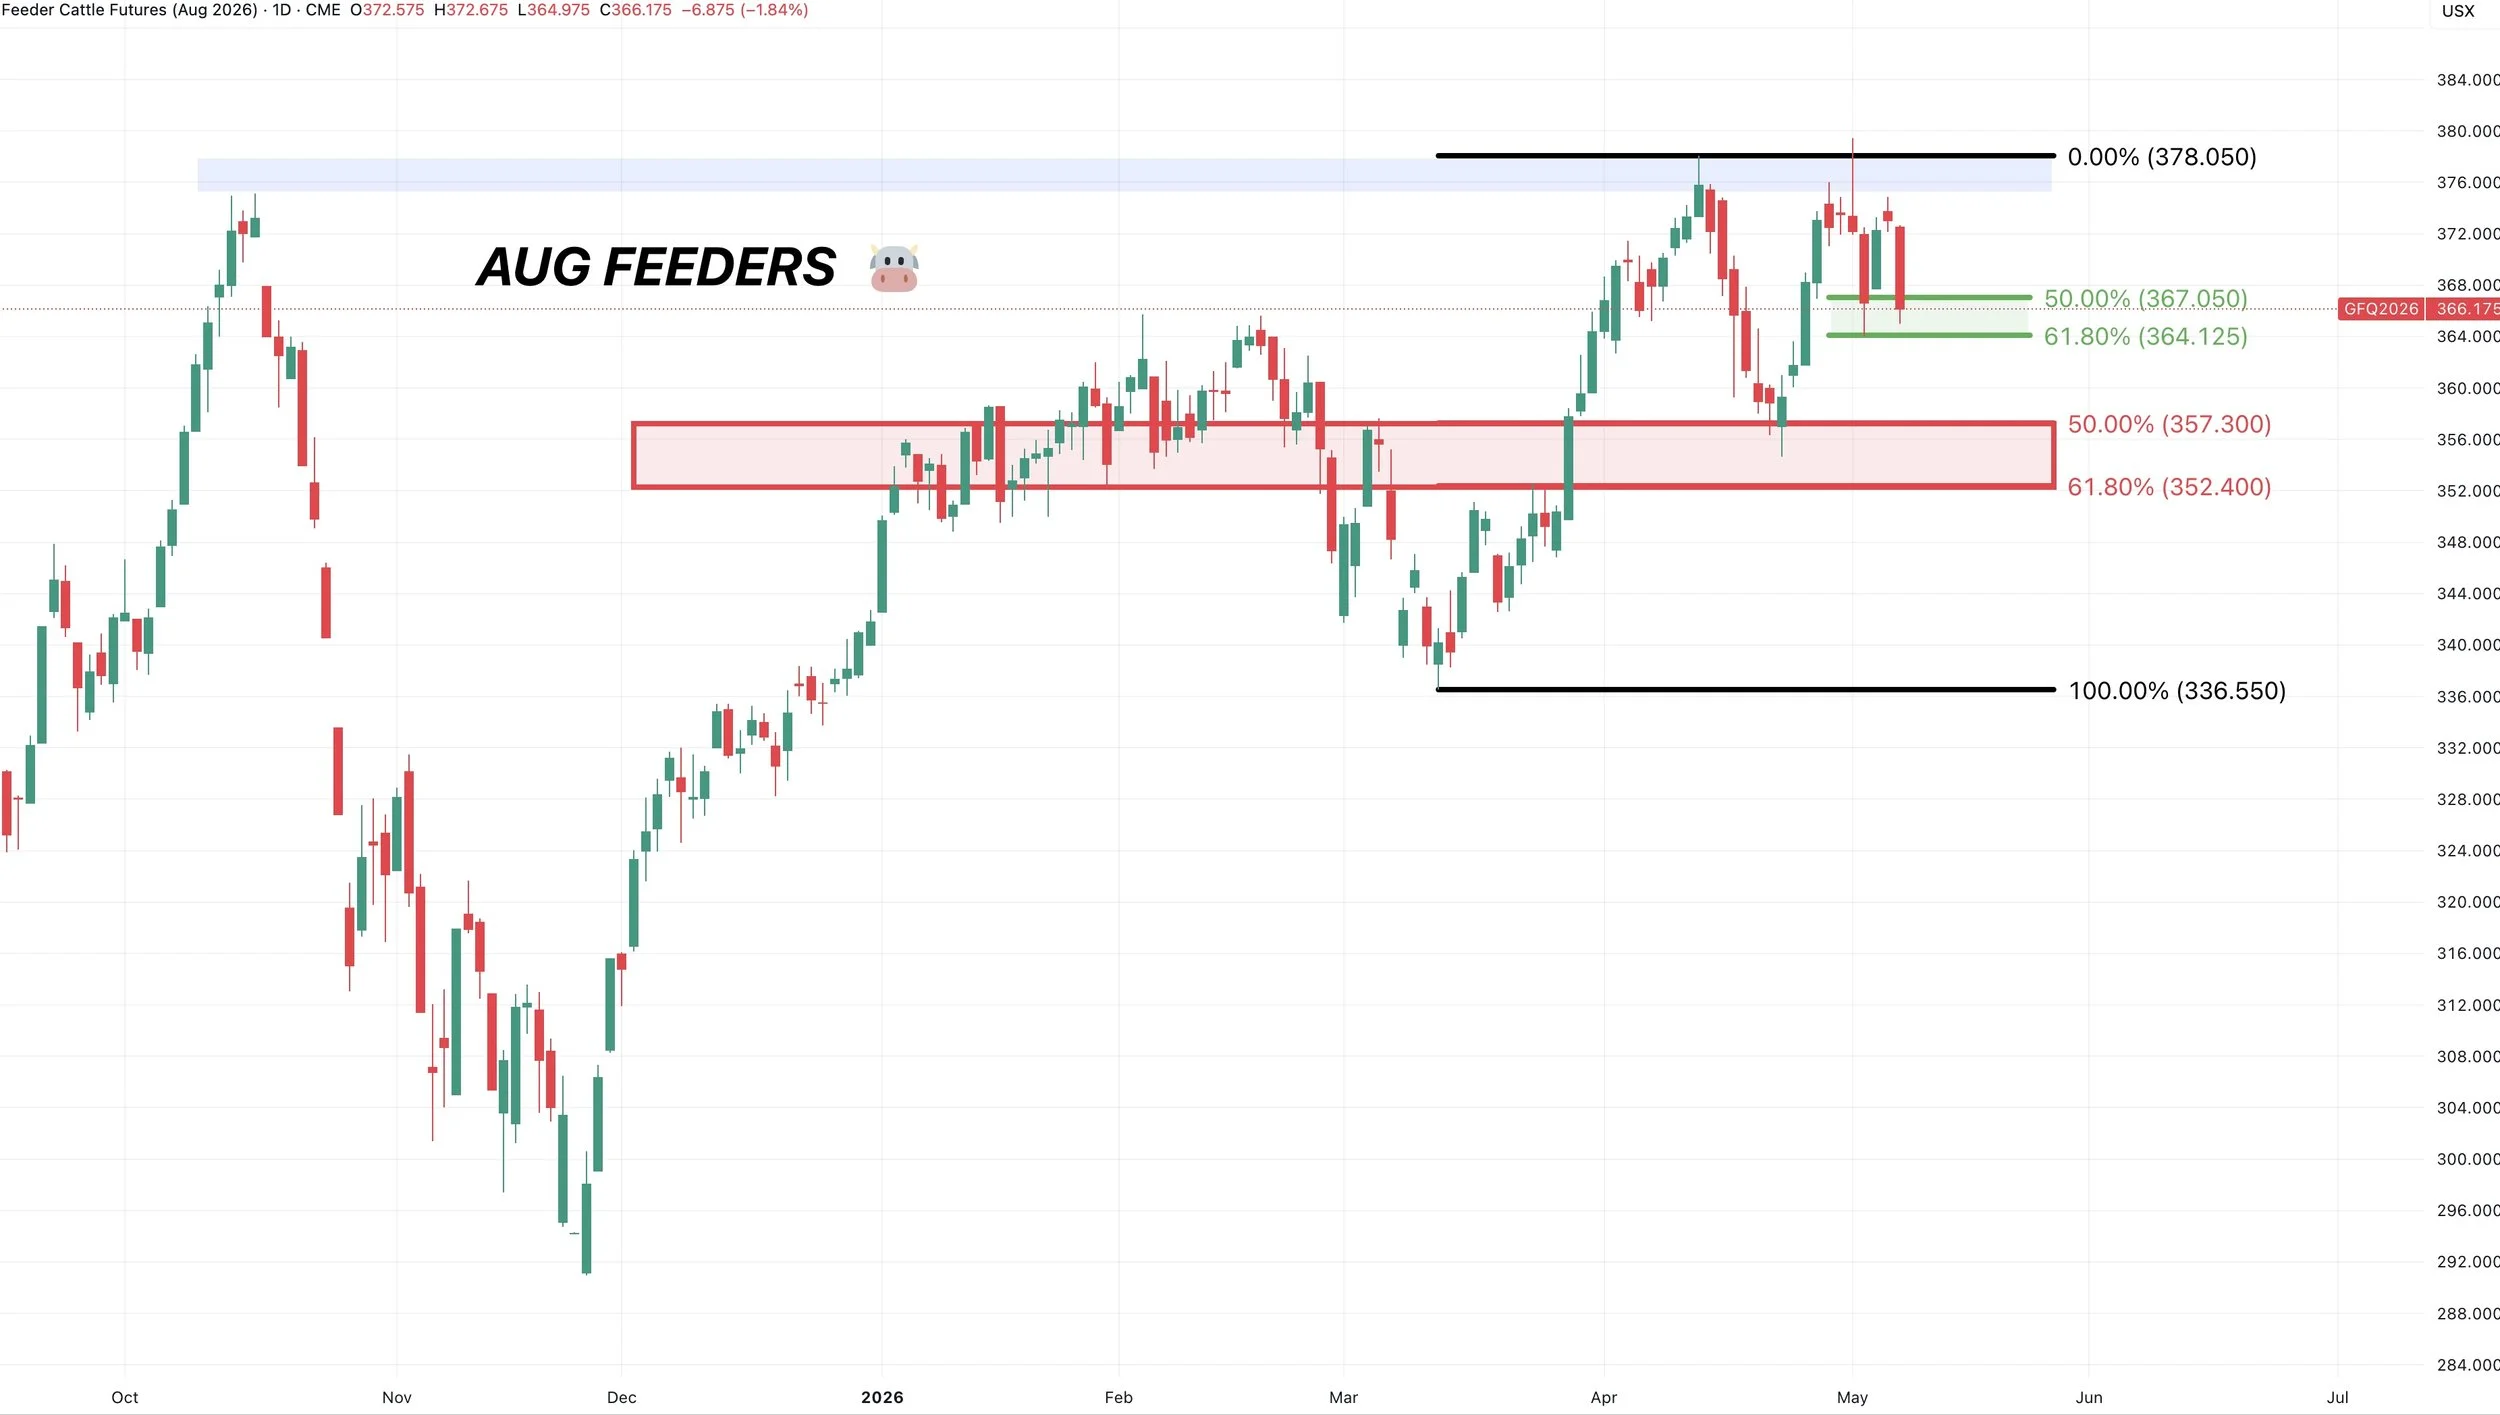
Aug Feeders 🐮
We held the golden zone.
Essentially trapped between here and the recent highs.
Whichever level we break likely decides what happens next.
Break above the highs, we get a leg higher.
Take out the golden zone and we go re-test the lows.
Want to Talk?
Our phones are open 24/7 for you guys if you ever need anything or want to discuss your operation.
Jeremey & Office: (806)484-1214
Sebastian: (605)280-1186
Email: sfrost@dailymarketminute.com
Hedge Account
Interested in a hedge account? Use the link below to set up an account or give us a call.
Recent Signals
April 28th, 2026: 🌾
KC wheat specific signal.
CLICK HERE TO VIEW
April 27th, 2026: 🌽
Corn catch up sell signal.
CLICK HERE TO VIEW
April 10th, 2026: 🌽
Corn buy signal.
CLICK HERE TO VIEW
March 19th, 2026: 🌱
New crop soybeans signal & hedge alert.
CLICK HERE TO VIEW
March 9th, 2026: 🌱
Soybeans signal & hedge alert. Sent via text.
March 6th, 2026: 🌽 🌾
Corn & wheat sell signal & hedge alert.
March 3rd, 2026: 🌽
Old crop & new crop corn sell signal & hedge alert.
Feb 26th, 2026: 🌱
Old crop & new crop beans sell signal & hedge alert.
Feb 19th, 2026: 🌾
KC wheat sell signal & hedge alert.
Feb 6th, 2026: 🌽 🌱
Old crop corn & soybean sell signal & hedge alert.
Feb 4th, 2026: 🌱
Soybean sell signal & hedge alert.
Nov 17th, 2025: 🌱
Soybean sell signal & hedge alert.