
USDA SNOOZE
MARKET UPDATE
You can scroll to read the usual update as well. As the written version is the exact same as the video.
Timestamps for video:
USDA: 0:00min
Corn: 1:50min
Beans: 8:15min
Wheat: 12:35min
Cattle: 14:35min
Want to talk about your situation?
(605)250-3863
Secure full access before your free trial ends so you don’t miss future updates or signals
Futures Prices Close
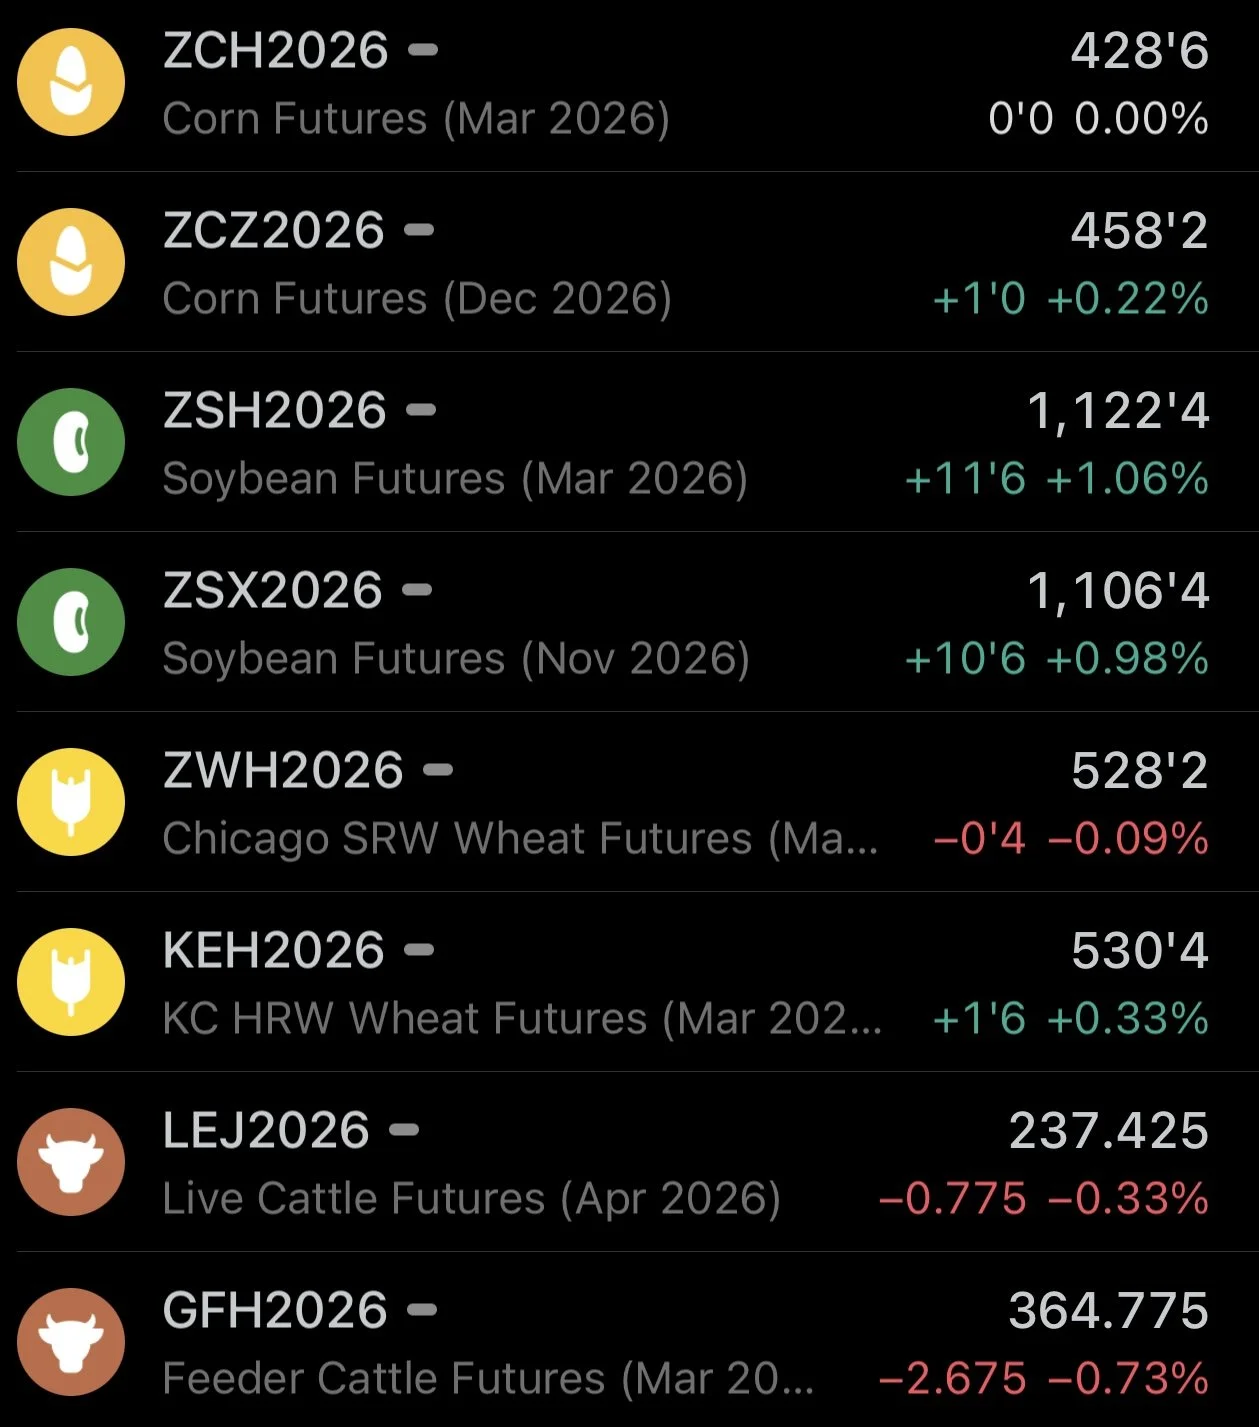
Overview
Grains mixed following the USDA report.
The report was pretty boring as expected.
Like we've mentioned, the February report is typically one of the more boring ones as it follows the major data dump from January. The only changes the USDA makes is demand, and usually it's just marginally.
Prices essentially had zero reaction to the report. At all.
Let's jump right into the report.
USDA Report
The report was pretty much neutral for both soybeans and wheat as there wasn’t any major changes. At all.
However it was on the slightly friendly side for the corn market.
Here is the numbers vs the estimates.


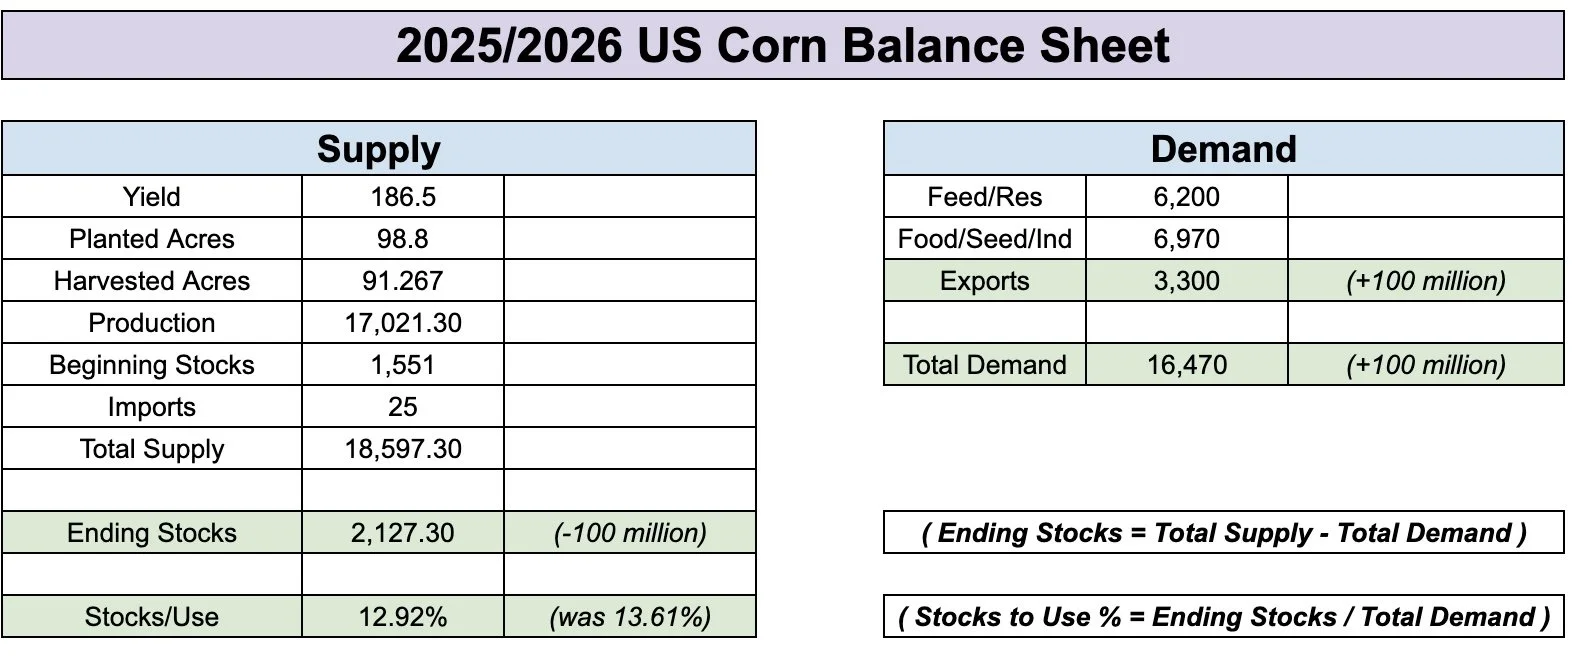
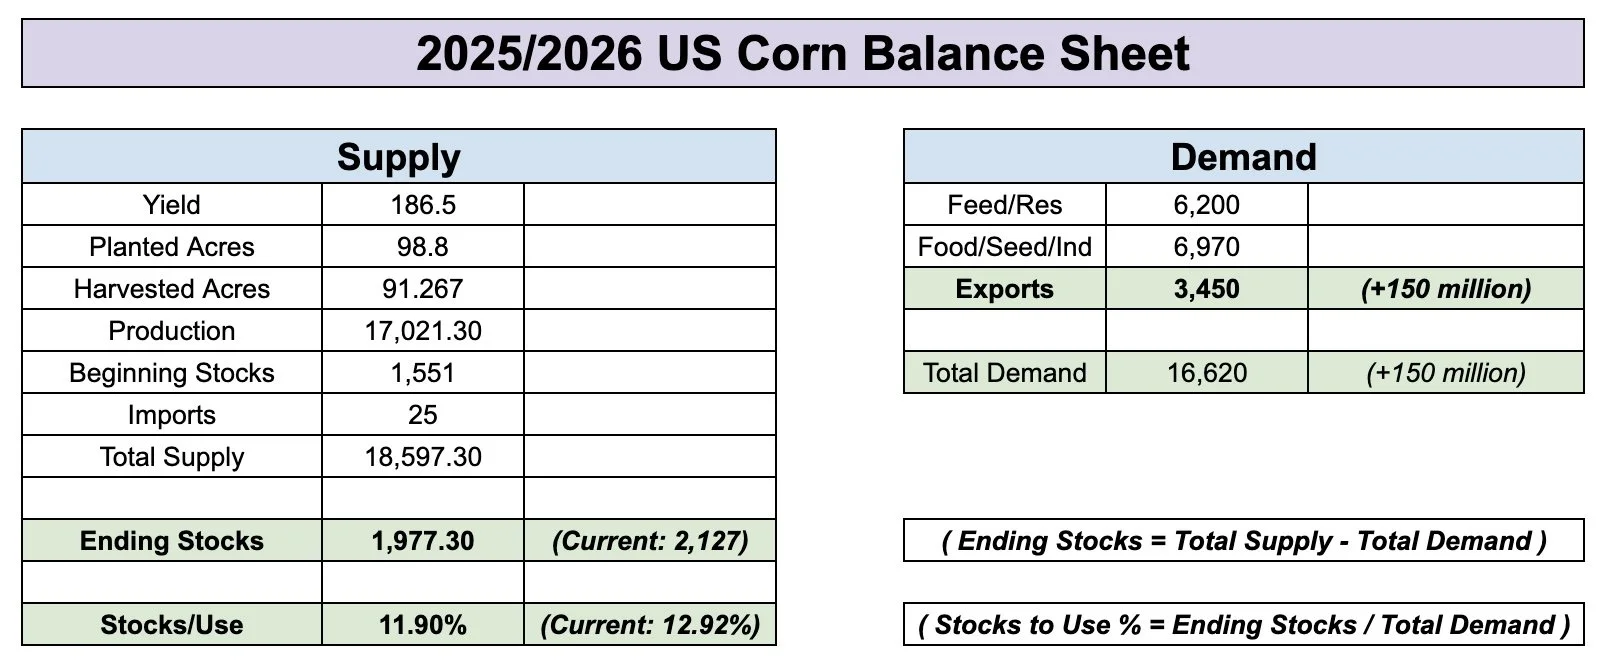
The only change in corn they made was that they bumped exports by +100 million, which was nice to see.
This dropped our carryout from 2.227 down to 2.127 billion bushels.
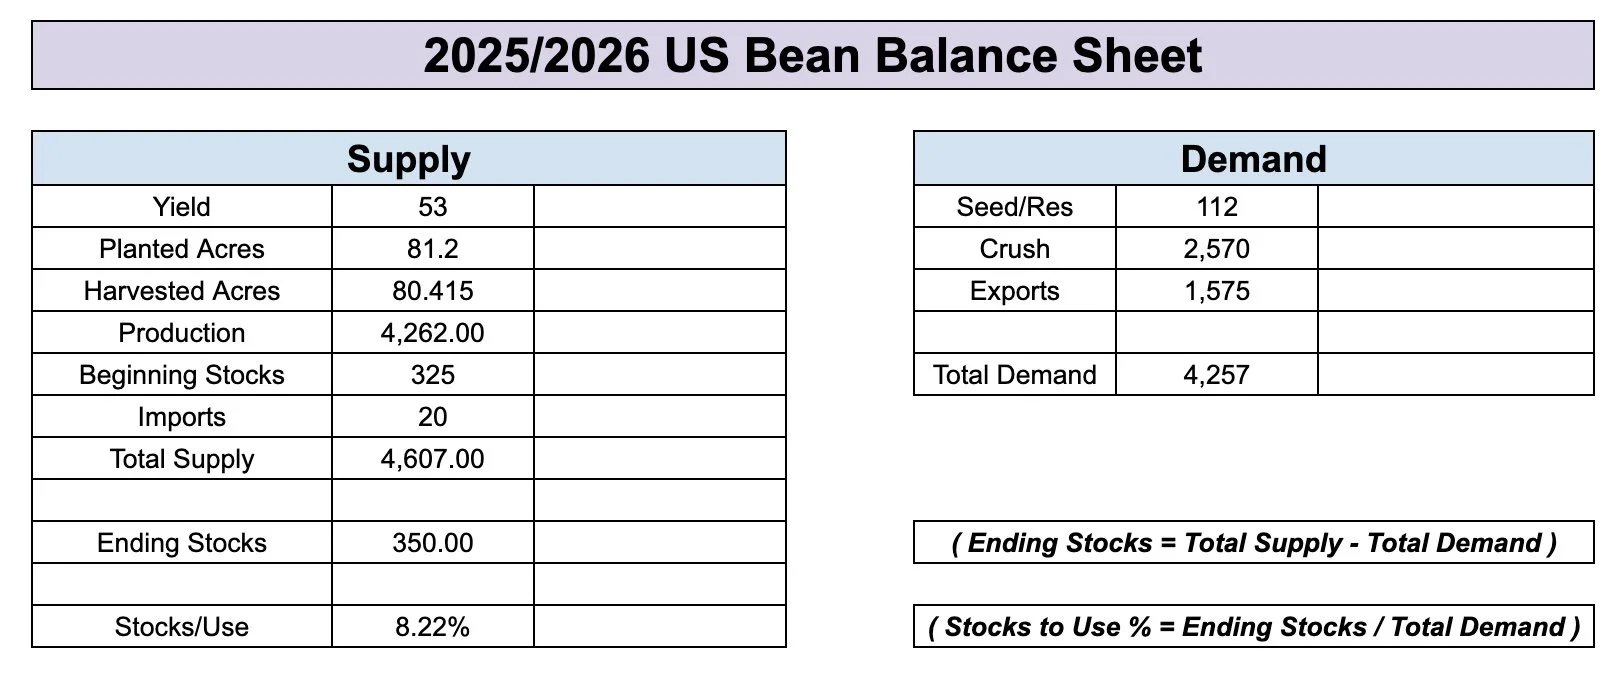
They made zero changes to soybeans.
Not a single thing was changed.
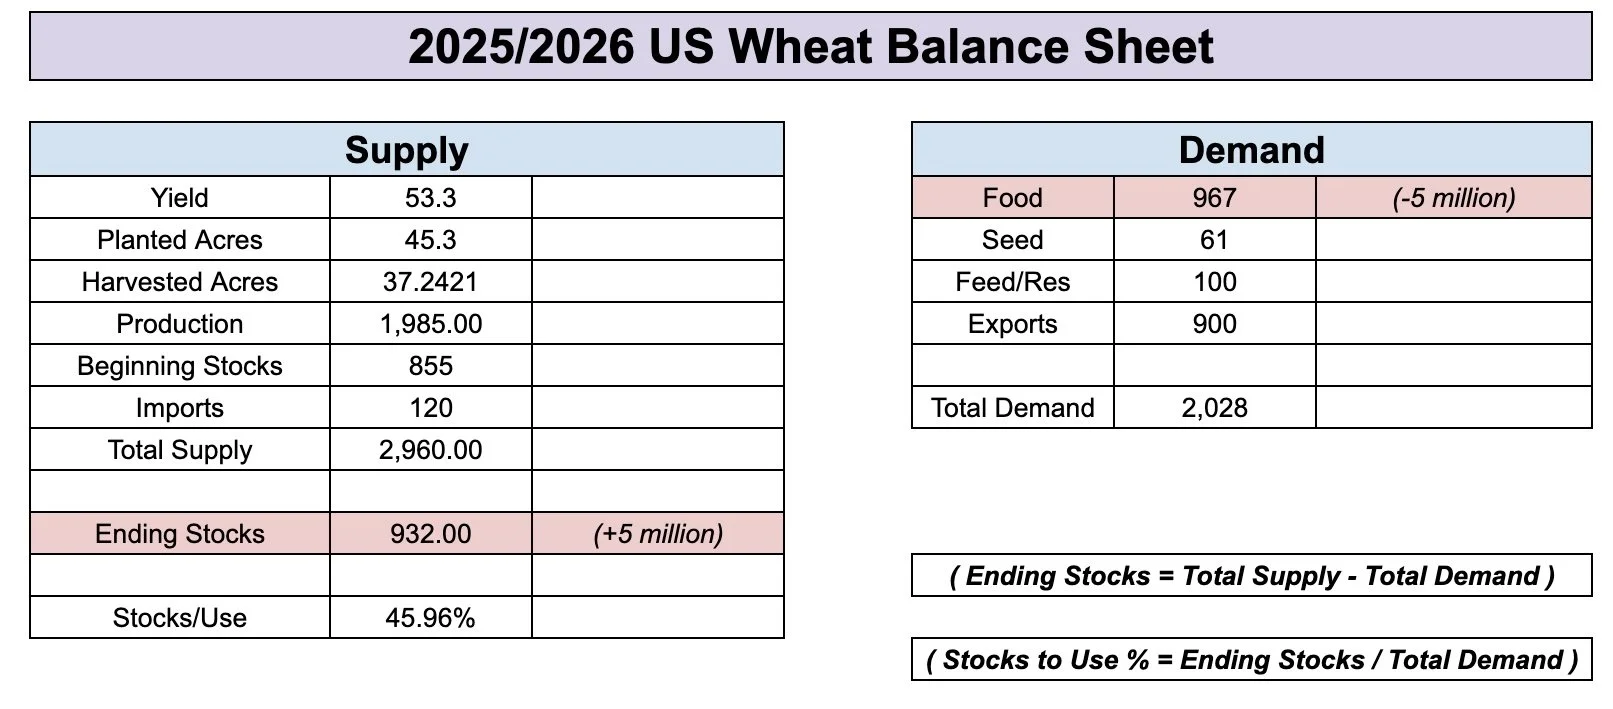
Very boring report for wheat as well.
The only change they made in wheat was a very slight drop to food demand by -5 million bushels.
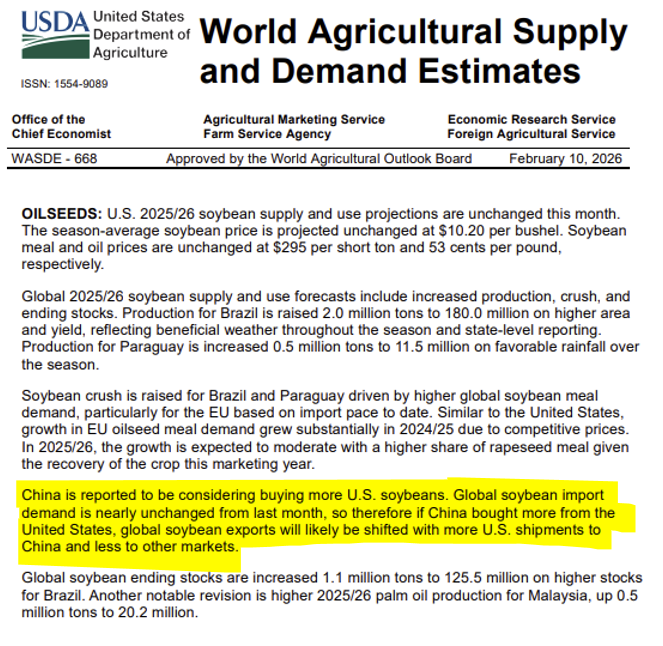
As for the South America numbers.
The USDA left Argentina's crops unchanged.
They also left Brazil's corn crop unchanged.
However, they did increase Brazil's soybean crop from 178 to 180 million metric tons.

Today's Main Takeaways
Corn
Did the report change anything?
This was actually the 2nd largest downside miss vs the estimates for the Feb report.
Yet.. corn actually closed lower, which was disappointing to see.
It seems like the market was already expecting some increases to demand.
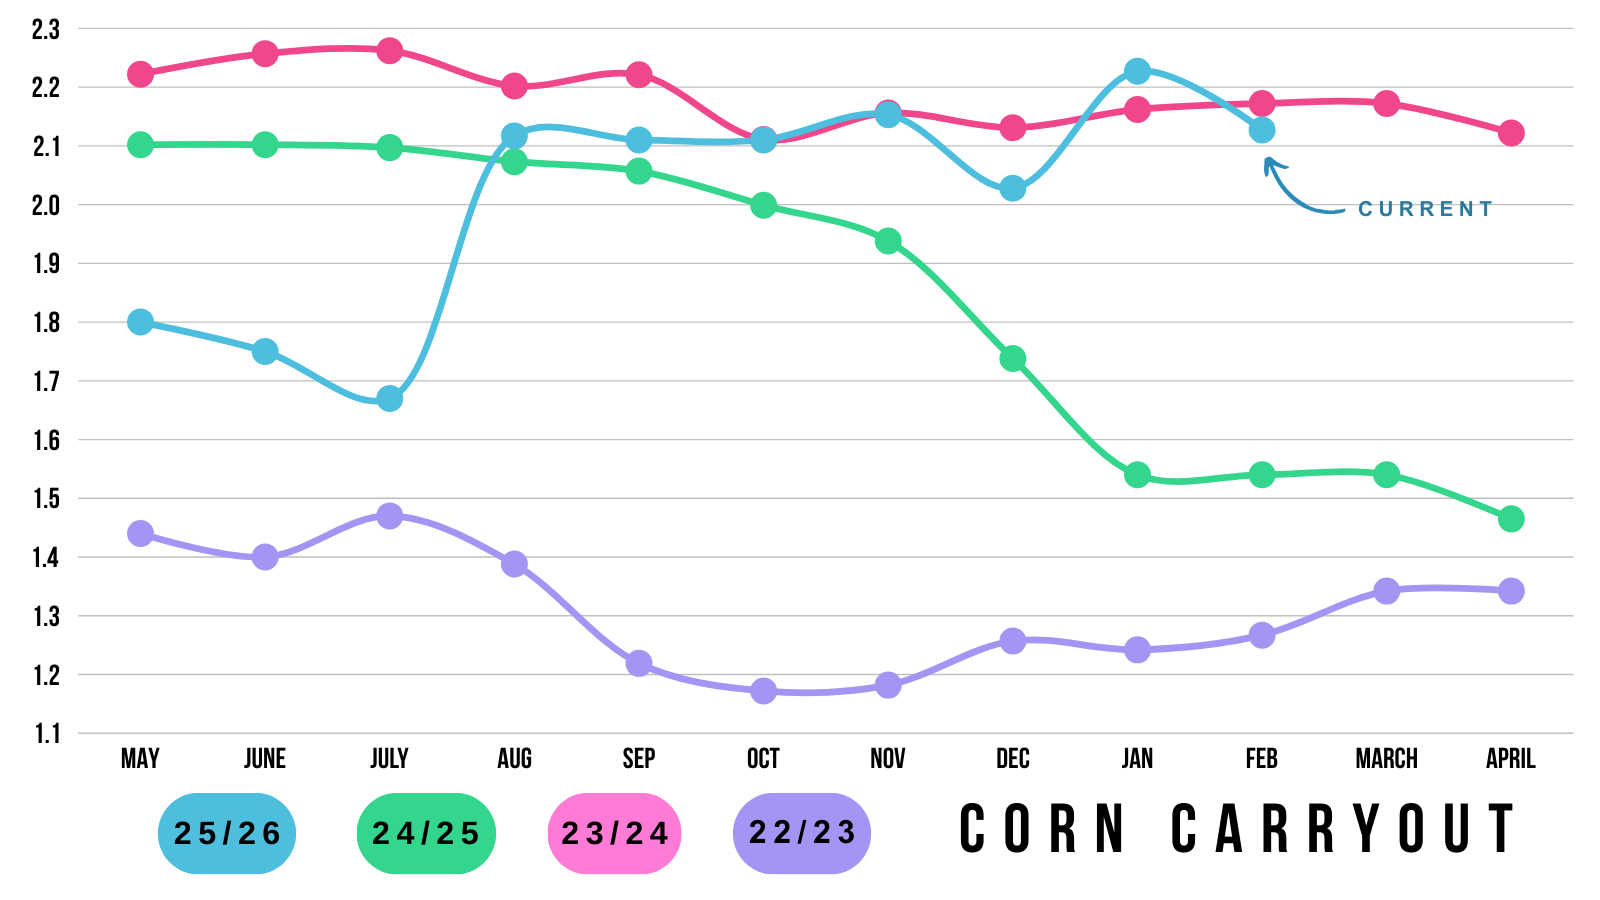
Even with the -100 million bushel drop on the balance sheet, we still clearly have a large carryout.
Still over +2 billion and one of the largest we've seen over the last few years.
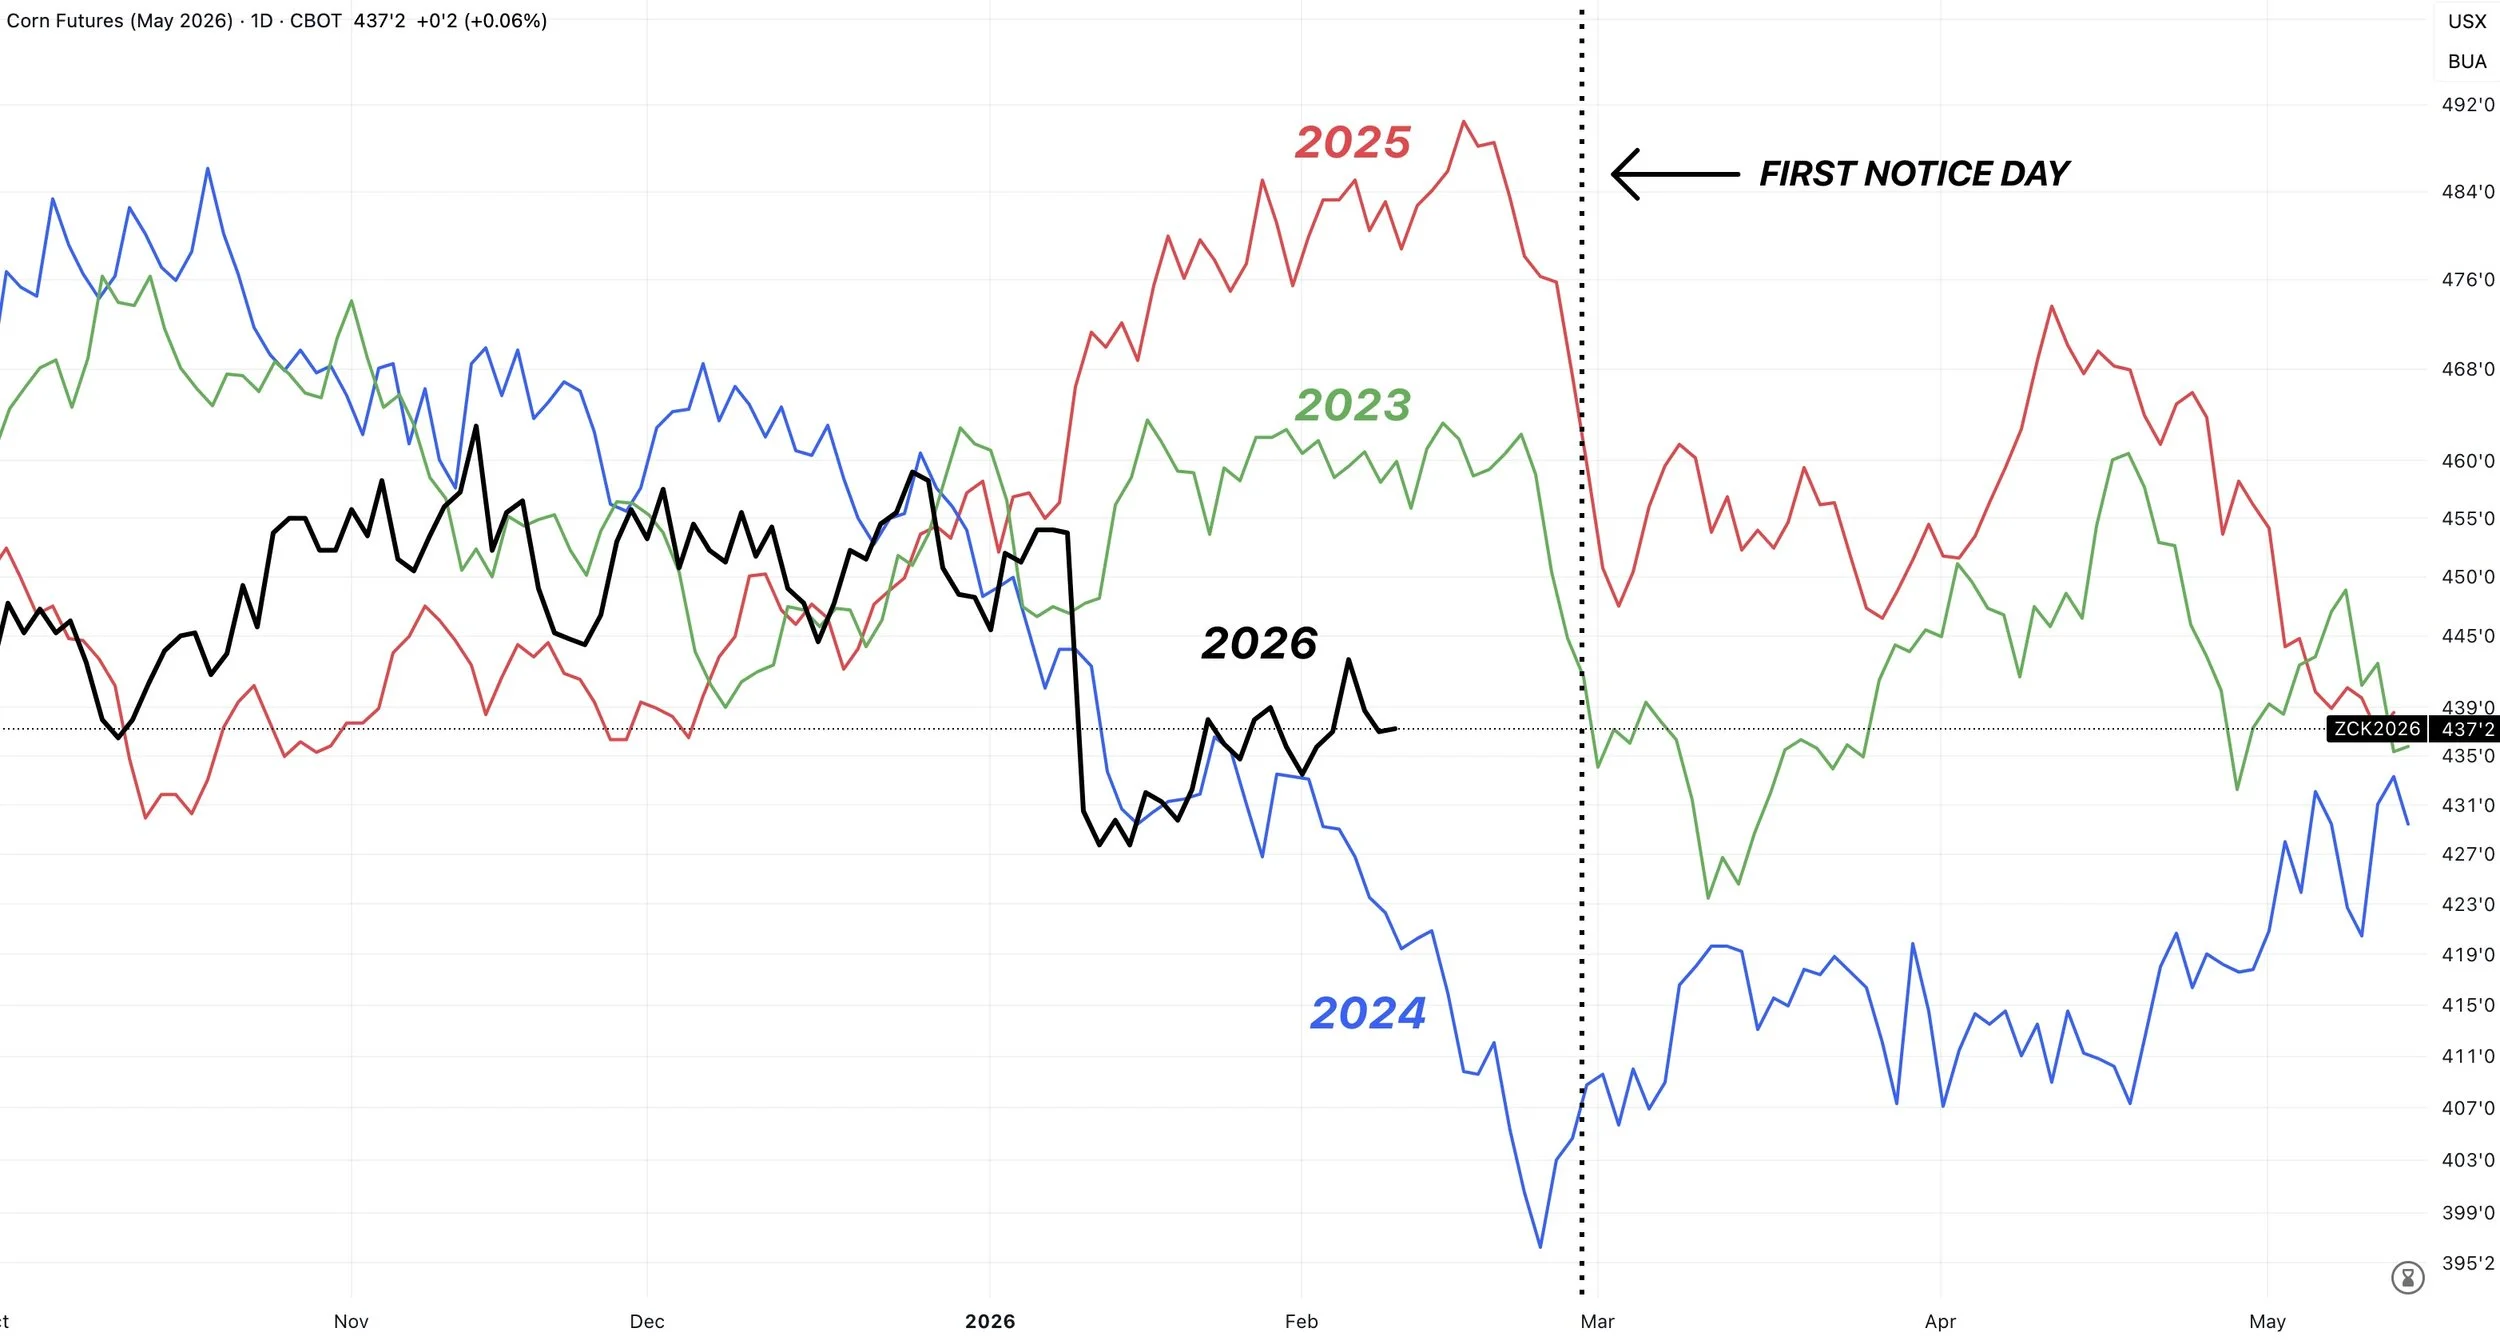
Currently we are right about on par with where we were in February of 2024.
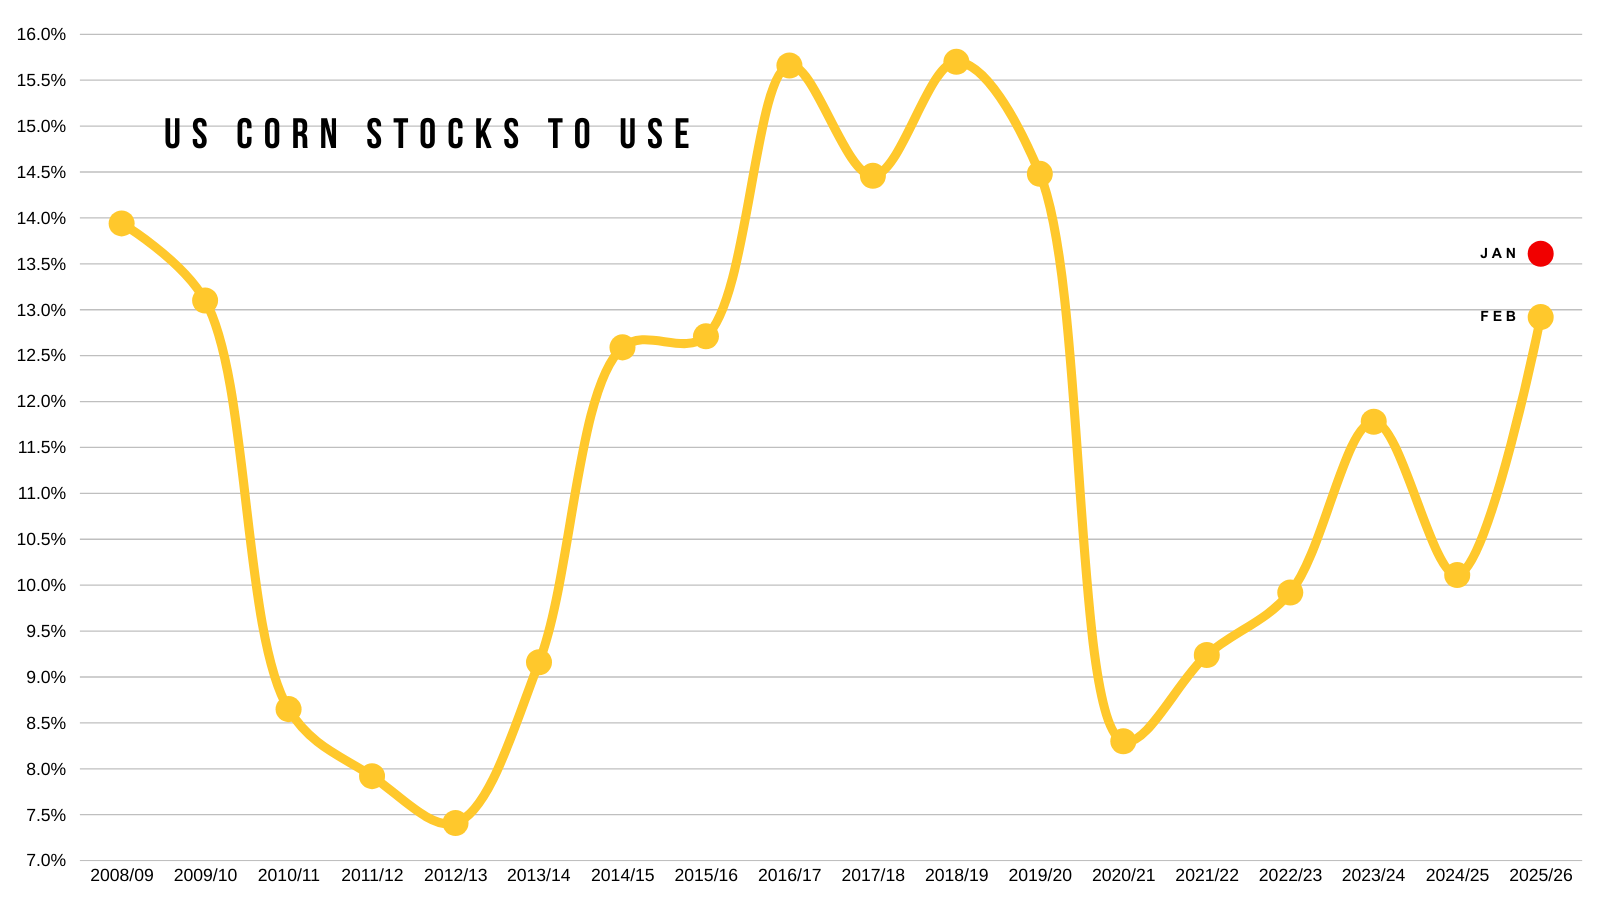
This report did result in a decent drop to our stocks to use ratio.
Dropping it from 13.61% down to 12.92%
Which is still far from being considered "bullish" at all.
It is on the bearish side for sure, but it is not quite as bearish as those super bearish years.
Here is the updated view if you throw the stocks to use ratio on top of corn's highest prices for the years.
We are still in "bear" market territory.
2009 was the last time we saw corn trade higher than $5.00 with a stocks to use ratio that was above 12.5% (sits at 12.92% today).
If we can work the stocks to use ratio below 12% than we'd be sitting in more middle ground scenario.
The situation wouldn’t be bullish, but at the same time, it wouldn’t be truly bearish either.
Often times we see two extremes in the corn market.
It's either really tight below 10%, or really loose above 12.5%. Rarely do we ever get a number inbetween.
2024 was pretty much the only year when it was truly in the middle of the two extremes.
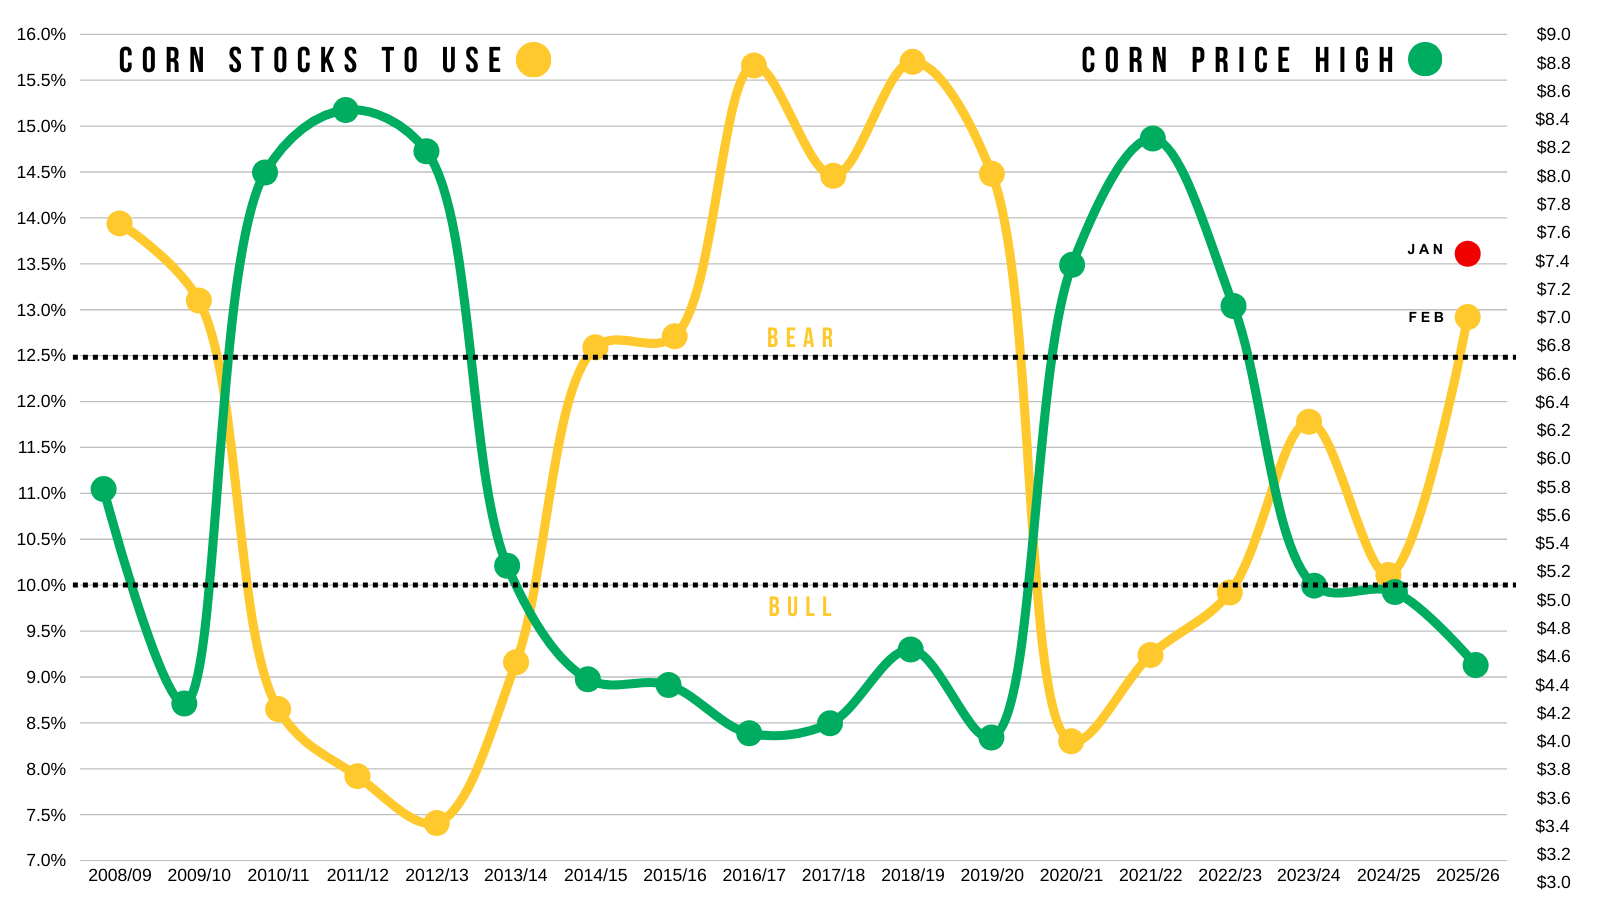
Now what would need happen to get this below 12% and away from true bear market numbers?
One scenario would to bump our exports another +150 million bushels without any other changes.
That drops it below 12% while at the same time just cracking that carryout below 2 billion.
This would not paint a bullish story, but it would prevent the corn market from being in a true bear market story.
Regardless, the corn story isn’t friendly today.
We still have a record amount of supply we are going to have to chew through. Which could limit our upside potential.
Yes. Demand is amazing.
This should prevent us from getting too cheap.
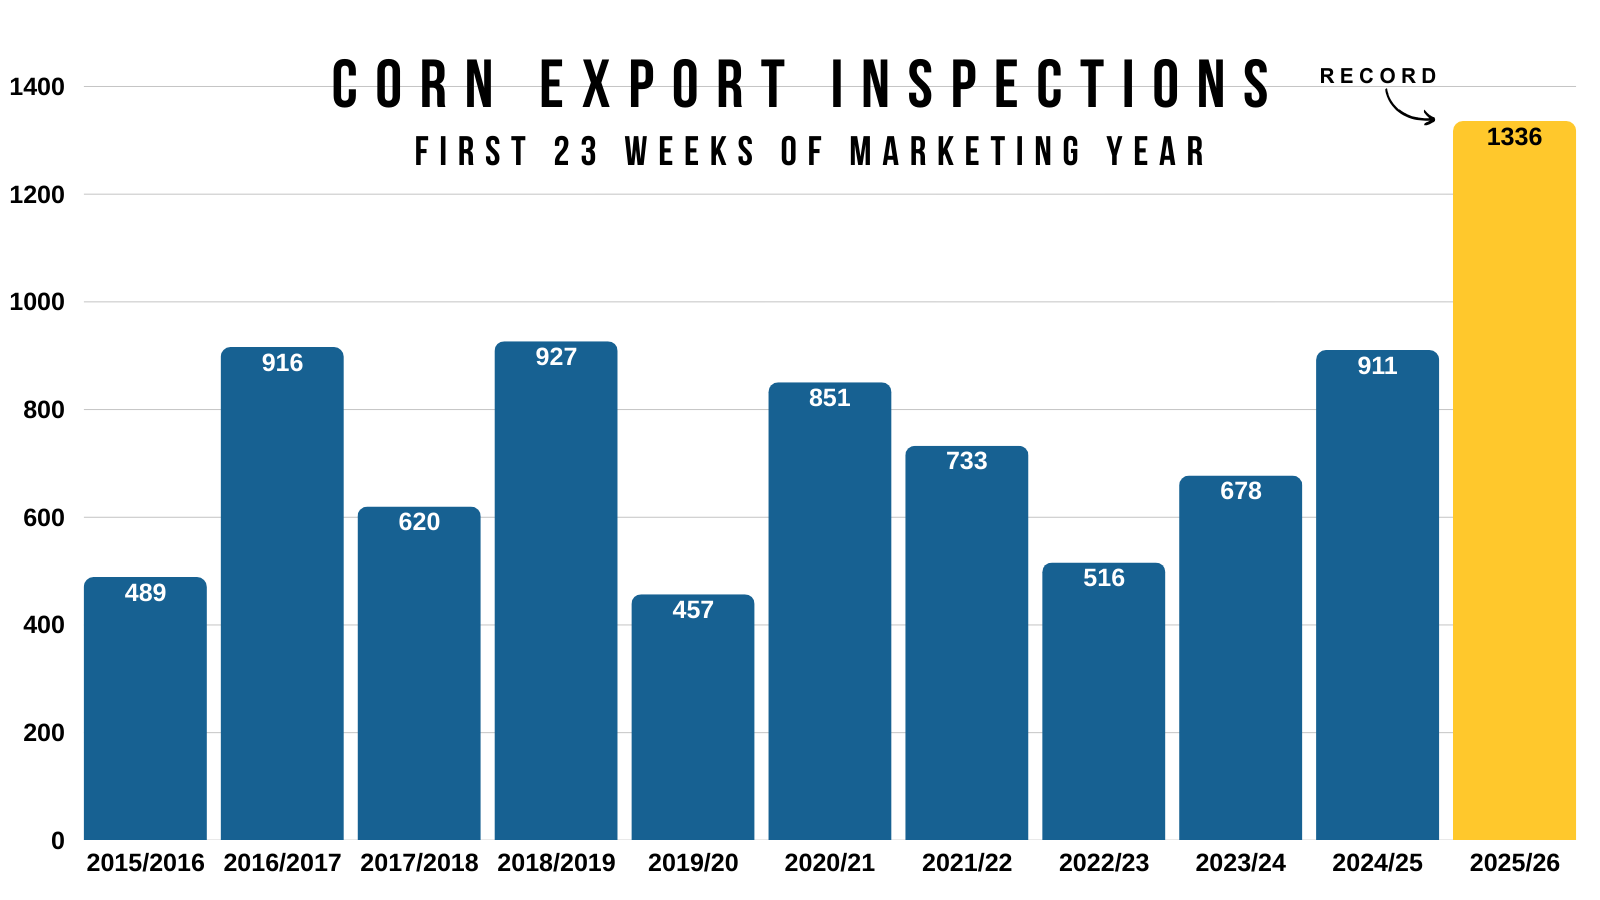
Just look at export inspections compared to every other year.
It's off the charts.
Even so, it's still hard to get super bulled up here.
For corn to get a REAL opportunity, it will probably have to come in the form of a weather scare this spring or summer.
We need the market to question that record supply.
More often than not.. we do get a chance for an opportunity.
But clearly last two years have proven that nothing is ever guaranteed.
I am still pretty cautious here heading into first notice day.
This is seasonally one of the weaker times periods for the corn market (aside from the sell off going into harvest of course).
There is more than likely plenty of basis contracts out there. As not many had those Jan USDA report numbers on their bingo card.
Which could add some pressure the next few weeks as contracts will be forced to be priced or rolled.
Like I've been showing in all of my updates the past few weeks, the corn market tends to struggle the next few weeks.
We've traded lower from Feb 15th to March 1st in the last 9 of 11 years due to first notice day.
Which was another reason for the sell signal and hedge alert on Friday morning. That alert was especially geared towards those who will have to move corn soon.
Link to Last Friday's Alert
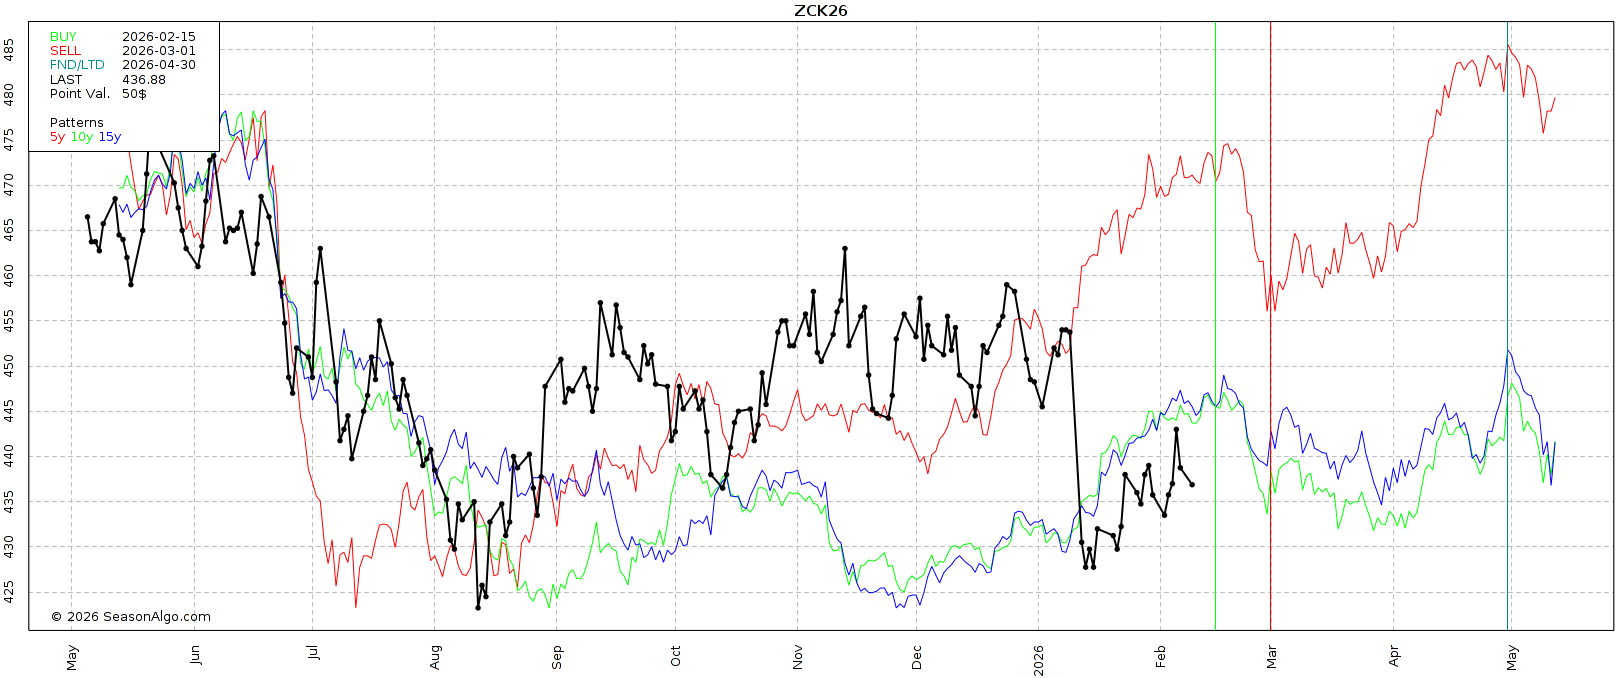
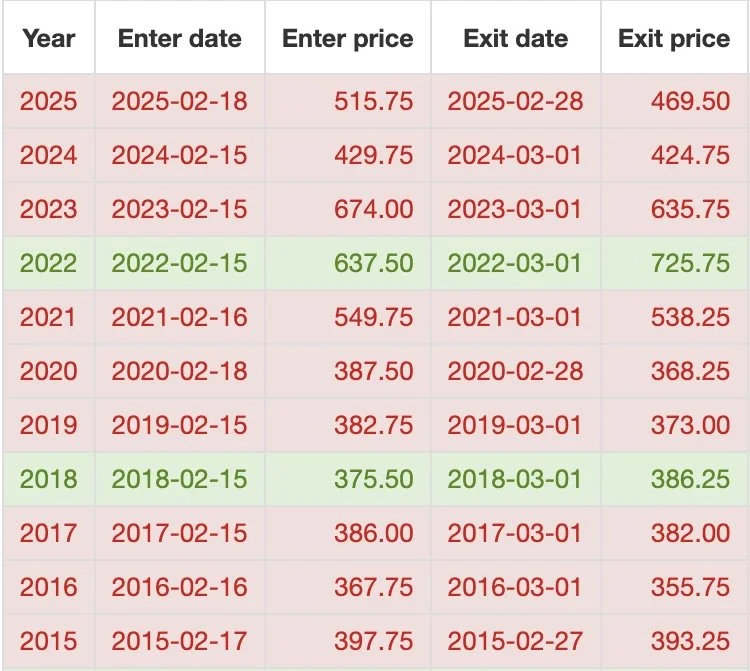

Here is what the corn market has done the last few years heading into first notice day.
We tend to be weak before finding some life afterwards.
Technicals:
March Corn
The other reason for the alert on Friday was the charts. As we were approaching some key resistance.
Last year we were stuck in a tight range for months.
We found support off that $4.35-36 level every single time before breaking down on the Jan USDA report.
A support level of that magnitude could offer some pretty stiff resistance.
Friday we tagged it before rejecting lower.
Similar how this market failed after testing the support from last spring.
Sometimes it really is as simple as old support turning into new resistance.
Rejecting there made sense, as I don’t see a reason for us to break out of the range today.
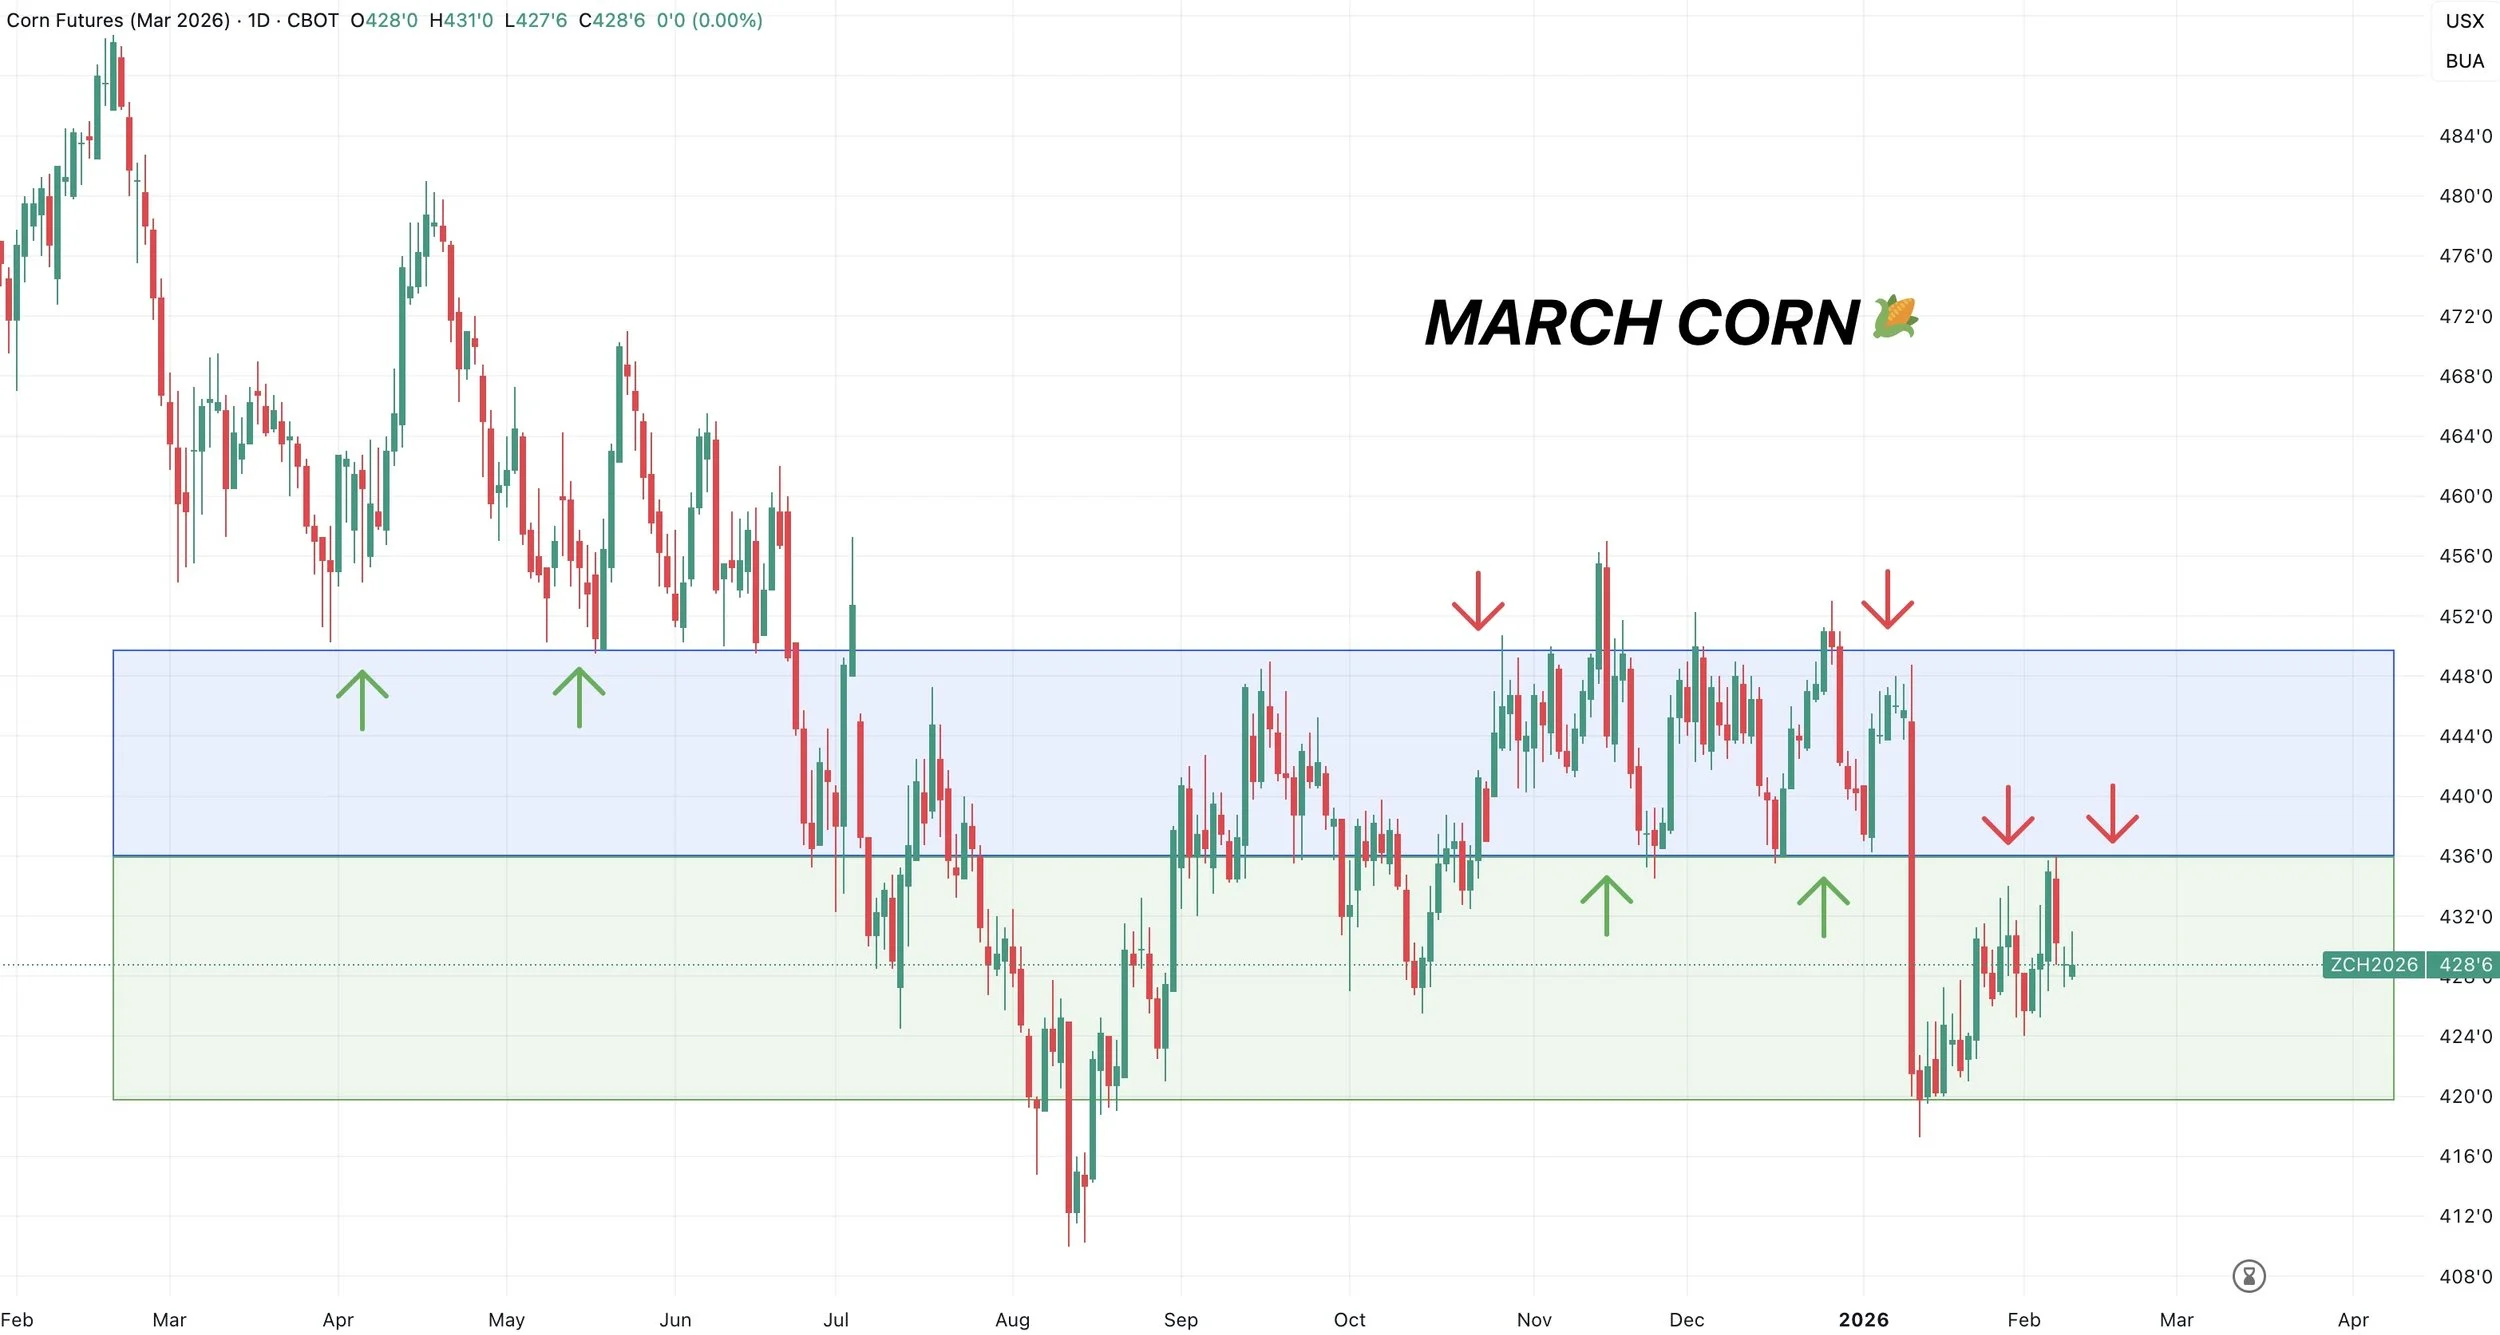
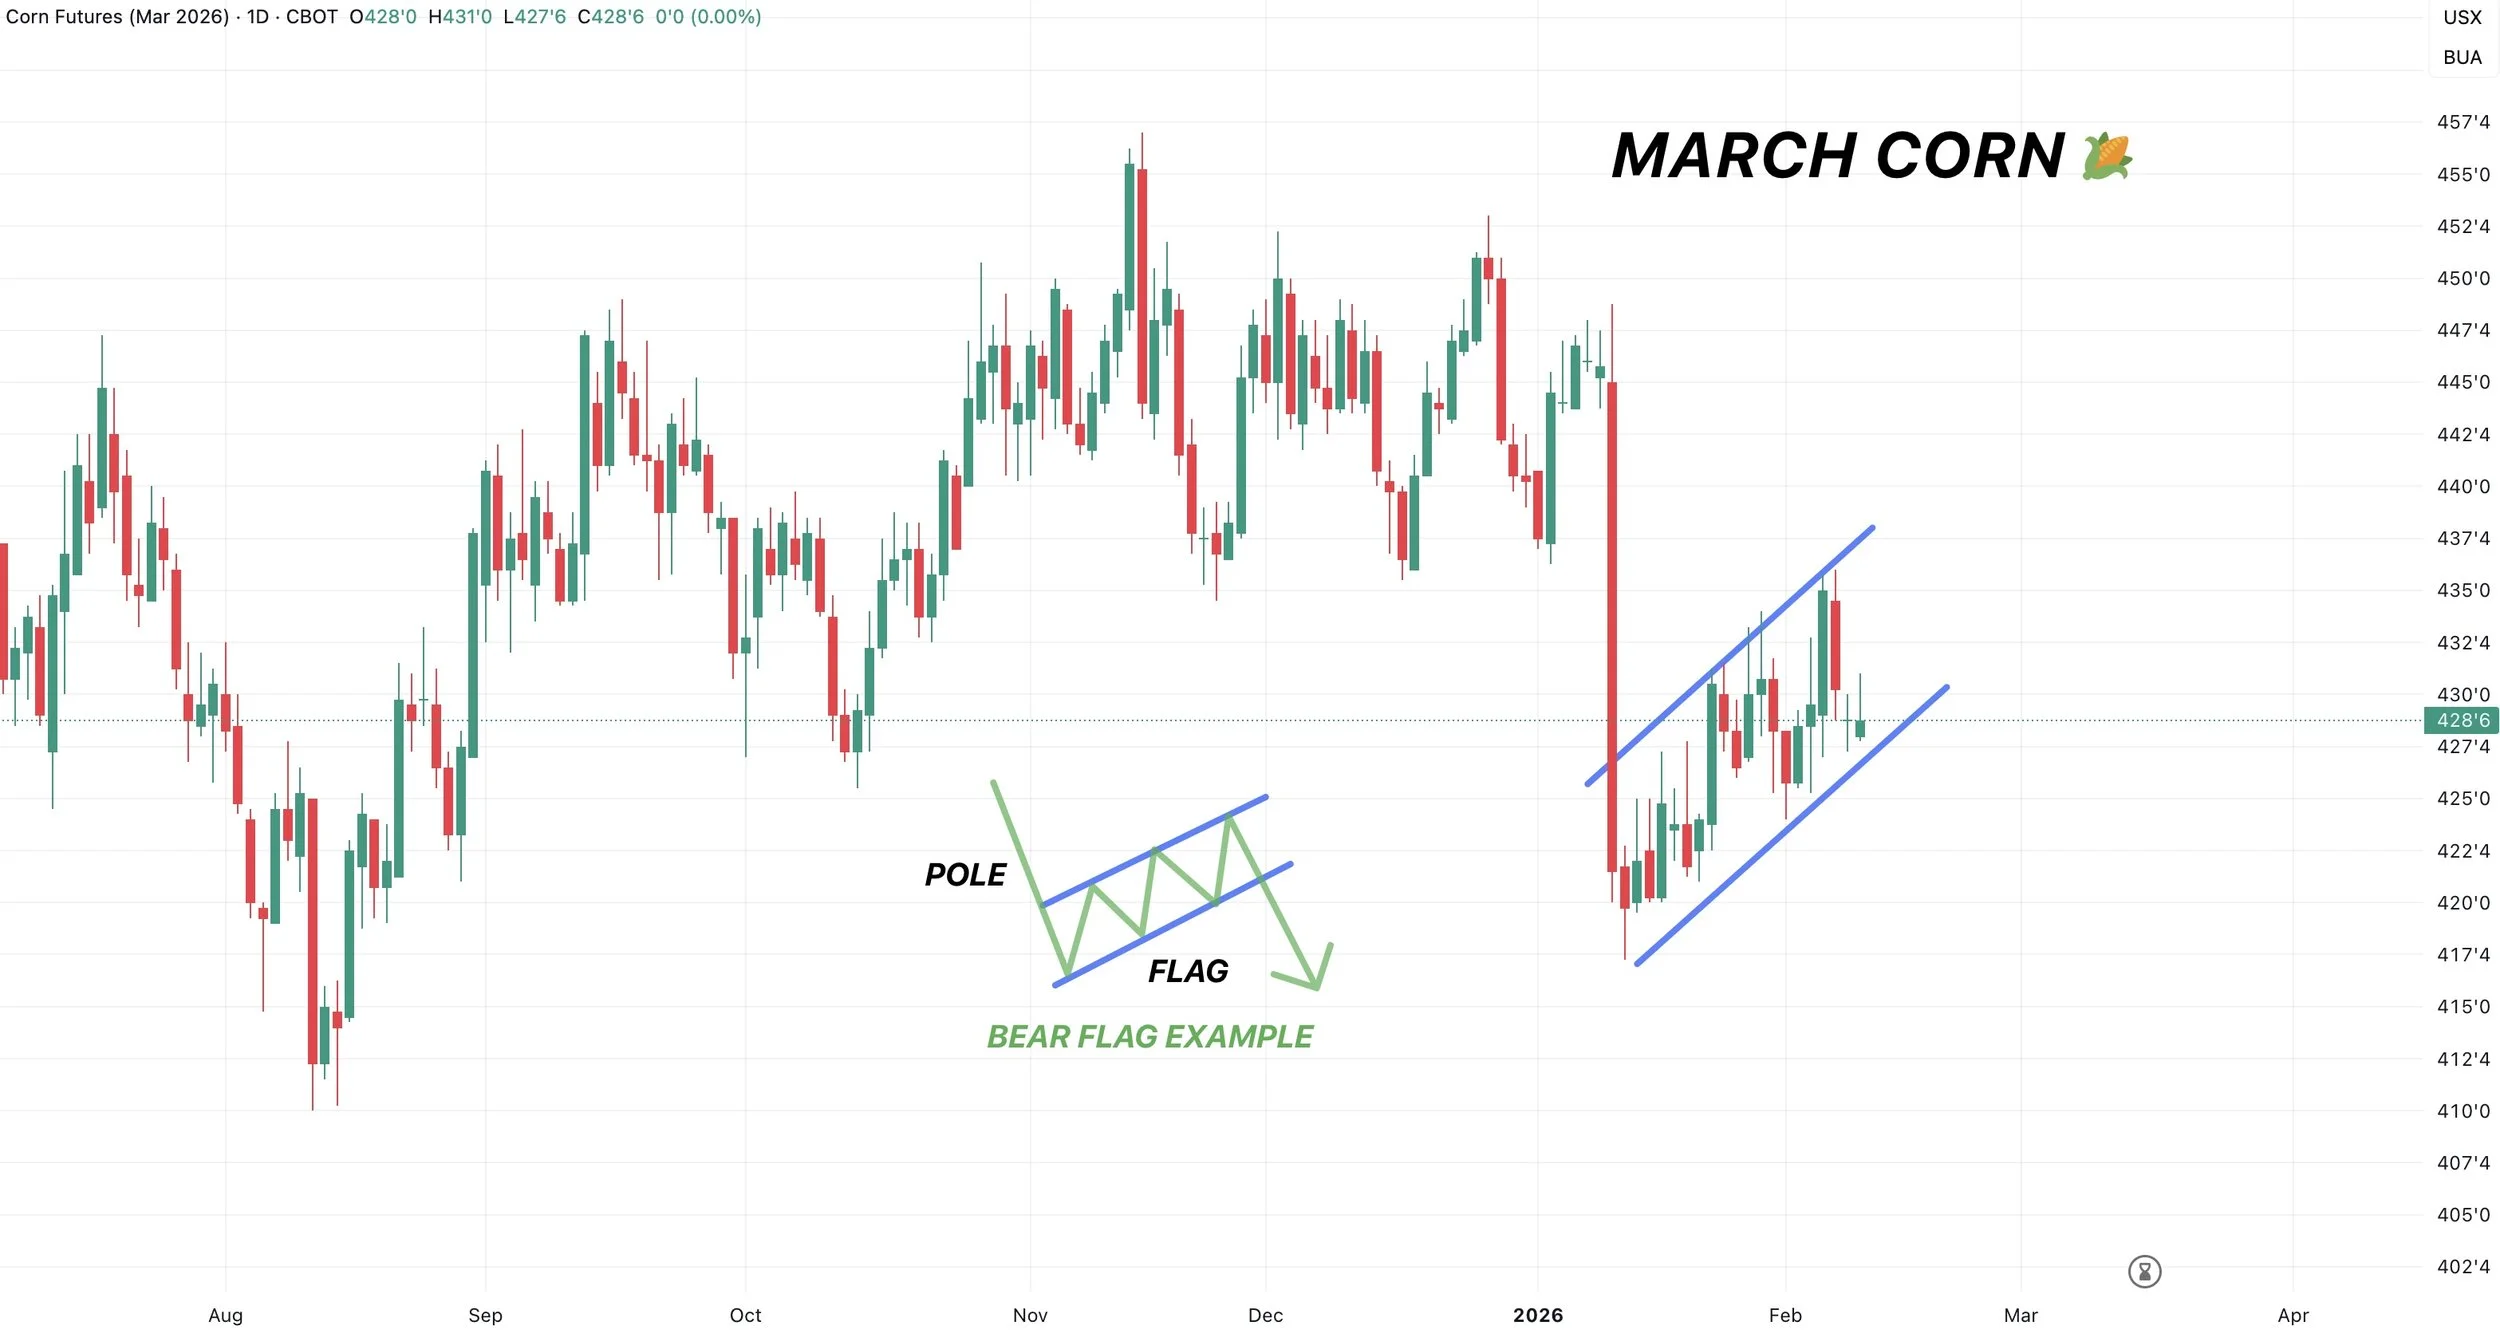
We also have a potential bear flag which is something to be aware of.
Which is a pretty textbook bearish pattern if we start to break down here.
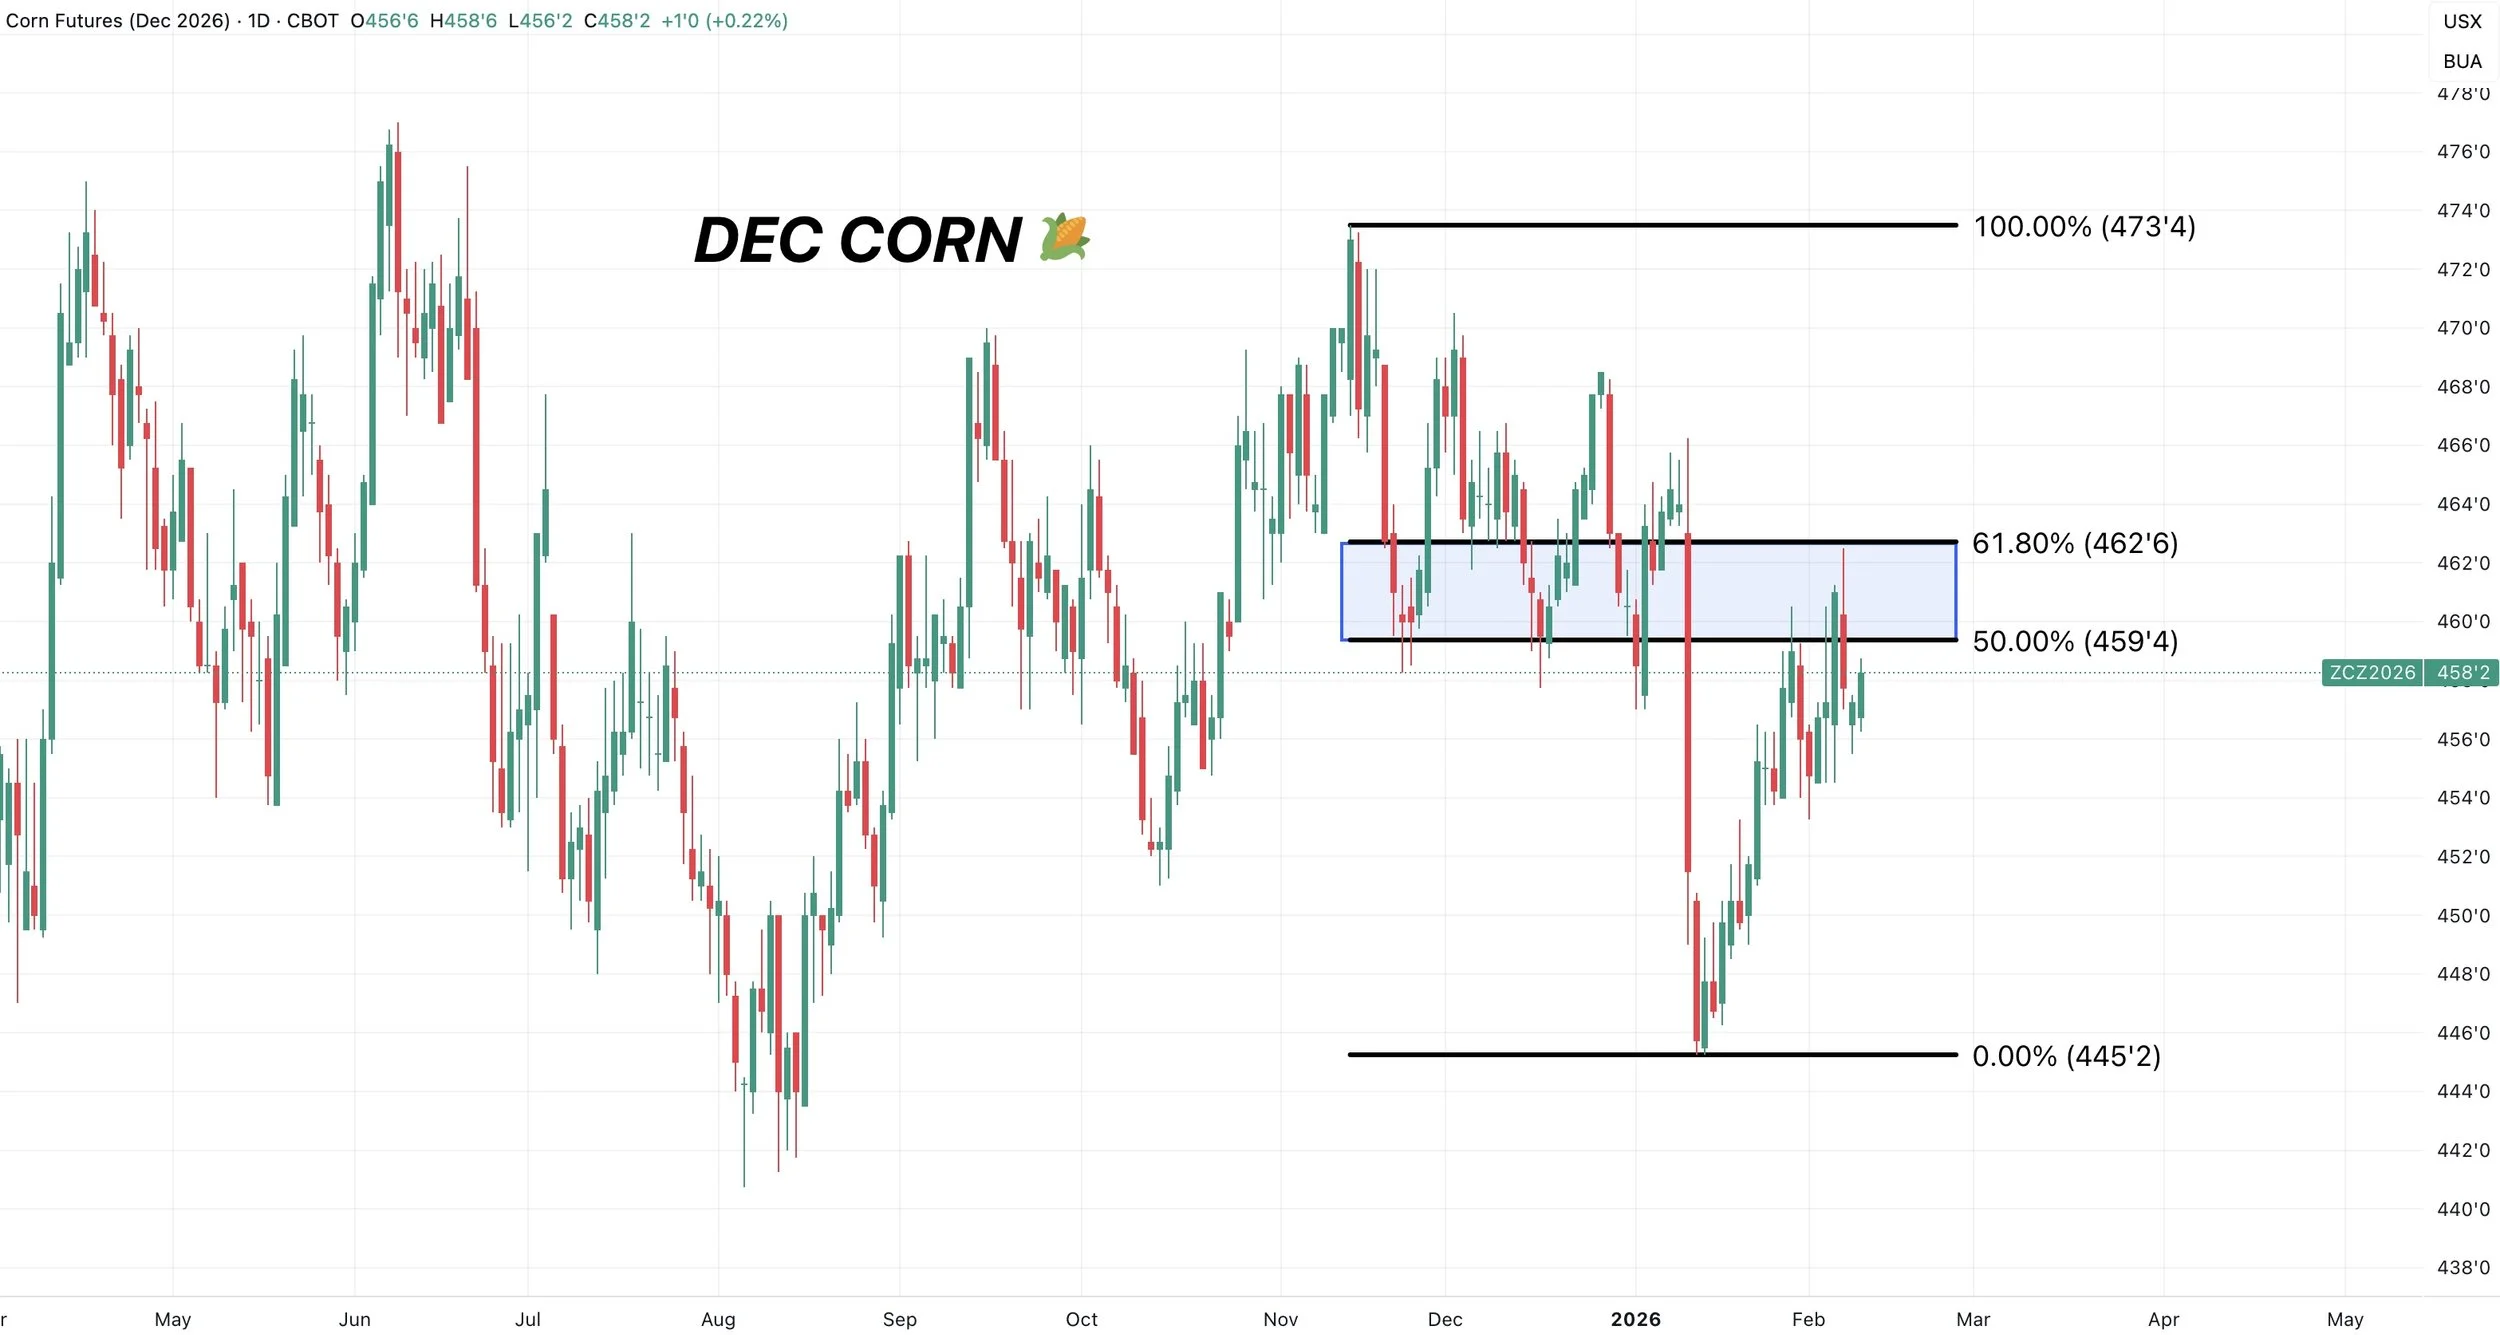
Dec Corn
We clawed back exactly 61.8% of the entire sell off.
The most common level for prices to pause.
This same level is old support as well.
So struggling here makes perfect sense.
Which was the reason for the signal Friday morning.
We like waiting until insurance pricing for some of you, but for others that do not have storage etc it made sense to get started on a little marketing or downside protection there.
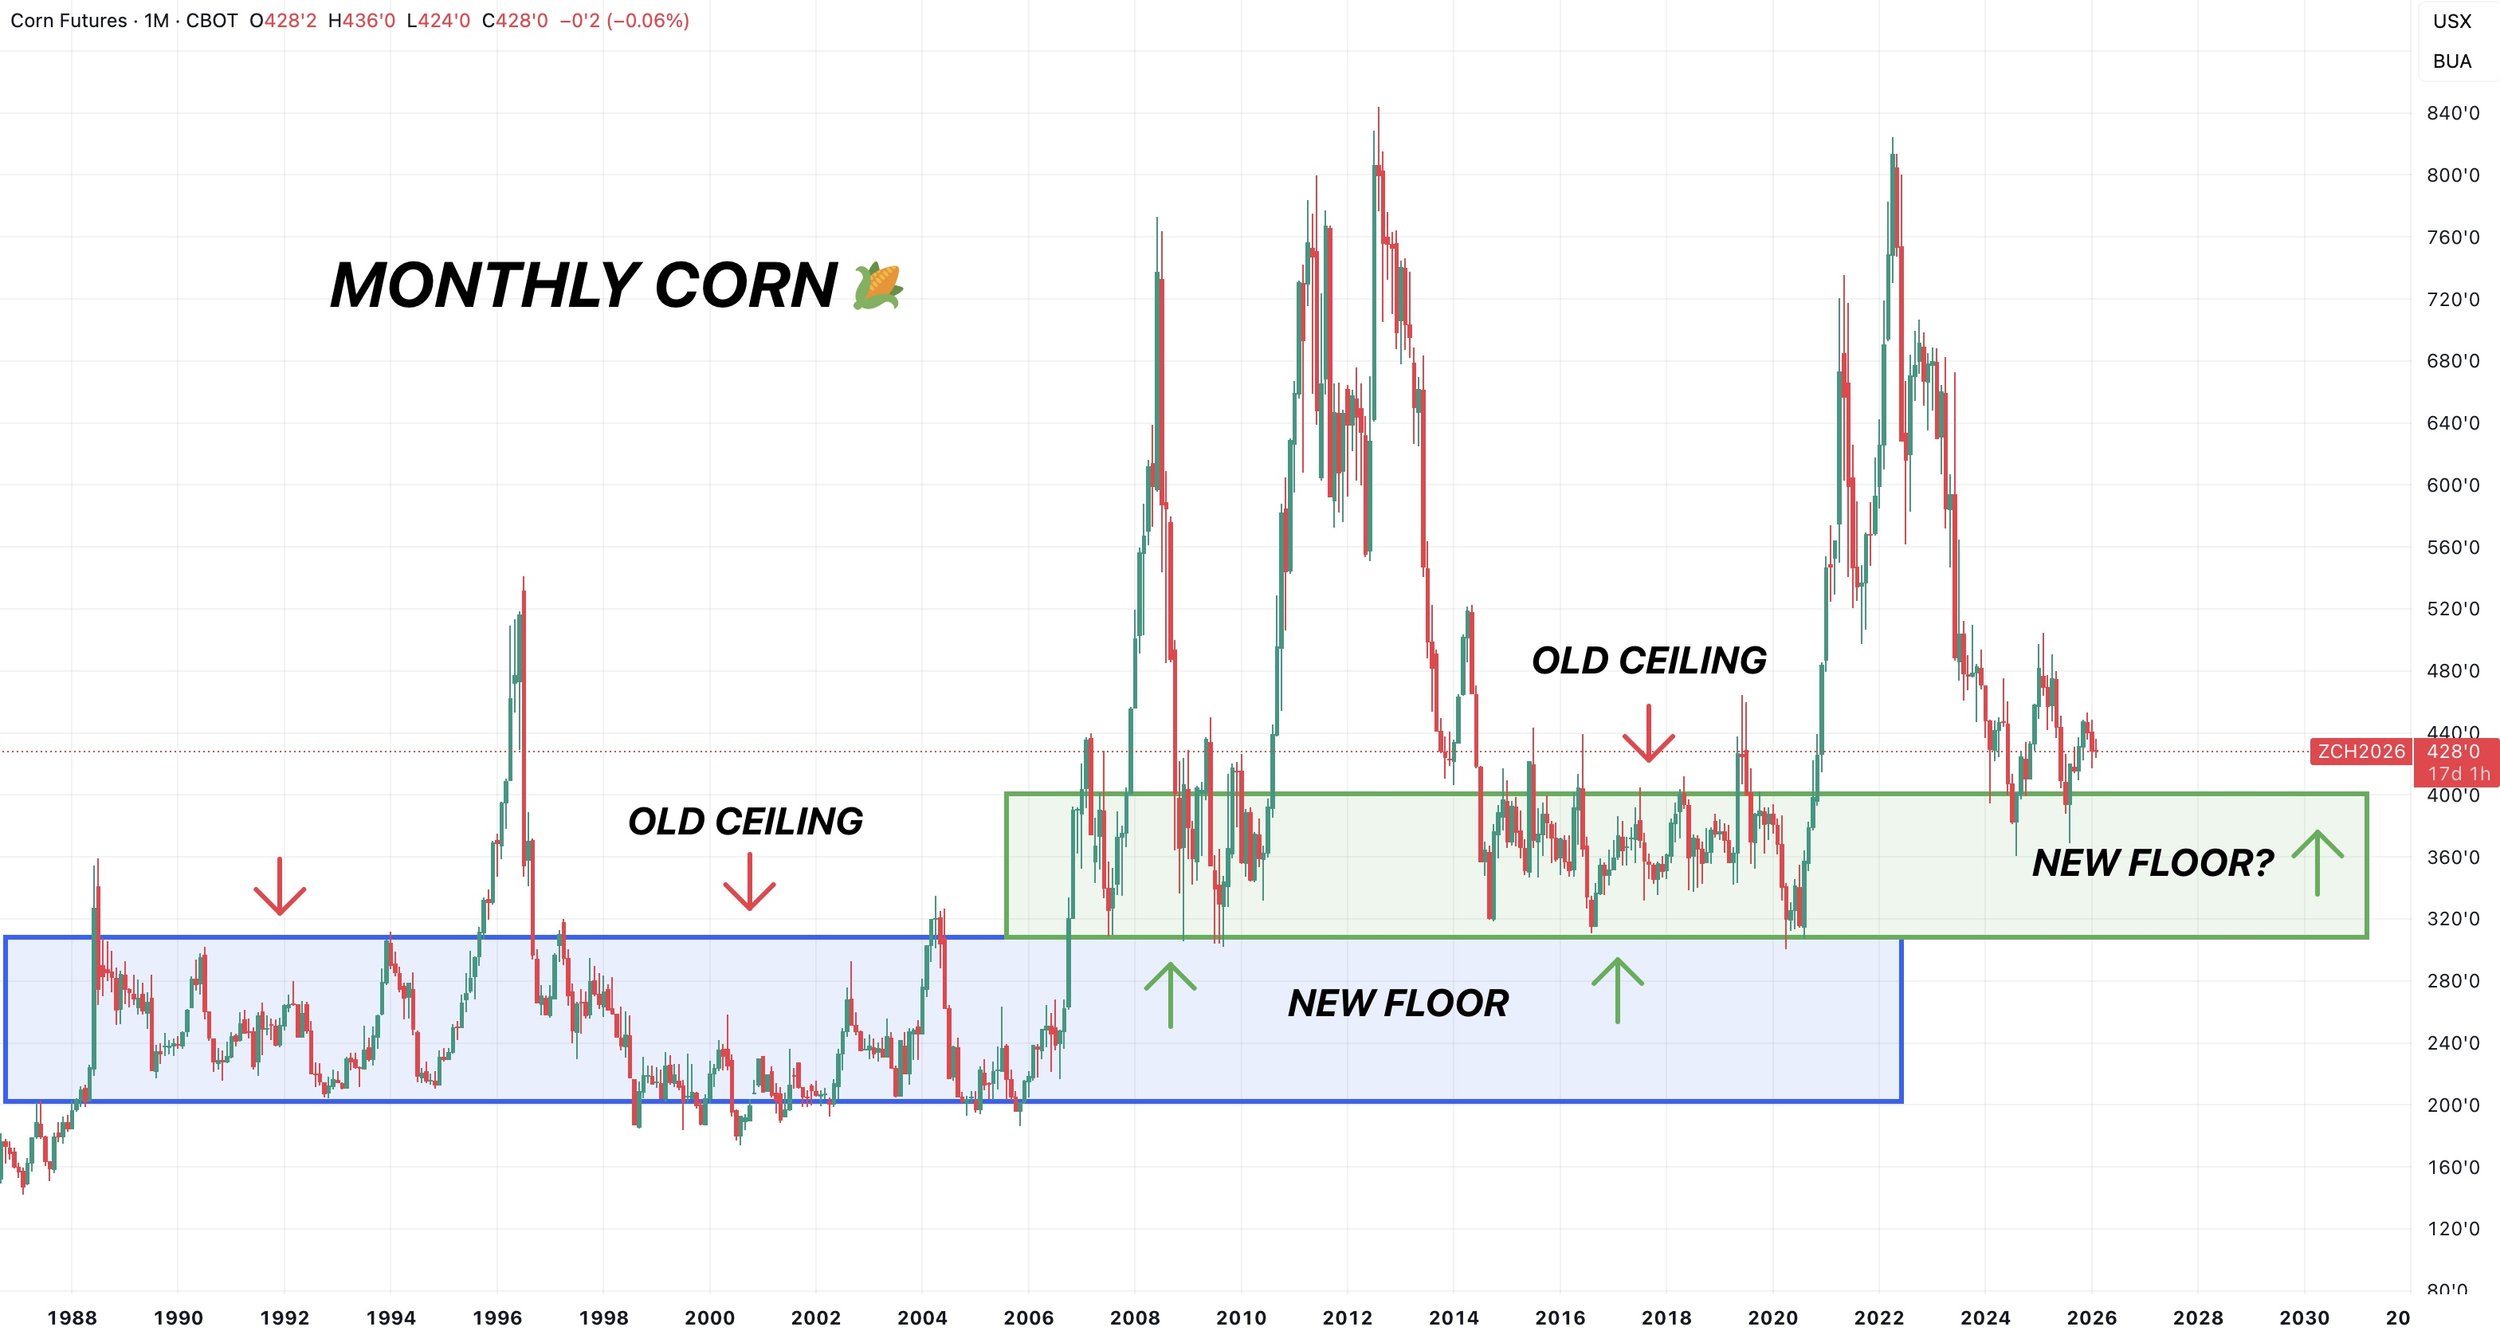
Monthly Chart
Even though our upside seems limited for now, I wanted to reiterate that I don’t think a sustained move below $4.00 happens.
I think we found our new long term floor here.
Before 2006, our ceiling was $3.00
From then until 2020, $3.00 was our new floor.
During the 2014-2020 bear market, our ceiling was $4.00
So far.. $4.00 has acted as our floor.
Soybeans
Fundamentals:
I am going to play a little bit of devil's advocate today and argue both sides of the China story.
As for the report, it was a nothing burger.
Something interesting to note is that the USDA made comments about China and Trump. So it sounds like the USDA is taking the potential China buying seriously.
It almost sounds like if it hadn’t been for Trumps comments, they were going to lower exports in this report.
Let's say China does go ahead and buy 20 million metric tons of soybeans.
I've shown this chart in my last few updates, but this would bring China's total purchases from 441 million bushels all the way up to 735 million bushels.
That is a MASSIVE difference.
294 million bushels to be exact.
The entire US soybean carryout is 350 million...
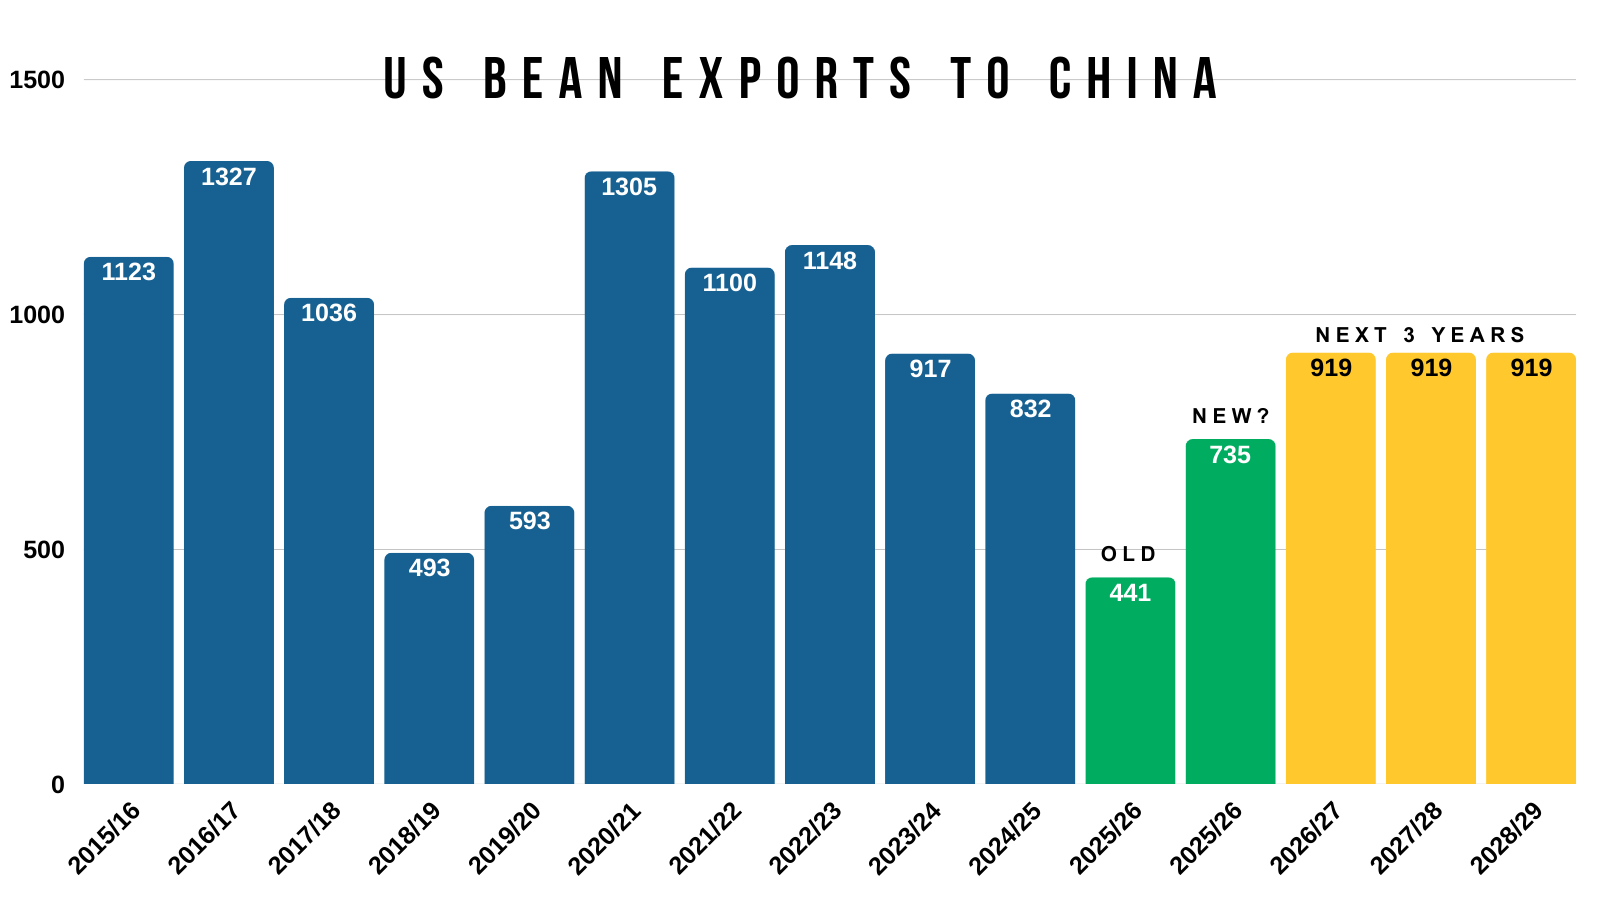
If they lived up to that it would of course be insanely bullish and does offer the potential for further upside.
However, let's flip the script and argue the other side of things.
Because there are definitely some reasons to pause and question how bullish this story really is.
For starters, the USDA confirmed Brazil has a monster crop.
It is by far a record at 180 million metric tons.
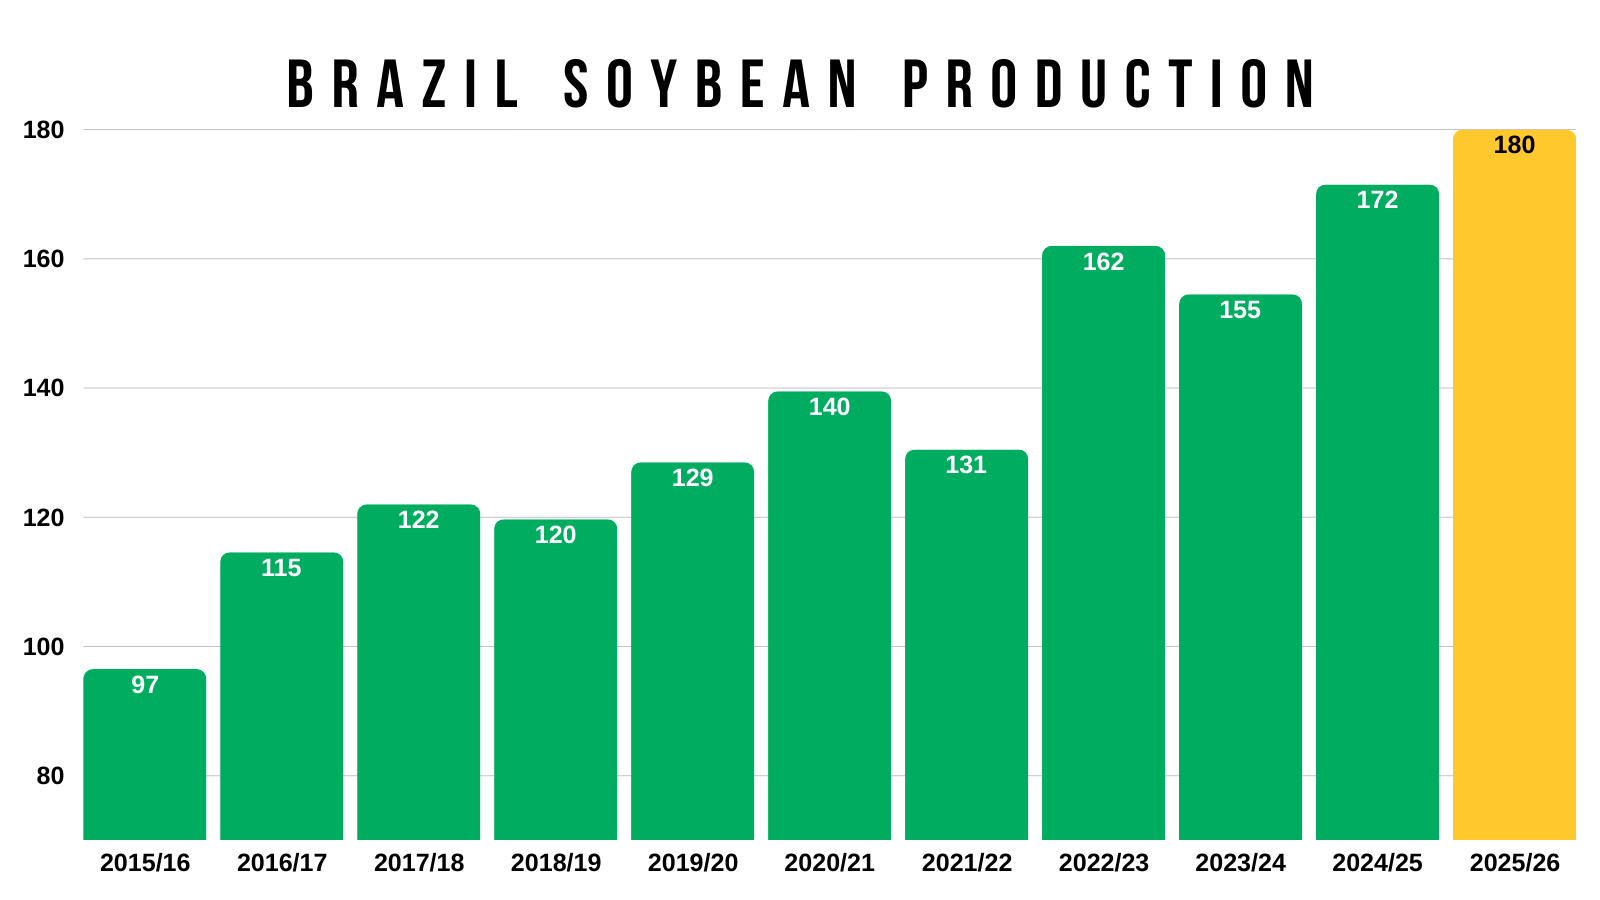
So you have a record Brazil crop.
We have a record yield here in the US.
We have a huge spread between Brazil and US fob prices given that Brazil is far cheaper than we are.
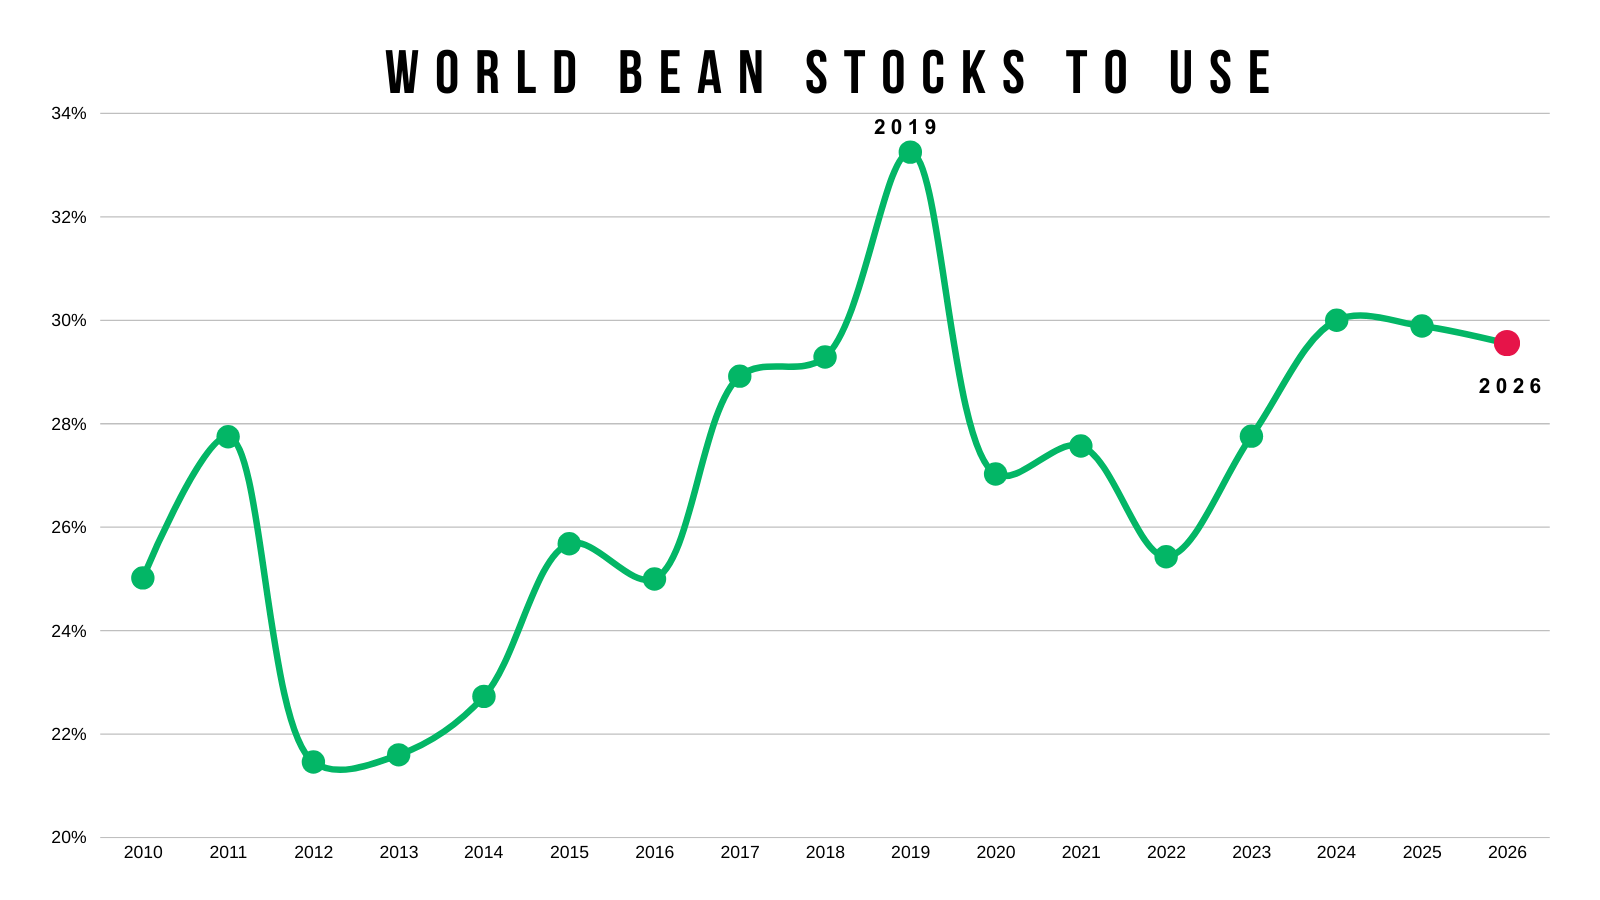
While at the same time, the world situation is still one of the largest we've ever seen.
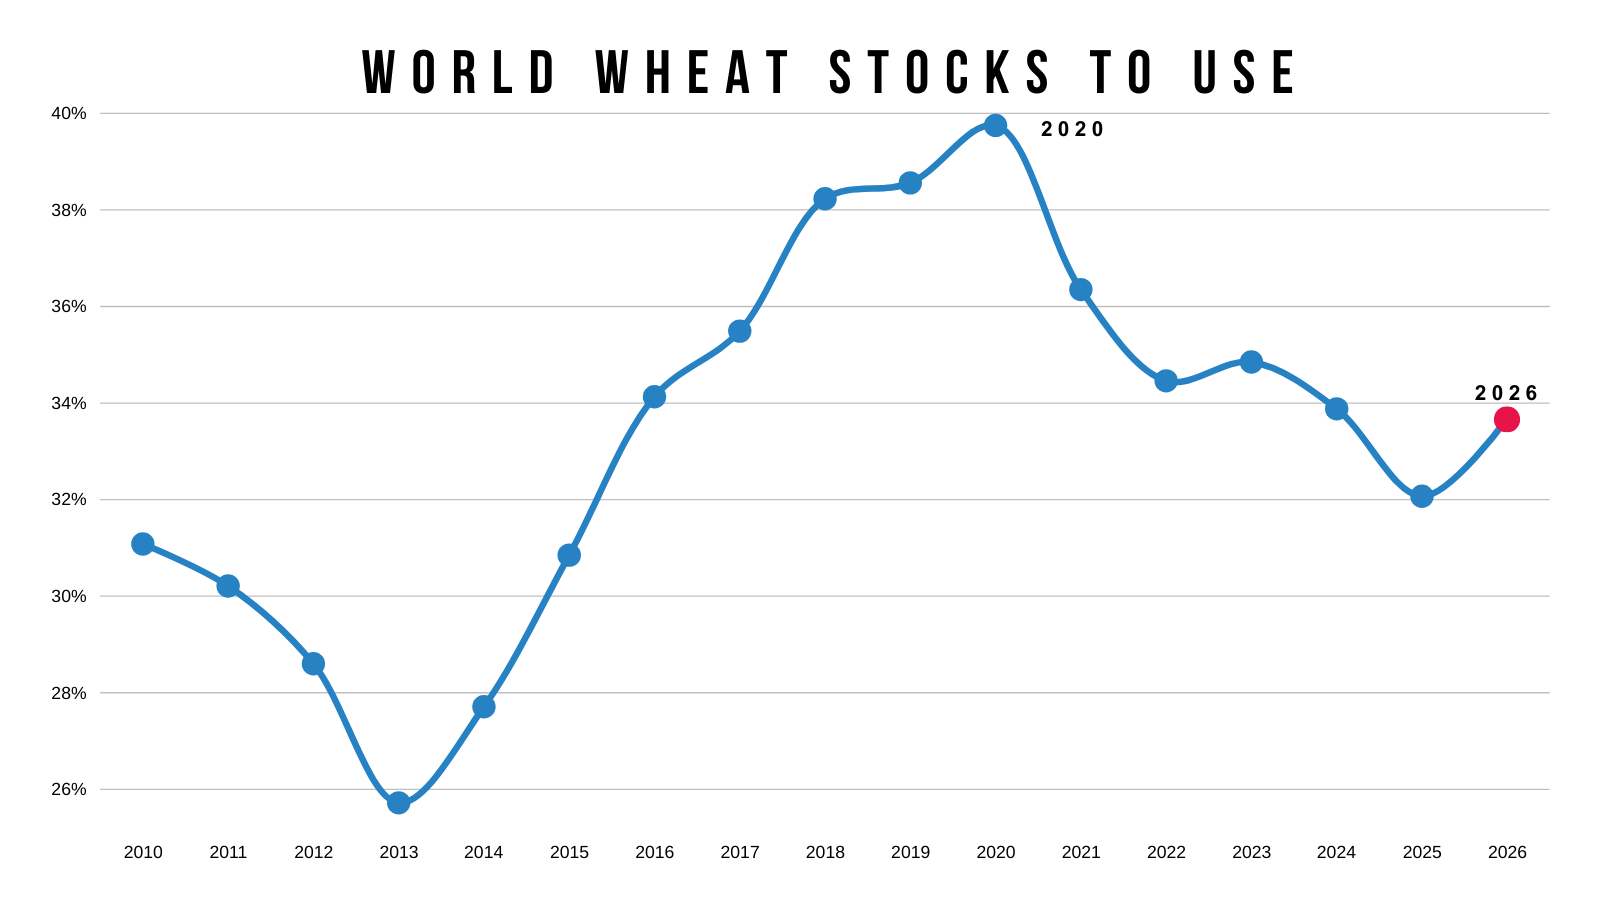
Here is our world stocks to use ratio. It's not tight.
You could argue that gaining that China business would result in us losing a ton of demand to non-China destinations.
Because we simply do not have an extra 300 million bushels of soybeans lying around.
For it to work, things are going to have to be shuffled around.
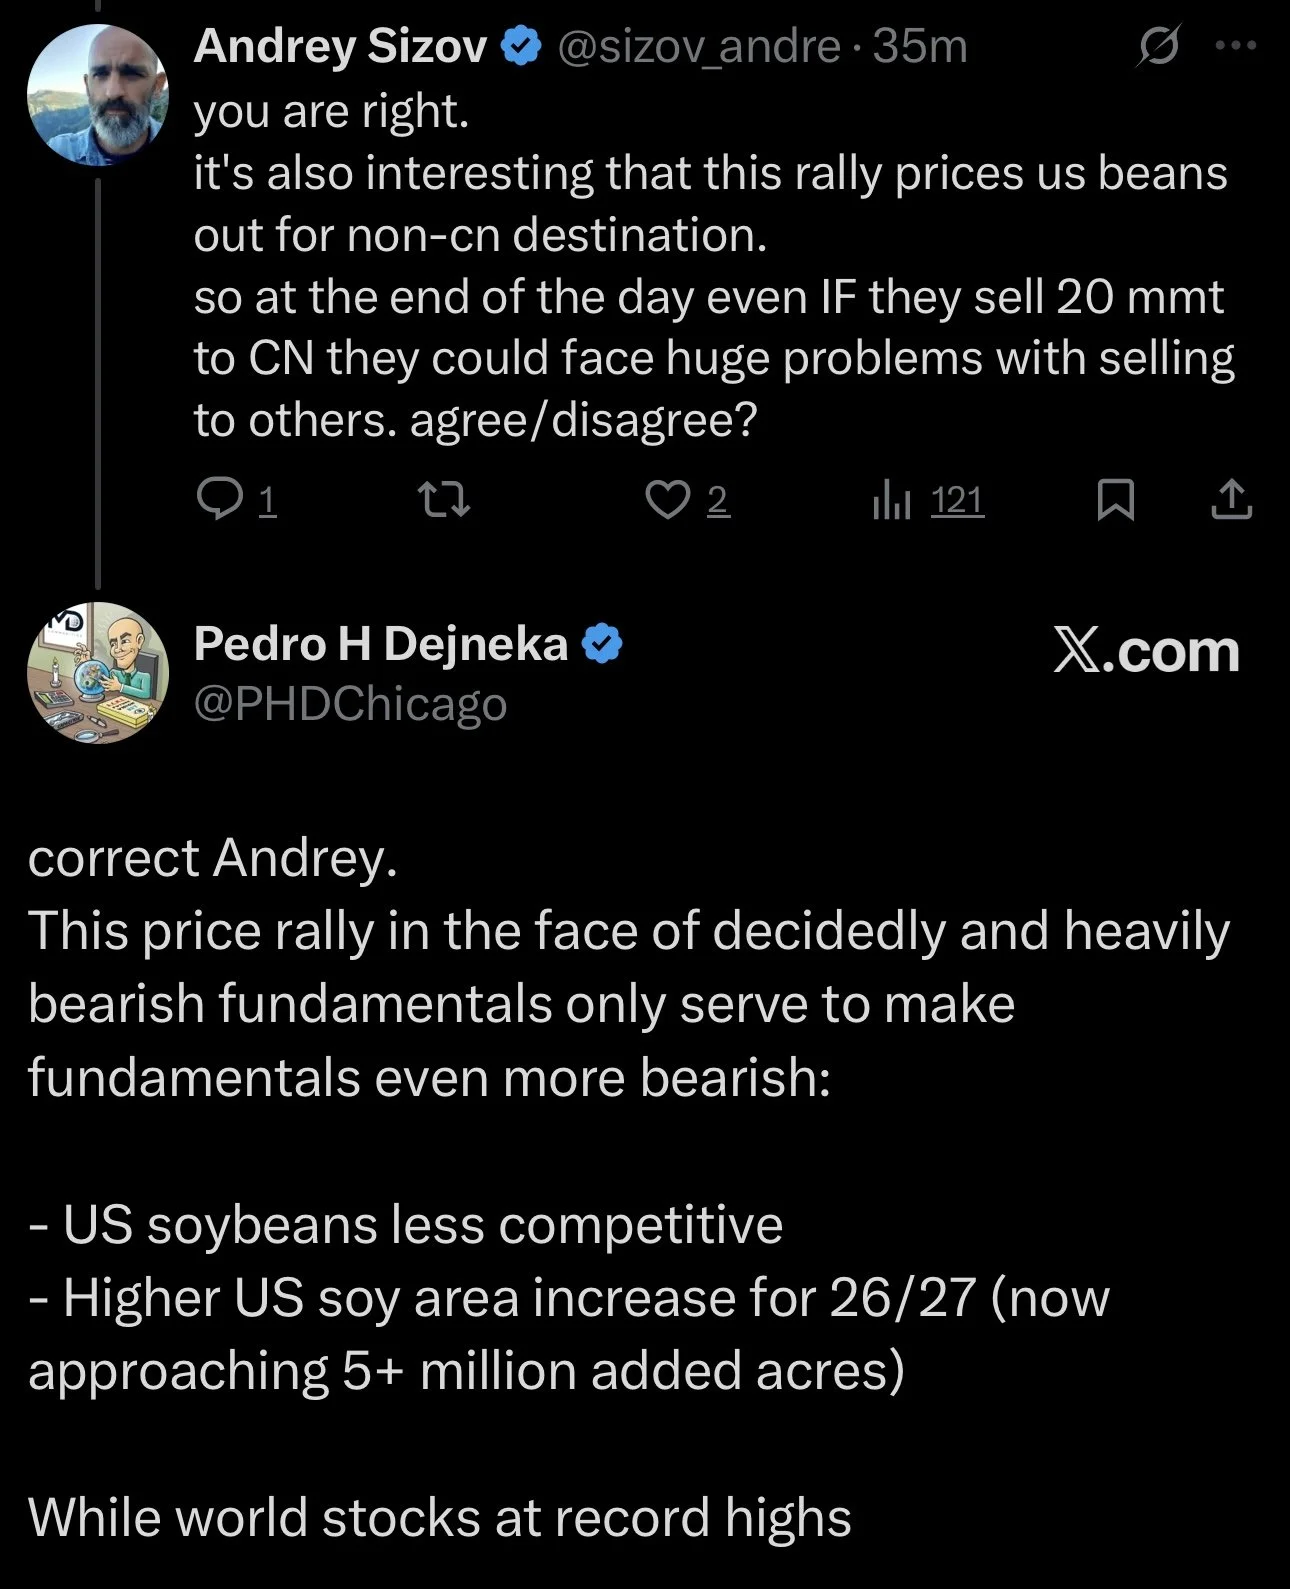
Here is a pretty interesting argument and conversation between South America analyst Pedro Dejneka and Black Sea analyst Andrey Sizov.
Pedro argues that a rally here simply makes US soybeans even less competitive while buying more acres.
All while world stocks sit near record high levels.
It's impossible to know exactly how it will all shake out. There are endless possibilities.
The potential is definitely there, but it doesn’t come without question marks.
Right now, all Trump said was that China is "considering" buying 20 million metric tons of soybeans.
He has yet to say they full on "agreed" to buy them.
If they agree, I don't see why it wouldn’t be "possible" for it to happen. Even if it logically doesn’t make sense for them to do so.
They lived up to their promise on the 12 million.
Sure, there are several logistical issues that make you wonder just how feasible and logical it would really be. Because it doesn’t make a lot of sense for them on the surface.
But if you are China and you are trying to secure trade deals with the US and keep the trade relationship happy.. wouldn’t you throw some soybeans in there as a goodwill offer?
Soybeans are a very small fraction when you look at the bigger picture approach between Trump and China.
Despite the potential, there are still some risks. Which is why we took a little risk off the table and alerted that old crop soybean sell signal and hedge alert on Friday morning.
Link to Friday's Alert
You could argue China isn’t going to buy RIGHT NOW as Brazil's harvest is underway.
Trump tweets have tended to be opportunities in the past.
You can’t completely ignore a $1.00 rally that was caused by a single tweet.
Trump could tweet something on any given day that results in us going a lot higher or lower. It's all about managing your risk where it makes sense.
Technicals:
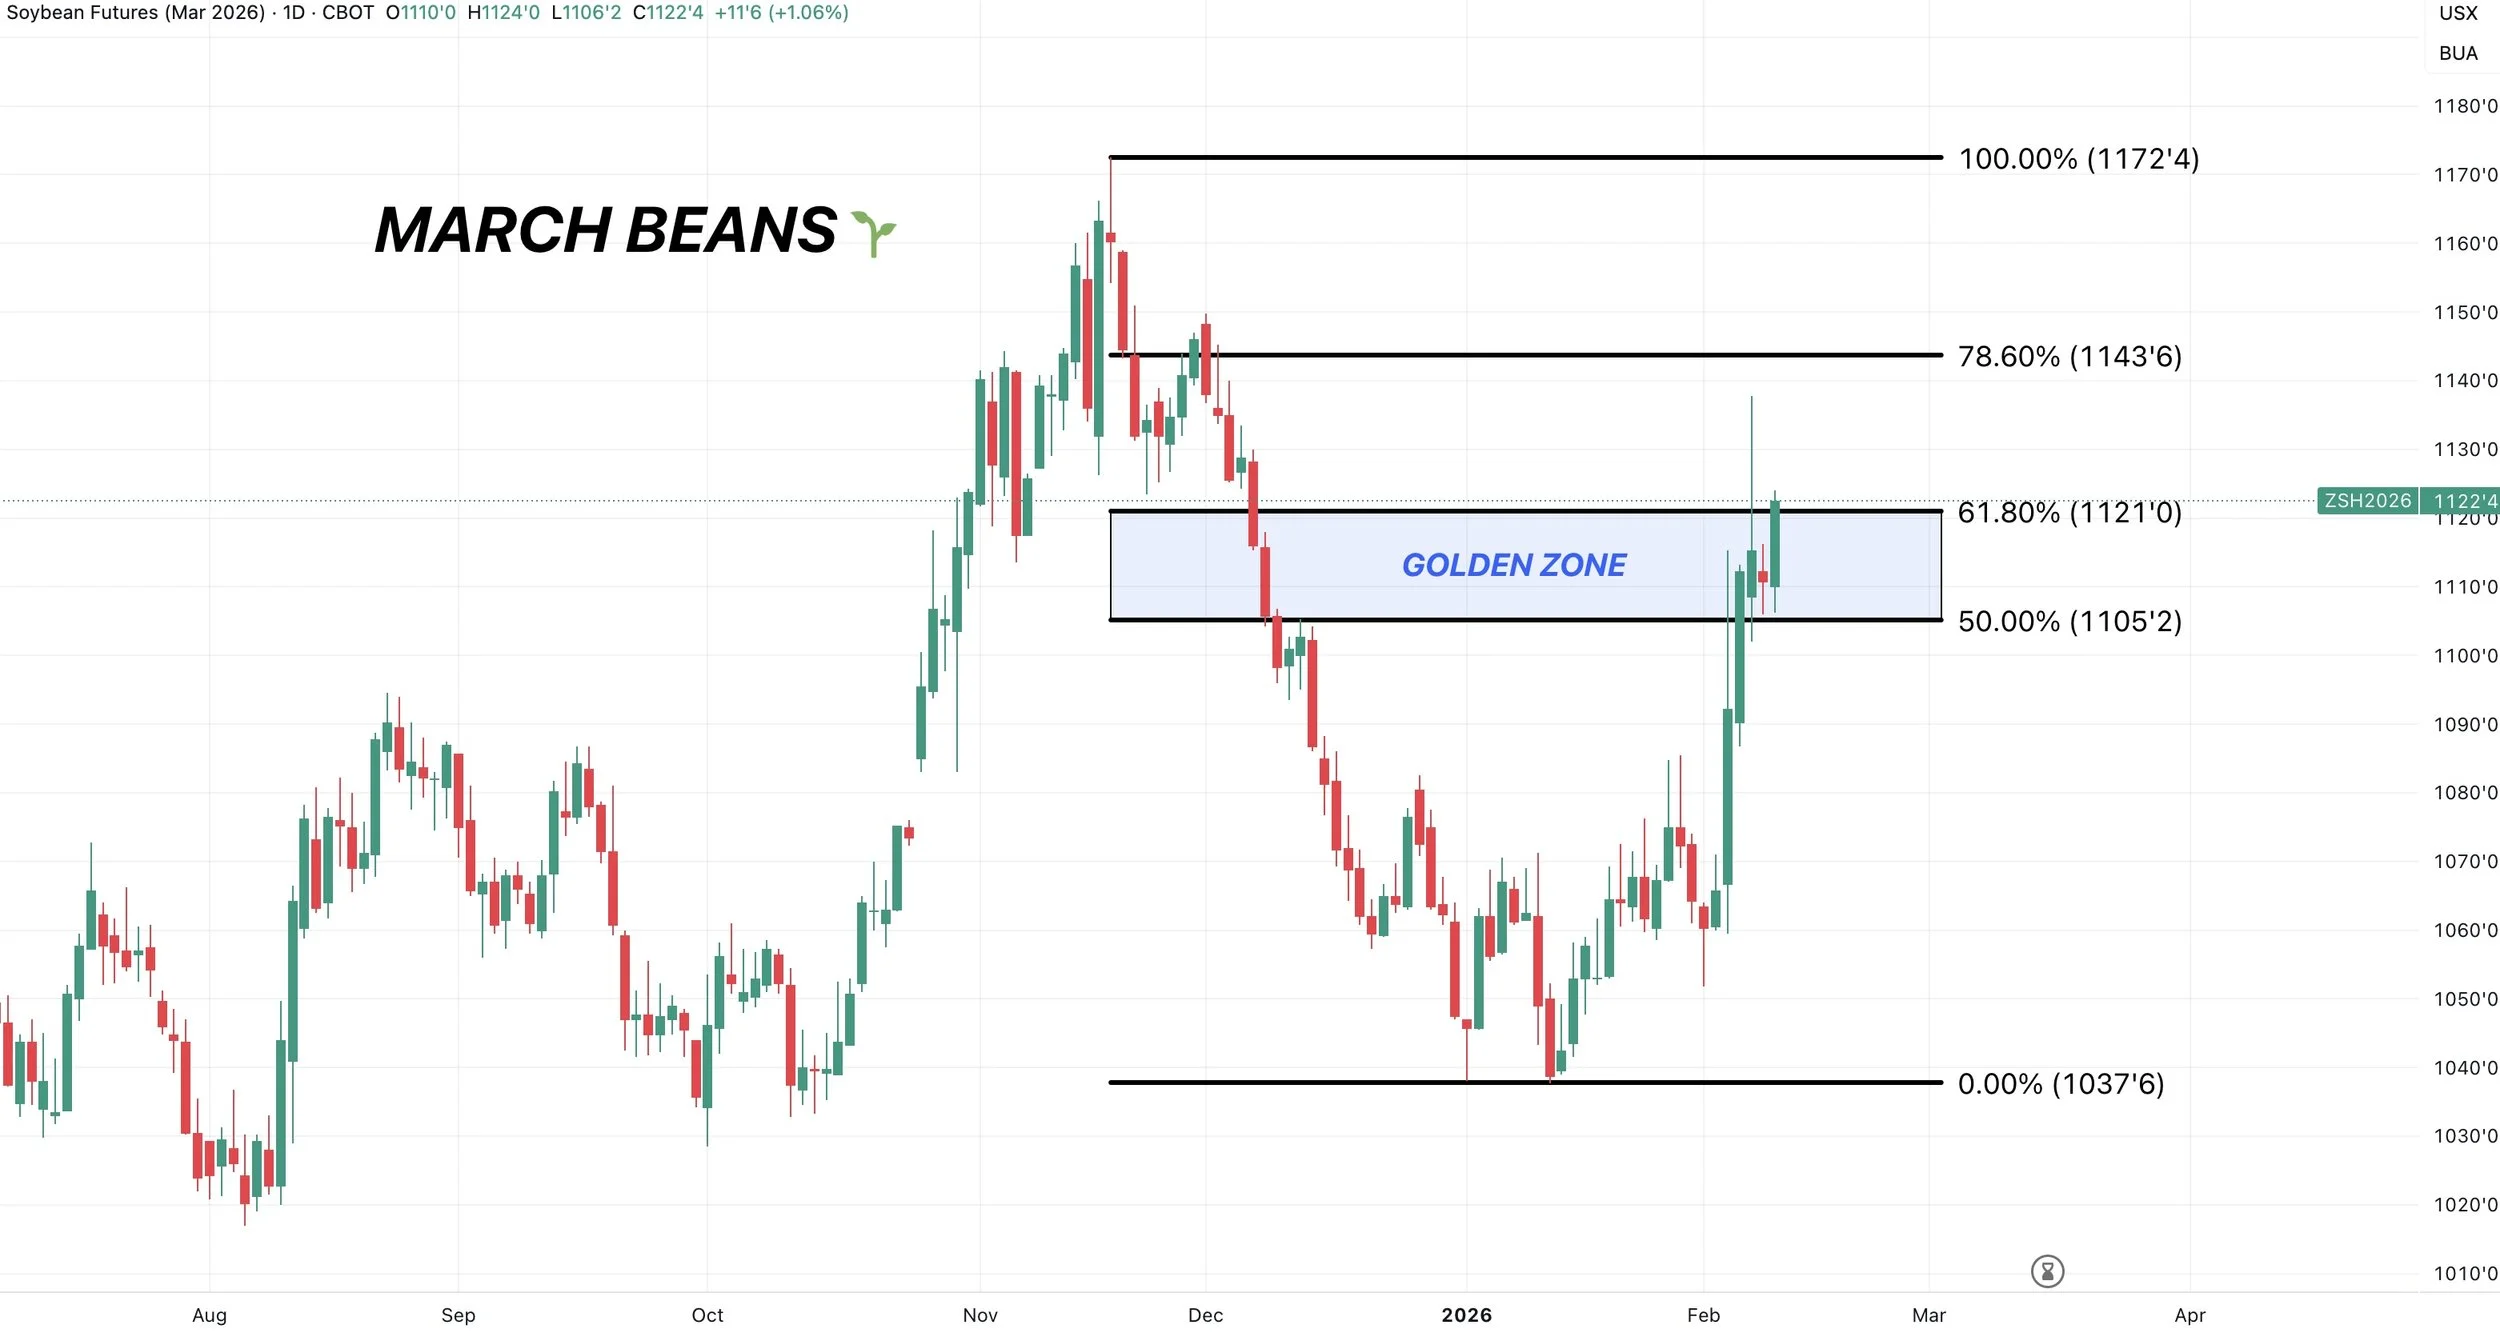
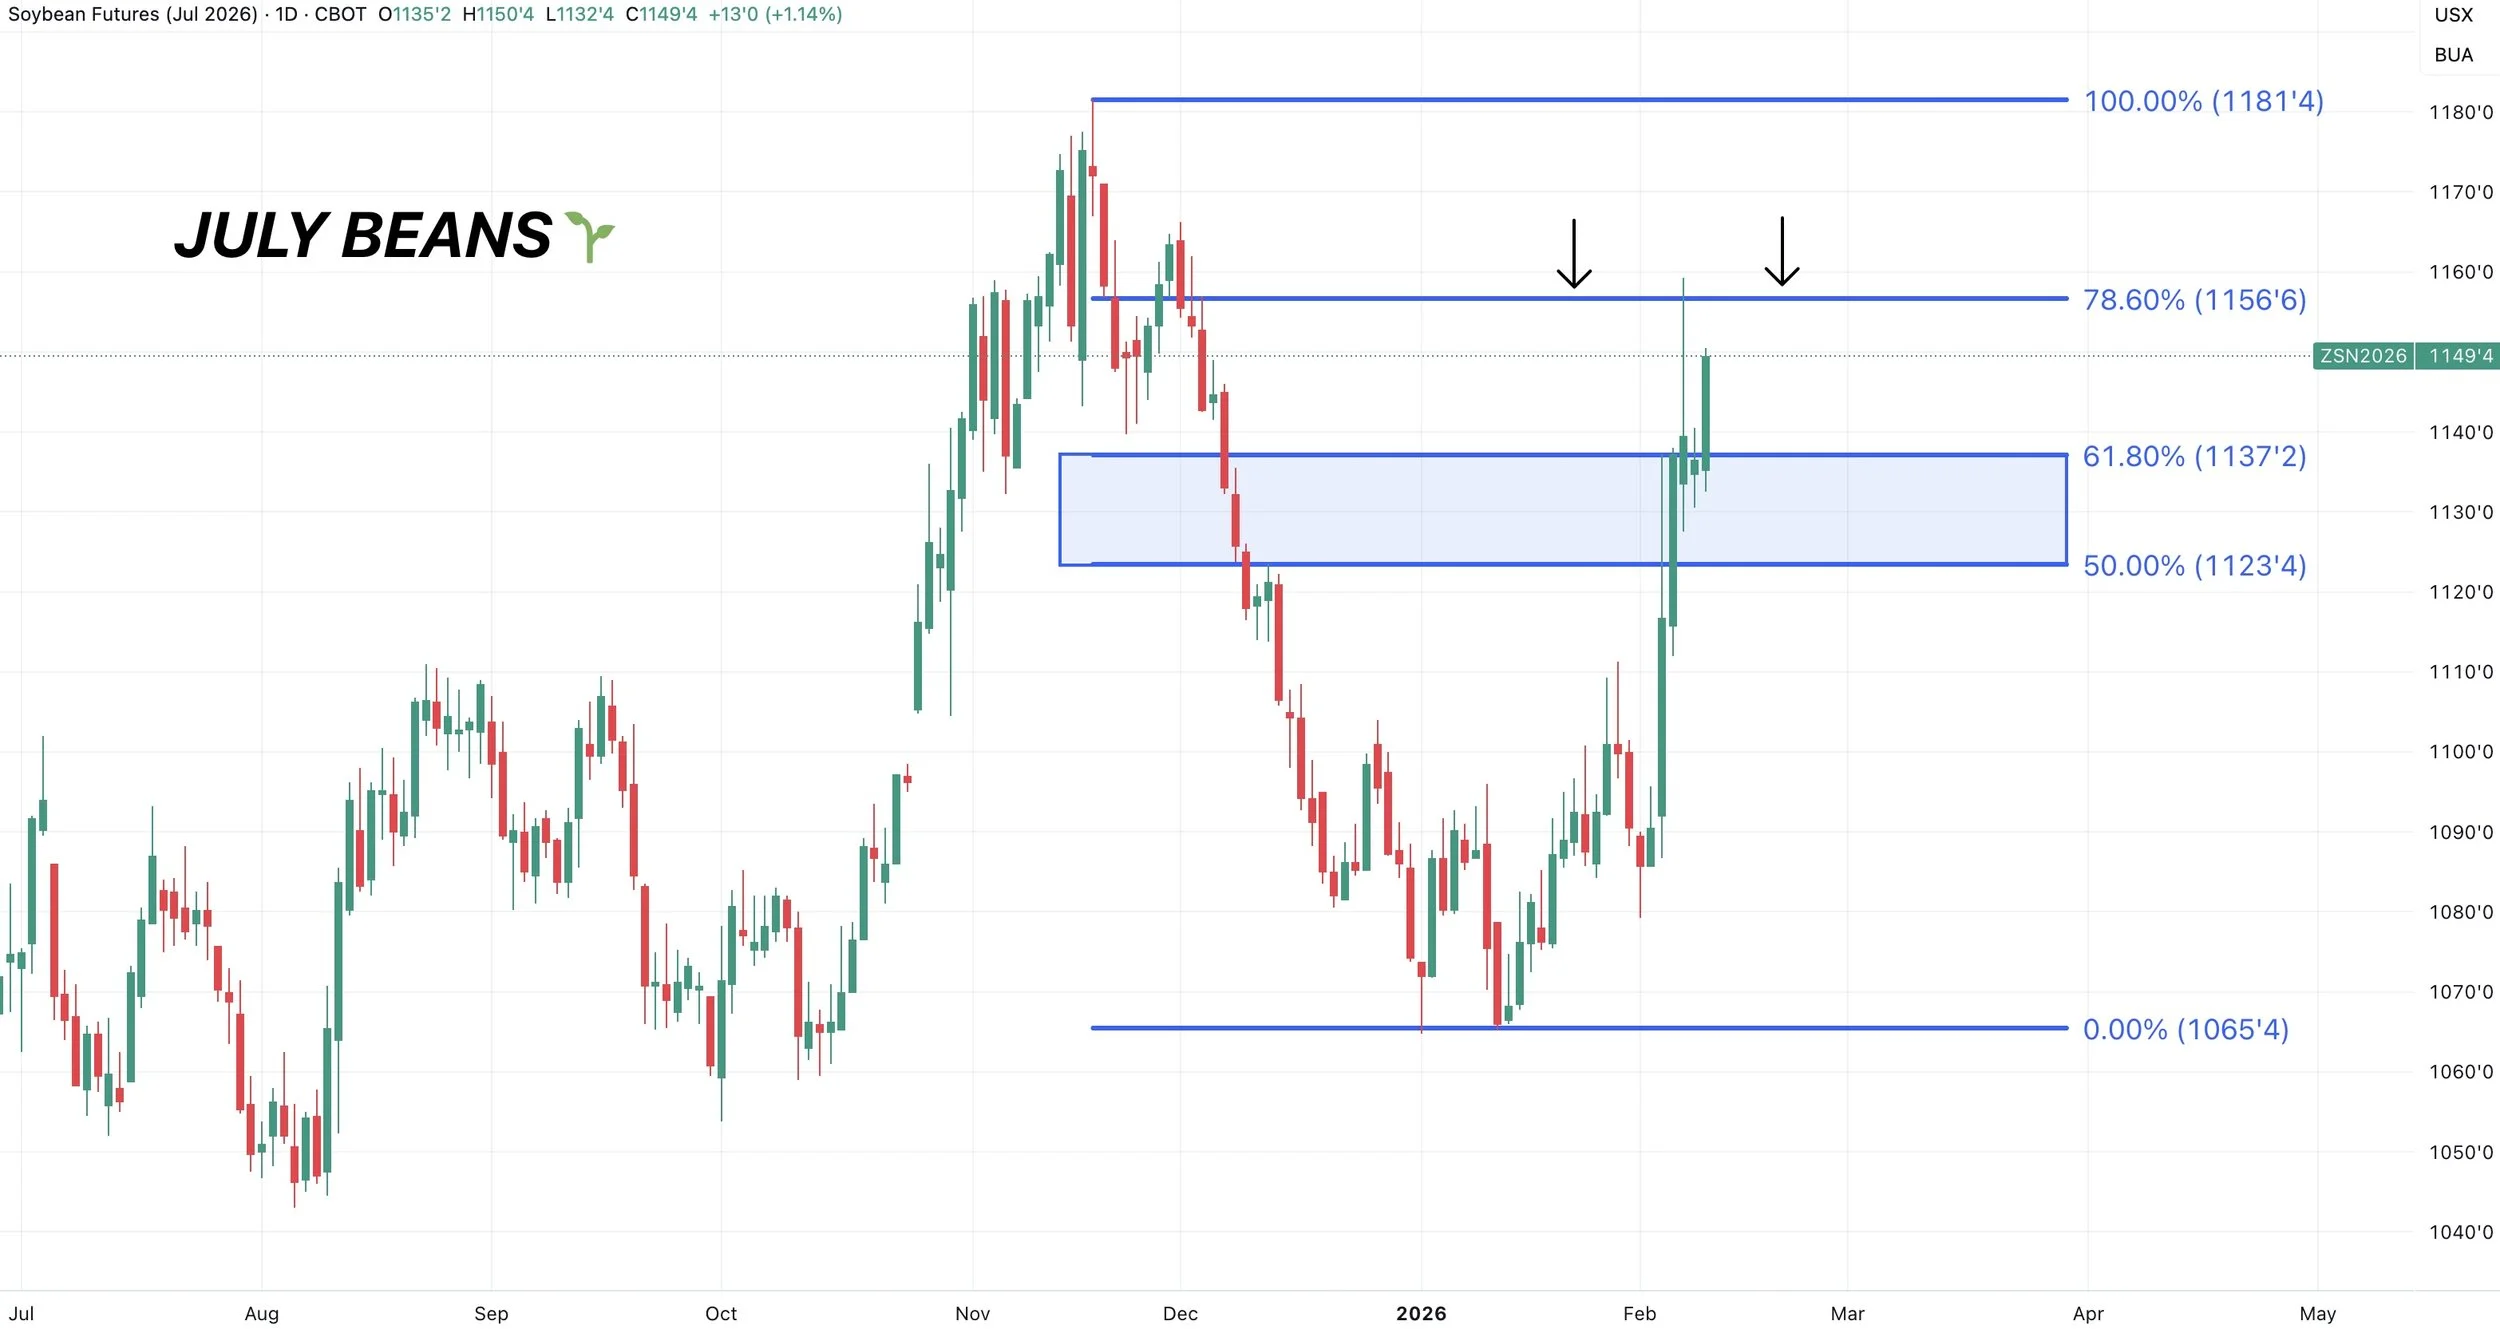
March beans sitting right at that 61.8% retracement level up to the November highs.
This is where bounces can often tend to fail.
However, consecutive closes above can often spark further upside.
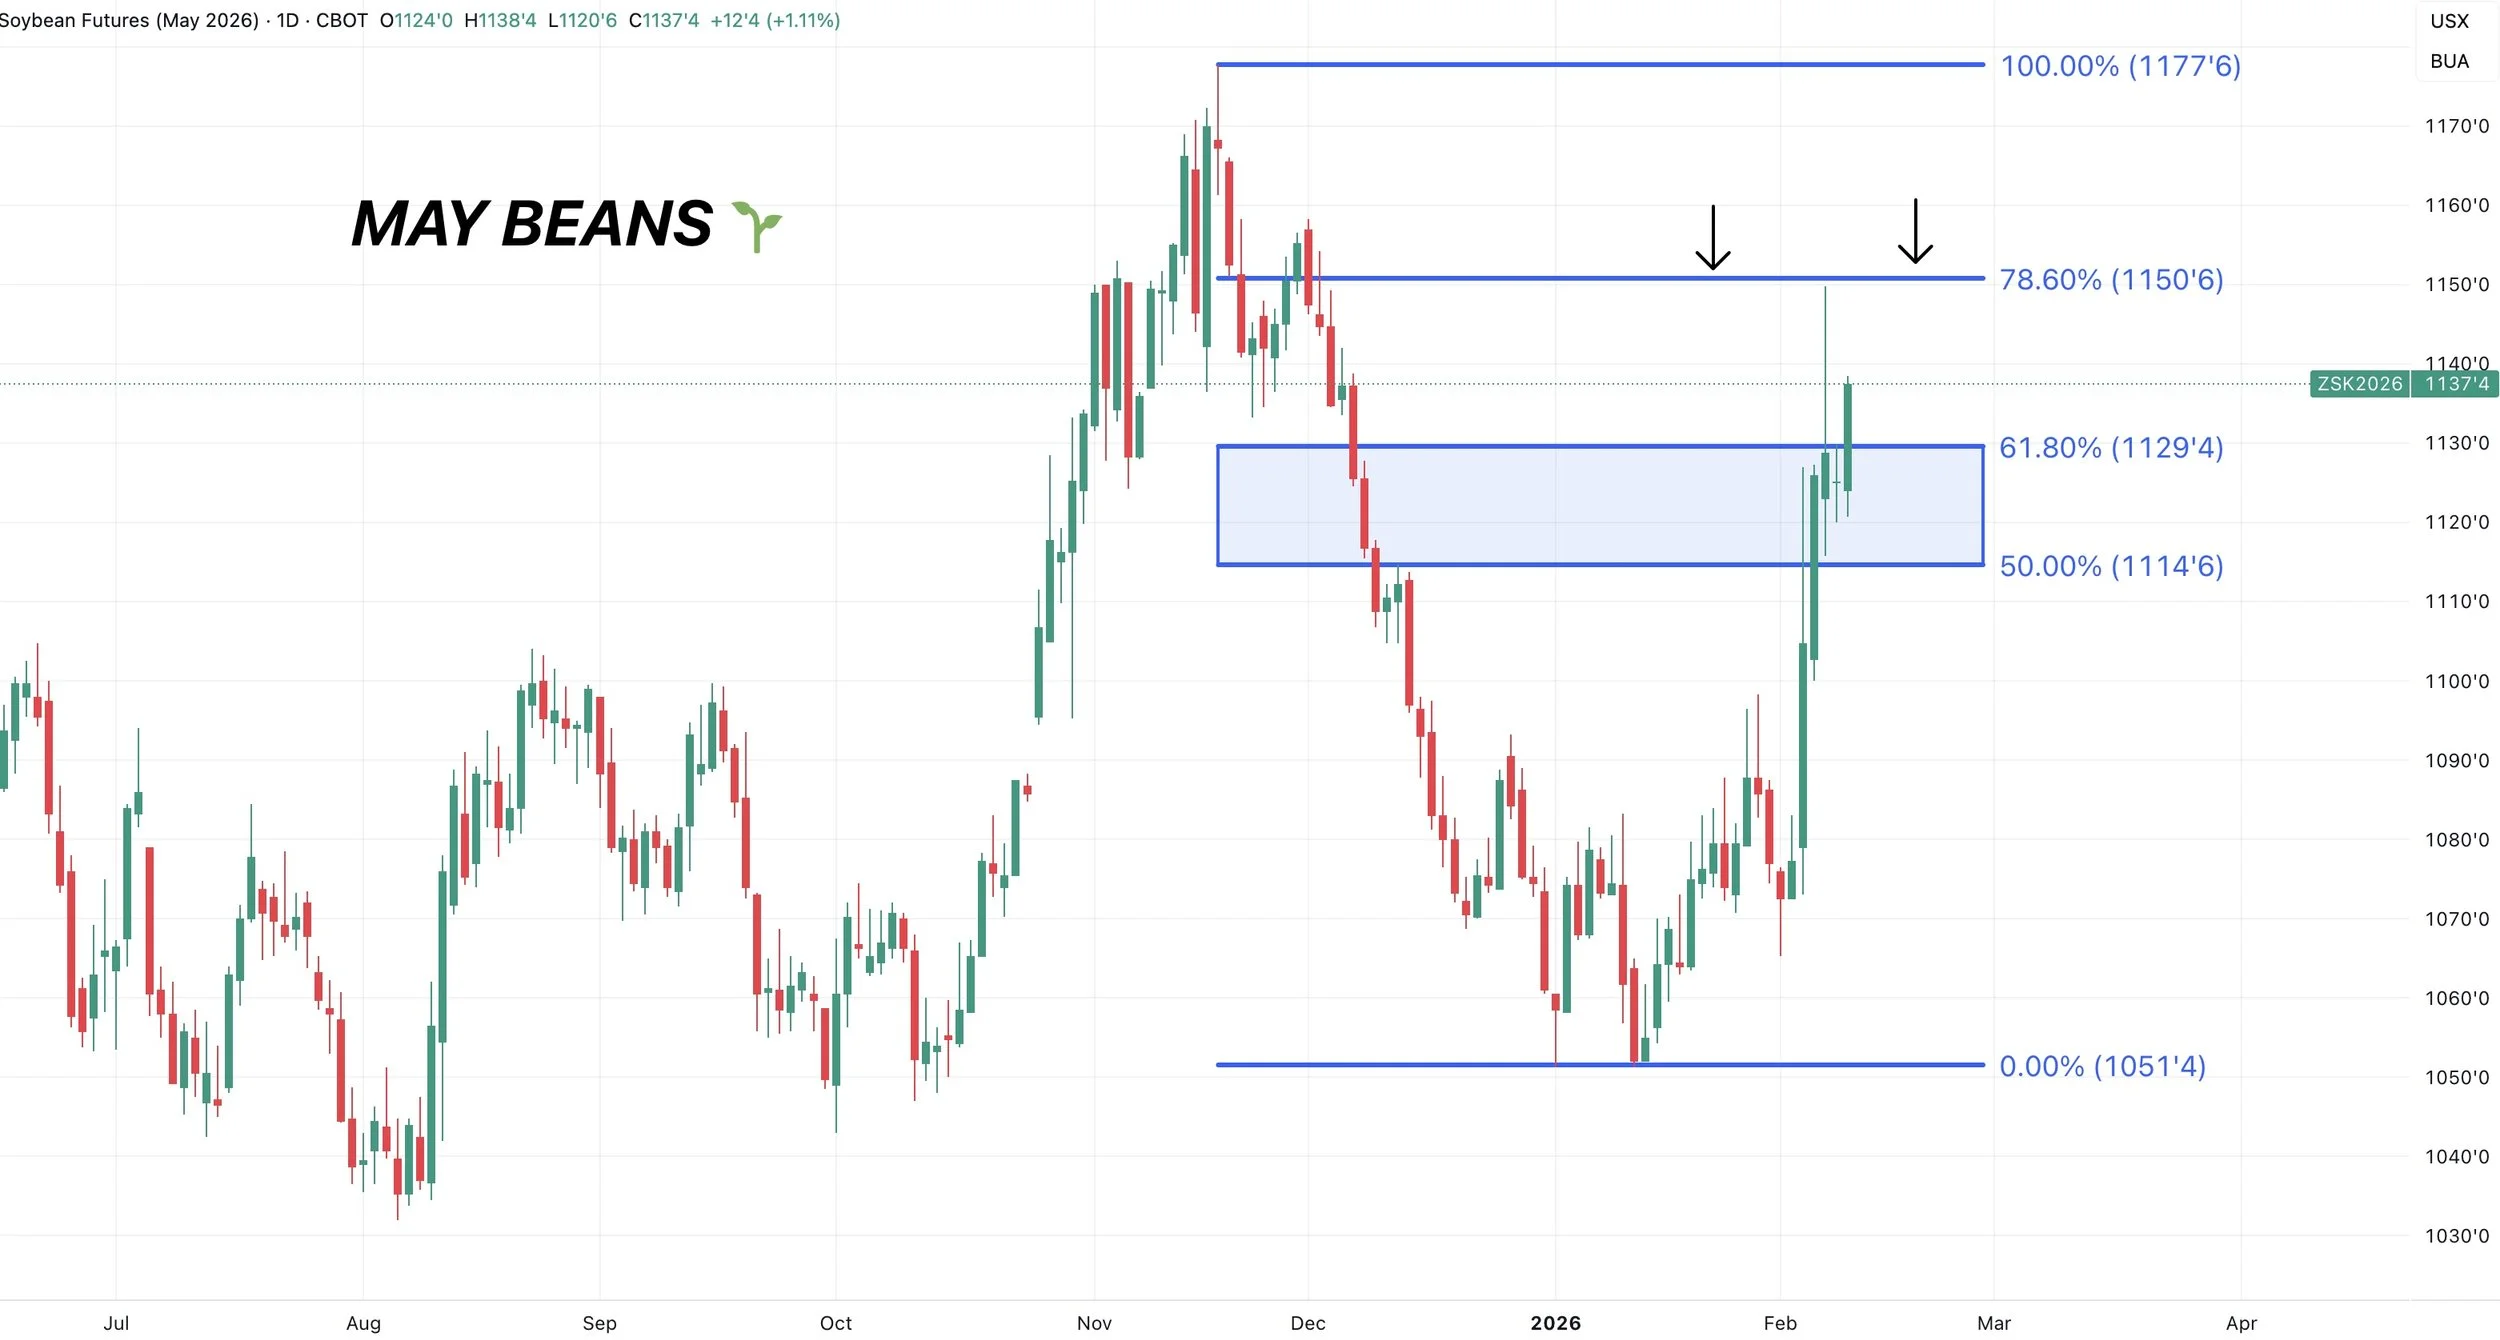
We alerted that sell signal Friday morning because May and July beans both clawed back 78.6% of the November highs.
The last retracement level before those highs.
Wheat
Fundamentals:
The USDA report was a snooze fest for the wheat market and changes nothing.
The wheat market still lacks a catalyst as we just have an abundance of supply on both the global and US markets.
It'll will likely take some sort of supply scare somewhere to get a true opportunity.
The funds are still heavily short, so that is all it would take for a quick rally.
As of late, the weather around the world hasn’t been perfect.
As a result, we've seen a decent rally off the lows.
However, I am still simply waiting for a larger opportunity when it comes.
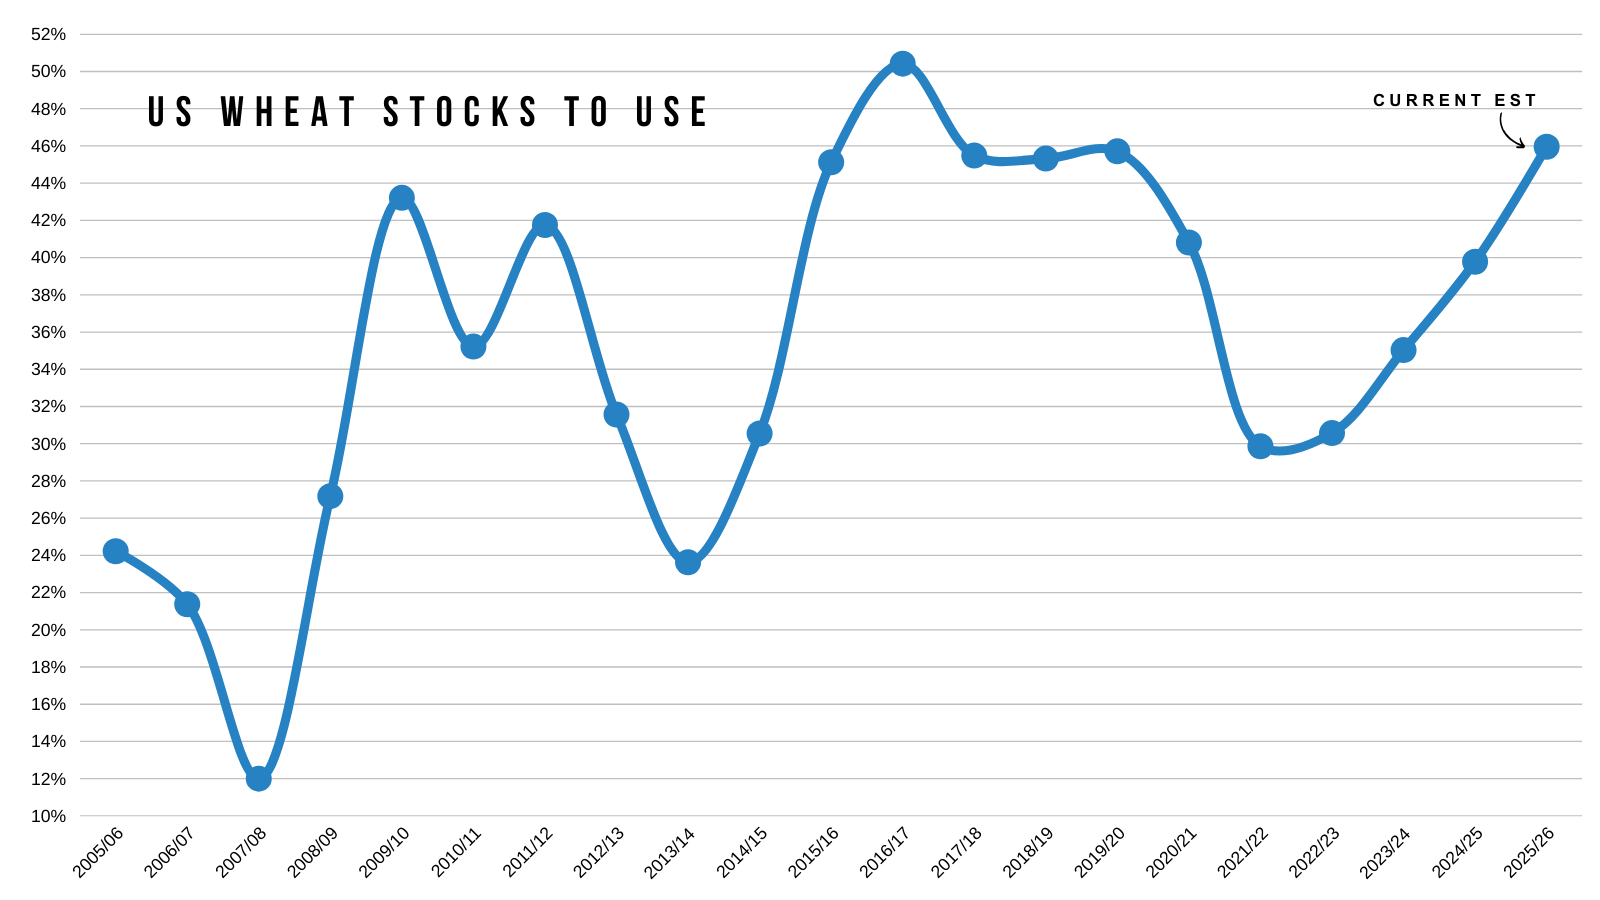
Here is the world situation vs the US situation.
Both have been on the rise and are the reasons we have been struggling for a while.
Not much else to update. It's the time of year when there just isn’t much for the market to digest.
Technicals:
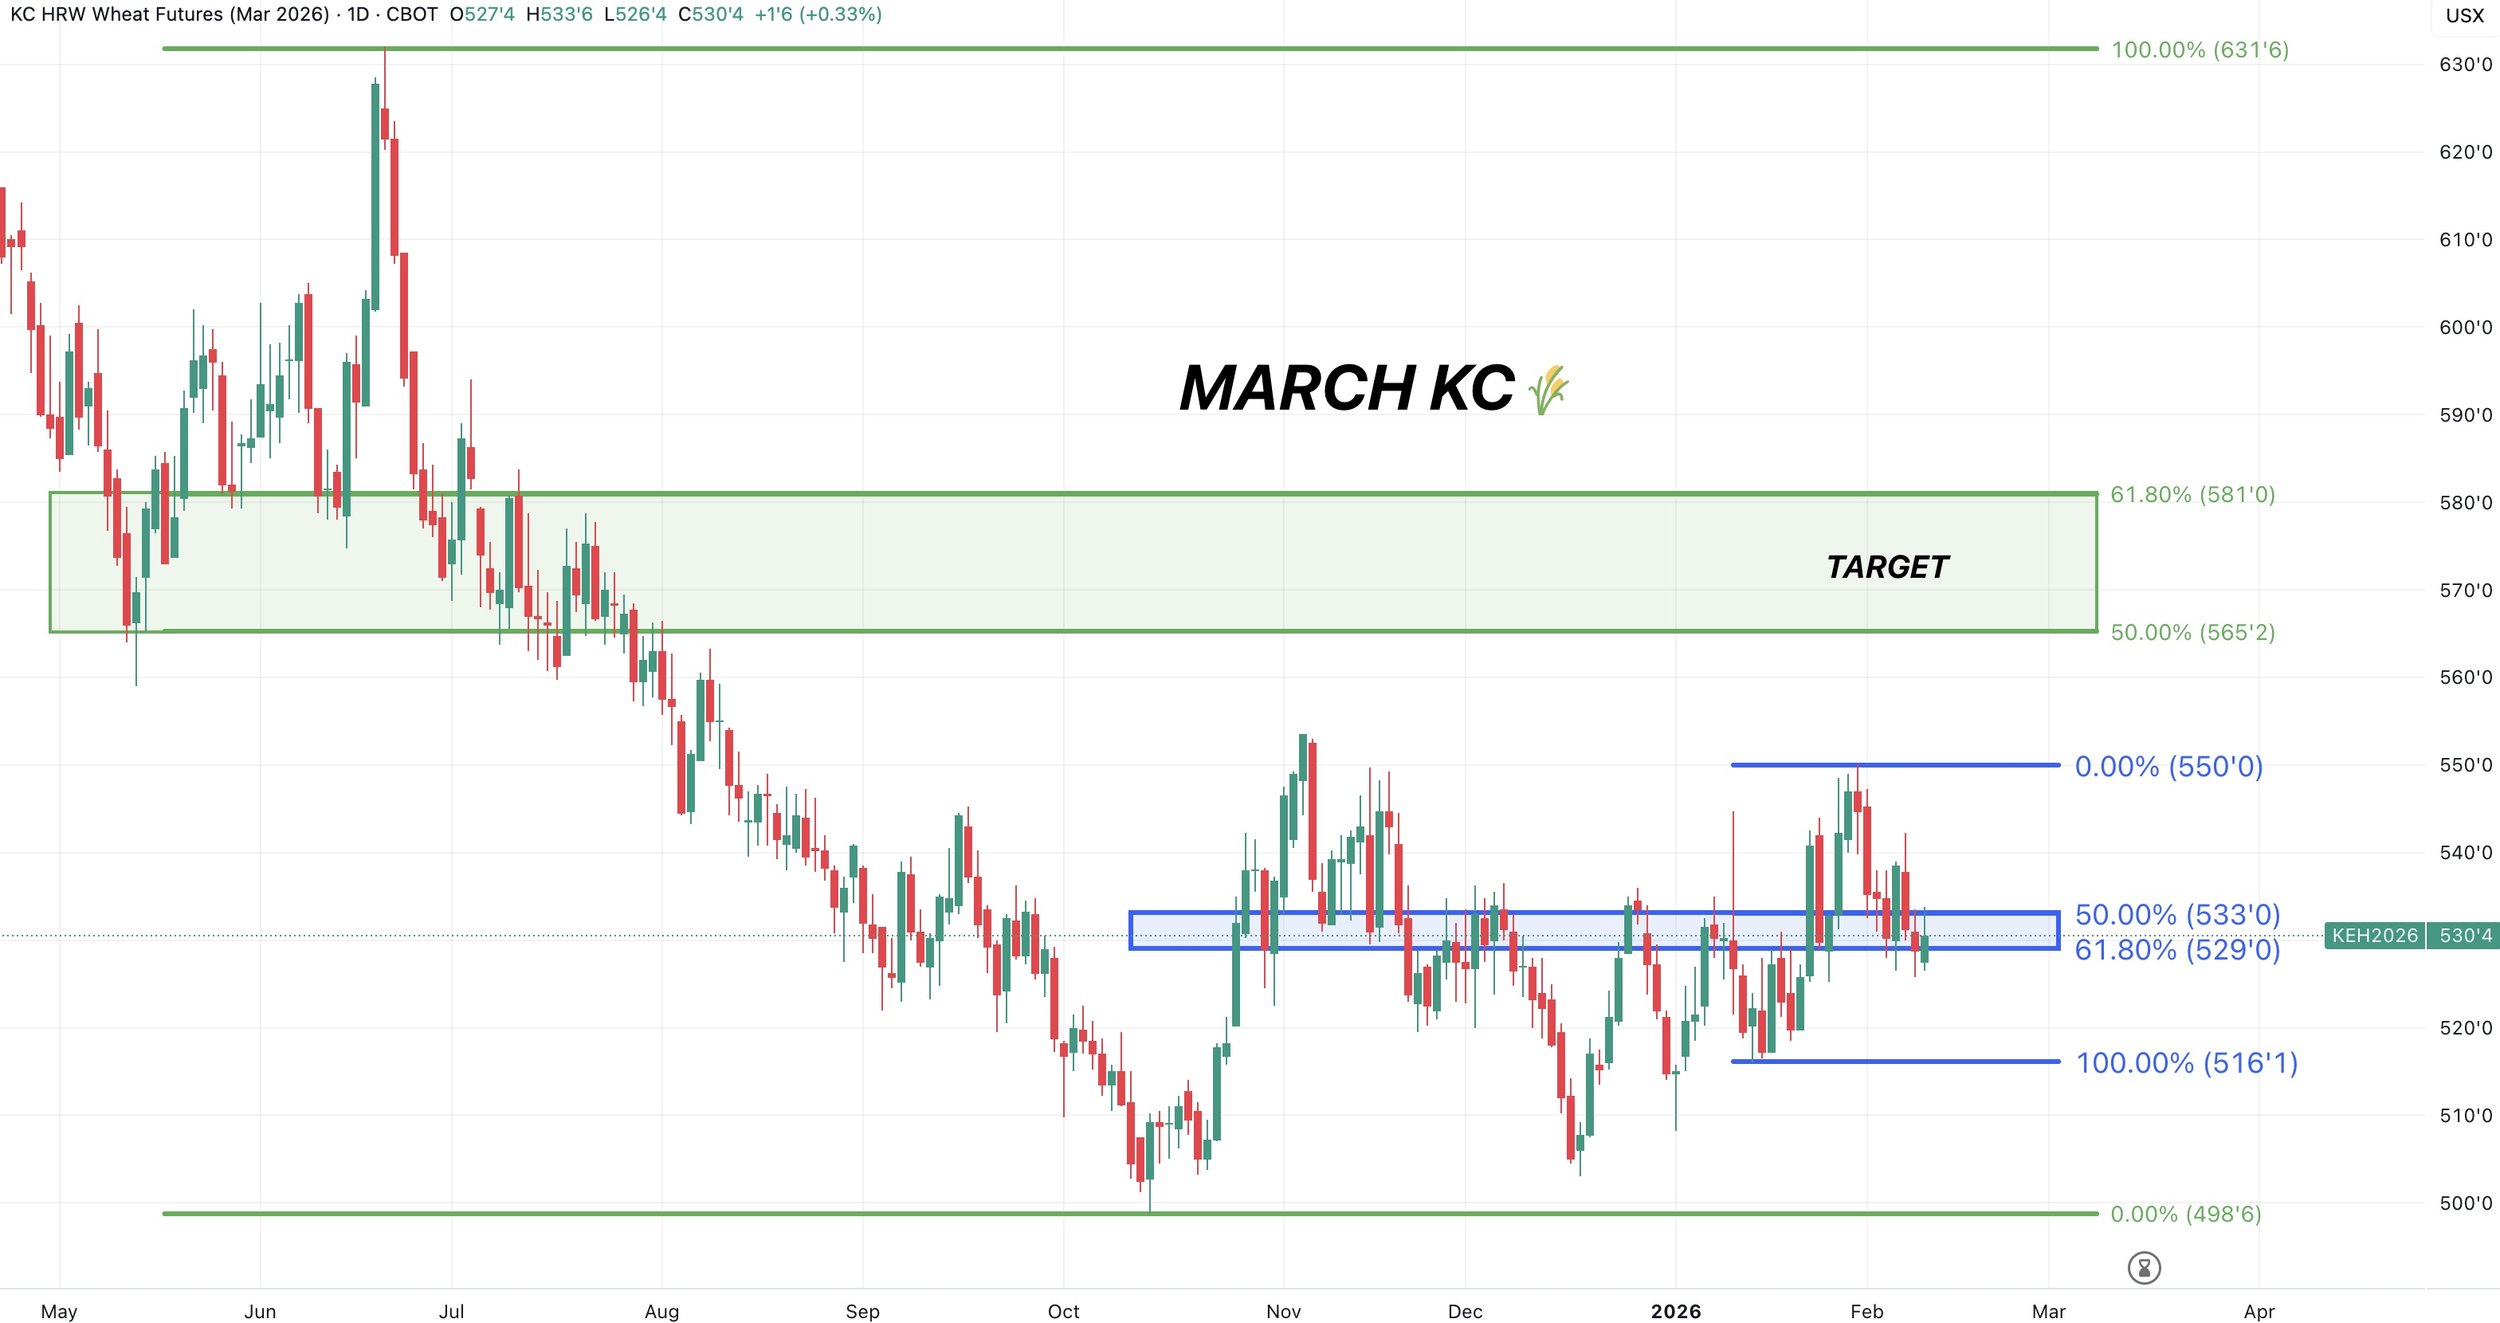
March KC:
Still sitting at key support here.
The 61.8% level of the recent rally along with prior resistance.
We need to hold here to prevent us from breaking down into the old range.
If we can take out the October highs, I am looking to reward a move towards the June highs golden zone.
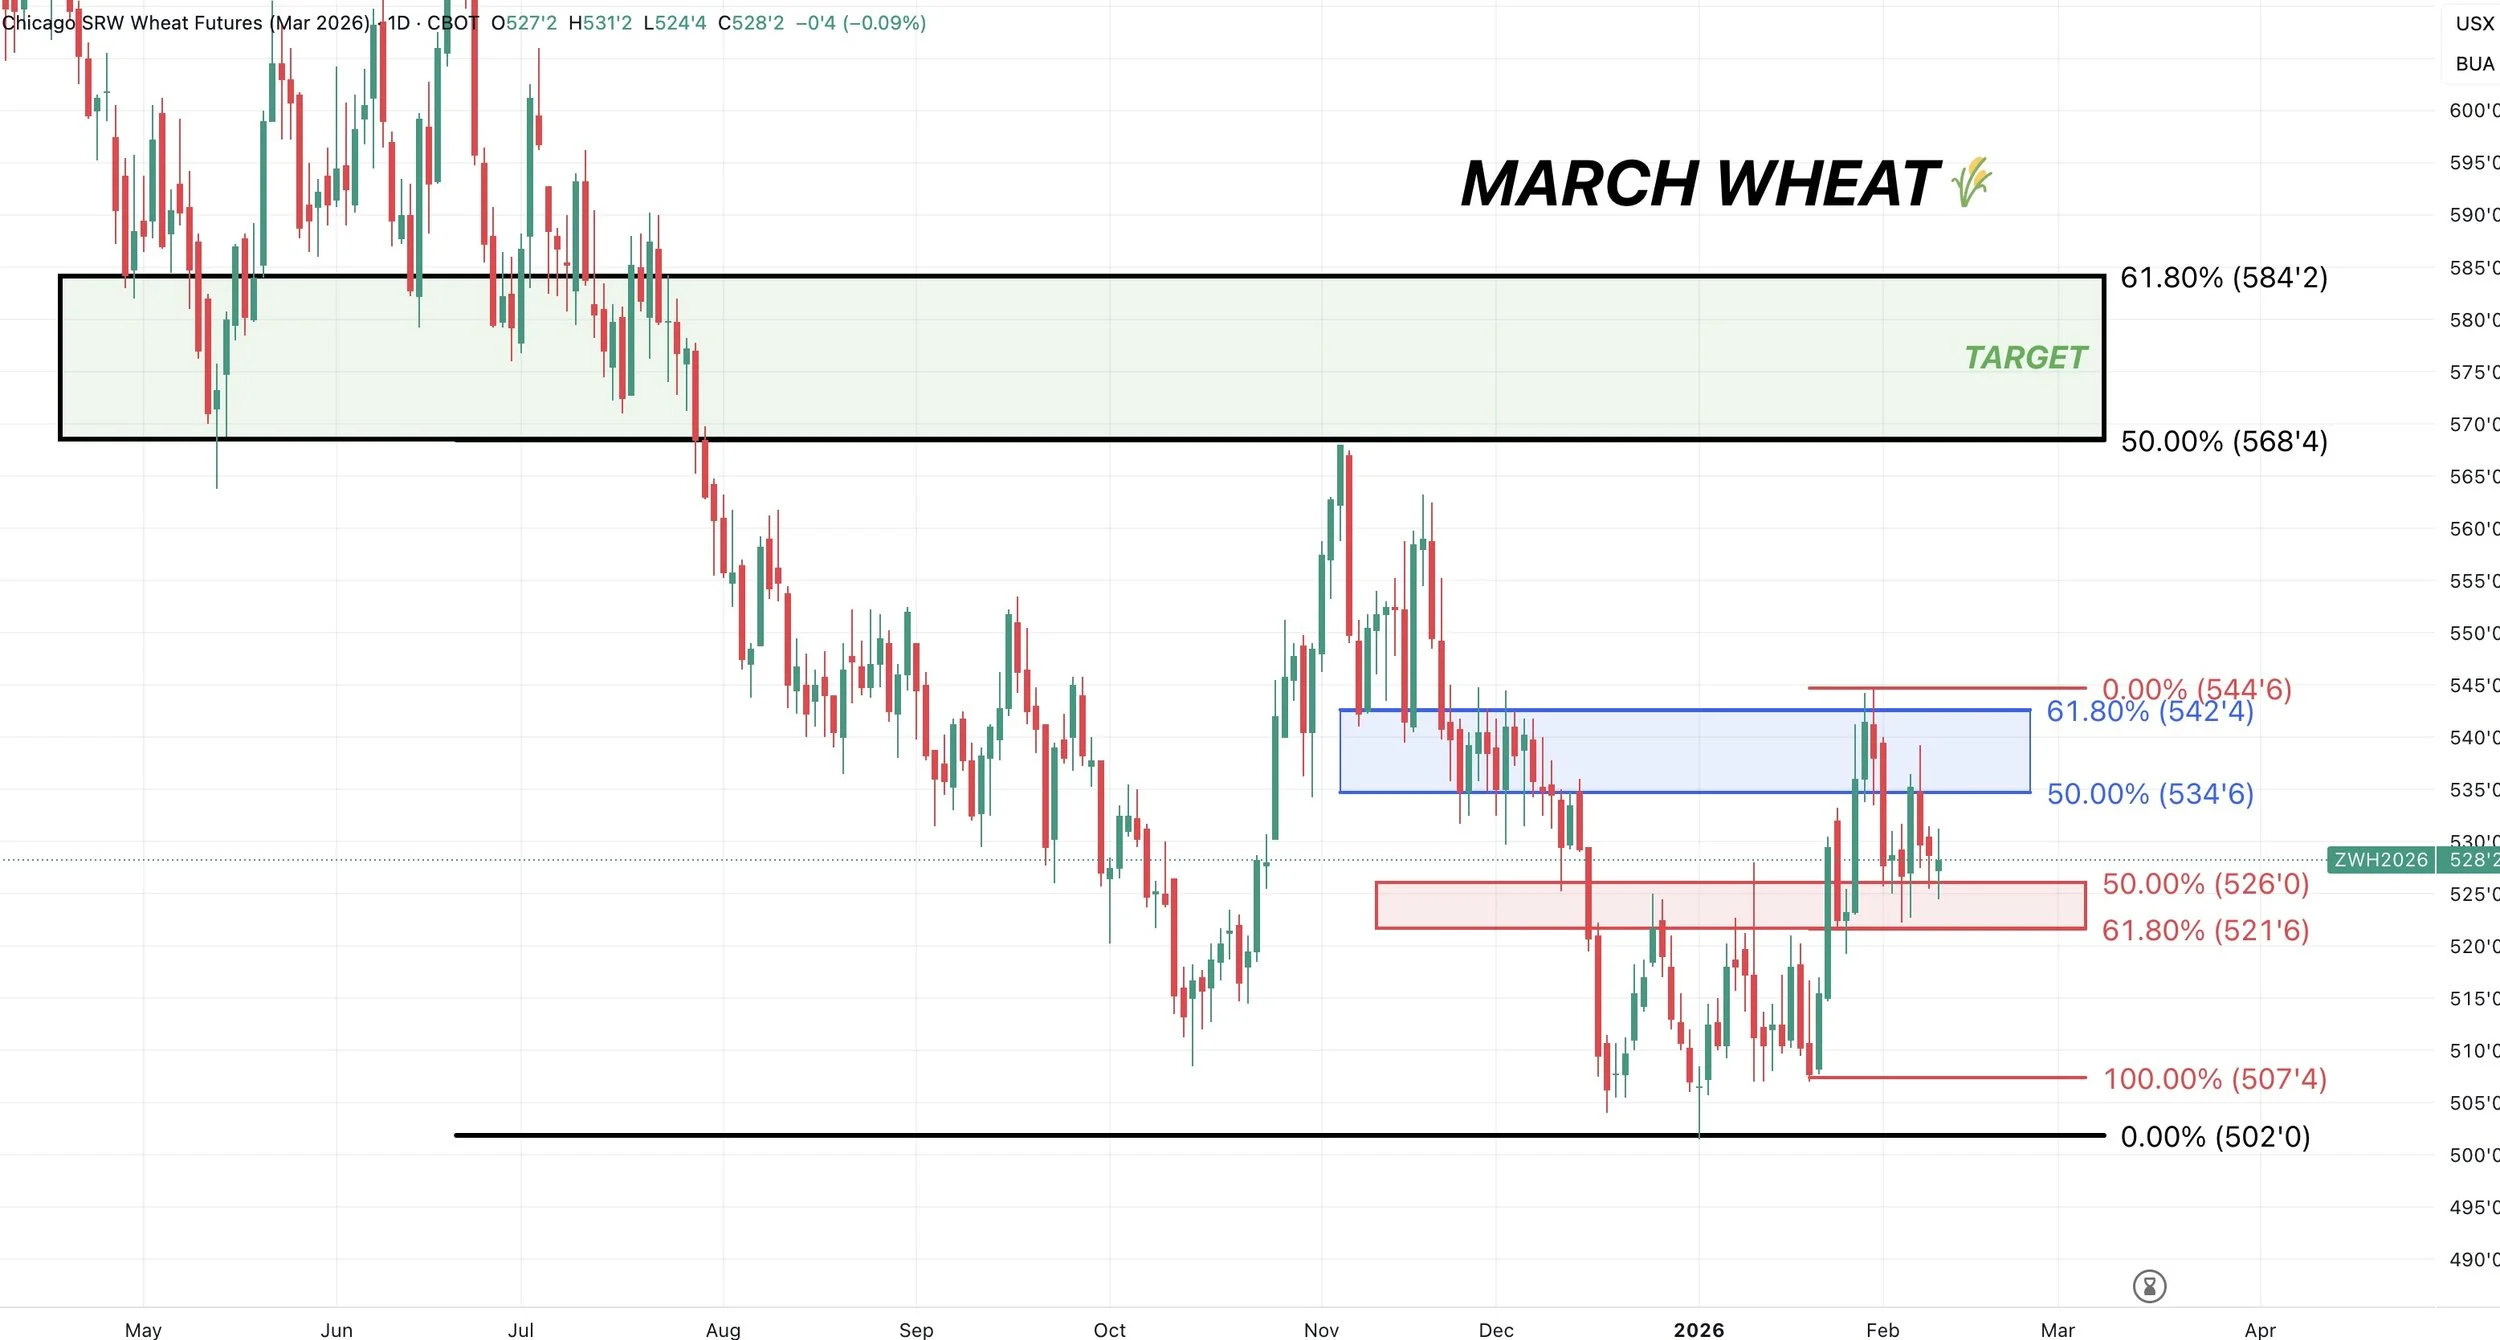
March Chicago:
We failed after clawing back 61.8% of the June highs.
Break above that level and we should see more upside.
On the downside, like KC, we are sitting at key support we would like to hold to keep the bias remaining higher.
The golden zone of the recent bounce, along with our old resistance.
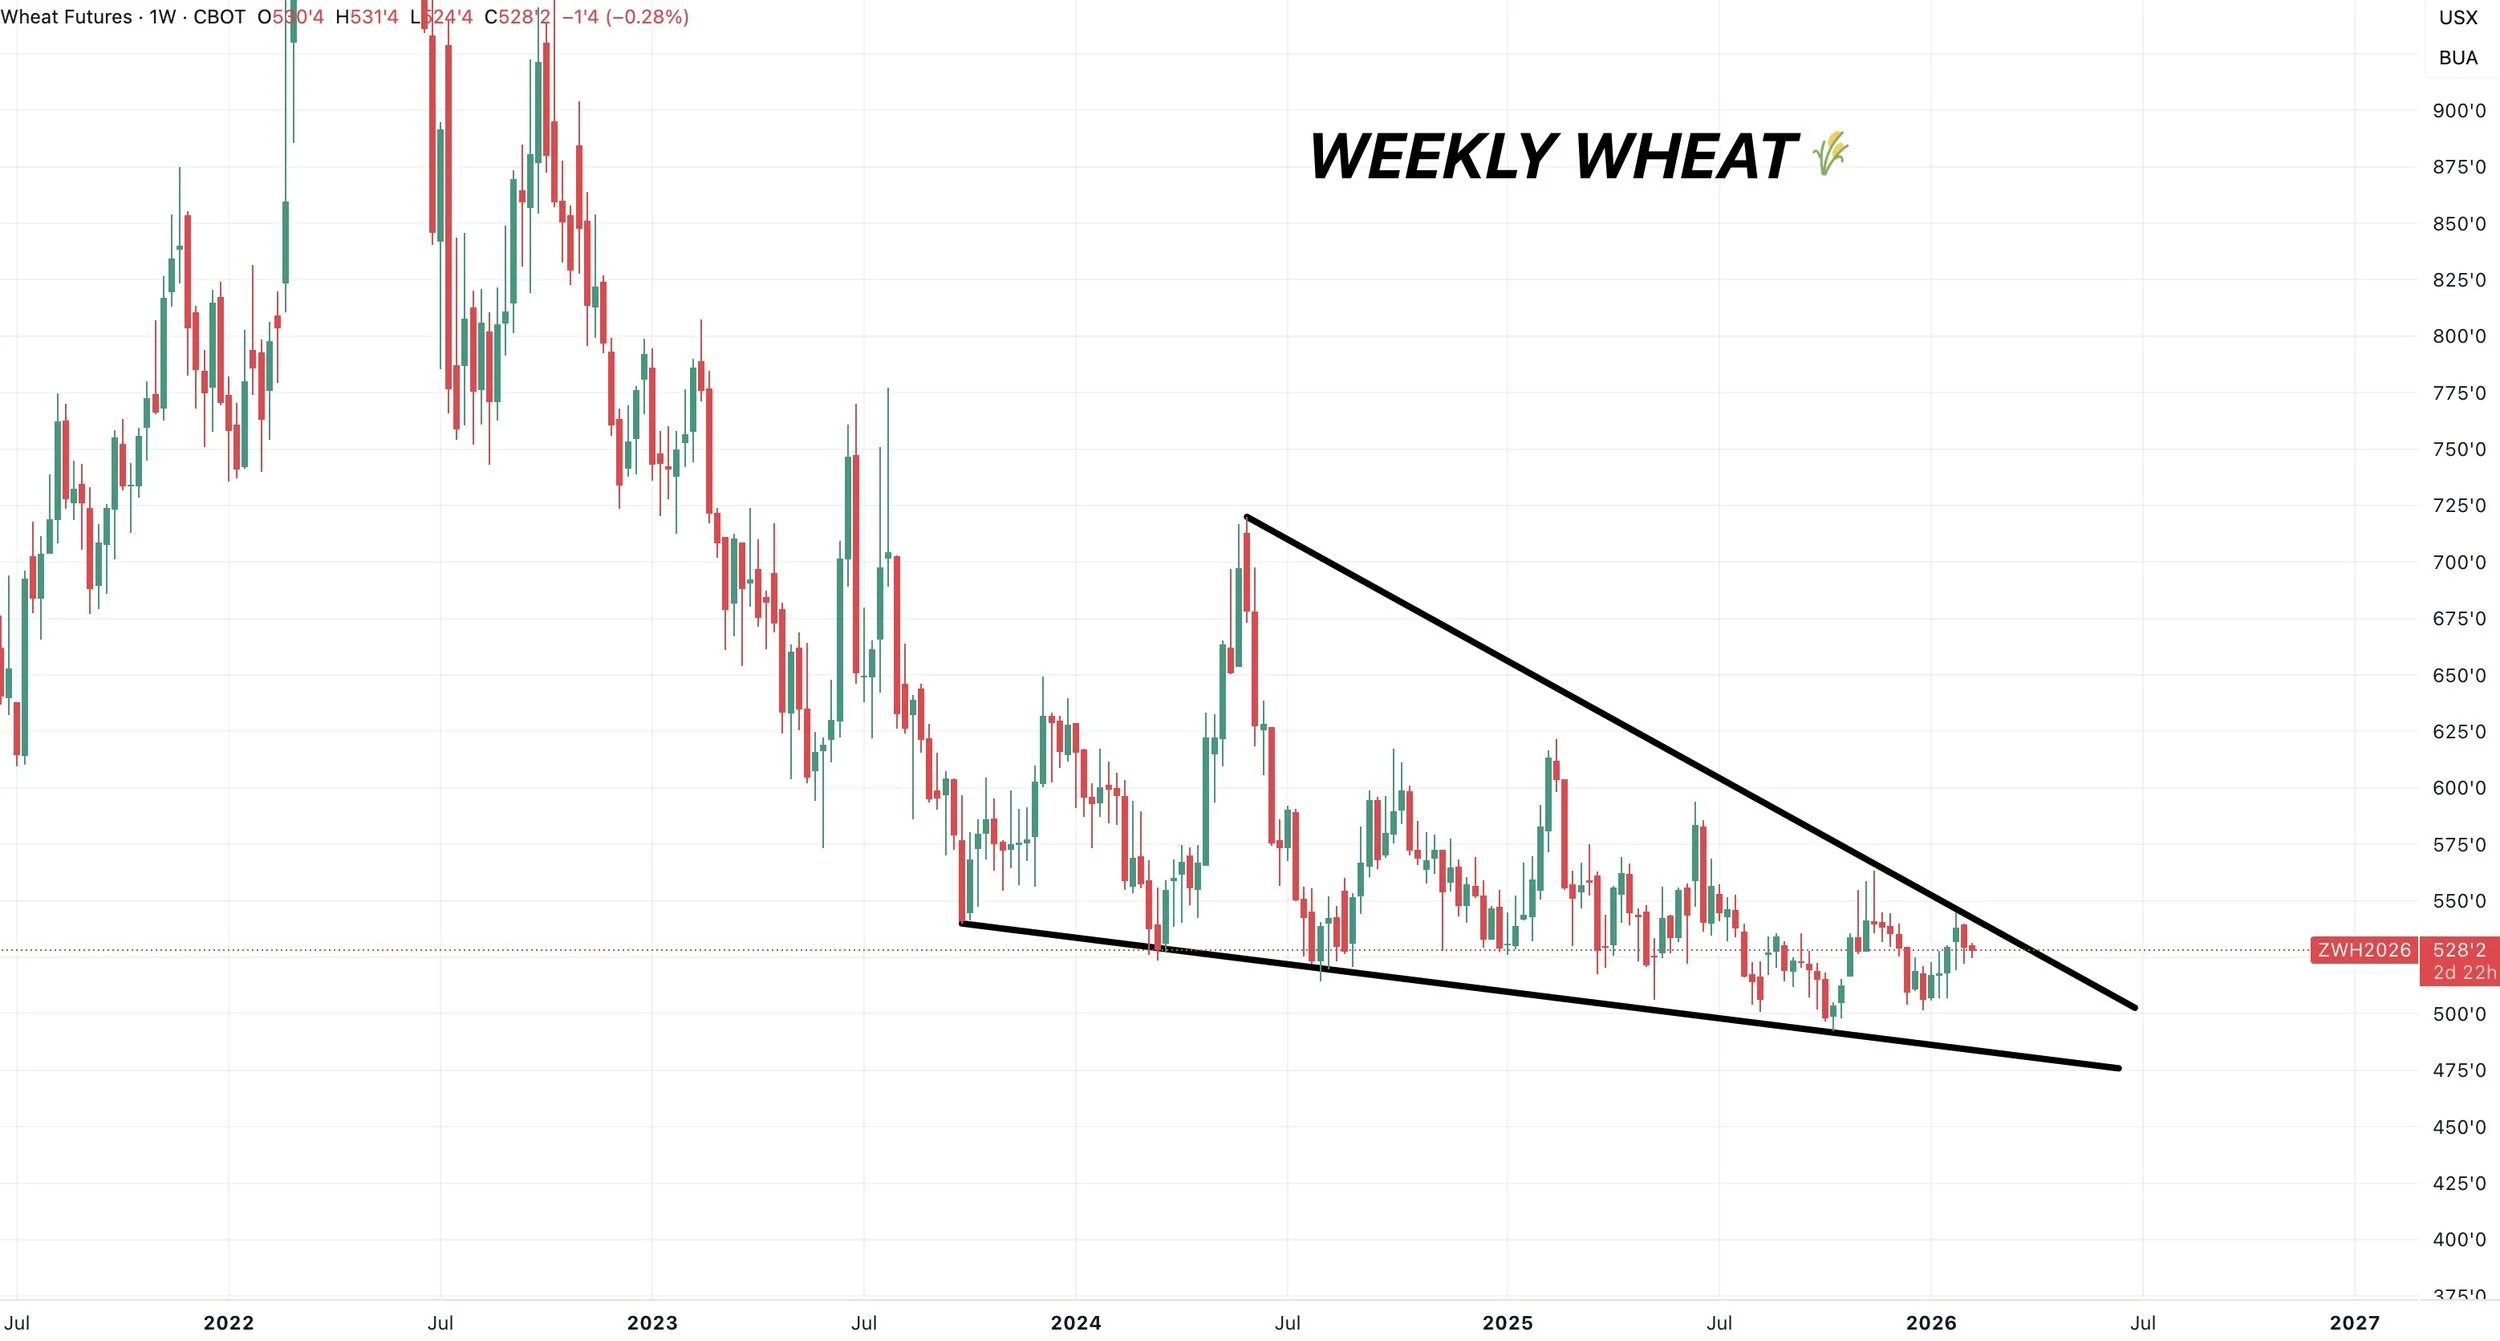
Weekly Wheat
Interesting chart here.
We've been coiling up in this wedge pattern for a few years.
Something to watch longer term.
Cattle
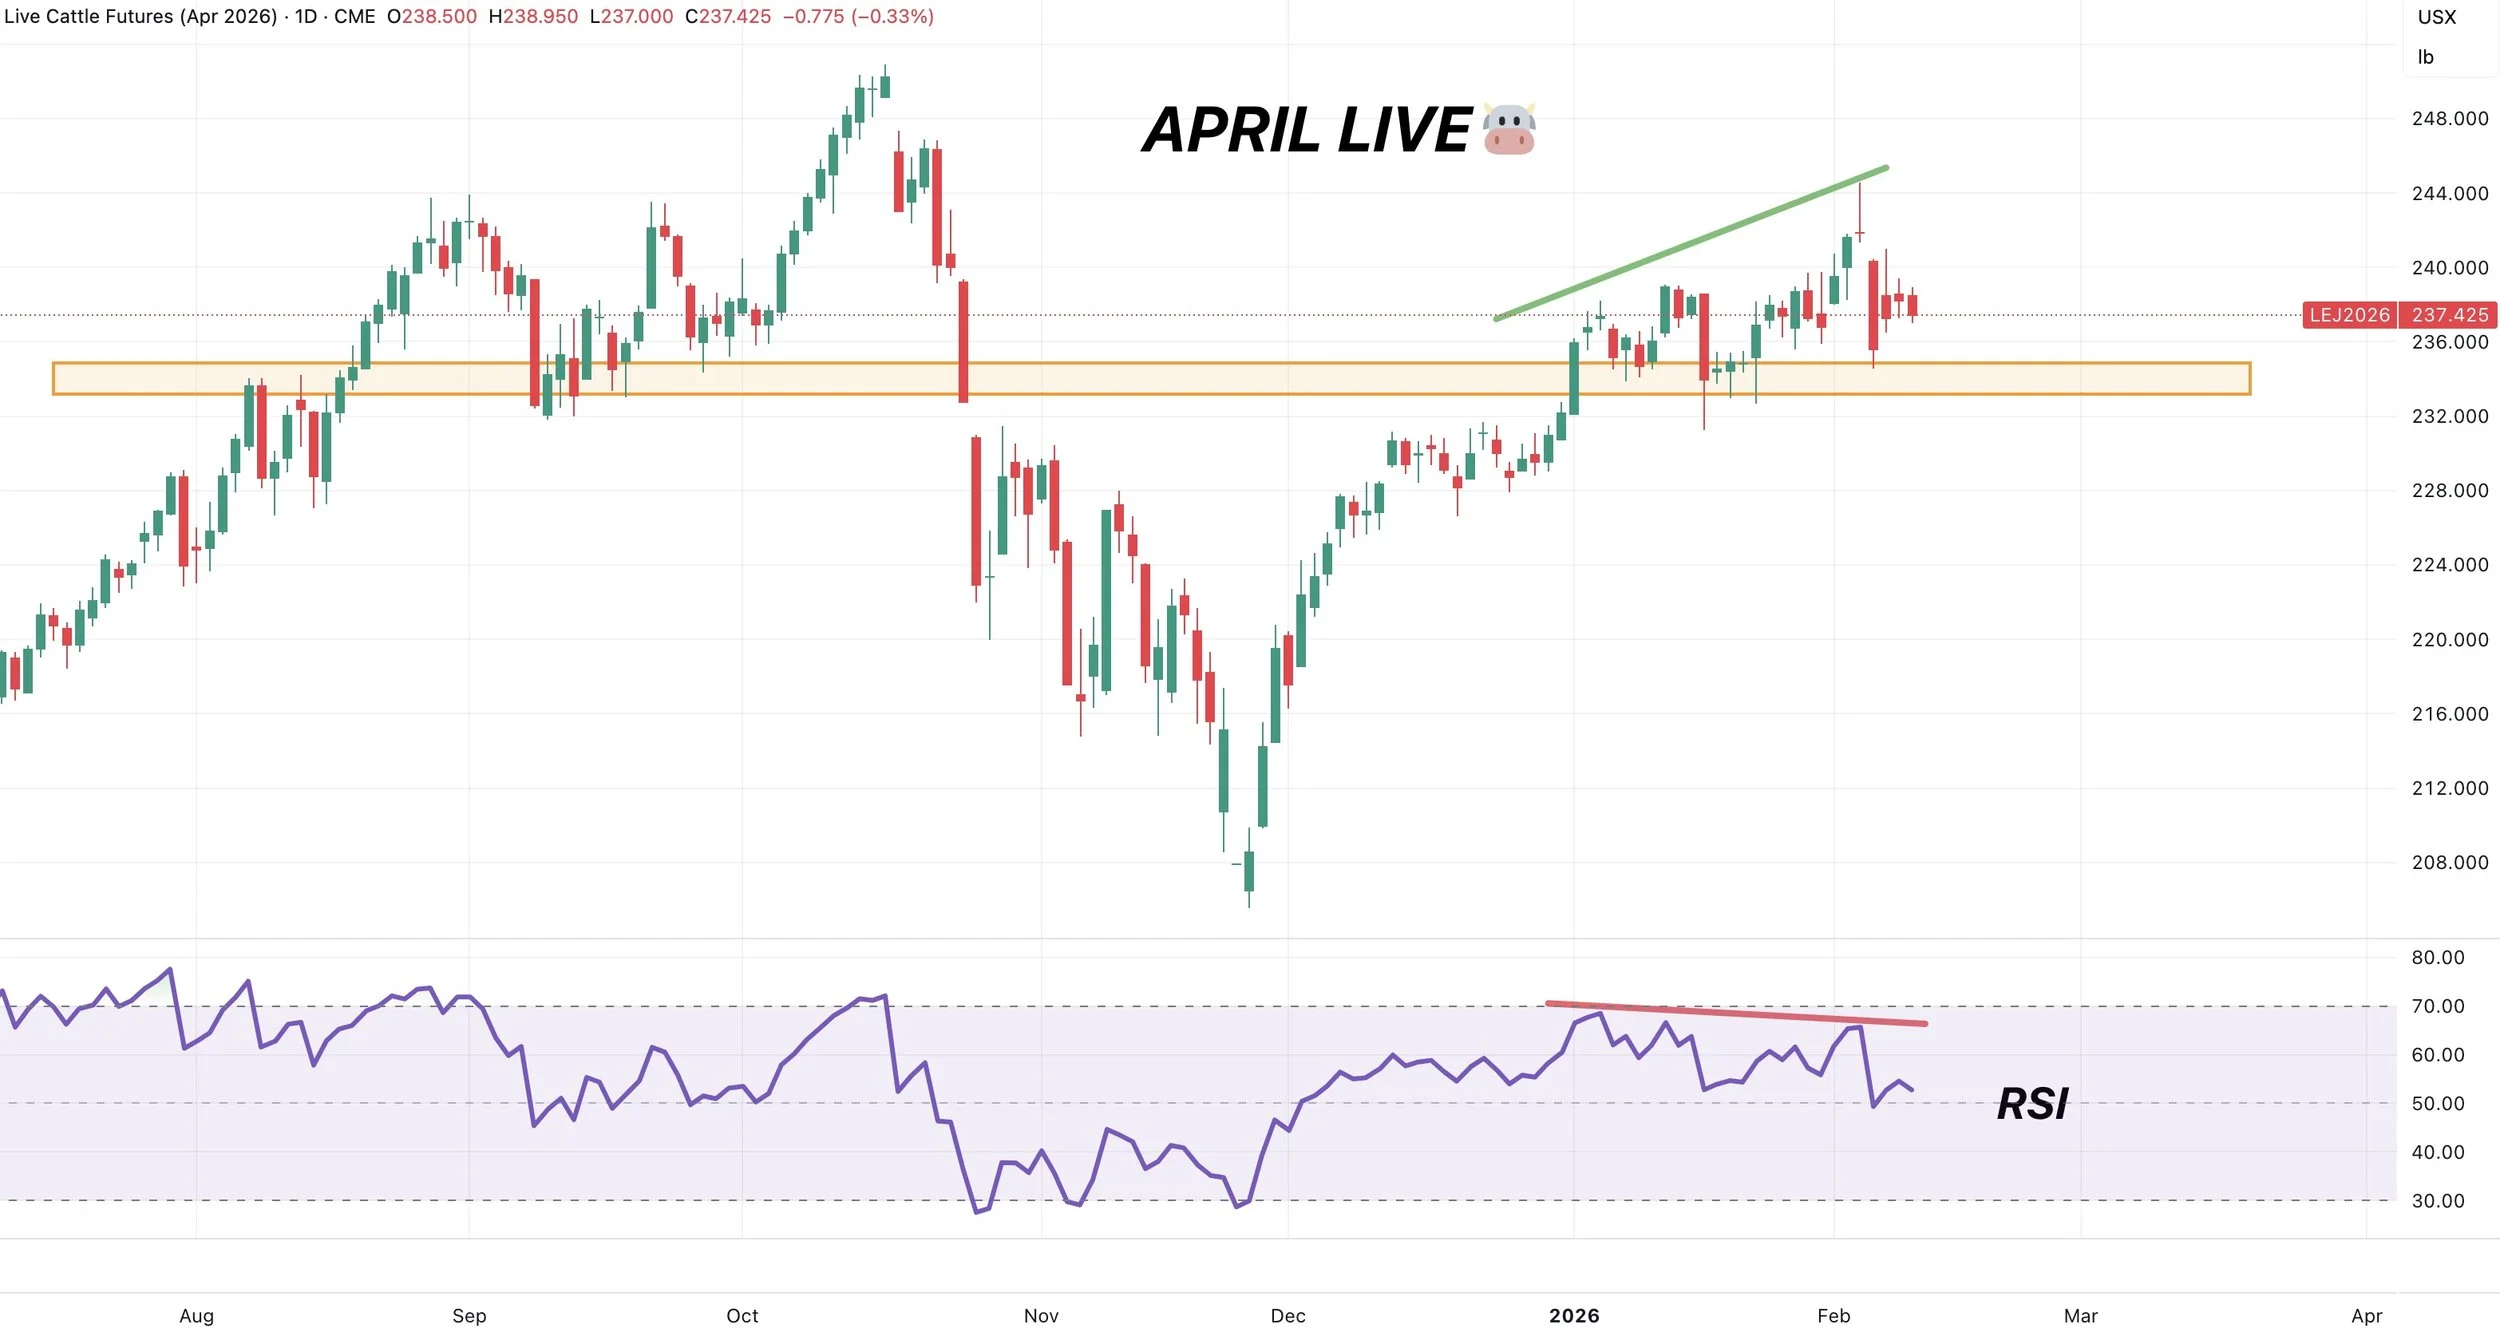
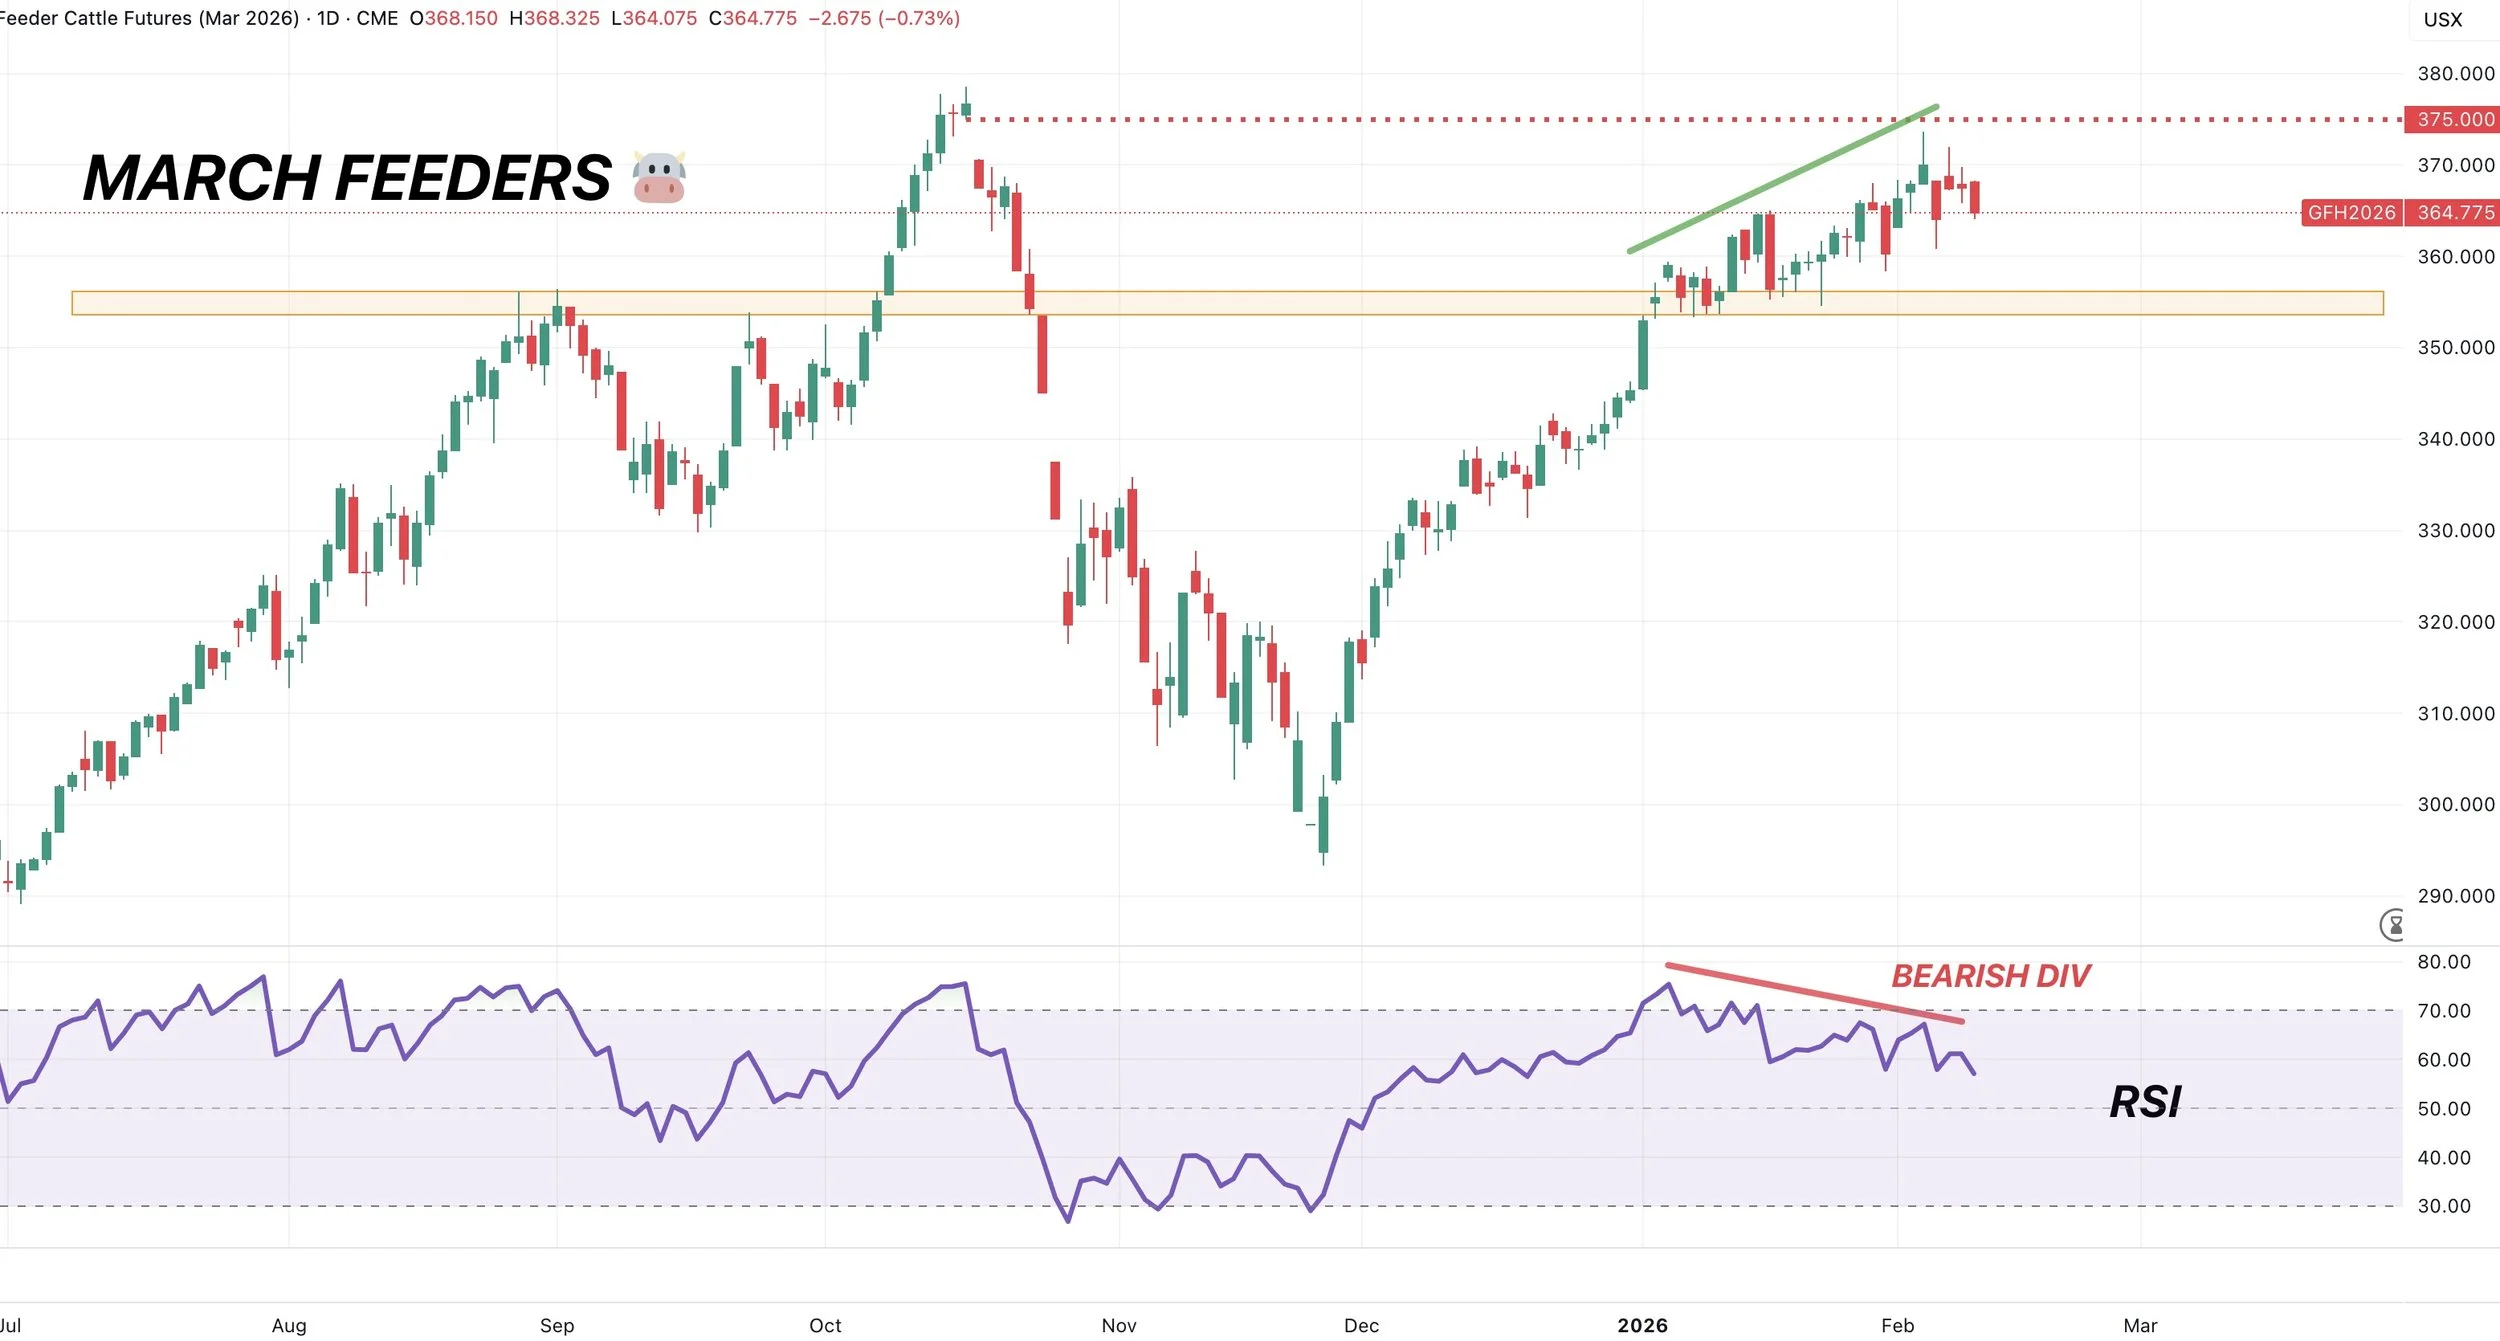
There is still a ton of headline risk in this market, and the charts are showing some reasons to be cautious, like we've been talking about the last few weeks.
Both April live cattle and March feeders are showing very definitive, confirmed bearish divergence on the RSI.
This is a warning sign that momentum is starting to get weak.
If we take out the local support boxes, it could spark a sizeable leg lower.
I don’t think it makes any sense to not have any downside coverage here knowing we are one headline away from seeing some downside pressure.
April Live
March Feeders
Past Sell or Protection Signals
Feb 6th: 🌽 🌱
Corn & soybean sell signal & hedge alert.
Feb 4th: 🌱
Soybean sell signal & hedge alert.
Dec 11th: 🐮
Cattle sell signal & hedge alert.
Dec 5th: 🐮
Cattle sell signal & hedge alert.
Nov 17th: 🌱
Soybean sell signal & hedge alert.
Nov 13th: 🌽 🌱
Managing risk in corn & beans ahead of USDA report.
Oct 28th: 🌽
Corn sell signal & hedge alert.
Oct 27th: 🌱
Soybean sell signal & hedge alert.
Oct 13th: 🐮
Cattle sell signal & hedge alert.
Aug 22nd: 🌱
Soybean sell signal & hedge alert.
July 31st: 🐮
Cattle sell signal & hedge alert.
July 10th: 🐮
Cattle sell signal & hedge alert.
CLICK HERE TO VIEW
June 5th: 🐮
Cattle sell signal & hedge alert.
June 2nd: 🌾
MPLS wheat sell signal.
April 10th: 🌽
Old crop corn sell signal.
March 19th: 🐮
Cattle hedge & sell signal.
Feb 18th: 🌽 🌾
Old crop KC wheat & old crop corn signal.
Jan 23rd: 🌽 🌱
Corn & beans old crop sell signal.
CLICK HERE TO VIEW
Jan 15th: 🌽 🌱
Corn & beans hedge alert/sell signal.
Jan 2nd: 🐮
Cattle hedge alert at new all-time highs & target.
Dec 11th: 🌽
Corn sell signal at $4.51 200-day MA
CLICK HERE TO VIEW
Oct 2nd: 🌾
Wheat sell signal at $6.12 target
Sep 30th: 🌽
Corn protection signal at $4.23-26
Sep 27th: 🌱
Soybean sell & protection signal at $10.65
Sep 13th: 🌾
Wheat sell signal at $5.98
May 22nd: 🌾
Wheat sell signal when wheat traded +$7.00
Want to Talk?
Our phones are open 24/7 for you guys if you ever need anything or want to discuss your operation.
Hedge Account
Interested in a hedge account? Use the link below to set up an account or shoot Jeremey a call at (605)295-3100.