
HOW LOW CAN GRAINS GO?
MARKET UPDATE
You can scroll to read the usual update as well. As the written version is the exact same as the video.
Timestamps for video:
News: 0:00min
Corn: 2:30min
Beans: 5:45min
Wheat: 11:15min
Cattle: 13:00min
Want to talk about your situation?
(605)250-3863
Futures Prices Close
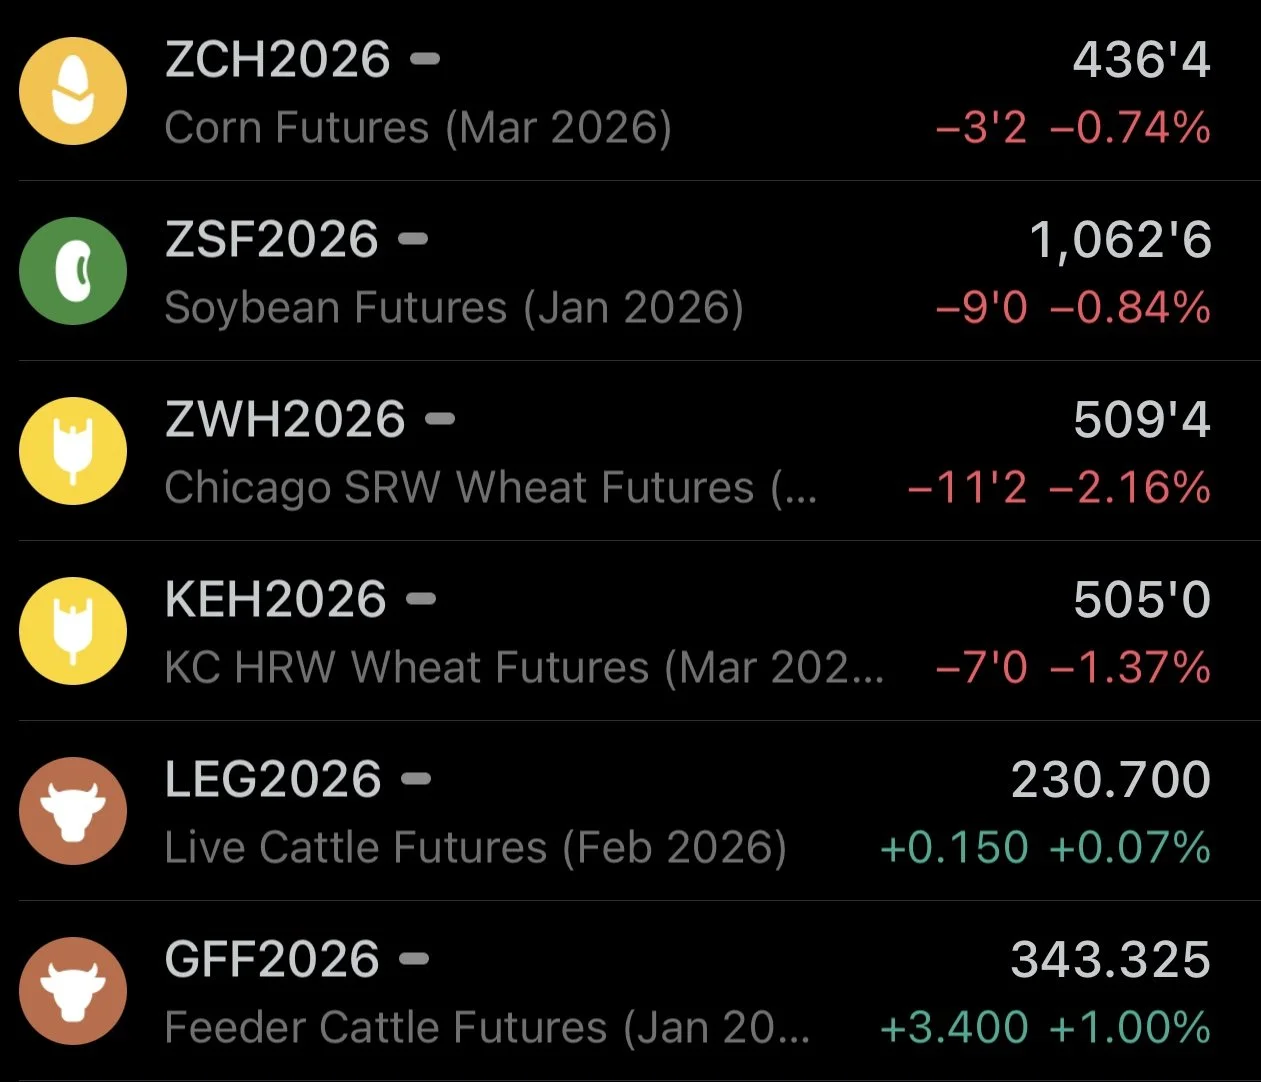
Overview
Grains hammered across the board today.
While soybeans are now over -$1.00 off their November highs and Chicago wheat posted a round of fresh new contract lows today.
Meanwhile, the corn market has managed to hold up better in comparison.
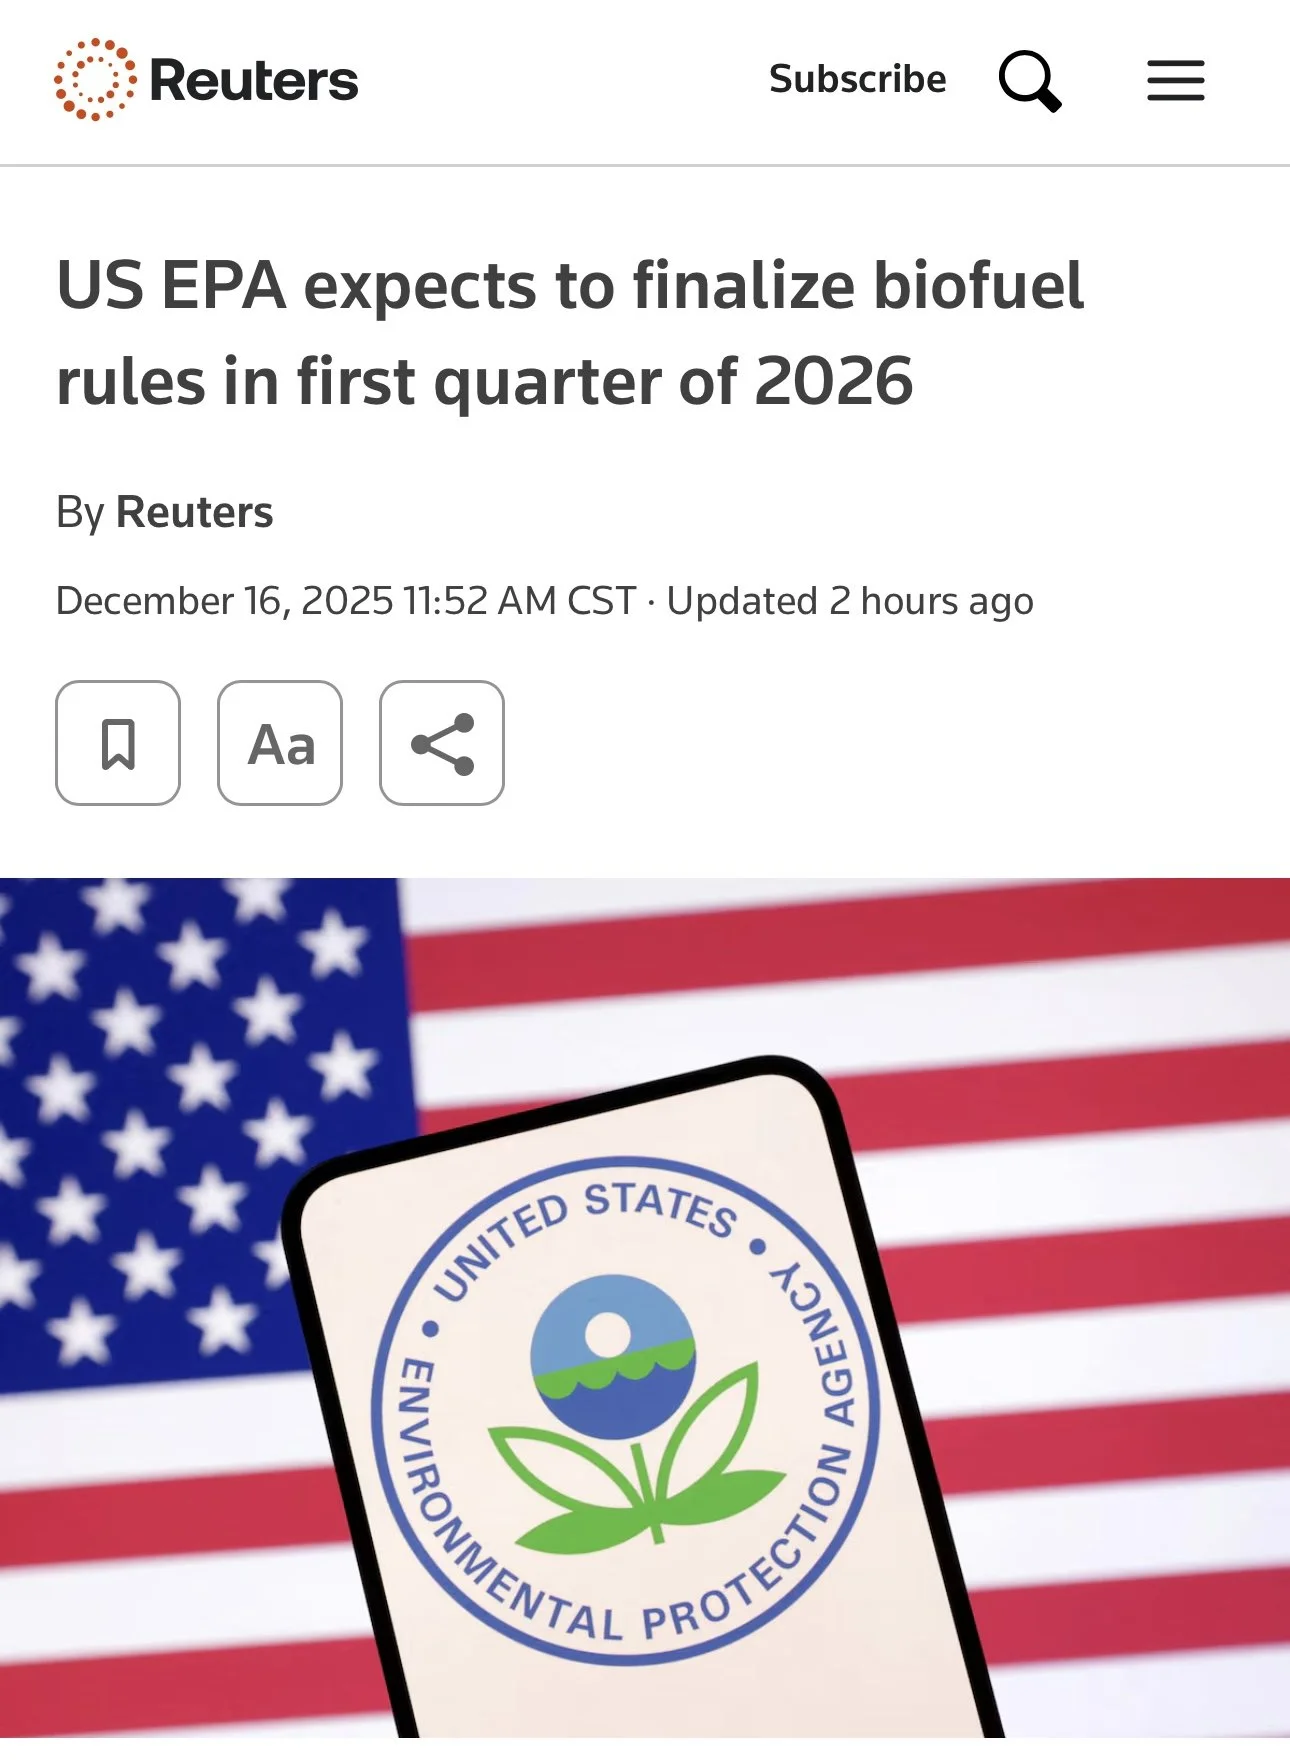
EPA Kicks The Can
The EPA kicked the can down the road.
This added even more negative pressure to soybeans and soybean oil.
As the EPA offically confirmed that the 2026 RVOs would not be released until Q1 of 2026. Which extends policy uncertainty heading into next year.
As a result, soybean oil has been falling hard.
Down over -9% in December and down over -2.50% today alone.
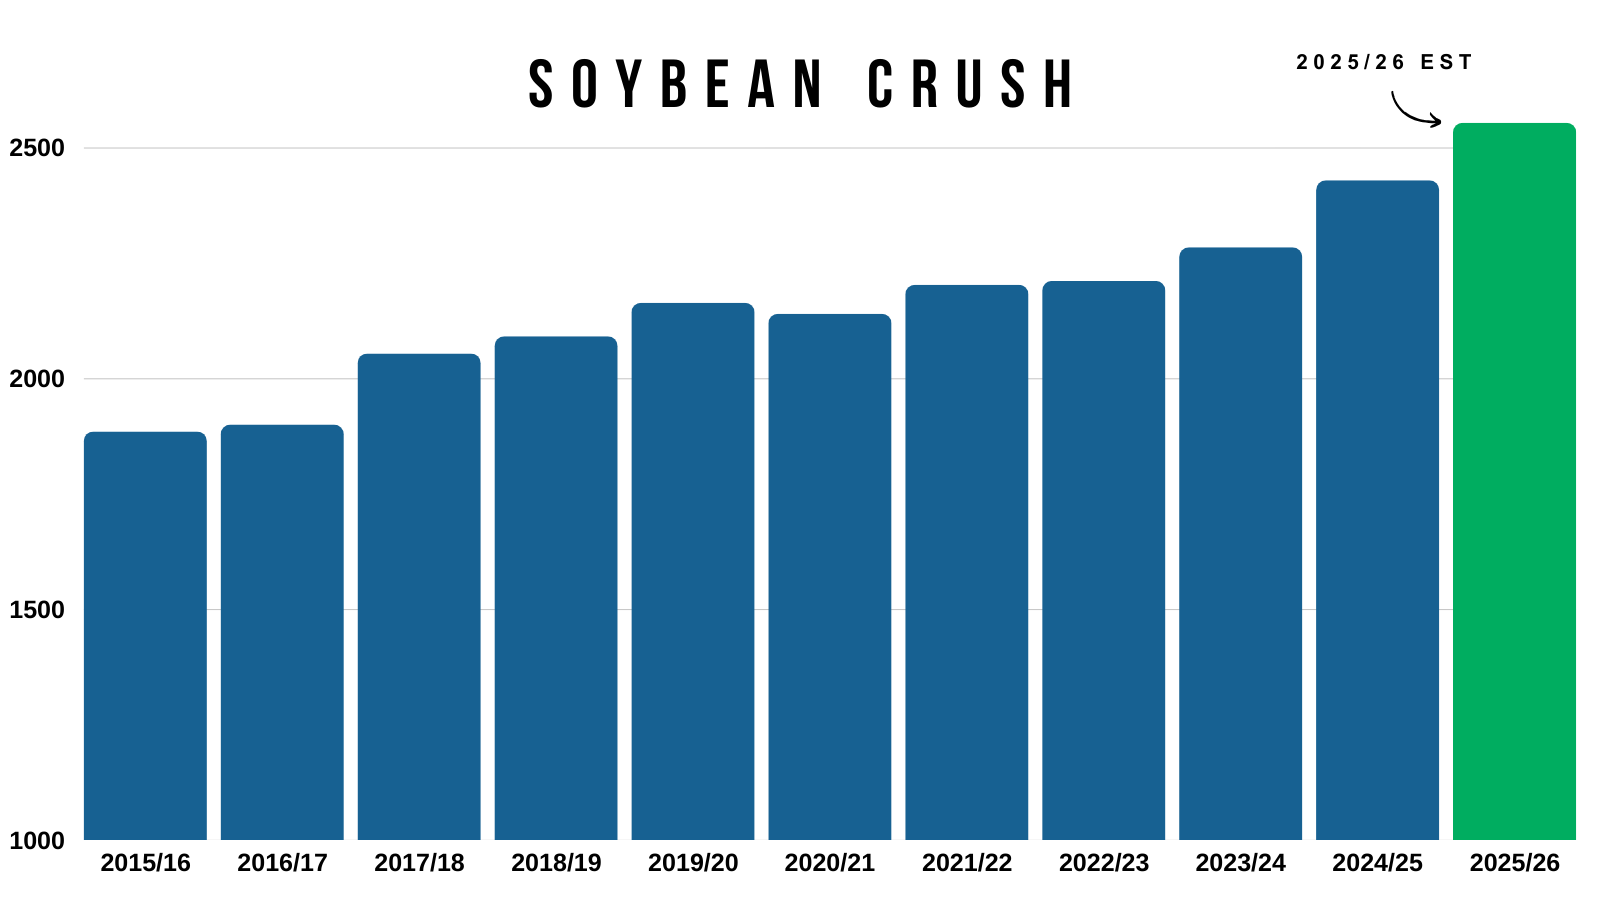
Record Crush
On the positive sign of things, crush demand continues to be solid for soybeans.
As the NOPA crush came in at a record for the month of November and was the 2nd highest month on record.
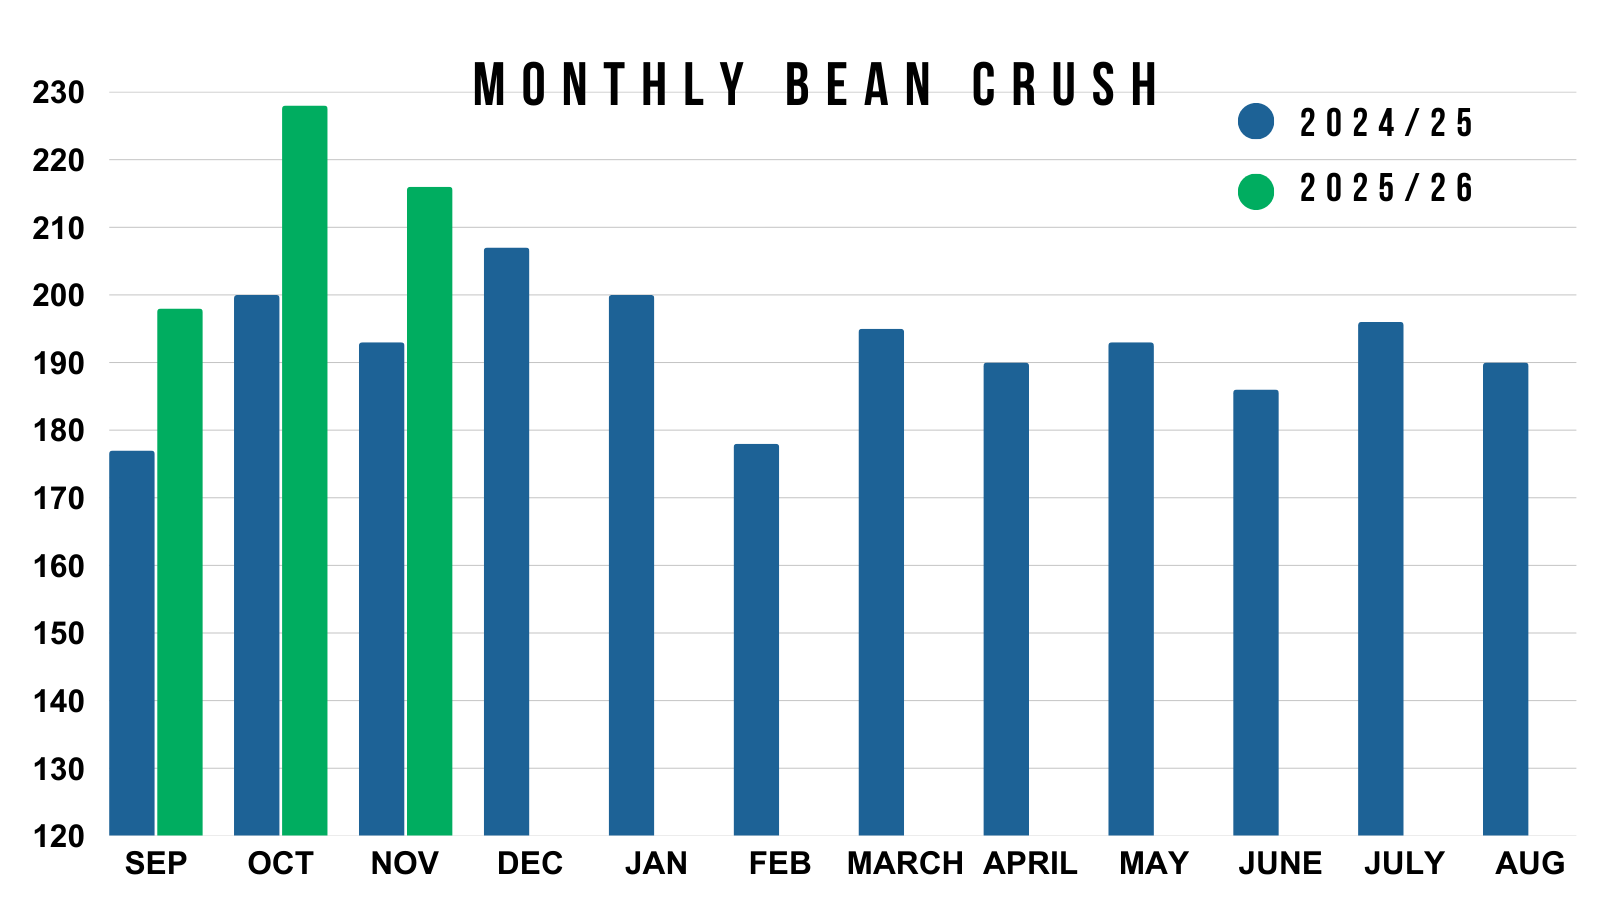
This is friendly, because crush demand actually does account for more total demand than our soybean exports do.
The difference has only increased the last few years.
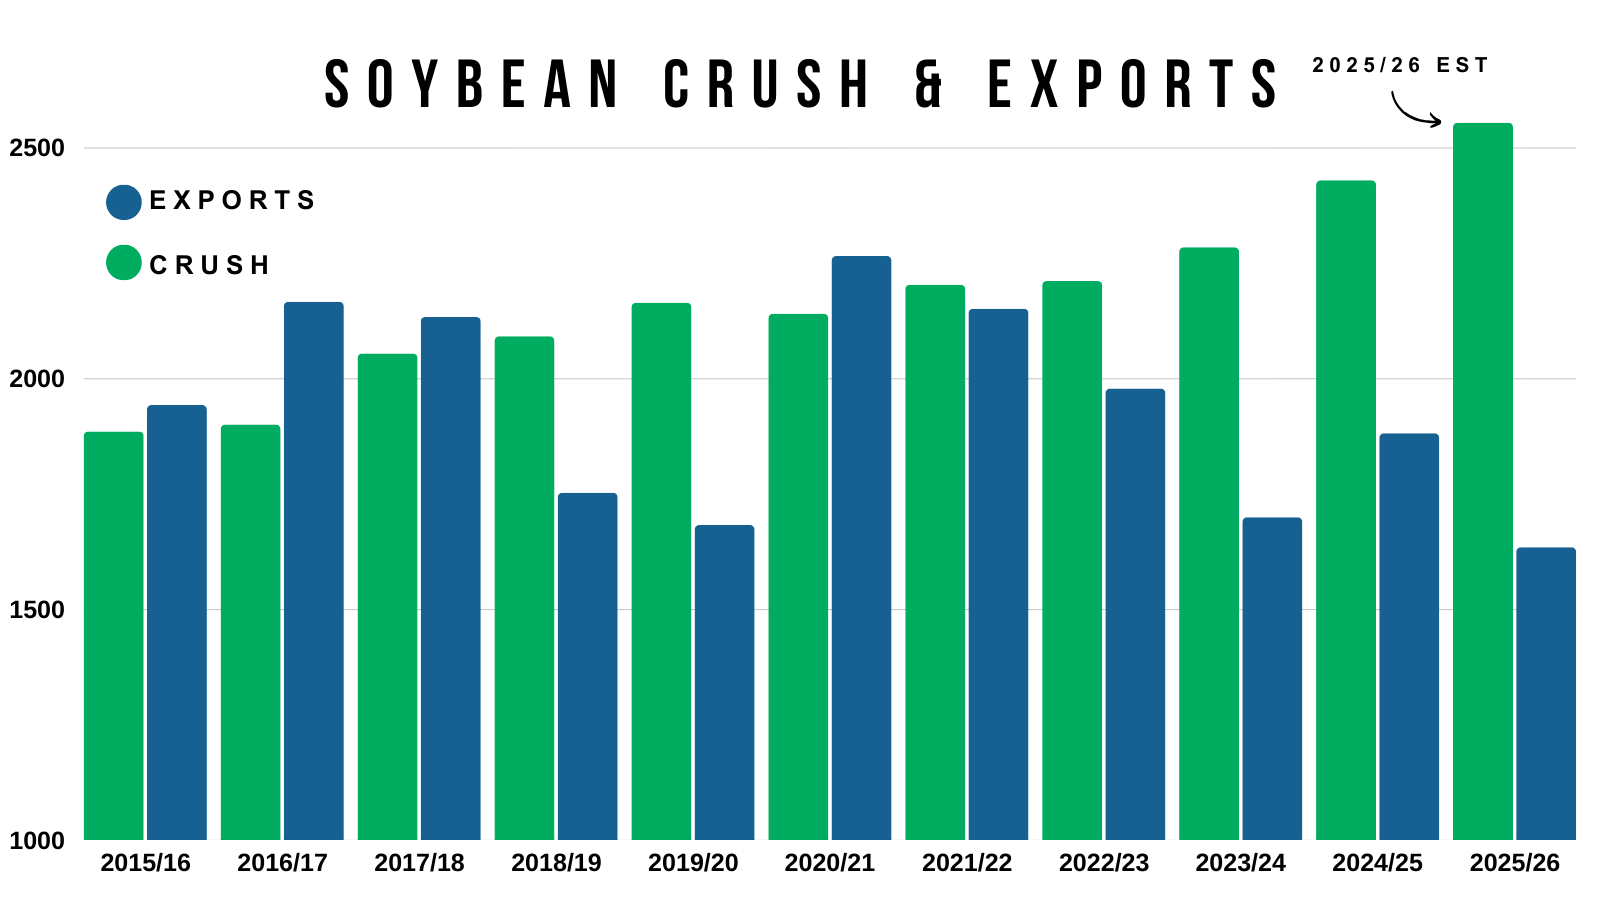
We are crushing more than ever before.
Exports - Corn Shines, Beans Still Struggle
Despite great crush demand, soybean exports still suck like we've discussed a dozen times.
Inspections (grain shipped) are still down -45% vs last year.
And the worst in over a decade.
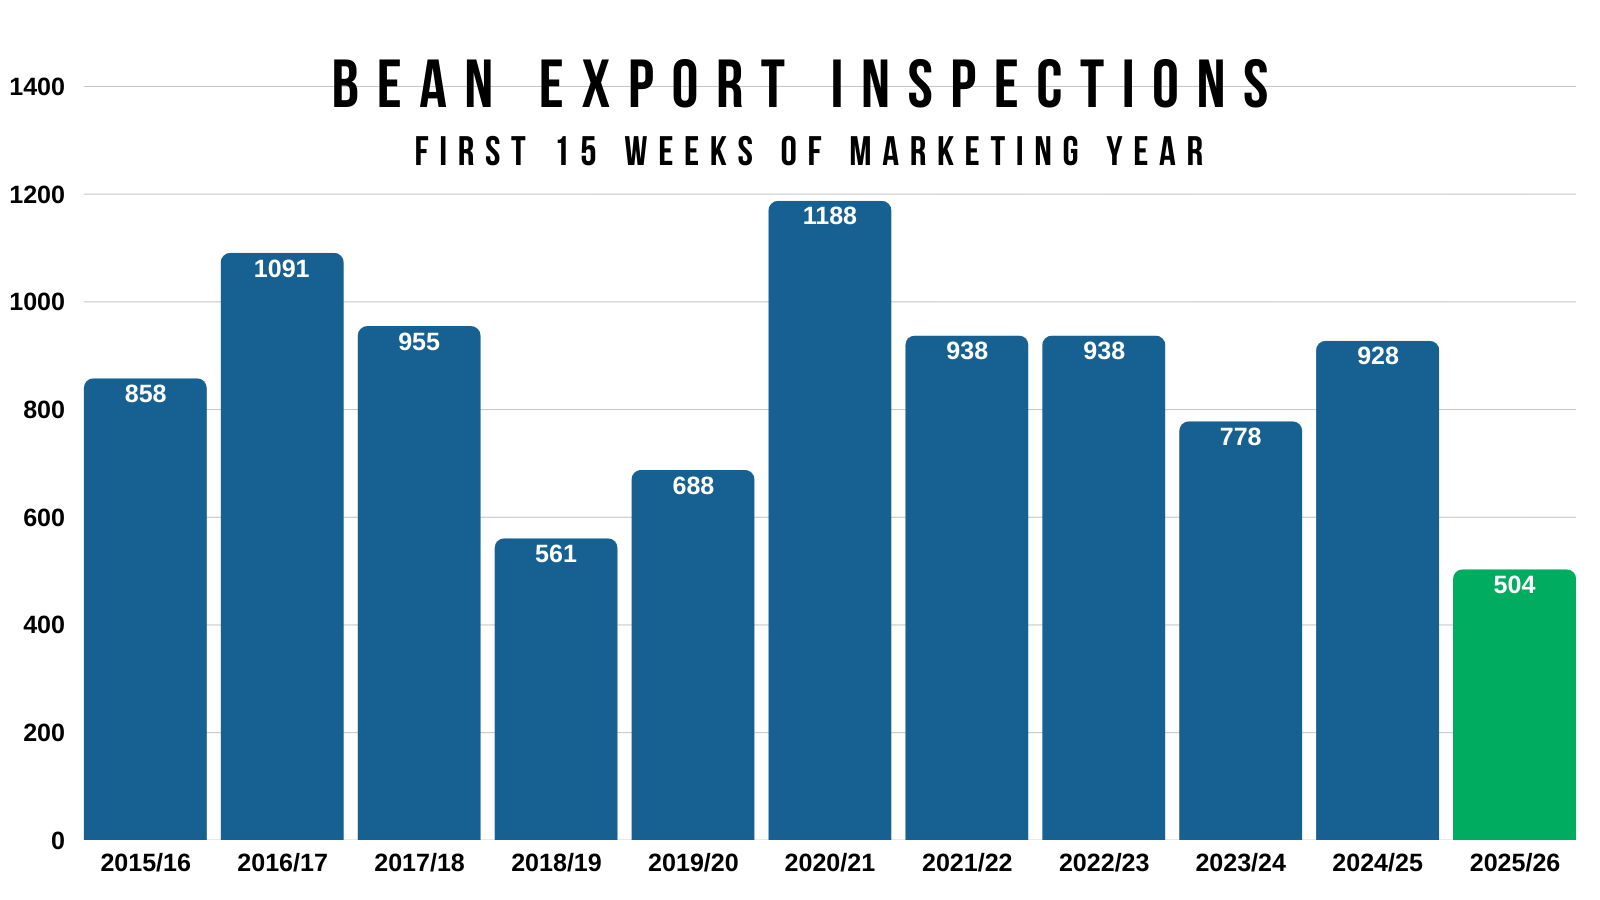
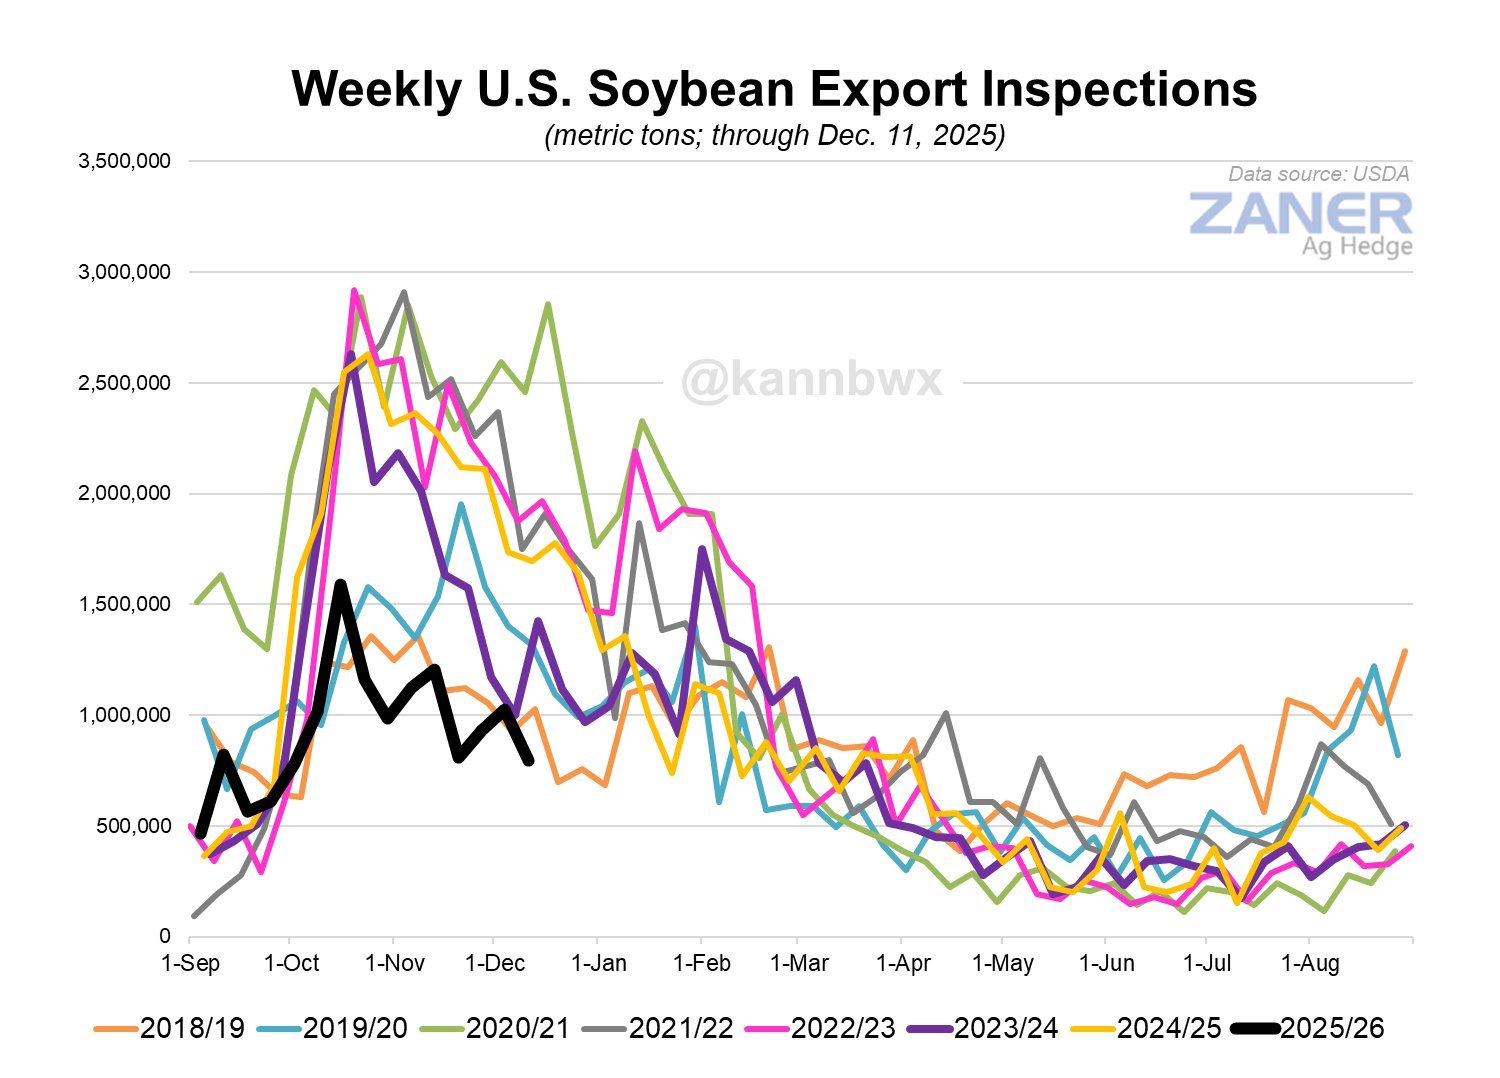
We are clearly past that typical "prime-time" shipping window where we usually ship the vast majority of our soybeans.
Here is a good visual from Karen Braun show casing that.
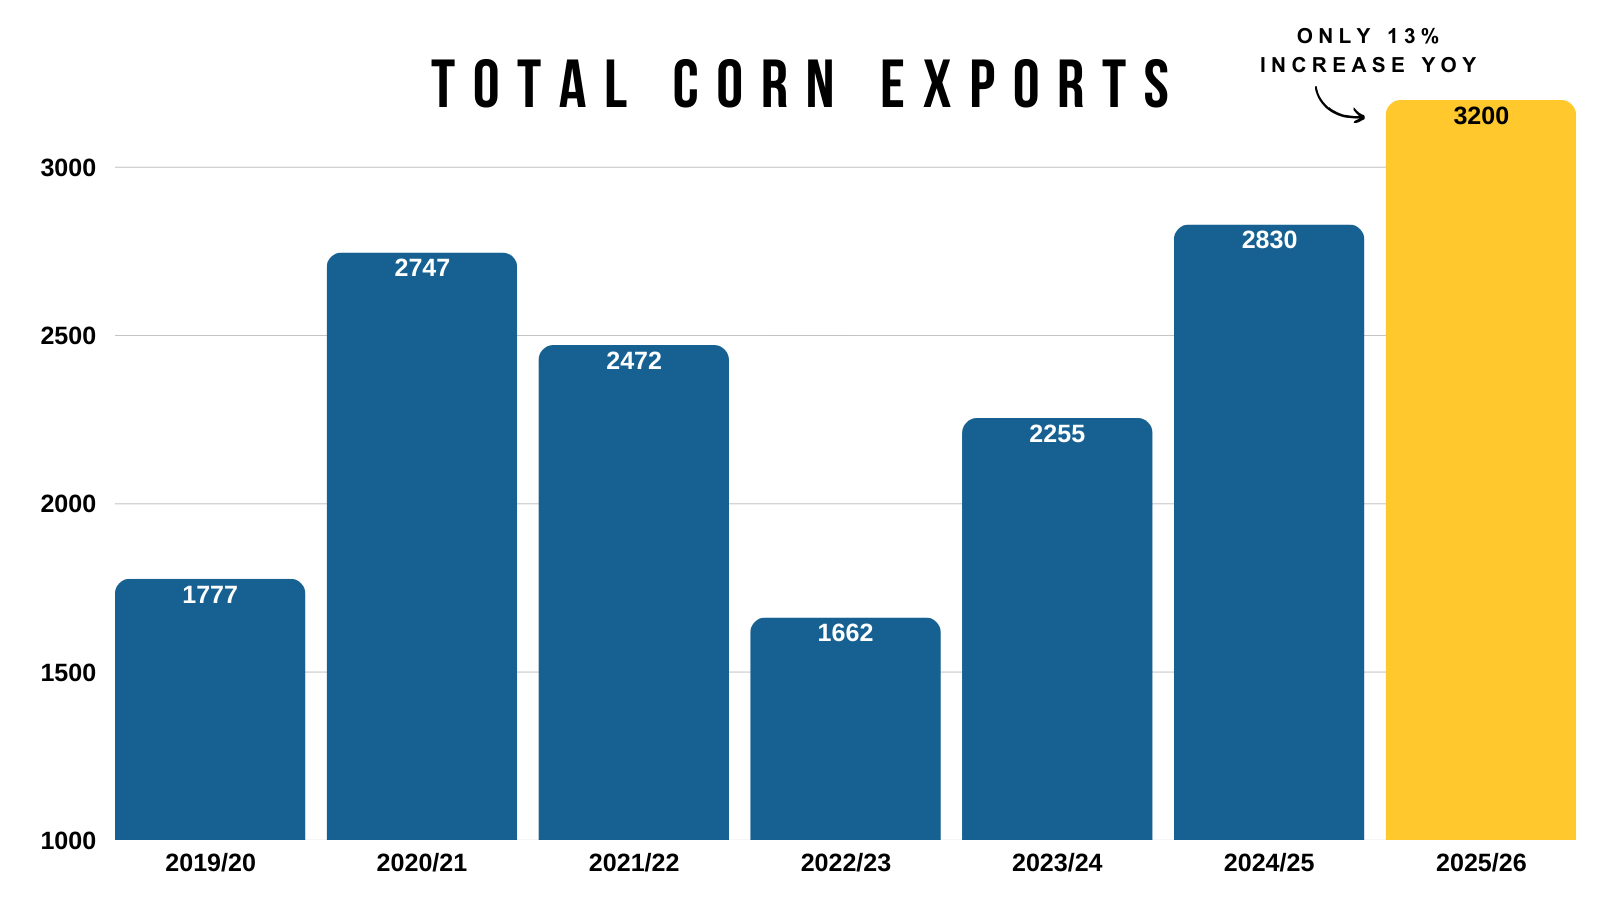
Corn on the other hand continues to be stout.
Corn inspections are up almost +70% vs last year.
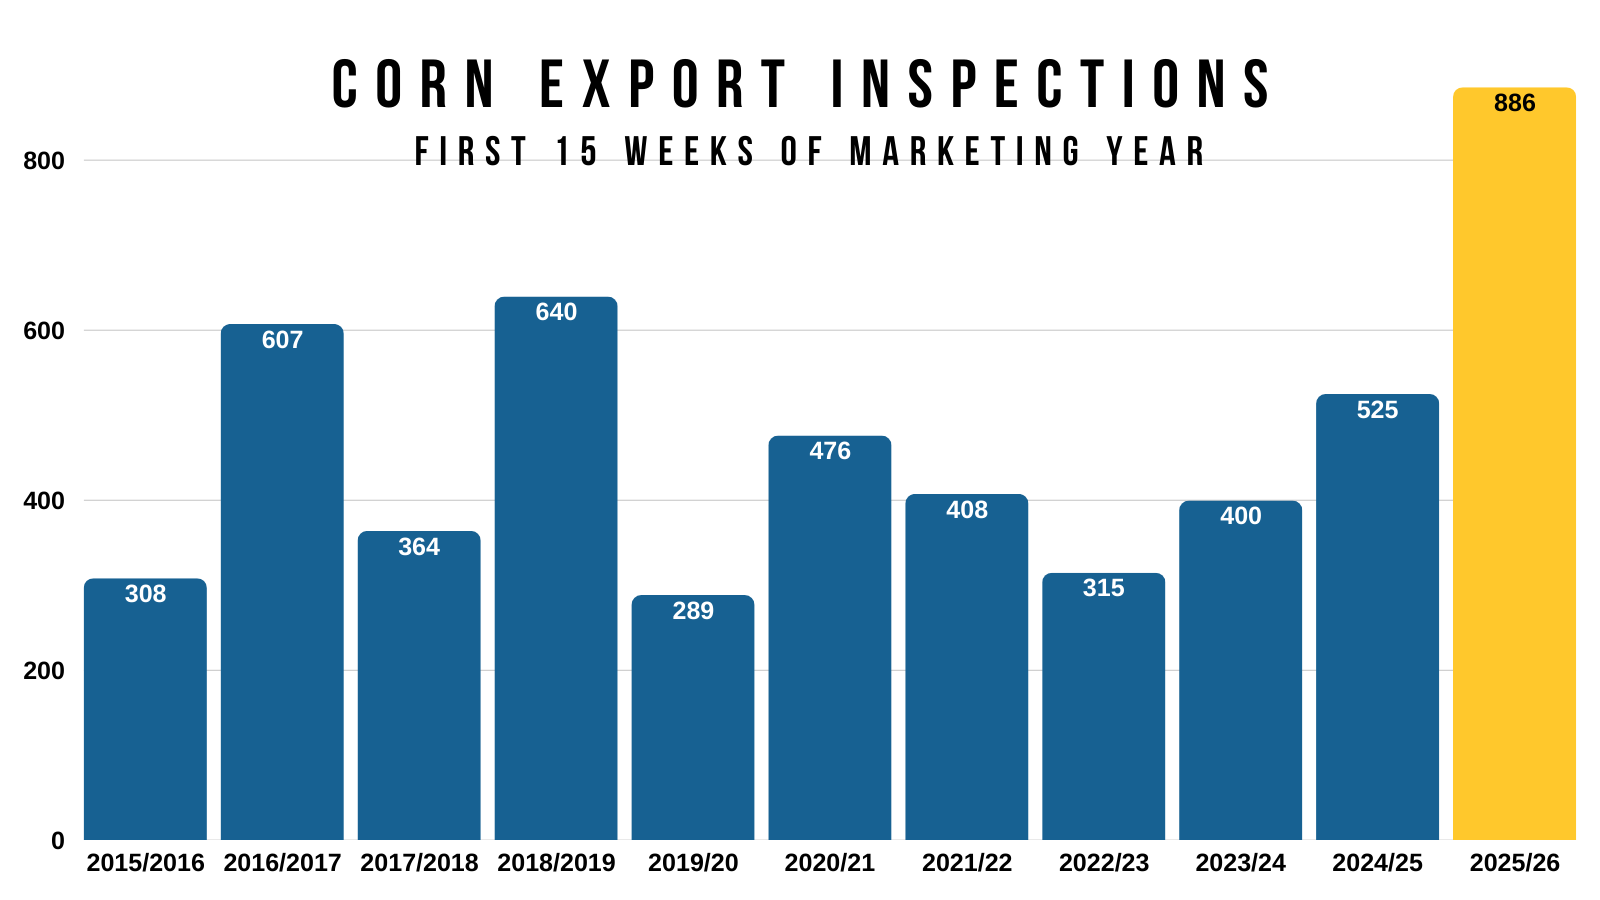
Last year featured a record book of exports for corn.
We are on pace to shatter that record.
The USDA currently only projects exports to be up +13% vs last year.
So you could very easily argue that they will need to continue to bump our export demand.
Some will argue,
"Oh but all of this demand is front loaded. There is no way we can keep up this demand."
Countless people argued that exact same thing last year. It didn’t slow down.
It's not like prices are at some high levels that are going to incentivize less export demand.
Karl Setzer from Consensus Ag said this:
People in Brazil are saying that they might not have corn to export until July. That leaves the US as the main source of corn.
Today's Main Takeaways
Corn
Fundamentals:
There isn’t a ton of fresh news surrounding the corn market.
Wheat continues to be a burdon.
We have a record crop that should limit our upside, but record demand should prevent this market from completely collapsing.
If corn goes lower, that would incentivize even more demand on top of the demand monster we've been creating.
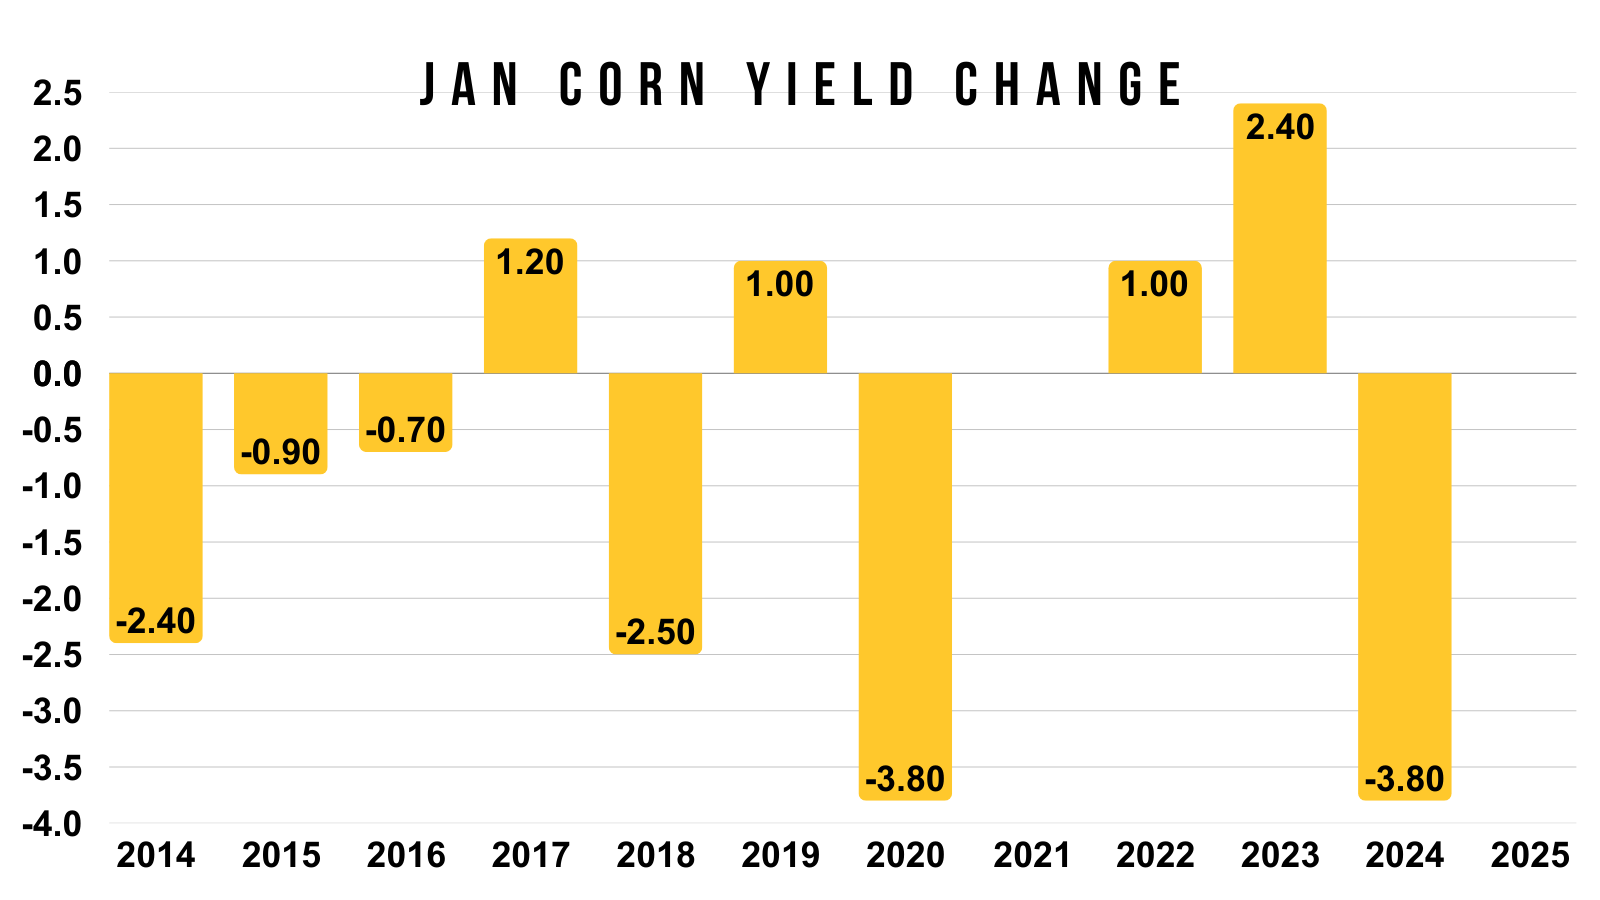
I think we should see a cut to yield in the Jan report.
Based on past reports, it would be reasonable to think we see yield drop down to that 182-183 range.
As the largest cut we've seen in the Jan report in recent memory was 2020 and 2024. Where they cut yield by -3.8 bpa.
It would take a bigger cut than we've ever seen to get a yield lower than that.
The issue is that almost everyone expects the USDA to offset that supply loss by cutting the feed and residual demand numbers.
Making it harder to paint a drastically bullish situation unless yield somehow came in closer to 180 or lower.
Regardless, this market can’t get too cheap without creating more demand.
The market's job is to put prices at levels that justify demand.
I think the record demand should help keep a floor under this market.
I've went over why corn's upside might be limited but our downside should also be limited several times. So I am not going to get too deep into it today.
Here are some updates where I talk about this in more detail:
Dec 9th - Comparing 25 vs 26:
Click Here to View
Dec 2nd: What Would Paint Bullish Corn Story?:
Click Here to View
For example, here is March-25 vs March-26 corn with our carryouts overlayed on top of prices.
So far we are following a very similar pattern.
However, it took a 1.54 billion bushel carryout for us to get over $5.00 last year.
Last year, we essentially just visited our spring highs.
I could see us do that again, which would put us in that $4.70 to $4.80 range.
But for now, +$5.00 doesn’t feel justified for now.
Because the situation today, is not as friendly as it was last year due to the record acres.
Things can always change. We can run into a weather scare. The USDA could surprise us. China could buy corn. But for now, based on what we know, that is why I view the upside as somewhat limited.
Carryouts on the chart:
Nov 2024: 1.95
Nov 2025: 2.15
Dec 2024: 1.74
Dec 2025: 2.03
Jan 2025: 1.54
Jan 2026: ?

Technicals:
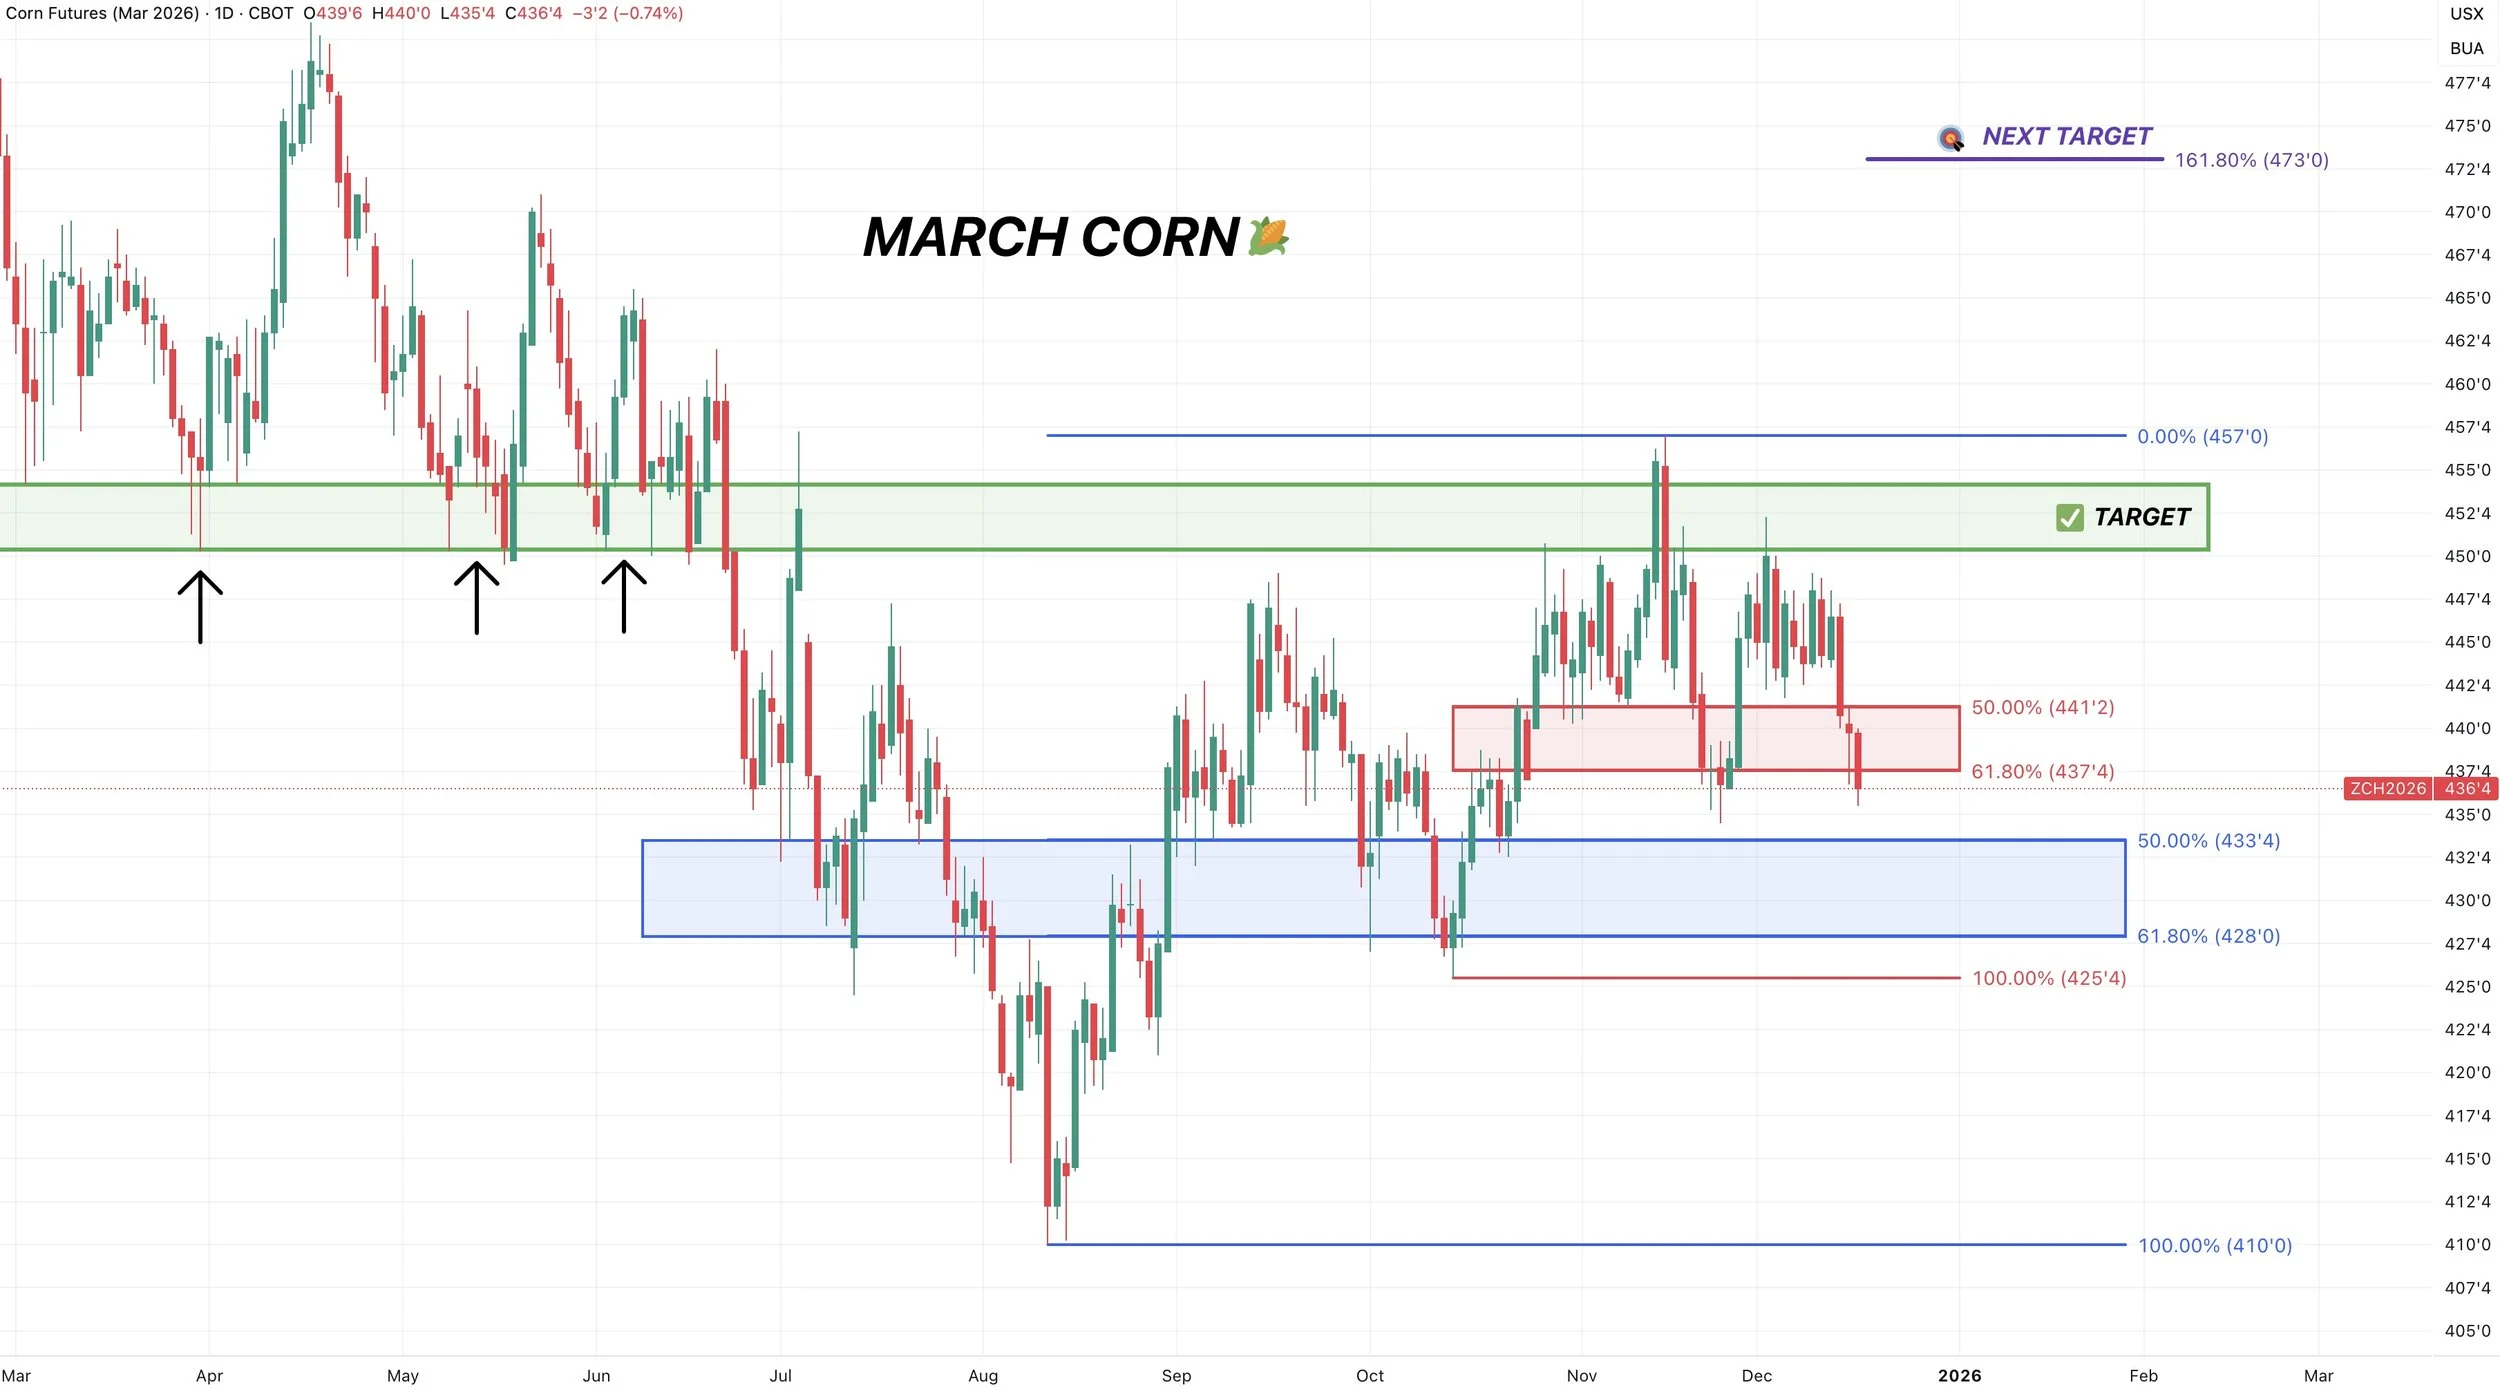
March Corn
We broke below a key spot here short term.
The 61.8% level down to the October lows.
Now what?
It could potentially open the door lower here.
I am eyeing the blue box at $4.28 to $4.33
That gives back 50-61.8% of the entire rally off contract lows.
Finding our bottom there would make sense.
That would be a good spot to look at some possible re-ownership strategies if we get there.
Soybeans
Fundamentals:
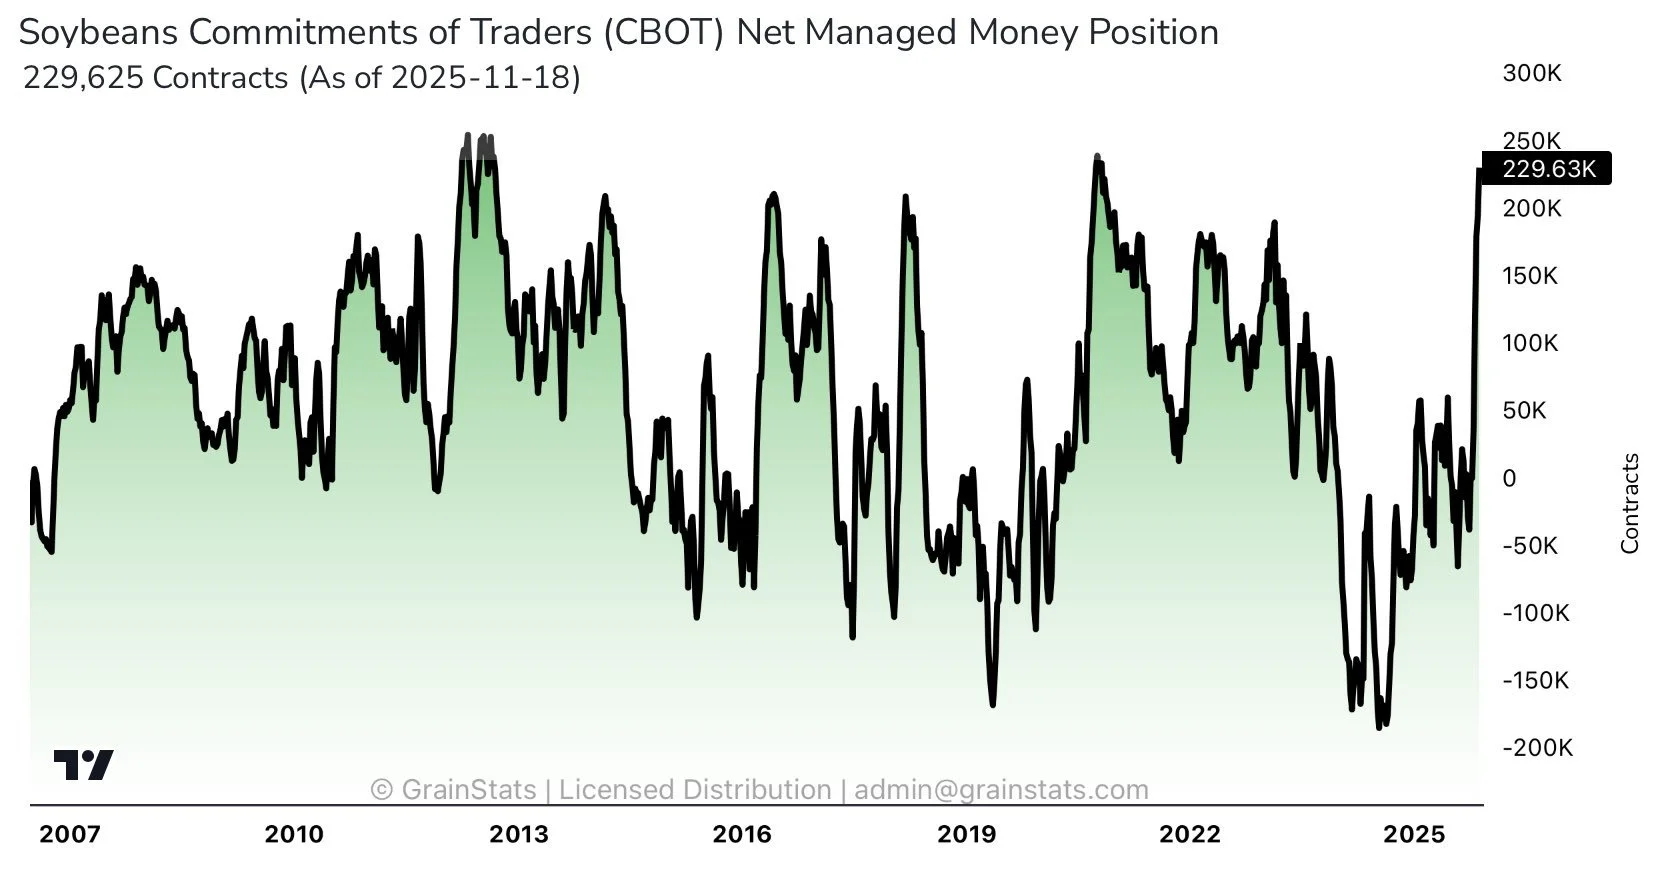
The top 3 times the funds were long soybeans:
1. Drought in 2012
2. COVID rebound in 2020
3. China soybean deal in 2025
It would’ve been nice to know that the funds were actually that long.
But I'm glad we took some risk off the table at the highs.
The CTFC just released the data for Nov 18th.
Which just so happened the be the day soybeans posted their highs.
Chart from GrainStats
Brazil doesn’t have any issues. That has been part of the reason for the weakness.
Then you add on the fact that we have still yet to receive any trade agreement out of China. Rollins said weeks ago that we would be getting the agreement any day now. It still hasn’t happened.
Then the EPA news certainly didn’t help either.
I've shown how little room for the error the US balance sheet has if demand doesn’t come down.
For example, a 51 bpa yield with the exact same demand numbers we currently has results in an extremely tight US situation.
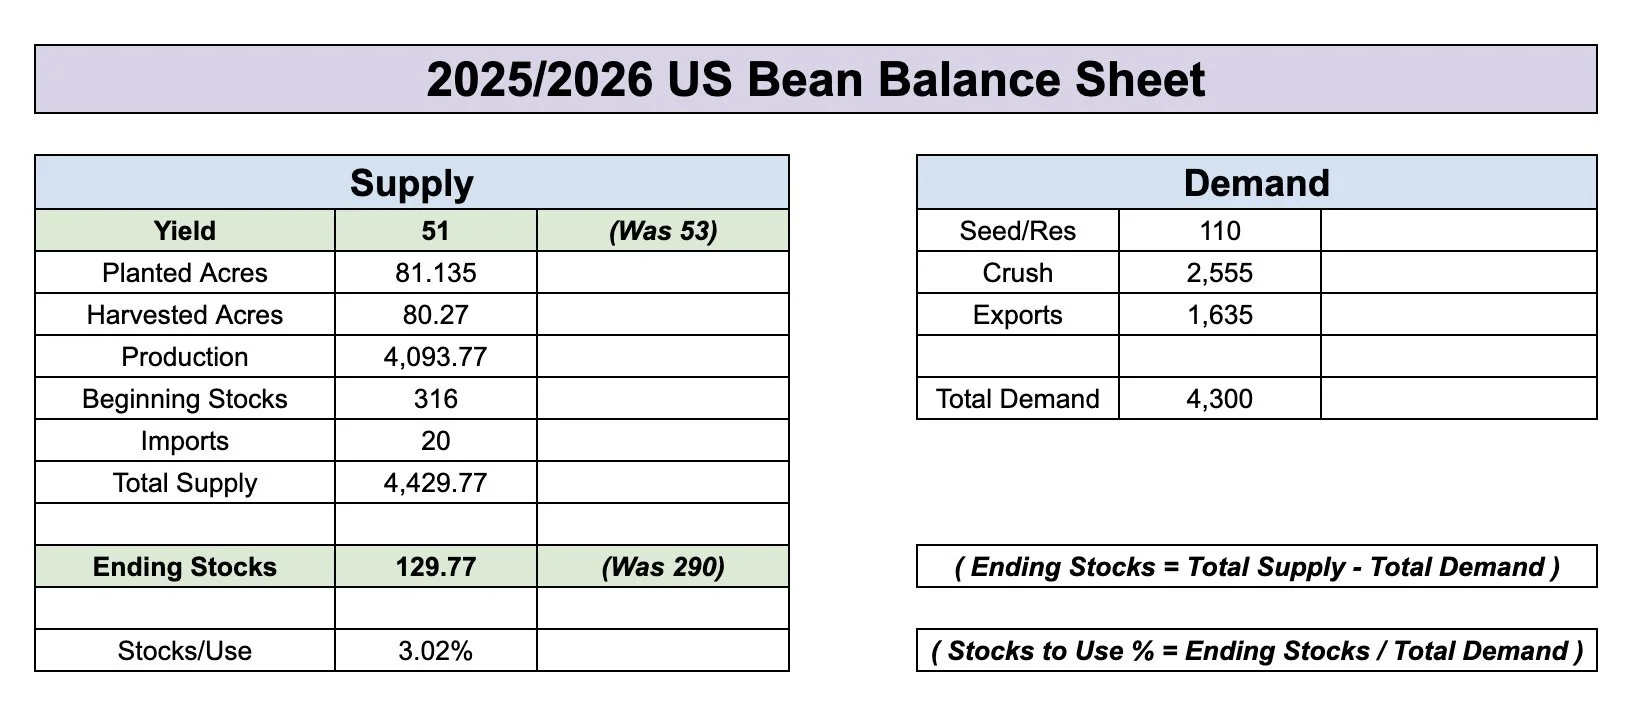
But yes, if the USDA drops yield, they will almost certainly lower demand.
That lower demand is probably going to have to come in the form of exports.
Current Export Projection: 1,635
Last Year's Export Number: 1,882
That is a -250 million bushel decrease from last year.
However, currently exports inspections are trailing last year by -400 million already.
So you could definitely argue the USDA has to work that number even lower.
Here is a pretty good chart from Susan of NoBull Ag that shows soybean inspections for China and the rest of the world.
Non-China business is about on par with last year, but China is still severely behind.
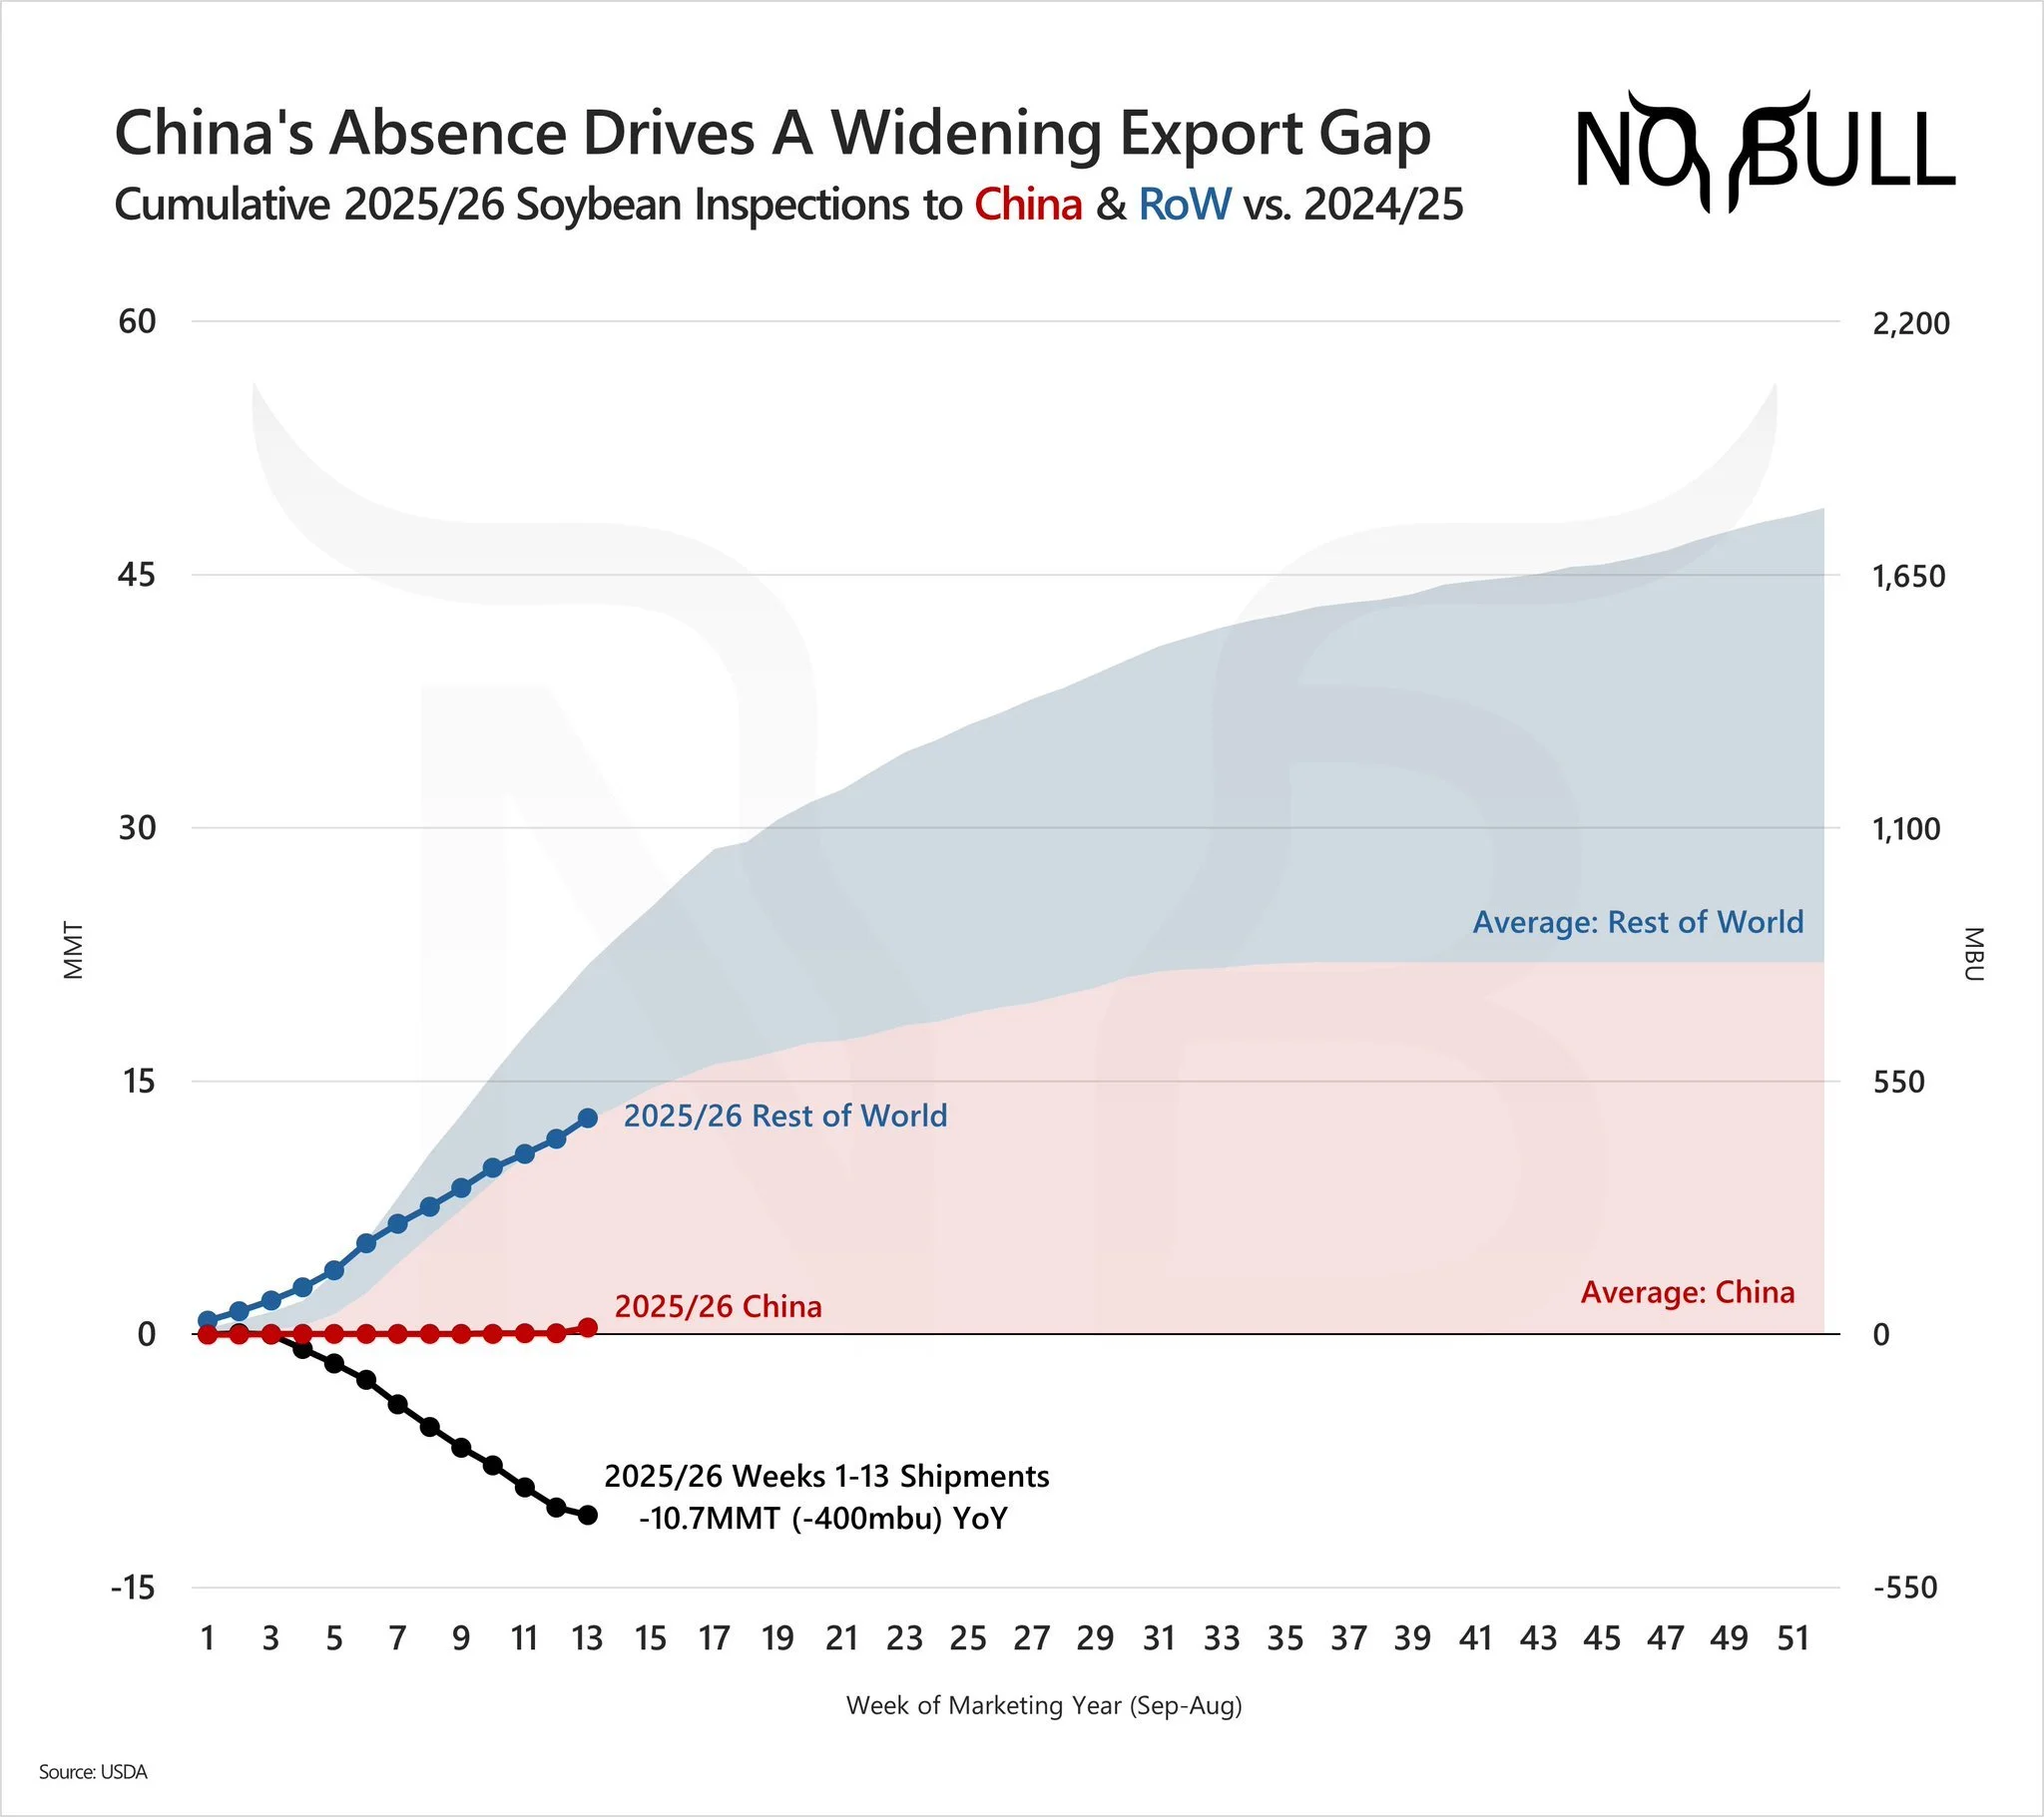
Since export inspections are trailing last year by -400 million, but the USDA only has our expect projection down -250 million from last year.
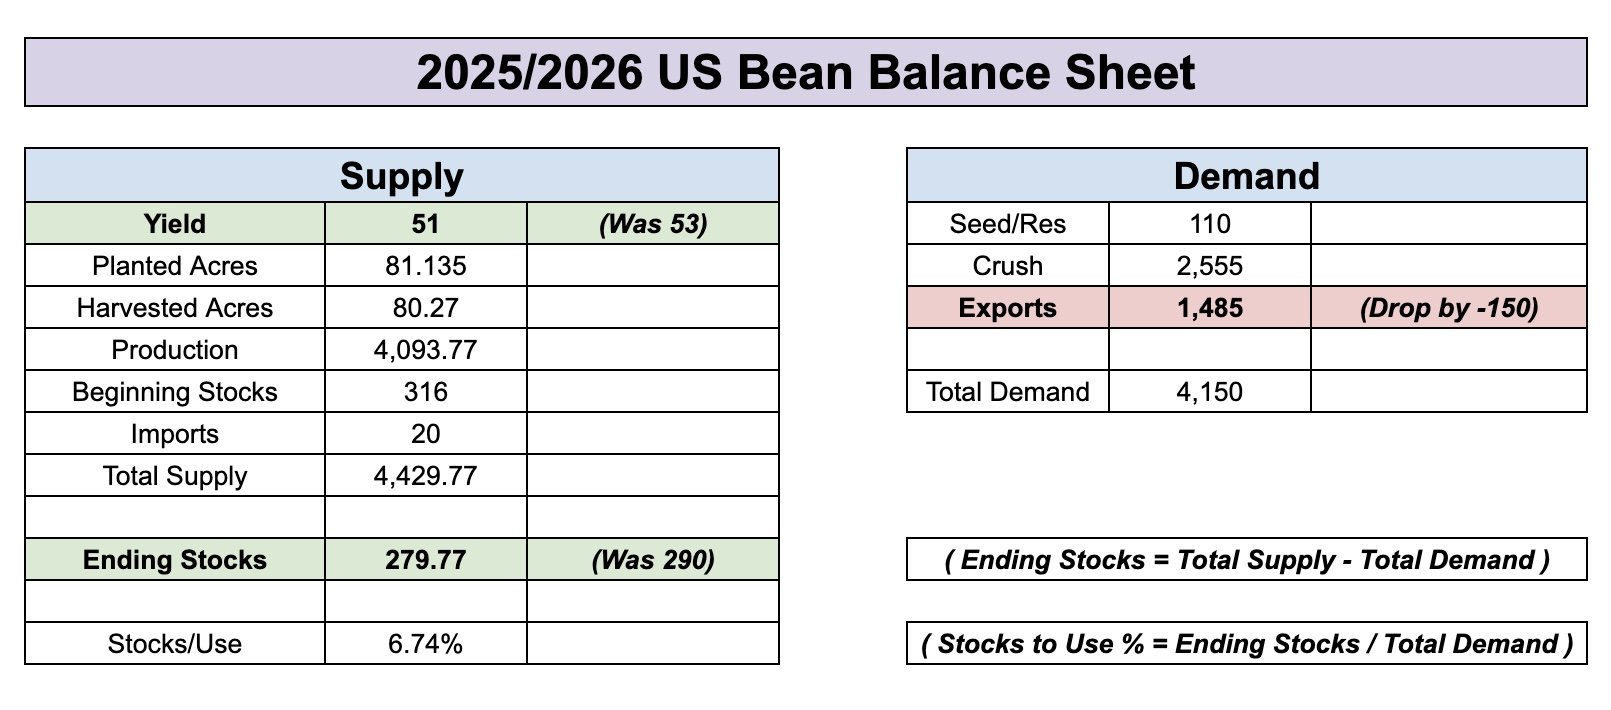
It would reasonable to think that they could potentially lower exports by as much as -150 million.
If that were the case, here is how the balance sheet would play out.
If you drop yield down to 51, while at the same time slash exports by -150, it results in a complete wash on the carryout.
It remains about the same.
Which isn’t a considered bearish figure.
But let's say yield drops to 52 instead.
While at the same time cutting exports by the same amount.
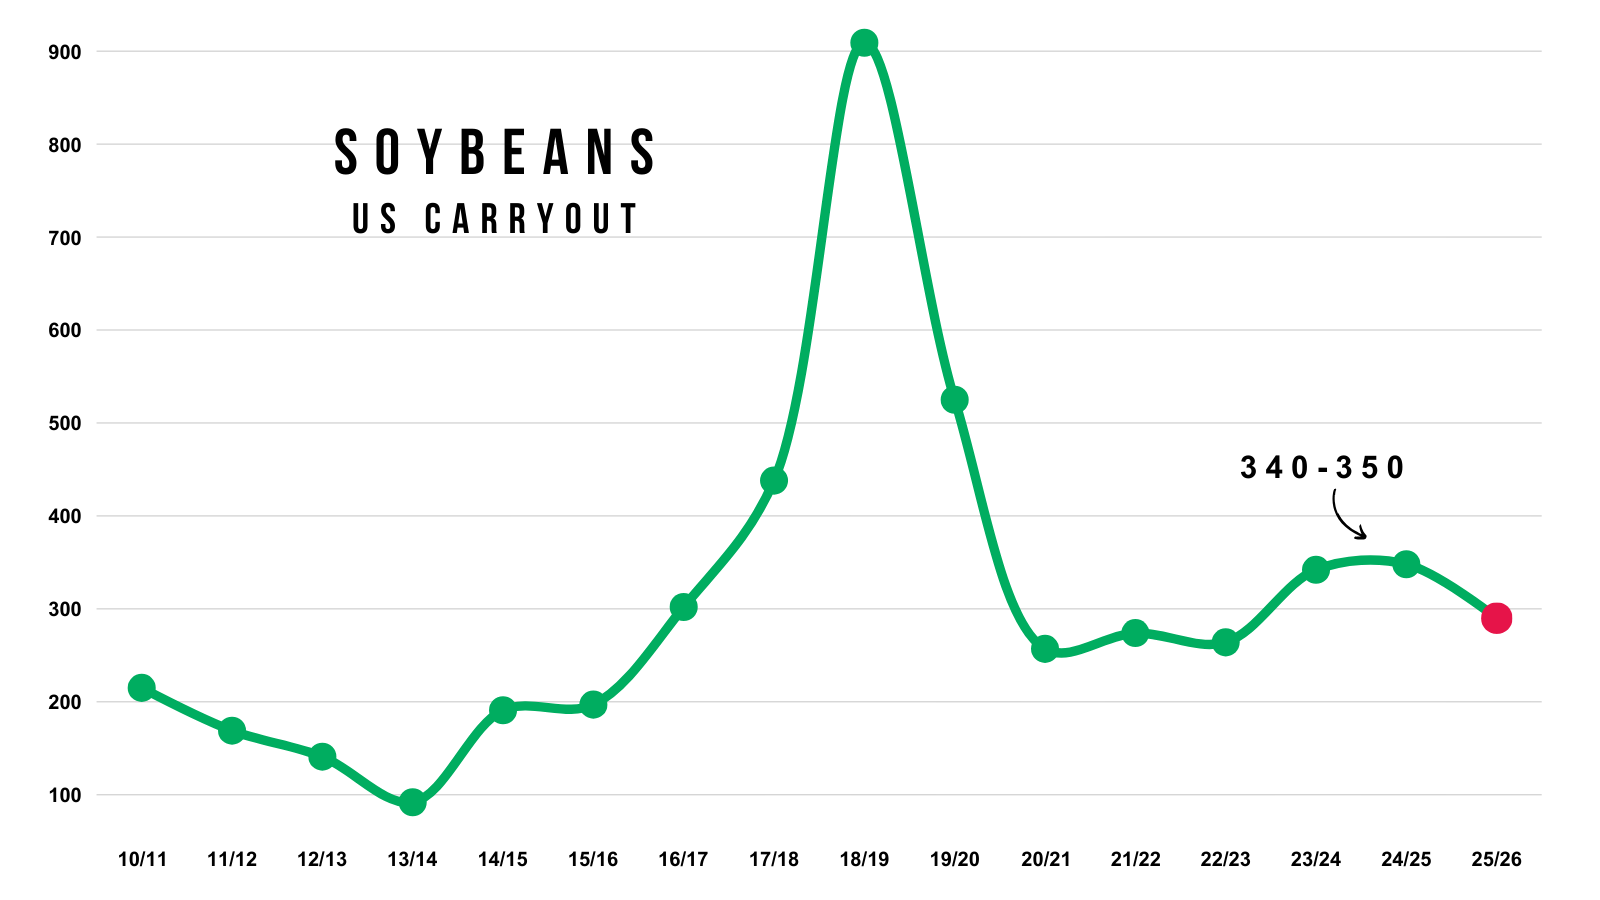
It would result in carryout jumping from 290 up to 360 million.
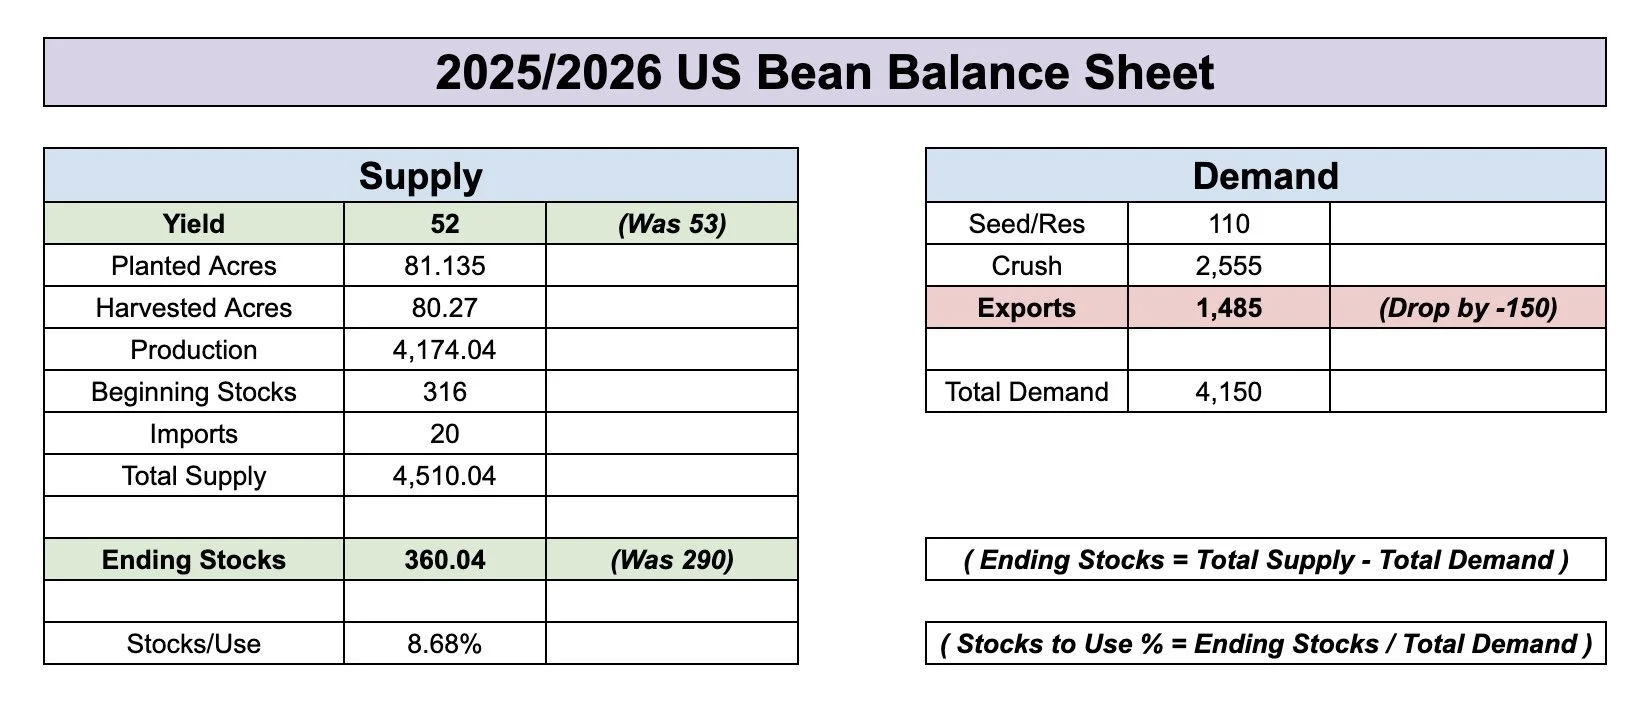
Which would be the highest since 2019/20.
As the last two years were around 340-350 million.
So there are plenty of unknowns as to how the US balance sheet with shape up.
For both exports as well as supply.
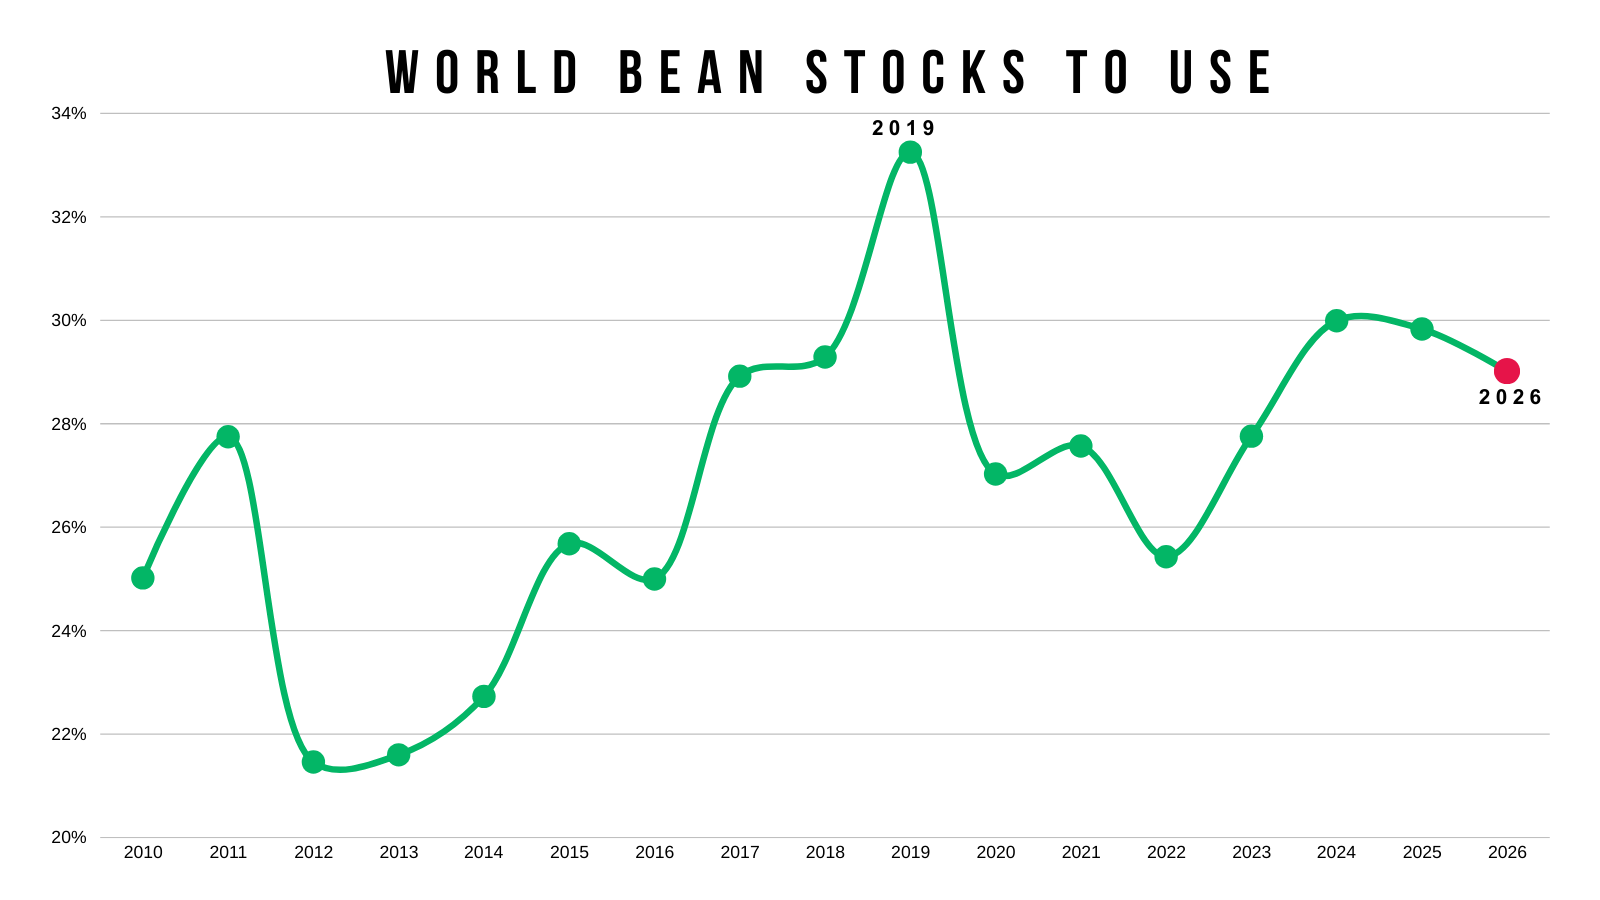
The problem is that the world situation is still on the bearish side.
The last true bull market featured a tight world situation, which we don’t currently have.
Overall, I think soybeans are due for some sort of relief bounce here soon.
But to get some major rally and post new highs, it would probably take either a big surprise in the Jan report or a weather scare of our Brazil.
Currently, there doesn’t appear to be any issues in Brazil as it remains favorable for now.
Technicals:
Jan Beans
Soybeans have officially filled that gap.
Meaning we are now lower than we were before all of the China hype.
I didn’t think we "had" to fill the gap. But we did.
We are now gave back over 61.8% of the entire rally. So it's not the greatest look here.
As often times when you break this level, the sell off is no longer viewed as a simple correction before heading higher.
It often tells us we could be in a deeper correction overall.
Which means we will want to look to reward a sizeable relief bounce out of here if it comes, following our last sell signal at $11.55
Where could the bottom be?
We could bounce at any time. We are getting pretty oversold. We filled that gap.
But the next point of interest is the 78.6% level at $10.46. So I'd say that's our downside risk from here.
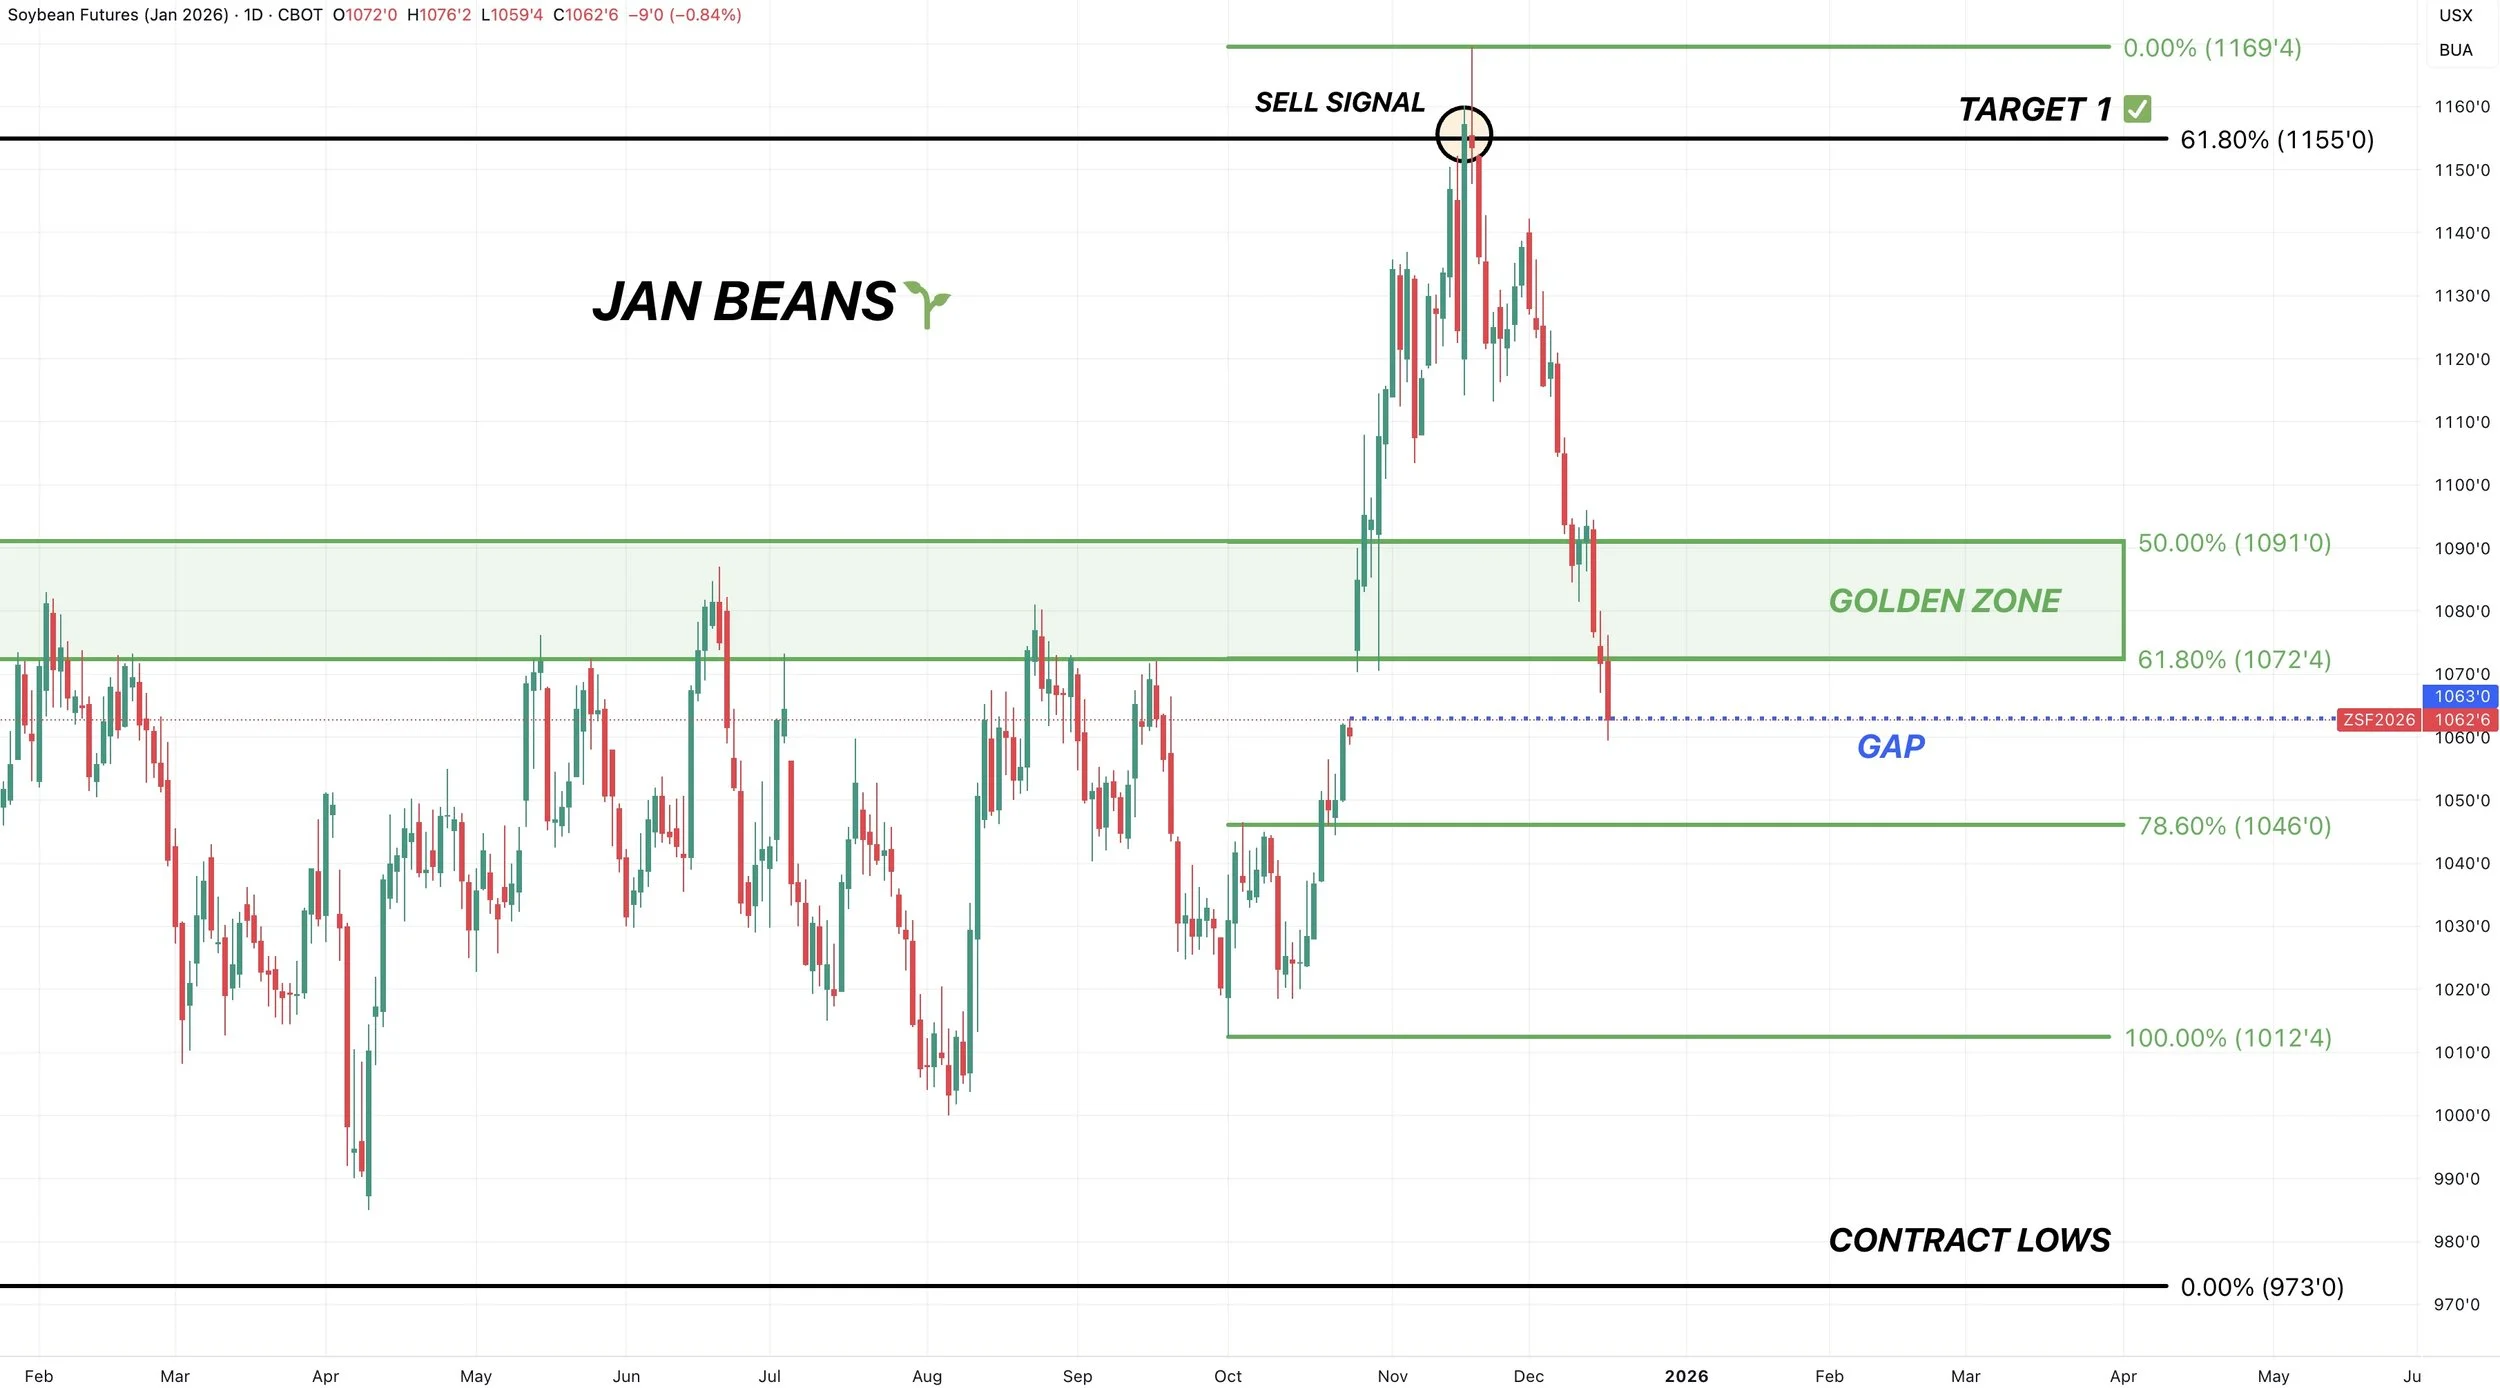
$10.48 gives back 61.8% of those November highs down to the contract lows.
So that adds even more confluence to that $10.46 to $10.48 level.
That would be a great spot to consider some re-ownership strategies if it came.

I'd like to think we are due for a relief rally here soon.
Whether we get another 10-15 cents of downside first or not.
The RSI is very oversold. At it's lowest levels in a long time.
At the same time, prices are not as low as they were the last time the RSI was this oversold.
This is called hidden bullish divergence.
Normal bearish divergence marked those November highs on our sell signal. As prices were making new highs, while the RSI was not.

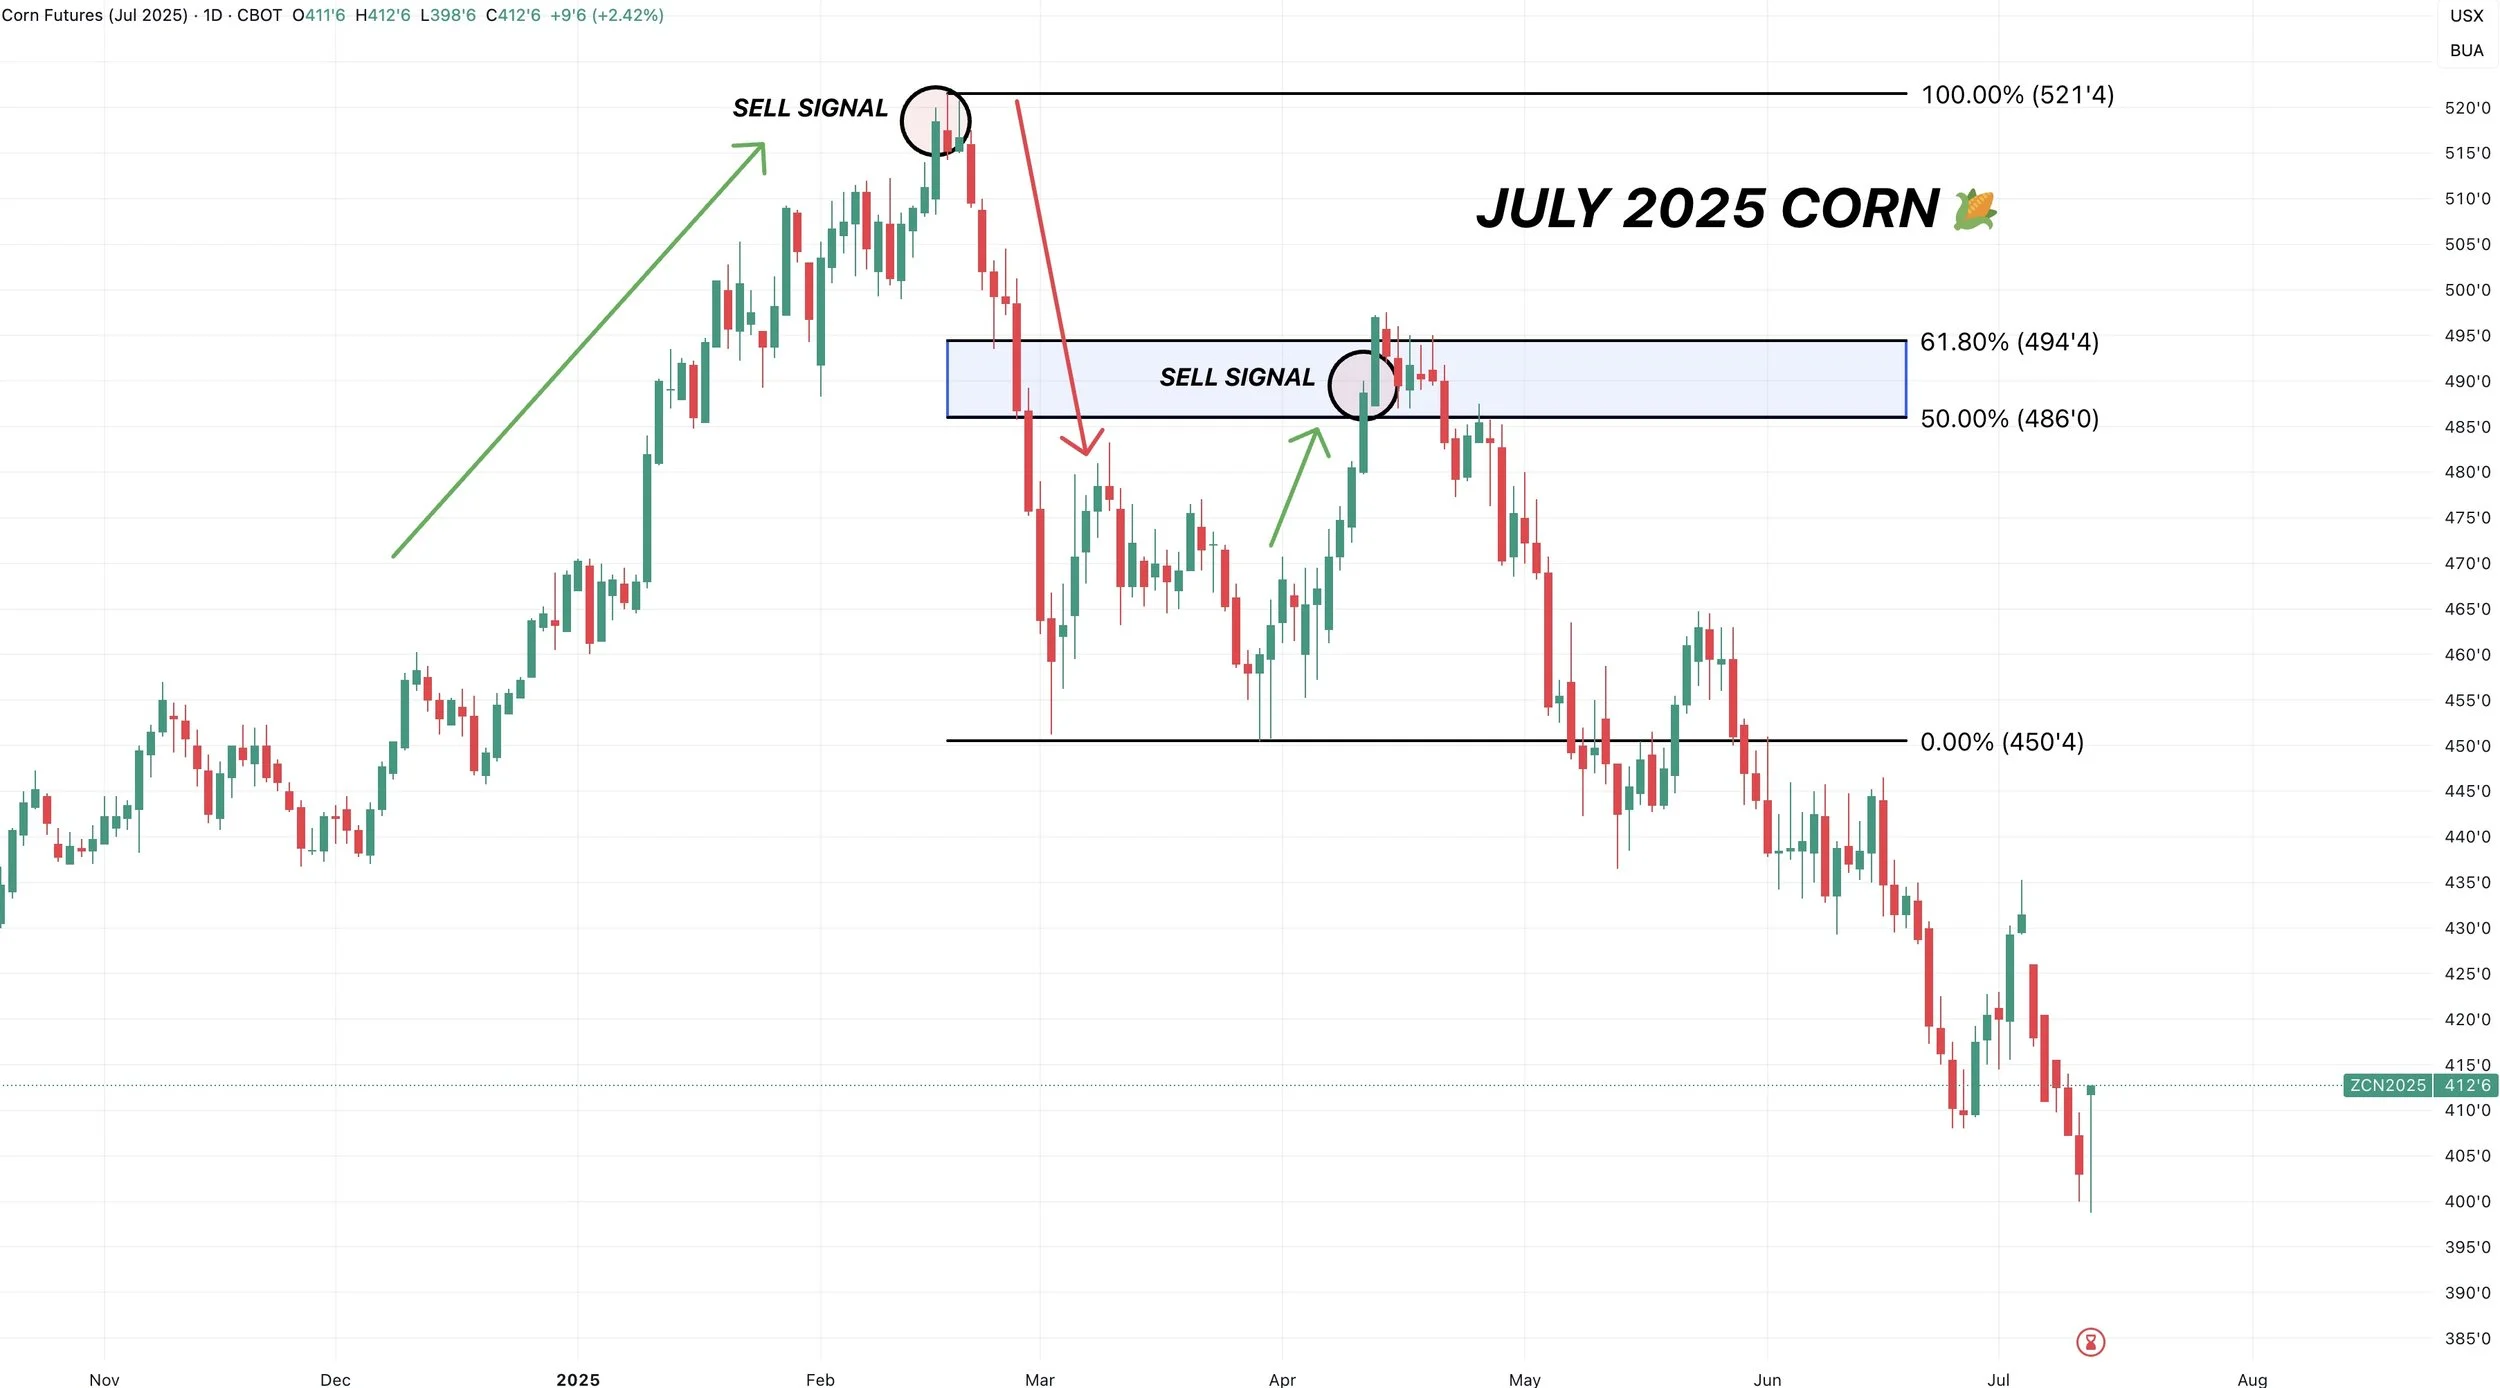
Markets often provides some sort of relief bounce after the intial sell off.
Take corn for example earlier this year.
This is July-25 corn.
We had that intial sell off from the Feb highs.
We then got that April bounce.
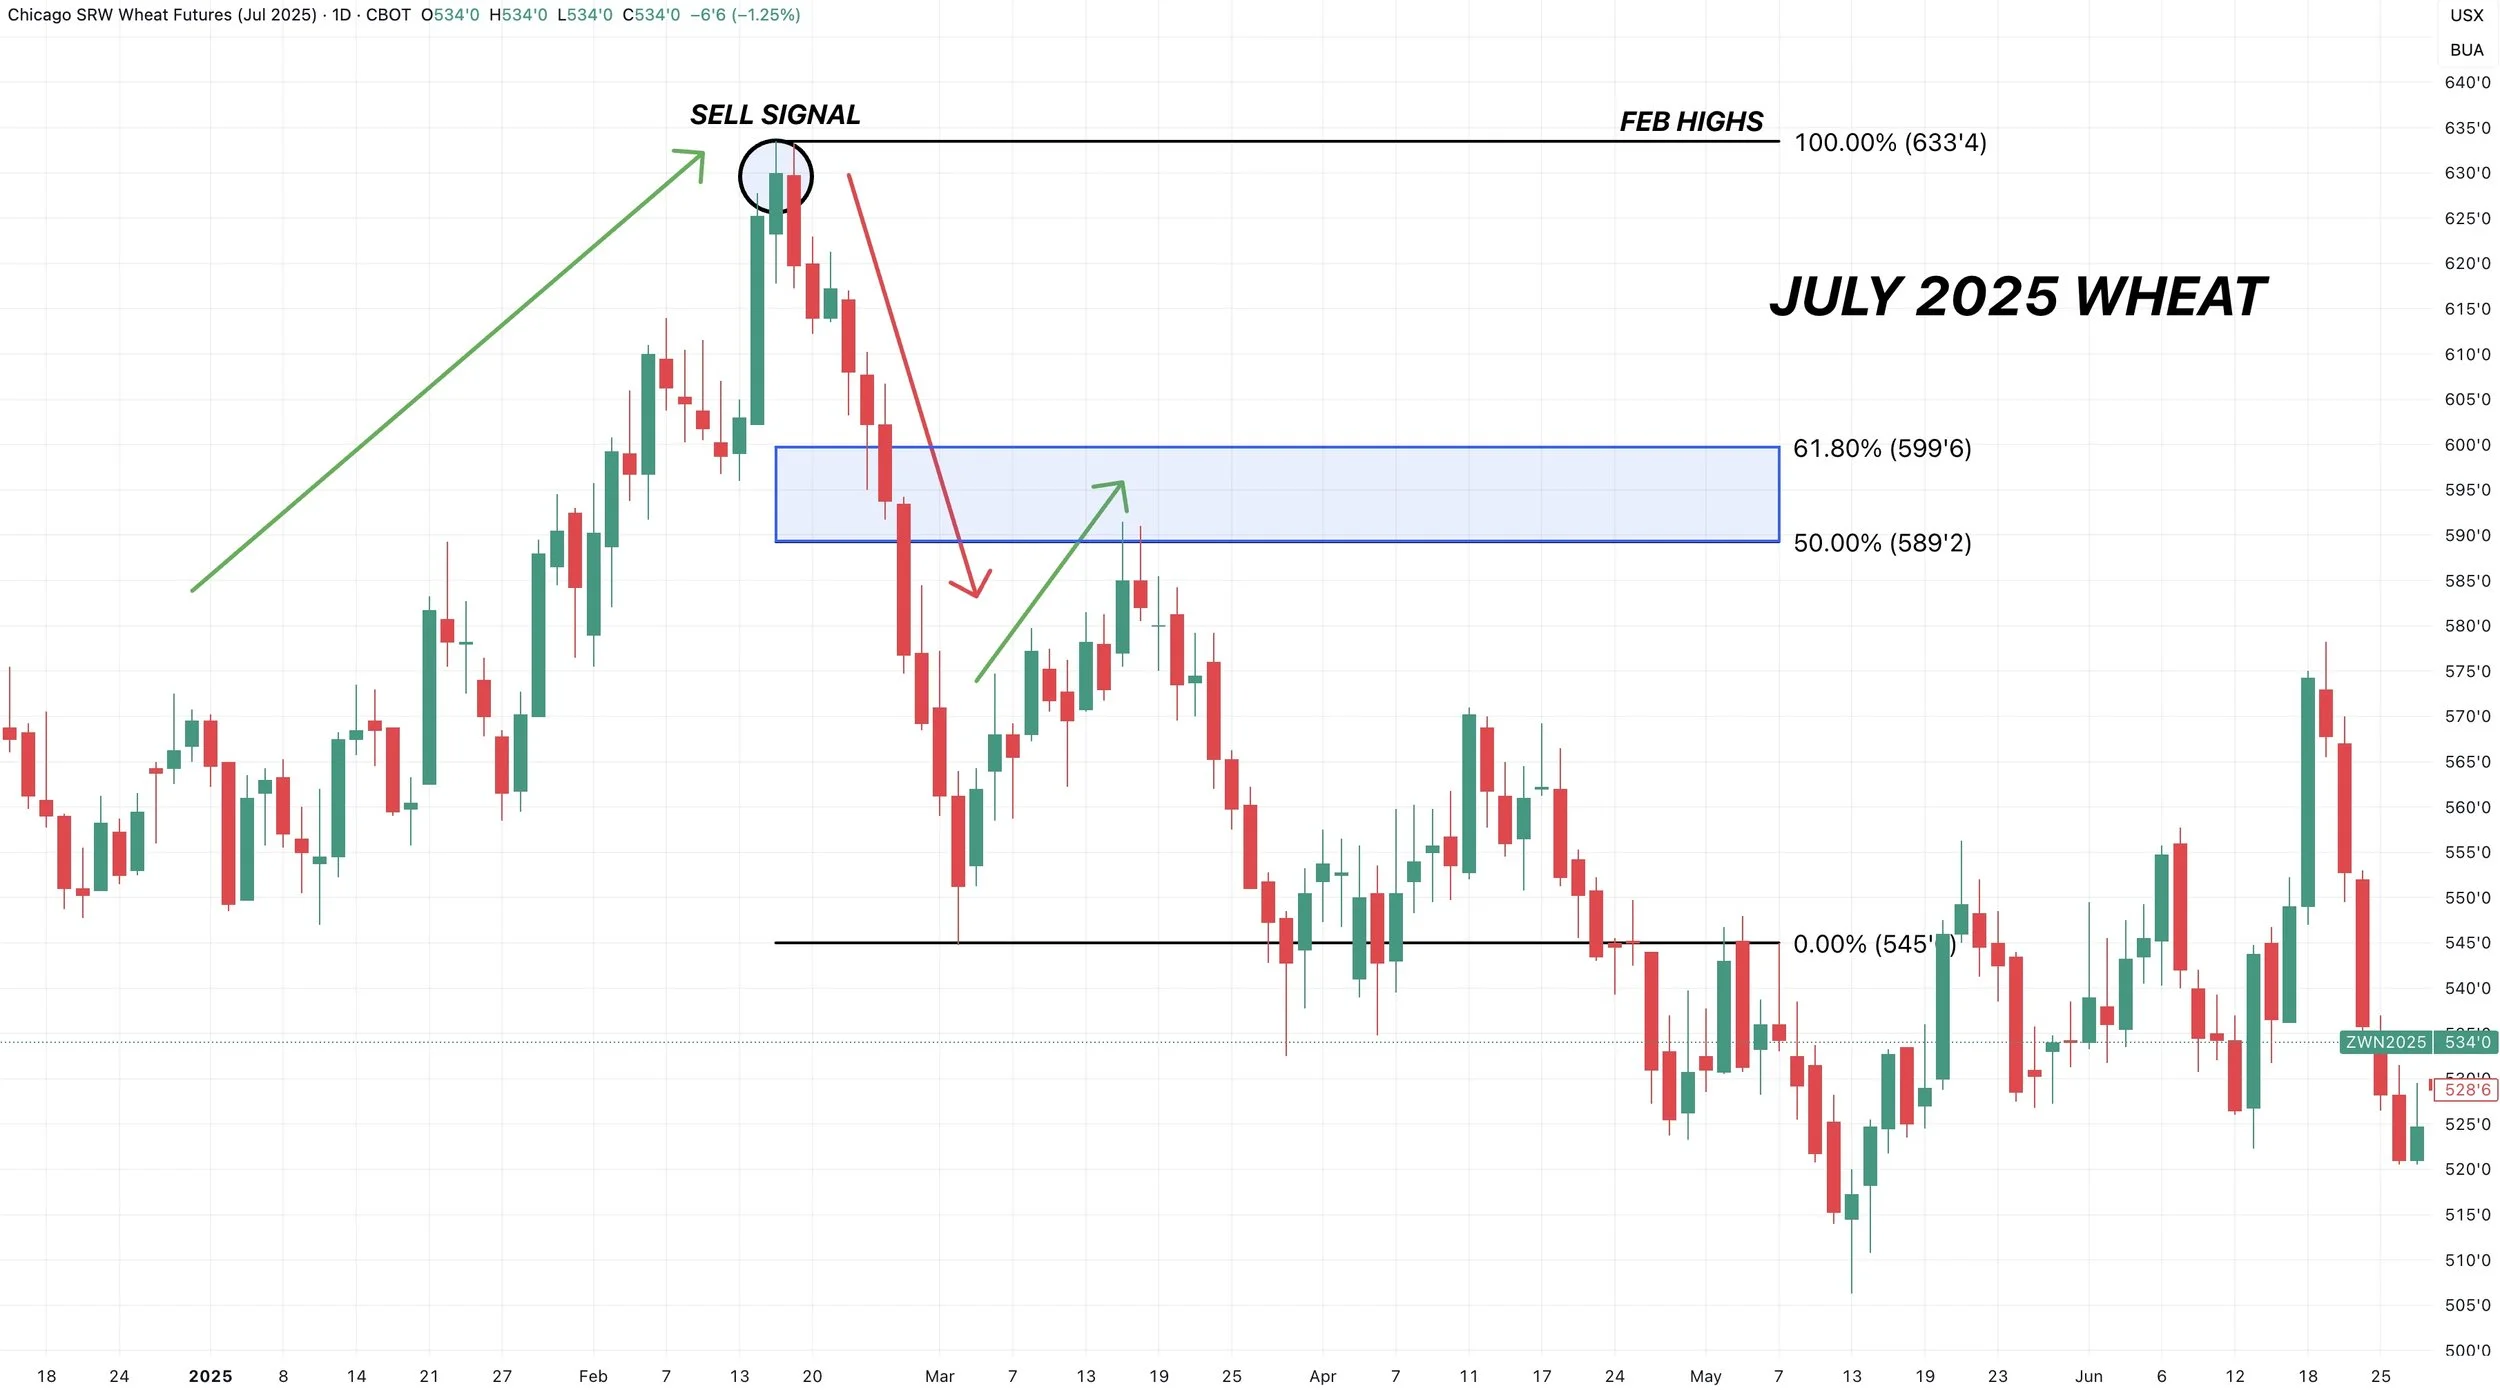
Same story in wheat earlier this year.
This is July-25 wheat.
We had the initial rally and sell off.
A relief bounce followed.
Markets don’t move in straight lines.
I will have my exact targets in soybeans once I feel like we've posted a bottom.
It doesn’t have to happen, but a lot of times you'll recover at least 50% of the sell off.
Wheat
Chicago wheat posted new contract lows today while KC wheat is about 6 cents away from their contract lows.
The world simply has too much wheat, and the USDA confirmed this in the most recent report.
We have several countries production estimates on the rise with countries like Argentina and Australia potentially having record crops.
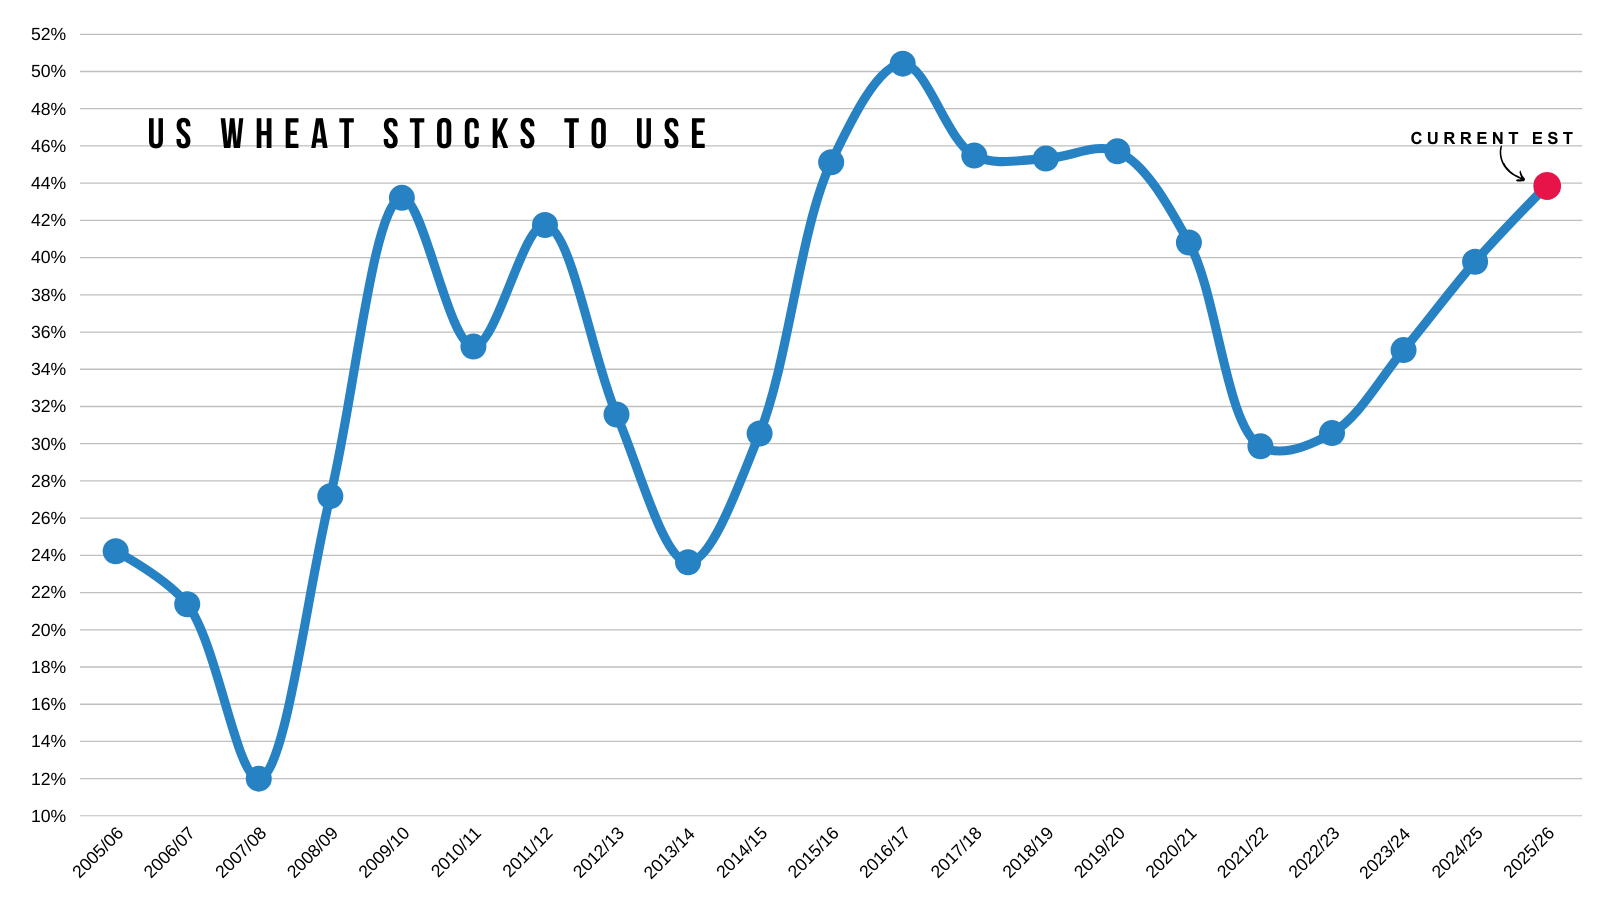
Then the situation here in the US is still pretty bearish.
With the stocks to use ratio sitting at it's highest levels in a 5 years.
Probably part of the reason prices are at 5 year lows.
Long term I think wheat is at an area of value.
But right now there is just nothing for bulls to get excited about or a catalyst saying we have to go higher.
The is no issues globally or here in the world, neither are short on supply.
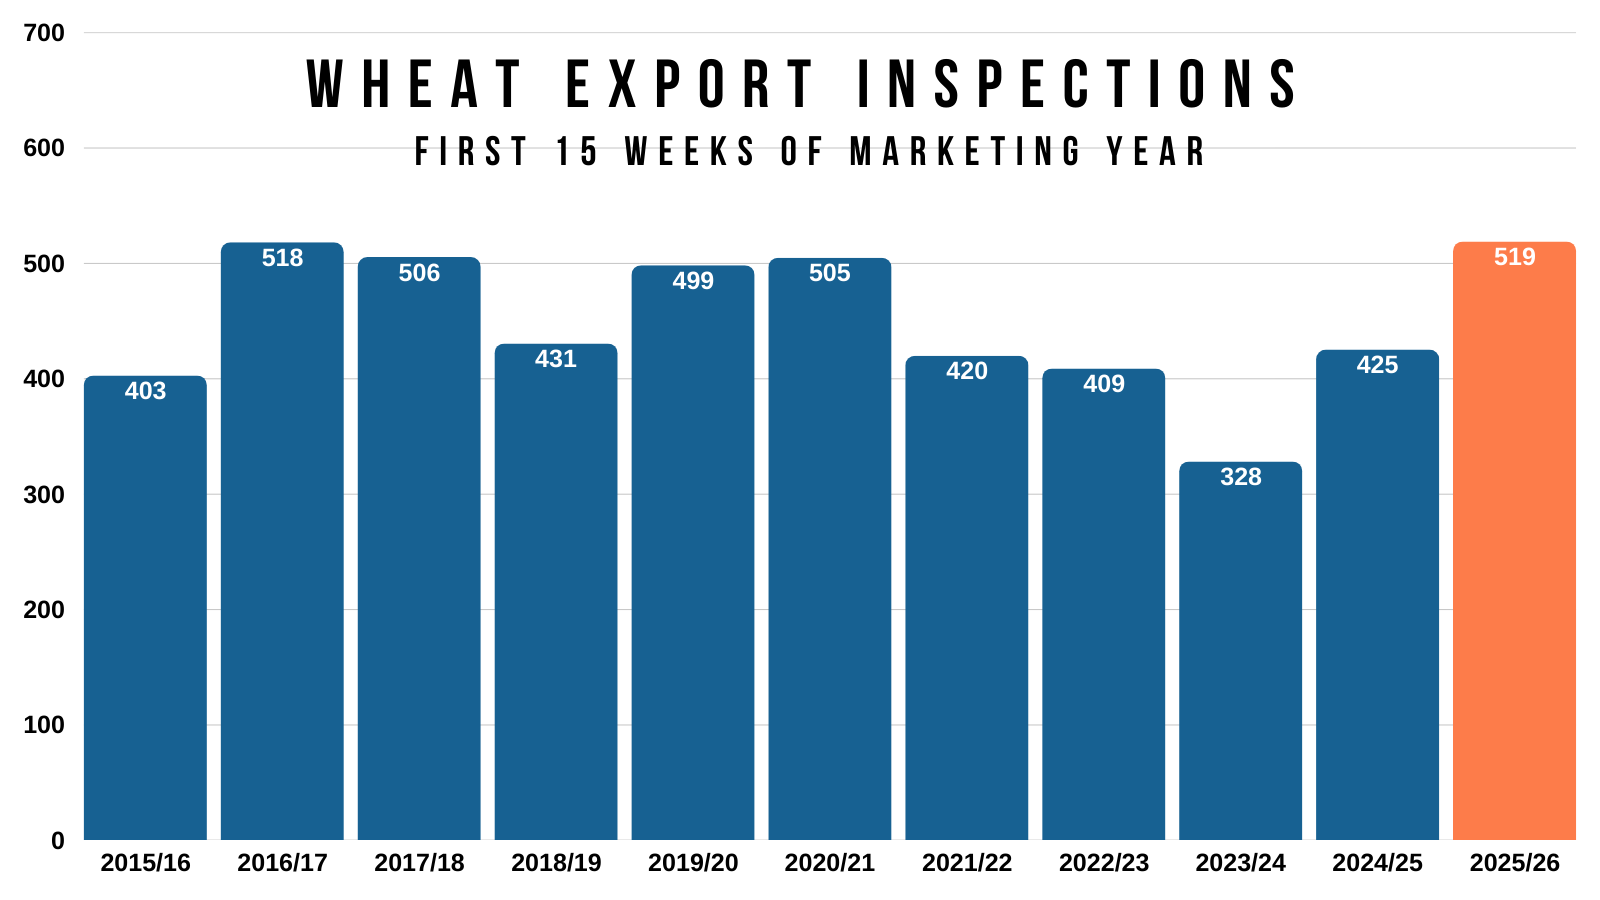
Wheat demand continues to be a bright spot, as inspections are up +22% vs last year.
But it's not enough to offset the supply.
Despite the wheat story not being bullish, I don’t think sub $5.00 is justified long term.
It seems like the market is trying to push wheat into losing acres next year.
I am not bullish wheat per say, as there really isn’t a reason to be. But I can’t get overly bearish taking a longer term perspective while we sit at multi-year lows.
Simply waiting for an opportunity that often only comes once or twice a year in the wheat market.
Technicals:
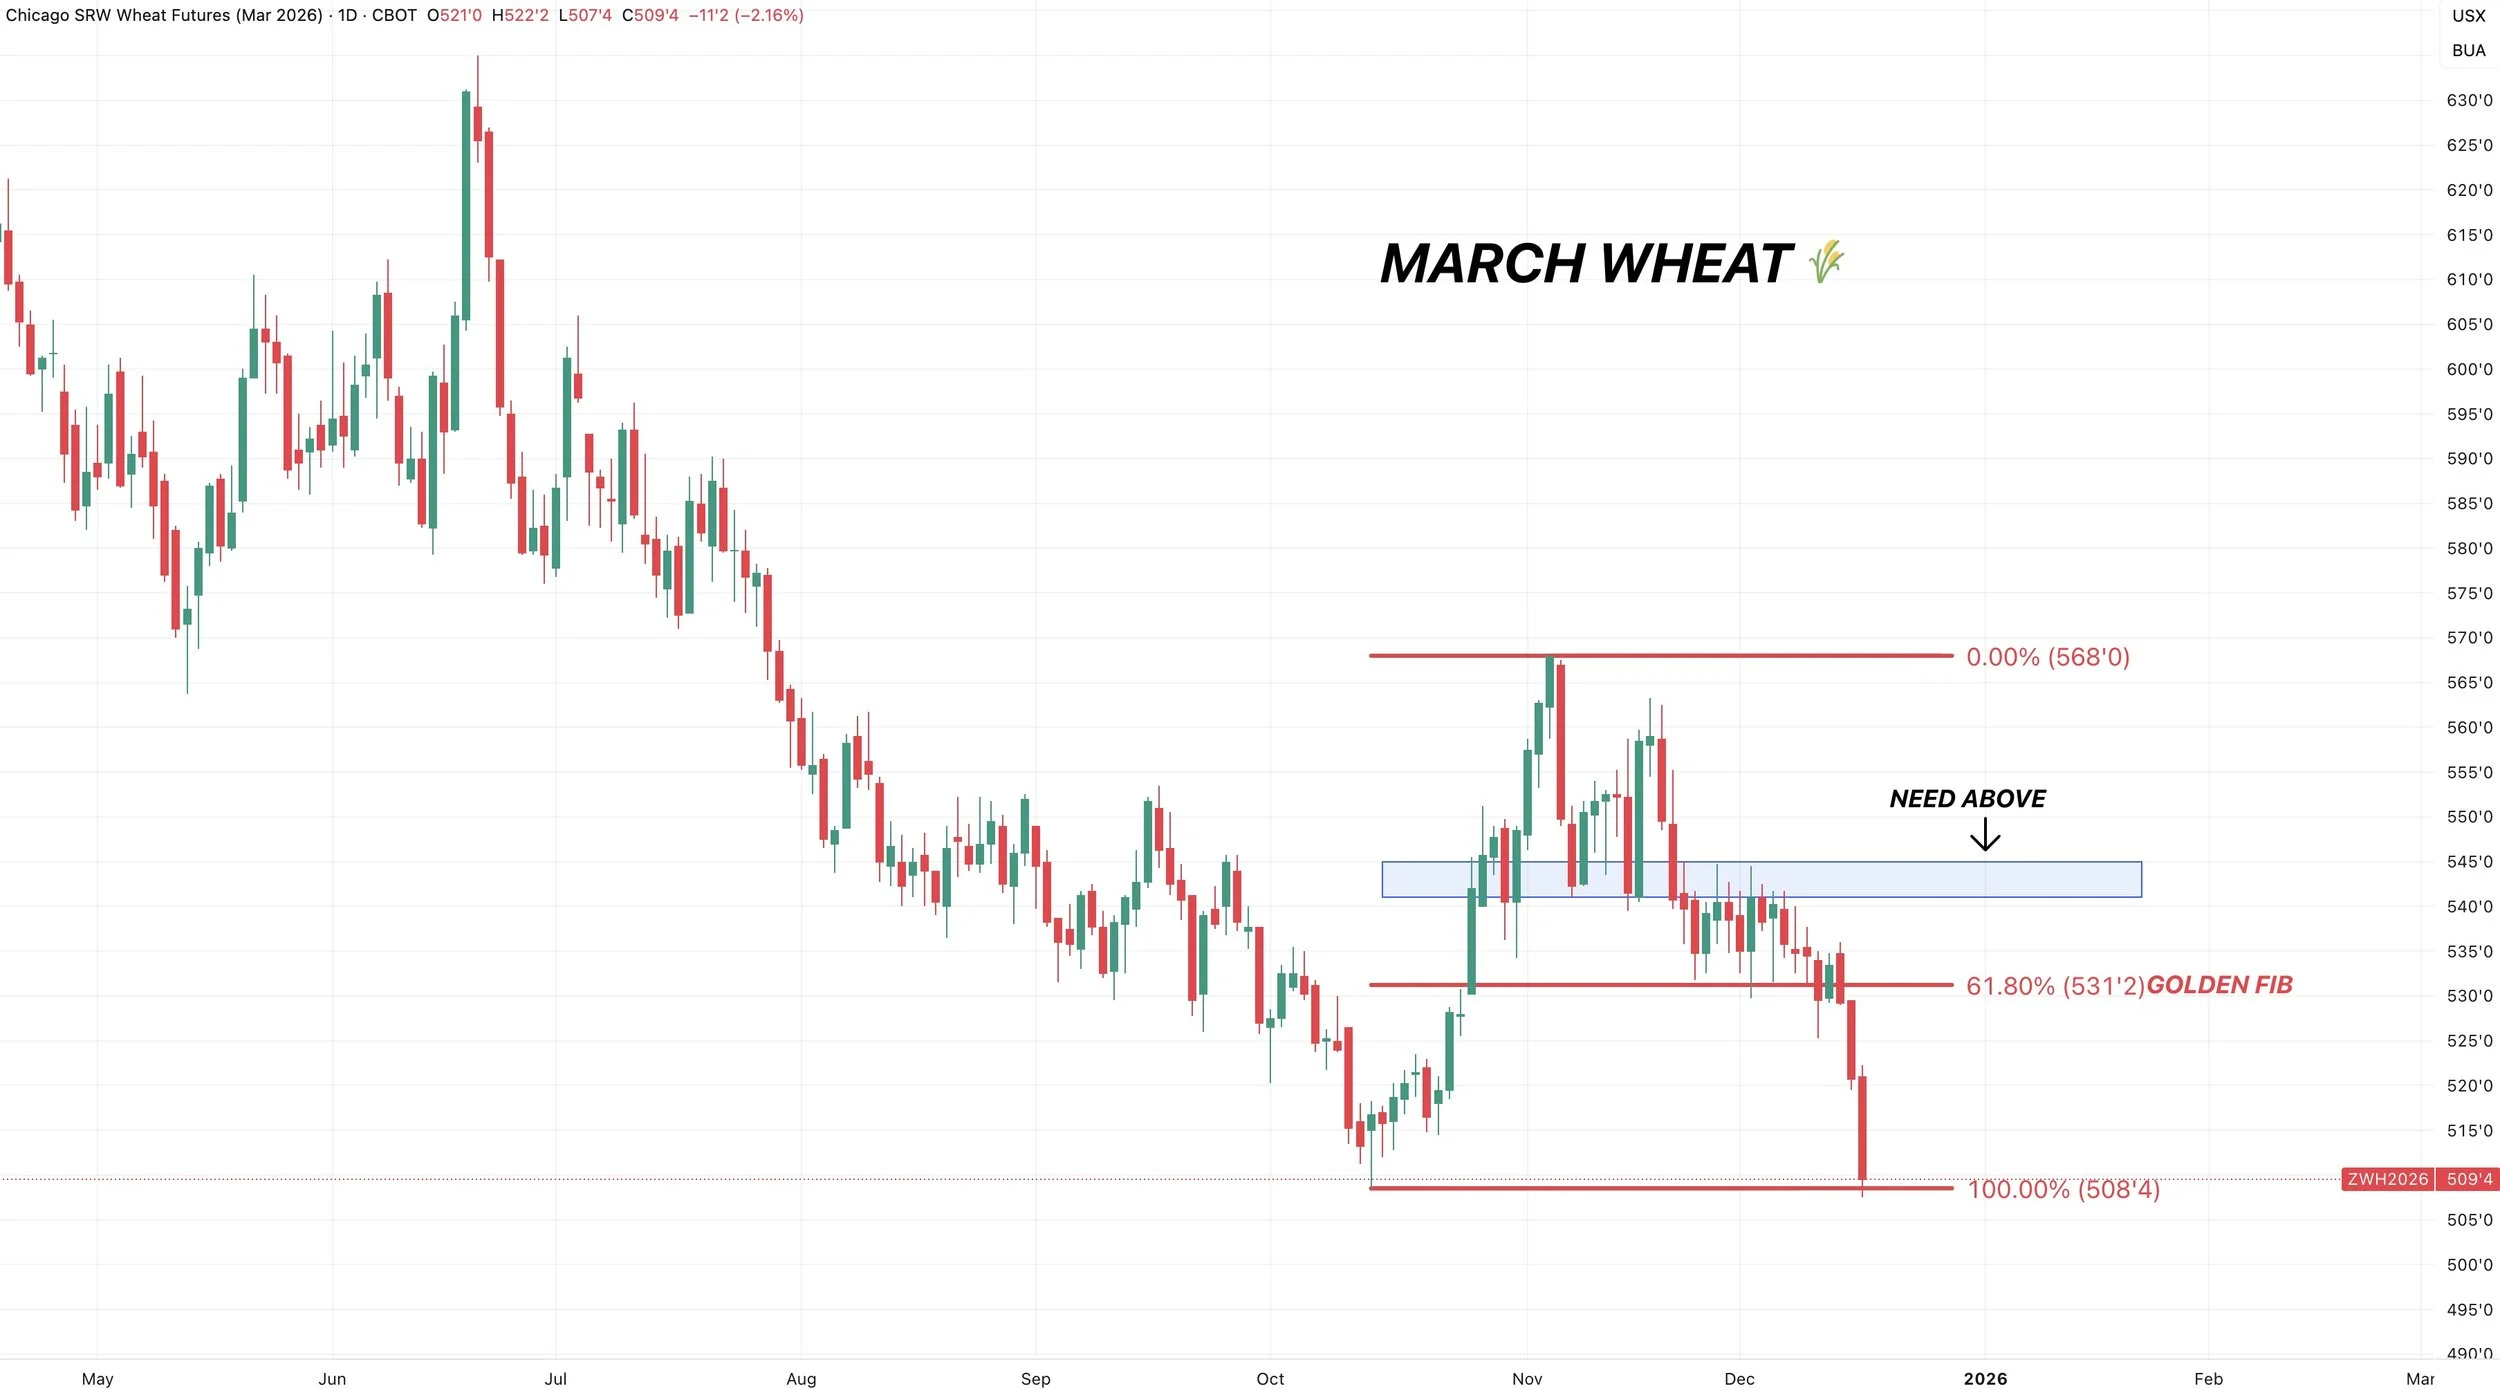
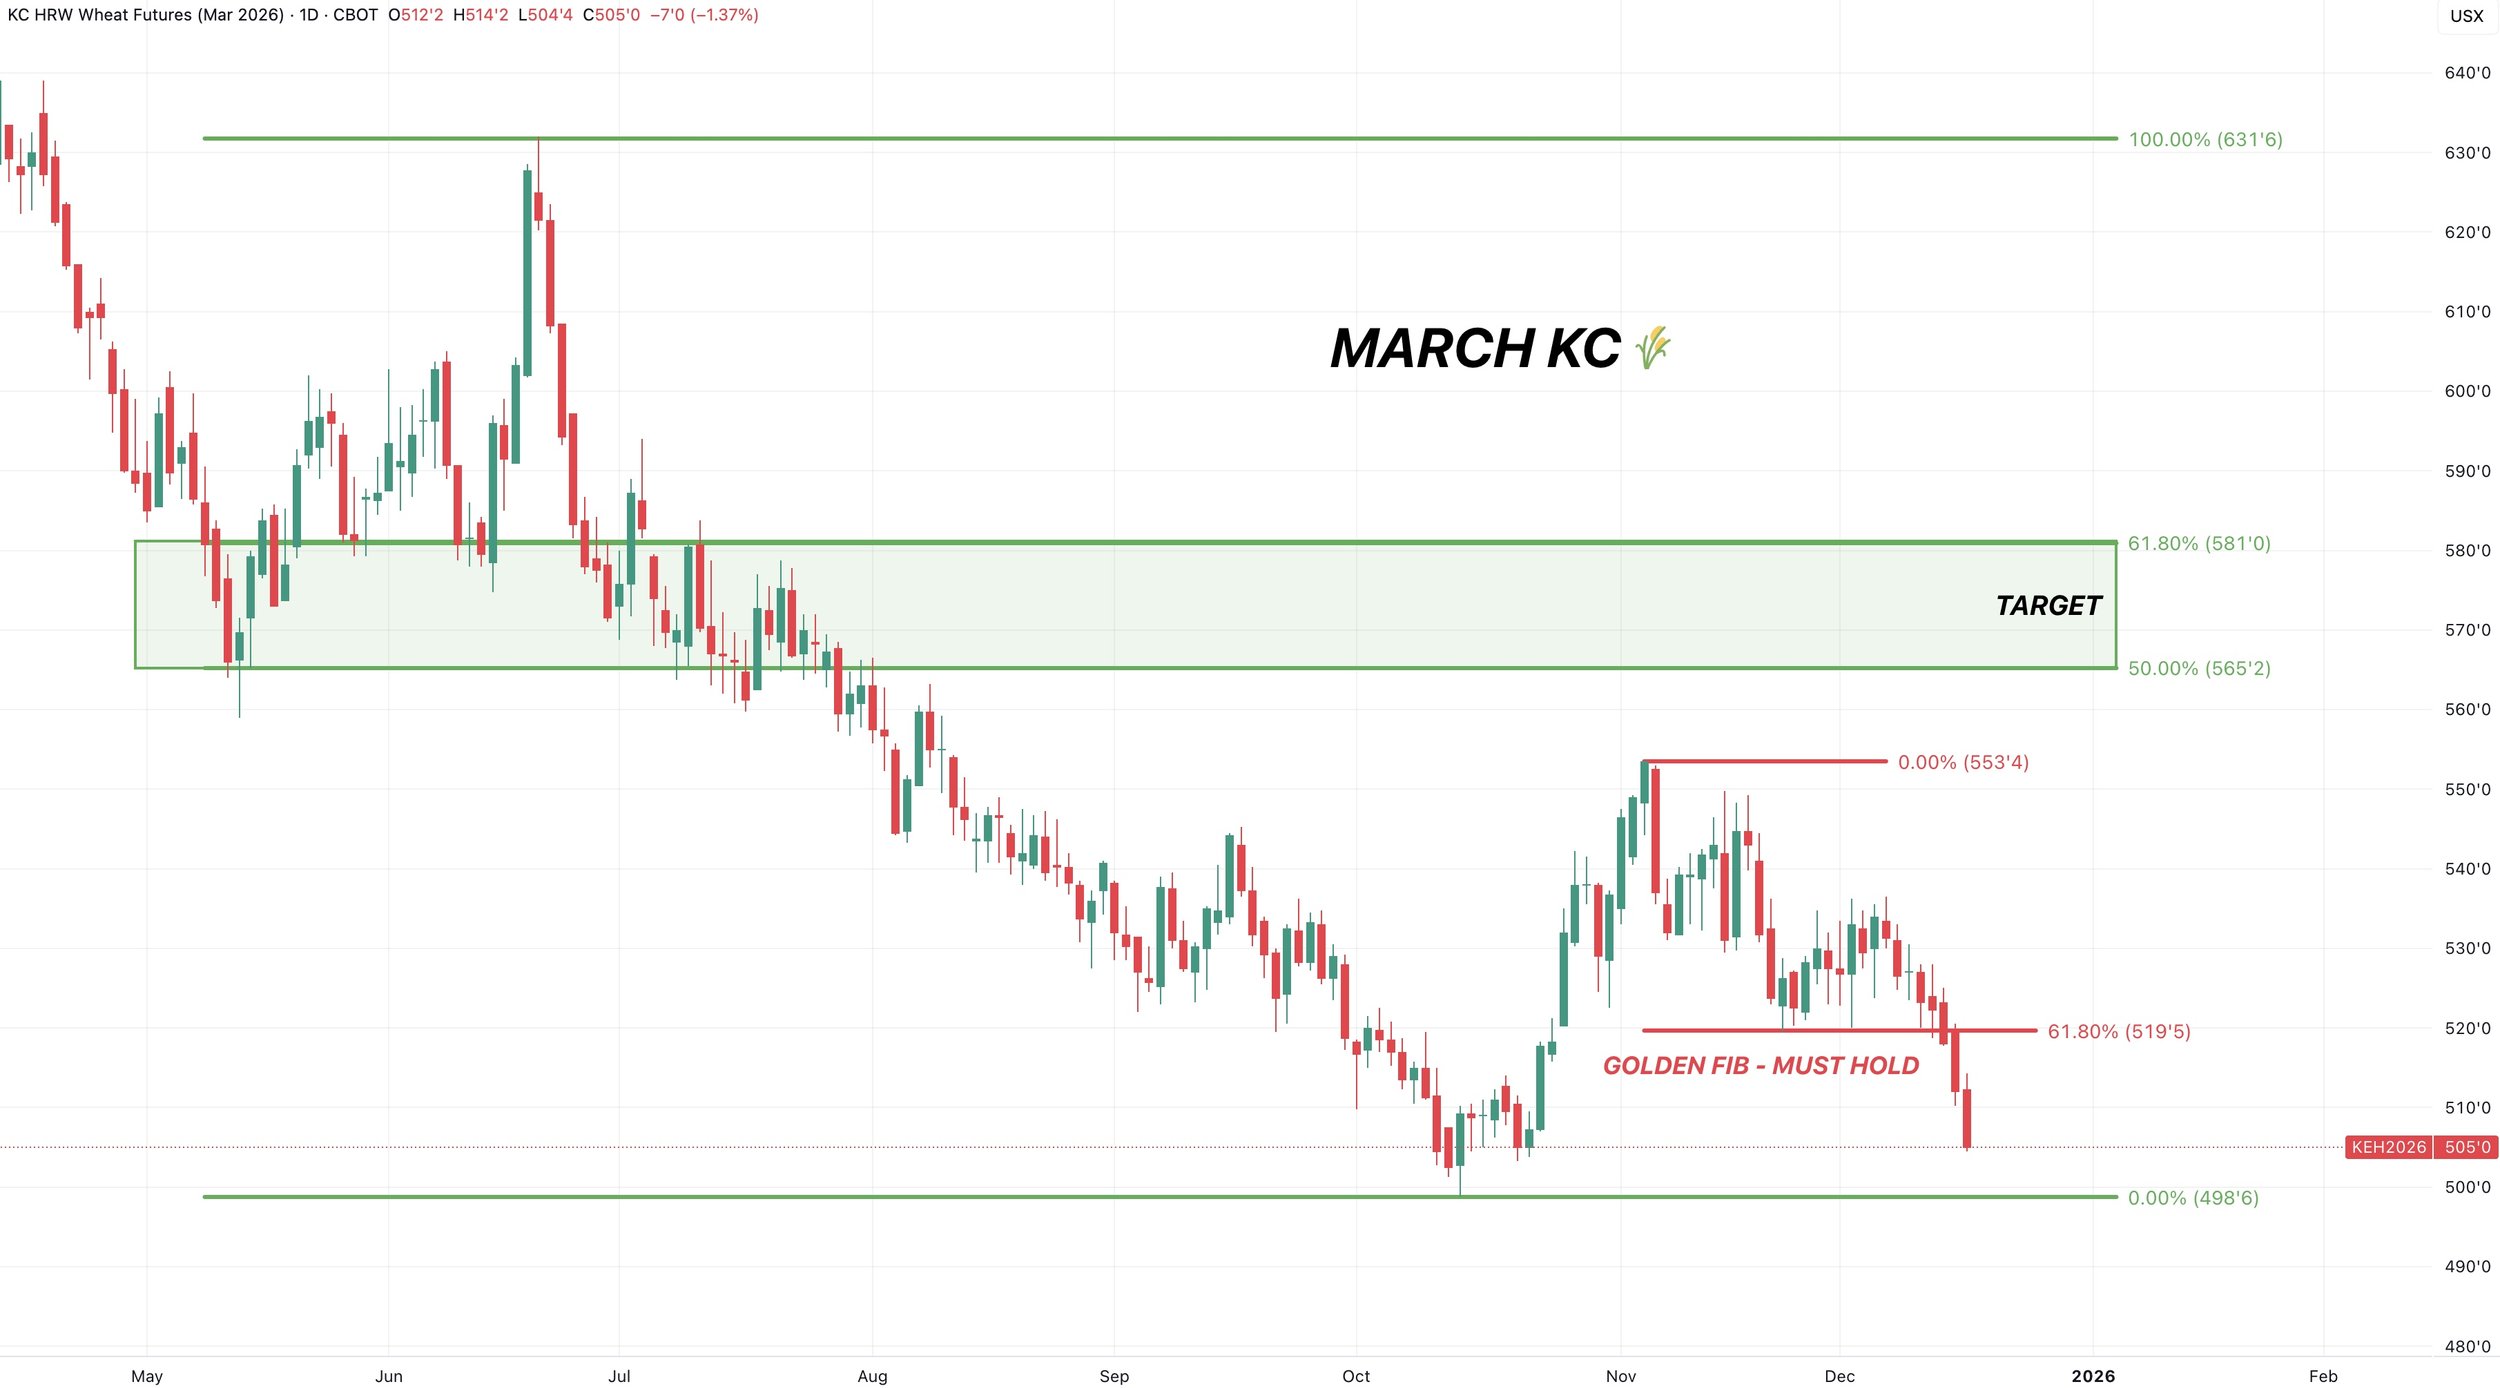
March Wheat
We talked for weeks about of crucial of a level $5.31 was and how negative it would be if it broke.
As it was the golden fib down to the contract lows.
Meaning we gave back 61.8% of the entire rally.
Where the market decides if this is a correctional sell off or not.
We got our answer. As we failed to hold and are now posting new contract lows.
We will have to wait and see if this level holds or if we are going to be going back to trying to catch a falling knife.
Dec KC Wheat
KC also broke the golden fib.
Next support is contract lows.
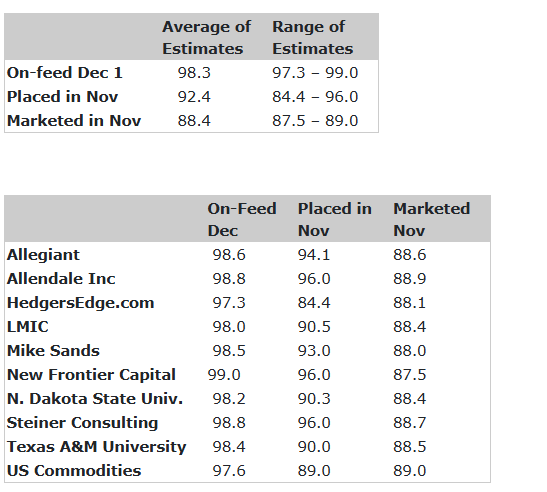
Cattle
We do have a cattle on feed report this Friday after the markets close.
Here are the estimates.
Technicals:
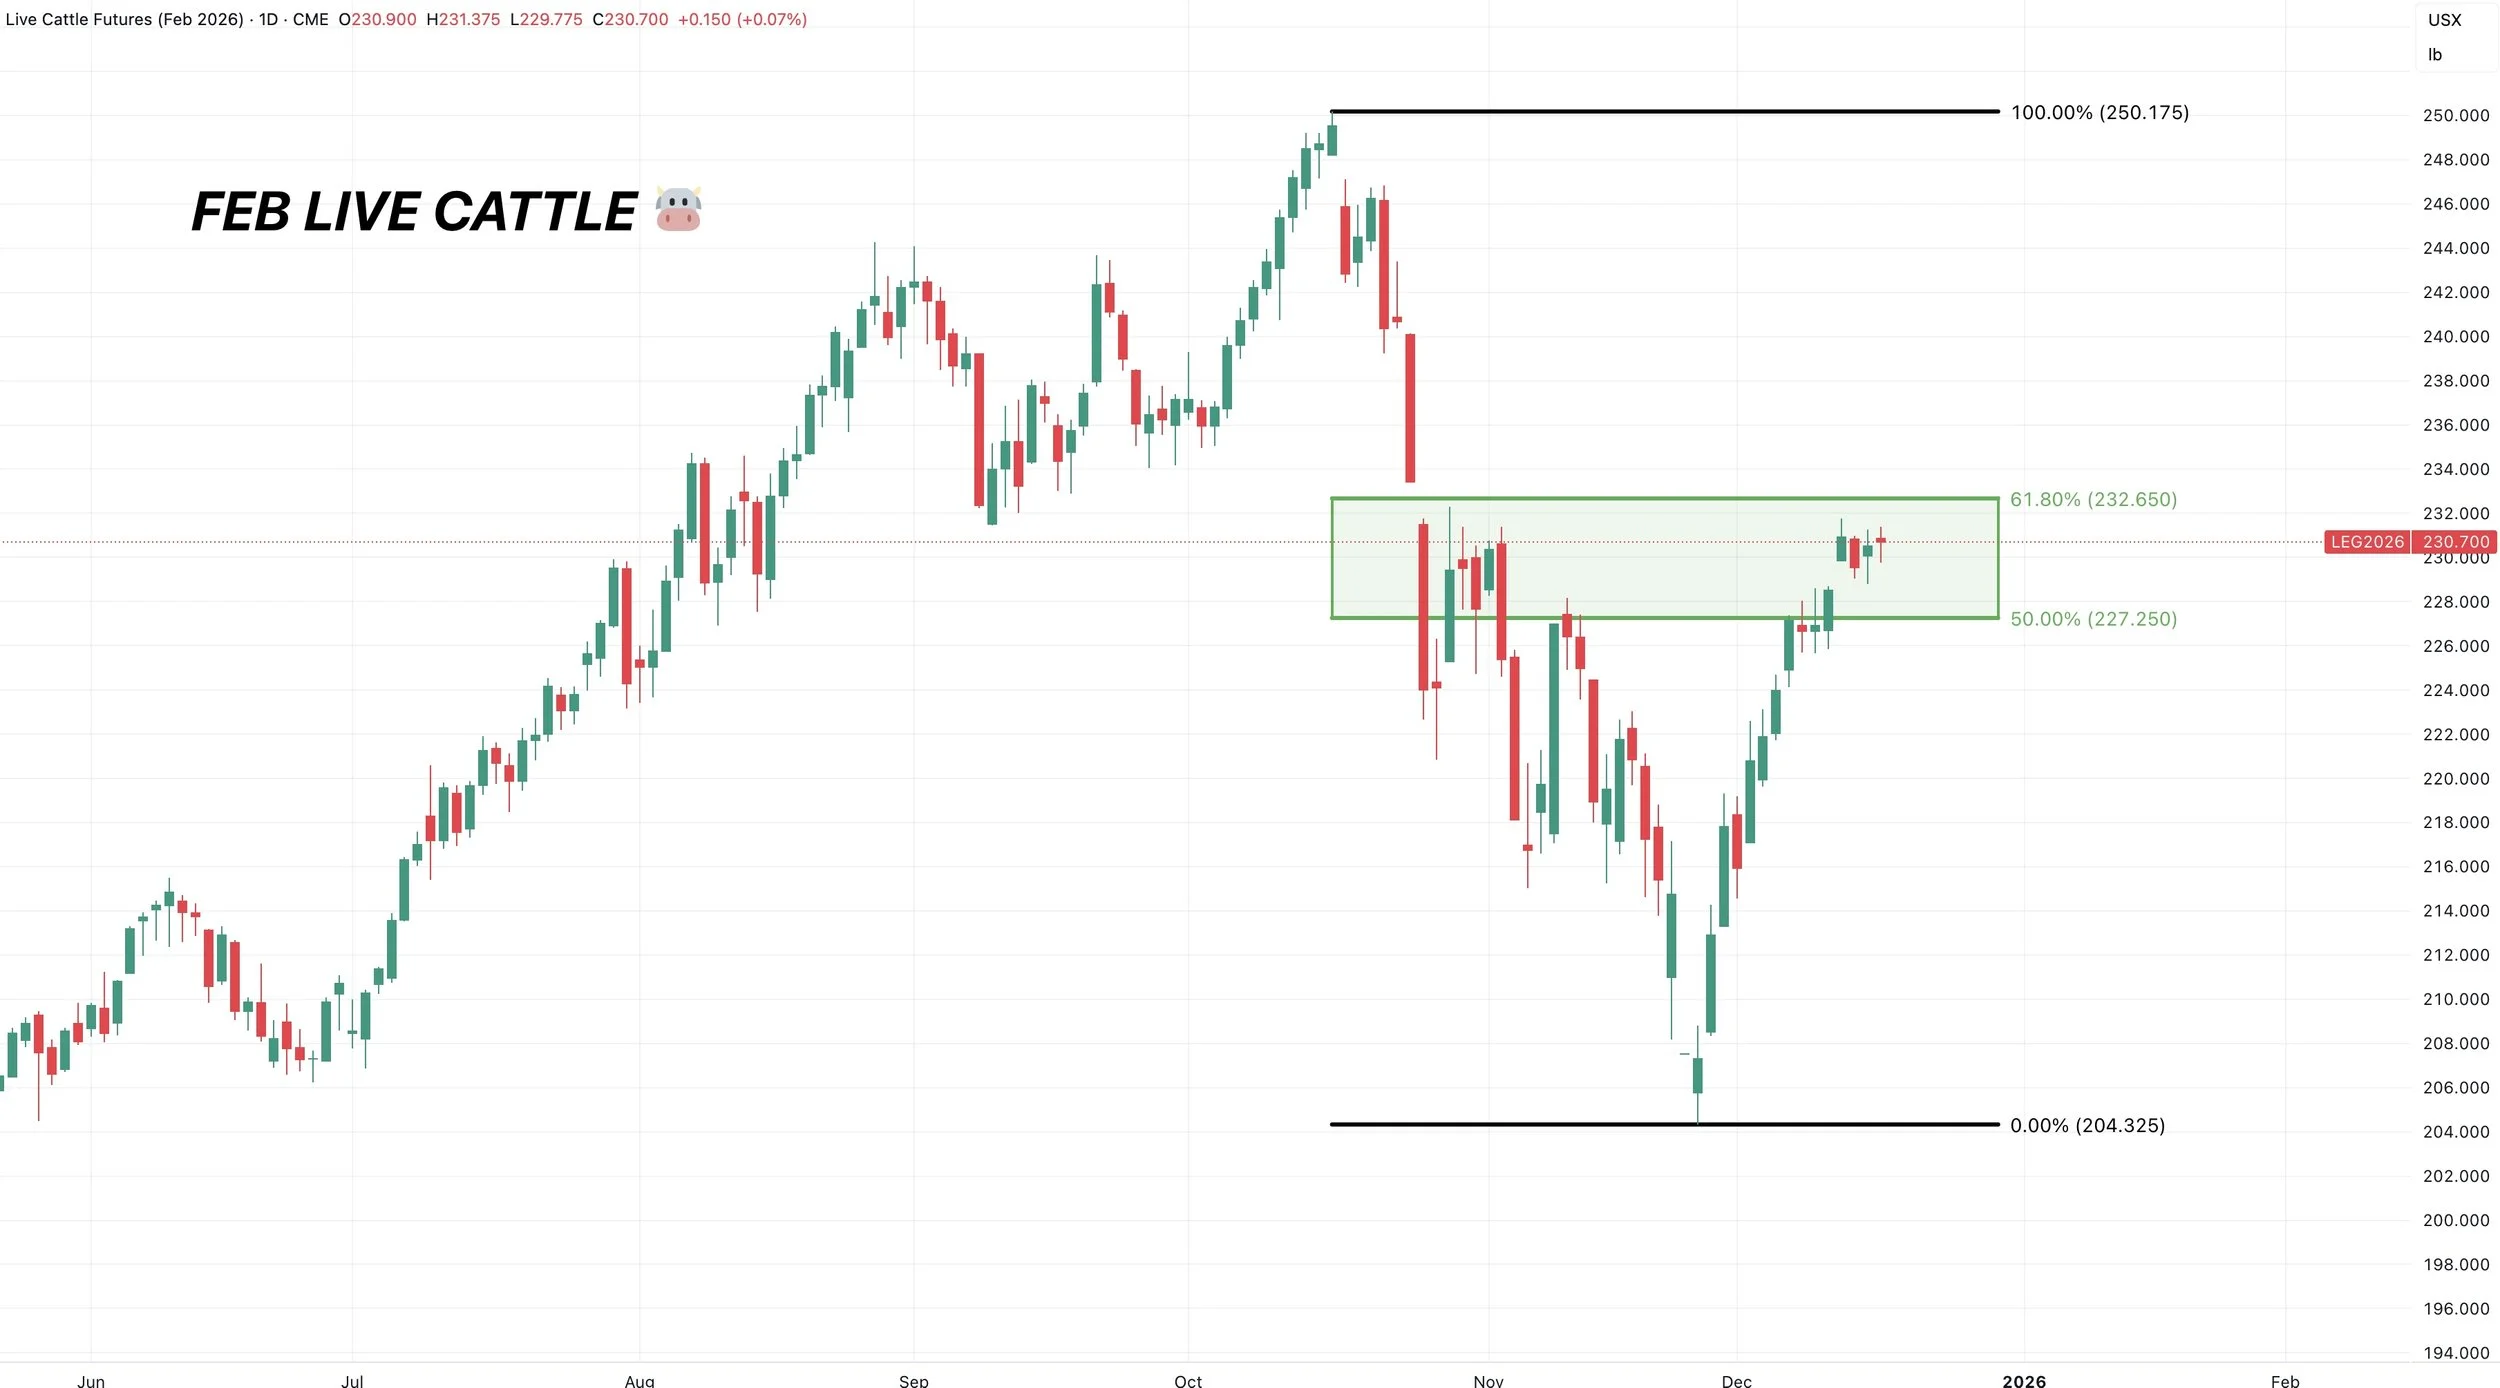
Feb Live
Overall I still like rewarding this rally if you have not.
Which is why we alerted a sell signal and hedge alert last Thursday following the gap open higher.
We are still sitting in the golden zone.
Which is the area where the market often has a big decision to make and where most relief bounces fail.
If you take out the 61.8% level then it would suggest this is more than a relief bounce. But for now, that is what it is viewed as.
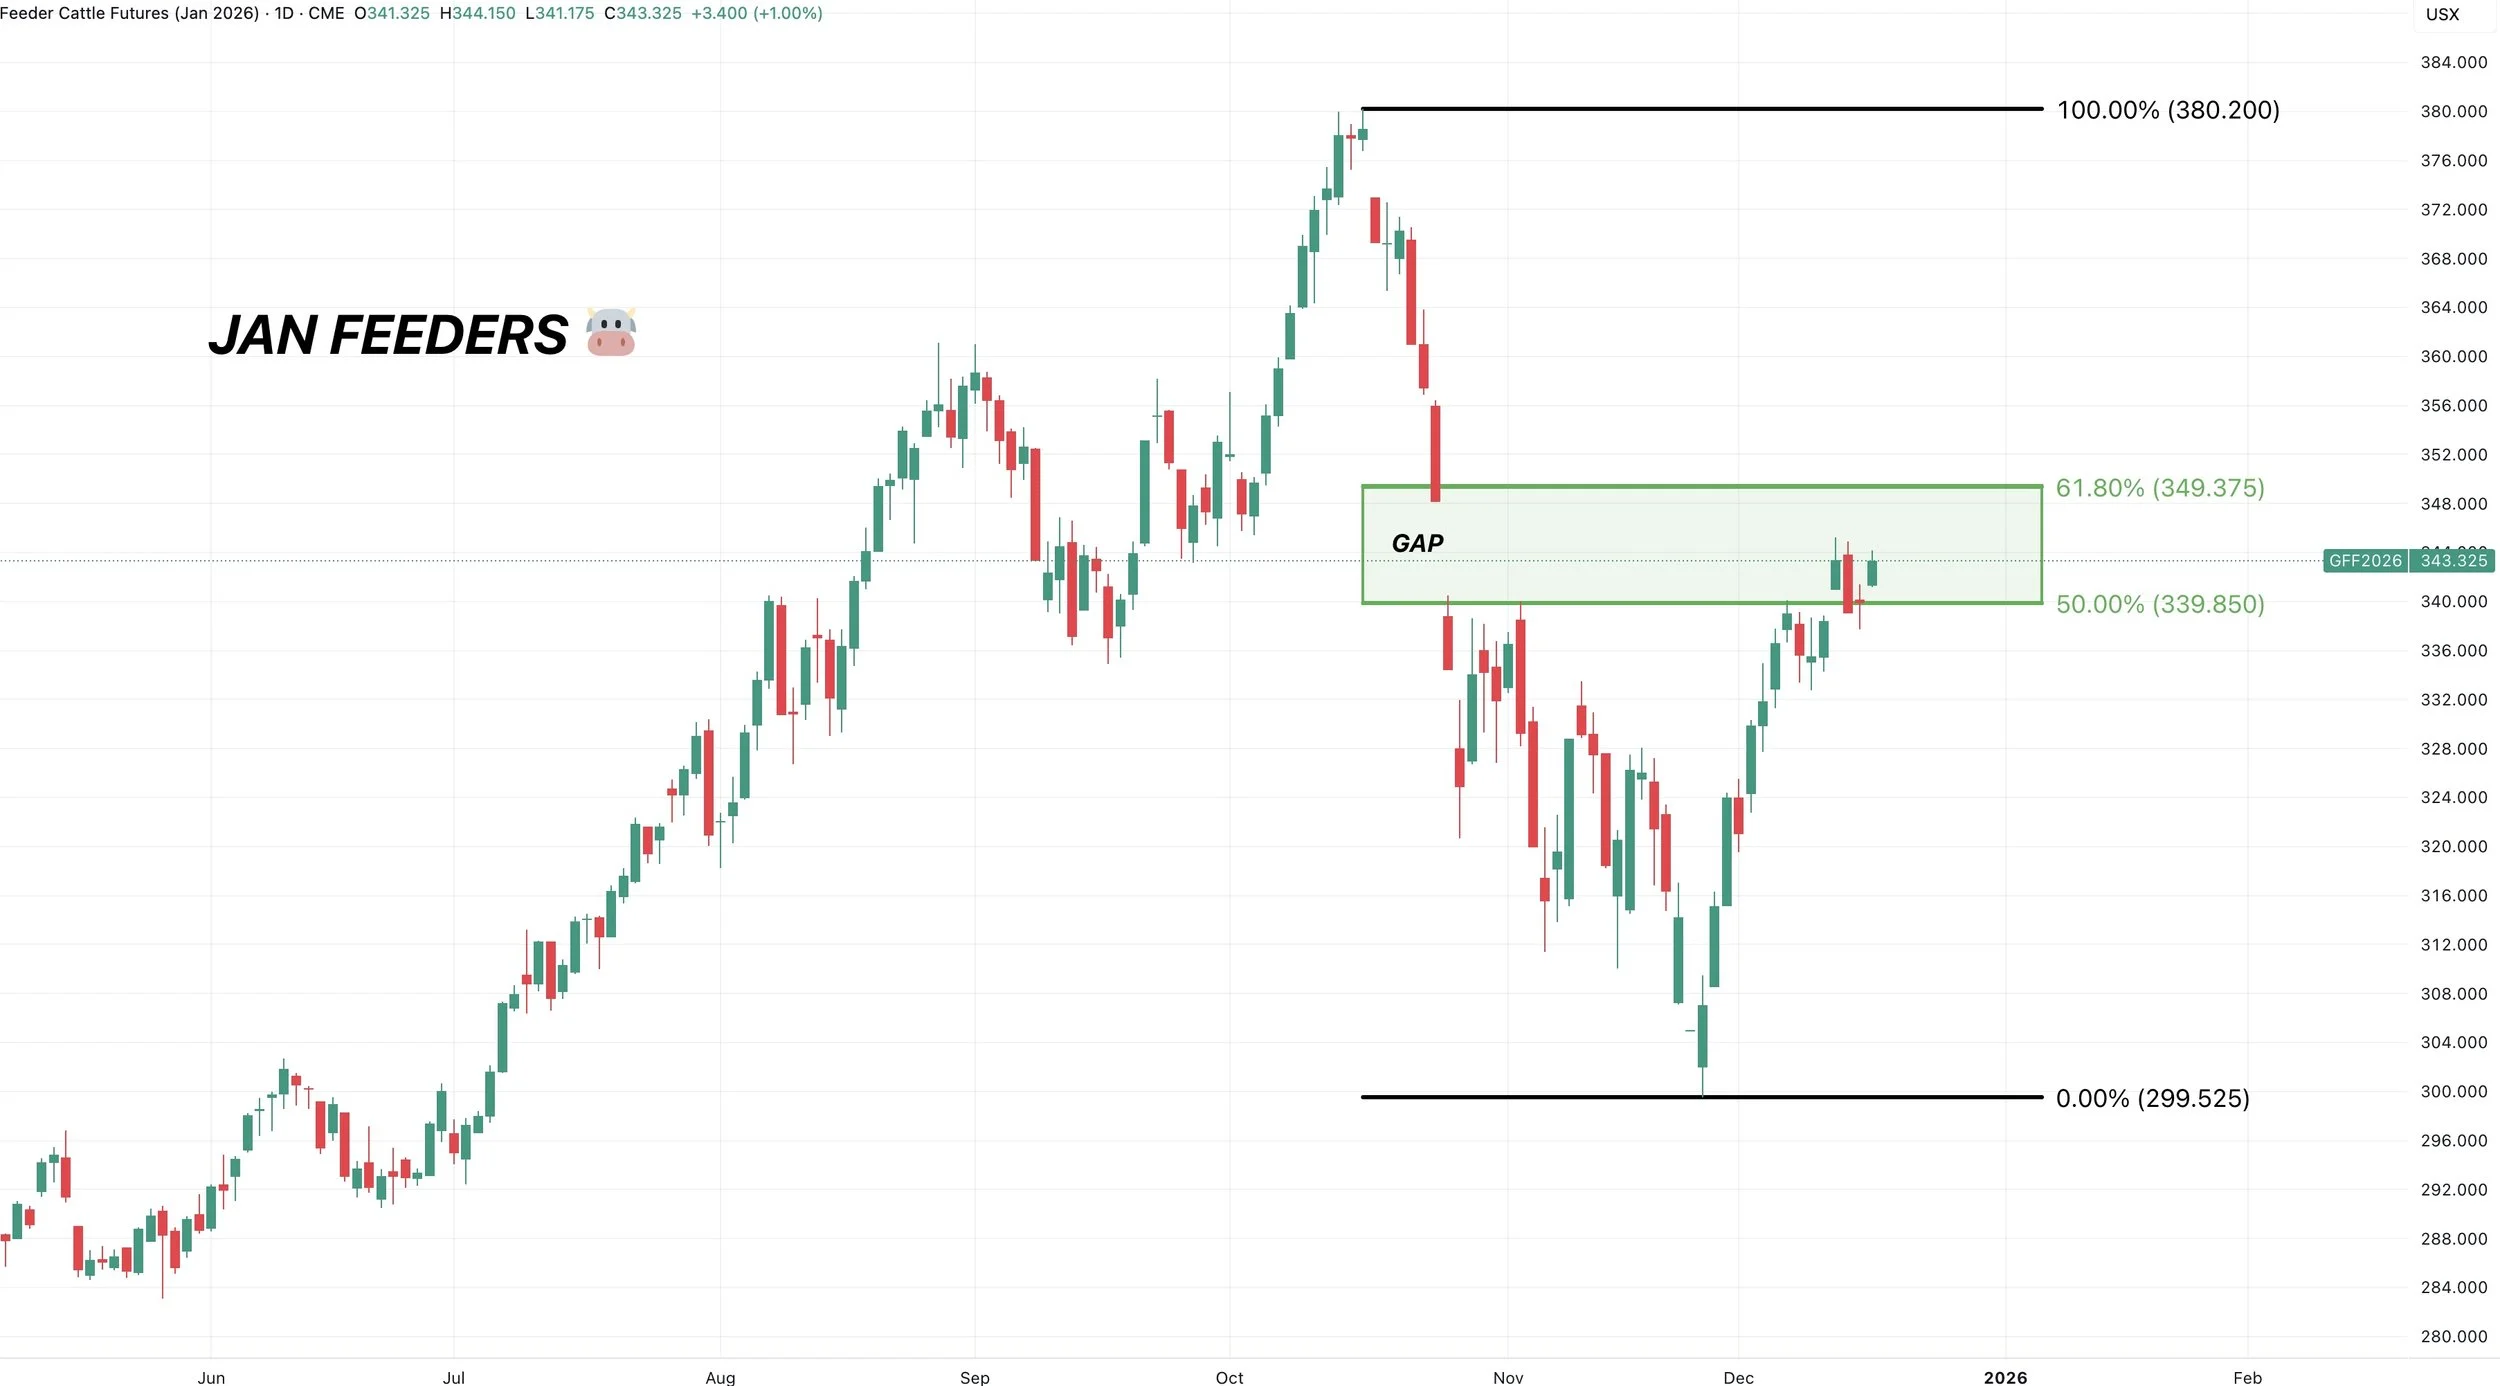
Jan Feeders
Feeders are also still sitting right in the golden zone.
We do still have a potential exhaustion gap from last week.
Where we gapped open higher after a big rally and then filled it.
This doesn’t mean we have to fall apart or can’t go higher.
It's often just a warning sign that momentum is slowing.
So just another reason to be careful up here.
What an exhaustion gap is:
Gap open higher after a big move
We filled the gap instead of pushing higher
Often marks the end of a trend
Momentum could be getting tired
Past Sell or Protection Signals
Dec 11th: 🐮
Cattle sell signal & hedge alert.
Dec 5th: 🐮
Cattle sell signal & hedge alert.
Nov 17th: 🌱
Soybean sell signal & hedge alert.
Nov 13th: 🌽 🌱
Managing risk in corn & beans ahead of USDA report.
Oct 28th: 🌽
Corn sell signal & hedge alert.
Oct 27th: 🌱
Soybean sell signal & hedge alert.
Oct 13th: 🐮
Cattle sell signal & hedge alert.
Aug 22nd: 🌱
Soybean sell signal & hedge alert.
July 31st: 🐮
Cattle sell signal & hedge alert.
July 10th: 🐮
Cattle sell signal & hedge alert.
CLICK HERE TO VIEW
June 5th: 🐮
Cattle sell signal & hedge alert.
June 2nd: 🌾
MPLS wheat sell signal.
April 10th: 🌽
Old crop corn sell signal.
March 19th: 🐮
Cattle hedge & sell signal.
Feb 18th: 🌽 🌾
Old crop KC wheat & old crop corn signal.
Jan 23rd: 🌽 🌱
Corn & beans old crop sell signal.
CLICK HERE TO VIEW
Jan 15th: 🌽 🌱
Corn & beans hedge alert/sell signal.
Jan 2nd: 🐮
Cattle hedge alert at new all-time highs & target.
Dec 11th: 🌽
Corn sell signal at $4.51 200-day MA
CLICK HERE TO VIEW
Oct 2nd: 🌾
Wheat sell signal at $6.12 target
Sep 30th: 🌽
Corn protection signal at $4.23-26
Sep 27th: 🌱
Soybean sell & protection signal at $10.65
Sep 13th: 🌾
Wheat sell signal at $5.98
May 22nd: 🌾
Wheat sell signal when wheat traded +$7.00
Want to Talk?
Our phones are open 24/7 for you guys if you ever need anything or want to discuss your operation.
Hedge Account
Interested in a hedge account? Use the link below to set up an account or shoot Jeremey a call at (605)295-3100.