
BIG SPOT FOR CORN. WHERE IS CATTLE FLOOR?
MARKET UPDATE
You can scroll to read the usual update as well. As the written version is the exact same as the video.
Timestamps for video:
Overview: 0:00min
Corn: 3:00min
Beans: 8:15min
Wheat: 12:00min
Cattle: 12:40min
Want to talk about your situation?
(605)250-3863
Futures Prices Close
Overview
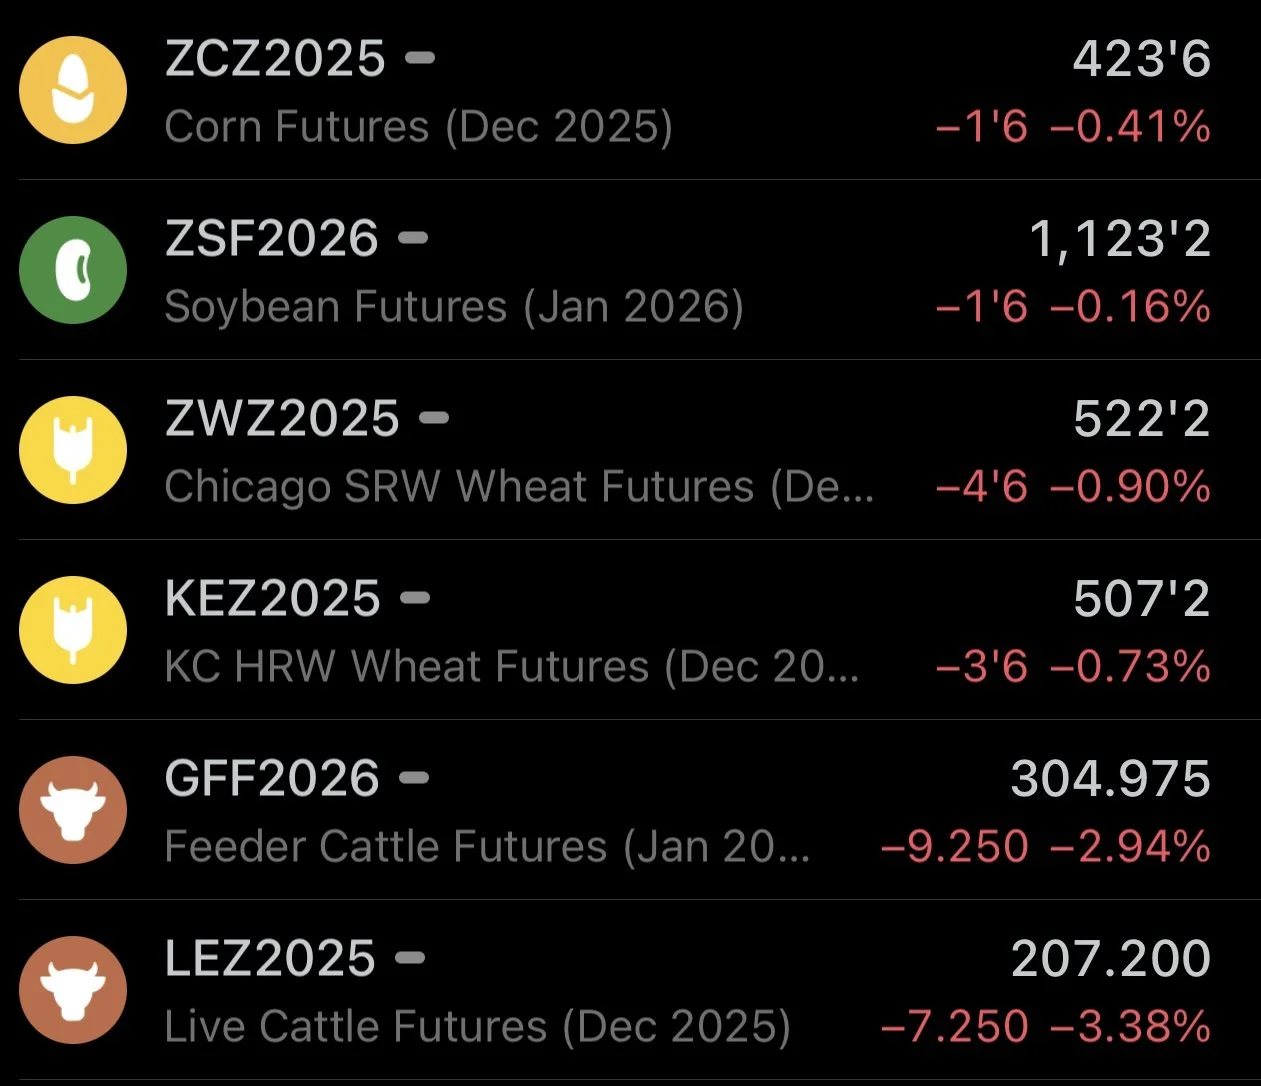
Grains softer to start the holiday week with first notice day on Friday.
Meanwhile, the cattle market opened limit down across the board due to Tyson foods shutting down one of their beef plants. Despite what most would consider a bullish cattle on feed report being released on Friday.
Since Thanksgiving is this week. The market has a different schedule than normal.
This Week’s Market Schedule
🟢 Tomorrow: Normal
🟢 Wednesday: Normal
🔴 Thursday: Closed
🟠 Friday: Opens at 8:30am CT and closes early at 12:05pm CT
First notice day is on Friday for Dec futures.
We will have an update out tomorrow. We will not have an update on Thursday with the holiday. Wednesday and Friday have yet to be determined, depending on what happens in the markets.
News
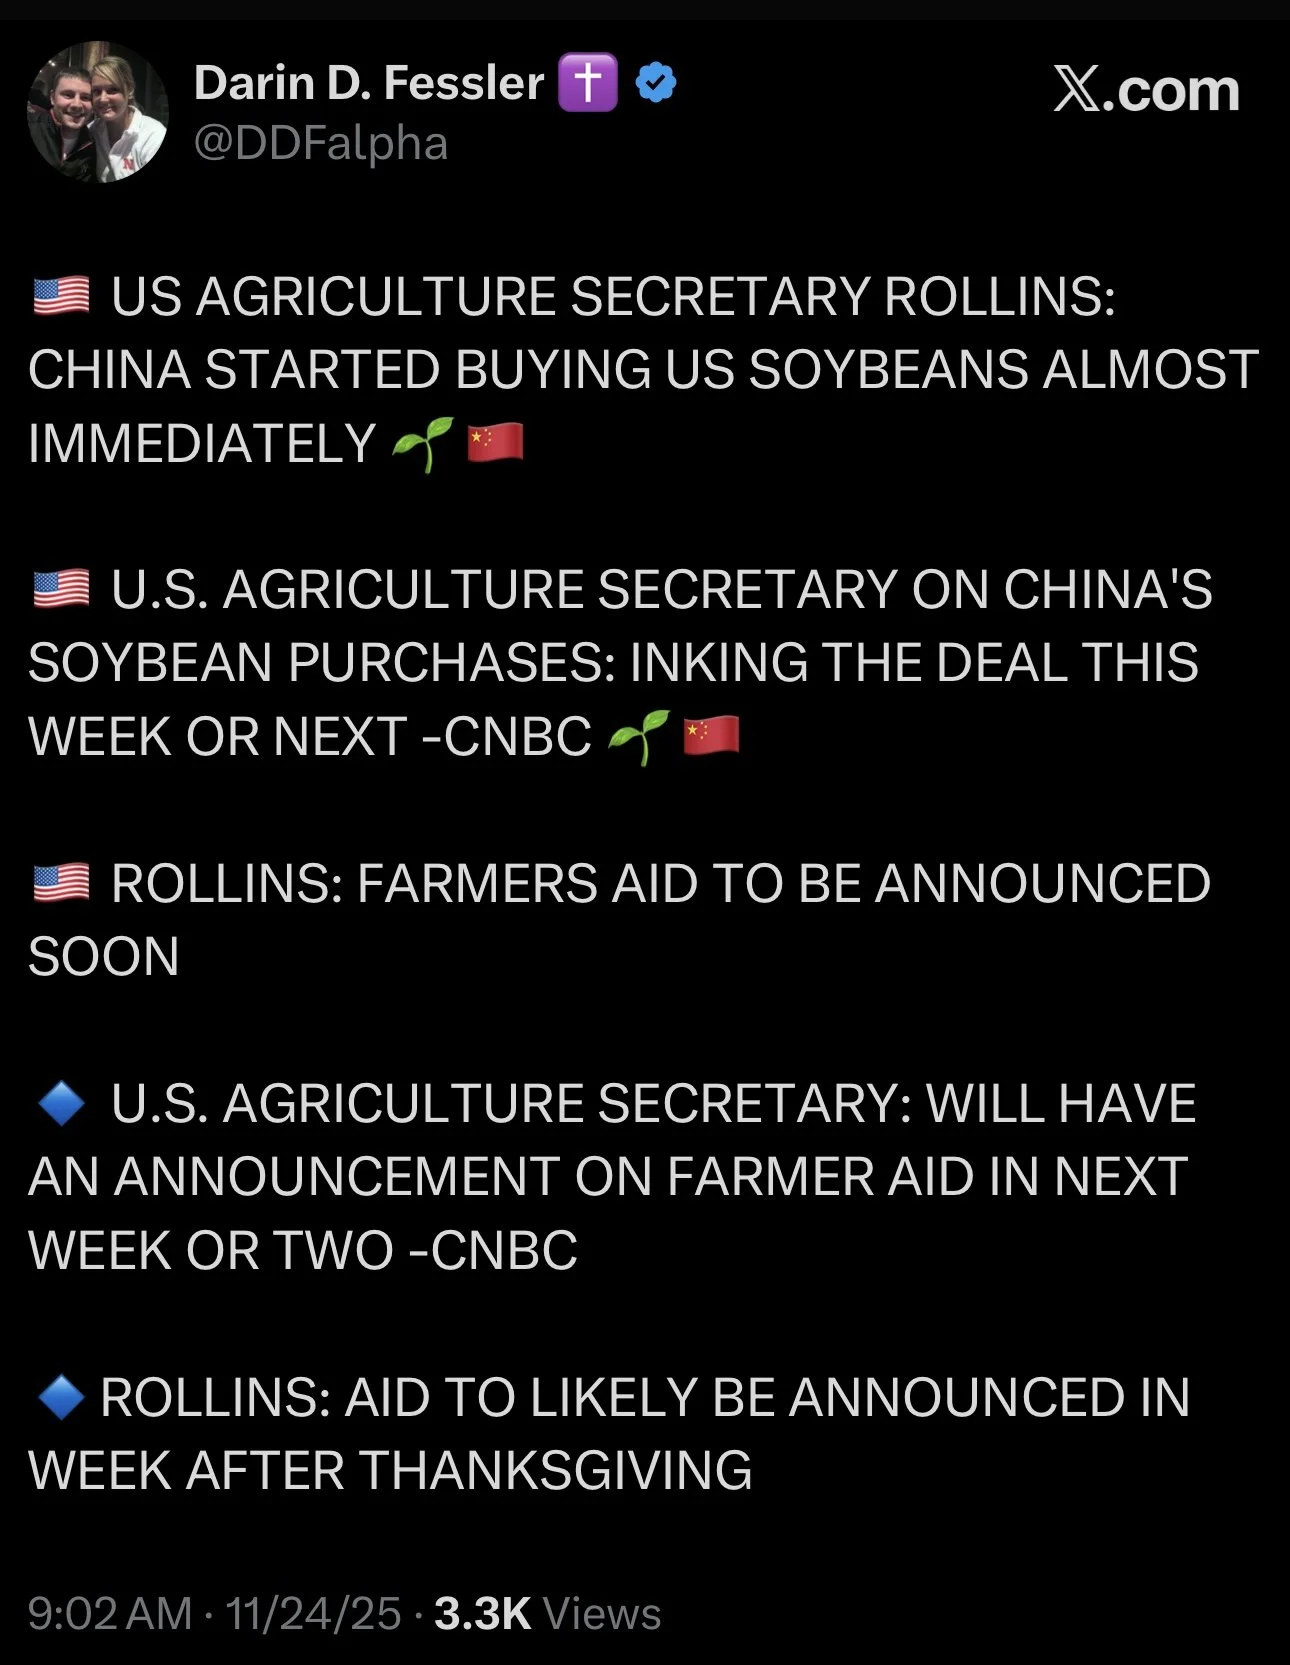
As for news, US Ag Secretary Rollins made some statements about China as well as the farmer aid.
She said they would be inking a Chinese deal this week or next week.
She also said that the farmers aid will be announced in the next two weeks, likely the week after thanksgiving.
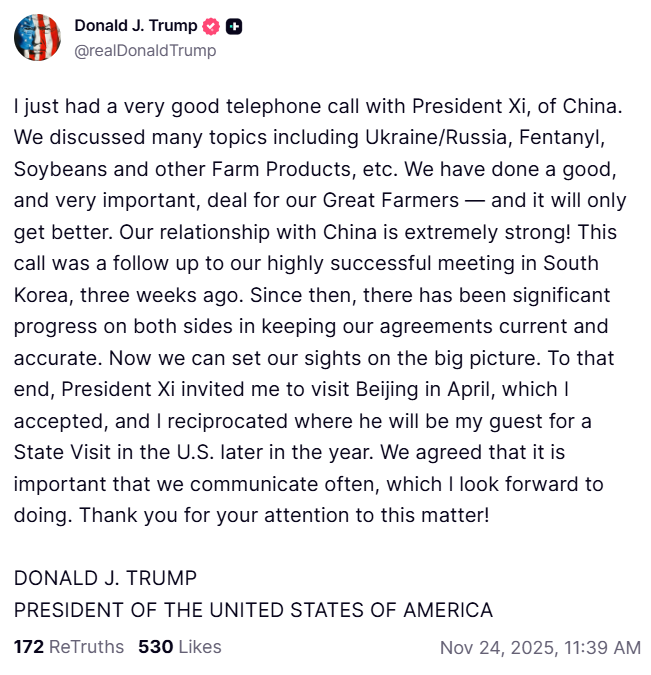
Trump and China's President has a phone call this morning that apparently went very well.
In his tweet this morning, he did mention soybeans, and how soybeans were a topic of discussion during the call.
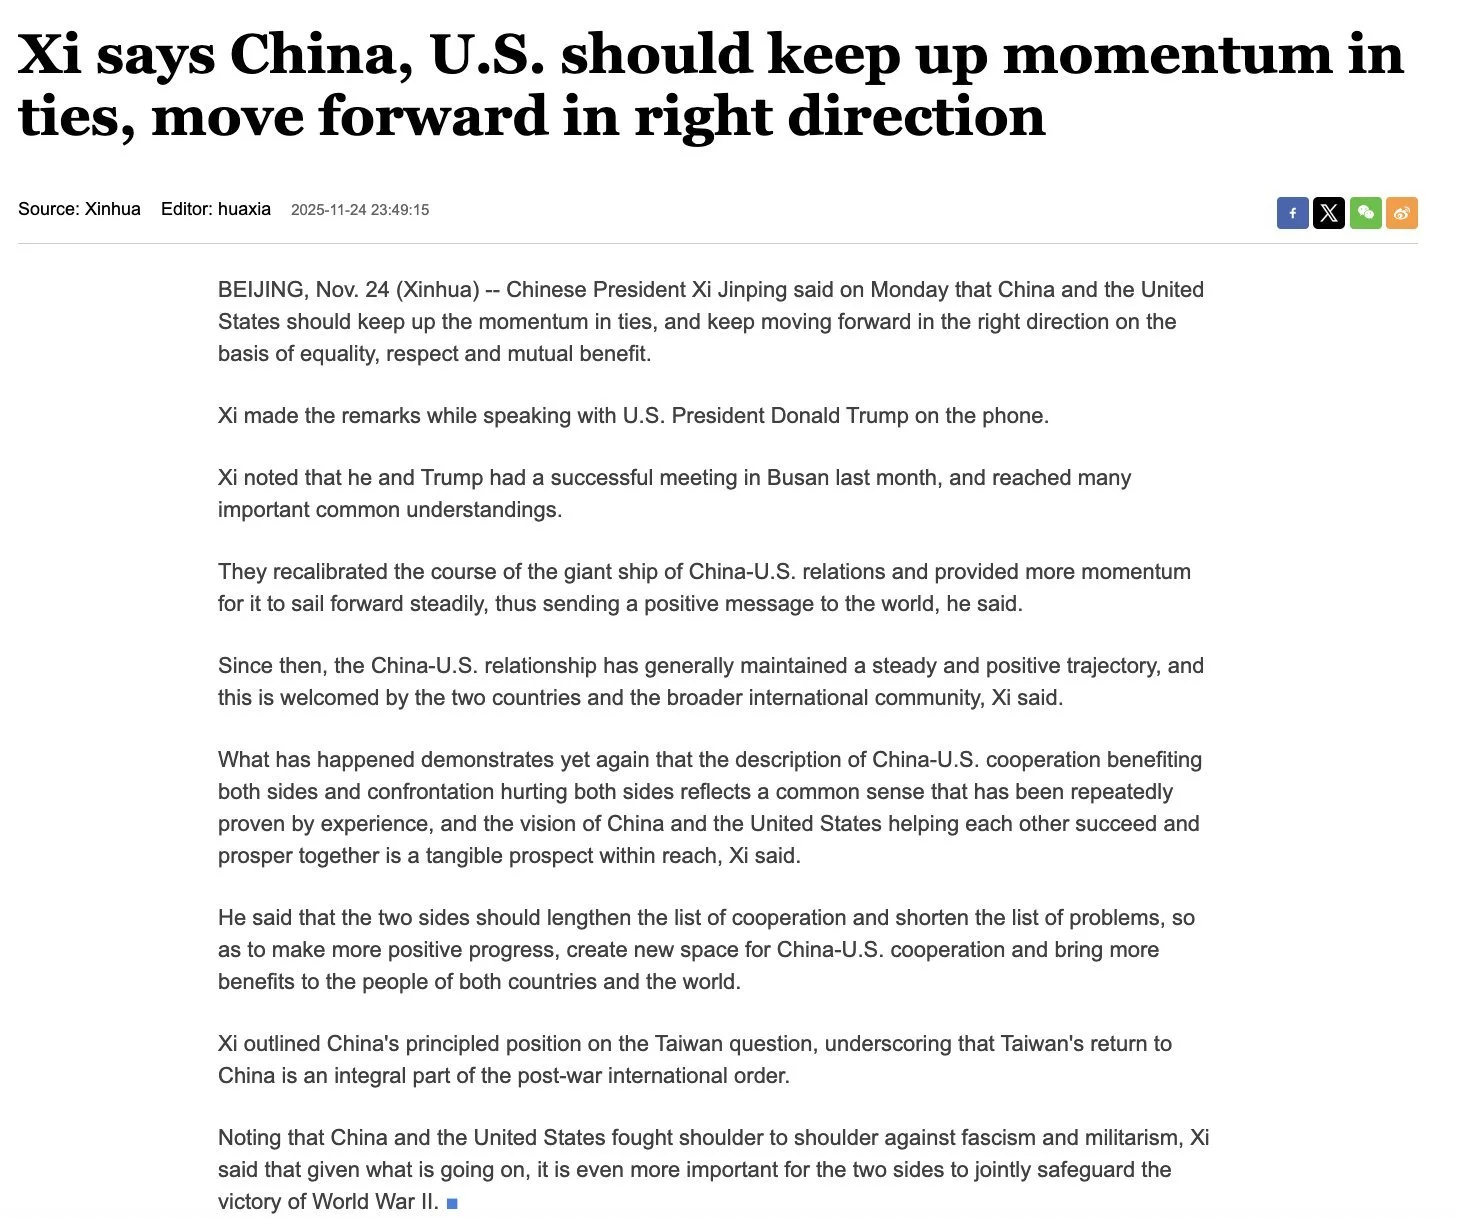
However.. this is what China's President said about the Trump call.
He didn’t mention soybeans at all.
A few weeks ago the market would’ve rallied about Trump posting about soybeans.
Today the market didn’t seem to care.
We had a quick +7 cent spike up but ultimately gave it right back.

We saw yet another flash sale of soybeans to China.
However, it wasn’t a monster amount. Only 123k metric tons.
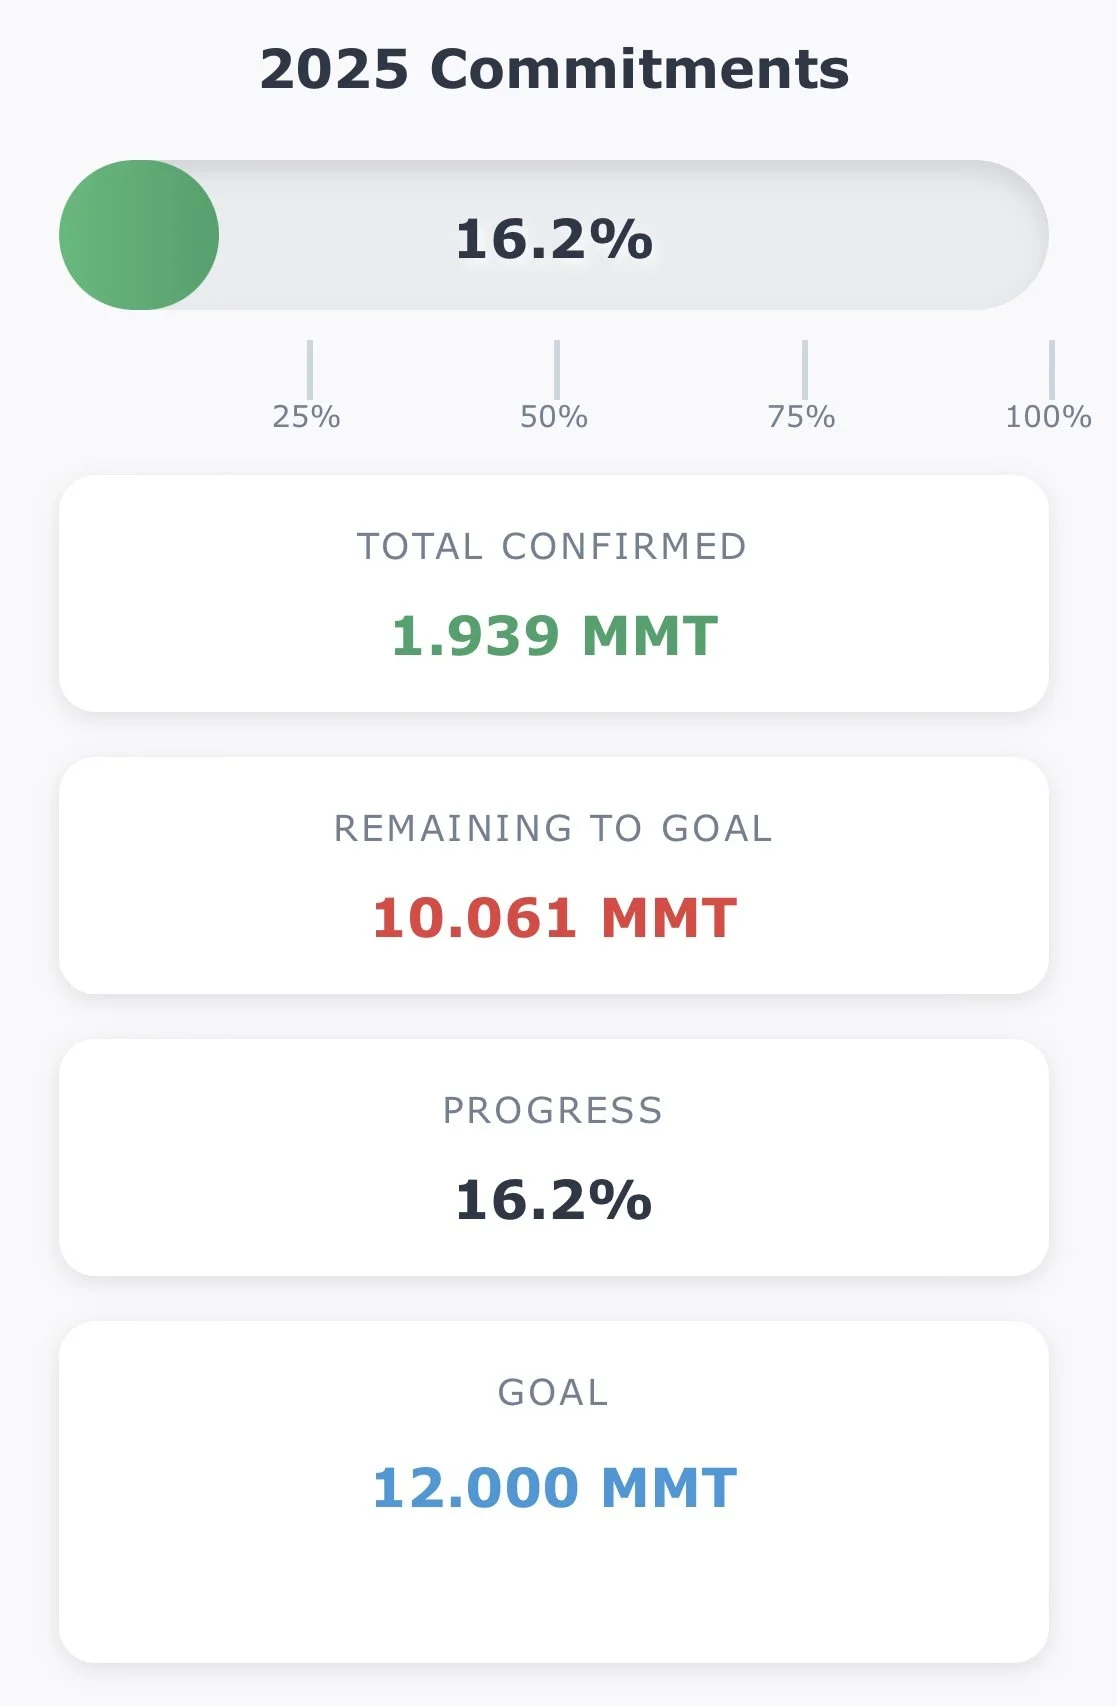
They have now bought a confirmed 1.94 million metric tons of the 12 million they agreed to buy.
Which is 16.2% of the goal.
Here are some nice visuals from GrainStats.

Export Inspections
Export inspections were released this morning.
Corn continues to impress.
This was the best week in over 30 years.
Through the first 12 weeks of the marketing year, corn inspections are up a massive +72% vs last year.
Sitting at a massive record number.
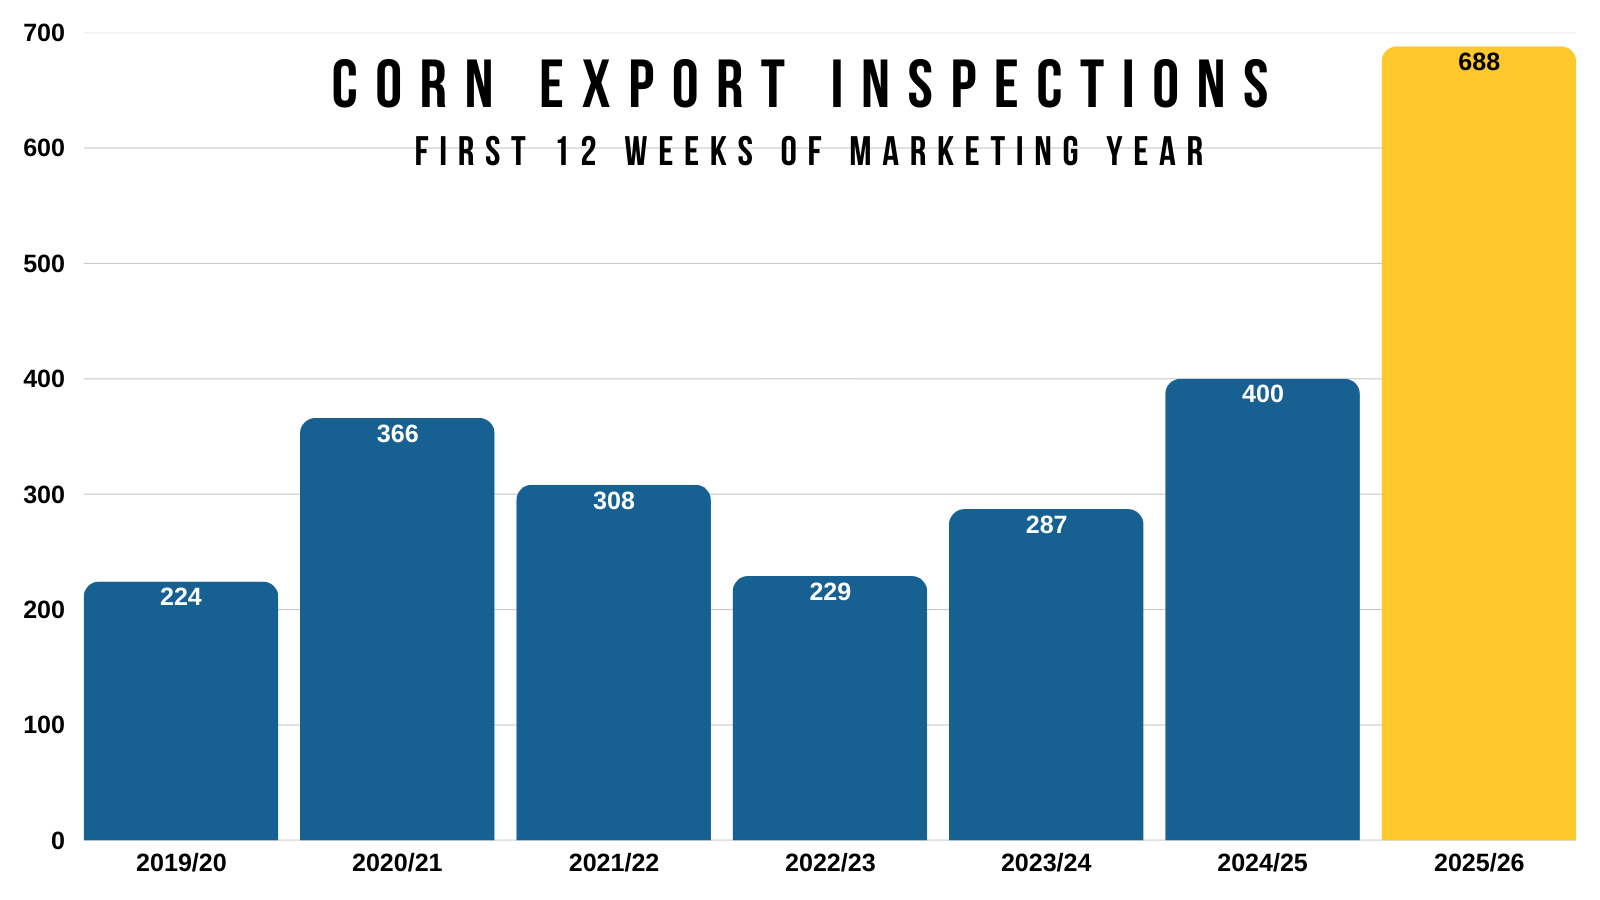
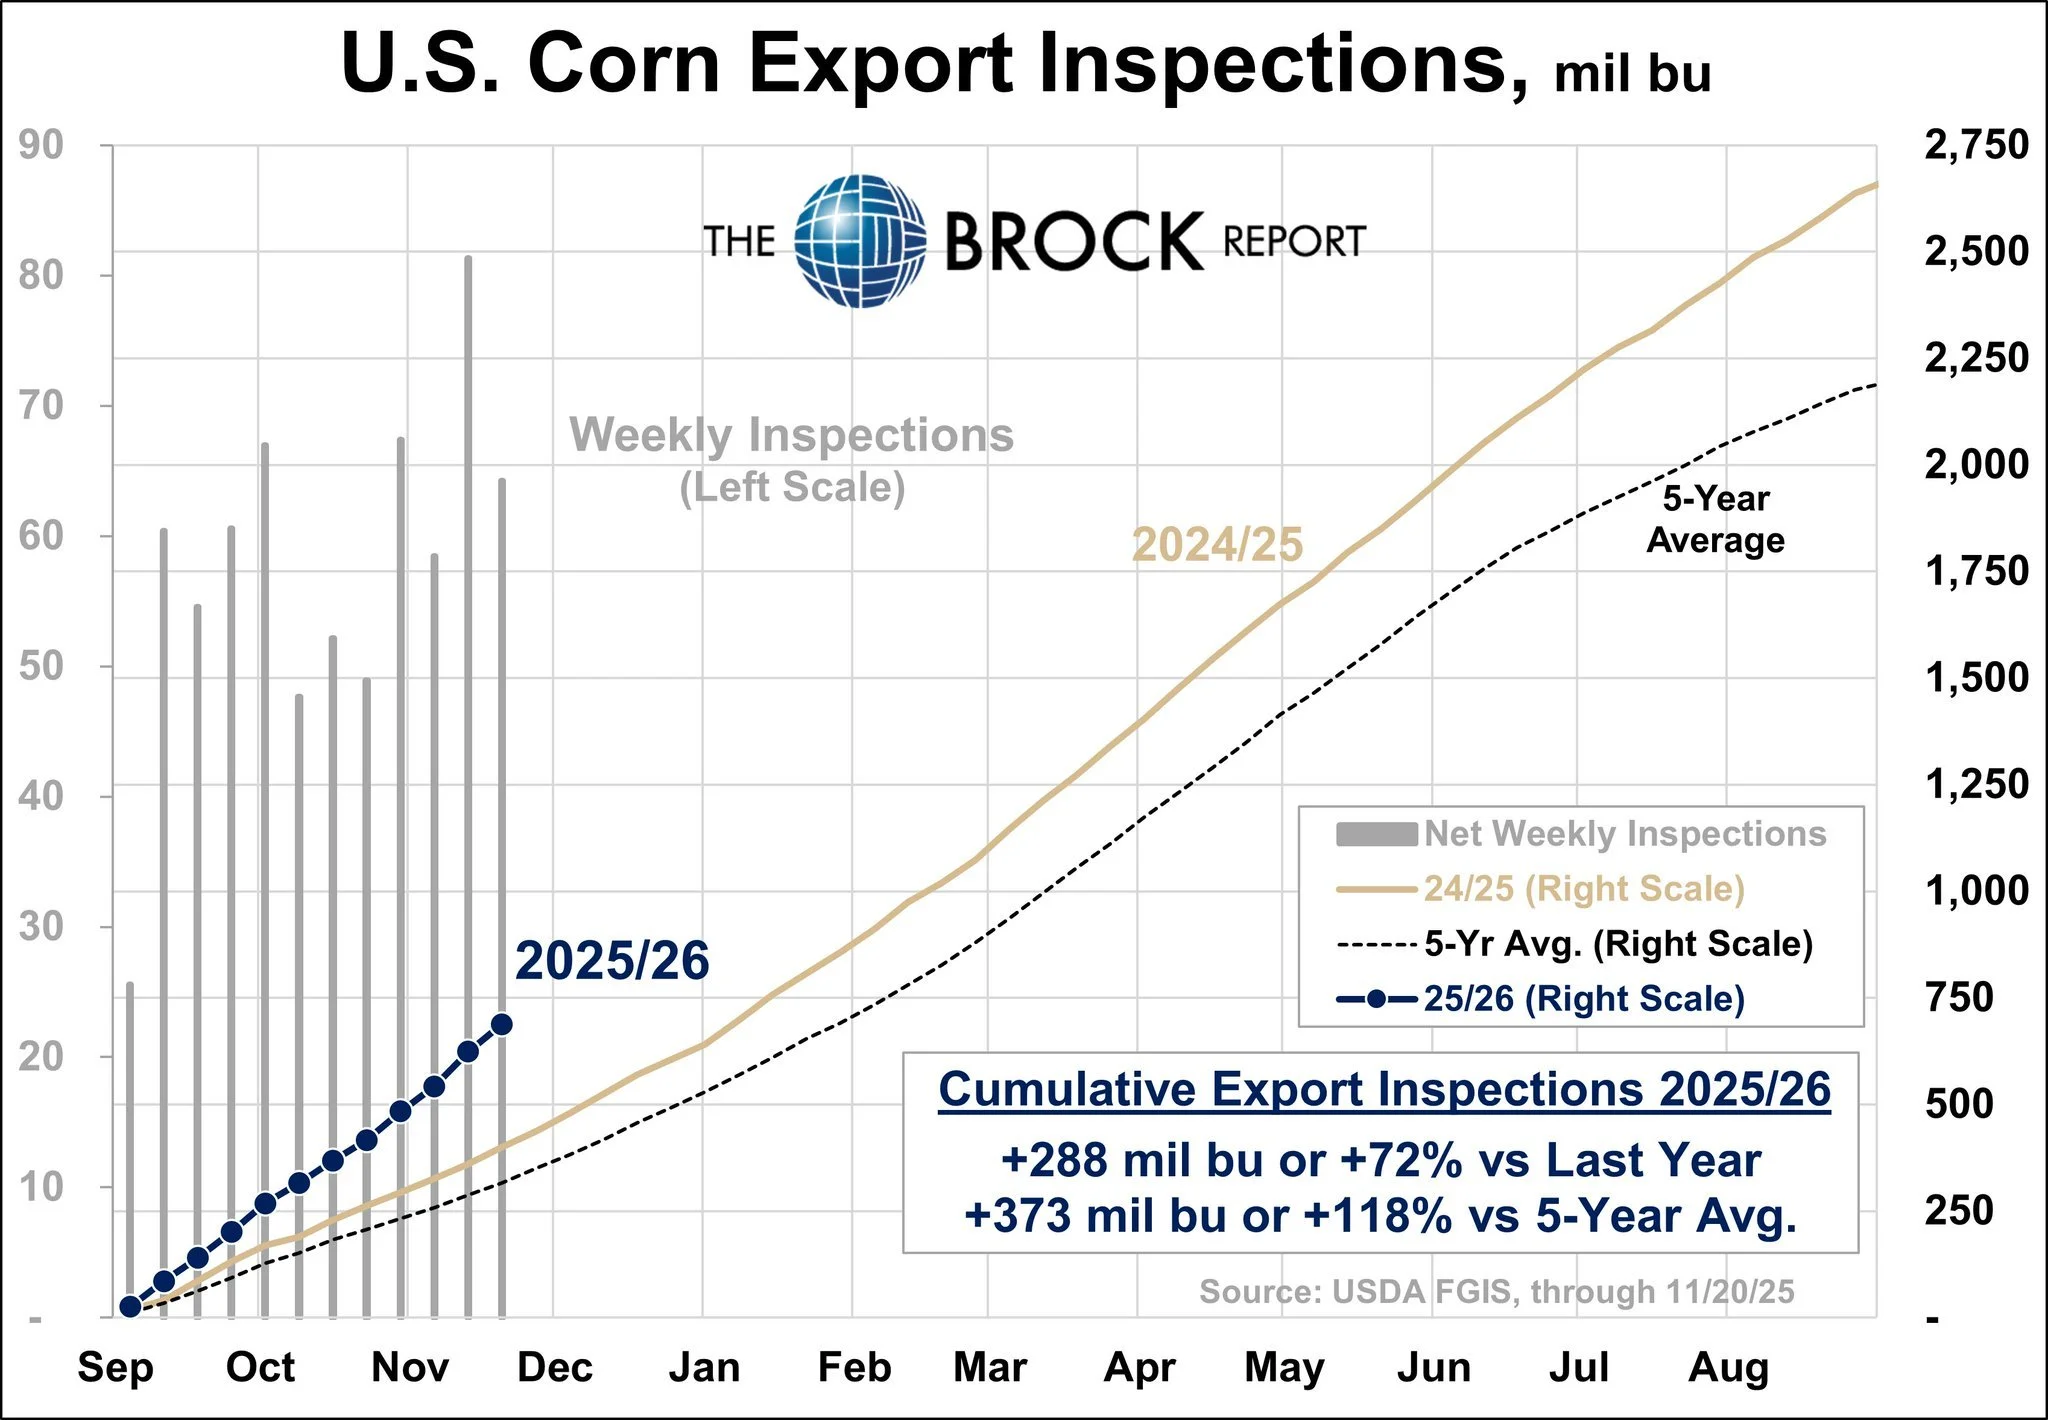
Here is nice visual from the Brock Report.
Not only are inspections up massively compared to last year.
They are up nearly a whopping +120% compared to the 5-year average.
Soybeans on the other hand continue to disappoint.
Inspections were some of the lowest in two decades.
Up this point, inspections are some of their worst on record.
Soybean inspections are down -45% vs last year.
Also down -45% vs the 5-year average.
Traders might be starting to doubt us hitting the USDA export estimates.
Despite the flash sales, we have still yet to actually ship a single bushel of soybeans to China in the inspections.
The last time we shipped any was back in May.

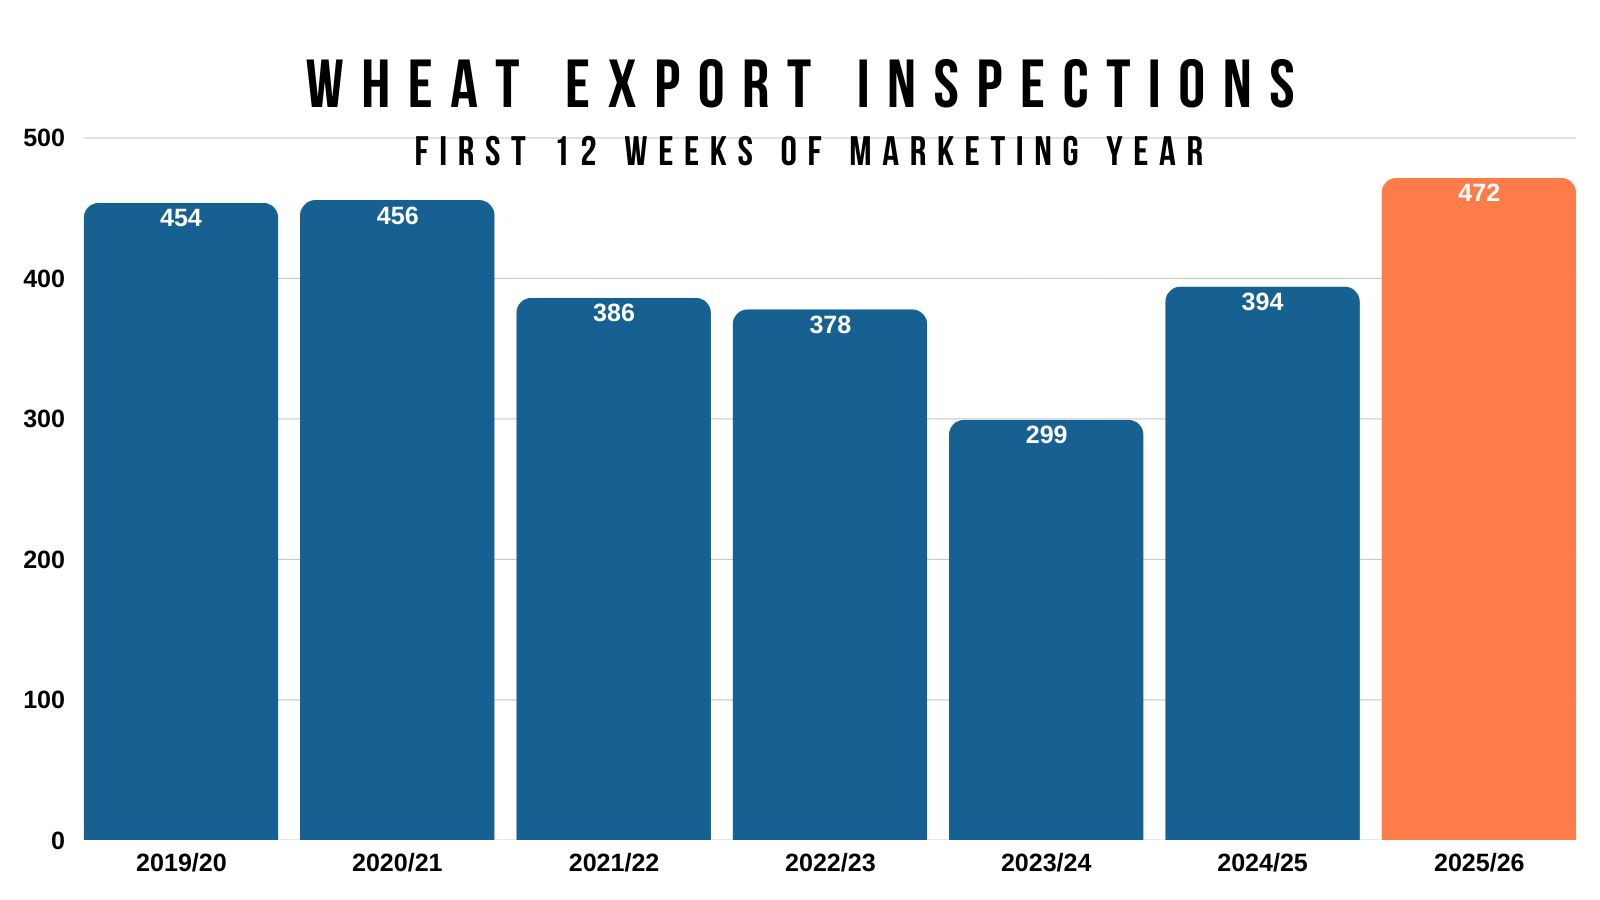
Wheat inspections still remain strong.
Sitting +20% better than last year.
Today's Main Takeaways
Corn
Fundamentals:
We have first notice day on Friday.
So all of those basis contracts have to be priced or rolled beforehand.
Often times, this pressures the market. Especially in a bear market.
That has been a large part of the recent weakness.
Once that first notice day pressure is out of the way, that nature sell pressure lifts off the market.
Now corn has less upside "potential" than soybeans.
I mean we just have too large of supply to get super bullish on the corn market.
Unlike soybeans, there is a less clear pathway to tremendously higher prices.
I am not saying soybeans "have" to scream higher either. Soybeans just have factors such as China, the US crop, and the Brazil crop. All with the potential to drastically shake things up in a bigger way.
US corn production is going to be a record no matter what. It's up over 10% vs last year.
We'd still have record production even if yield fell to 180 and even 175 like we've discussed several times.
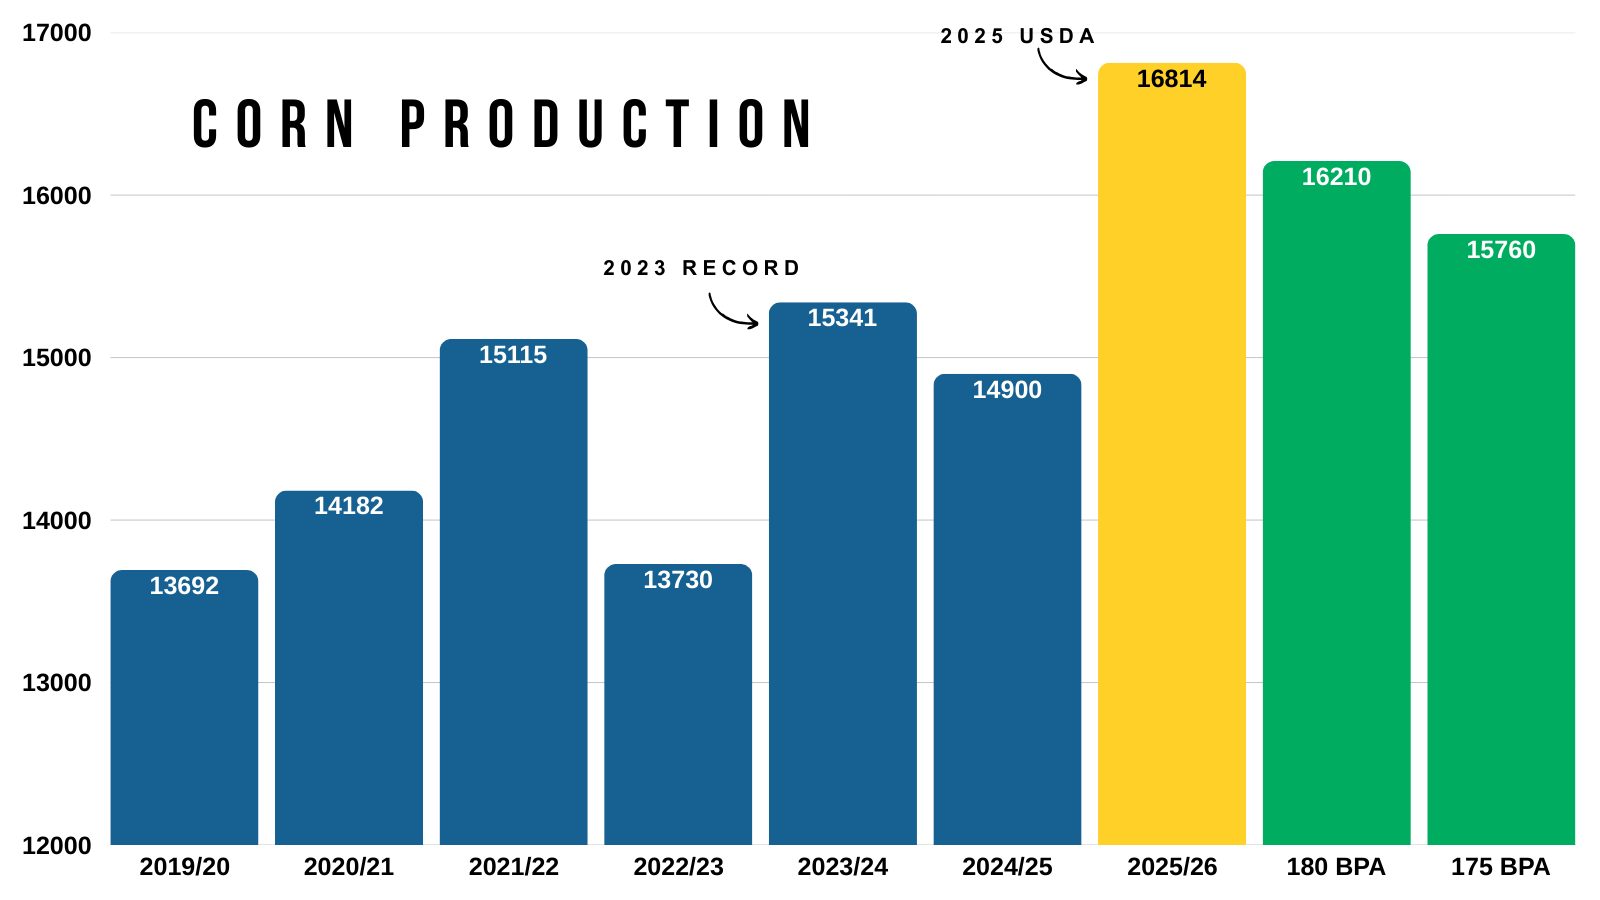
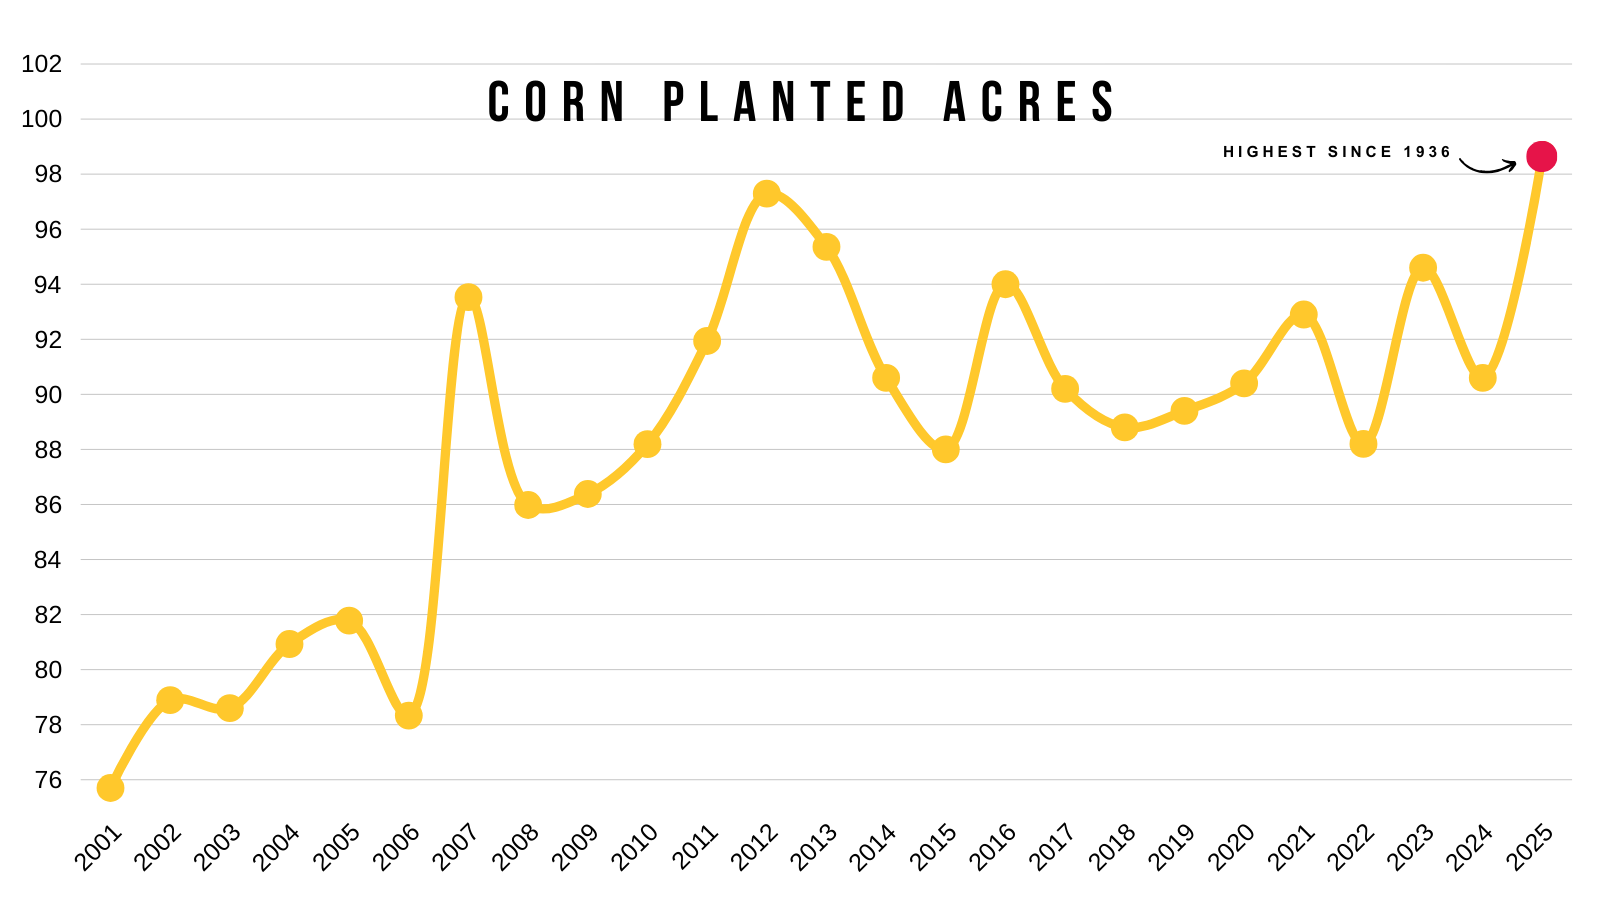
This is largely due to the fact we are looking at record acres.
Just because we have a massive crop here in the US doesn’t mean I'm bearish corn. Our upside is just somewhat limited here.
Like we've talked about several times, corn can’t too cheap here without creating even more demand.
Demand should help keep corn from getting too cheap, hence why we can’t get too bearish.
Things can change drastically by next summer, such as a weather scare. But I am talking about right now.
The only way to get extremely bullish on corn is if one of the following happens:
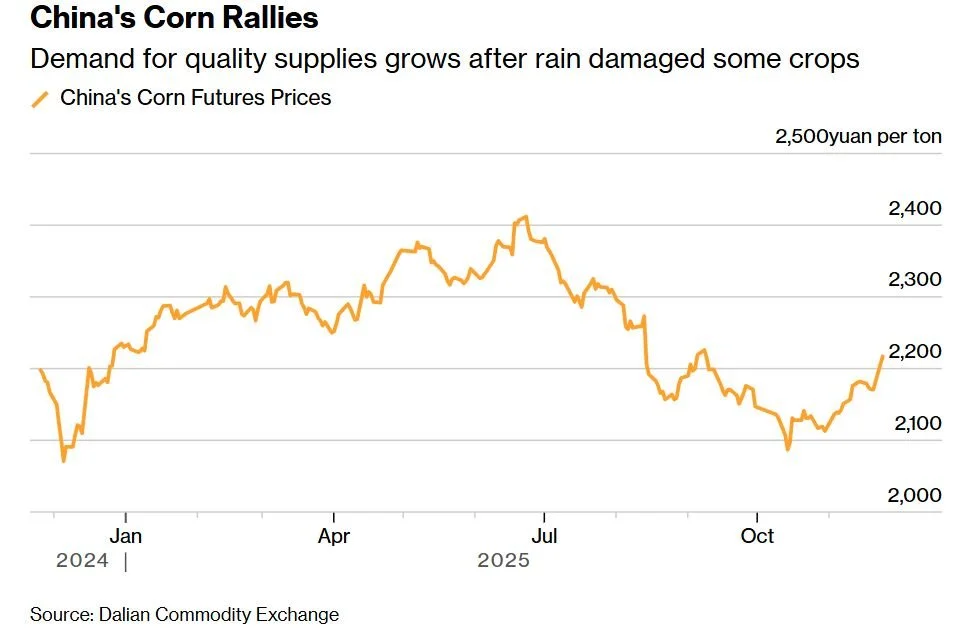
1) China for whatever reason decides to buy corn.
I wouldn’t hold my breath on this. At all.
But China is auctioning corn and Chinese corn has been rallying.
Chart from UkrAgroConsult
2) The US crop is actually 180 or lower.
Even if yield is 183 and demand remained unchanged, it still wouldn’t paint an overly bullish scenario. With a near 1.90 billion bushel carryout.
It is more friendly than the current 2.15 billion bushel carryout we have today. But far some super bullish.
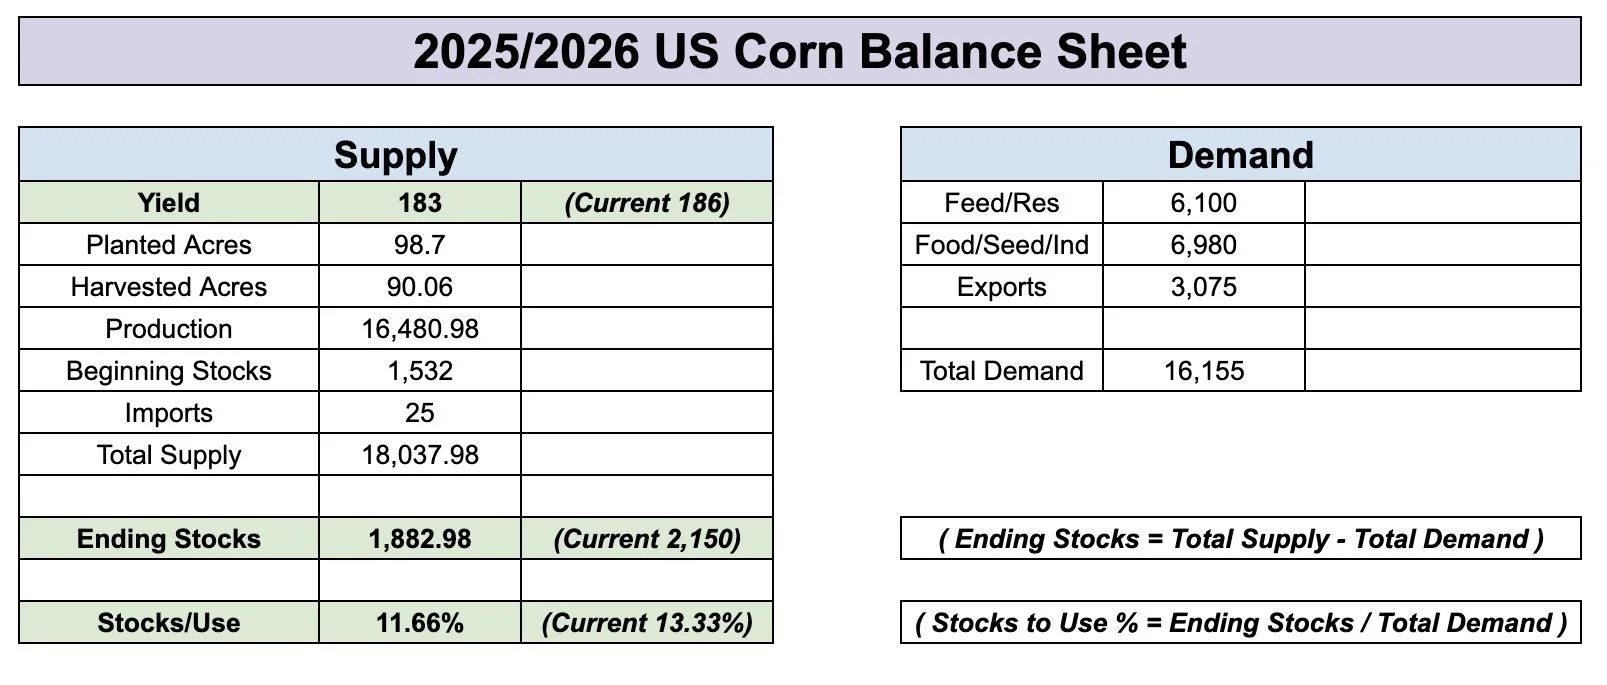
Without touching demand at all, a 180 yield gives you a 1.60 billion bushel carryout and a 10% stocks to use ratio.
This would be bullish. As anything 10% or lower is typically considered bullish.
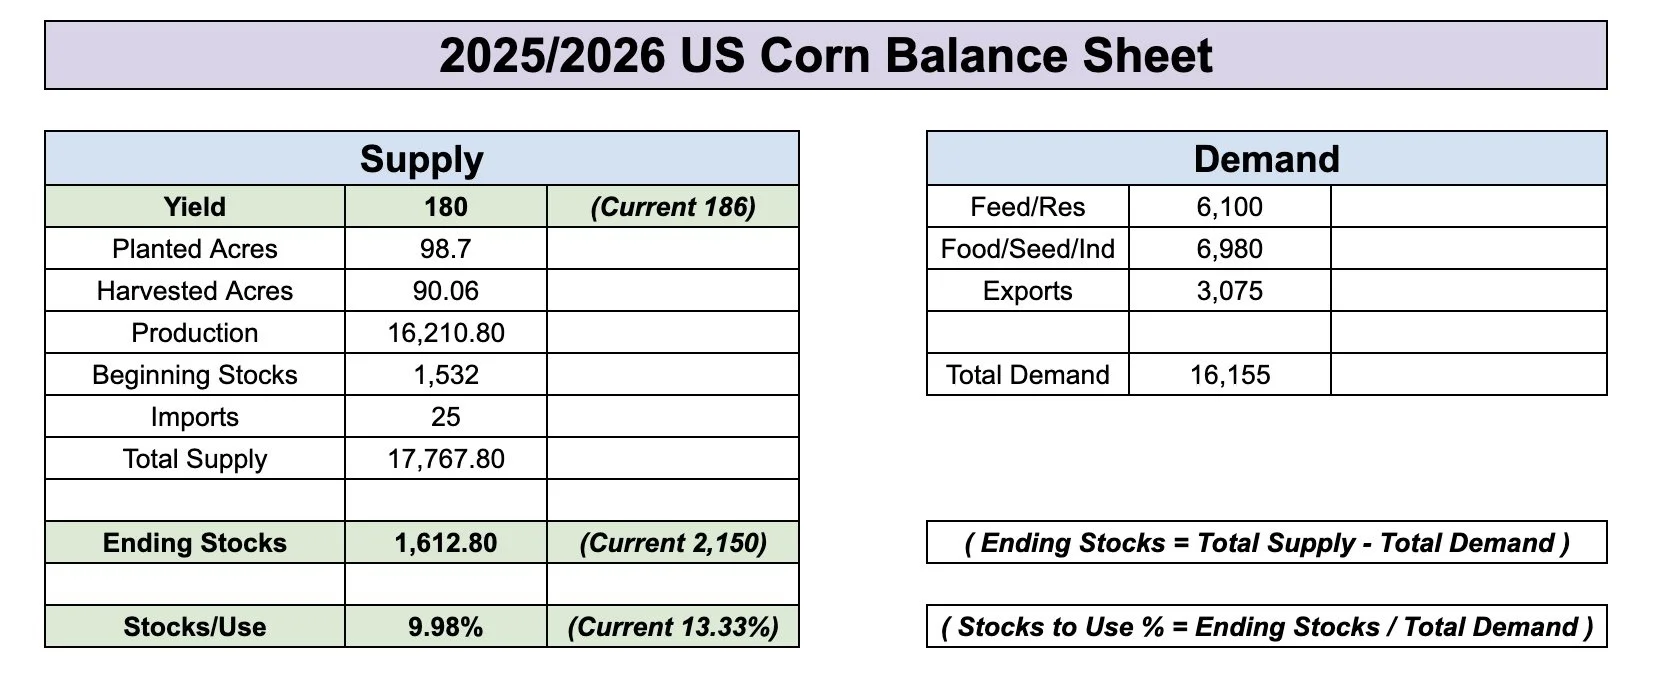
However, if the USDA drops yield, I am sure some of it will be offset by cutting demand.
Most agree feed and residual demand is too high to begin with.
If you drop yield down to 180, while at the same time cut feed and residual demand by -200 million bushels.
It gives you a carryout of 1.80 billlion and a stocks to use ratio of 11.40%.
Not out of this world bullish, but I wouldn’t say it's really bearish either.
So it is somewhat hard to get a really bullish situation in corn, unless yield somehow winds up in the realm of 180 or lower.

Now the USDA has Indiana having a record yield.
They have Ohio near +10 bpa higher than last year.
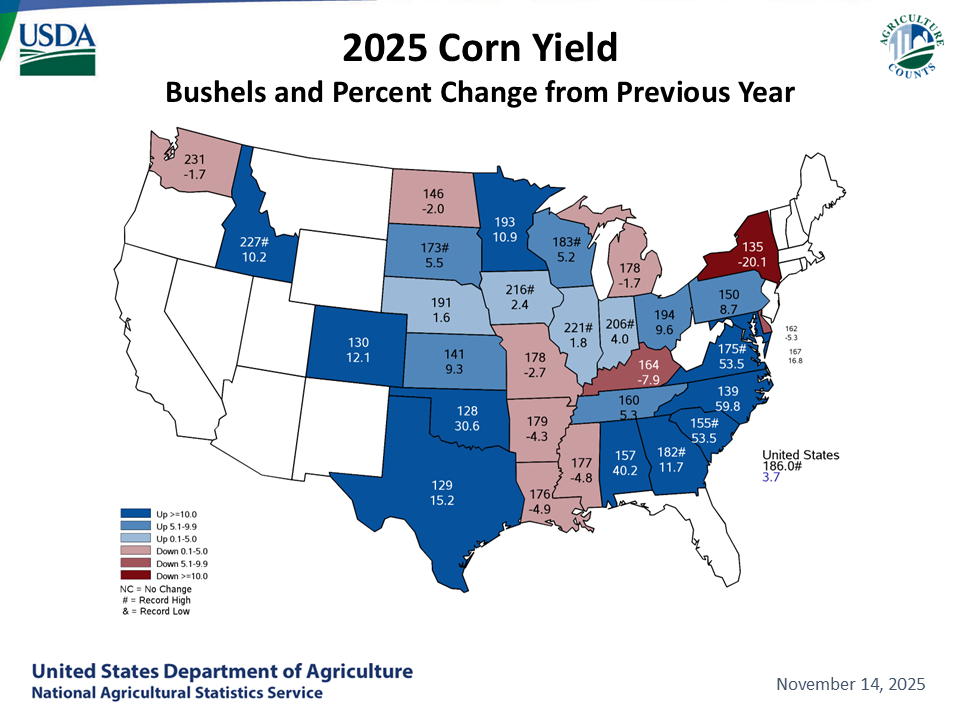
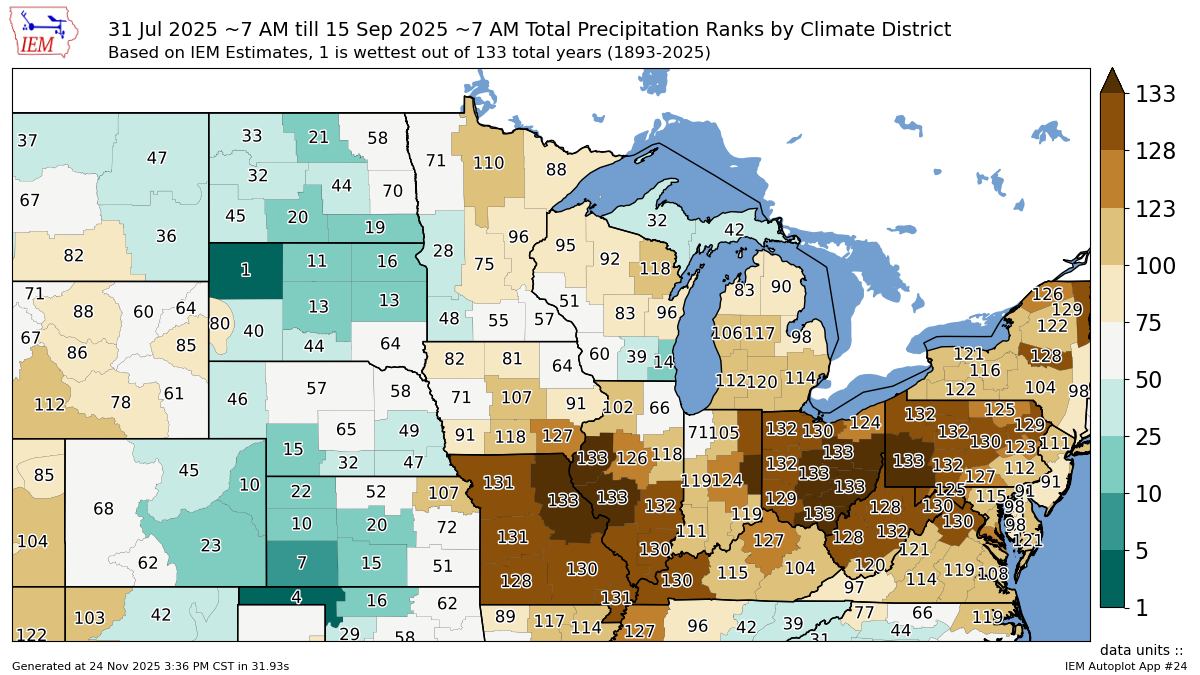
Here is the August to mid-Sep precip rankings.
Does this dry finish really scream either of those are true?
Ohio specifically had their driest finish ever.
I'd love to think yield is 180.
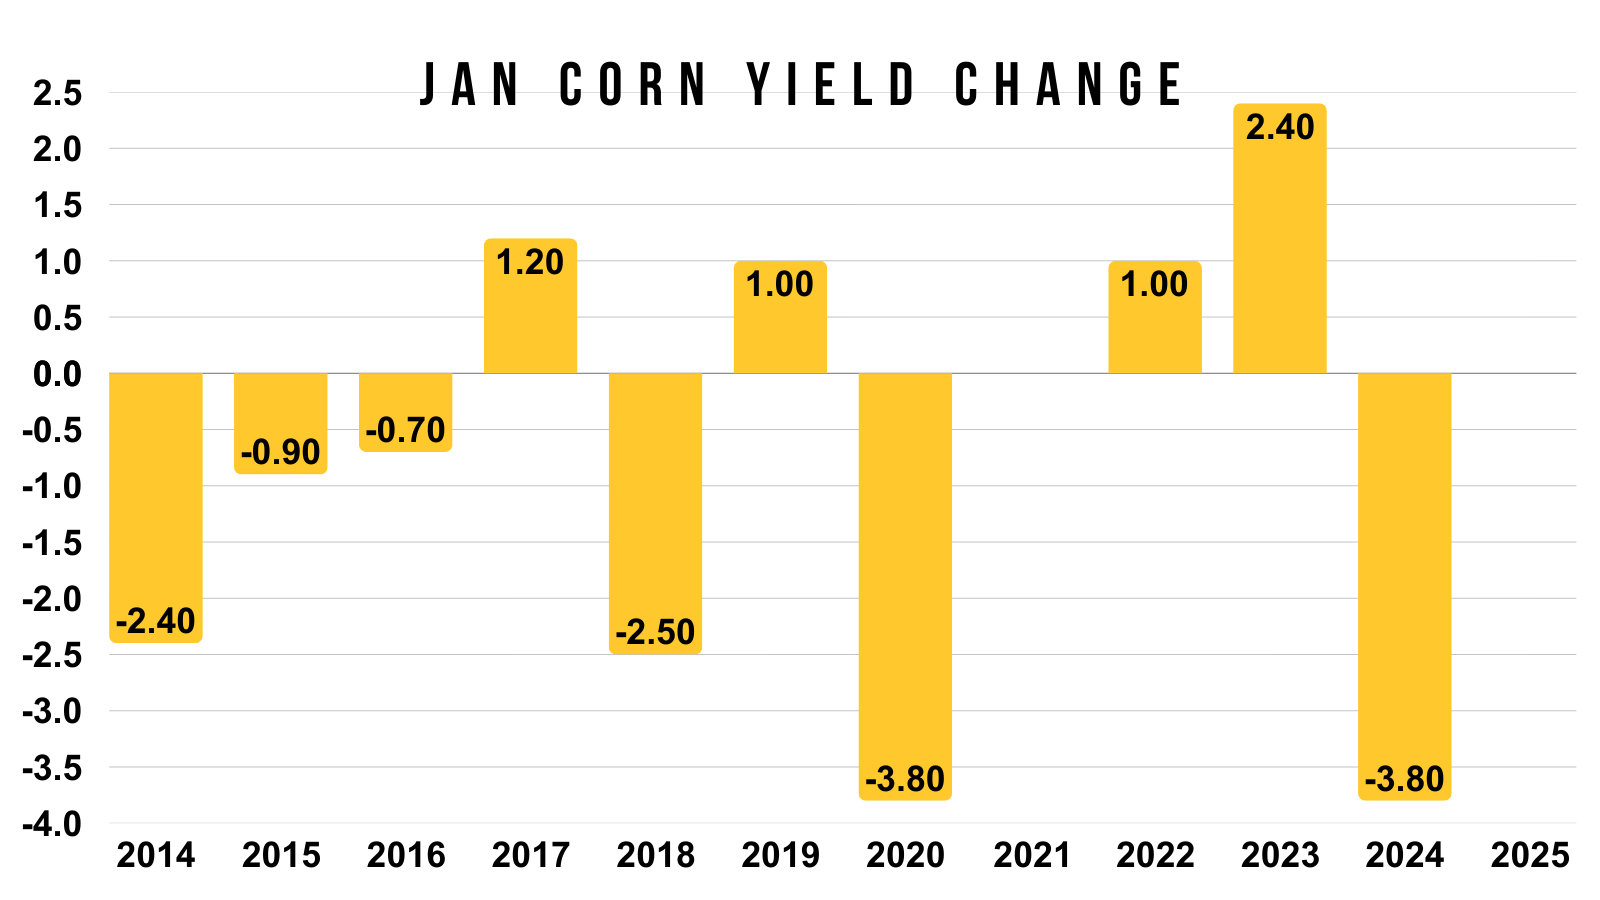
But the reality is that it would require a pretty massive -6 bpa cut from the USDA.
Something we rarely ever see.
As the largest cut we've seen in the Jan report in the last decade was -3.8 bpa. Which happened twice.
This would put us around 182 to 183.
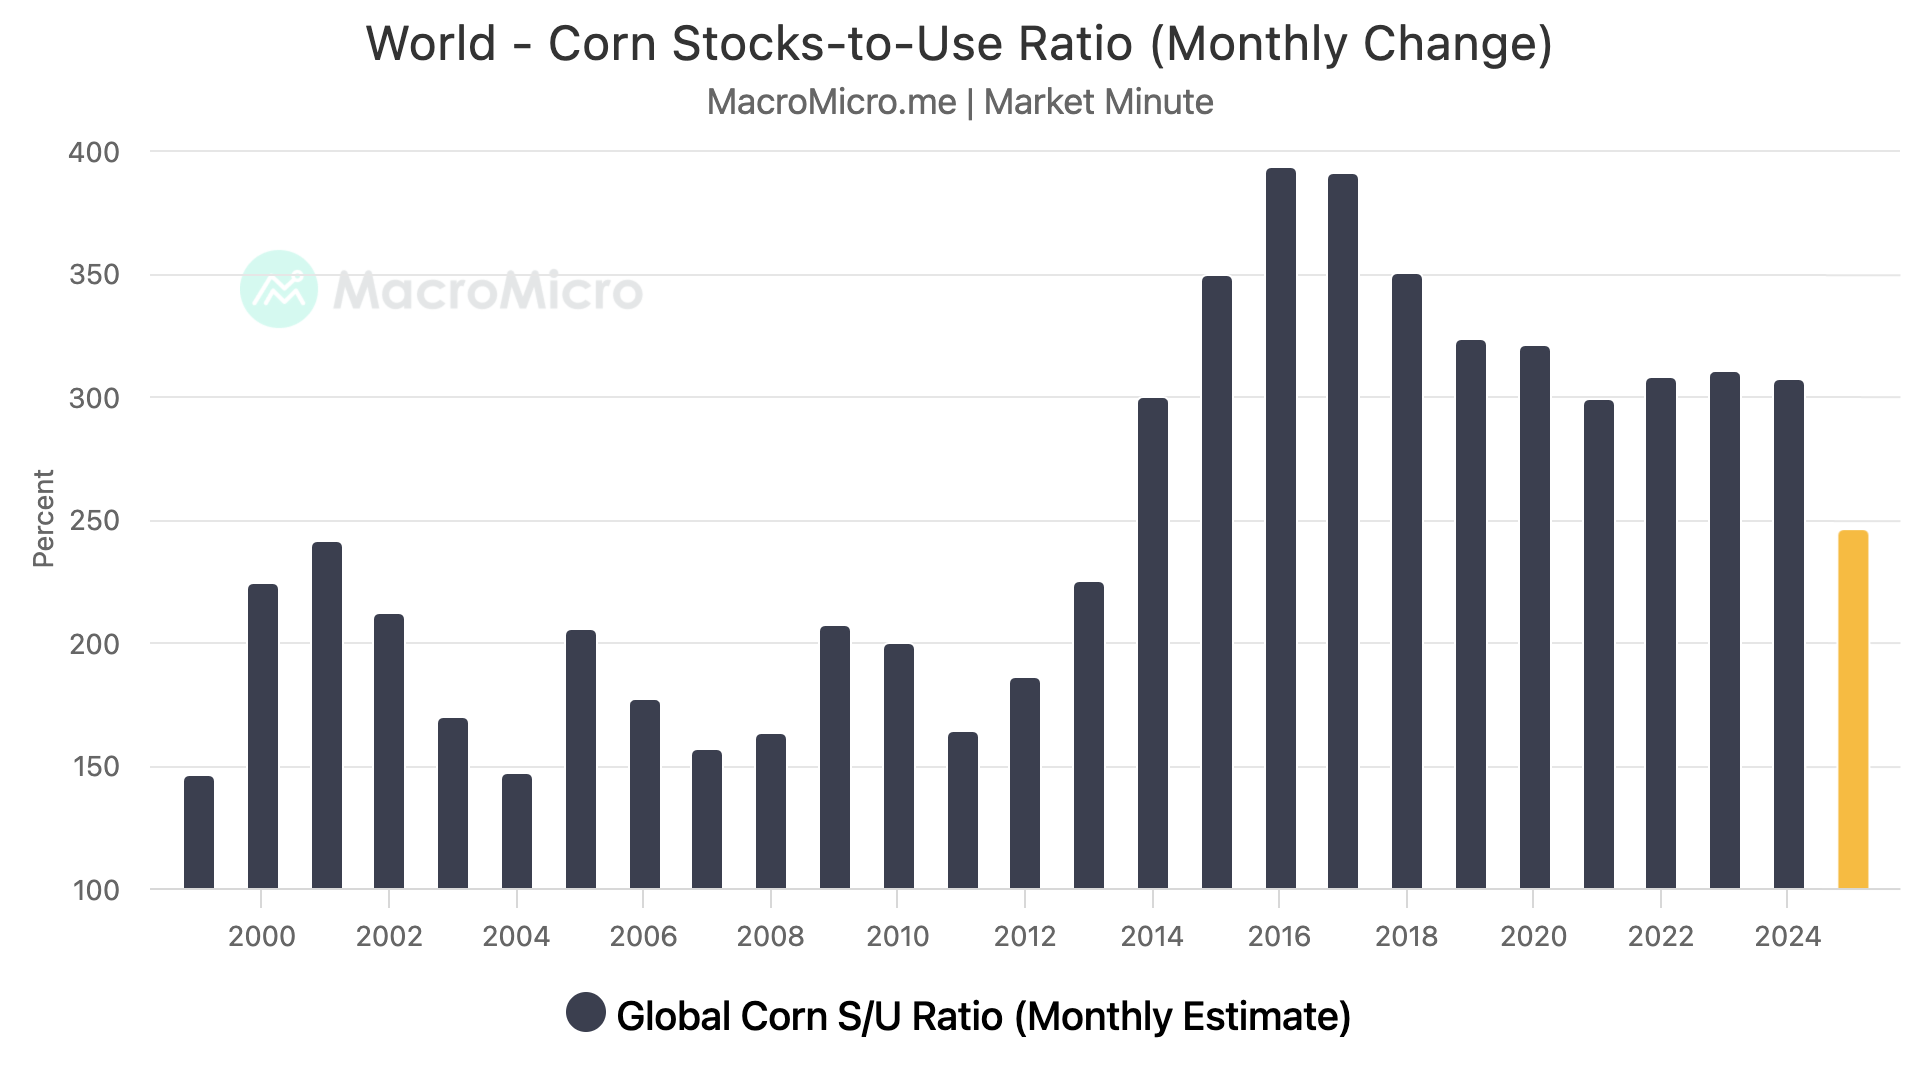
The world situation on the other hand is still friendly.
World corn stocks to use is the tightest in over a decade.
This is with record production out of the US.
The world still clearly needs our corn.
If we ever have a production issue here in the US, it could be amplified due to this.
Technicals:
Dec Corn
We are sitting at some pretty important must hold levels in corn.
Dec corn gave back exactly 61.8% of this rally from Oct today before bouncing.
As you know, the 61.8% level is the most common spot for a correction to find a bottom.
Often times, if you break below the 61.8% level it could be something bigger than just a small correction.
So a bounce here would make sense. But it's a big spot we want to hold.
The Sep sell off also gave back 50-61.8% of the rally off contract lows before finding a bottom.

March Corn
Very similar set up in March corn.
We continue to battle that 61.8% level.
The same level we bottomed at after the Sep sell off.
Big spot to hold.
A break below could result in us heading towards those Oct lows.

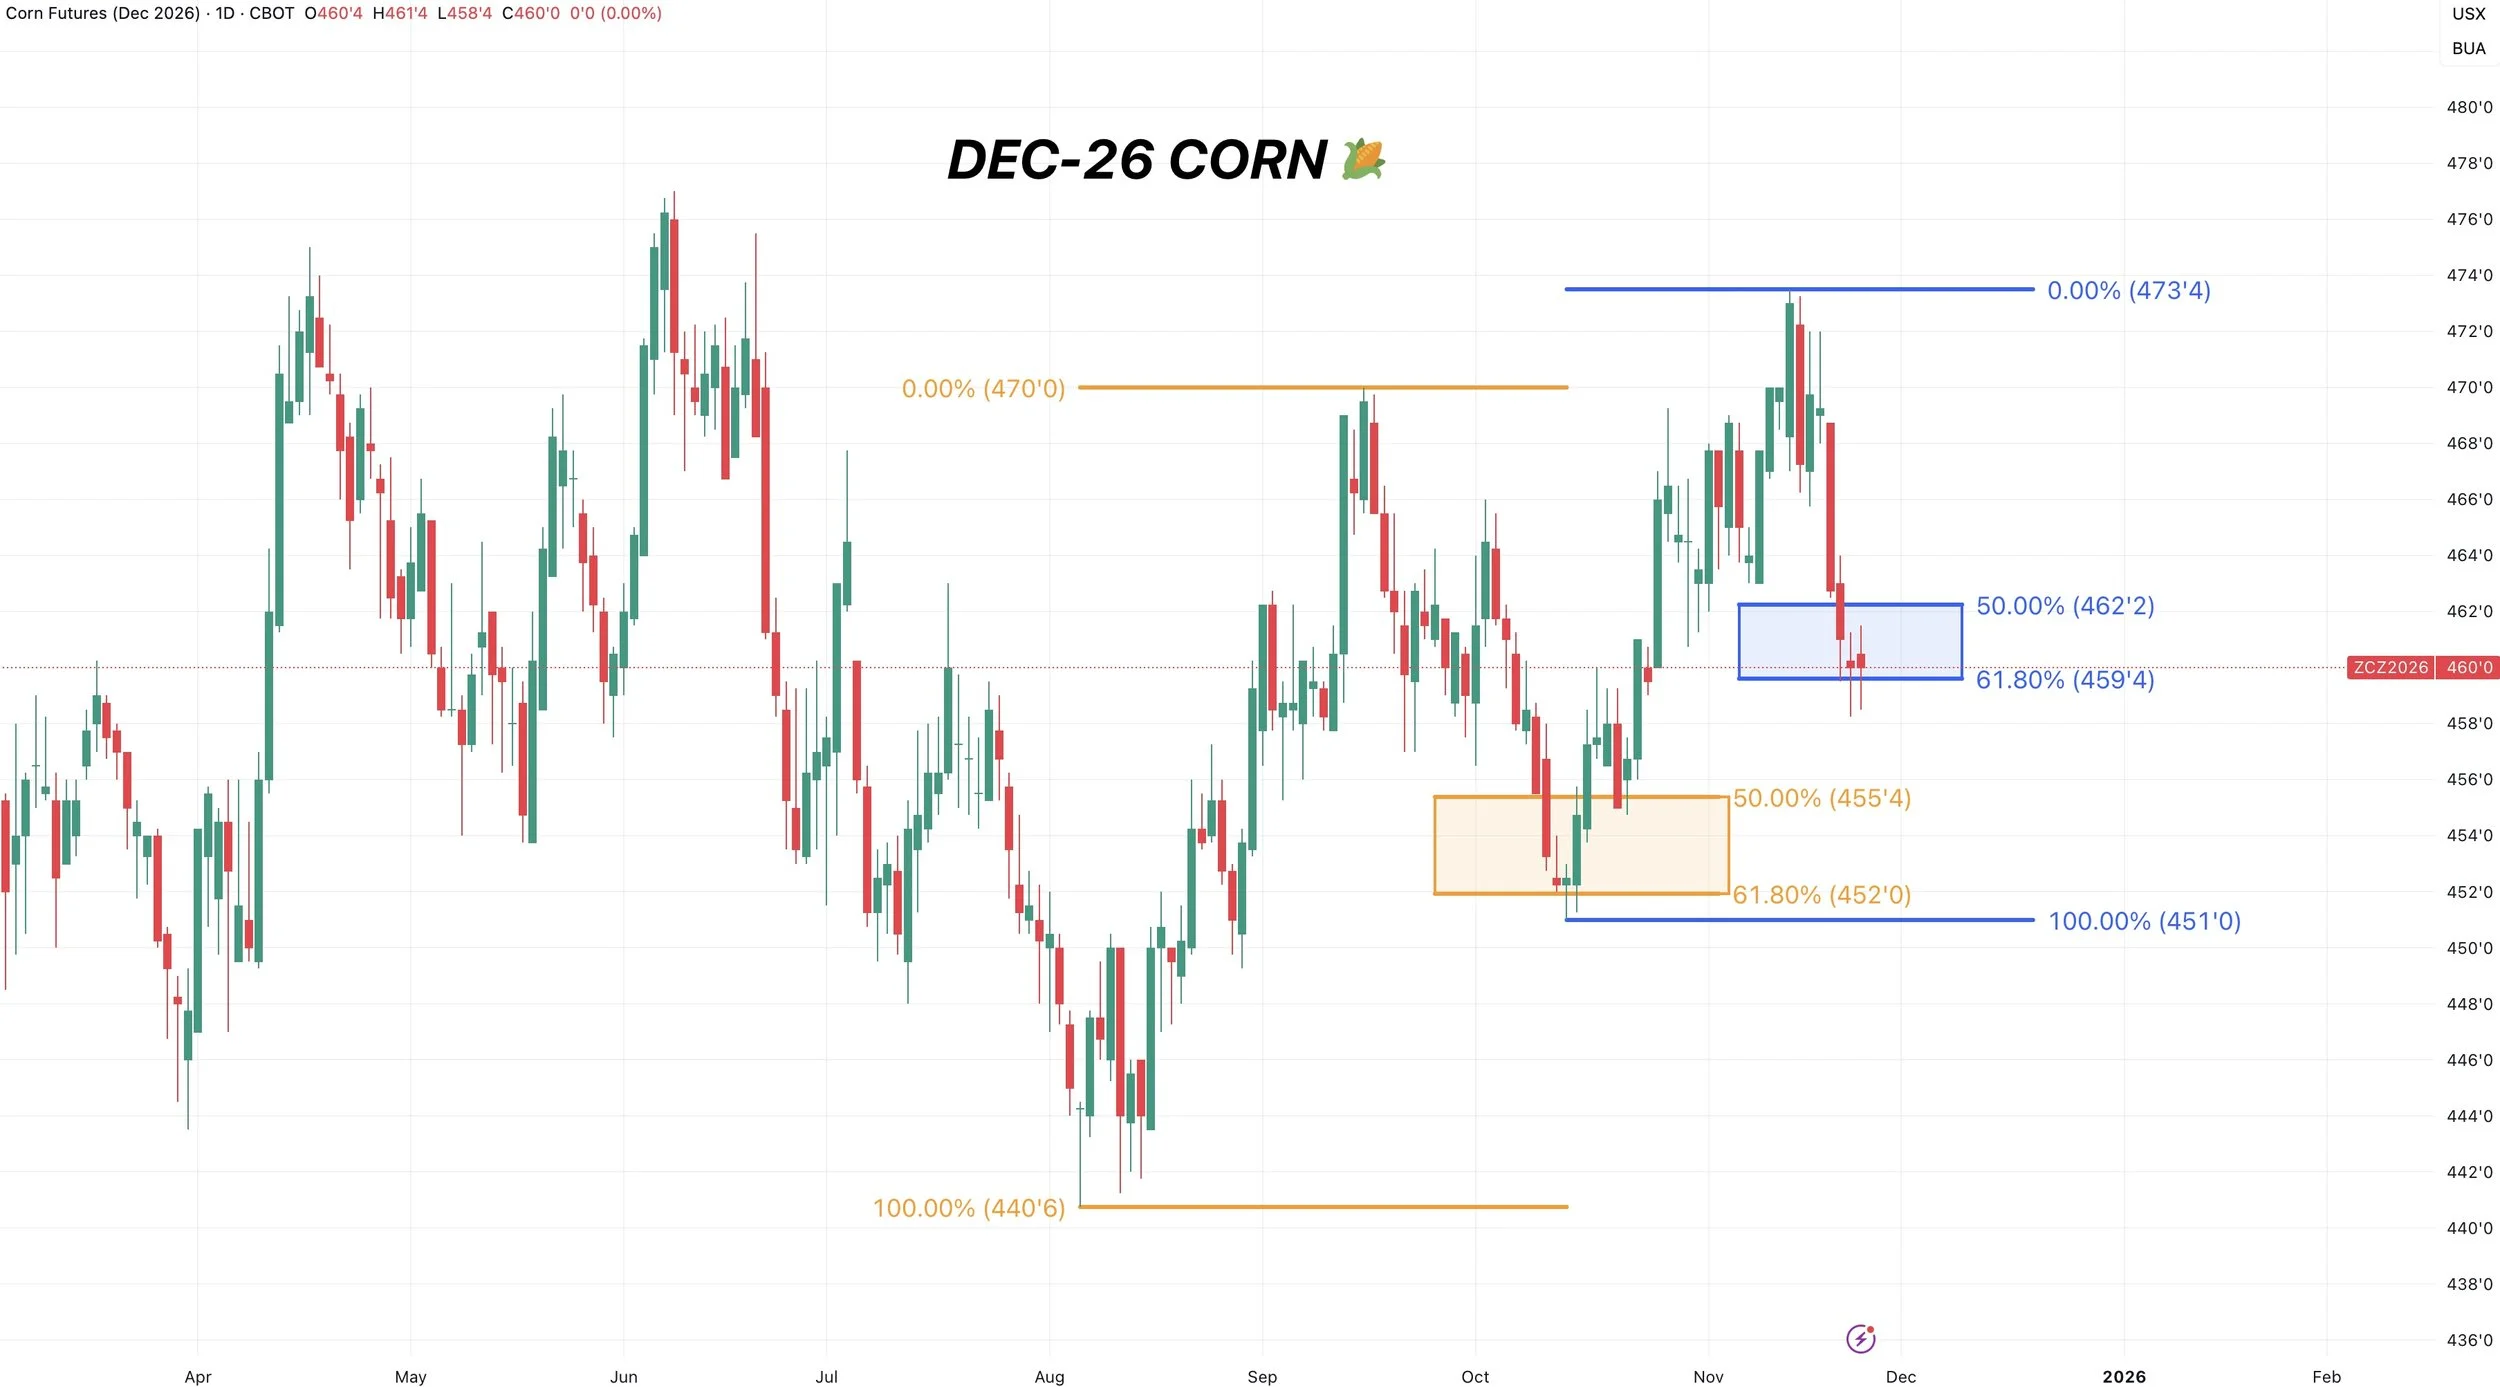
Dec-26 Corn
I had someone ask me about Dec-26 corn the other day.
Almost all of my technical analysis is based on the front months, as that is where all of the volume is at.
However, it is sitting in almost the exact same scenario as both Dec-25 and March-26 corn.
Hovering right at that 61.8% level.
On the Sep sell off, we bounced right at the 61.8% level as well.
Soybeans
Fundamentals:
Soybeans continue to drift lower despite the flash sales from China.
The market is starting to ask whether China will be able to meet that 12 million metric ton requirement.
The export inspections do you make you wonder if the USDA's export demand is overstated, and if so, by how much?
Soybeans probably have the most upside "potential".
But I'd also say they have the most downside risk here. Especially after the run they just had.
They don’t have that demand to help keep a floor like corn does.
There are just so many different factors at play.
1) Brazil Weather
Will they have a weather scare?
Will they have yet another bumper crop?
If they have issues, China could be forced to buy even more soybeans from the US.
Unlike corn where the US is the dominant player on the global front. Brazil is the biggest player in soybeans.
So how their crop turns out will play a massive role in where we go from here.
What do you think happens if the world's largest producer runs into a weather issue?
What do you think happens if they raise yet another monster crop like they did last year?

2) Where does US production come in at?
This is also a major factor.
Given that we saw the 2nd lowest acres in the last decade, any change to yield moves the balance sheets in a big way.

For example, this is how changing yield moves our carryout. Without touching demand.
This is just to show you how big of a factor yield is. If the USDA cuts supply, they will probably cut demand to offset some of the change.
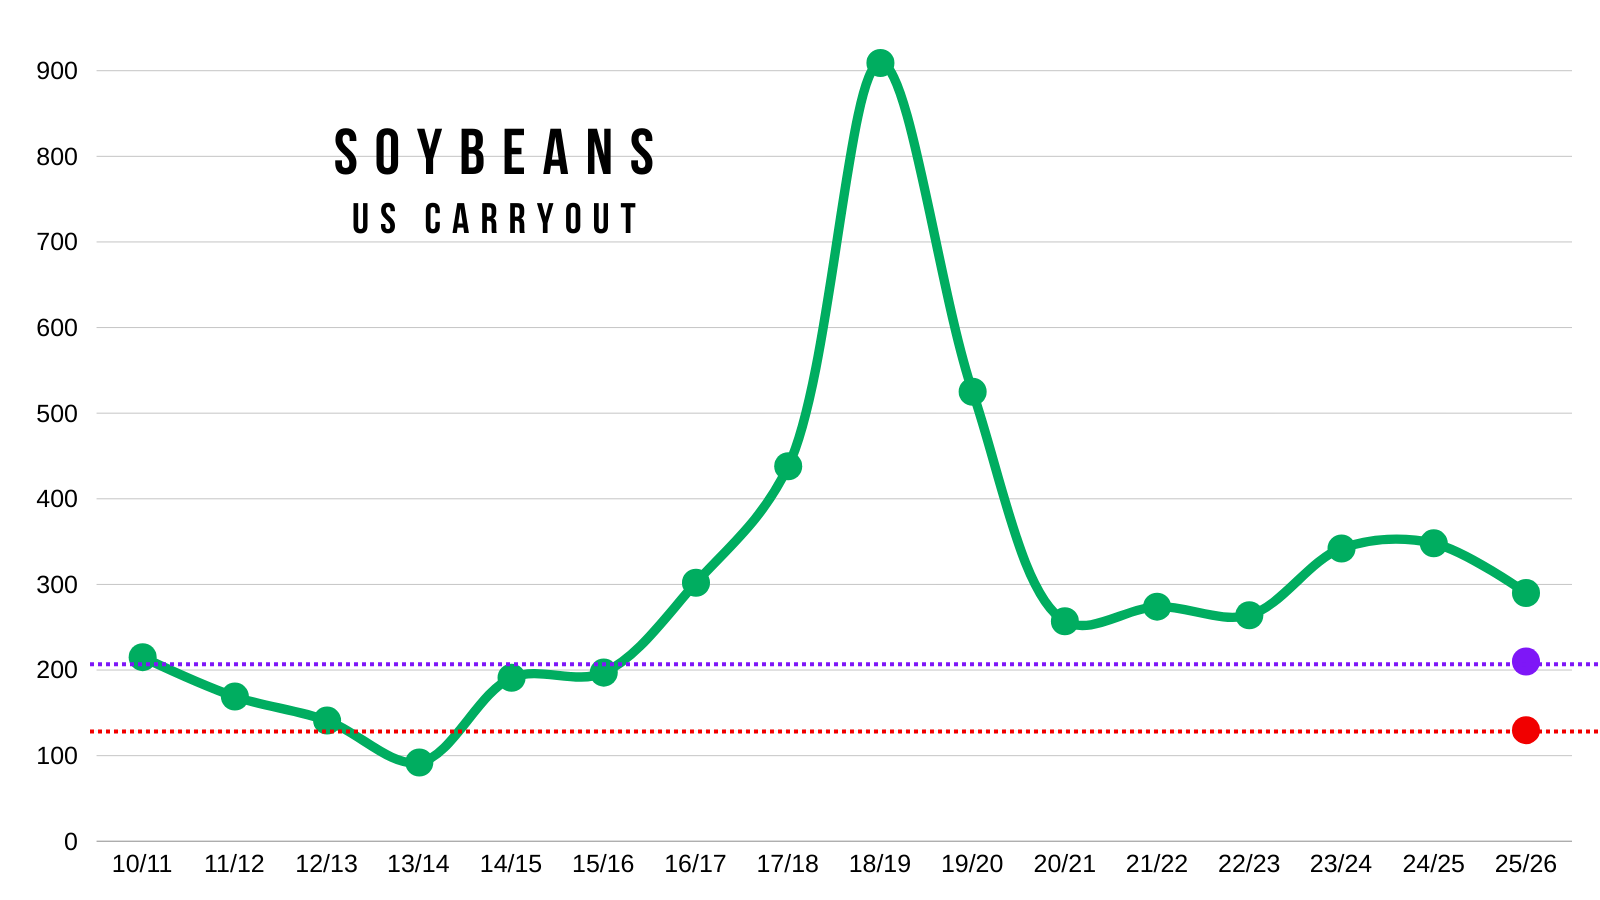
53 bpa = 290 million bu (current)
52 bpa = 210 million bu
51 bpa = 130 million bu
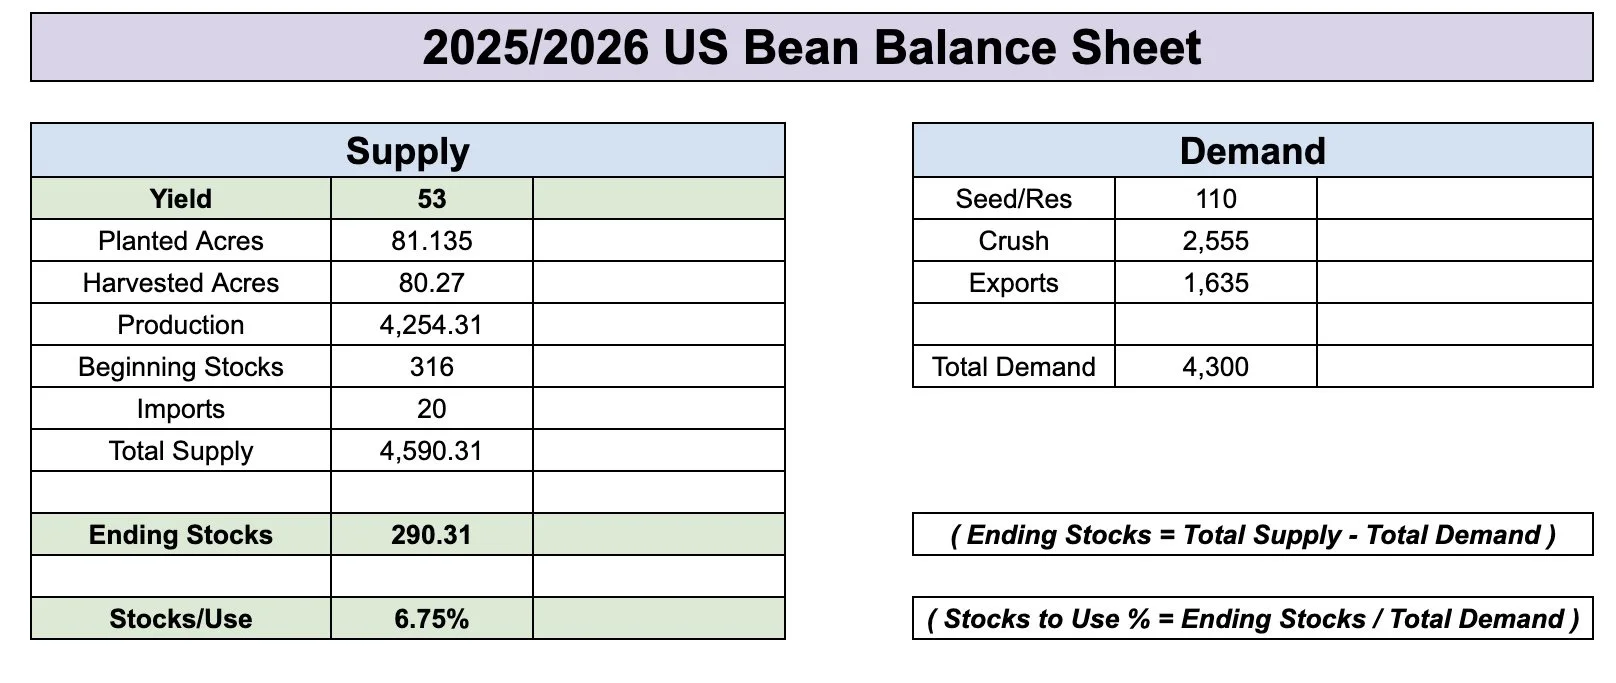


For reference, here is those 3 scenarios laid out on a visual.
Our current carryout isn’t bearish to begin with. It's the tightest in a few years.
3) China
Will they meet their 12 million metric tons they agreed to?
Bulls argue that soybeans are such a small part of the trade deals China is trying to make that soybeans are especially a drop in the bucket in the grand scheme of things.
If they do, how does this affect demand elsewhere?
Does this result in less demand from non-China destinations?
Like we talked about last week, some bears argue that business from China is like shuffling around pieces on a chess board. Where we simply lose demand some other countries. Rather than actually removing the pieces on the board.
Technicals:
Jan Beans
We hit that first $11.55 target last week when we alerted that sell signal and hedge alert.
As that reclaimed 61.8% of the contract highs.
If the rally continues, our next target is right around $12.00

If we zoom in here, we want to hold $11.08 to prevent further downside.
That gives back 61.8% of that candle where we gapped open higher on the China news (marked with red lines).
If we fail to hold that level, the next point of interest would be the green box. As that gives back 50-61.8% of the entire rally we just saw. That level also lines up with our yearly resistance, which is now viewed as support if we fall that far.
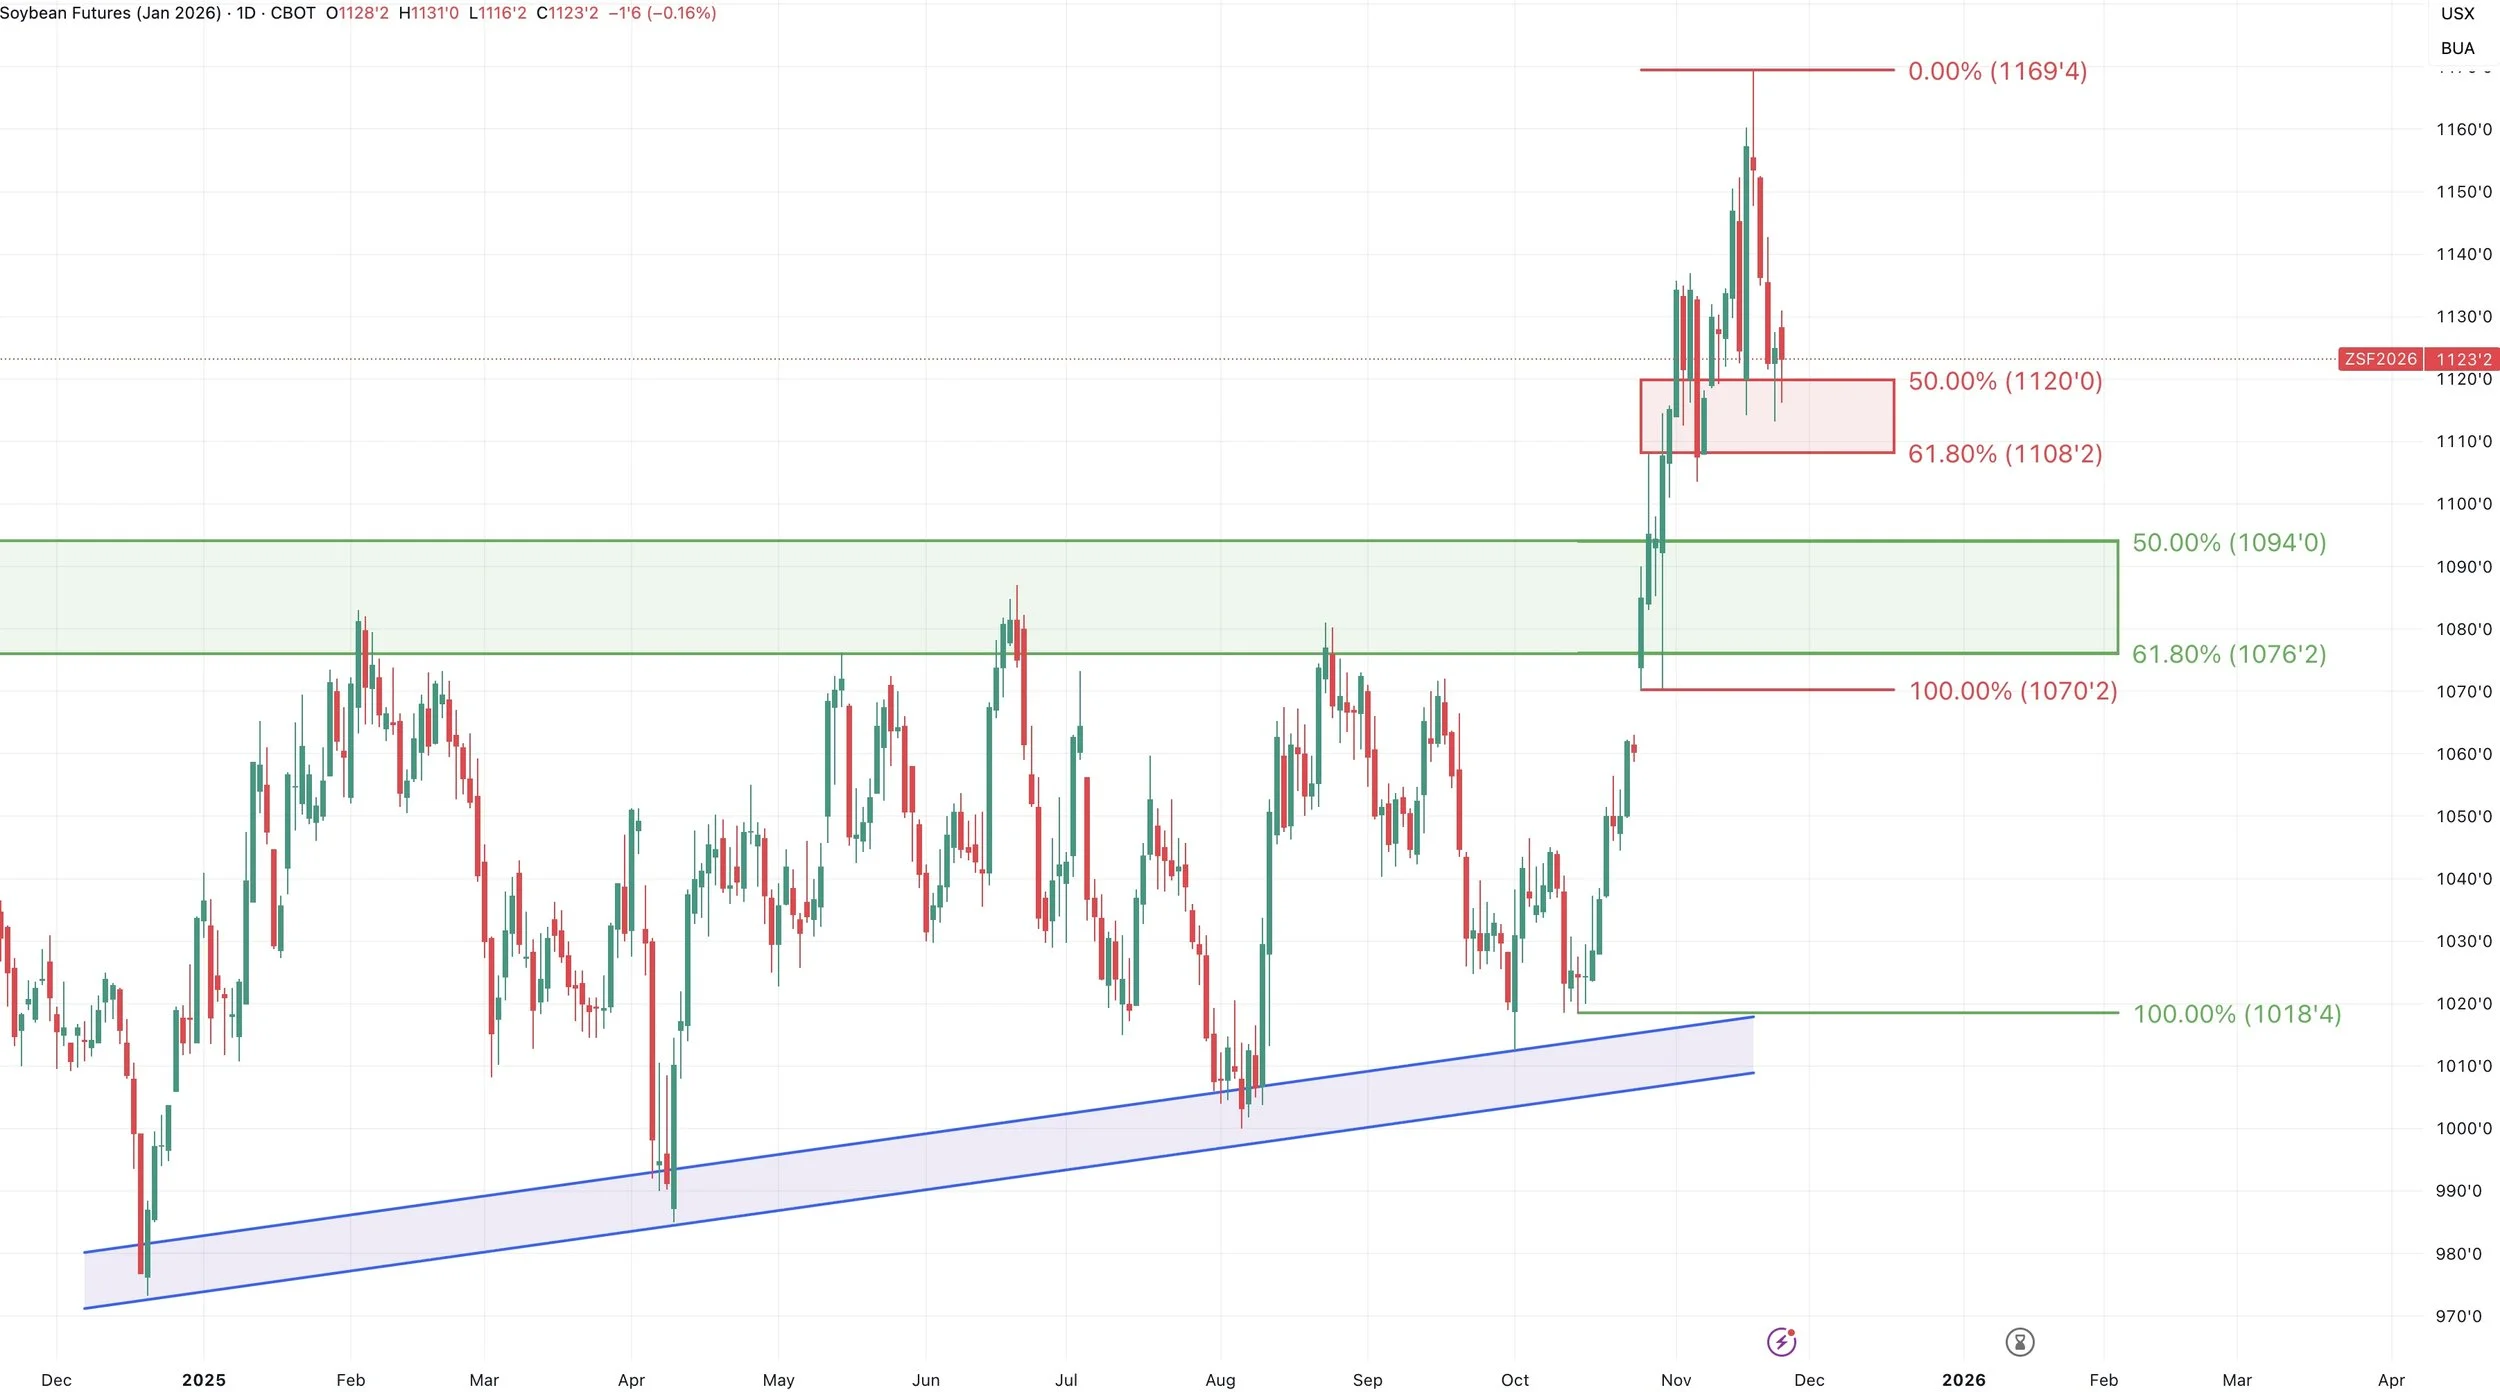
I still think we have a realistic chance at $12.00 soybeans.
I am not saying it "has" to happen.
But very possible.
No rally that started in the $10.00's then broke $11.00 has ever stopped in the $11.00's.
It could happen this time, but it hasn’t happened before.
We do have a pretty ugly monthly candle currently.

Wheat
Nothing new fundamentally.
We still lack a true catalyst.
Let's just look at the charts as we are approaching some key spots bulls want to hold.
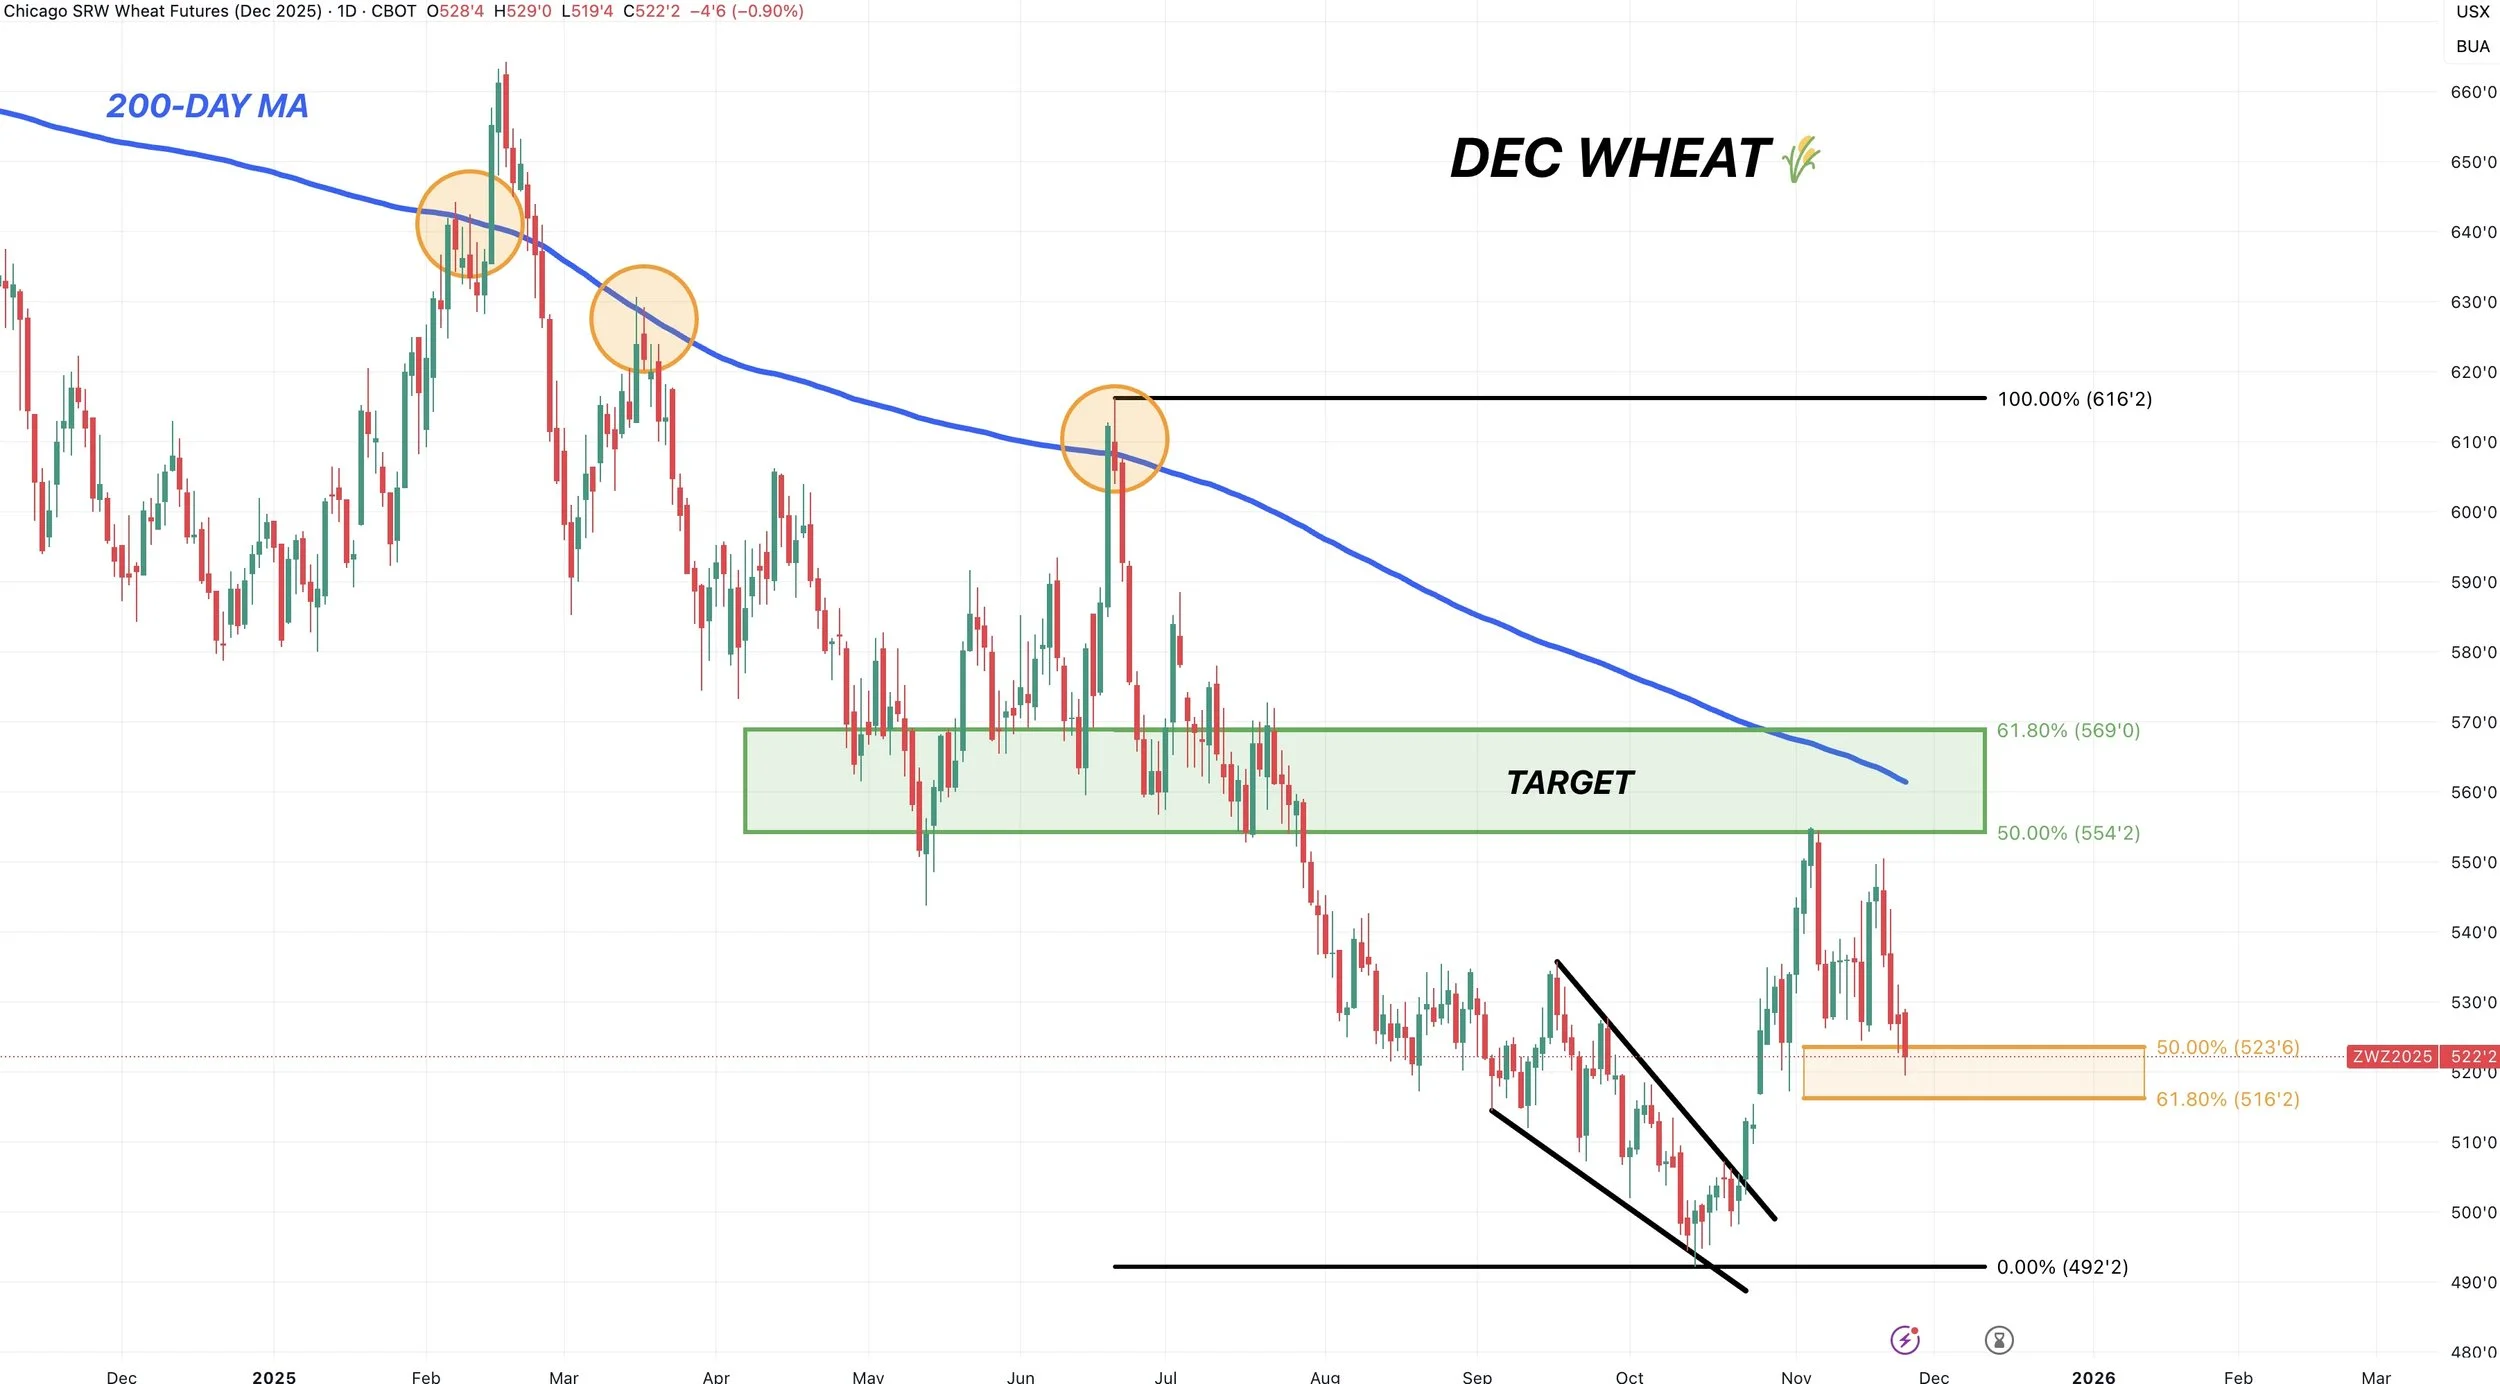
Dec Wheat
We are right in that golden zone.
The 50-61.8% retracements from the entire rally off contract lows.
We need to hold this box ($5.16).
This is the most common place for a bounce to happen.
If we break below, it wouldn’t be a good sign.
Dec KC Wheat
Also sitting right in the golden zone.
If we are going to bounce, it should be here.
If we fail to hold this box, we could very well go test contract lows.

Cattle
We had some big news in the cattle market.
As today we opened limit down and stayed limit down.
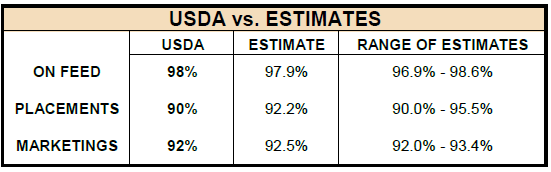
For starters, we had the cattle on feed report on Friday.
It was actually somewhat bullish of a report.
It didn’t provide any major surprises, but it reassured just how tight a situation the cattle market is truly in.
As placements for October were lower than expected, coming in at their lowest number on record.
Chart from CattleTrend
So fundamentally, the cattle situation is still as tight as it's ever been.
But the government is still trying to get prices lower.
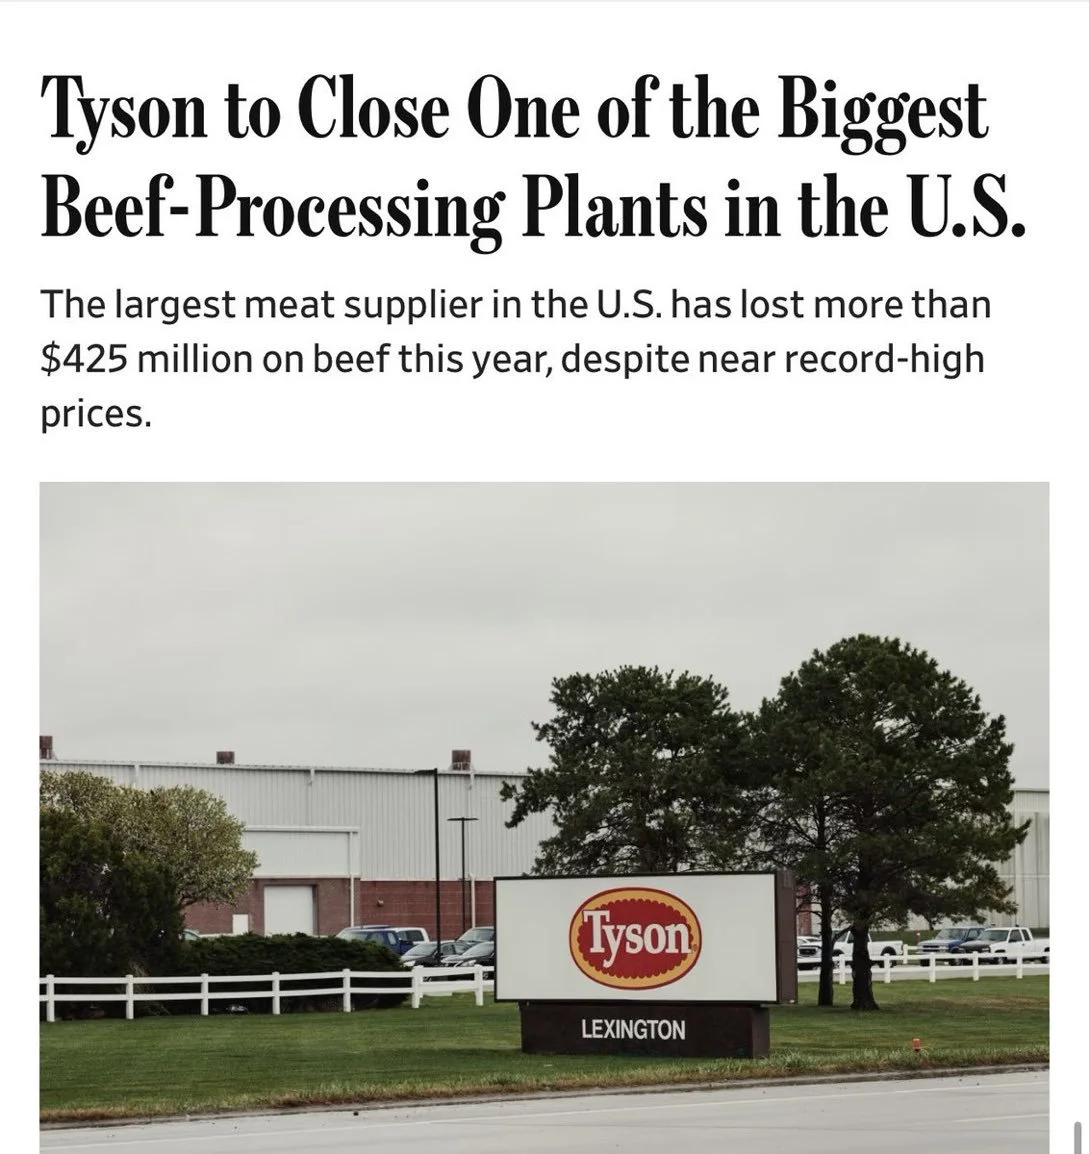
To add on to this, we had some other news out over the weekend.
This was the reason for the sell off today.
Tyson foods closed a major US beef plant in Nebraska.
The reason for closing this was because cattle supplies are tight and raising the cost for US meat packers.
The plant had been losing money the last 18 months.
Why is this so bearish?
Cattle isn’t like grain, it can’t stored. This plant shutting down is one less person that can buy cattle.
They convert cattle to beef, so it backs up the cattle as they aren’t killing them as fast.
It essentially creates a bottle neck in the supply chain. Markets hate bottle necks.
It is less immediate demand, and more supply sitting in feedlots.
Once that kill capacity comes off line, it doesn’t come back.
What happened last time we saw this?
This plant had a 5k daily head capacity.
We've seen a few plants shut down over the years. Most were a lot smaller, around 2k head.
However, the last one of this size was January 2013.
Where Cargill in Texas shutdown. They had a 4.5k head capacity.
If we look at the charts, it took the market a good 6 months to come back to the price levels it was at before the shutdown.
So not only do we have this, but we have Trump saying prices are coming down. It is not a great combination for higher prices.

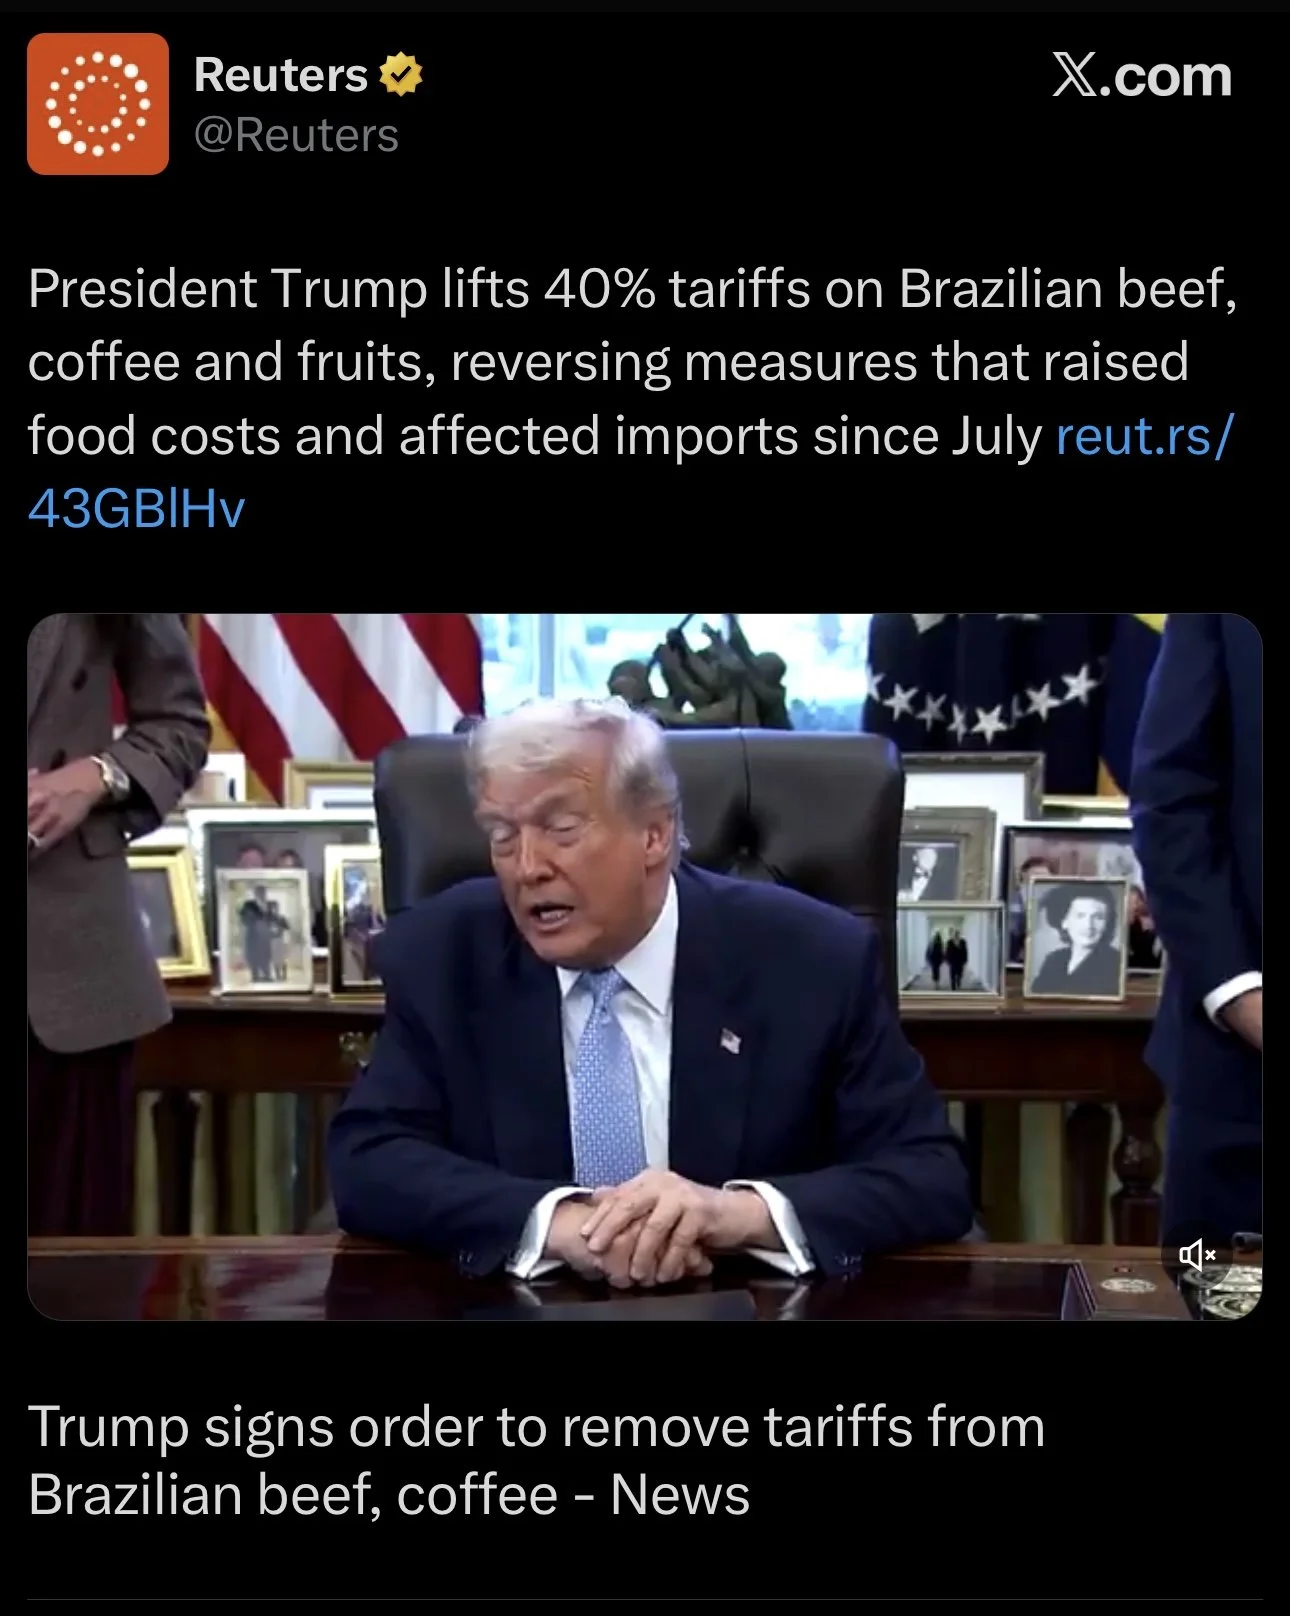
Not only that, but we removed some of the tariffs on Brazil beef last Thursday.
As we dropped the additional 40% tariffs. There is still a 24% tariff that has been there, but we removed the extra 40%.
However, it feels like this news was priced in as the market showed some resilience on Friday.
But this was probably part of the reason for weakenss during the week, some insider trading.
Technicals: Where is the long term floor?
Jan Feeders
The charts do not look good.
You can barely even todays candle, because we opened limit down and stayed locked limit down.
We are now below the 200-day MA.
If we get any relief bounce, it is going to want to be rewarded.
But how low could we actually go looking more longer term?
Scroll for some more charts.

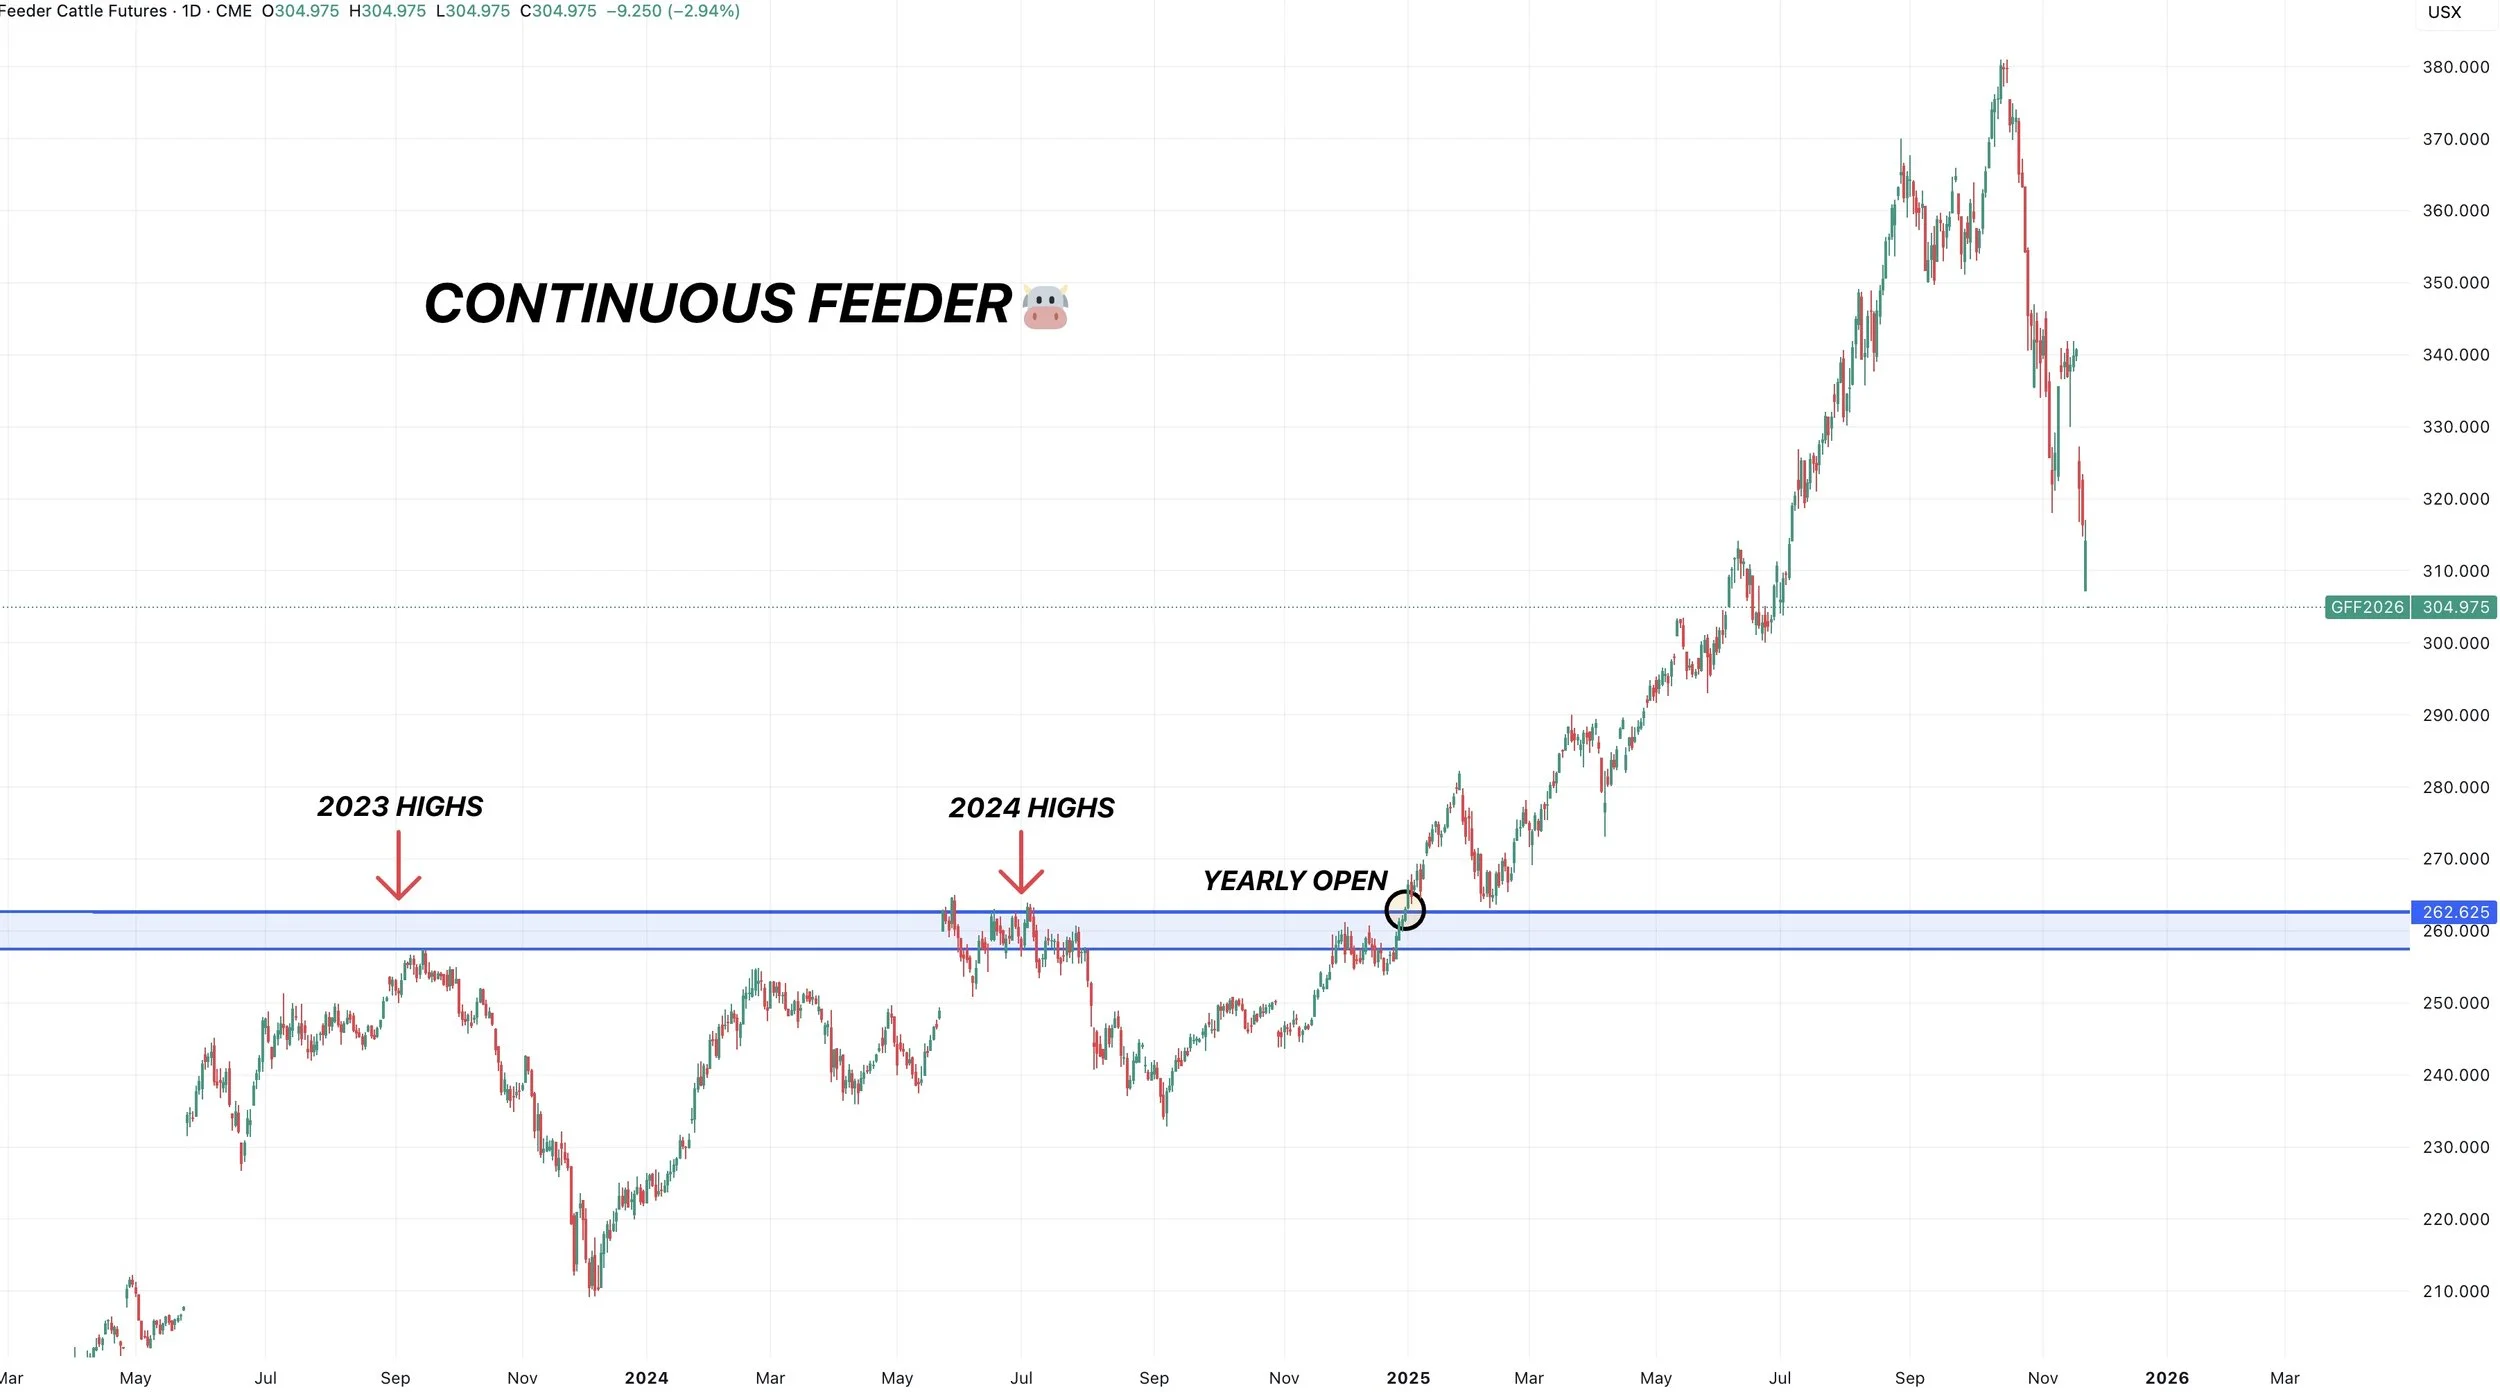
Continuous Feeders
We opened the year at 265.
If you notice, 265 is also our highs from last year.
Old resistance, often becomes new support.
We could see some dead cat bounces in between, and it could take a while, but ultimately that could an area where we find a long term floor. Basically, our new base.
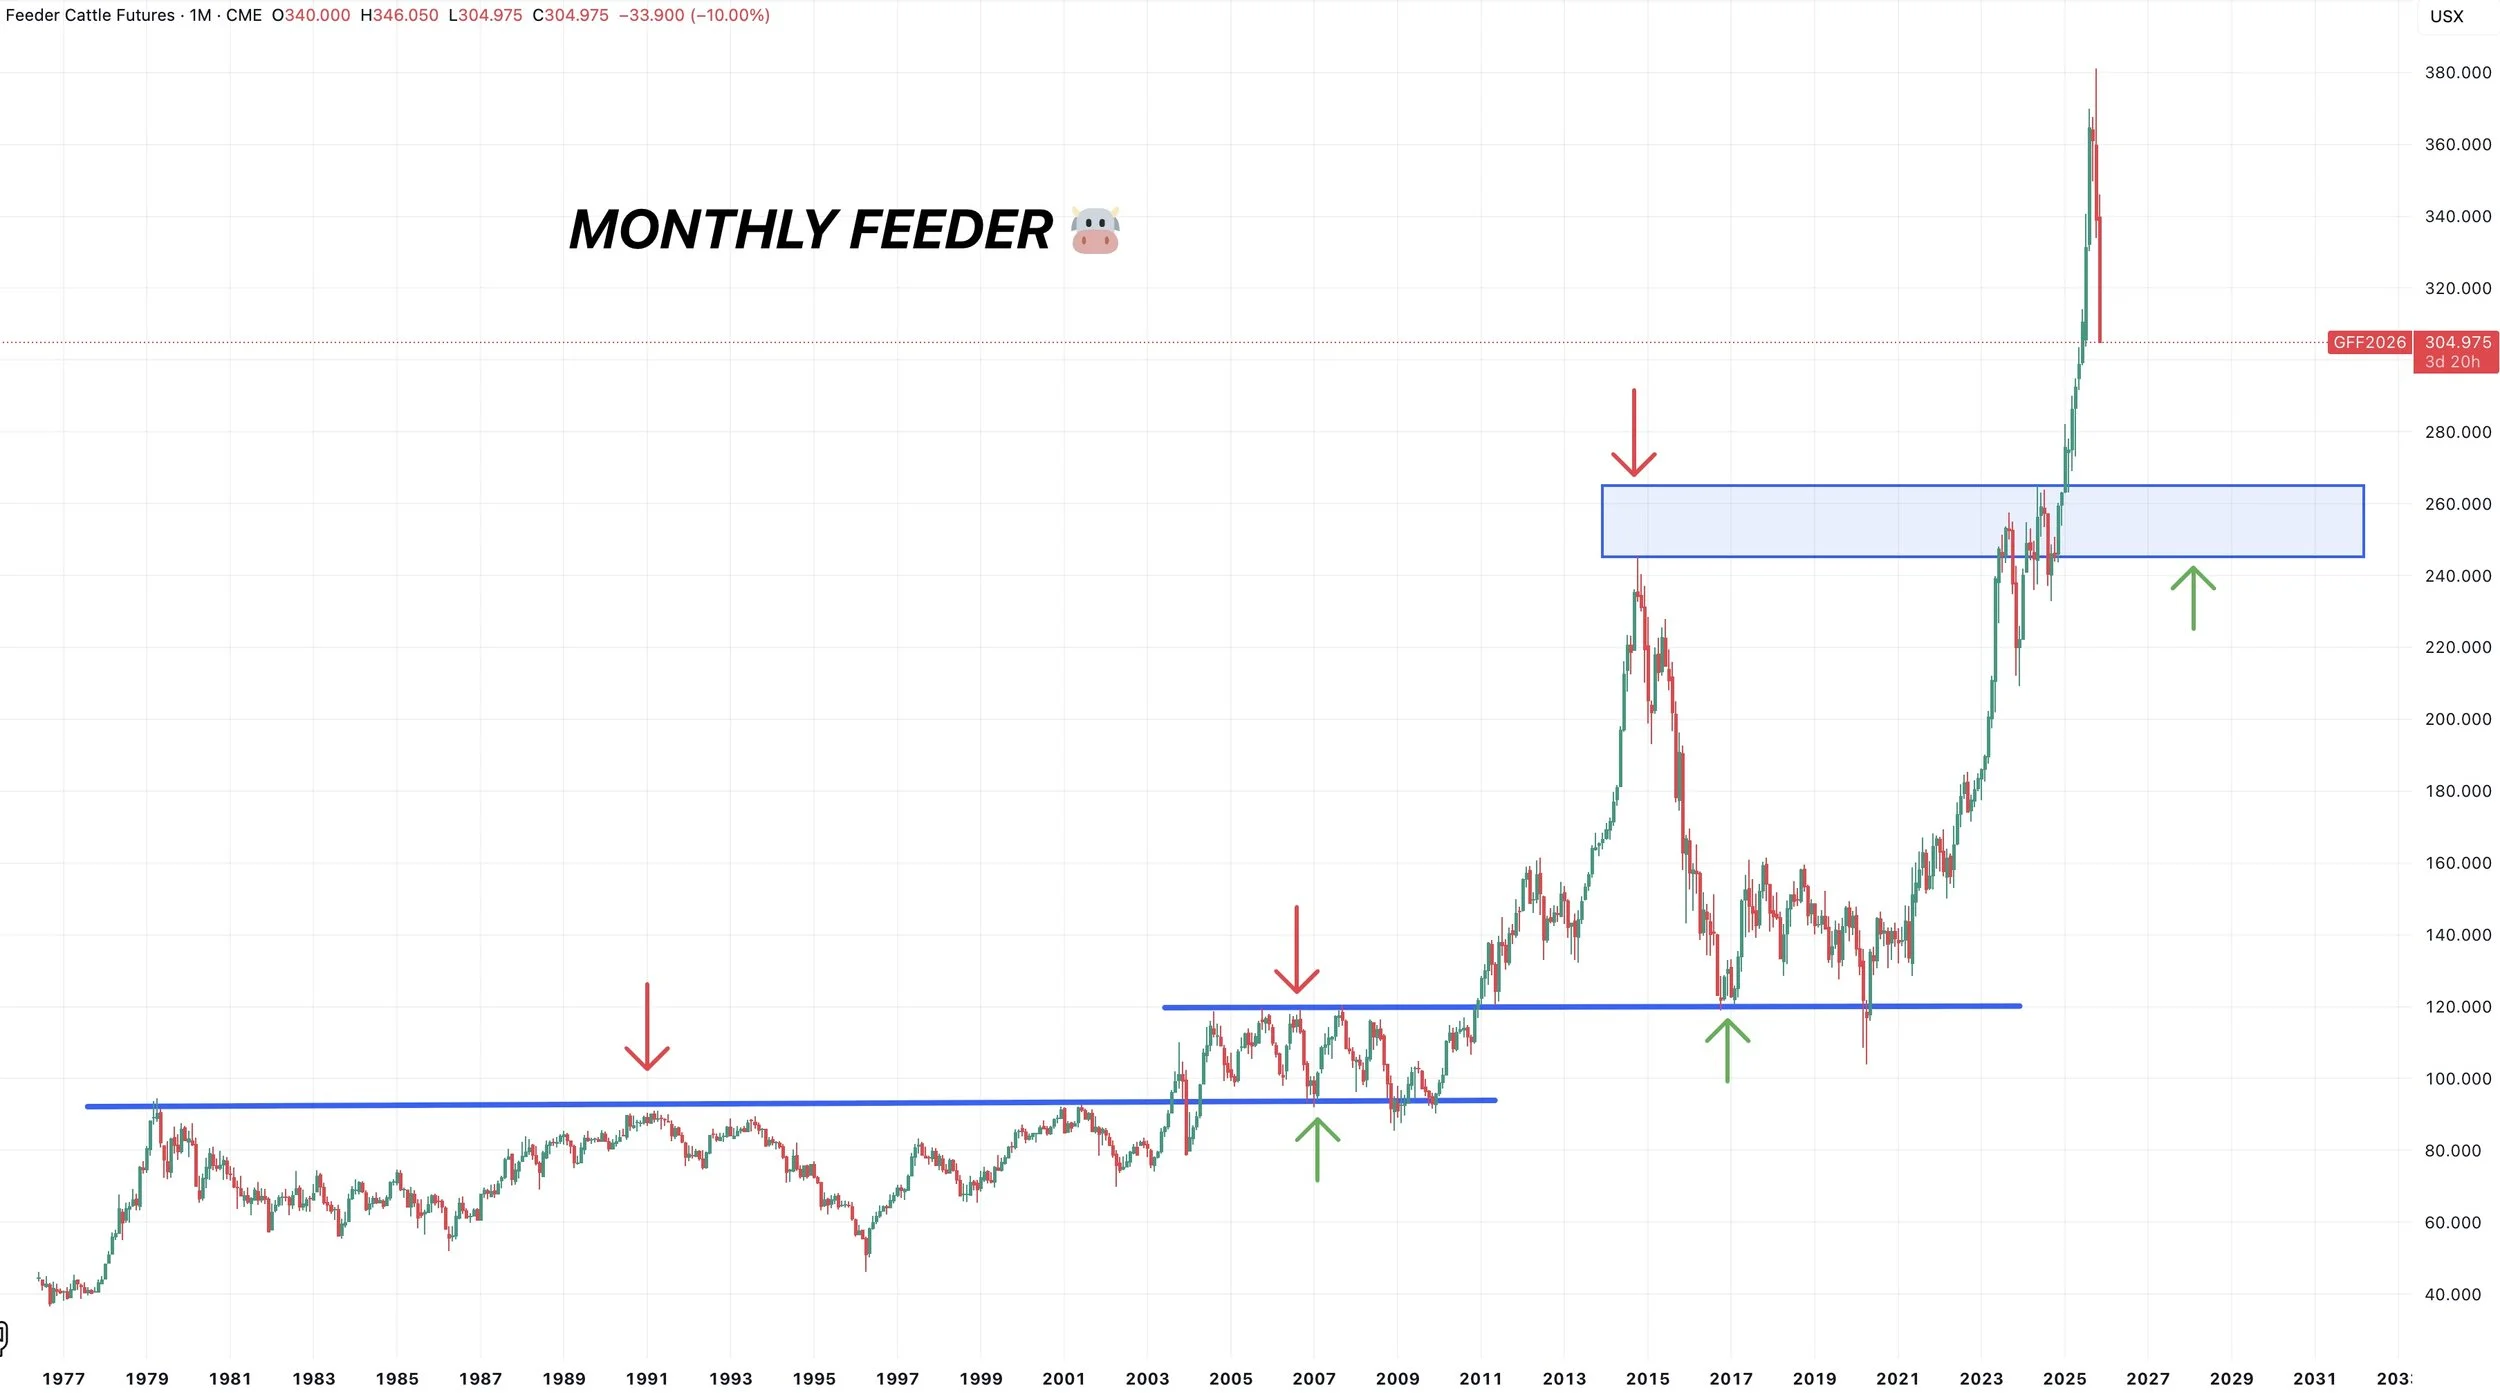
If we zoom out even further, there are several cases of the cattle market turning old resistance into new support.
The resistance from the 90's become our support in the 2000's.
The resistance in the 2000's become our support in the 2010's.
Dec Live
Also below the 200-day MA.
So not a great look.
We could get a relief bounce at any point.
But ultimately the past of least resistance is lower.
Scroll to see where I think we could possibly find our long term support.
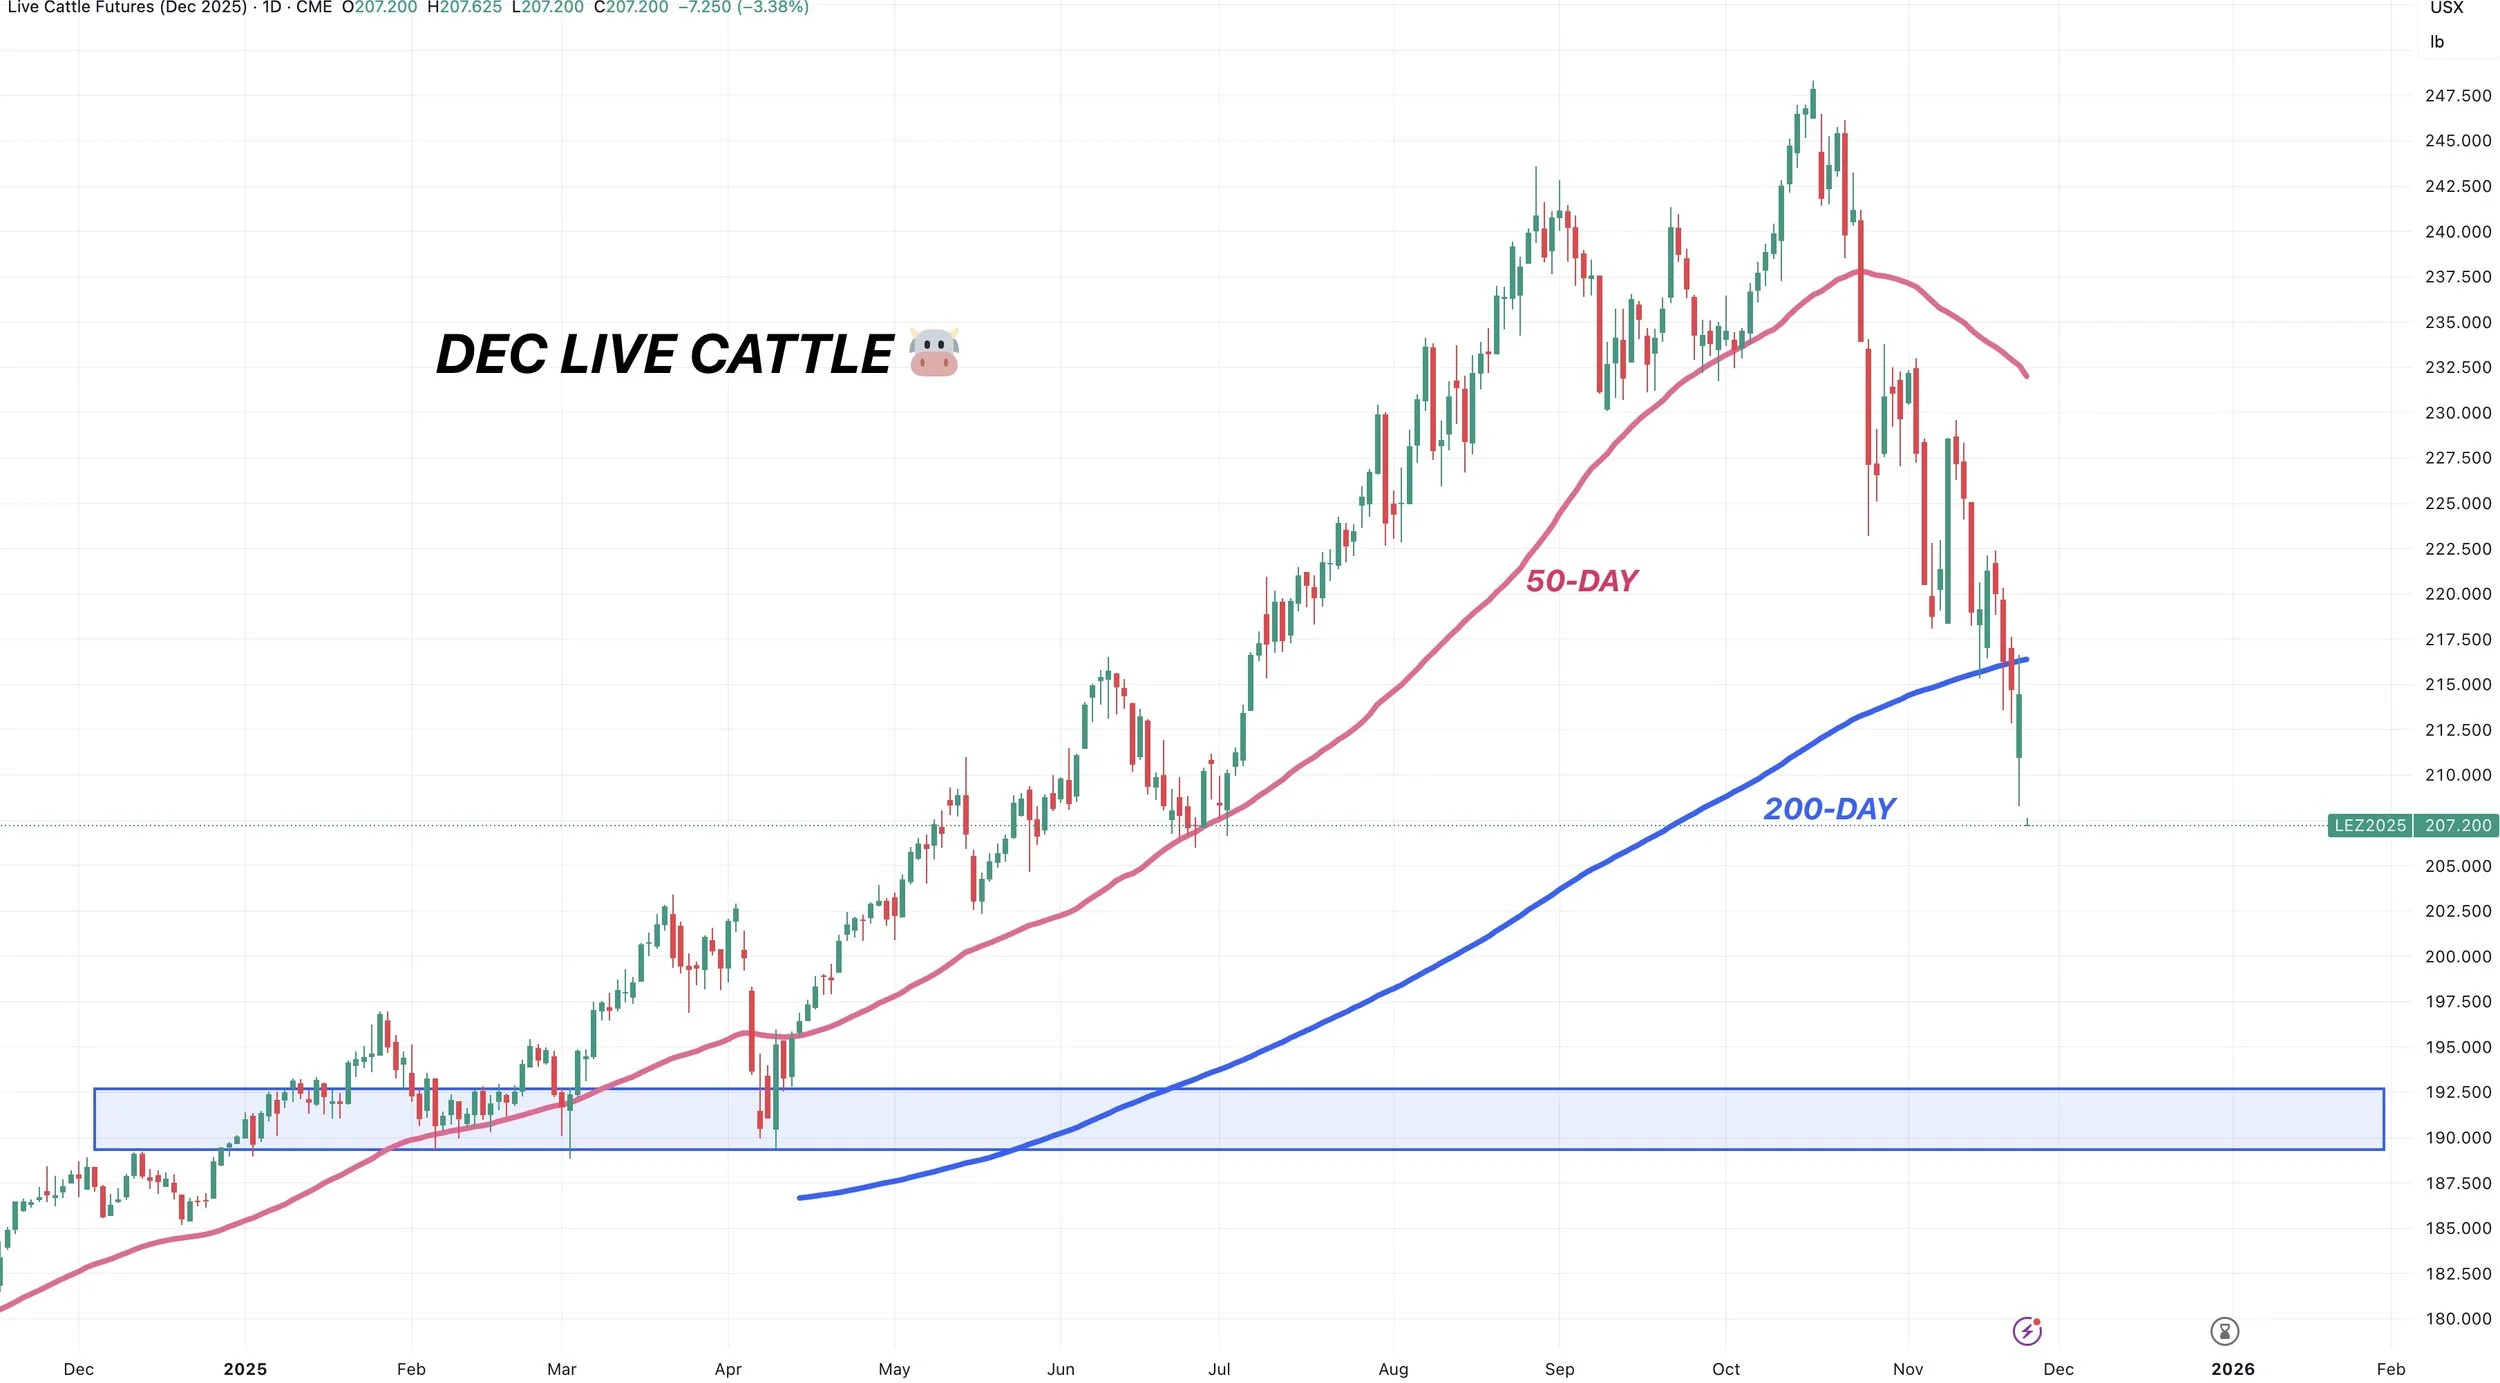
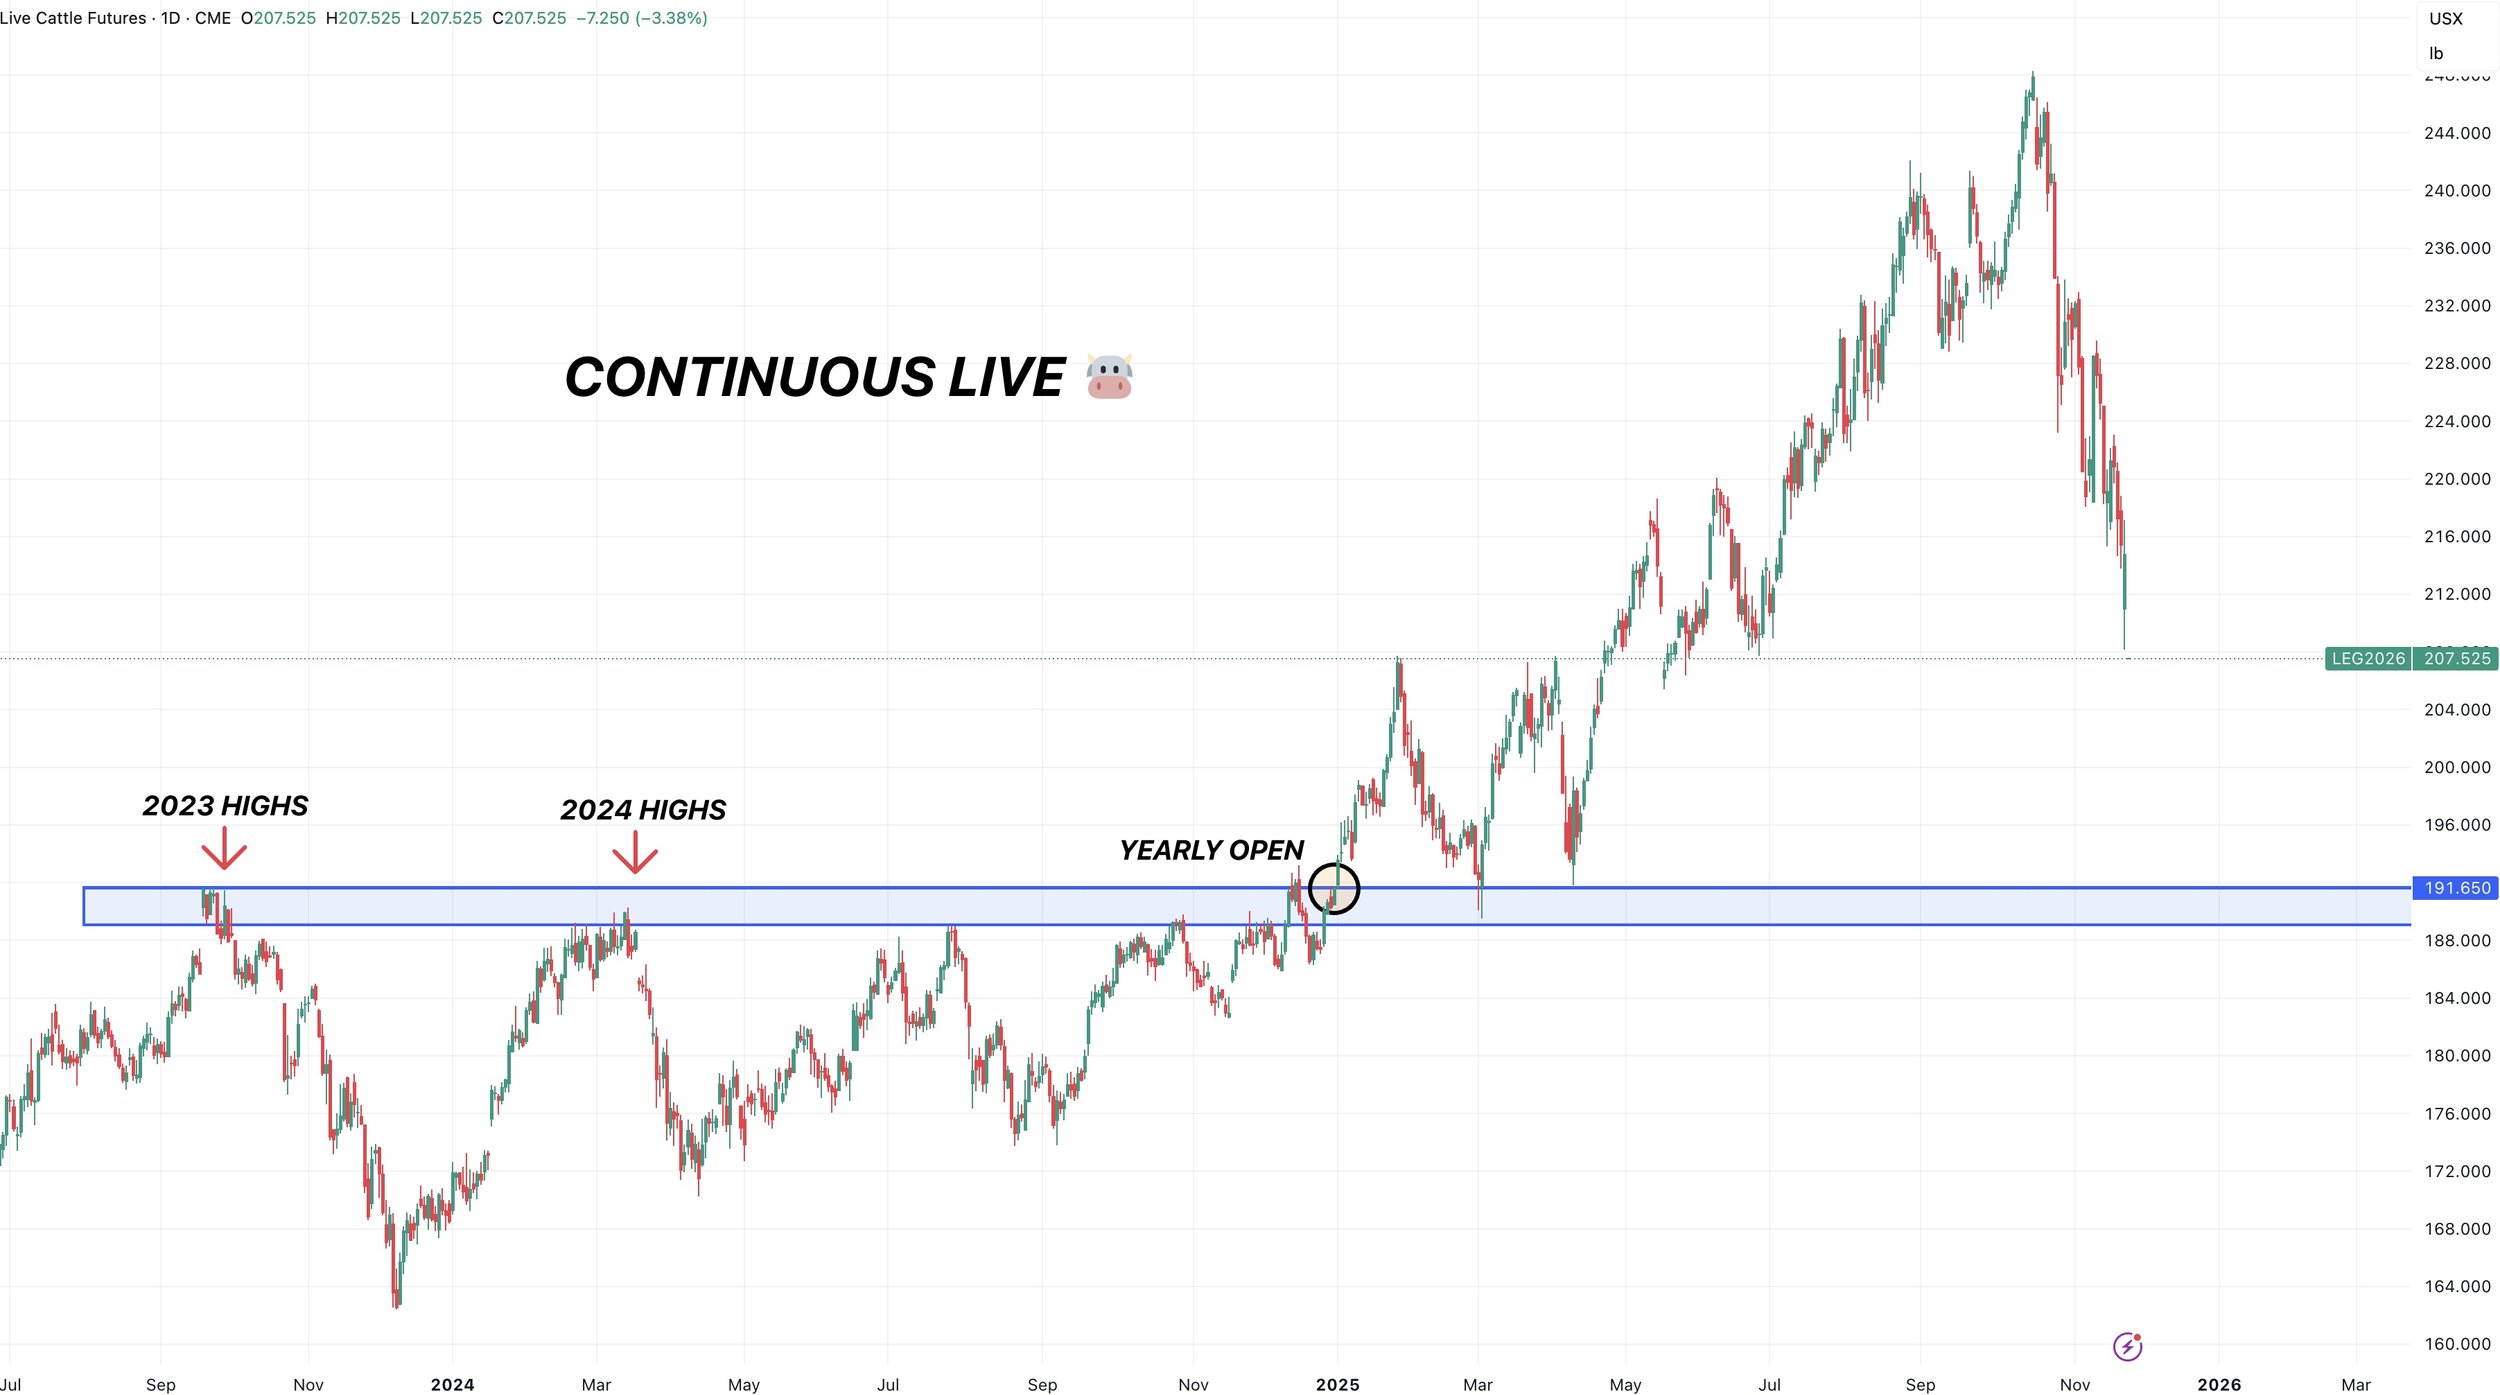
Continuous Live
Our yearly open was 190 or so.
That same 190 range was also our resistance in 2023 and 2024.
So I think that should offer a good base for our longer term support.
Past Sell or Protection Signals
Nov 17th: 🌱
Soybean sell signal & hedge alert.
Nov 13th: 🌽 🌱
Managing risk in corn & beans ahead of USDA report.
Oct 28th: 🌽
Corn sell signal & hedge alert.
Oct 27th: 🌱
Soybean sell signal & hedge alert.
Oct 13th: 🐮
Cattle sell signal & hedge alert.
Aug 22nd: 🌱
Soybean sell signal & hedge alert.
July 31st: 🐮
Cattle sell signal & hedge alert.
July 10th: 🐮
Cattle sell signal & hedge alert.
CLICK HERE TO VIEW
June 5th: 🐮
Cattle sell signal & hedge alert.
June 2nd: 🌾
MPLS wheat sell signal.
April 10th: 🌽
Old crop corn sell signal.
March 19th: 🐮
Cattle hedge & sell signal.
Feb 18th: 🌽 🌾
Old crop KC wheat & old crop corn signal.
Jan 23rd: 🌽 🌱
Corn & beans old crop sell signal.
CLICK HERE TO VIEW
Jan 15th: 🌽 🌱
Corn & beans hedge alert/sell signal.
Jan 2nd: 🐮
Cattle hedge alert at new all-time highs & target.
Dec 11th: 🌽
Corn sell signal at $4.51 200-day MA
CLICK HERE TO VIEW
Oct 2nd: 🌾
Wheat sell signal at $6.12 target
Sep 30th: 🌽
Corn protection signal at $4.23-26
Sep 27th: 🌱
Soybean sell & protection signal at $10.65
Sep 13th: 🌾
Wheat sell signal at $5.98
May 22nd: 🌾
Wheat sell signal when wheat traded +$7.00
Want to Talk?
Our phones are open 24/7 for you guys if you ever need anything or want to discuss your operation.
Hedge Account
Interested in a hedge account? Use the link below to set up an account or shoot Jeremey a call at (605)295-3100.