
IS YIELD ACTUALLY ABOVE TREND?
MARKET UPDATE
You can scroll to read the usual update as well. As the written version is the exact same as the video.
Timestamps for video:
Overview: 0:00min
Yield vs Conditions: 1:45min
Corn Charts: 9:00min
Bean Charts: 11:45min
Wheat Charts: 14:35min
Cattle Charts: 16:10min
Want to talk?
Office: (806)484-1214
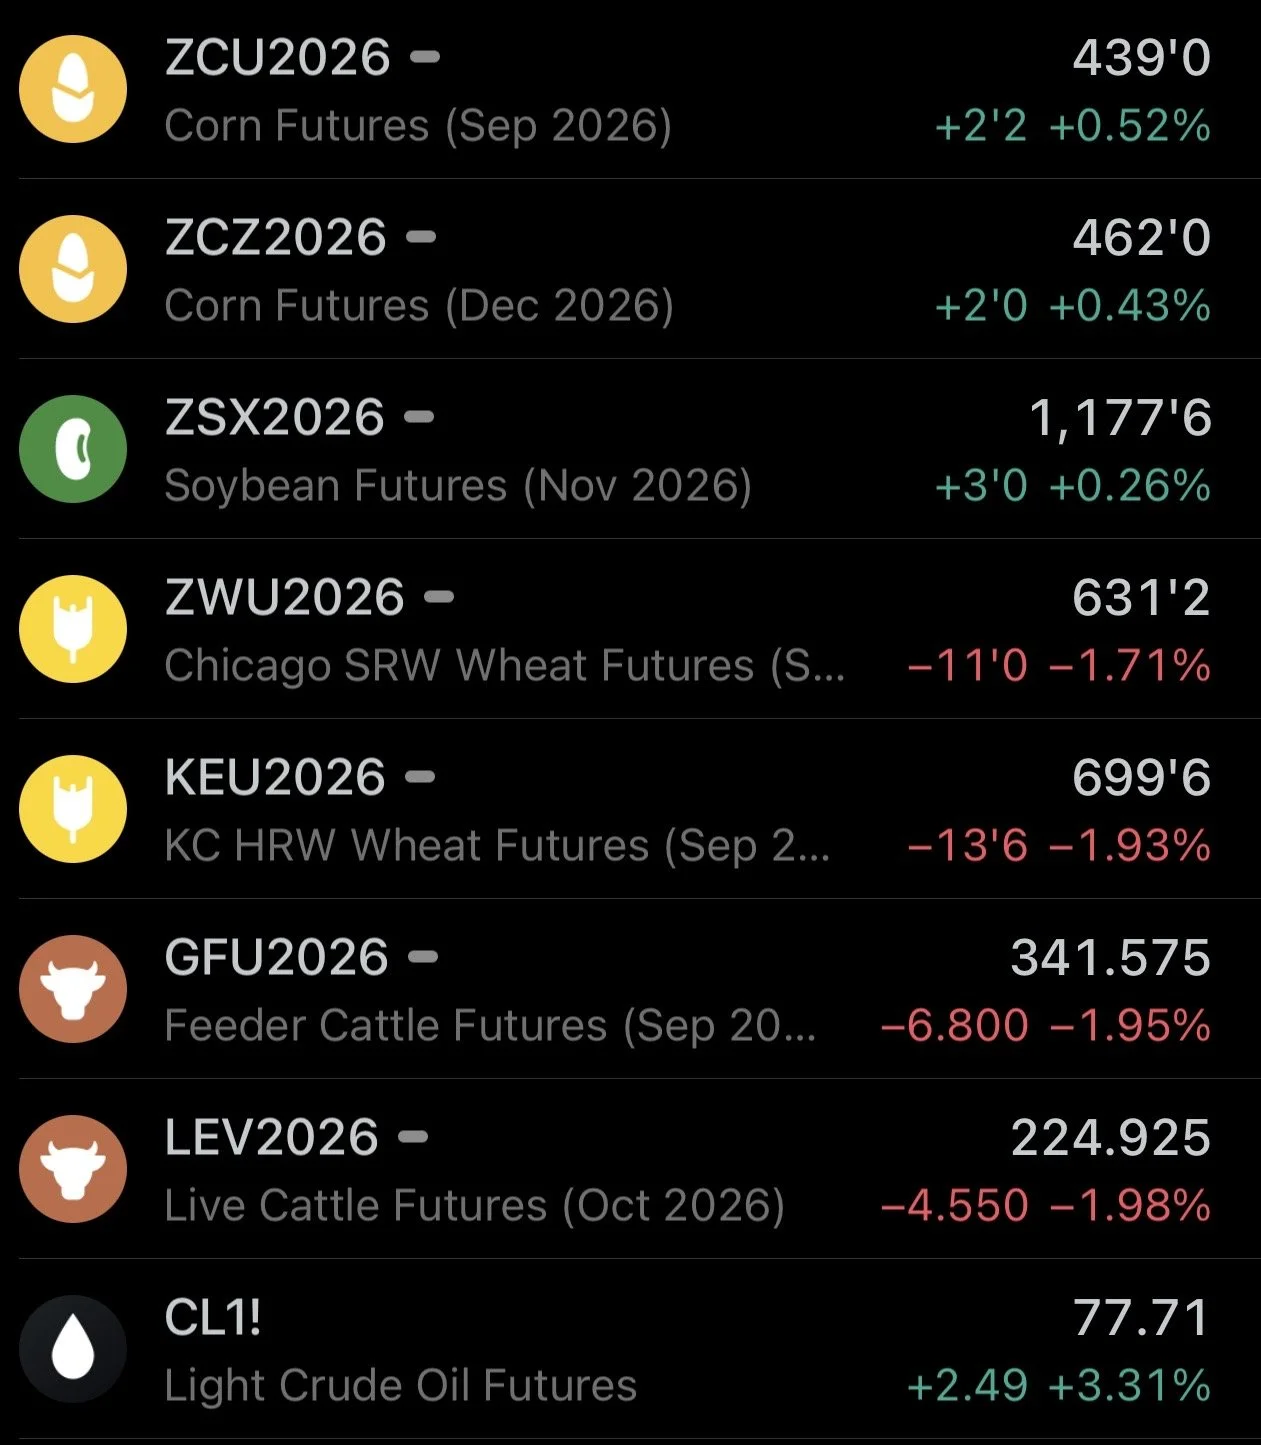
Futures Prices Close
Overview
Very quiet day for corn and soybeans, as both had pretty small ranges today.
Soybeans had an 8 cent range, closing up +3 cents.
Corn had a 5 cent range, closing up +2 cents.
The wheat market took a sizeable hit today despite the ongoing Black Sea disruptions, things over there haven’t resolved but the market just seems disinterested in the story for now.
Cattle was down hard. I didn’t see any specific reasoning behind the weakness aside from cutout being down. Cash traded higher yesterday.
Overall news is pretty light this week. As all of the focus is going to be on the big USDA report next week. As that is going to be our next real catalyst. As the market simply lacks a fresh story for now.
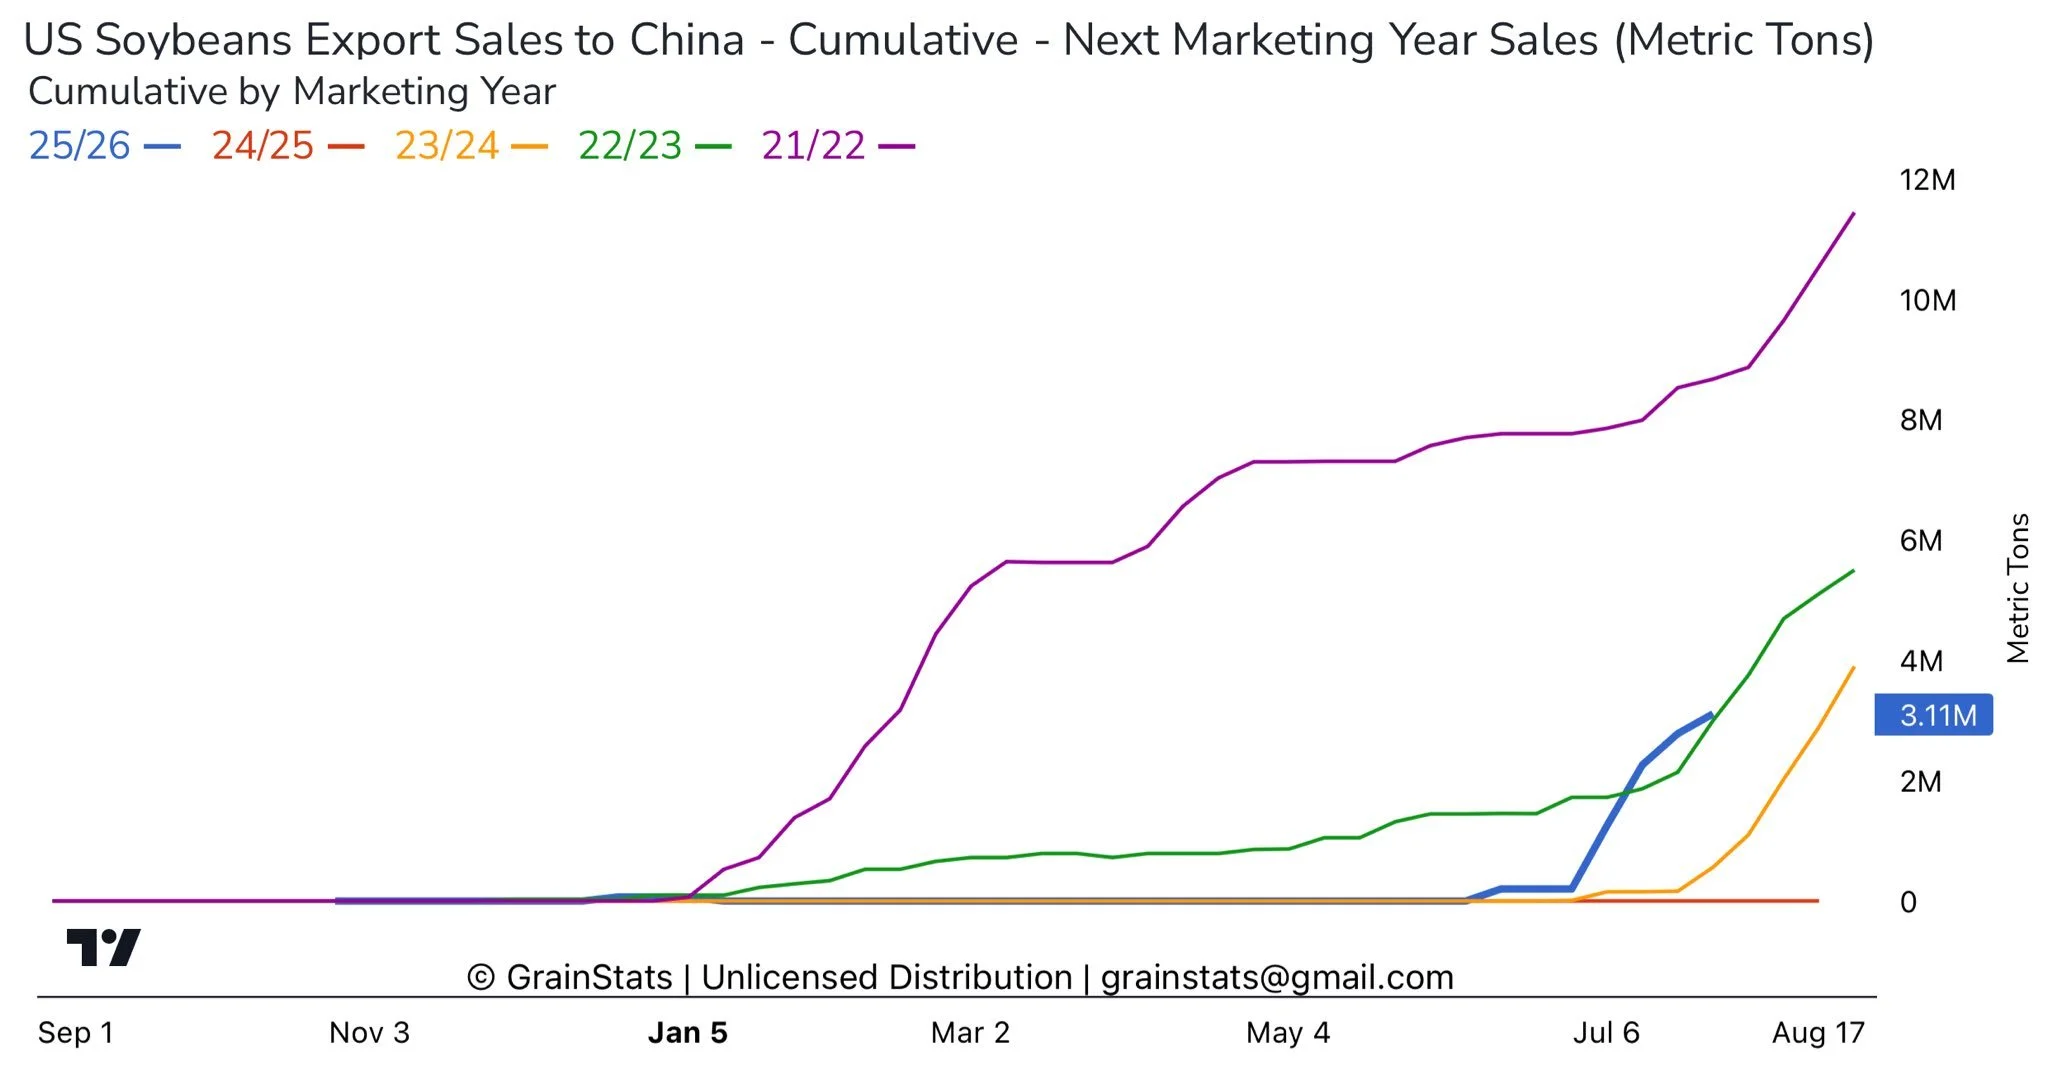
We do continue to see China step in and buy soybeans. As we saw yet another flash sale this morning. As we've sold around 900k MT this week.
Our sales to China for new crop are running at their best pace since 2021/22.
Chart from @GrainStats on X
Right now the markets are just waiting for something to chew on.
As we really don’t have anything new or exciting, and likely won’t until the report.
We had that counter-seasonal rally, but bulls ran out of catalysts and needed to continue being fed going into what is usually a seasonally weak time frame heading into August.
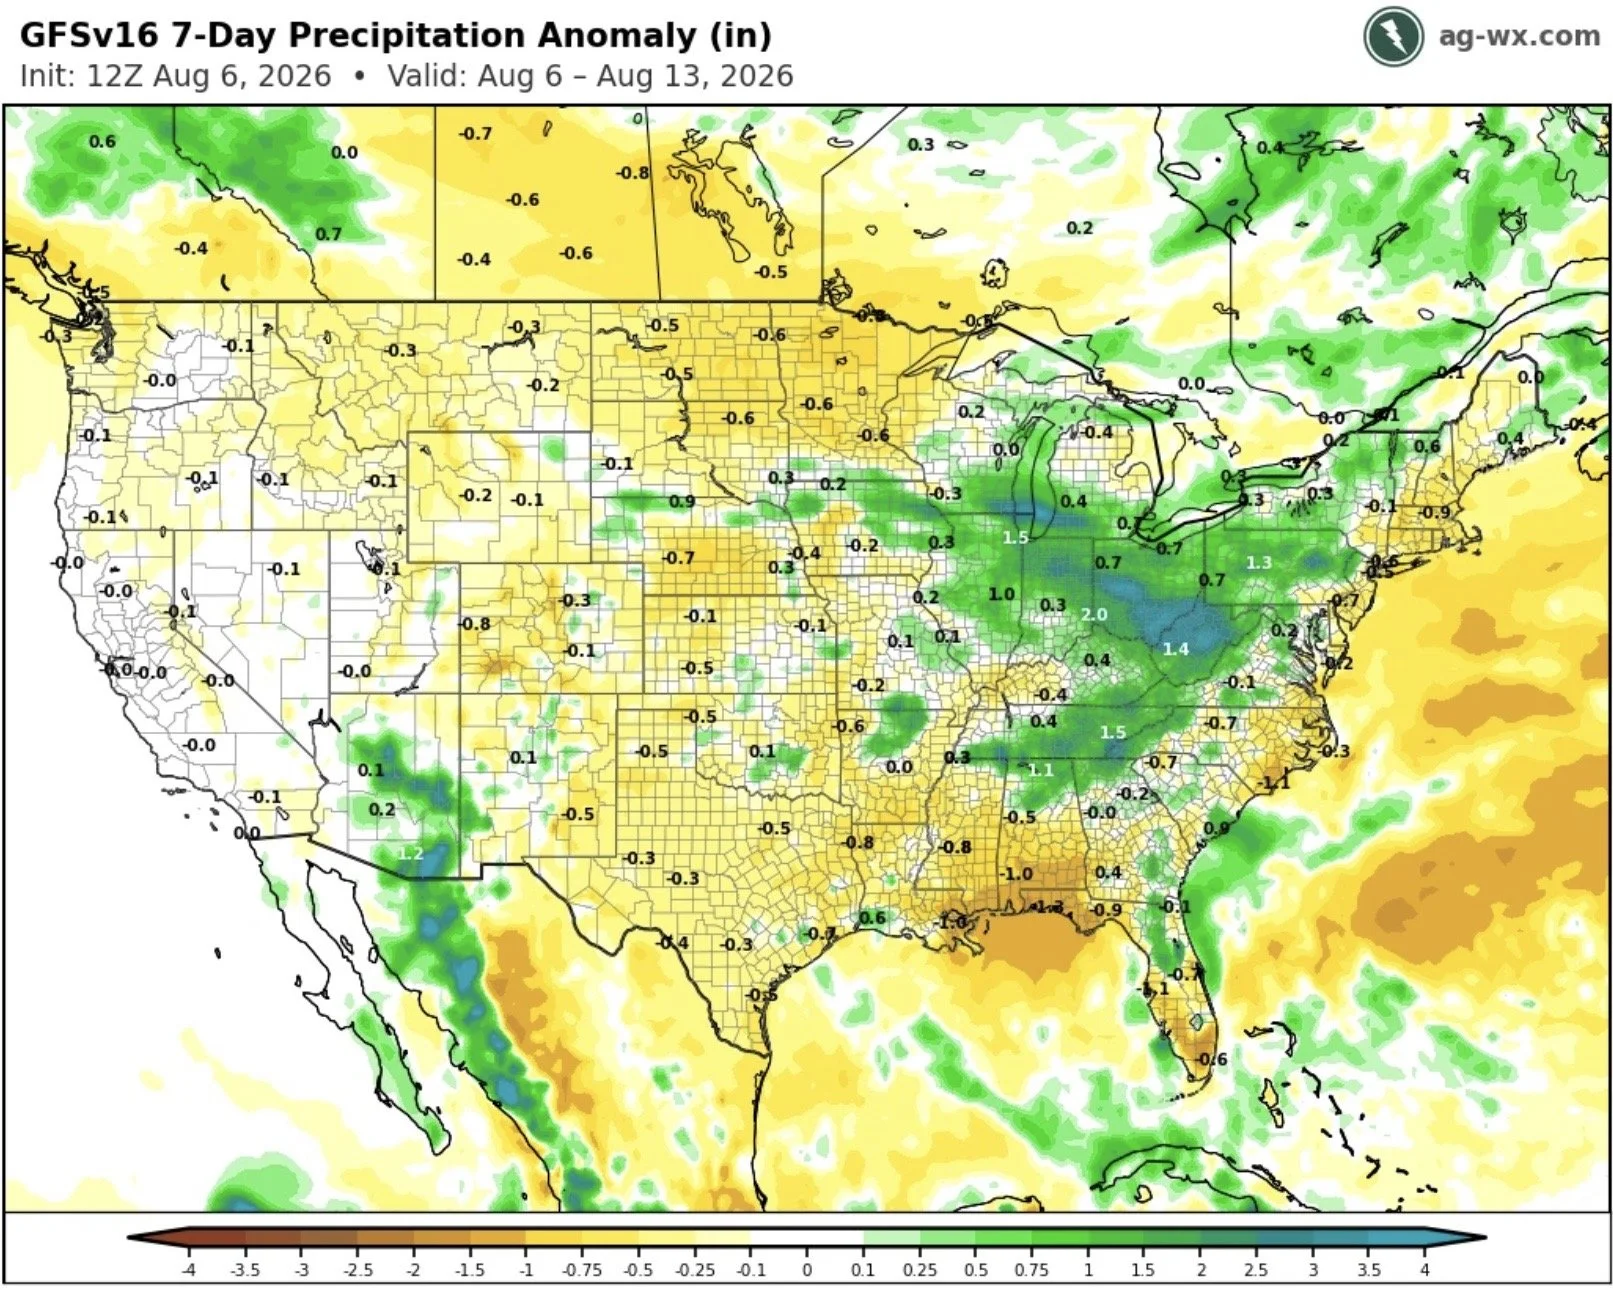
Weather does look like it's still on the favorable side. With plenty of rain in the central to eastern corn belt.
Weather isn’t going to make or break the corn crop here, but is still going to be big when it comes to crop potential for soybeans.
Given that nothing has changed and the market is waiting for the USDA.
Today we are doing a little deeper dive into what these corn crop ratings could mean, along with a bunch of technical charts.
Let's jump right in.
Diving into Conditions vs Yield
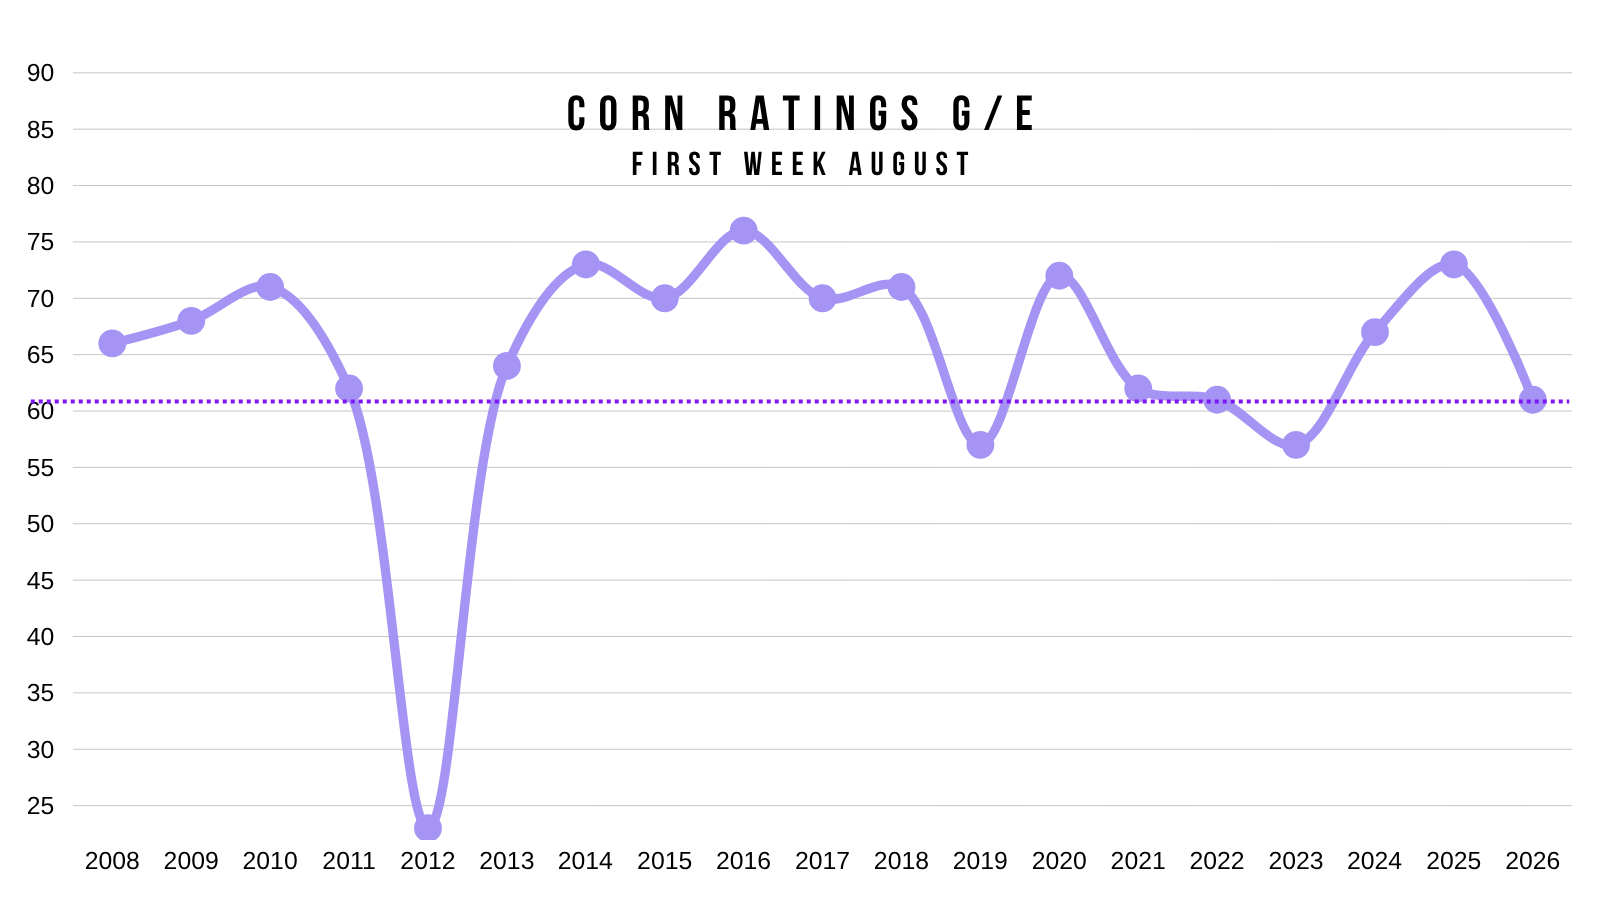
Corn crop conditions are at 61% G/E.
How poor is that rating when compared to other years?
Since 2008, this would be the 4th lowest rating.
There are only 3 other years that featured a worst rating.
2012: 23%
2019: 57%
2023: 57%
2026: 61%
2022: 61%
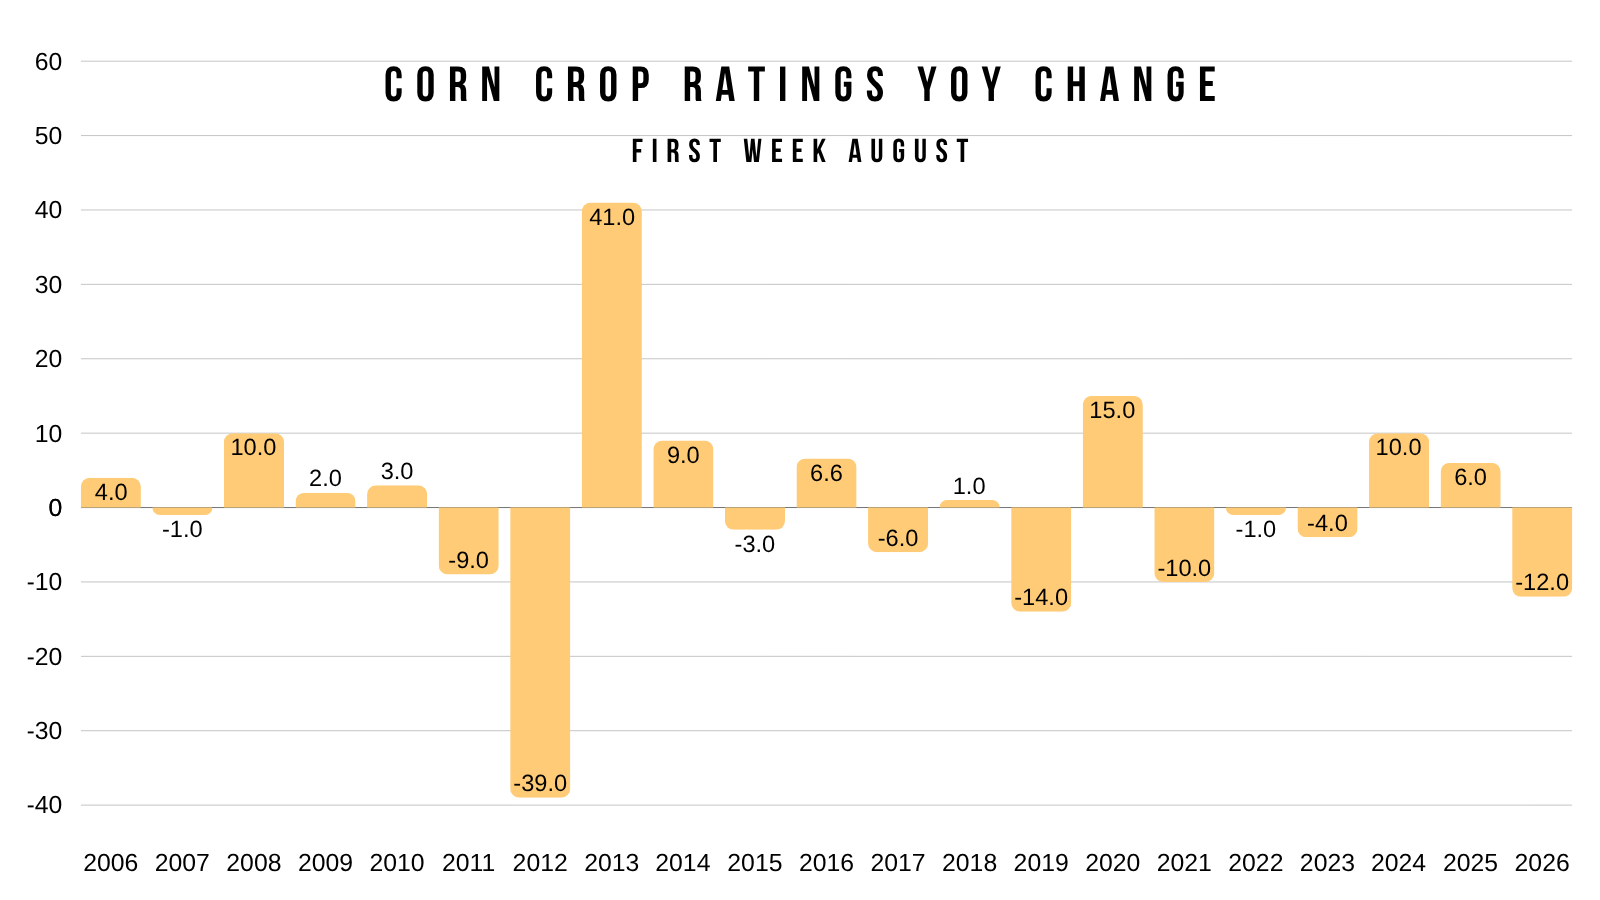
Corn ratings are down -12% from last year.
That is a pretty significant decrease.
This would be the 3rd largest YOY drop in at least the last 20 years for today's date.
The only two years that saw a larger drop were 2012 and 2019.
2012: -39%
2019: -14%
2026: -12%
2021: -10%
2011: -9%
I showed this next set of data earlier this week.
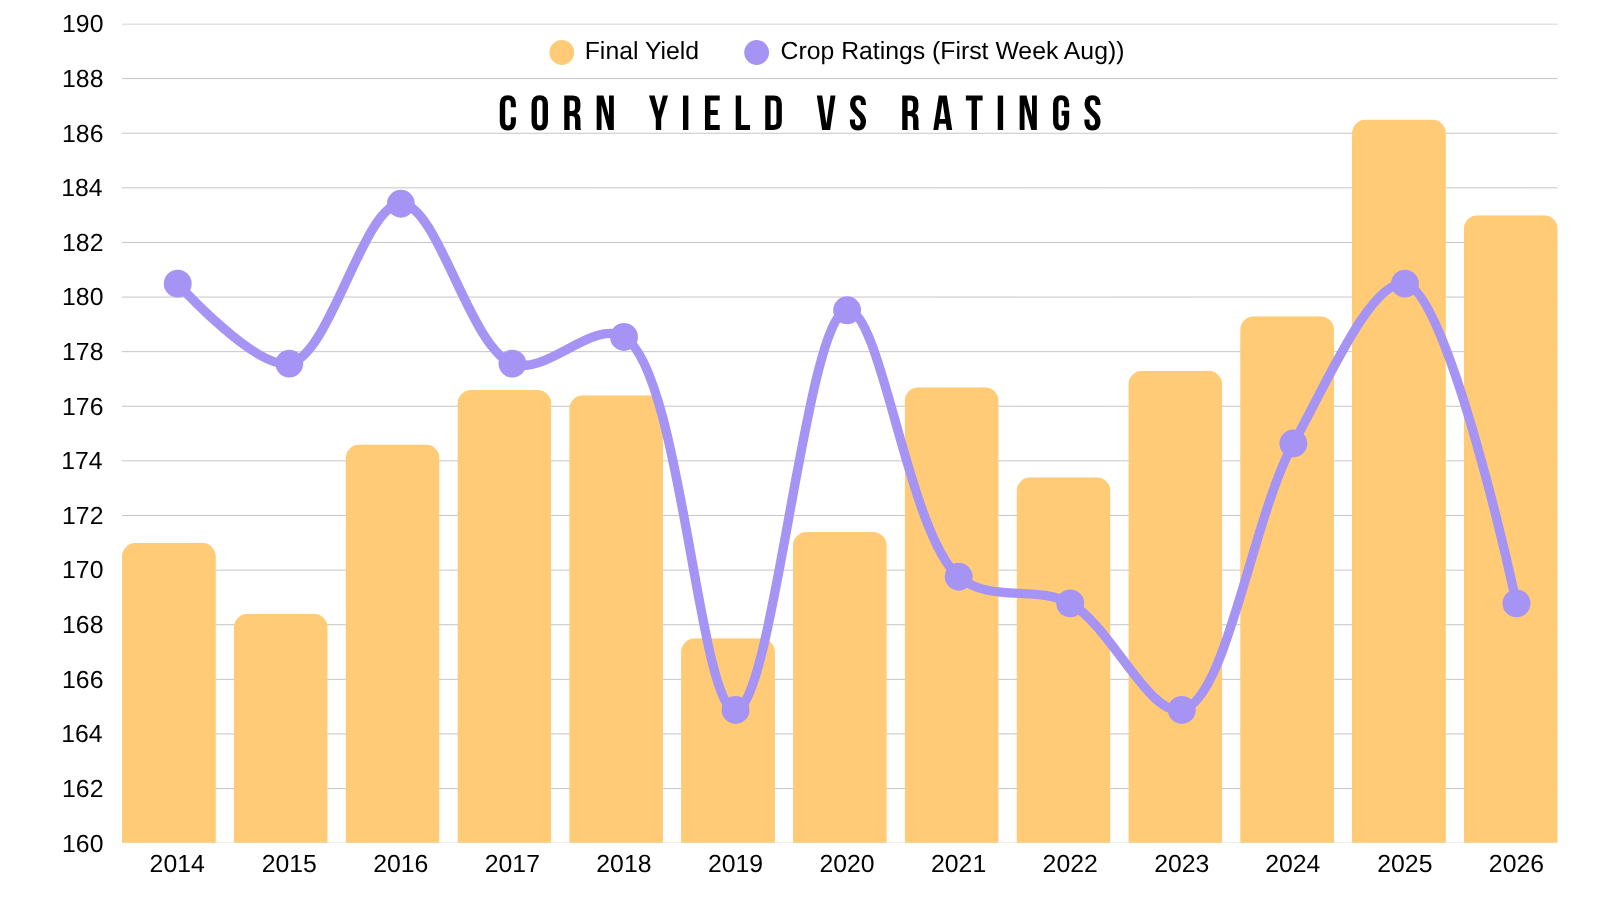
This first chart shows final corn yield vs crop ratings for today's date.
At first glance, you would assume crop ratings really have no correlation when it comes to final yield.
As based on this chart, there really is no correlation.
We've seen plenty of years where crop ratings were worse than the year prior, yet yield actually ended up higher.
Examples of this would be:
2017
2021
2023
But does that first chart really tell the whole story?
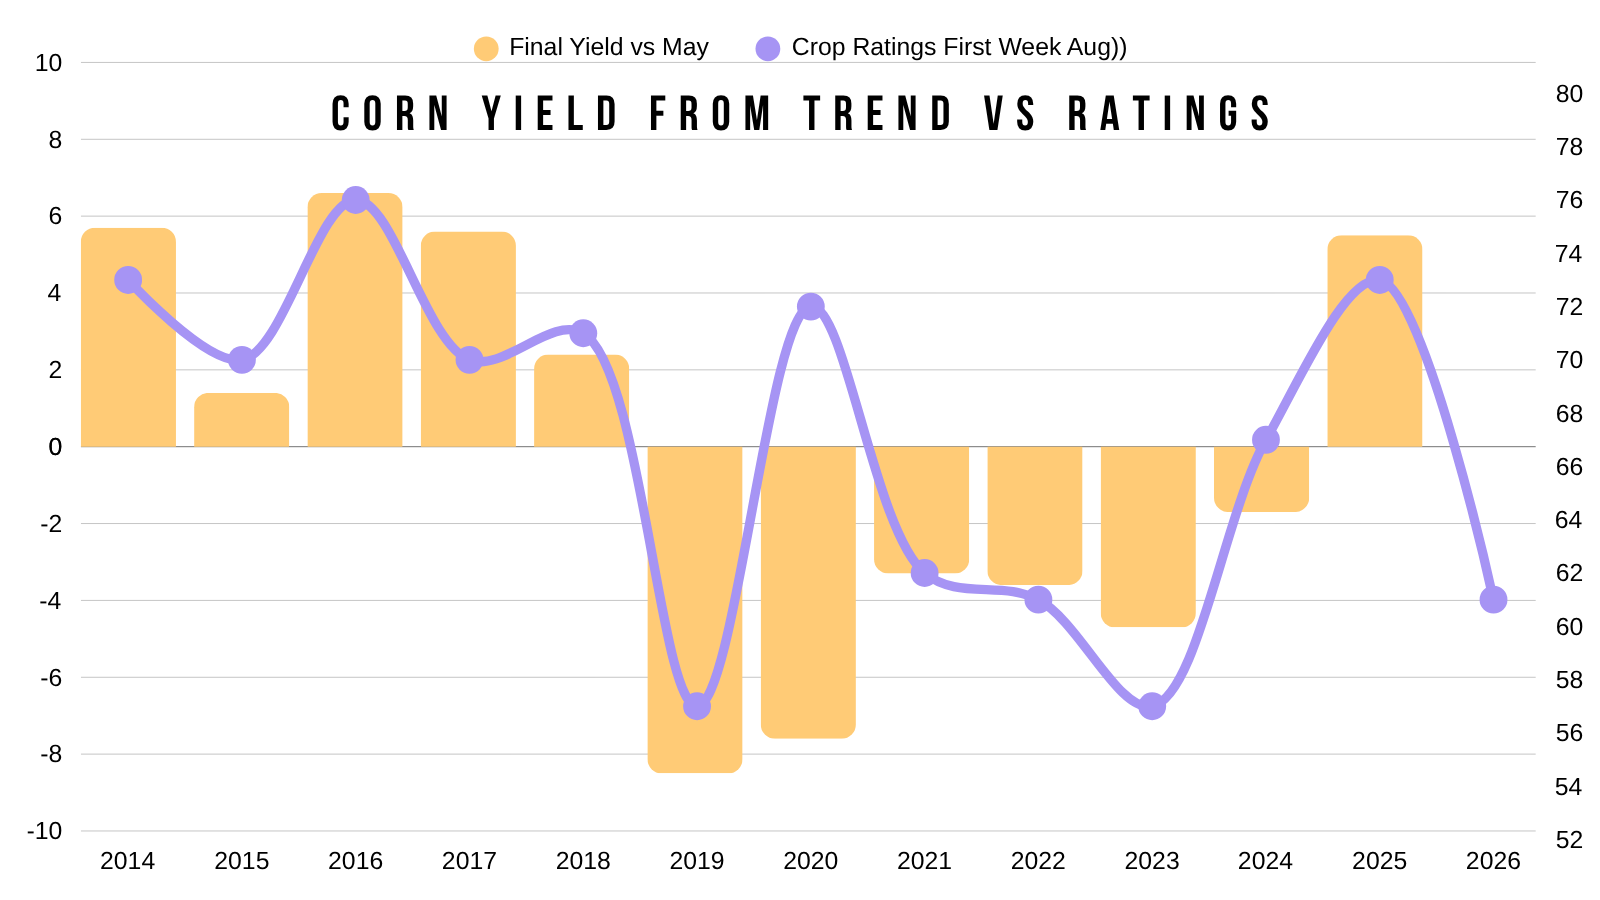
Here is another chart I shared earlier this week.
This one shows crop ratings along with how our final yield changed vs the starting point in May.
So rather than comparing how yield changed vs the prior year, it simply compares how yield changed from the start of the year.
I would argue there is a very clear correlation here.
Every year ratings were around 70% or higher, we saw yield come in above trend.
This happened from 2014 to 2018. Then again in 2025 last year.
The only year we saw good ratings this time of year, yet a below trend yield was 2020. Which was due to the late year issues and derechos etc.
On the flip side, every time we have seen crop ratings around 67% or lower, yield has came in below trend.
Which happened from 2019 to 2024.
So take 2023 for example. We had awful ratings that year. Yield was also a record that year. But despite yield being a record, yield came in well below where it started at.
This would be one big reason why I think there is a decent chance yield is not above trend.
Ratings can always change. Maybe the crop sees an improvement from here, and the data ends up favoring a bump in yield later.
However, crop conditions do have a tendency to continue to decrease as the year goes on, rather than improve. That does not mean they cannot improve for a few weeks, but usually they decrease over time.
Over the last 6 years, the only year we saw conditions improve as the year went on was 2023. Given that they started very low in June.
Even in 2023 the ratings then topped in early August before continuing to fall lower.

The USDA is likely going to be moving yield.
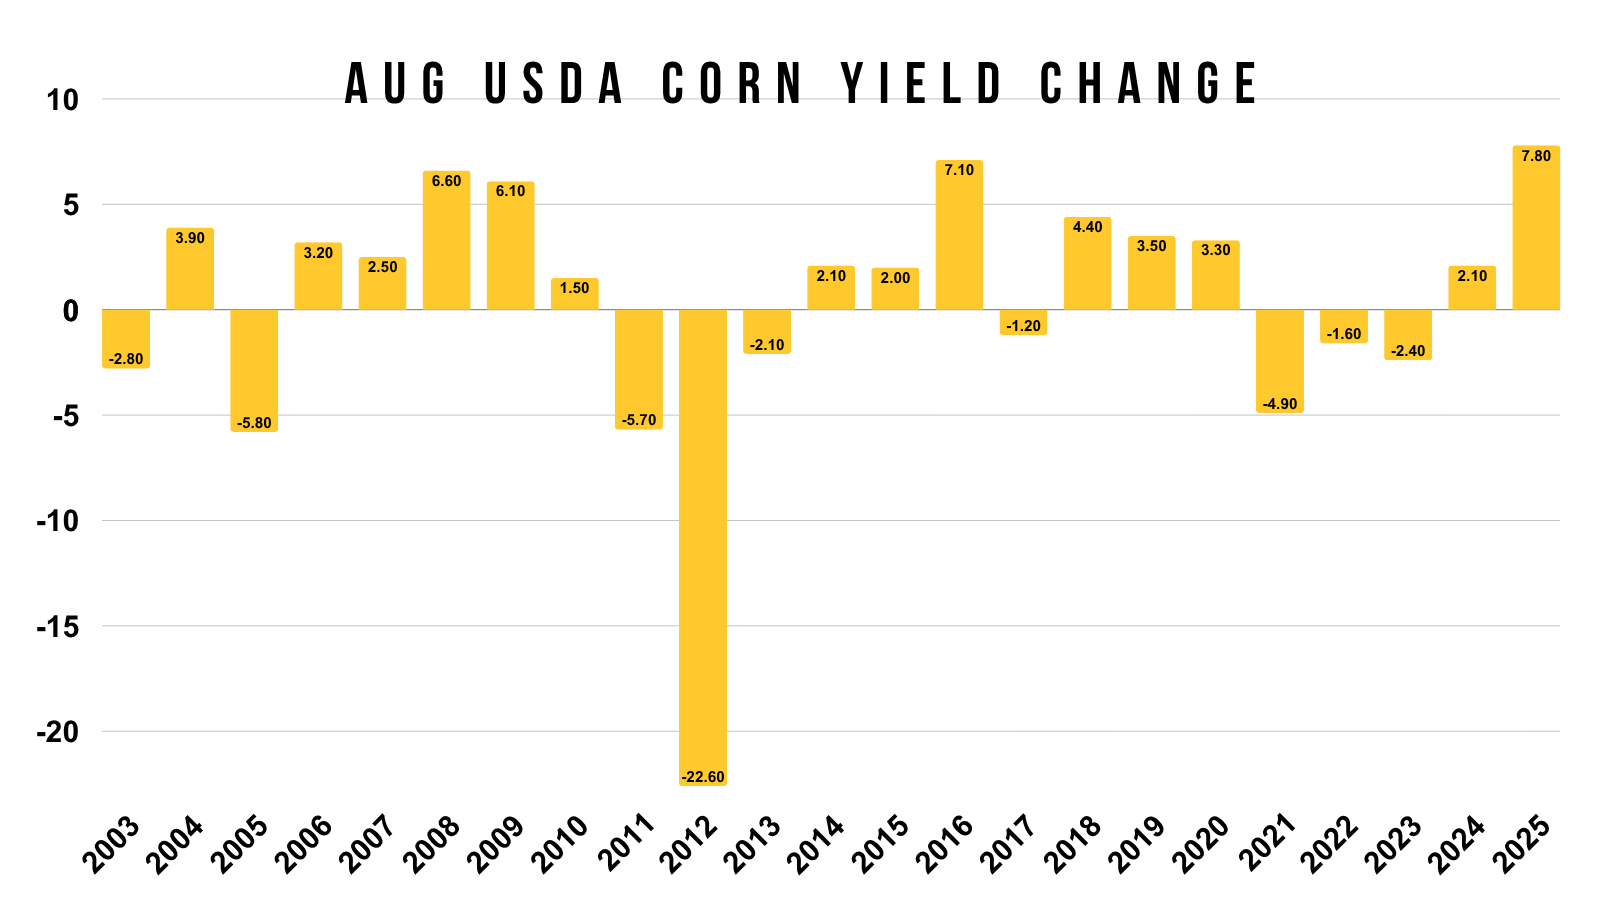
They have a history of moving it pretty significantly in this report.
Over the last 23 years, we have never seen then move yield by less than 1 bpa.
The smallest change we saw was 2017's 1.20 bpa decrease.
Over the last 23 years, the USDA has only moved yield by less than 2 bpa three times. Which was 2010, 2017, and 2022.
So we should be expecting some changes next week.
We knows what the USDA is going to do next week.
We all know they have a history of slow playing any massive friendly changes.
So if yield is actually lower, there is always the chance we don’t find out until even January.
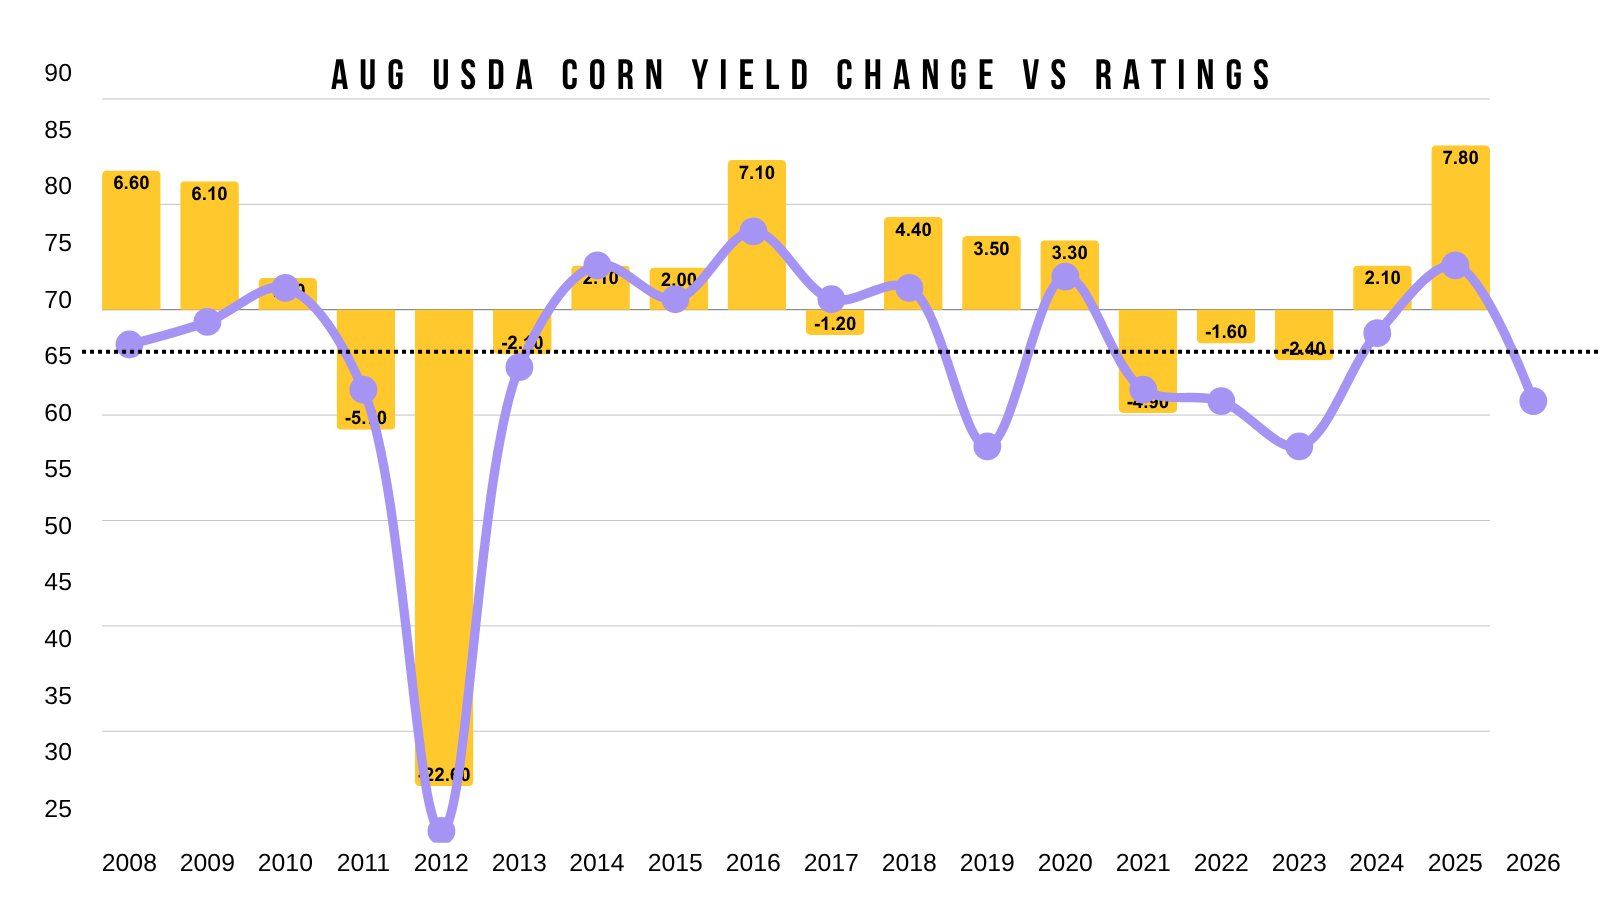
If we look at how they changed yield in August vs the crop ratings at the time, there is some interesting data.
Every time ratings were below 65% they did lower yield in the August report. (The only year they did not drop it in August was 2019, as they made the rare yield change in July).
We'll have to wait and see if this matters or not, or if it's simply a coincidence.
However, most of the industry and the market seems to believe we are going to be getting an increase.
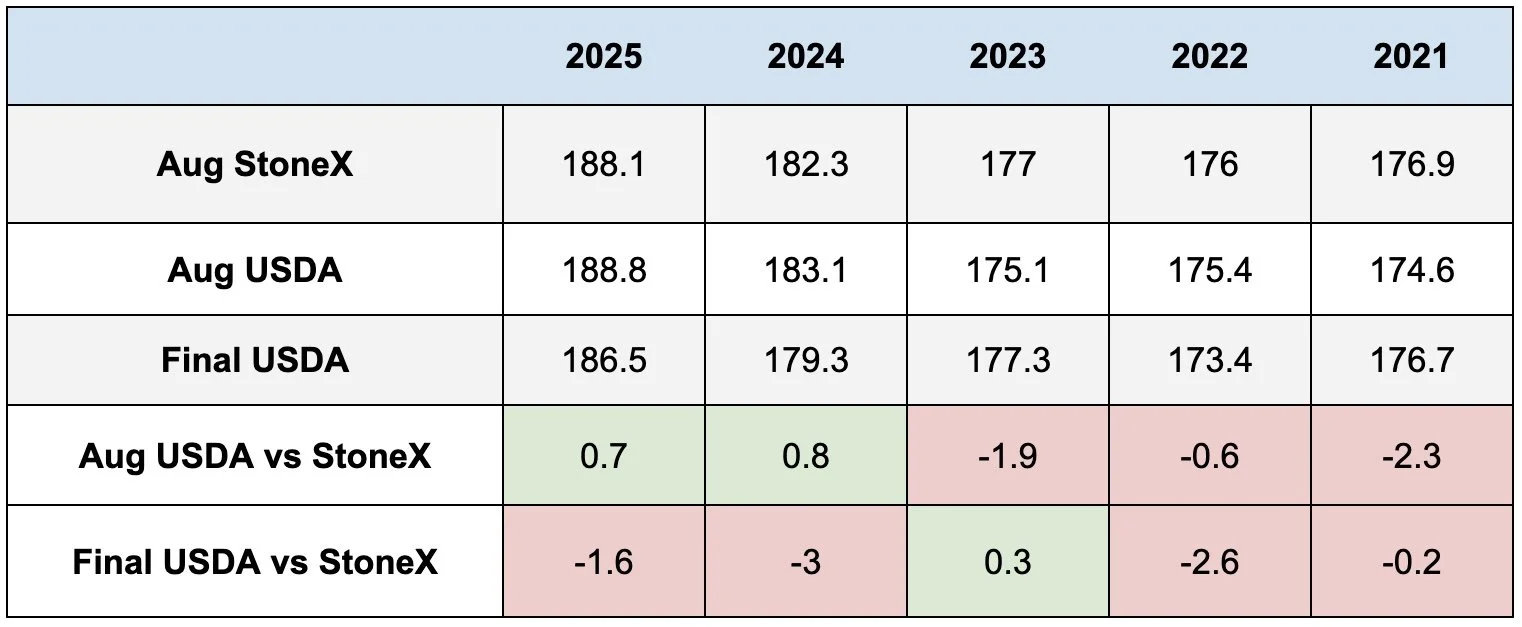
StoneX did just put their guess at 184.8 vs the current trendline 183.
If we look at how StoneX has done in the past, here is the data for the last 5 years.
The USDA came in slightly higher than StoneX's guess the last two years. But lower in the 3 years prior.
The final USDA yield has came in below StoneX's guess 4 of the last 5 years. 2023 was the only year it did not.
We'll have to wait and see what the USDA decides to do next week.
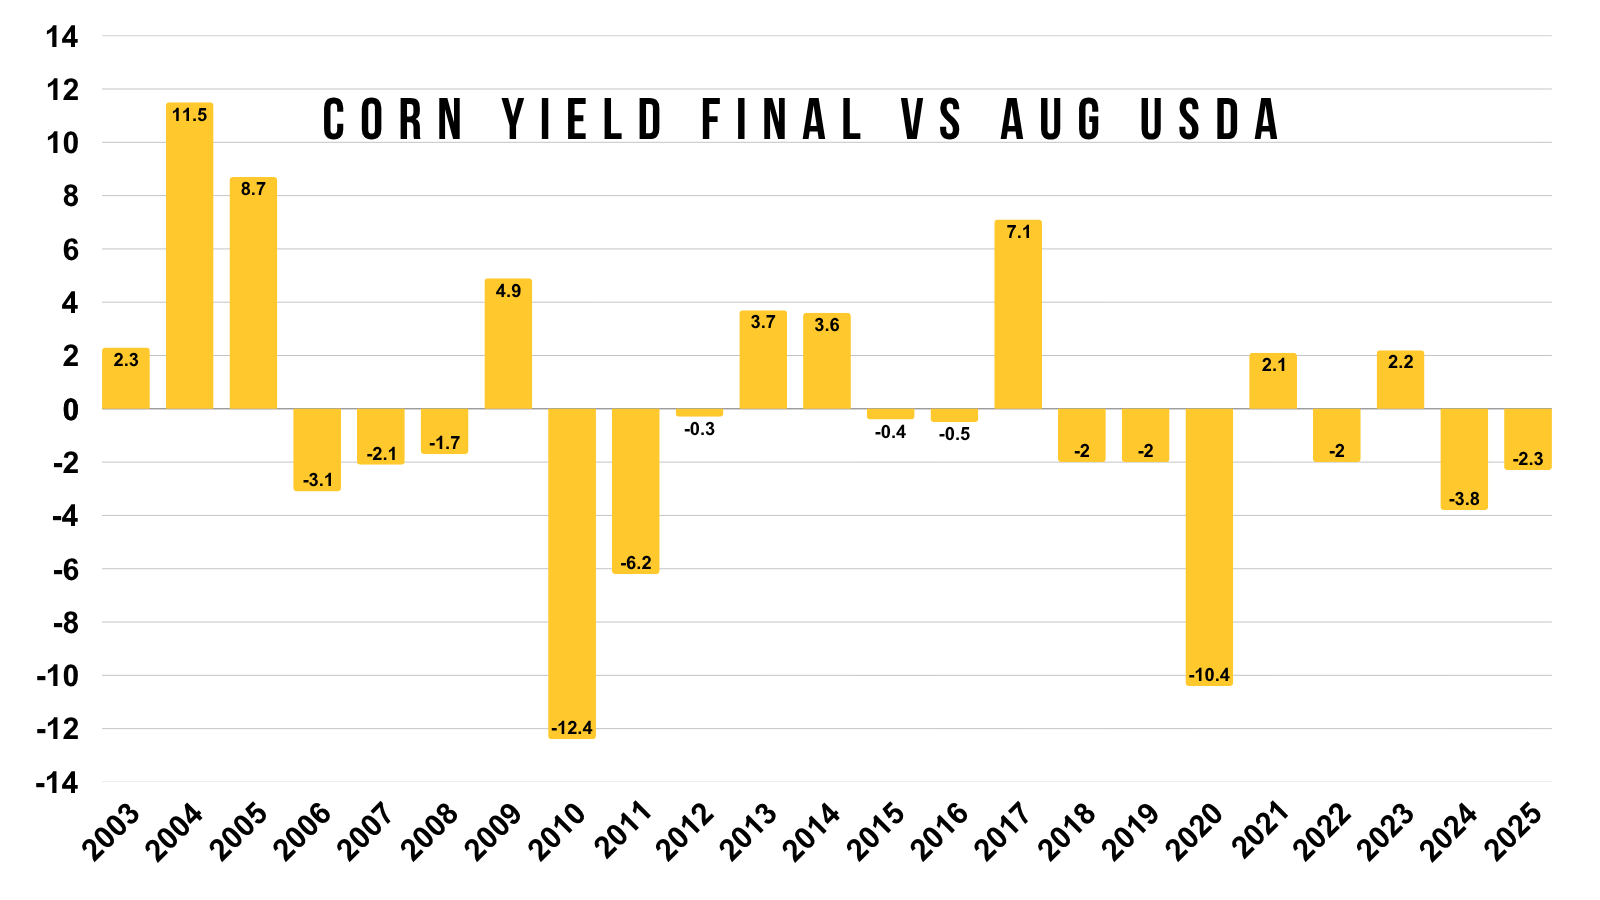
Here is the changes from the August yield to the final yield.
It has decreased the last 14 of 20 years. So the final has a tendency to come in lower than August.
Let's just say the USDA bumps yield. As that is a very real possibility.
Then what?
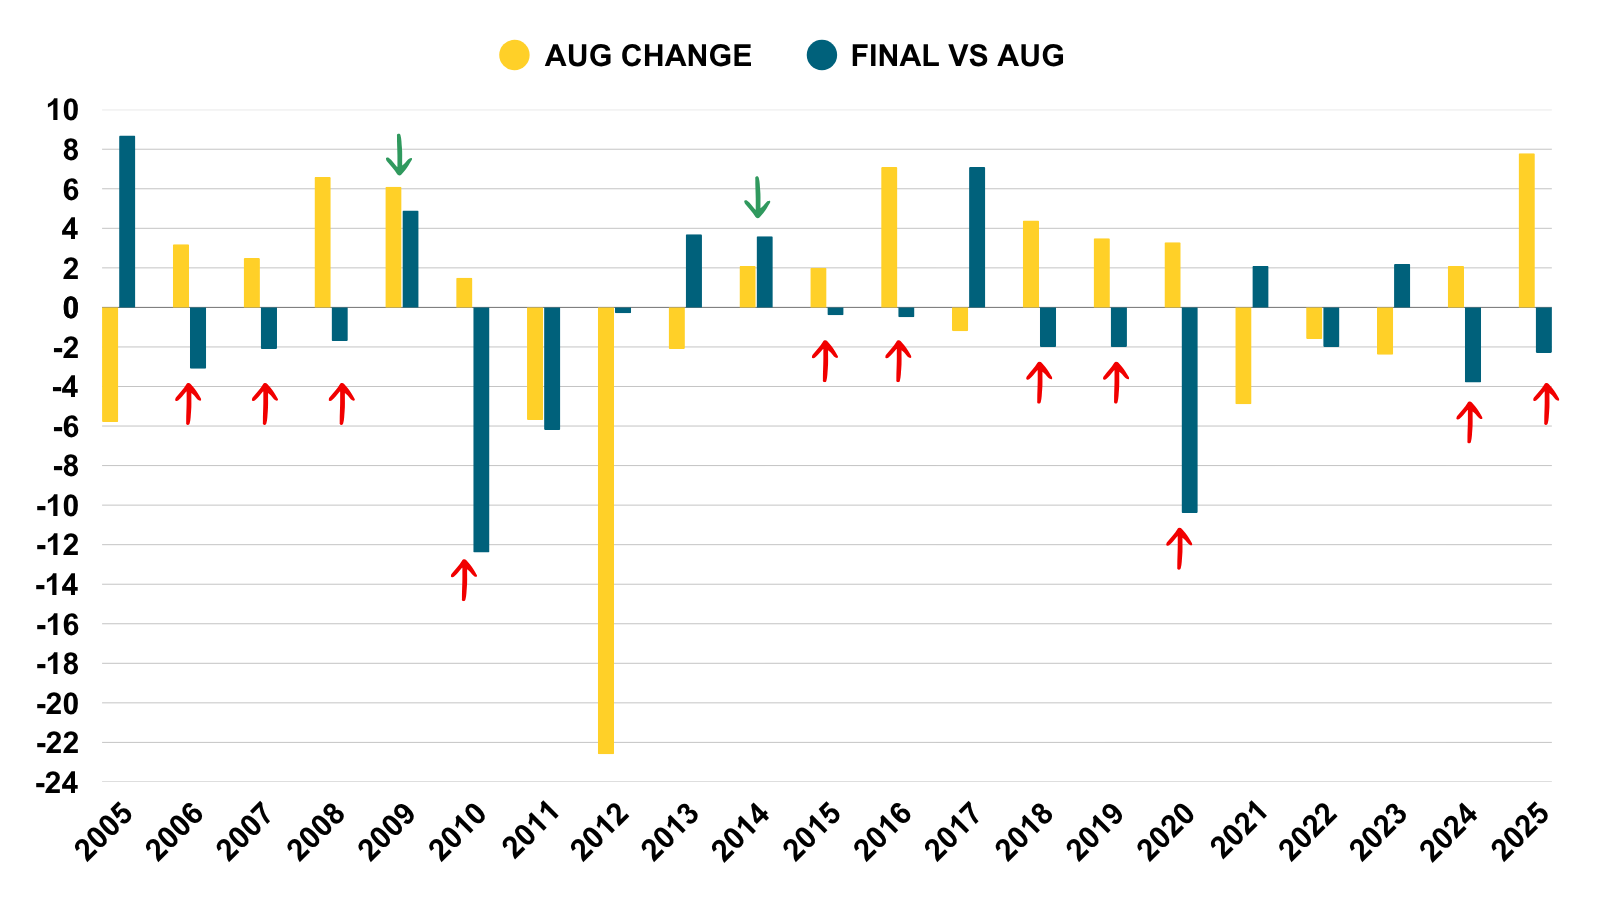
This chart shows how the USDA changed yield in August in yellow.
While also showing how the final yield changed vs August in blue.
Most of the time, if they raise yield in August, the final yield winds up being lower than where they printed it in August.
So anytime that yellow bar was higher, which resembles the USDA raising yield in August.
It was typically followed by a lower blue bar, which resembles the final yield coming in below the August estimate.
There are only two years where the USDA raised yield in August, and the final ended up being higher than the August print.
That was 2009 and 2014.
The other 11 instances final yield came in lower.
So based on all of this data, it's hard to say whether or not the USDA adjusts yield lower next week or not. Most believe they are going to bump it a little higher.
But when it's all said and done, there are plenty of reasons to believe that yield eventually comes down unless crop ratings end up seeing a big improvement.
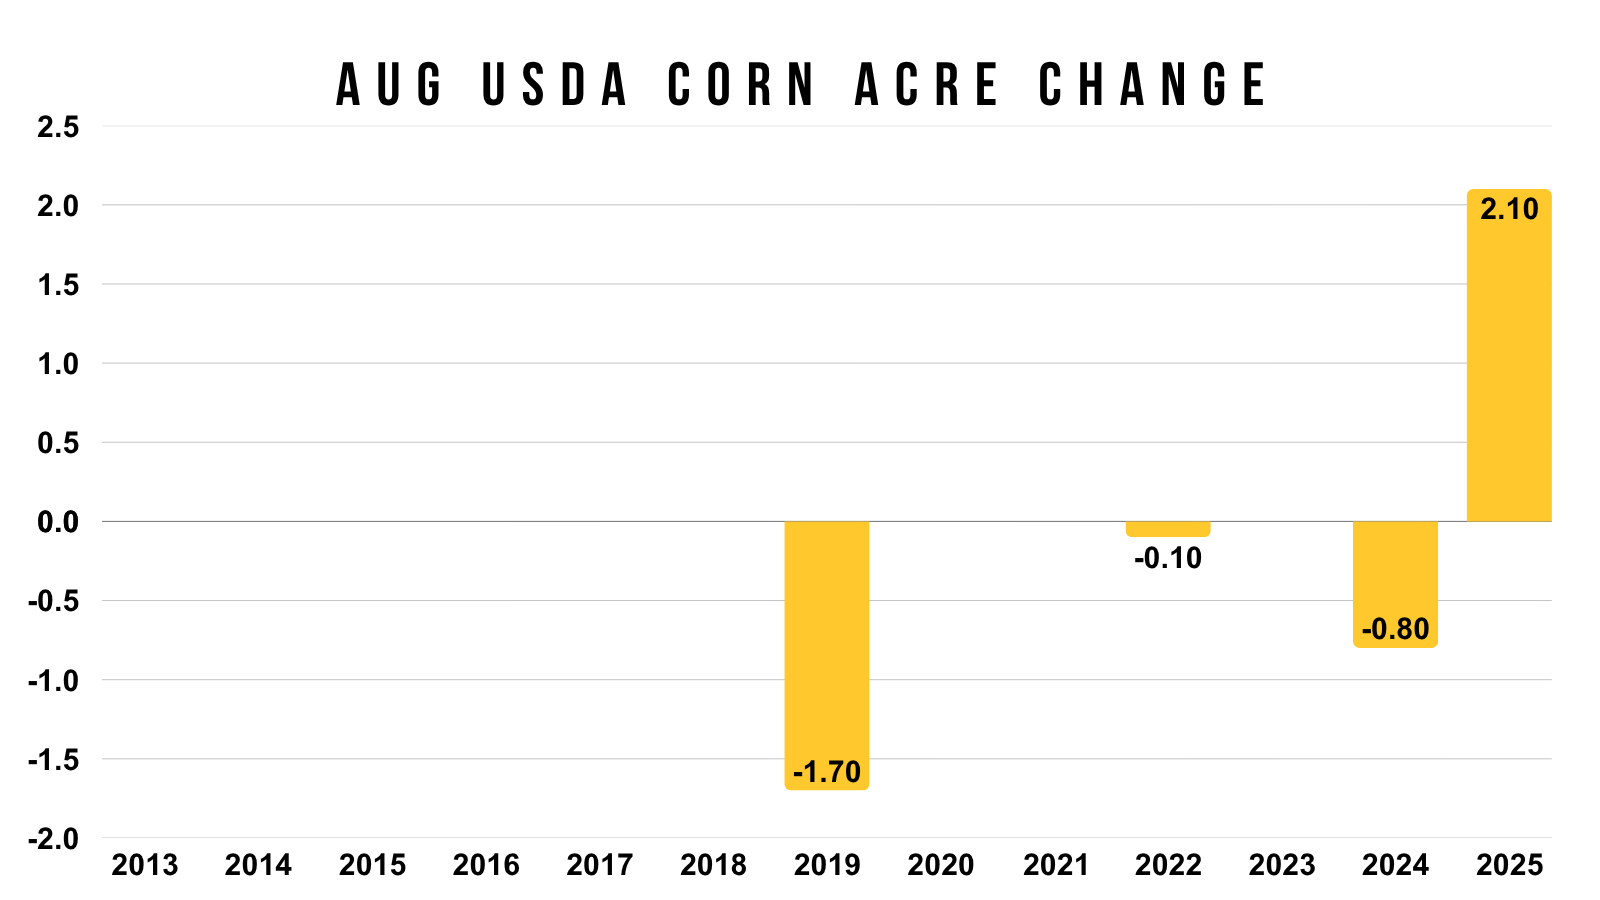
One last thing to note is acres.
Usually the USDA does not change acres in August, but both of the previous two years have actually saw a large change in acres.
If acres change, it could be just as important as yield.
That's all I got today for fundamentals.
If you want some deeper dives on the fundamentals, check out some of my previous videos.
As we've gone over fundamentals and the short-term risks along with the long-term possibilities plenty of times recently.
Aug 4th Update: Click Here
July 28th Update: Click Here
July 24th Update: Click Here (this one had a lot of charts and reasons for defending the rally)
Now let's get into the charts and key levels we want to be watching.
Charts
Corn
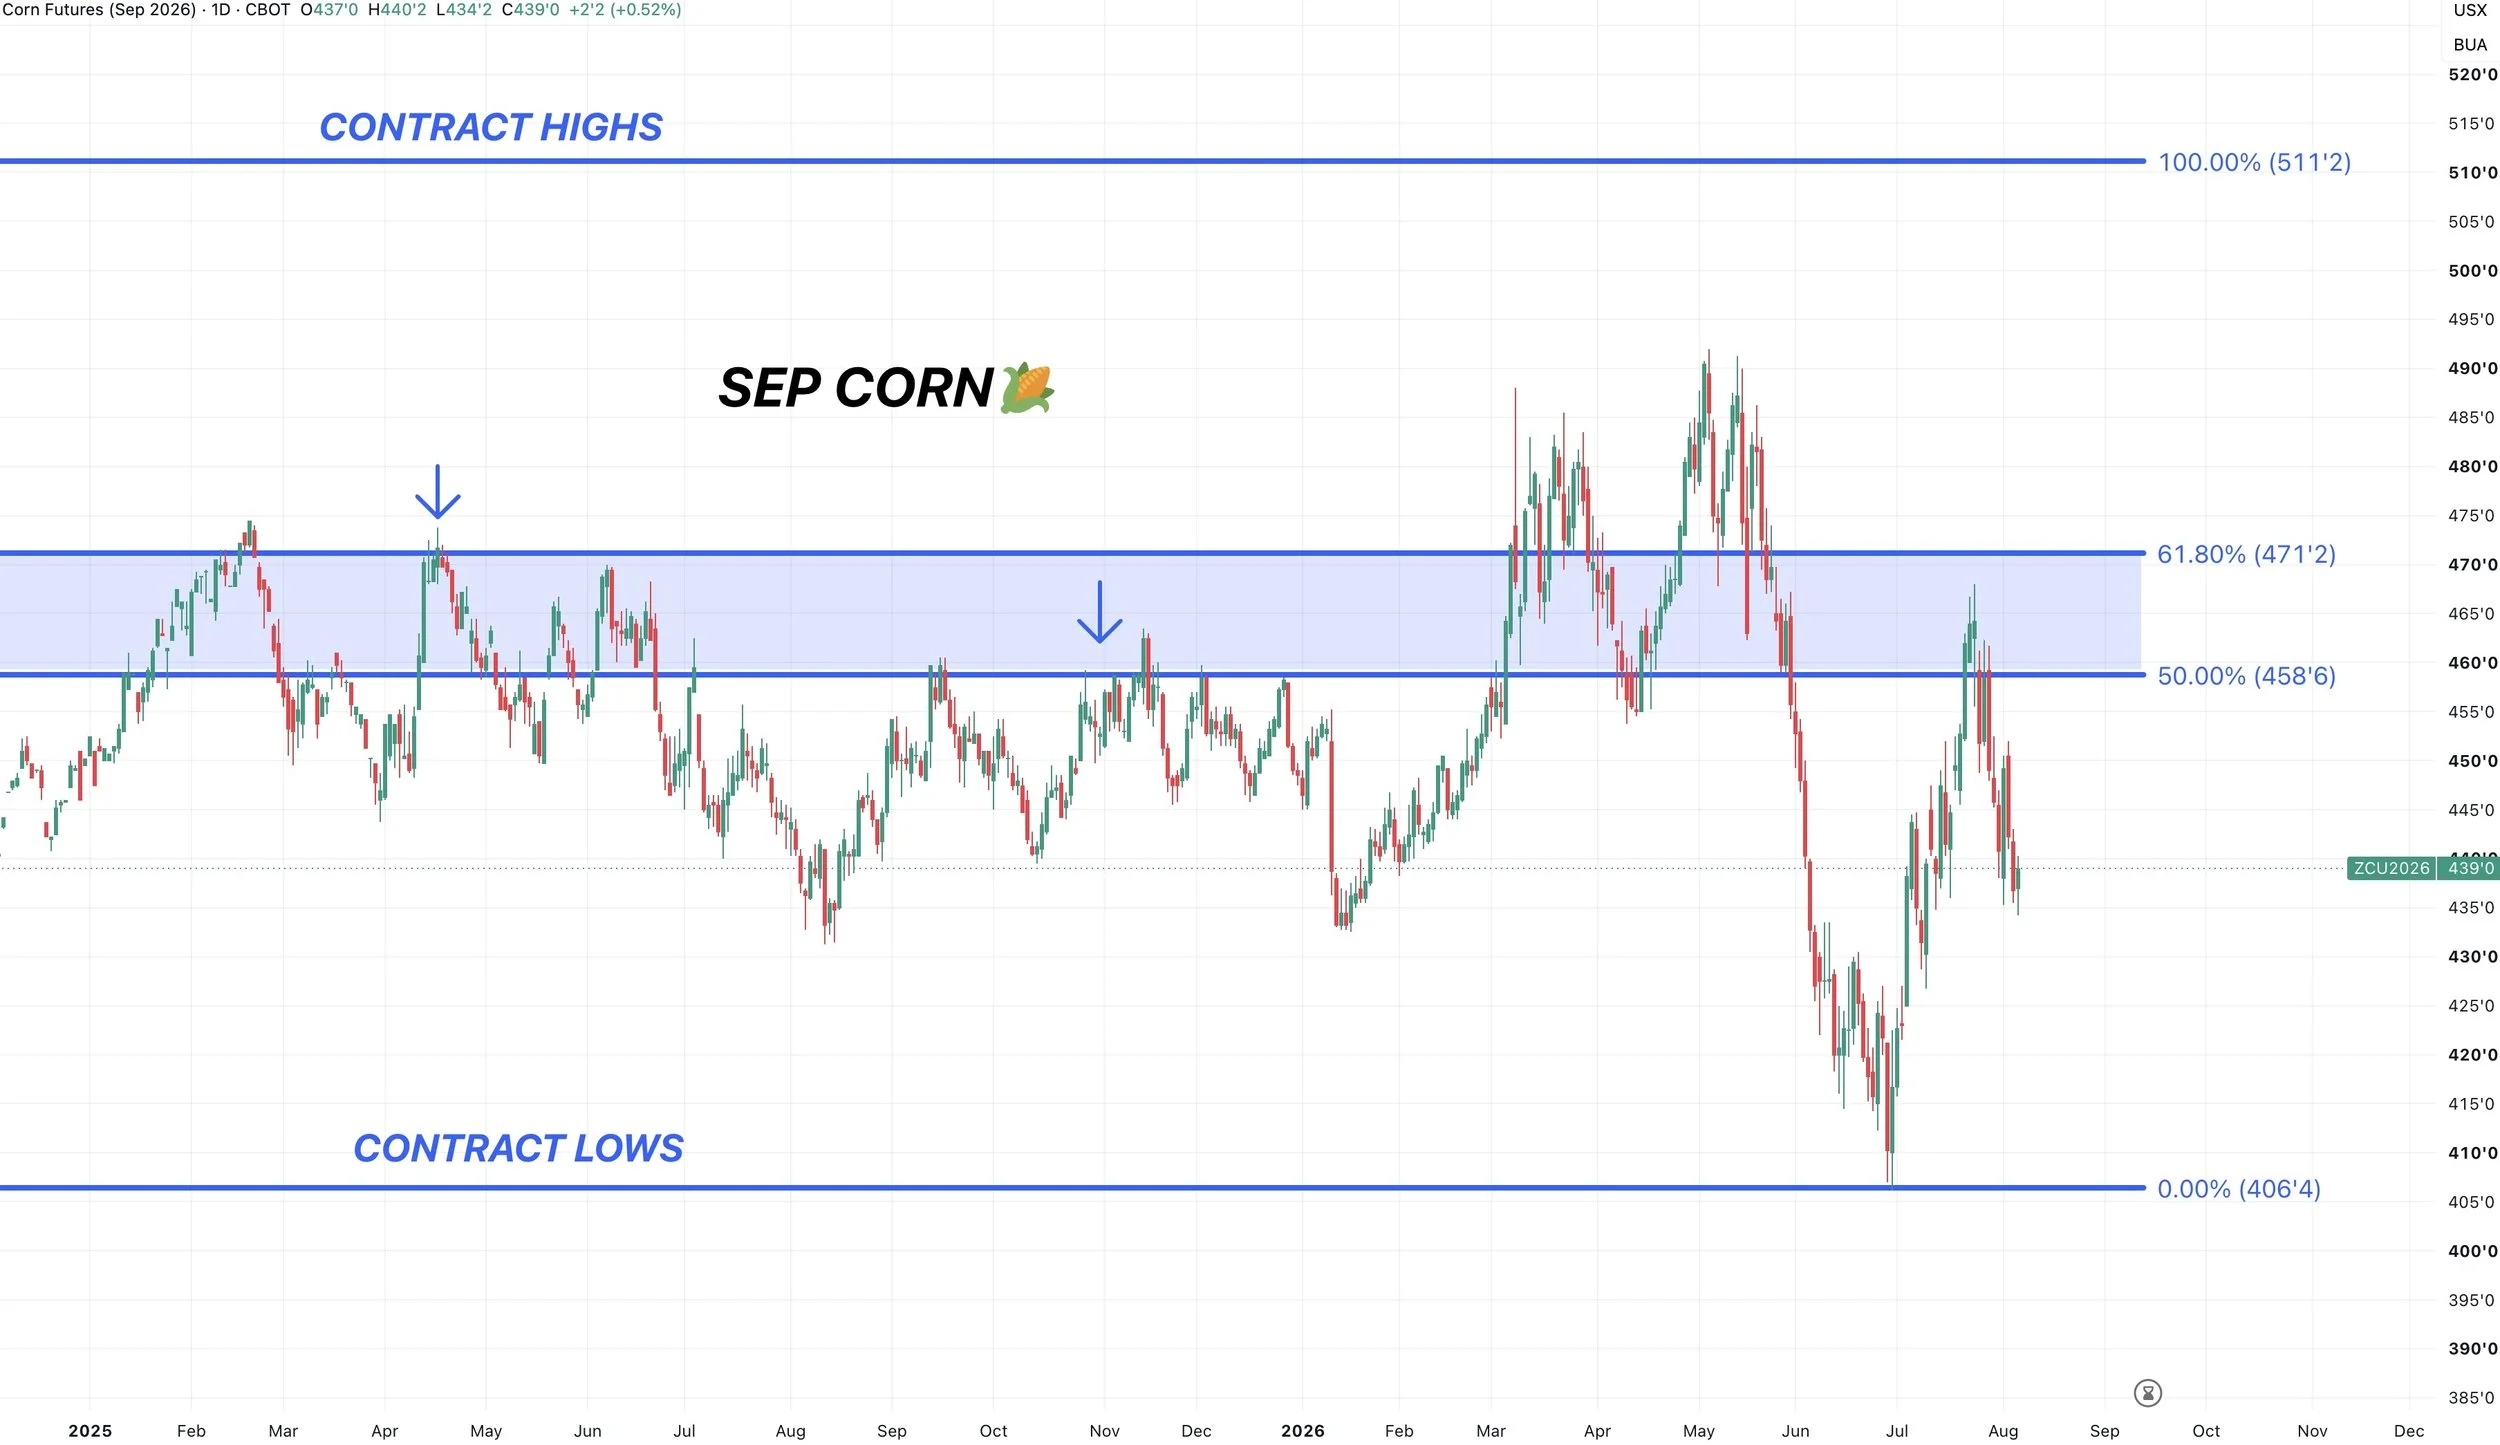
Sep Corn Chart:
We rejected that key zone we had been talking about.
Which was the golden zone from the contract lows up to contract highs. That same area was prior key support and resistance.
That was the area we wanted to de-risk in corn, so remaining patient for now as we enter some key levels we want to hold.
Nothing has changed.
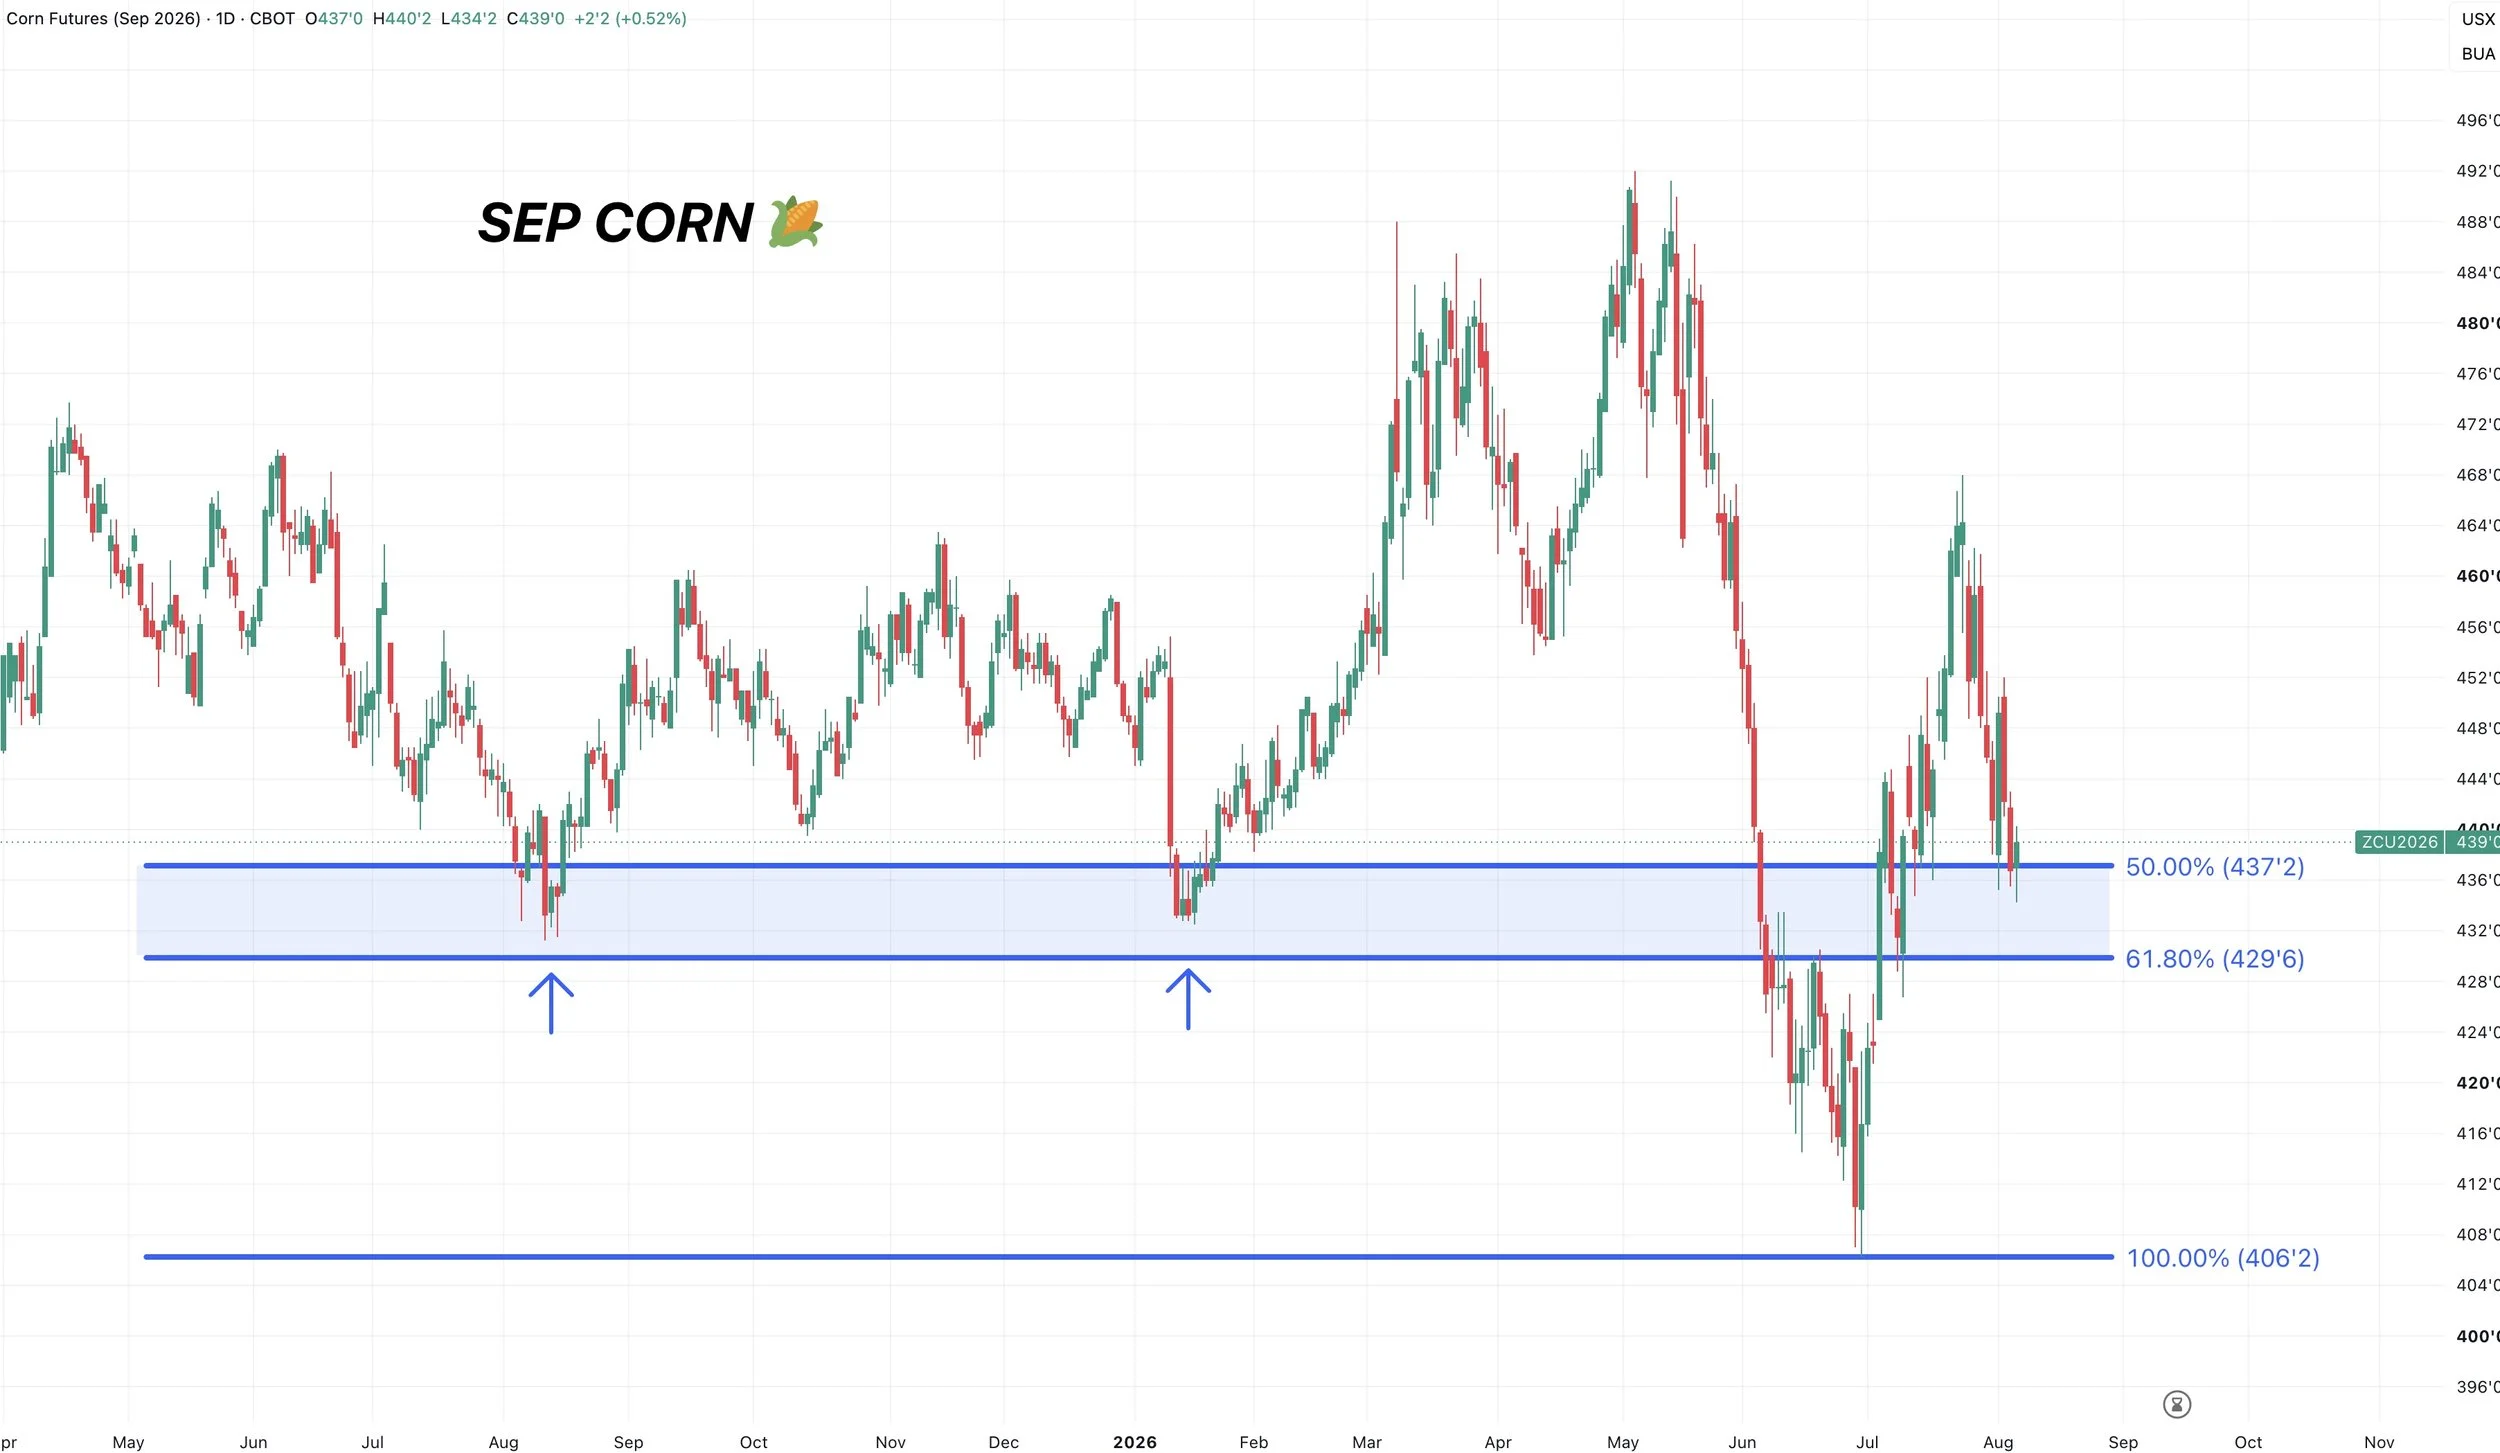
We simply want to hold this $4.30 to $4.37 level.
Which gives back 50% to 61.8% of the entire rally from contract lows.
If we are going to bottom, this would the most common place for it to happen.
If we break below the 61.8% level at $4.30 it will often tell us this is no longer a healthy pullback, and it would open the door to test the contract lows.
This area has also marked two major bottoms in this market.
It was the harvest lows last year, and lows from January.
So it's the golden zone and prior key support.
Meaning we want to see us hold here.
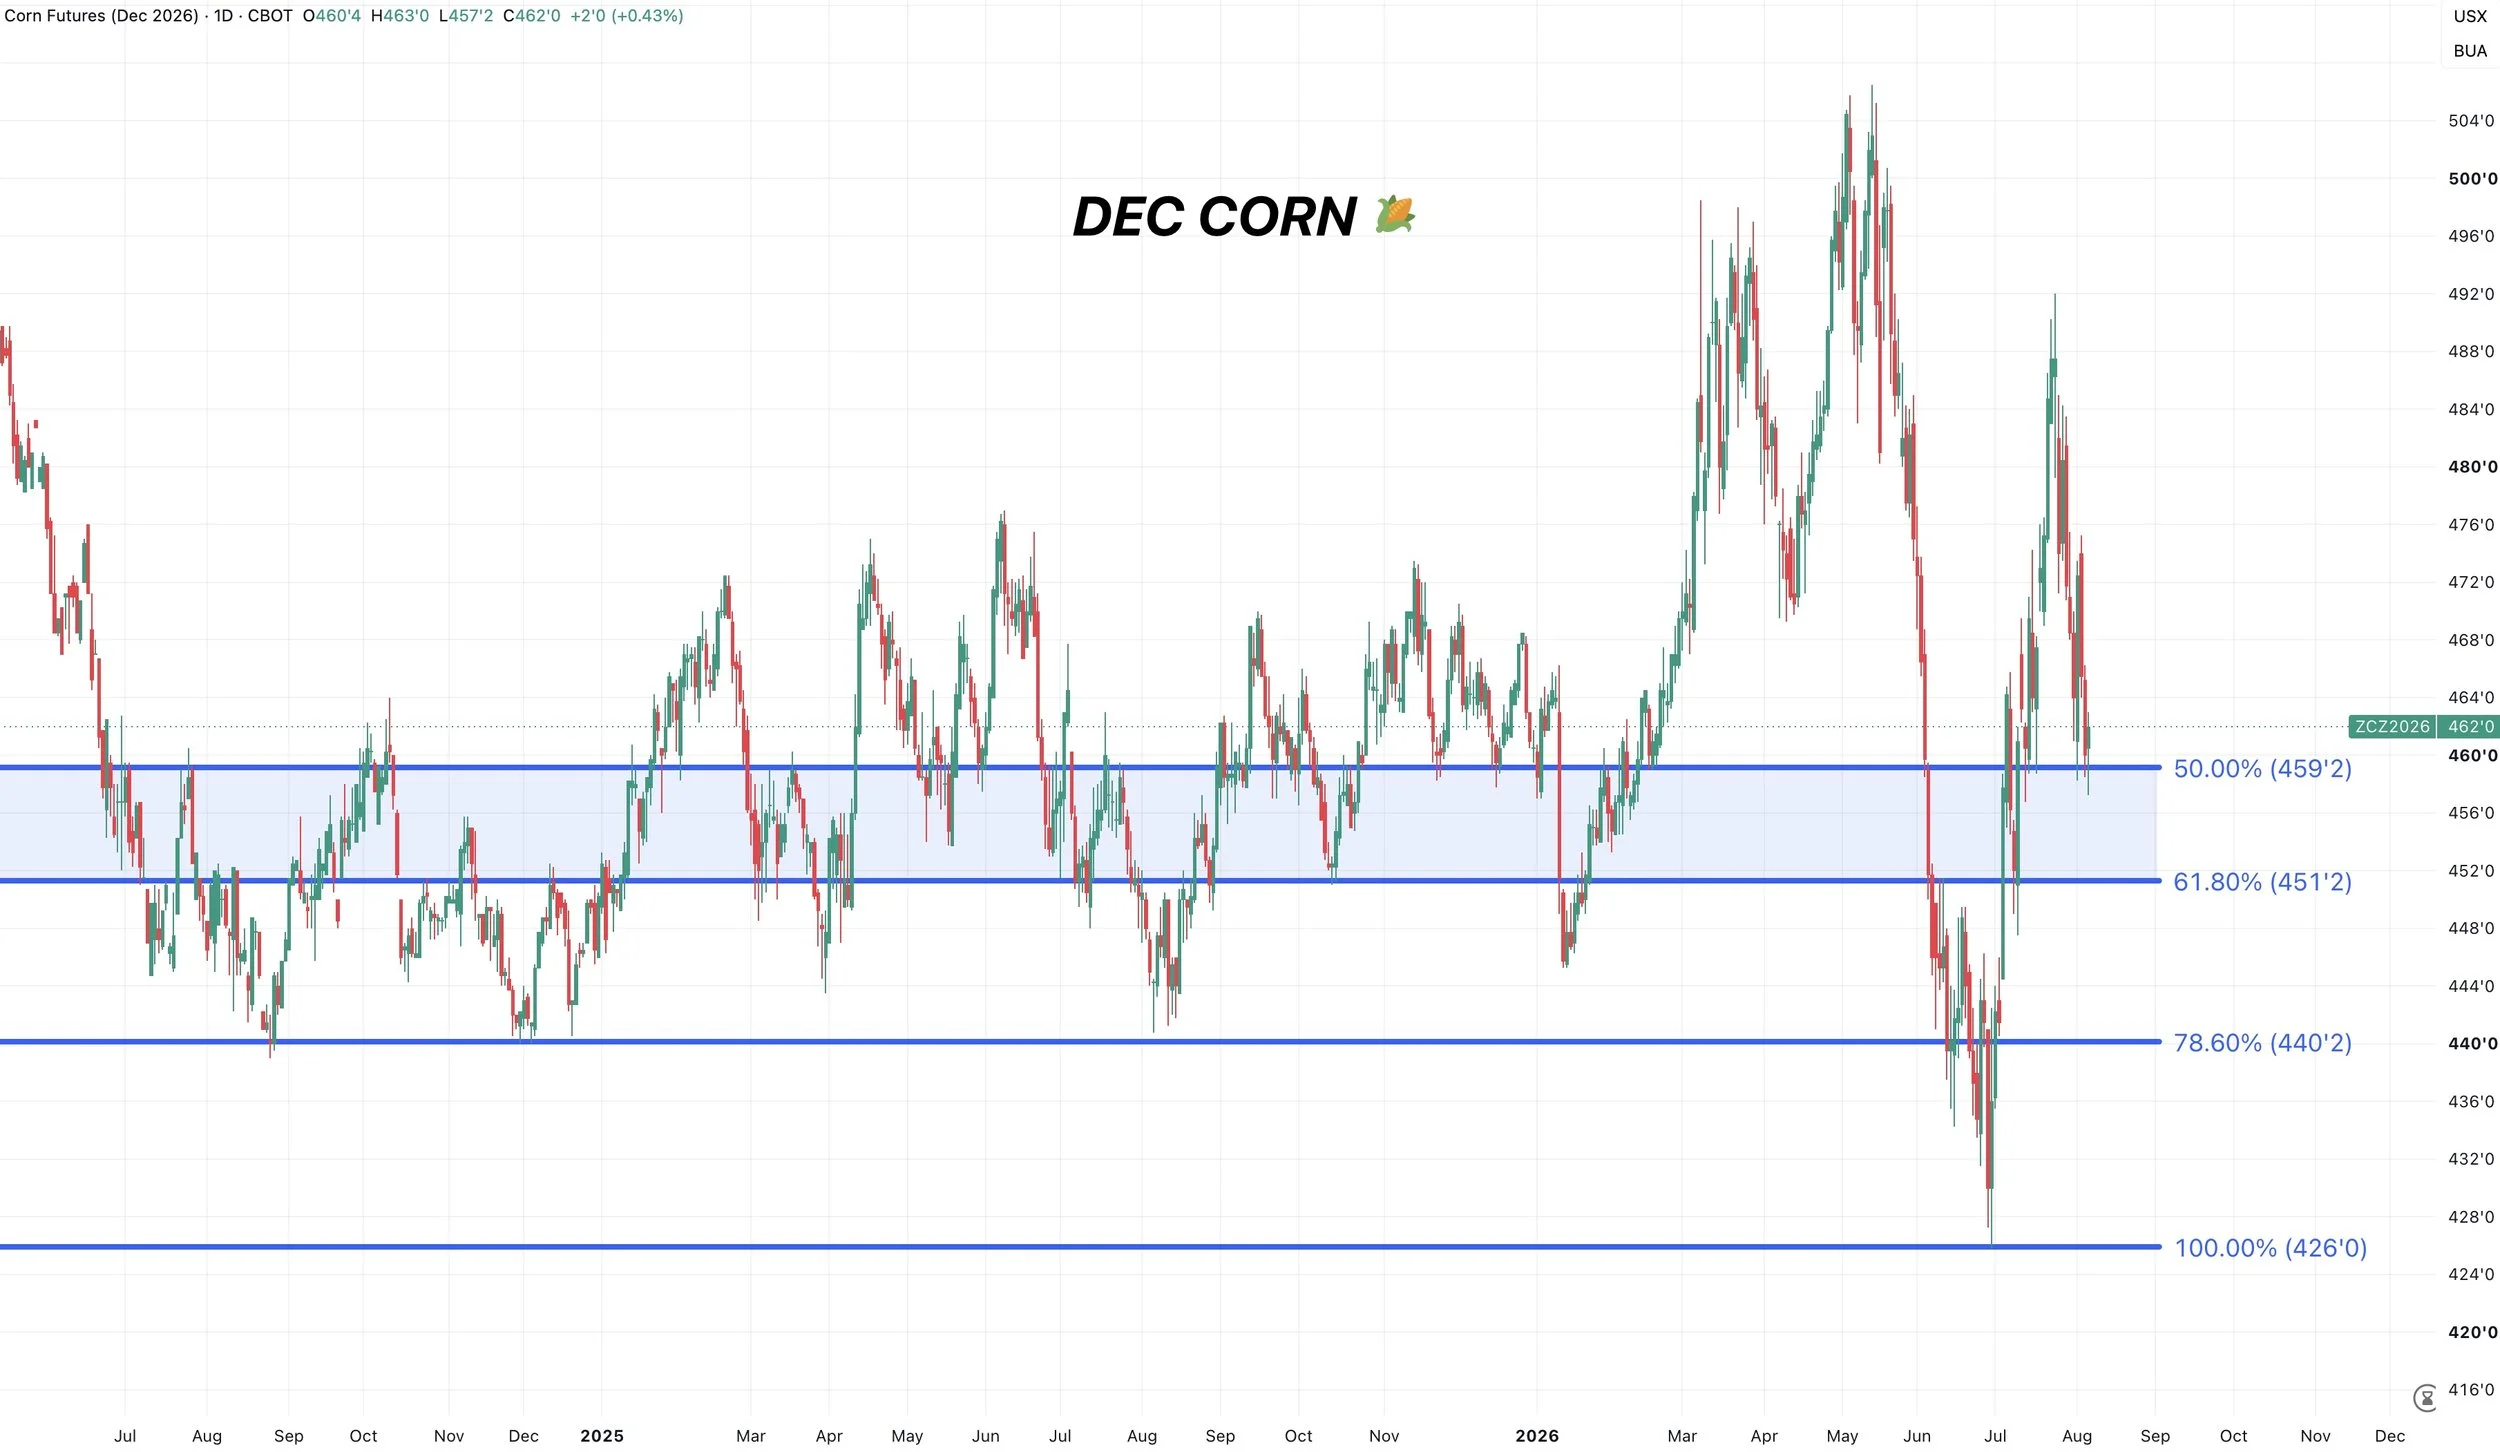
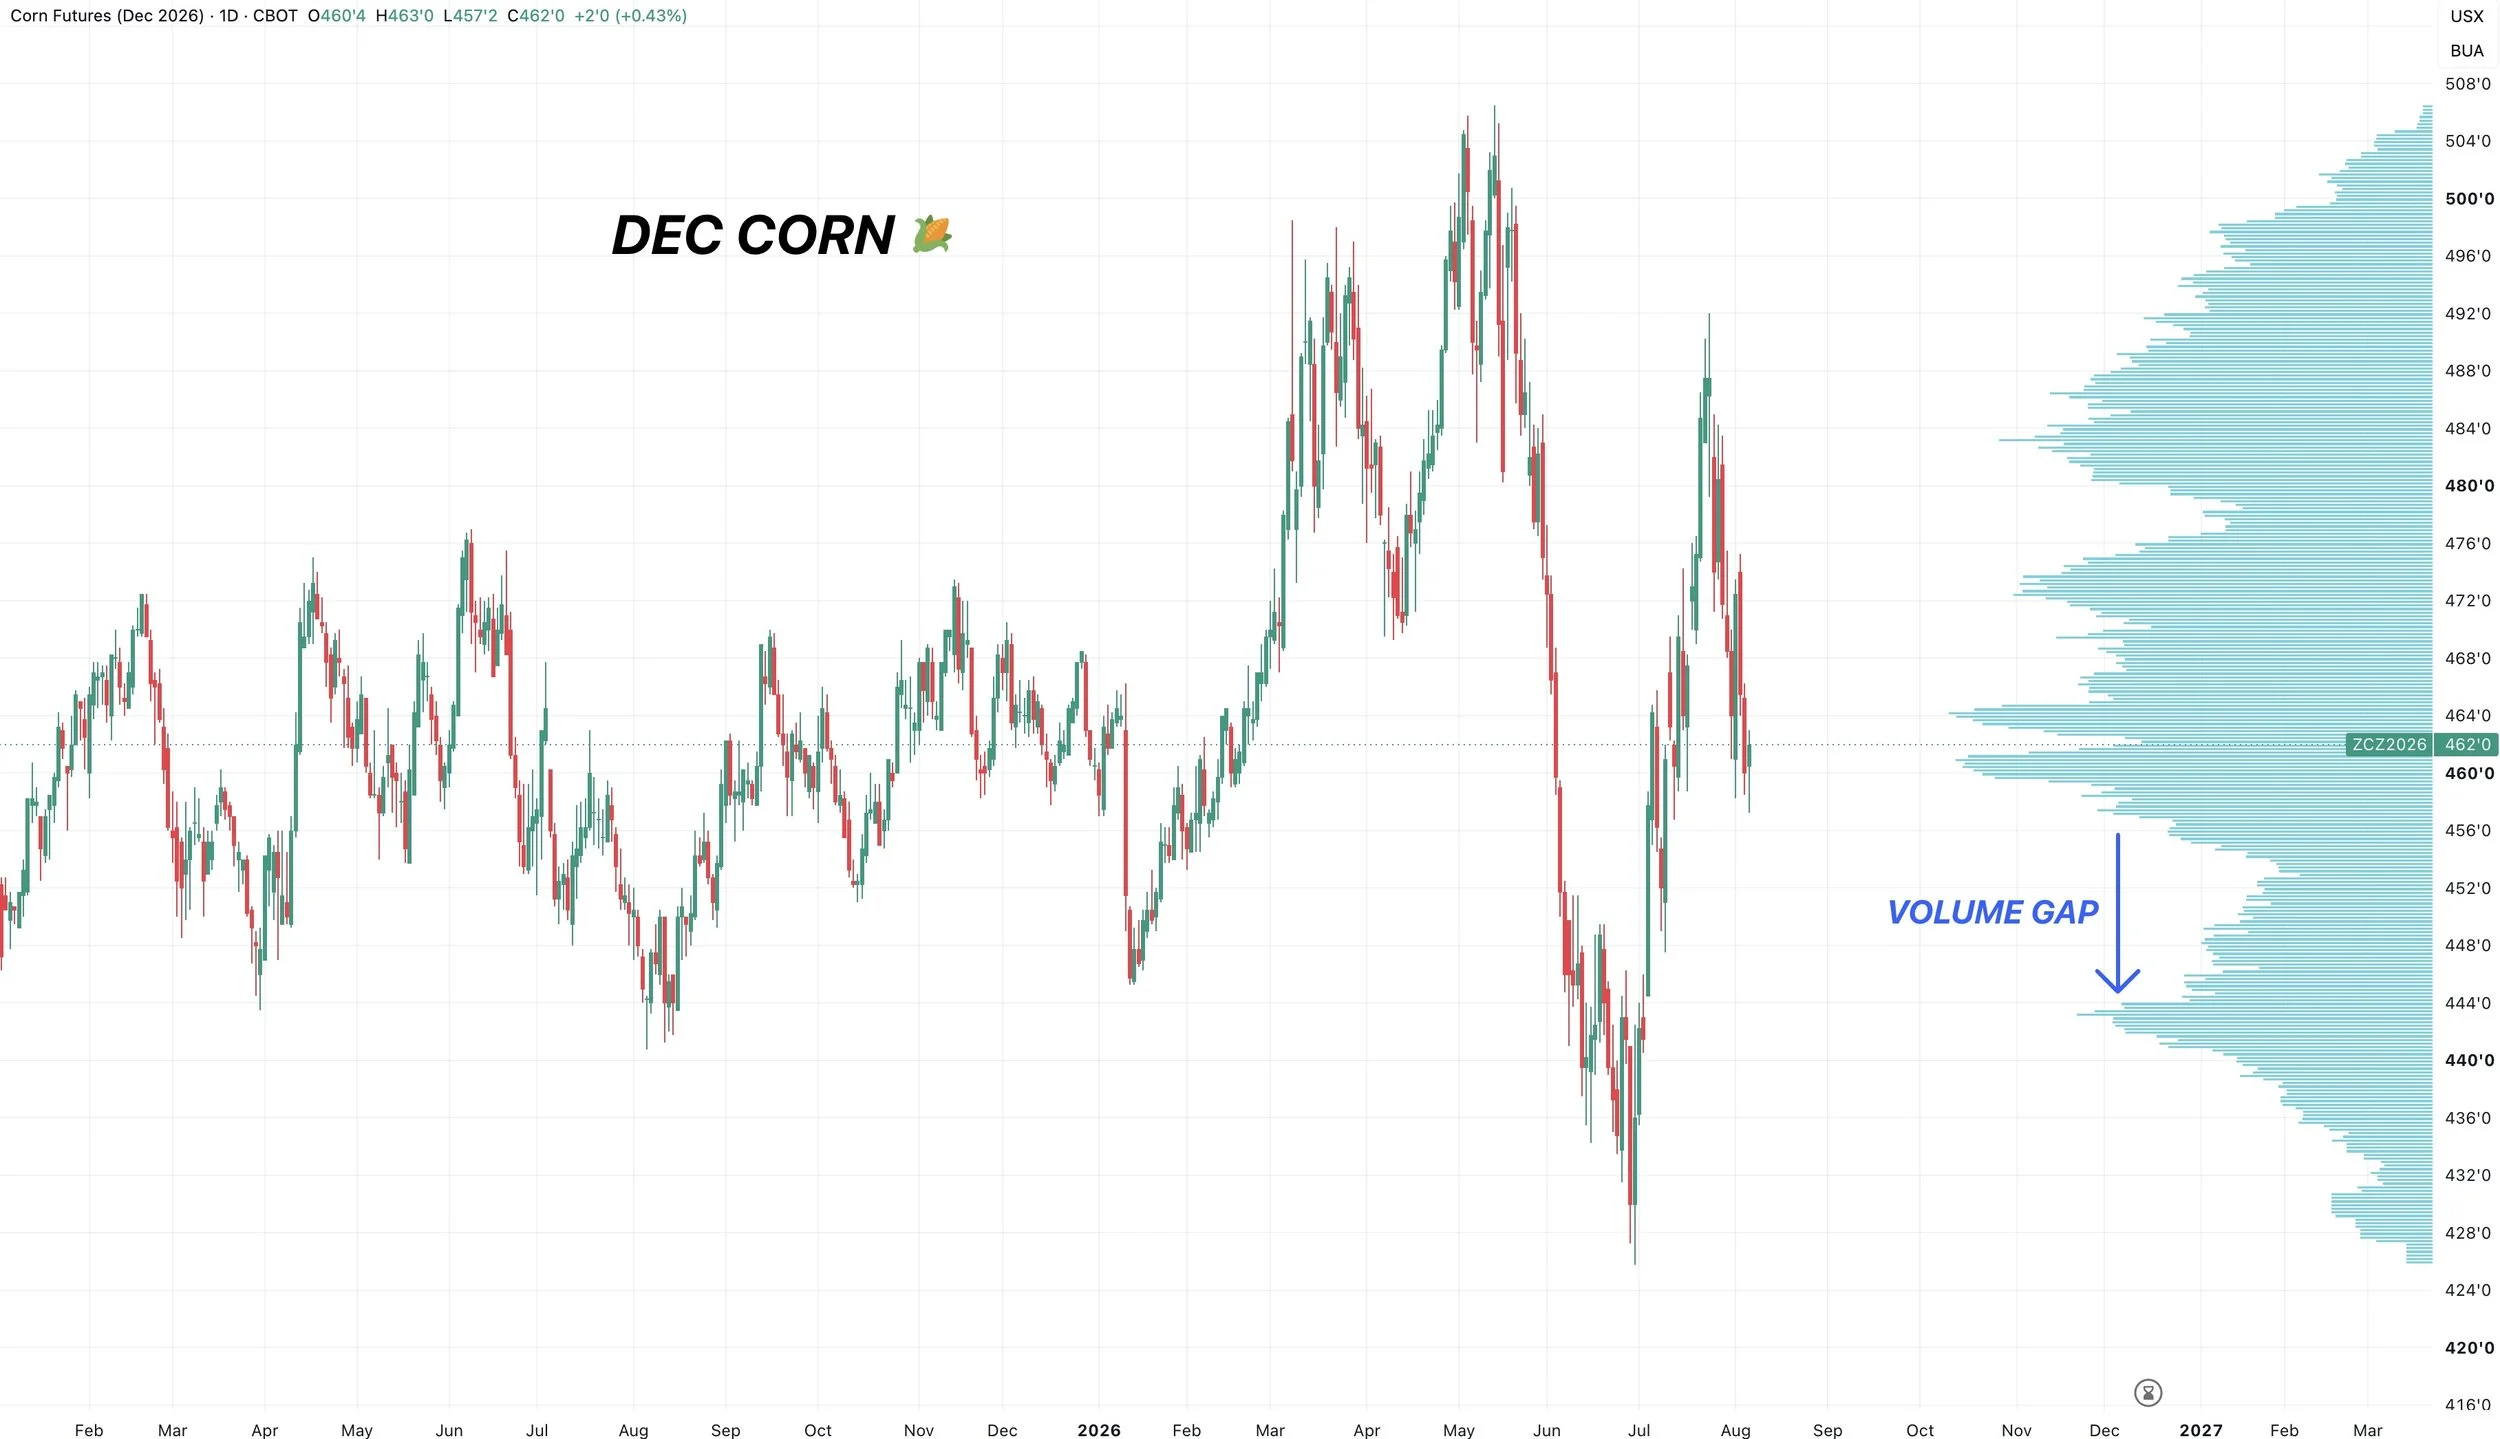
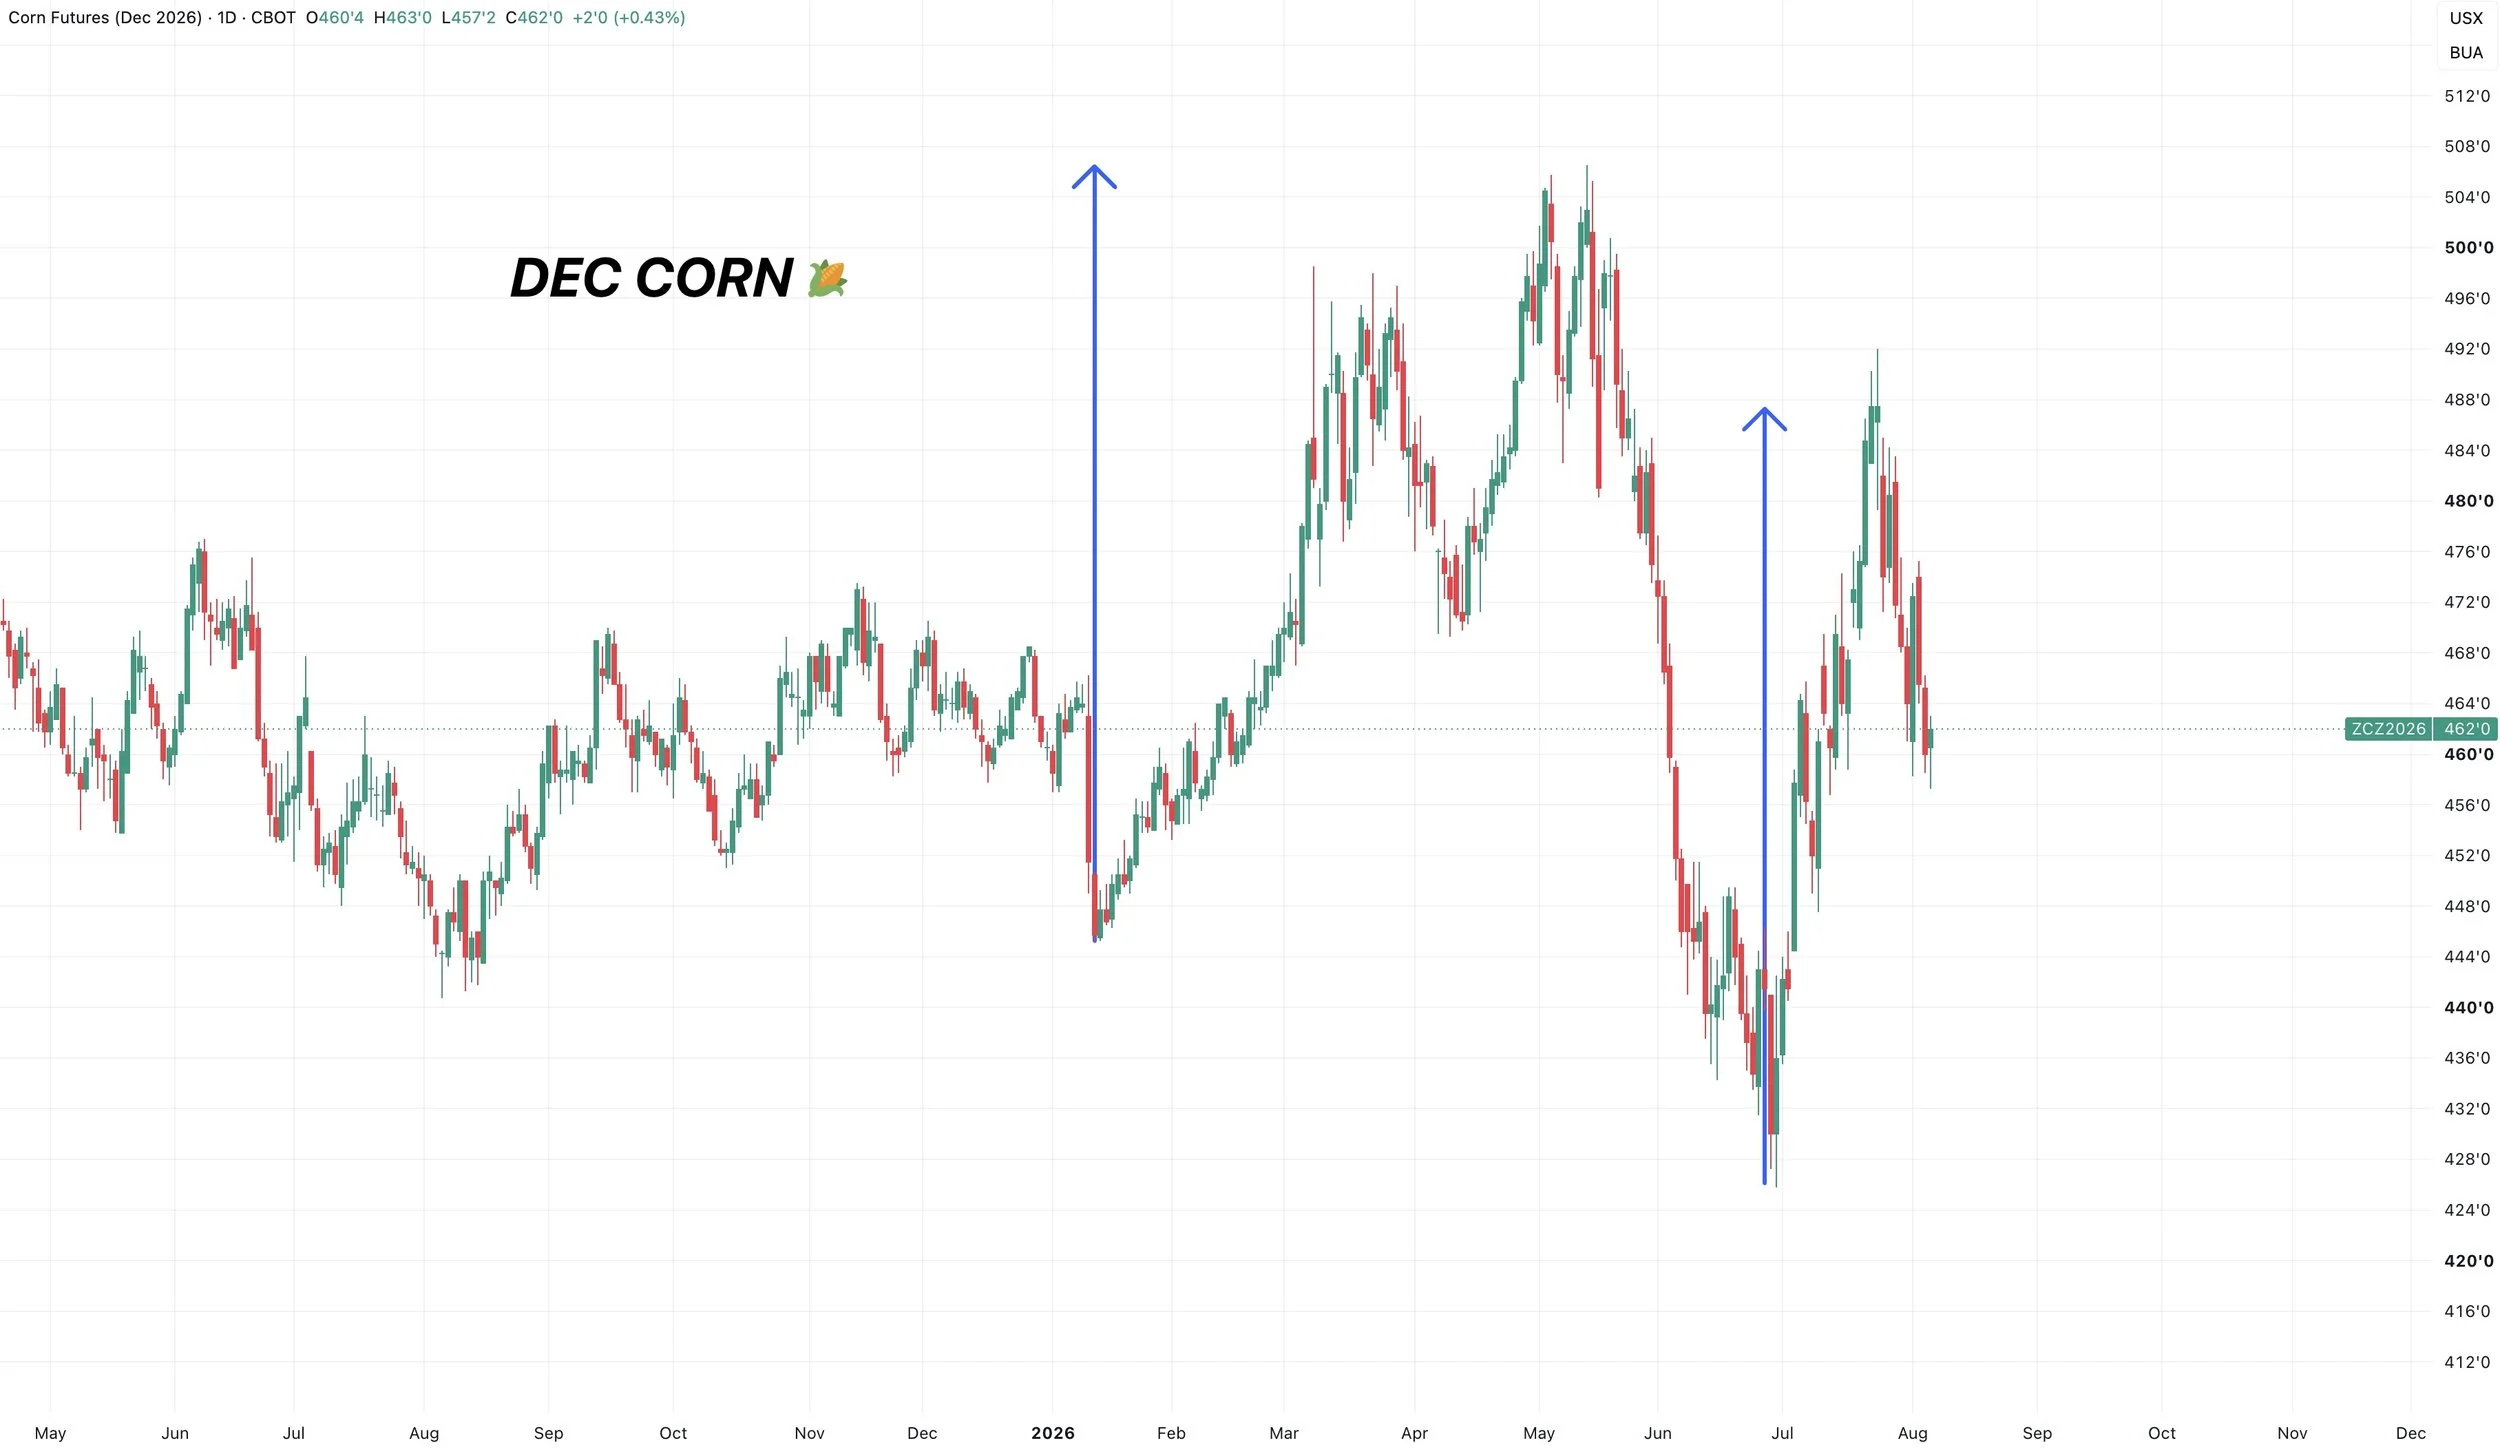
Dec Corn Chart:
We've already given back 50% of the rally.
Like we always talk about, between here and the 61.8% level is where a typical correction will often end.
If you zoom out, this 50% level has been a big level in the past.
It's the bottom of that range from late last year.
The must hold level is the 61.8% level at $4.50
If we break that it would suggest further potential downside.
But until that level breaks, the overall bias leans higher.
Ideally we would like to carve out some lows soon.
Because if we look at the volume, there is a pretty large volume to the downside if we are unable to hold this area of high volume.
When prices enter areas of low volume, they tend to move through them fast.
Areas of high volume act as magnets. Currently we are still at peak volume.
Monthly Chart:
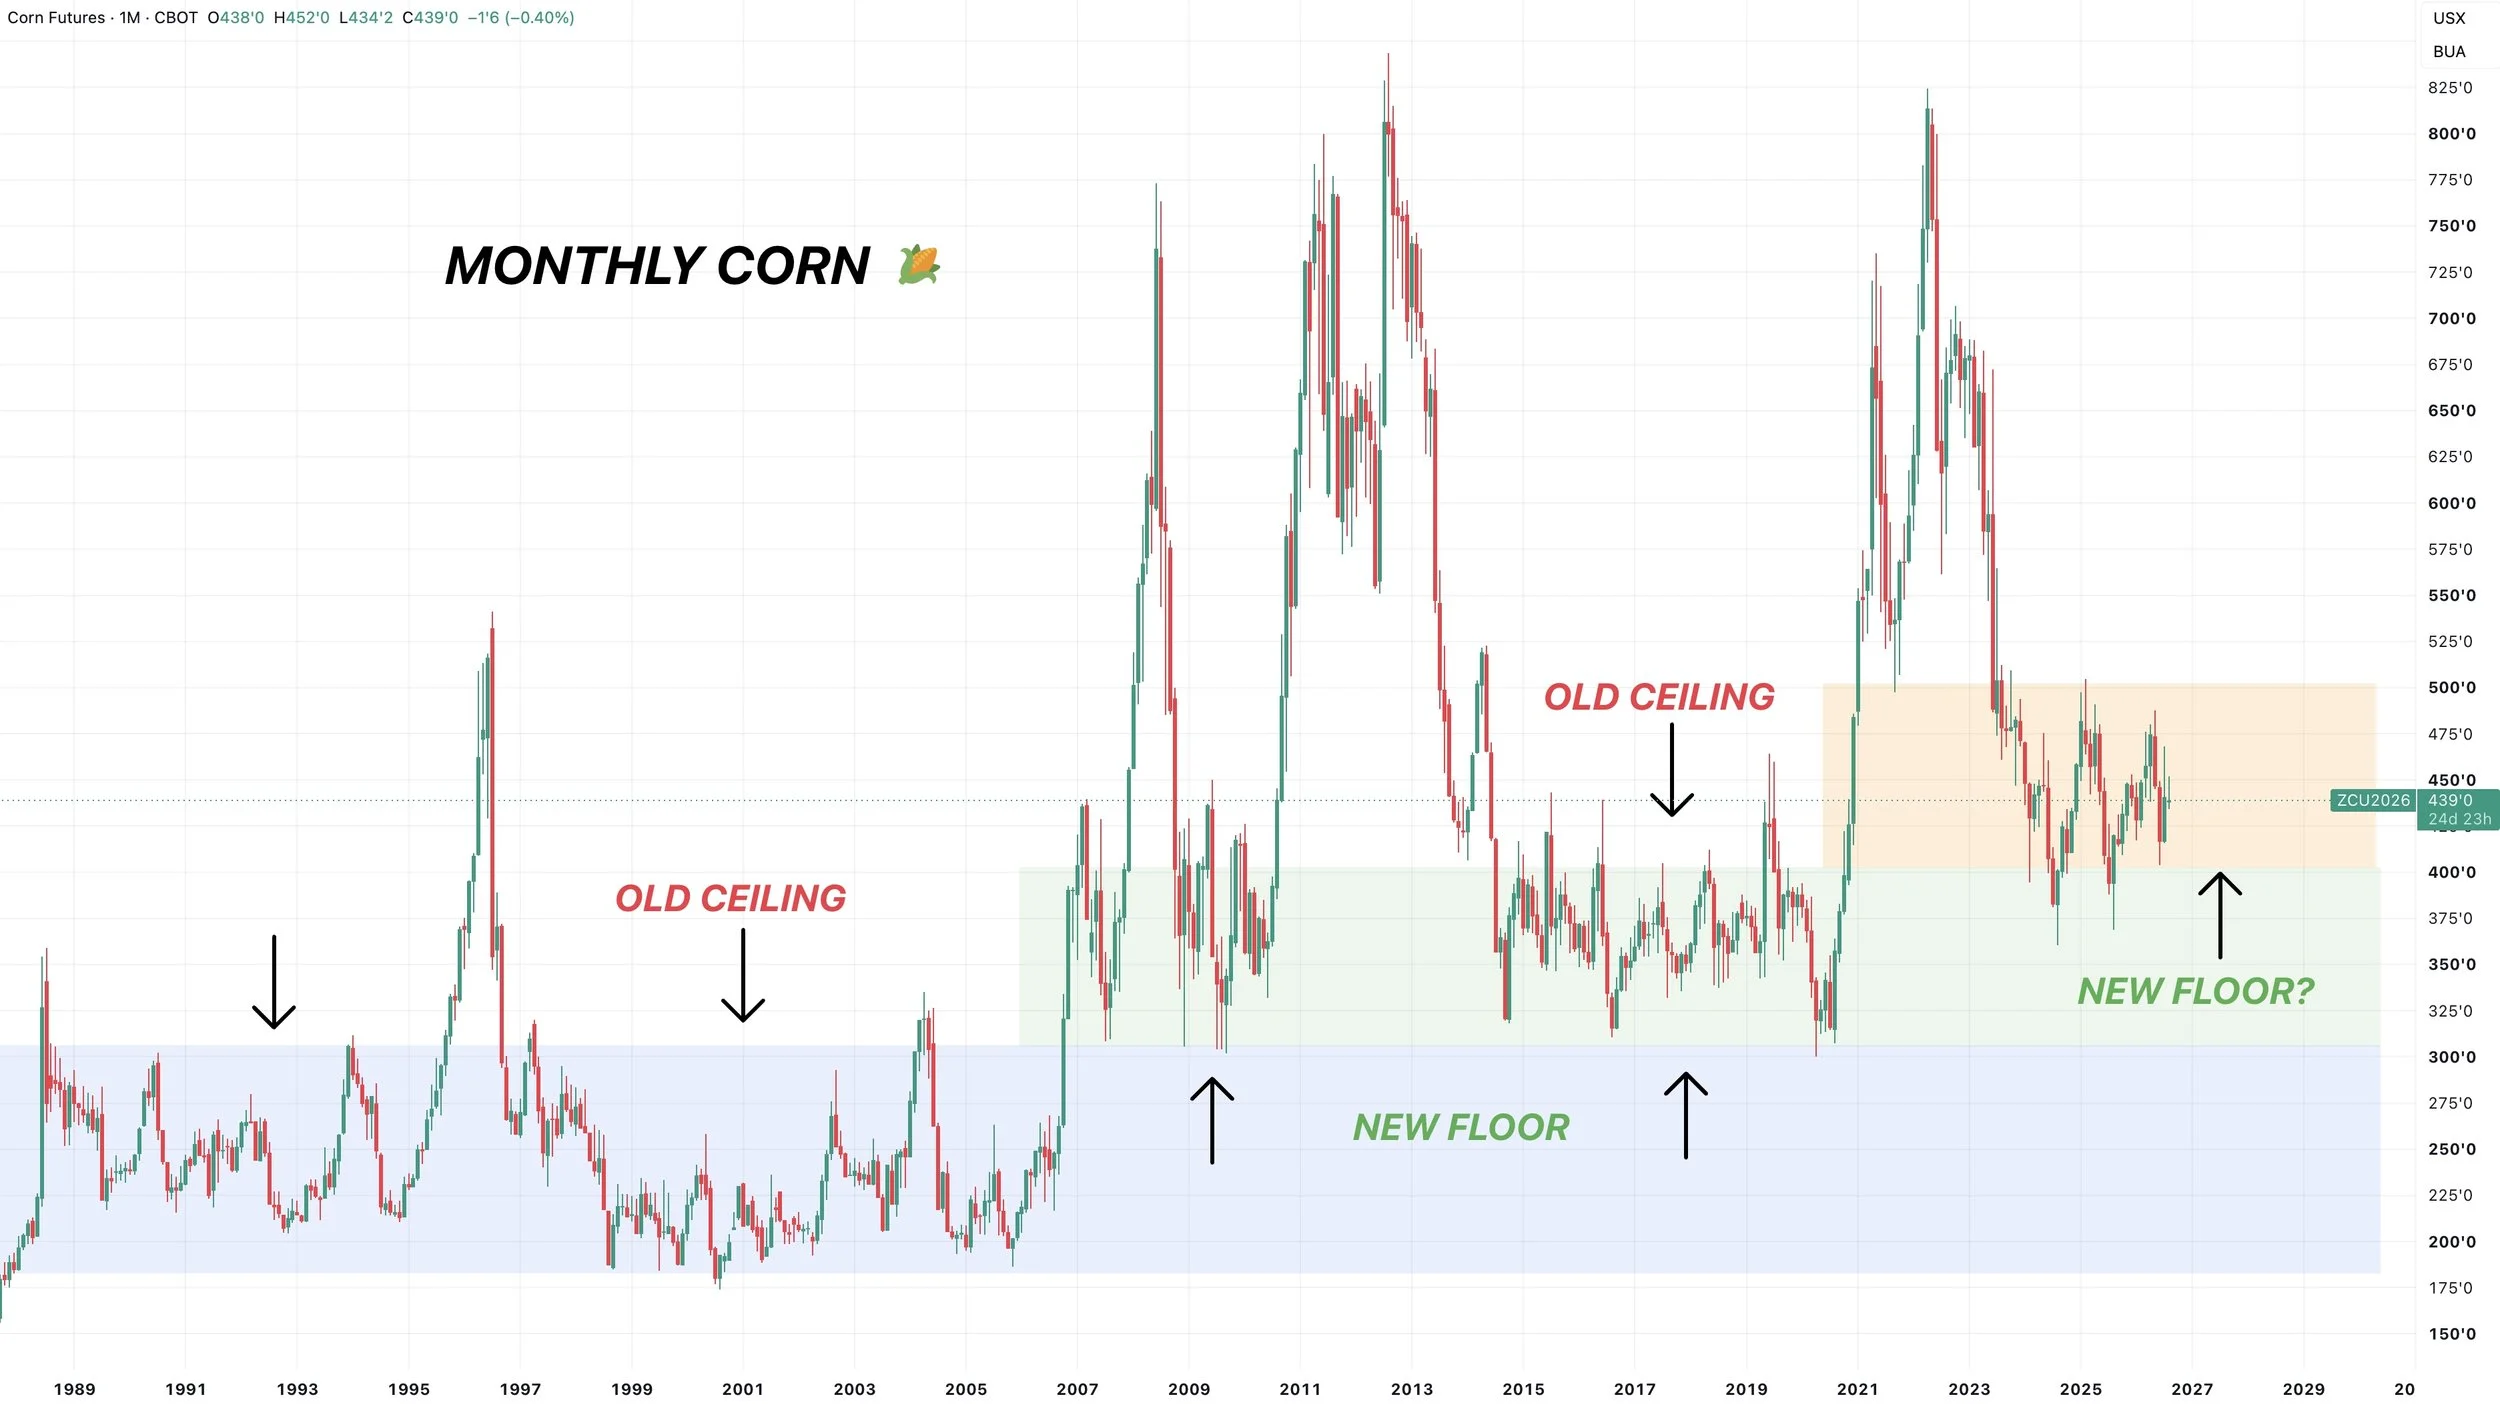
Thought I'd throw this in here today.
Despite the dollar swings from the highs the lows over the last year or two, we have essentially just been trapped in a range from $4.00 to $5.00
Until 2007, we were trapped between $2.00 to $3.00
We then broke out of that range, and the $3.00 ceiling became the new floor.
From 2014 to 2020, we were trapped in a range between $3.00 to $4.00
We've now been trapped in yet another $1.00 range, turning that old $4.00 ceiling into our new floor.
If we ever break above $5.00, we would be out of this range we are currently trapped in.
In doing so, that would be our first higher high of the entire bear market. The fun starts above $5.00
Soybeans
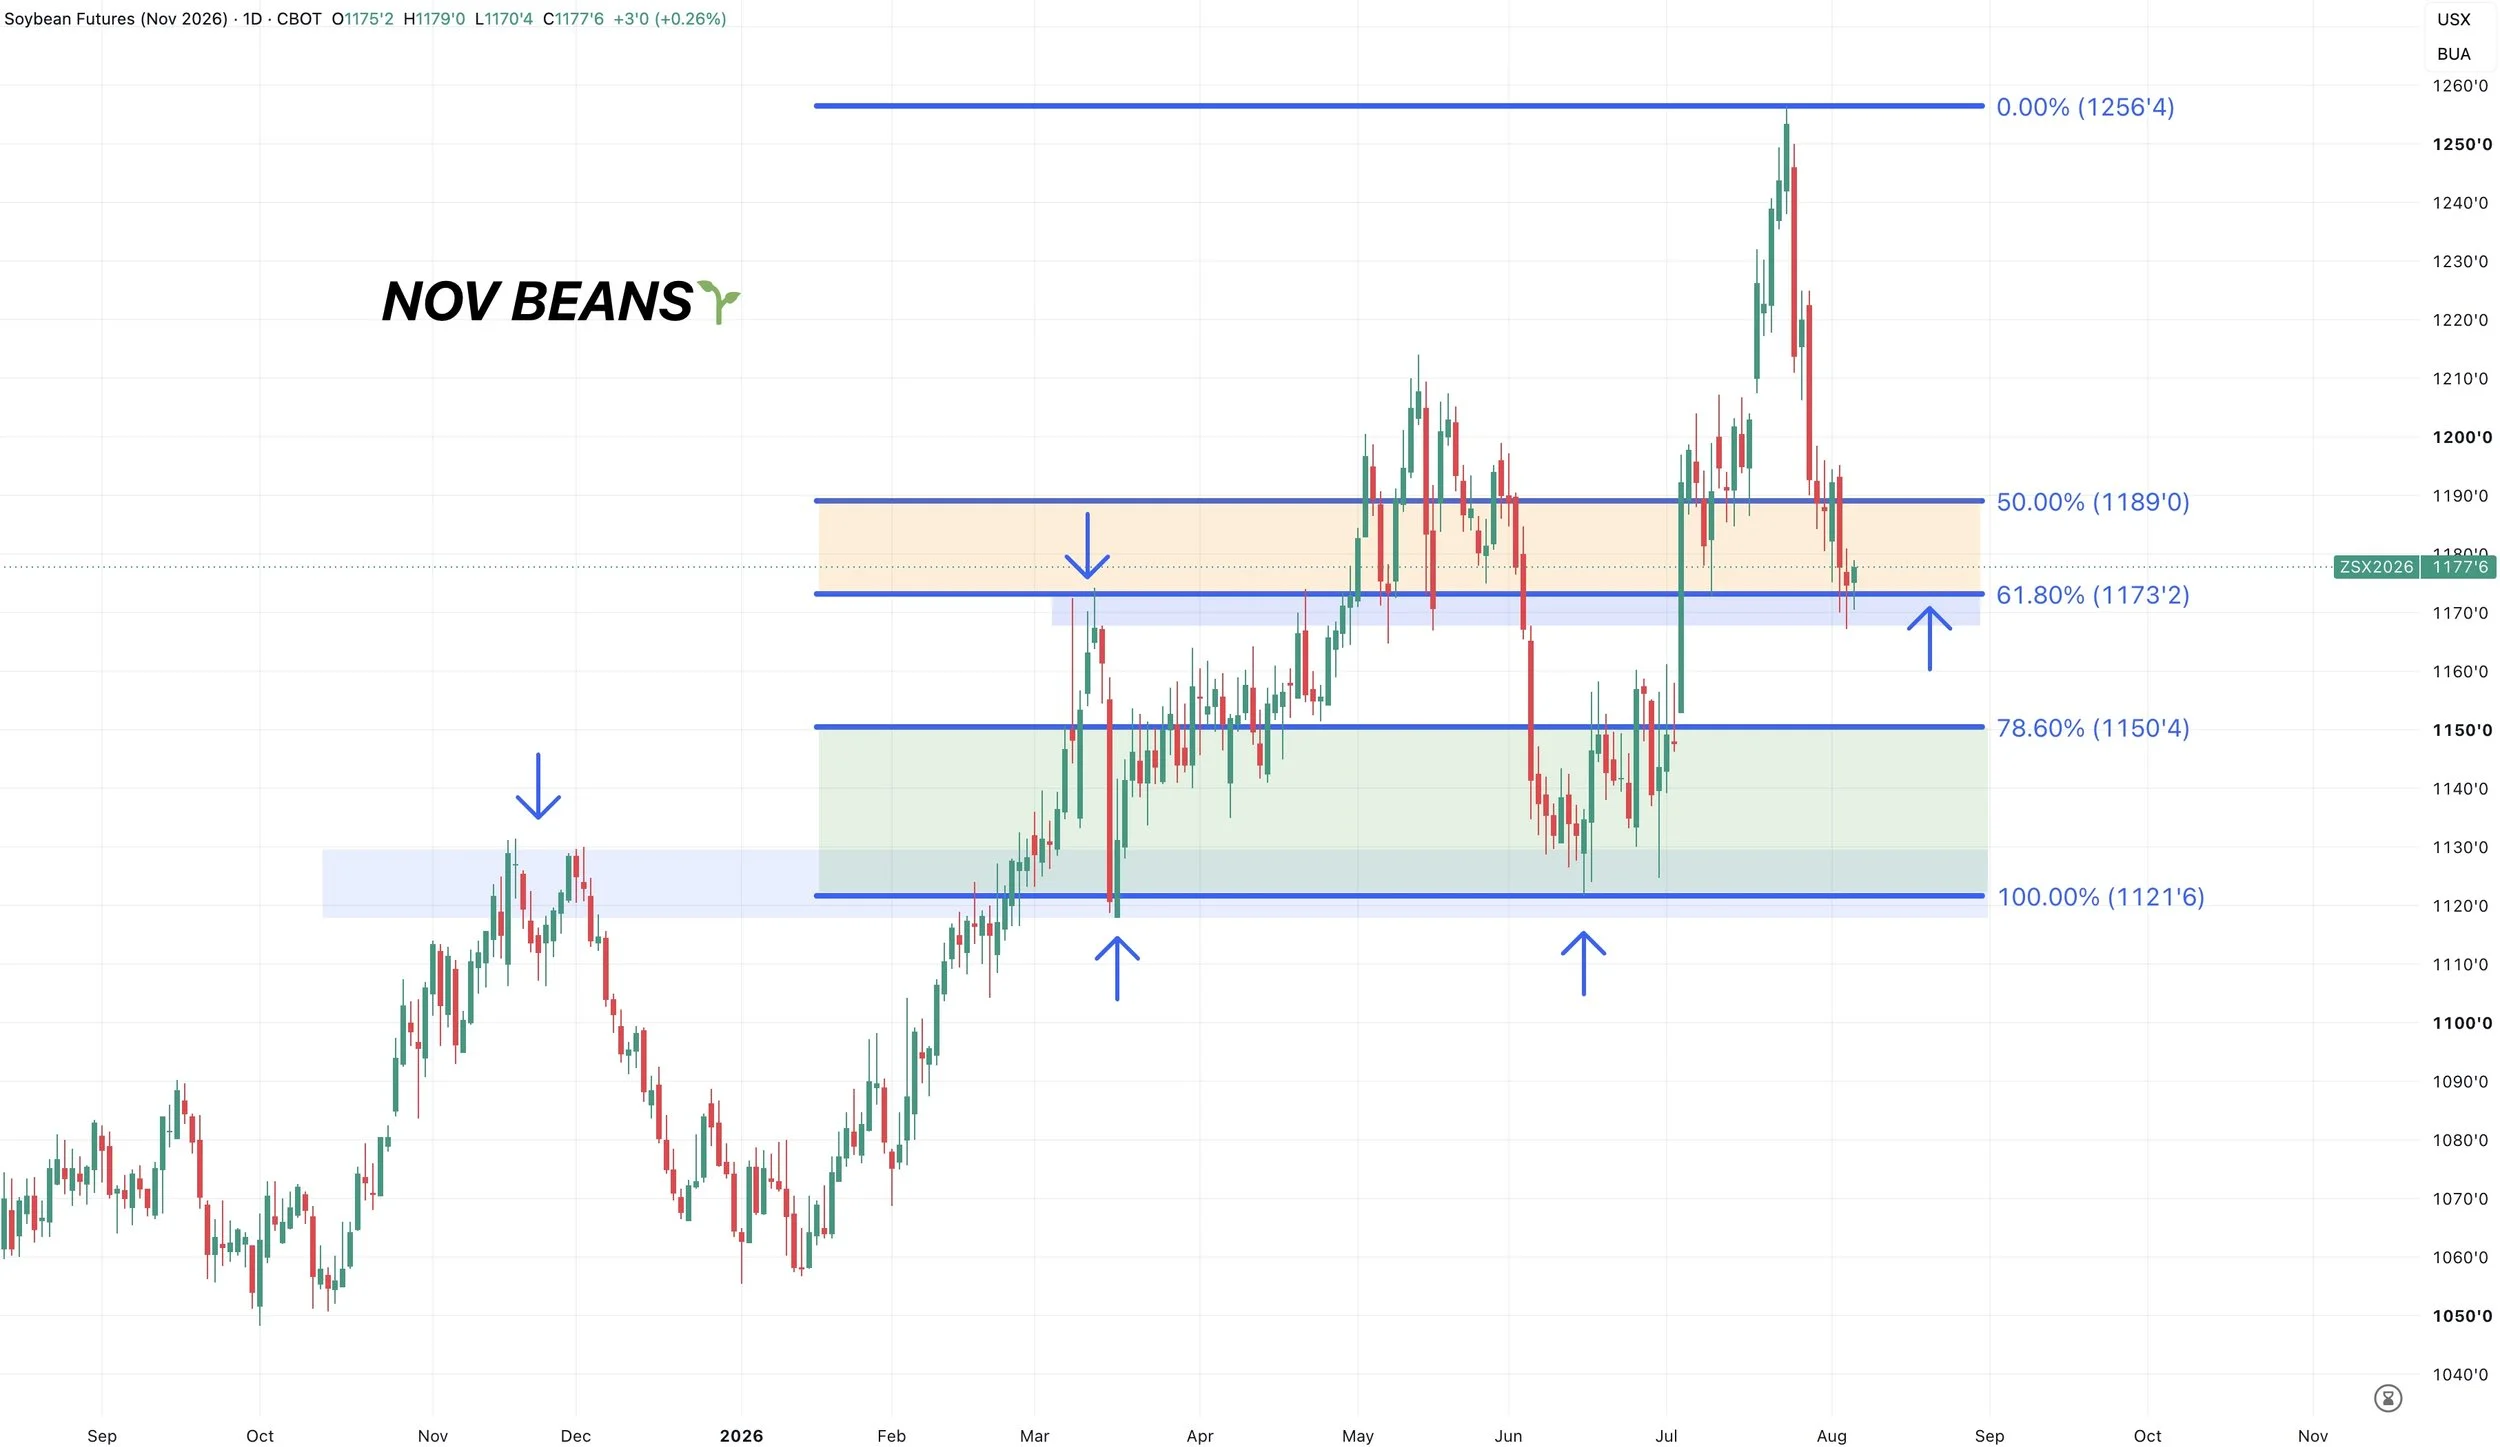
Nov Beans Chart:
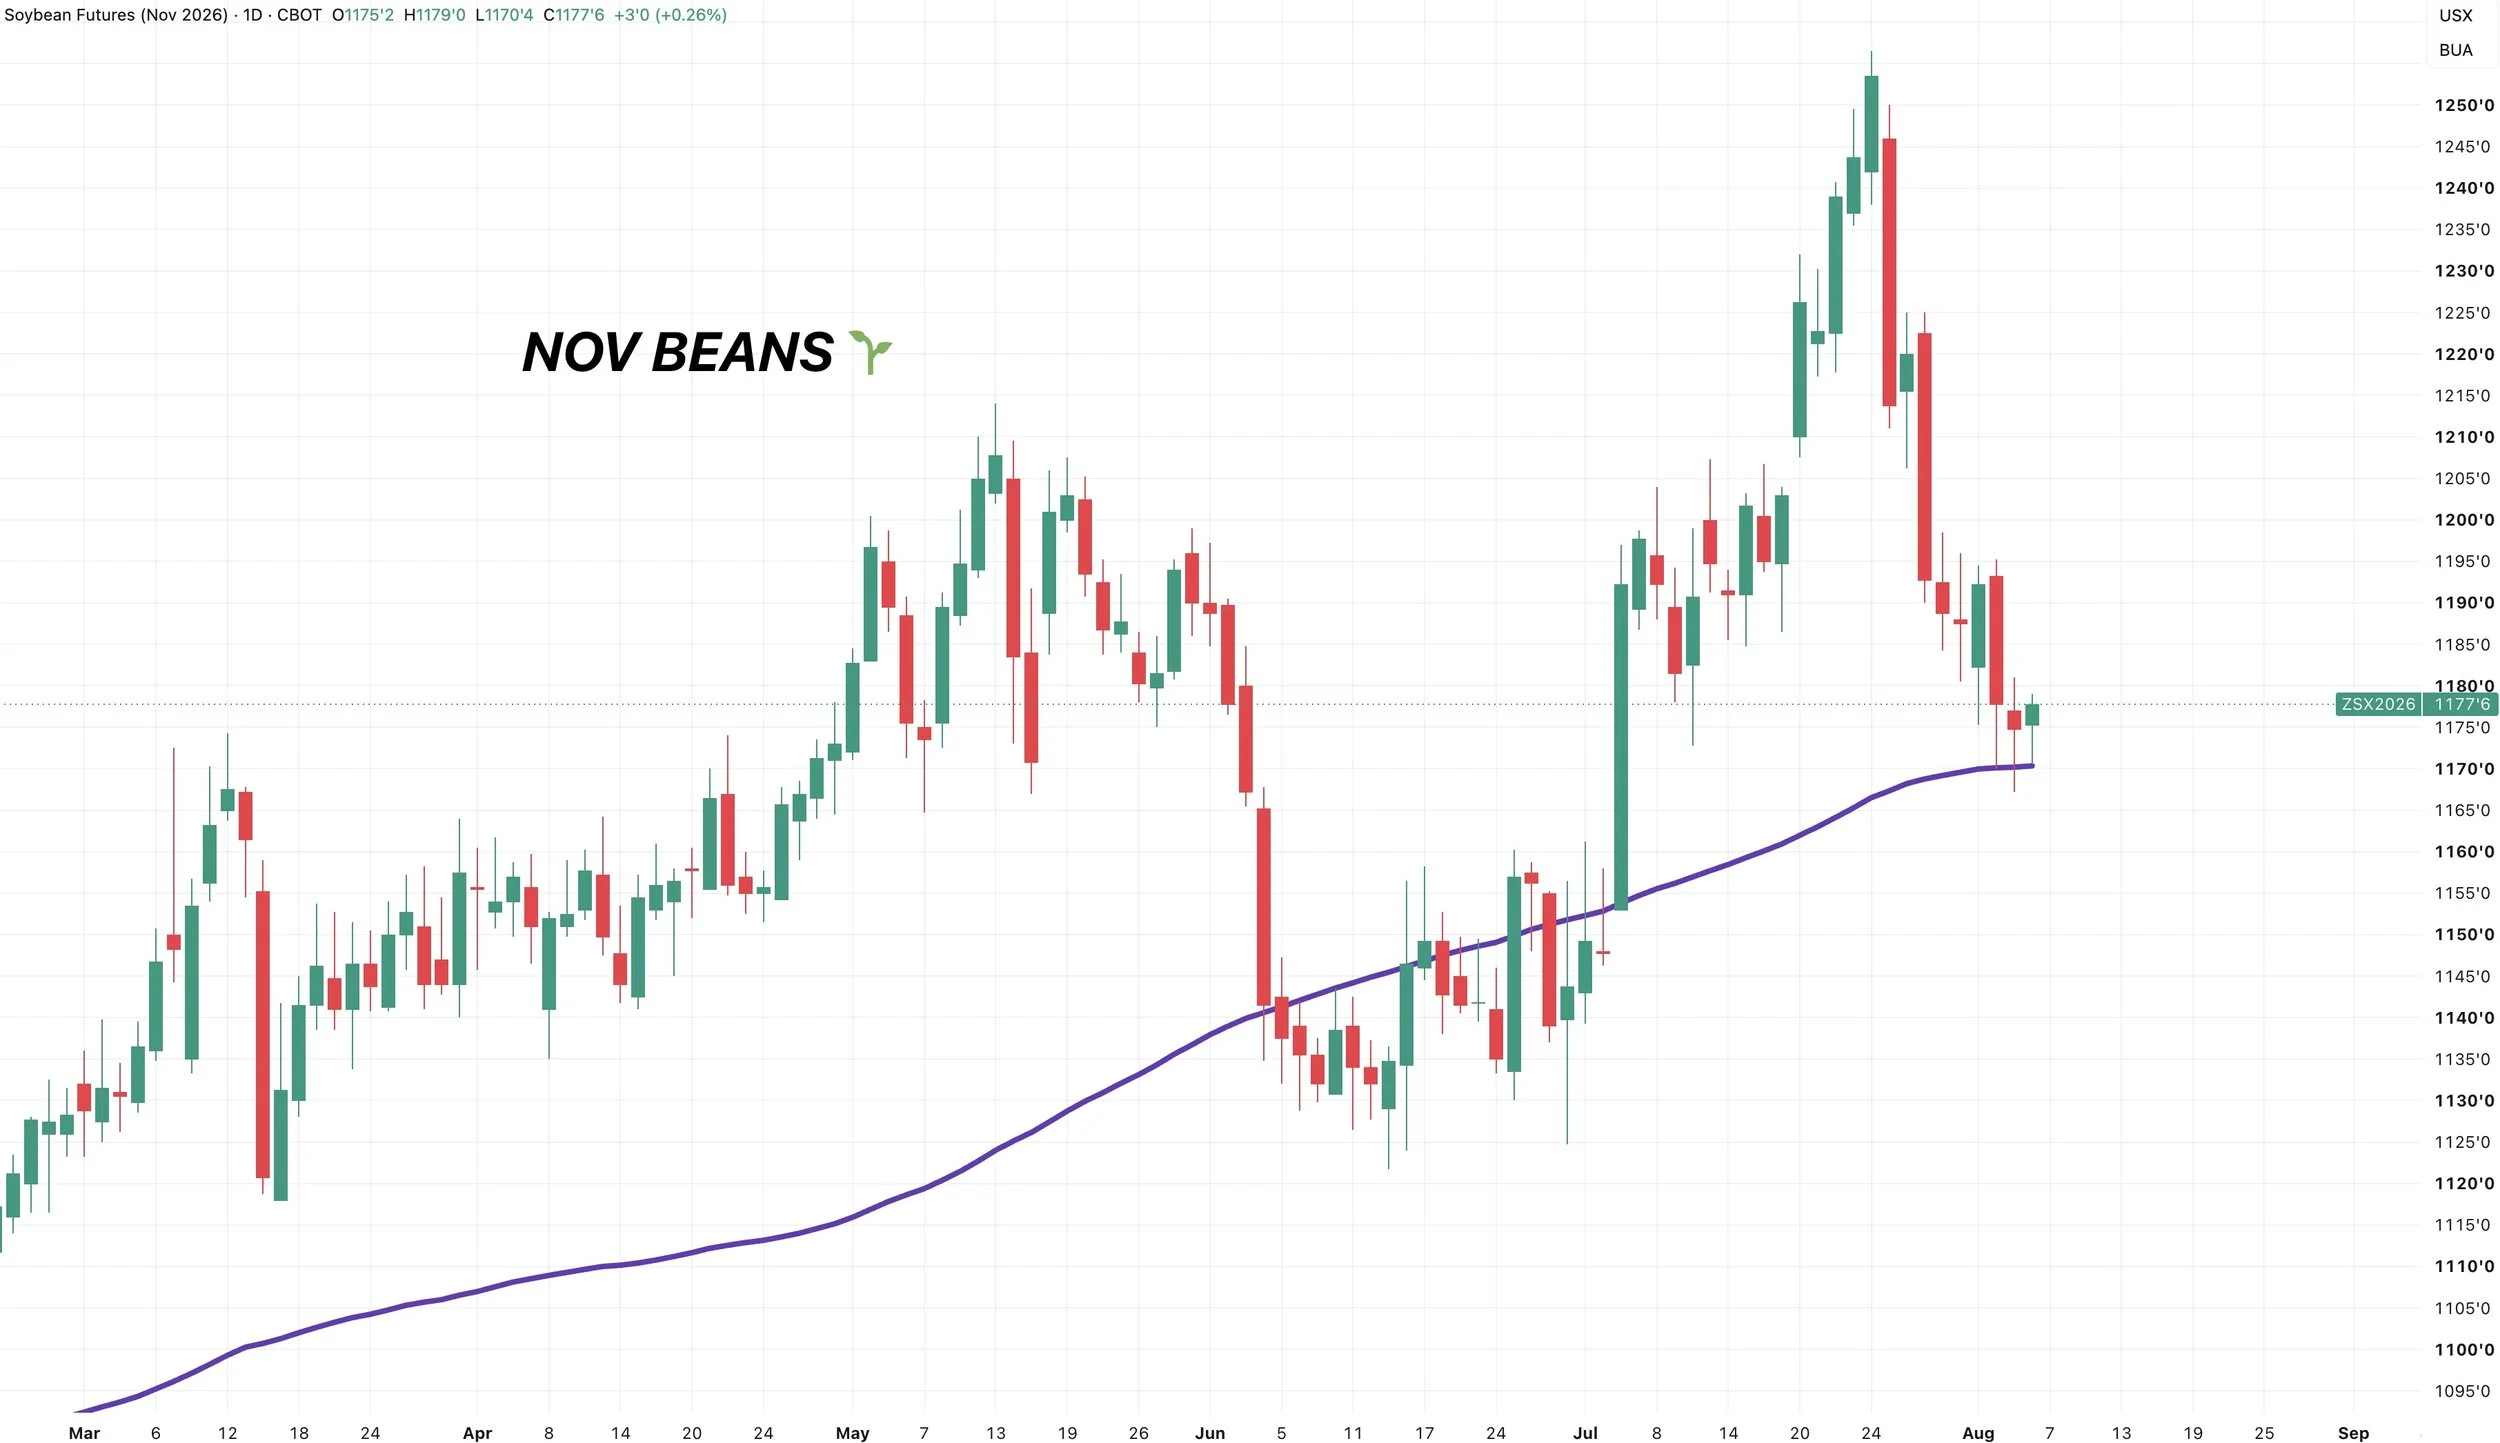
We are still sitting at some major support here that we would like to see us hold.
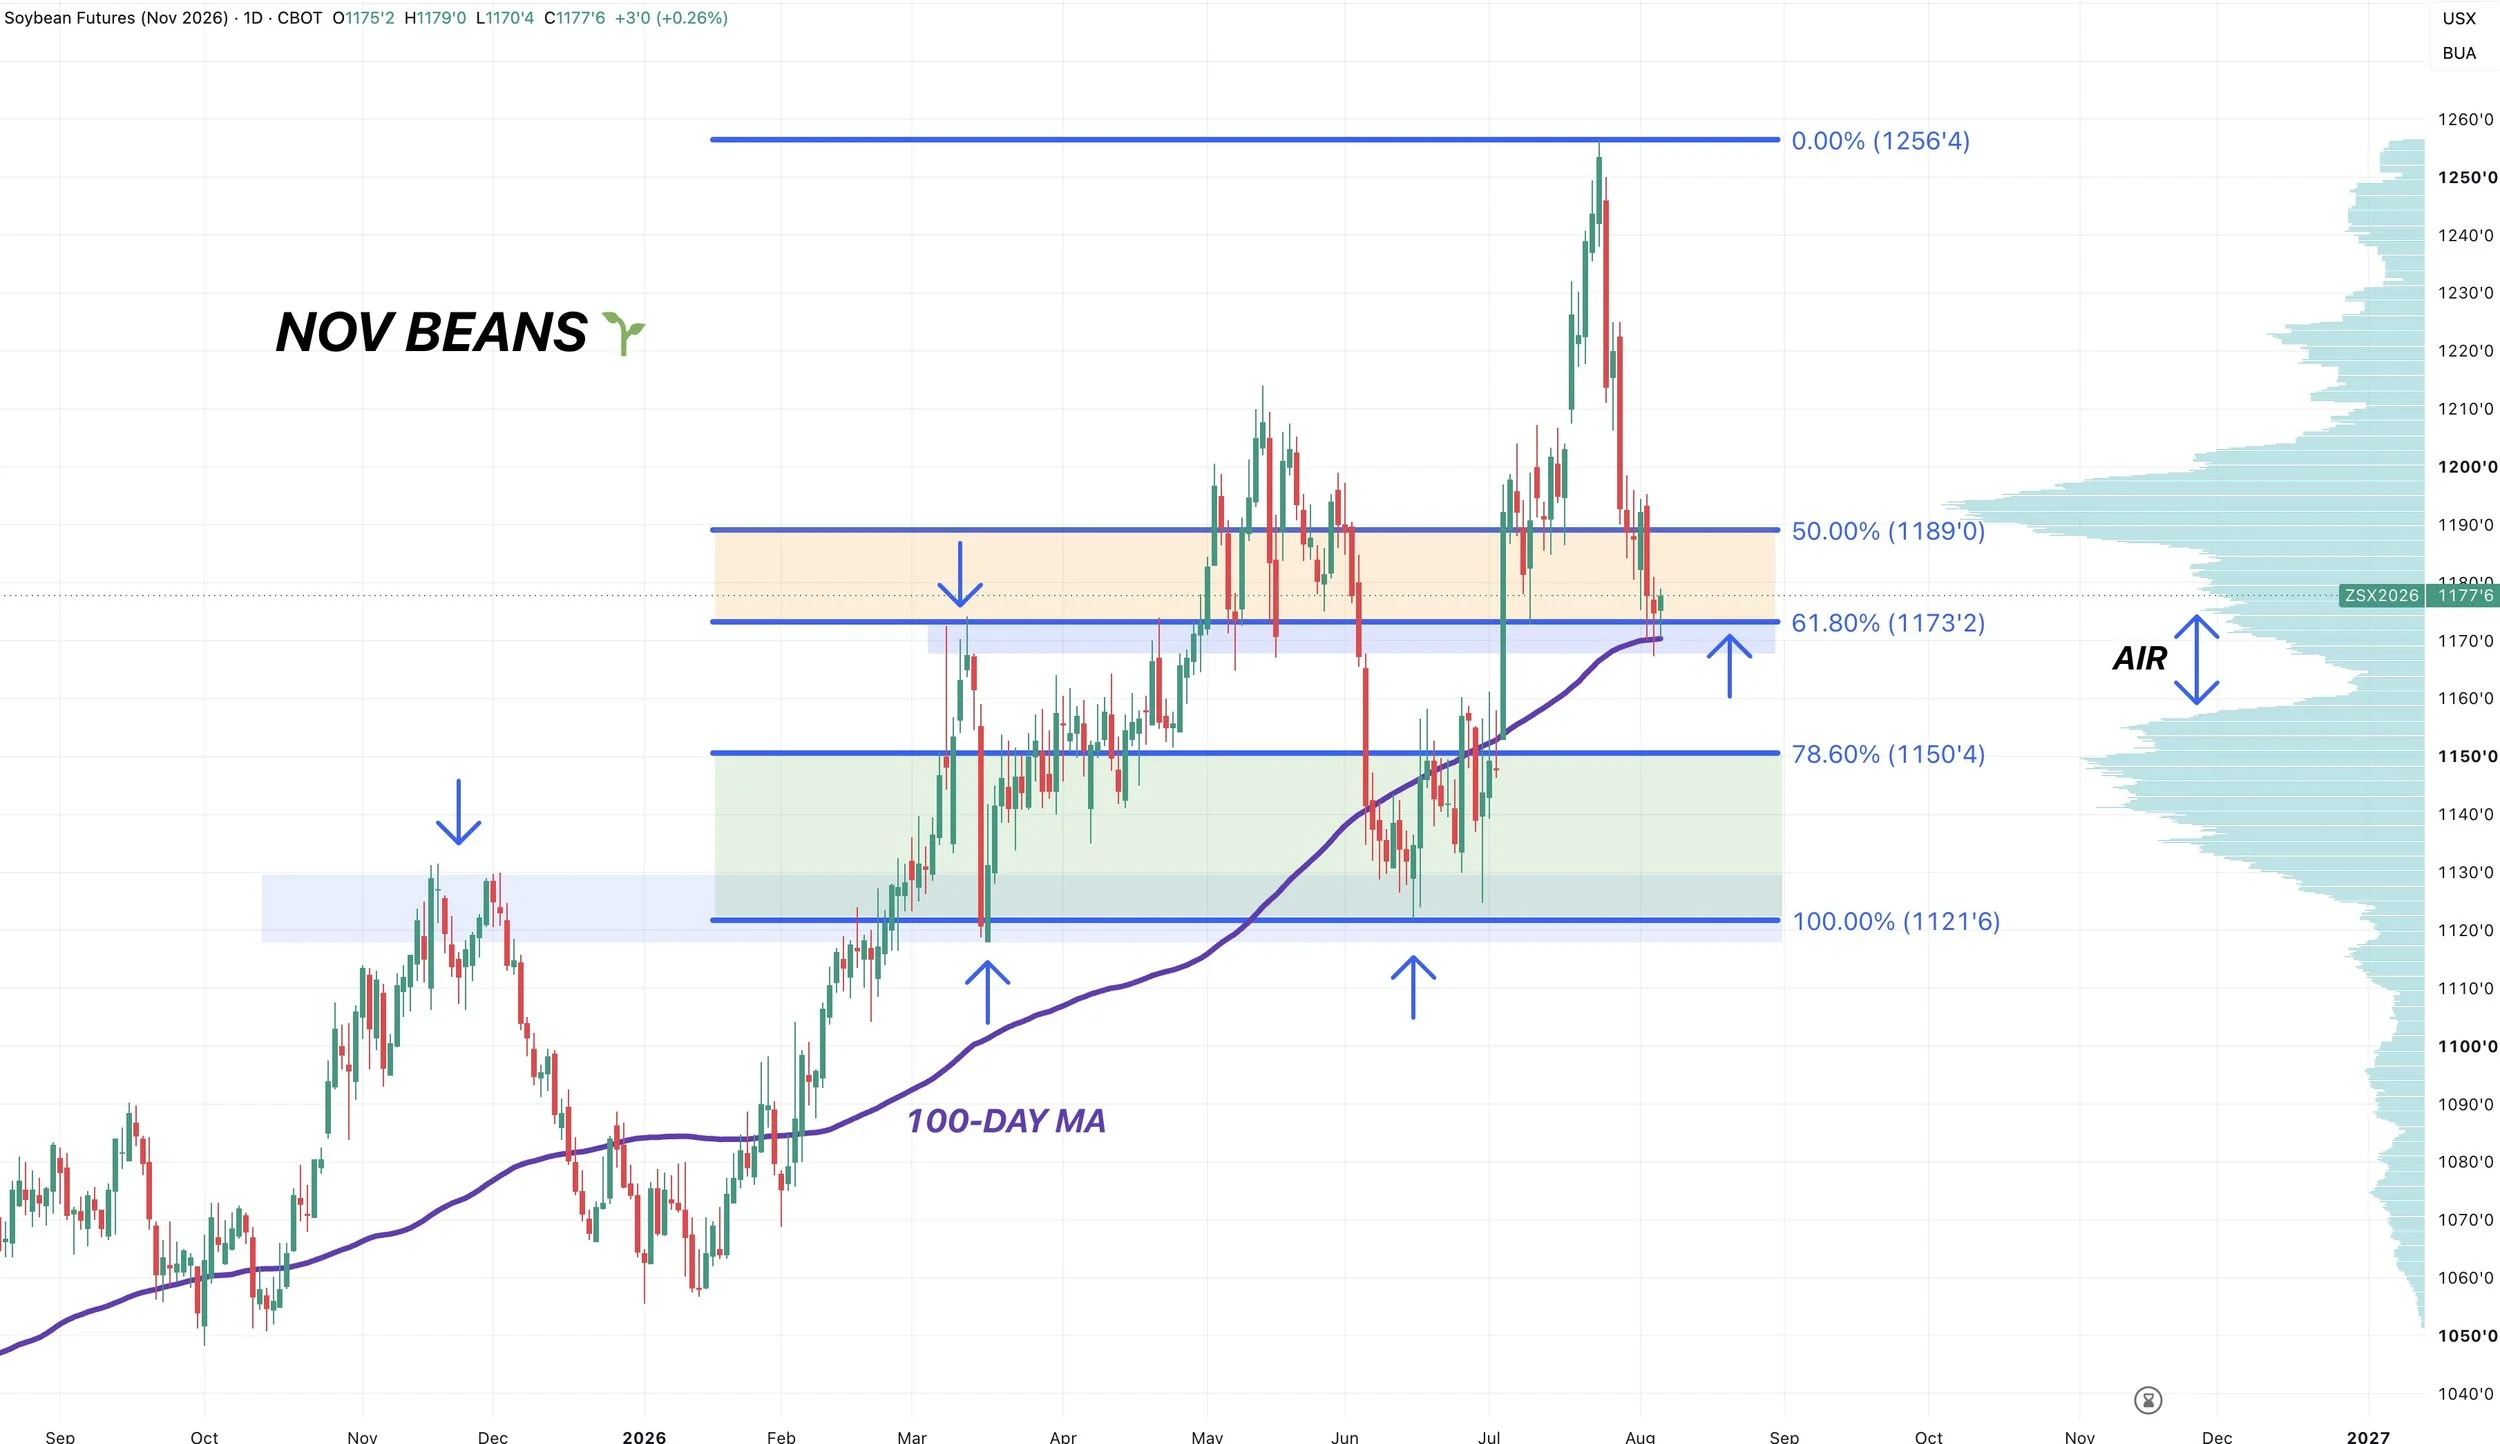
We have given back 61.8% of the entire rally from June.
Again, this is the most common retracement and where the market will often tell us whether this is your standard healthy pullback or the start of something larger.
So if we are going to bounce, this is still where we would expect to see it happen.
But at the same time, it's also a key level we need to hold. As a break below will likely spark further downside.
Let's break down why this is a big spot one chart at a time to help simplify things.
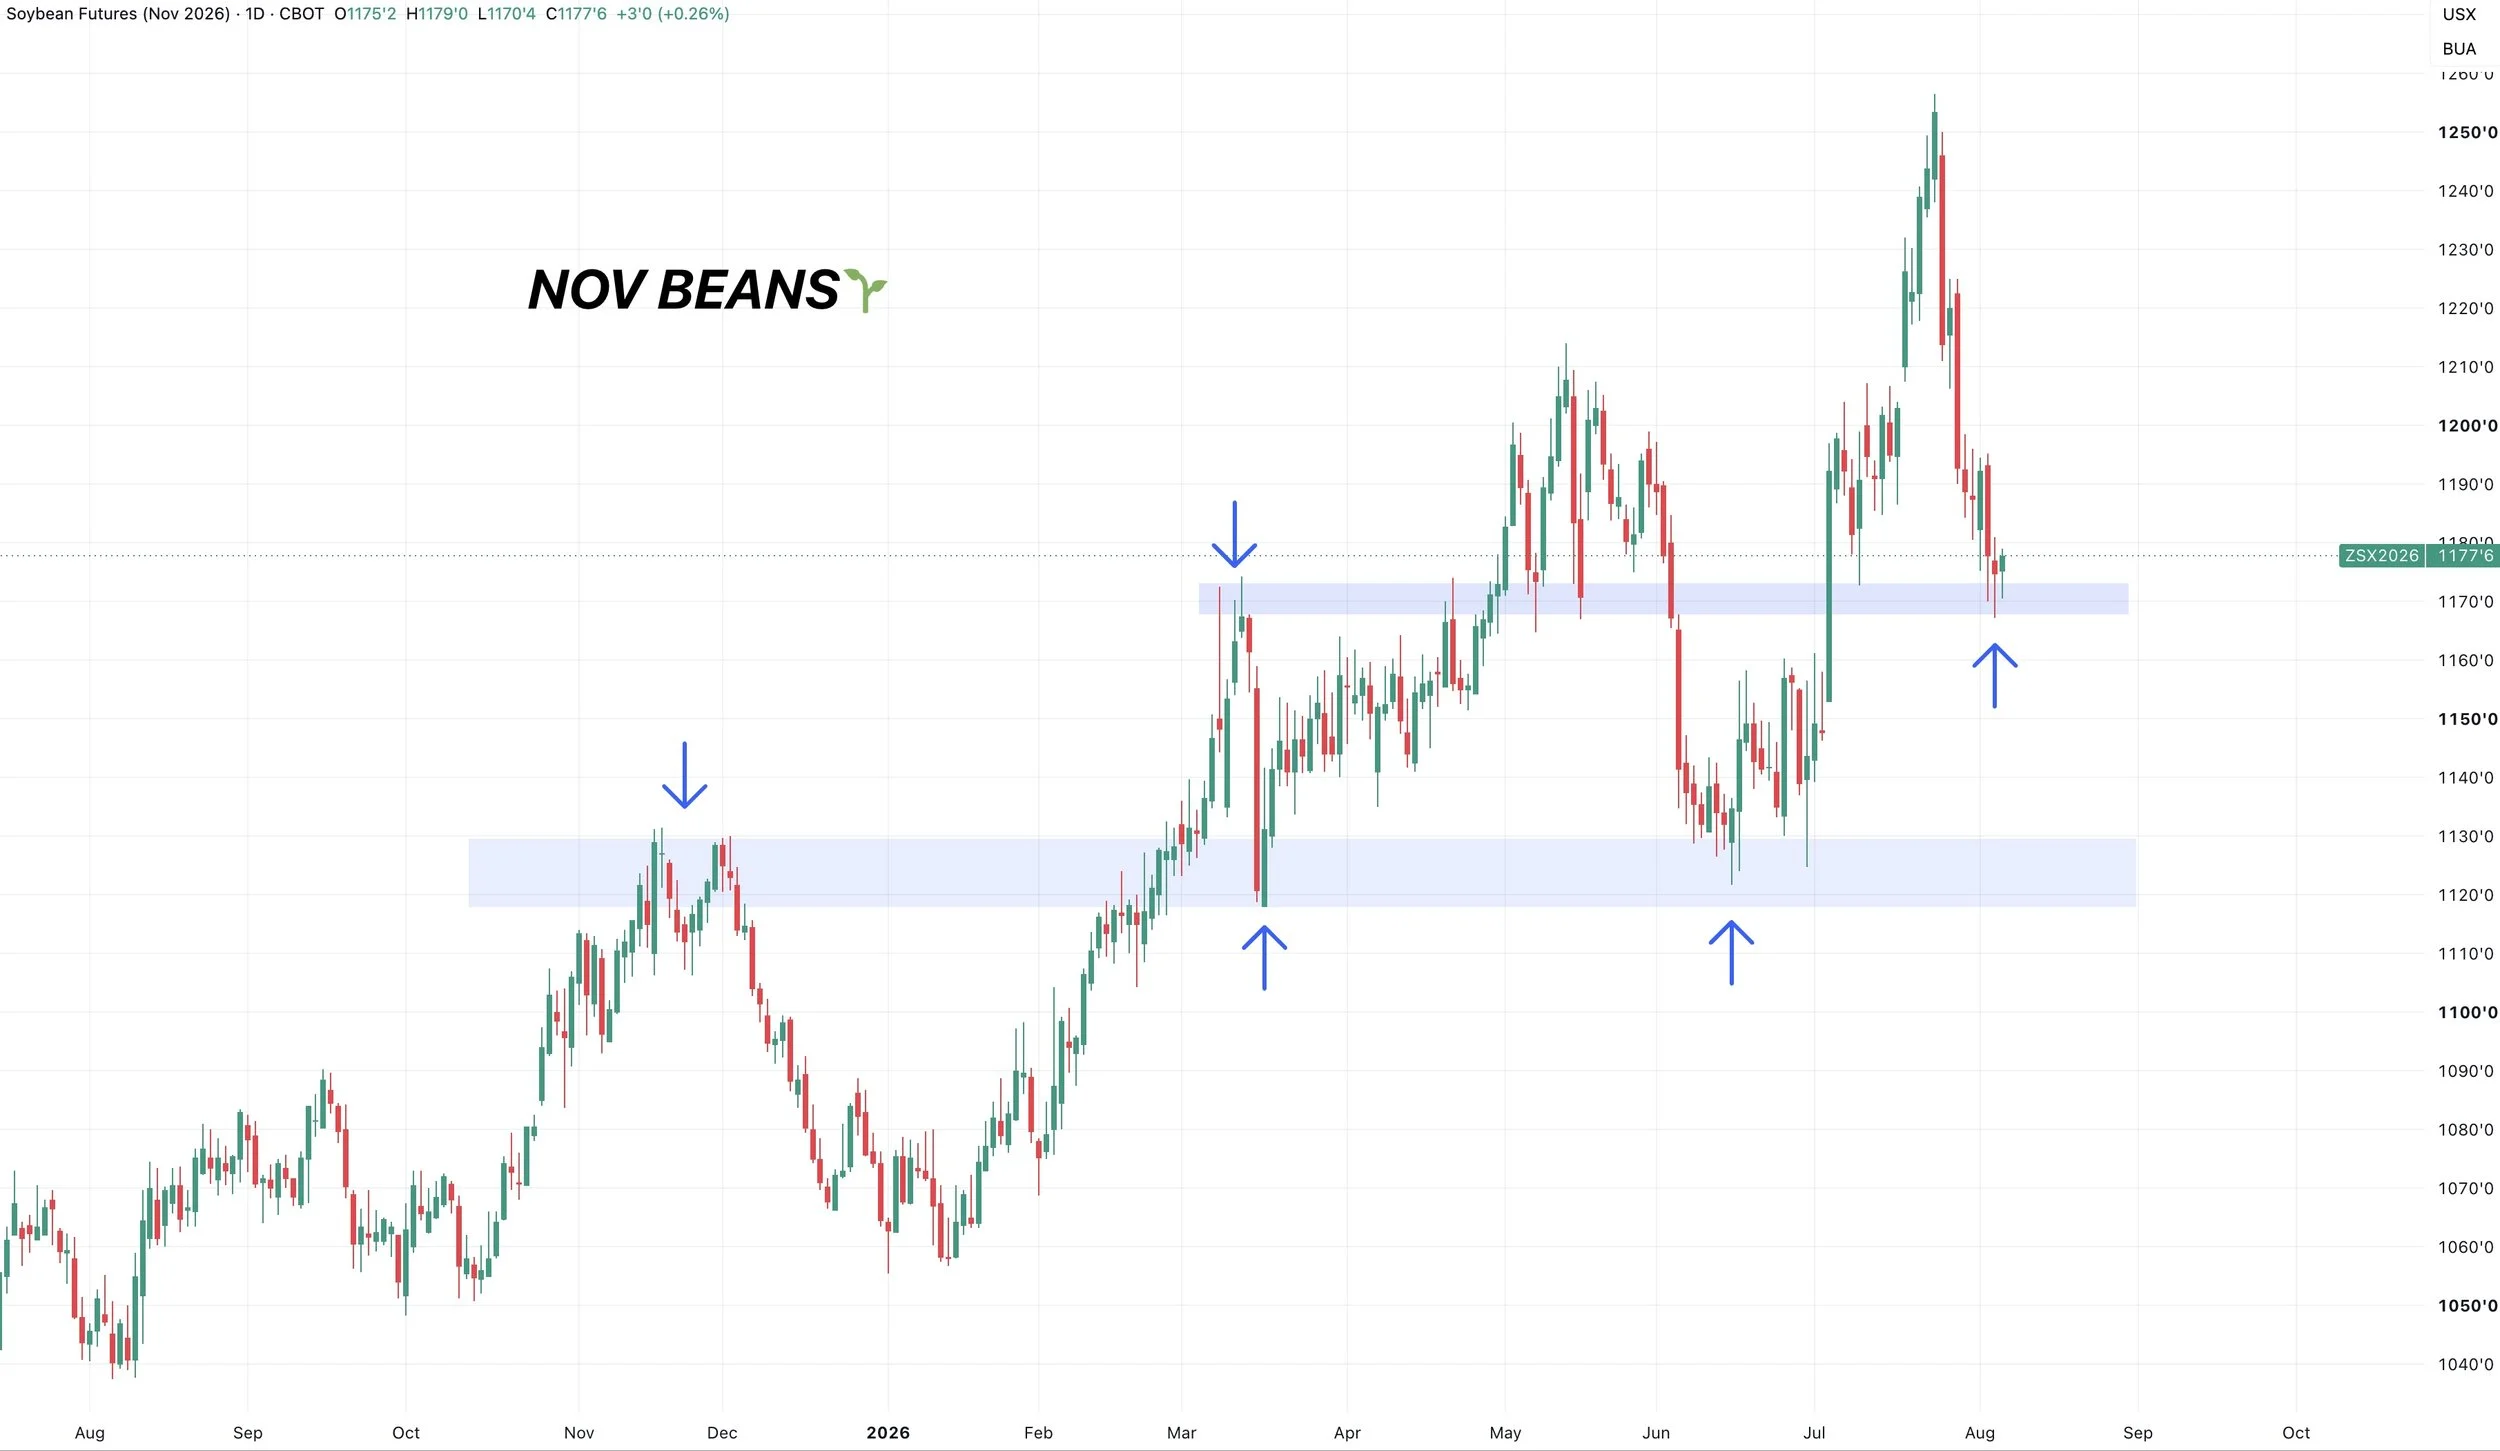
Not only is this the 61.8% level.
We are sitting right at those highs from March and lows from May.
It's been an area of key support and resistance in the past.
So ideally we want to see us turn this old ceiling into our new floor.
Similar to what we saw earlier this year.
When we sold off in March, we found our lows right at those highs from November.
We have also tagged the 100-day MA for three straight days in a row.
Bouncing off of it each time.
This is something the funds and algos are paying attention to.
I have been liking the fact that we've continued to close well off the lows for 3 days in a row.
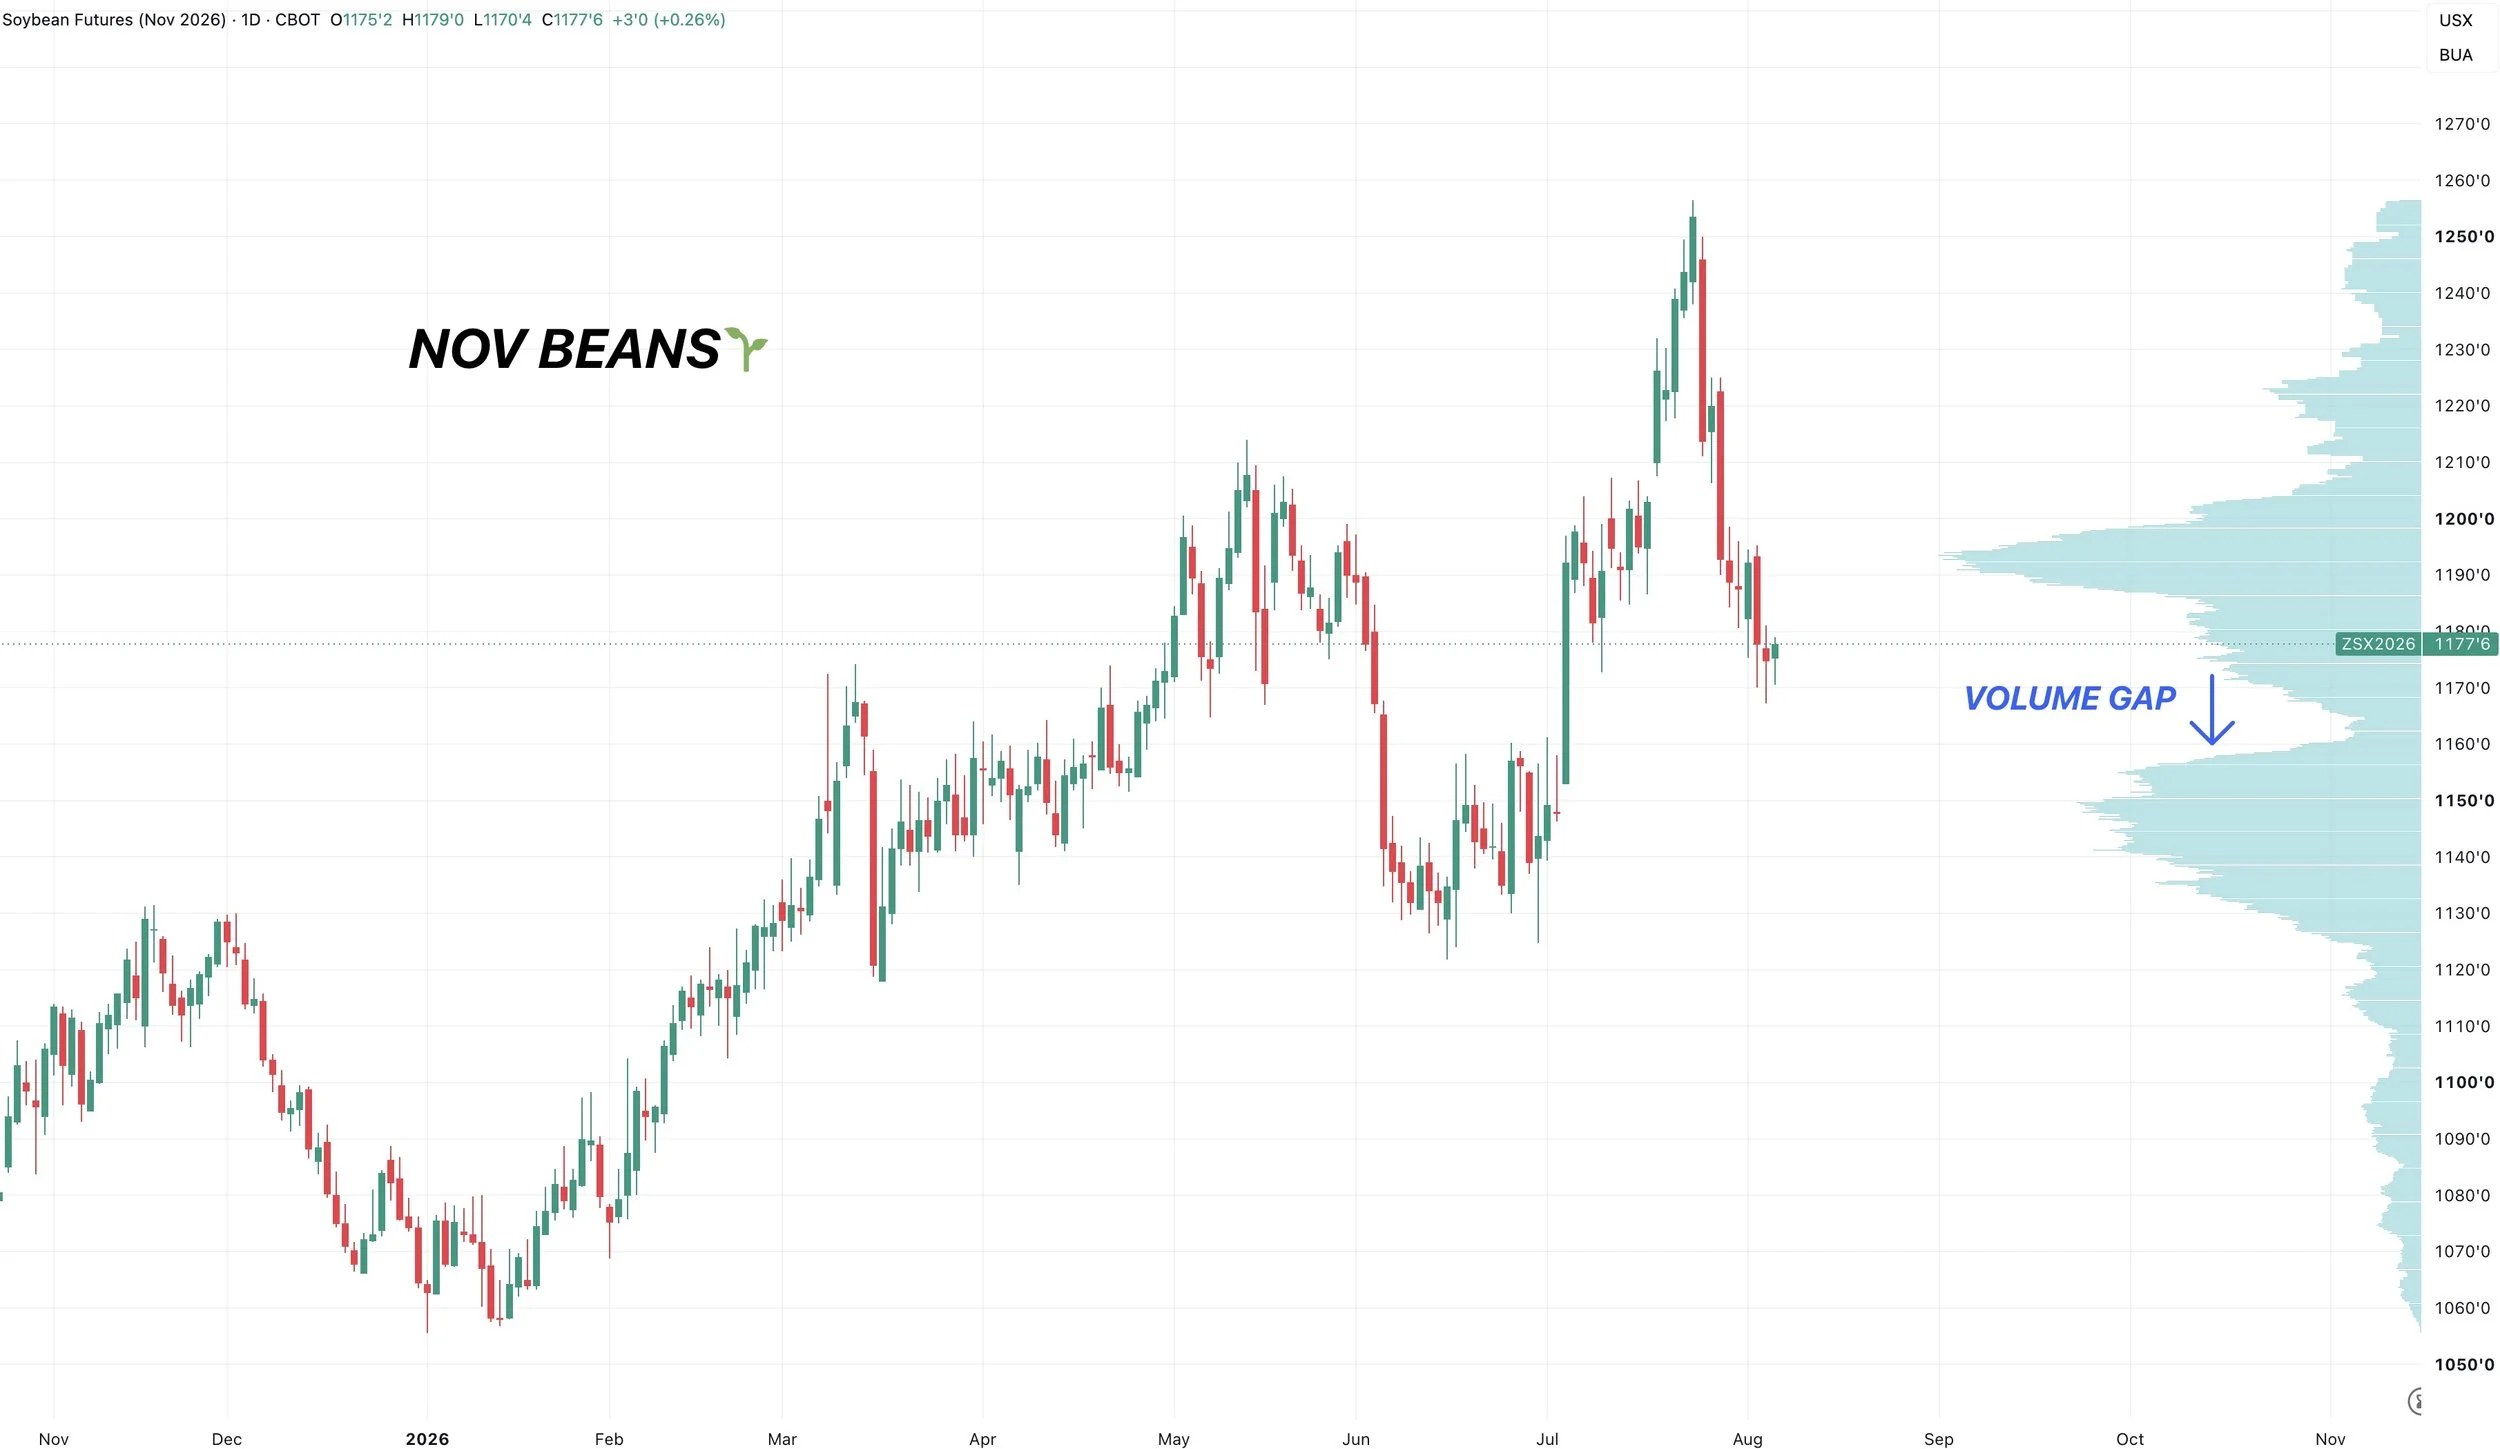
Lastly let's look at the volume profile.
If we fail to hold here, there is a gap of air to the downside. Back down to that old range from June.
Here is all of that thrown together.
Bottom line, soybeans are at critical support.
Right where we would expect us to bounce. But if you fail to hold key support, it often opens the flood gates lower.
If you are someone who likes to re-own, this would still be a good area to consider doing so. However, again keep in mind that if we lose this level it opens the door lower.
But being at key support gives you a defined risk level.
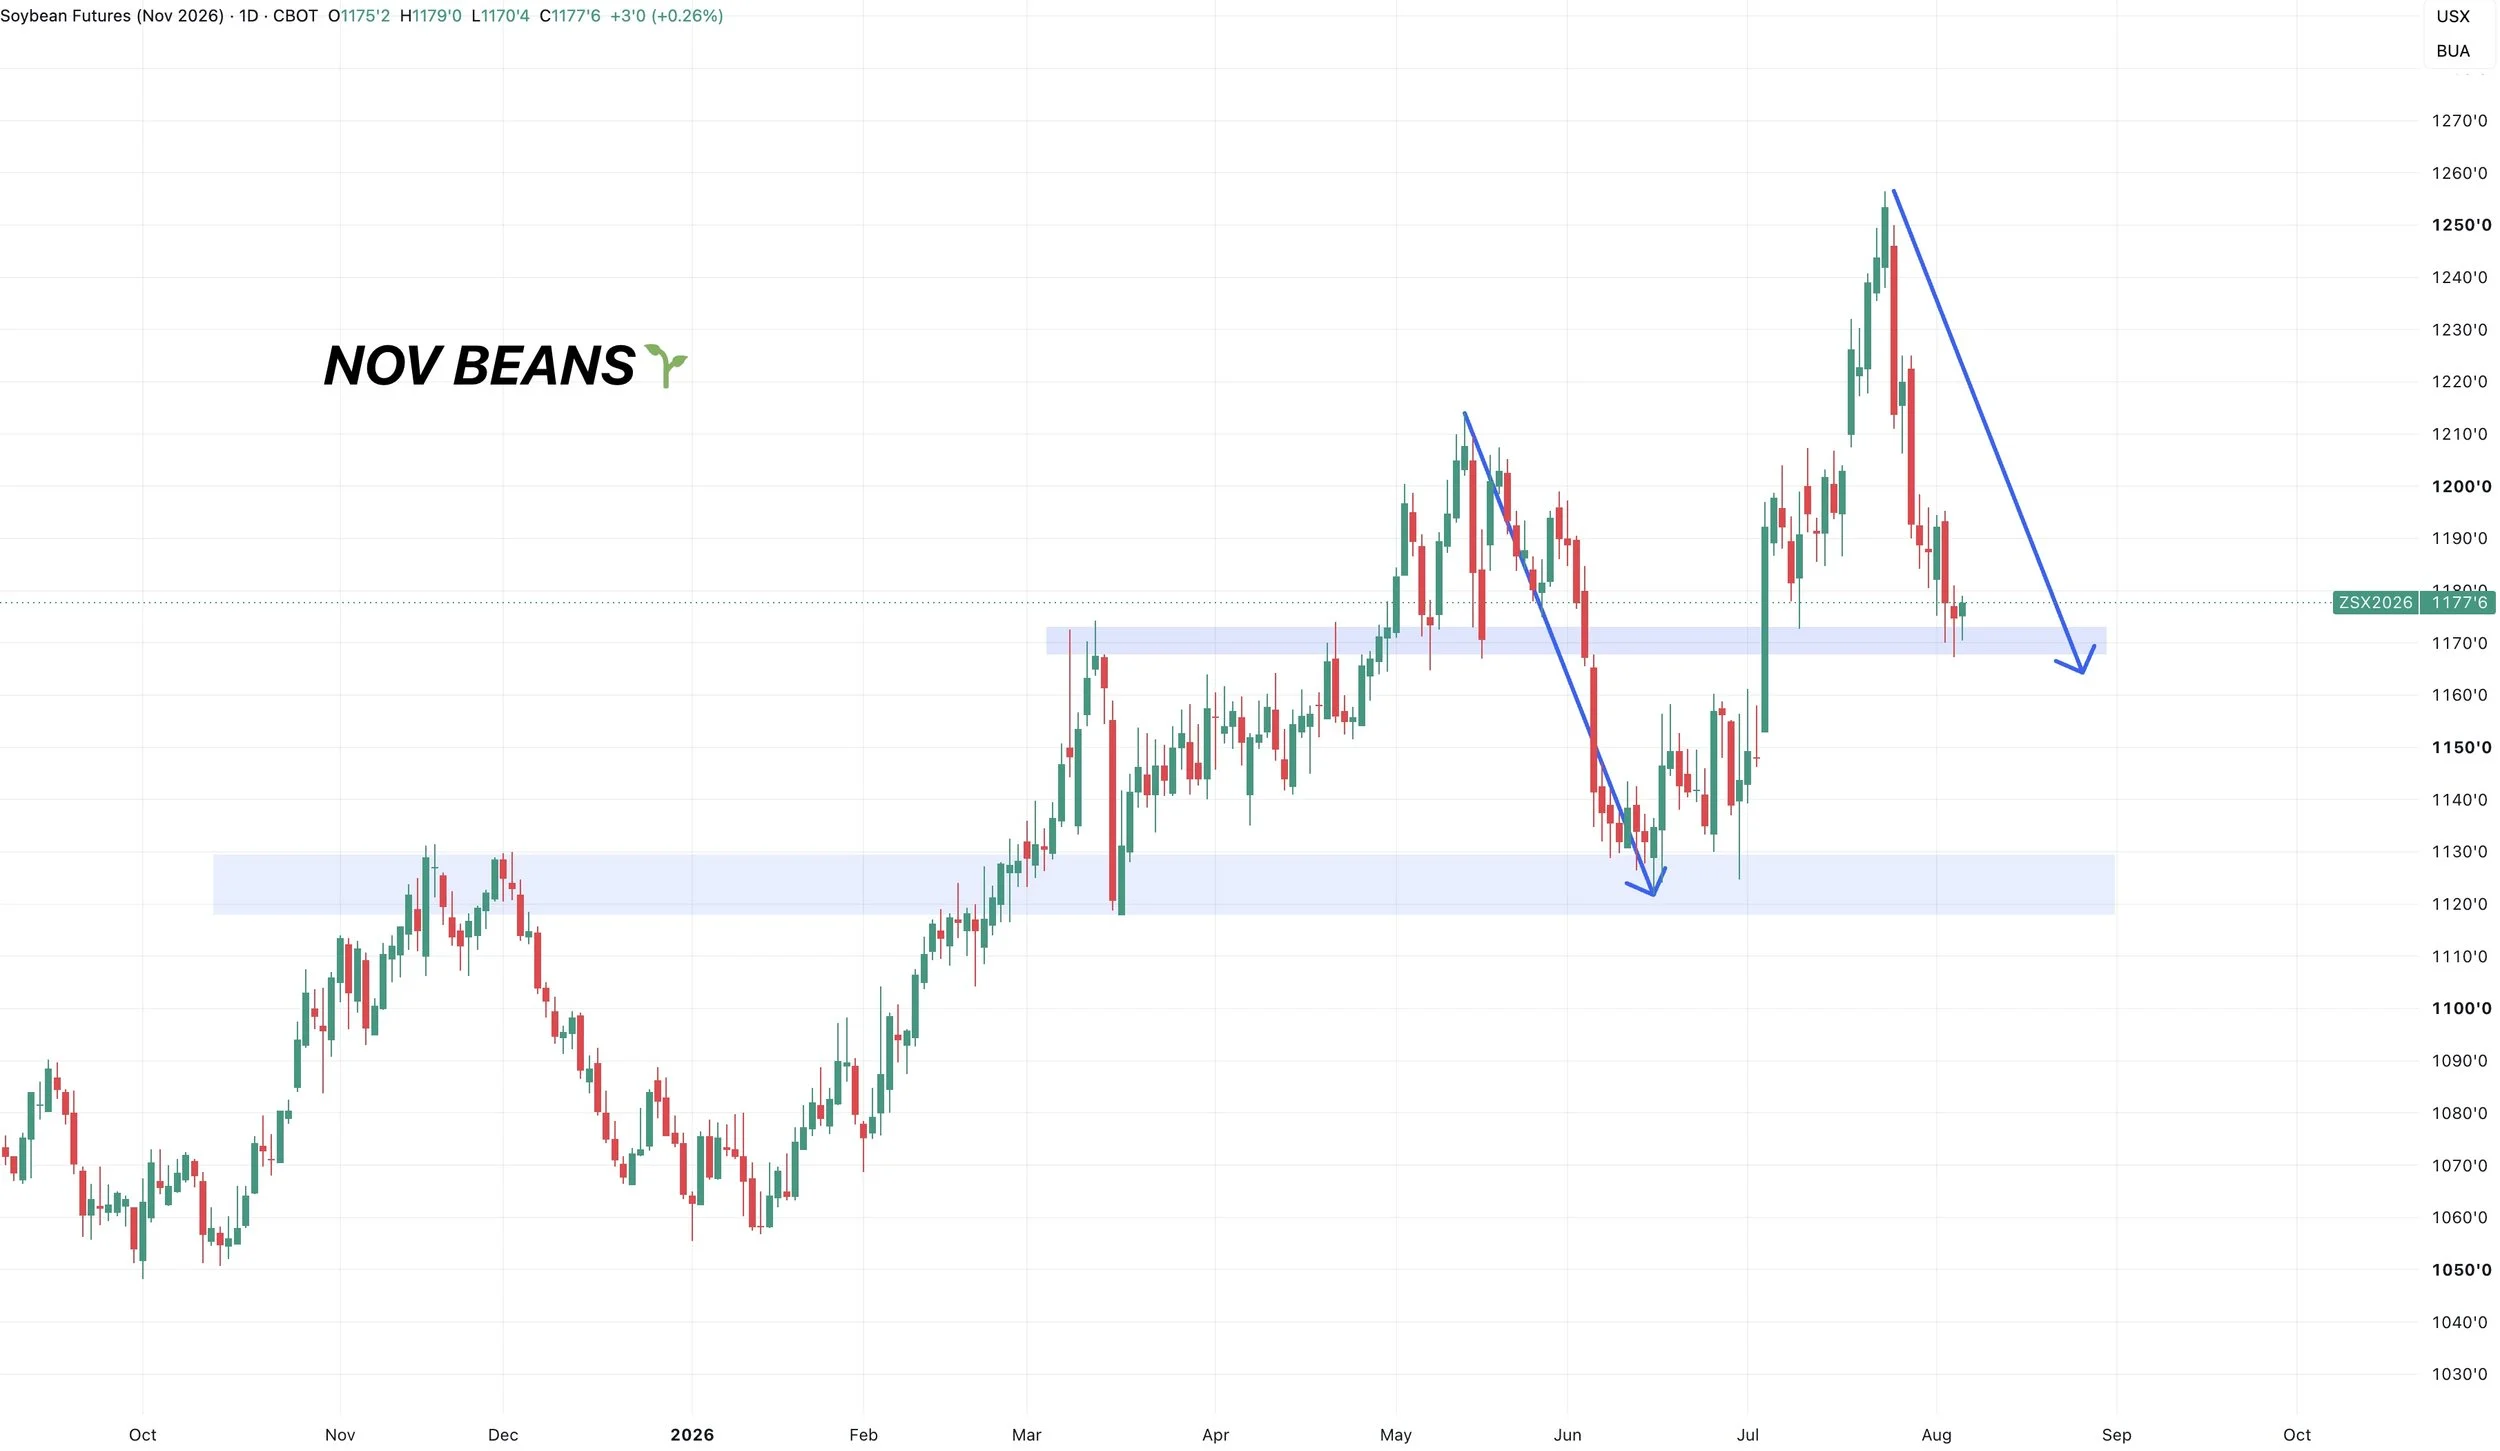
One last reason why a bottom may make sense here is that this current sell off is the 1 to 1 move from the May sell off.
Right now, this sell off is the exact same size as the one from May.
Those two arrows are the same size.
This was a similar reasoning to why we liked defending corn near the recent highs.
The rally was the same exact size as the entire rally from Jan to May.
Weekly Chart:
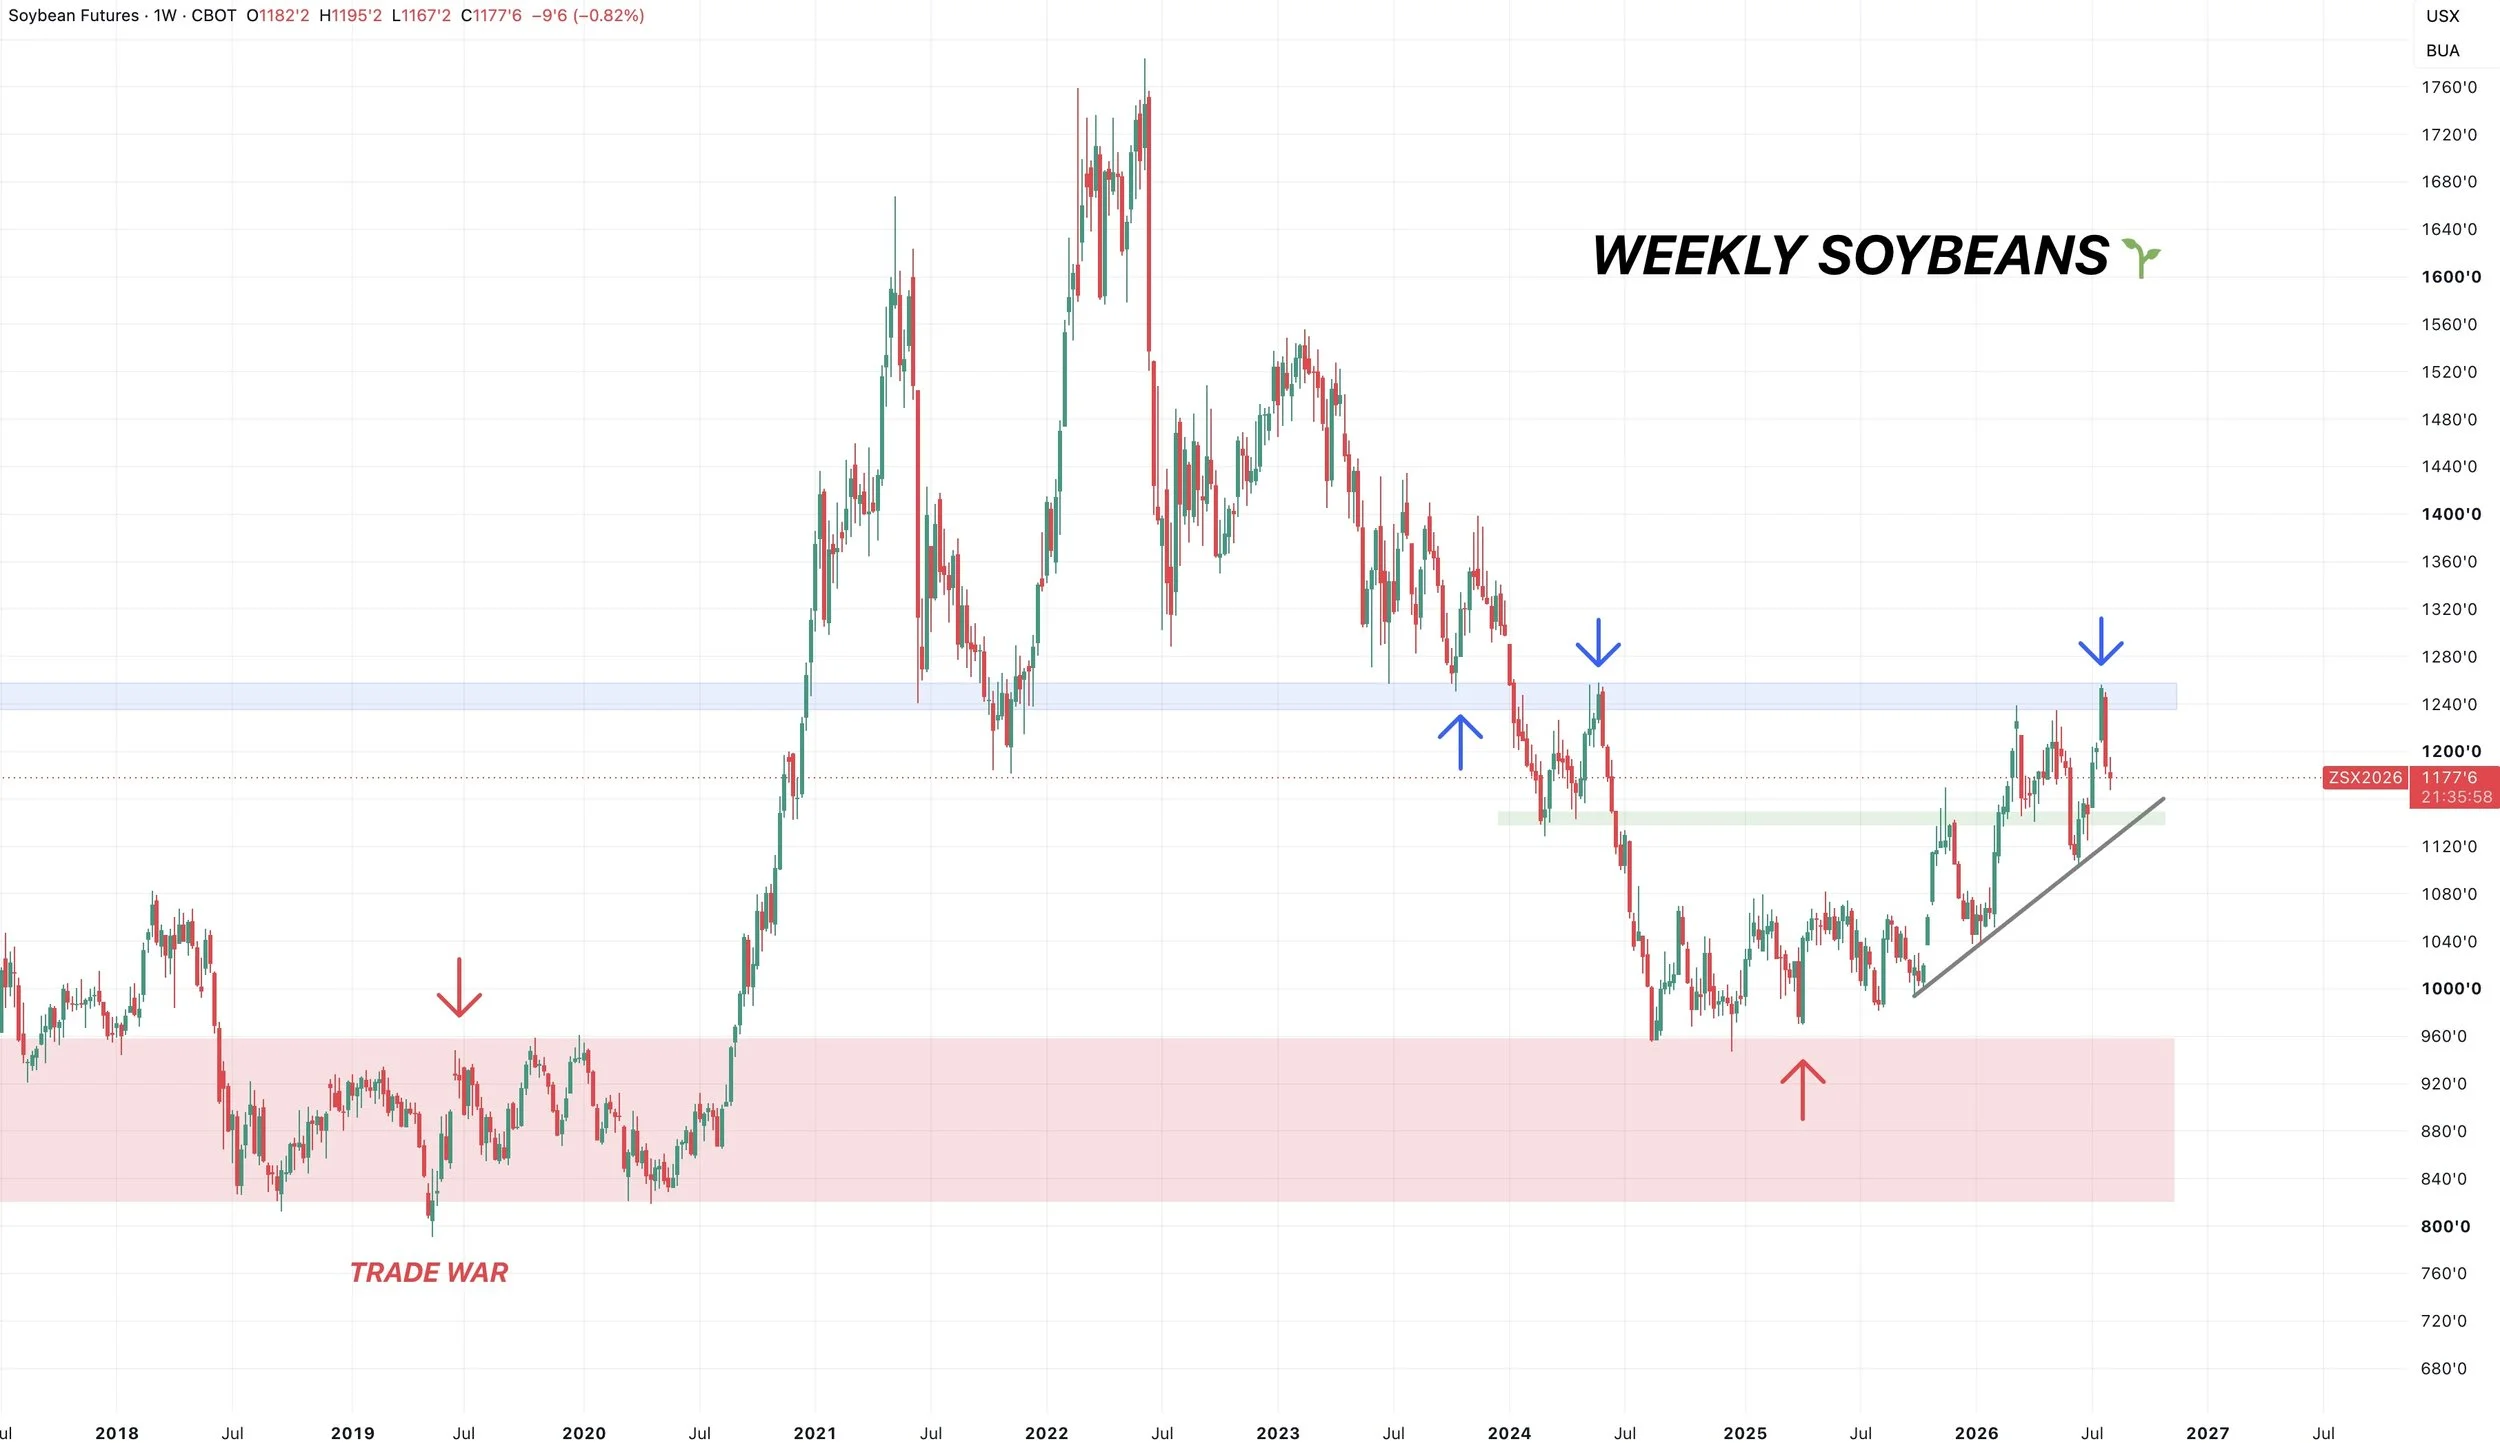
There are zero things bearish about the soybean chart when you zoom out.
The long term structure of this chart looks very friendly.
In 2024 we bottomed right at those highs from the trade war.
We now have a series of higher highs and higher lows after breaking out of that year long range we had been trapped in.
We rejected that high time frame resistance two weeks ago.
Which was the highs from 2024 and lows from 2023.
That's going to obviously be a big level.
If you ever break above that level.. things get very interesting.
Wheat
Sep KC Wheat Chart:
We tapped that golden zone today.
As we have now given back exactly 50% of the entire rally from June.
I am not concerned about wheat unless we break below the 61.8% level which sits at $6.74
That same level is the highs from March and lows from May.
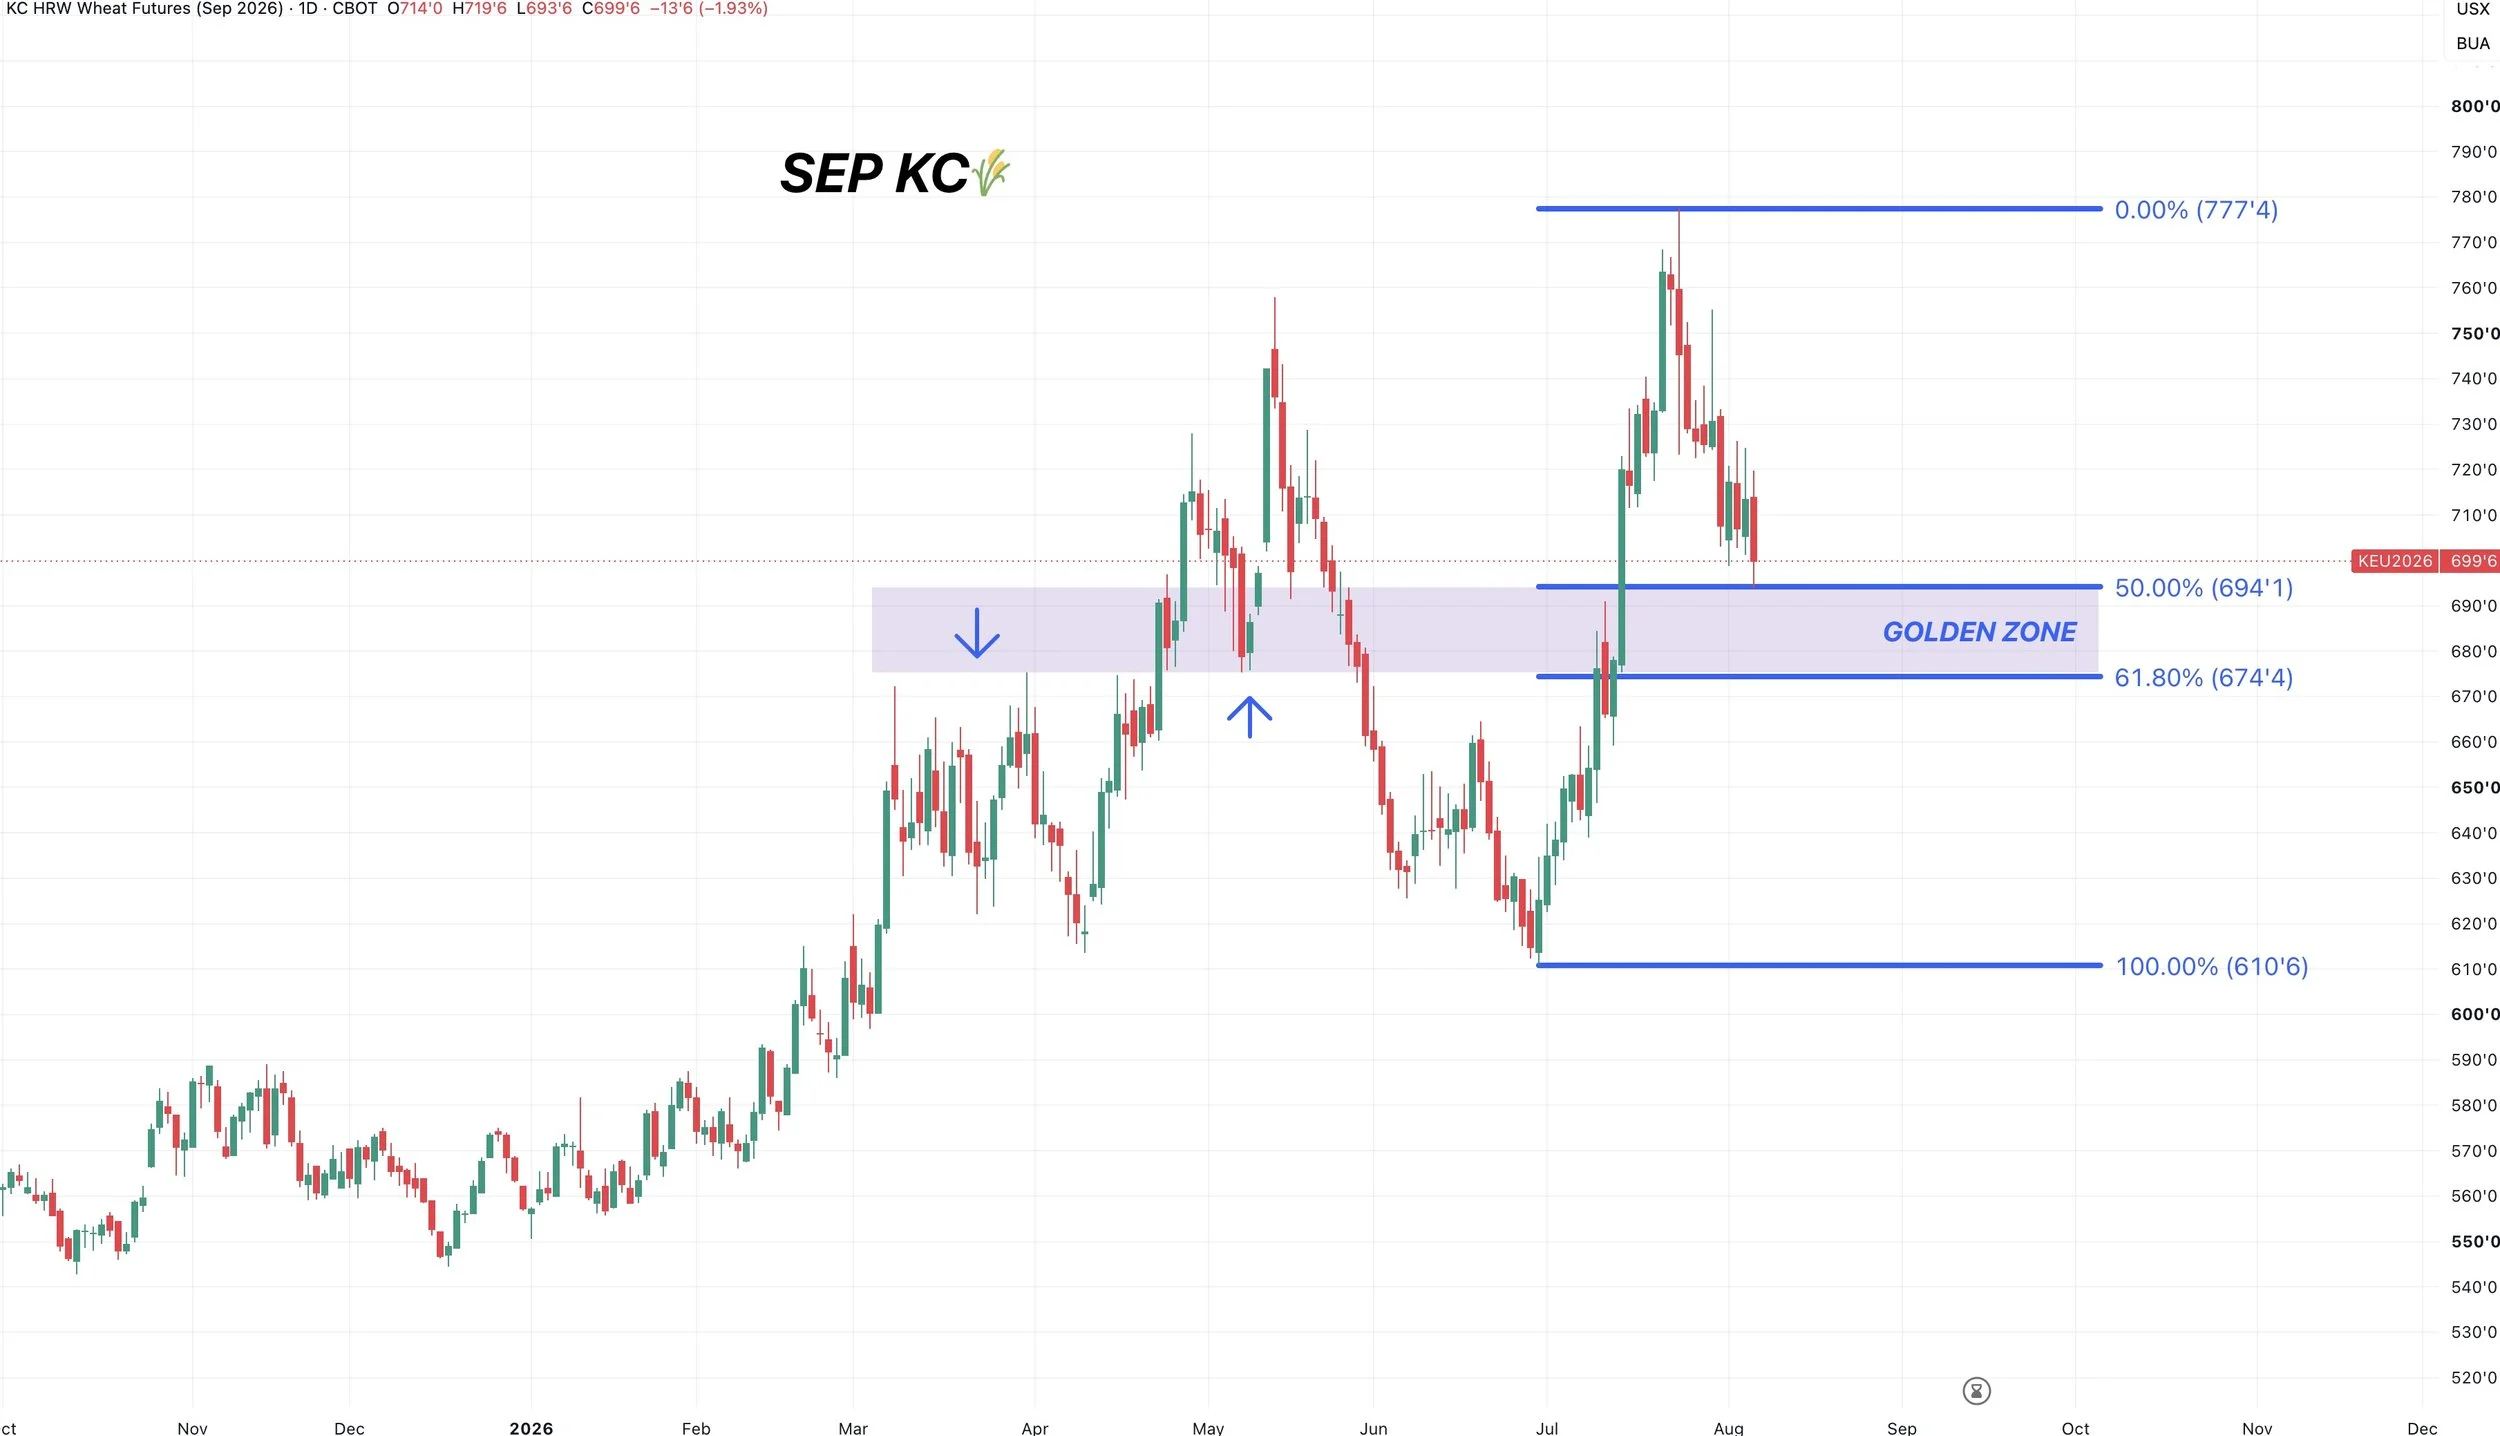
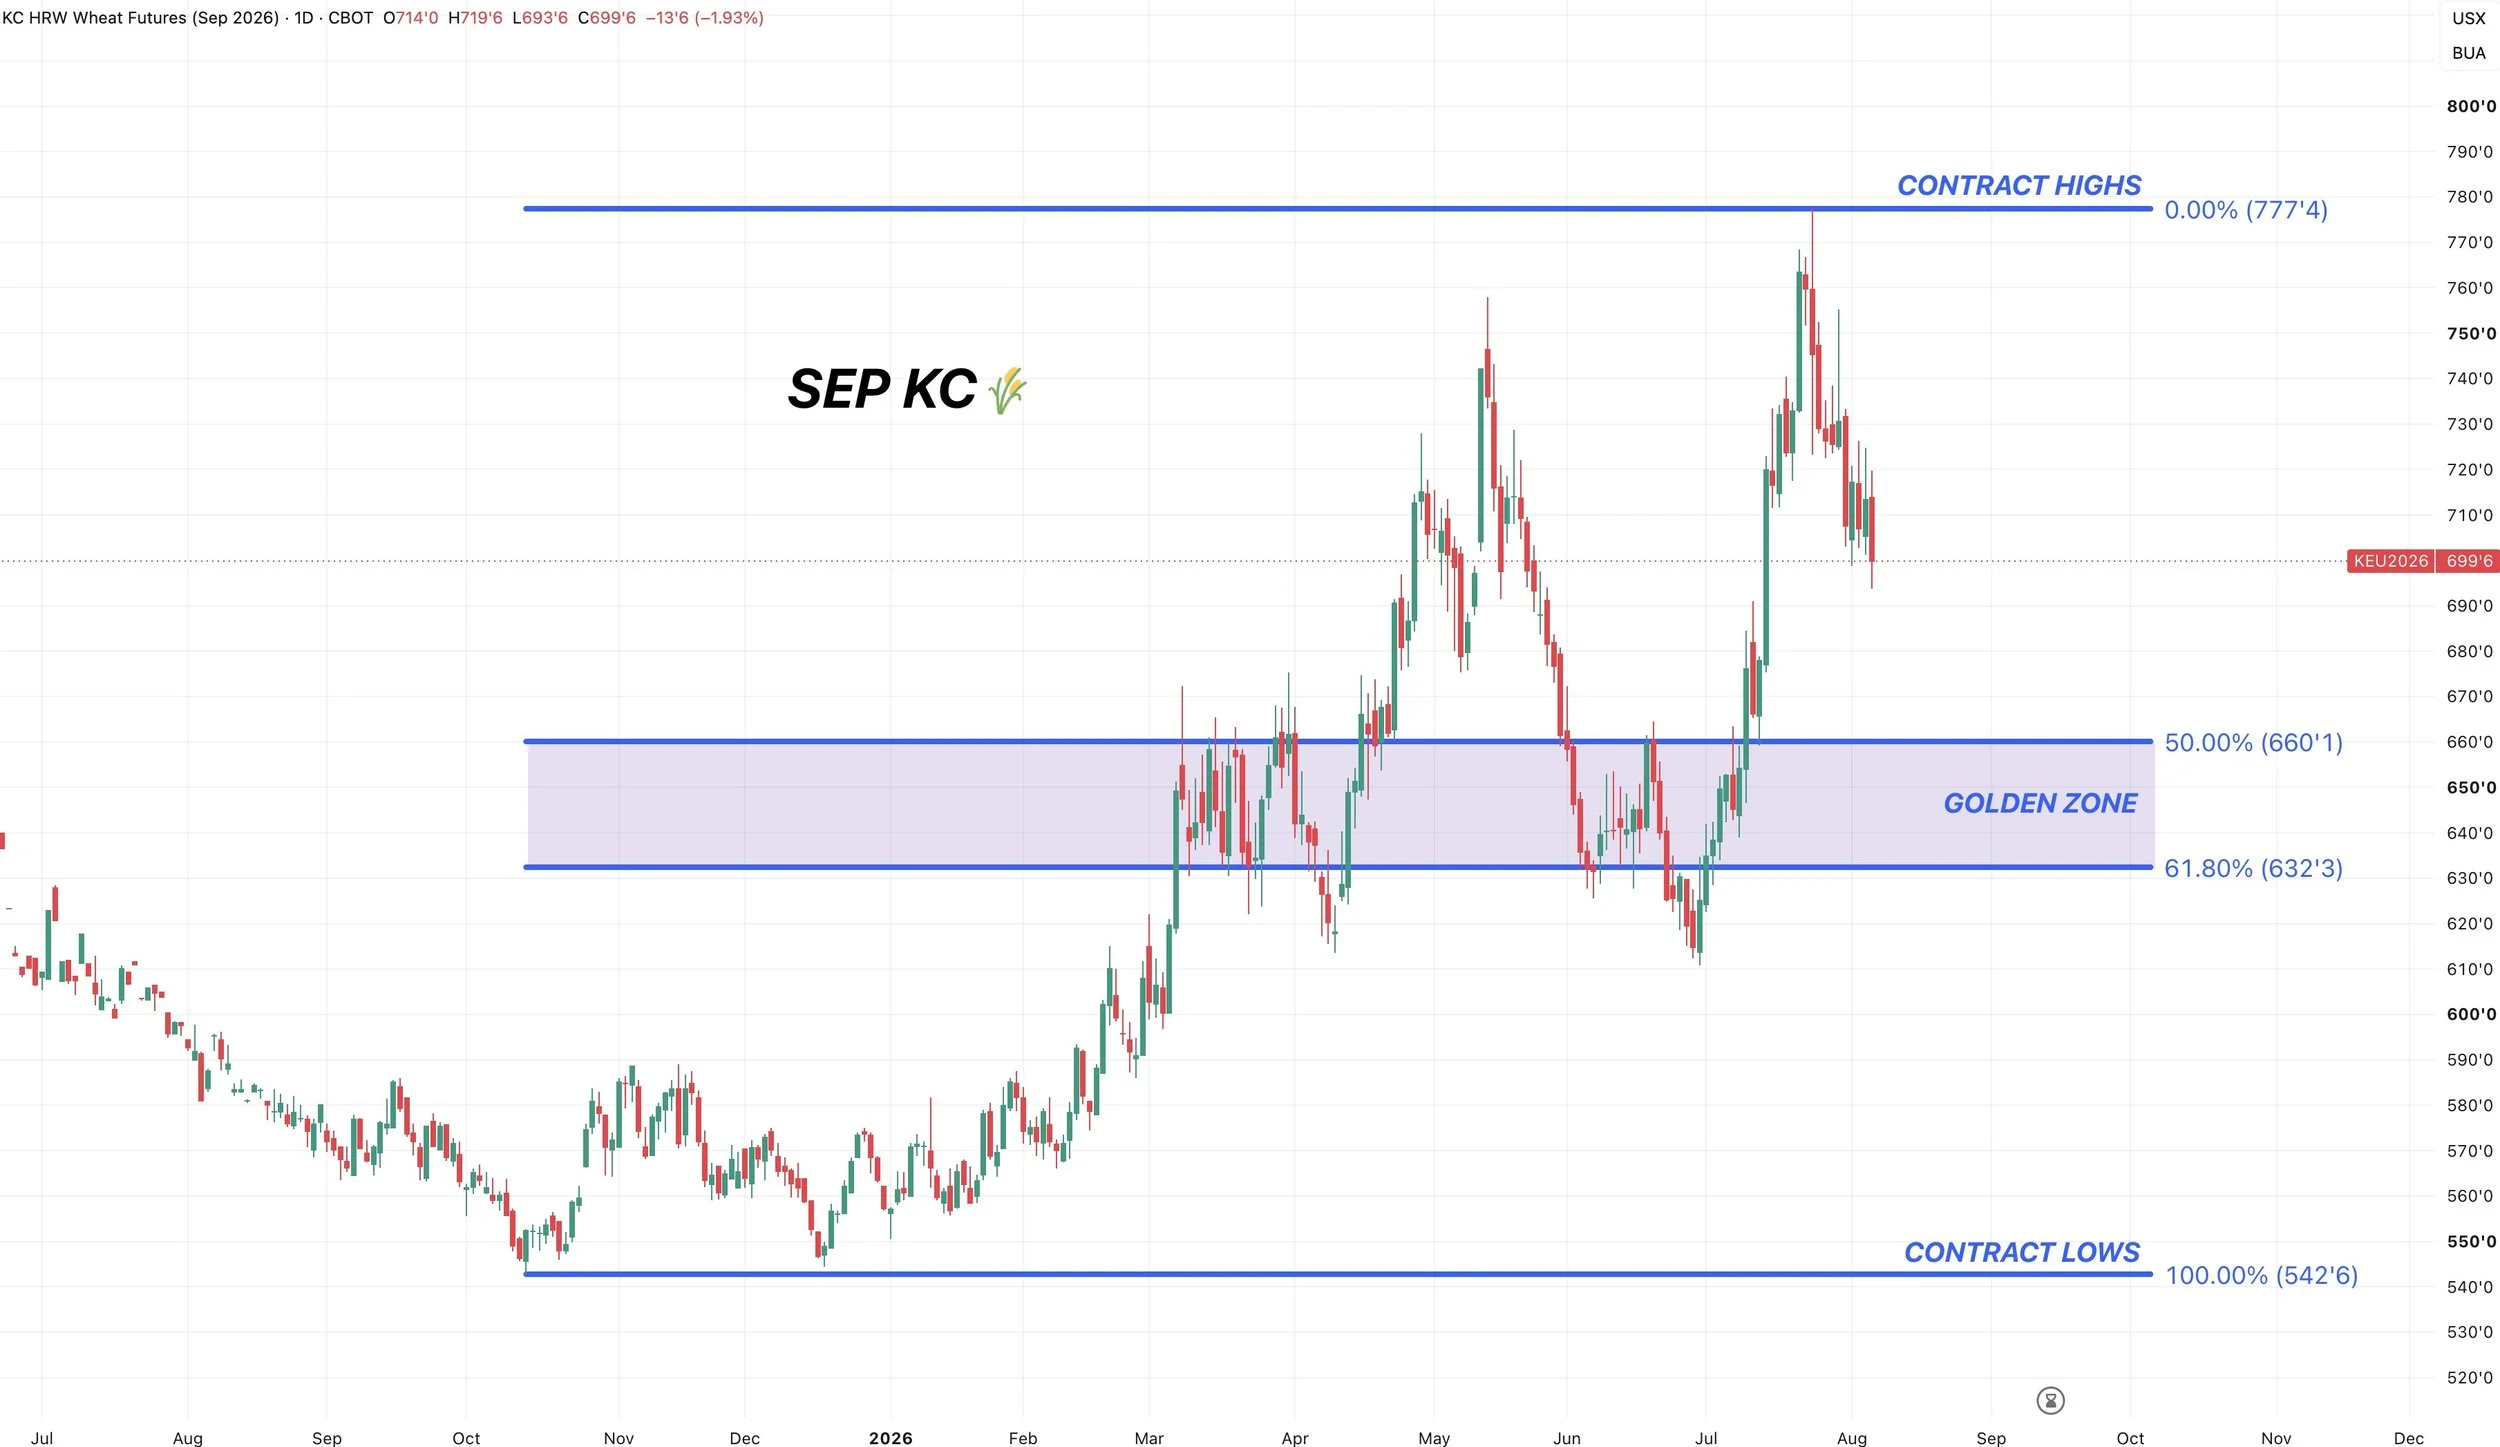
If you fail to hold this golden zone, it opens the door down the those recent June lows.
That same area is also the golden zone from the contract highs down to the contract lows.
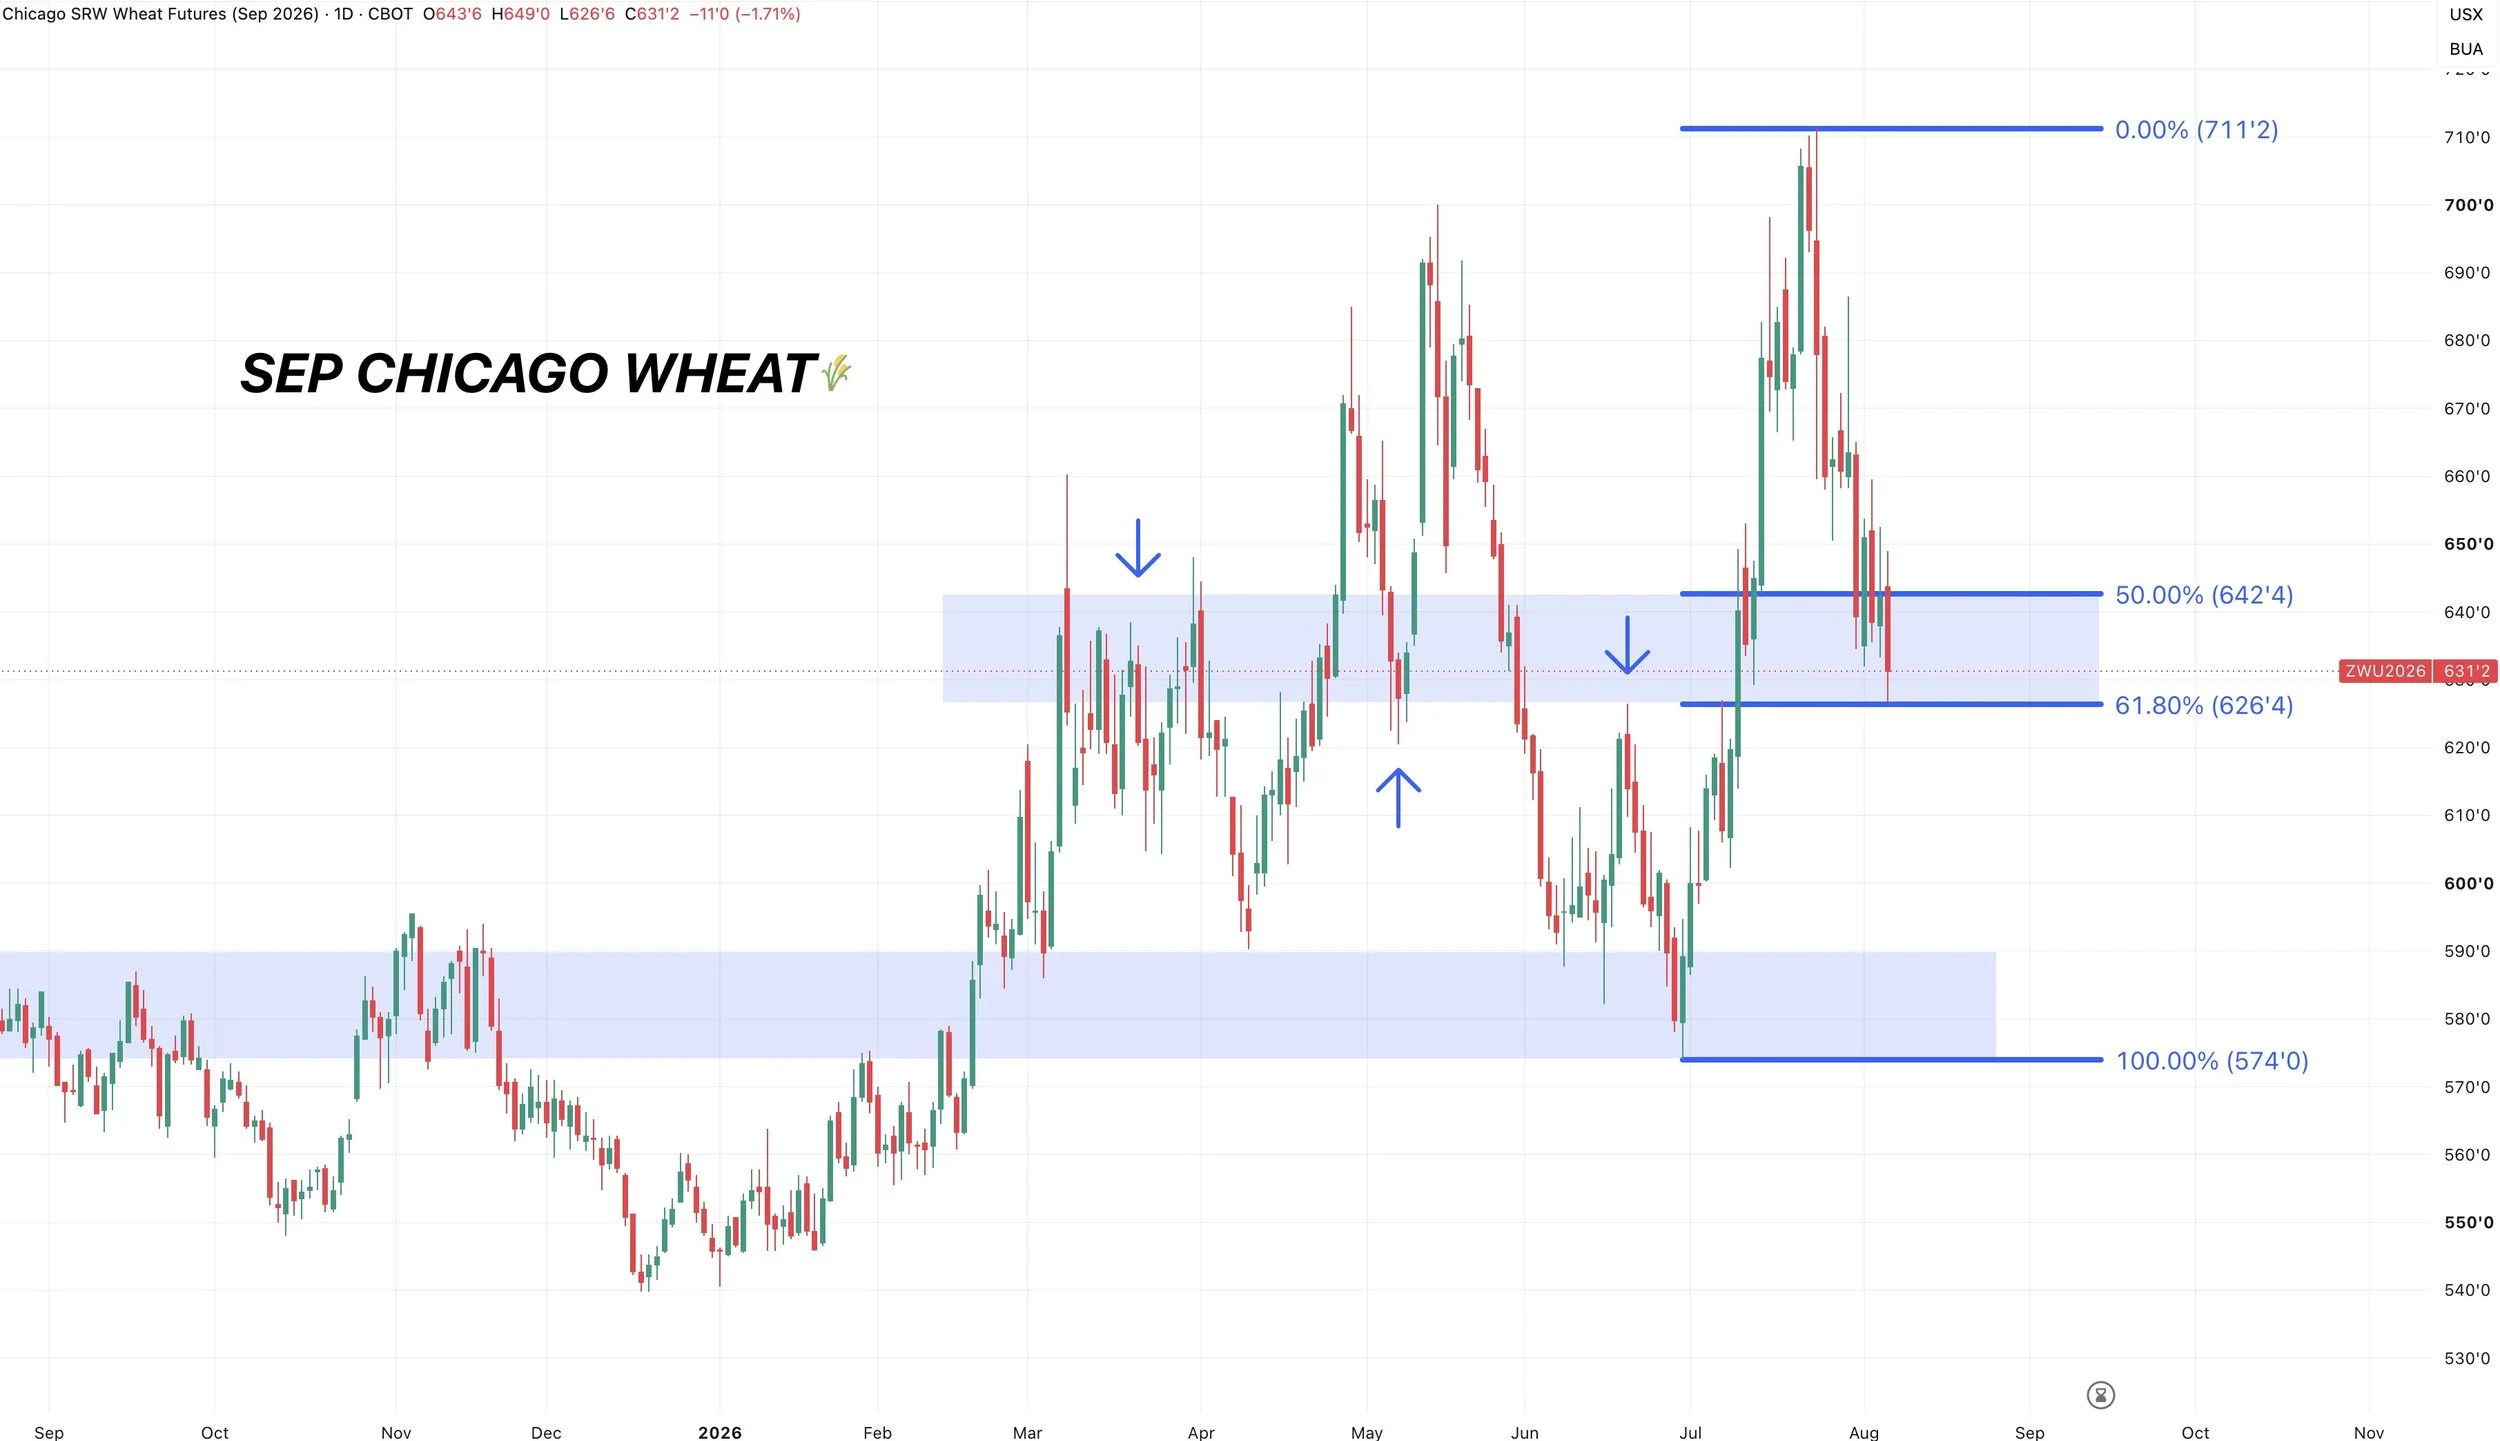
Sep Chicago Wheat Chart:
Here is another reason to think the wheat market could be close to a bottom.
Chicago wheat gave back exactly 61.8% of the entire rally today.
This spot has been prior support and resistance.
If we are going to bounce, we would like to see it happen here or it could open the door lower.
Similar to soybeans, this is where a bounce would make sense, but it's also a level where we need to hold.
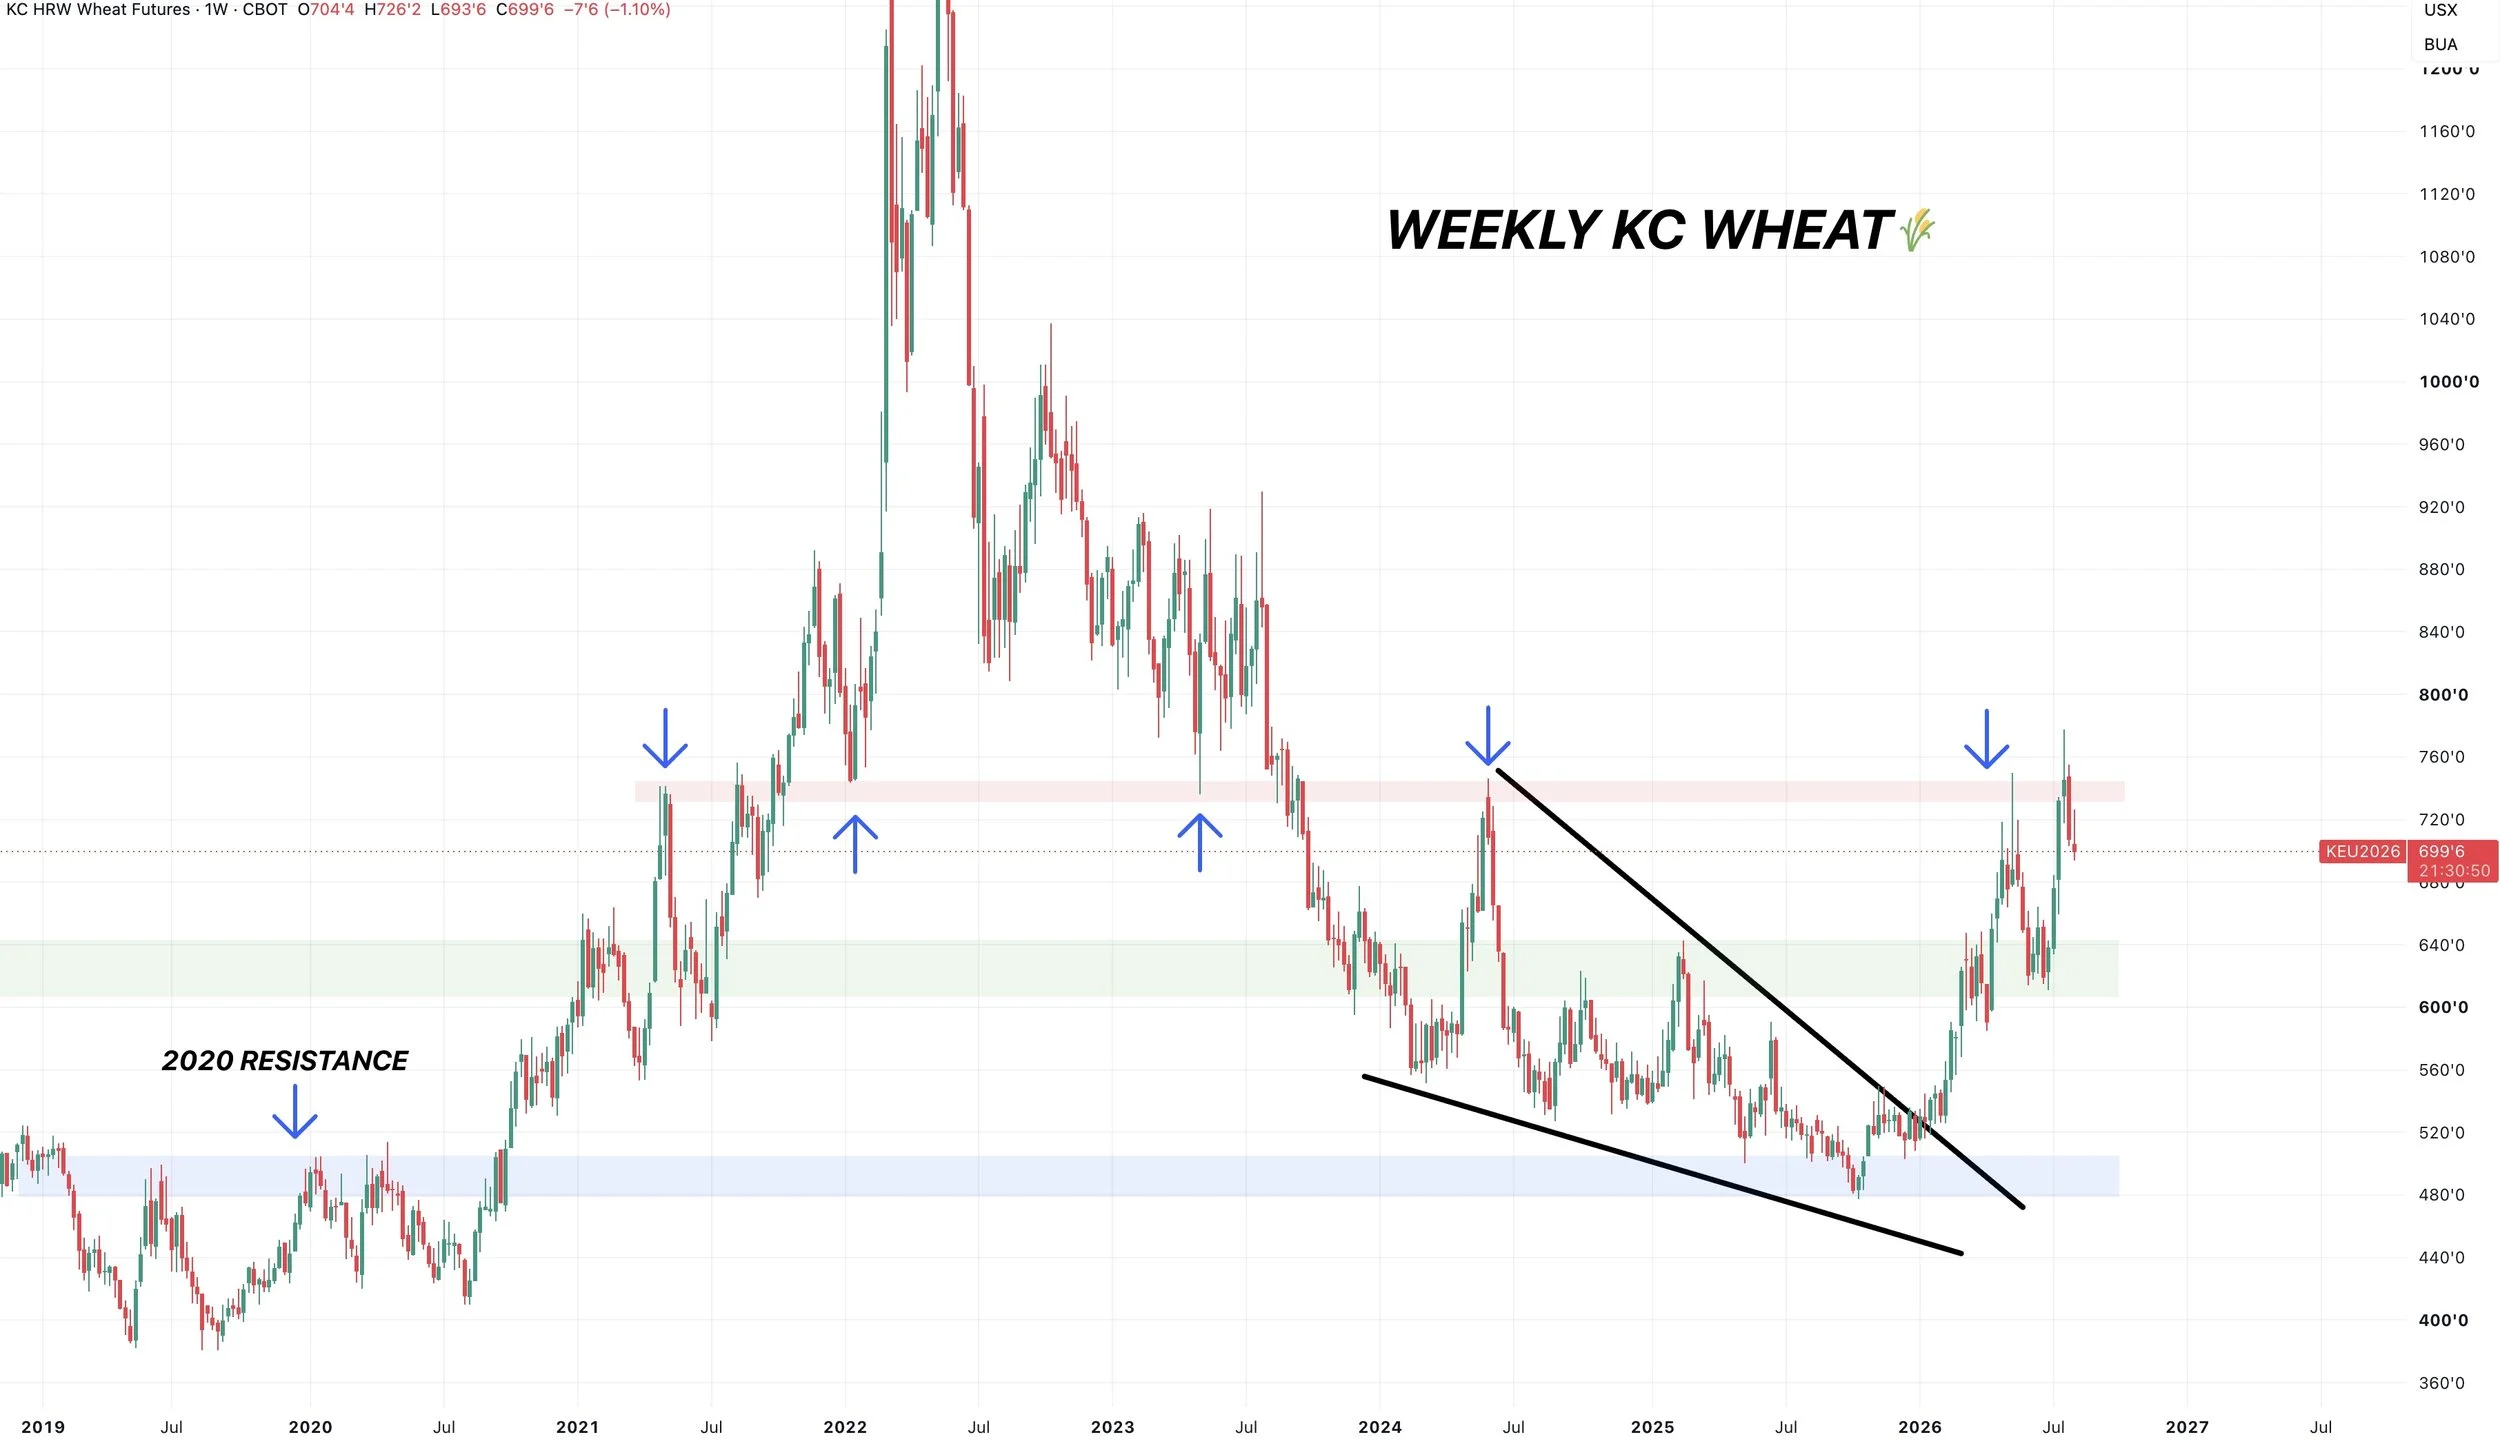
Weekly KC:
Like in soybeans, there is nothing bearish about the chart when you zoom out.
We printed our first higher highs of the entire bear market.
We rejected some high time frame resistance.
As on the weekly time frame, we failed to break that big $7.45 to $7.50 level.
That was the highs from May. It was the highs from 2024. The lows from 2023. The lows from 2022. And the highs from 2021.
So that's clearly the major hurdle needed to break to reach some of those 2022 to 2023 type of prices.
Cattle
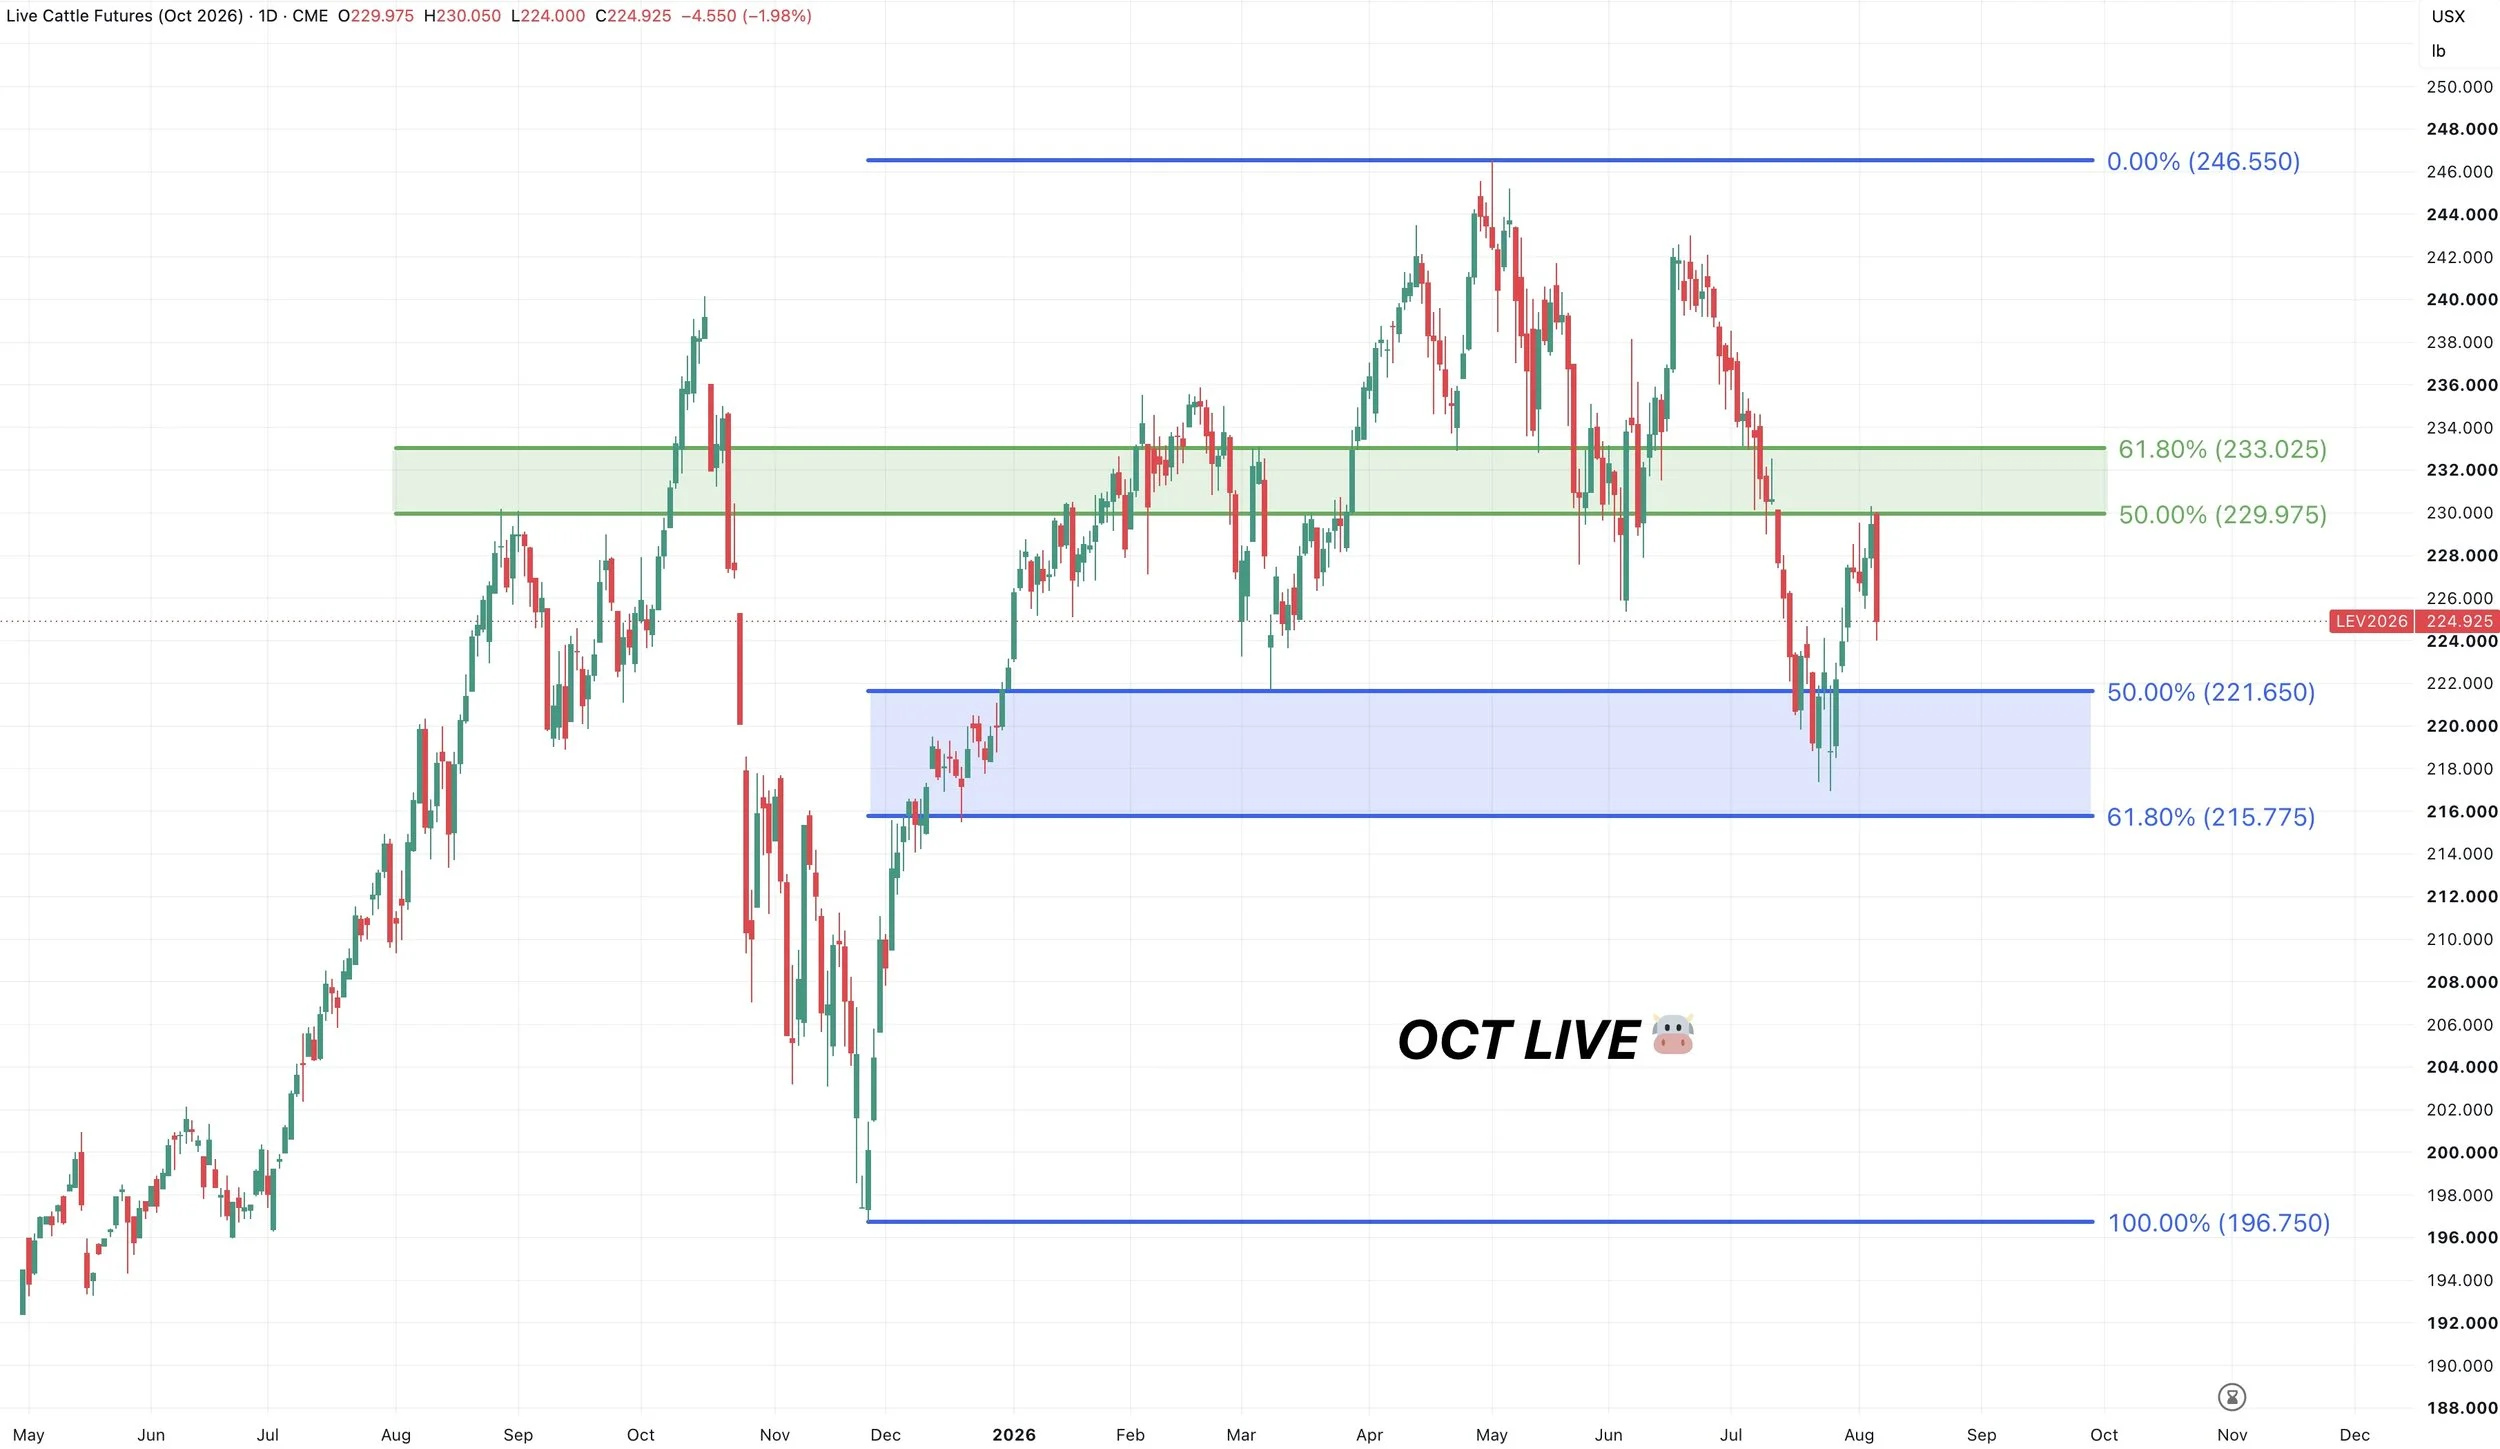
Oct Live Chart:
Nasty day in cattle.
Live cattle clawed back exactly 50% of the sell off before rejecting.
Between there and the 61.8% level is going to be a common area to fail if this is simply just a relief bounce.
So that's still the area to defend like we've been mentioning.
To the downside, still need to hold those recent lows or it could open the door a lot lower.
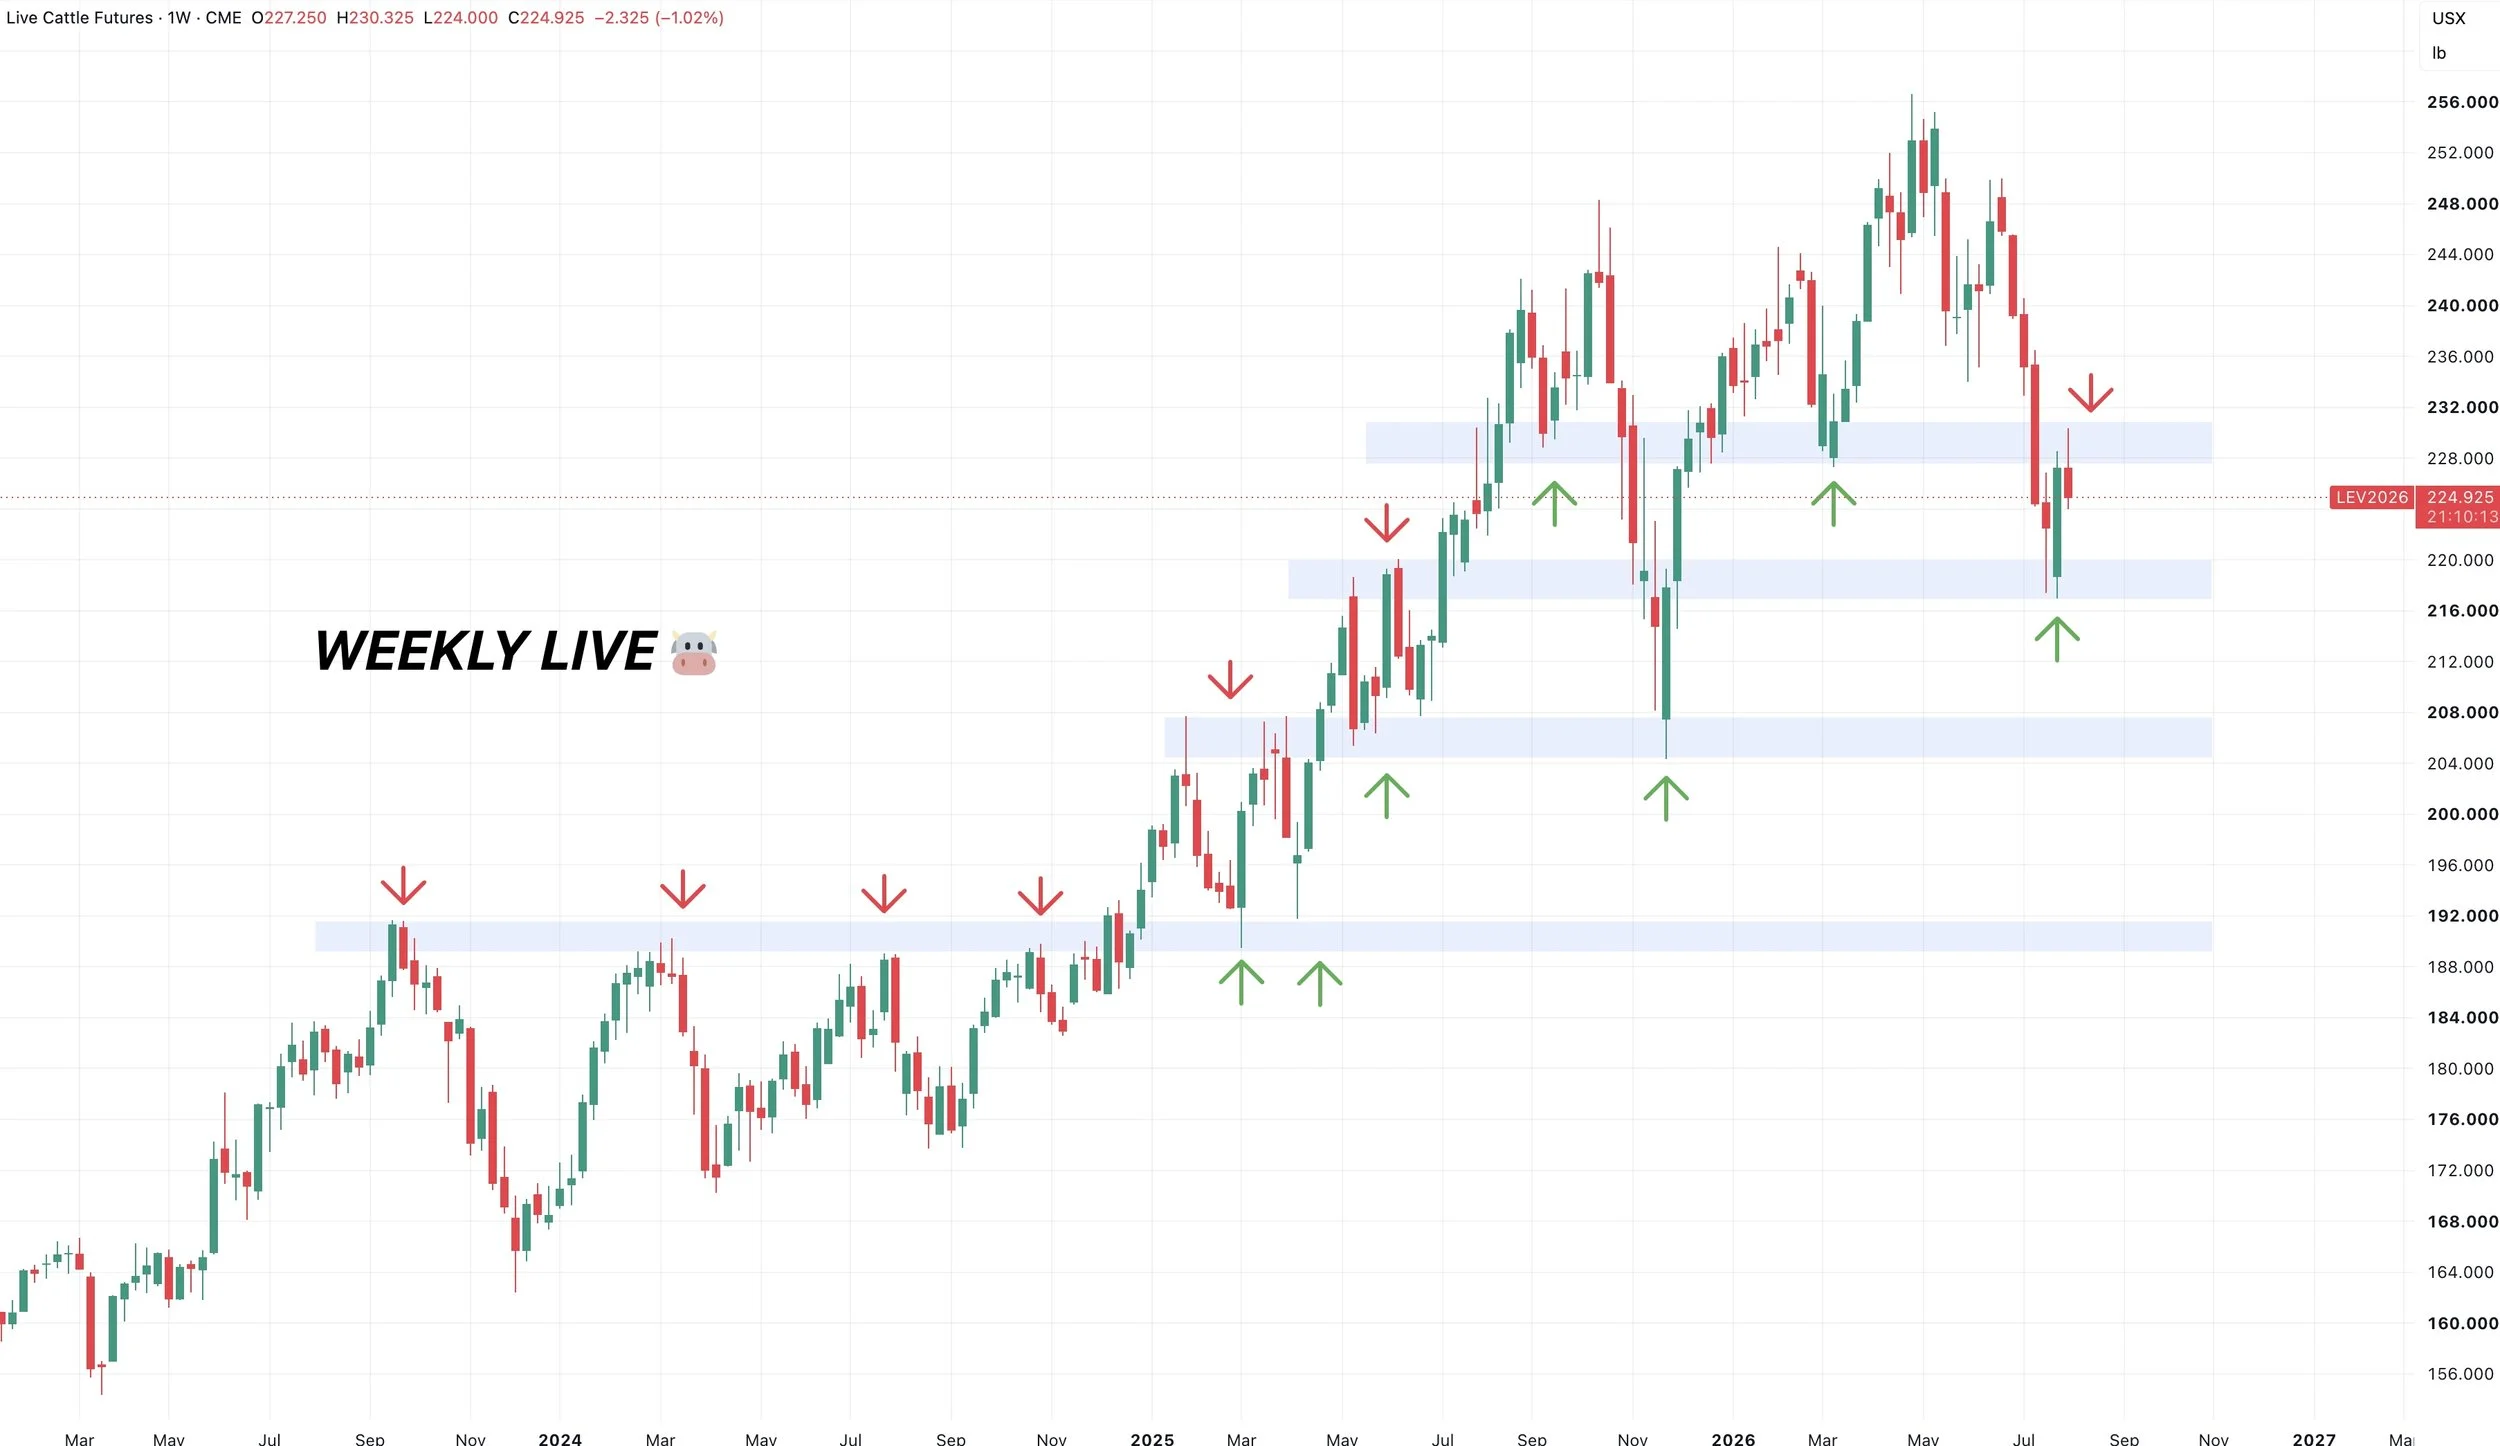
Weekly Chart:
This chart respects support and resistance levels constantly. Always turning prior support into new resistance (and vice versa).
Right now we are rejecting off those highs lows from March.
If we break the recent lows, it could very easily open up further downside towards those lows from last November.
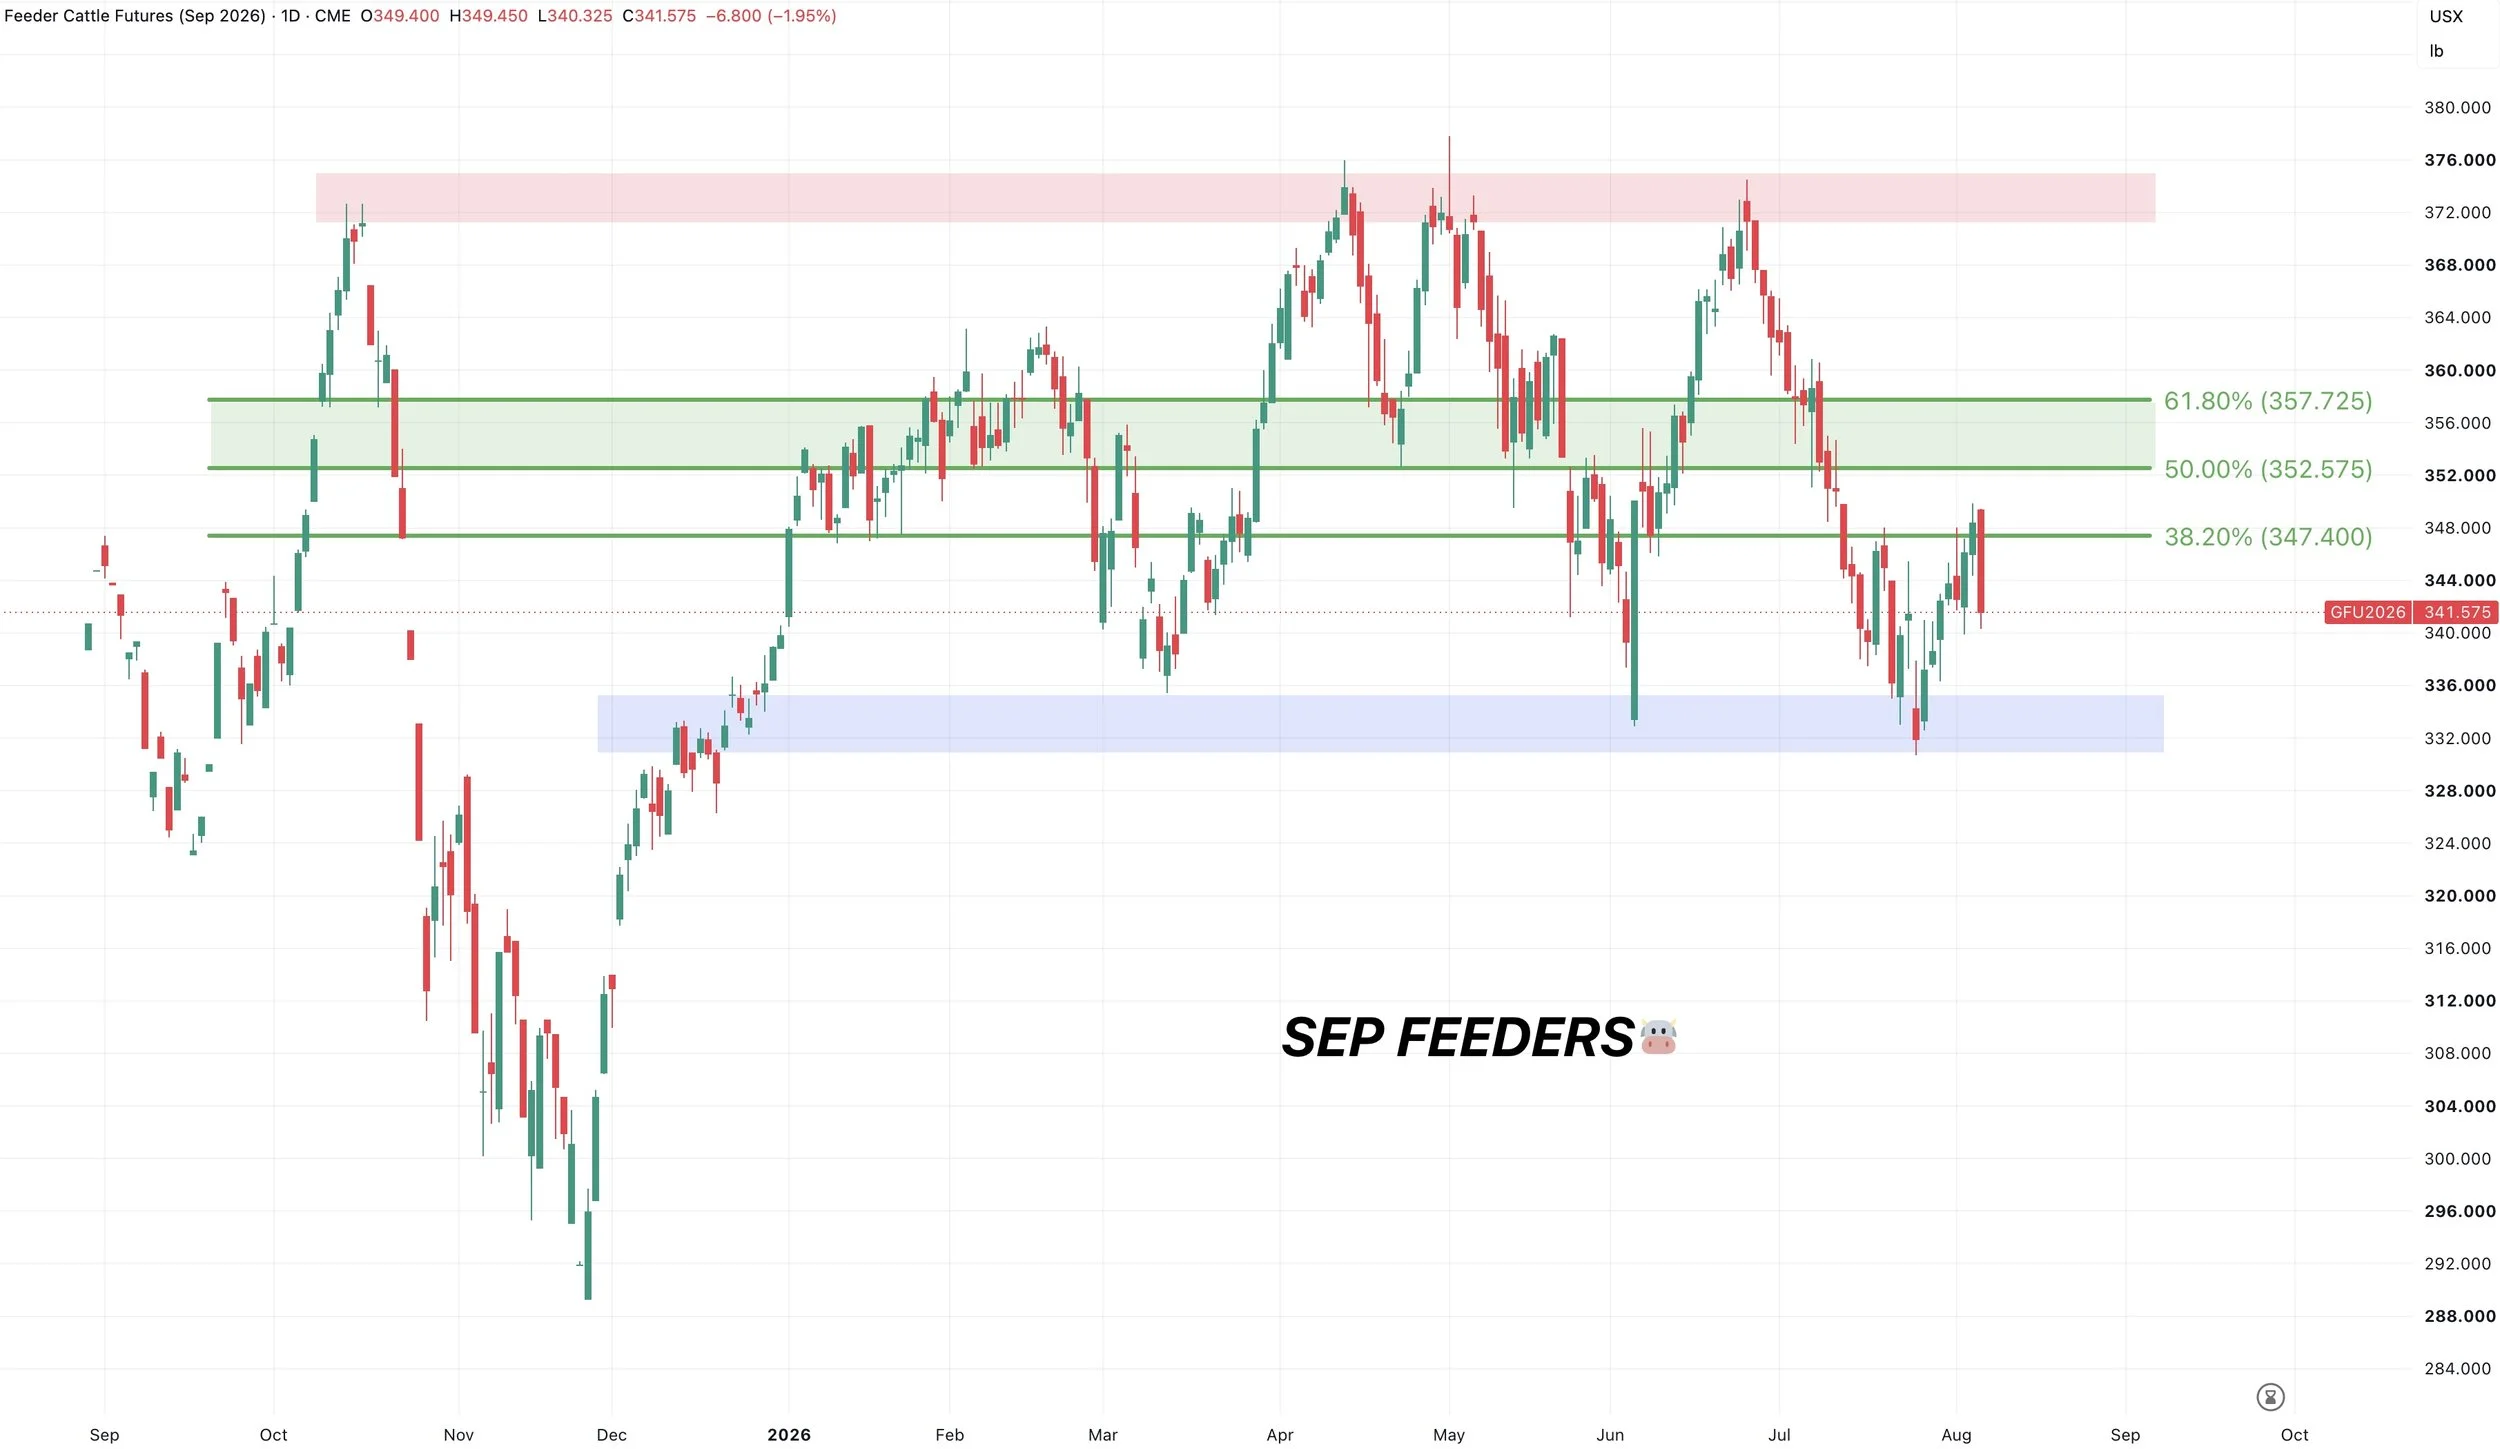
Sep Feeders Chart:
We did not quiet make it into the golden zone like we did in live cattle.
If we get up there, that's still an area to protect and an area we'd expect us to potentially struggle.
Overall just want to continue to see us hold this key support level and those recent lows.
If we fail to do that, there is a ton of air to the downside.
Want to Talk?
Our phones are open 24/7 for you guys if you ever need anything or want to discuss your operation.
Jeremey & Office: (806)484-1214
Sebastian: (605)280-1186
Email: sfrost@dailymarketminute.com
Hedge Account
Interested in a hedge account? Use the link below to set up an account or give us a call.