
CROP RATINGS MATTER? KEY LEVELS ON CHARTS
MARKET UPDATE
You can scroll to read the usual update as well. As the written version is the exact same as the video.
Timestamps for video:
Overview: 0:00min
Crop Ratings: 1:15min
USDA: 4:30min
Corn: 6:20min
Corn Charts: 9:30min
Beans: 10:45min
Bean Charts: 13:10min
Wheat: 15:35min
Cattle: 16:30min
Want to talk?
Office: (806)484-1214
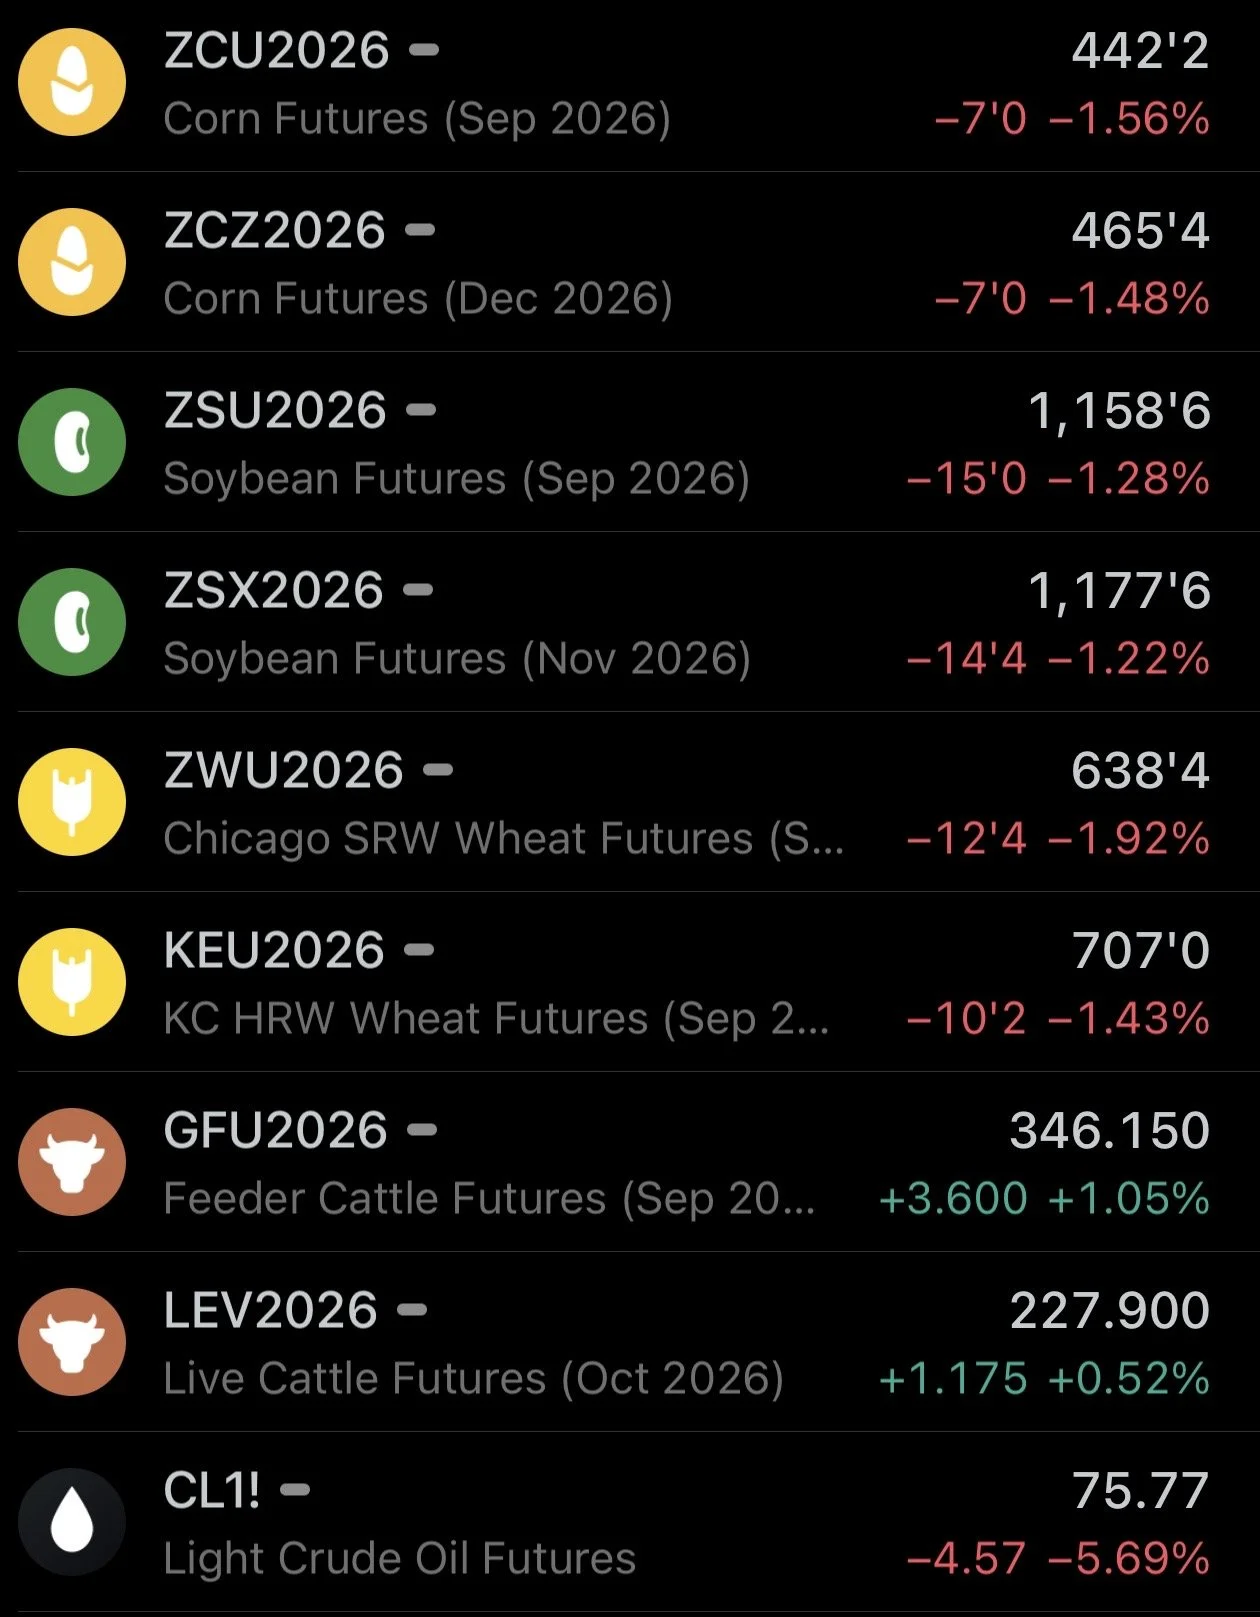
Futures Prices Close
Overview
Grains down hard across the board following yesterday's impressive price action.
Why the weakness?
We have a few headlines hitting the market.
The first is the Iran war.
Bessent says there "may be a deal Tuesday or Wednesday to open the Strait of Hormuz with freedom of movement".
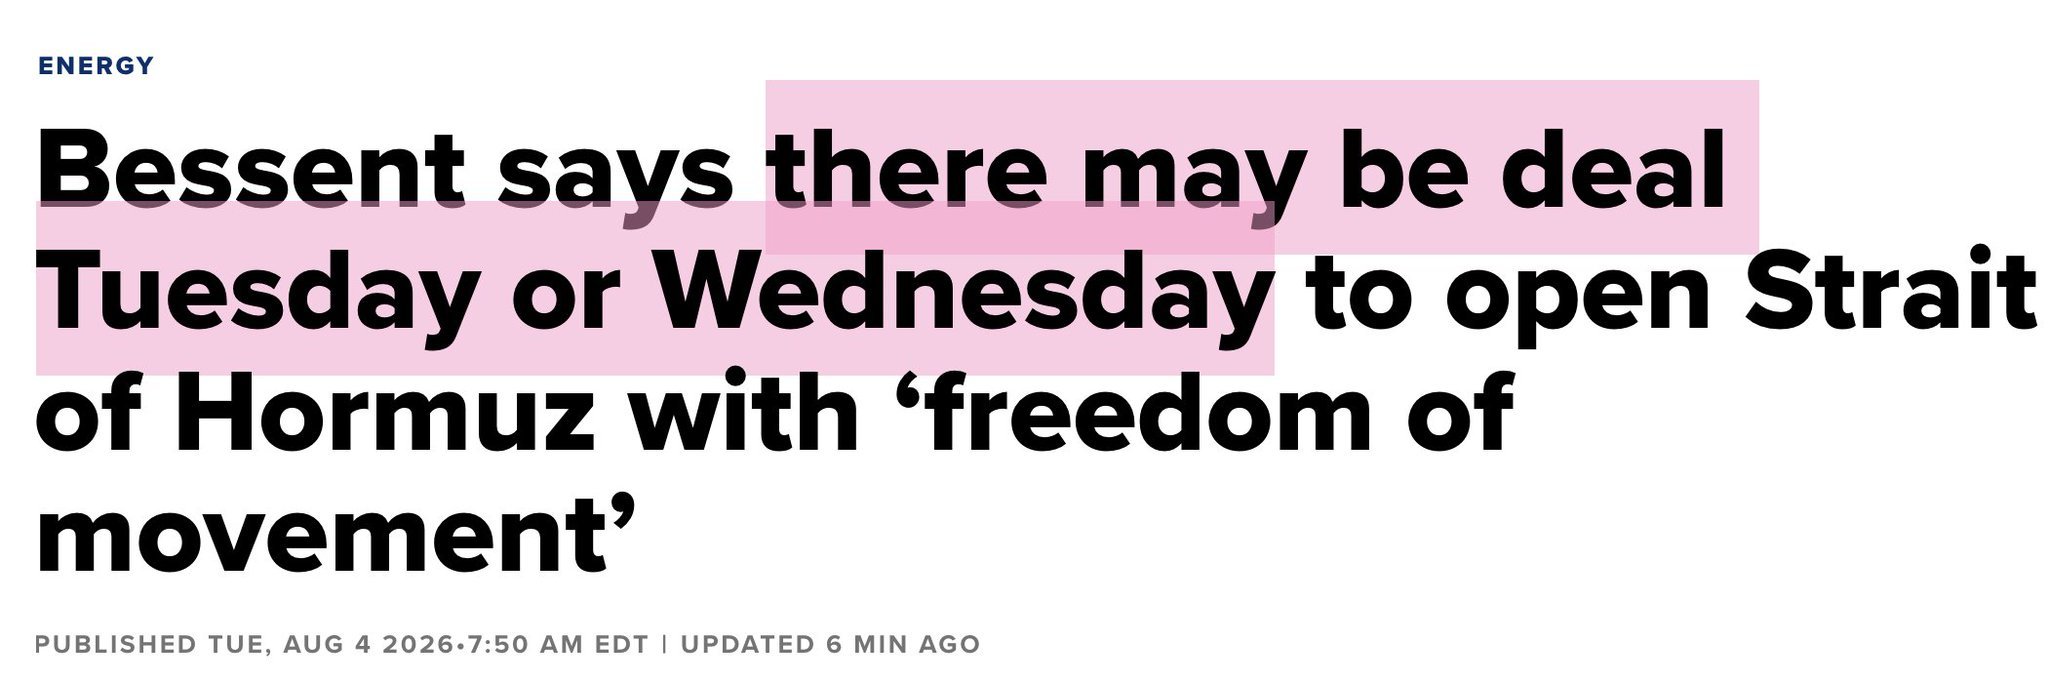
So that added some pressure. With crude oil down another -6% and soybean oil tagging along for the ride.
Crude oil is now $18 and nearly -20% off the recent highs after clawing back exactly 50% of the entire sell off.
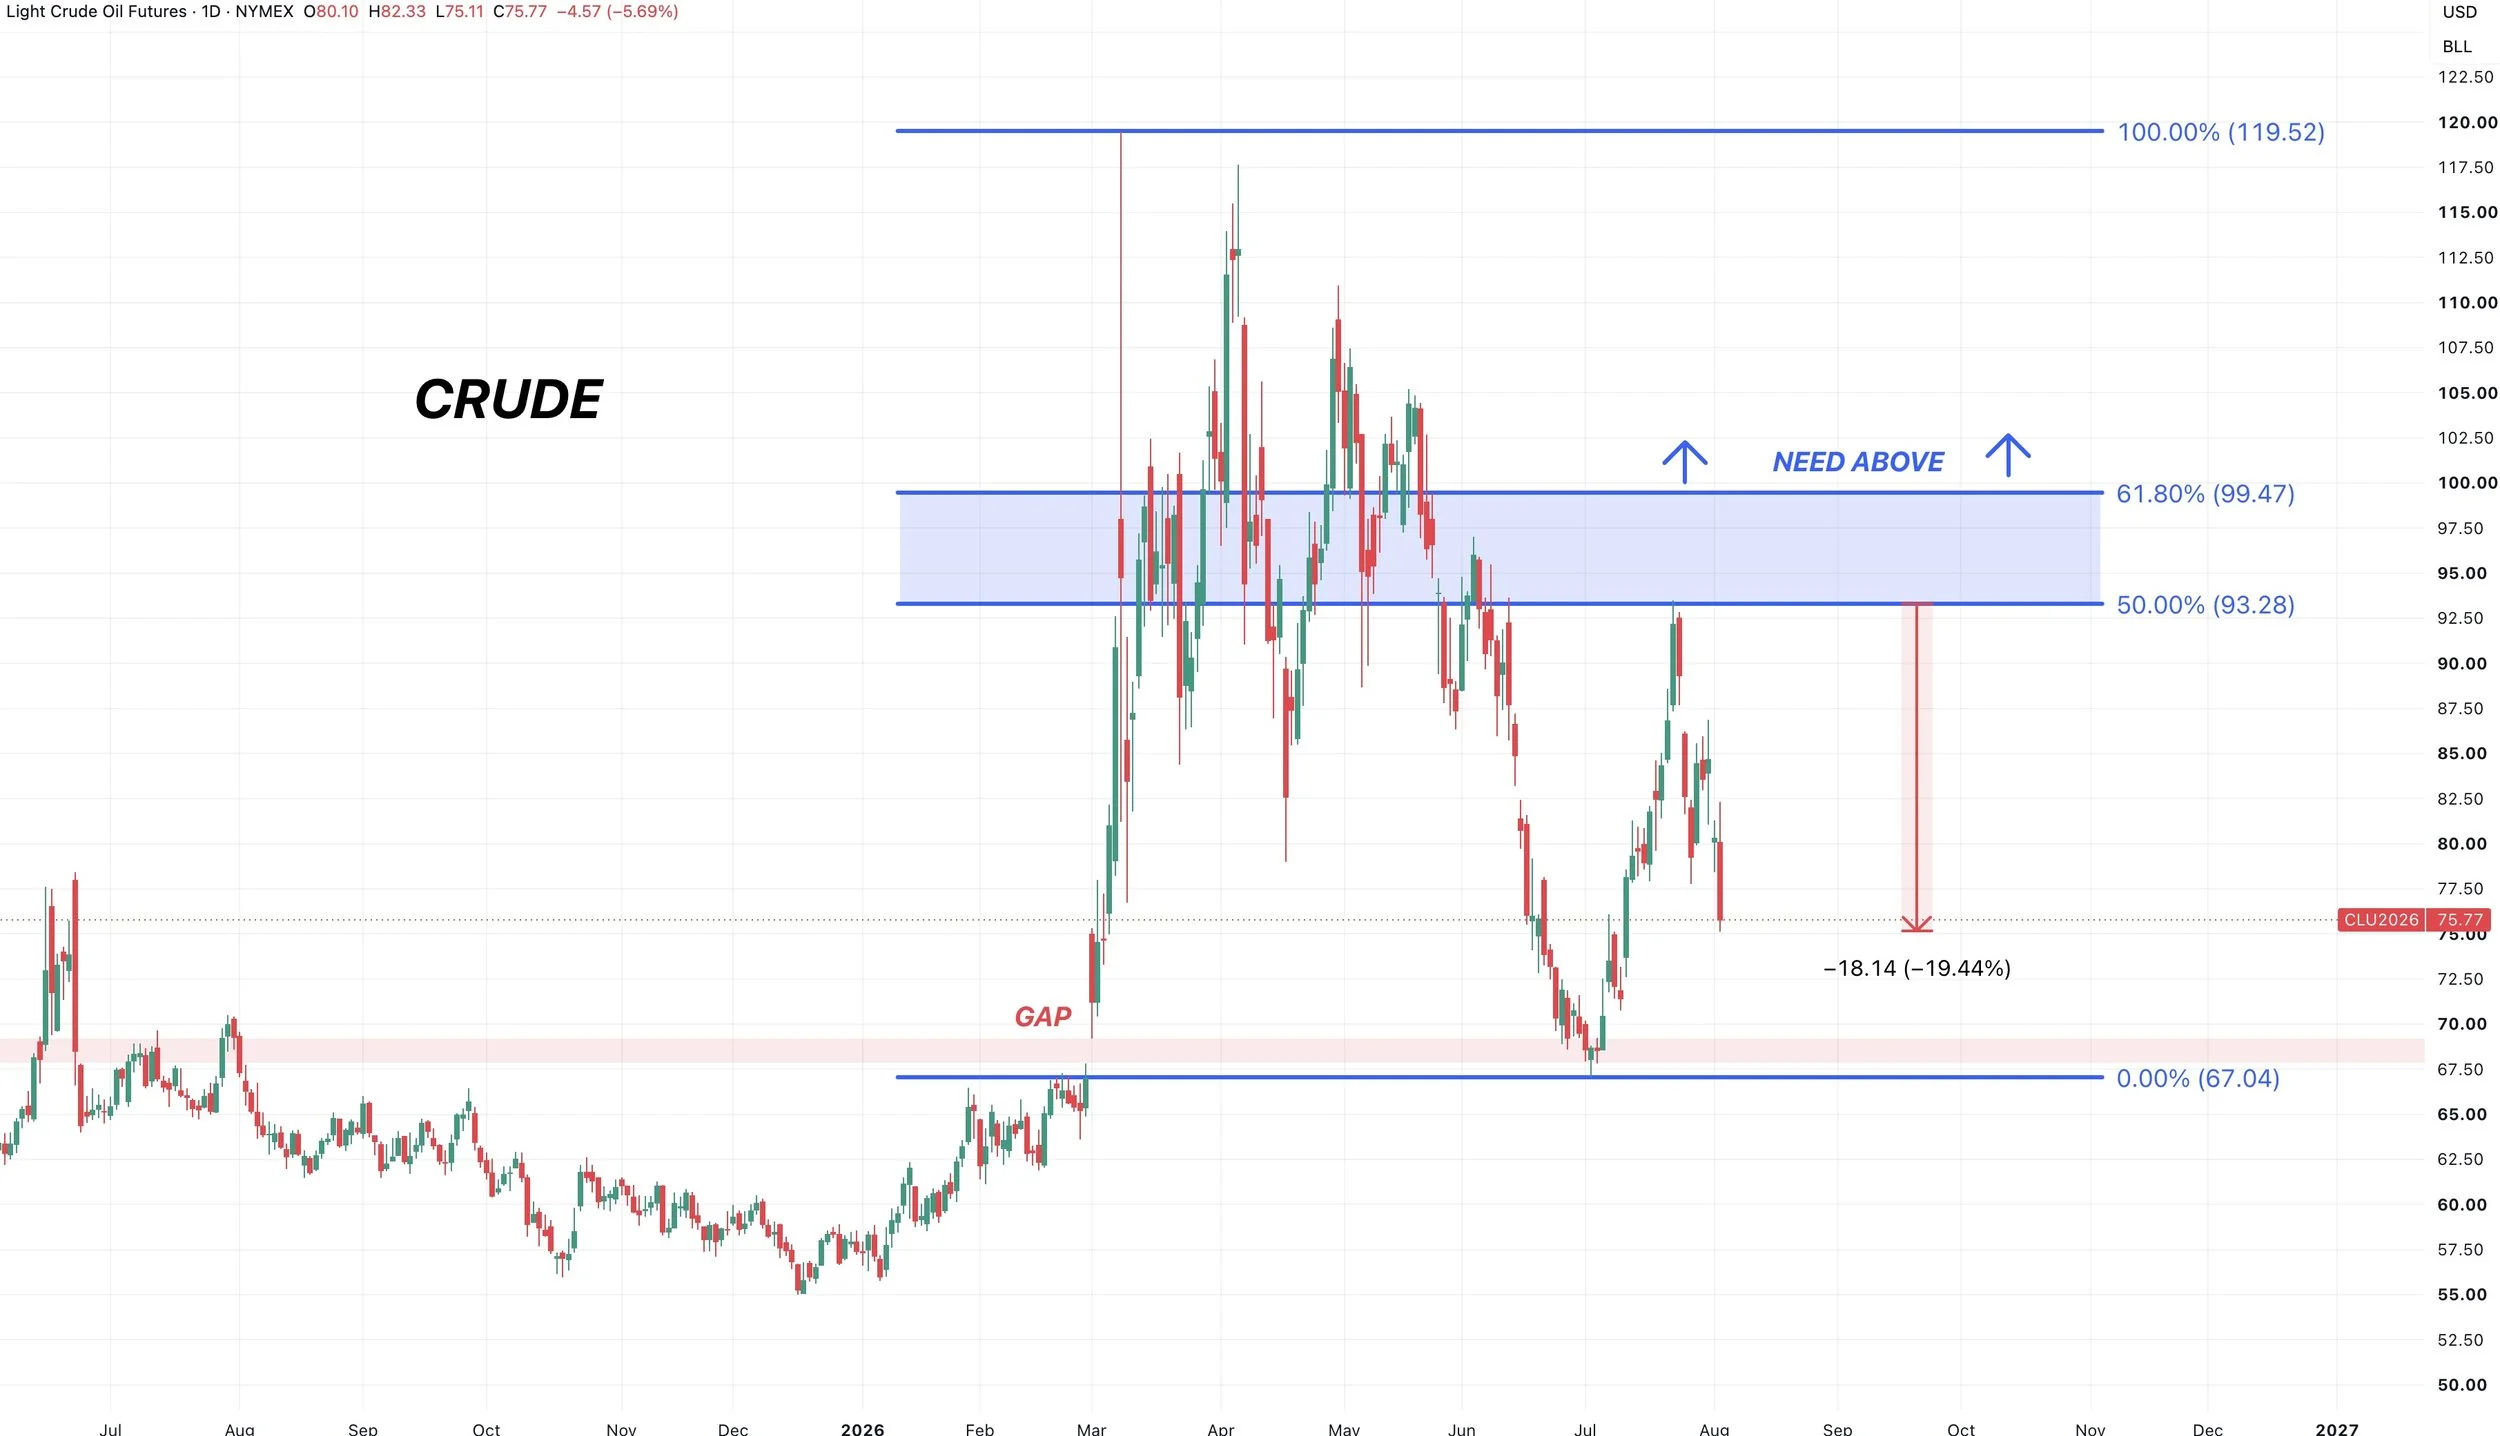
Crude was down big yesterday, but the grains were strong.
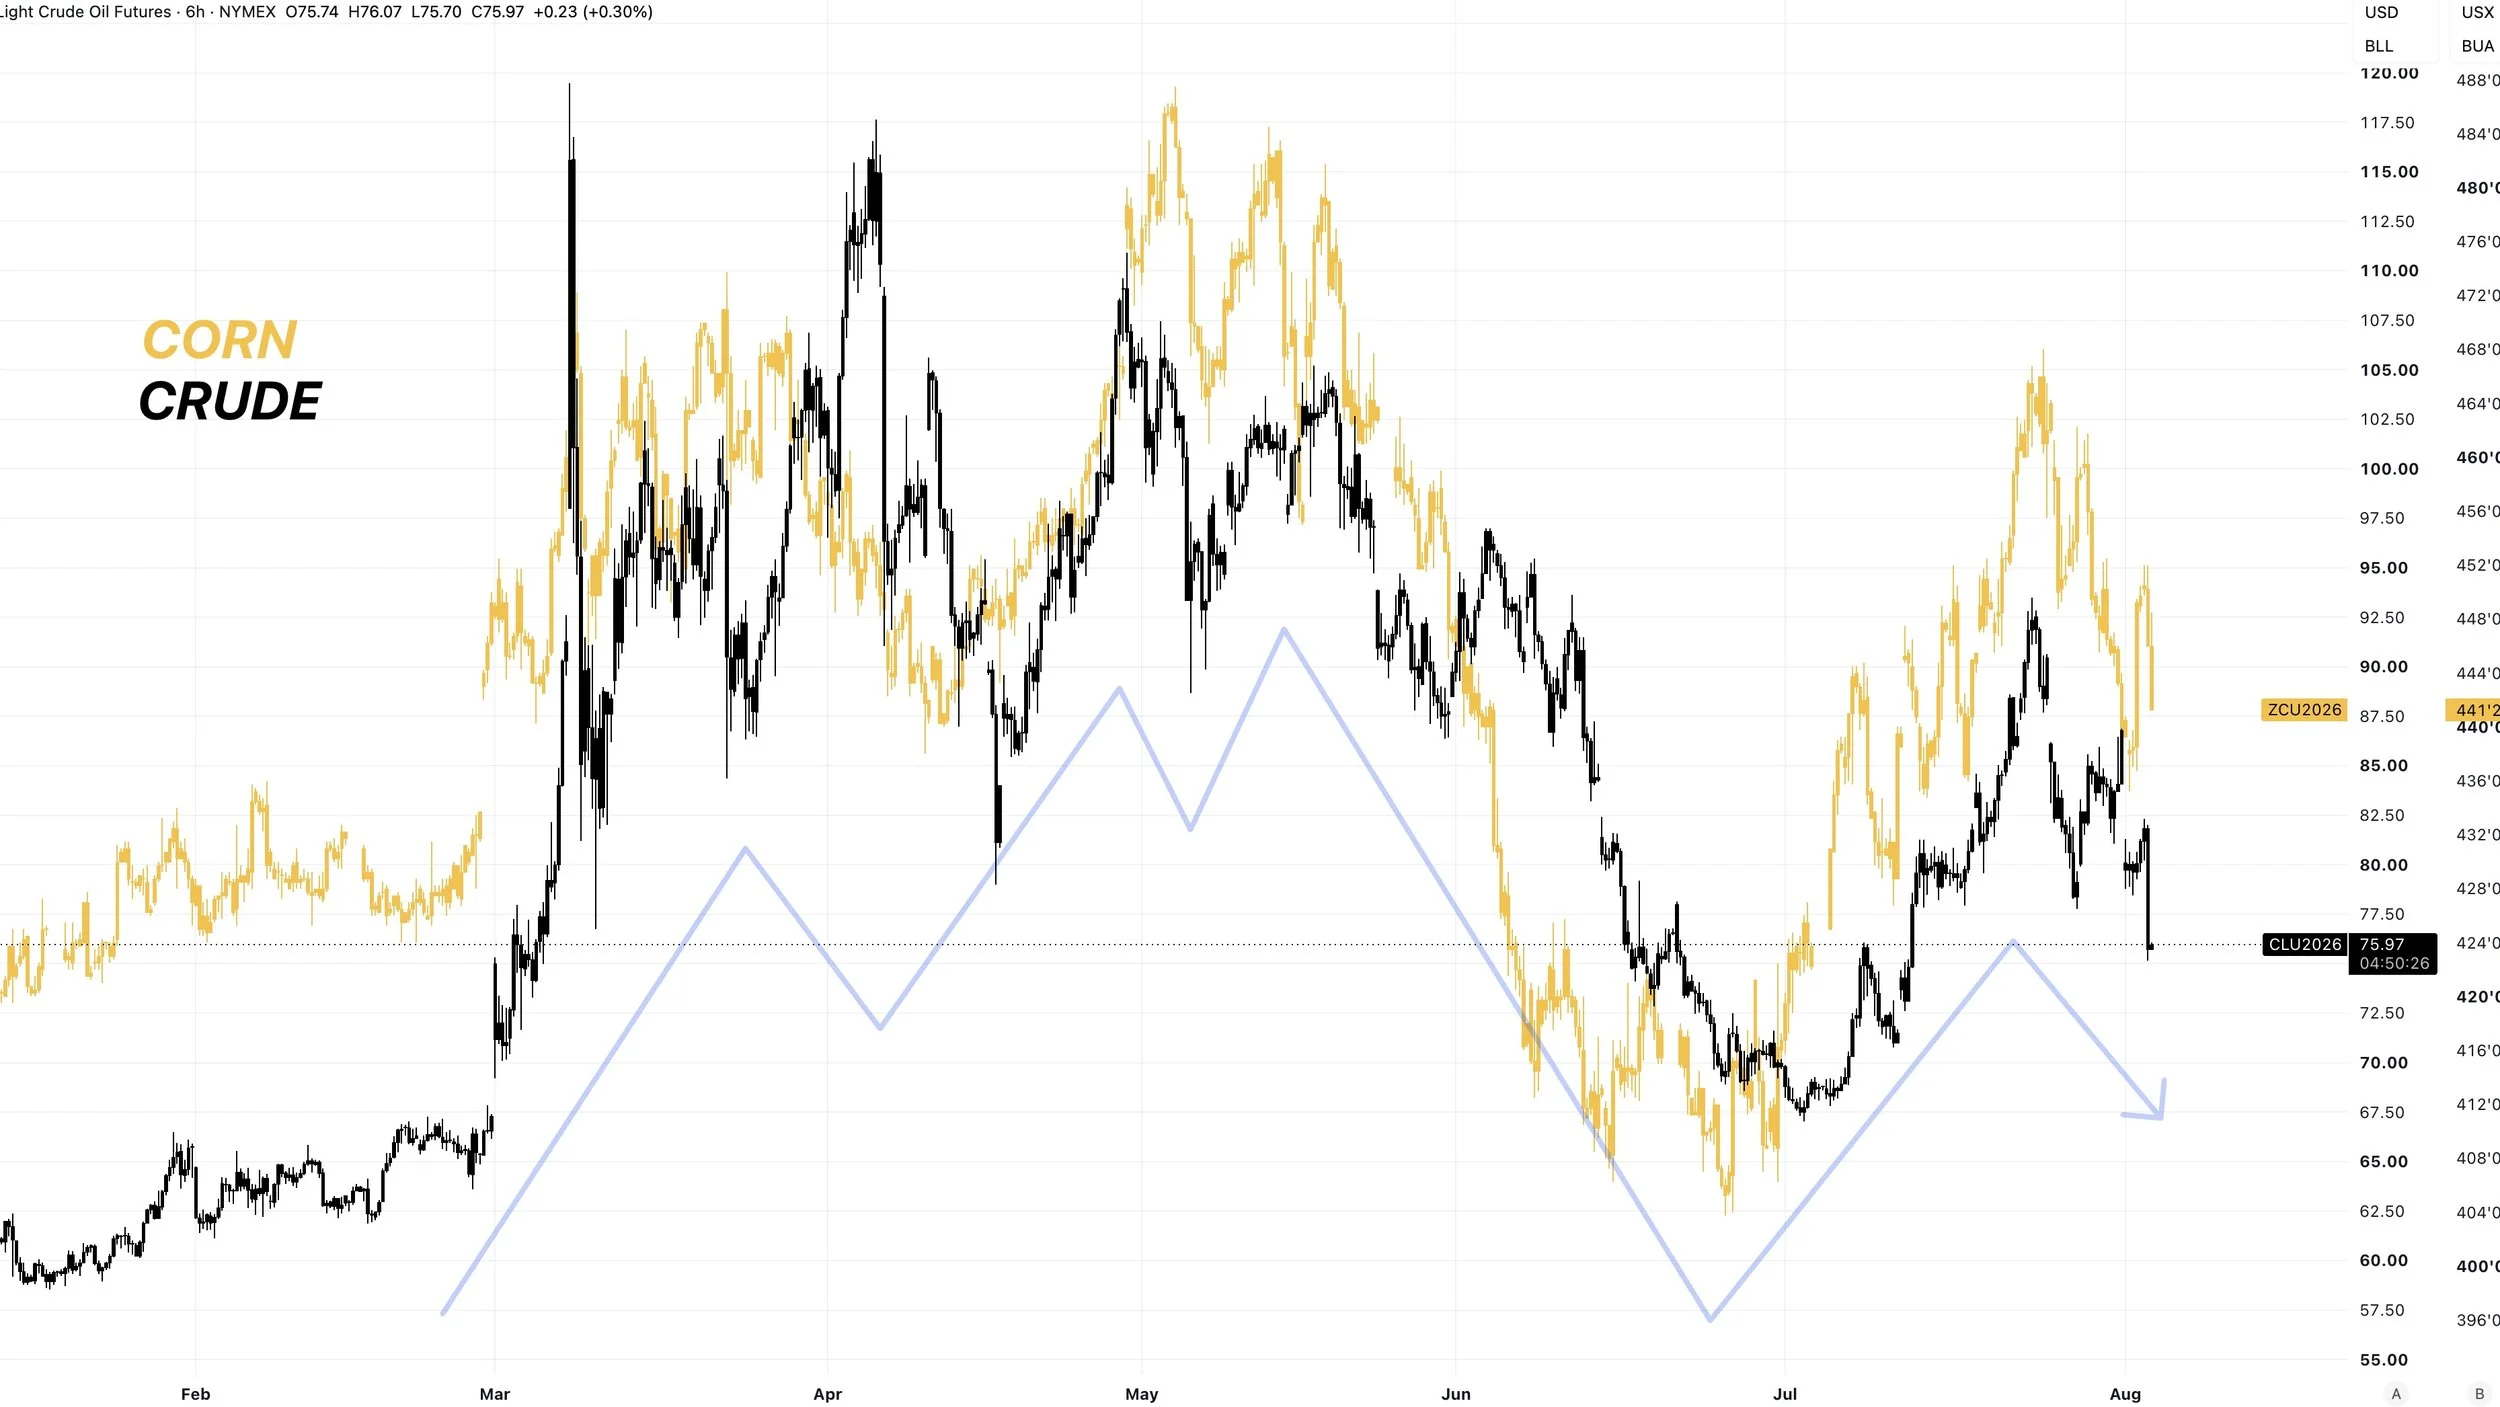
The crude vs grains relationship isn’t always going to be a day to day perfect correlation.
But if you zoom out, corn and crude's overall structure and moves have lined up very closely all year long.
Lower crude isn’t helpful, and higher crude isn’t bearish.
Then we have the weather.
Weather isn’t going to be majorly impactful to the corn market given it's already August, but is still going to be a big deal for soybeans.
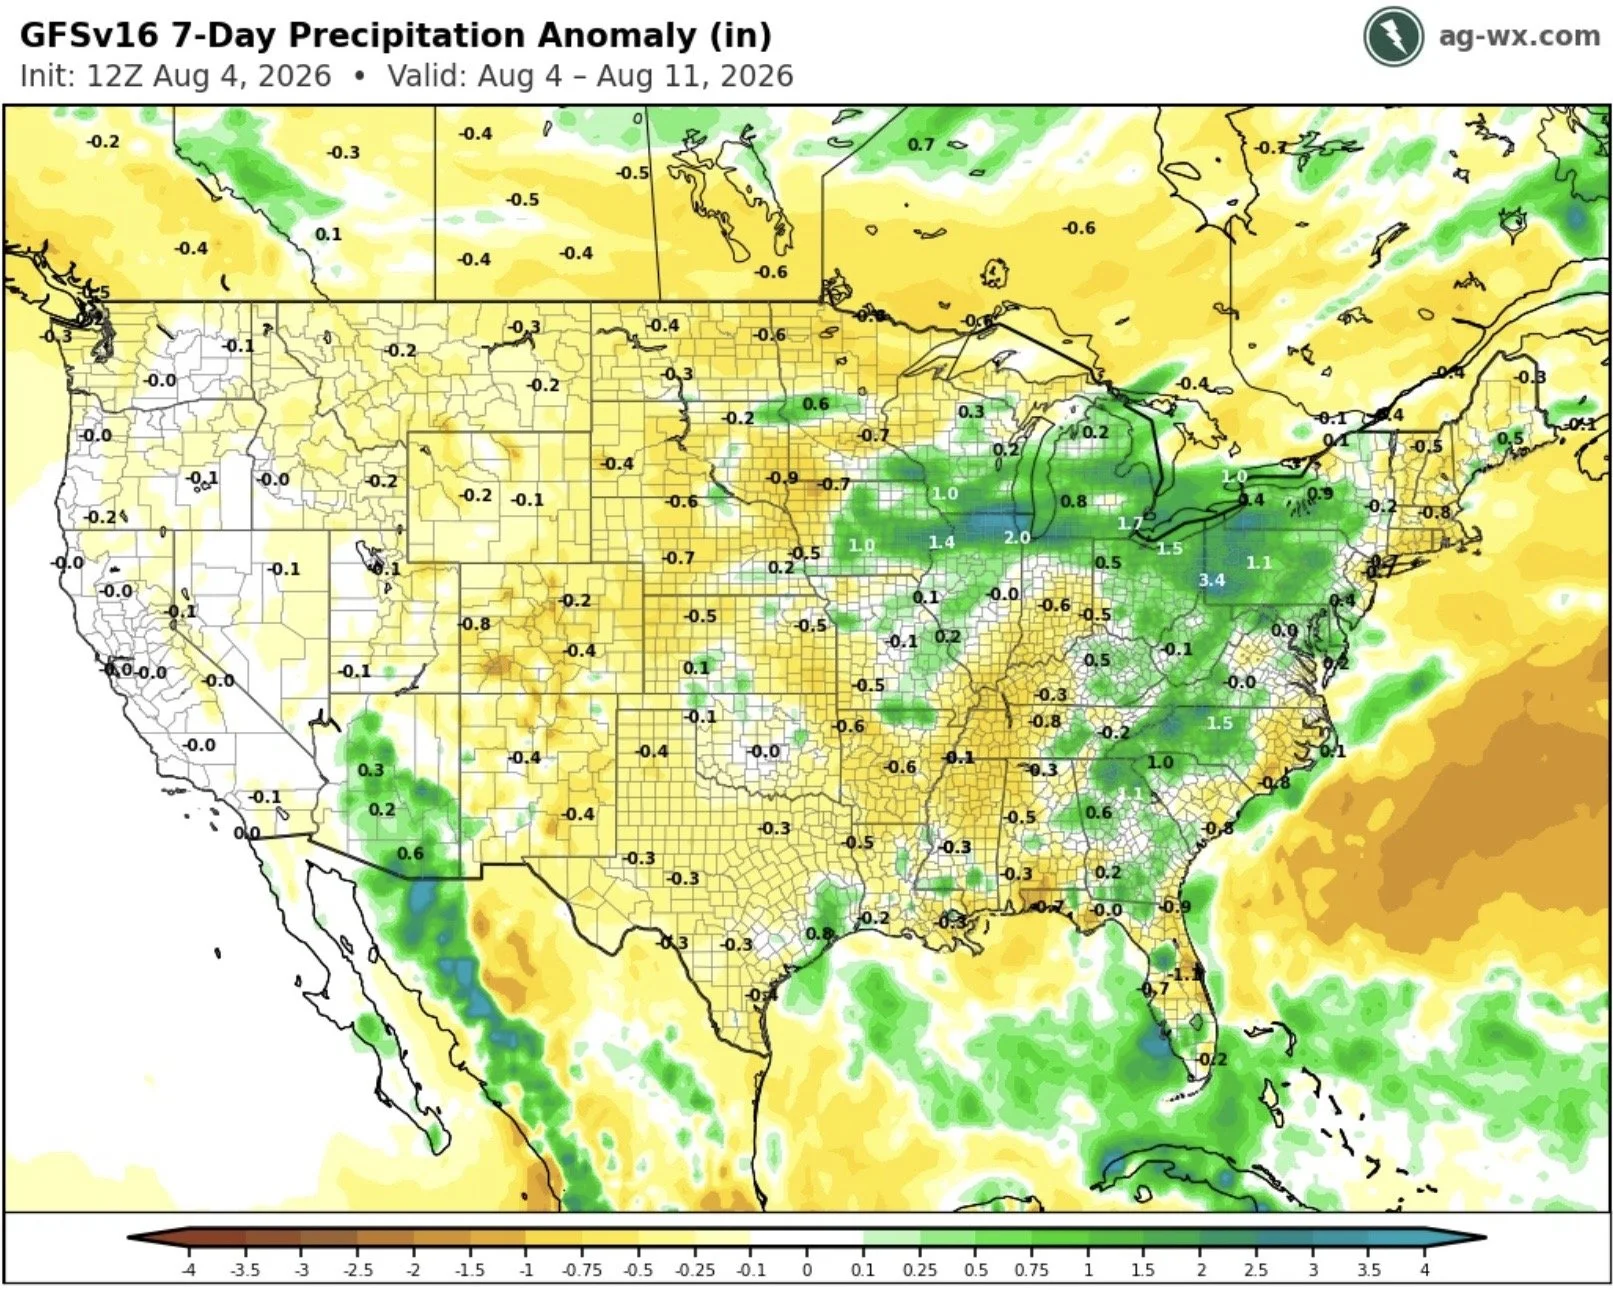
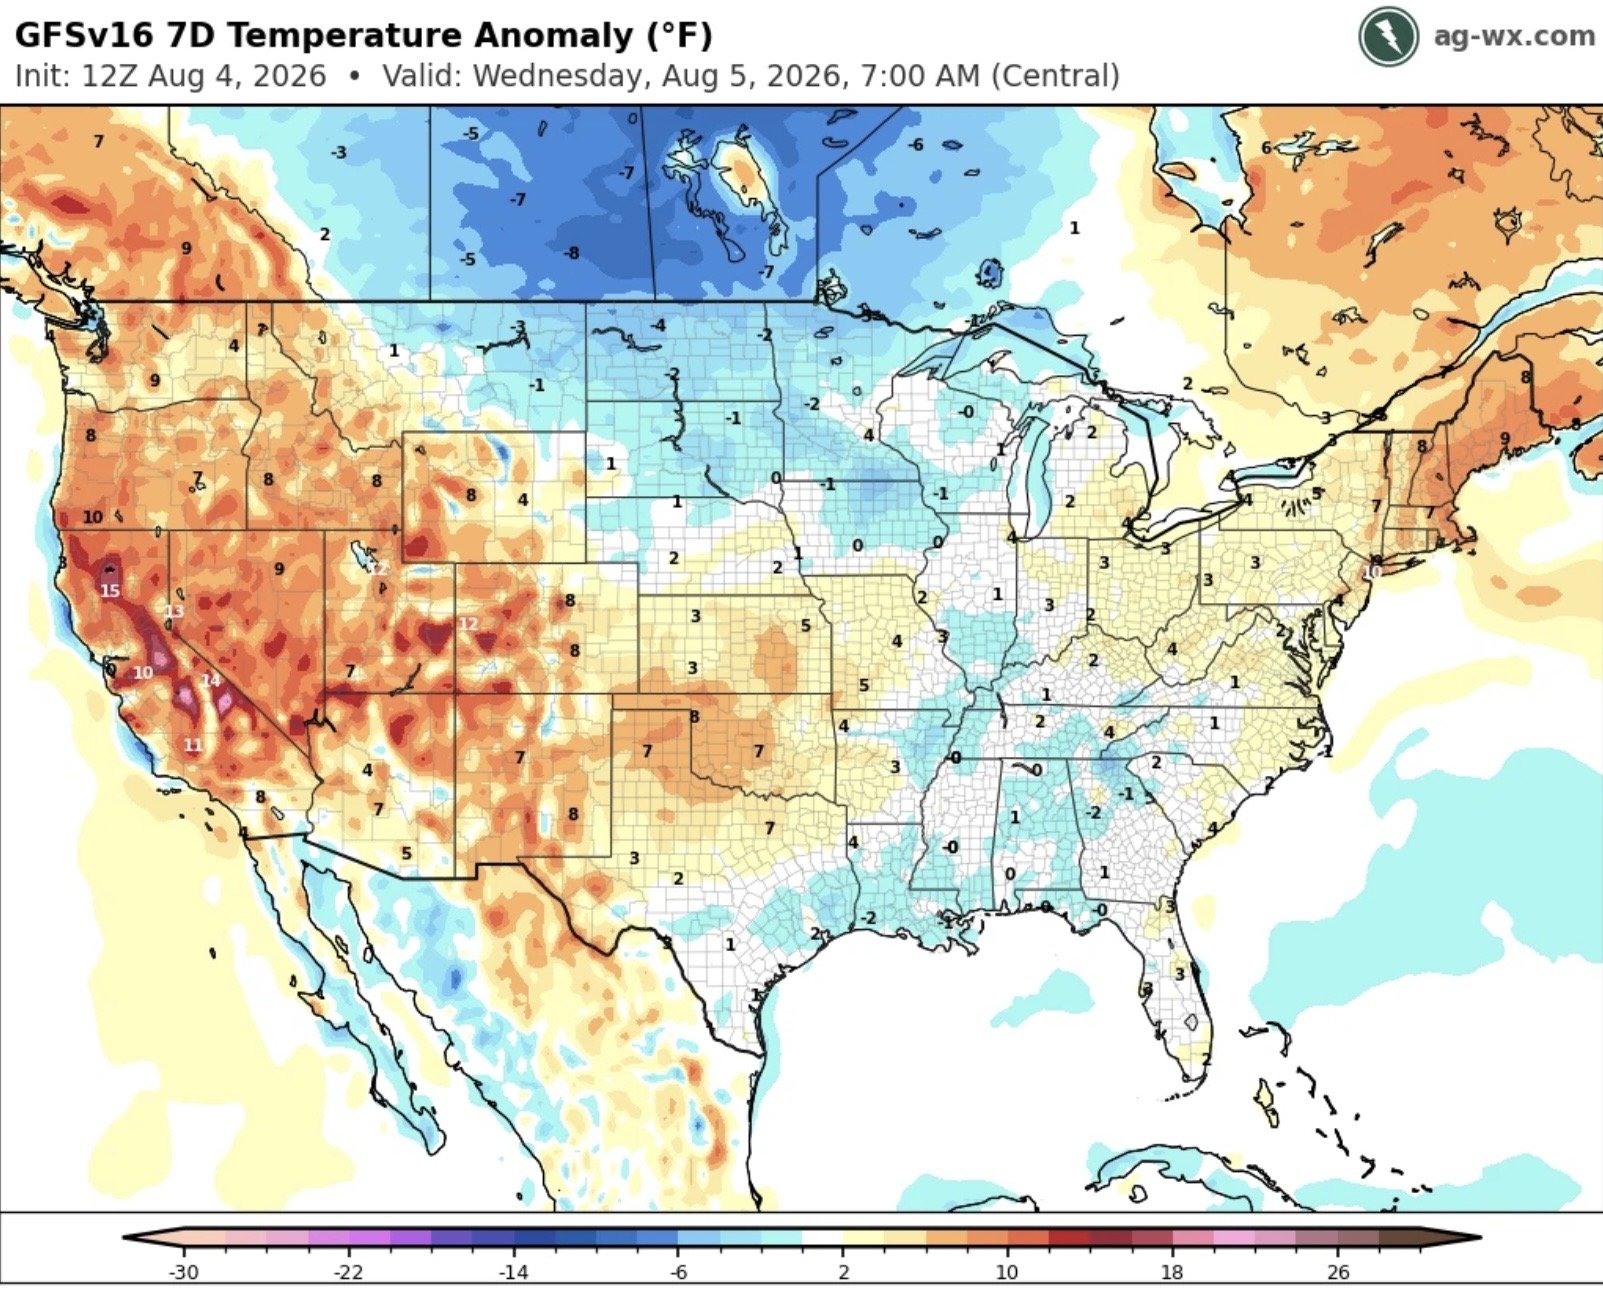
Currently the forecasts do not appear all that threatening for at least the next week.
With some rain, and looking like it's going to be on the cool side for a few weeks.
Below is the outlook for the next week.
Crop Ratings
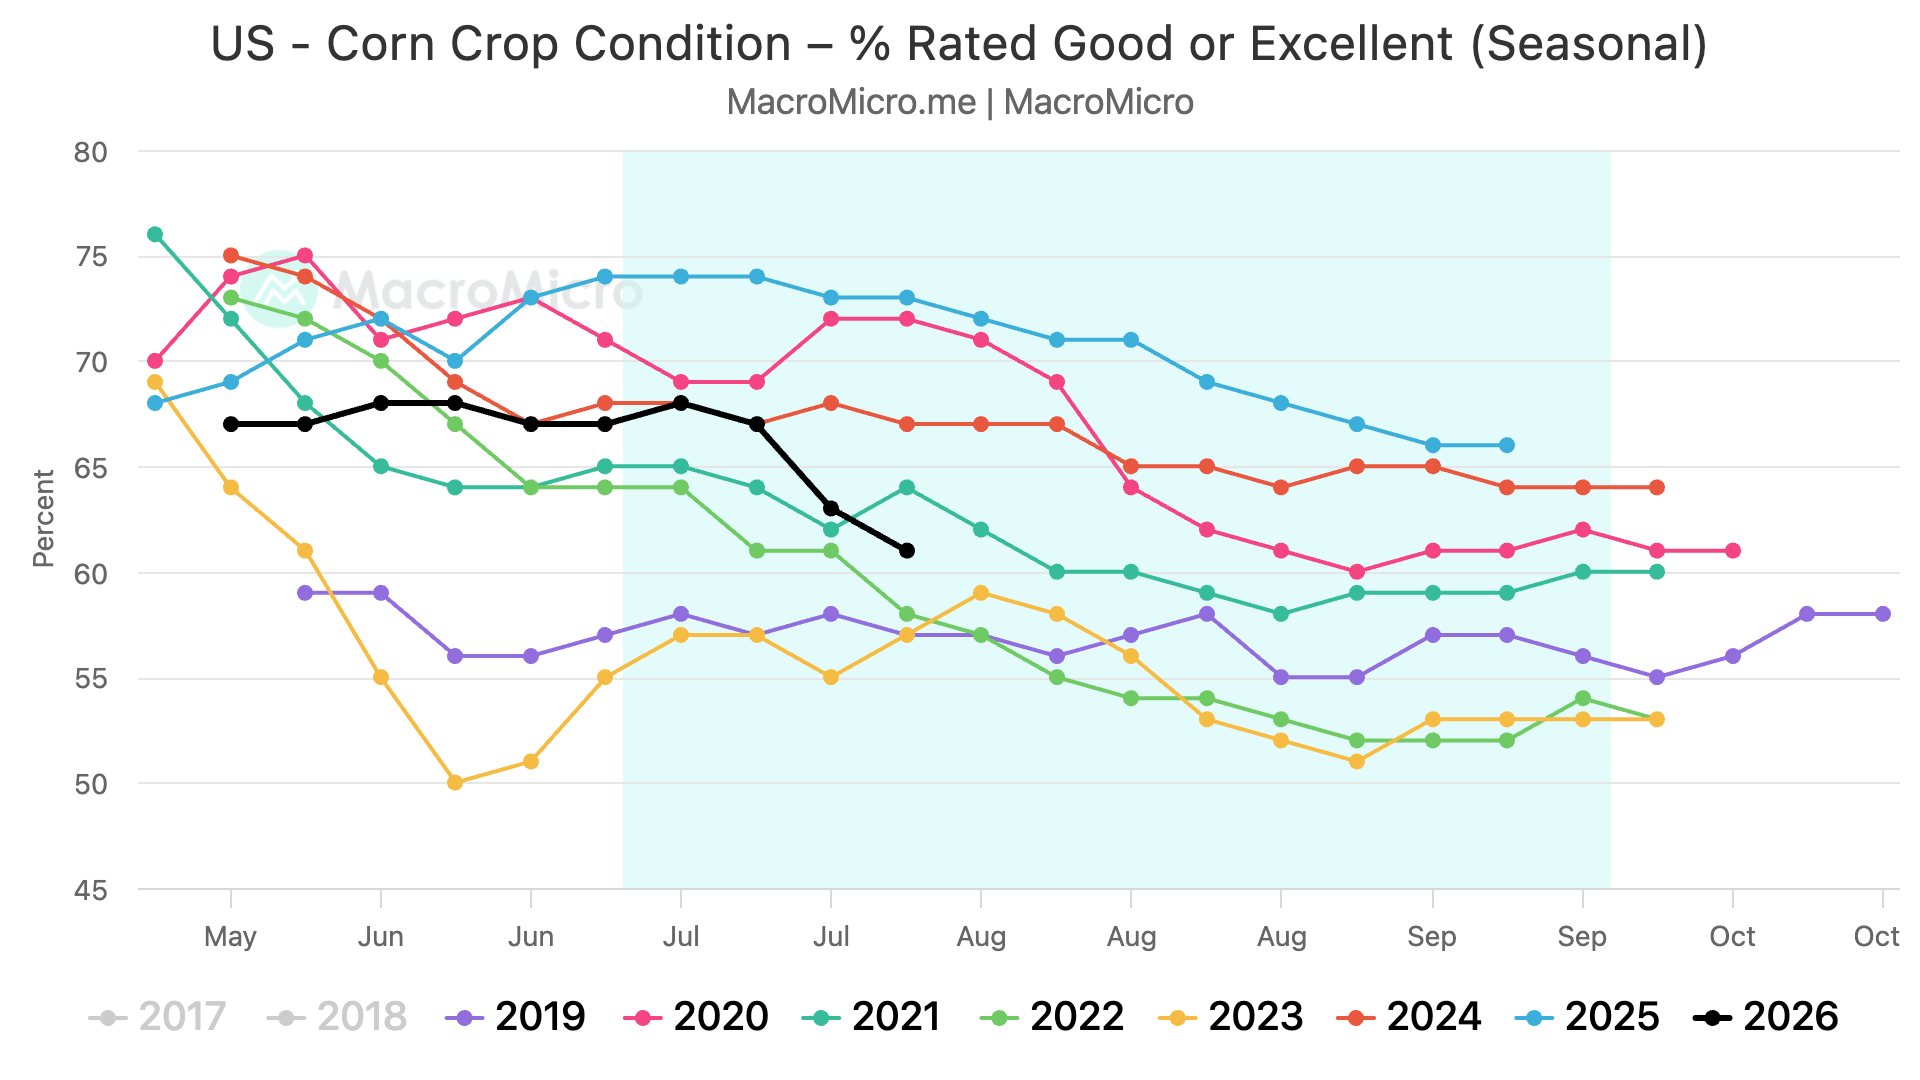
We had crop conditions out yesterday.
Corn dropped another -2% while soybeans remained unchanged.
Corn
Today: 61%
Last Week: 63%
Last Year: 73%
5-Year Avg: 64%
Soybeans
Today: 63%
Last Week: 63%
Last Year: 69%
5-Year Avg: 62%
So both are well below last year but about on par with the average.
Both of these are the lowest since 2023.

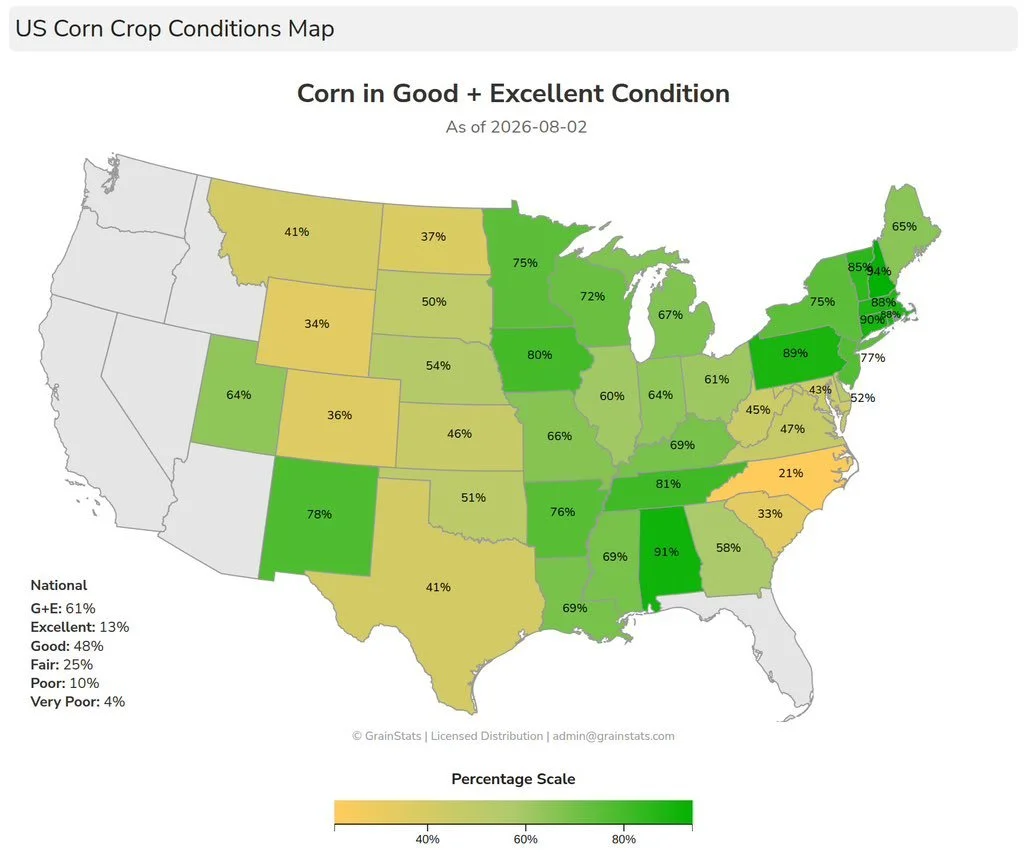
Here is a map that showcases the corn ratings from GrainStats.
The crops in the central to eastern belt are not too bad.
I mean you have Iowa sitting at 80% G/E.
The issues are clearly out west.
How Are Ratings vs Last Year?
But how do these ratings actually stack up vs last year?
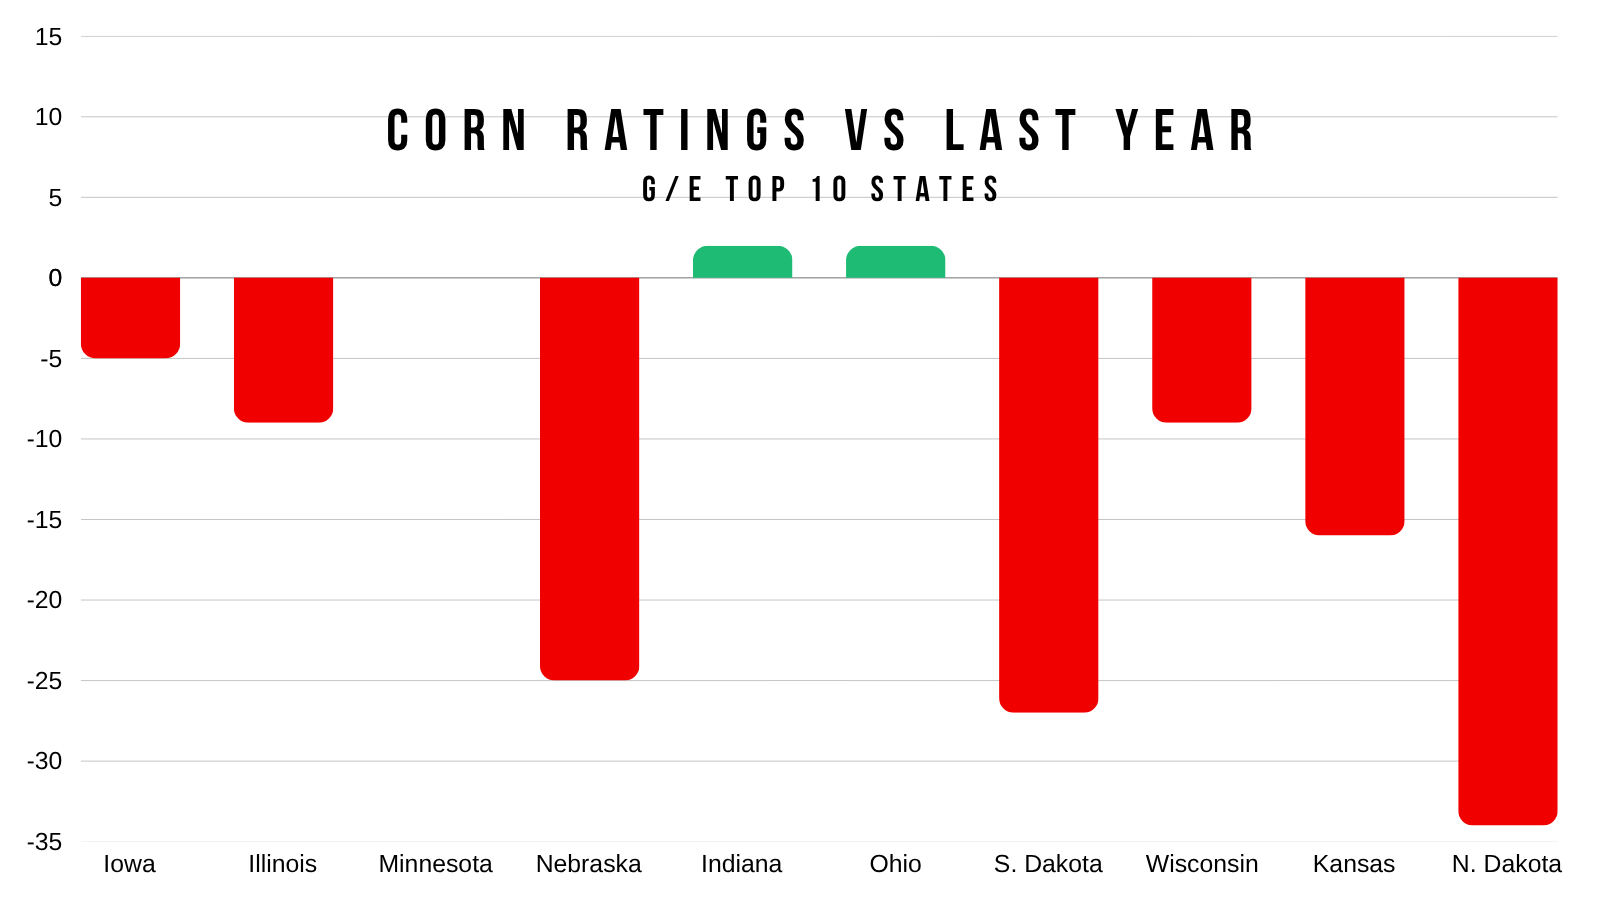
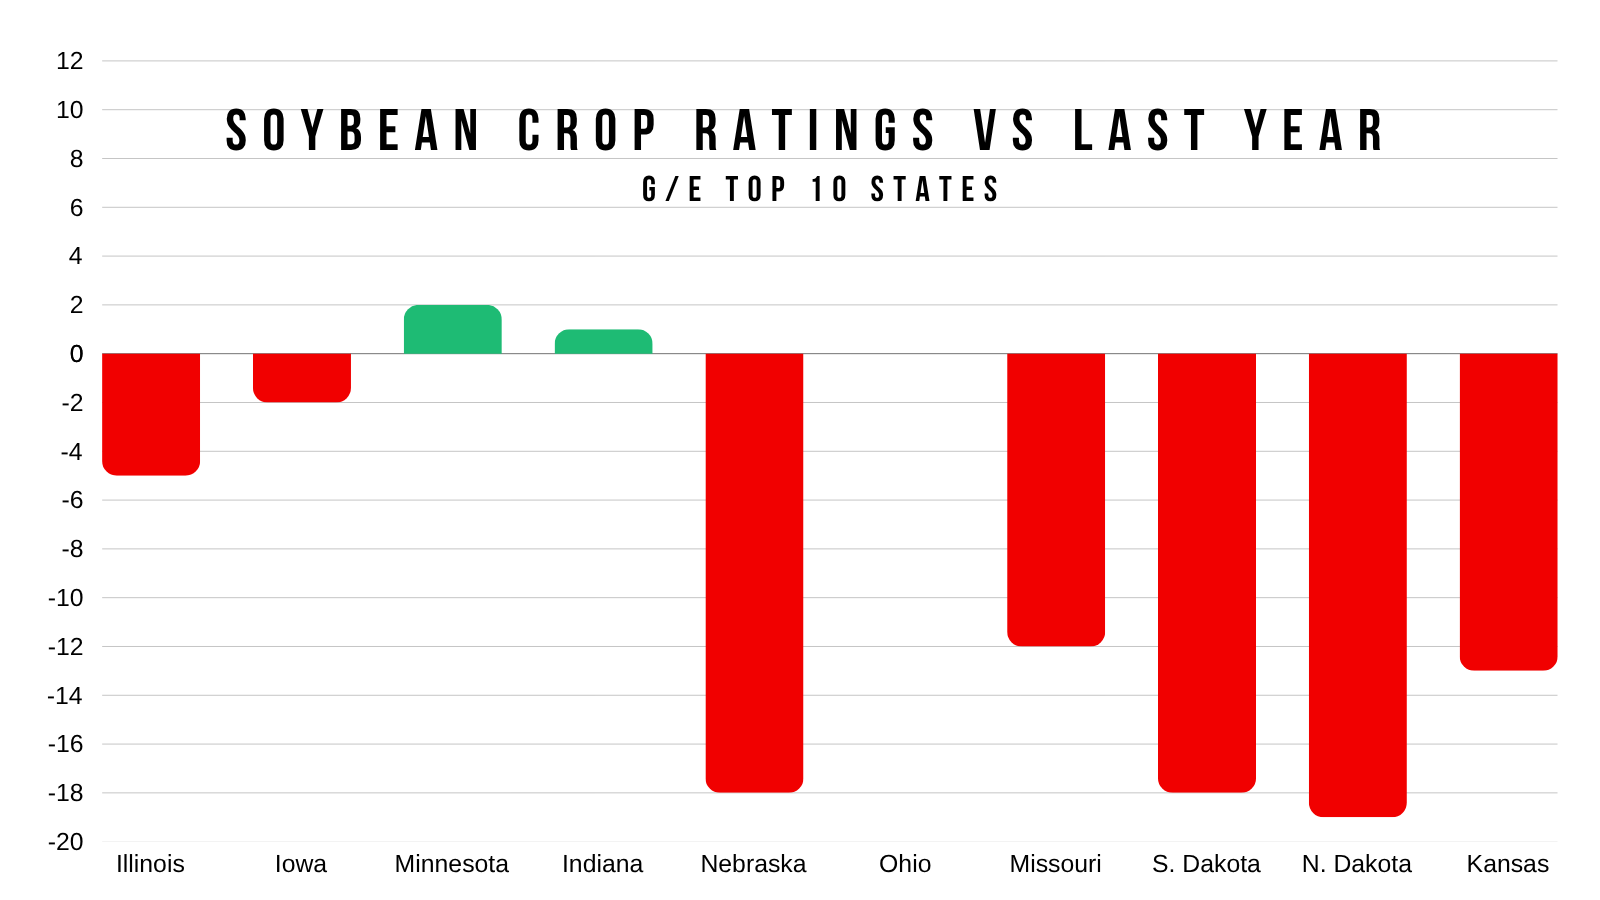
If we look at the top 10 states for both corn and soybeans.
Only 2 of the top 10 are rated better than they were last year for both.
For corn only Indiana and Ohio are better, while Minnesota is the same.
For soybeans, only Minnesota and Indiana are better, while Ohio is the same.
So purely based on crop ratings, you would assume the crops aren’t on par with last year.
Do Crop Conditions Matter?
Crop ratings are not some perfect indication of yield.
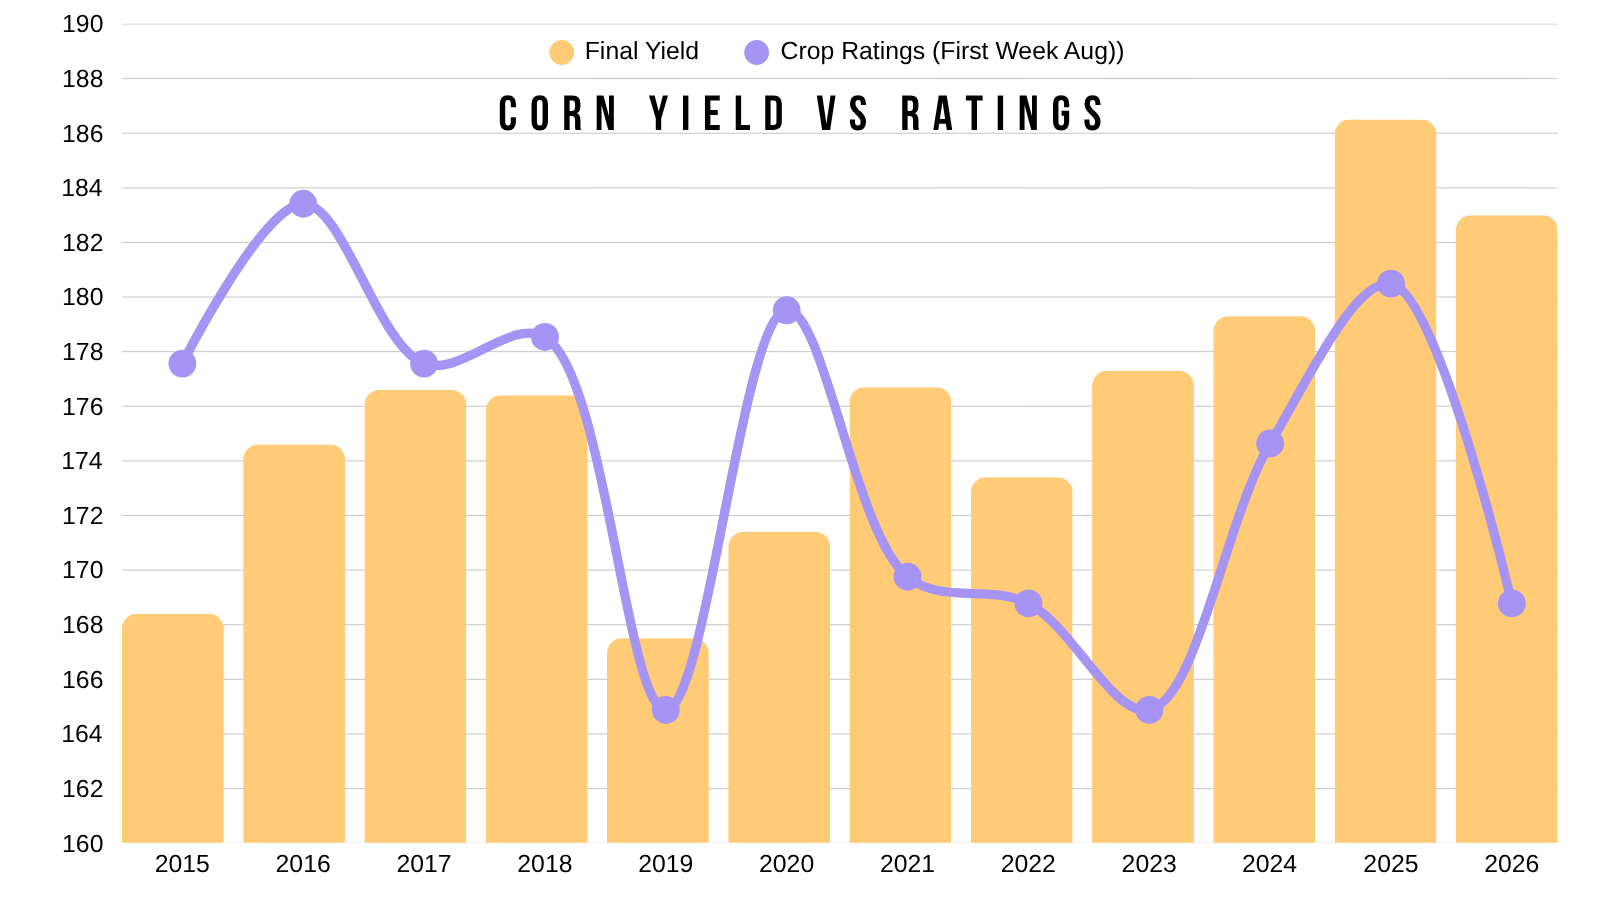
Here is the crop ratings for today's date vs final yield.
At first glance, you would say crop ratings don’t have a major impact on where yields end up.
Take 2023 for example. Awful ratings. Yet a record yield.
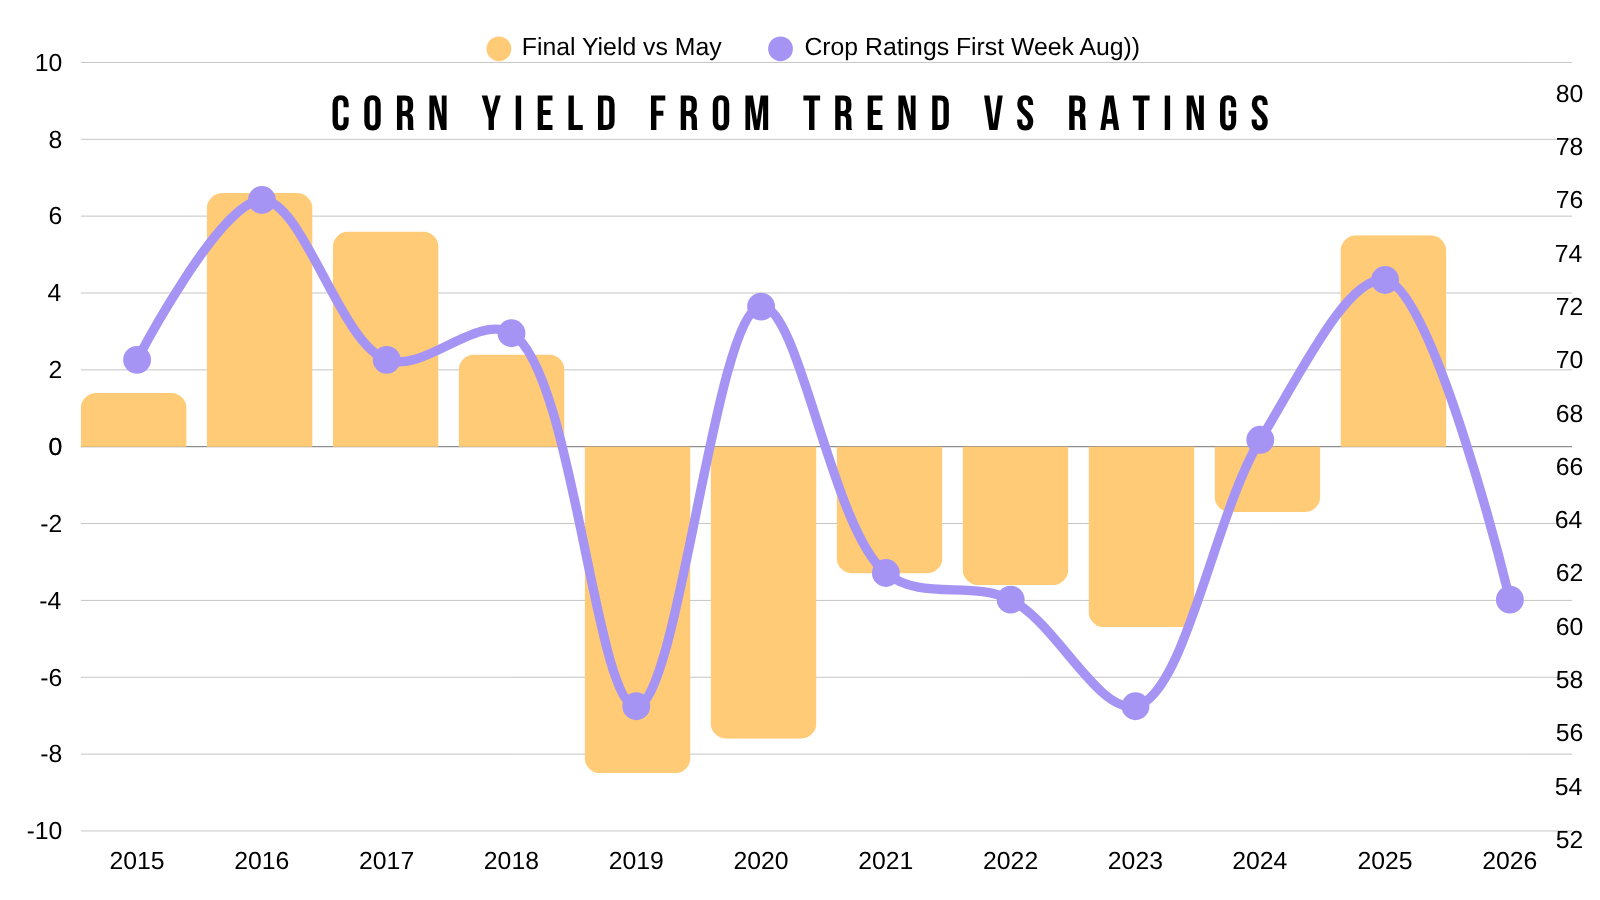
But here is another way you could look at it.
This compares the crop ratings for today's date vs our yield change from trend.
So how far yield came in above or below where the USDA started in May.
These low of ratings have actually correlated with a below trendline yield.
2015 to 2018 saw great crop conditions and above trend line yield. So did last year.
2019 to 2023 saw poor crop conditions and a below trend line yield.
So that is something to keep in mind.
Here is the data for soybeans.
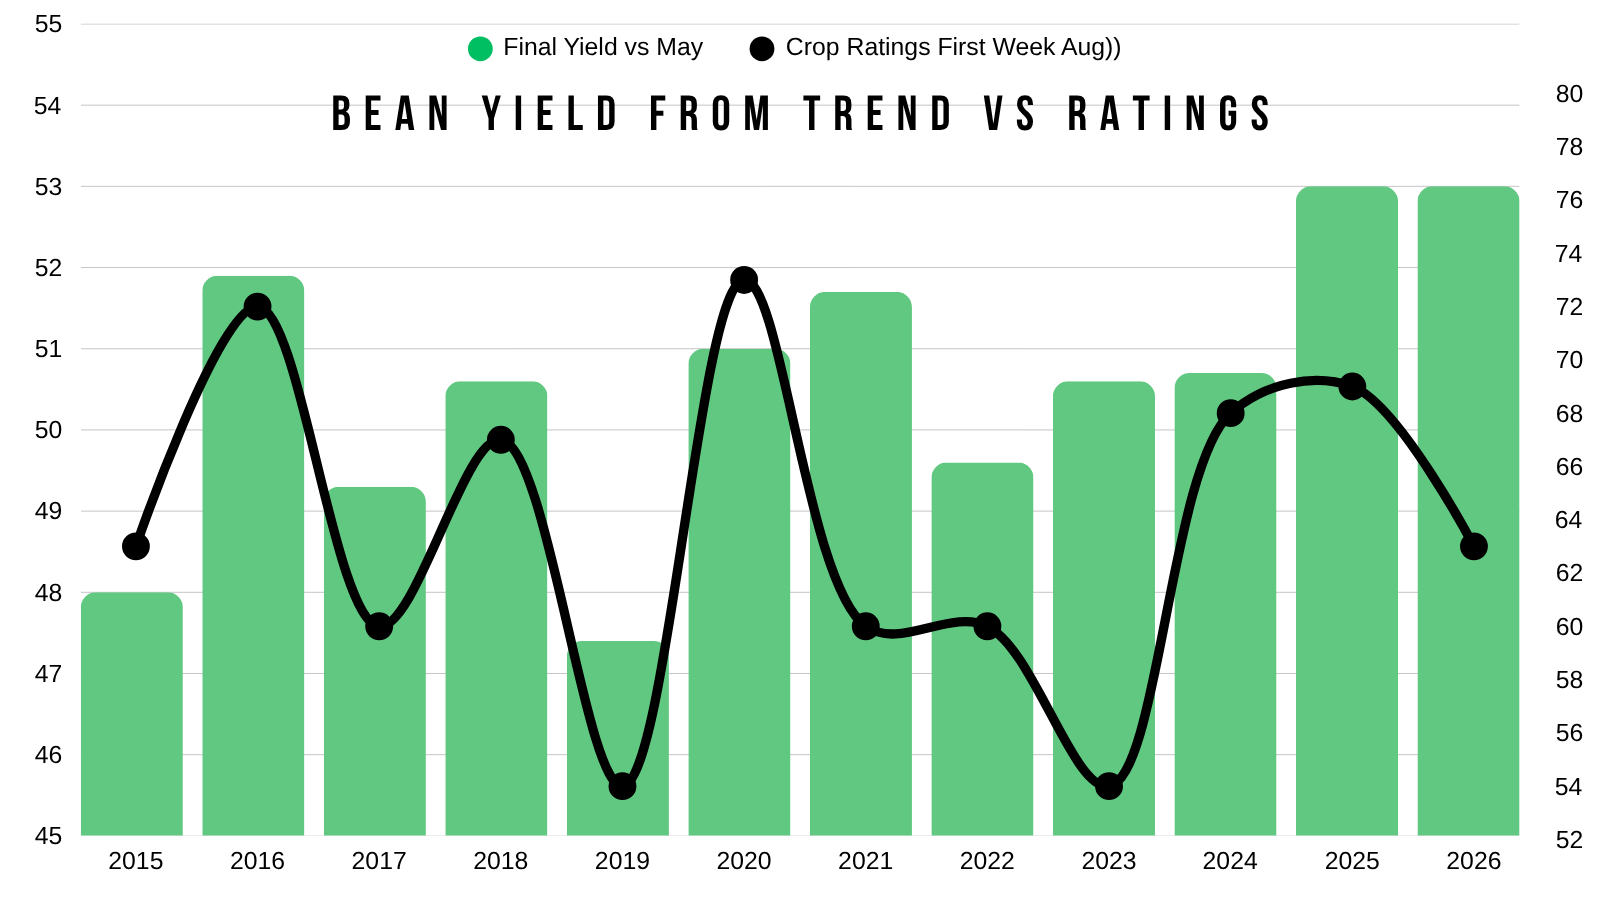
This is today's ratings vs final yield.
It is hard to believe soybeans are going to be another record yield with crop conditions well below where they were last year, and most of the top states are worse than last year.
However, it has happened before.
2023 would again be the best example of this.
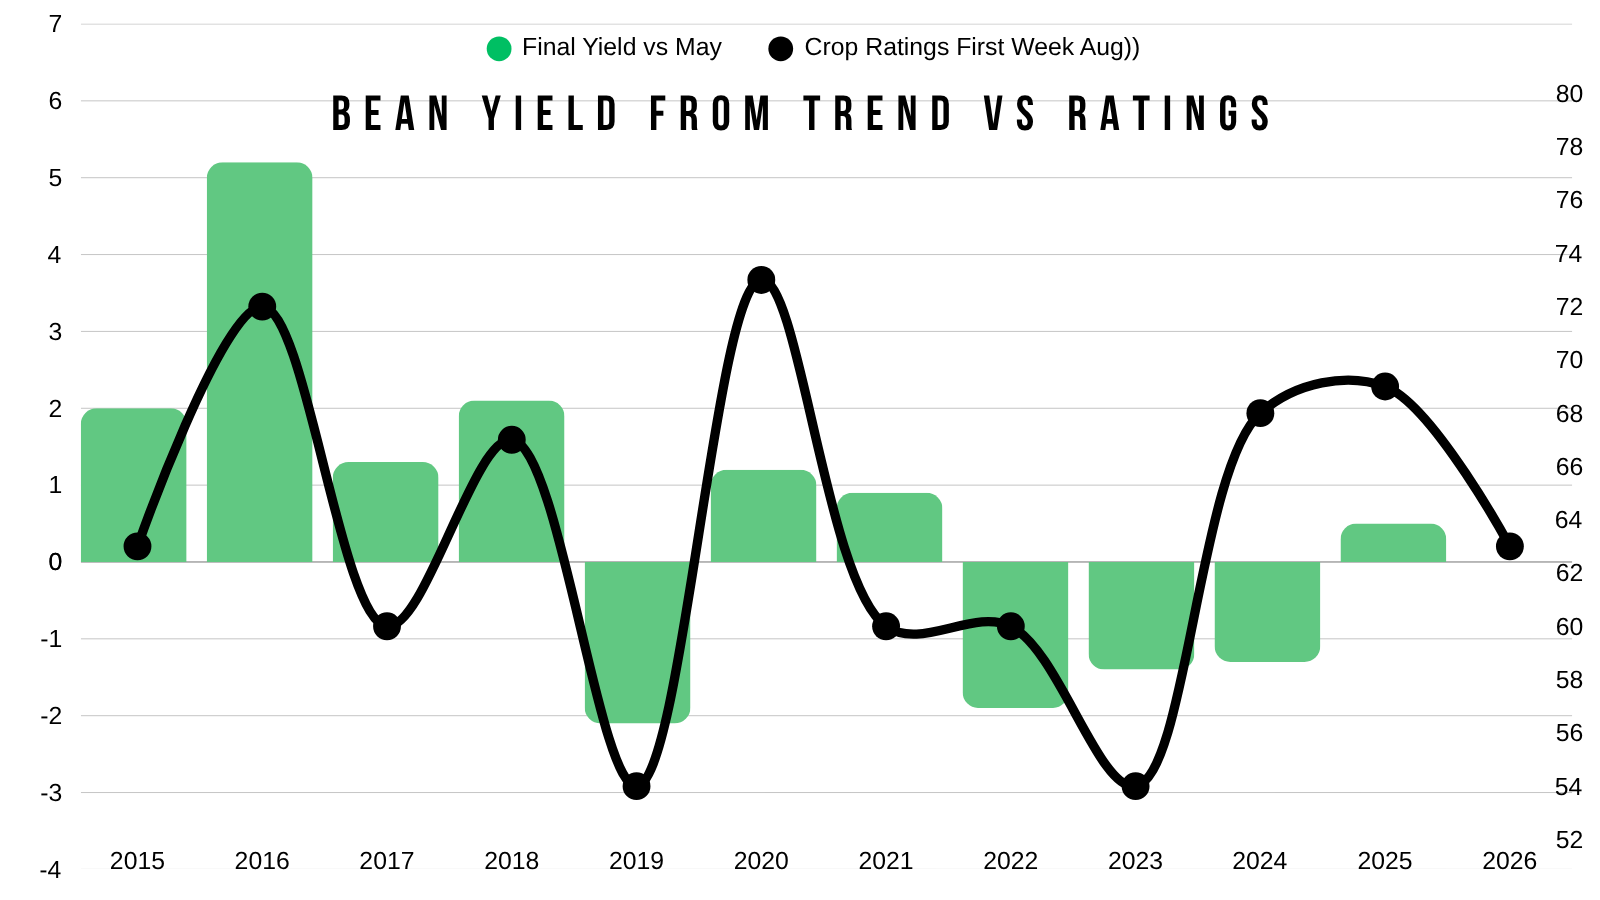
Here is ratings vs yield's deviation from trend.
Not nearly as clean of a correlation here as there is in corn.
I'd argue there really is no correlation here.
USDA Next Week
We will get the August WADSE report next Wednesday.
This report does usually include several changes.
And it's where the USDA usually first tweaks our yield, so it's going to be an important one.
We will start seeing some of the analyst estimates come out this week.
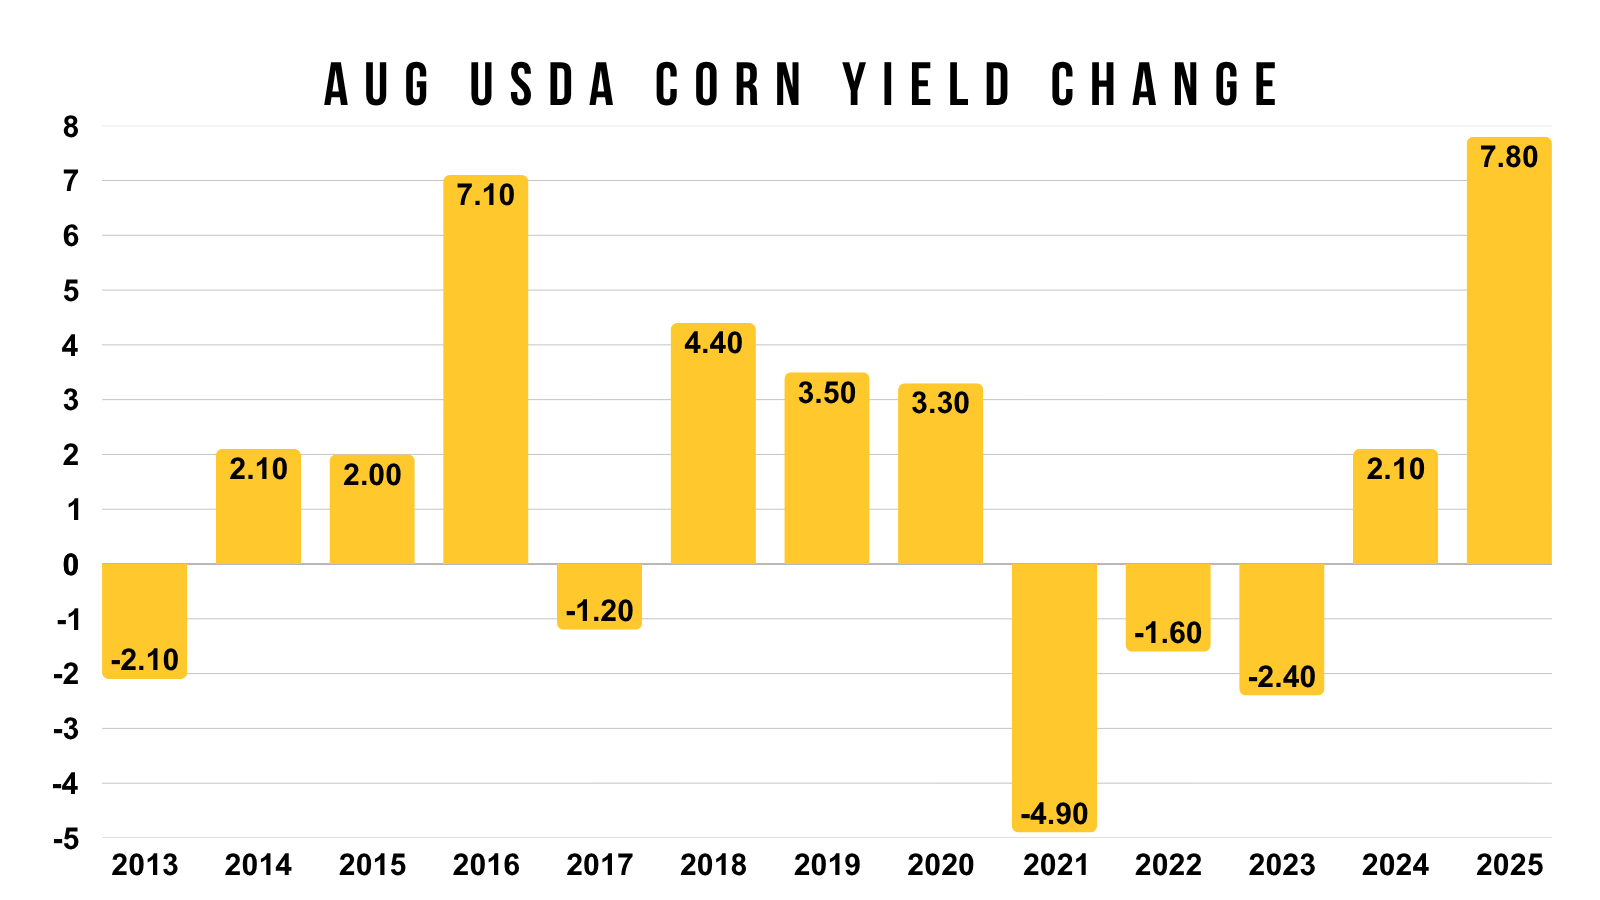
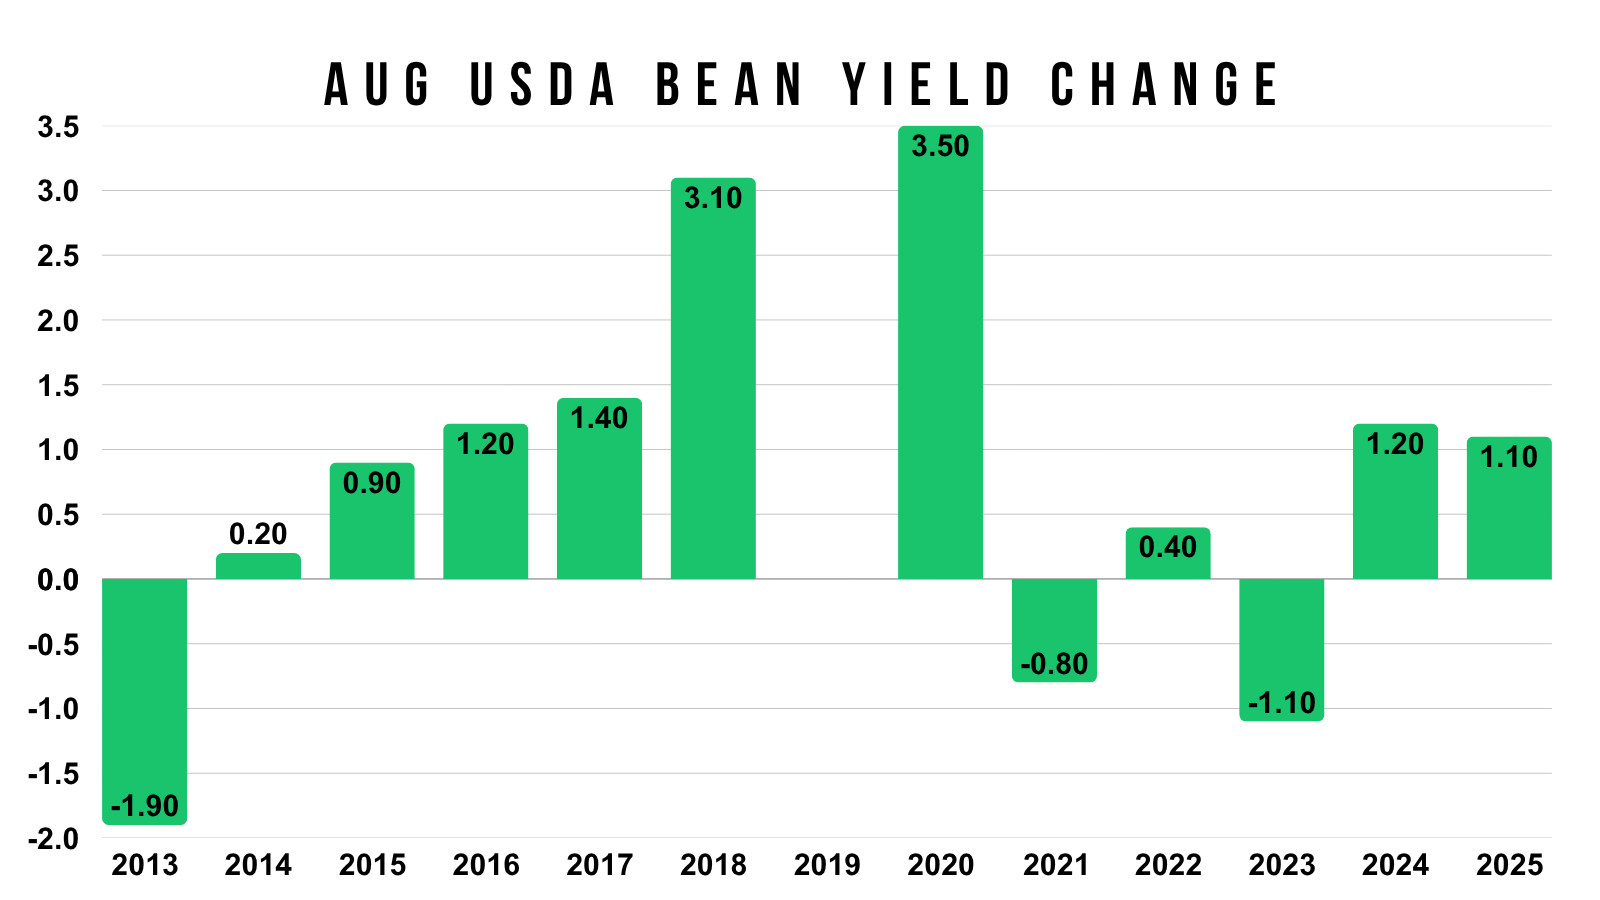
Here is the past corn yield changes for this report.
Almost every year we've seen at least a 1 bpa swing, but most years featured a 2-3 bpa change. With last year being the biggest upside change we've seen.
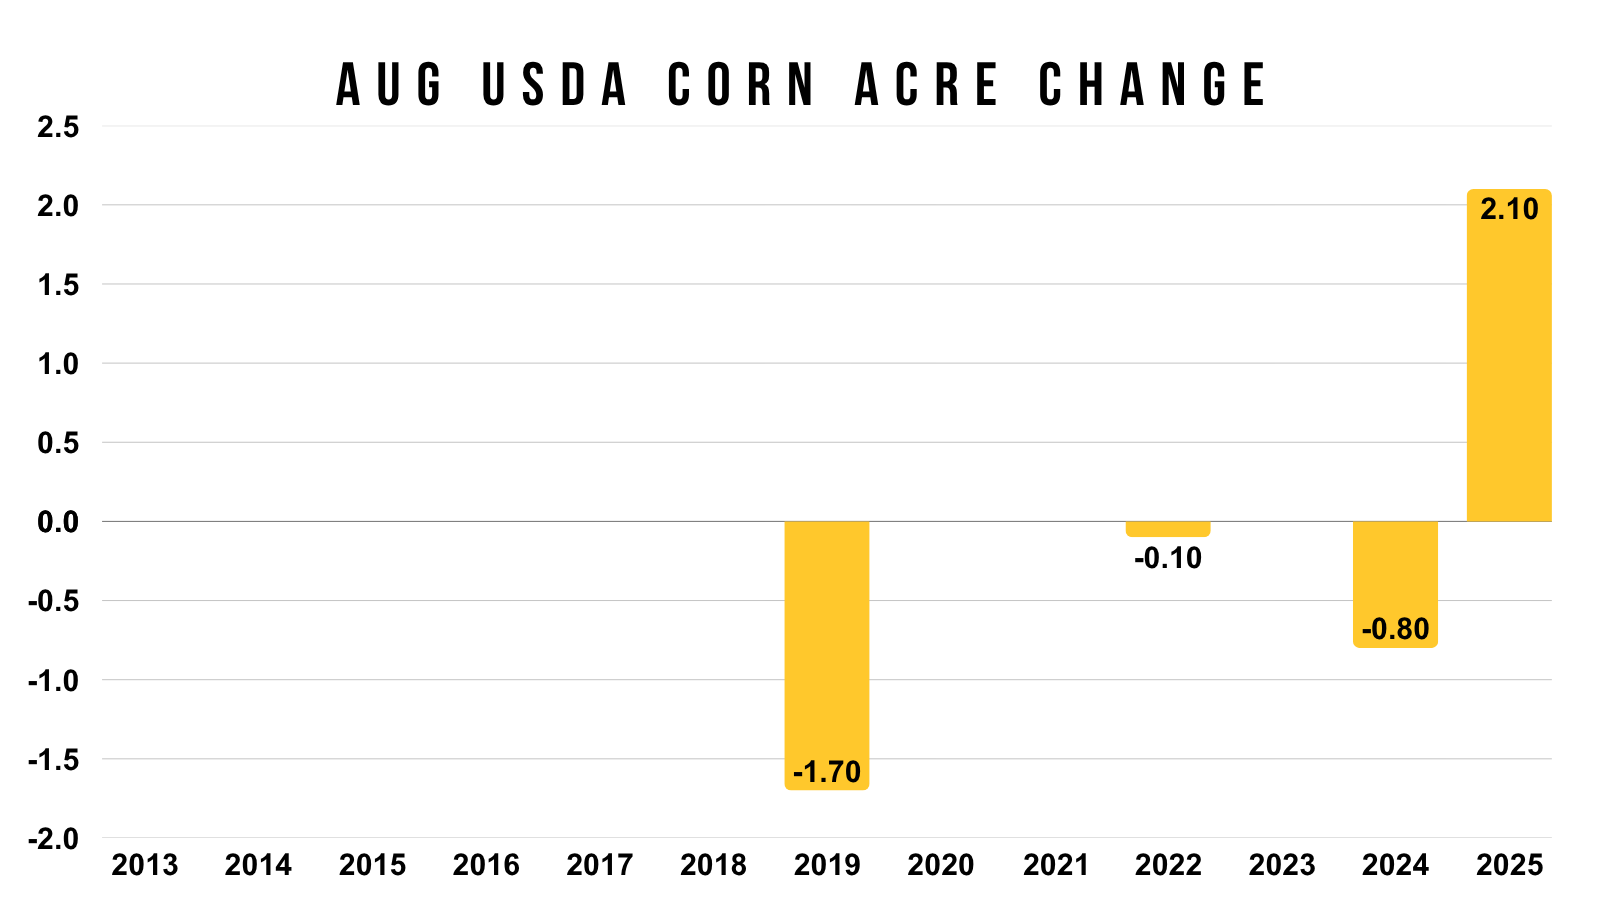
More recently, the USDA has also changed corn acres in this report.
As they've done so in back to back years.
Which up until recently, was very rare. As 2019 was the only other time we saw a big change.
For soybeans, we also usually see some changes.
Yield has typically changed by at least 1 bpa.
They've only left it unchanged once in the last several years. Which was 2019 as they made that rare change in July instead.
The USDA has had a tendency to raise yield in August for soybeans over the last decade or so.
StoneX Survey
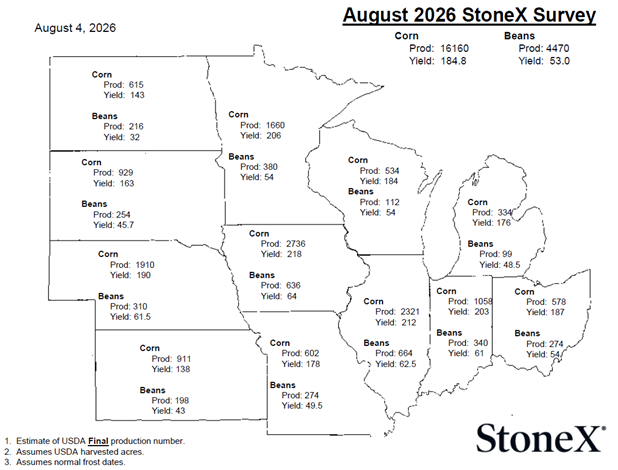
StoneX released their August survey this afternoon. They had:
Corn: 184.8 bpa (USDA is at 183)
Soybeans: 53 bpa (USDA is at 53)
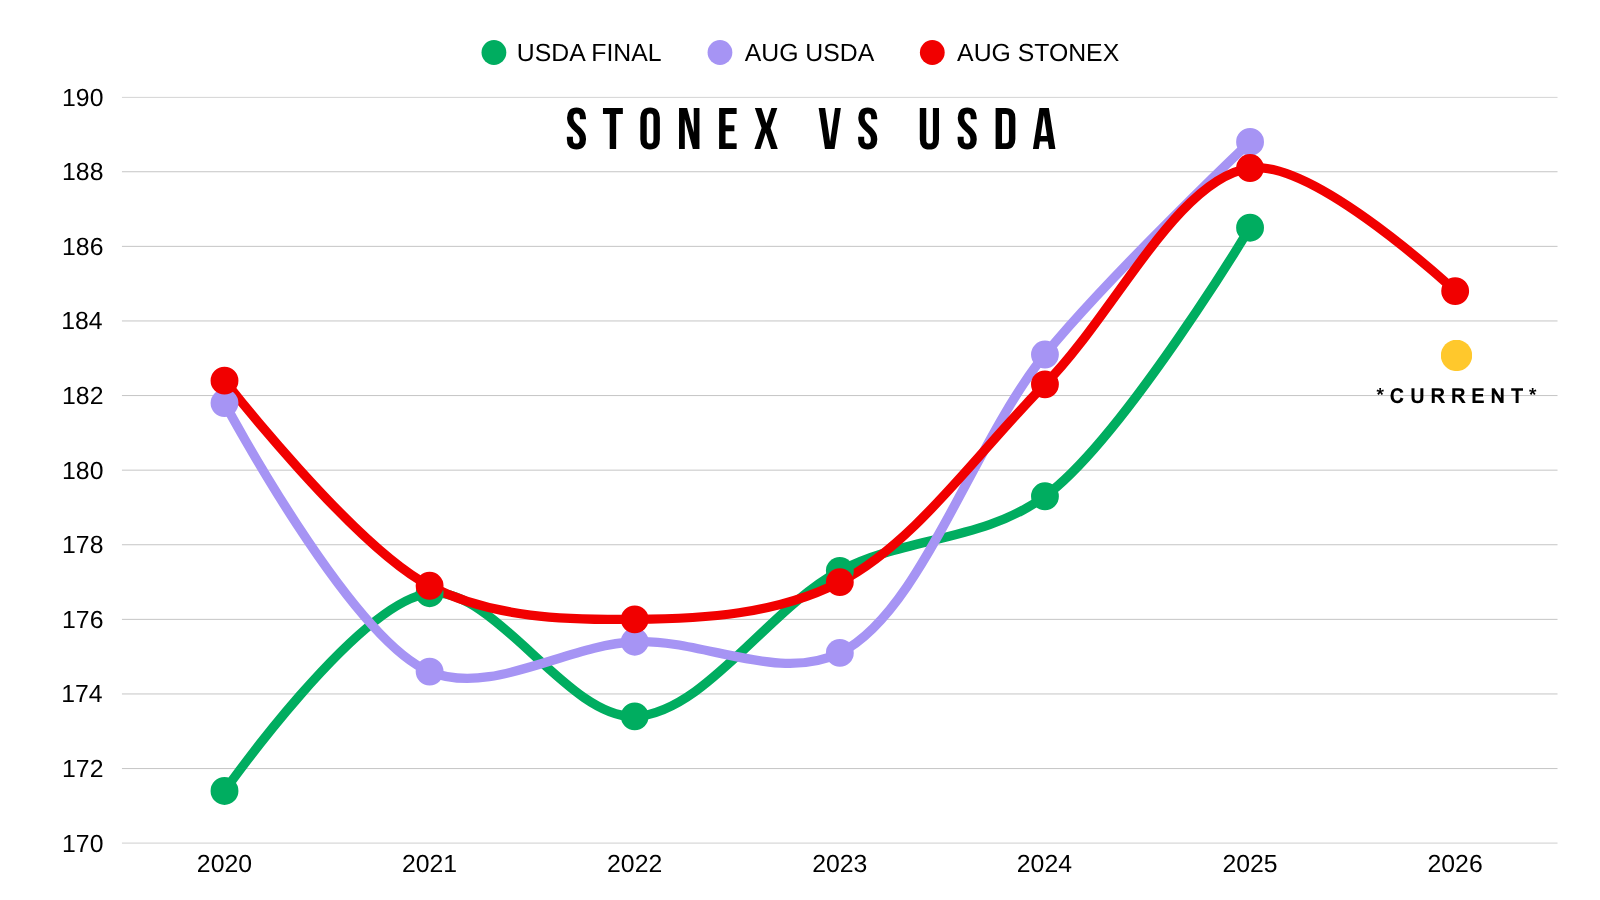
StoneX got a lot of heat last year when they released their August survey and it was 188 bpa vs the USDA's trendline 181.
But then the USDA ended up raising our yield to 188.8 bpa in the August USDA report.
Below is a chart that compares:
USDA Final = Green
August USDA = Purple
August StoneX = Red
If we look at the last few years, StoneX's August survey has actually been right in line with the August USDA the last two years.
In the three years prior, StoneX's numbers were a little higher than the USDA.
Today's Main Takeaways
Corn
Long term I still think corn has a ton of potential.
Short term bulls still need to be fed. Which is why I've been pretty vocal about managing your risk the last few weeks, especially if you are in that situation where you need to move stuff off the combine or lack storage etc.
This is usually a weak time frame, and we were coming off the back of what was largely a supply driven weather scare.
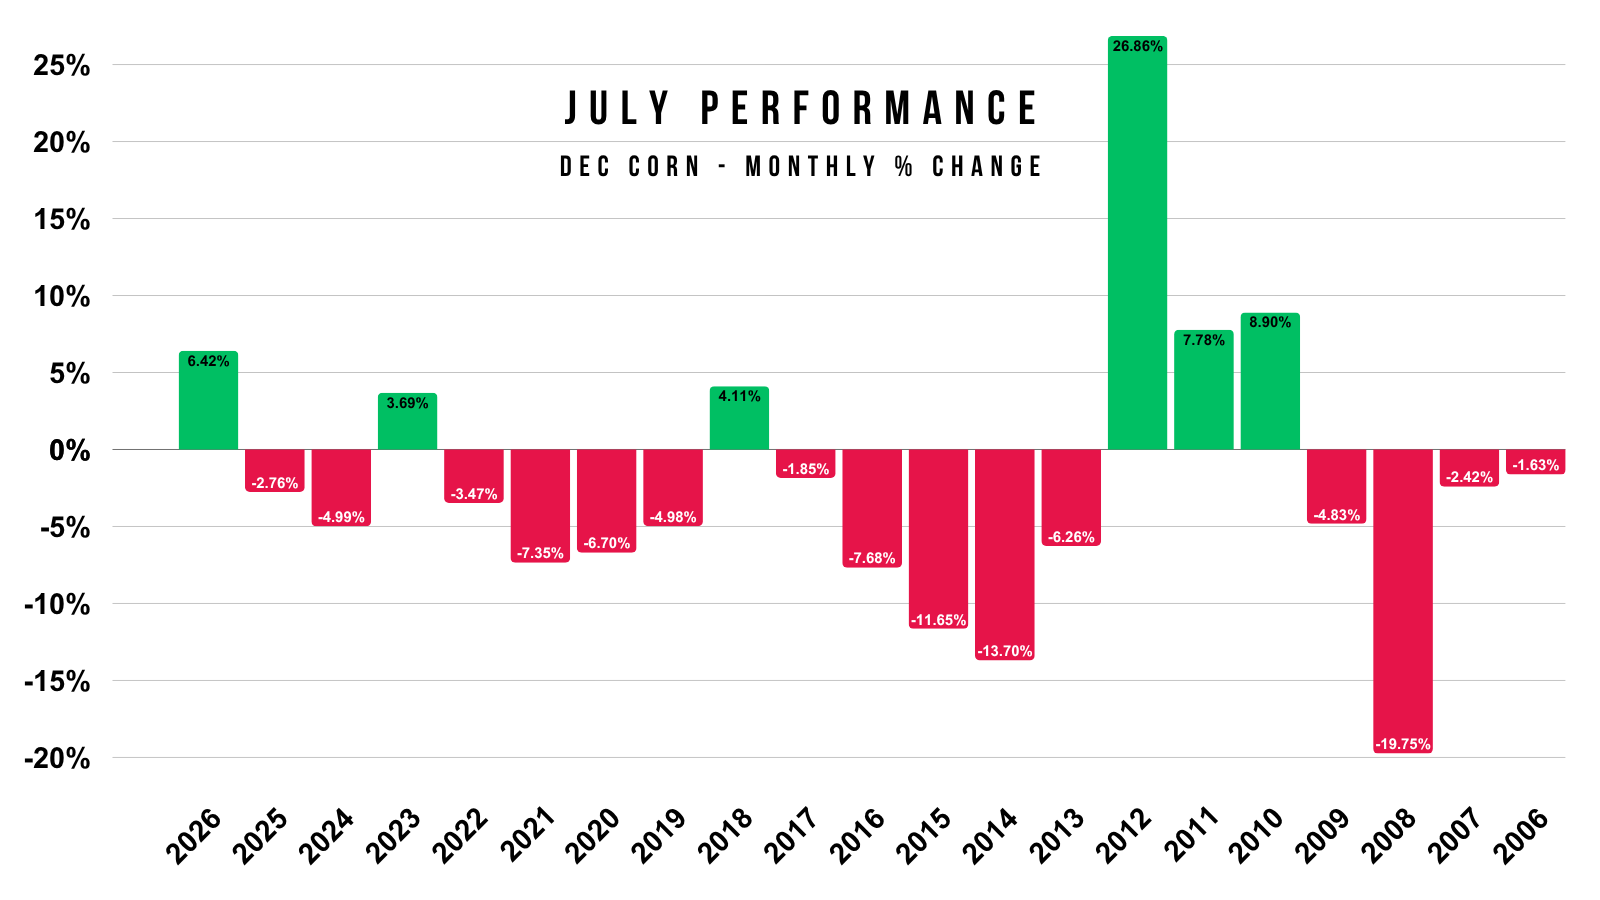
Seeing what is considered a rare counter seasonal rally, which does not happen very often.
Until this turns into a demand led rally that lasts, supply driven rallies are meant to be protected.
We are supposed to see weakness going into harvest.
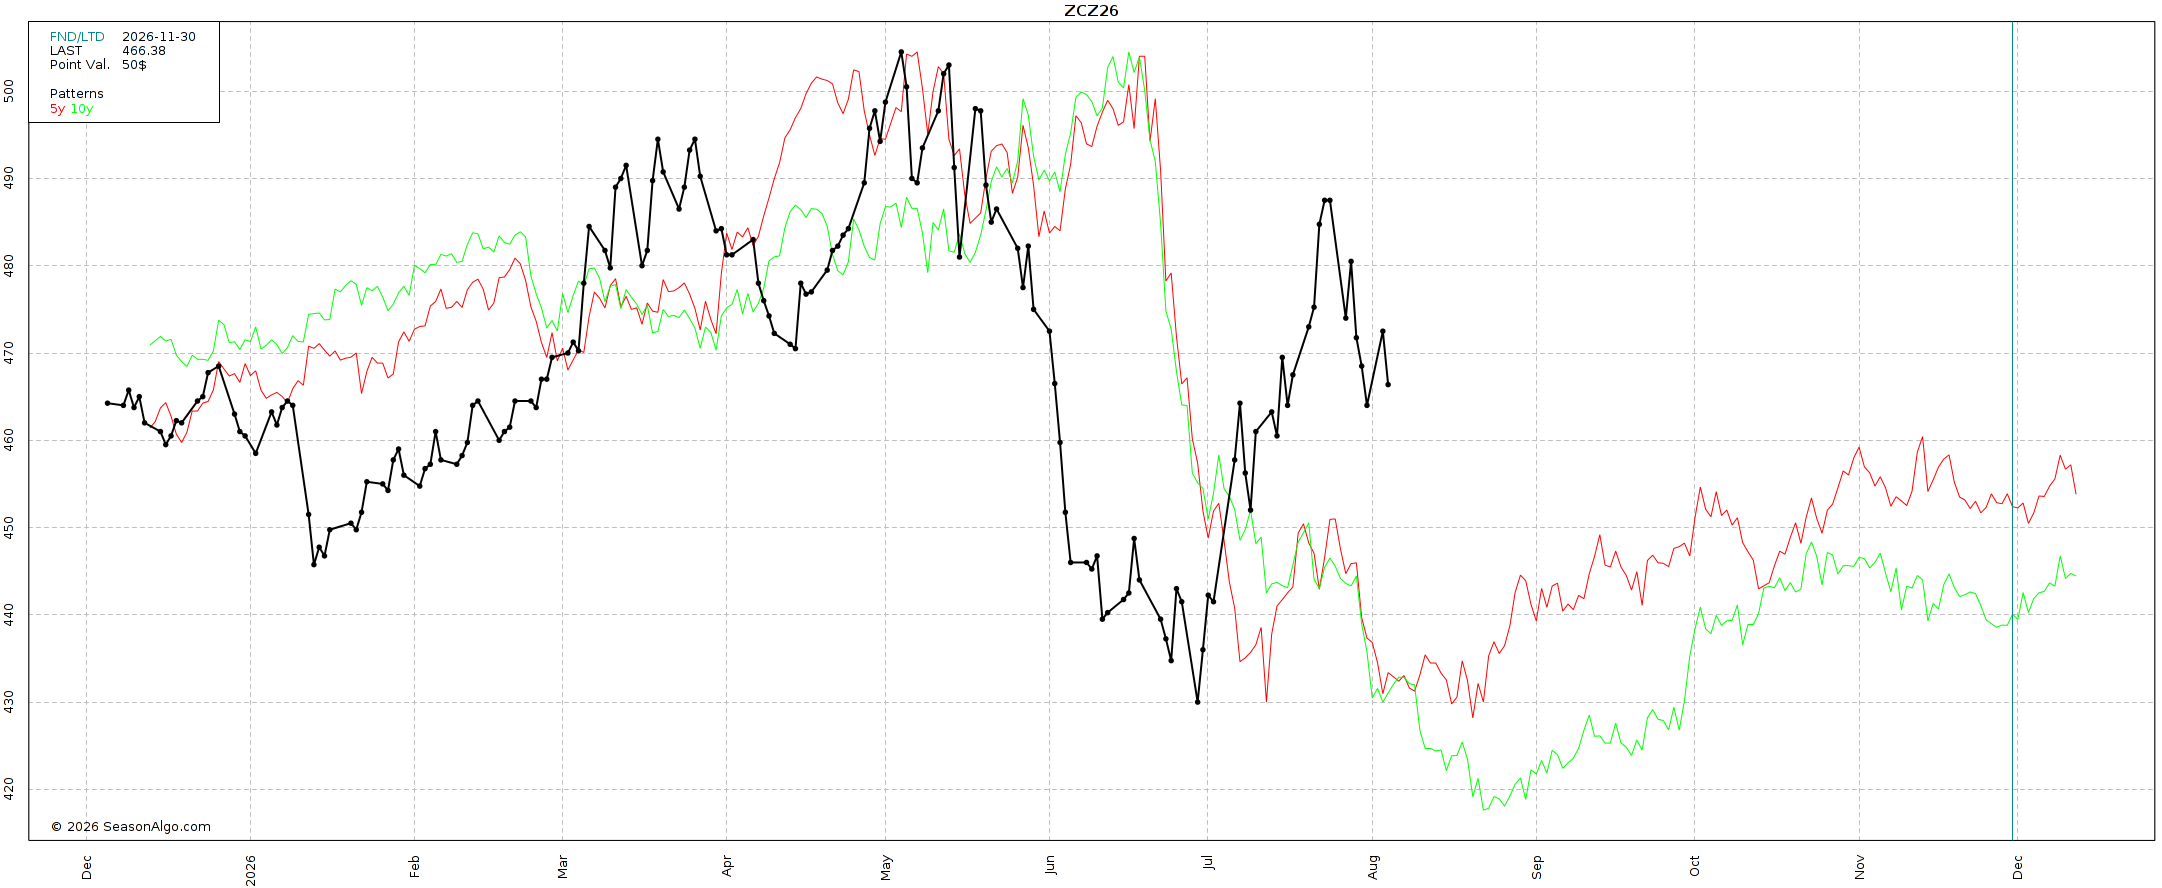
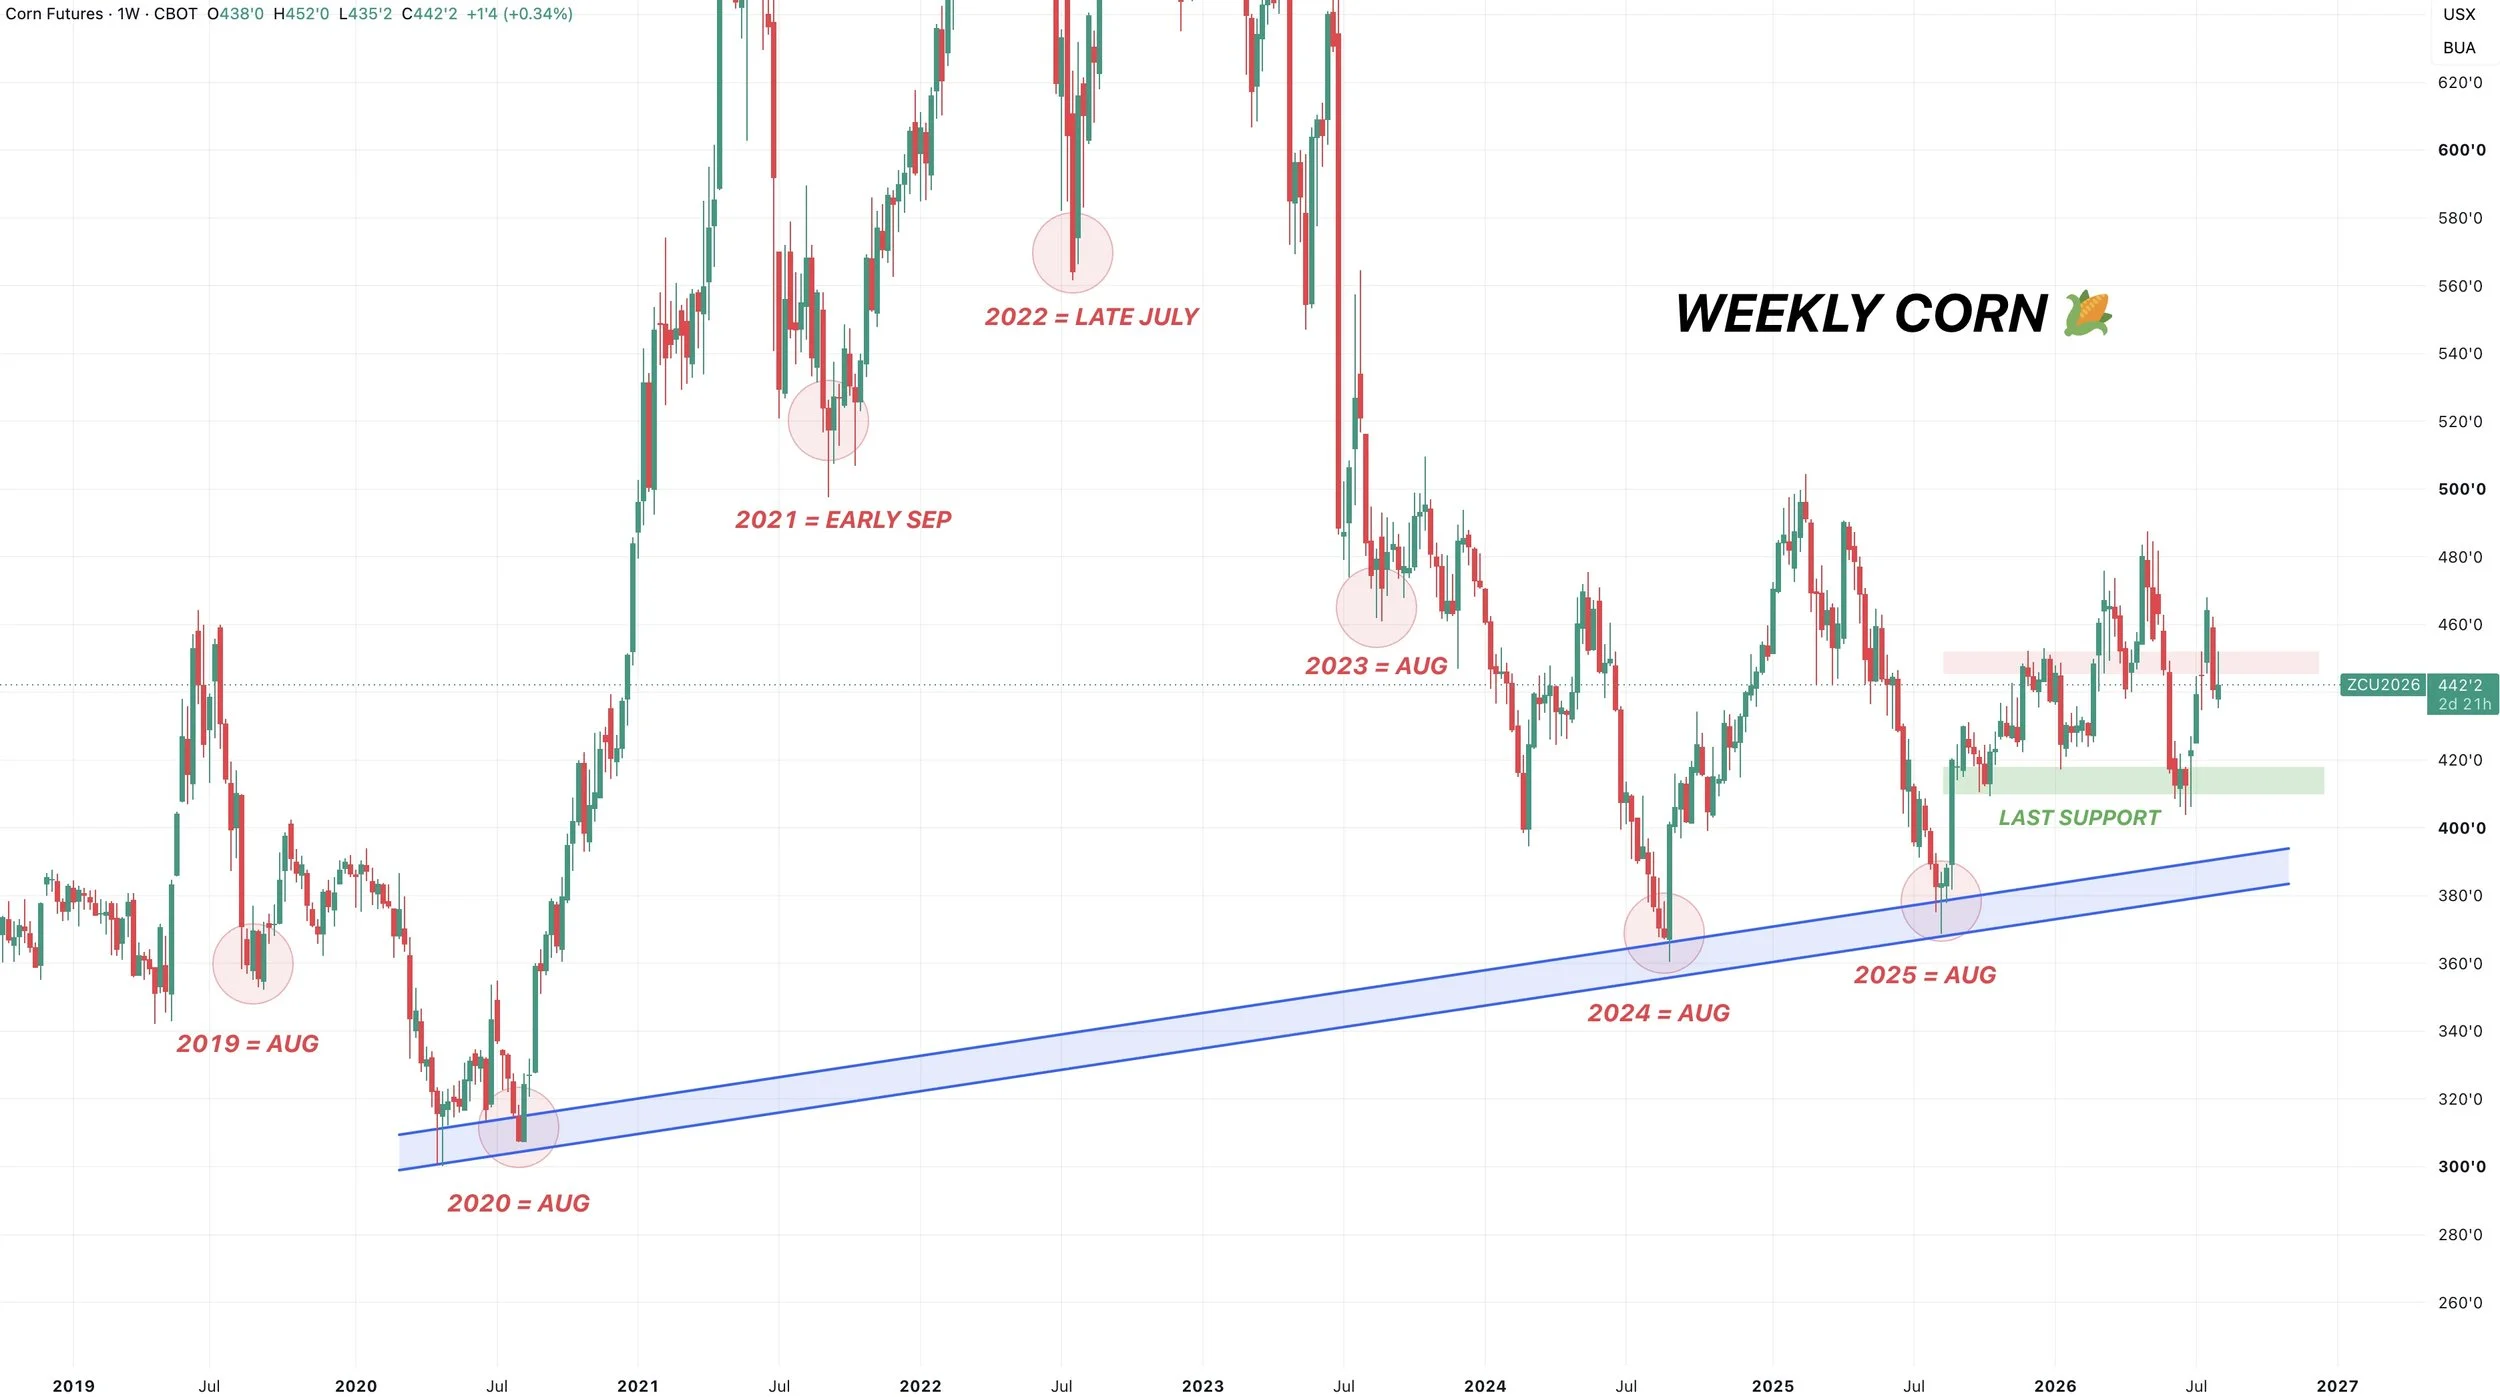
Something to note is that last several years we have bottomed right around August.
Although, this is the first time in a long time we rallied before hand.
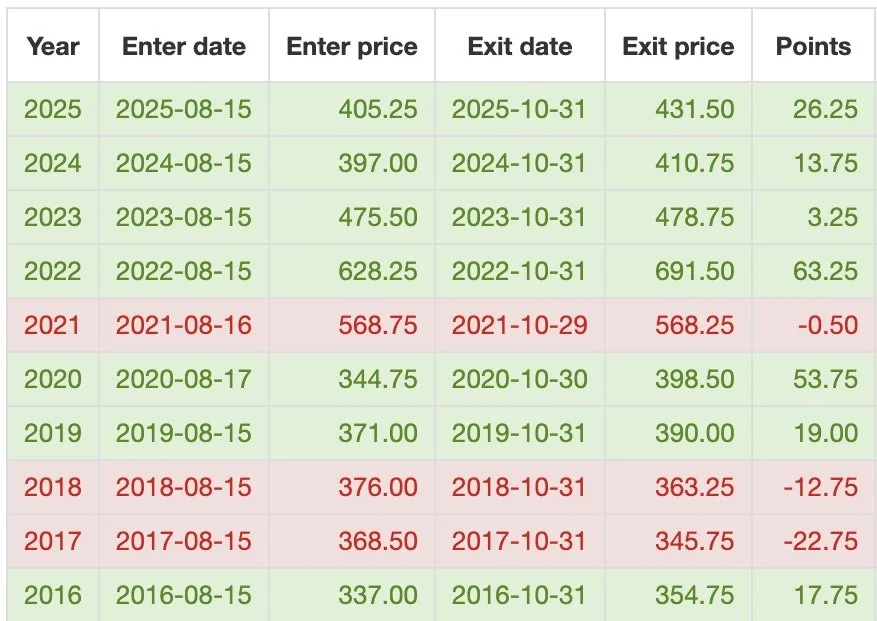
From August 15th by the end of October we've been higher the last 6 of 7 years.
Higher the last 7 of 10 years.
So once we get through the natural pressure from harvest, we often see more opportunities into the latter part of the year and into next.
Am I bearish corn? No. However, we might need some fresh factors to push this market to new highs going into this seasonally weak time frame.
Whether that's some help from the USDA, more concerns surrounding the Black Sea, a rally in crude oil, or maybe some eventual buying from China.
As we have already priced in plenty of factors.
We had the weather scare. We had the Iran war. We had the boost from the Black Sea story.
Which is why we wanted to do something the last few weeks, especially if you lacked storage or knew you'd have to move something.
We did just see the best July rally since 2012.
I do however believe there will be more opportunities. They just might not happen as soon as we'd all like.
Long term, I am talking several months and heading into next year. I think there is a chance for a real demand led rally.
Which is a rally that actually lasts.
I've went over the balance sheet a thousand times. We're going to get our next big update next week.
But the balance sheet really can’t afford a yield below trend.
That stocks to use starts to immediately tighten up if yield starts to fall.
If yield falls, the USDA will try to balance the balance sheet by lowering our demand. To justify lower demand, you typically need to see higher prices incentive that lower demand.
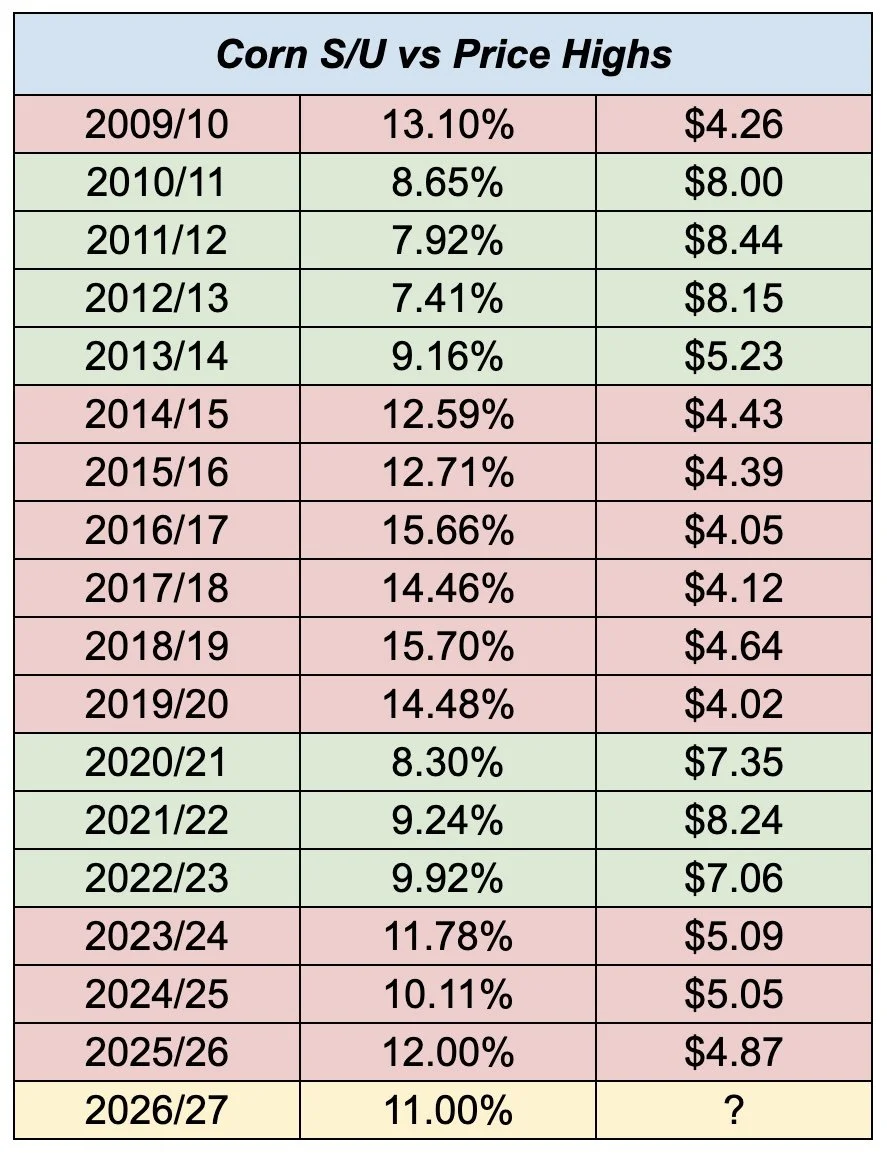
There are still several "potential" ways for the new crop stocks to use to end up in the realm of 10% or lower.
On the other hand, no, if yield is actually trend or higher, fundamentally we do not have to tremendously higher. But the potential is there.
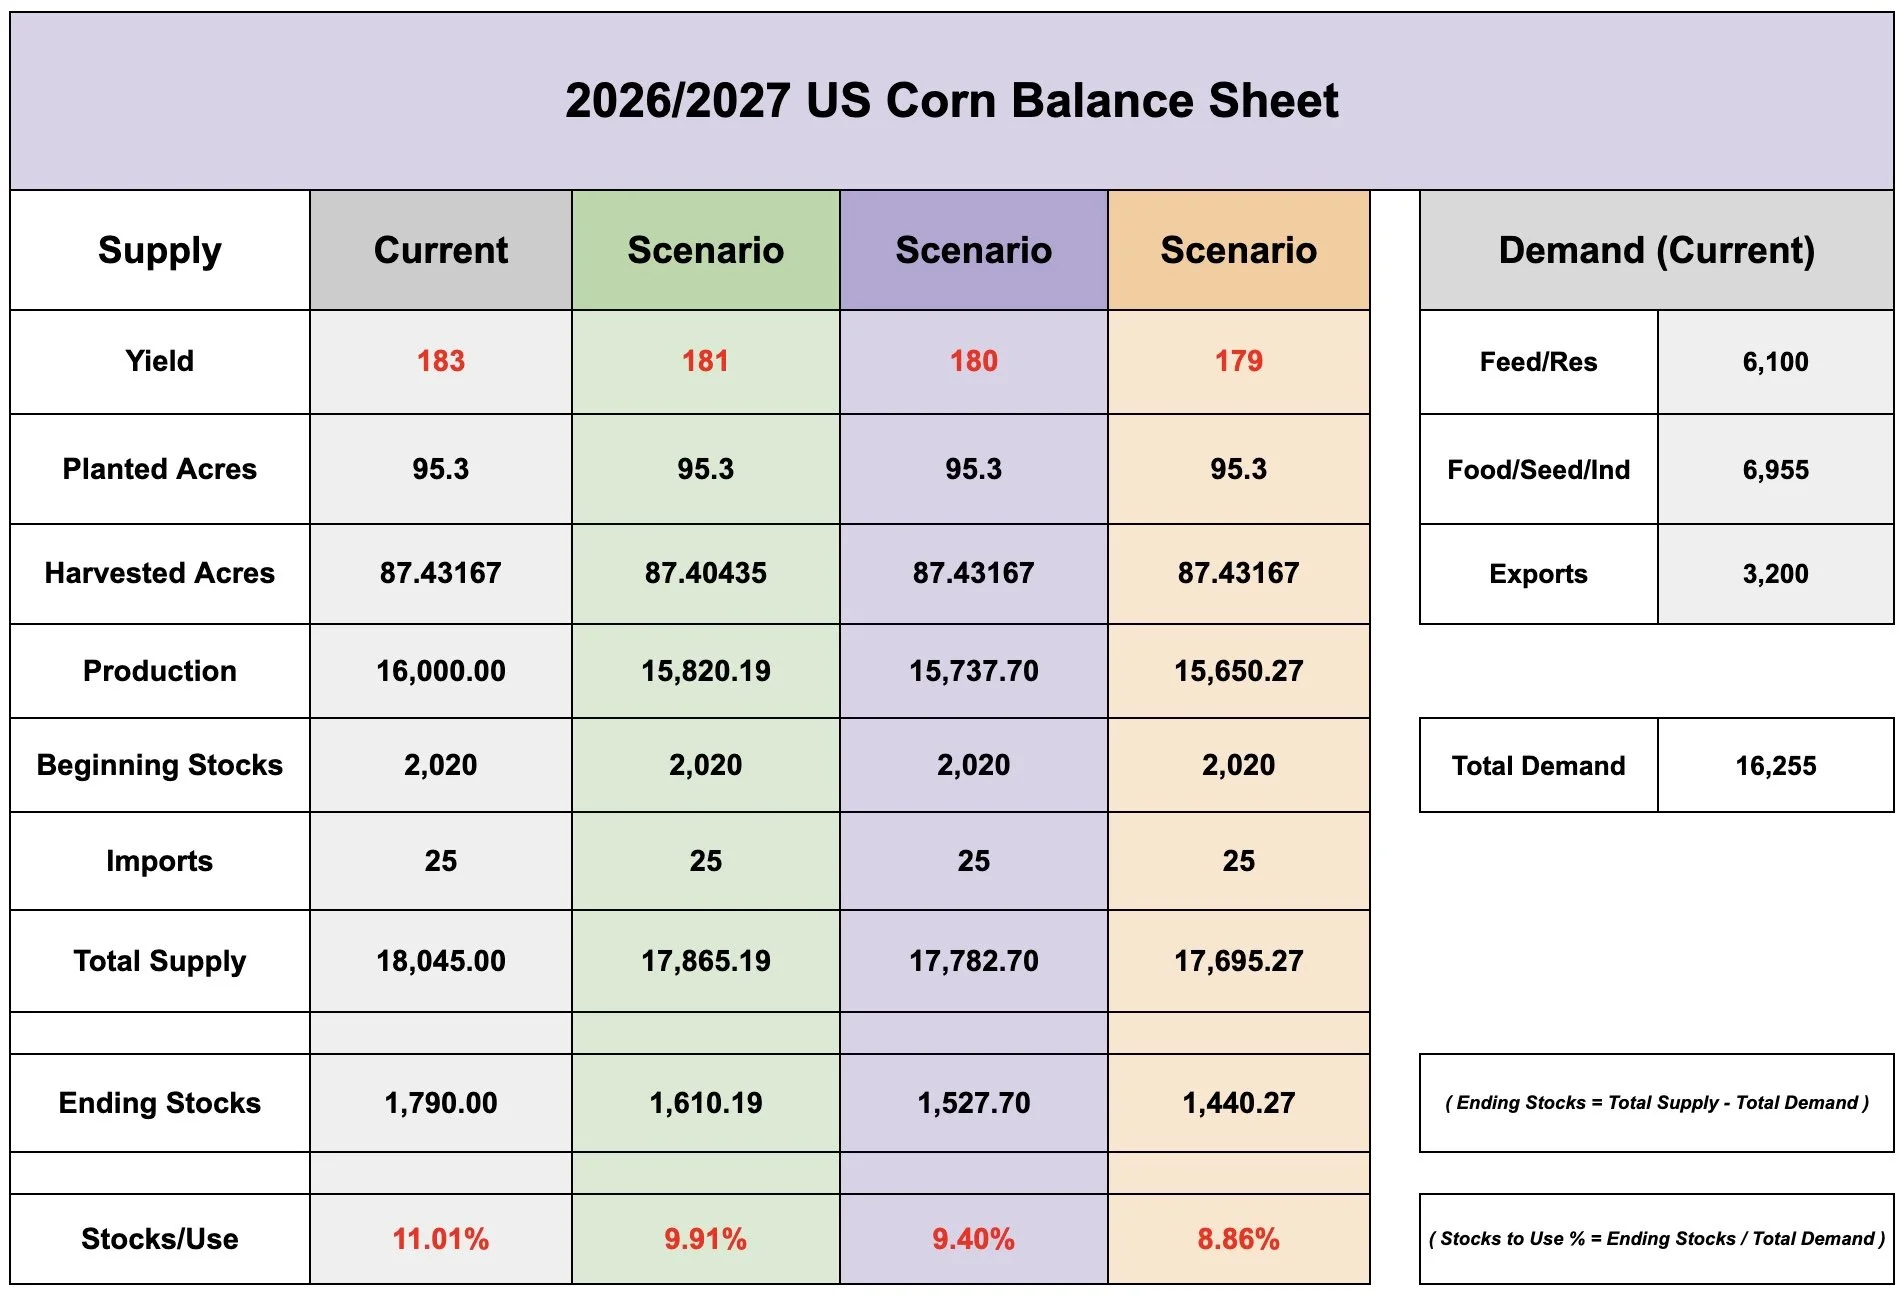
As for us to get corn much beyond $5.00 we will need to probably see that stocks to use fall down to 10% or lower.
It doesn’t have to happen.
But this is the best possibility we've had in a while. Given the new crop stocks to use is at 11% even if we see a trendline yield.
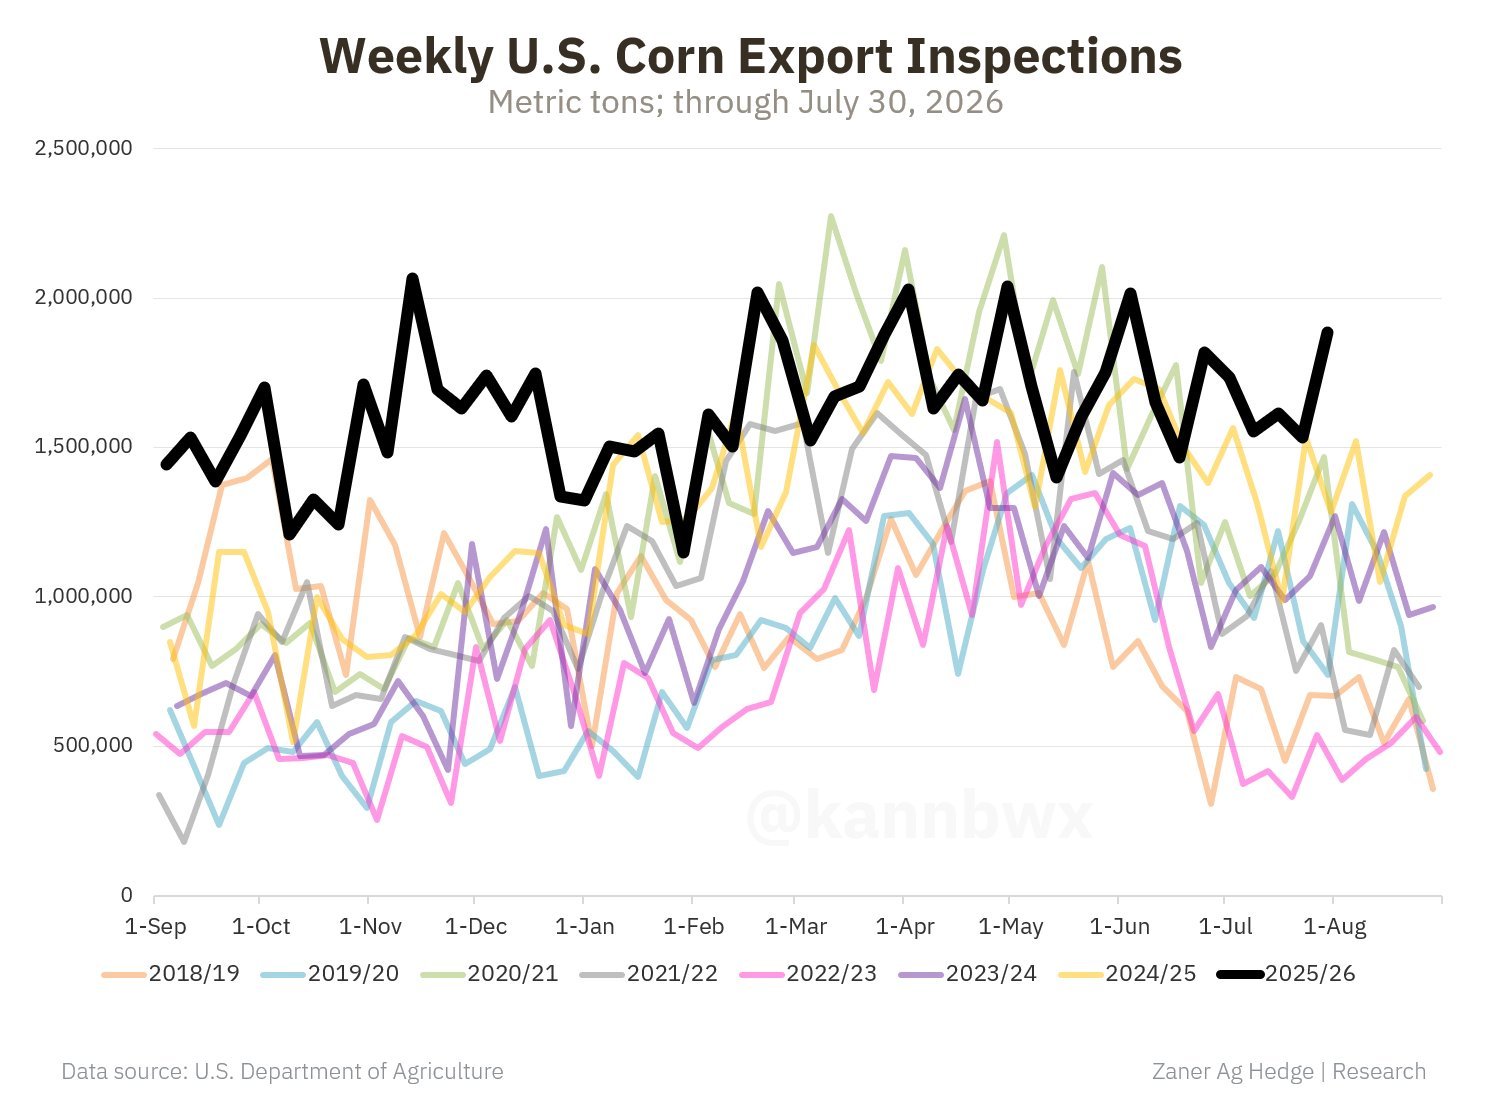
Not to mention our exports arguably need to be bumped higher given how far ahead of pace we are.
Which tightens up the old crop and new crop balance sheet even further.
Amplifying the need for a trendline yield to keep the balance sheet aloft.
Just look at our export inspections.
We are nearly 200 million bu ahead of the USDA's current pace.
So that'll be something to watch for next week.
Chart from Karen Braun on X
Charts
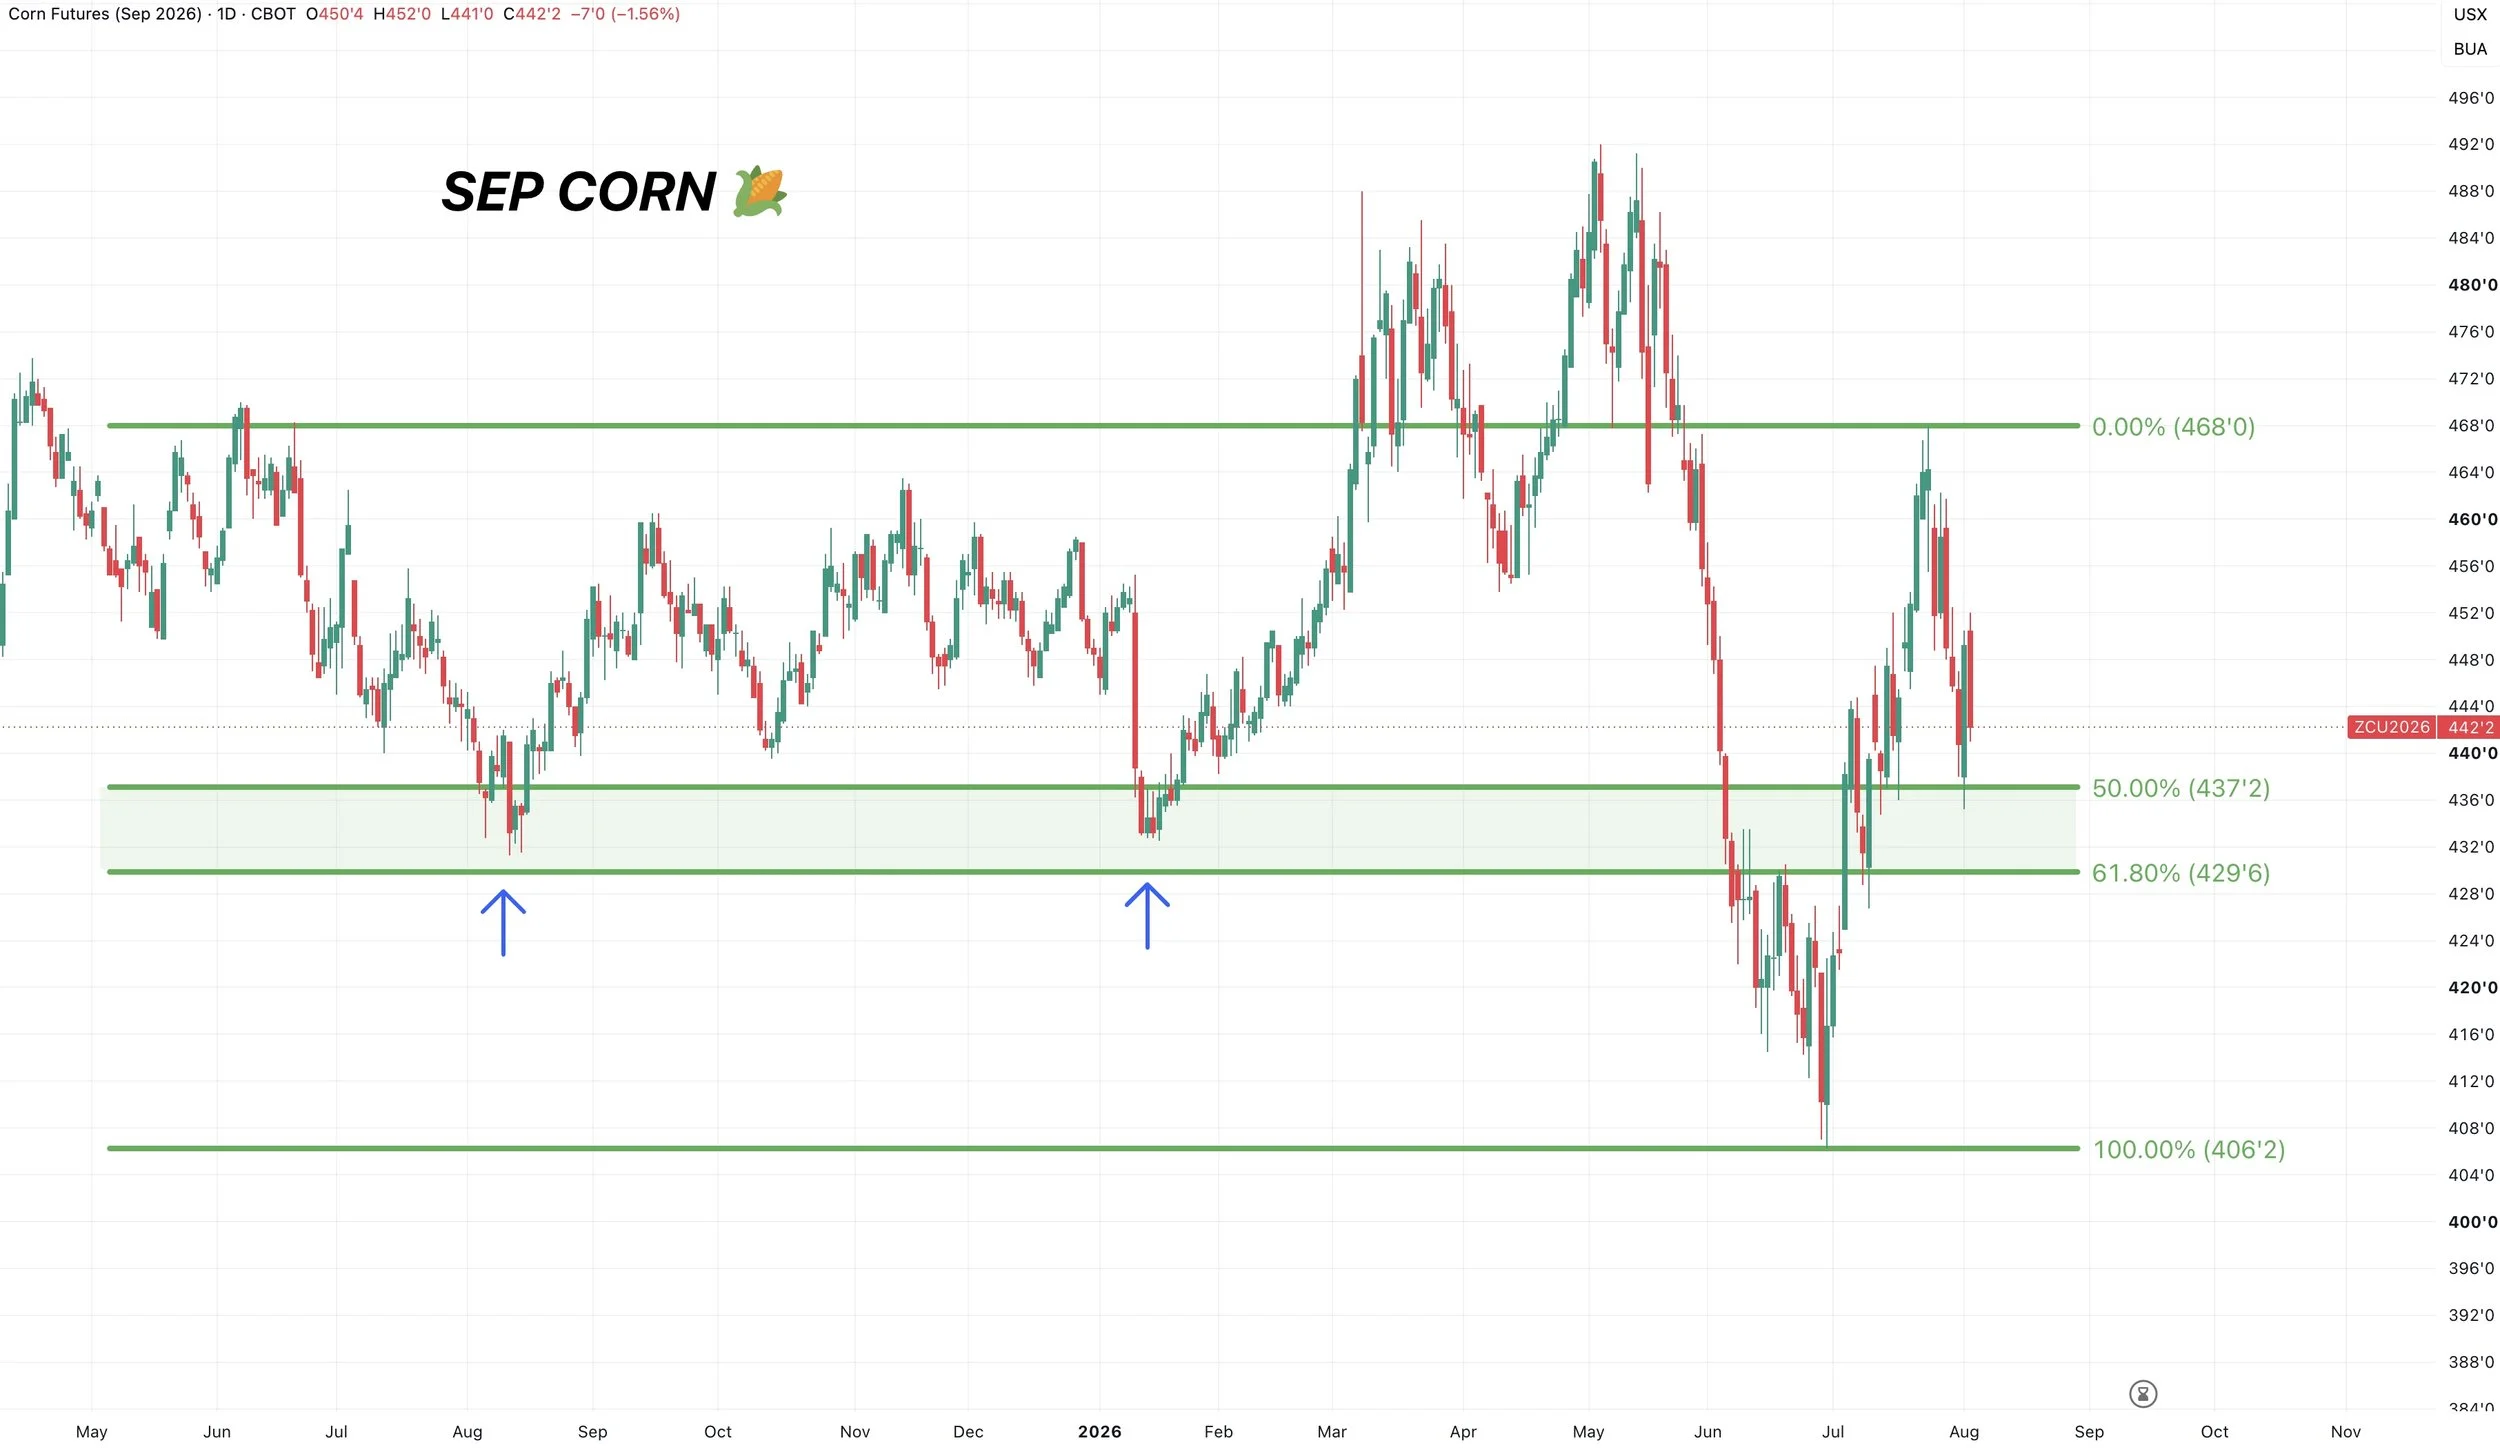
Sep Corn Chart:
We rejected that golden zone from the contract lows up to contract highs. That same area was prior key support and resistance.
Which is why we wanted to defend that level the last few weeks.
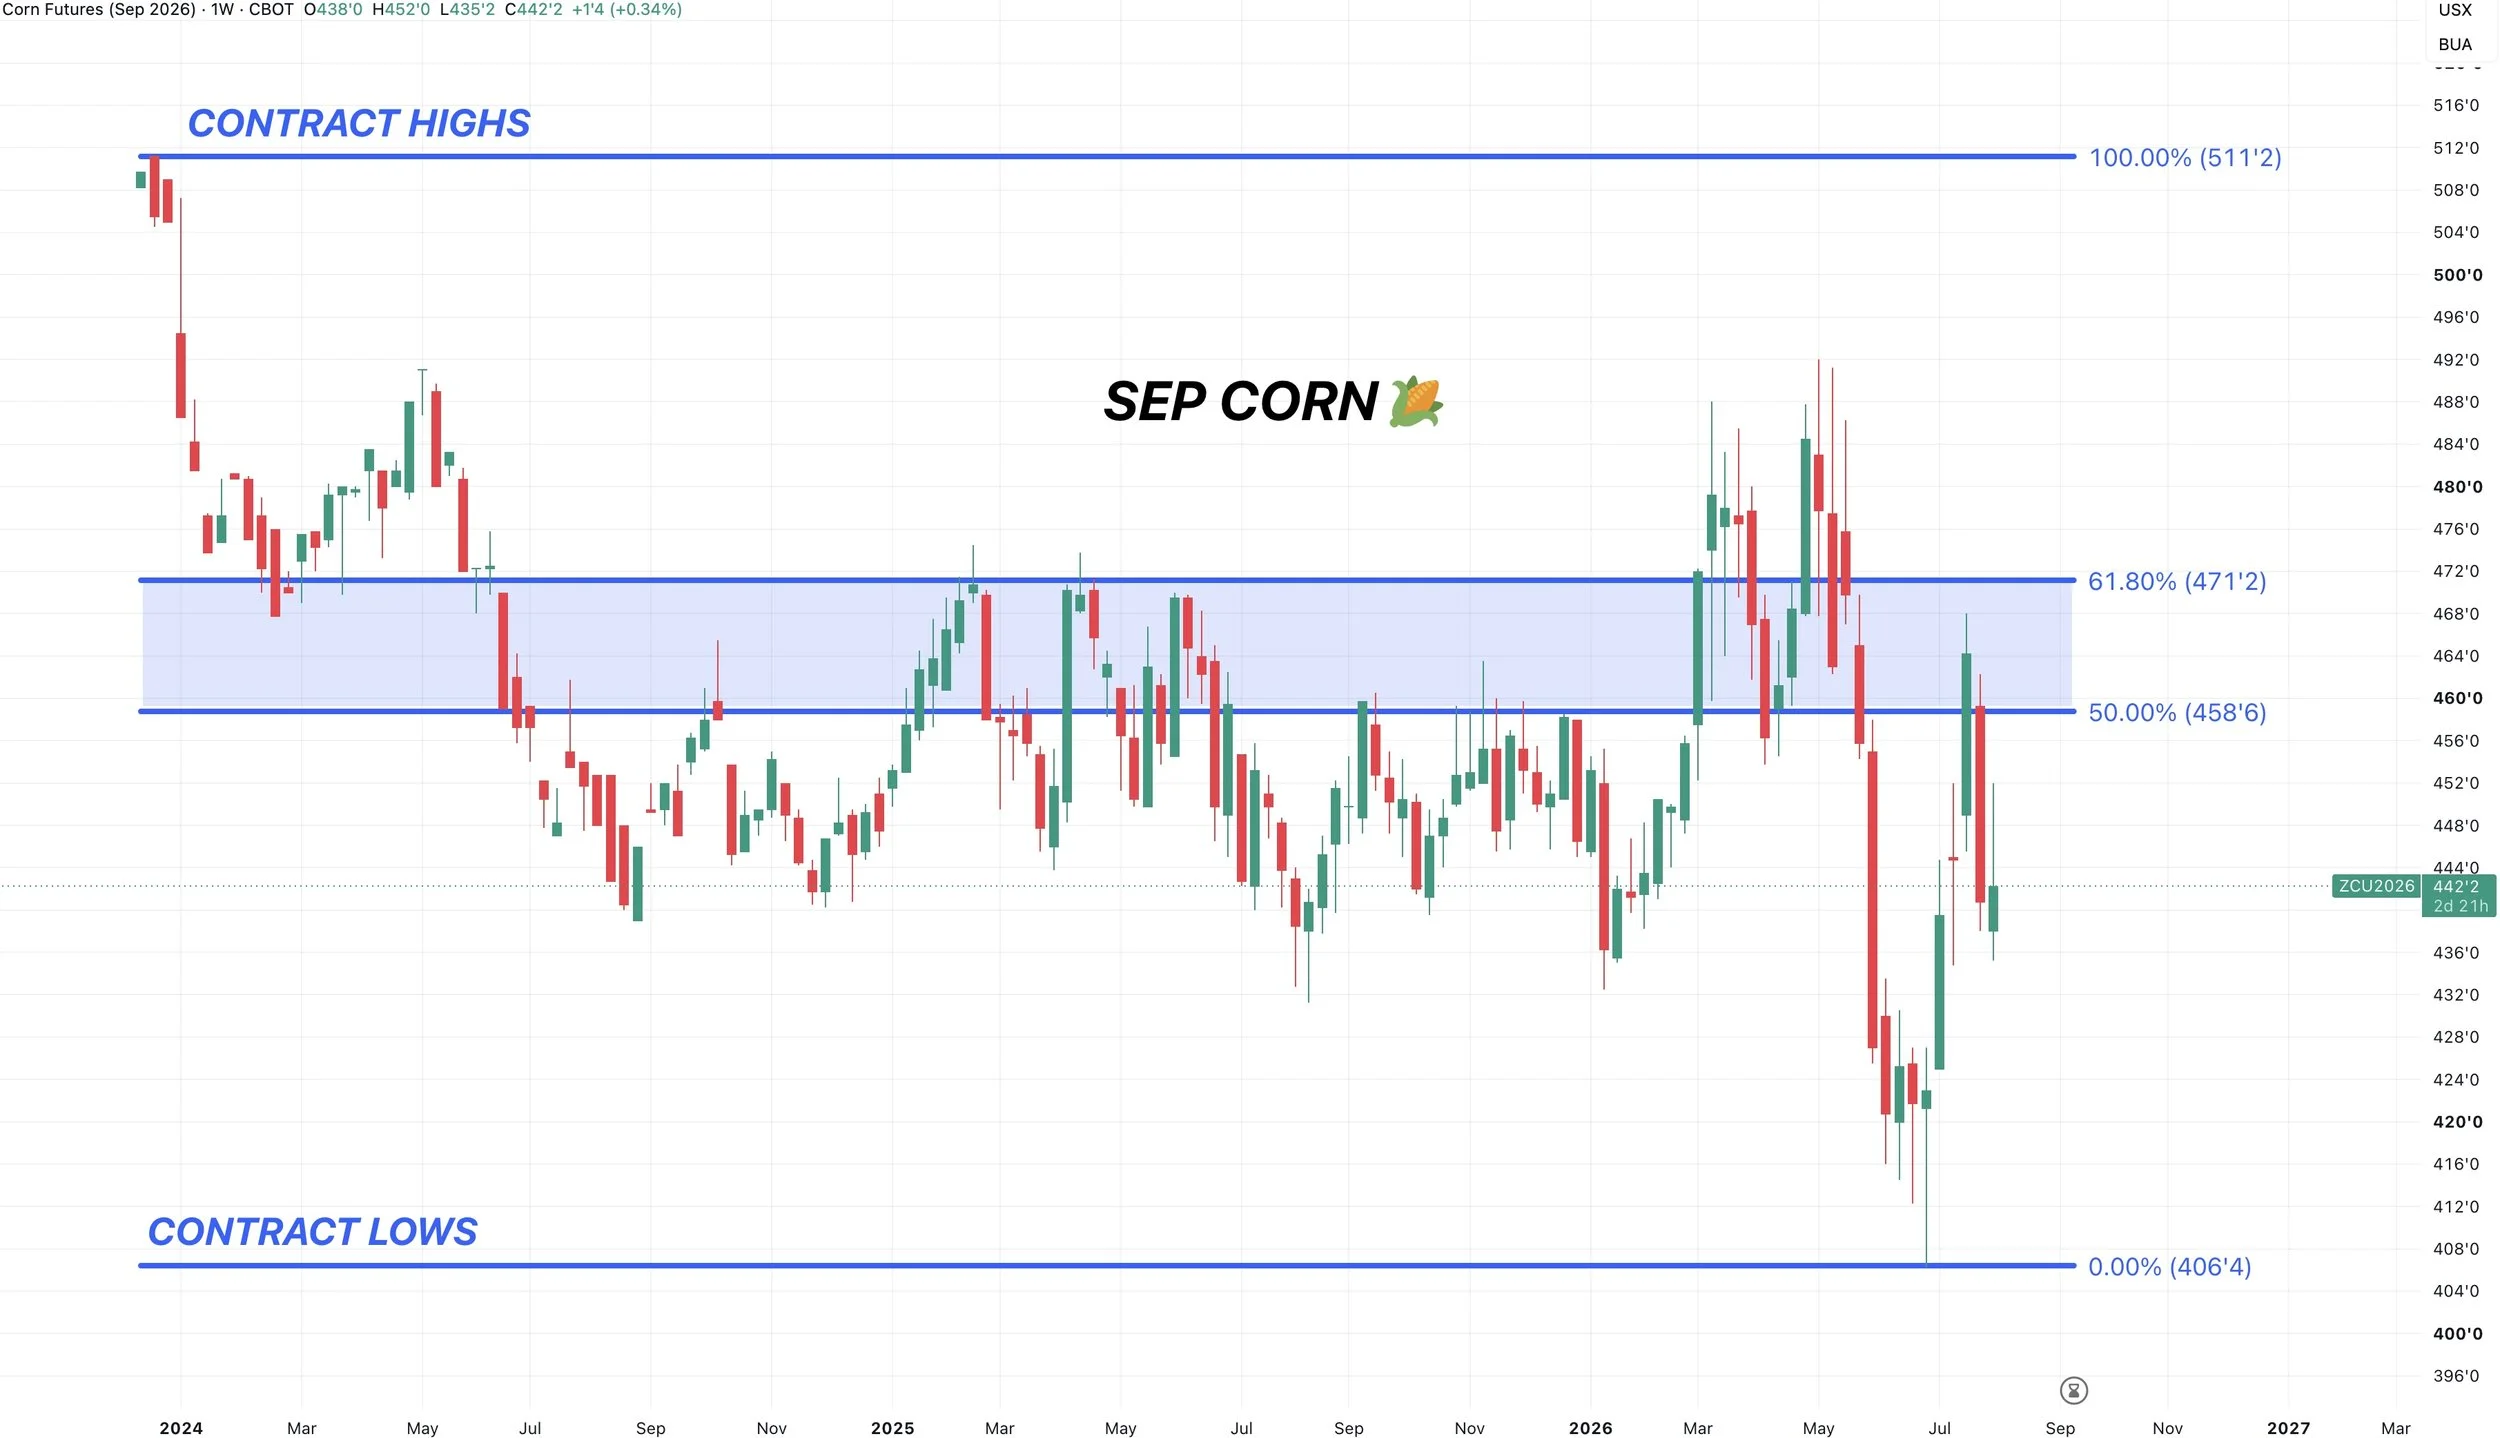
Now bulls want to defend the golden zone to the downside.
We've already given back 50% of the entire rally from contract lows.
We need to hold these 50% to 61.8% levels.
This is where the market often tells us whether this is simply a correction or if the market is starting to fall apart.
Not only that, this zone is where the market bottomed out at twice in the past.
Break that level and we likely revisit the lows.
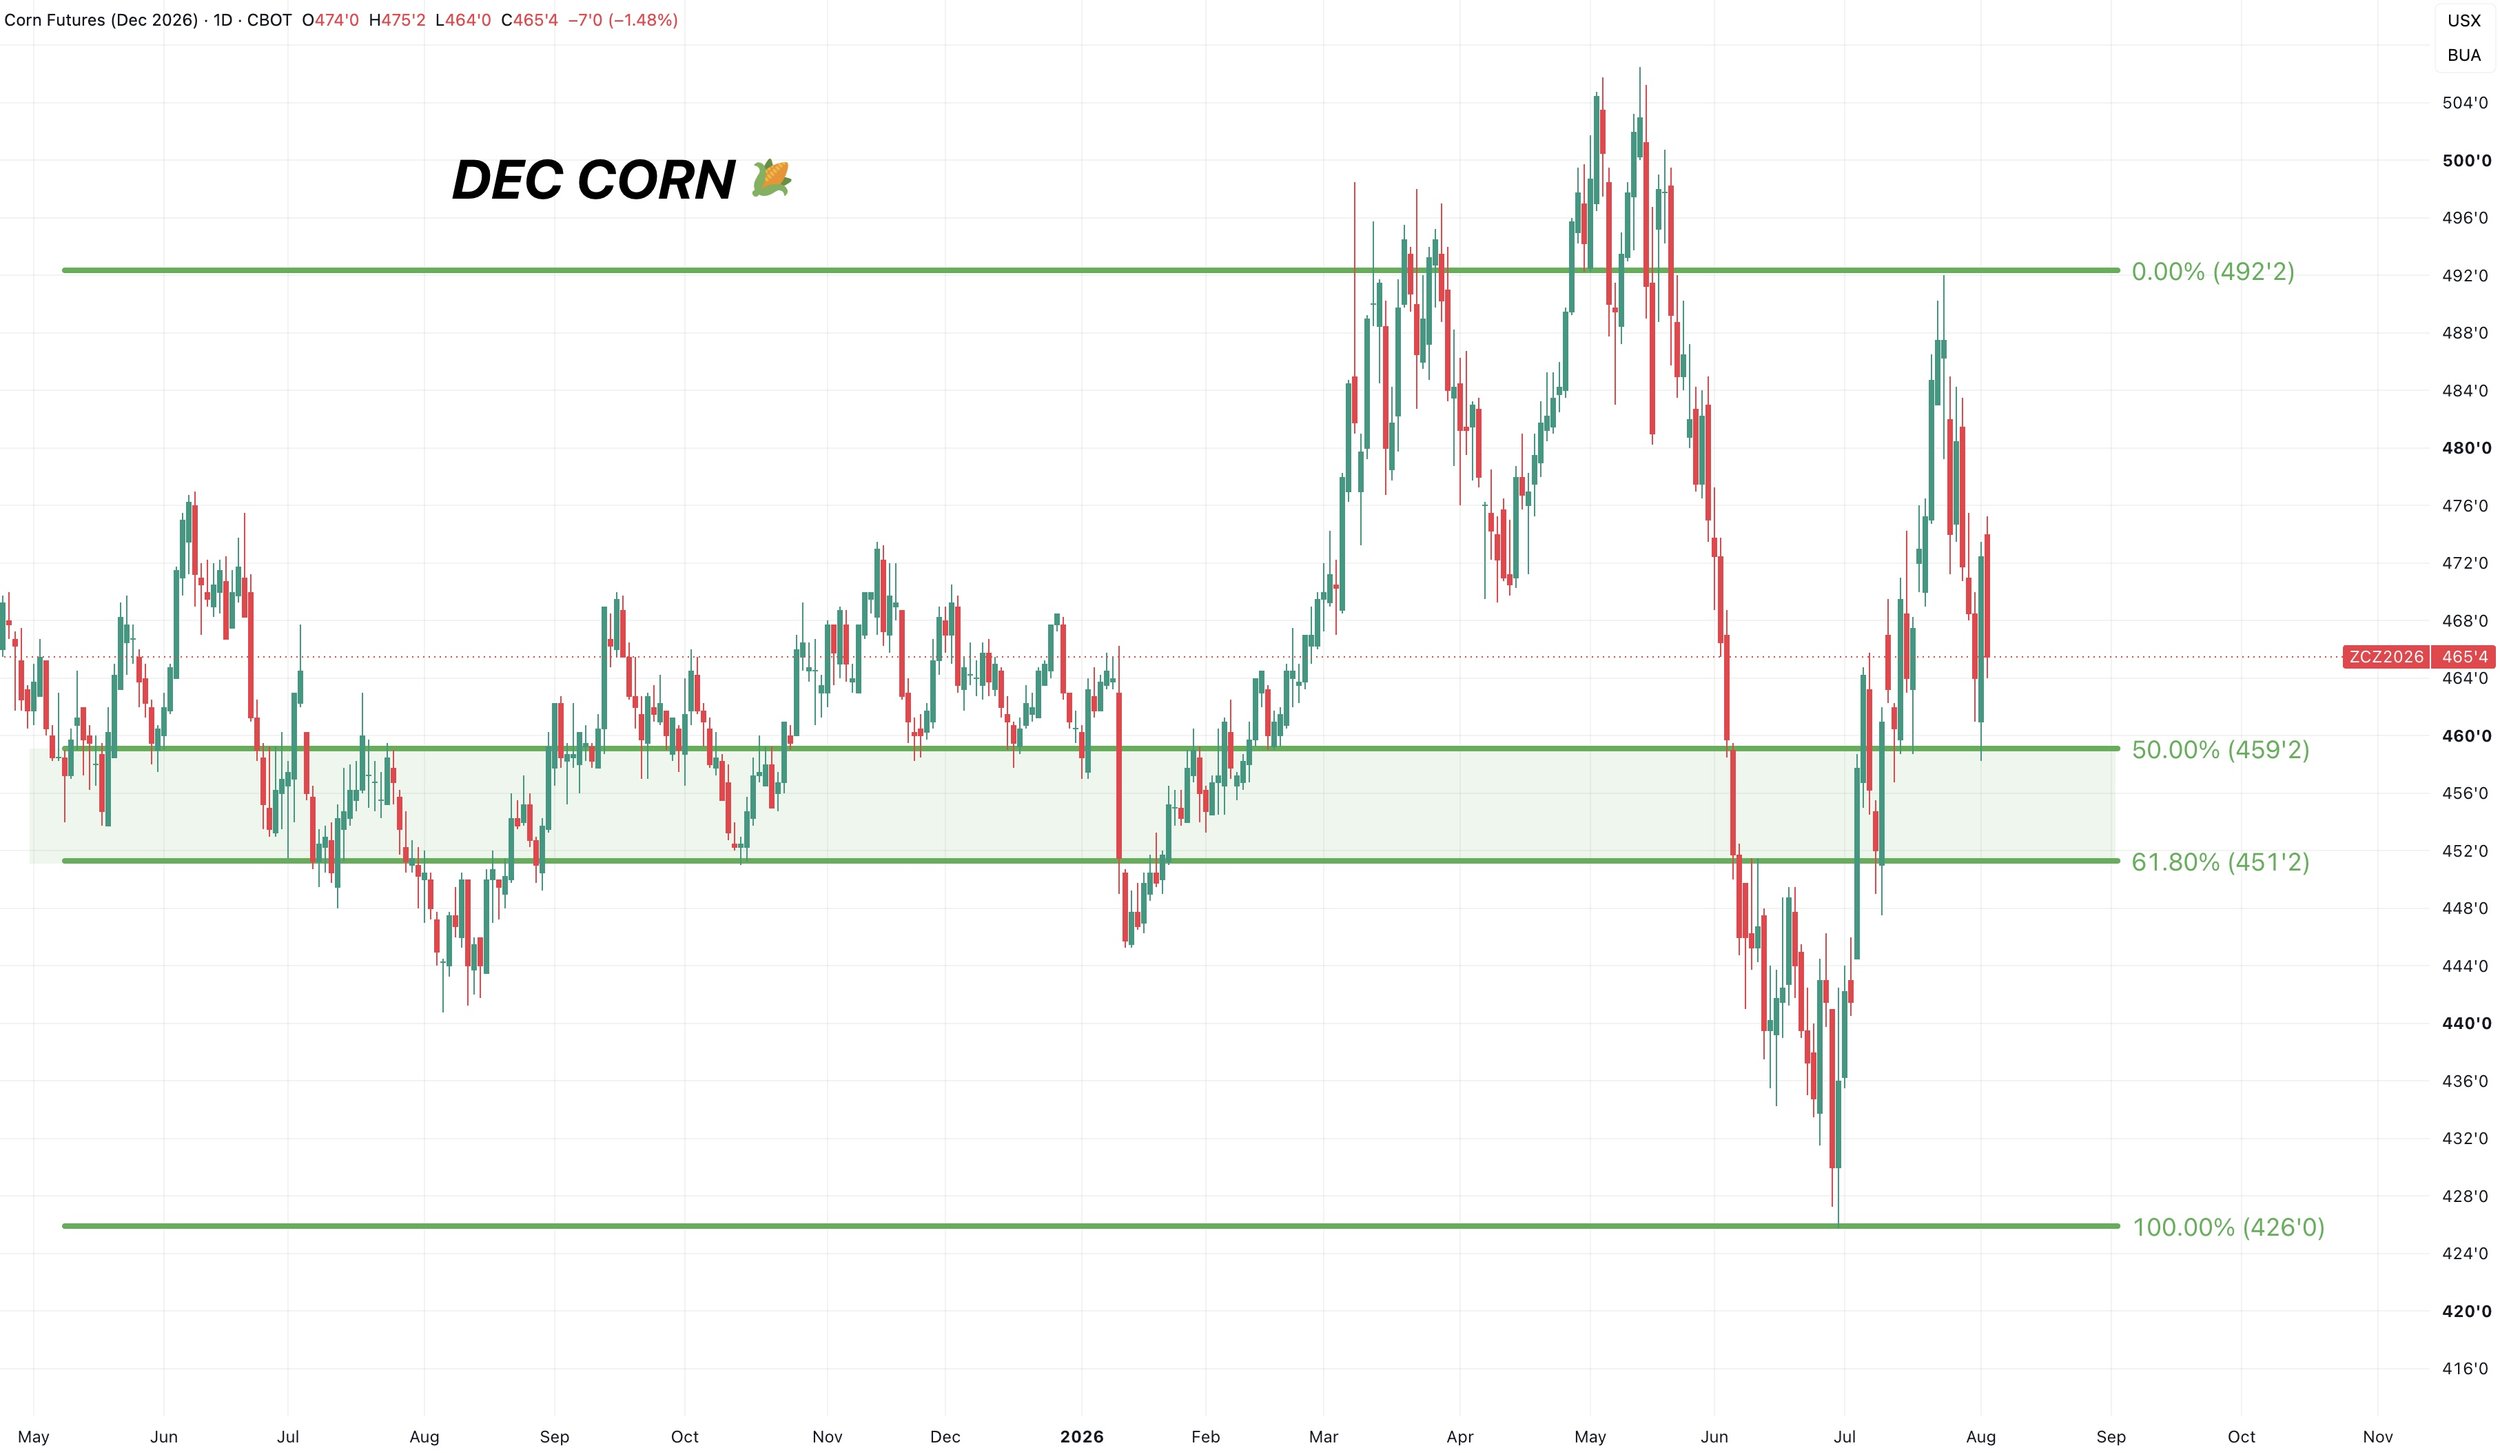
Dec Corn Chart:
Same story in Dec.
We already gave back 50% of the entire rally.
We need to hold this 50% to 61.8% zone from $4.50 to $4.59 or we likely take a trip back down to the lows.
As this would be the most common area to find a bottom in a simple correction. If you break below, it often tells you it's something more.
Soybeans
The long term bull case:
Today's fundamental section is going to be a lot of things we've already talked about in the past.
Let's run through it anyways.
The soybean balance sheet actually has even less room for error than corn does.
Anything below trend drastically cuts into that carryout.
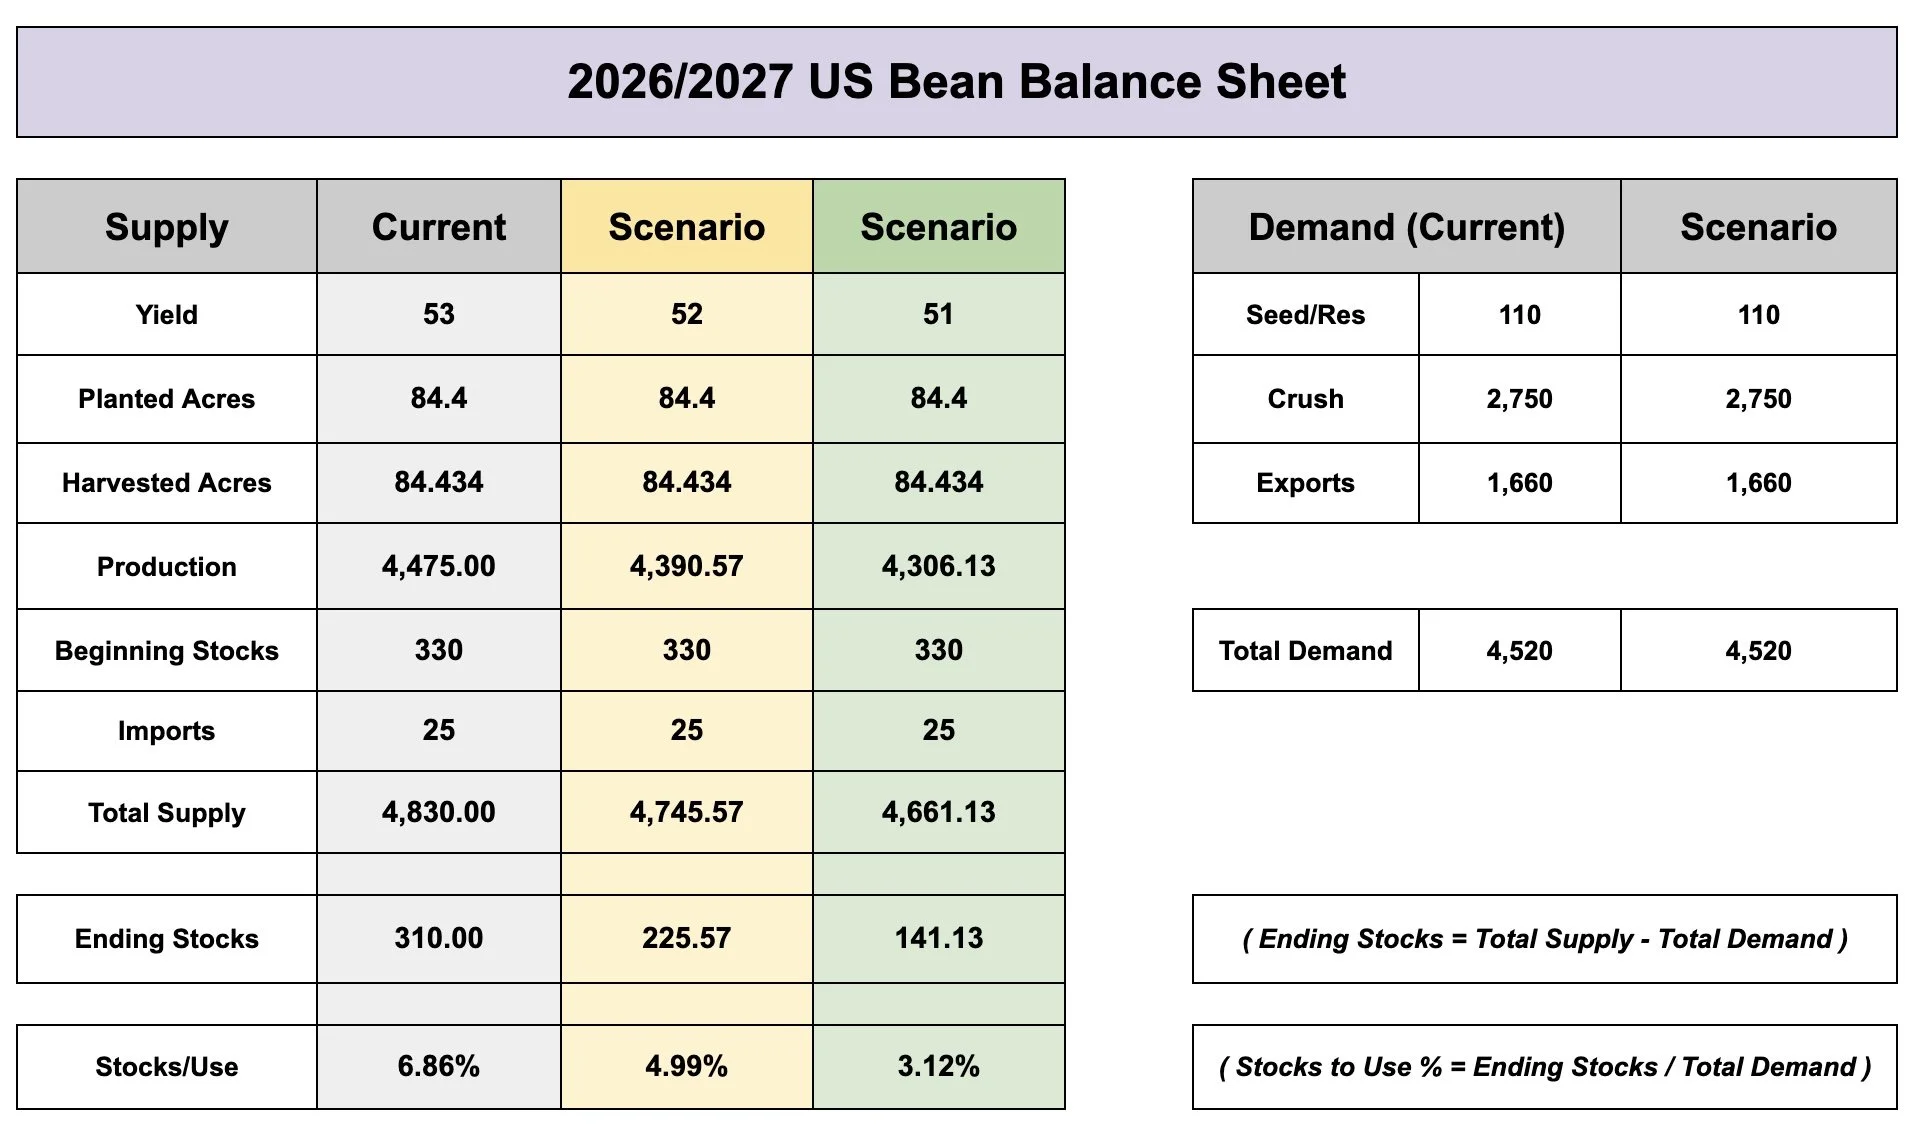
I am not an agronomist so I have zero idea where yield will ultimately end up.
Maybe it's above trend, maybe it's not.
What we do know is that a carryout below 300 million would usually be associated with higher prices.
Does that have to happen? No. Not if yield is trendline or higher.
But the potential is there is yield is not.
Even with a trendline yield, our carryout is still the lowest it's been in years either way.
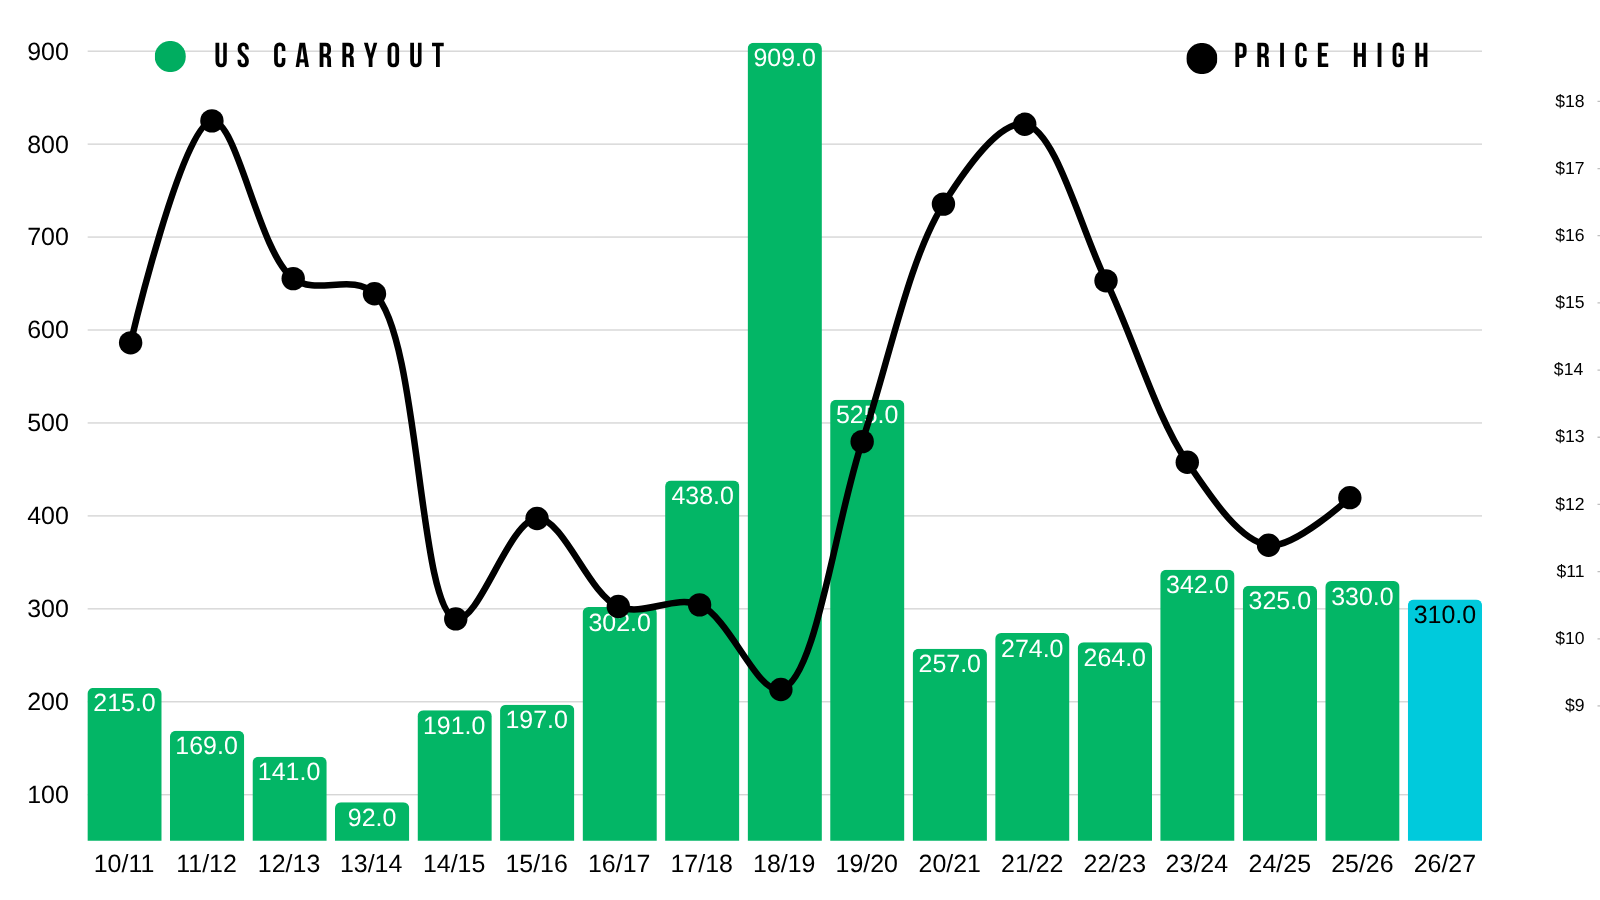
If supply were to end up light, the USDA would be forced to ration demand lower to prevent the carryout from being too tight.
It's their way of balancing the balance sheet.
The USDA already expects our exports to be poor.
So what is the only way to justify them getting even worse? That would likely be higher prices.
Especially if China is already going to be buying 25 MMT of our soybeans no matter what the price of ours are.
If something is higher priced, it leads to less demand. If something is cheaper, it leads to more demand.
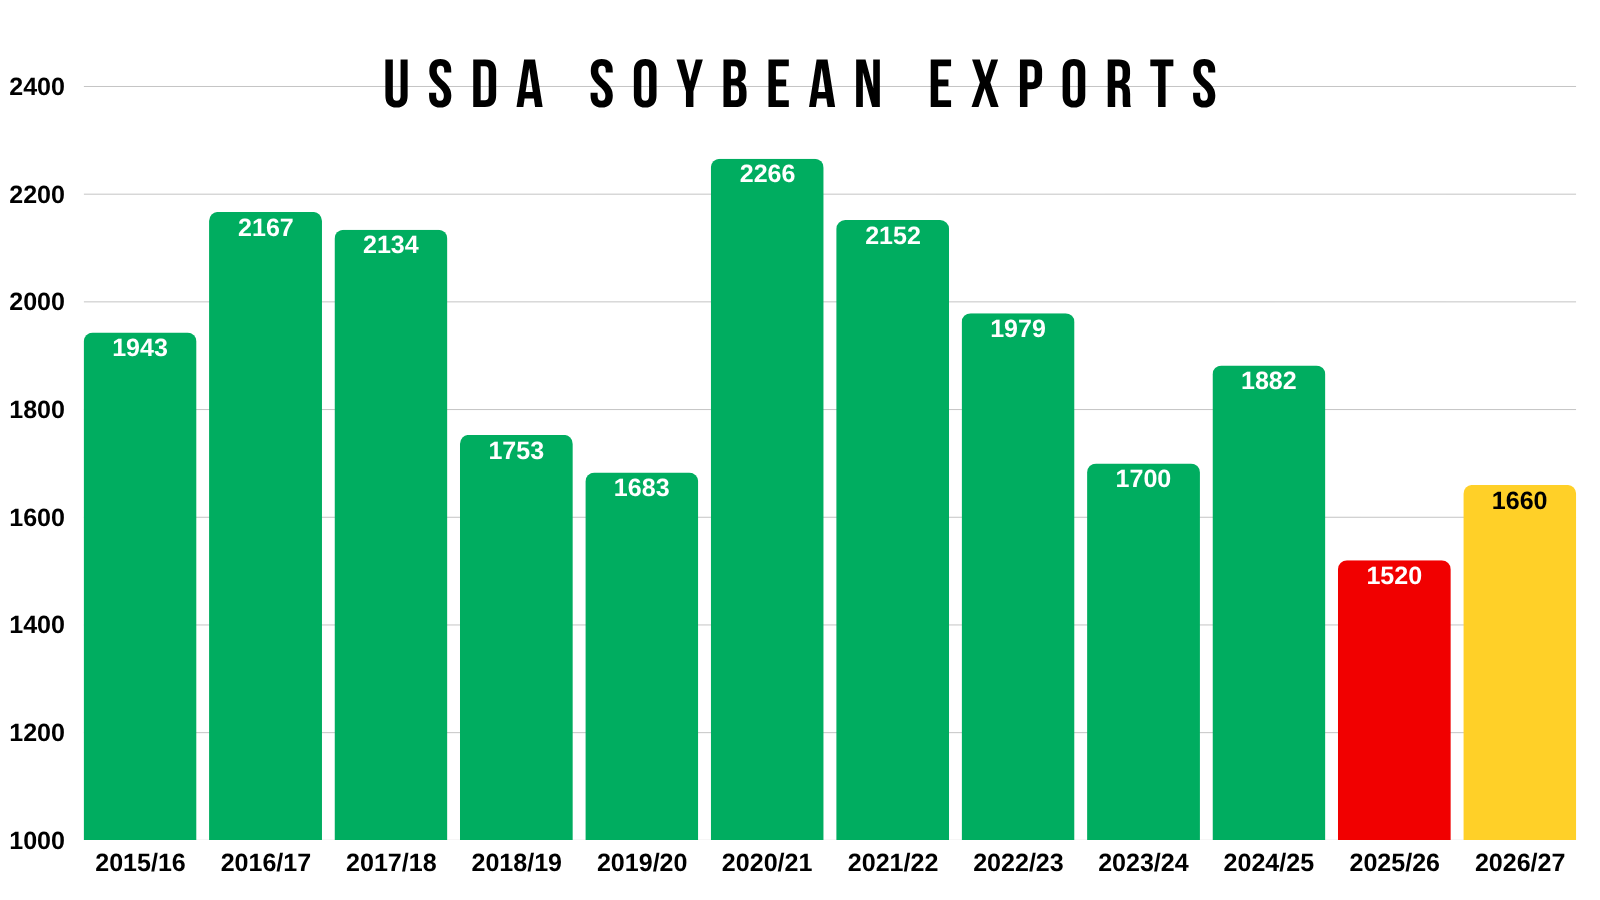
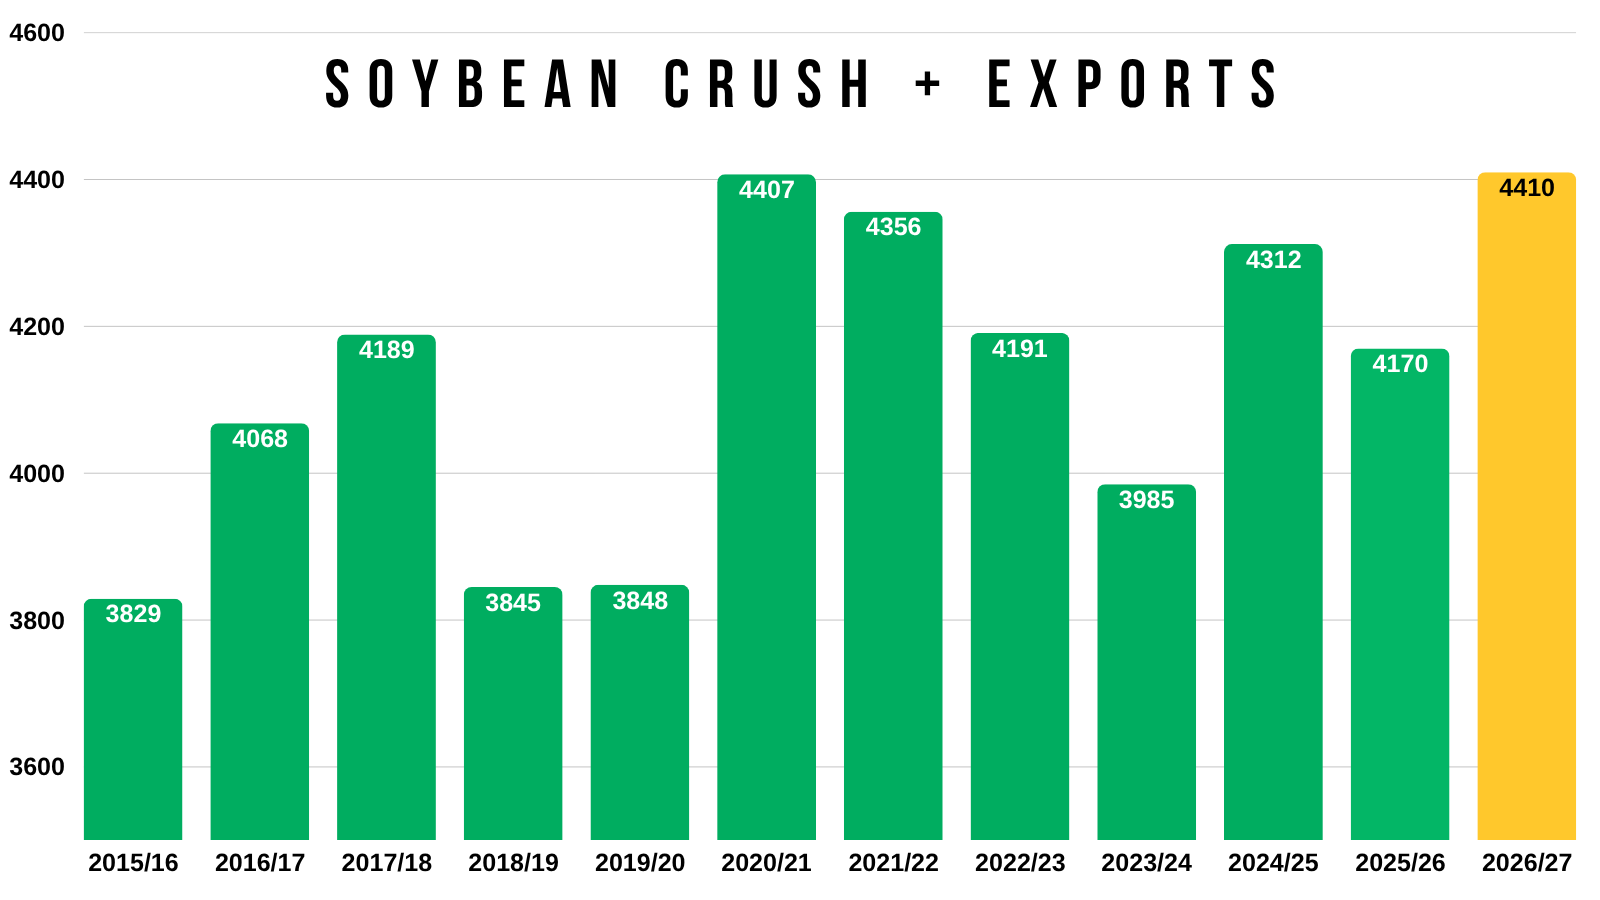
Crush demand is the best it's ever been. It's not going anywhere.
It's outpacing the losses in export demand.
When you combine our total exports plus our crush demand, it's actually the best it's ever been.
So what if exports improve? Or simply just return to normal levels?
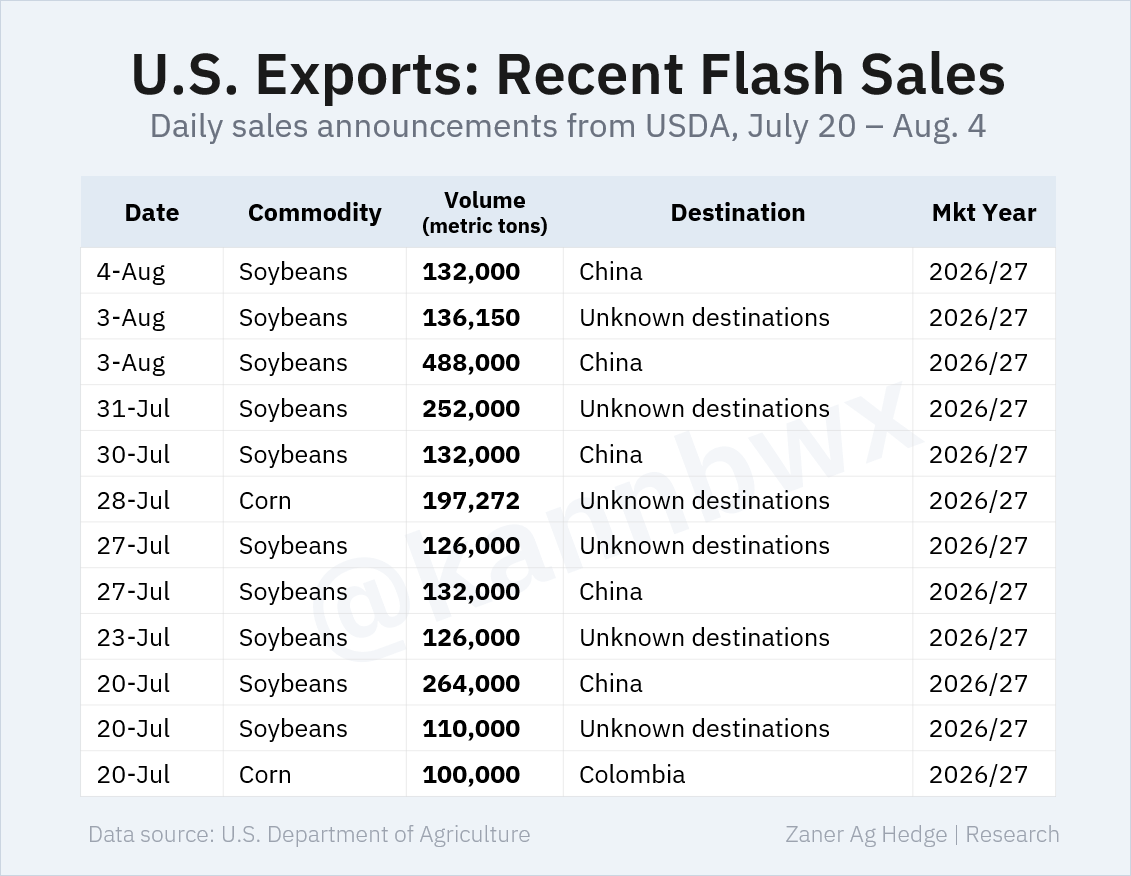
We continue to sell soybeans to China. With plenty of flash sales.
As we've been seeing very consistent buying lately from China. Which is a positive.
Chart from Karen Braun on X
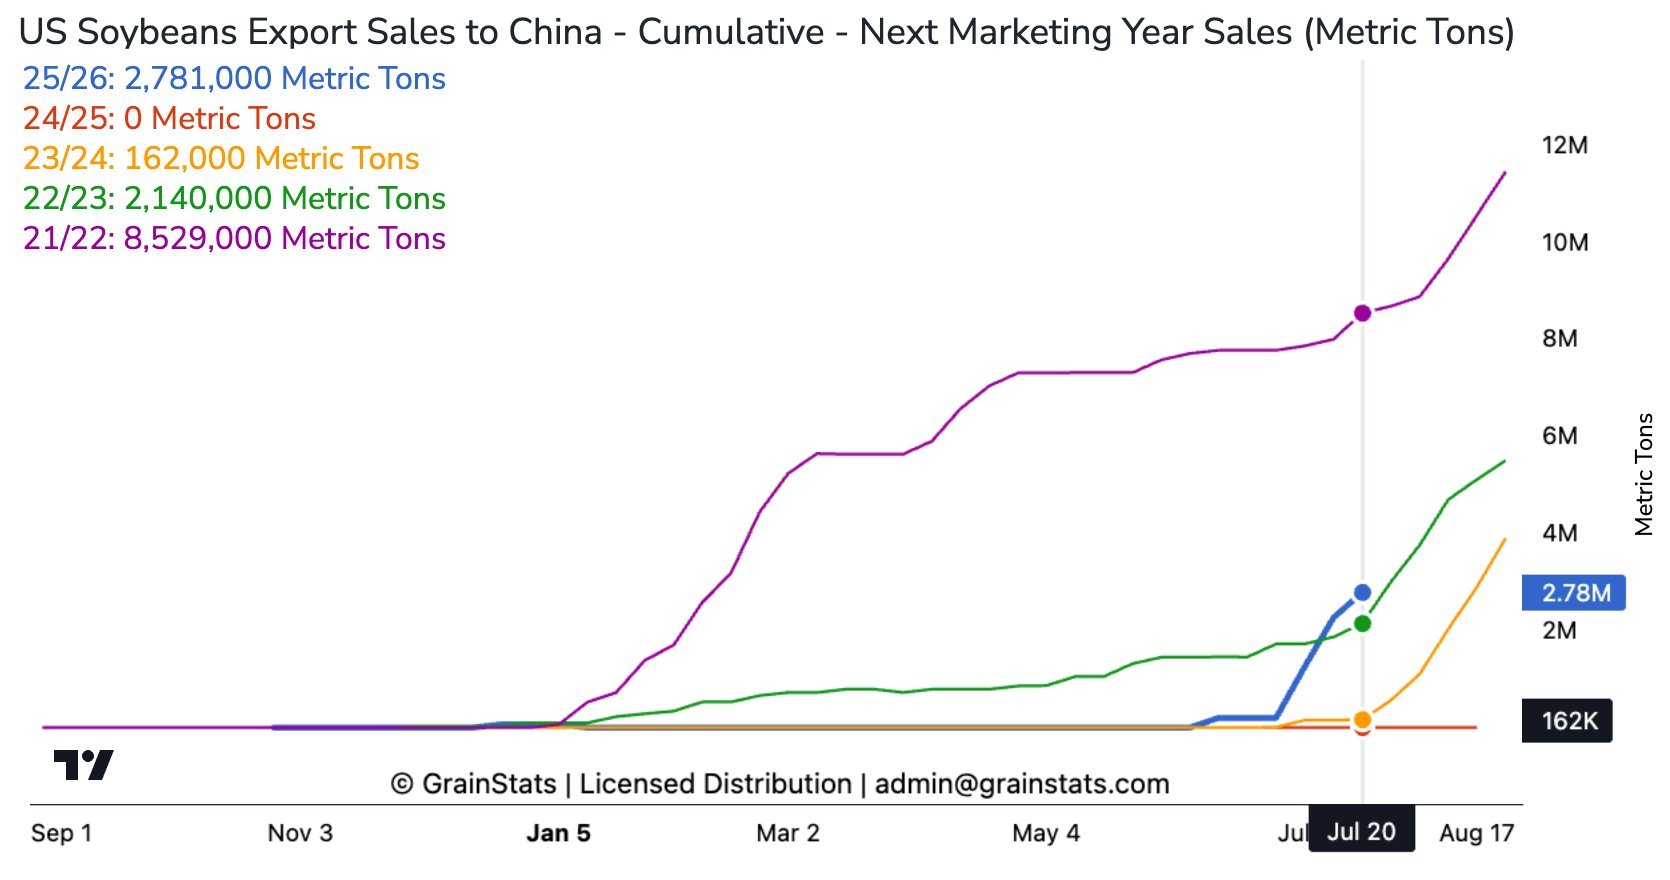
New crop soybean demand has actually been impressive.
Our sales for new crop are actually sitting at 4 year highs in soybeans.
Our soybean export sales to China for the next marketing year are also currently at highest levels in 4 years.
That's not a bearish item.
Chart from GrainStats on X
Just because soybeans have long term potential, does not mean we have to go higher right now or even at all.
Especially if weather is favorable during a weak seasonal time frame.
Which is why I've been preaching about taking some risk off the table the last two weeks if you know you're someone who needs to do so or was short on time.
As we were sitting at some high time frame resistance on the charts.
Long term, we do still have South America's weather market sitting around the corner, which is going to be another big factor come October.
I am already hearing plenty of chatter about the possible impacts from the Super El Niño.
Charts
Nov Beans Chart:
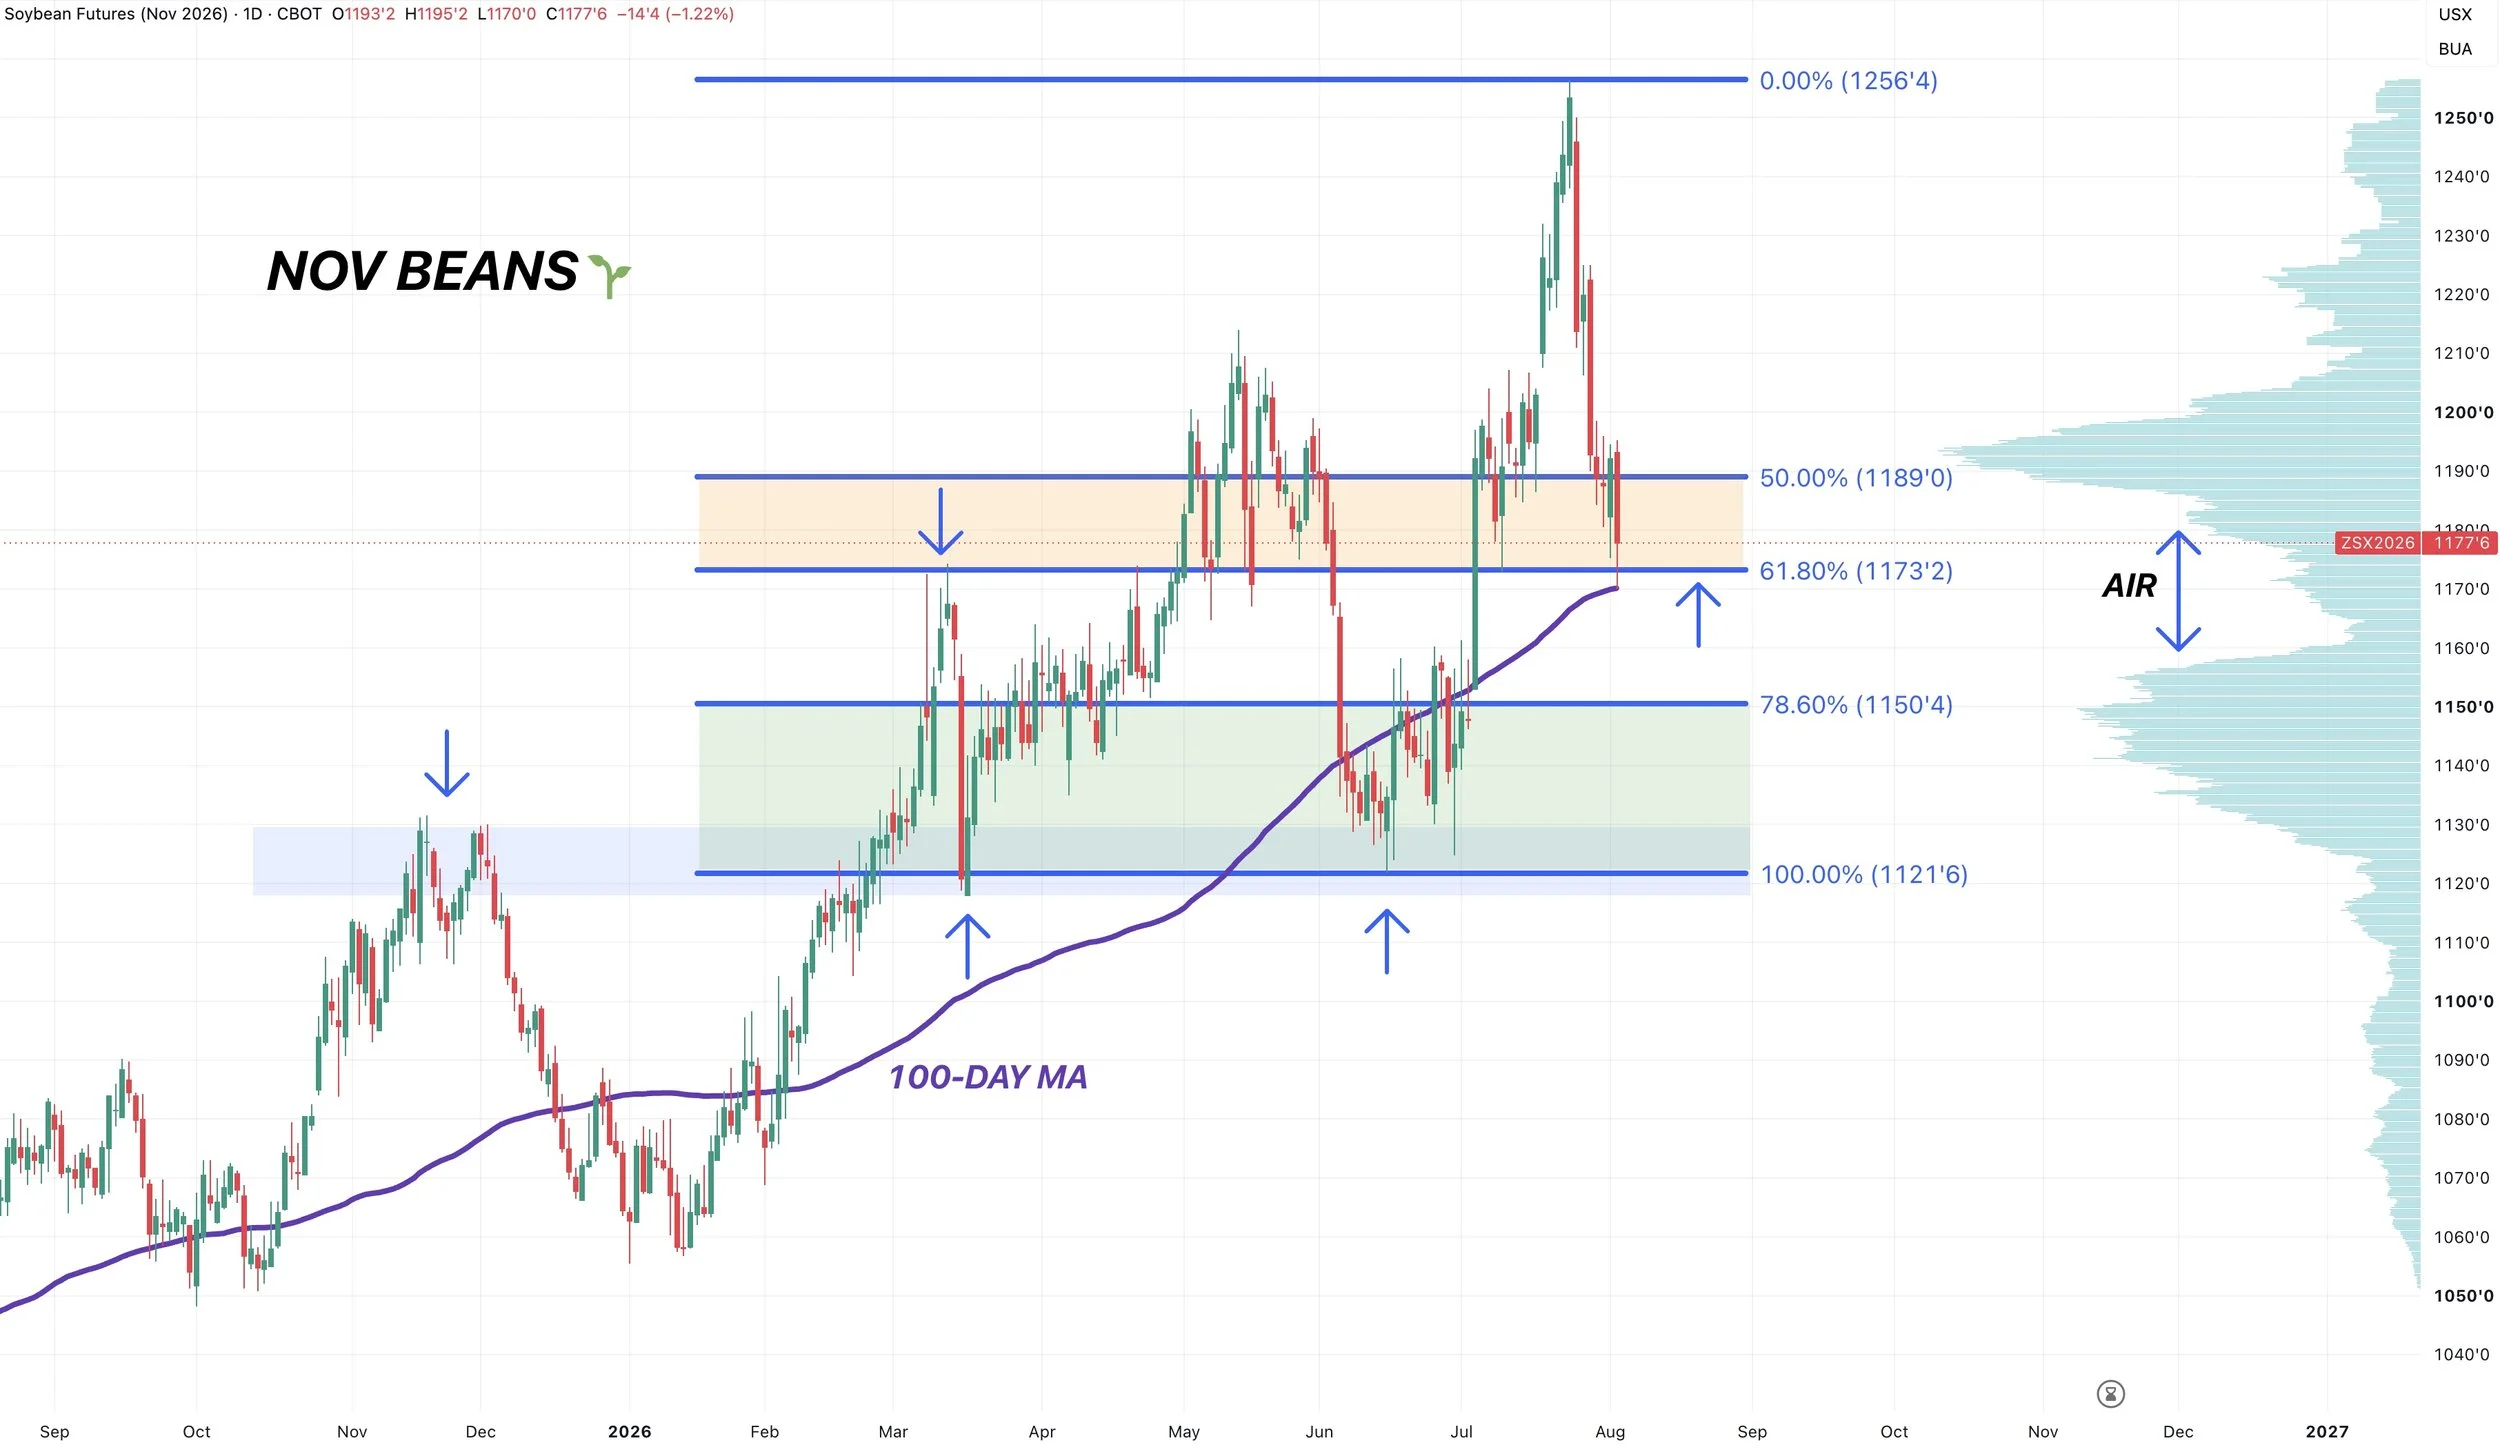
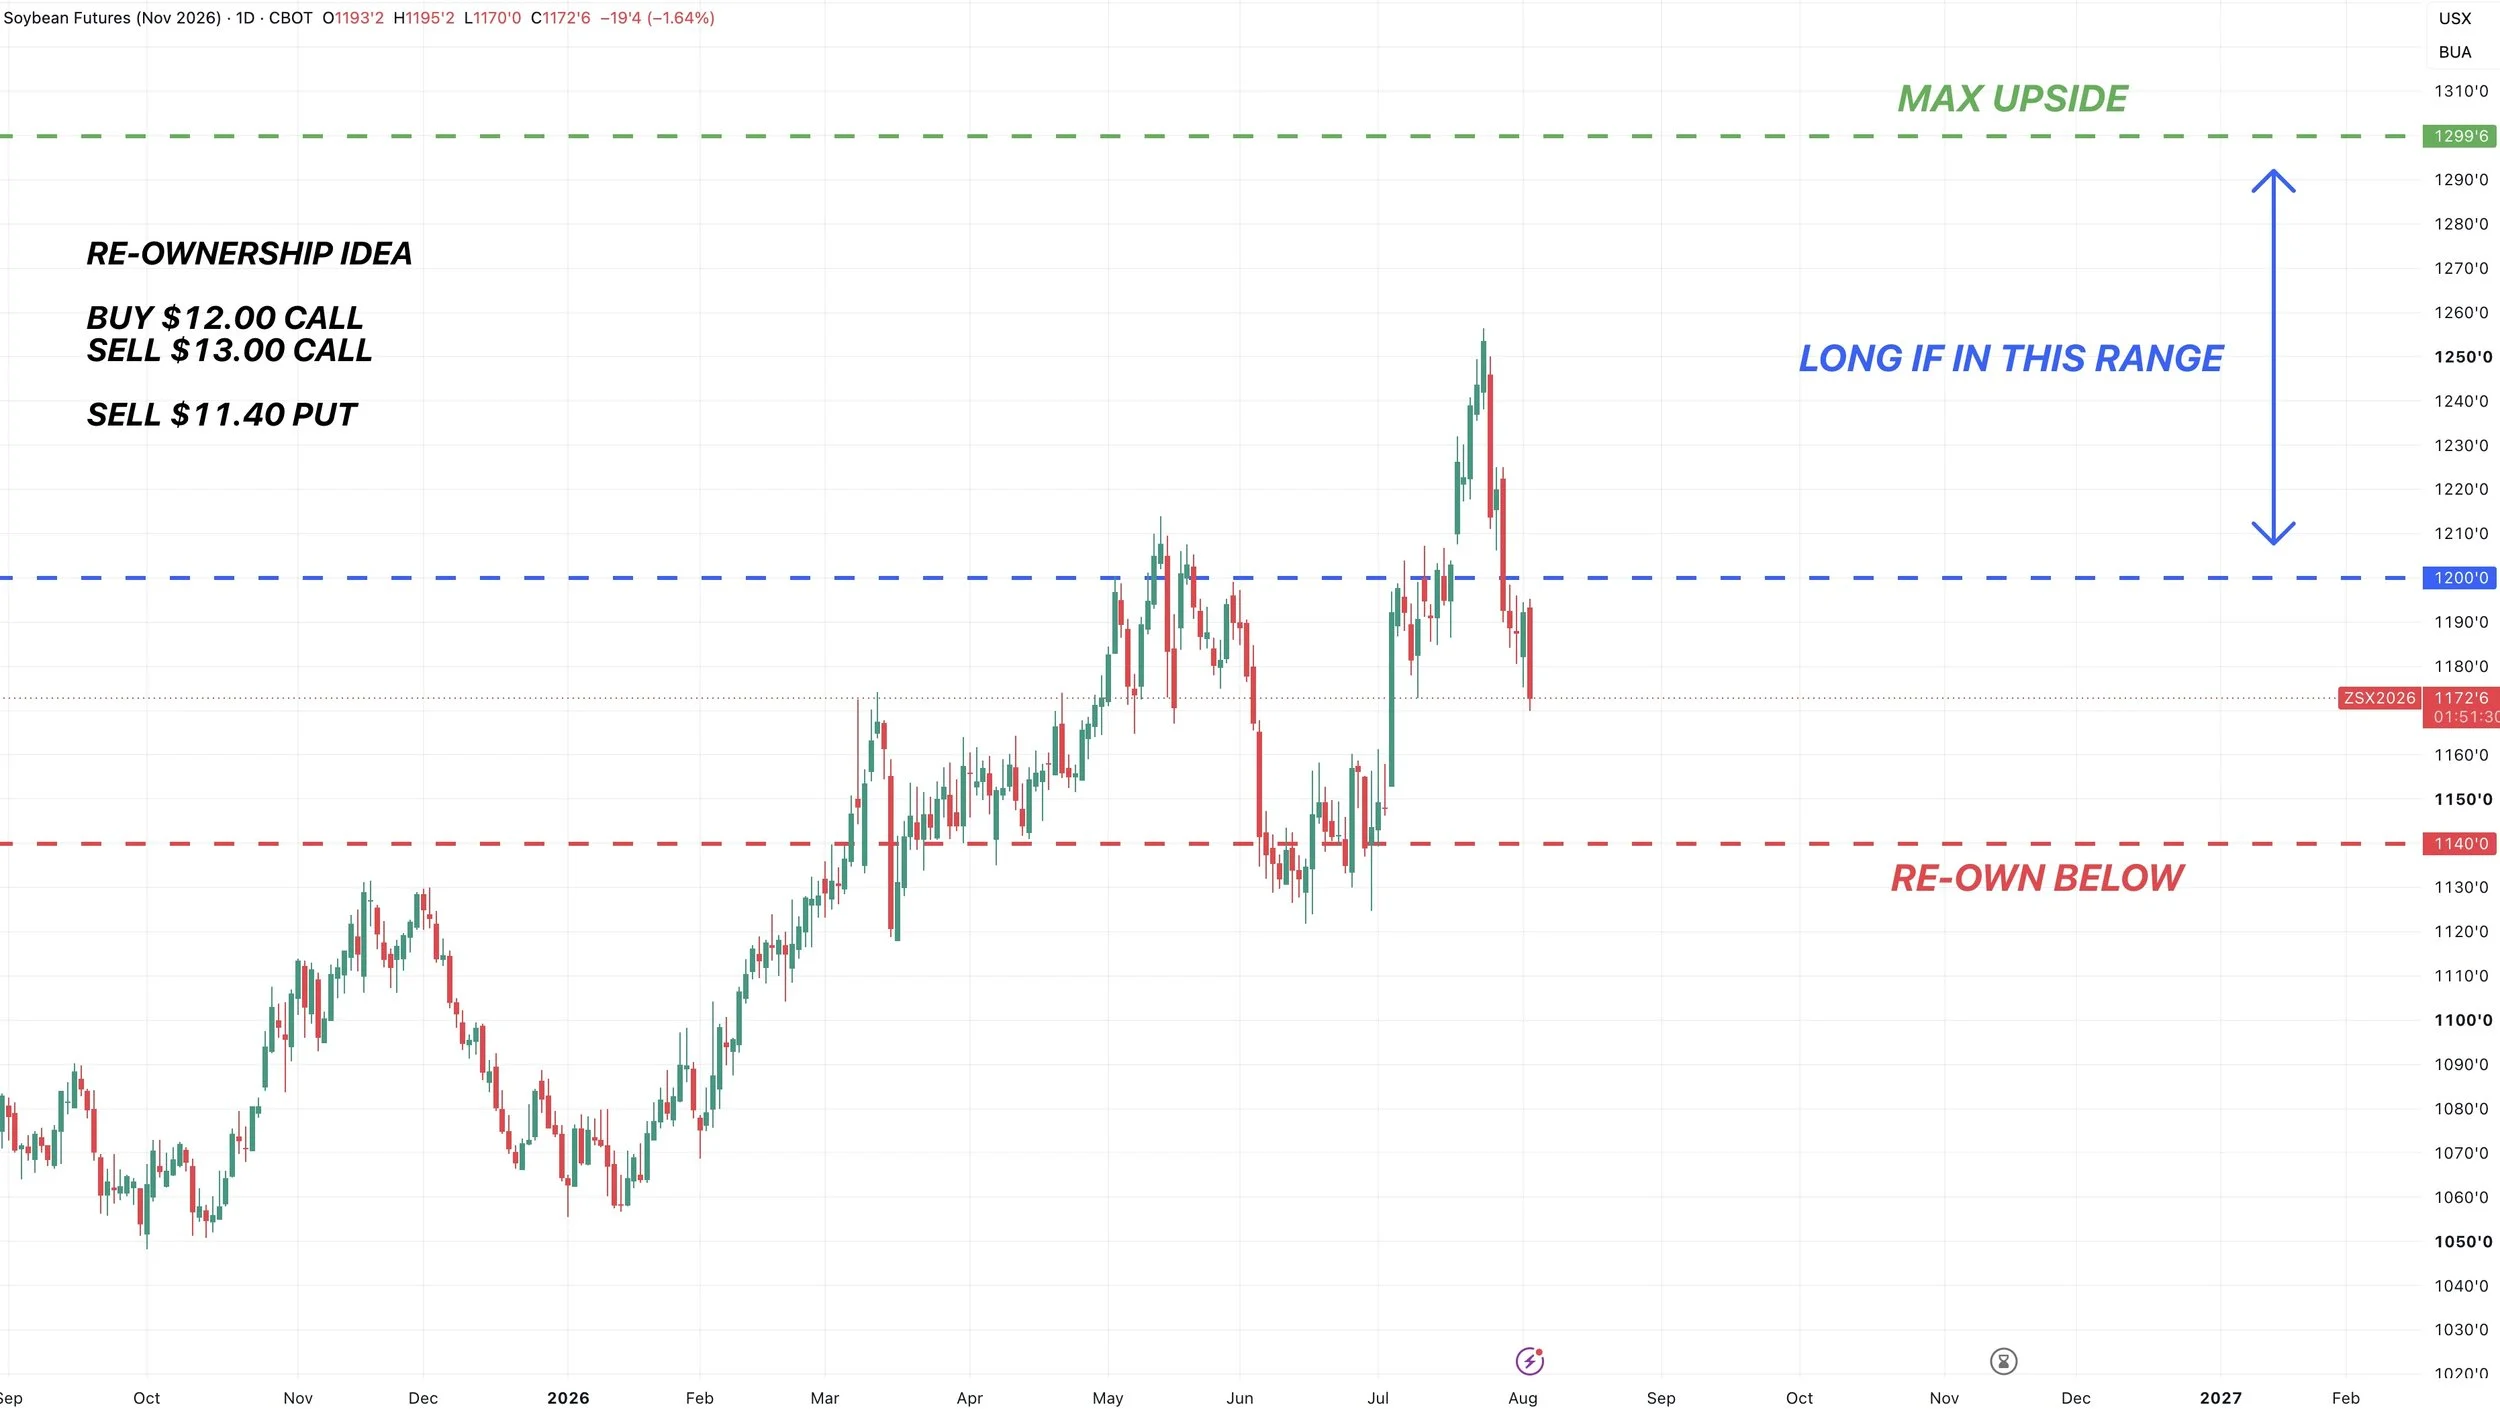
We are sitting a major level here.
We have given back 61.8% of the entire rally. The most common retracement.
This same level is those highs from March. It's been a key support and resistance level several times before.
We also tapped the 100-day MA today.
If we are going to bounce.. this is where we would expect it to happen.
We do not have to bounce, but this is where it would make sense for us to do so.
This is however also a must hold level.
If we break below, it would suggest this isn’t your typcial correction before resuming the uptrend.
It would likely spark a leg lower towards the bottom of the range, as we do still have the volume gap to the downside with plenty of air to the downside.
So it's where we'd expect us to bounce but also a very key level to hold.
Re-Ownership Idea:
*Disclaimer: Futures and options are risky and not suitable for everyone. This is our opinion and should be treated as such.
There are two strategies we like considering if you are someone who wants to re-own soybeans and sold some higher than we are today.
Strategy 1:
Buy $12.00 call
Sell $13.00 call
Sell $11.40 put
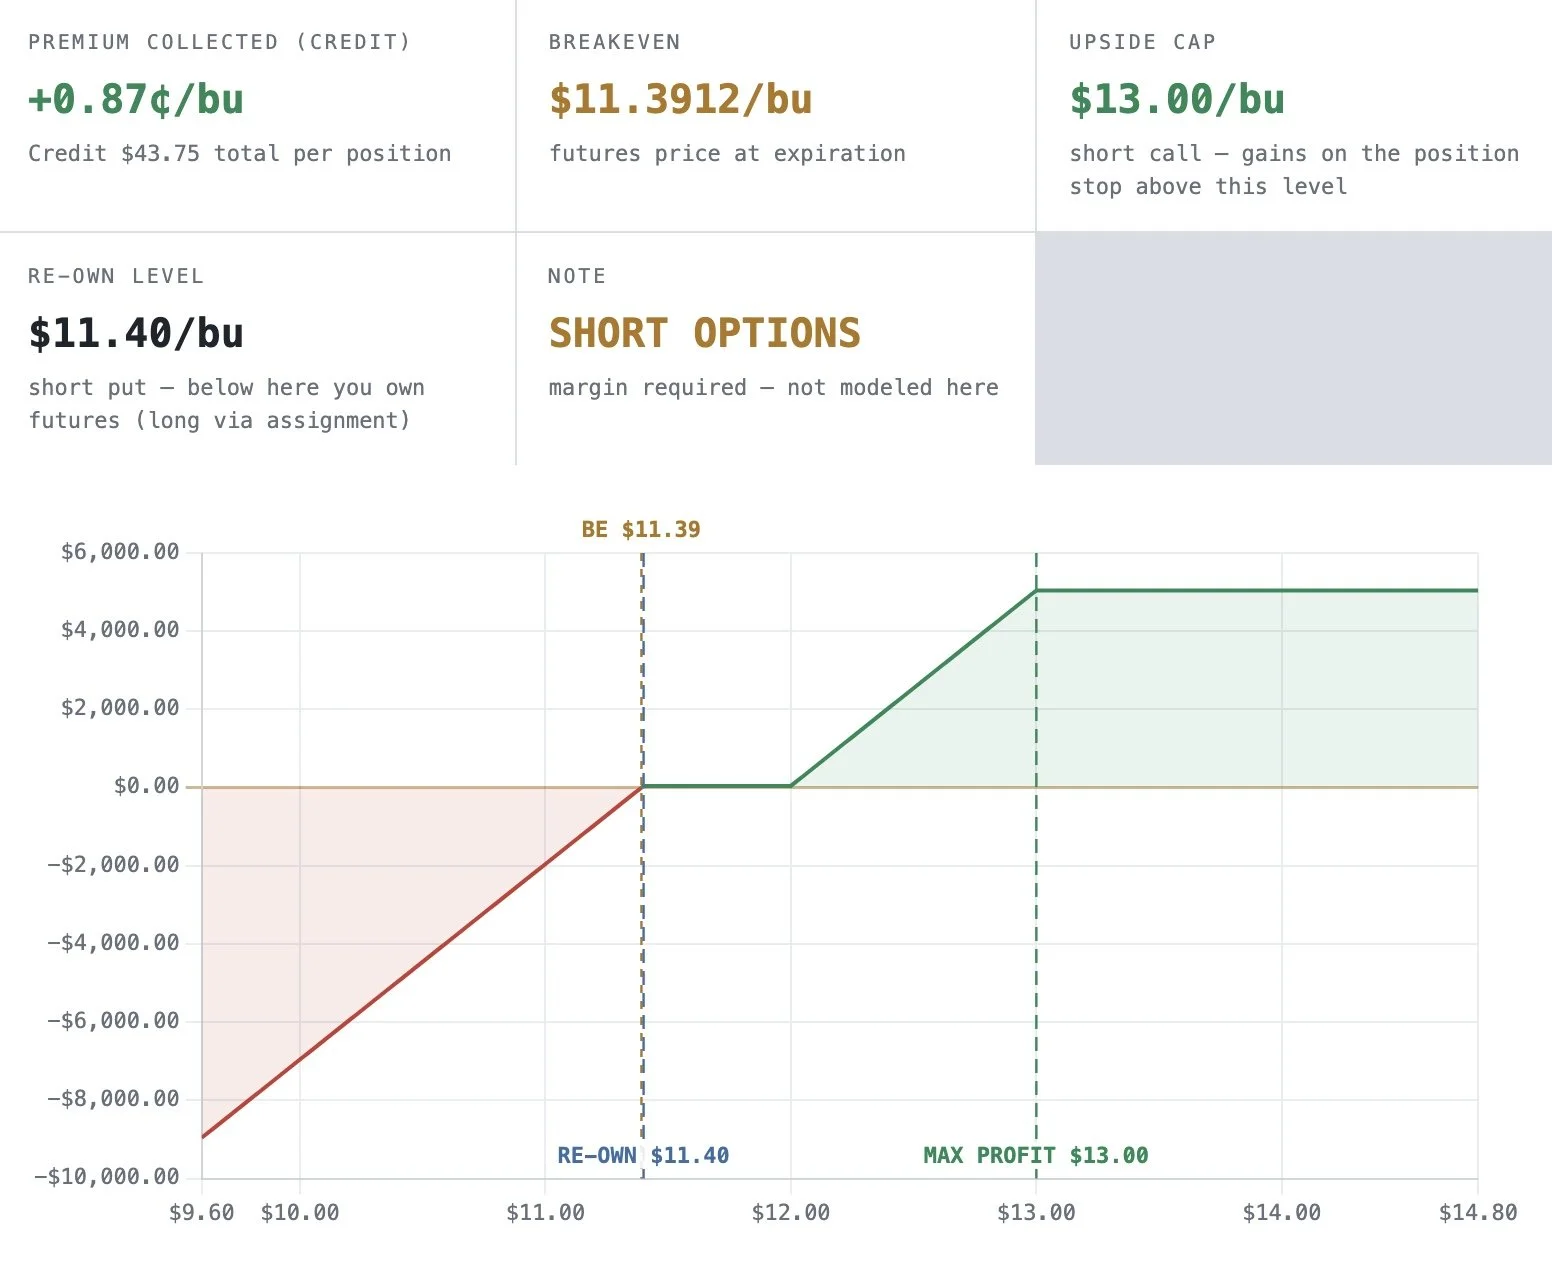
This would be roughly a zero cost trade but does include margin.
Essentially, you would make money and be long from $12.00 to $13.00 at expiration with a max upside of $13.00
You would re-own via futures if we dropped to $11.40, which is near those yearly lows.
Strategy 2:
Would simply be a long futures position with a stop loss below today's lows. Since this is key support, it offers an area where you can define your risk.
But as always, there is never anything wrong with walking away from a good sale you are happy with. These are just some ideas for those who want to re-own.
If you have any questions or want to talk, feel free to reach out, as these may or may not be suitable for your operation, and all involve different risks.
Office: (806)484-1214
Visuals for Strategy 1
Front Month Chart:
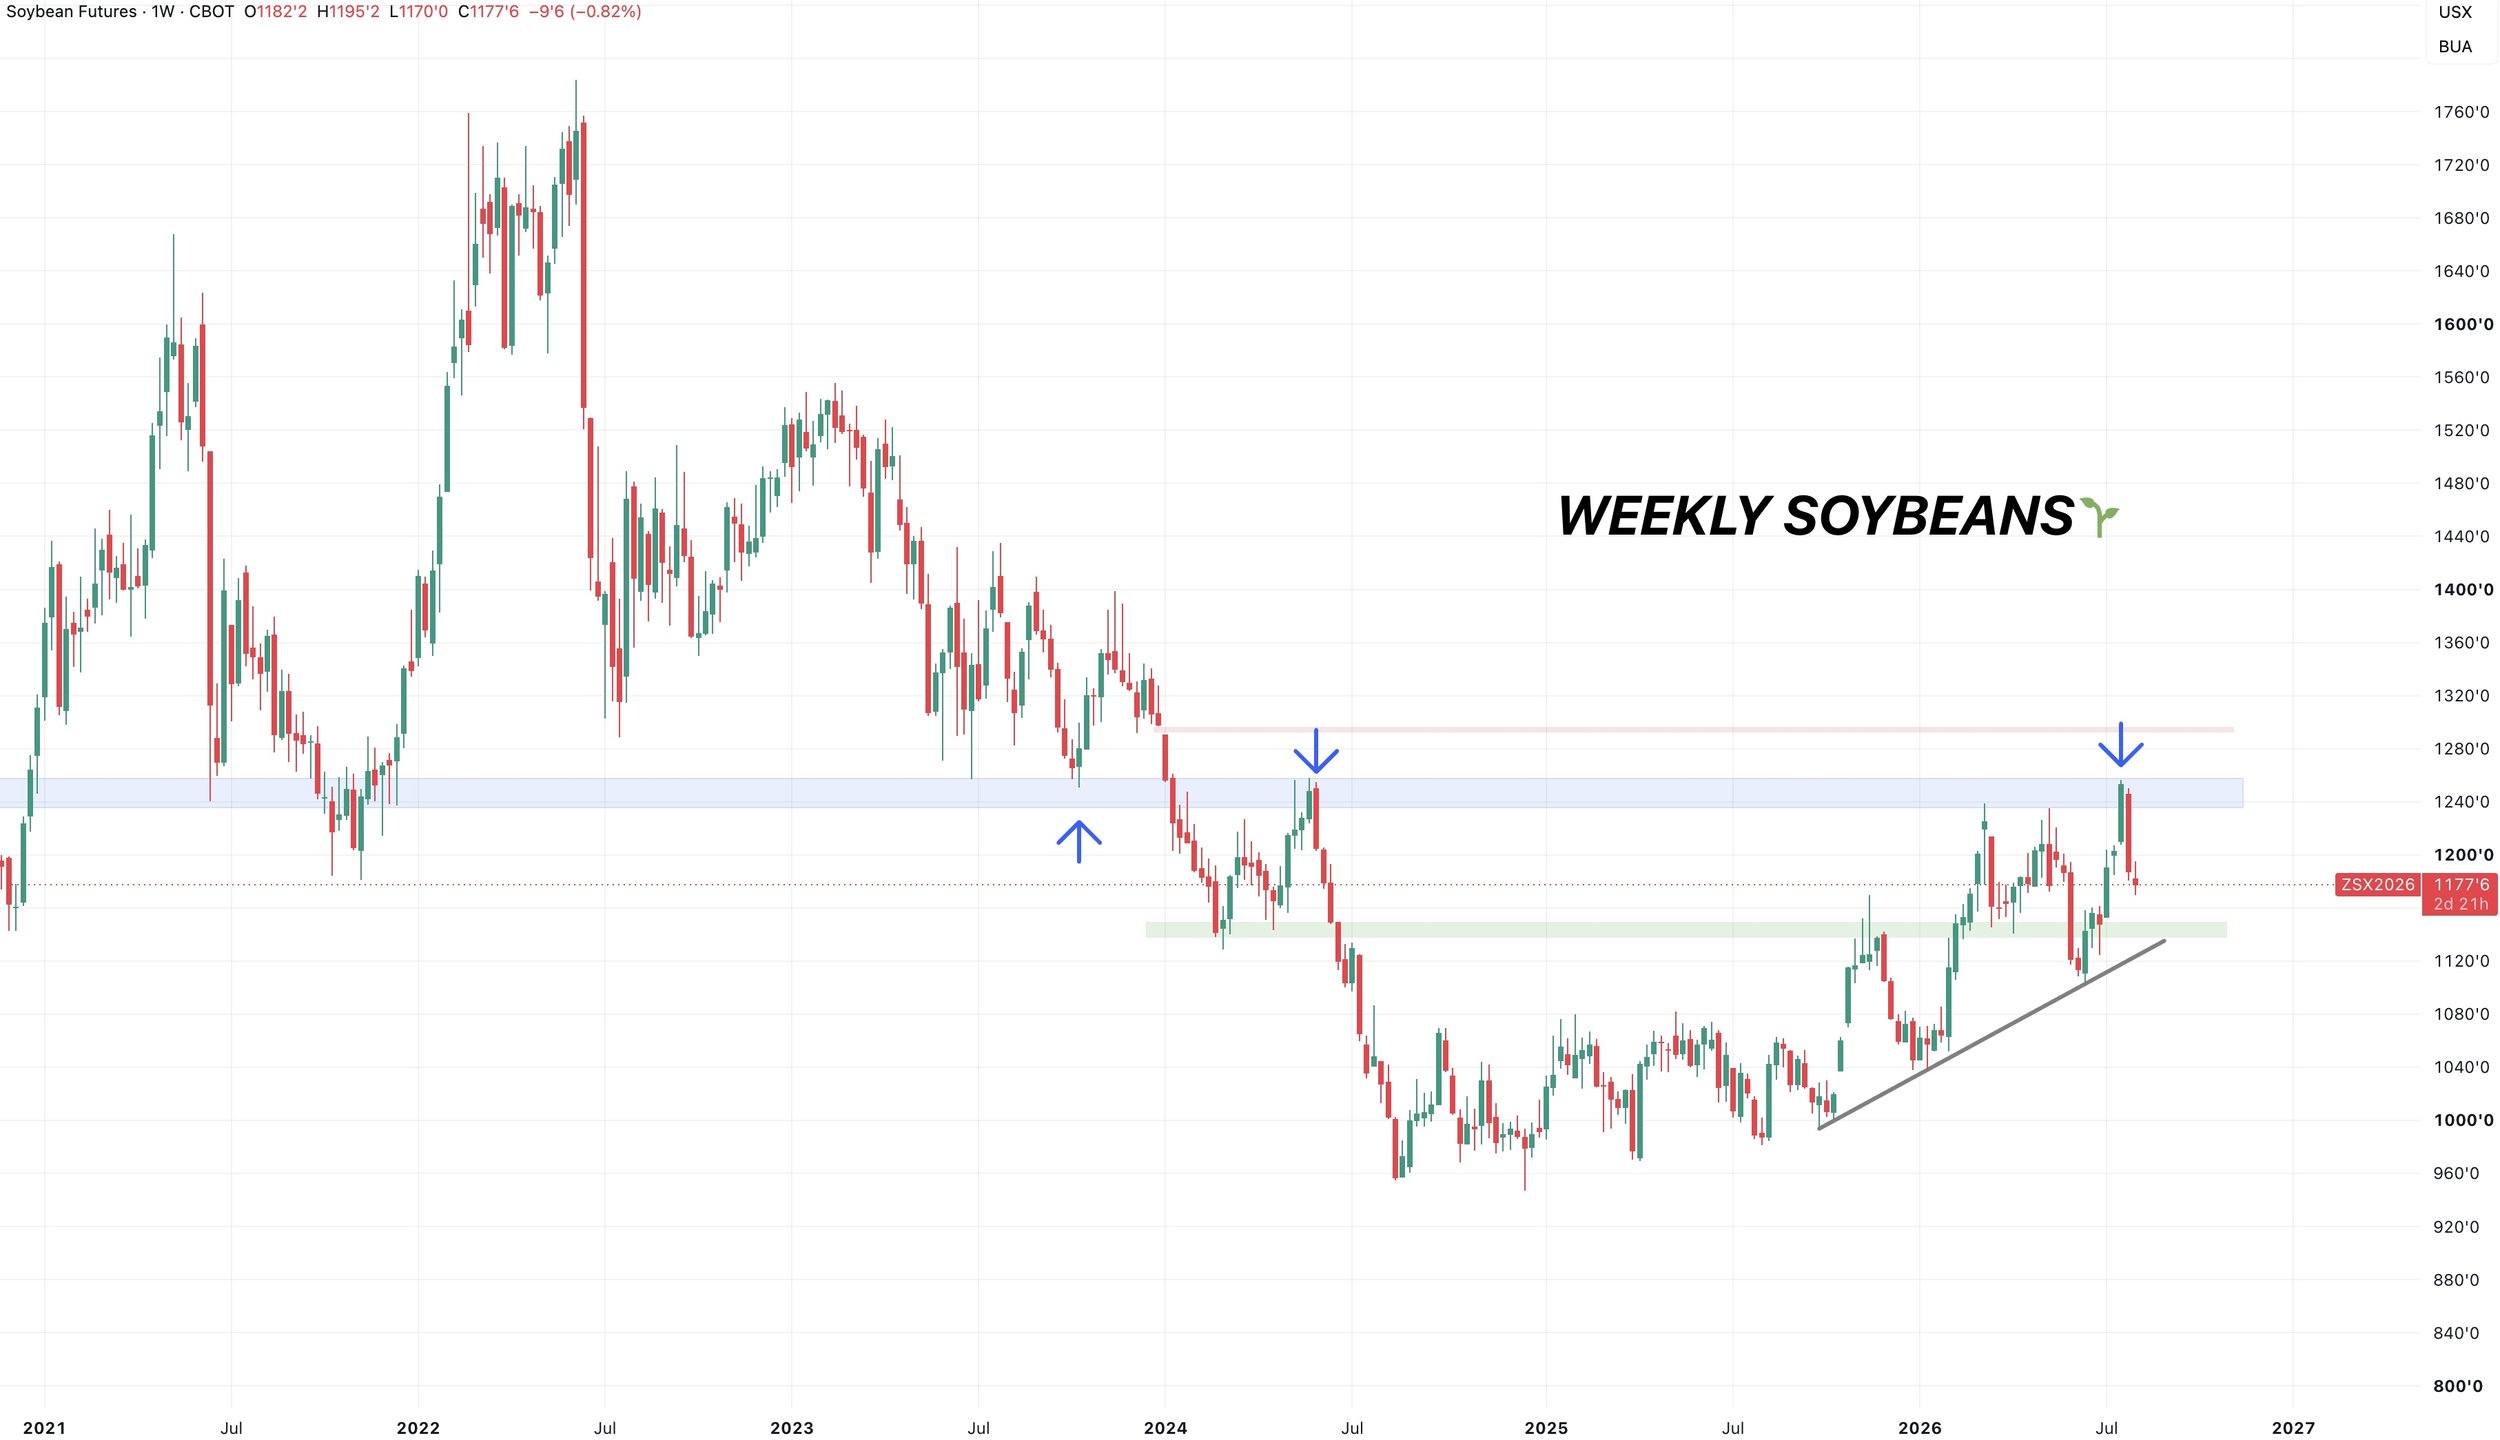
This is a big reason why we wanted to defend those recent highs in some sort of manner.
We were testing a major level at $12.50
That is the highs from 2024. It is the lows from 2023.
So it's clear high time frame resistance.
If we are ever able to break above, it does offer plenty of upside.
The long term structure in beans is clearly higher as well.
Wheat
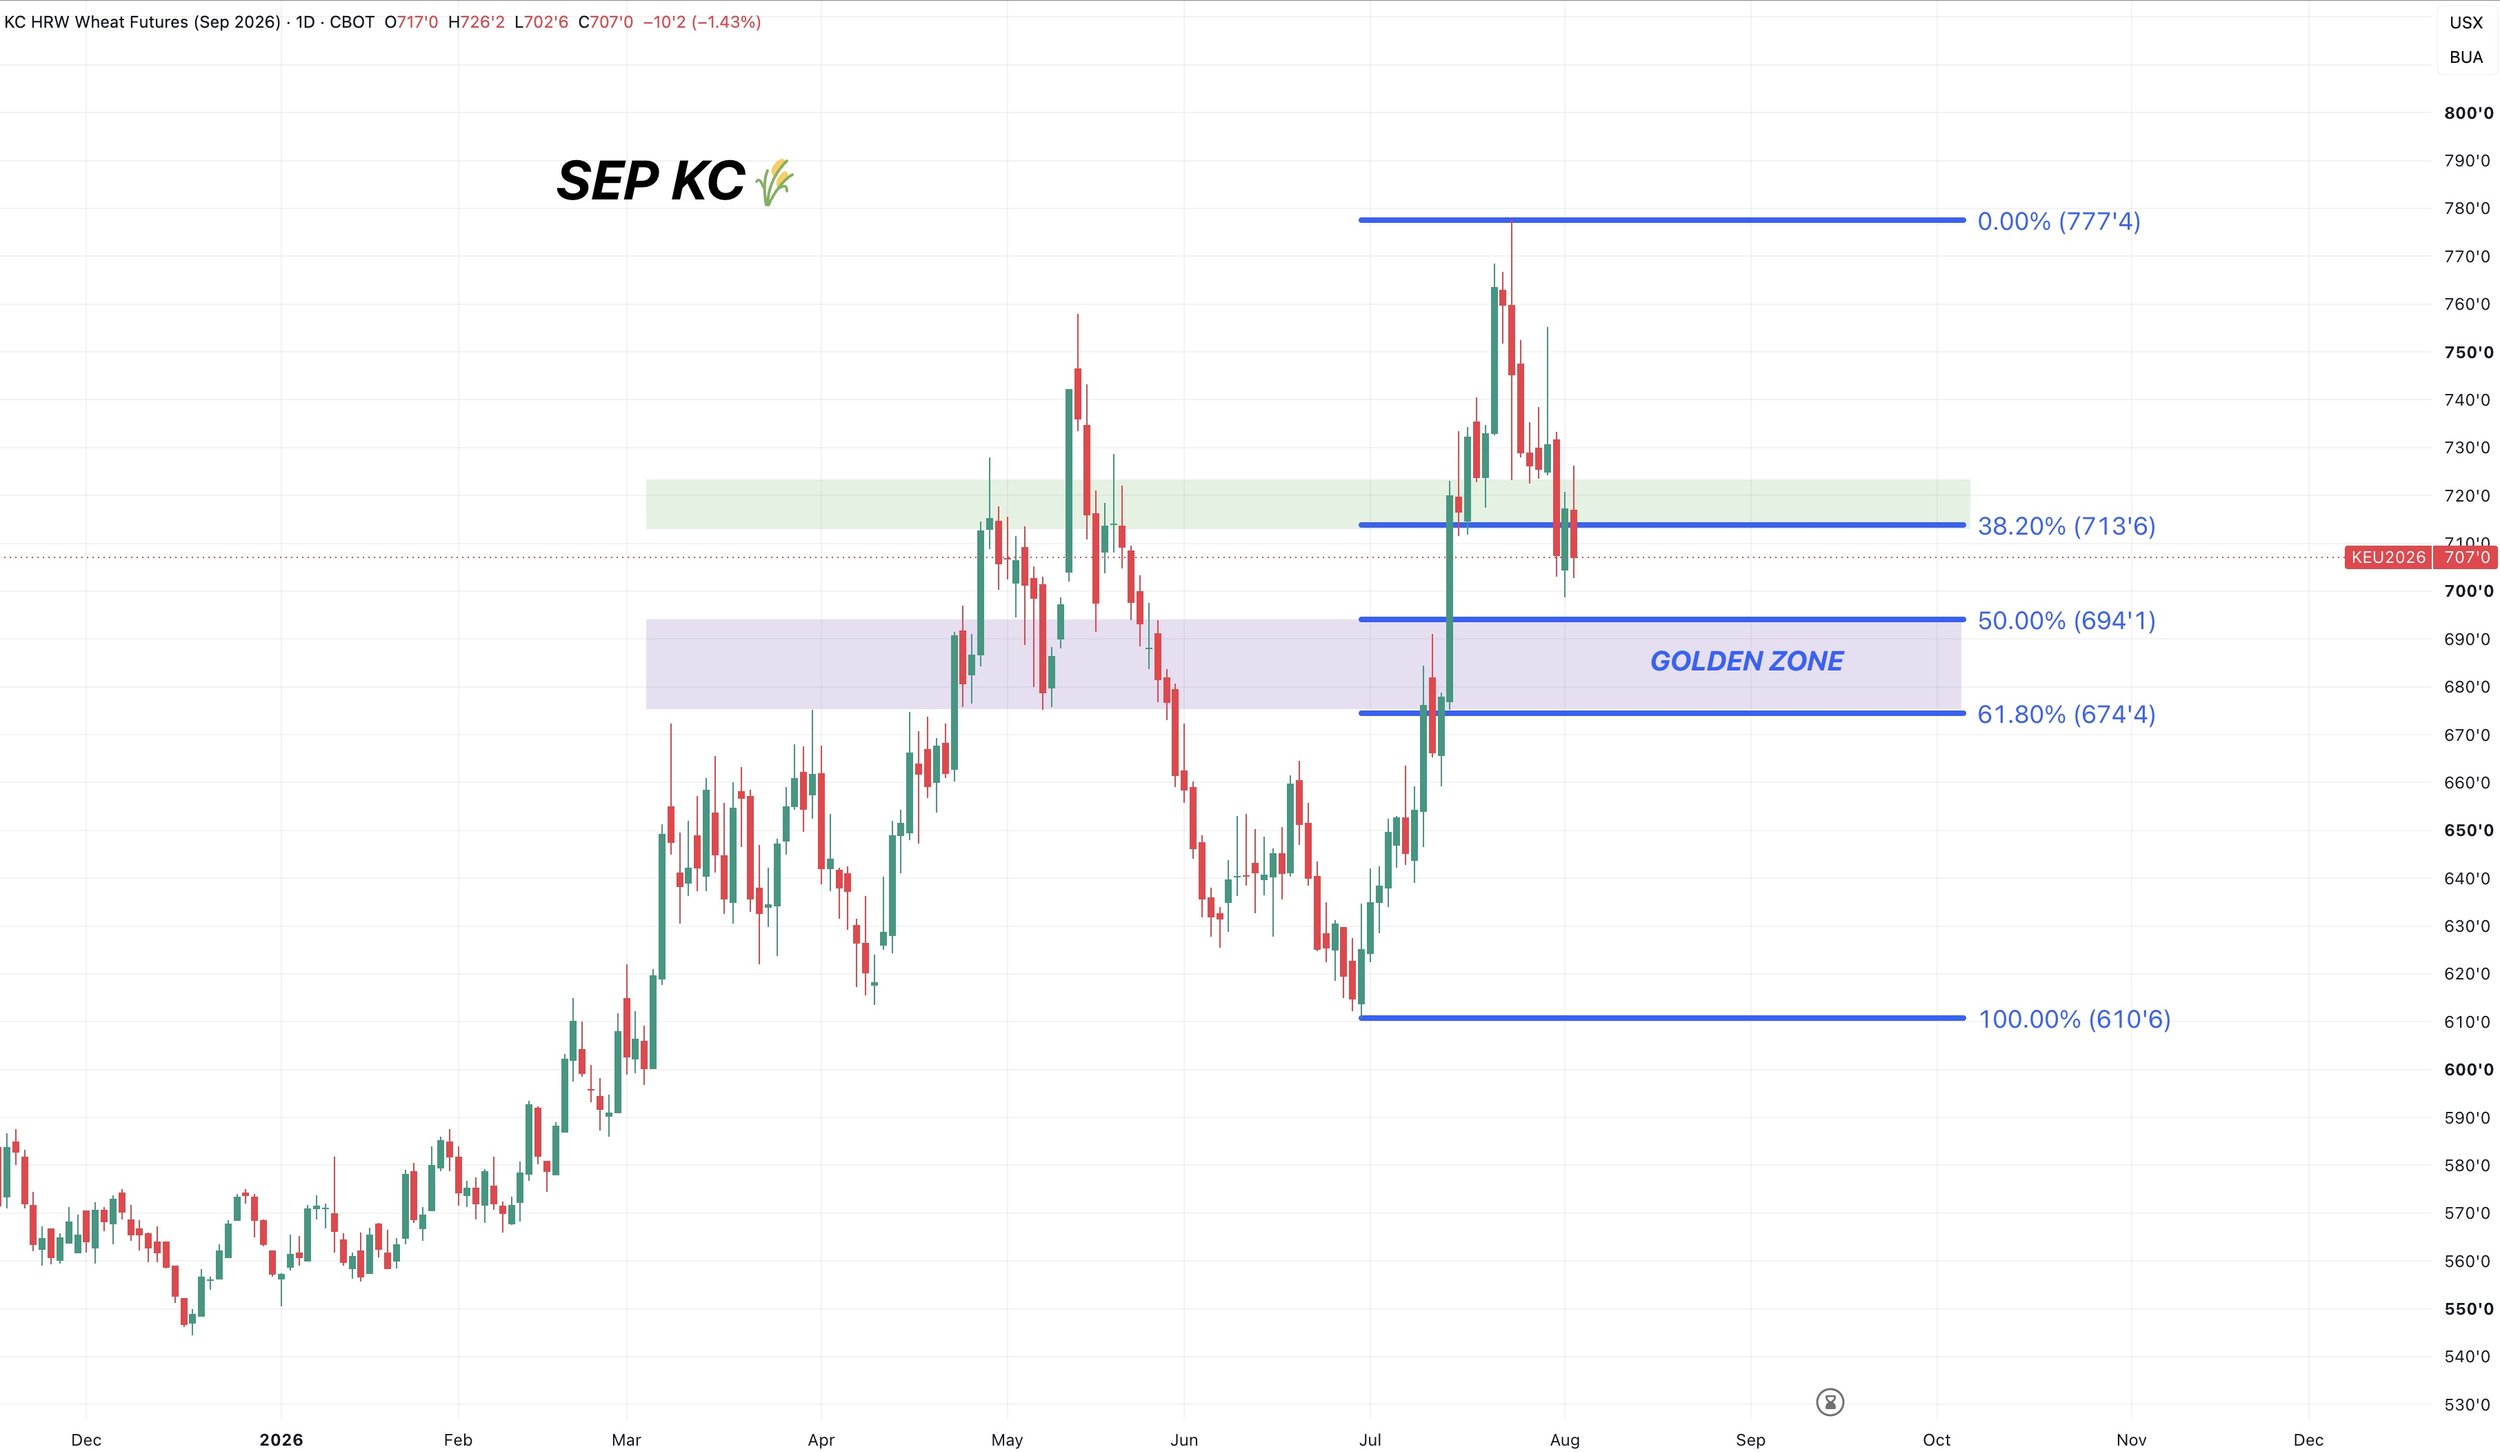
Sep KC Wheat Chart:
Just looking at the charts today.
The Russia story isn’t resolved, but the market hasn’t seemed too interested in the story as of late.
If things continue to be shut down over there, it could still make an impact to the world situation long term.
Bulls want to hold this golden zone.
As long as you do that, the structure remains higher despite the pullback.
That golden zone has been prior key support and resistance as well.
Being the highs from early spring and lows from May.
If you lose that level, then you'd have to start being more concerned.
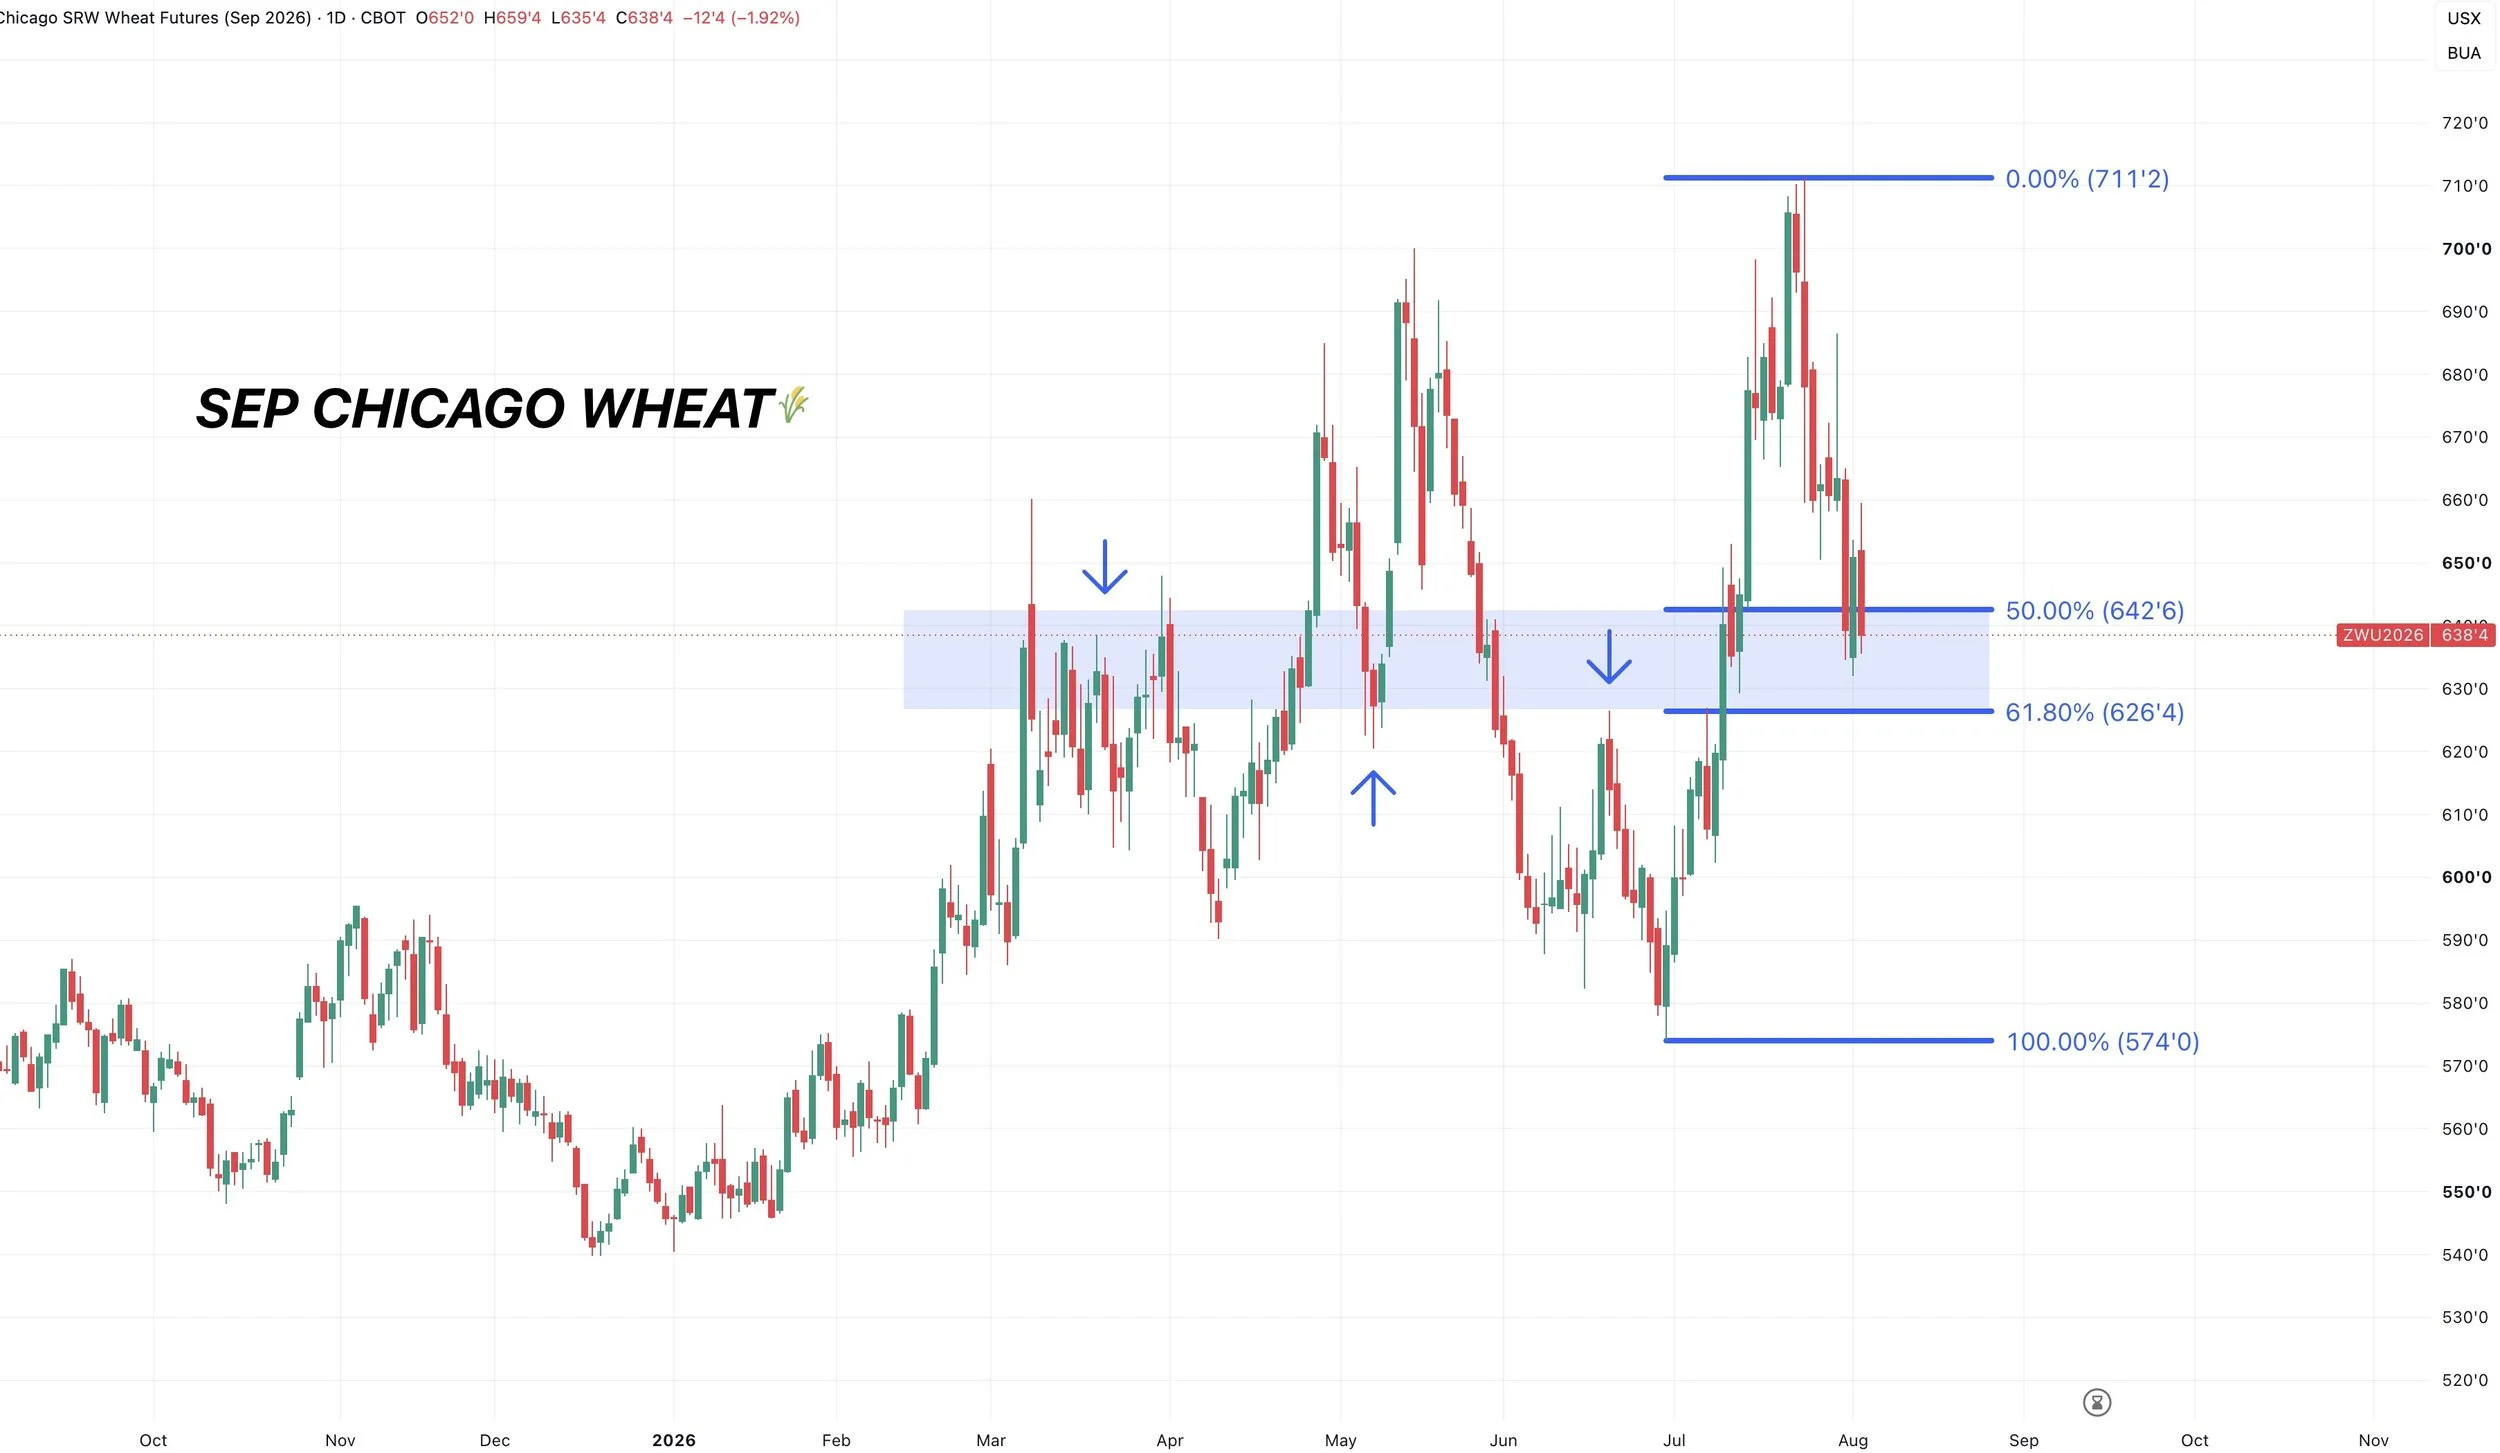
Sep Chicago Wheat Chart:
Sitting right in the golden zone.
As always, this is the most common area for a correction to end.
But if you break below, it would not be a good sign as it would offer more downside.
This golden zone has also been big support and resistance before. So we want to see us hold here.
Cattle
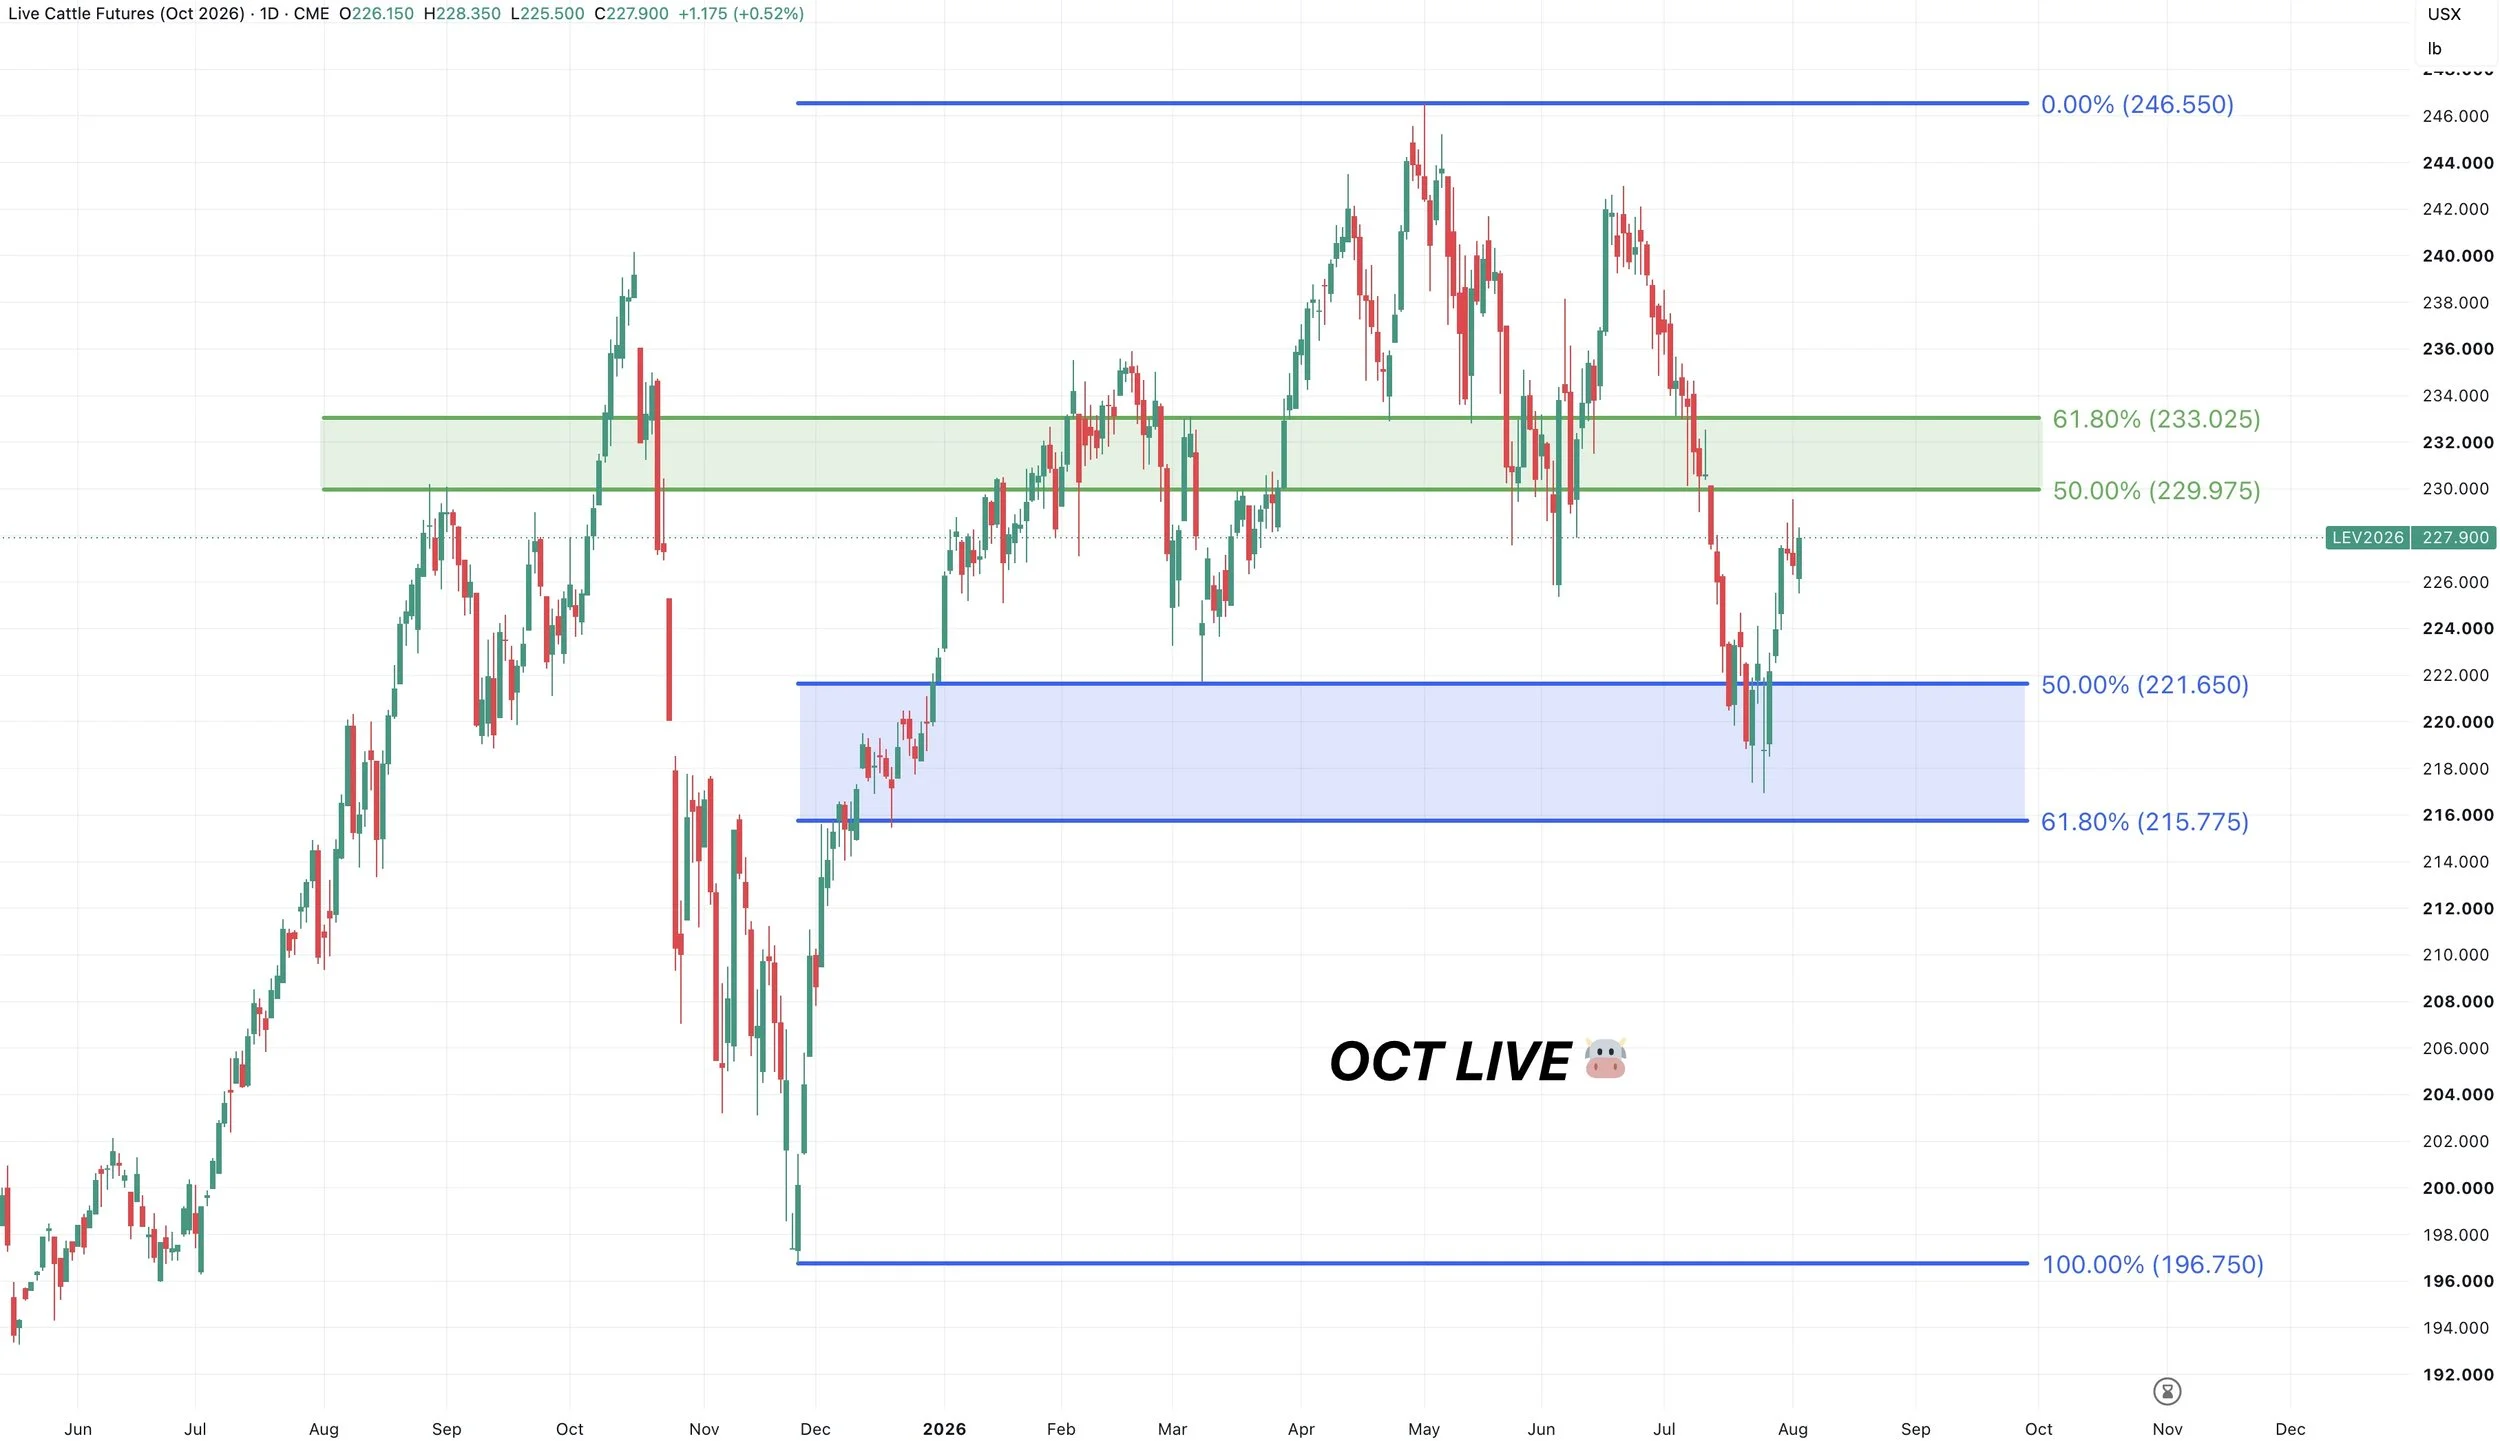
Oct Live Chart:
We have switched to the Oct contract now.
So far we are finding life where we need to. In this golden zone down to those lows from late last year.
This box is still the must hold area to prevent another leg lower.
To the upside, we want to look to defend a move into that golden zone. As if this is just a typical relief bounce, that would be a common area to fail.
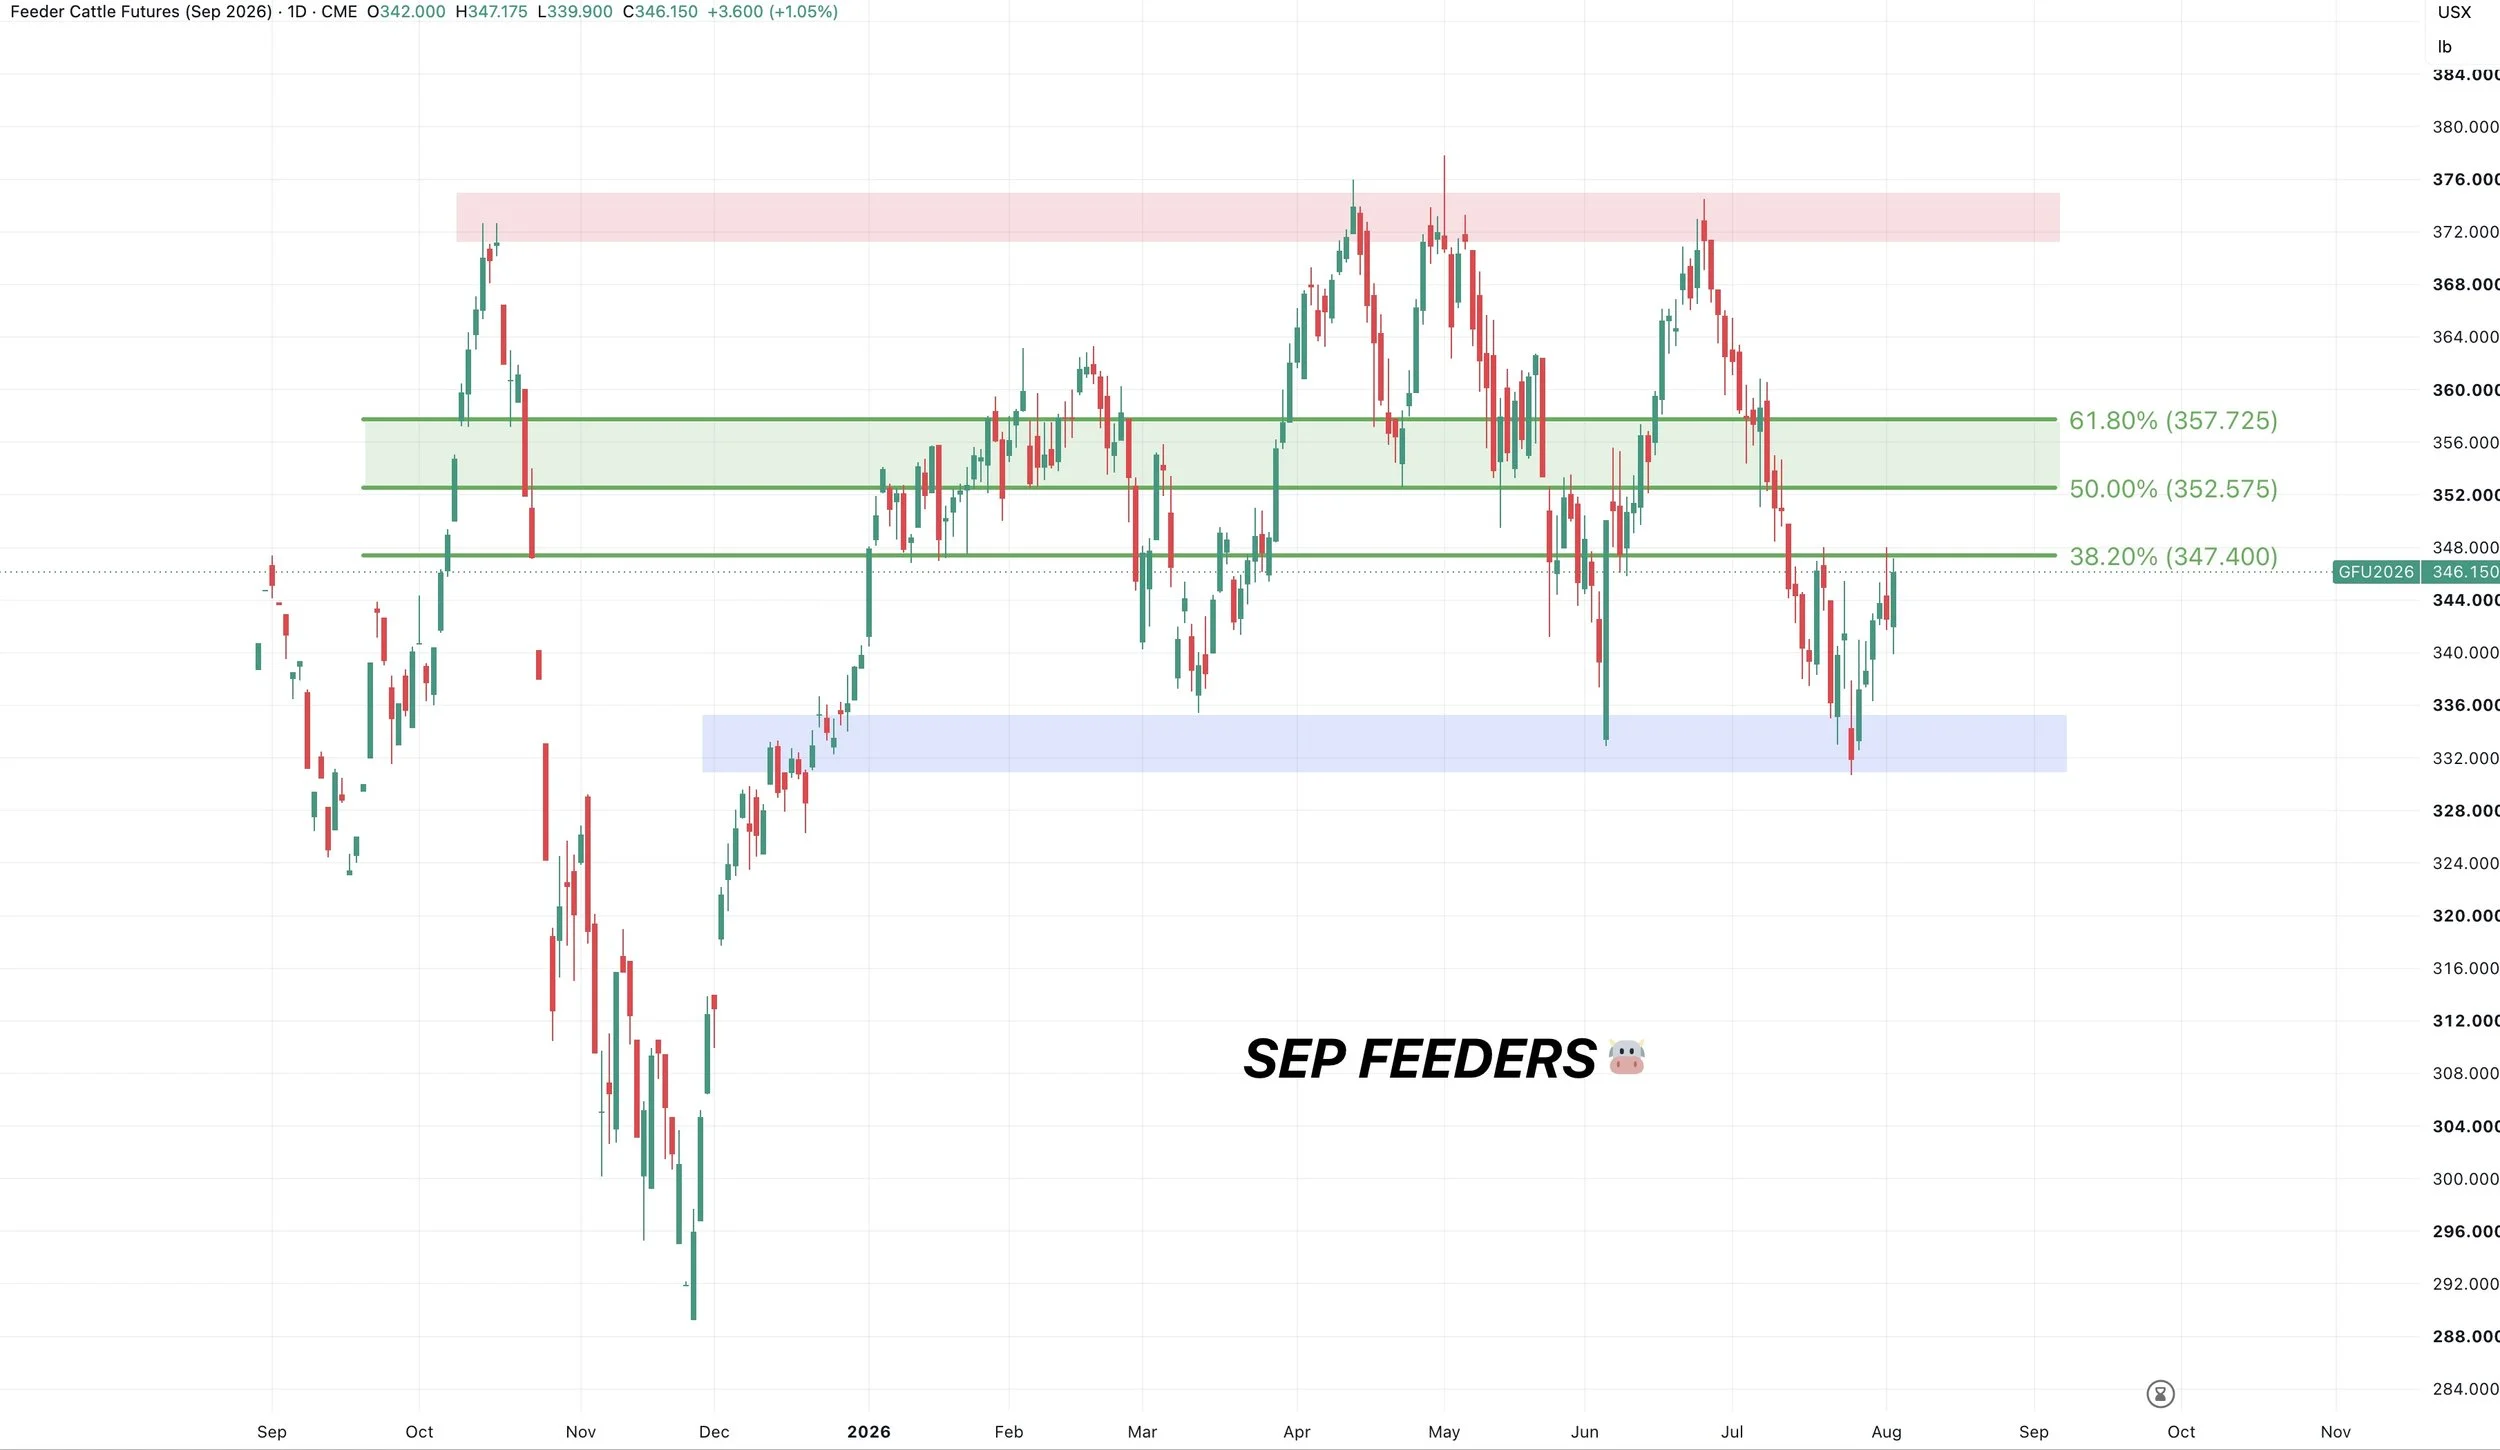
Sep Feeders Chart:
We have switched to the Sep contract now.
Bulls want to see us hold the recent lows.
I want to defend any sort of bounce up into that golden zone. Currently battling the 38.2% level.
Want to Talk?
Our phones are open 24/7 for you guys if you ever need anything or want to discuss your operation.
Jeremey & Office: (806)484-1214
Sebastian: (605)280-1186
Email: sfrost@dailymarketminute.com
Hedge Account
Interested in a hedge account? Use the link below to set up an account or give us a call.