
RATINGS FALL & GRAINS BOUNCE BACK
MARKET UPDATE
You can scroll to read the usual update as well. As the written version is the exact same as the video.
Timestamps for video:
Overview: 0:00min
Corn: 4:25min
Beans: 10:00min
Wheat: 13:20min
Cattle: 15:00min
Want to talk?
Office: (806)484-1214
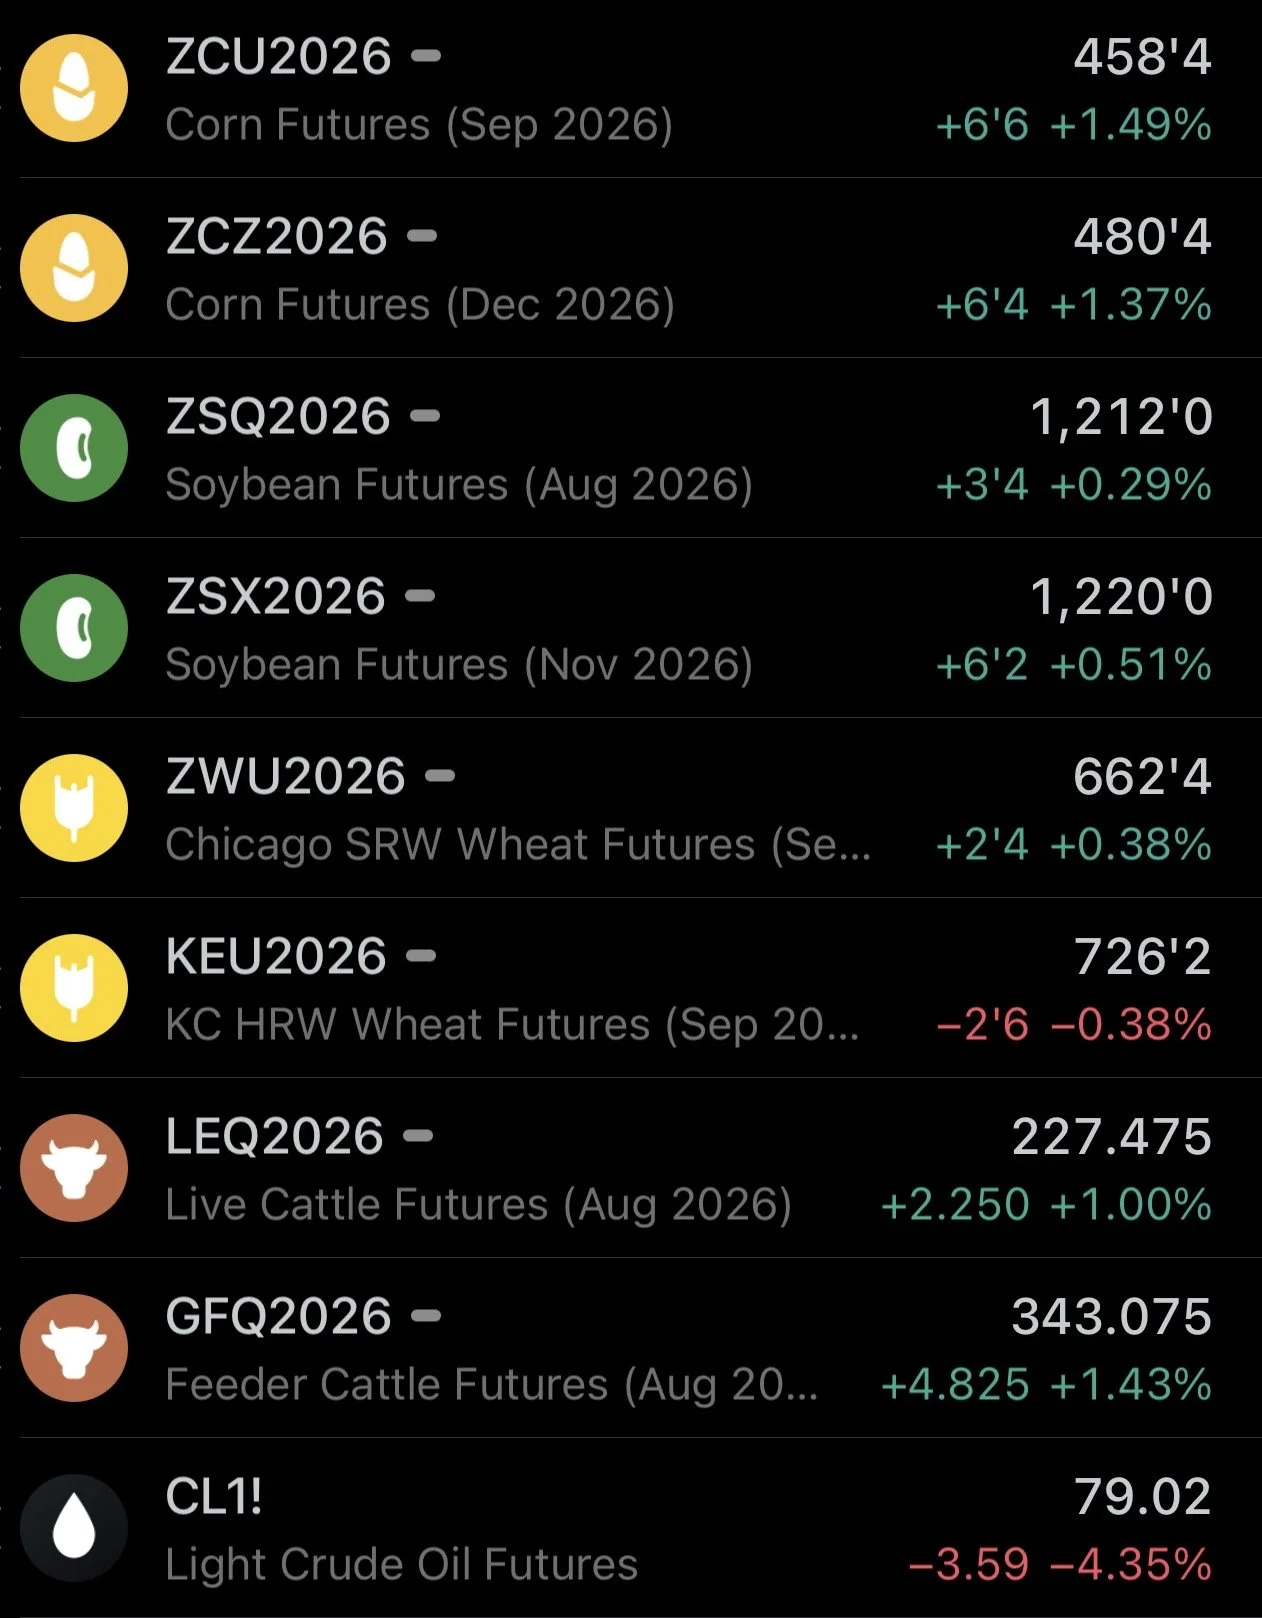
Futures Prices Close
Overview
Solid day across the board today in both grains as well as cattle following yesterday’s heavy pressure.
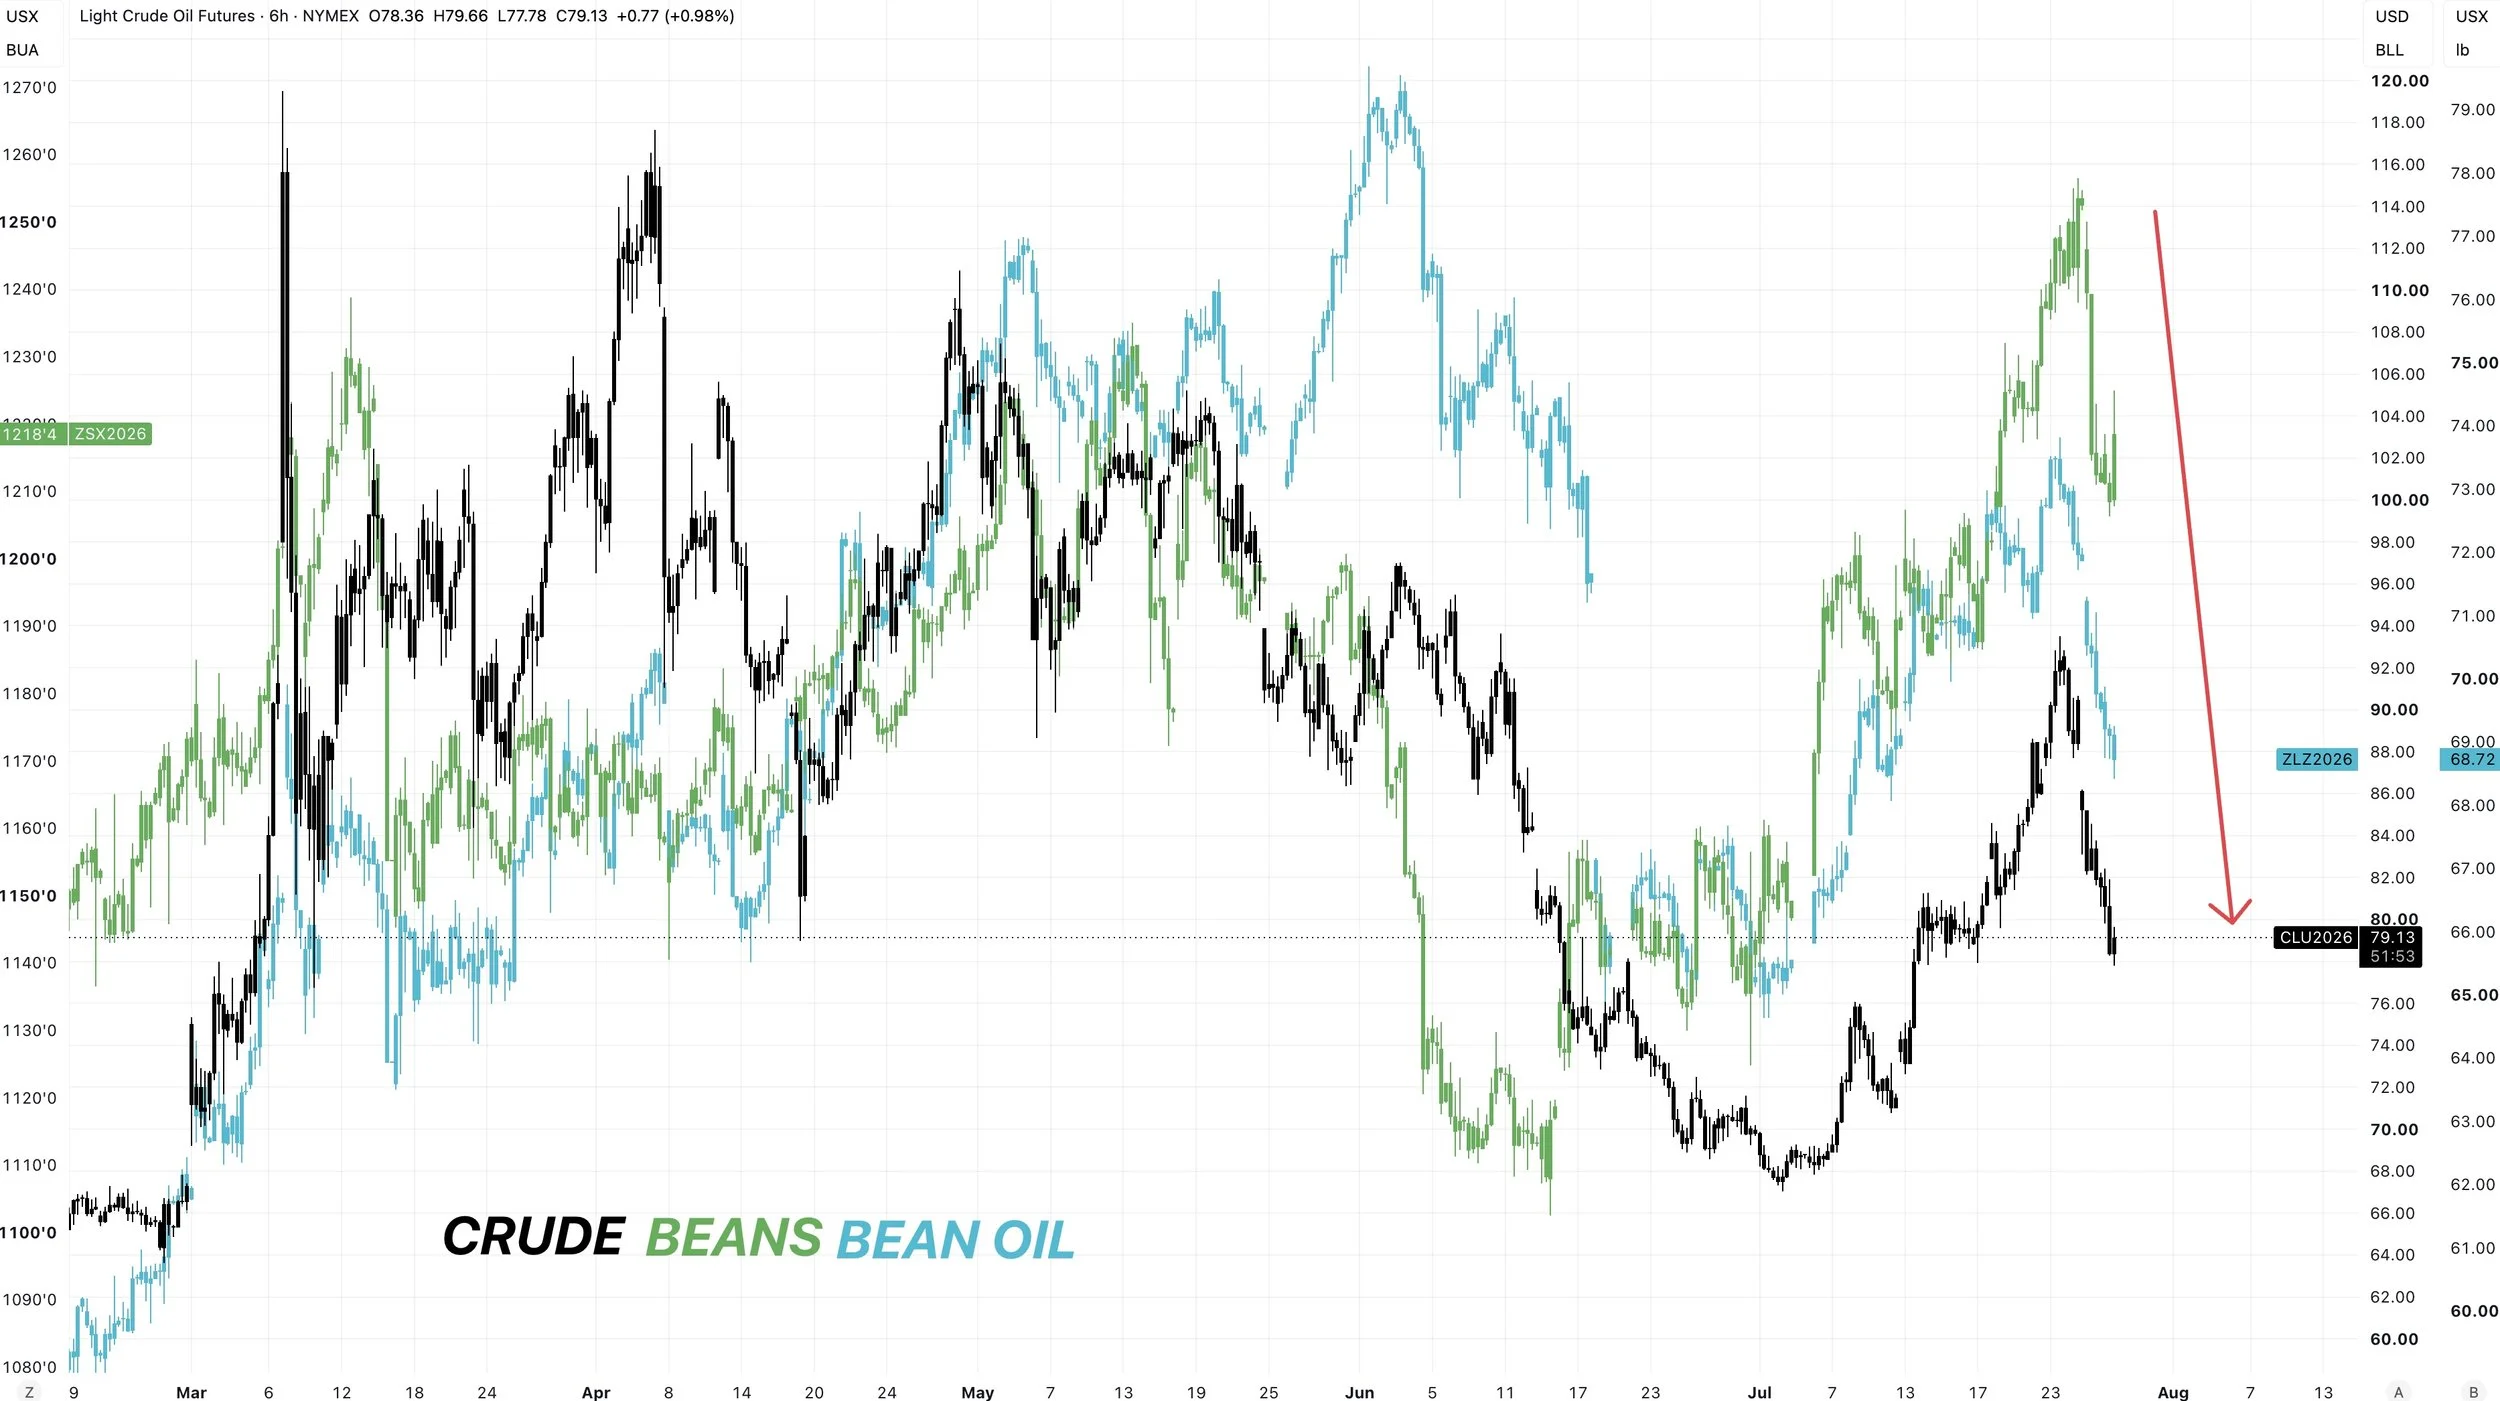
Corn and soybeans were able to trade higher even with crude oil getting hit hard again today.
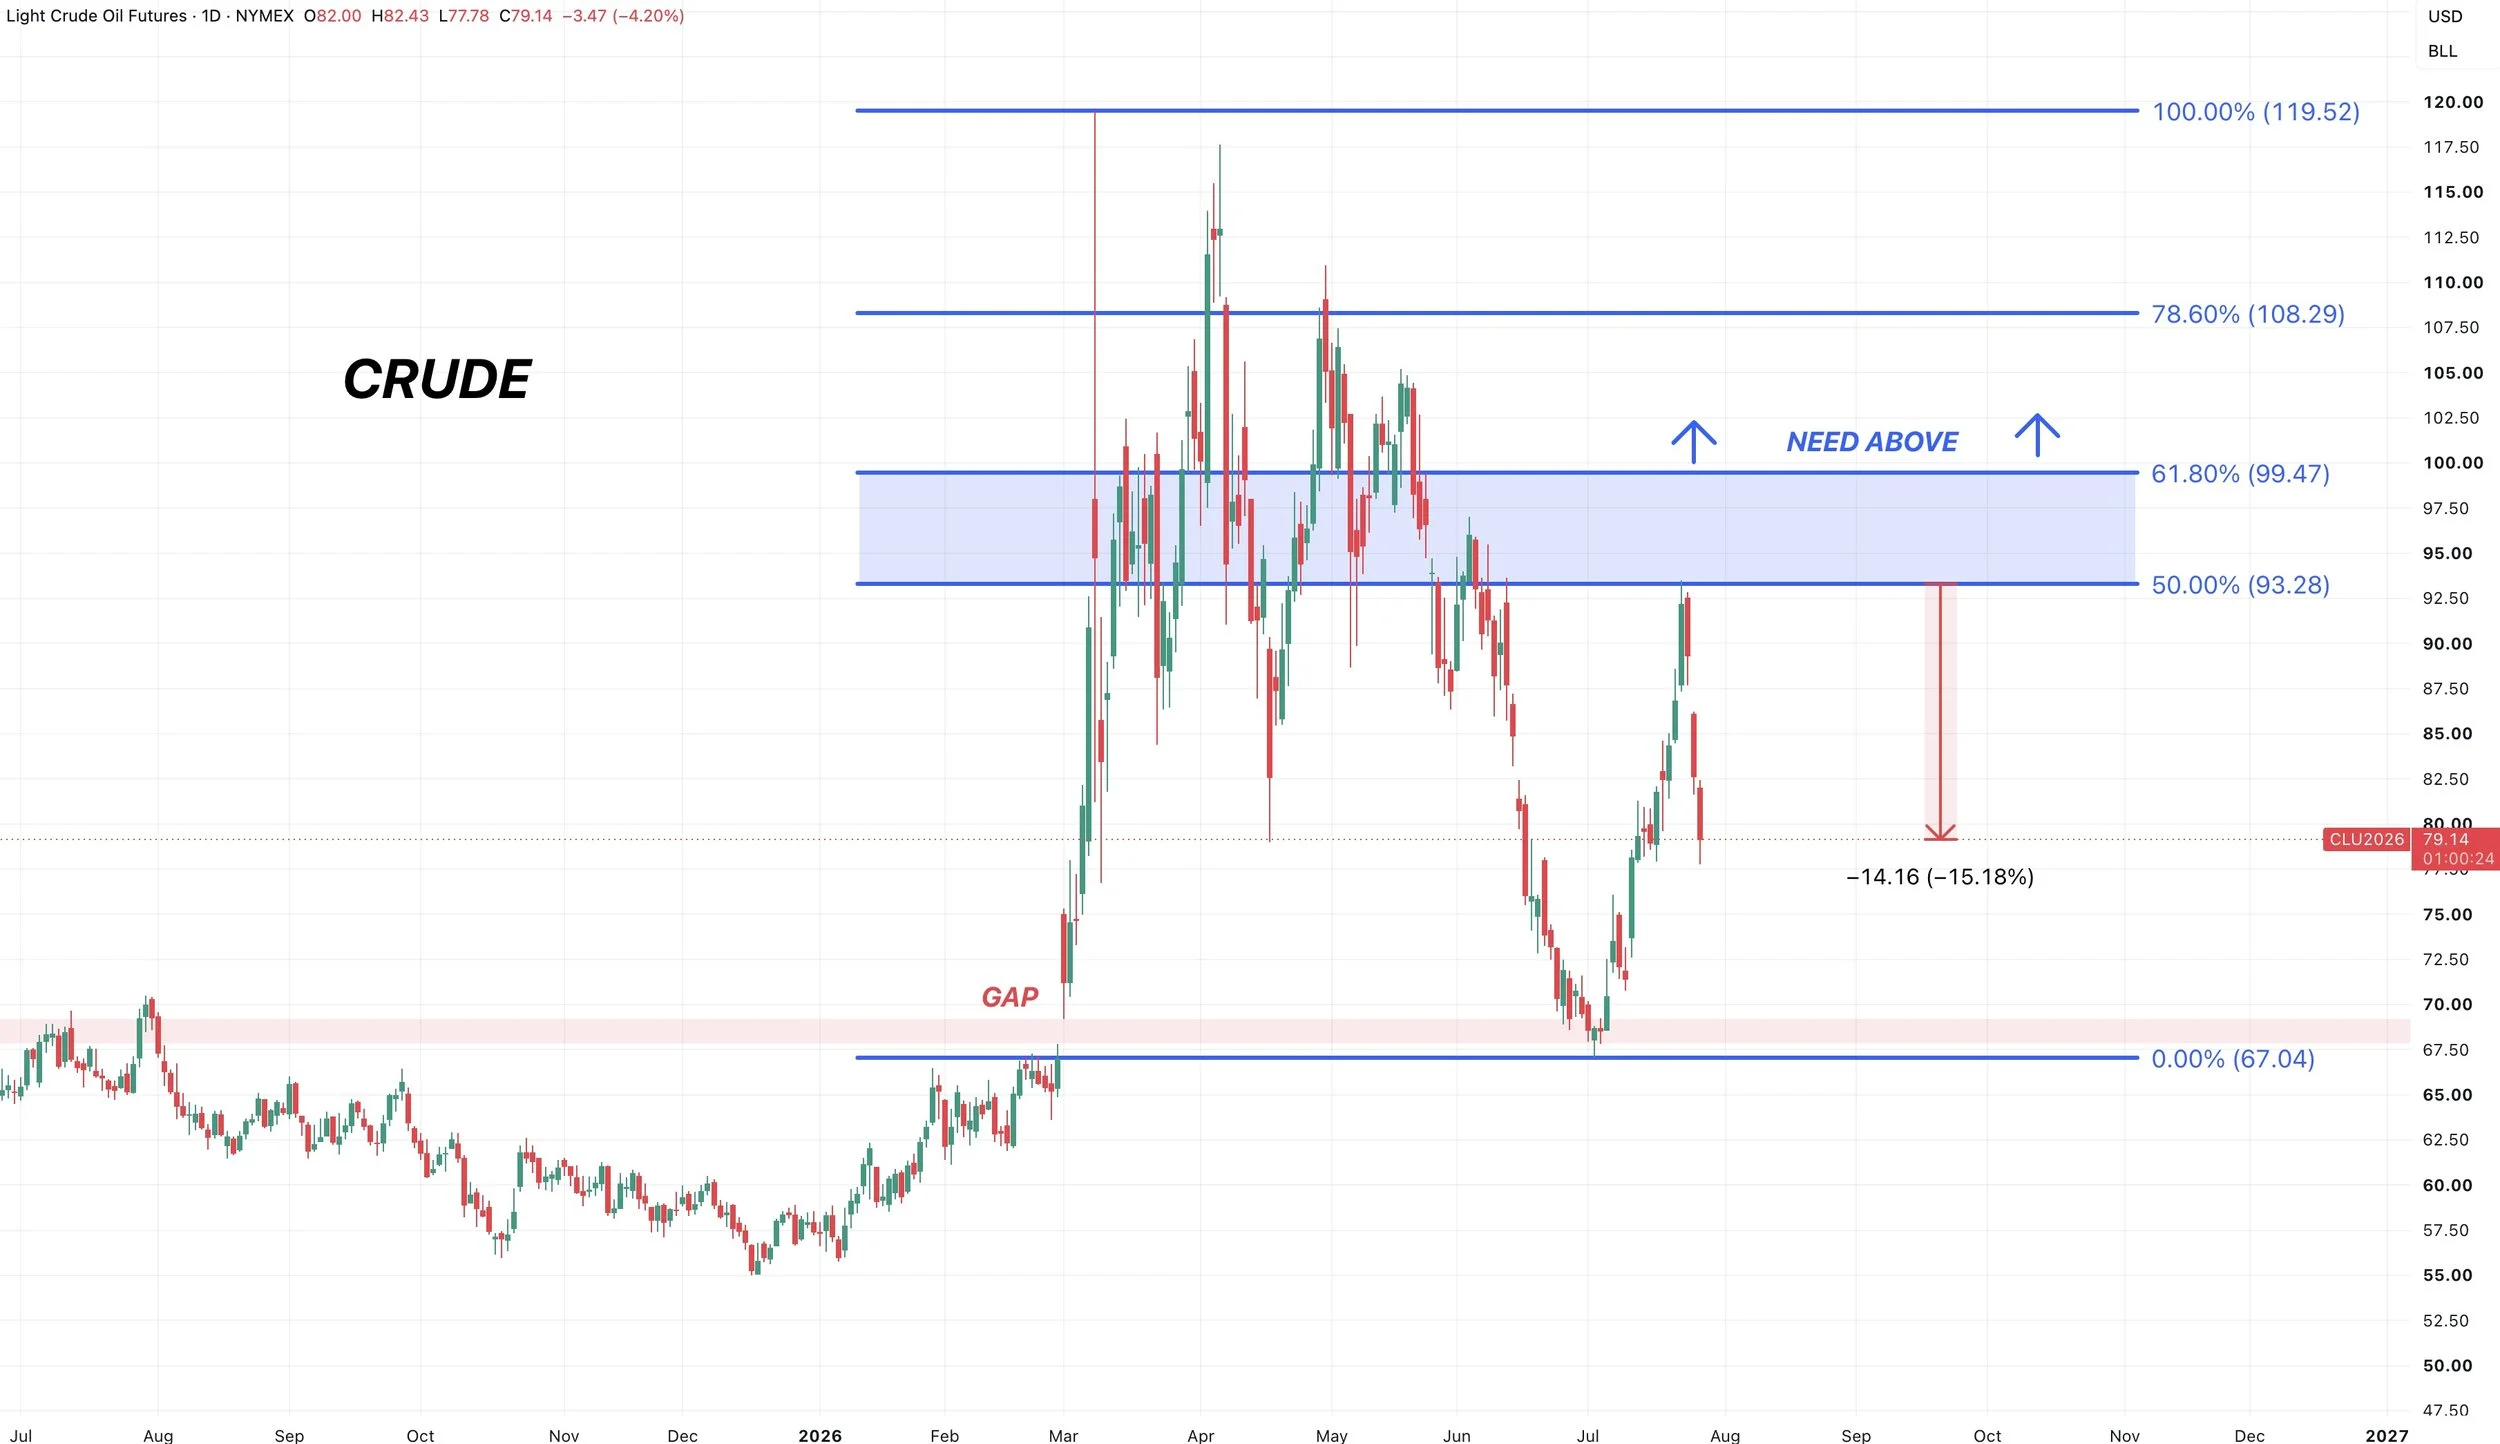
Crude oil is down -$14 the last 3 days. After clawing back 50% of the entire sell off.
The trend in crude remains lower unless it breaks above the 61.8% level and $100.
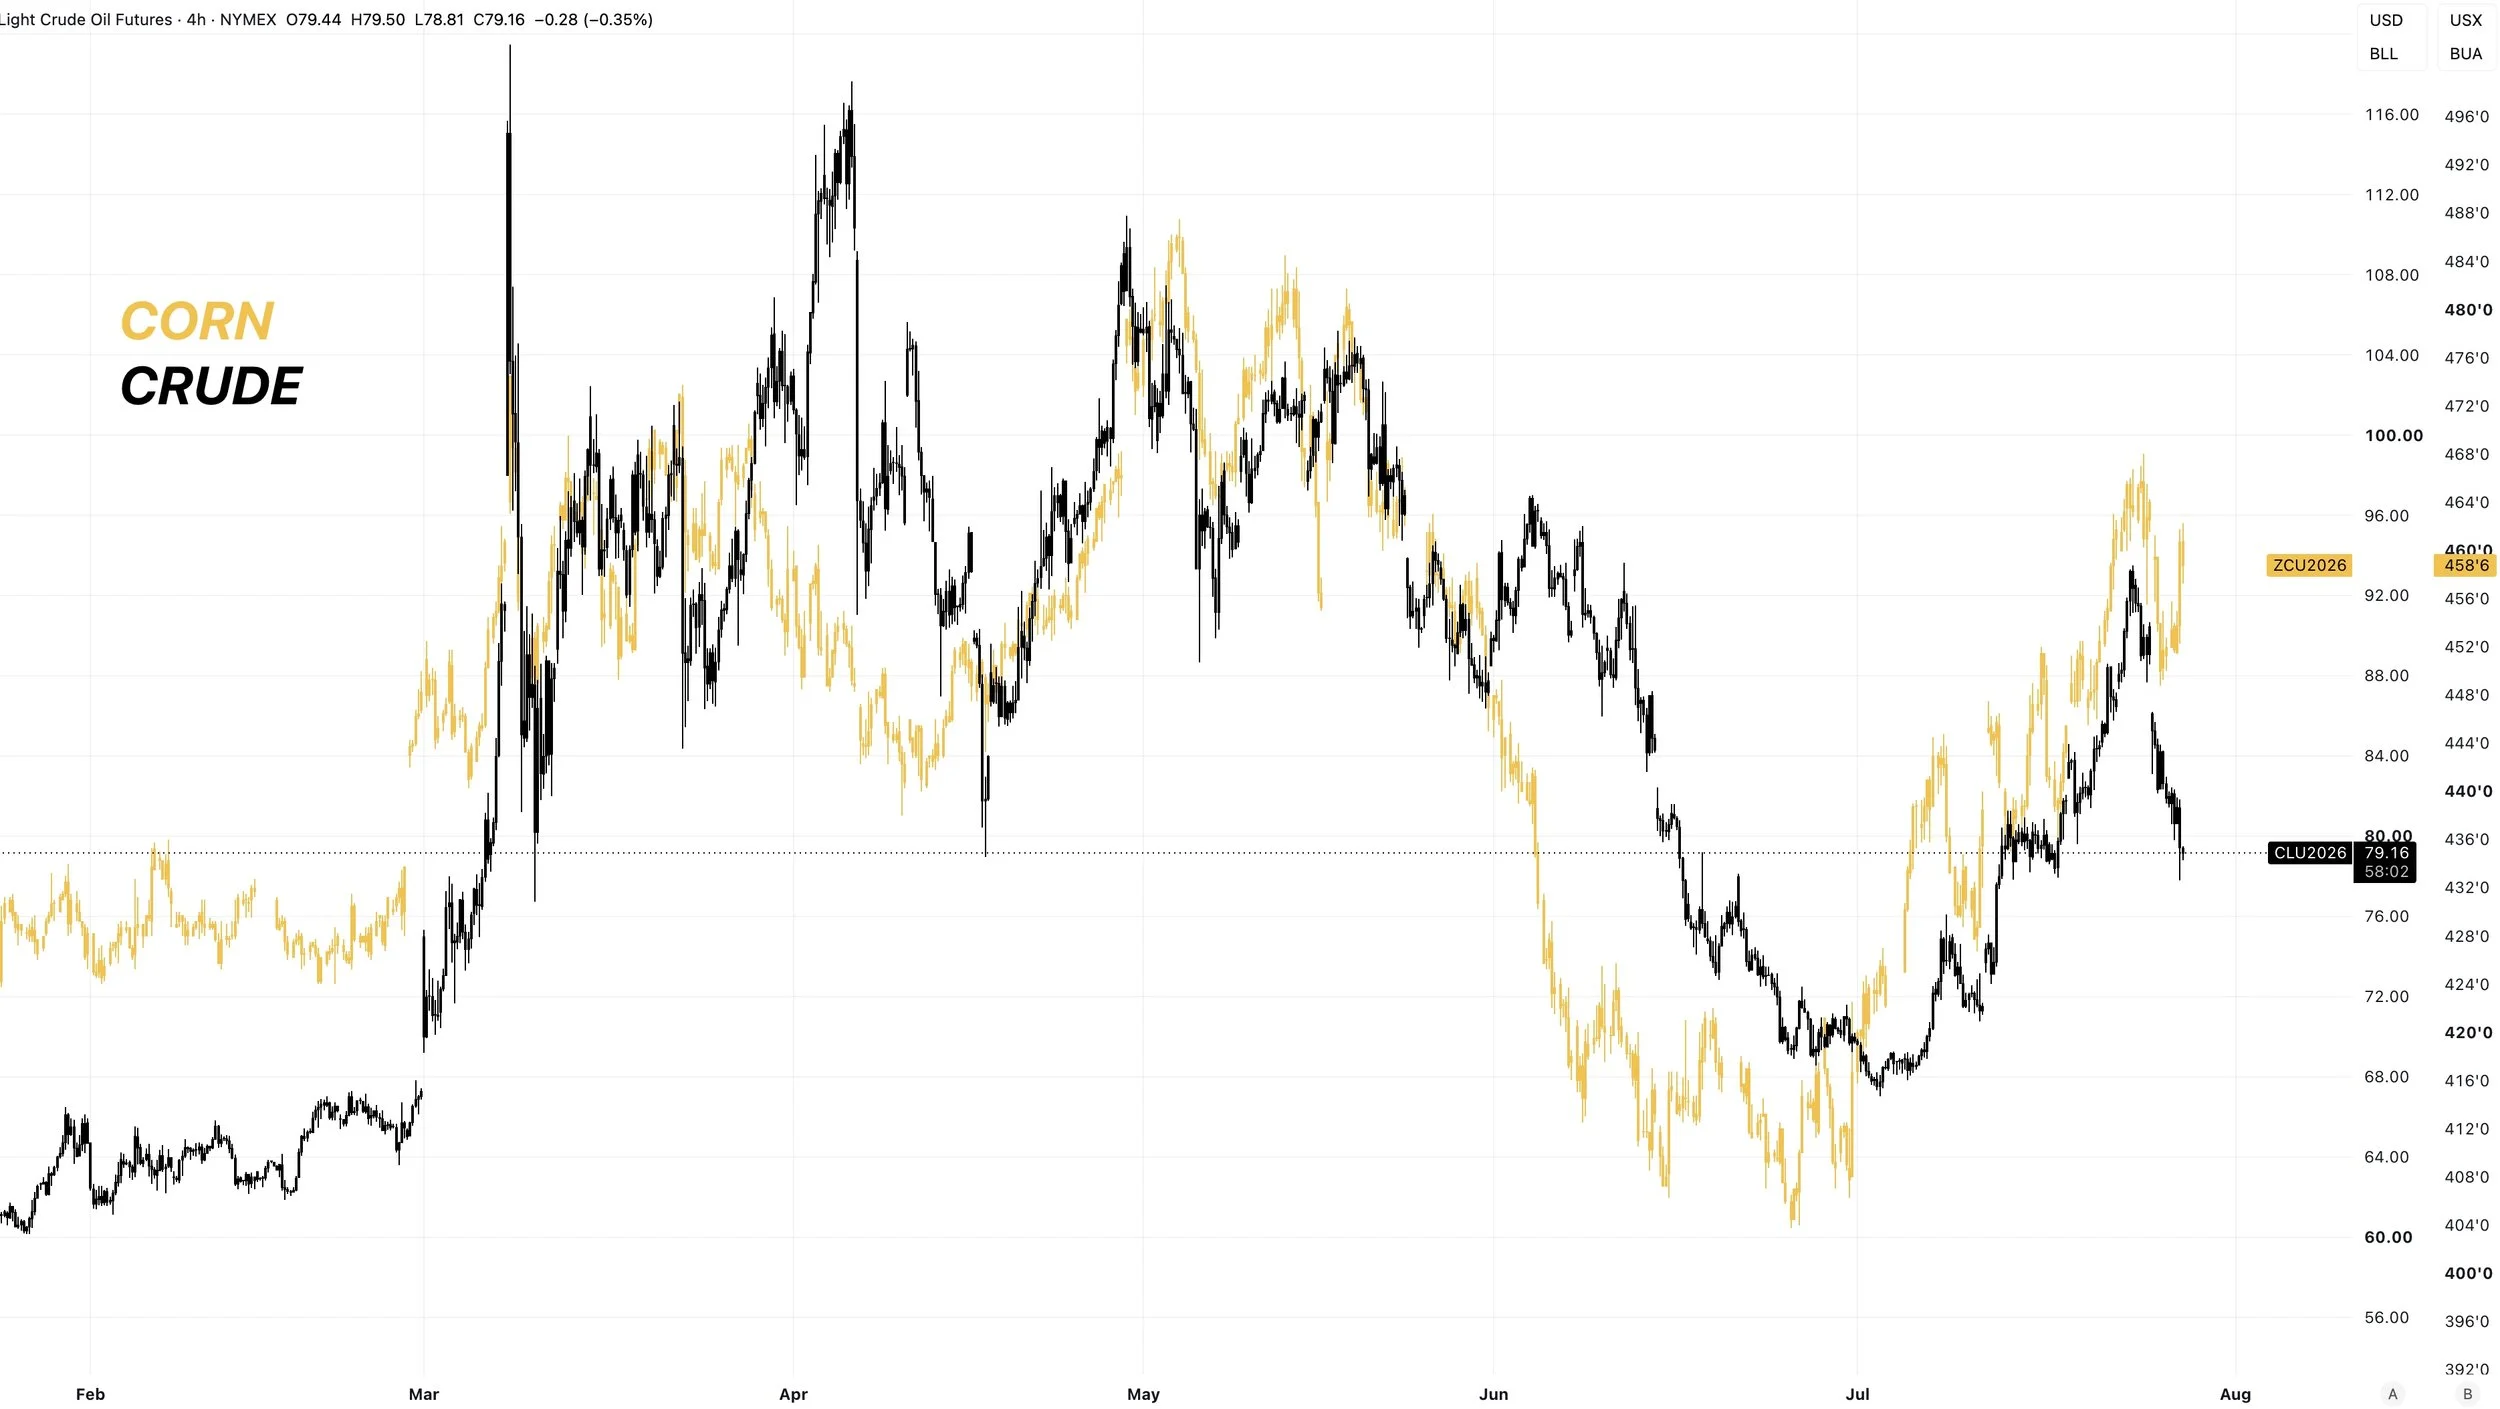
There is no direct day to day correlation between corn and crude.
But if you zoom out, the overall trend of both markets has tracked very closely.
Higher crude isn’t going to be bearish for corn.
Where as lower crude isn’t going to help corn.
Why the pressure yesterday?
As we talked about in the audio yesterday, it stemmed from a few bearish headlines hitting the markets all at once.
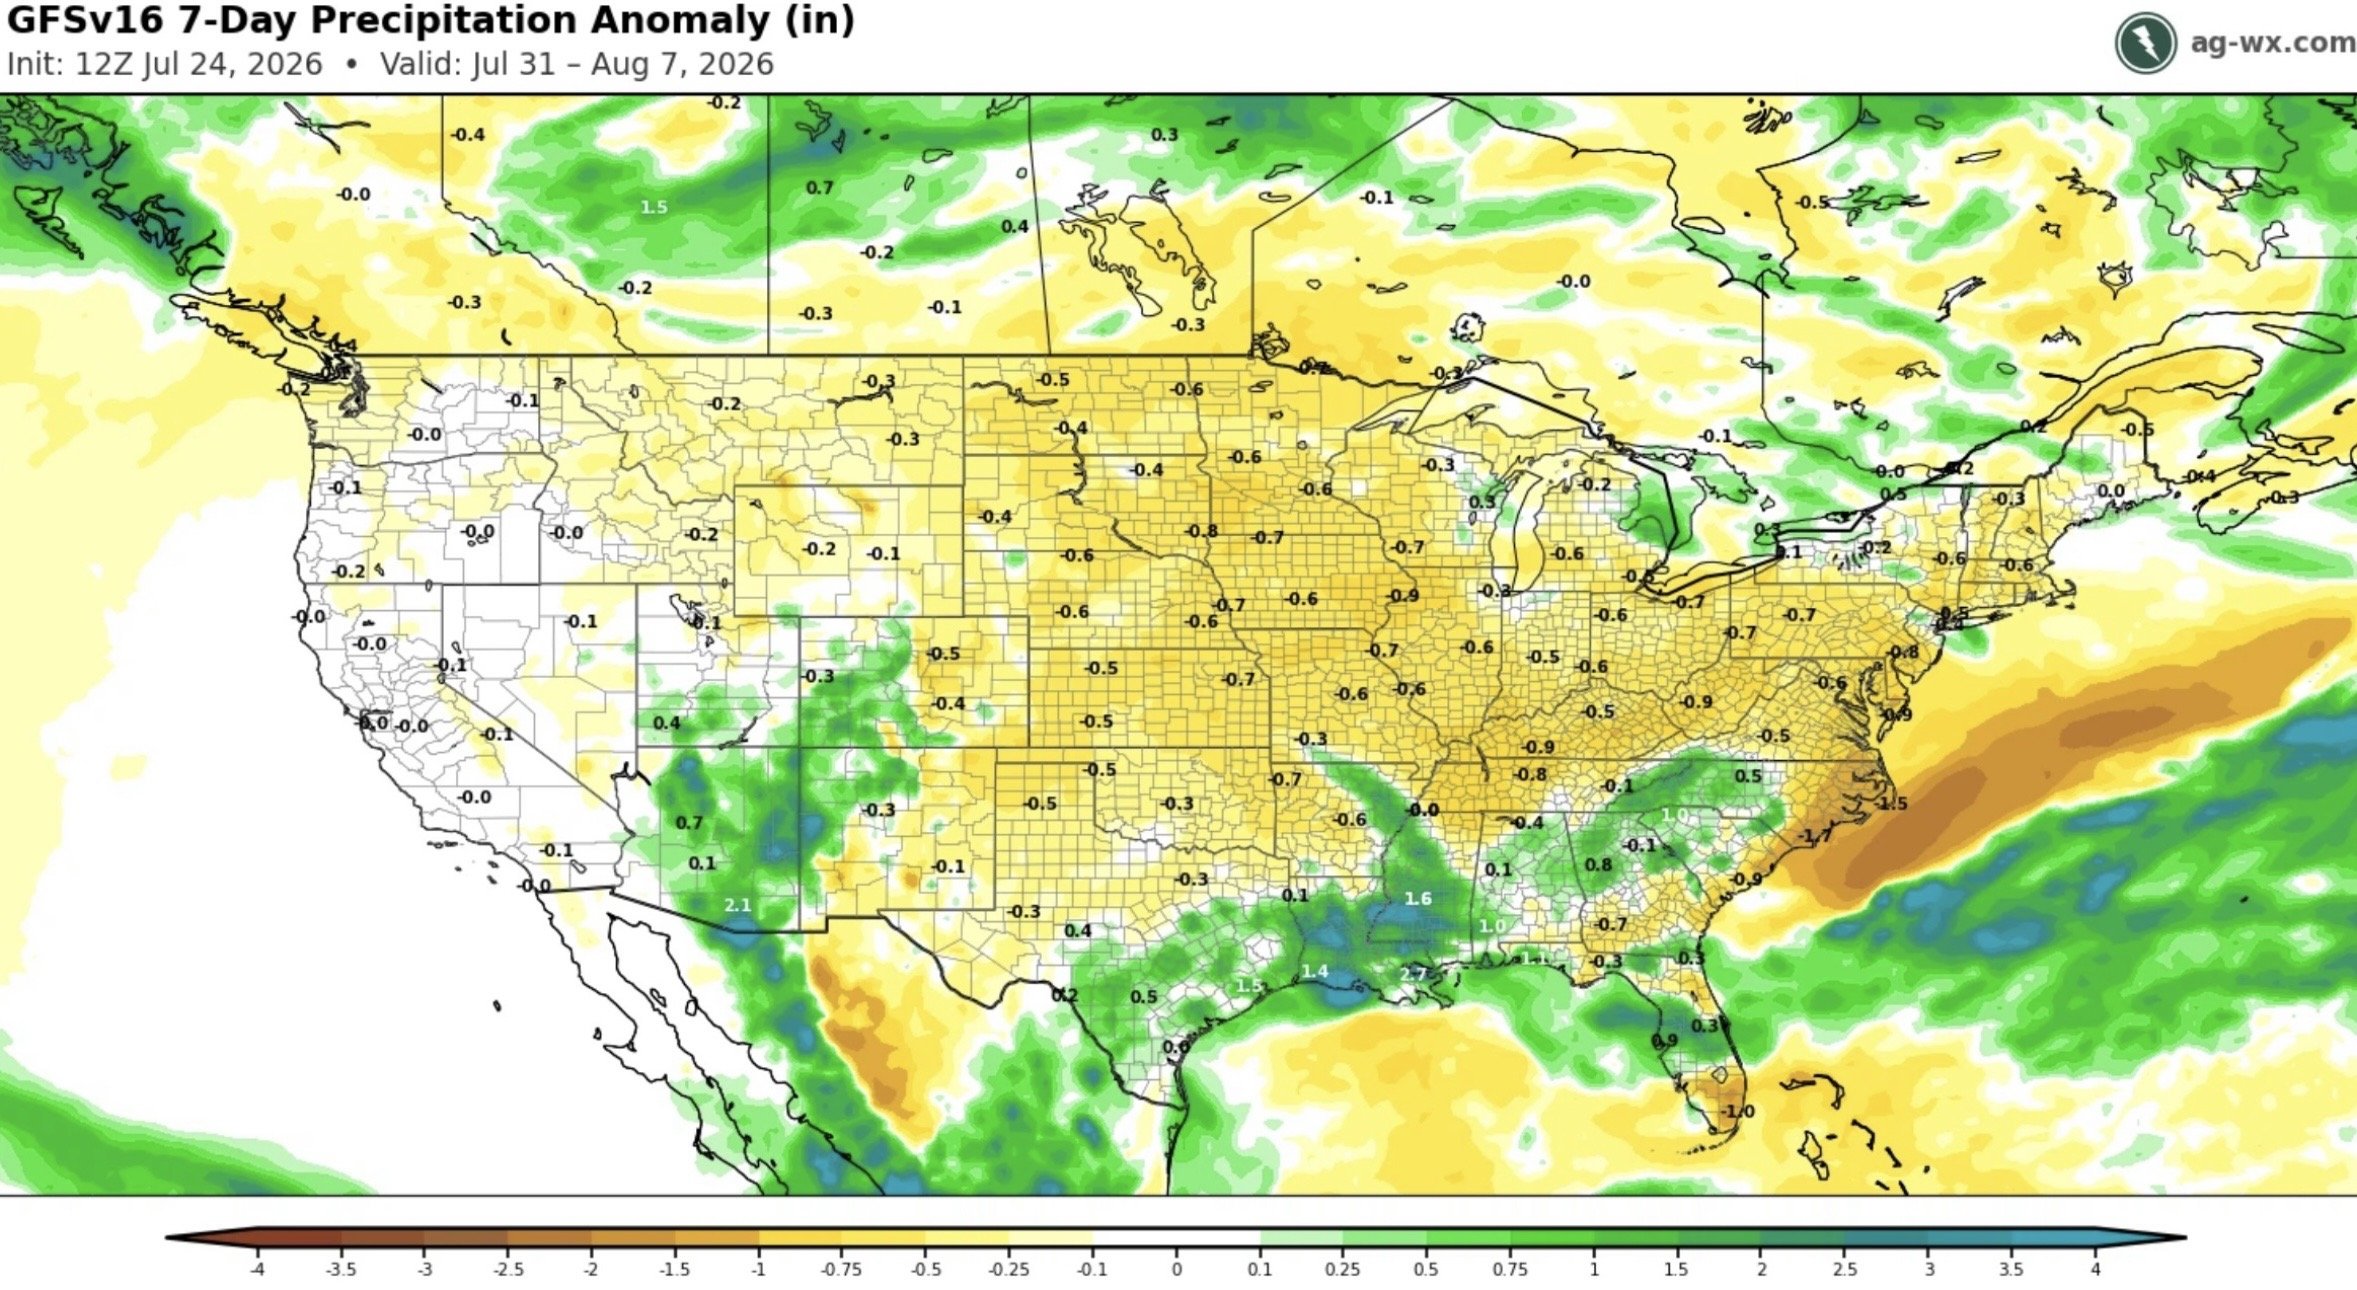
Sunday night forecasts flipped wetter. We are in a weather market where forecasts can change on a dime.
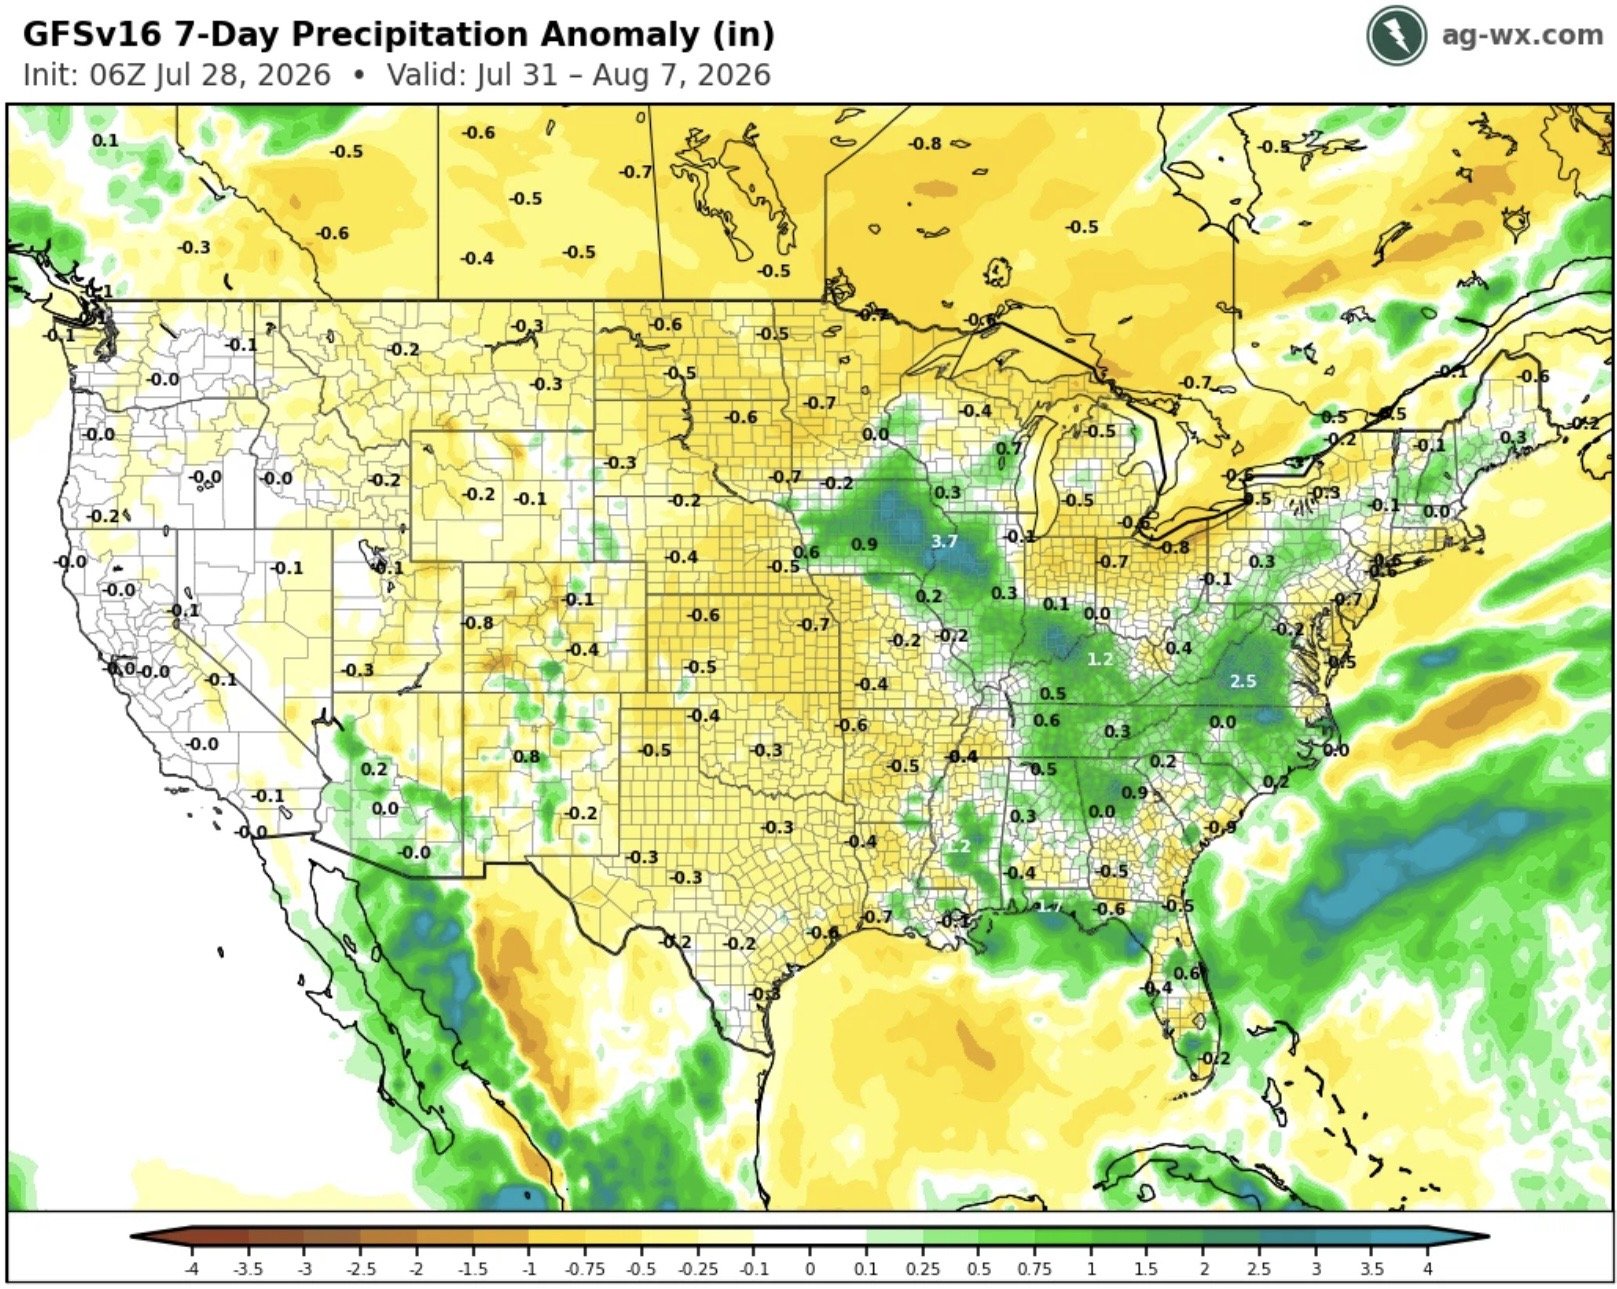
For reference here was the outlook for the first week of August on Friday vs the first week of August today.
They did throw in some rain vs originally expecting it to be bone dry.
Friday
Today
There was also talk that China wasn’t happy with tariffs so that caused some concern with China relations.
Then lastly we saw the Iran war de-escalate which led to crude oil and soybean oil tanking yesterday.
As a result, soybeans led the way lower yesterday. Given that part of the weakness was China relations and pressure in soybean oil.
Weather
Let's take a quick look at the weather. As there are some discrepancies in the models.
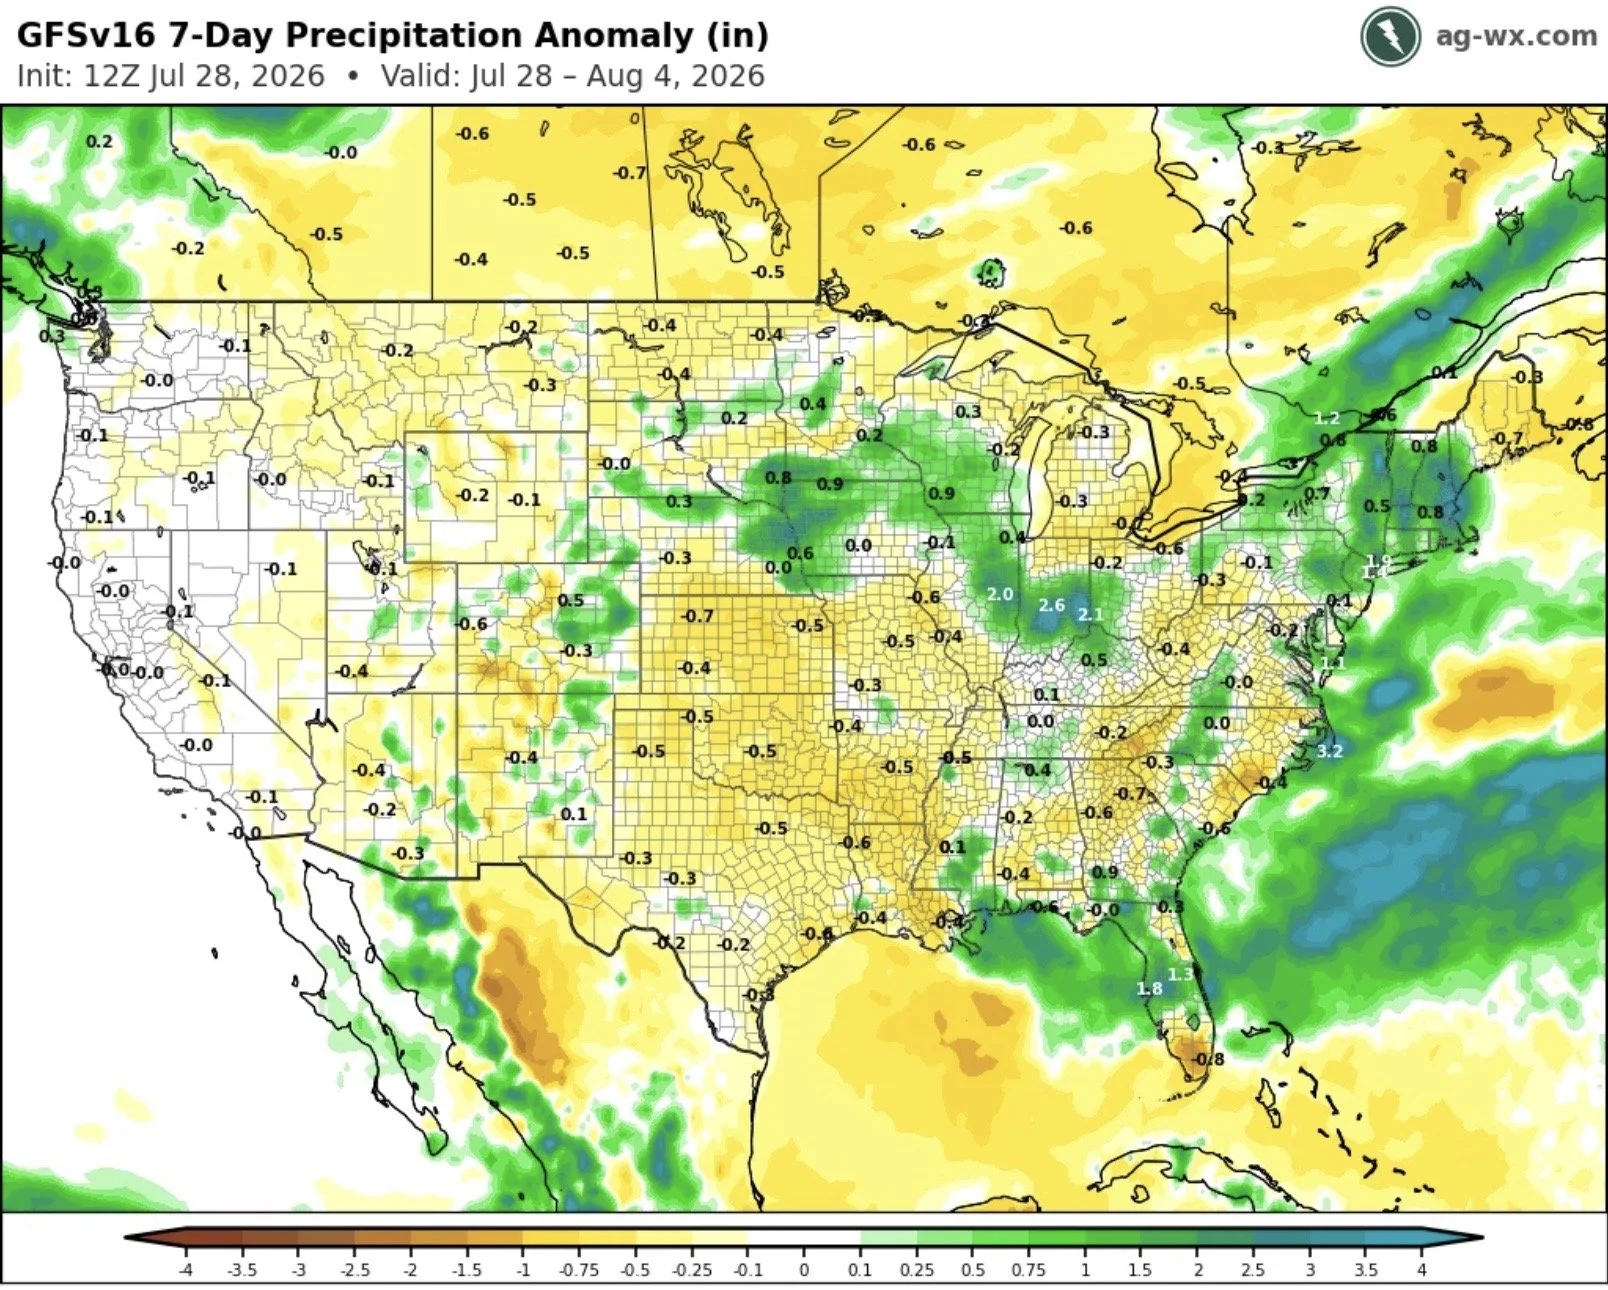
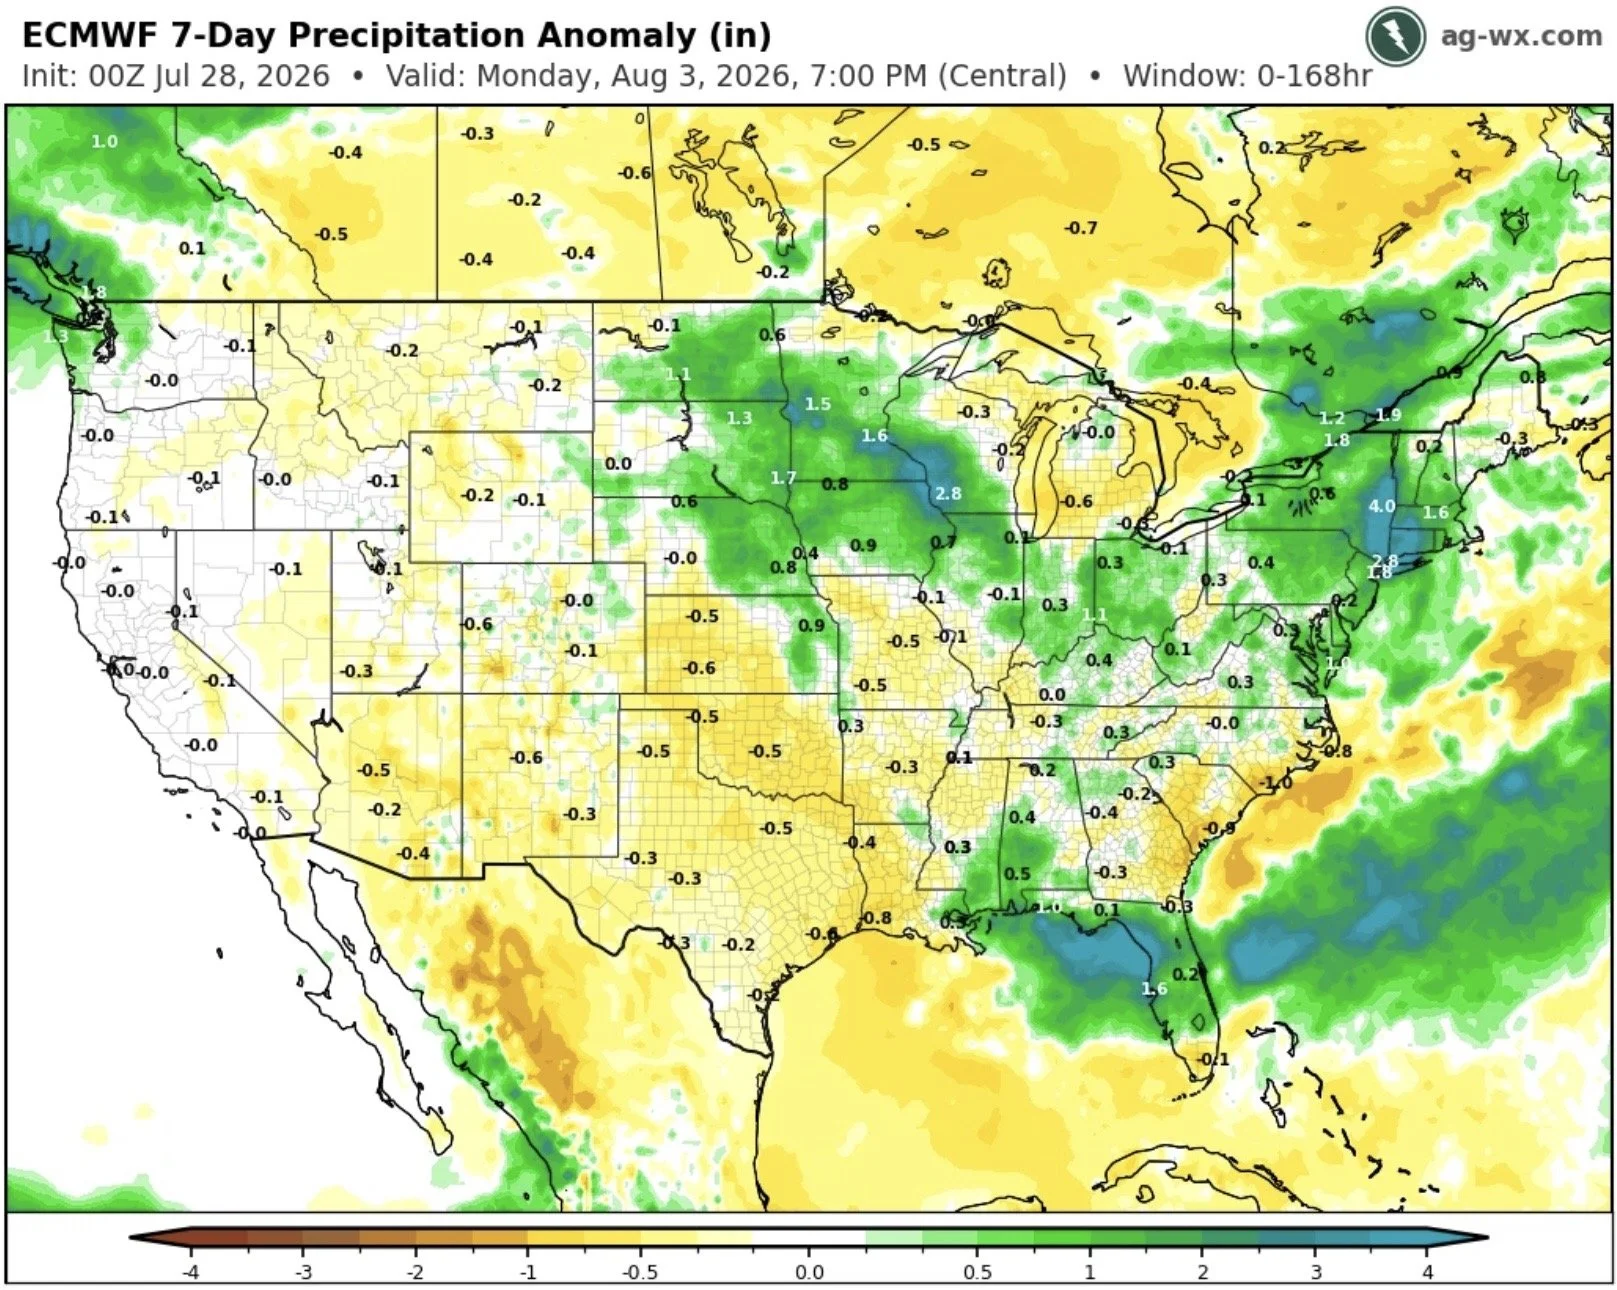
Here is the GFS vs the Euro for the next 7-days.
The Euro is a lot wetter than the GFS is.
GFS
Euro
Here is another big discrepancy in the models.
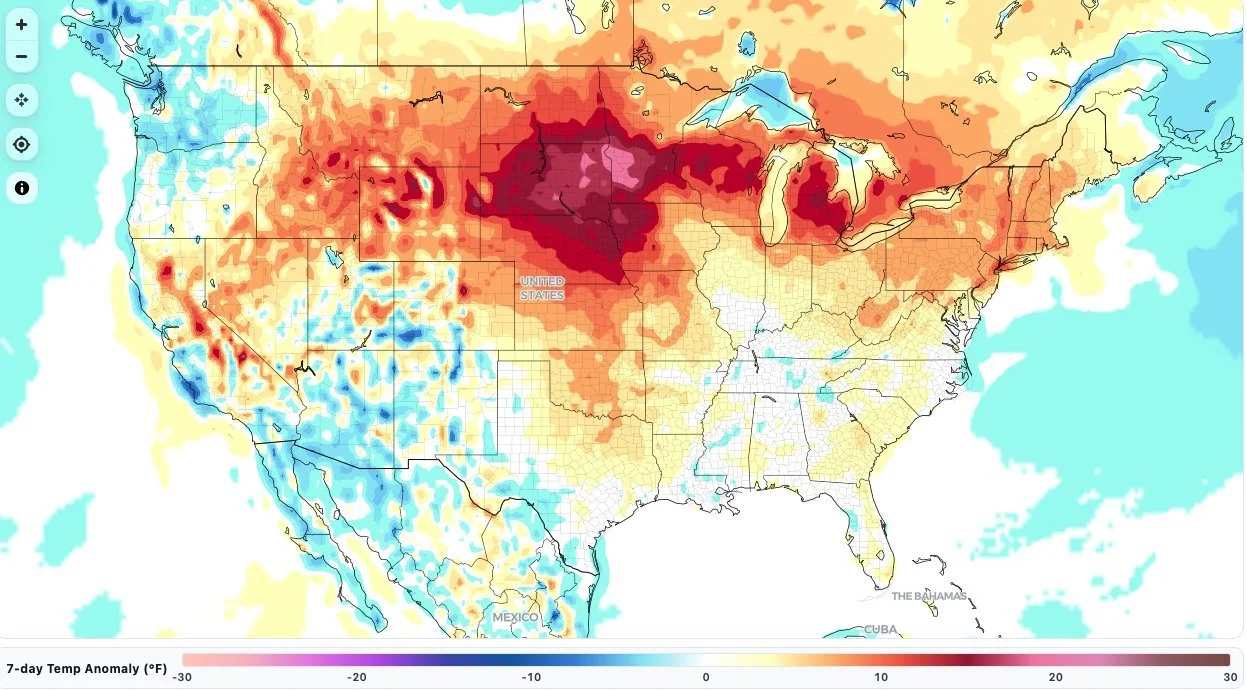
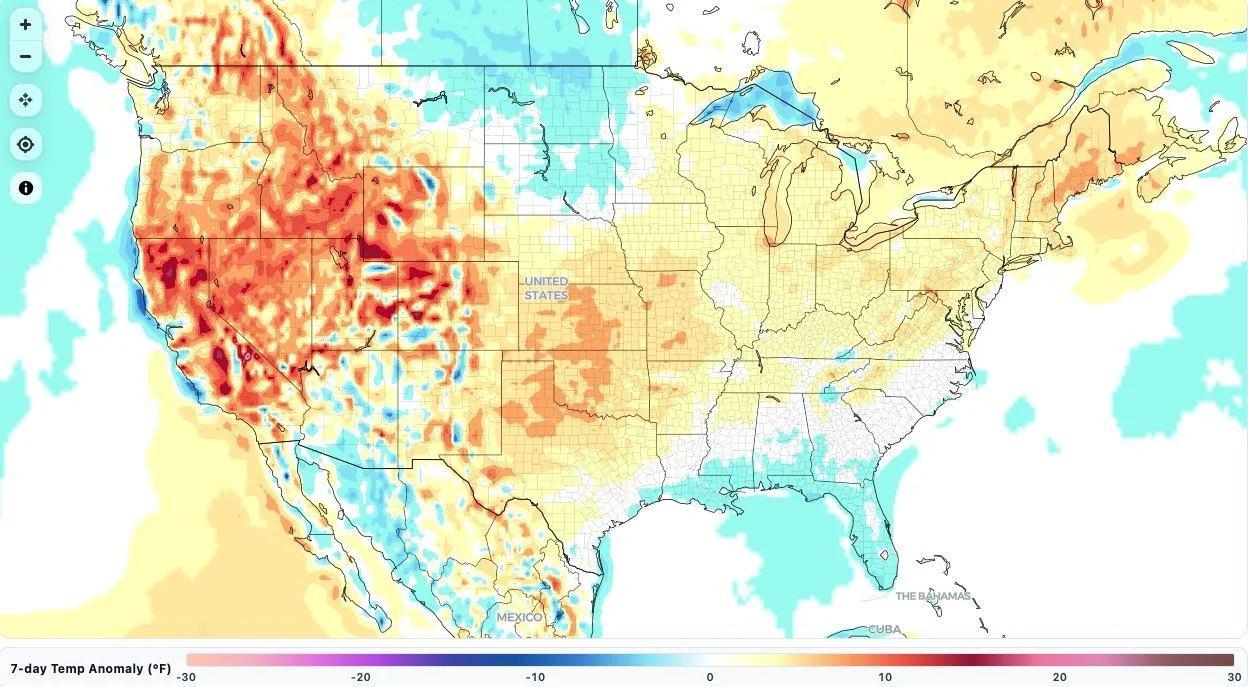
This is the heat outlook for week two.
The GFS is far hotter than the Euro is.
Seems safe to say no one knows what's actually going to happen.
The market knows it's been hot and dry, and we've rallied.
So now it's all about what do the forecasts say and what verifies or doesn’t verify?
GFS
Euro
Crop Ratings: Big Drop
Today's strength was all about yesterday’s crop ratings.
We actually saw some historically large drops that helped provide a boost today.
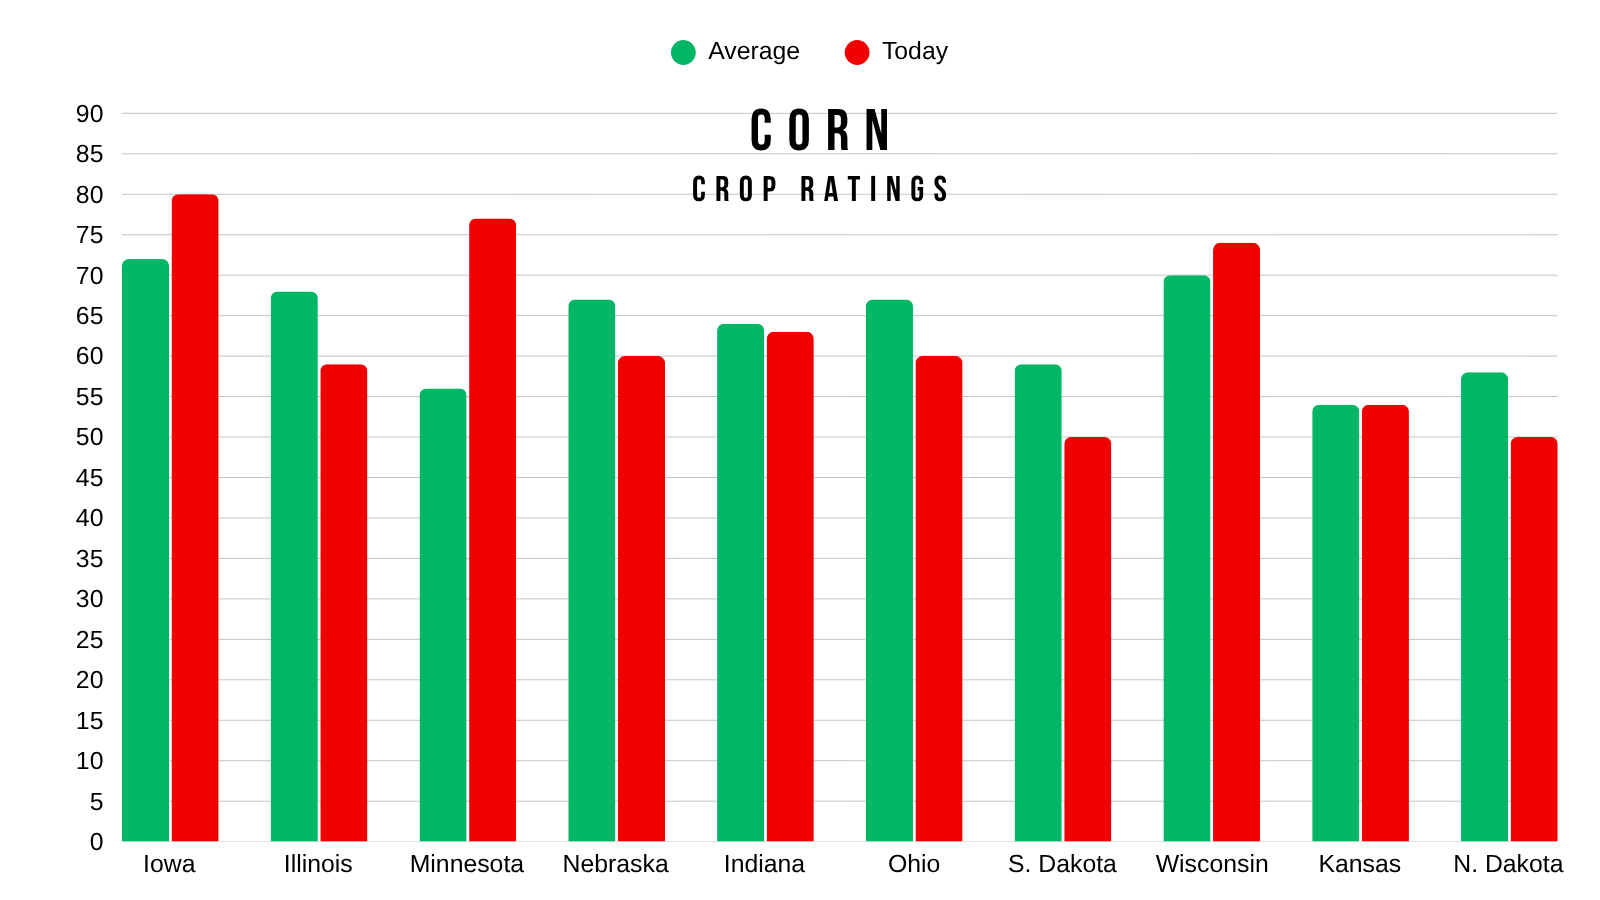
Corn Ratings:
Corn dropped -4% (vs -2% expected).
The market was expecting ratings to drop, but they dropped by more than was anticipated.
For corn, this was the largest weekly drop since 2023.
Corn ratings now sit at 63% G/E.
Which is -10% below last year's 73% but just under the 5-year average of 64%.
This rating is however the lowest since 2023.

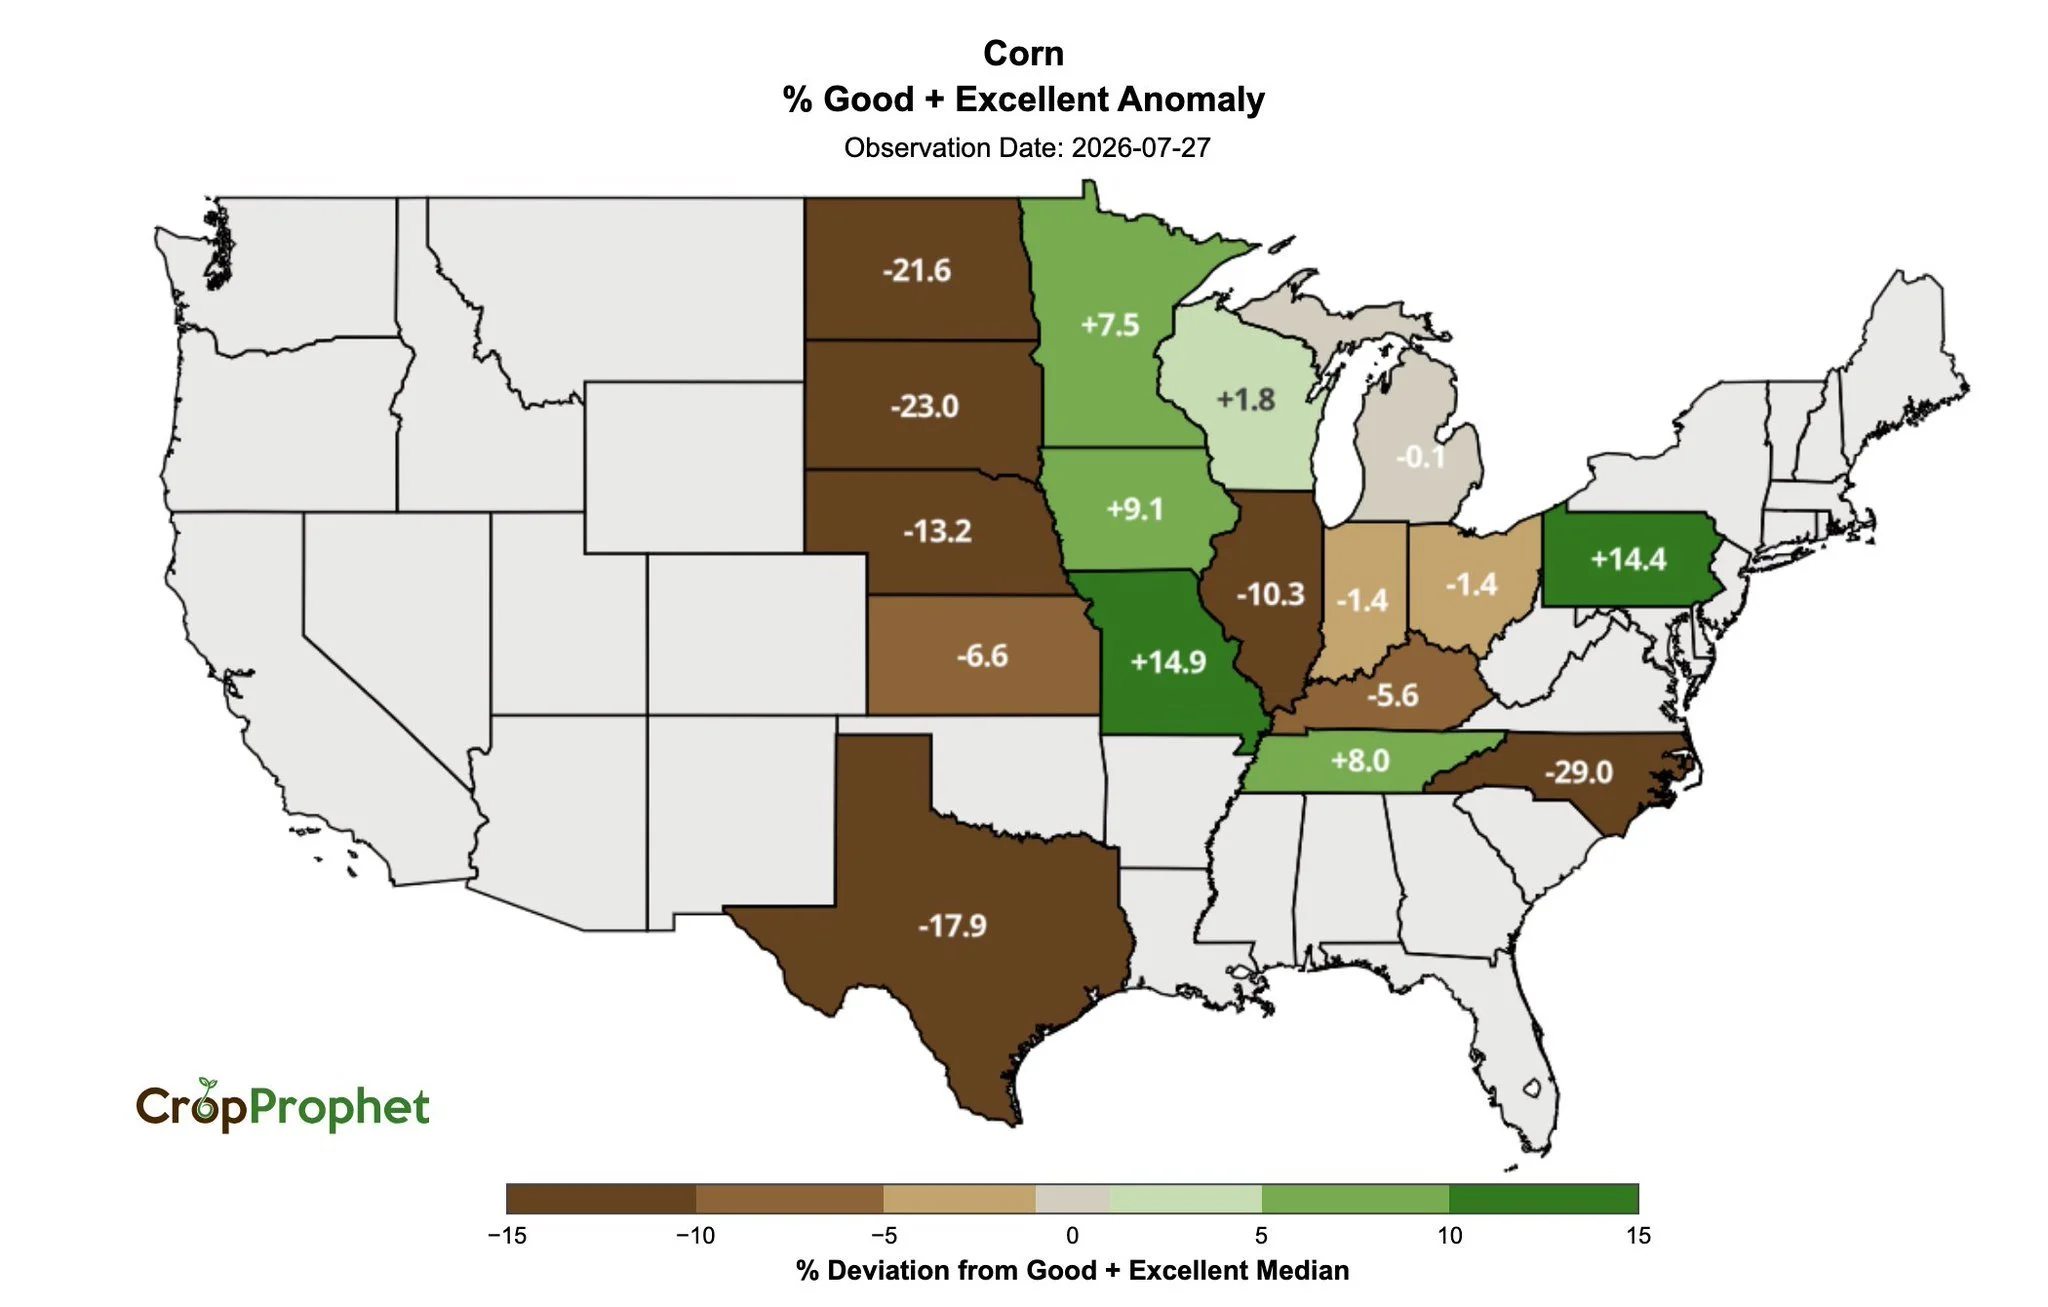
Here is a great map from Crop Prophet that shows the current state ratings vs their 5-year average.
The clear issue remains out west.
North Dakota and South Dakota are over -20% worse than normal.
However you do have Iowa sitting +9% better than normal.
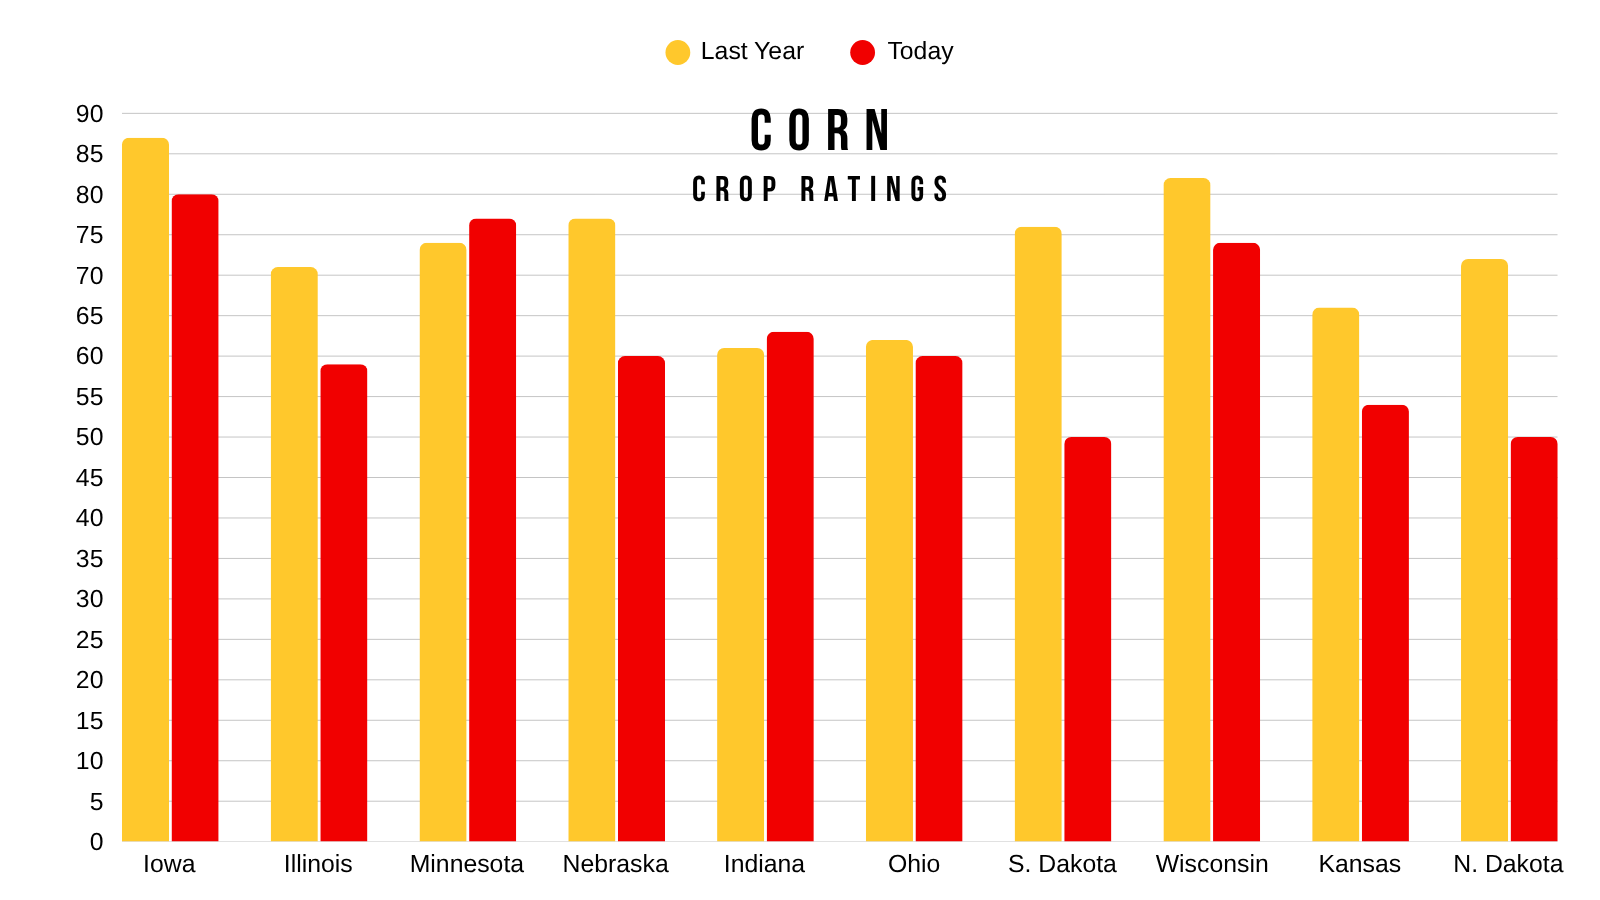
Here is how the top 10 states stack up vs last year.
Better than last year:
Minnesota
Indiana
Worse than last year
Iowa
Illinois
Nebraska
Ohio
S. Dakota
Wisconsin
Kansas
N. Dakota
8 of the top 10 states are worse than last year. So seems safe to say the crop is not nearly as good as it was last year.
Here is how the top 10 states stack up vs their average rating.
Better than Avg:
Iowa
Minnesota
Wisconsin
Kansas
Worse than Avg:
Illinois
Nebraska
Indiana
Ohio
S. Dakota
N. Dakota
So 6 of the top 10 states are also rated worse than normal.
Soybean Ratings:
Soybeans dropped -3% (vs -2% expected).
For soybeans, it was the largest weekly drop since 2020.
We are rated at 63% G/E.
Which is -7% worse than last year but still just about the 5-year average of 62%.

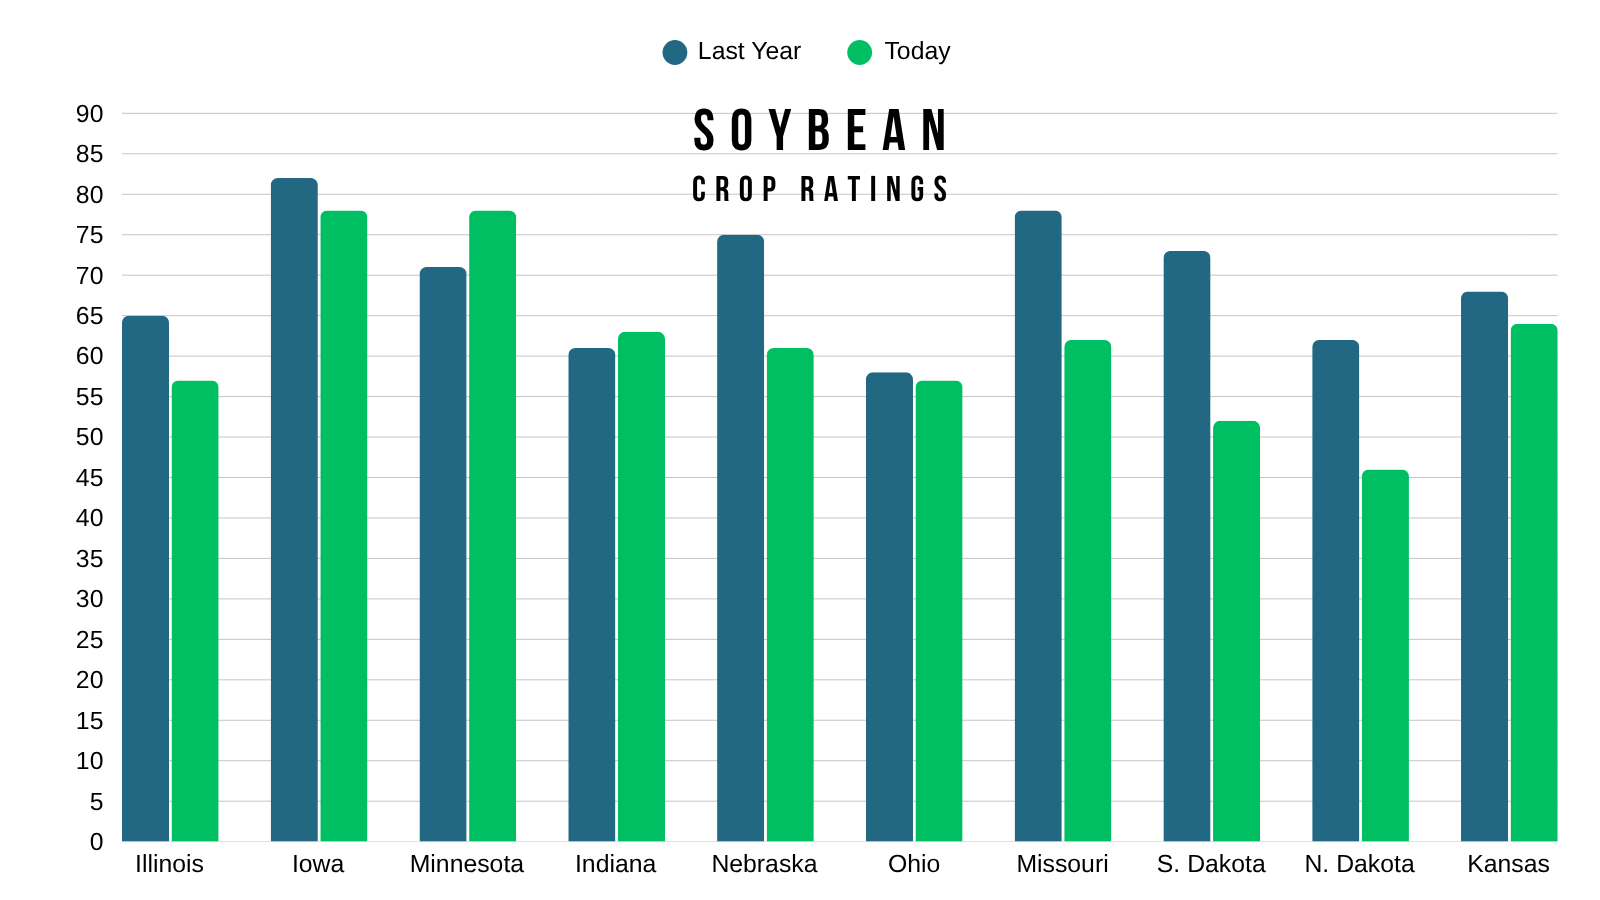
Here is how the top 10 states stack up vs last year.
Better than Last Year:
Minnesota
Indiana
Worse than Last Year:
Illinois
Iowa
Nebraska
Ohio
Missouri
S. Dakota
N. Dakota
Kansas
8 of the top 10 are worse than last year.
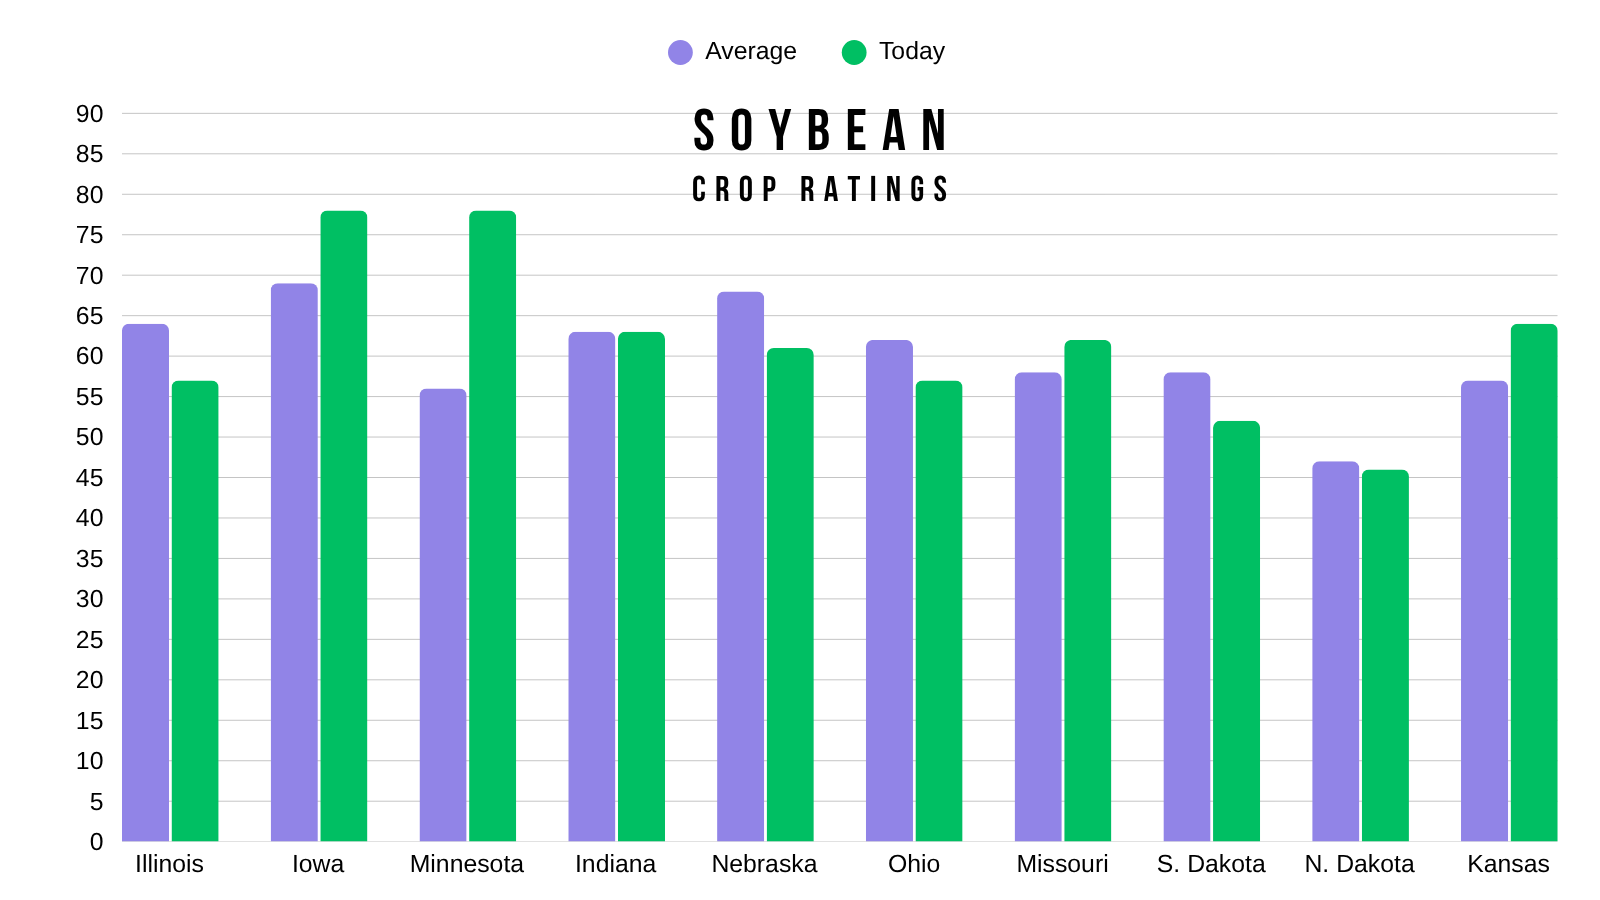
Here is the top 10 vs their 5-year average.
Better than Avg:
Iowa
Minnestoa
Indiana
Missouri
Kansas
Worse than Avg:
Illinois
Nebraska
Ohio
S. Dakota
N. Dakota
Although the crop appears worse than last year, it's about 50/50 when compared to average.
Today's Main Takeaways
Corn
Supply vs Demand Rallies:
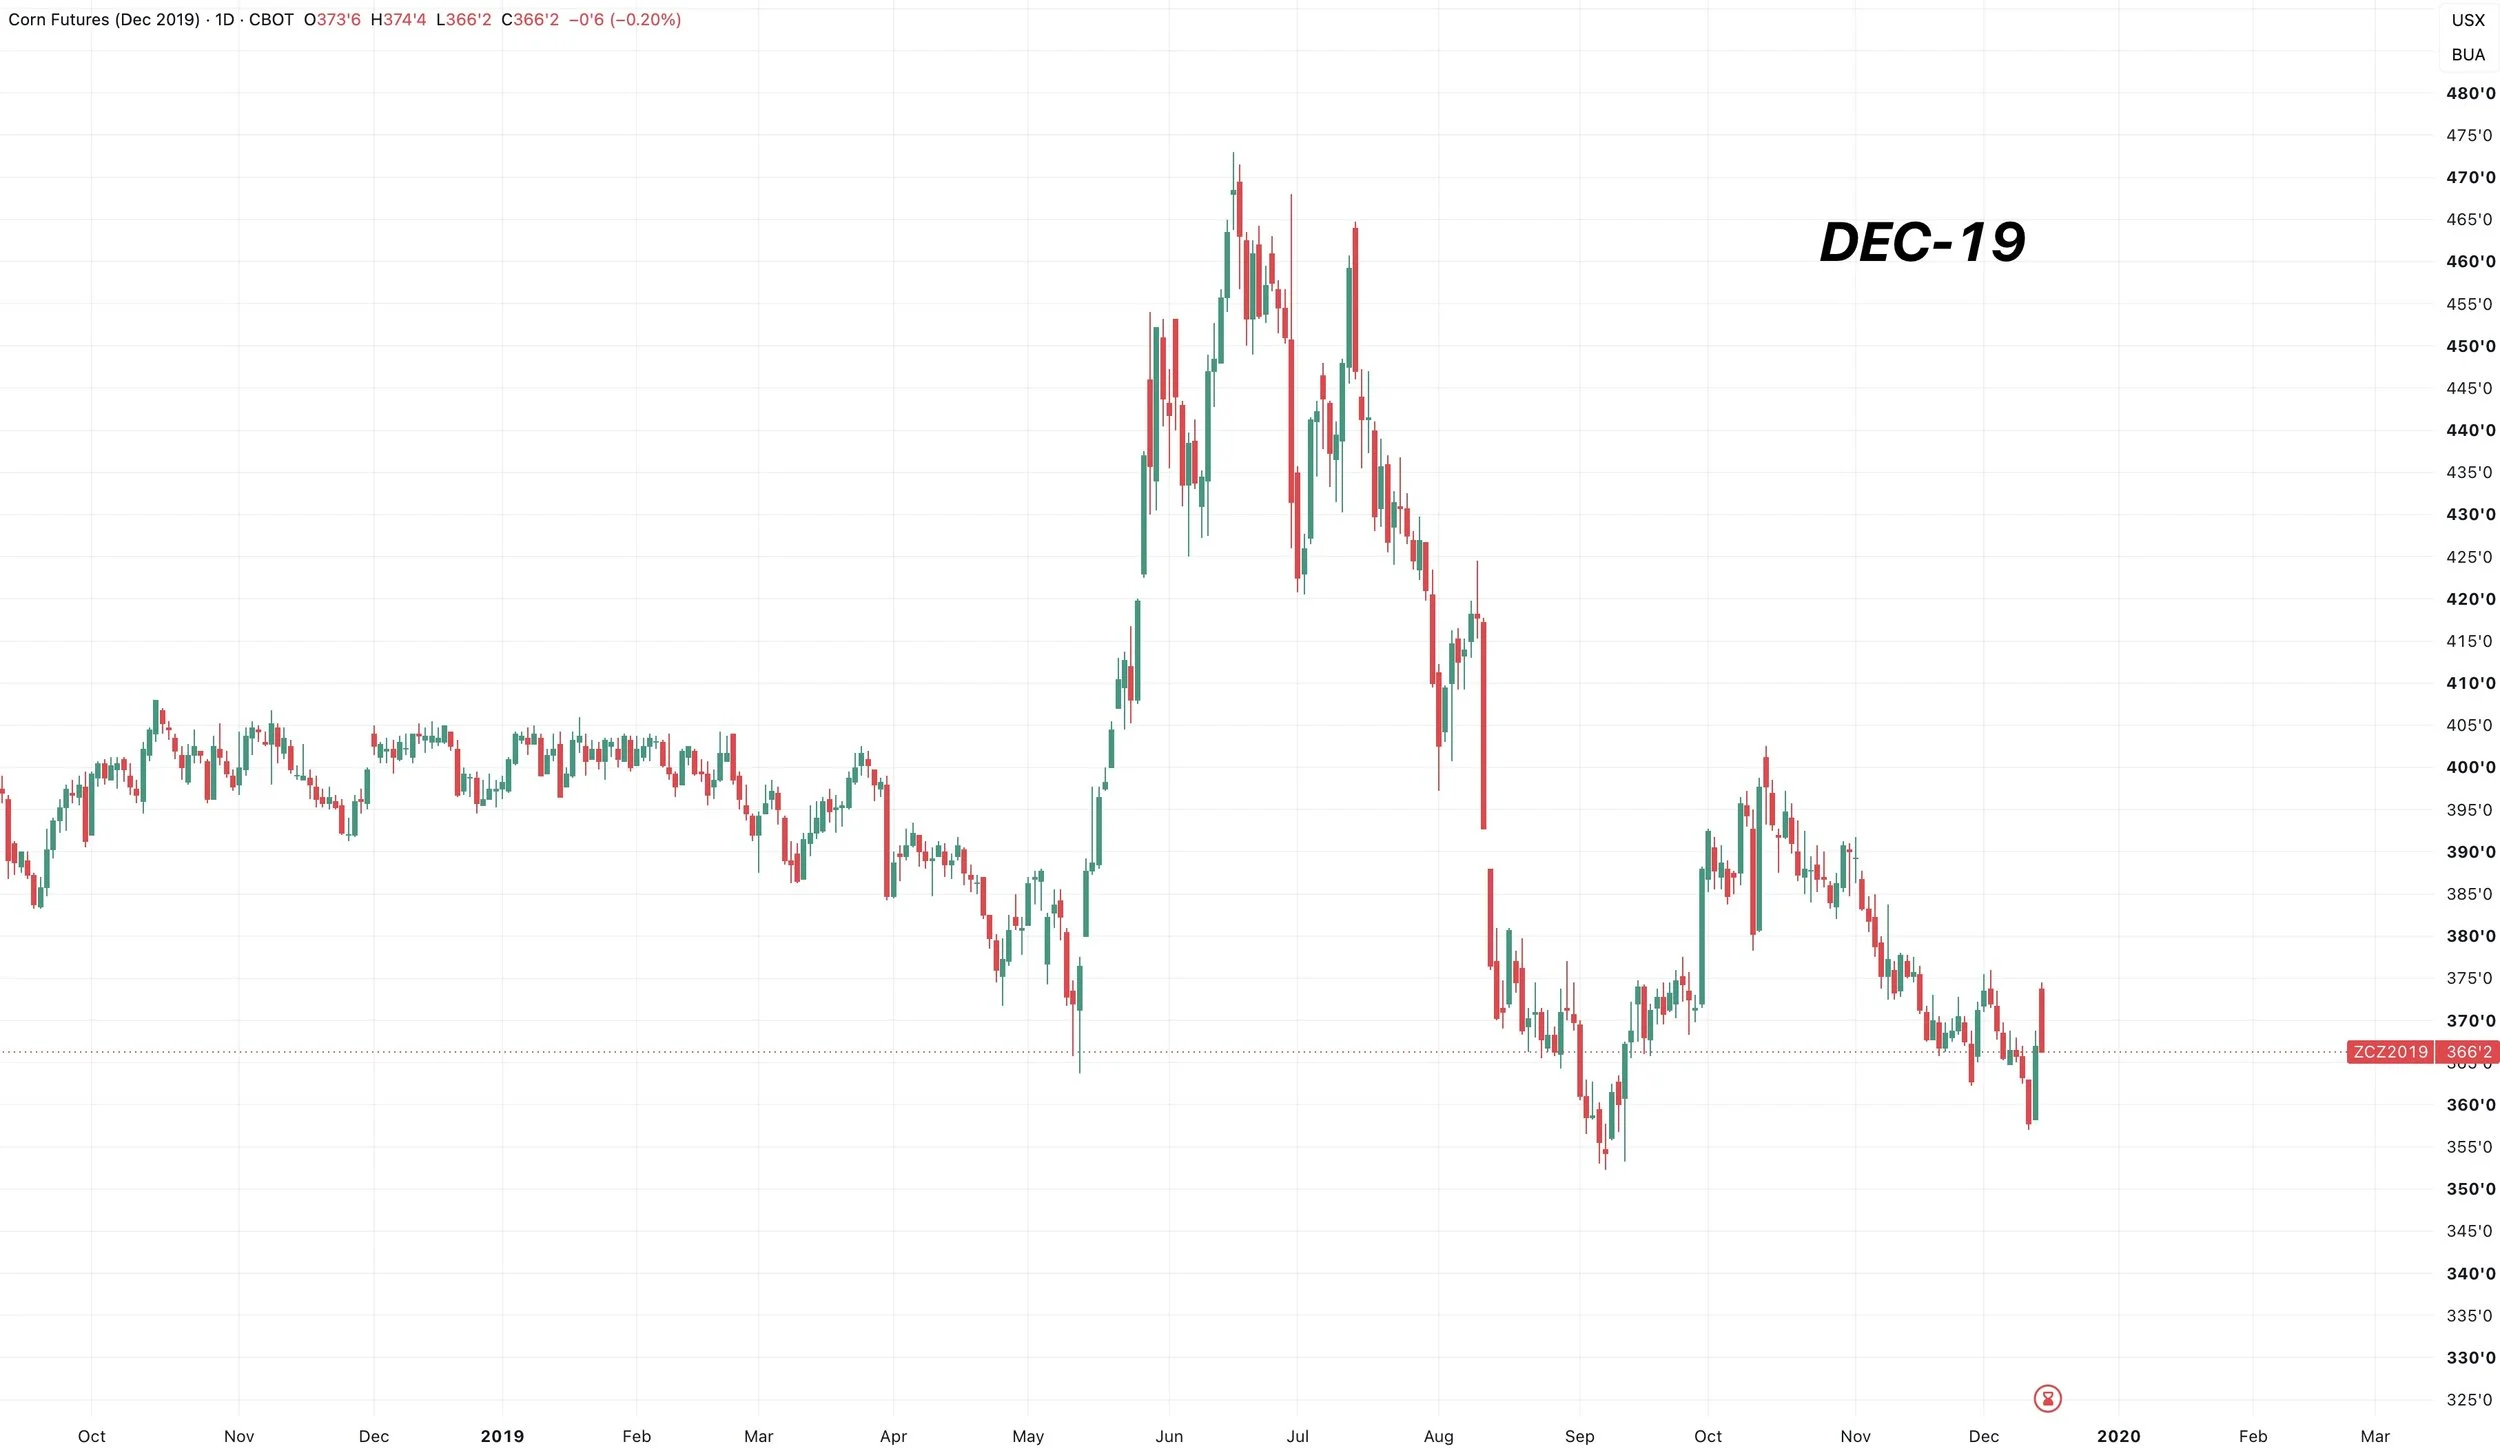
What is the difference between a supply rally and a demand rally?
Usually, supply rallies are meant to be rewarded.
Demand rallies are meant to be respected.
Supply rallies run hard and fast, but often don’t last. Demand rallies take longer to build, but they often last.
Here are some examples.
2019: Supply Rally
The rally went almost as fast as it came.
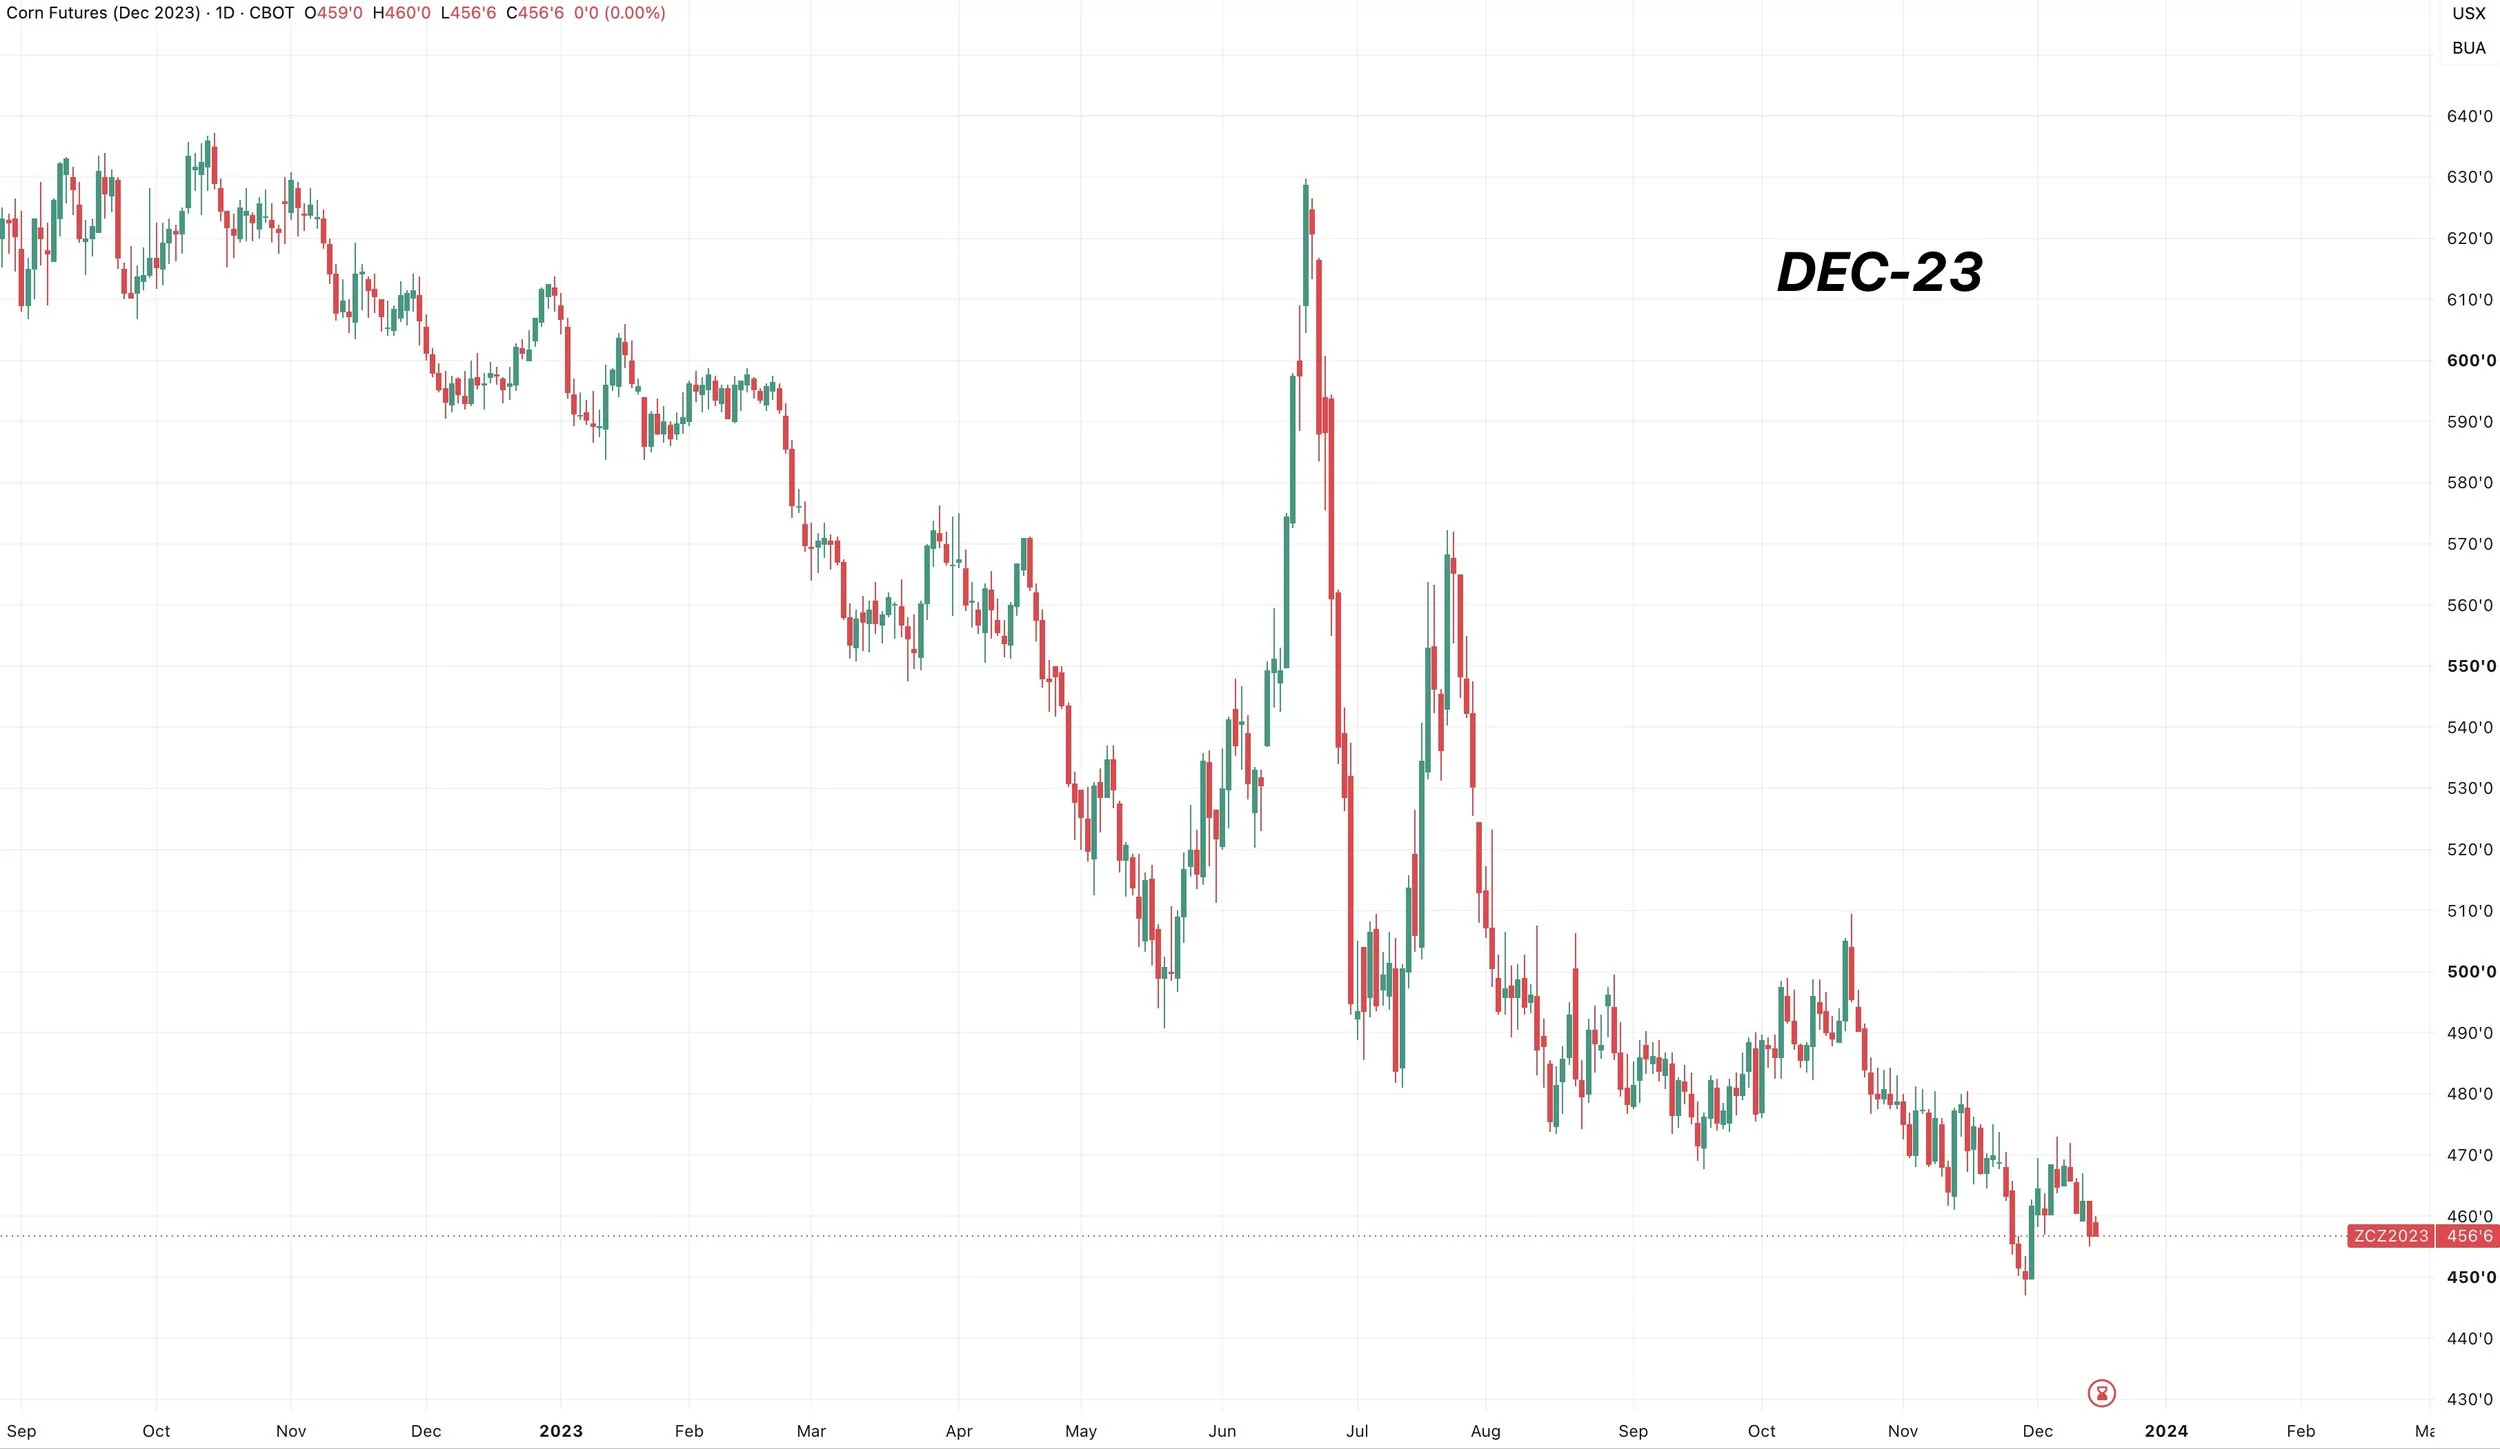
2023: Supply Rally
Another prime example of a supply rally.
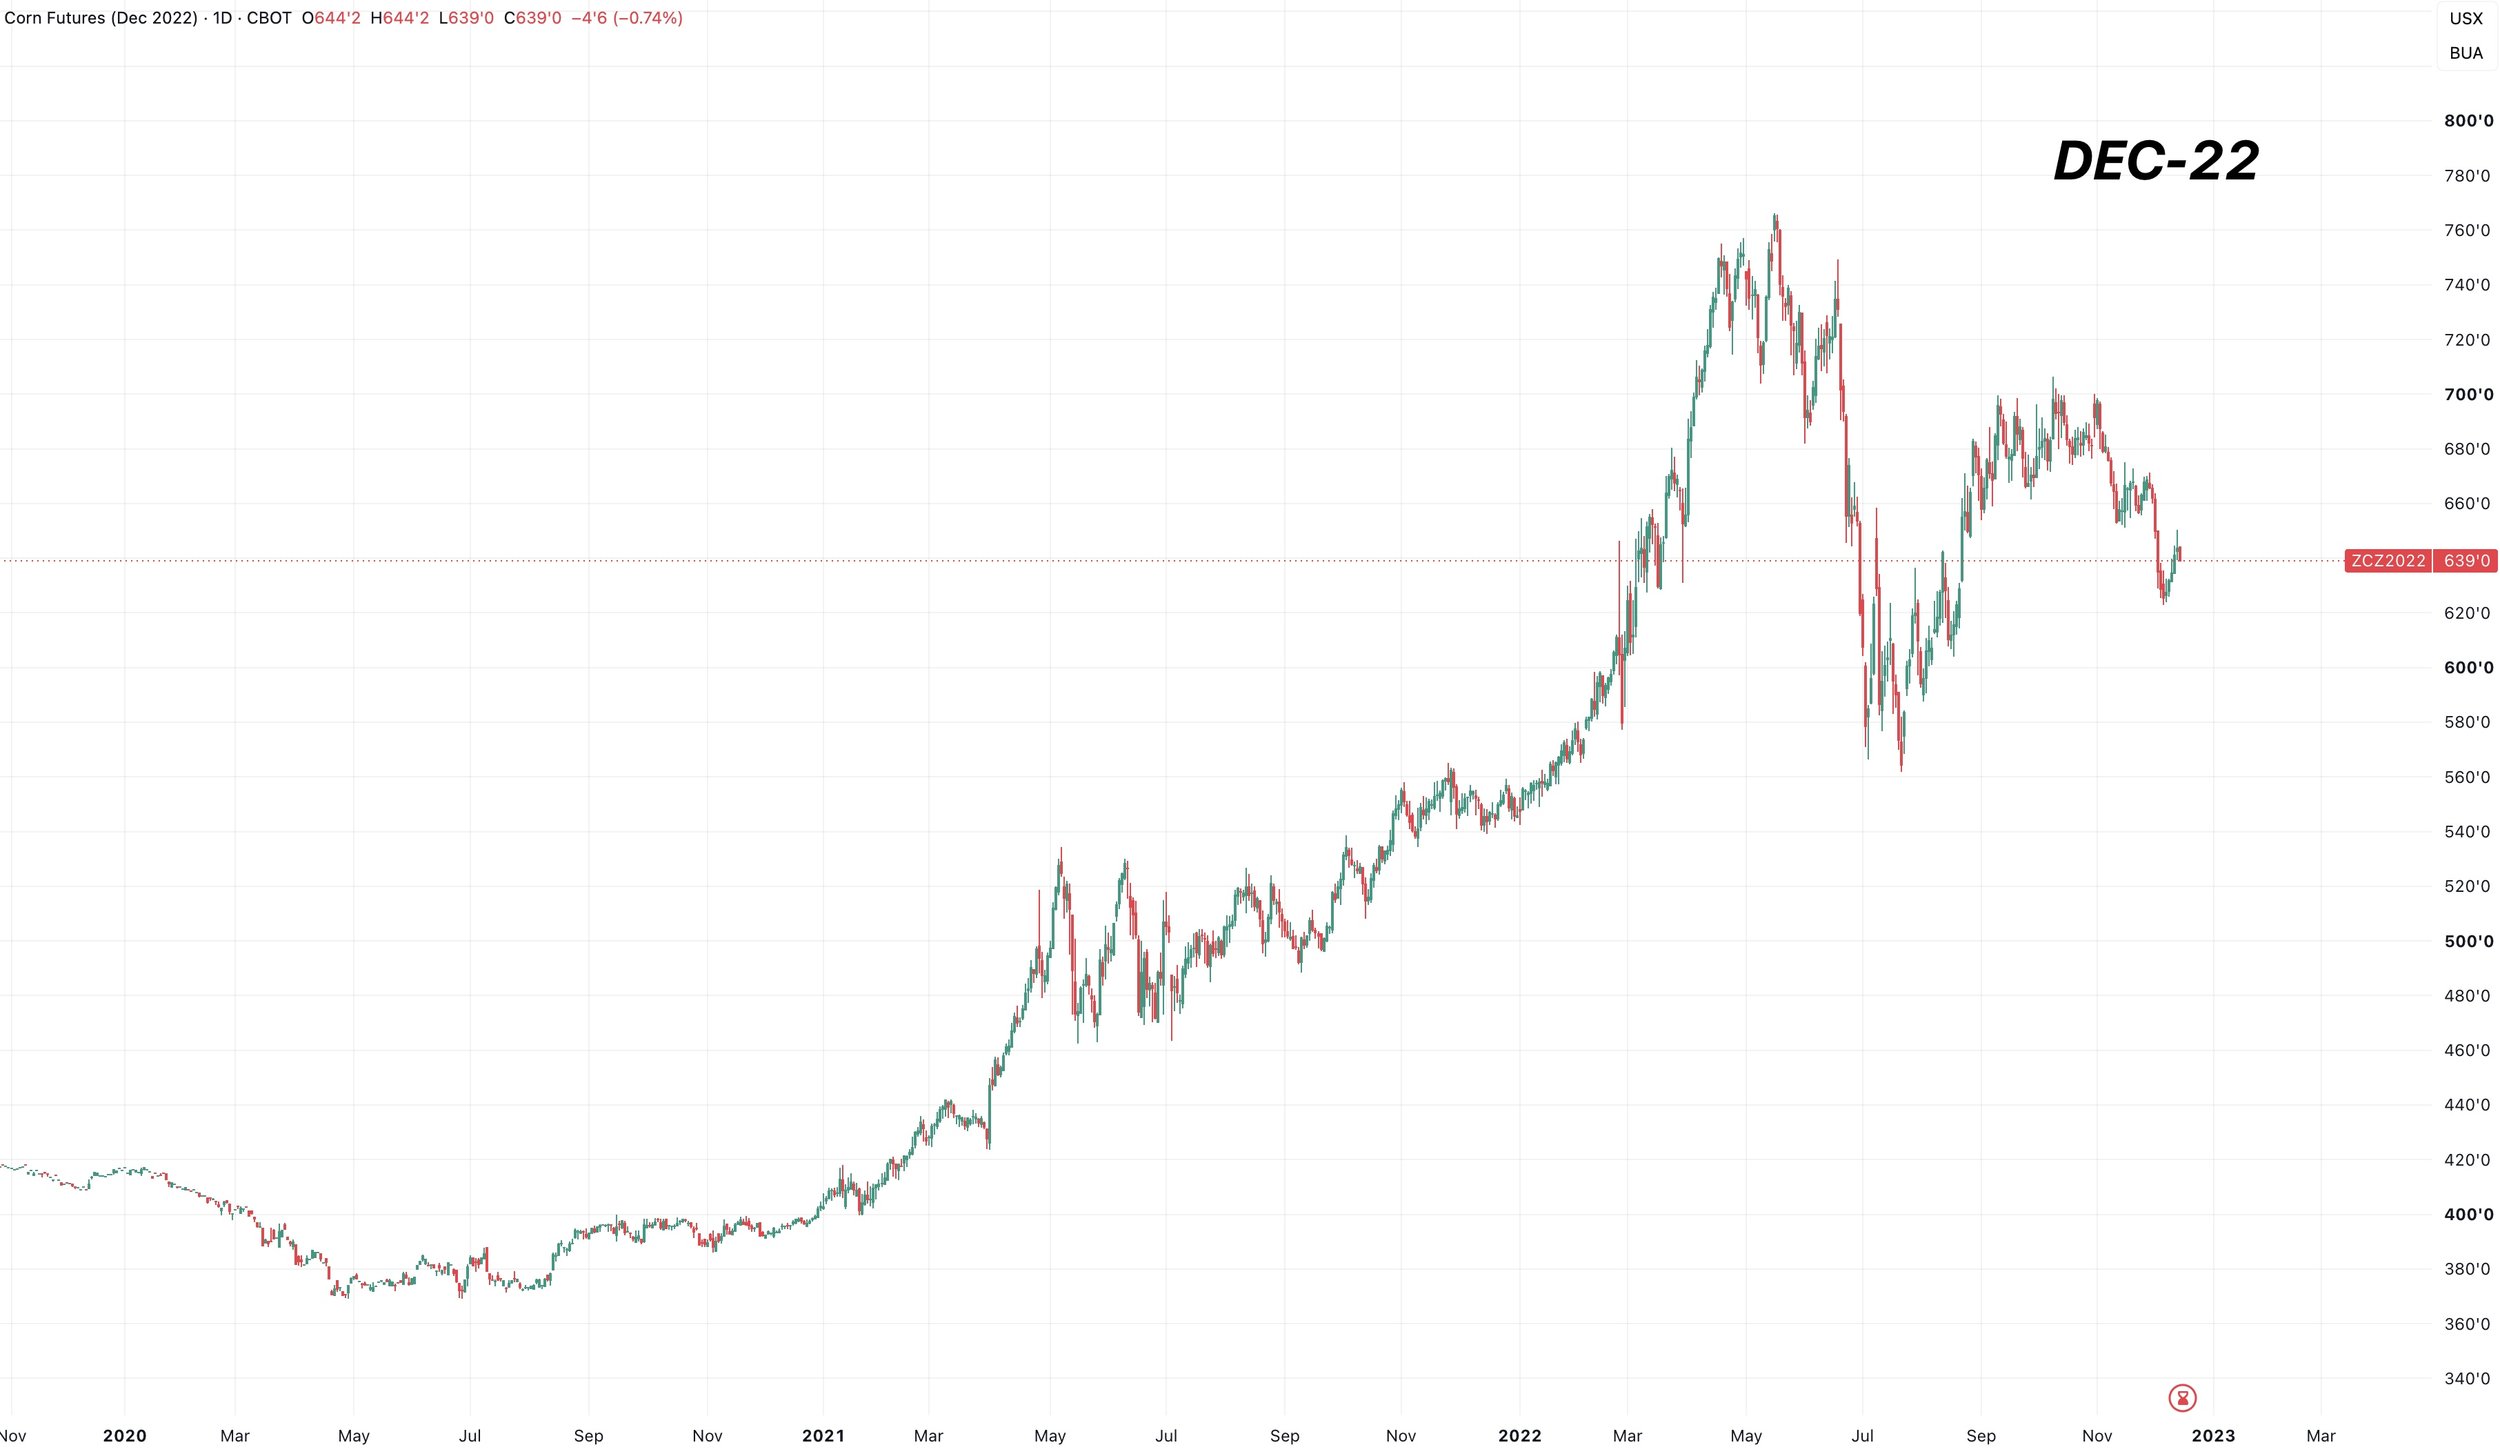
2022: Demand Rally
The rally built a long base in 2020, and ran higher for 2 years.
As it was led by demand.
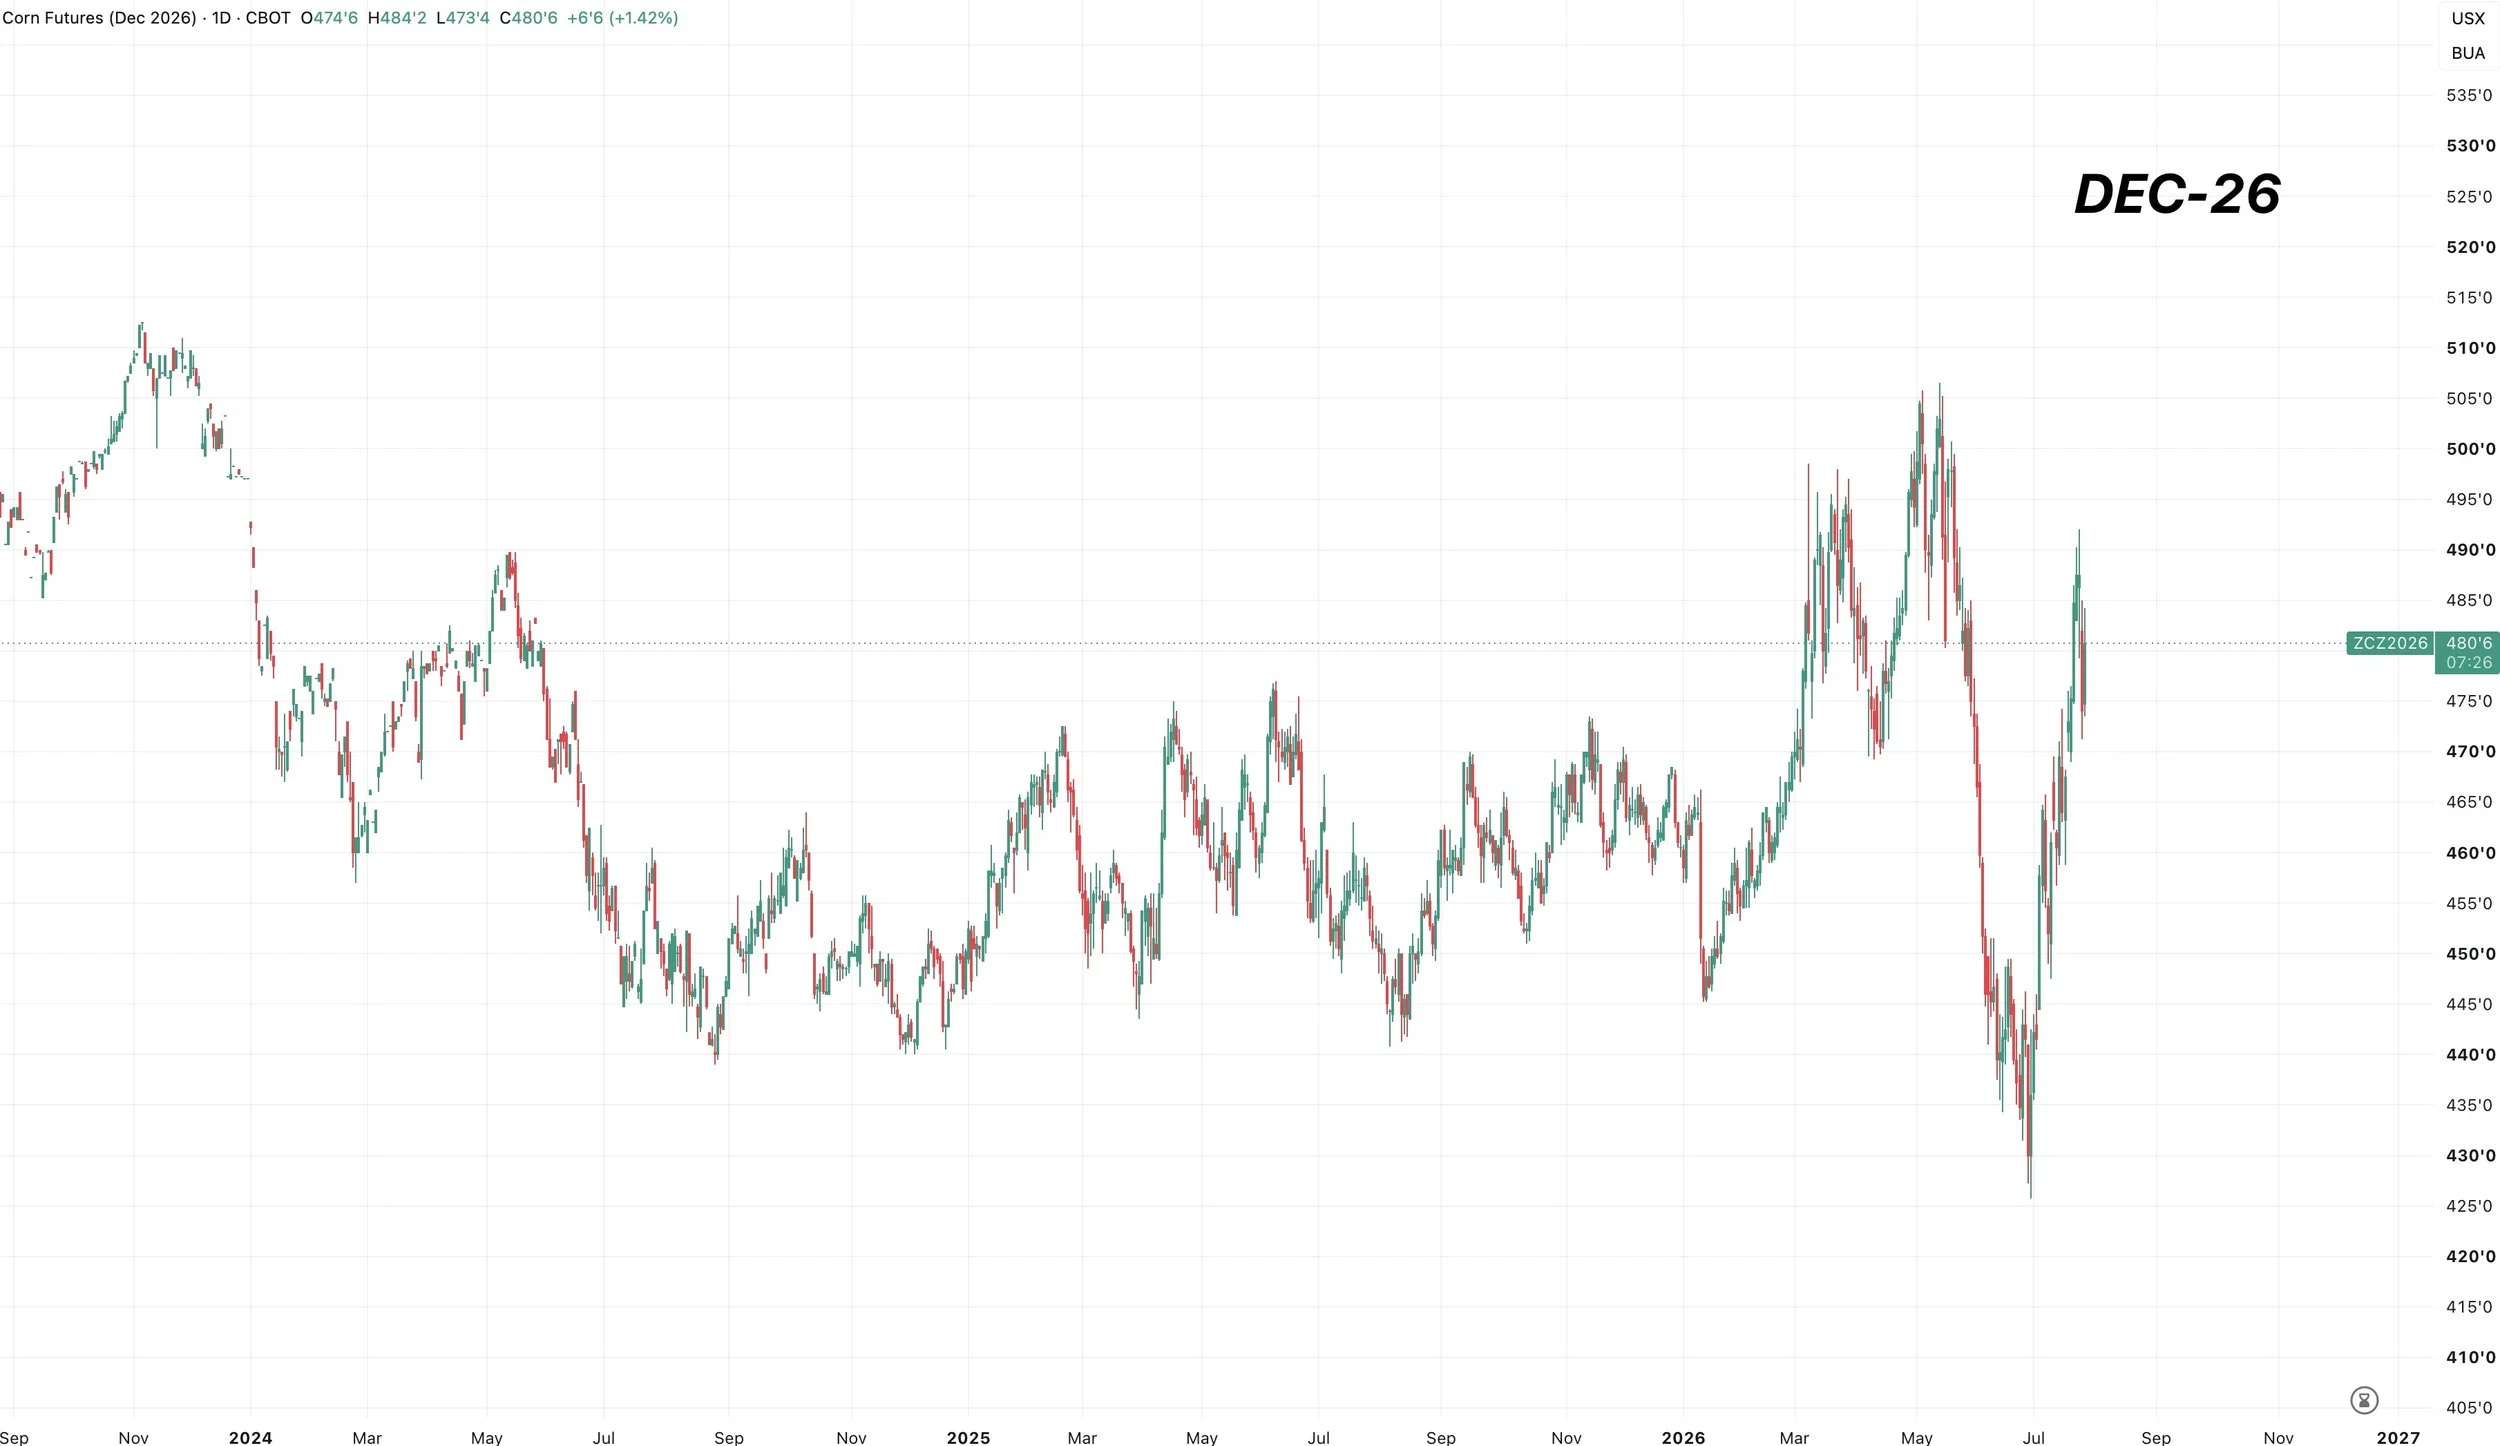
2026: ?
So which one are we in today?
You could argue both.
Short term, I would say this has been a supply rally. Which means we should still be managing our risk where it makes sense. As supply rallies can fade if the bull doesn’t continue to be fed.
But long term, I think this market could develop into a longer term demand rally.
A few reasons why:
I have talked about this a thousand times, the balance sheet simply cannot afford a non-trendline yield.
The recent crop conditions already have many speculating that yield may no longer be trend.
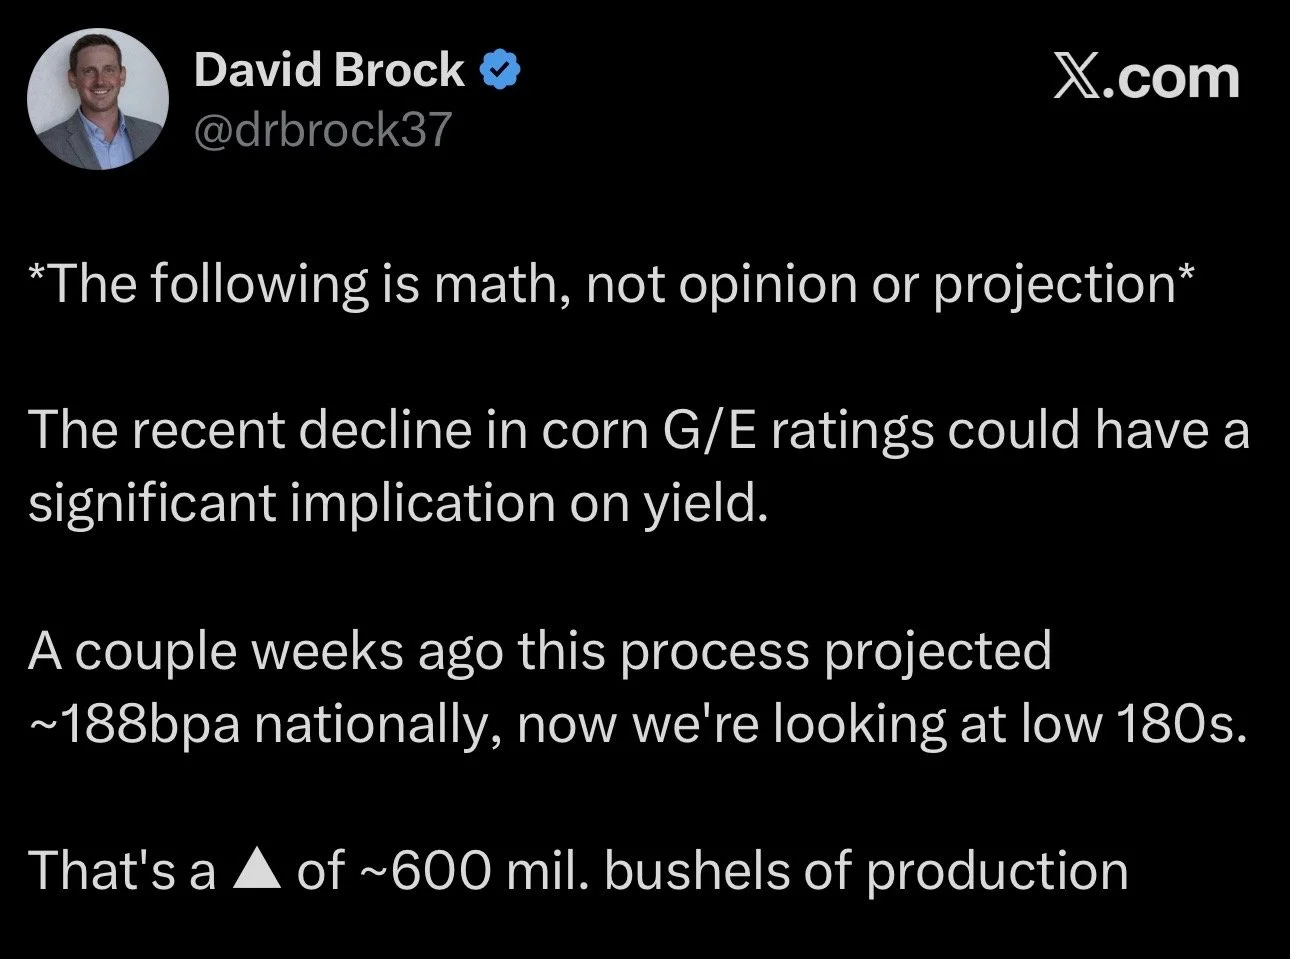
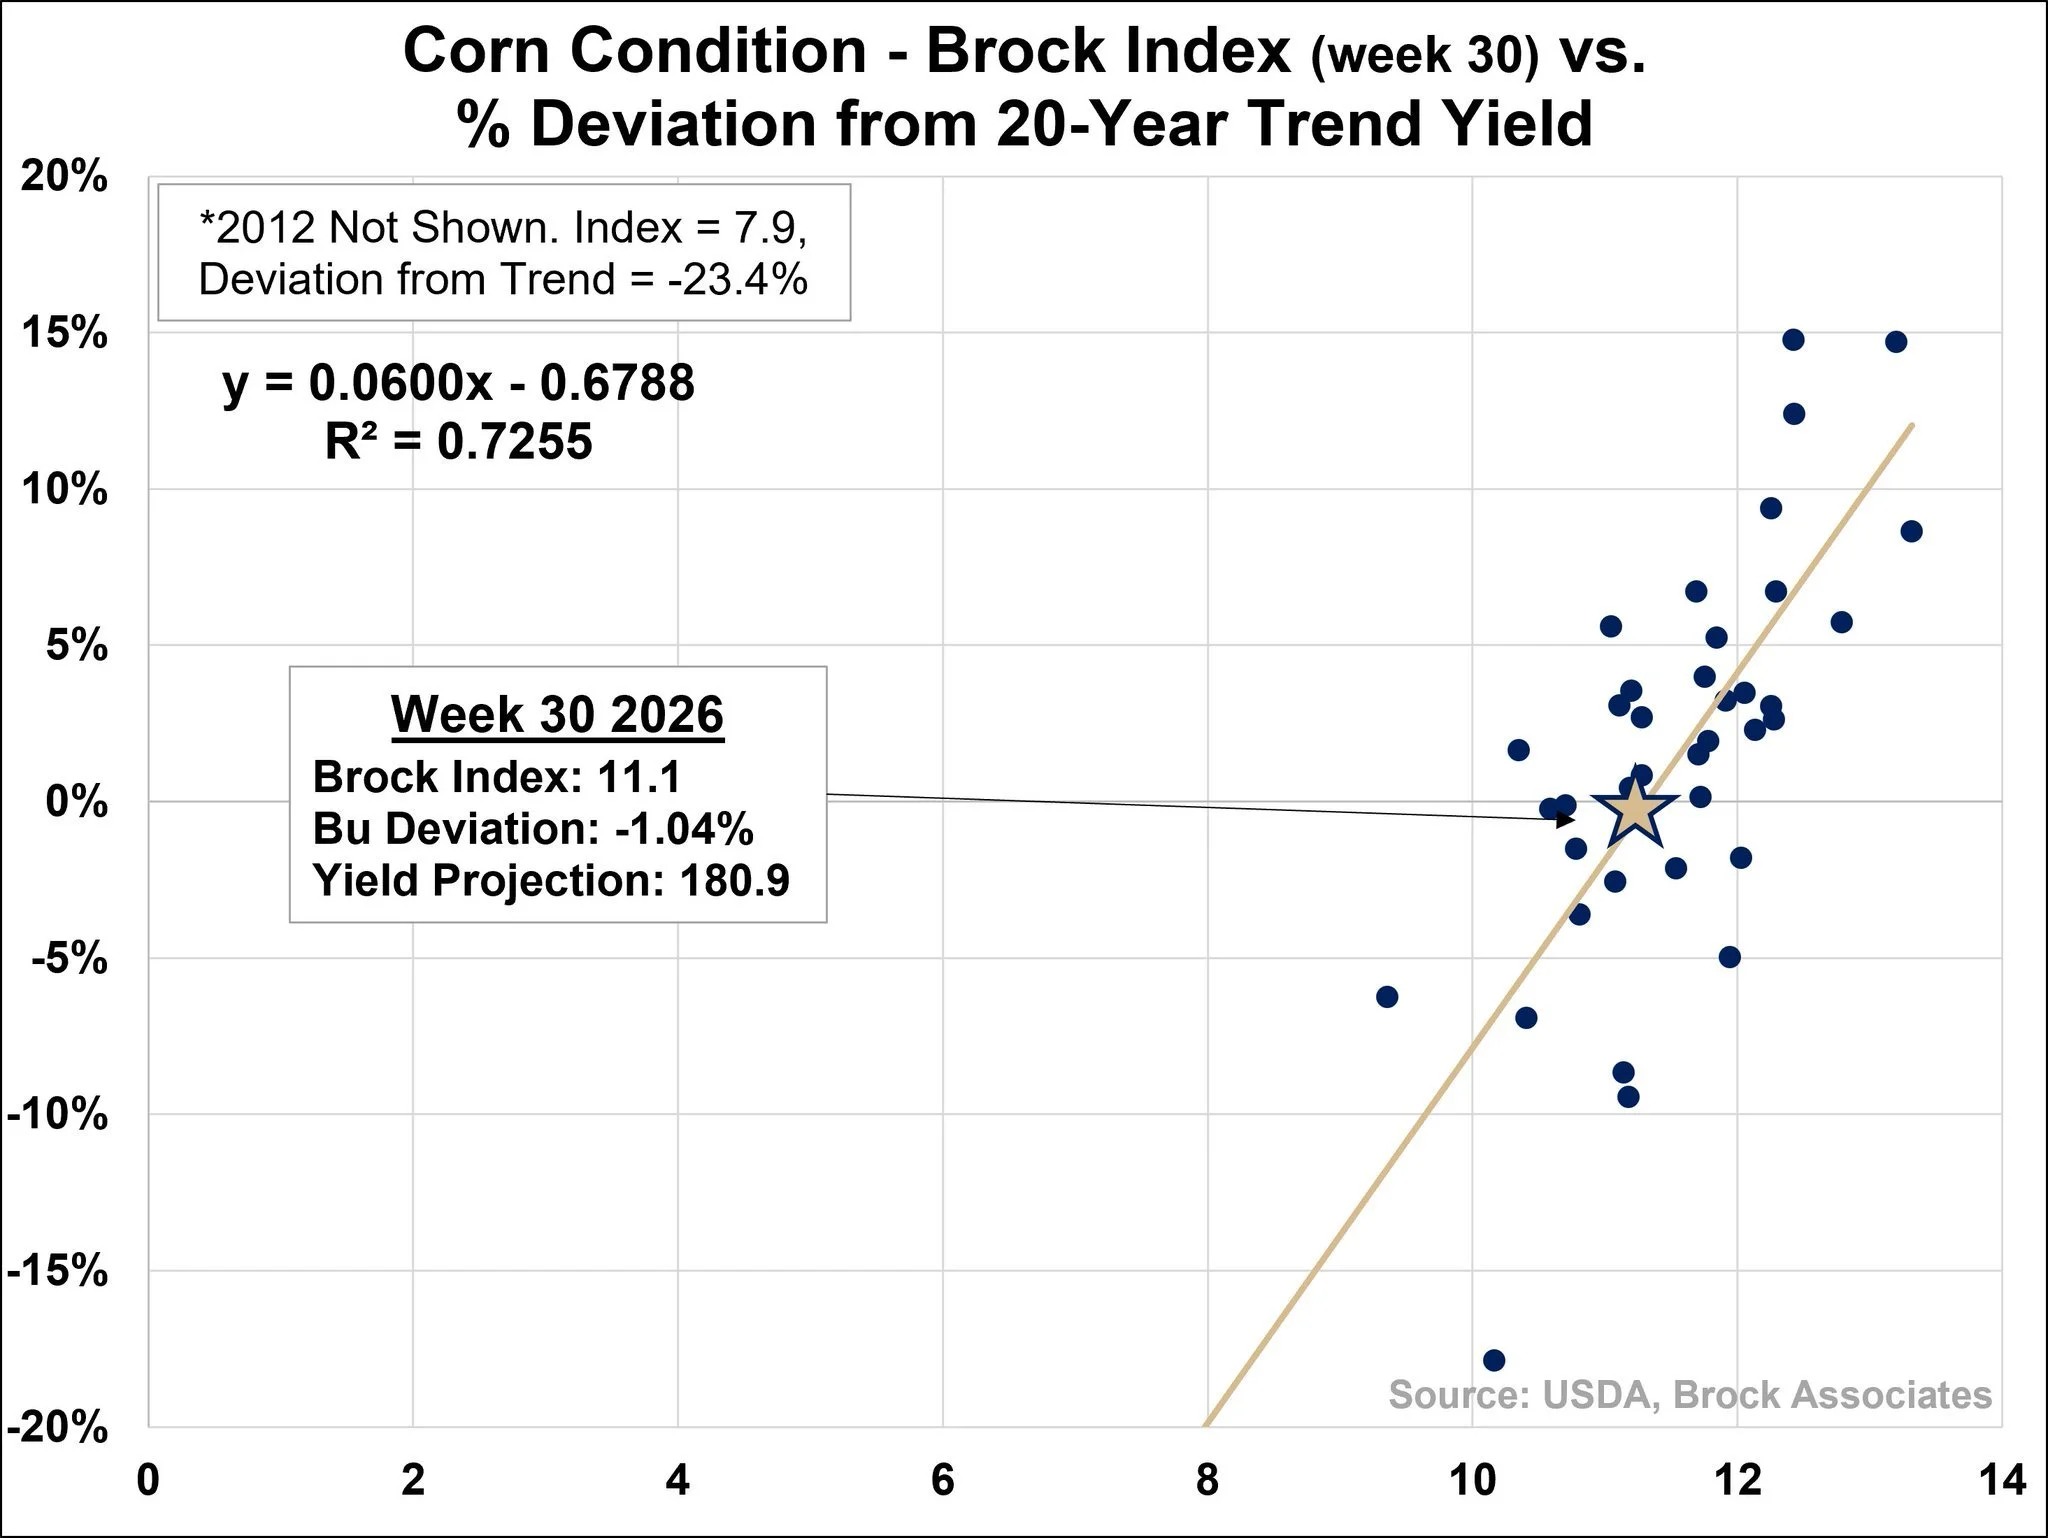
Here is a great post from Dave Brock of the Brock Report, where he shares his yield model based on crop conditions using math.
A few weeks ago the crop conditions were implying a 188 yield.
The math model now implies a yield of 180.9 bpa.
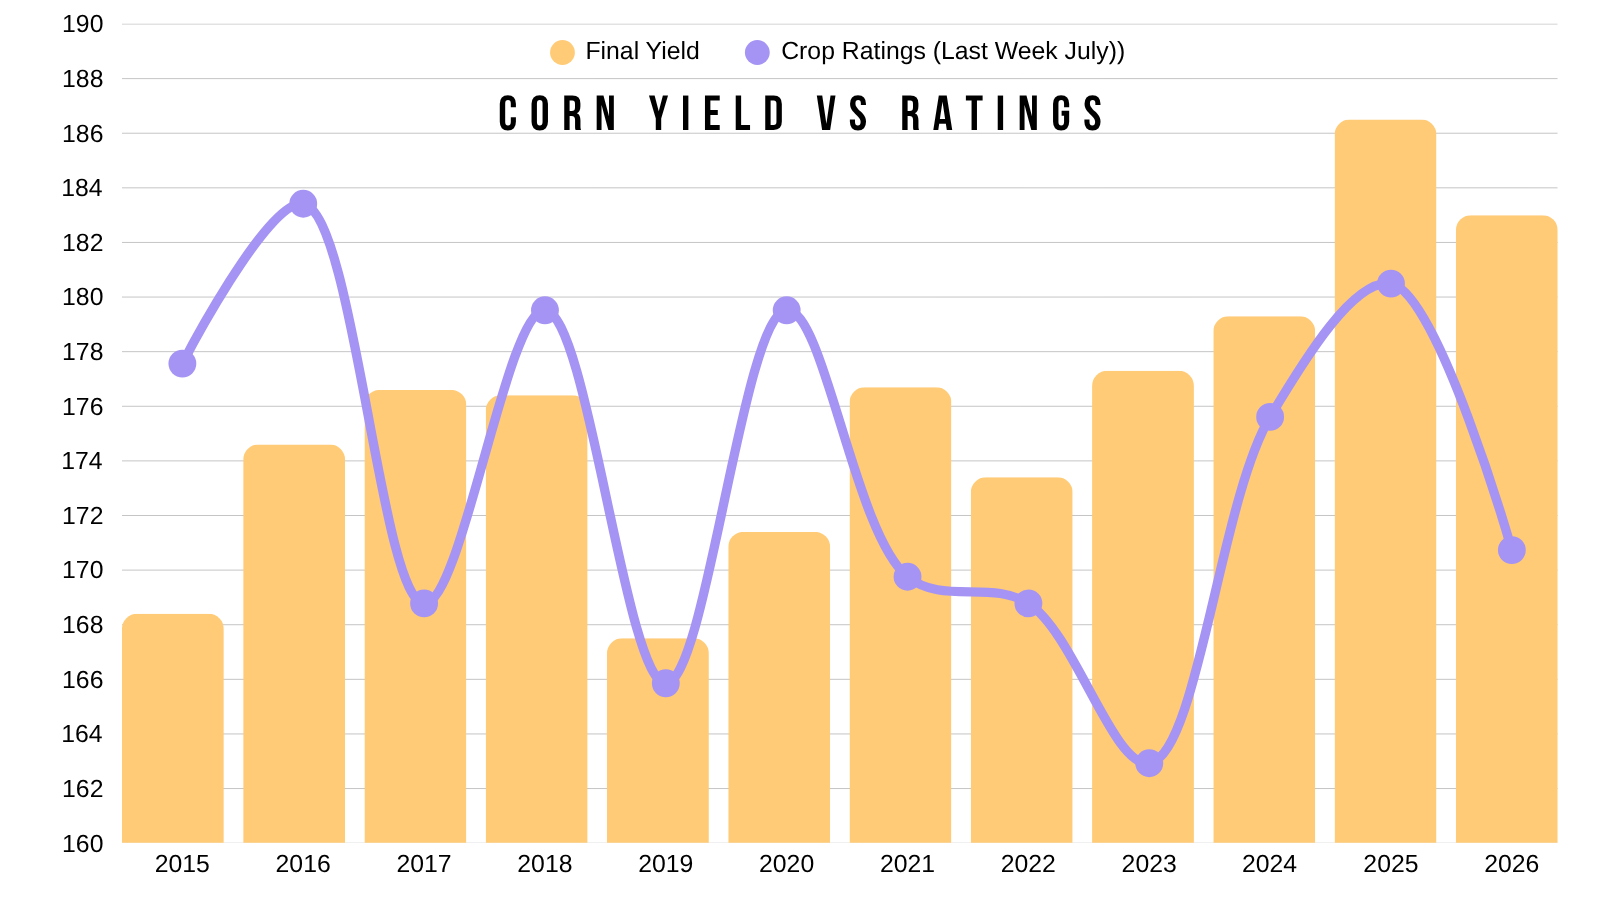
No, crop conditions are not a perfect indication of final yield.
Take 2023 for example.
Conditions were awful. We ended up with a record yield.
Here is the crop ratings for today's date vs final yield.
However, it is hard to ignore that the crop conditions are much worse than they were the prior two years.
Short term, if weather flips favorable we could very easily give back a good portion of this rally short term and heading into harvest. Hence the sell & hedge alert last week.
Just because I am bullish long term, does not mean you shouldn’t be managing your risk either. Especially if you lack storage or are behind etc.
Last Week's Alert: Click Here
But long term the bull case potential is still very much alive as well.
A lot of this is stuff we've talked about multiple times already. So I apologize if you get tired of seeing the same charts.
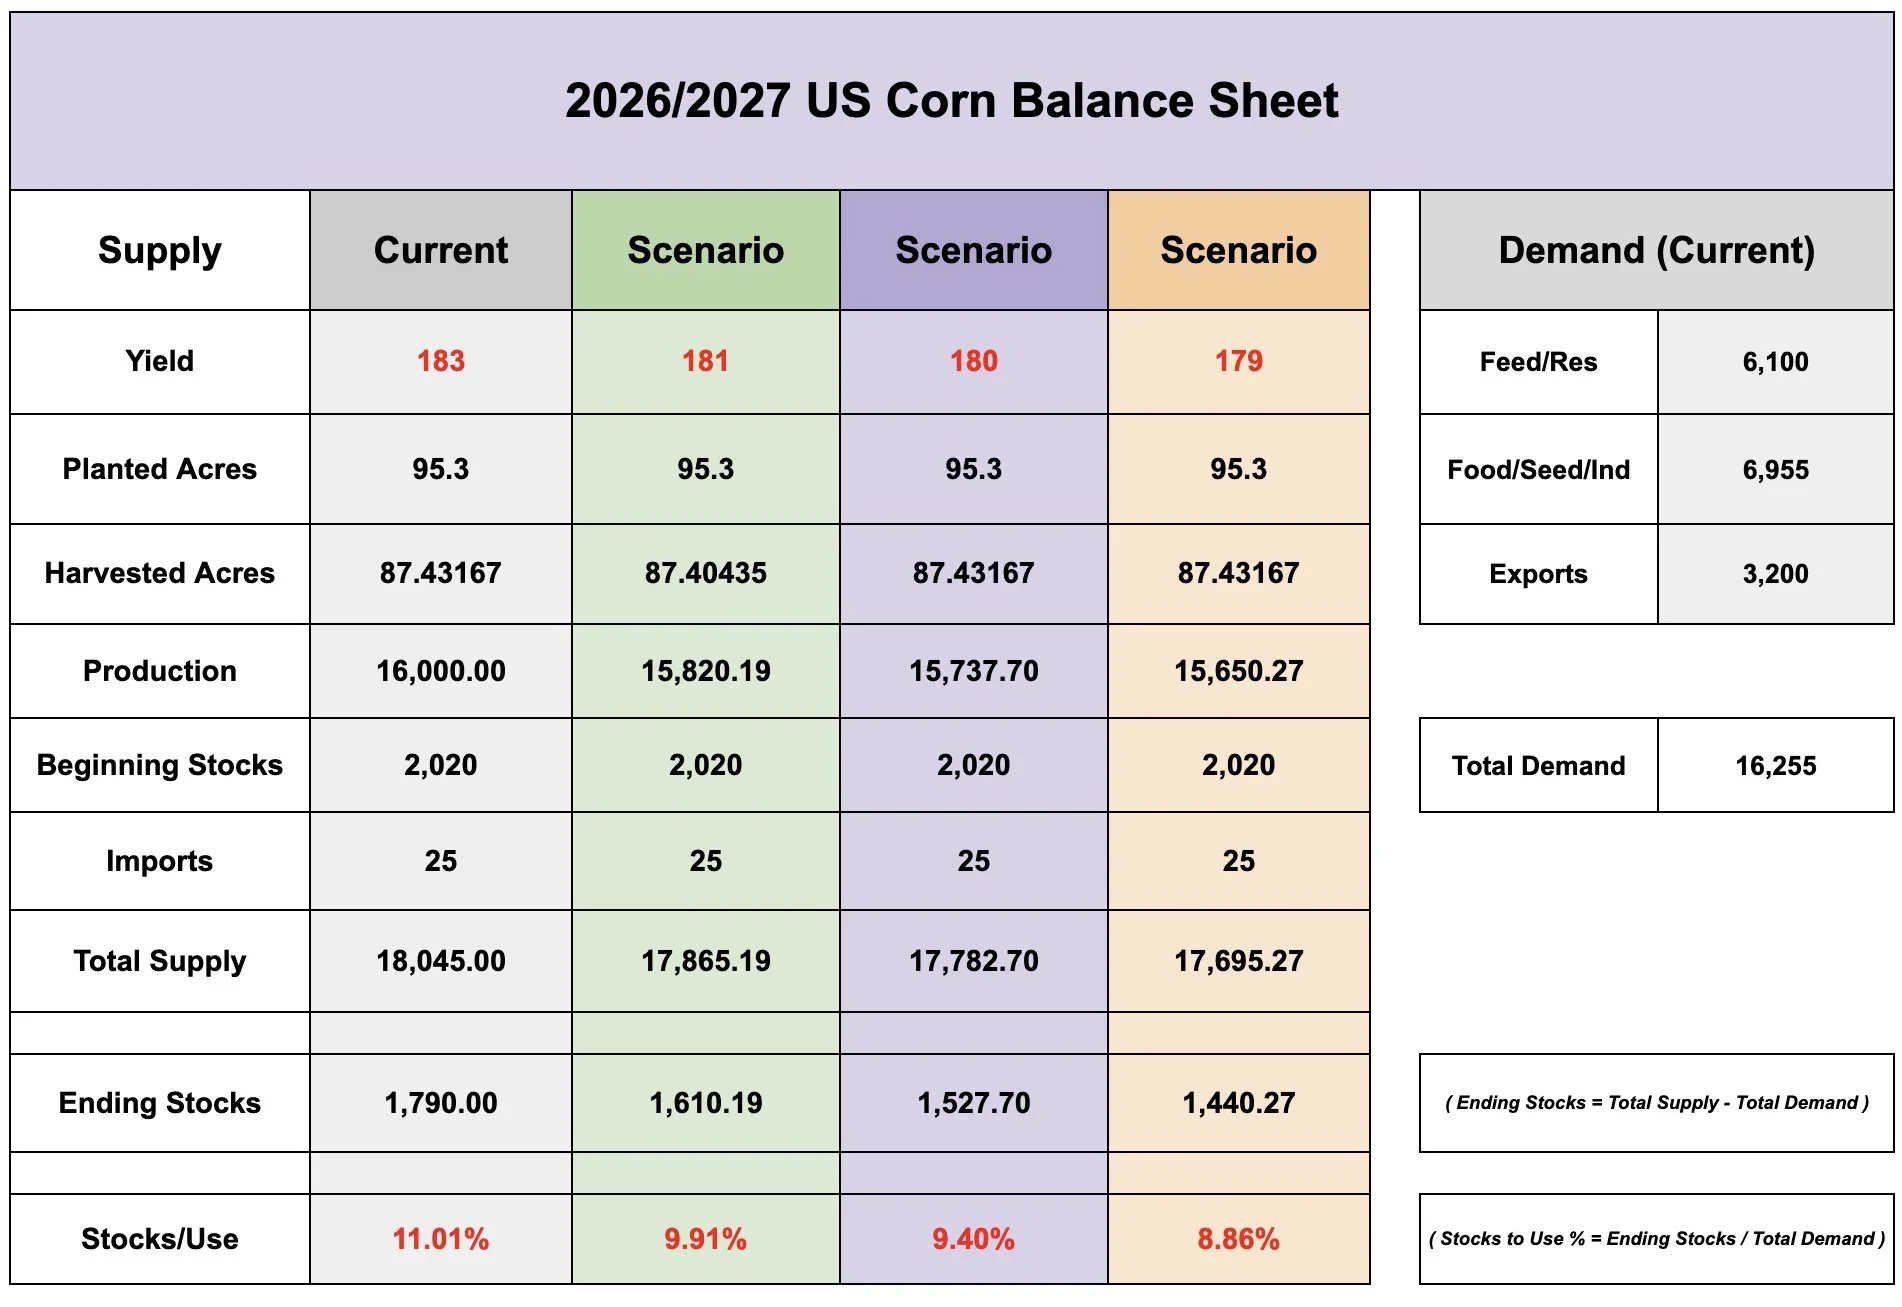
The current balance sheet is not even bearish with a 183 yield to begin with.
I have no clue where yield is going to end up. But, if yield drops to 181 or lower? Well, things would get very, very interesting.
If yield ends up well above trend, then no, fundamentally we don’t have to go and stay above $5.00.
But it would take an above-trendline yield to get a "bearish" new crop balance sheet from here.
While anything below trend starts to paint a pretty friendly story.
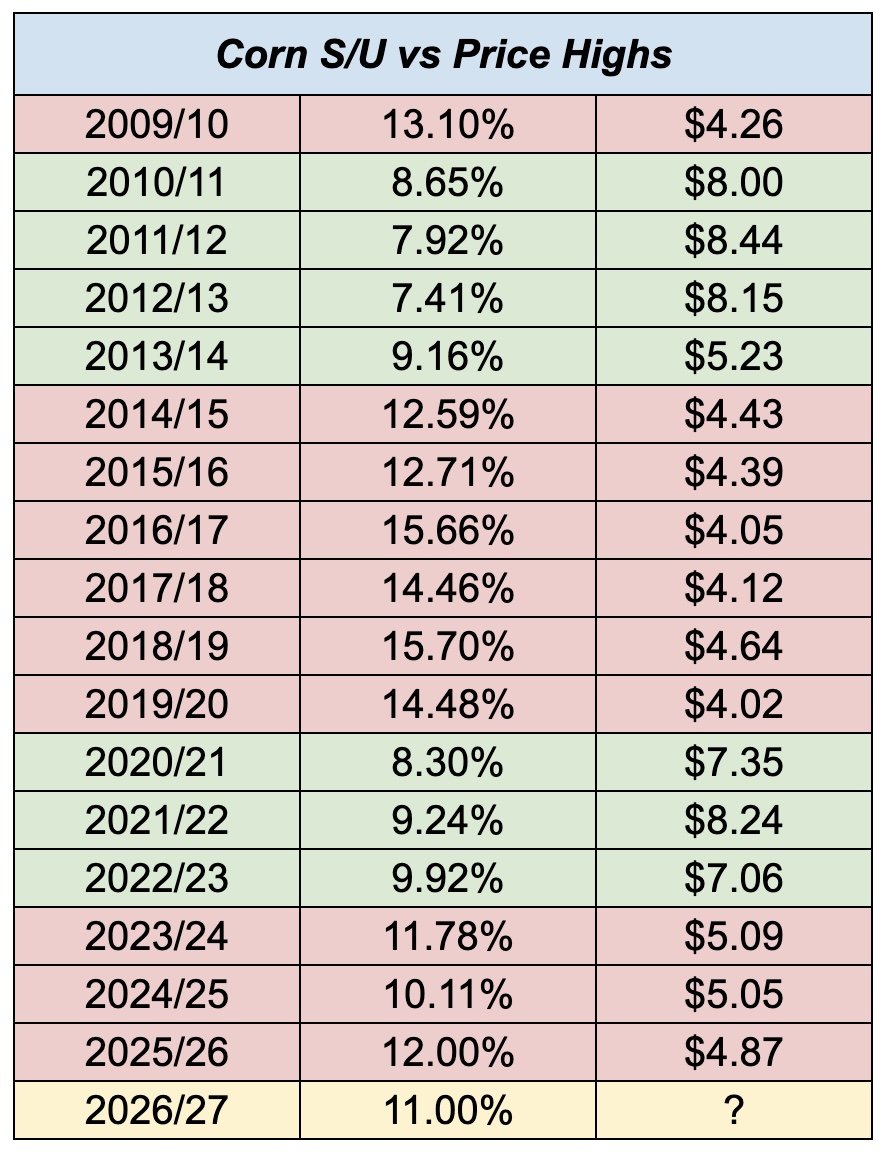
Our current 11% stocks to use is viewed as friendly, but not "super bullish".
A 10% stocks to use is usually that threshold to see "bullish" prices.
A stocks to use close to 10% and you are usually looking at front month corn around $5.00.
If that drops to 8% to 9% then you are looking at prices potentially well above $5.00
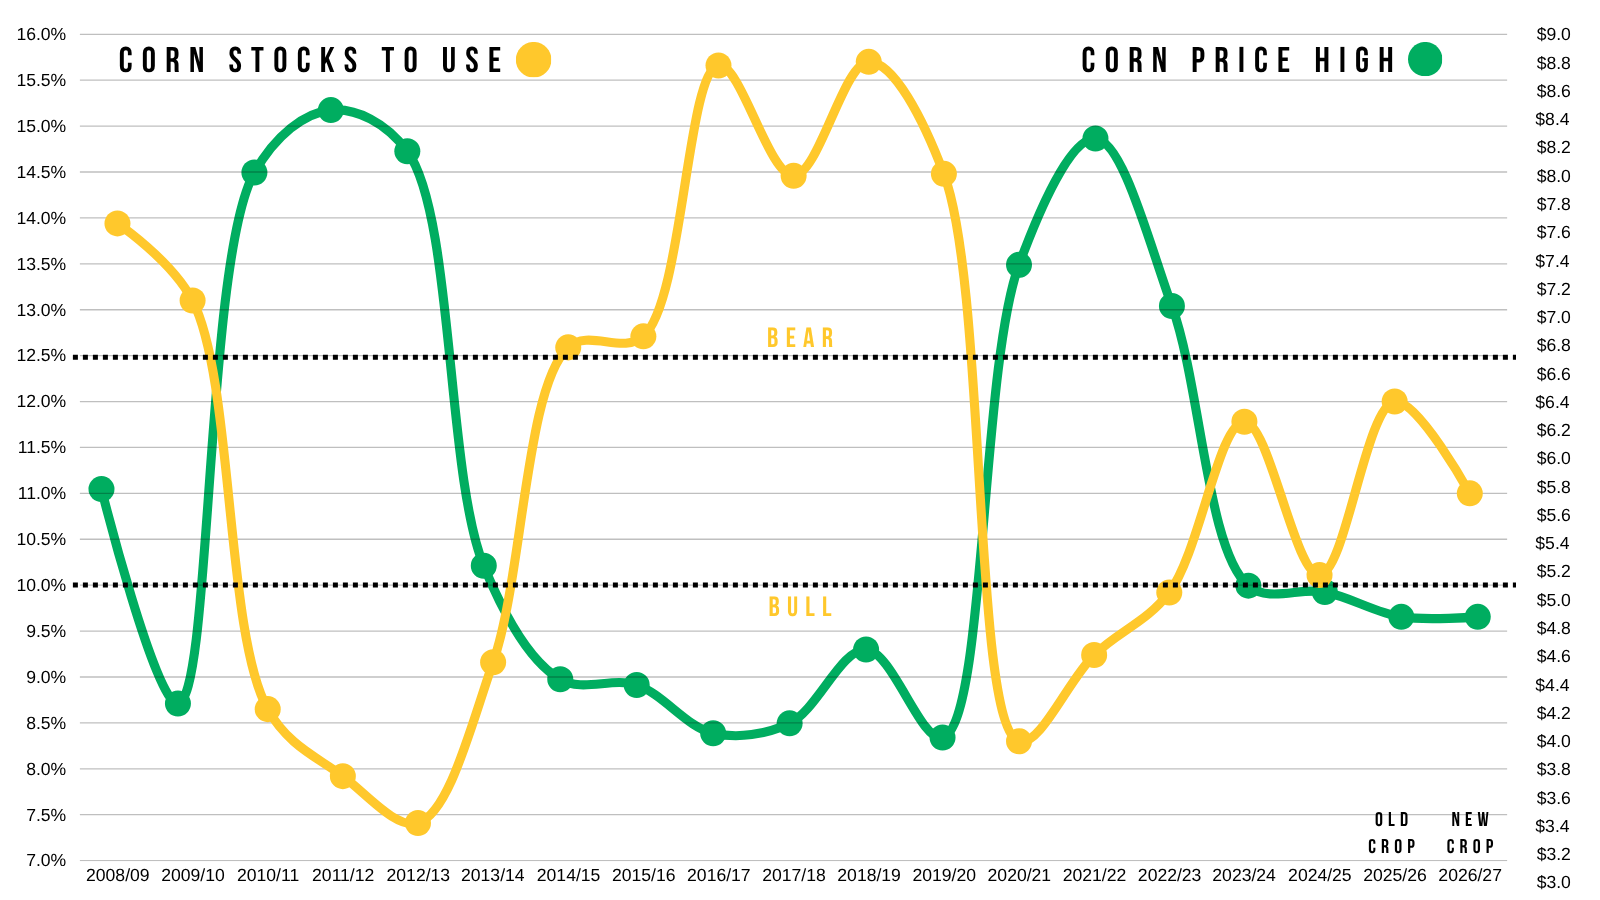
Here is another visual so you can see the actual numbers for every year.
Normally if the USDA cuts supply, they cut demand. To balance the balance sheet.
But demand has been phenomenal.
What happens if supply is falling but demand is not? Oftentimes we have to justify lowering our demand. Which often means prices need to go higher.
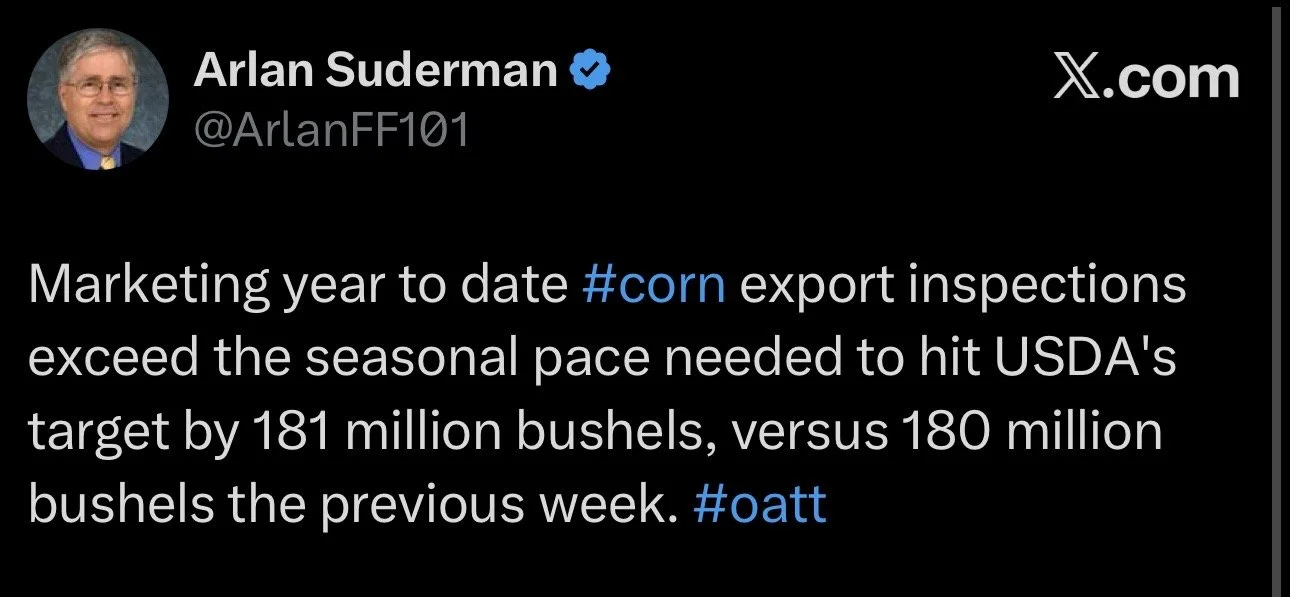
Our export inspections are currently running +25% ahead of last year. While the USDA is only expecting them to be up +16%.
So we could easily see our old crop exports continue to eat into that balance sheet.
If the old crop balance sheet gets lowered, that carries into the new crop balance sheet. Further tightening up that room for error and the necessity for a big yield.
Long term I think there is plenty of potential upside.
I think the next few years are going to be better than the last two.
Short term, we still don’t want to ignore the fact that we've seen a great rally.
We are seeing a huge +60 cent counter seasonal rally right now. Which doesn’t happen all that often.
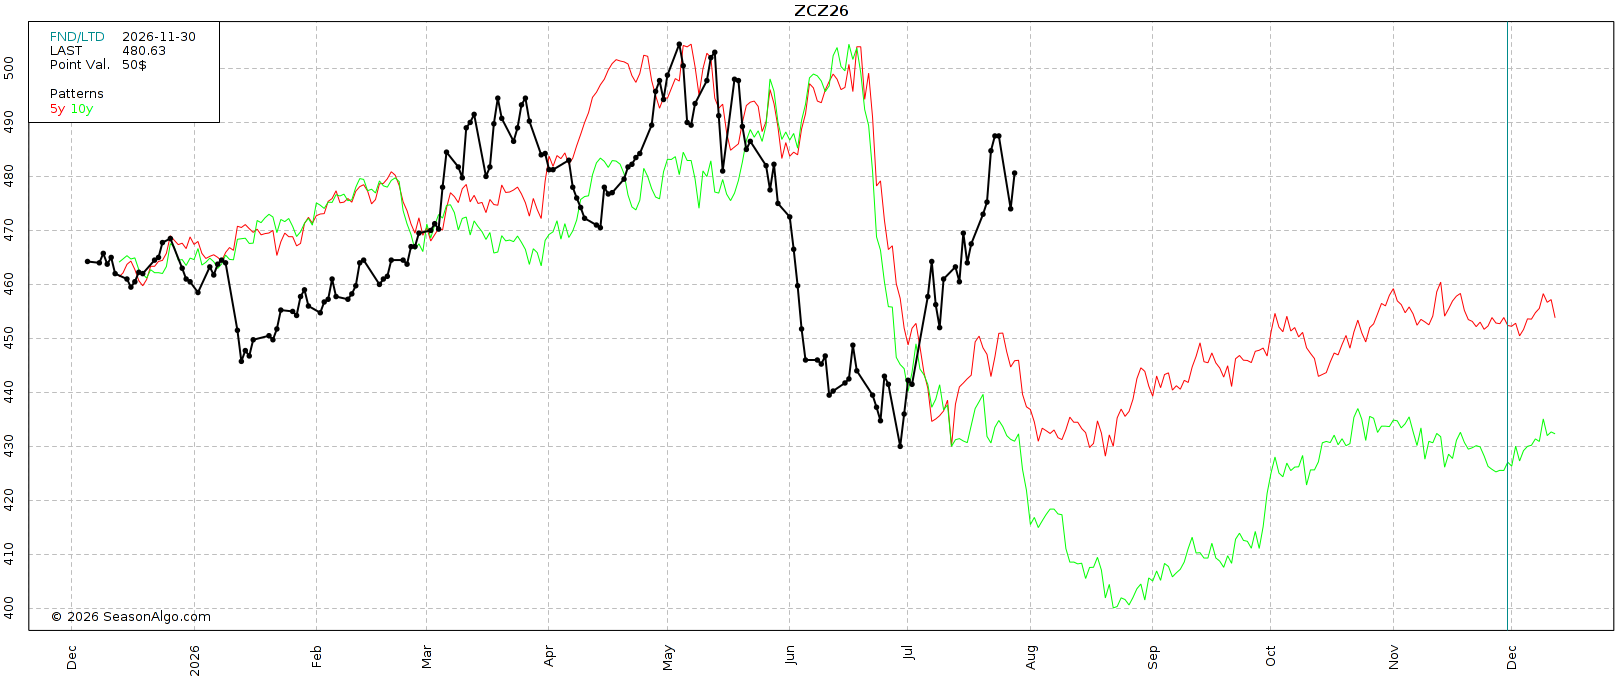
The last time we saw something like this was 2012.
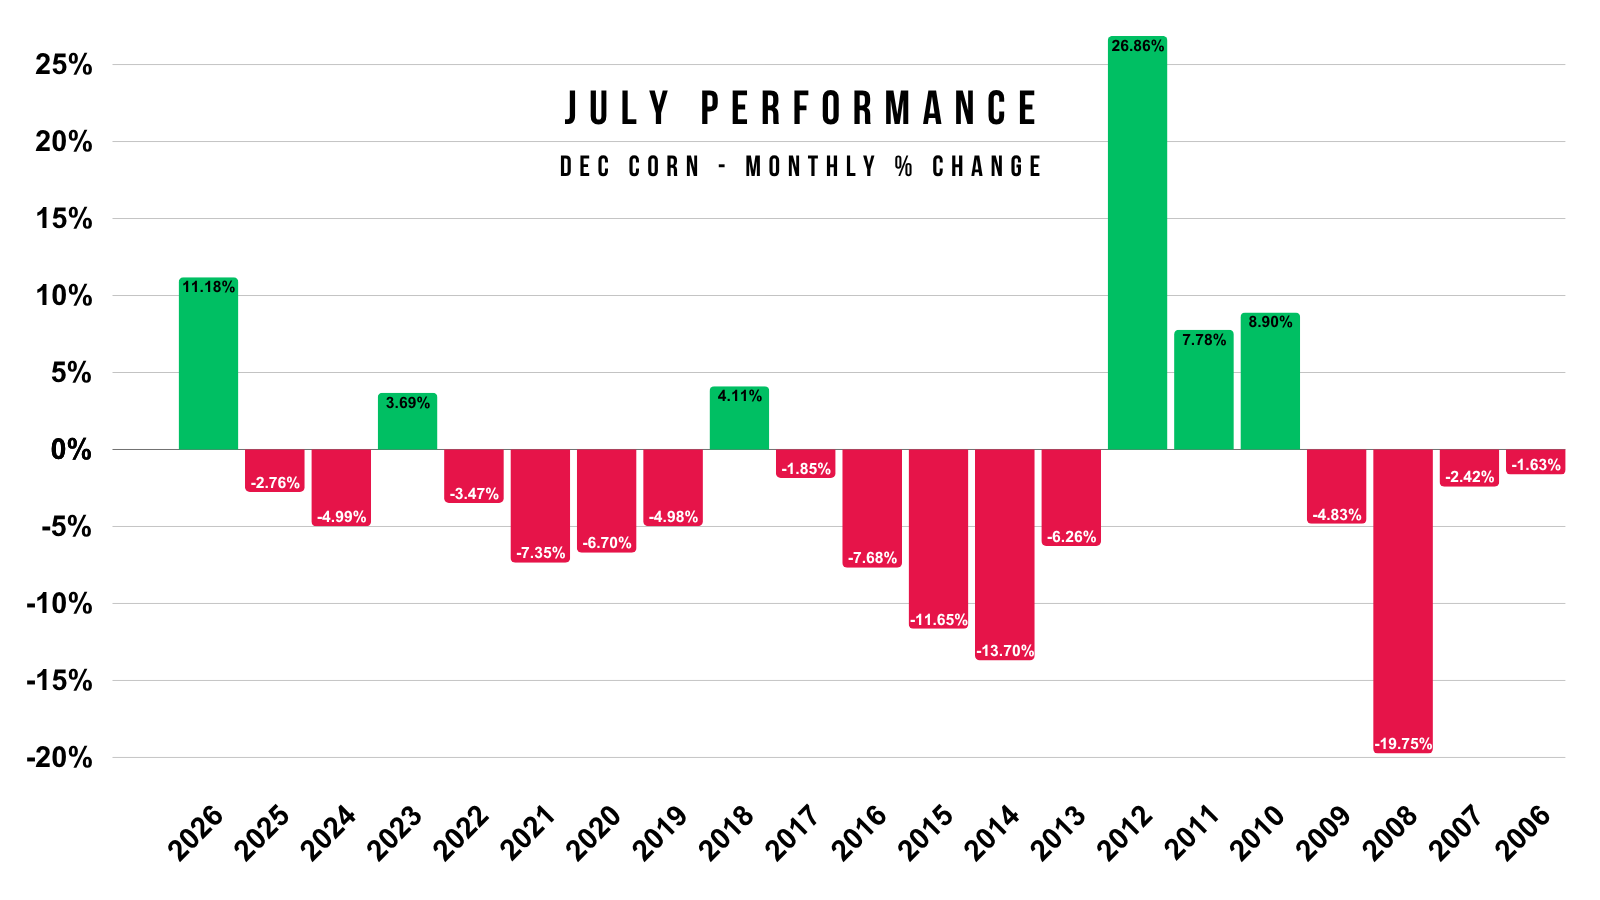
As we just saw the 2nd strongest July ever, only behind 2012.
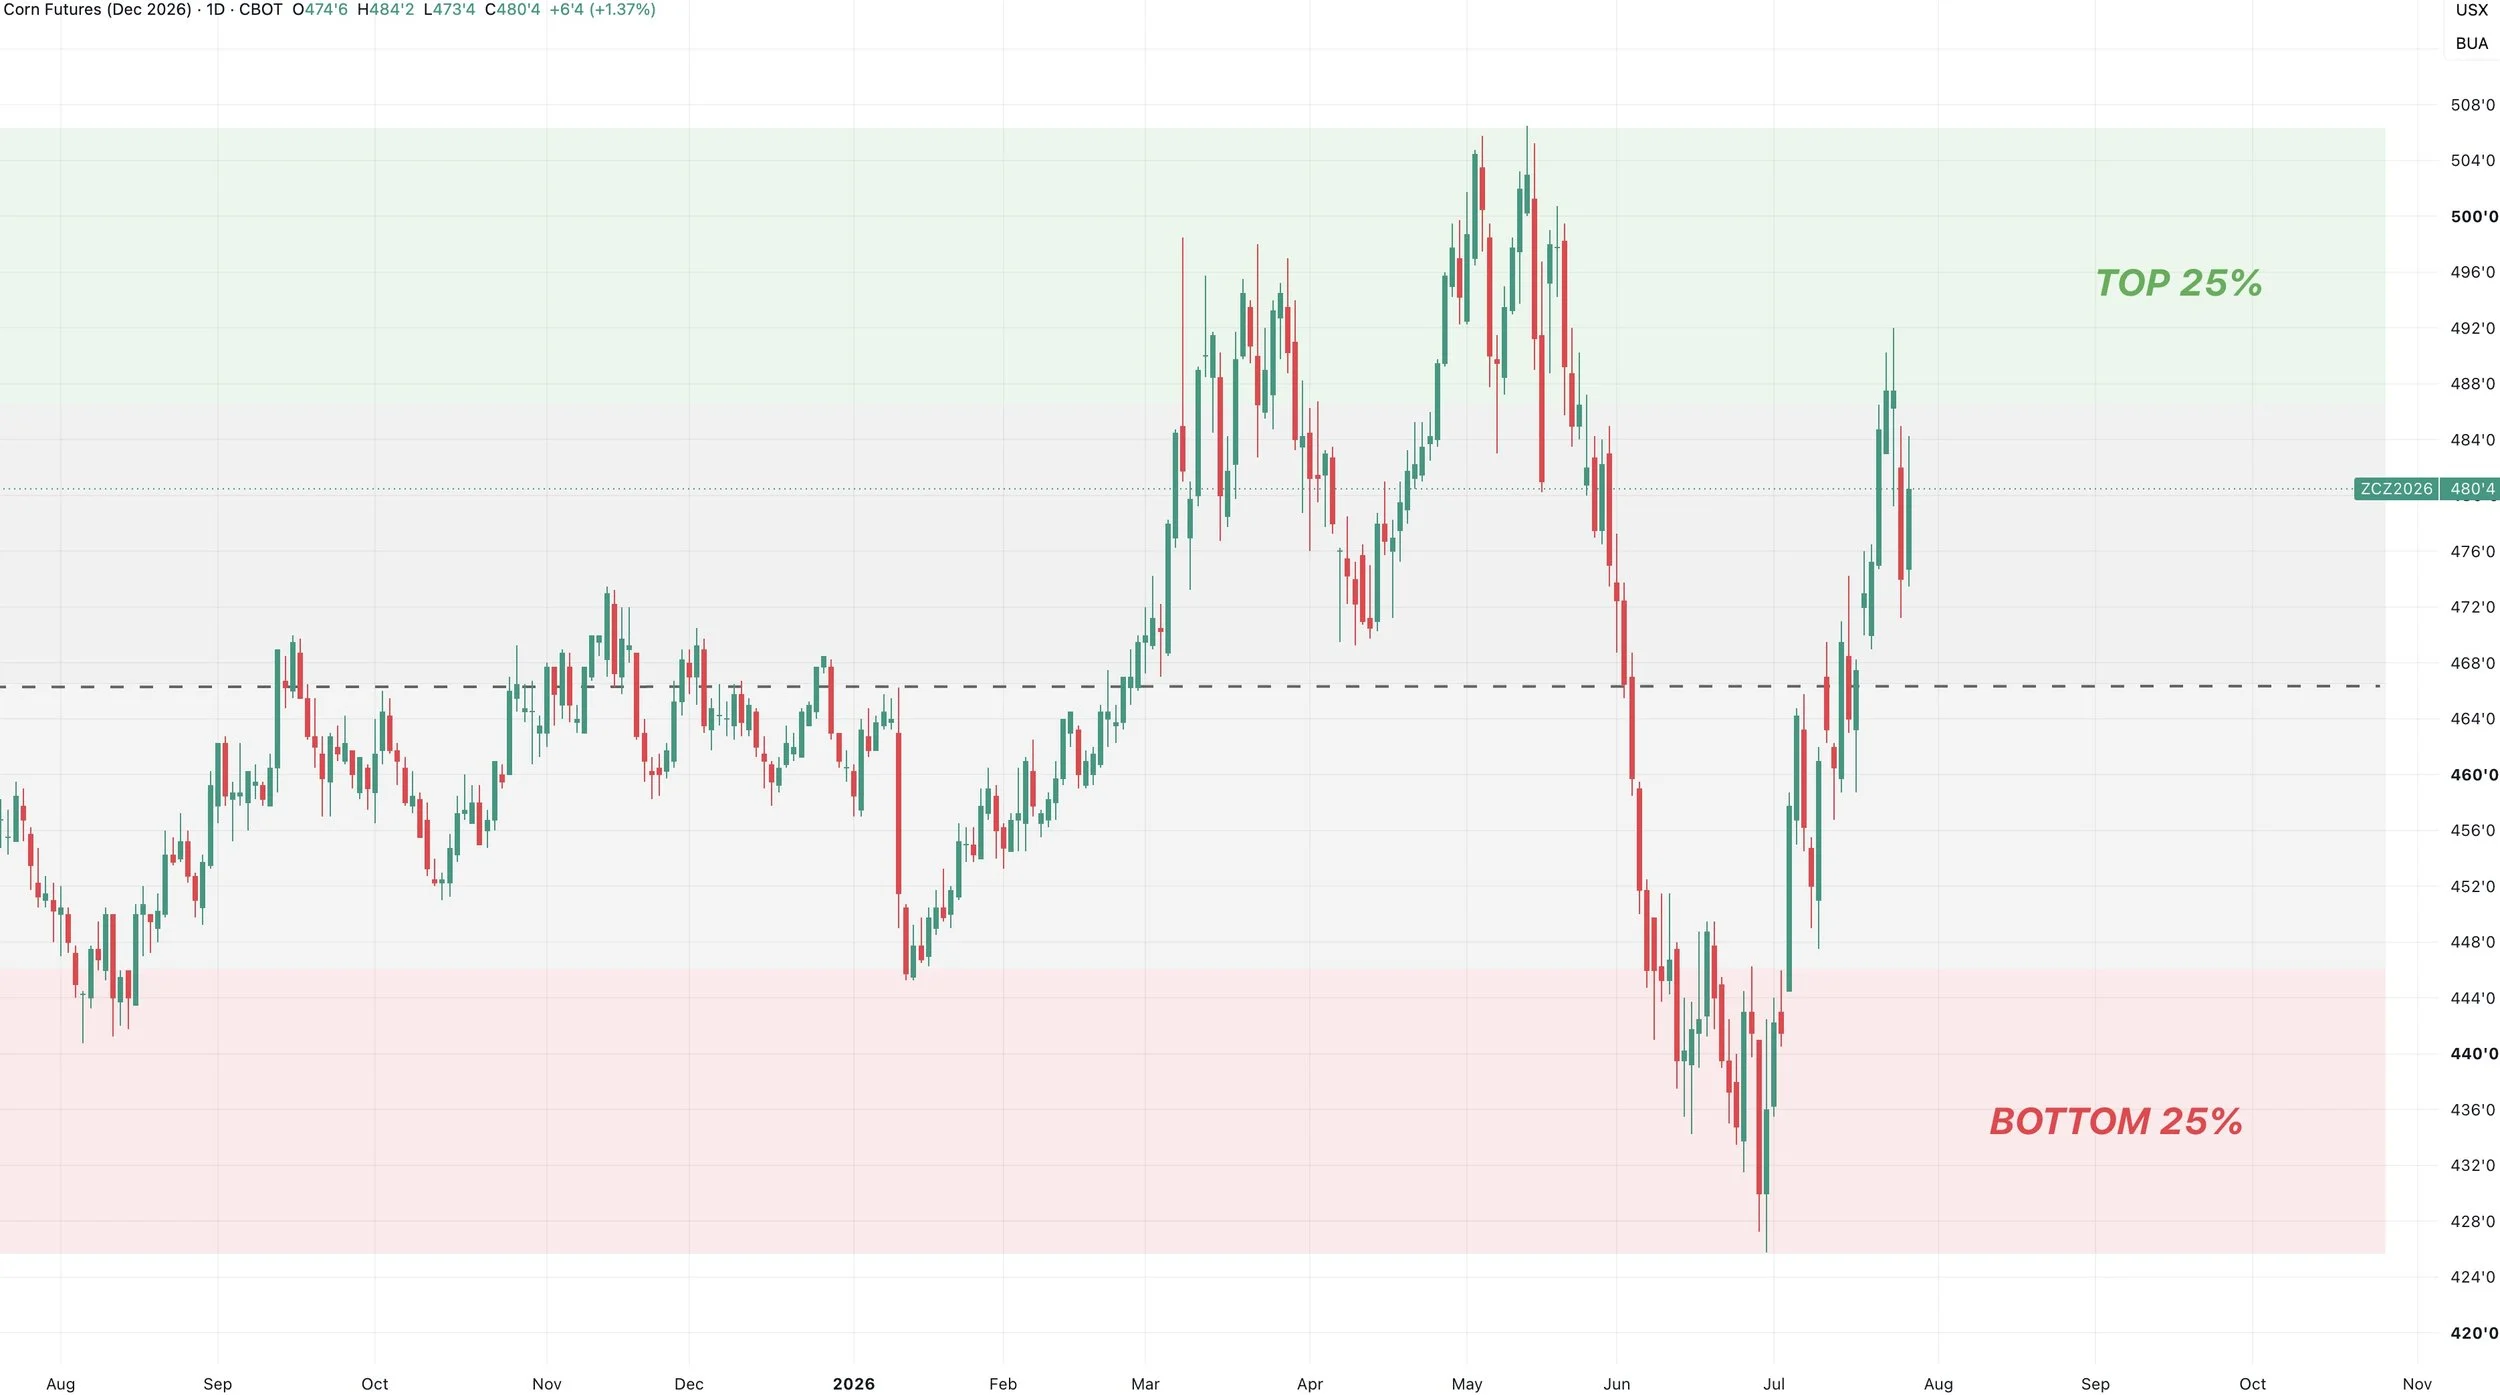
Dec corn is right back in the top 25% of prices we have seen all year long.
Not the worst spot if you are someone who was mad at yourself for not doing anything back in May.
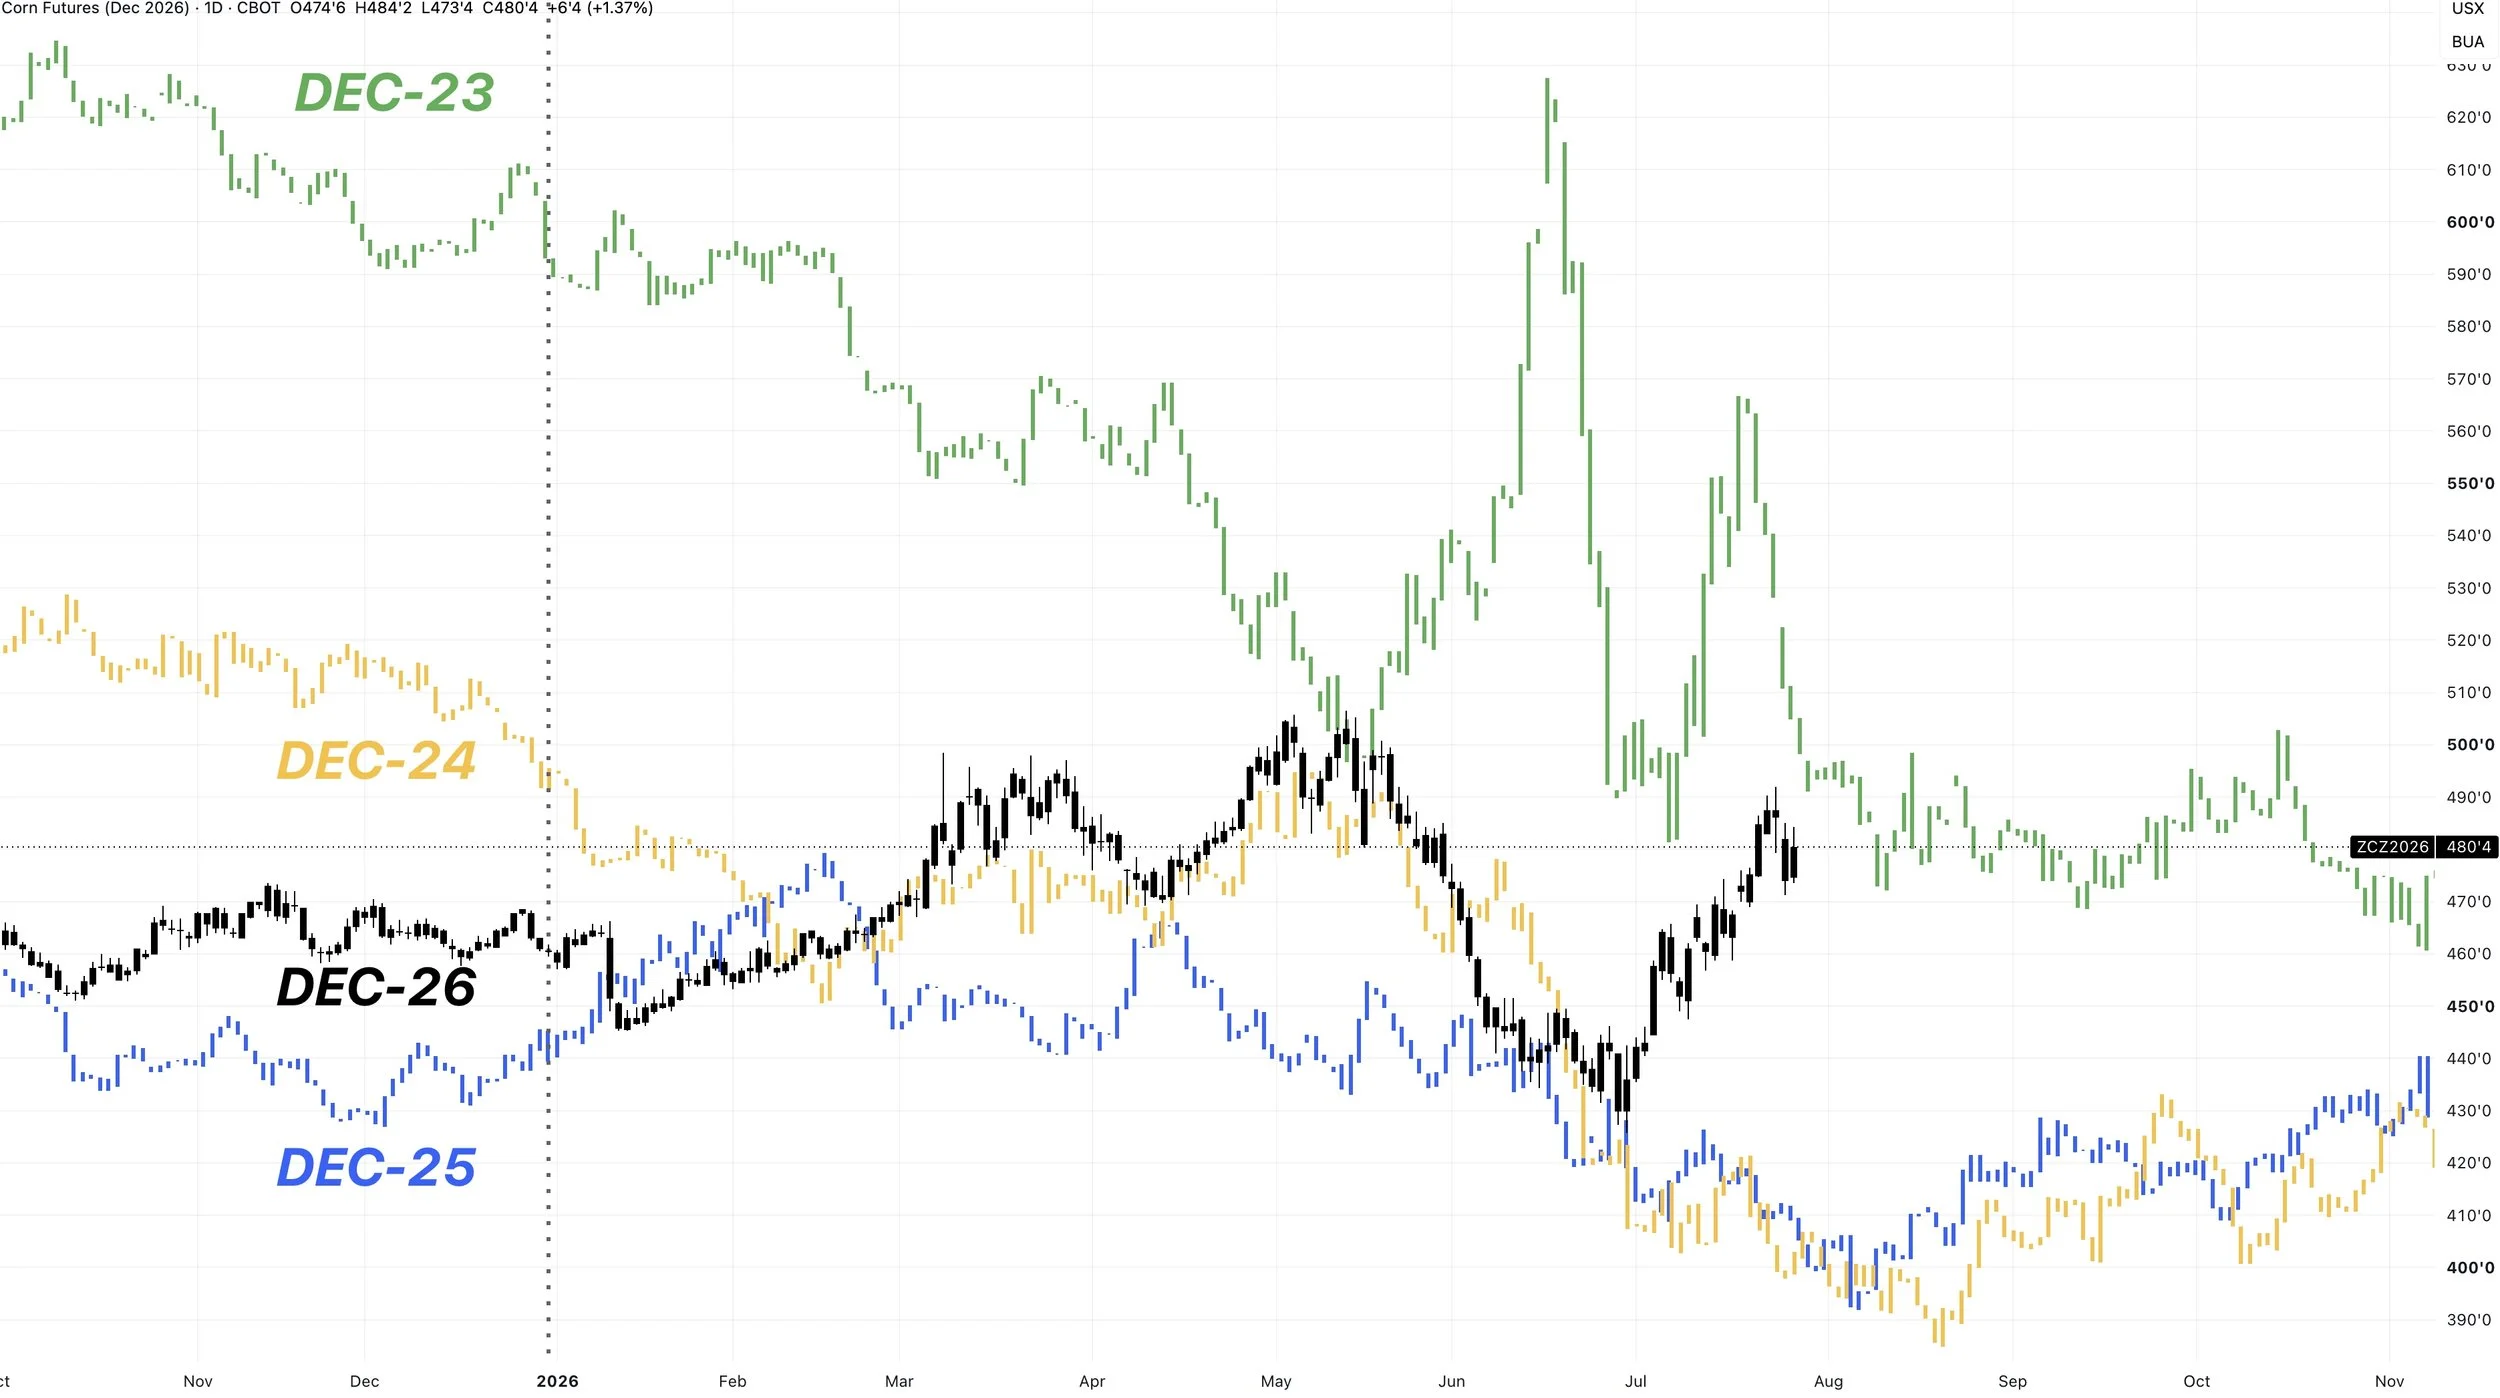
We are also around +85 cents higher than we were the last two years at this point in the year.
We're actually on par with those levels we saw in fall of 2023.
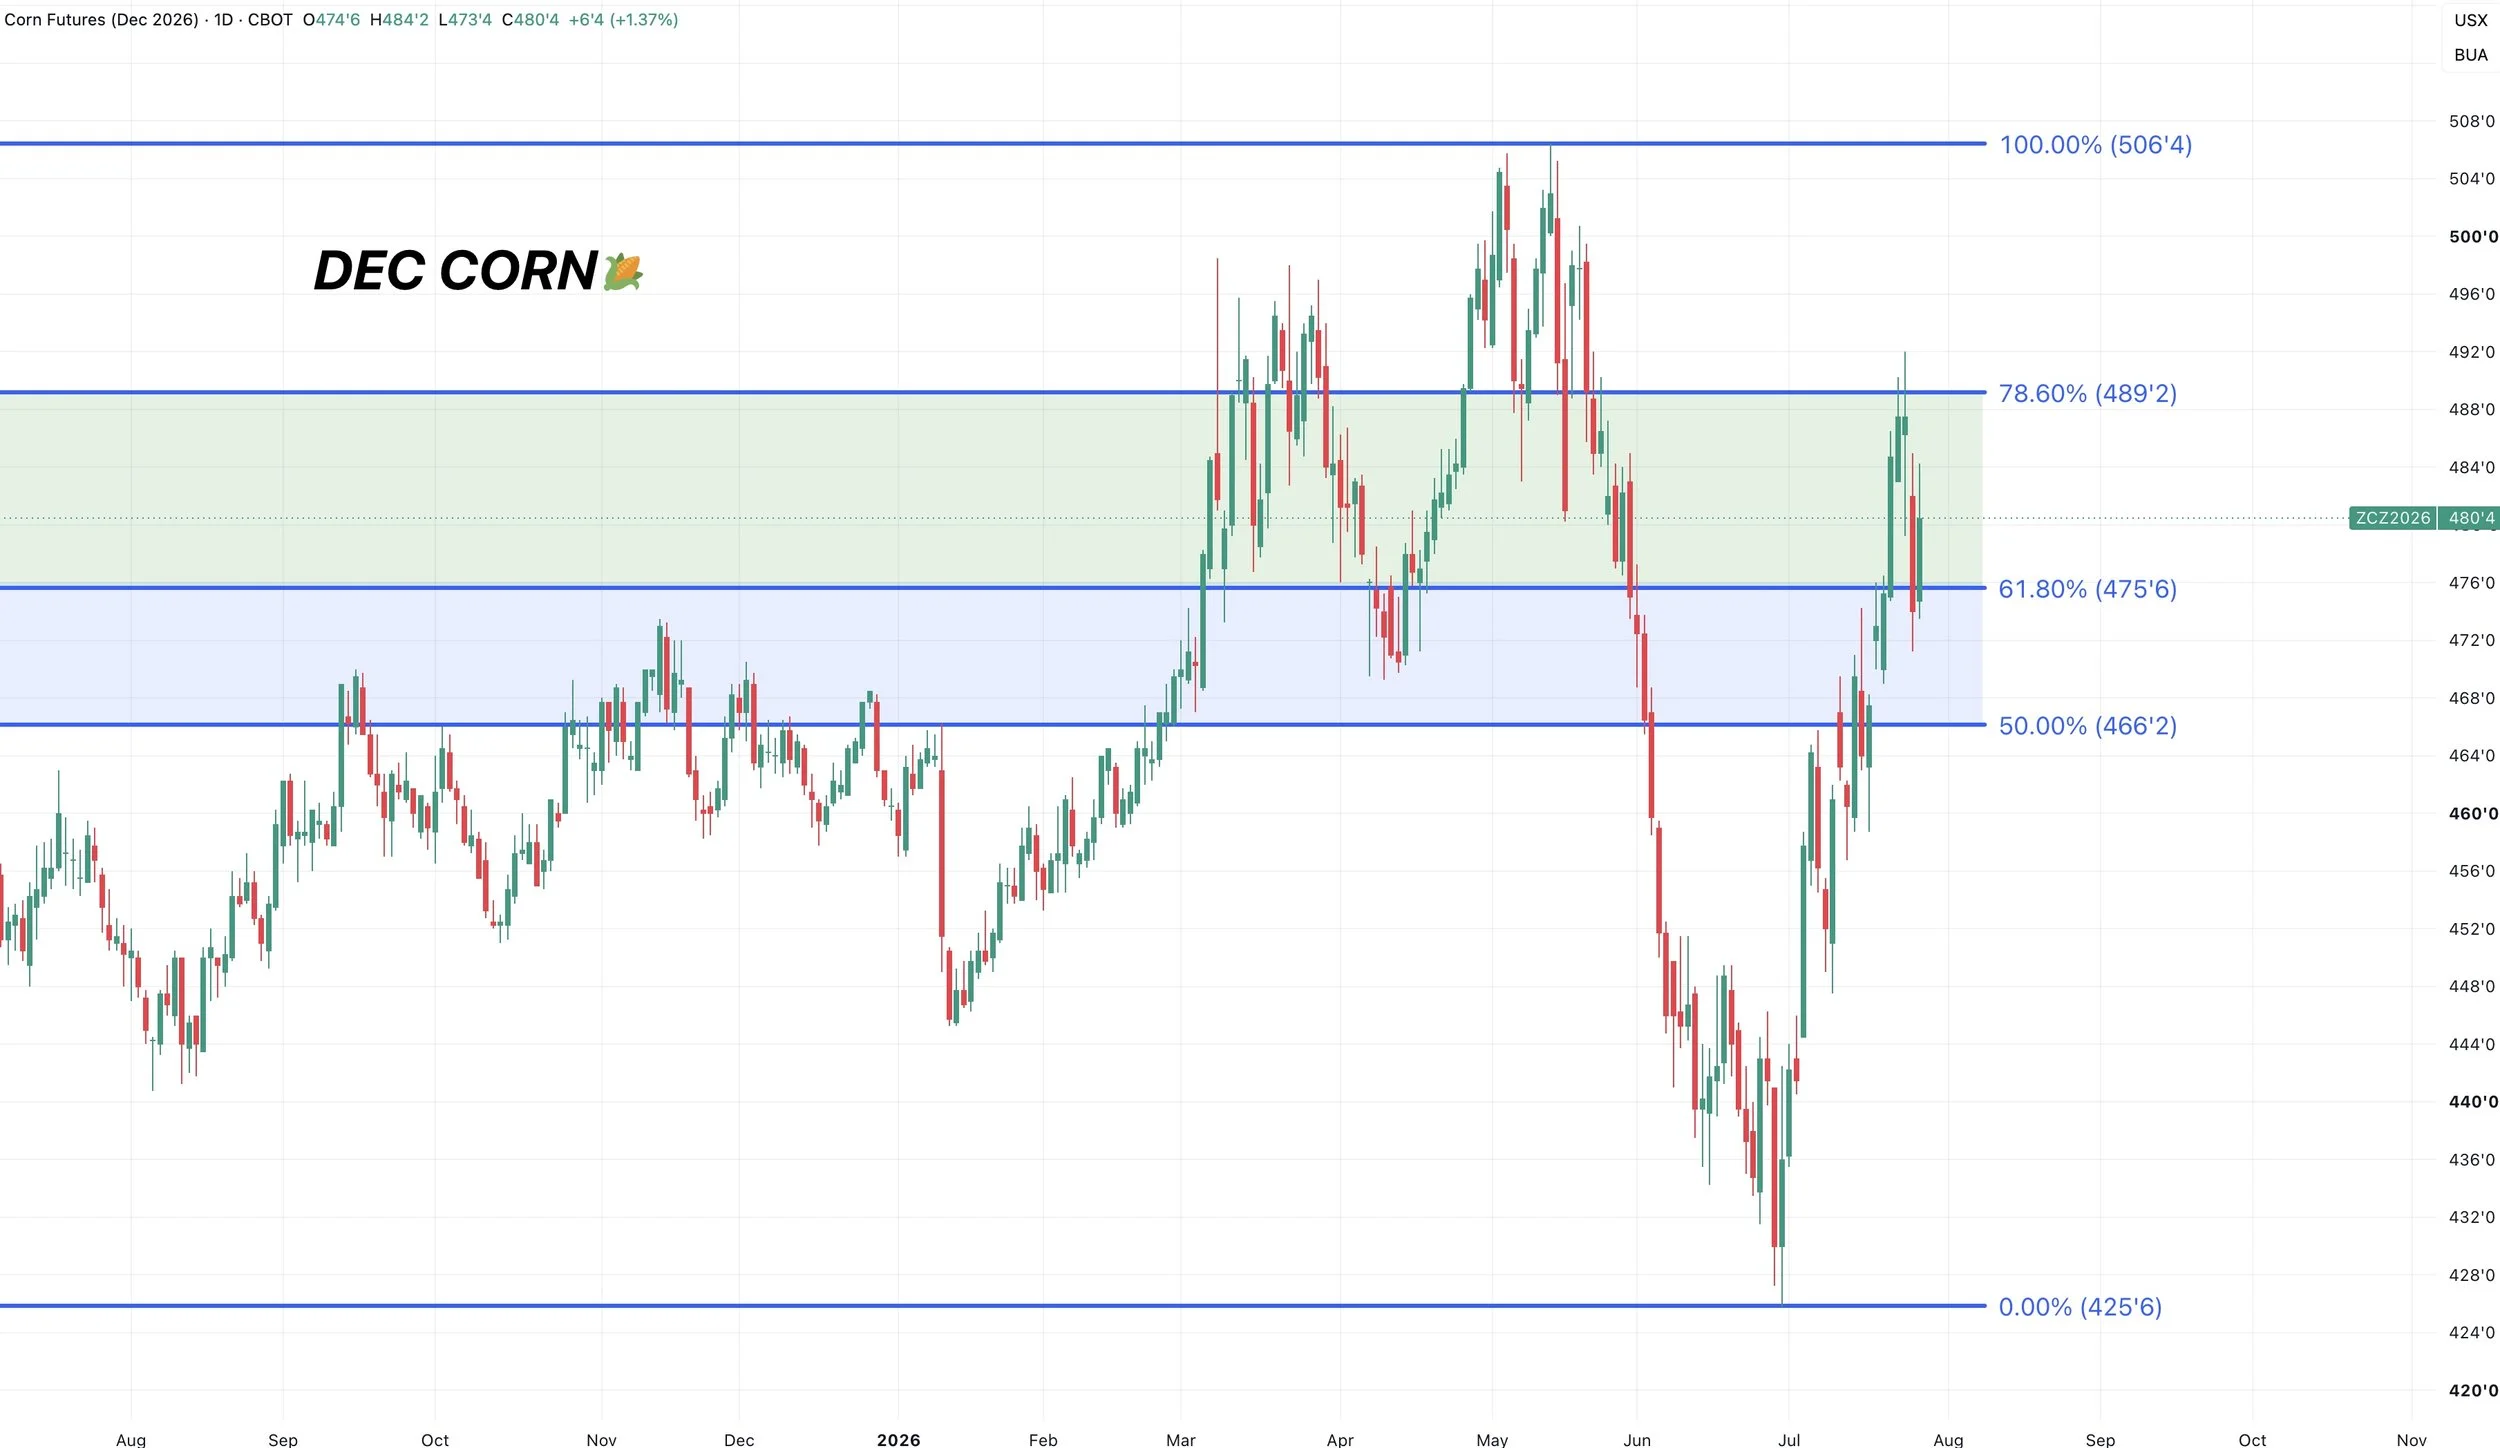
Dec Corn Chart:
We failed after clawing back 78.6% of the May highs.
That level is going to be the last resistance before those May highs.
Today we posted an inside day. We didn’t take out yesterday’s highs or lows.
Which ever happens first gives us our next direction likely.
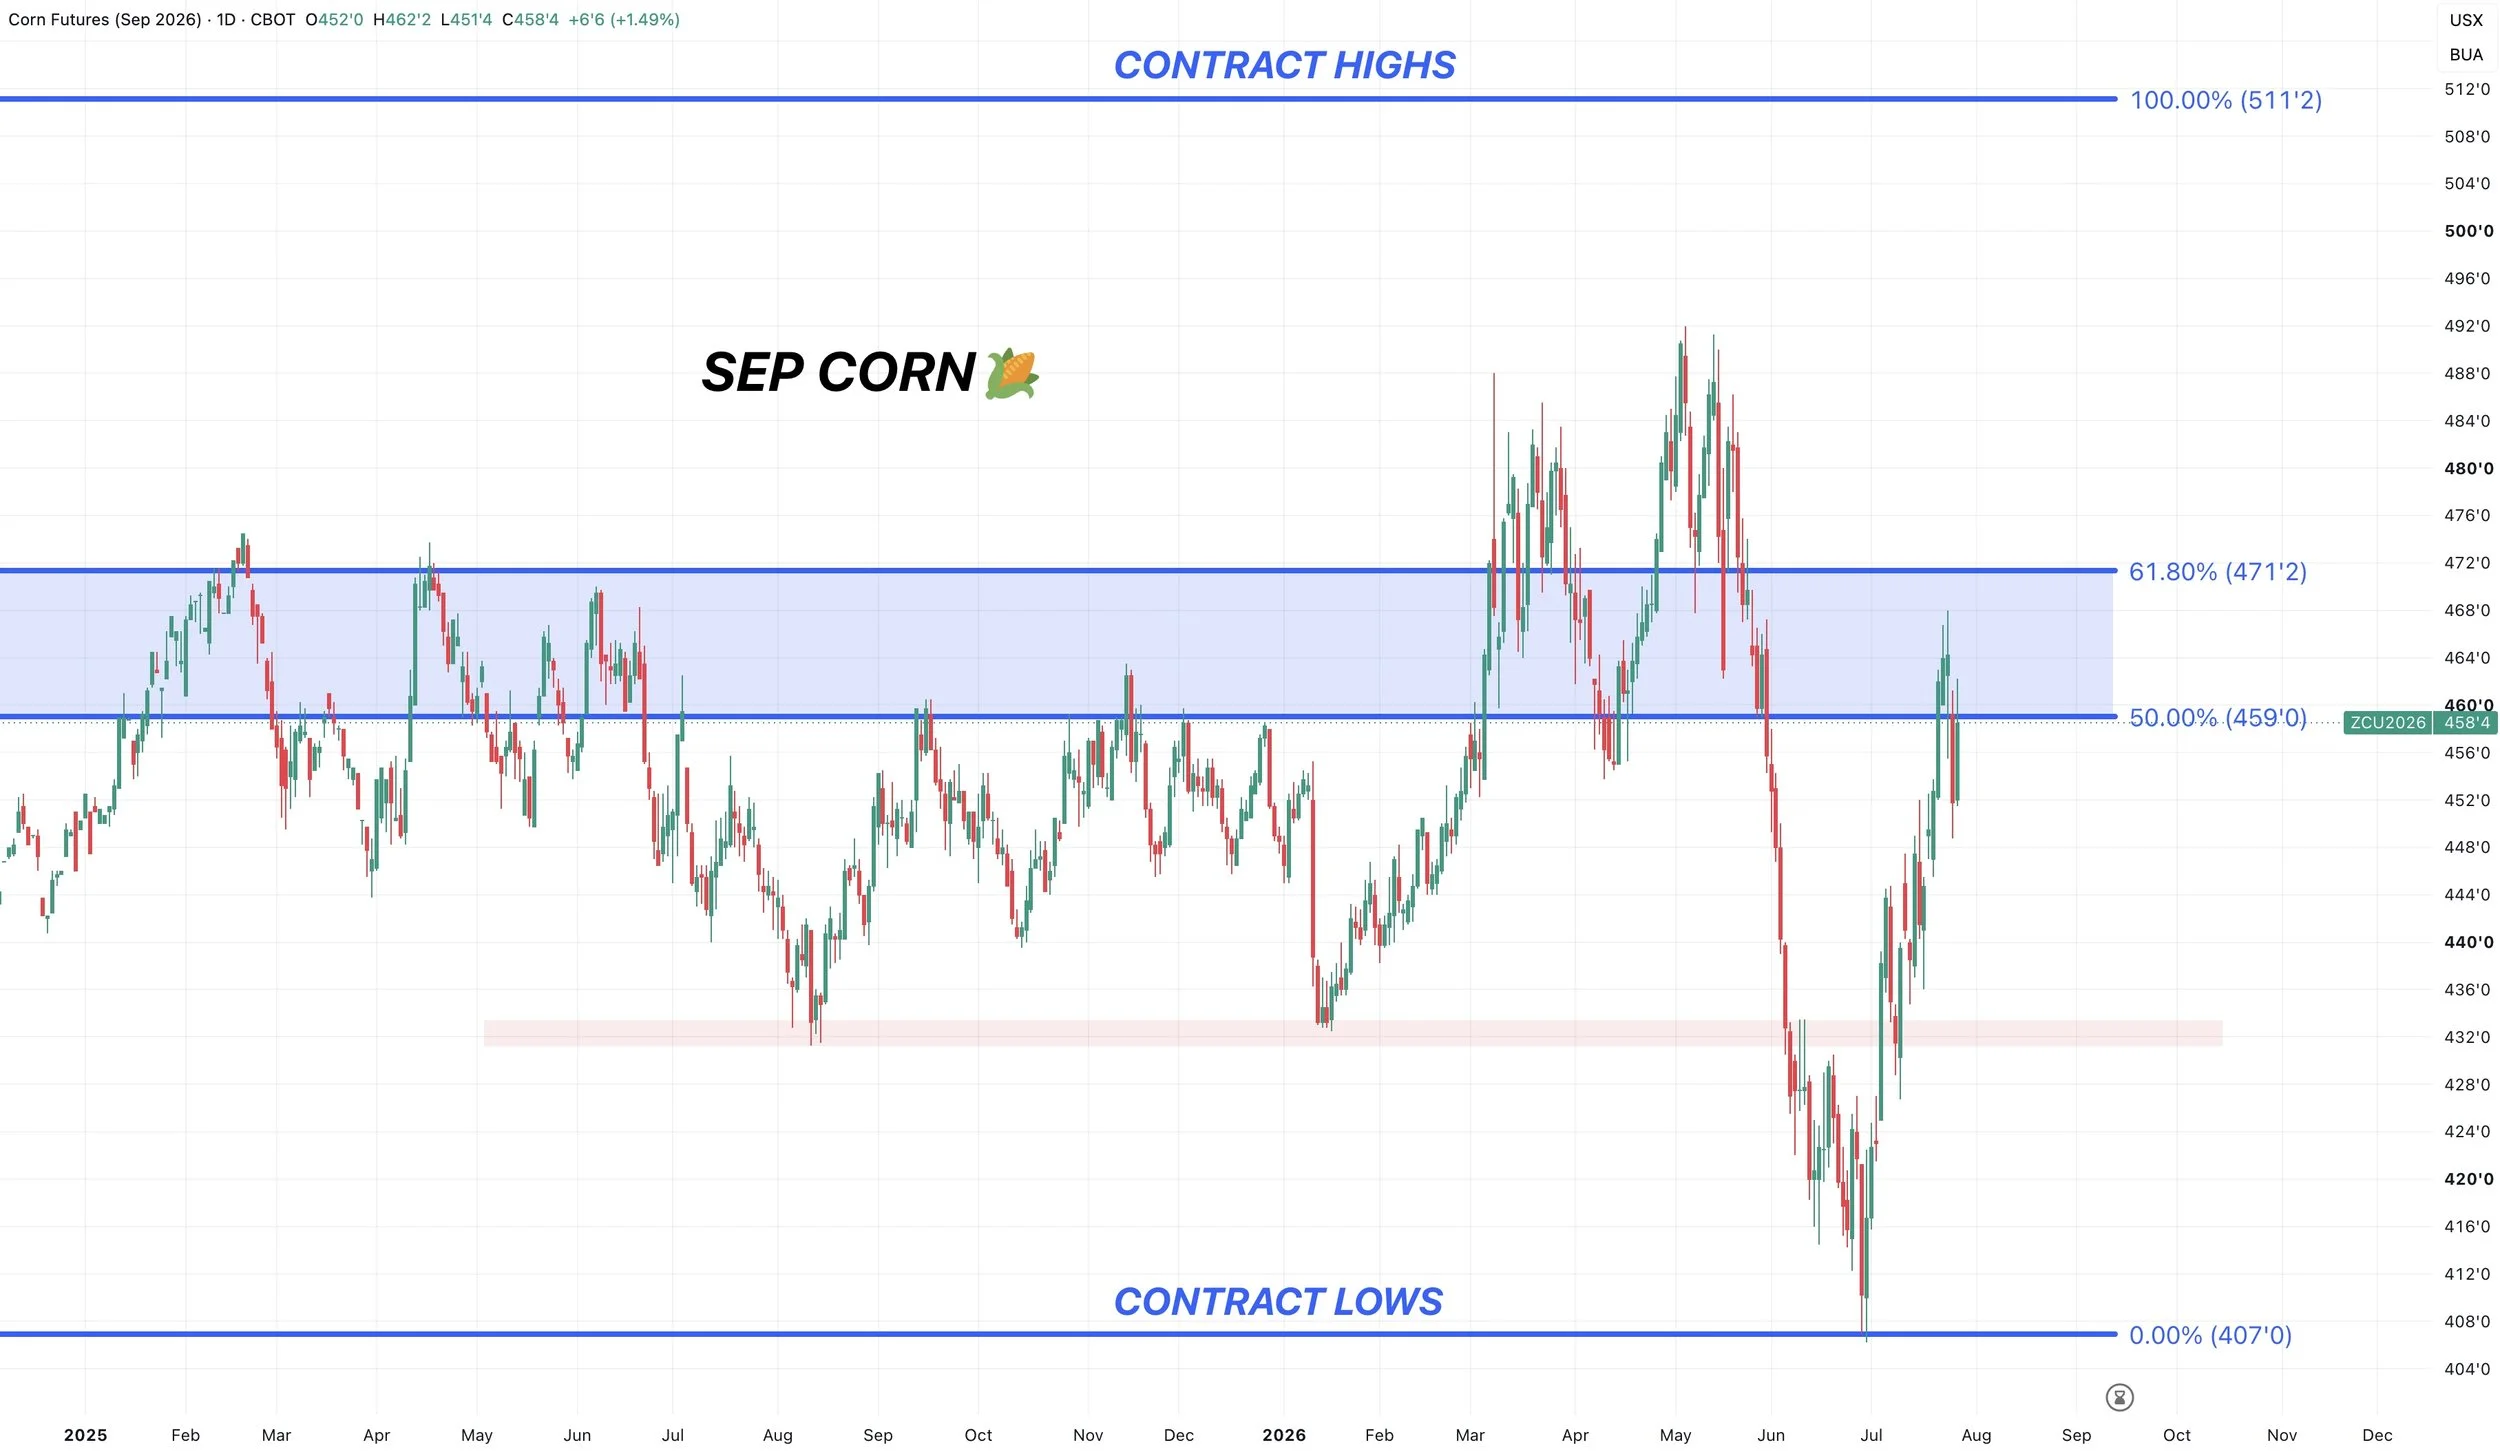
Sep Corn Chart:
We are struggling right in the golden zone from contract lows all the way to contract highs.
Like we mentioned last week, this could be a big area and an area we wanted to defend.
As if the rally is going to stall, it would not be surprising at all to see it happen between the 50% to 61.8% retracements.
The 50% level was resistance last fall.
The 61.8% level was resistance last spring.
Soybeans
Soybeans haven’t just been rallying on weather.
There has been a few different factors aside from weather that's helped this rally.
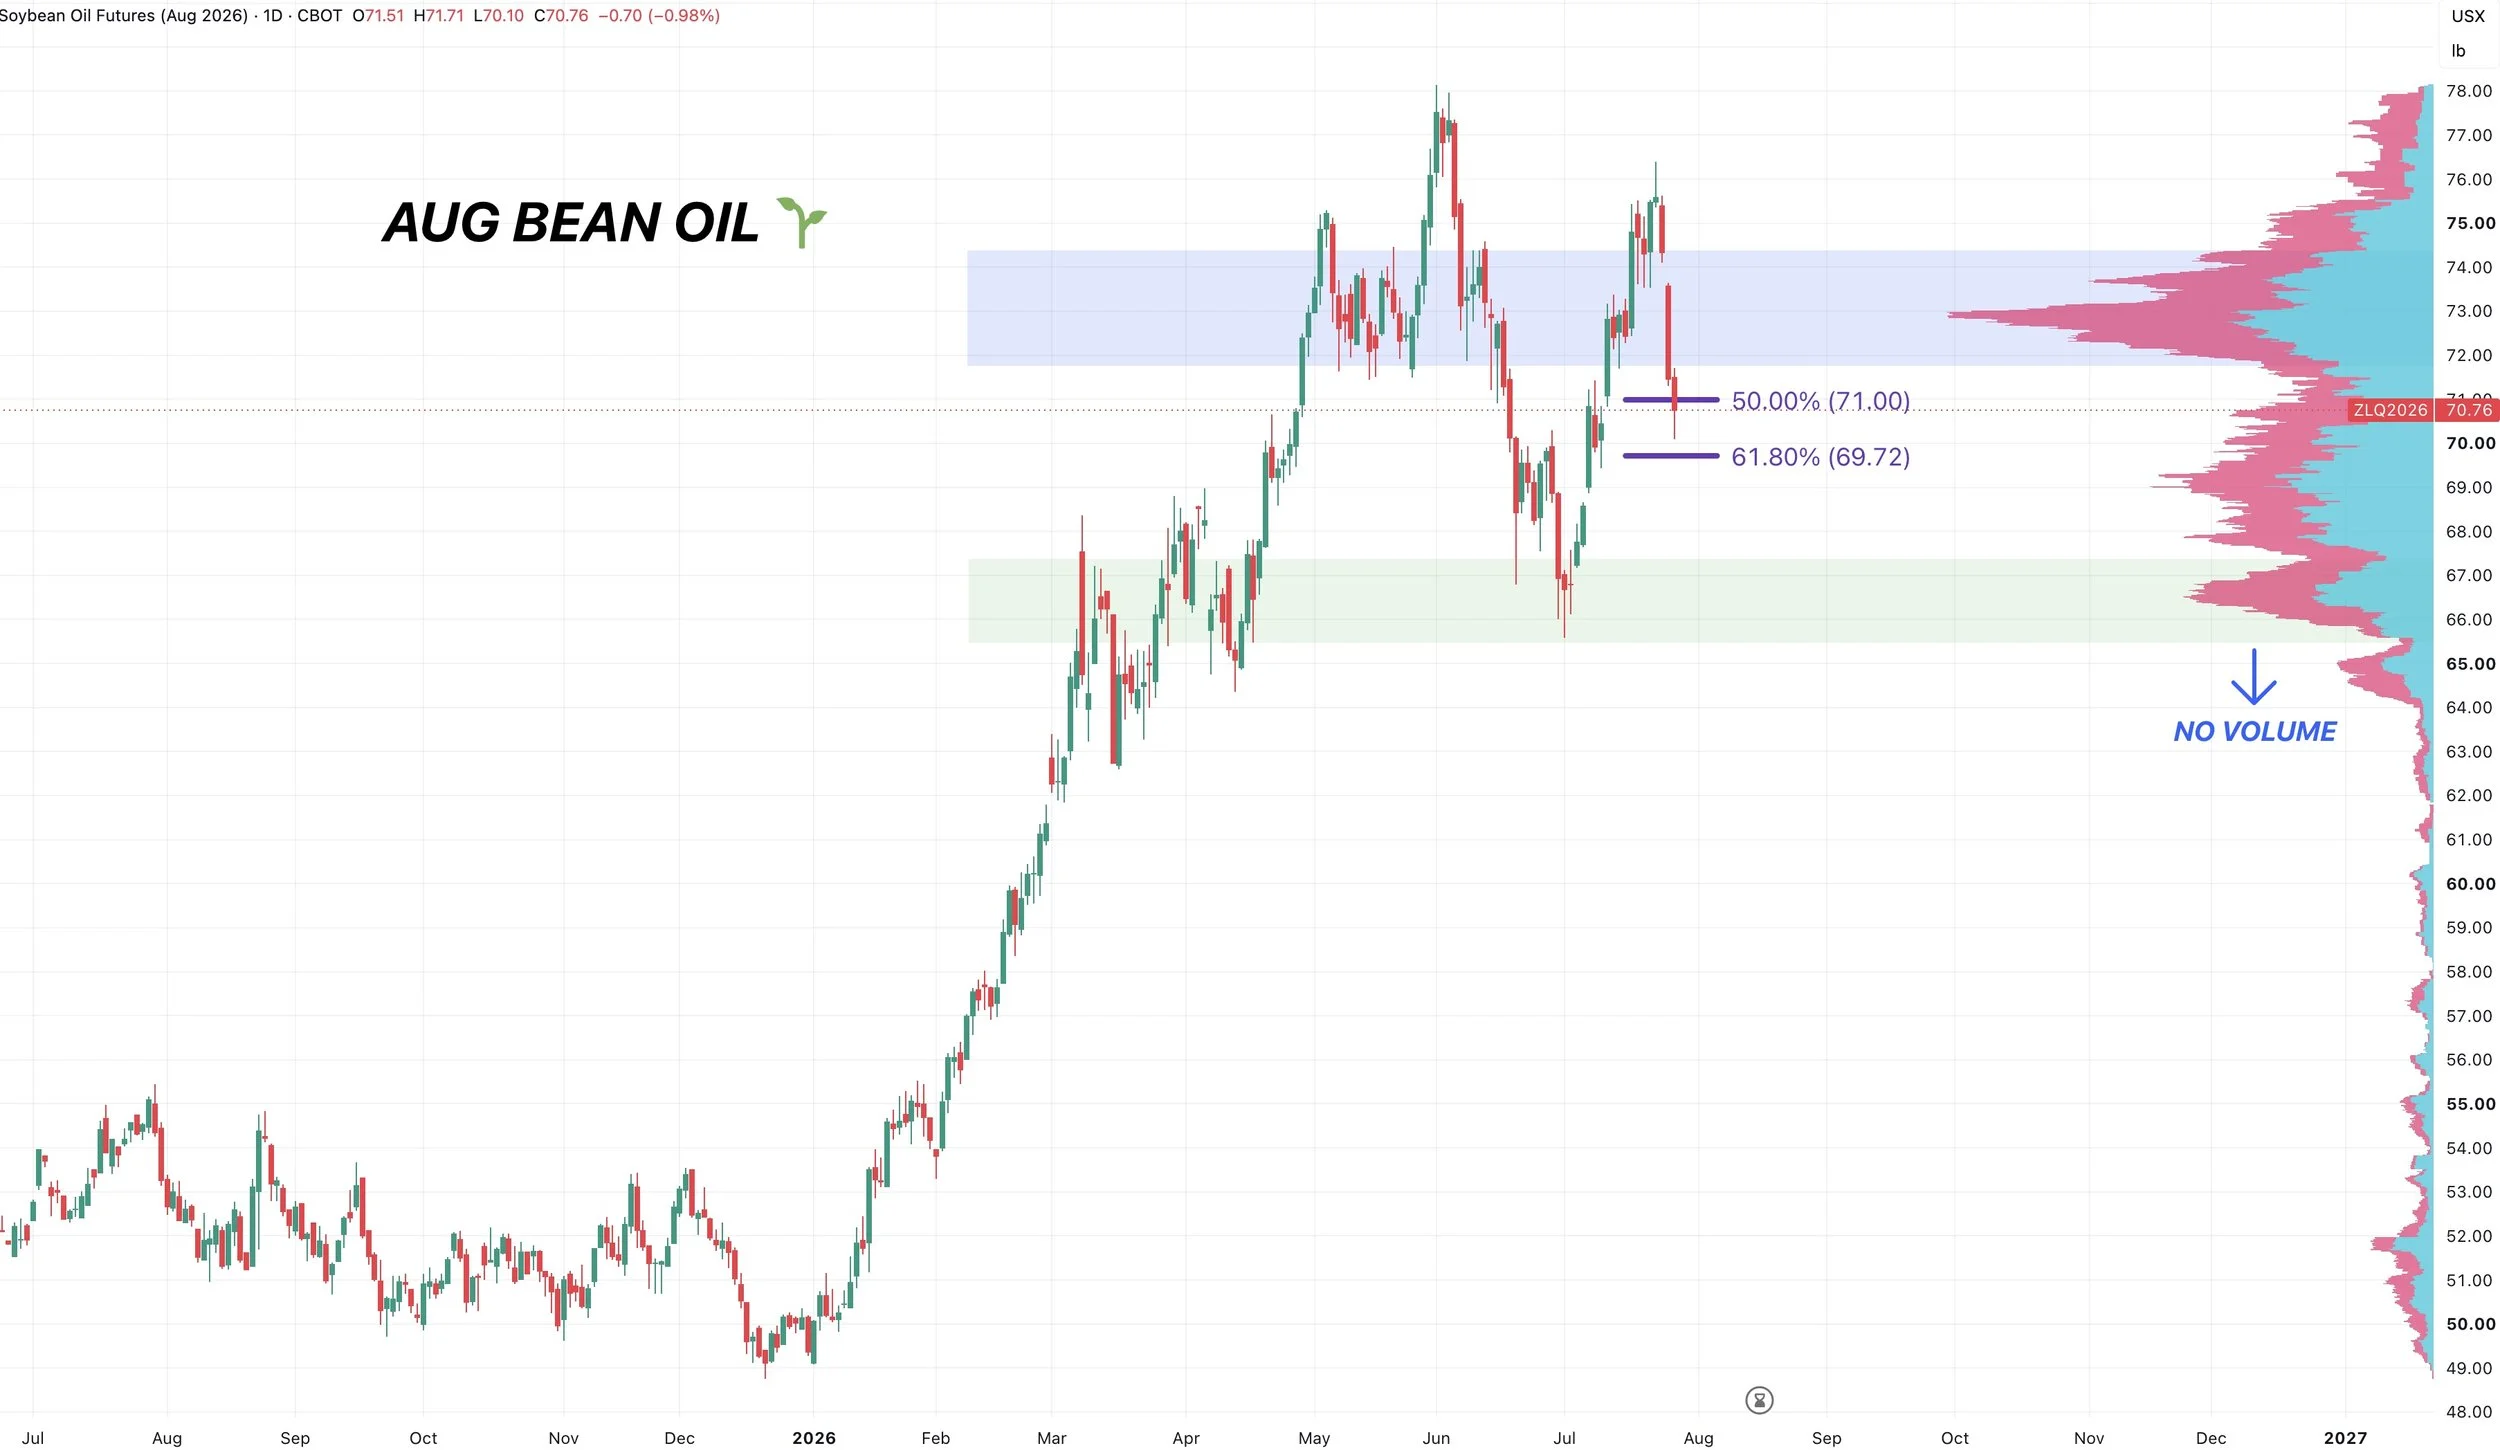
For starters, soybean oil.
Crude rallied recently which helped pull bean oil higher.
If you are the funds, and you are holding a record long position in the soybean complex.
You probably don’t puke out of that position until bean oil gives you a reason to do so.
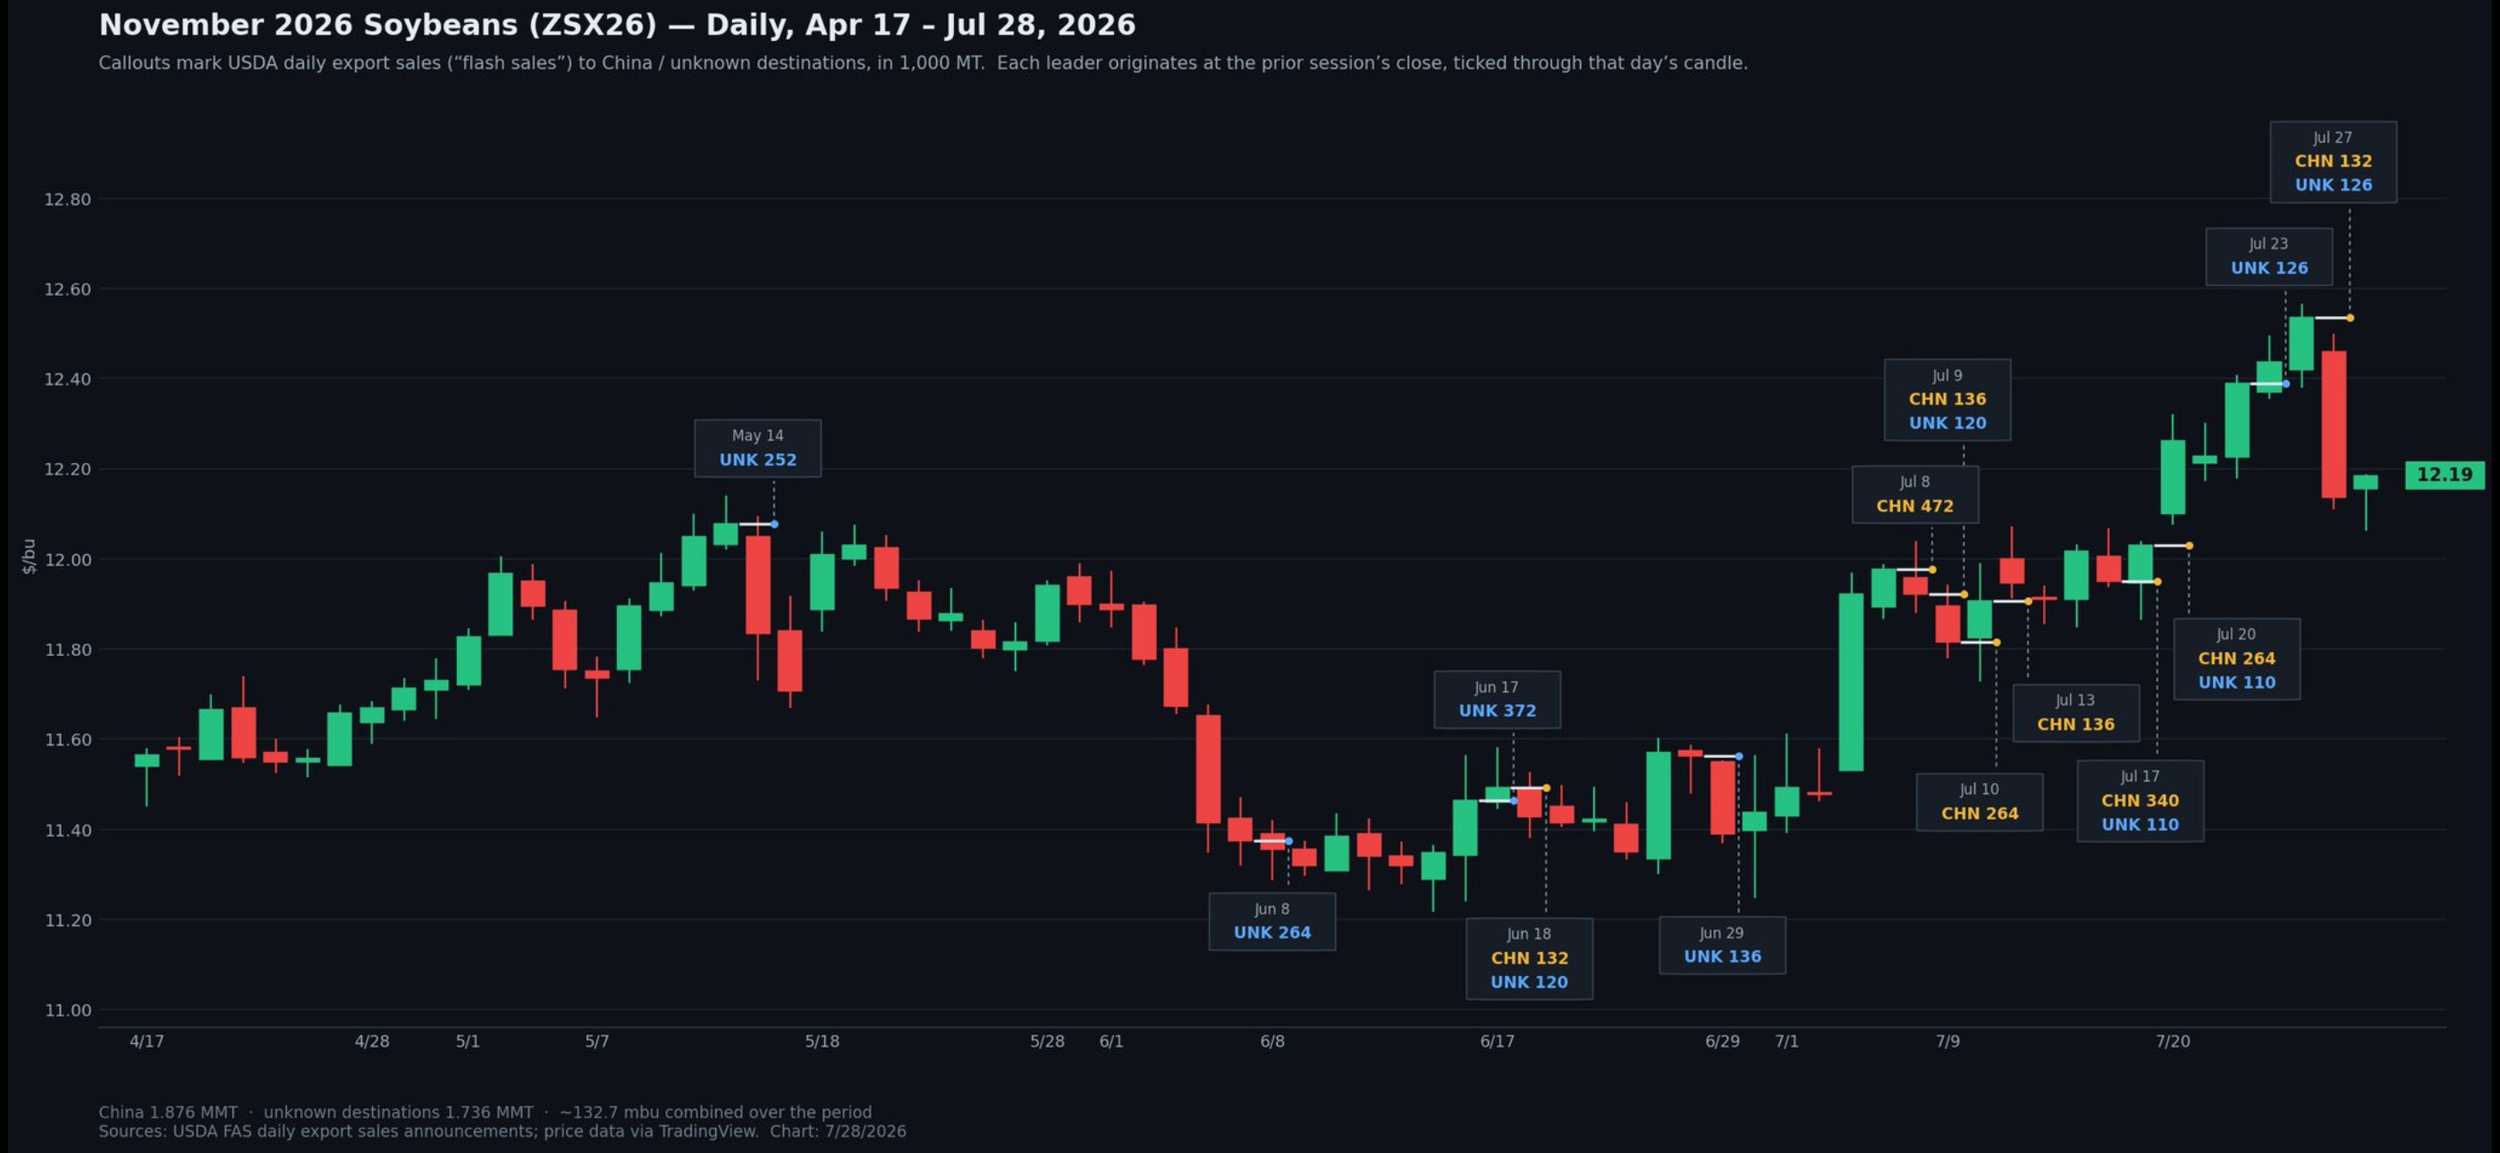
The other big reason is China.
They've been buying a bunch of soybeans.
Here is a great chart from Daniel Hussey on X.
It outlines the Nov soybean chart with China purchases.
With the recent break, we are now back at levels where China has previously stepped in more aggressively. So perhaps we see them step back in here.
I found this chart pretty interesting.
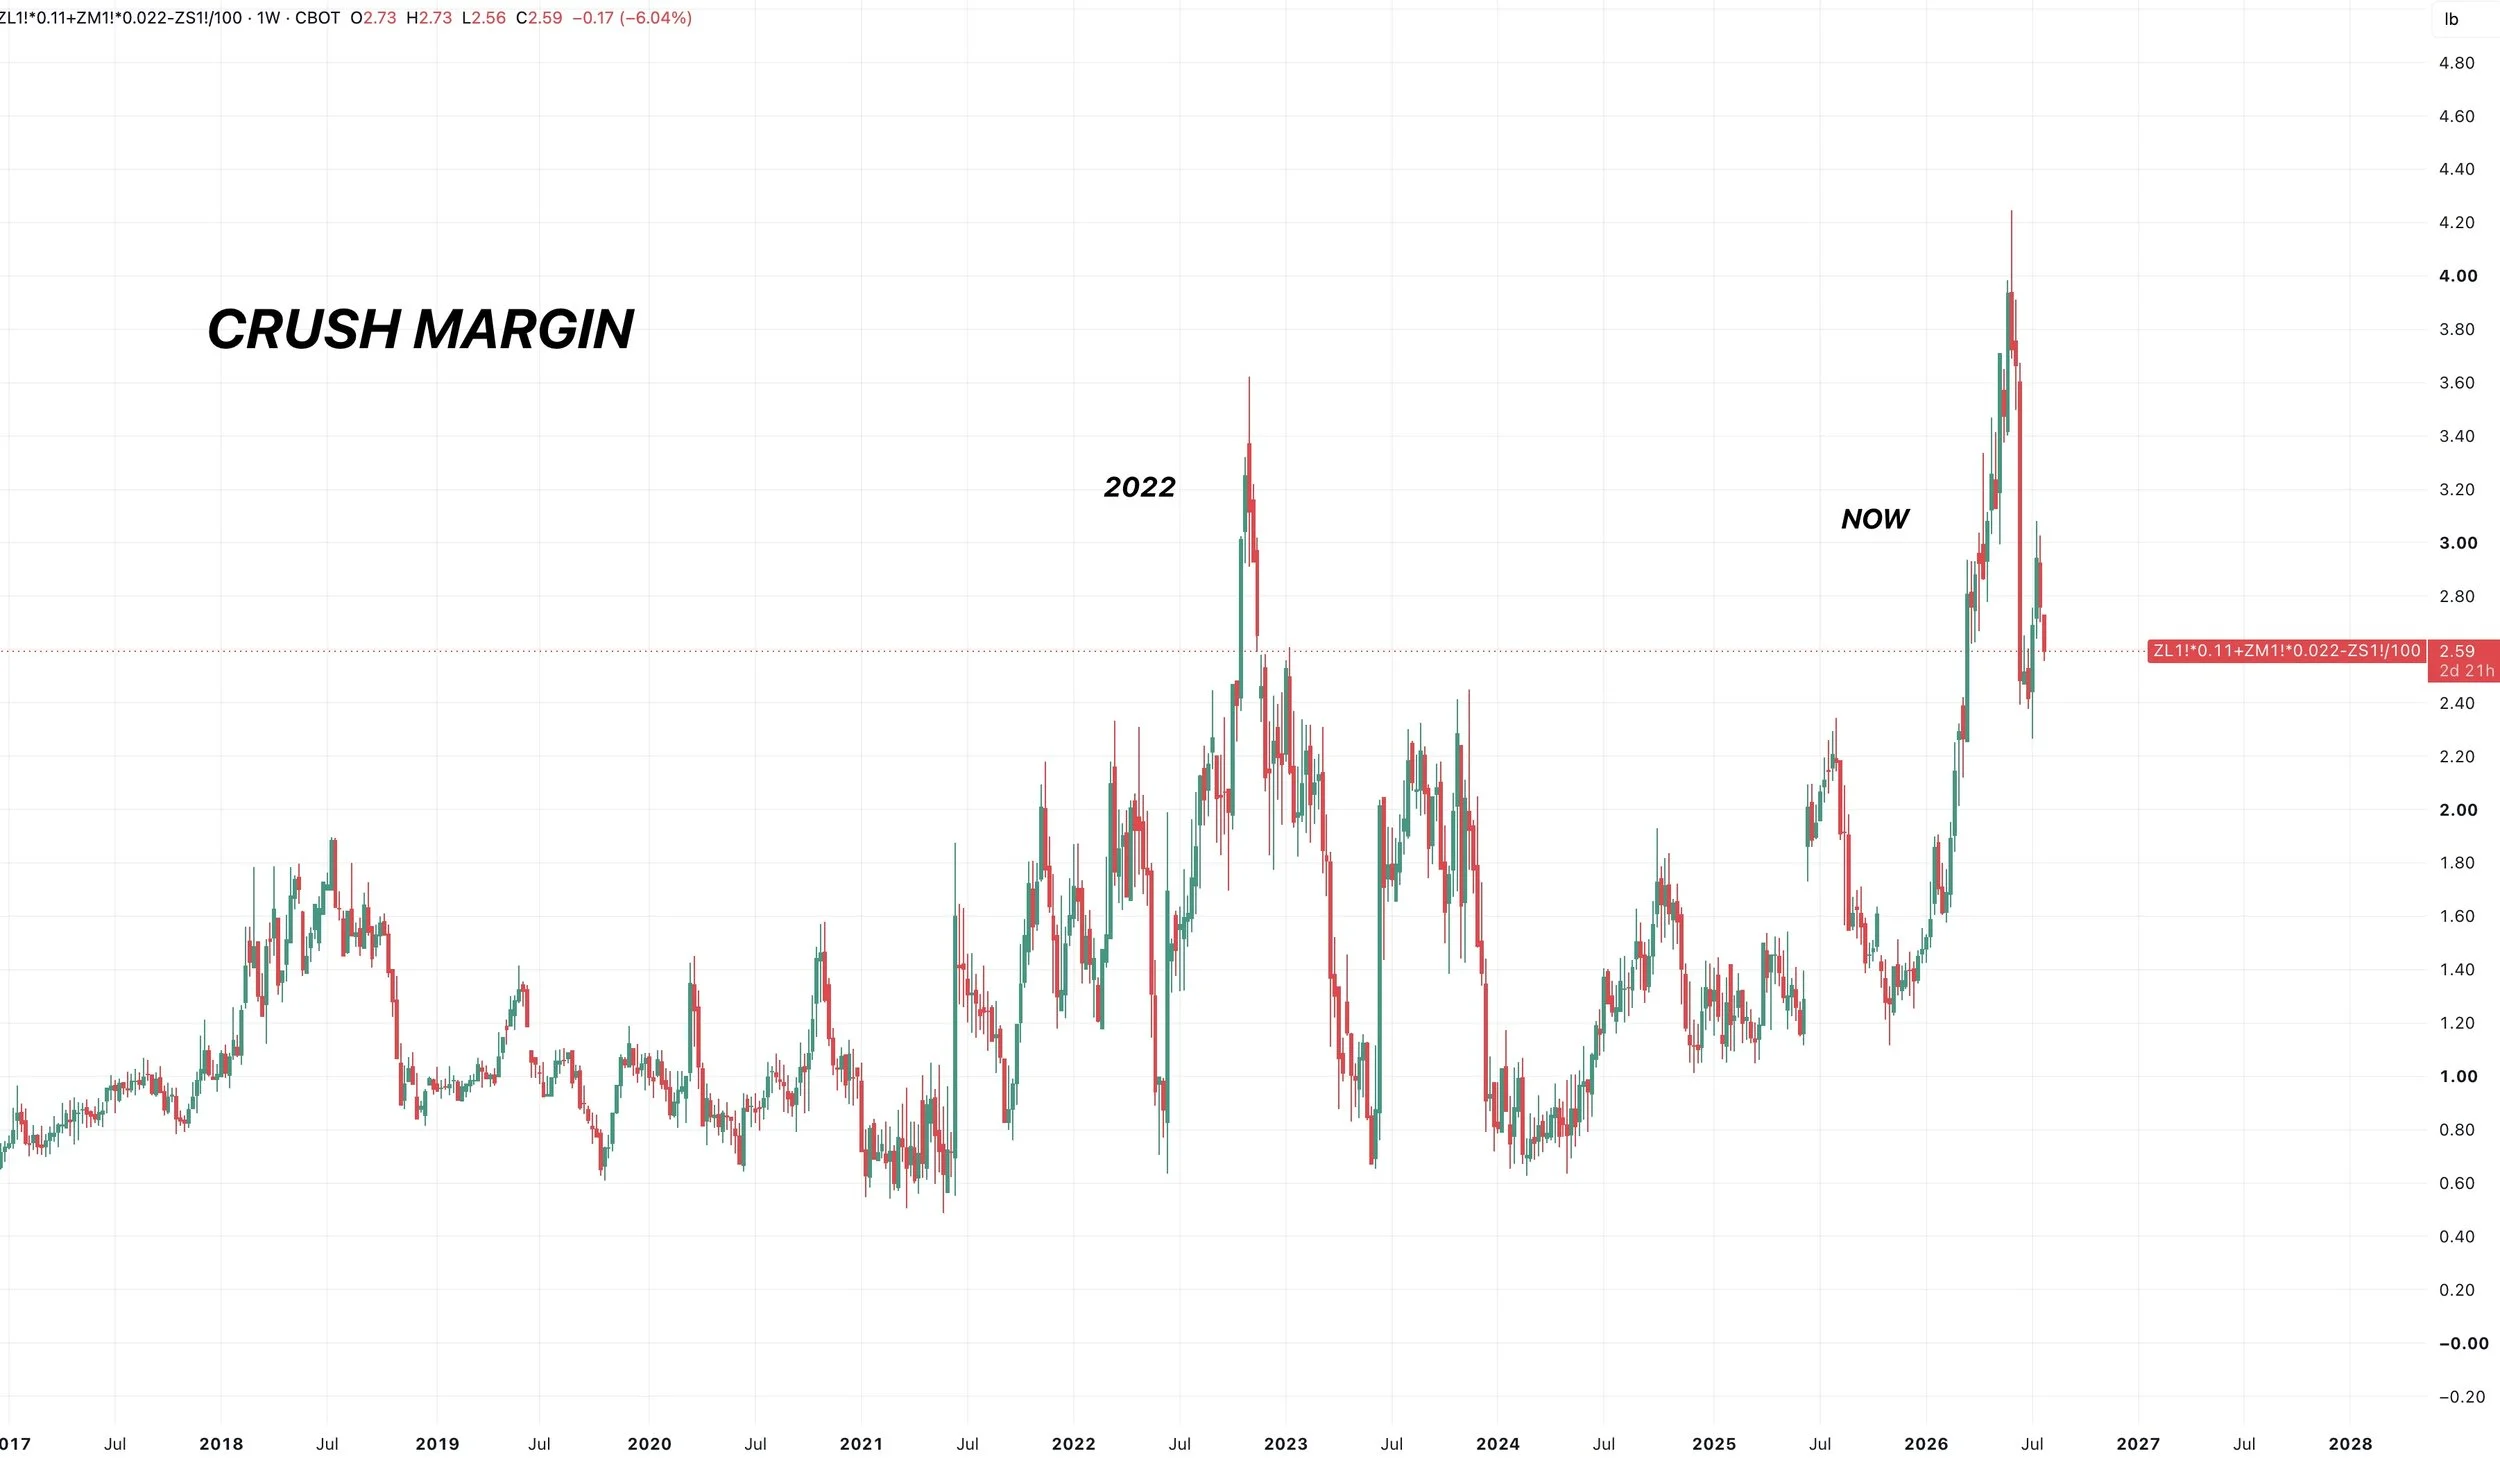
Like in corn, I think soybeans have plenty of "long term" potential.
Crush margins are still fantastic.
Still sitting at record levels.
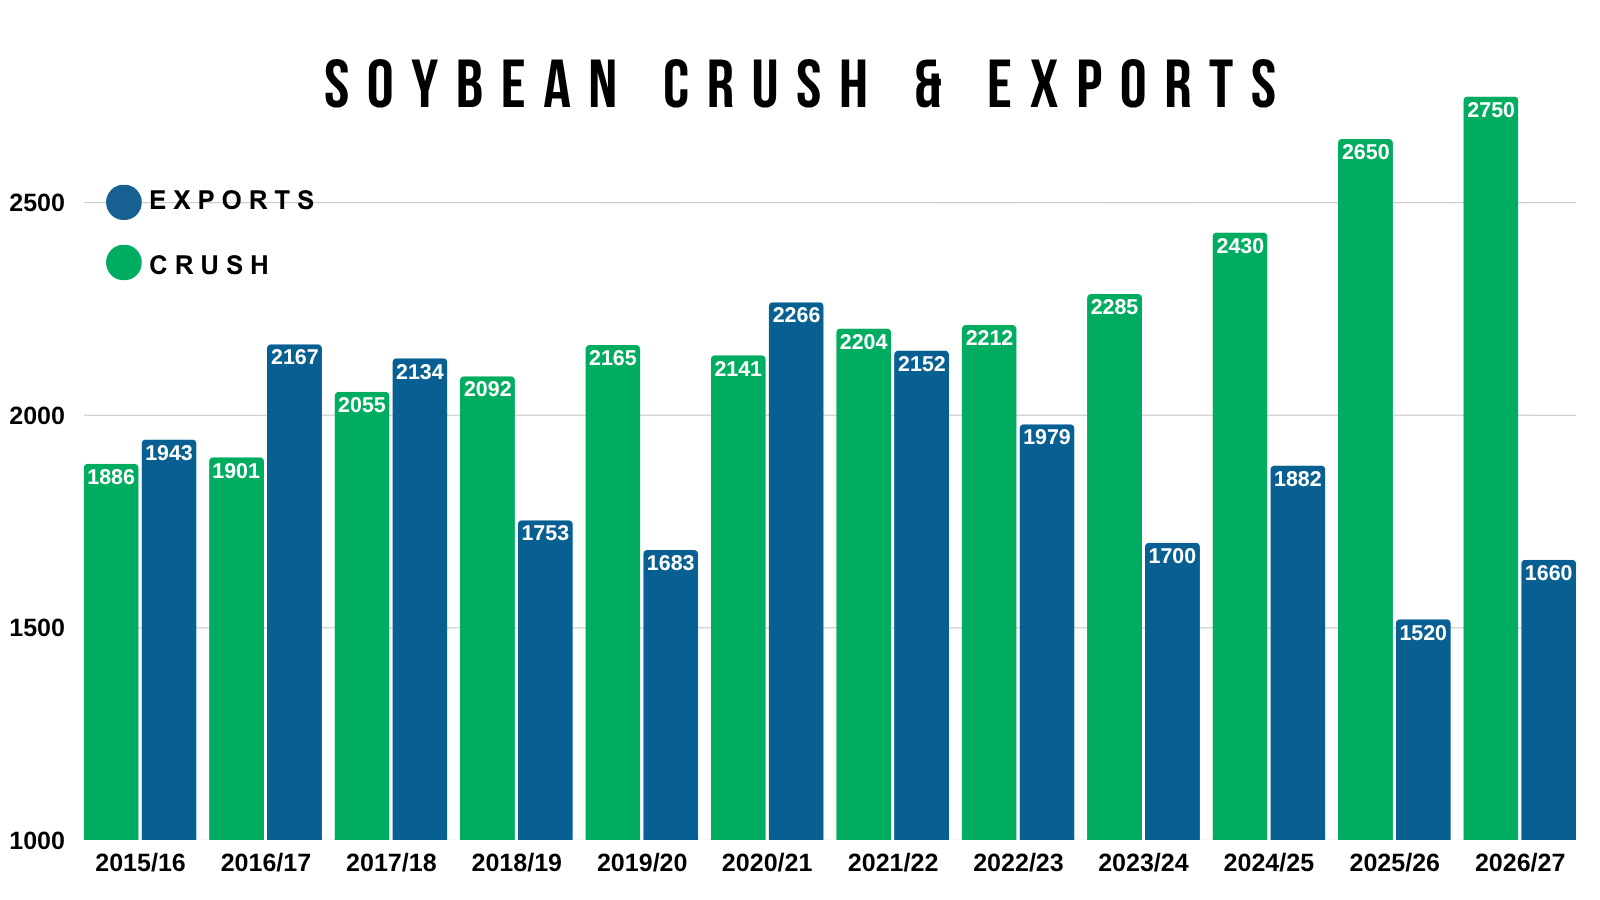
Crush demand remains the best it's ever been.
You have to ask yourself:
What if exports improve?
That is one way this balance sheet could tighten up further.
The other big question we have to ask is:
What if yield isn’t trend?
The room for error is razor thin like we've talked about for months.
8 of the top 10 states crop ratings are worse than last year.
So another record 53 bpa is not a guarantee.
Even just a 52 bpa yield drops our carryout below 300 million before adjusting demand.
Crush isn’t going away where. So if this happens, we'd need to ration our exports lower. How do you do that? Prices often need to go higher to justify losing demand.
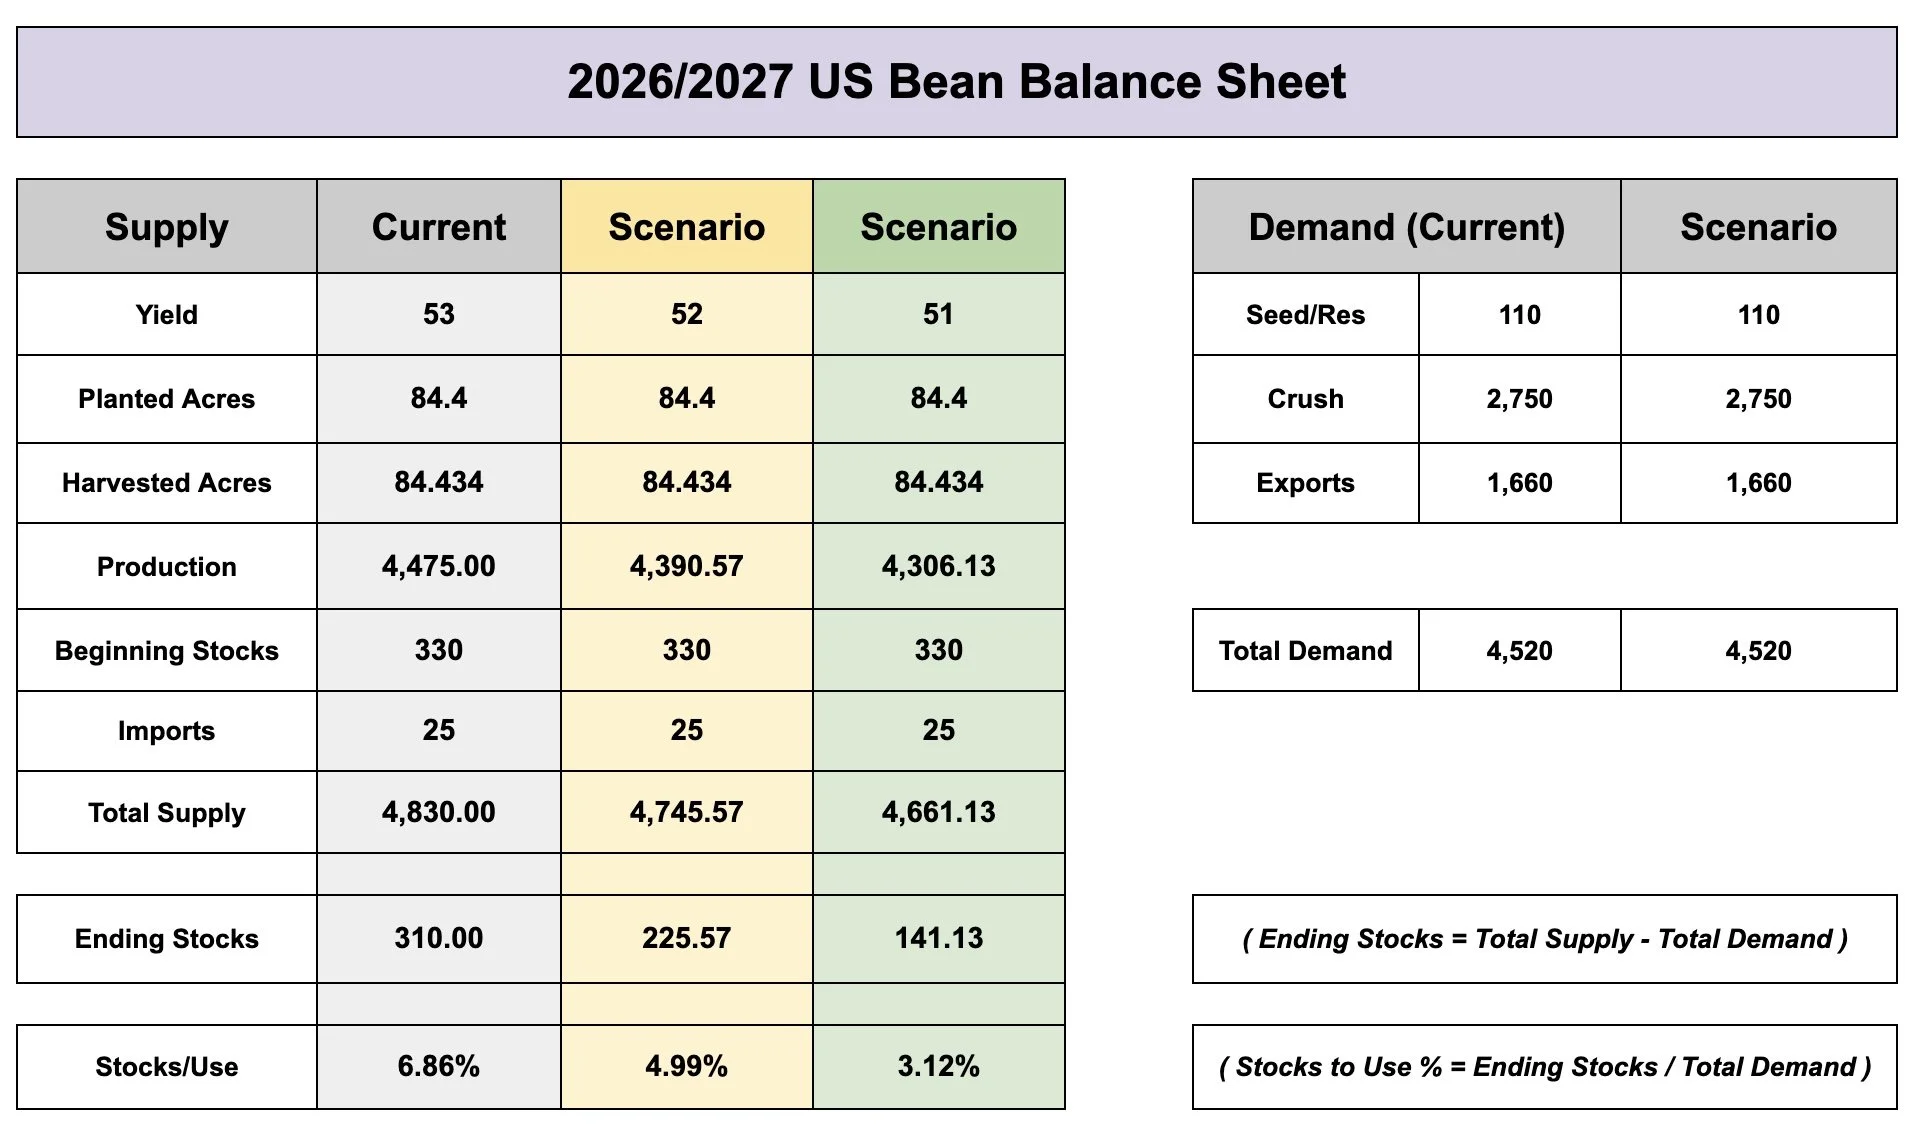
We haven’t seen a sub 300 million carryout since the bull market.
So there are several potentially friendly factors for soybeans down the road.
Does it "have" to happen? No. But that's your story.
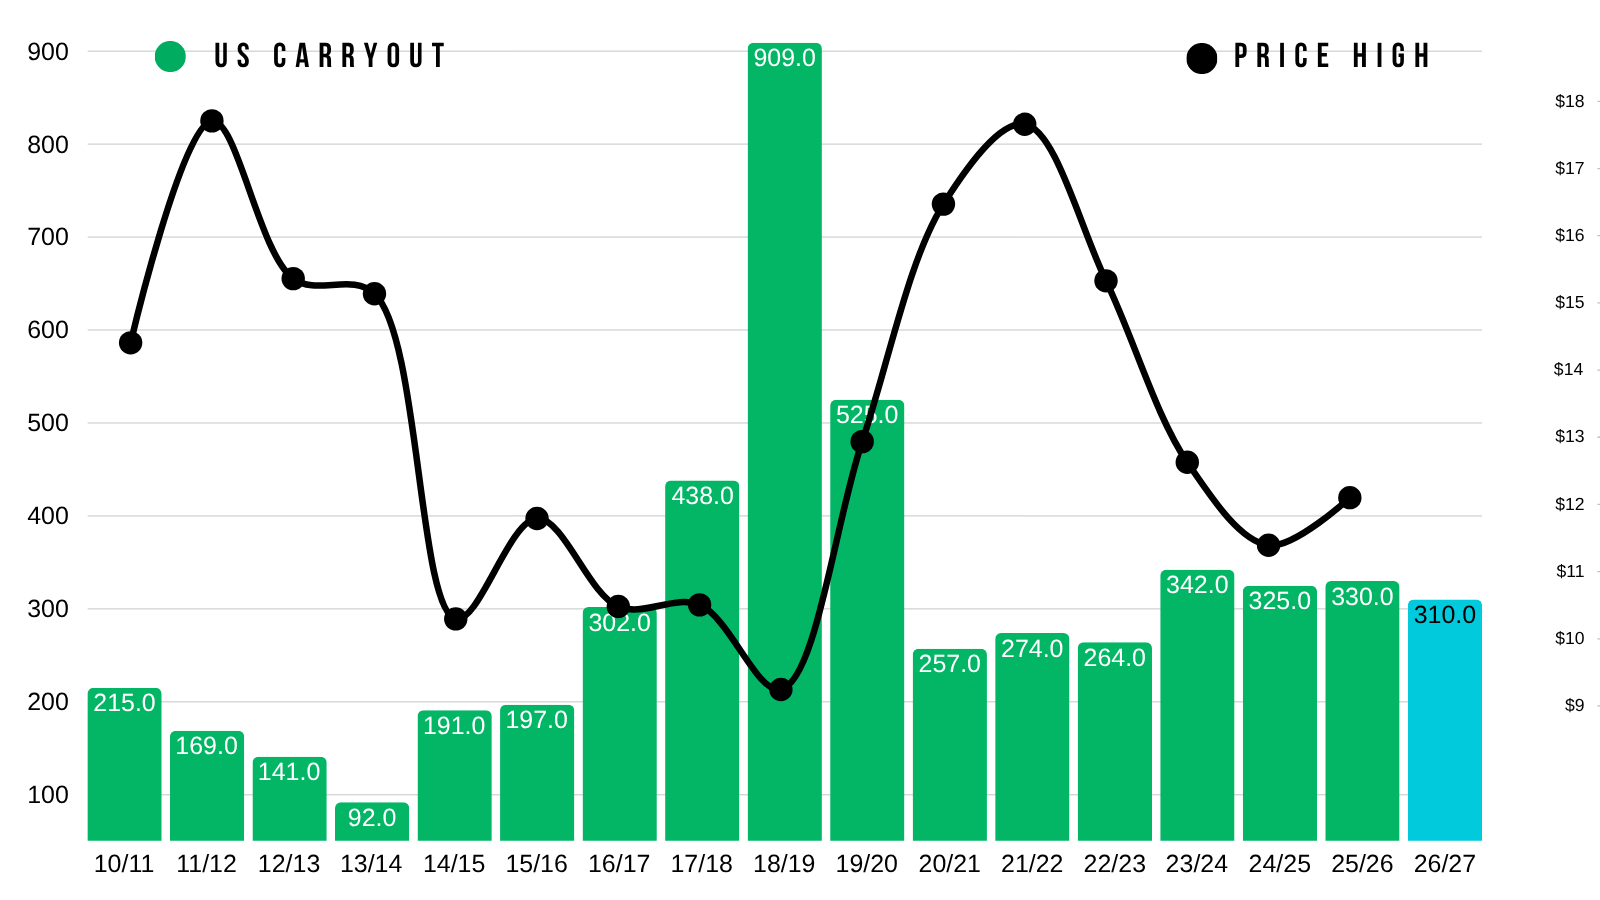
But like in corn, just because I see a story long term. Does not mean there isn’t short term risk.
Hence the hedge alert last week.
Click Here for Alert
This is a weather market. What happens if the forecasts flip cool and wet?
We could absolutely struggle.
We have seen an amazing counter seasonal rally heading into what is usually a weak time frame.
Seasonally speaking, the trend is usually lower into fall before we then run into Brazil's weather season.
The Super El Nino and Brazil production is going to be another major wild card later this year. As many are speculating that it could have a big impact down there.
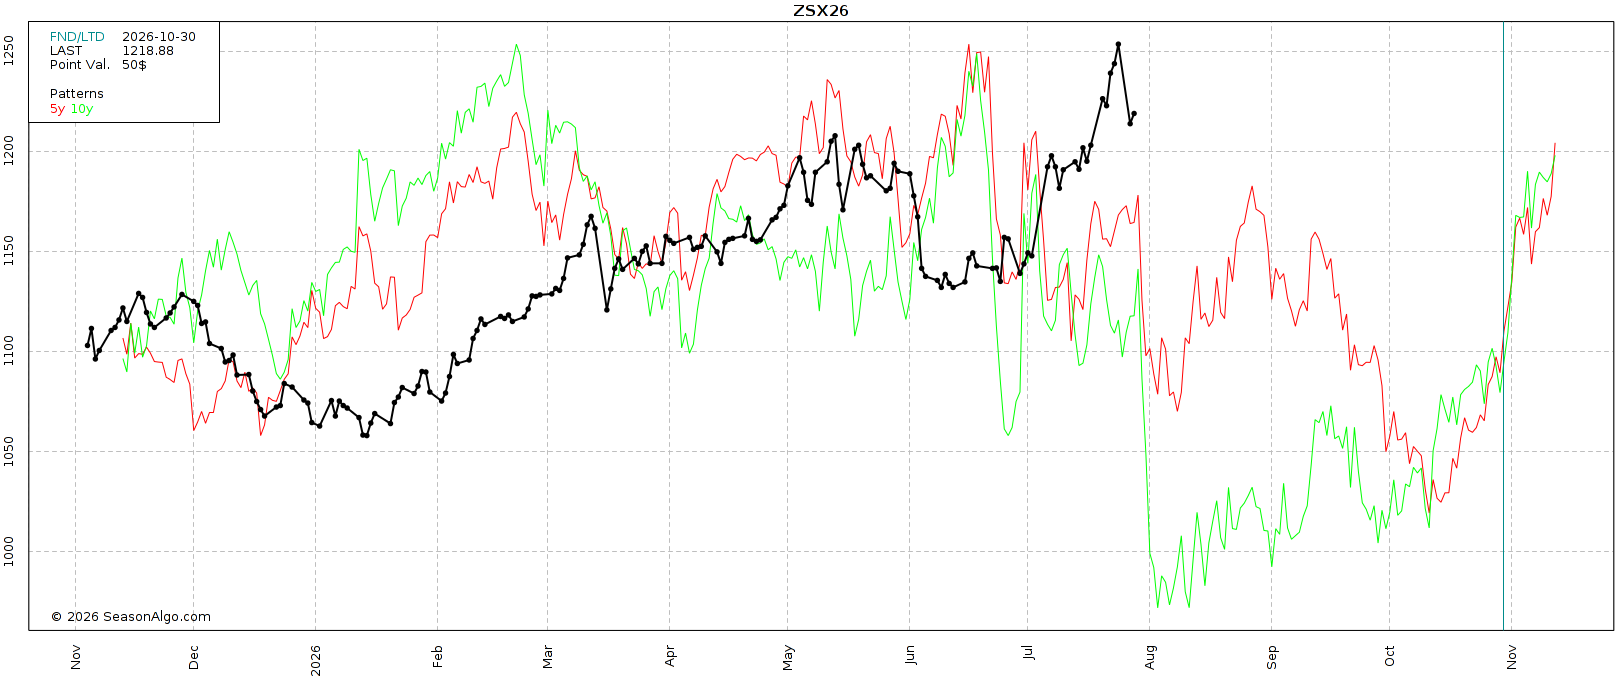
The other big reason we wanted to at least do something last week was the fact that new crop beans are over +$2.00 higher than they were the last two years.
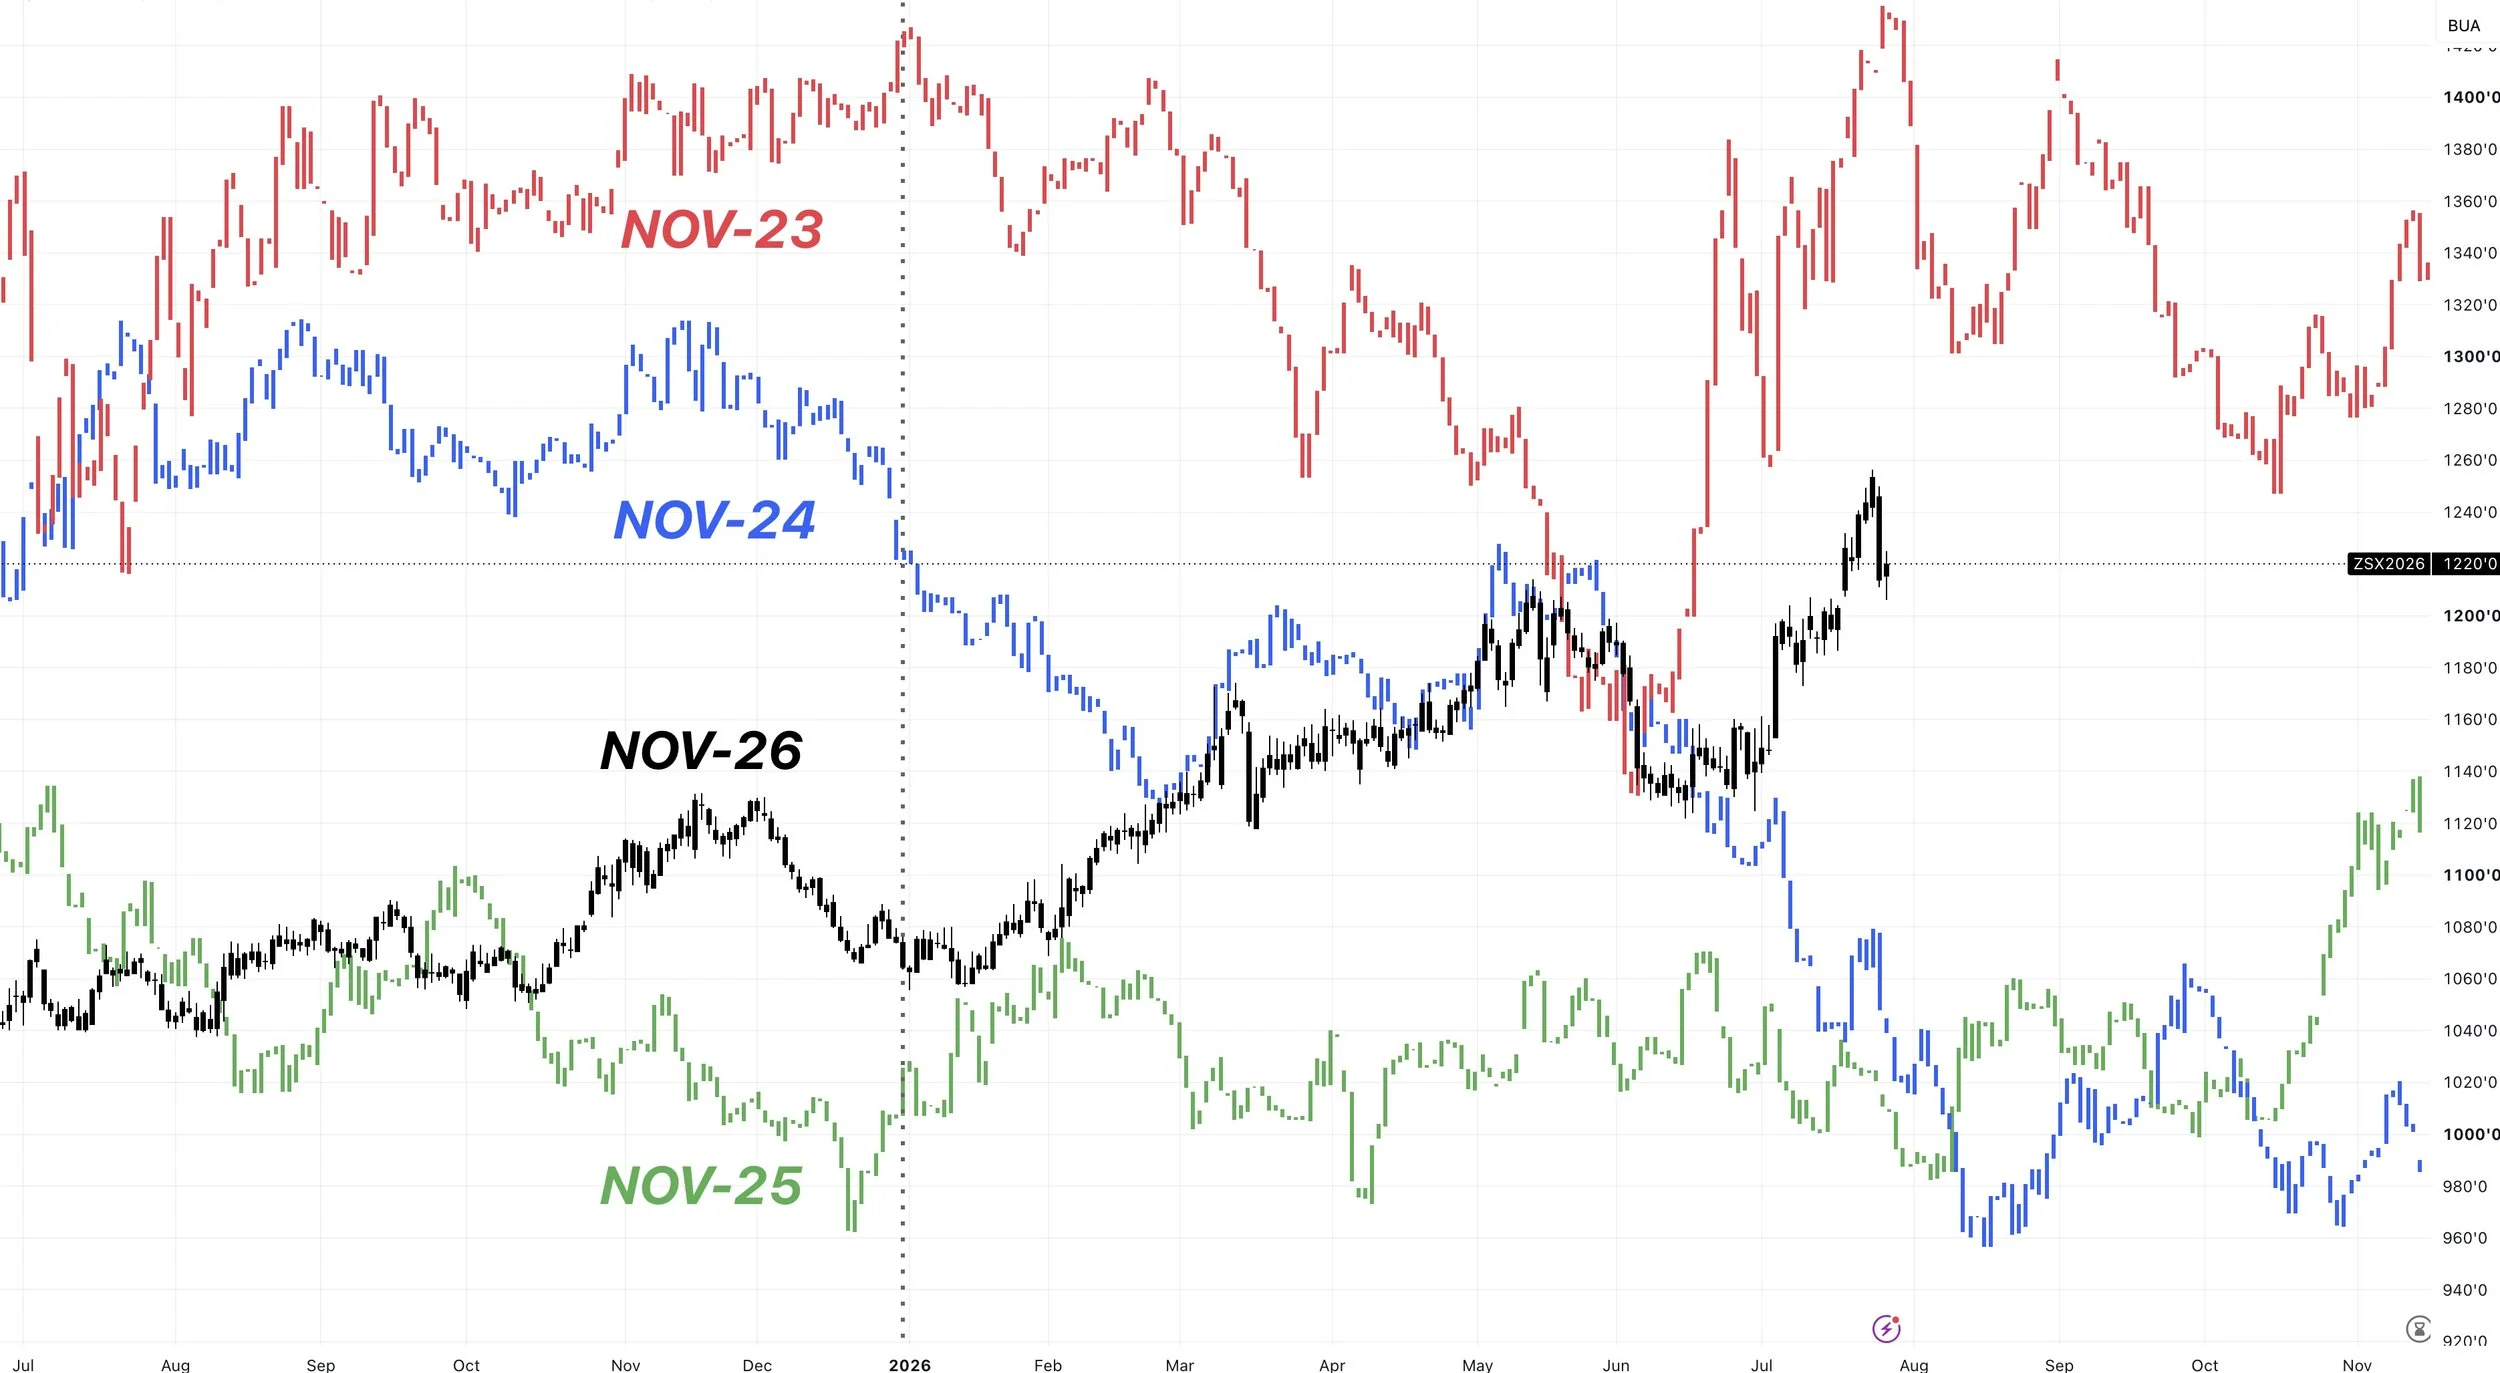
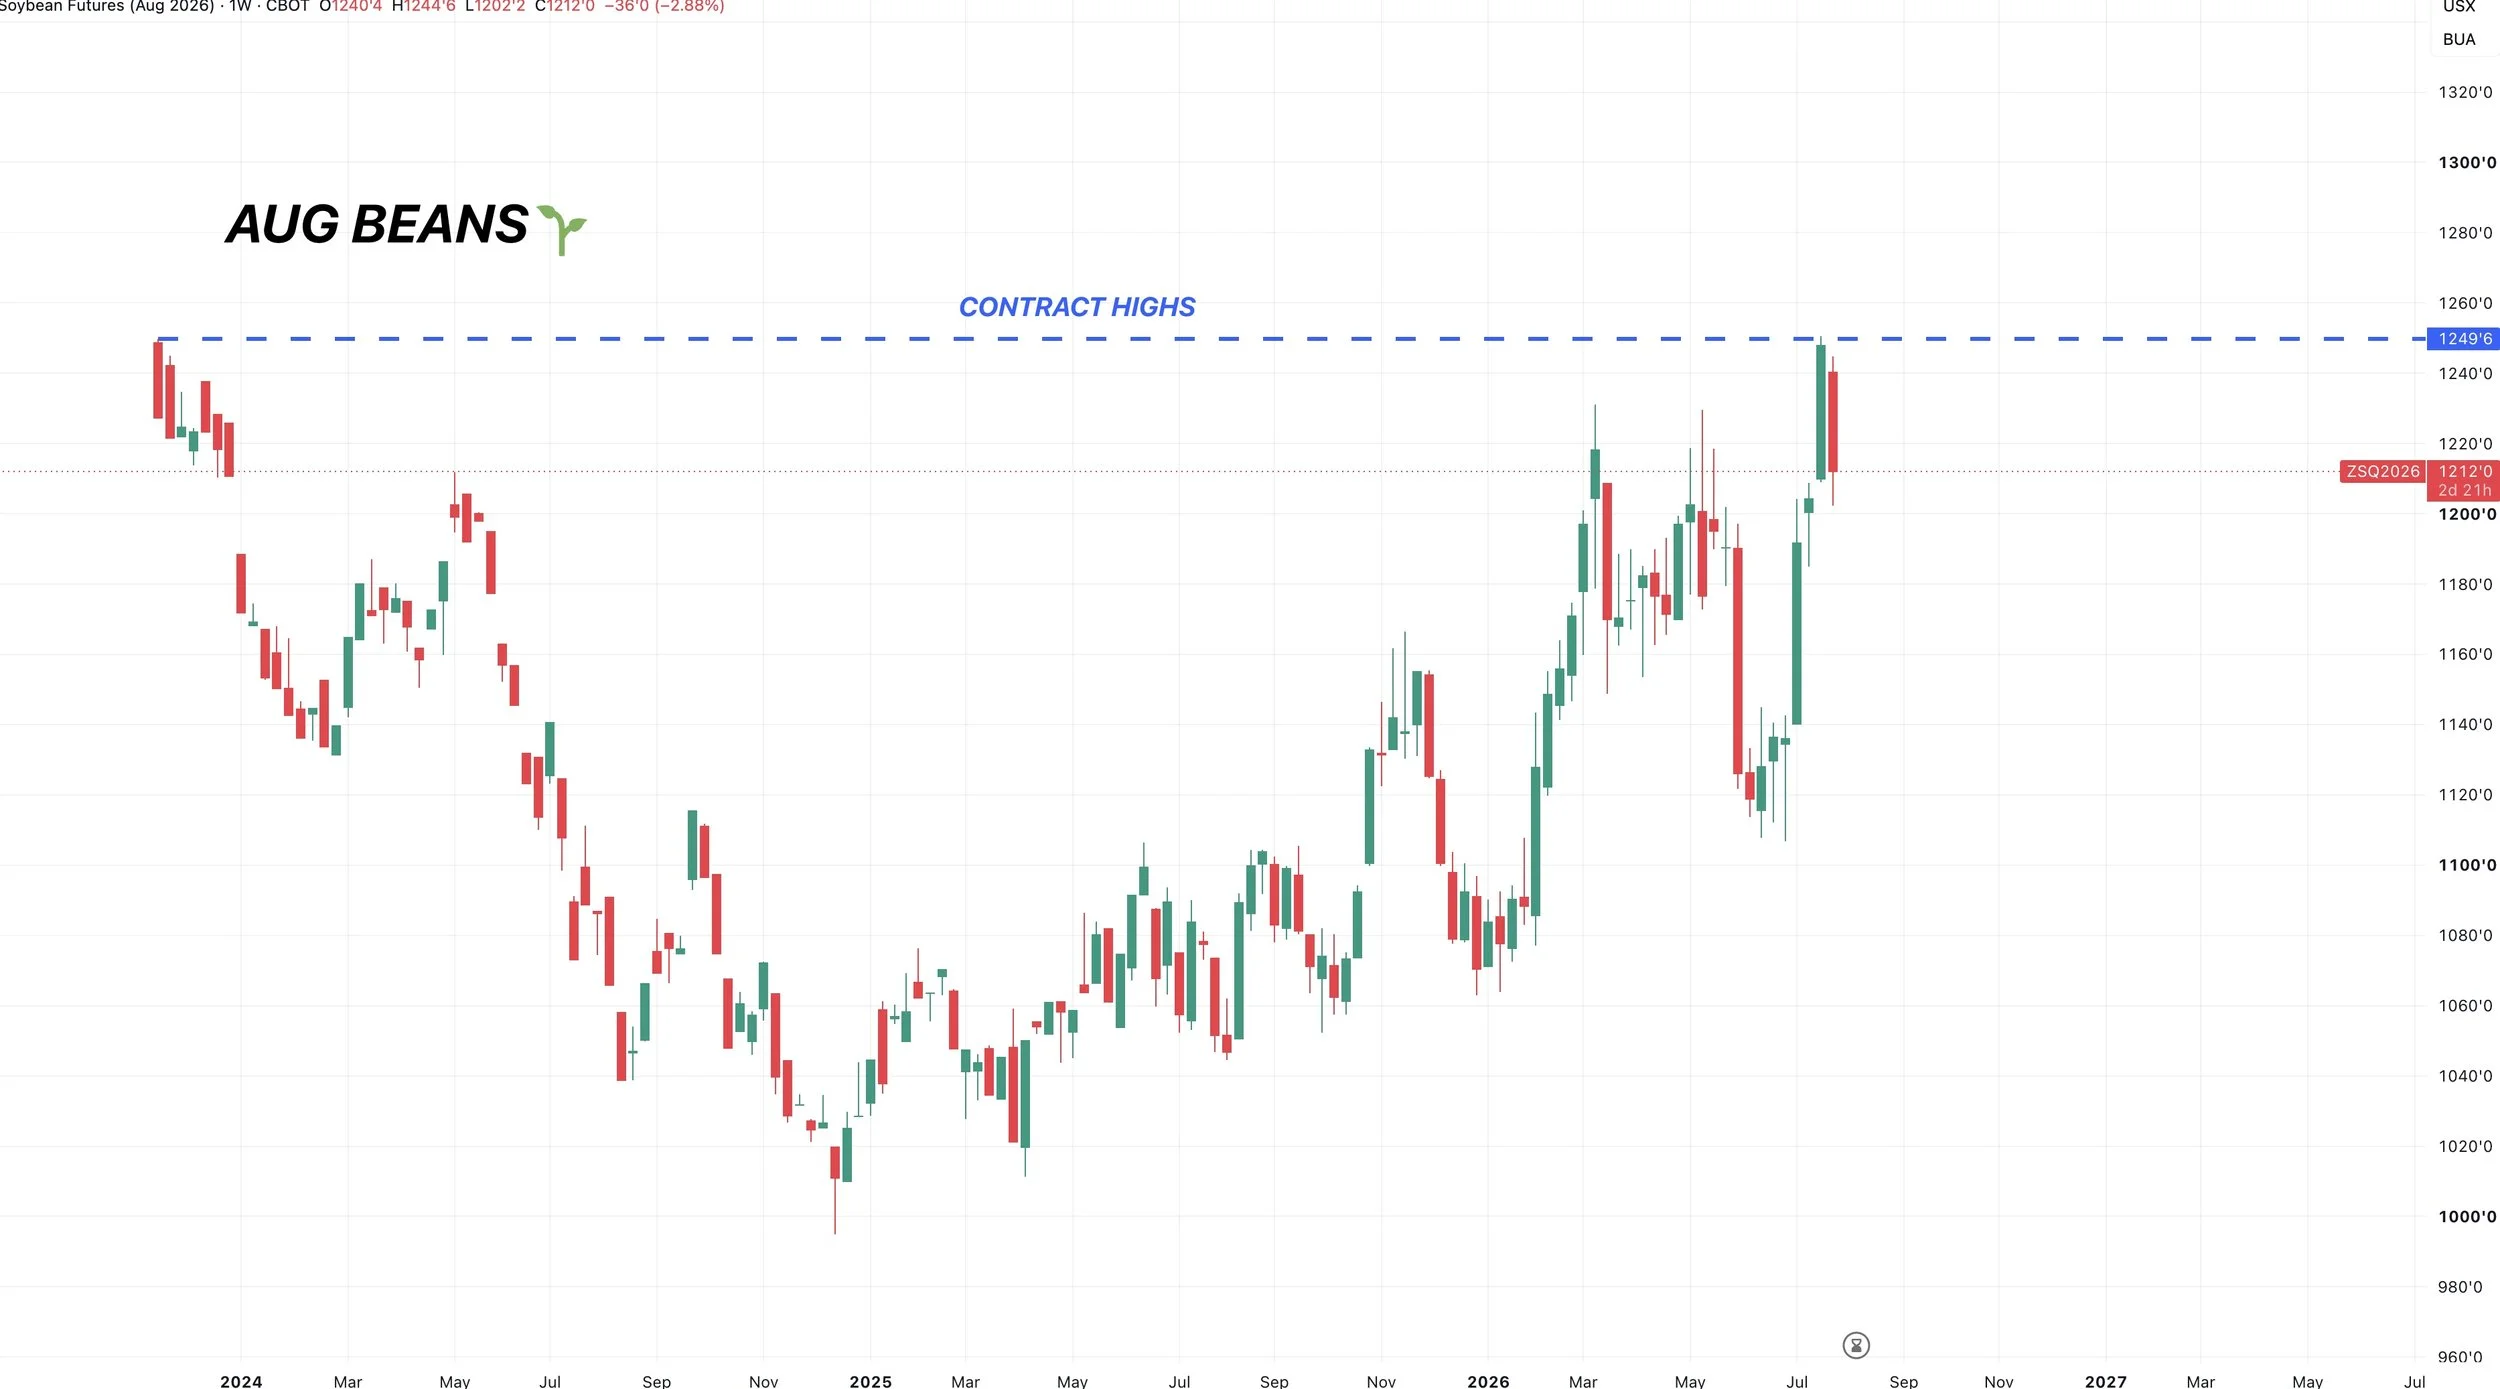
Aug Beans Chart:
We rejected those contract highs we talked about last week.
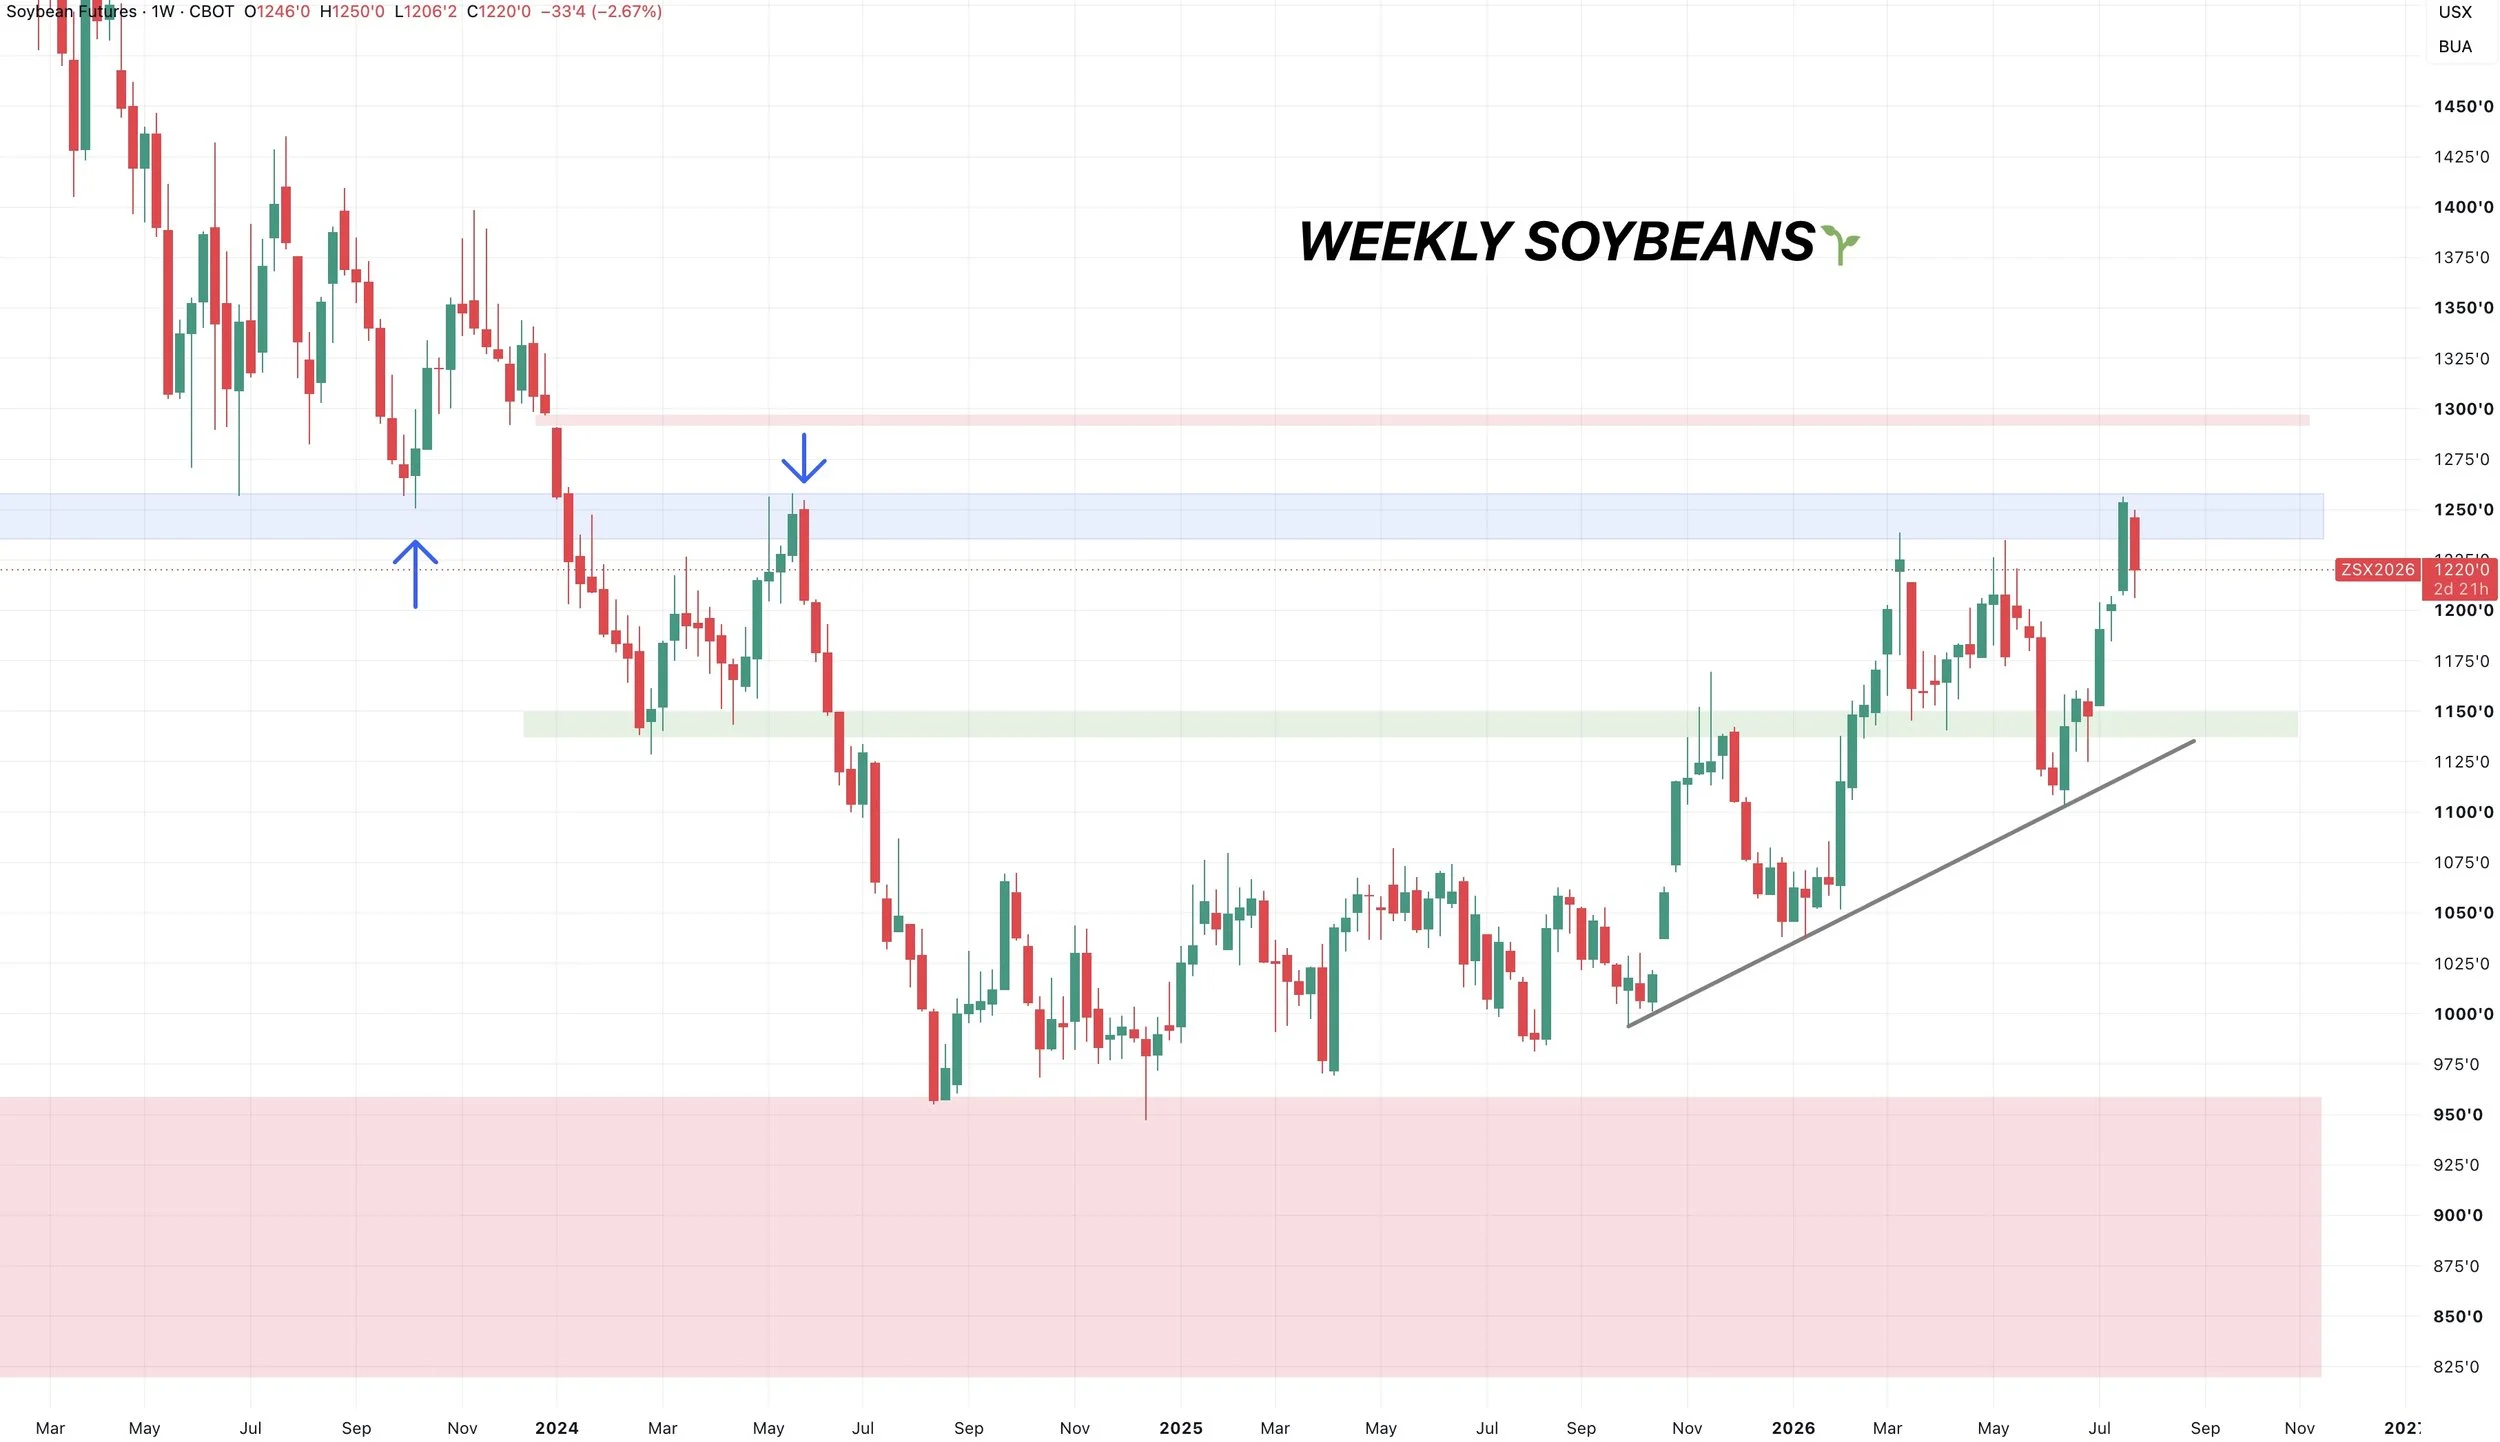
Front Month Chart:
Not only was that level contract highs in Aug beans.
It was a massive level on the continuous chart as well.
It was right where we failed in 2024.
It was right where we bottomed in 2023.
Now we are rejecting again.
So it's clearly a very big level.
However, if you are able to break through this huge spot there is an unfilled gap that sits at $13.00
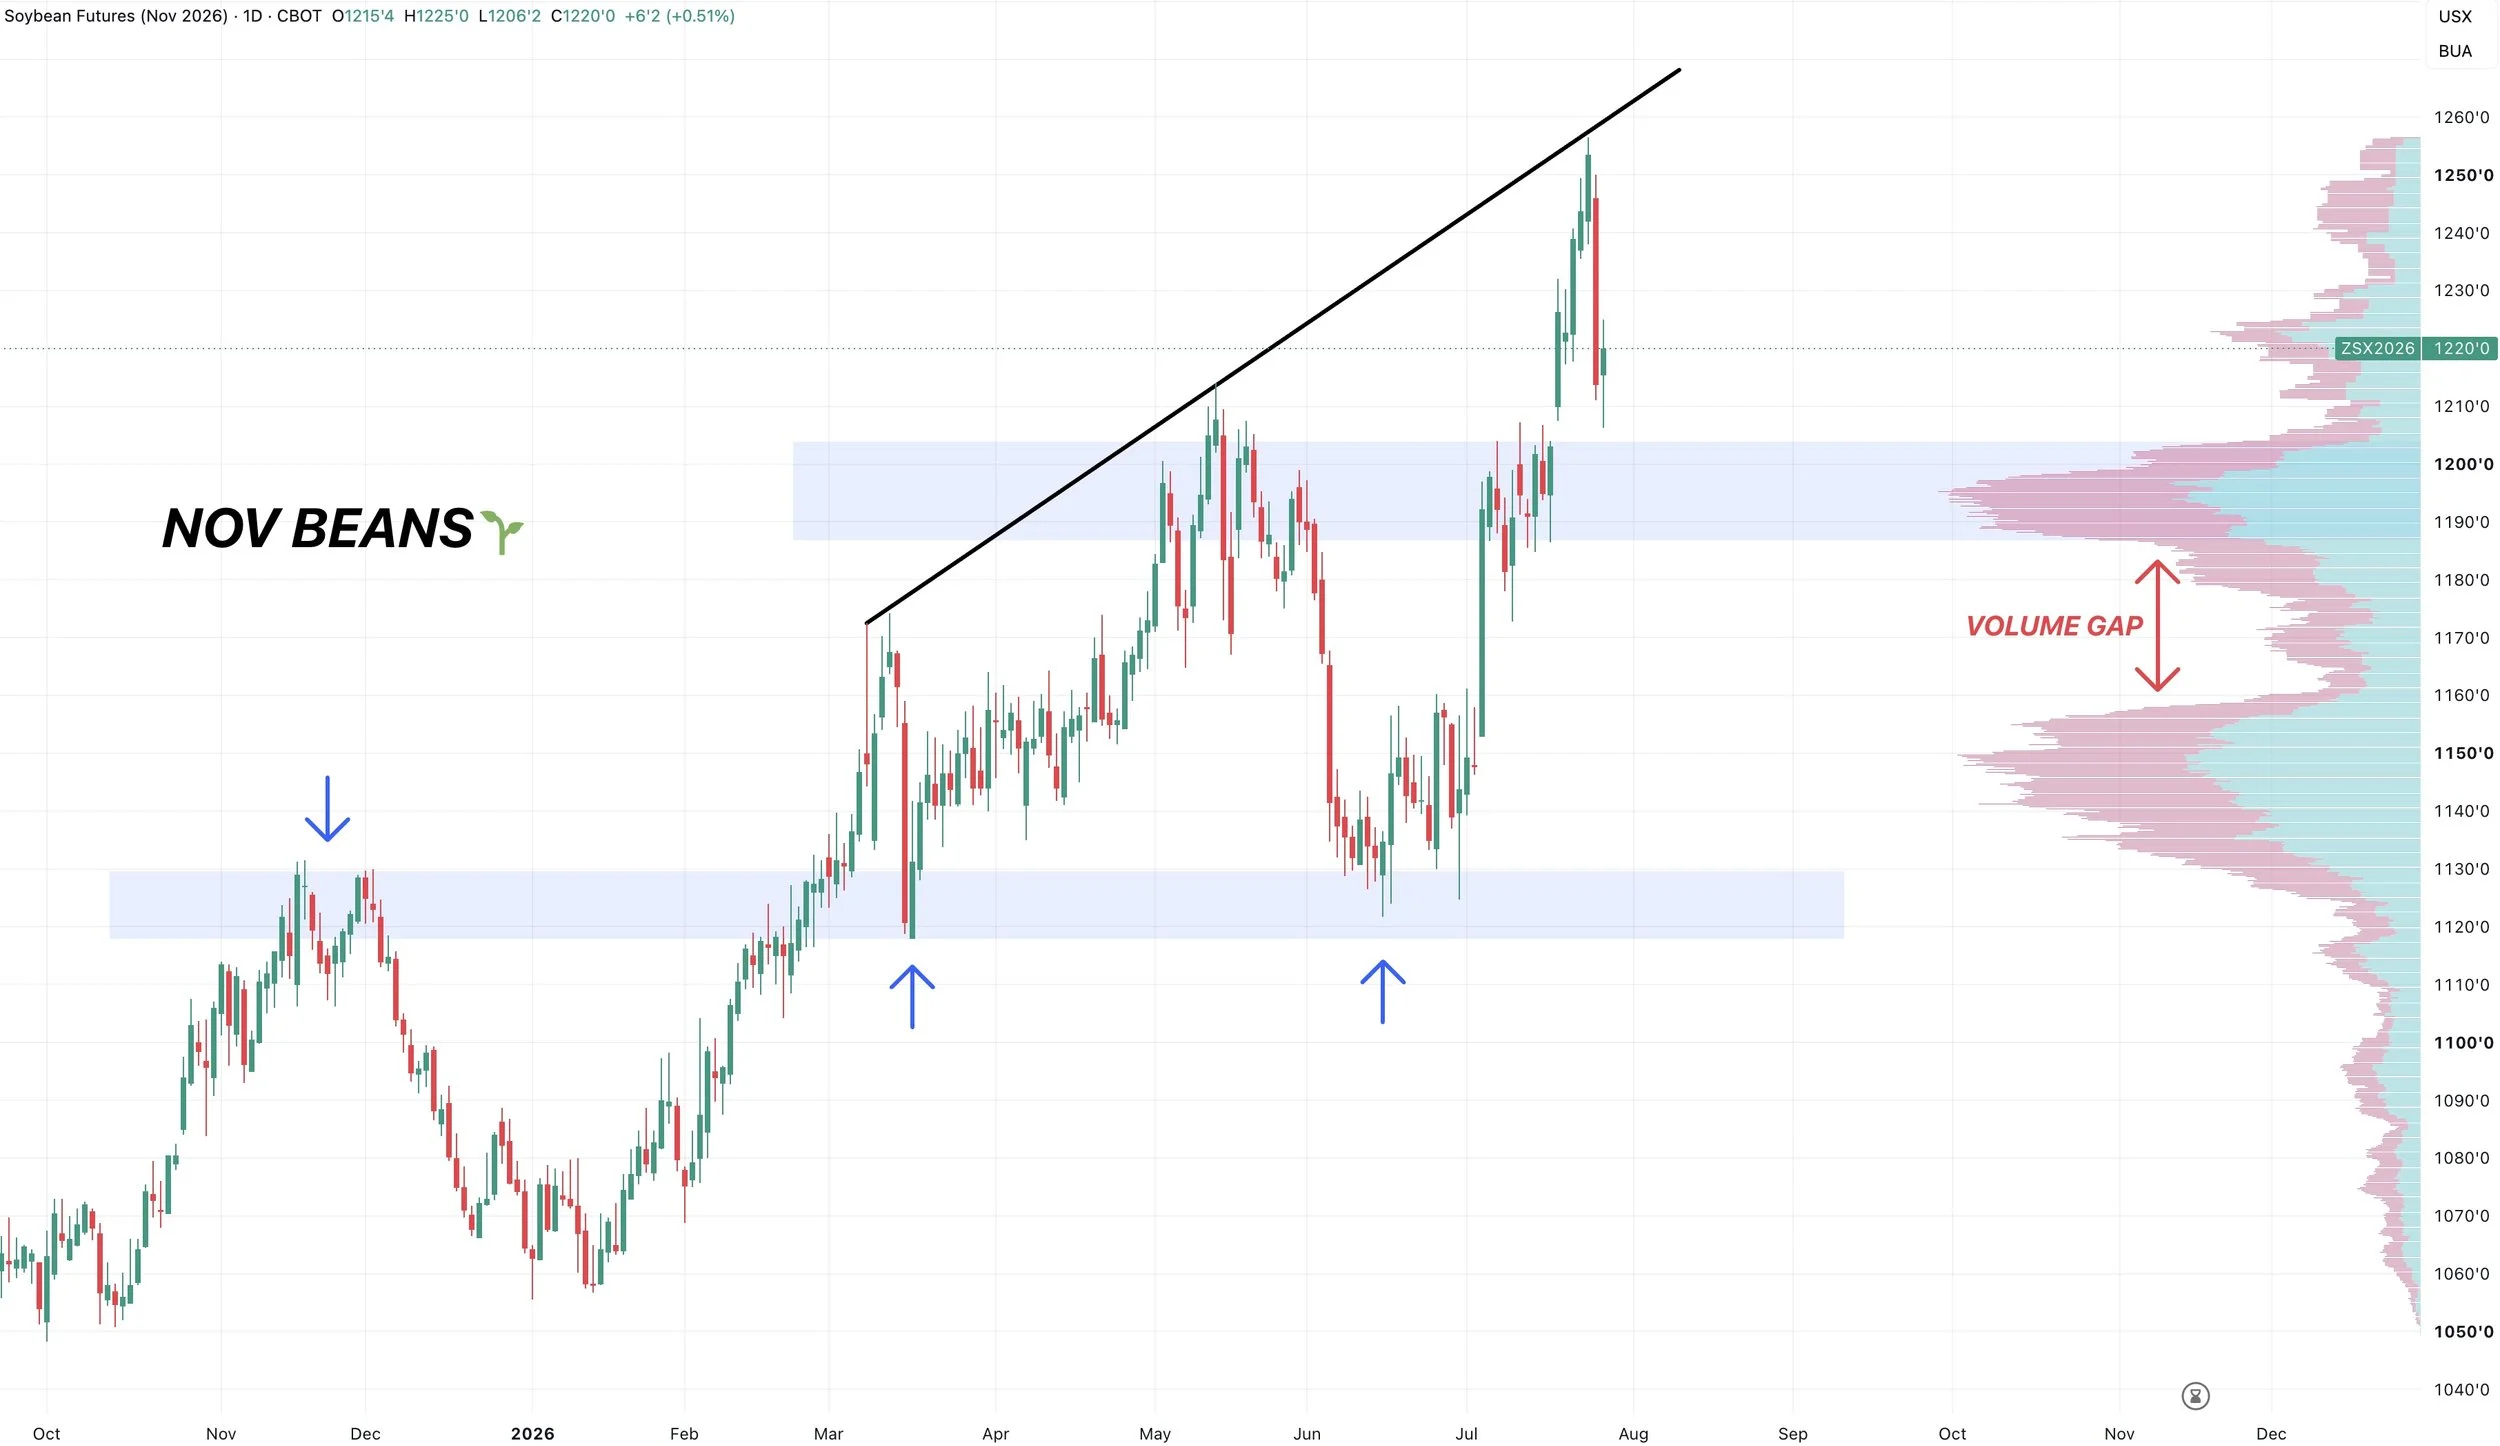
Nov Beans:
We rejected some trendline resistance.
We still have that downside gap we have yet to fill.
Overall, bulls simply want to hold this volume shelf.
While turning those old highs into our new floor.
As if we break below that level, there is air to the downside.
Since there is no volume, there is no support.
Wheat
Not much on wheat today.
Who knows how the Russia story will play out.
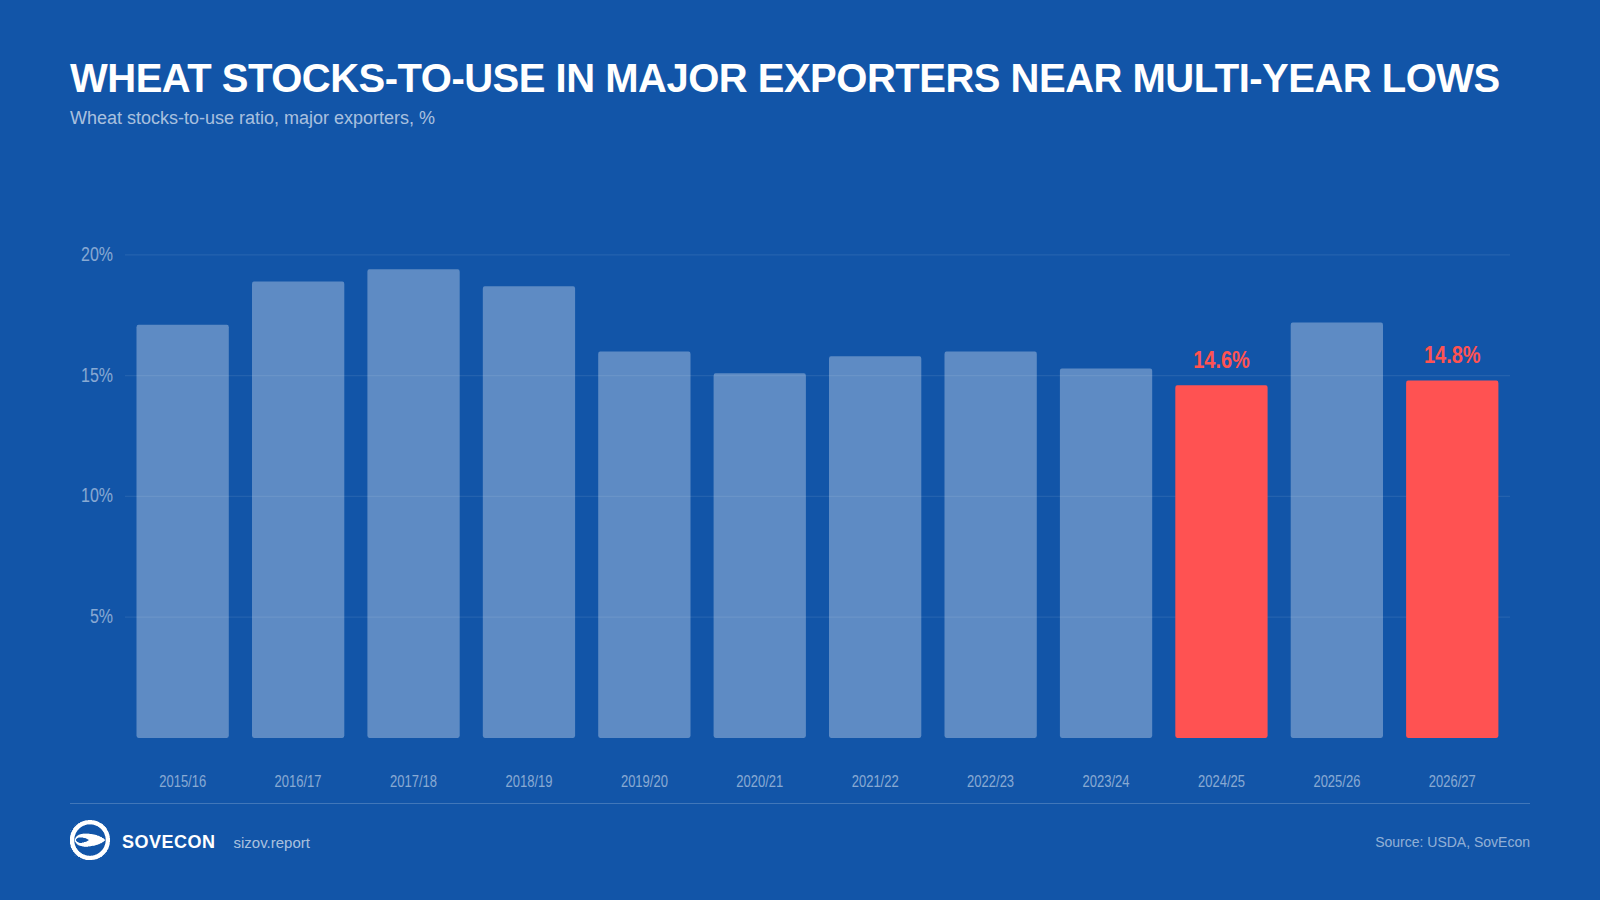
Below is a chart from the Black Sea guru Andrey Sizov that shows the stocks to use for the major wheat exporters around the world; we are still sitting at some of the tightest levels ever.
Which no doesn’t directly lead to higher prices.
Hence why we were at multi-year lows in 2024/25 price wise despite a tight situation.
But if you add on the possibility for the world's leading wheat exporter of Russia having their exports restricted, things could certainly get interesting.
The Russia story isn’t over yet. It could last for months. Nobody really knows.
But we do have to realize that once it's solved, the sell off after a Black Sea rally can be nasty. Which we've seen before.
We do also know that Ukraine is actively trying to find a solution.
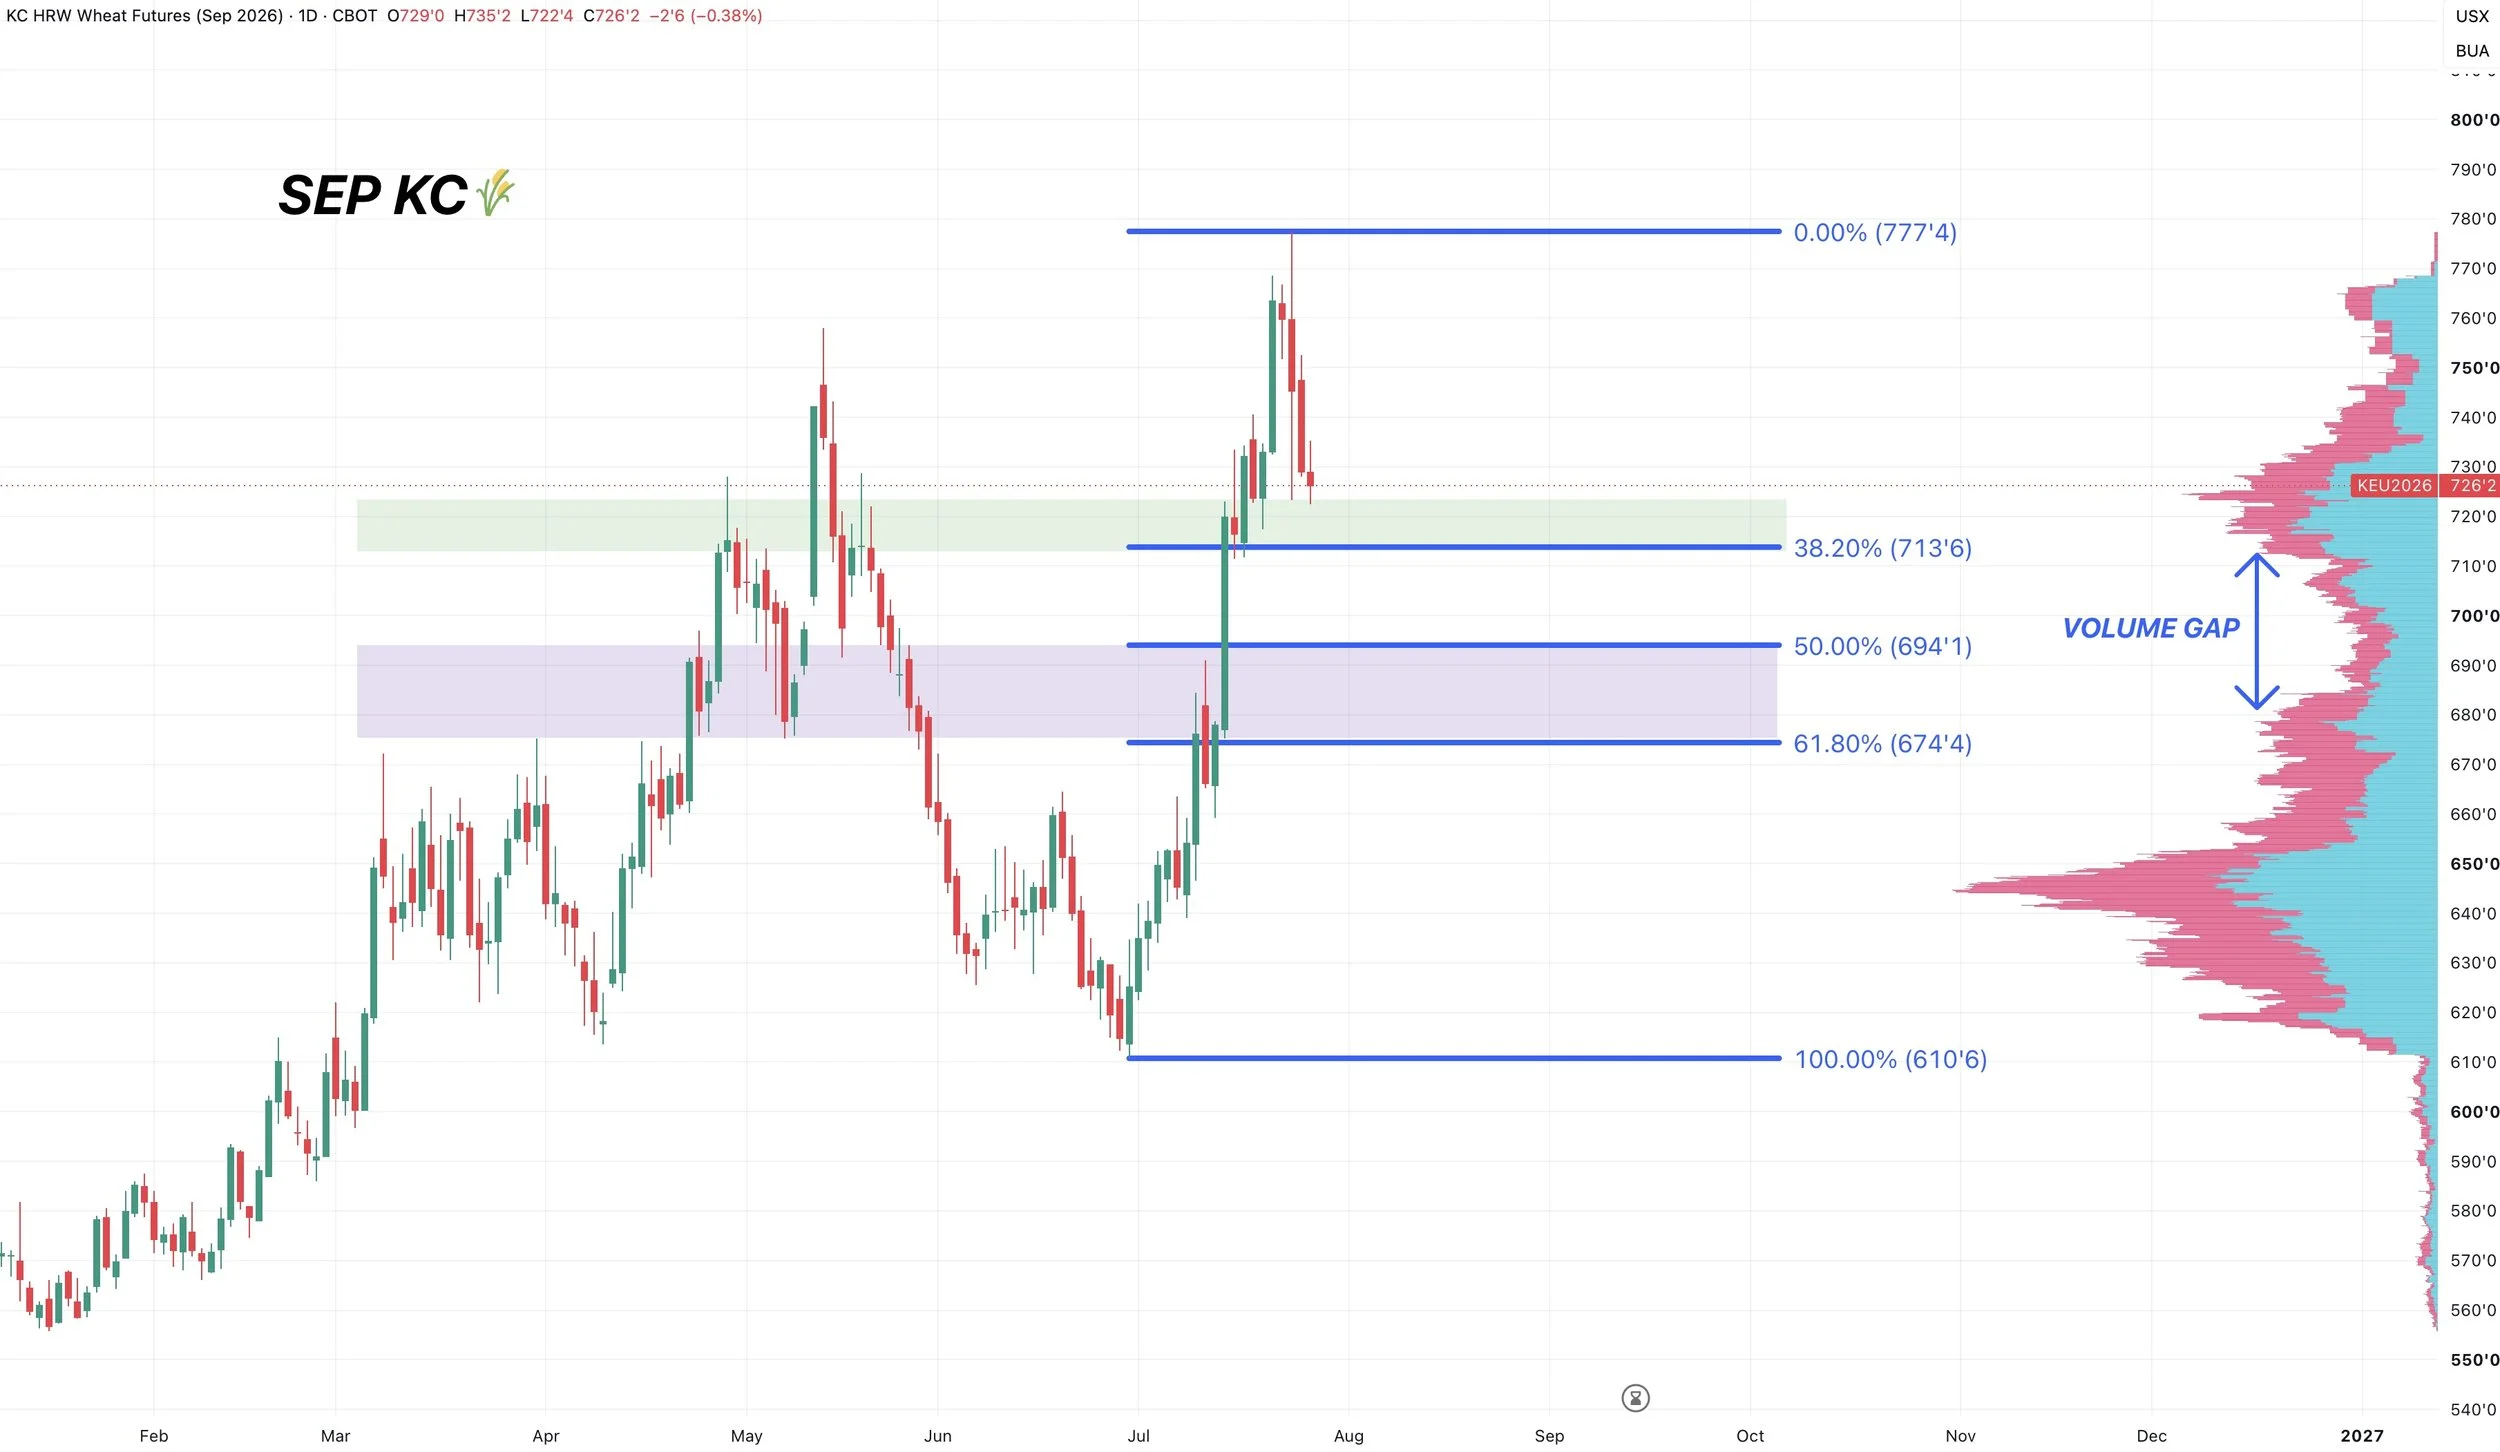
Sep KC Wheat Chart:
Bulls would like to see us hold the 38.2% retracement at $7.13
As below that there is a gap or air to the downside and very little volume.
So if it breaks, we could drop down into that golden zone which has offered support and resistance in the past.
Continuous Weekly Chart:
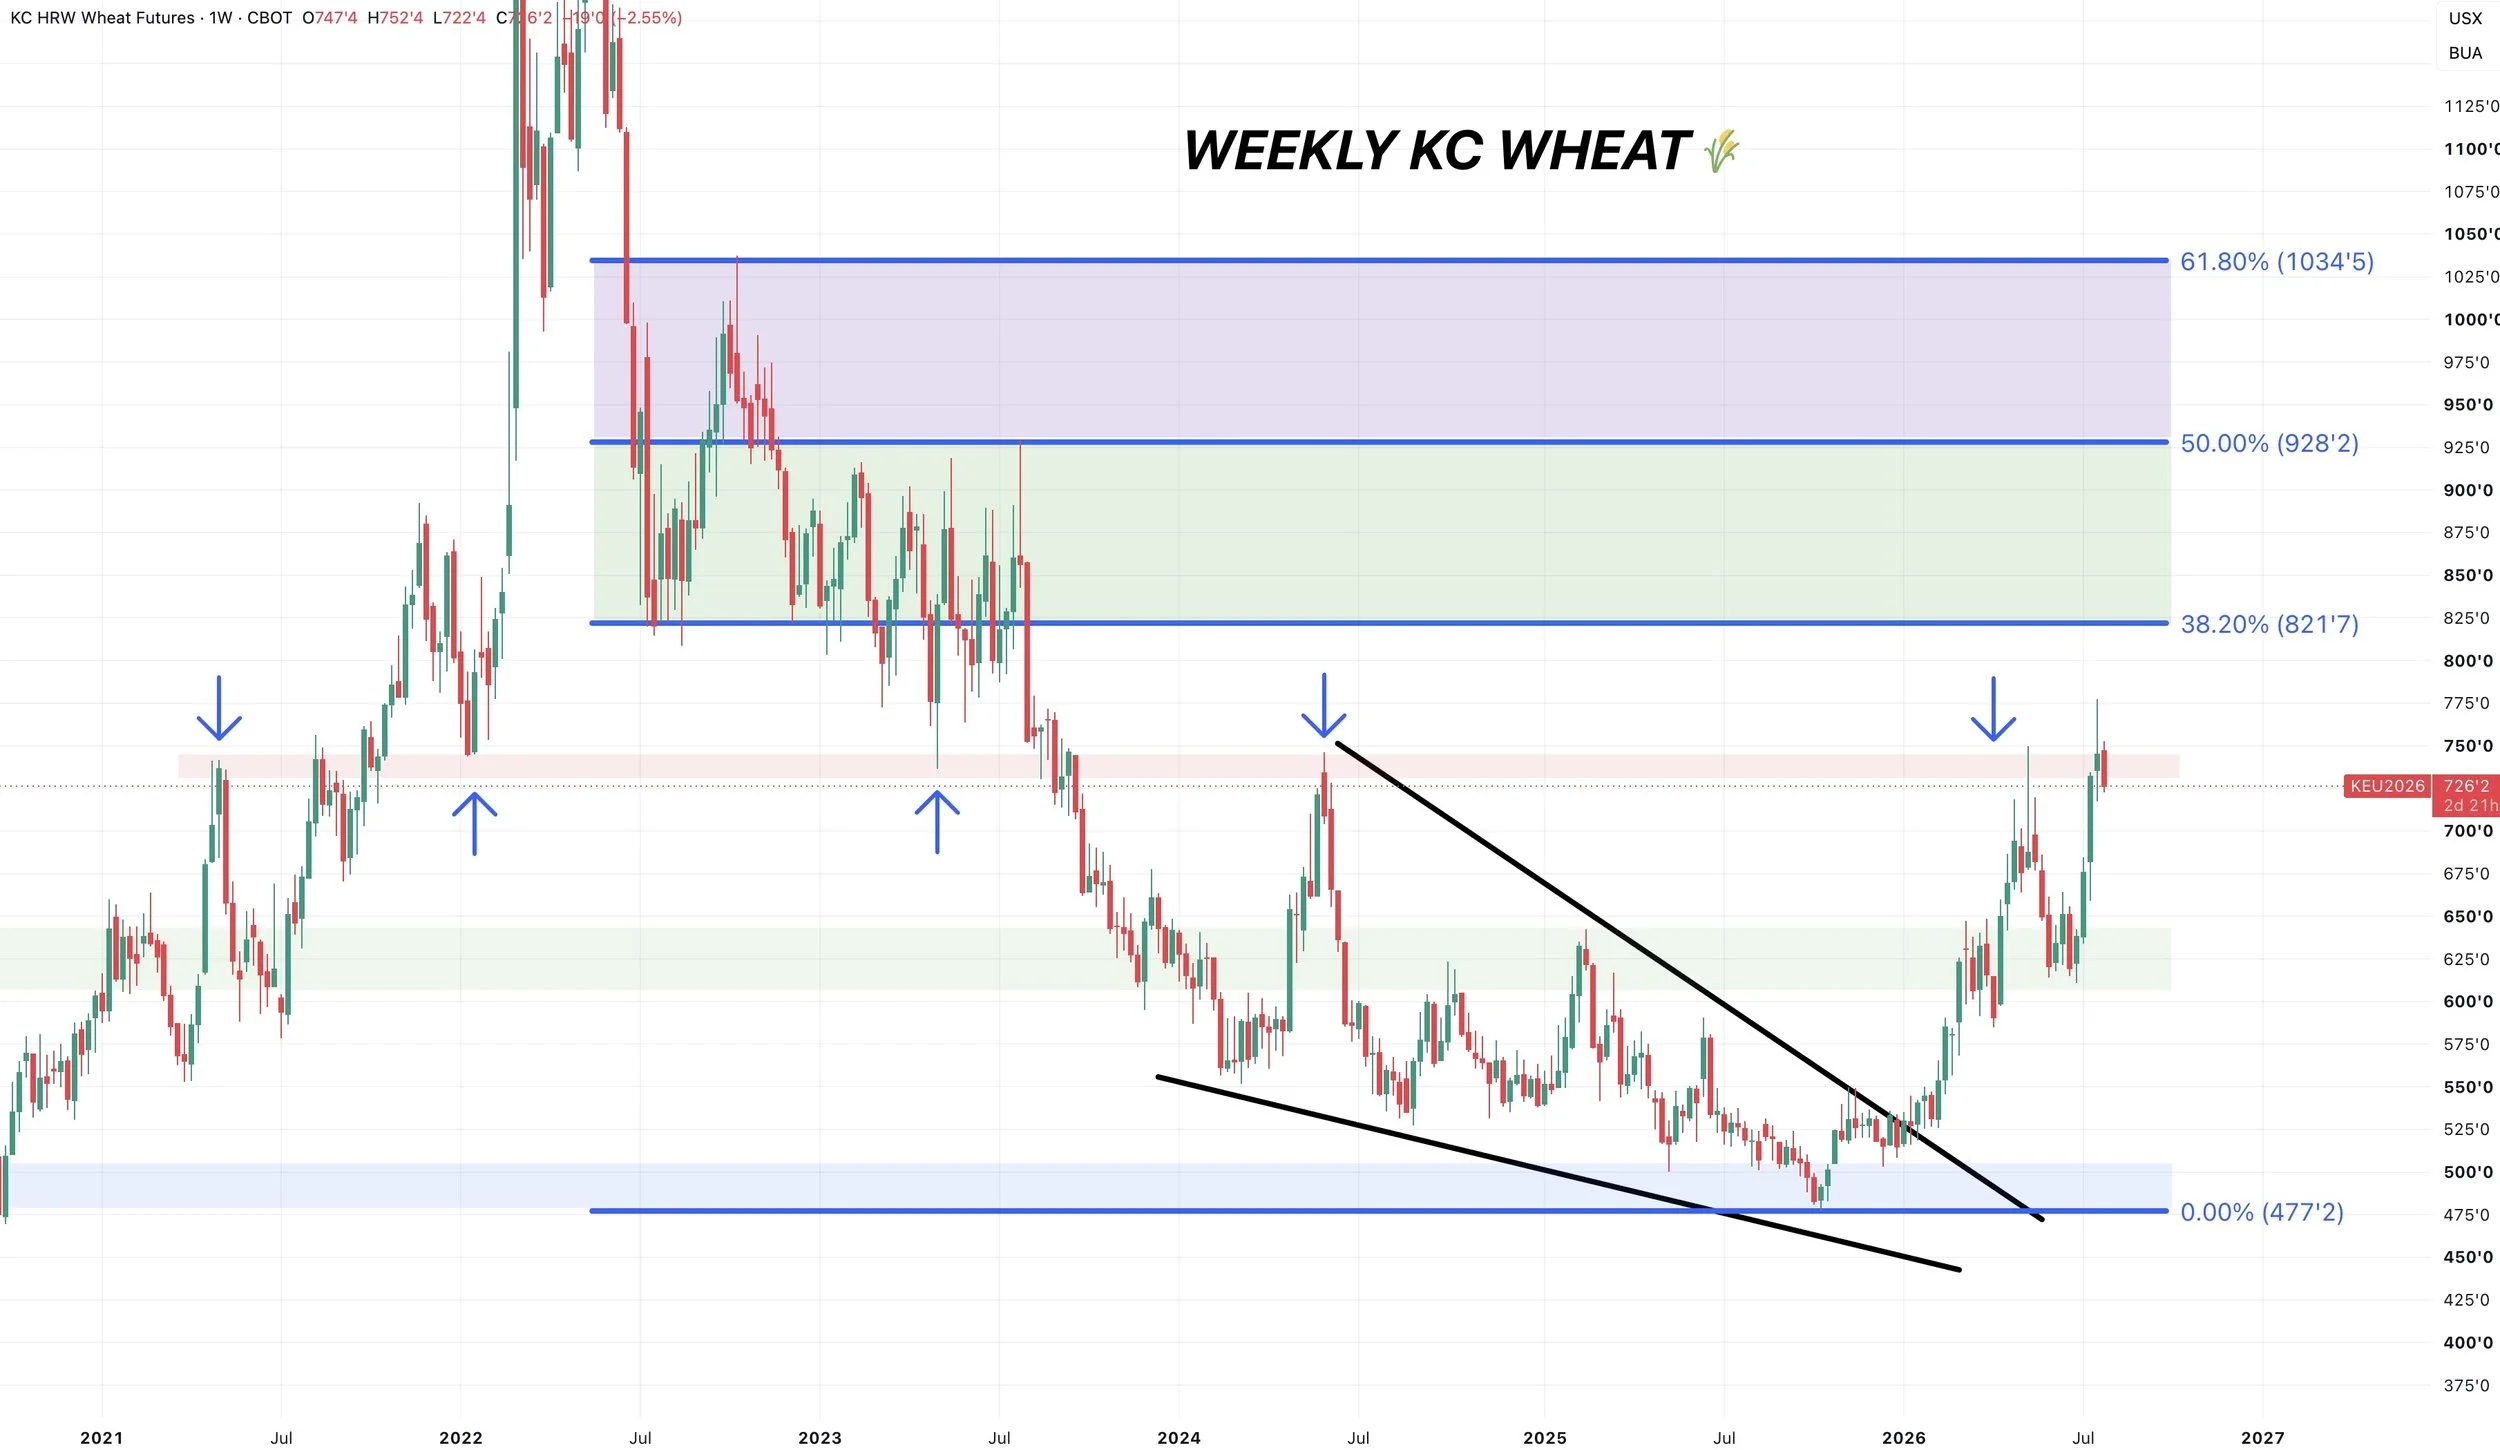
We have still yet to get a weekly close above this major high time frame resistance.
It's been a major pivot for wheat countless times.
The highs from 2024.
The lows from 2023.
The lows from 2022.
The highs from 2021.
Clear resistance for now. But if you are able to break above, it offers plenty of upside. Then you can start targeting some of those longer term targets from that 2022 to 2023 range.
Cattle
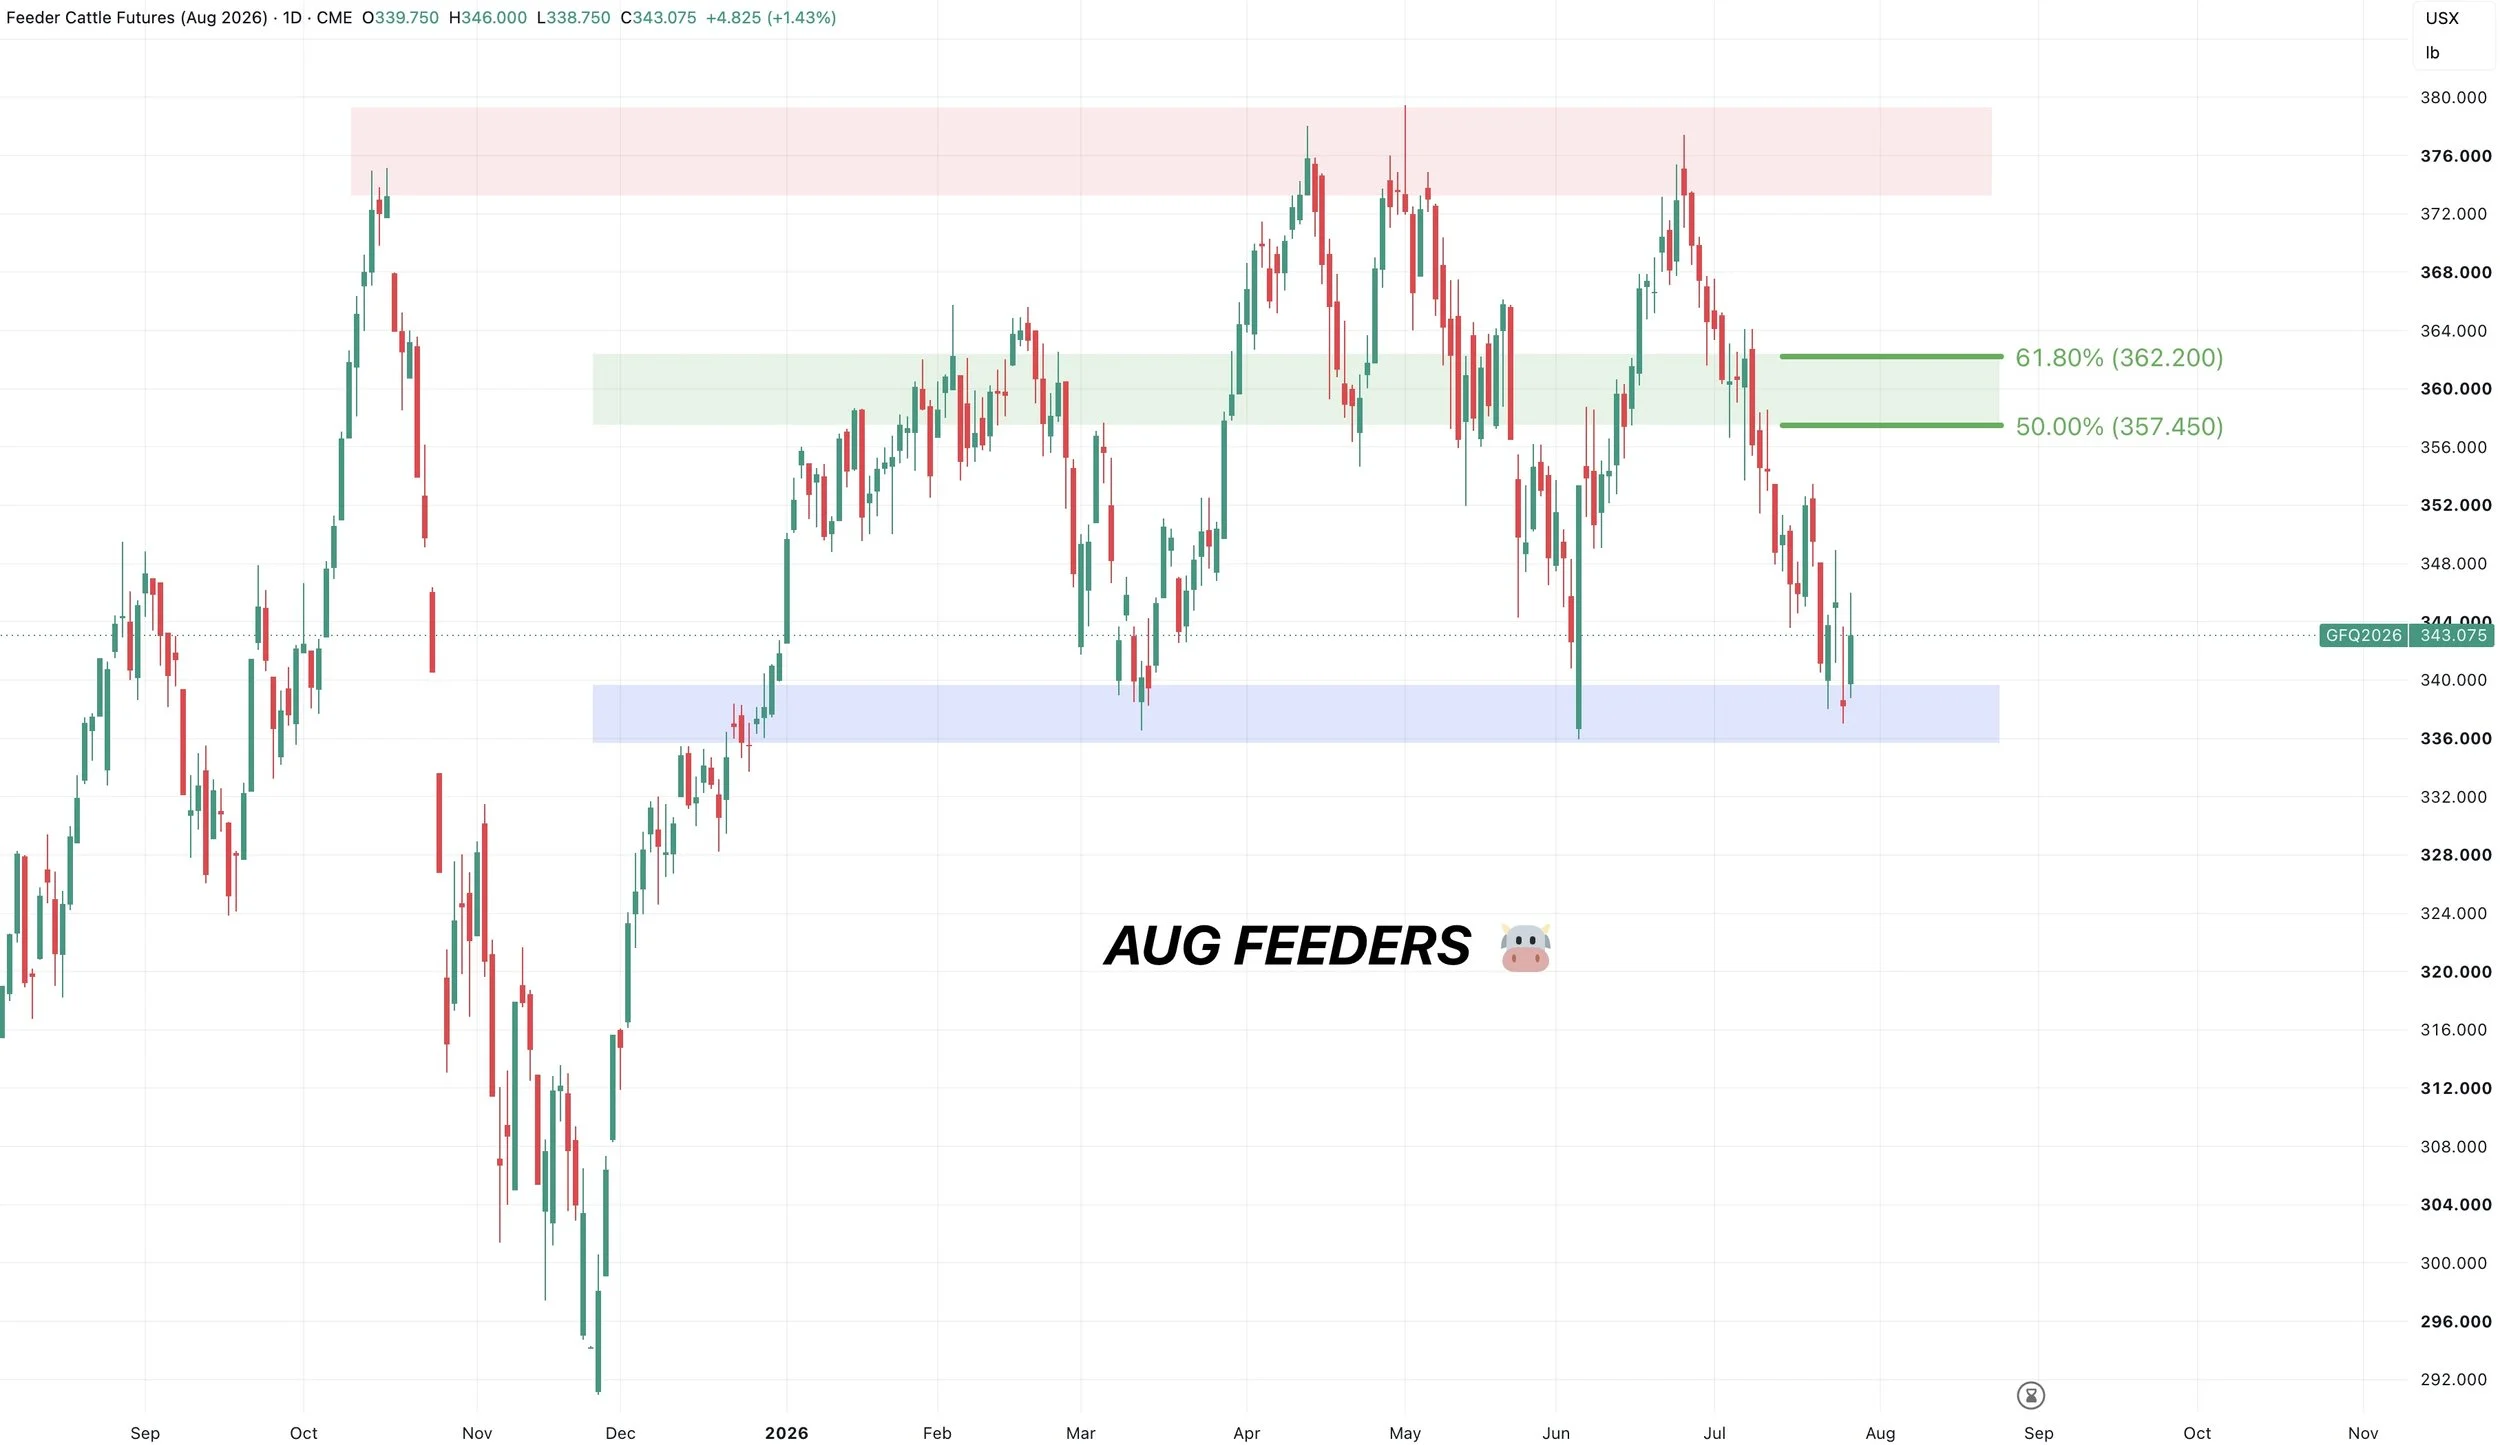
August Feeders Chart:
The border closed Friday, which led to weakness yesterday.
However, we bounced back nicely today.
As I'm sure someone knew that was coming. The market sold off going into that news, so it was probably partially priced in.
But overall, feeders continue to hold where they need to.
This is clear key support. If we are going to bounce, we want it to be here.
If it breaks, it would not be a good sign.
I'd still be looking to defend a move towards the golden zone if we get a bounce up there.
Aug Live Chart:
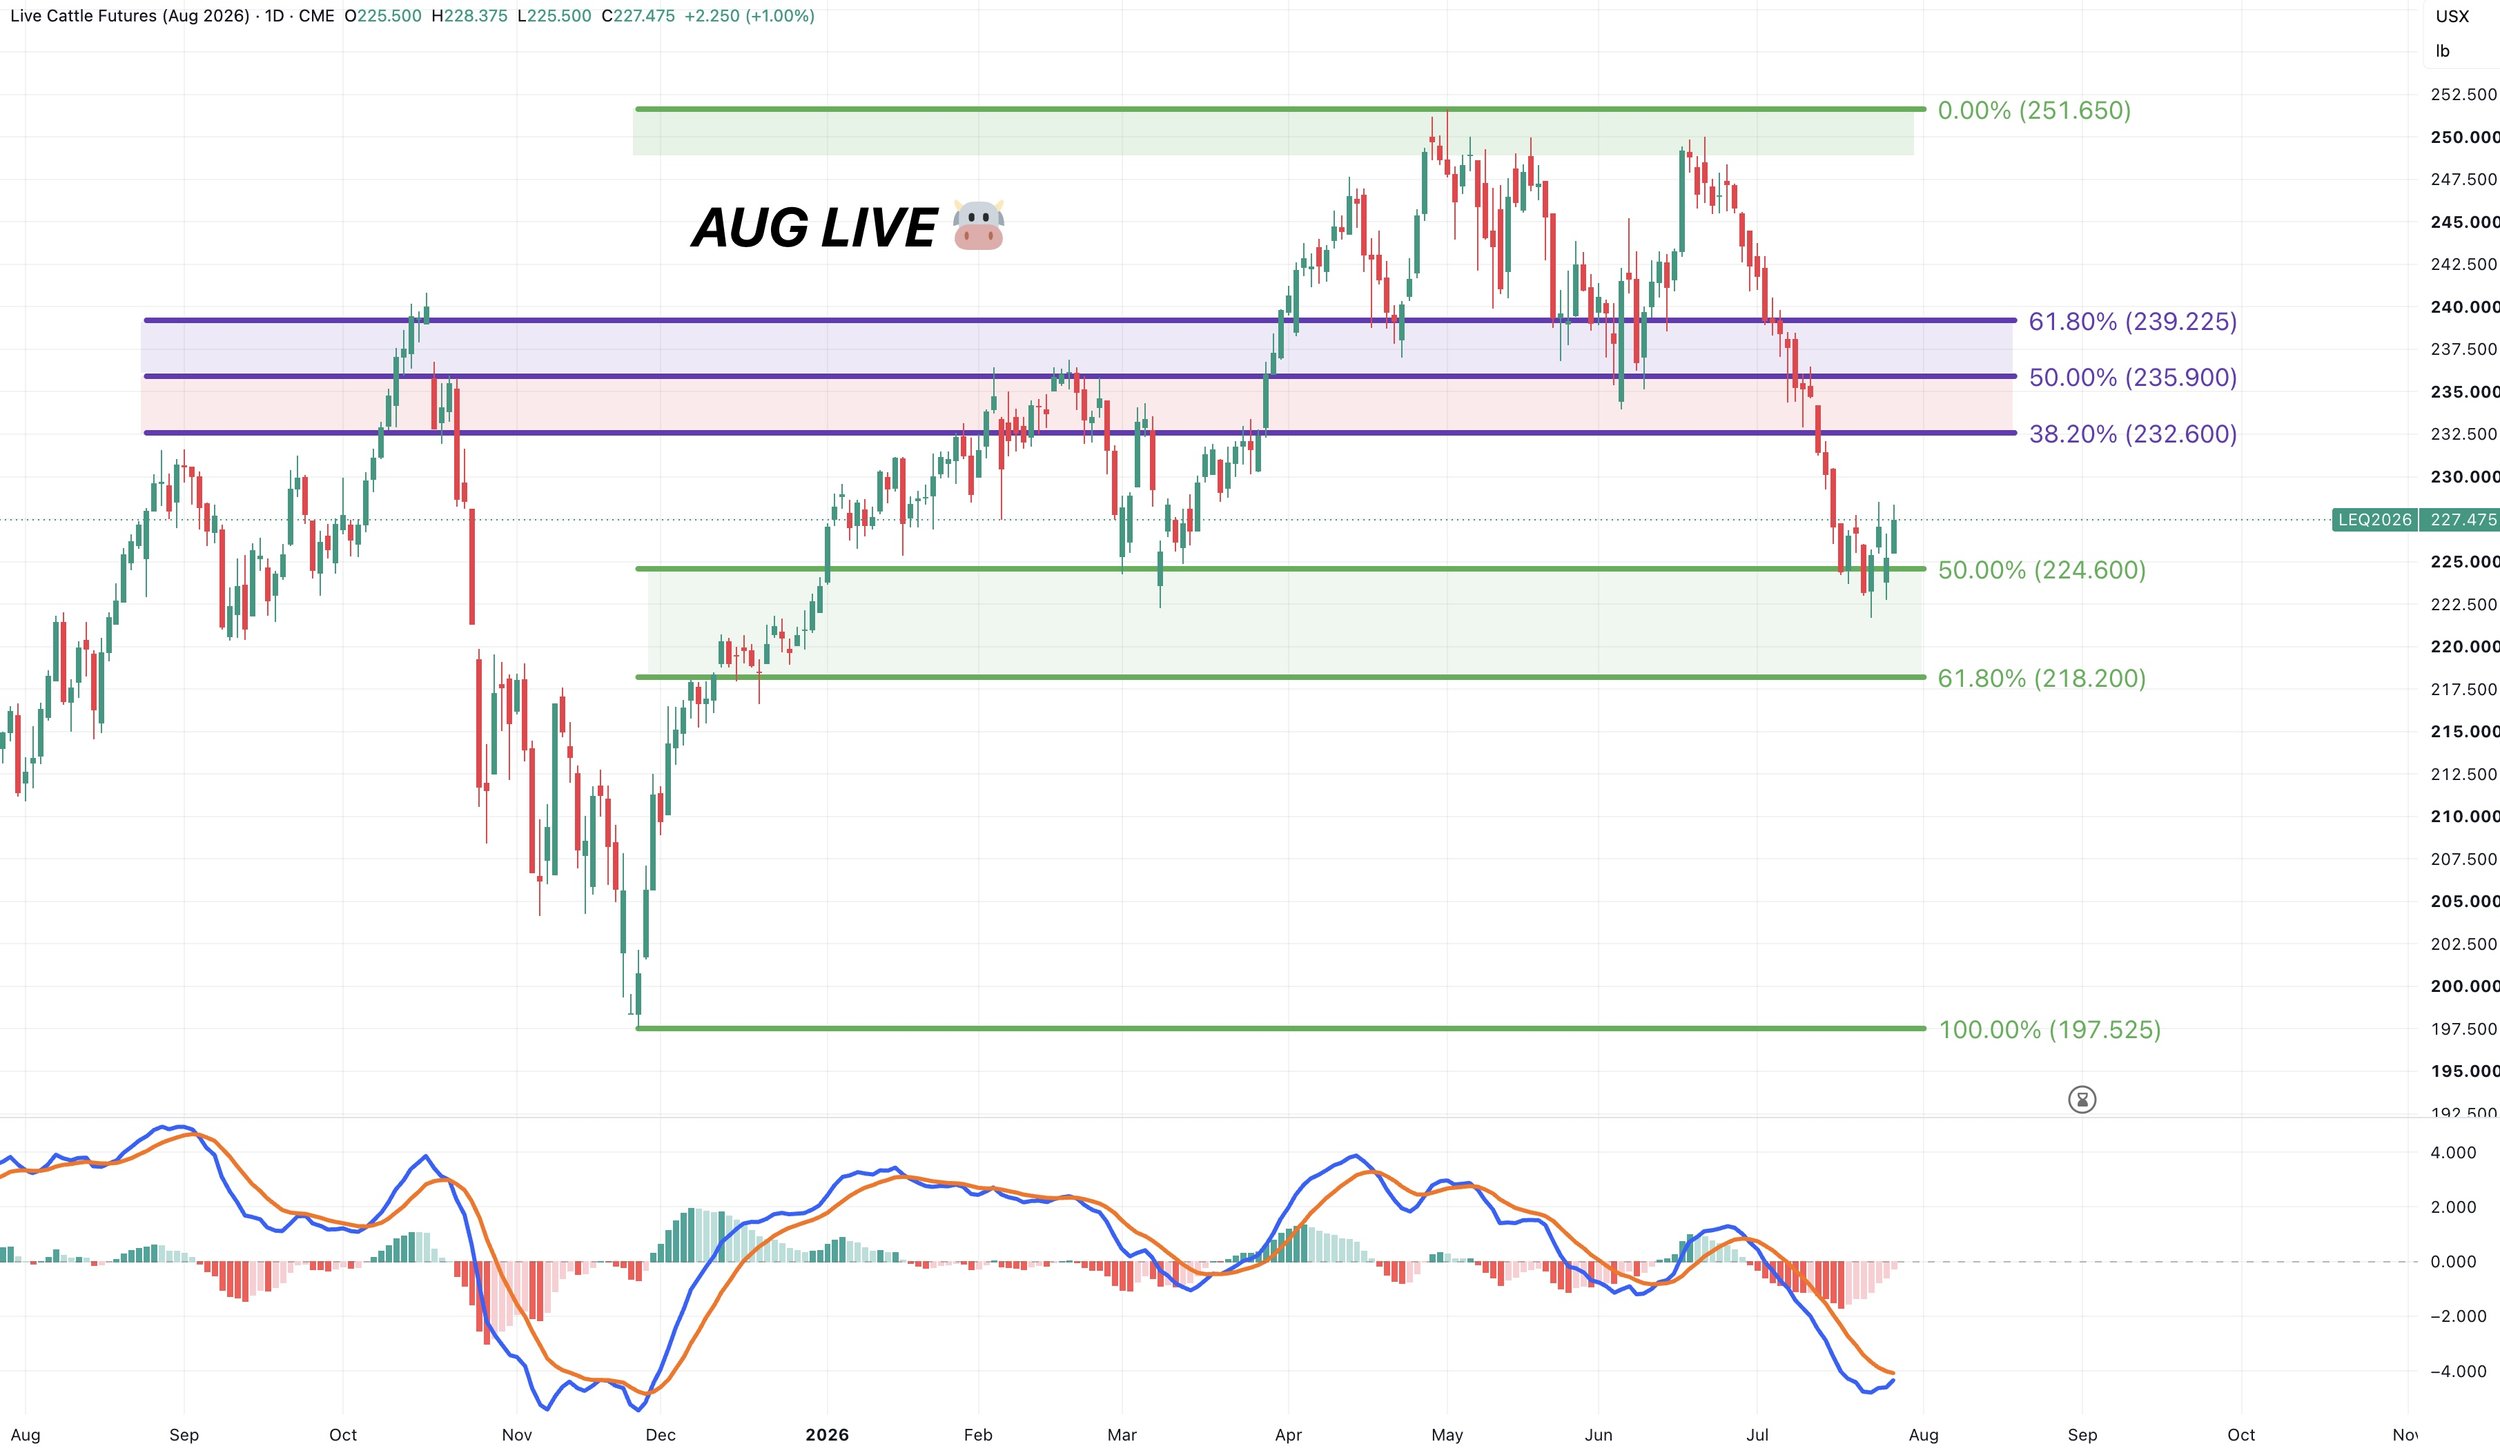
If we are able to claw back half of this sell off, I'd look to protect it.
On the flip side, if we lose that 61.8% retracement down to the December lows it would be bad news.
Something to note is that the MACD is close to crossing bullish. So we might finally be due for a bounce. As this suggest momentum may be trying to shift higher.
Want to Talk?
Our phones are open 24/7 for you guys if you ever need anything or want to discuss your operation.
Jeremey & Office: (806)484-1214
Sebastian: (605)280-1186
Email: sfrost@dailymarketminute.com
Hedge Account
Interested in a hedge account? Use the link below to set up an account or give us a call.