
MARKET UPDATE
You can scroll to read the usual update as well. As the written version is the exact same as the video.
Timestamps for video:
Overview: 0:00min
Corn: 3:15min
Corn Charts: 9:10min
Beans: 11:15min
Bean Charts: 14:00min
Wheat: 16:40min
Cattle: 18:30min
Want to talk?
Office: (806)484-1214
Futures Prices Close
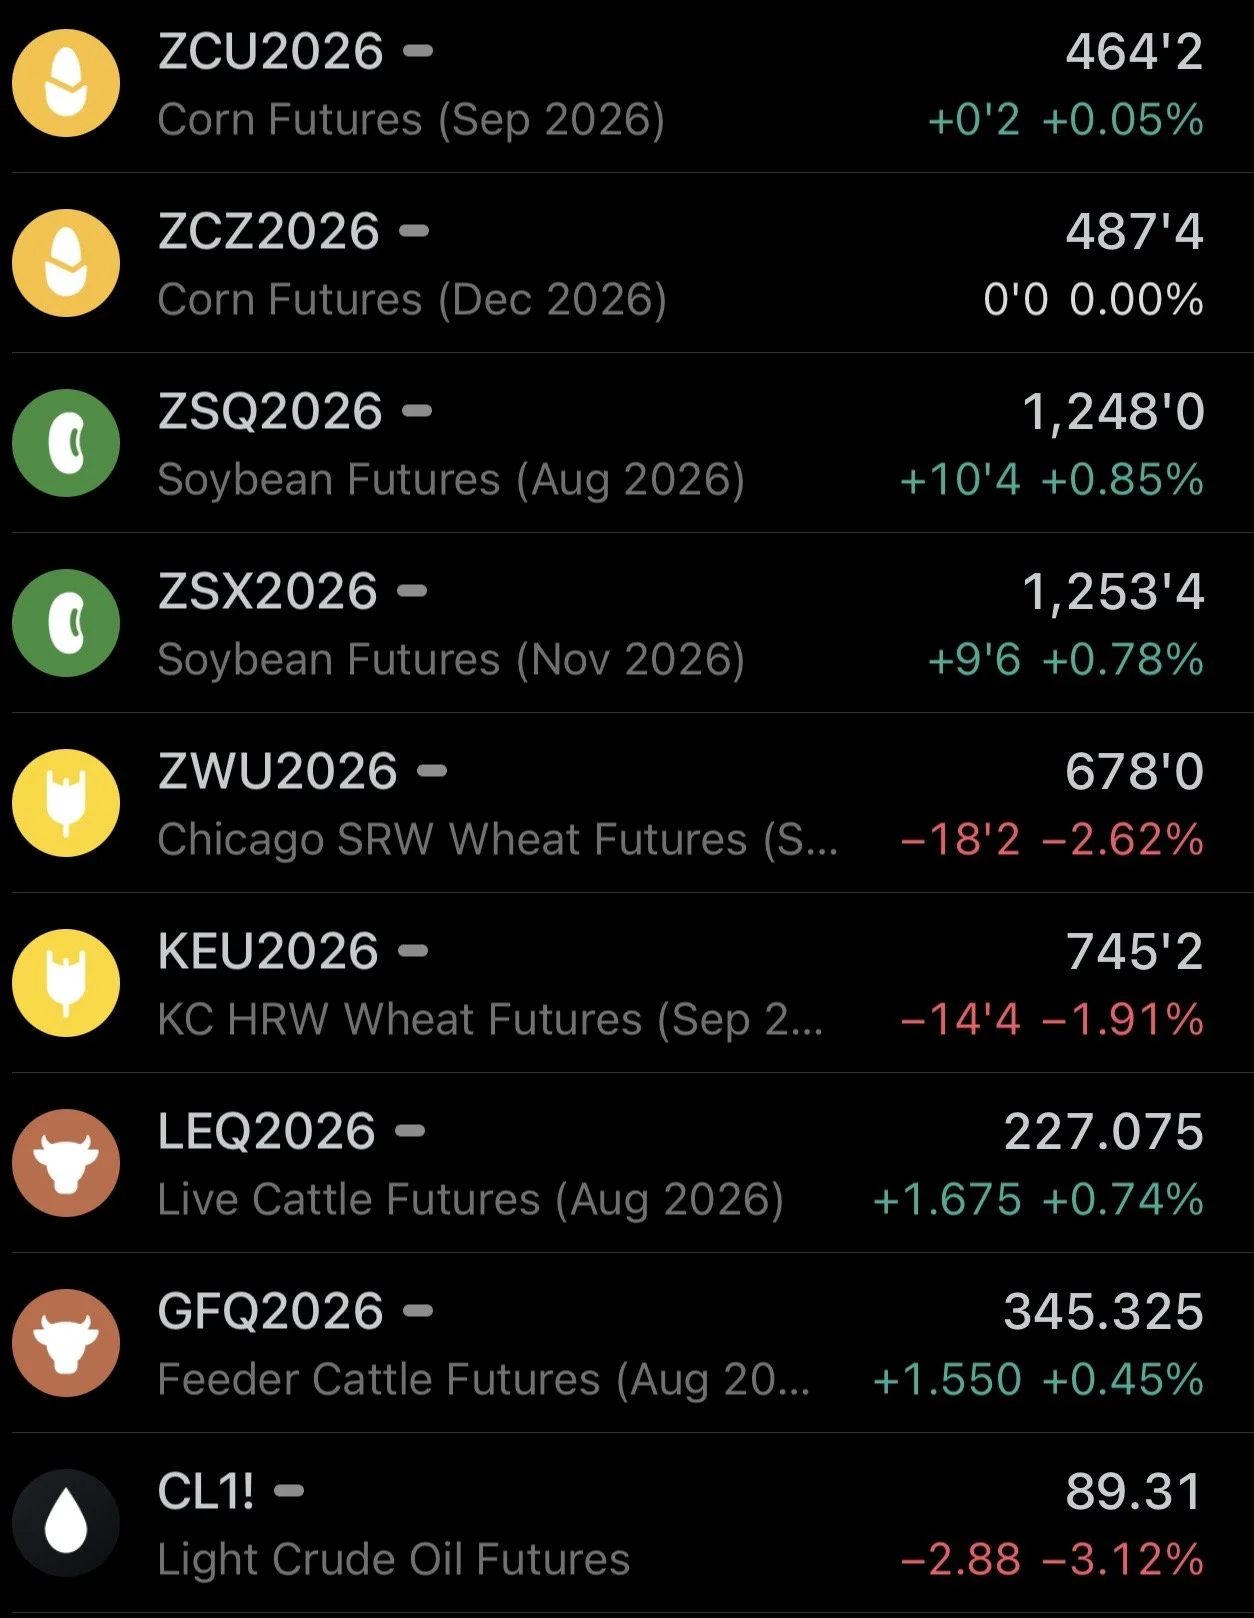
Overview
It was a pretty wild day across the grains. Overnight and early this morning we were screaming higher once again.
Overnight KC wheat was up +18 cents.
Then around 6am CT grains started to sell off heavily.
KC wheat then at one point was trading -36 cents lower on the day. Which is a massive -54 cent swing off the overnight highs. We then rallied +23 cents off the lows to close down -15 on the day.
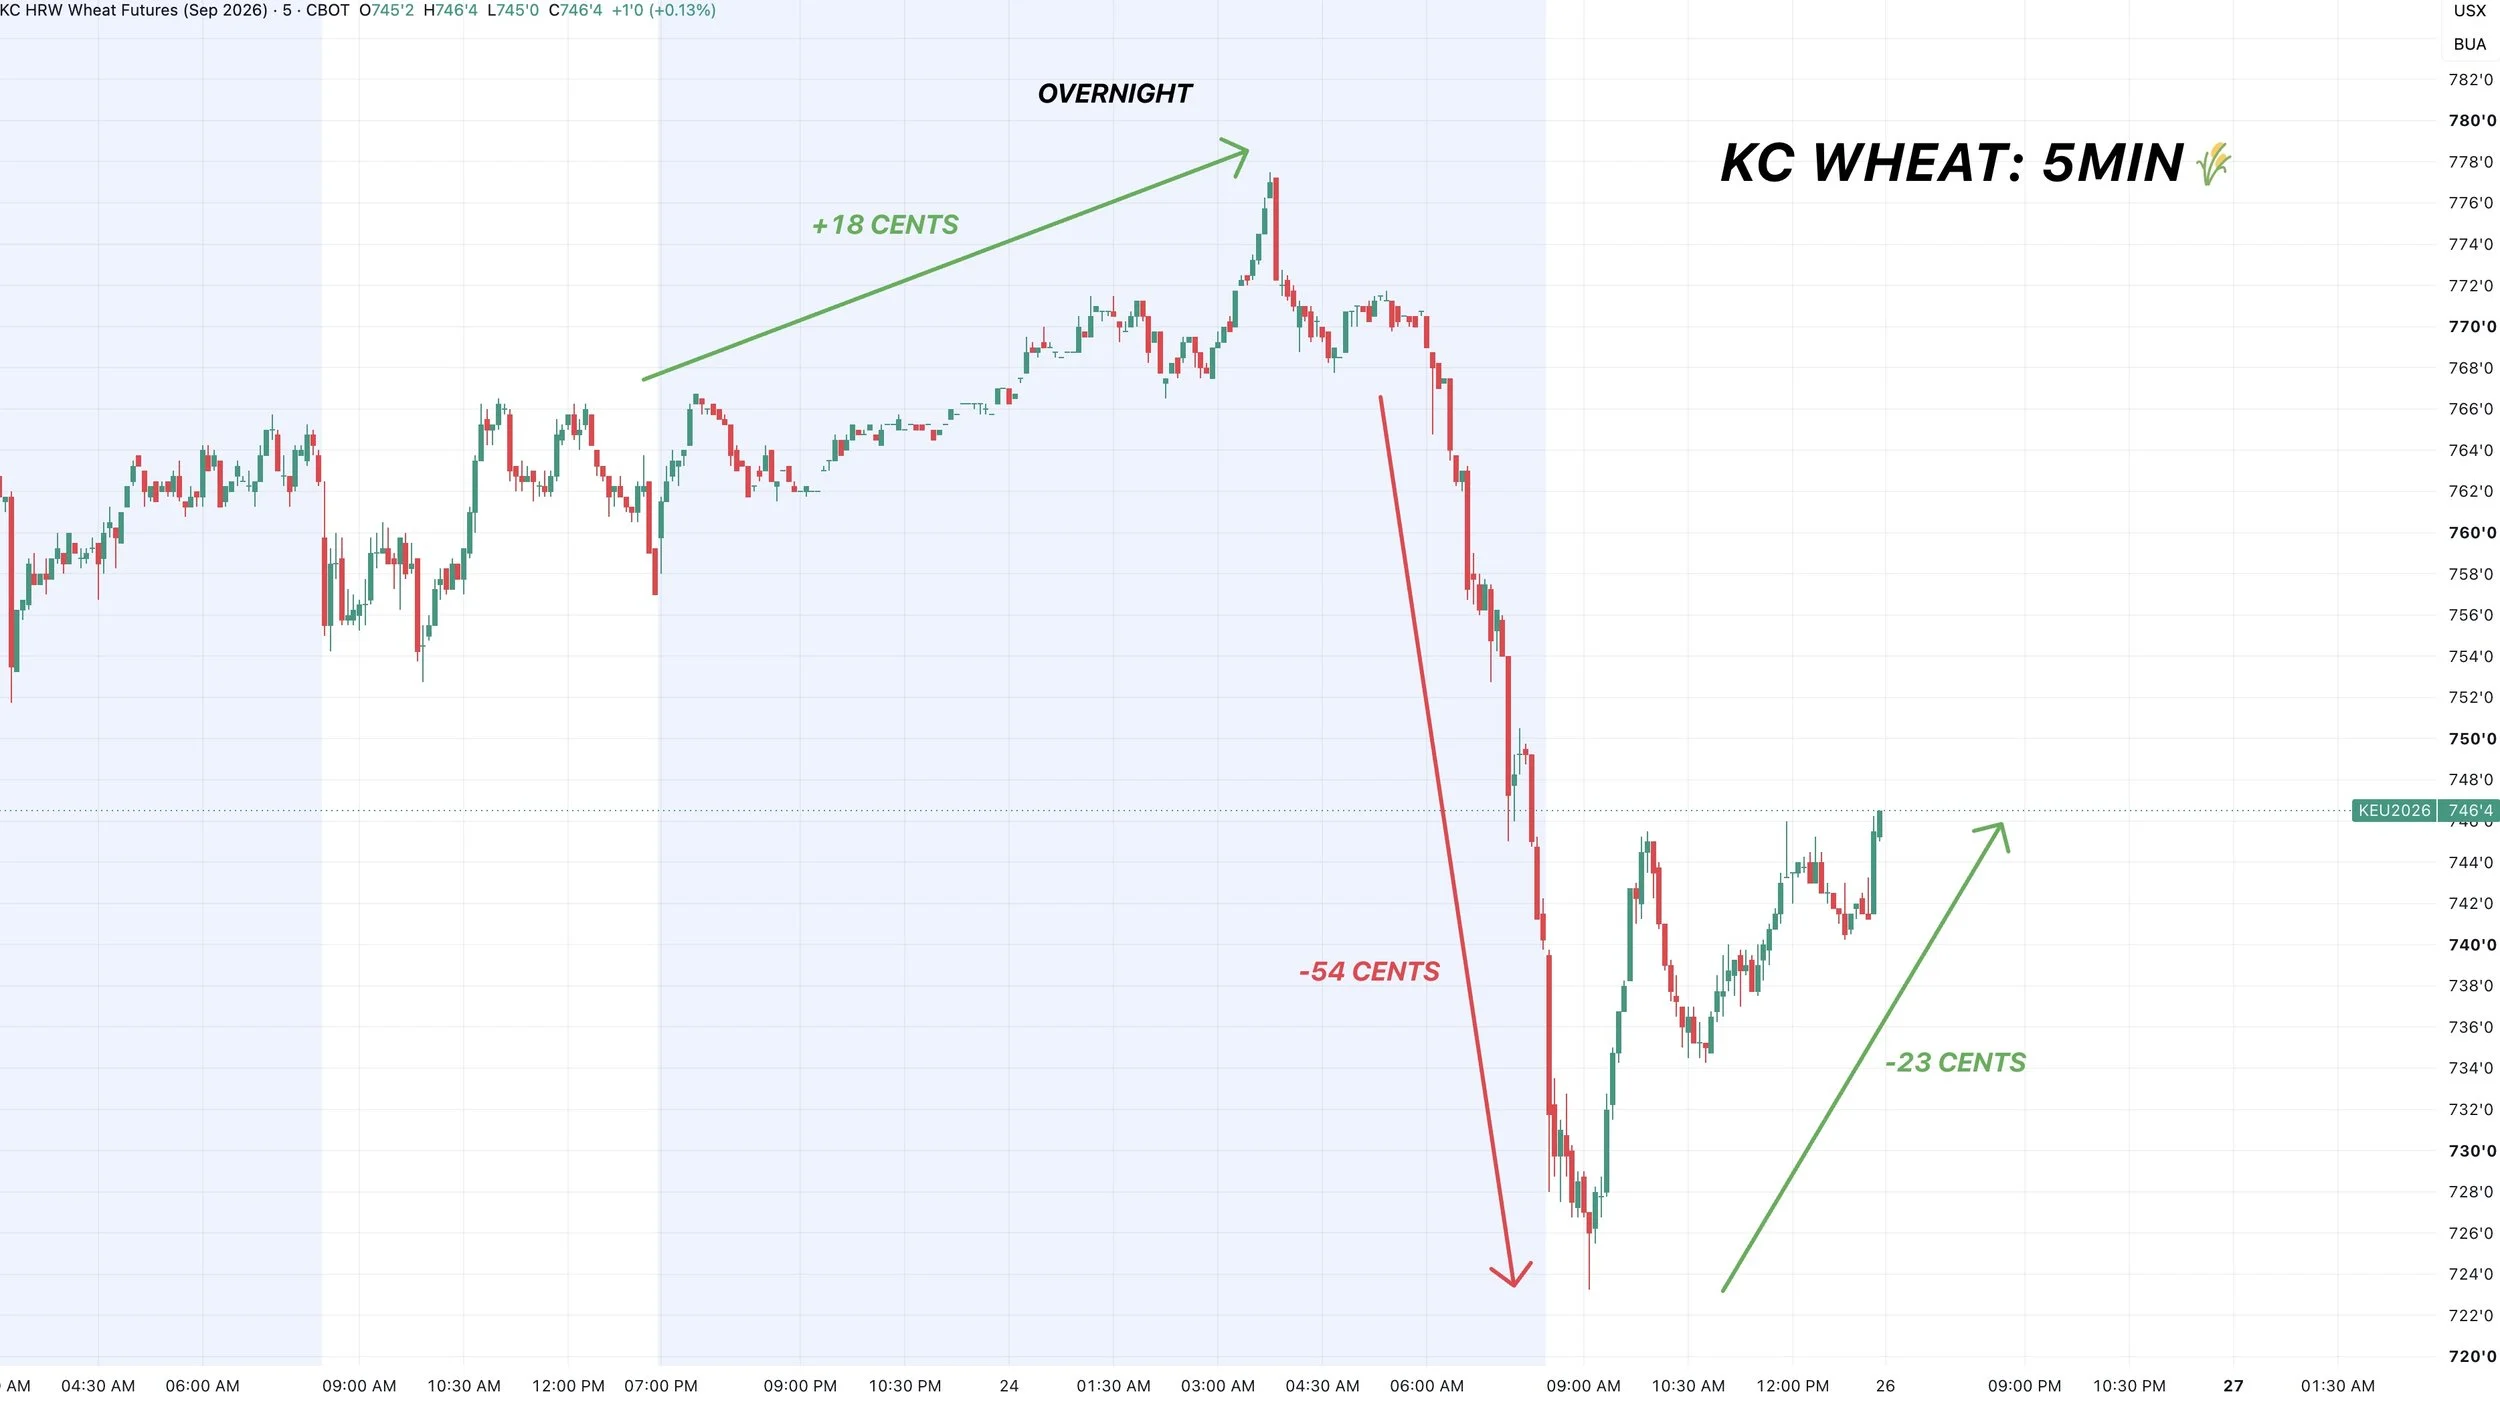
So what happened?
We saw some headlines out of the Black Sea. In a headline driven market, headlines can change immediately and cause the markets to flip immediately.
Yesterday it was reported that Russia is offering to subsidize rail transport of grains to alternate ports in attempt to keep exports flowing.
The market has been rallying on the idea that Russia's exports could be restricted. So if the exports are not able to flow, the market gives back some of that premium and concern.
Who knows how big of a difference this will actually make, and this doesn’t solve the problem entirely. As you can’t re-route absolutely everything.
However, it does show that they are actively trying to find a solution to the problem.
The bigger headline and actual reason for the sell off was this piece of news this morning.
Reports say that the US and Ukraine are working on a proposal to present to Russia in an attempt to restore the Black Sea trade and get exports moving.
So it looks like Ukraine is trying to find a way to keep vessels moving through the Black Sea.

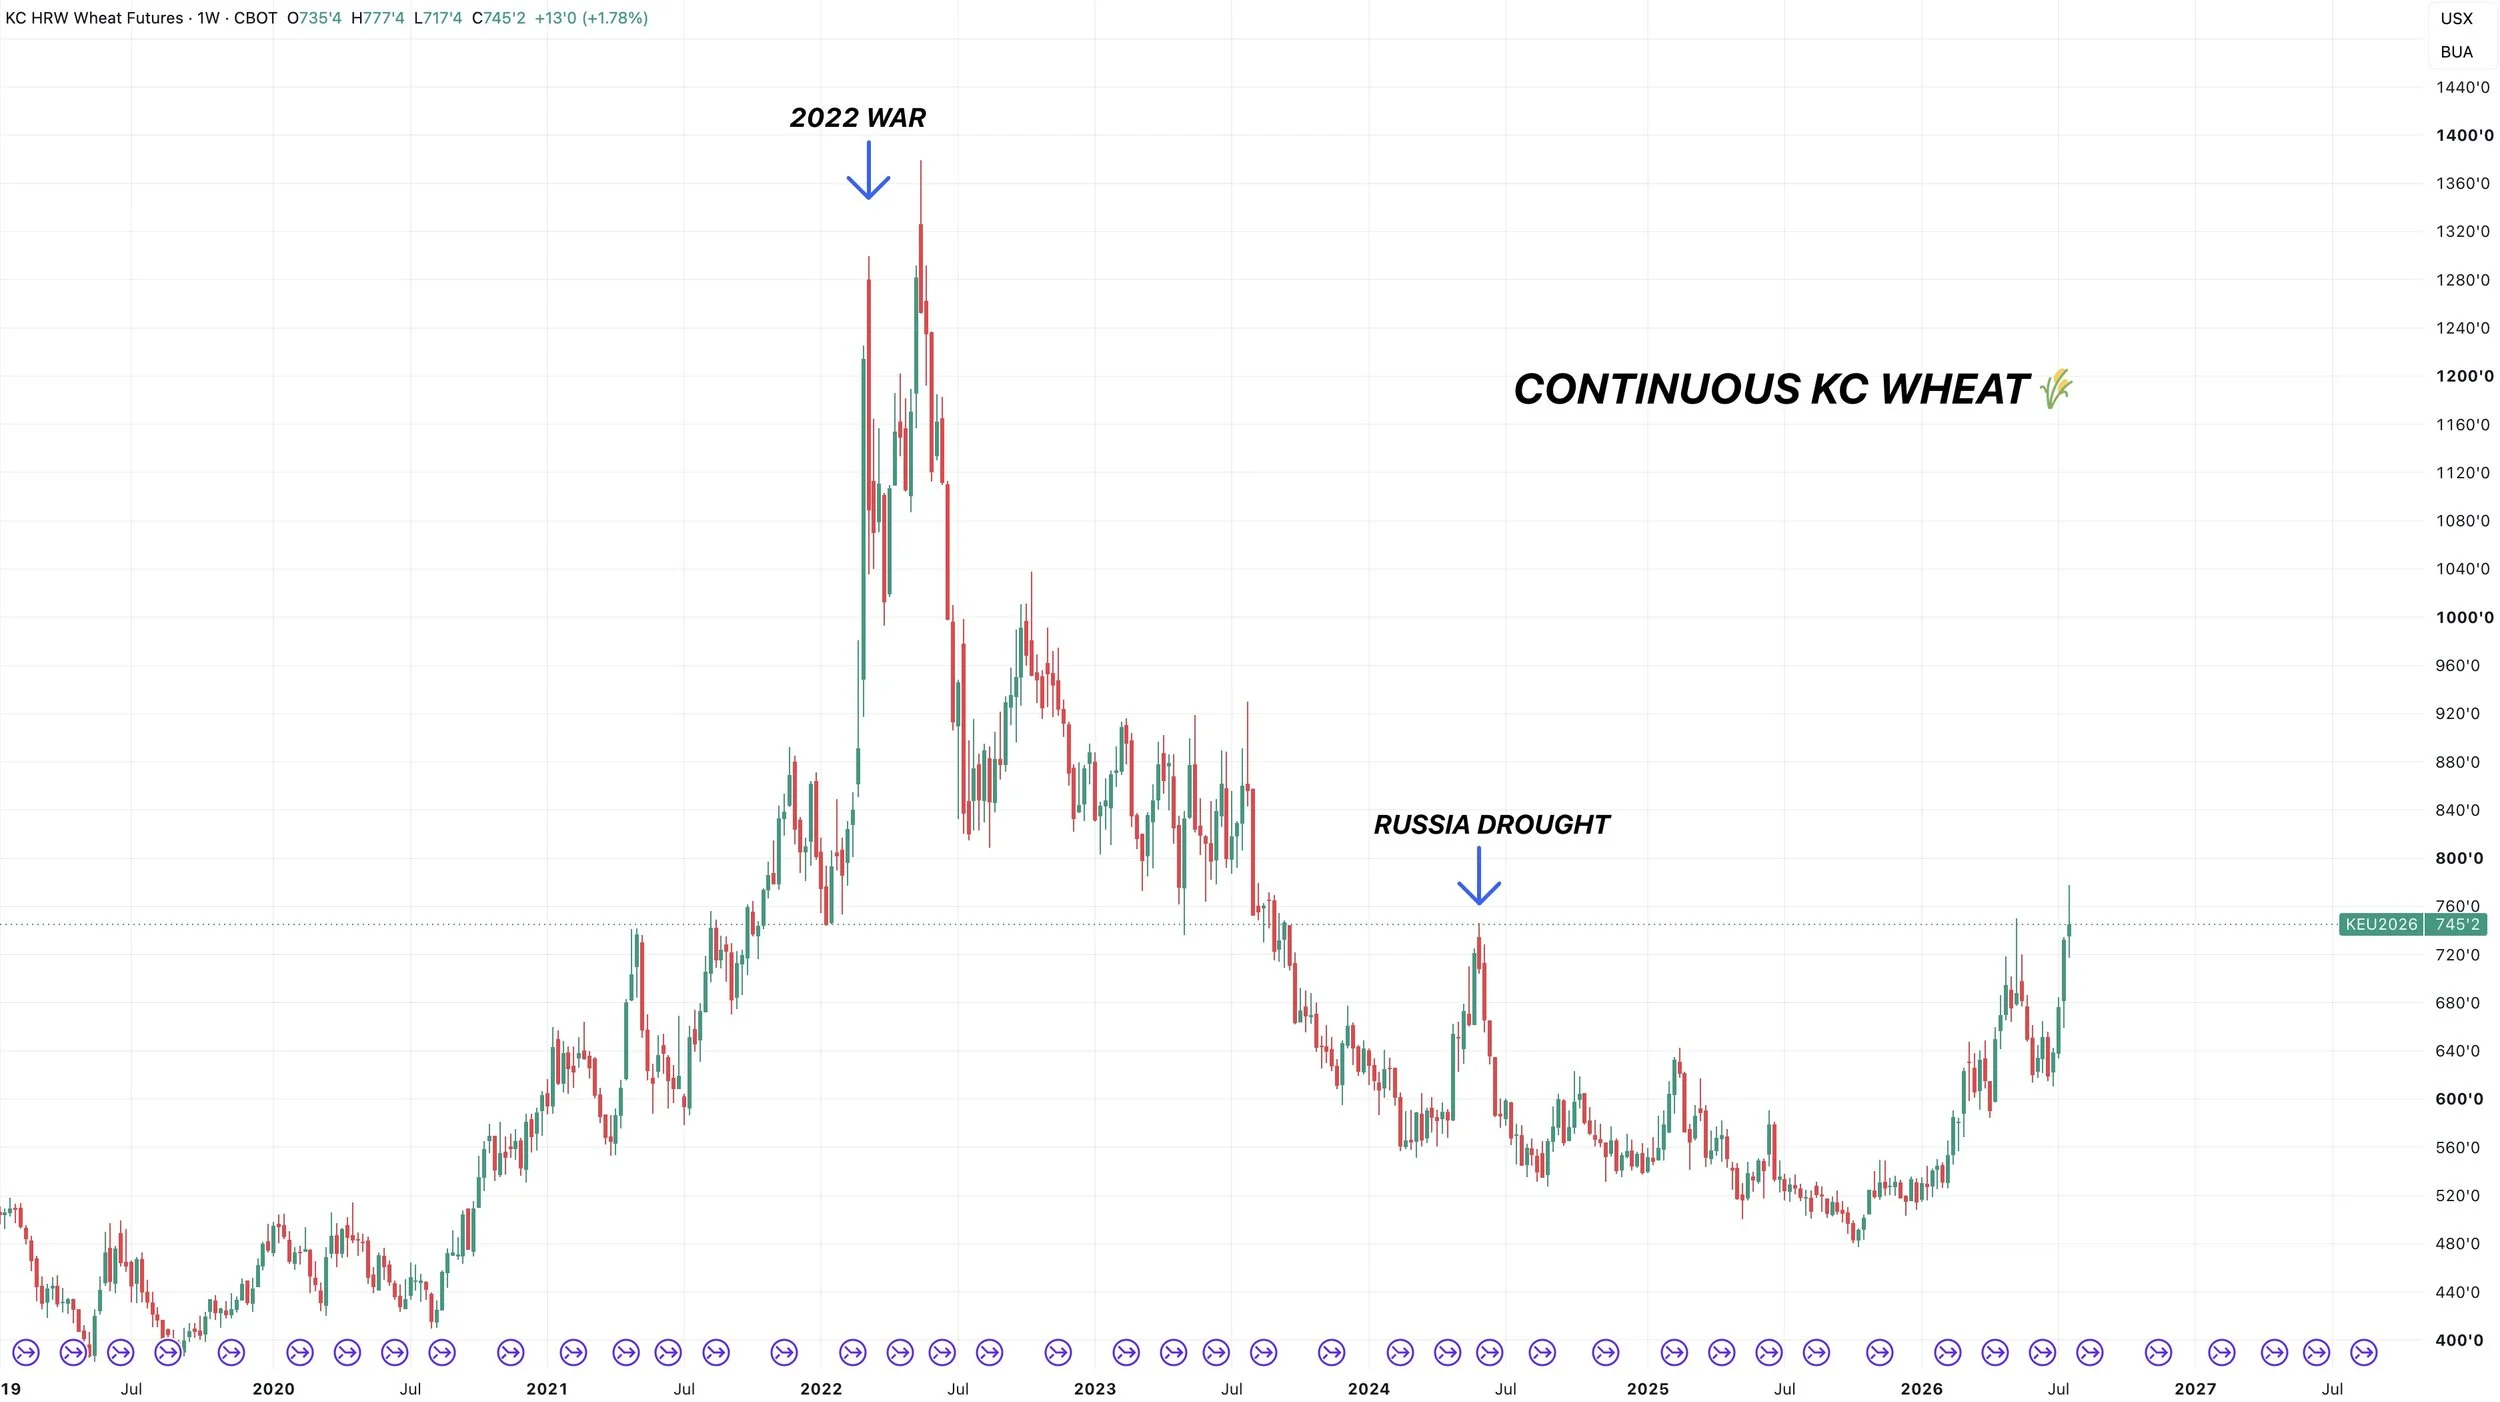
Every major rally in wheat has came from the Black Sea.
2022 was the Russia and Ukraine war.
The May 2024 rally was a frost scare in Russia.
Now we have the attacks and restrictions on exports in the Black Sea.
If this issue continues, and if exports remain restricted, there is no telling just how high this market can go. Because if the physical flow of exports continues to be restricted, wheat should go higher.
However.. we do need to be very aware that Black Sea rallies can reverse hard and fast when they decide to do so.
All it really takes it one headline.
Take 2022 for example.
The wheat market rallied $3.00 in 15 days.
The wheat market then fall -$5.50 over the course of the next 50 days.
We all saw what happened to crude oil and the Strait of Hormuz. If things stay closed it could get really interesting. But if things start to look like they are resolving, it could result in a nasty sell off.
So that is something you just have to be aware of. There is plenty of headline risk to both sides.
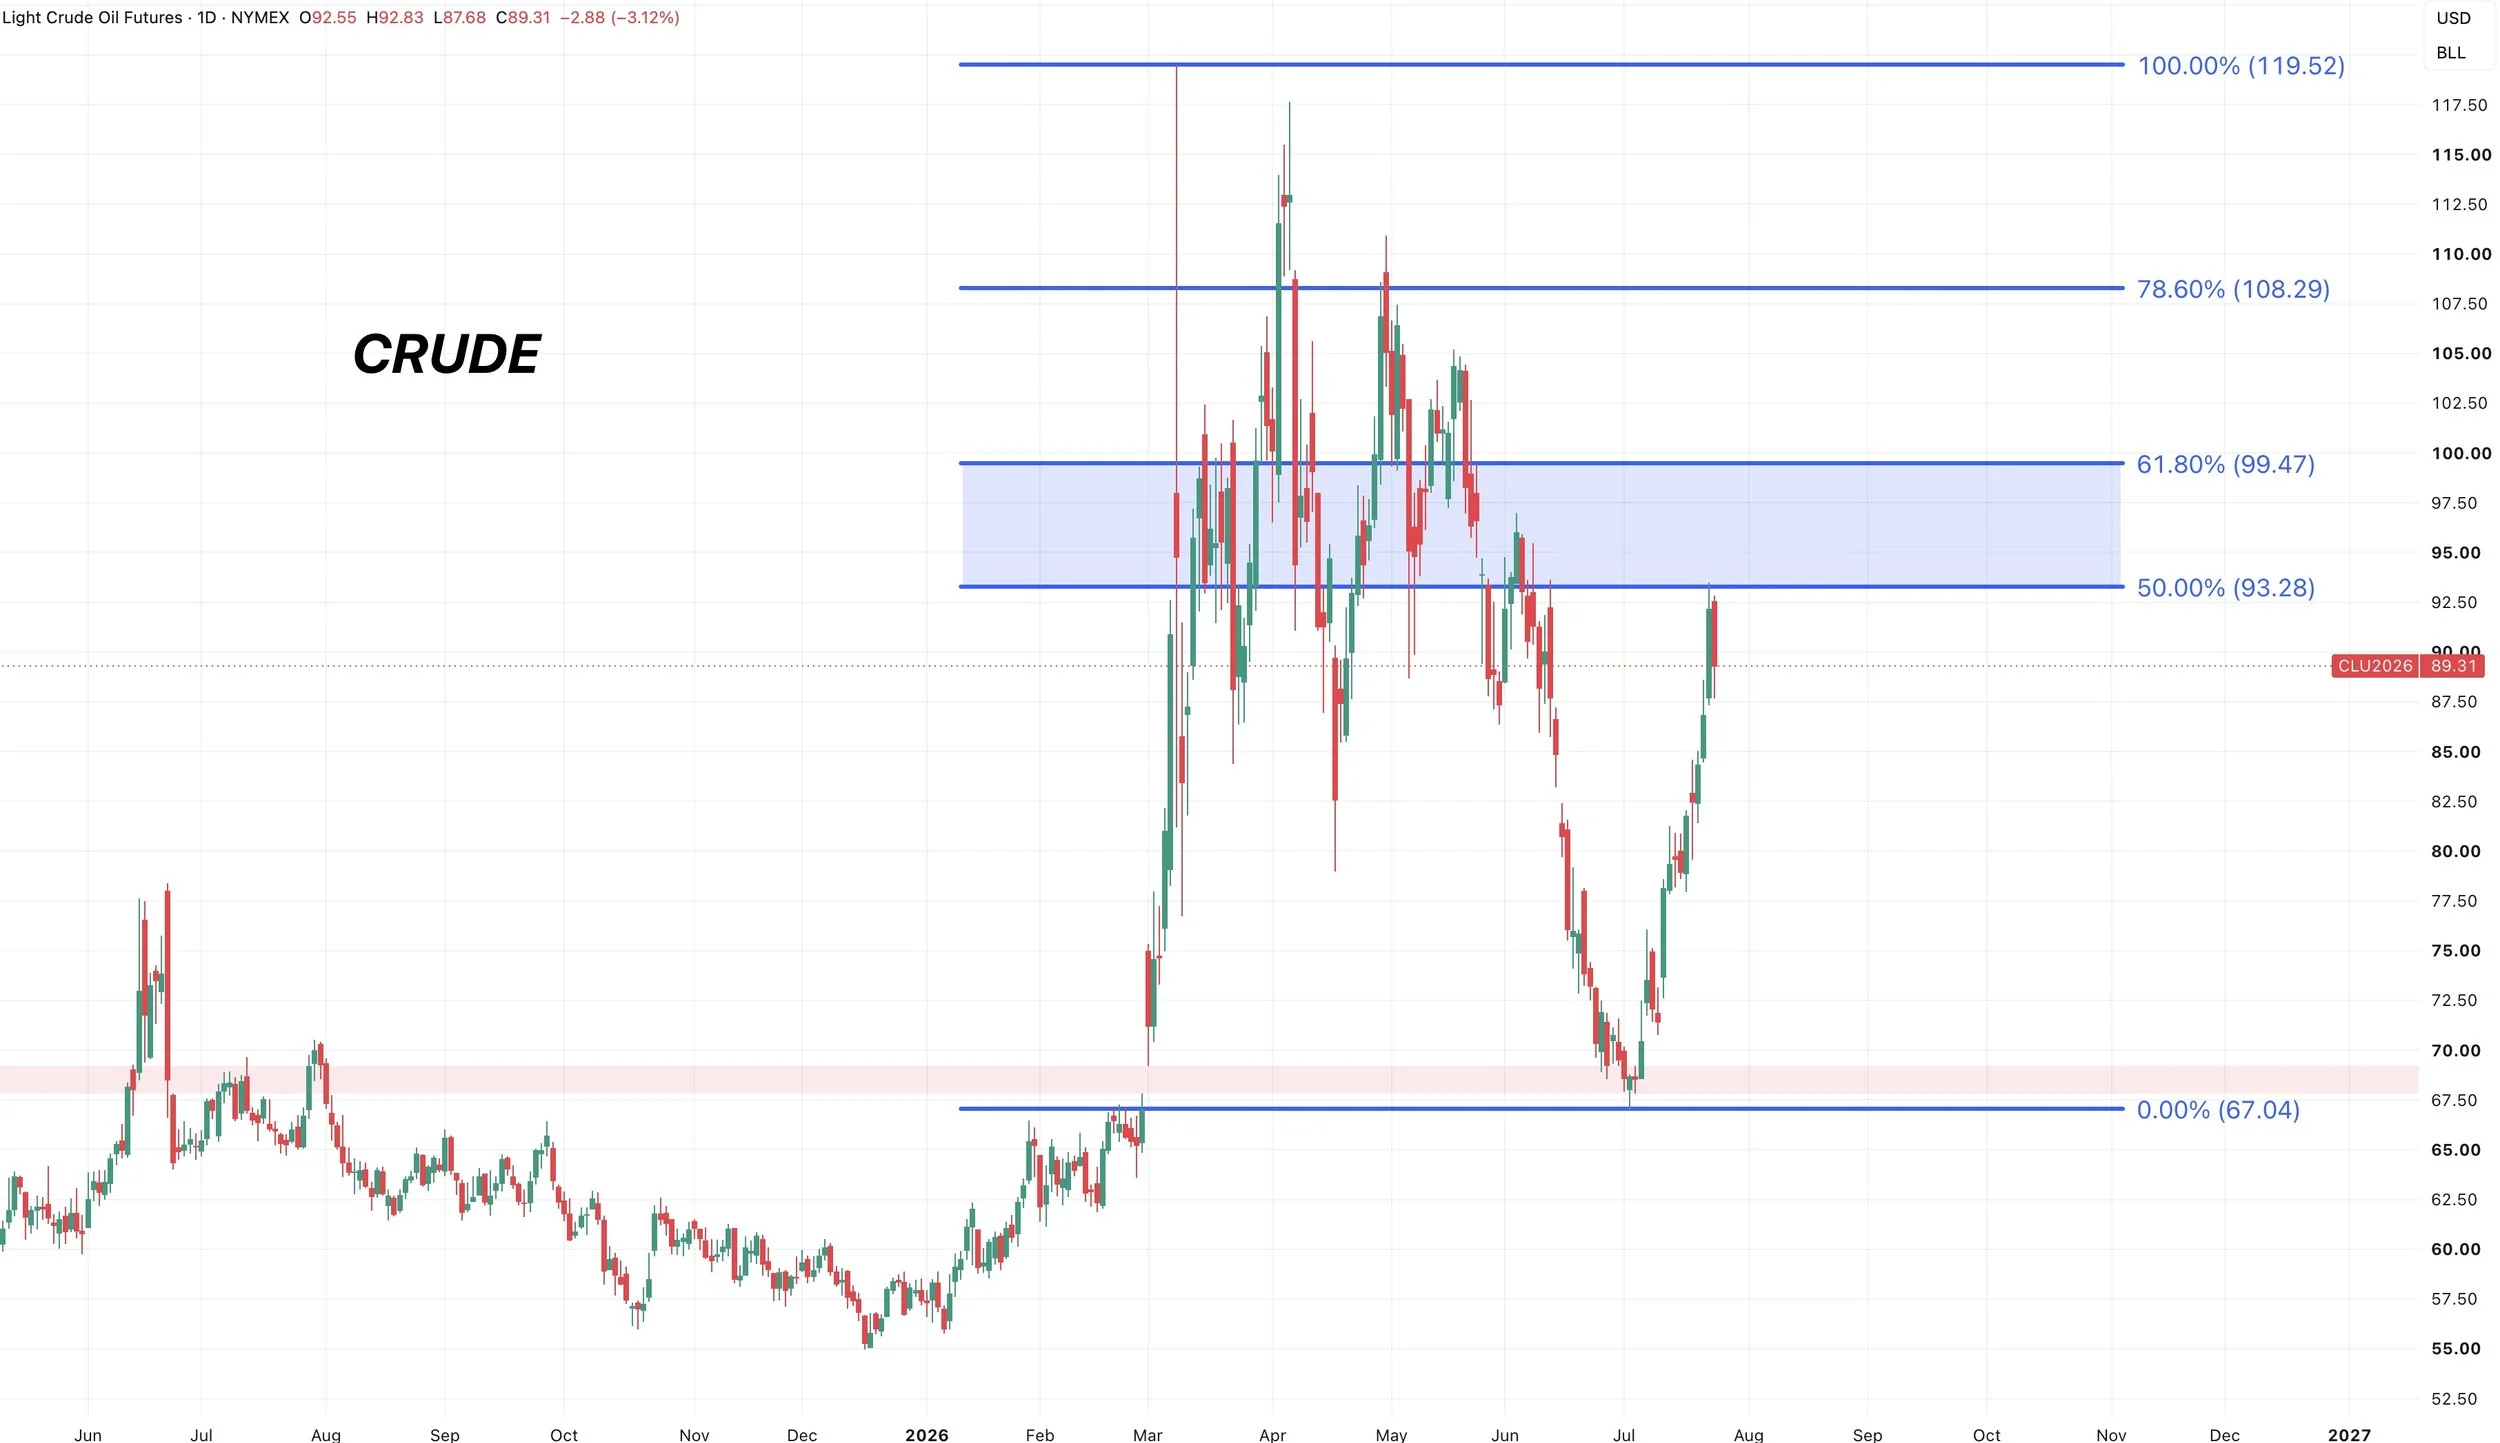
Speaking of crude, it's been providing a friendly catalyst to the grains.
So not only do we have weather issues and the Black Sea issues, but the Iran war escalations have picked up and as a result crude is rallying.
Trading back above $90 yesterday.
We perfectly filled that gap we left from February that we had been talking about previously.
We've now clawed back 50% of the entire sell off. So we are technically still in a downtrend, but if we are able to break above the 61.8% level at $100 then things would get very interesting.
If crude goes higher, it obviously wouldn’t be bearish for grains.
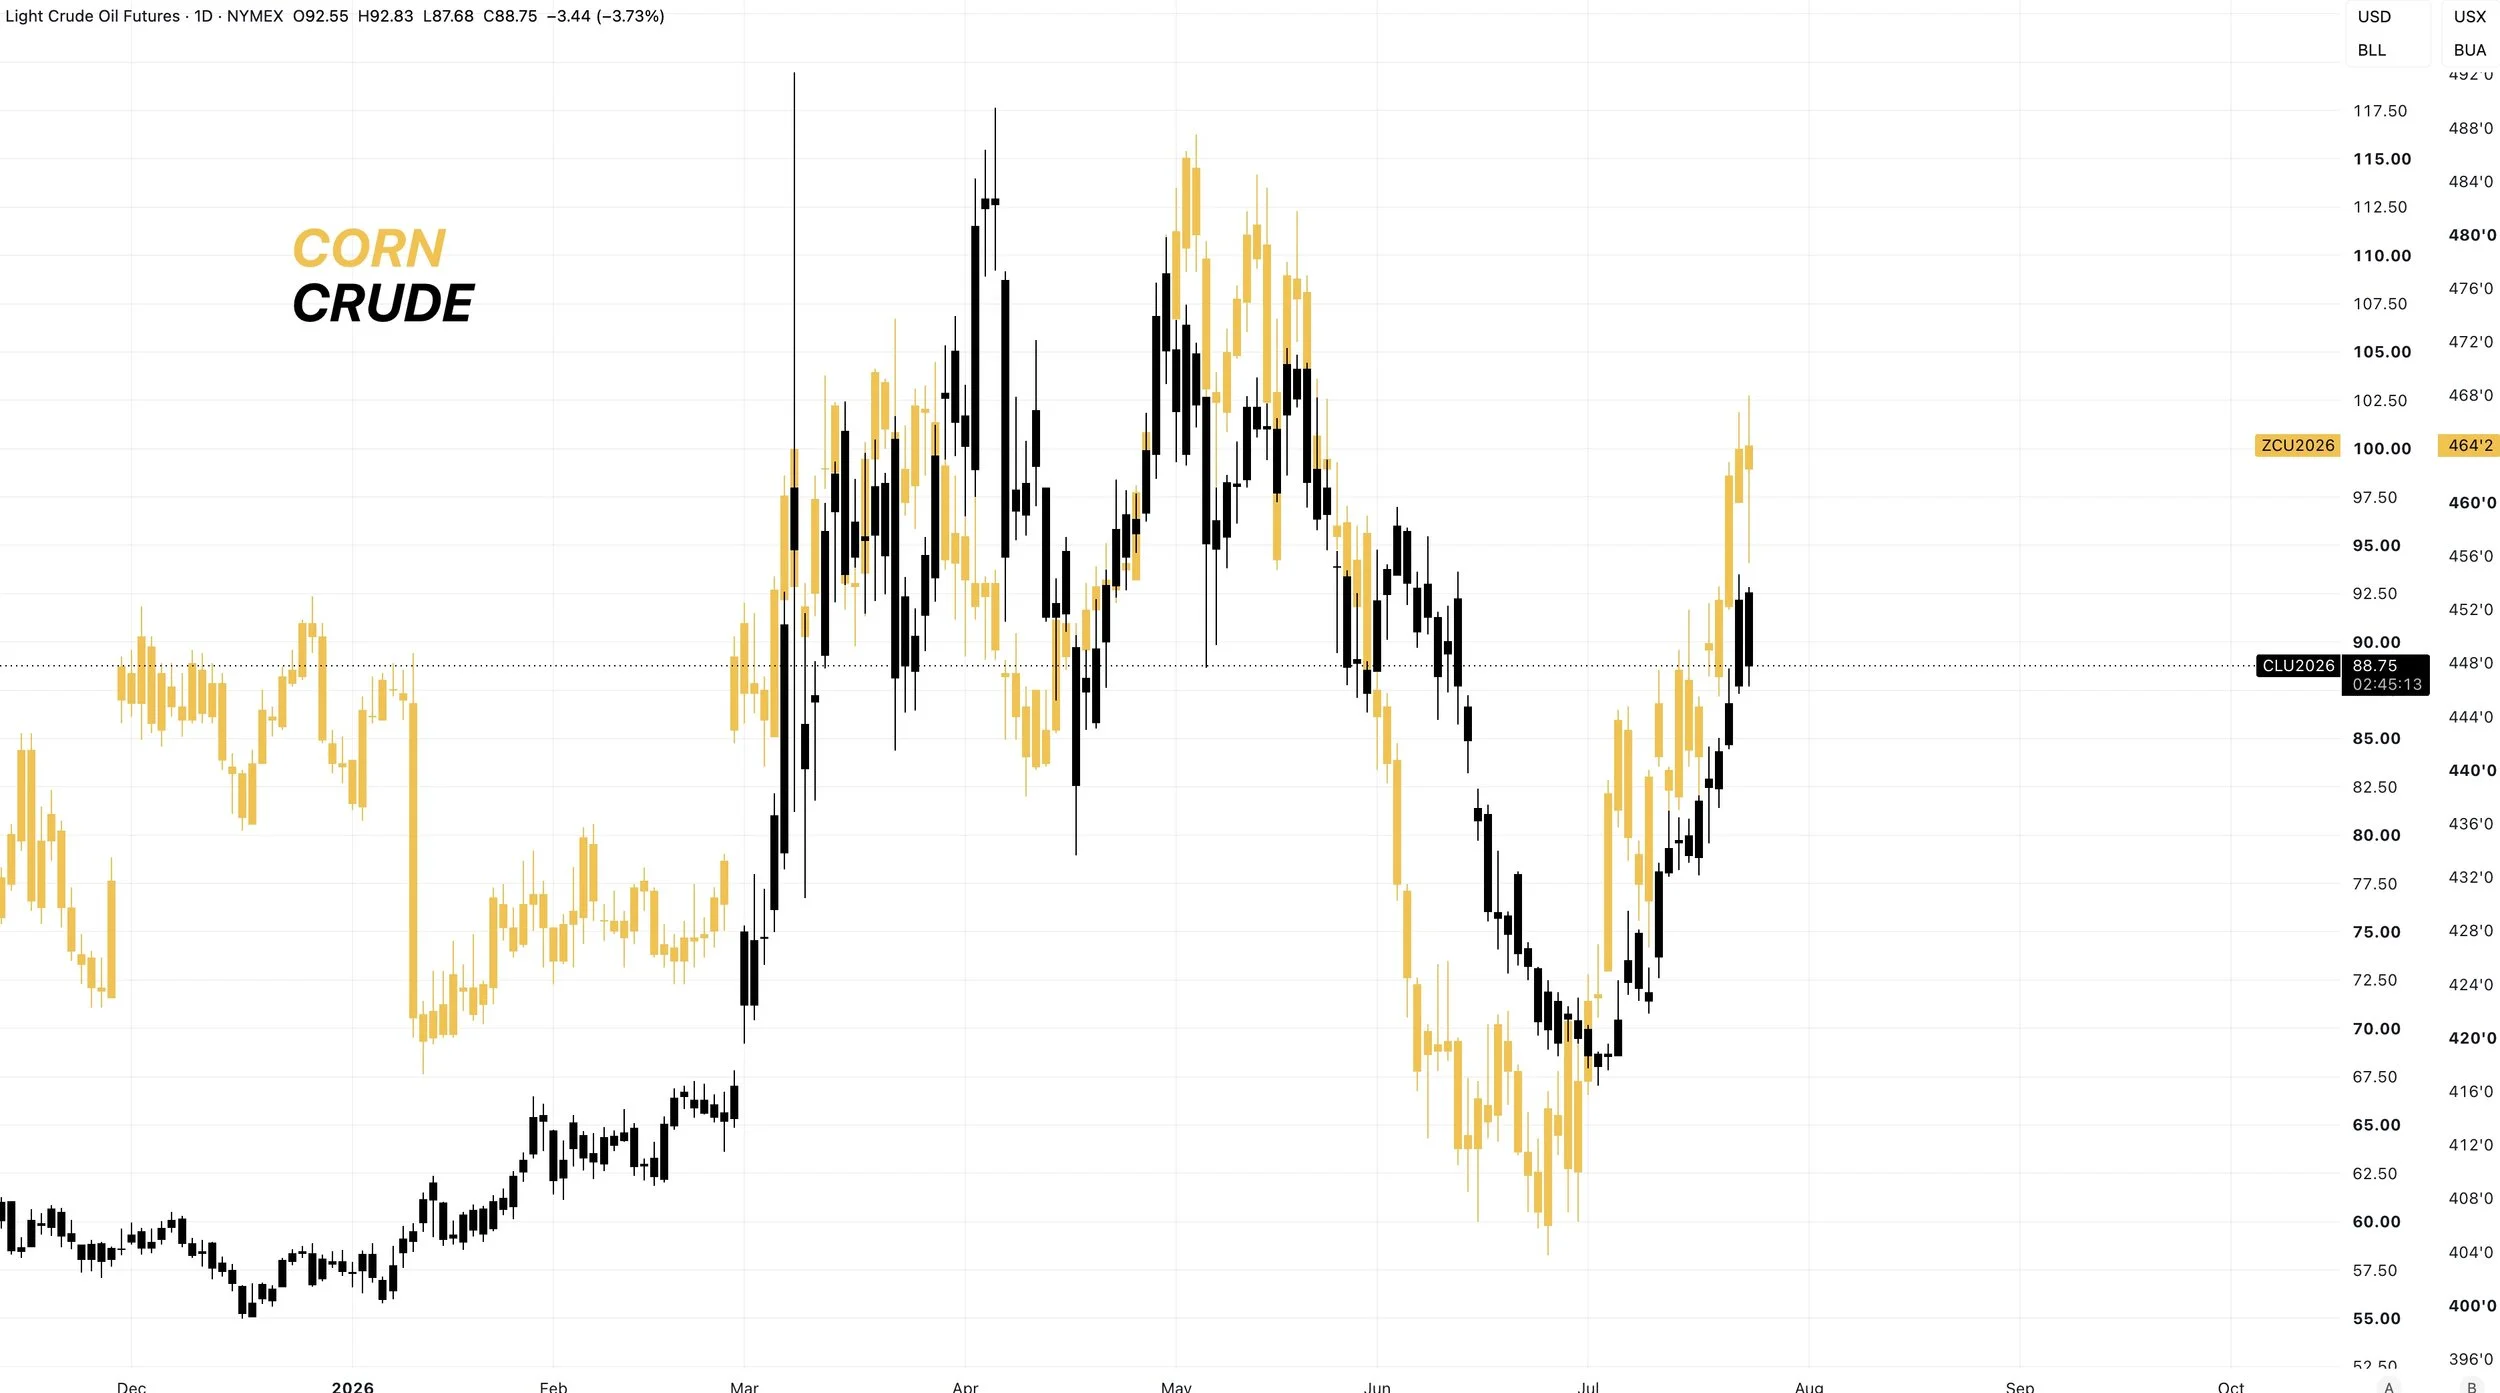
Here is a corn vs crude chart from this year.
There has been a pretty decent correlation. Almost identical price direction the entire year.
Today's Main Takeaways
Corn
Factors:
We've really seen a perfect combination of friendly factors hit the markets all at once.
Not only are we seeing hot and dry weather, but we have the geopolitical premiuim in Russia resulting in wheat helping pull corn higher.
We have seen crude oil ramp back up amidst middle east tension.
As a result, we are seeing a pretty counter seasonal rally.
Here are all of the seasonal patterns for reference.
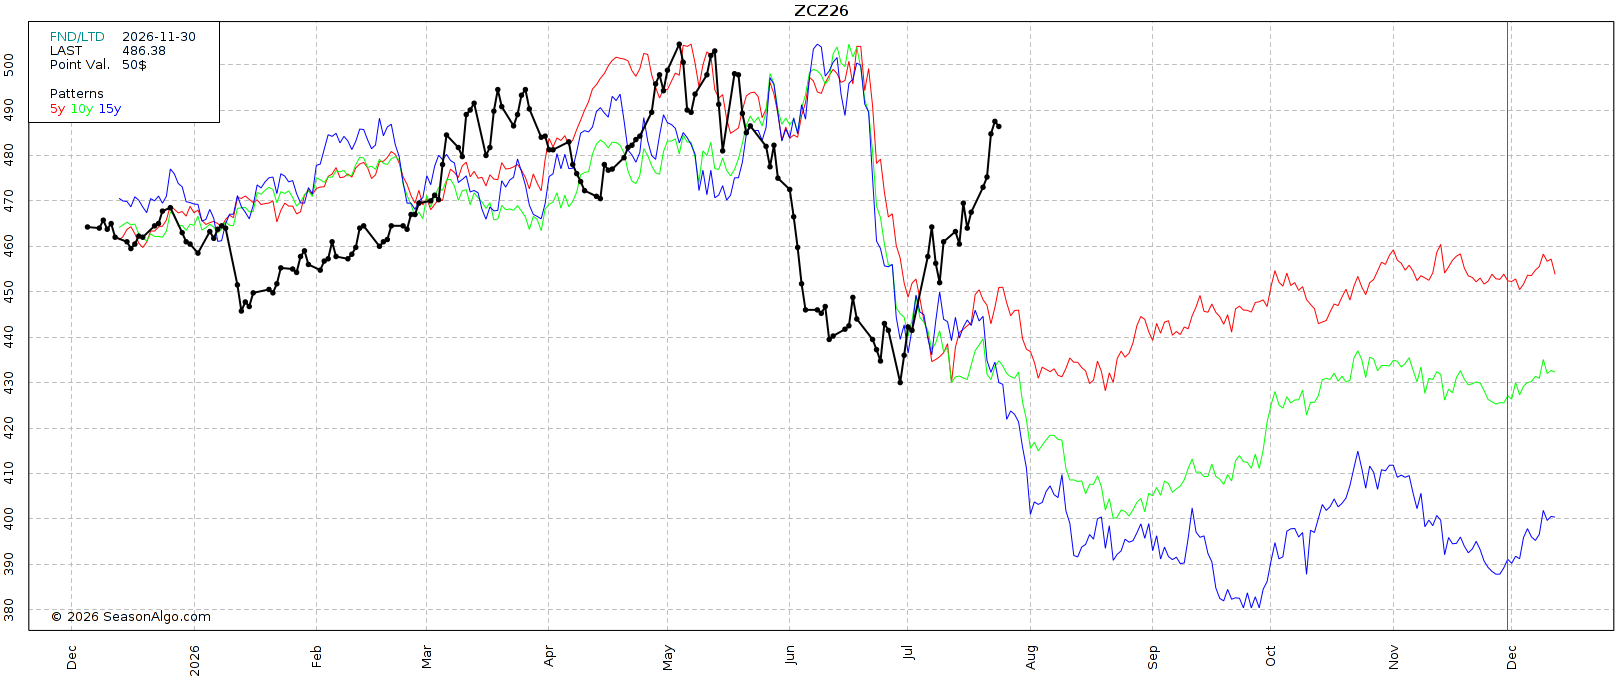
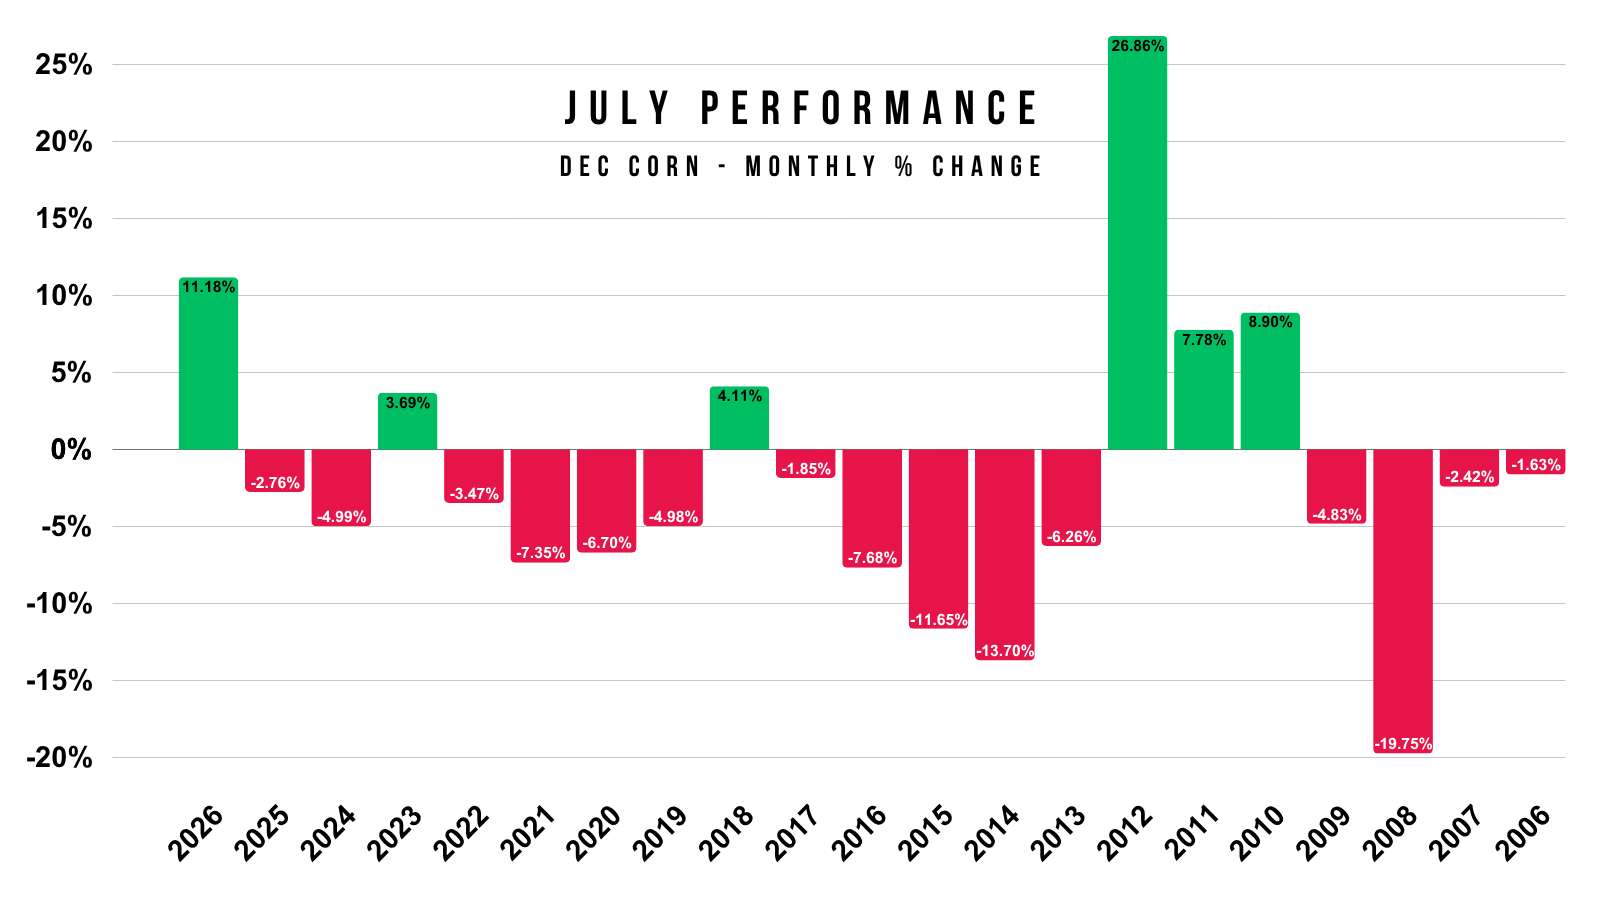
This counter seasonal rally has led to corn seeing it's strongest July since 2012, and 2nd strongest July ever.
Dec corn is up over +11% this month.
The only year we had a stronger July was 2012's 27% run.
Weather:
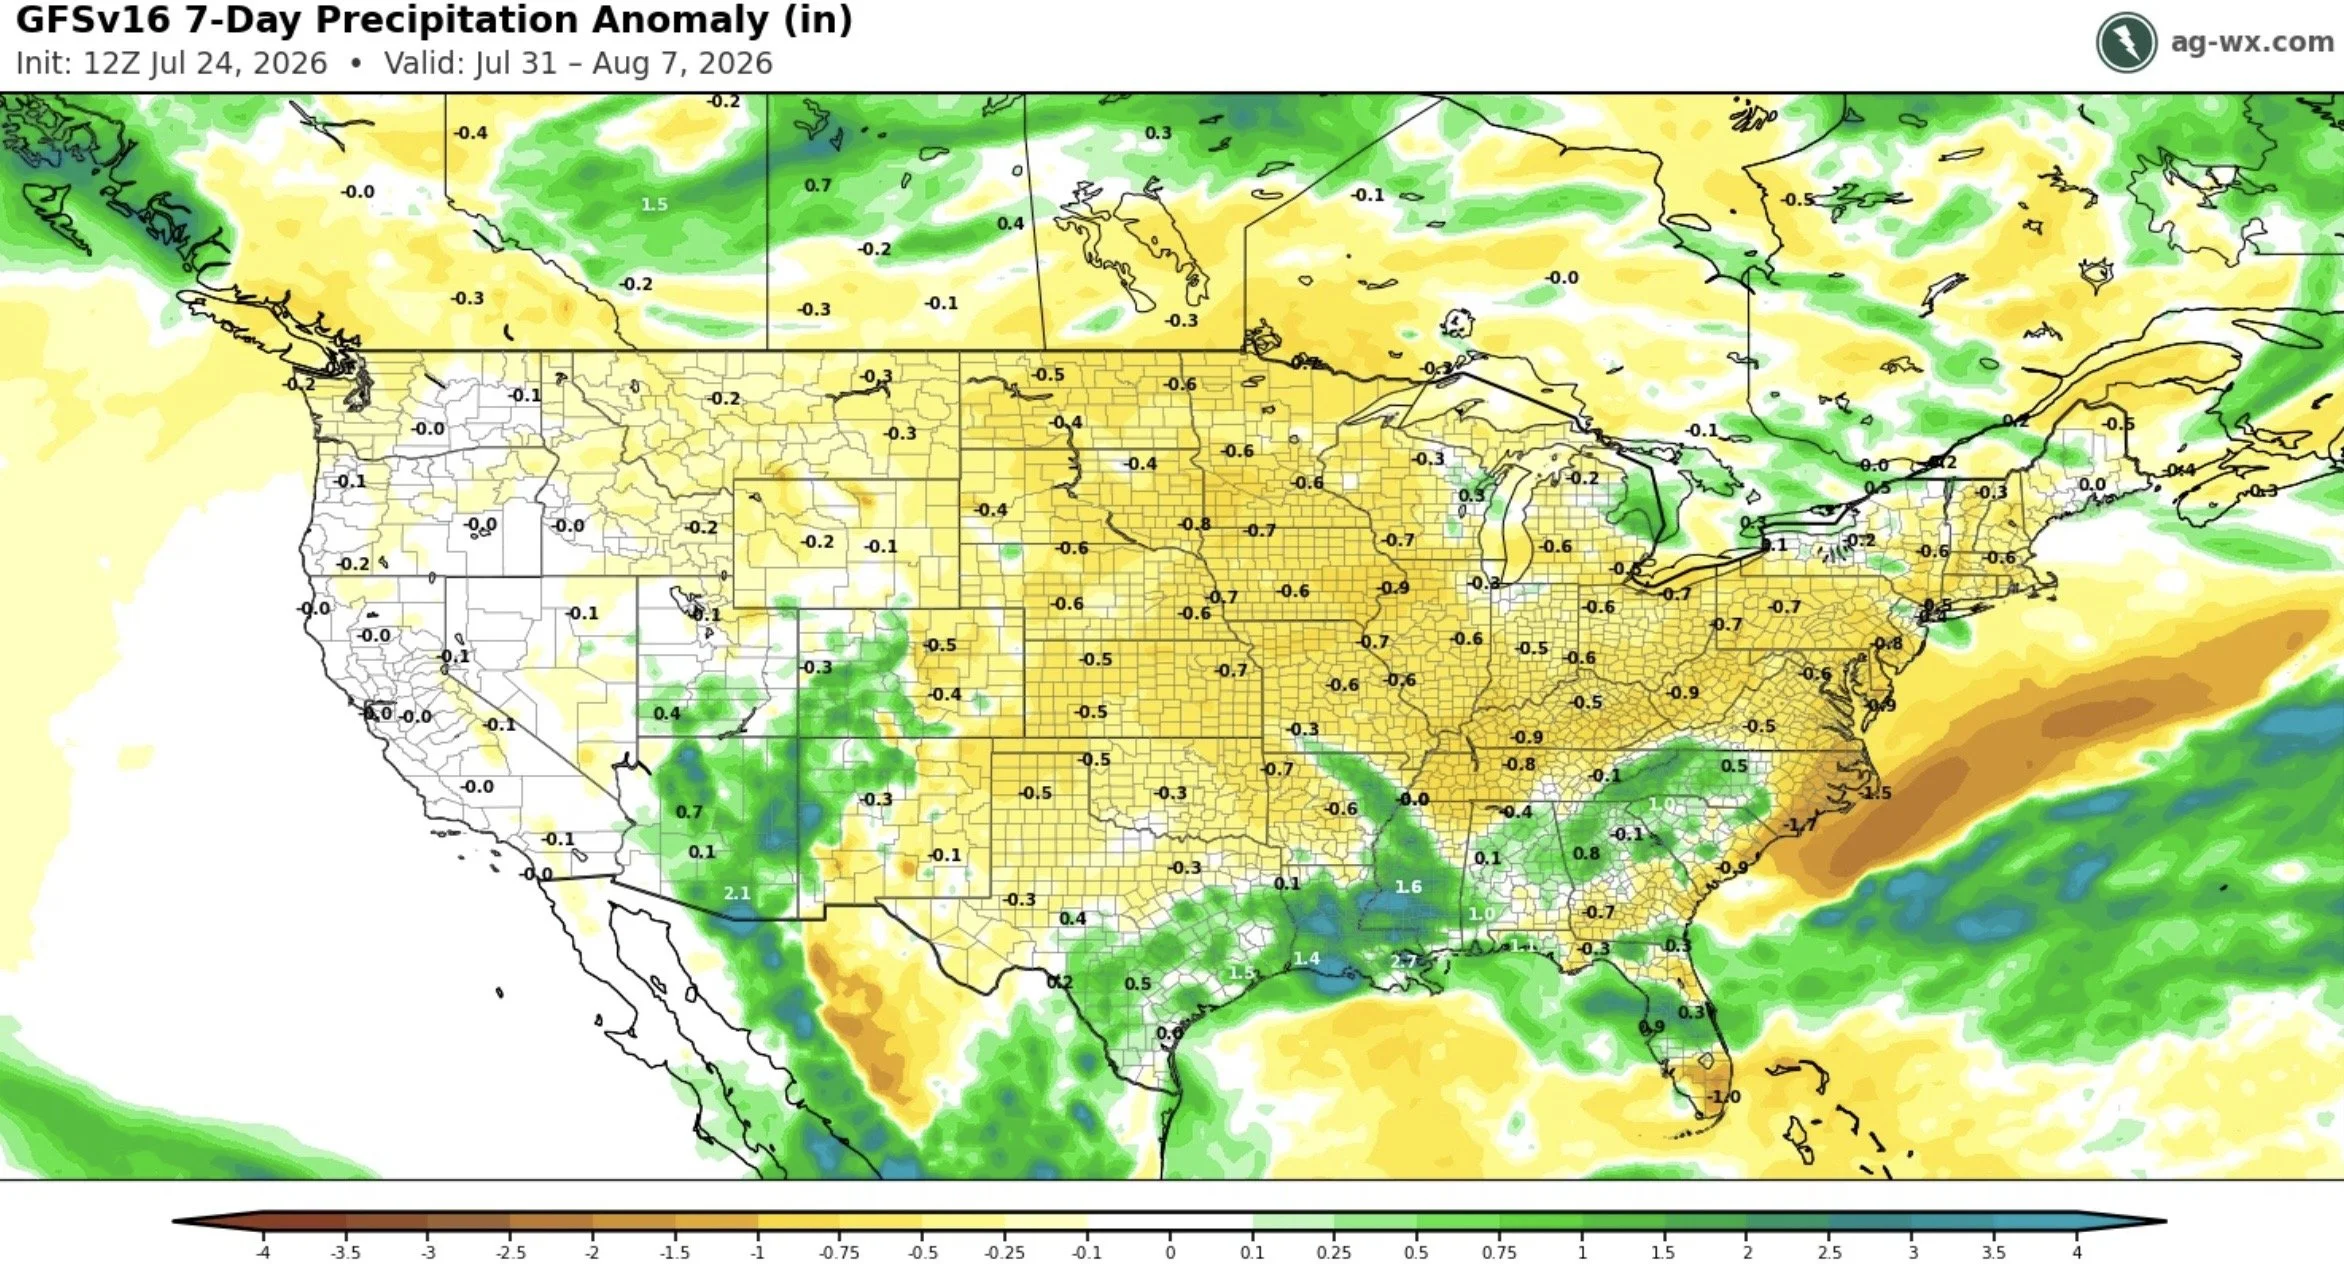
Here is the next 7 days of precip.
You do have some pockets that are going to be missing out on rain.
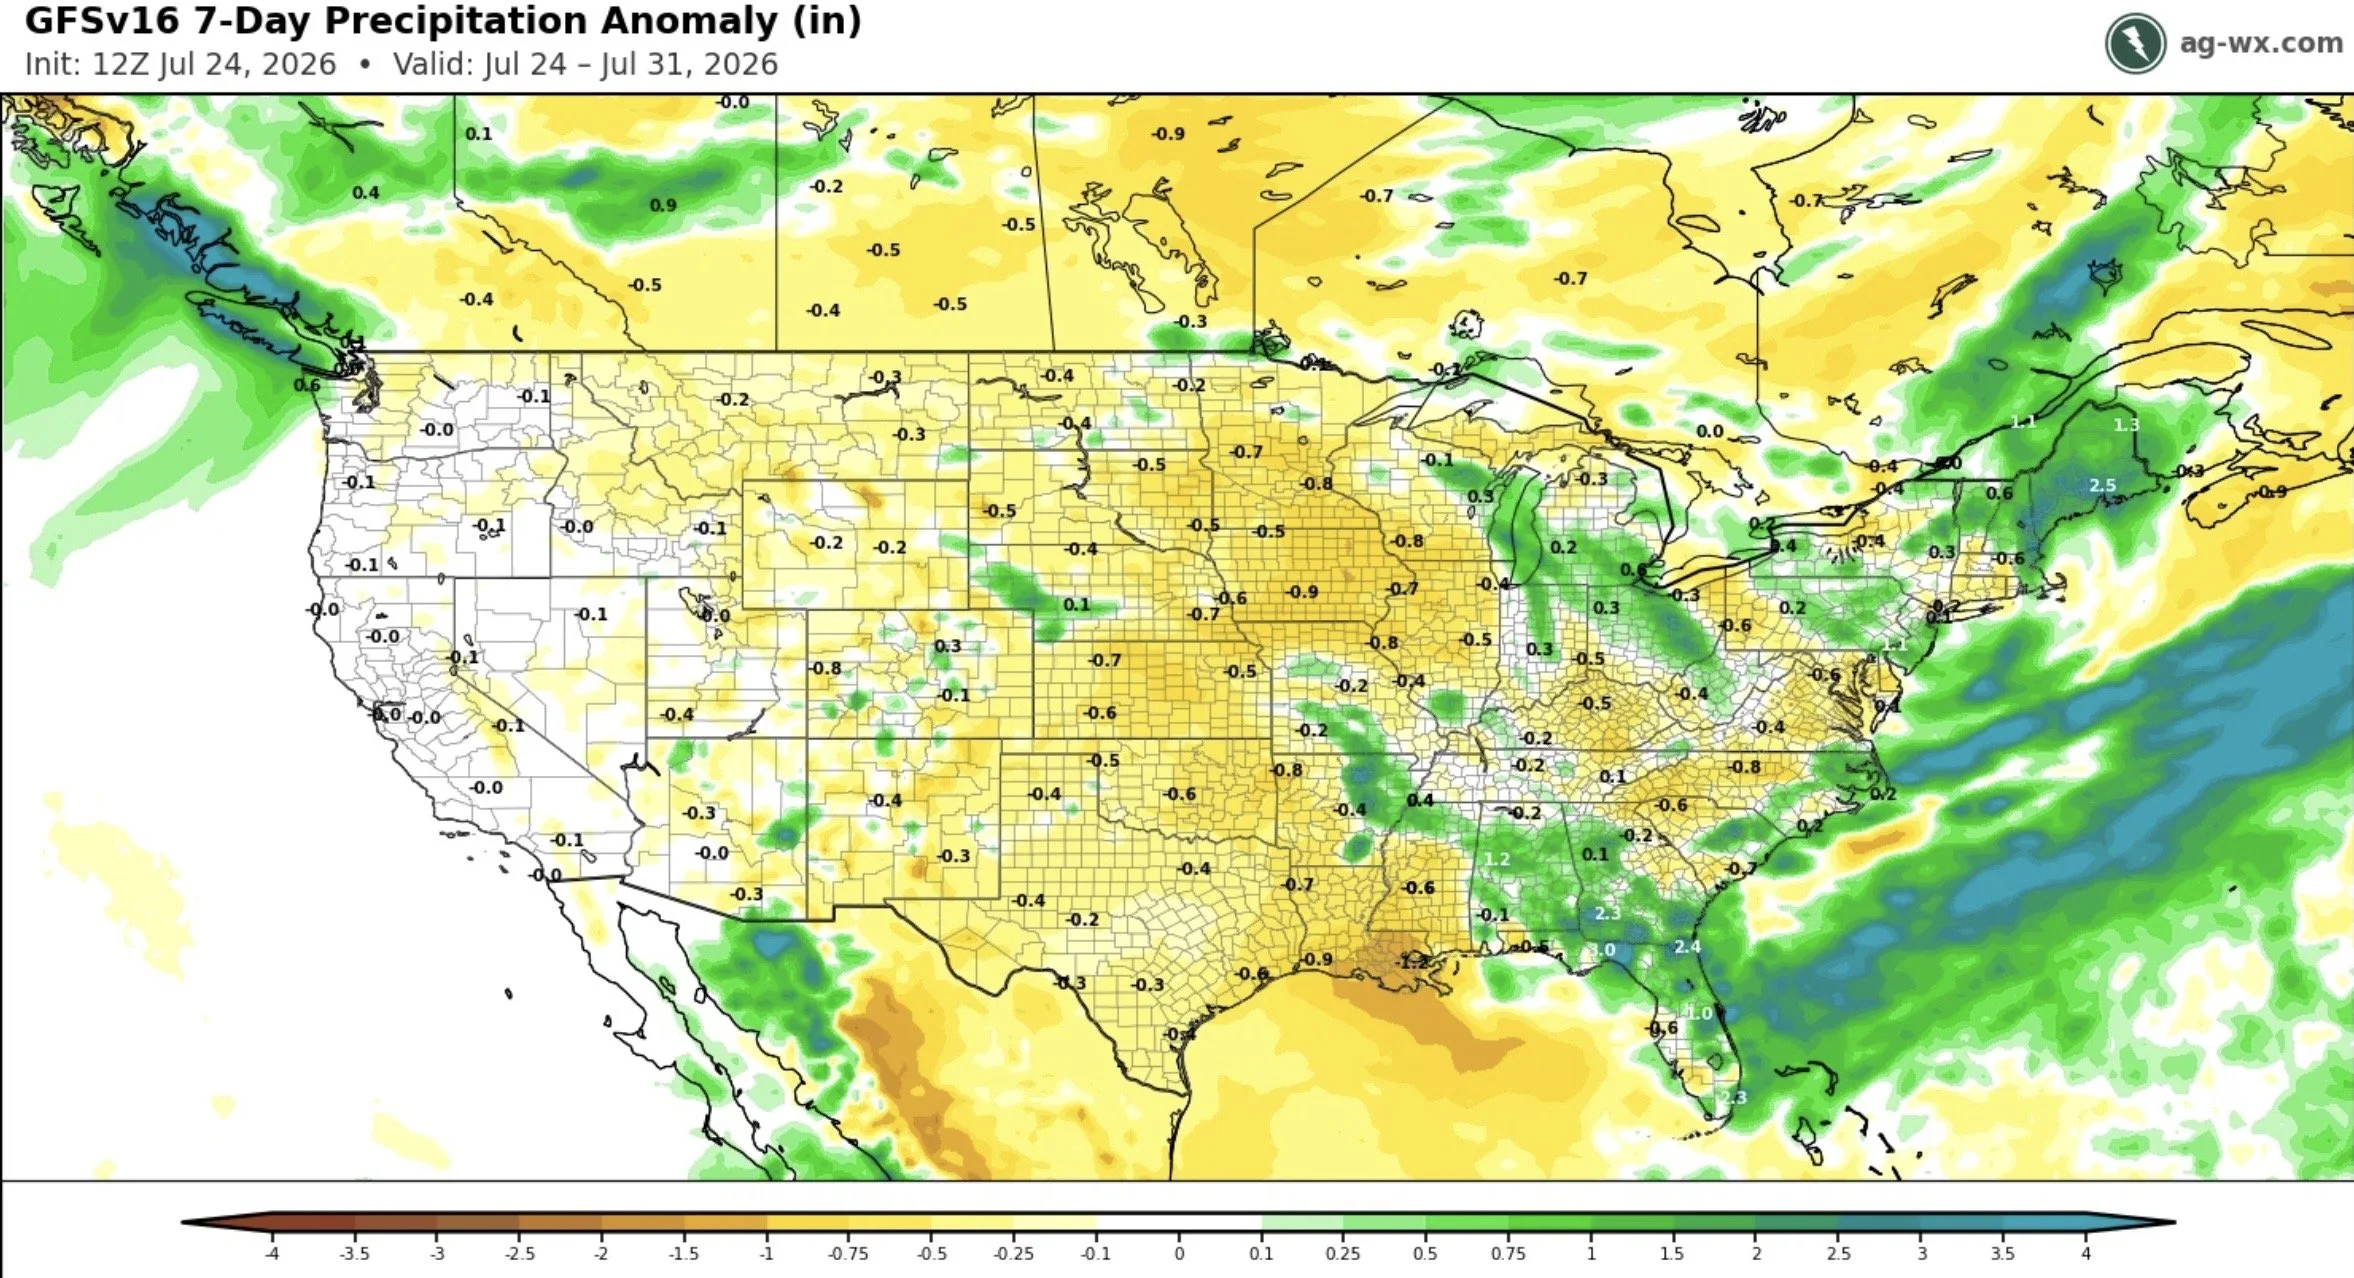
If you look at the extended forecasts, the first week of August also looks like it's going to be very dry.
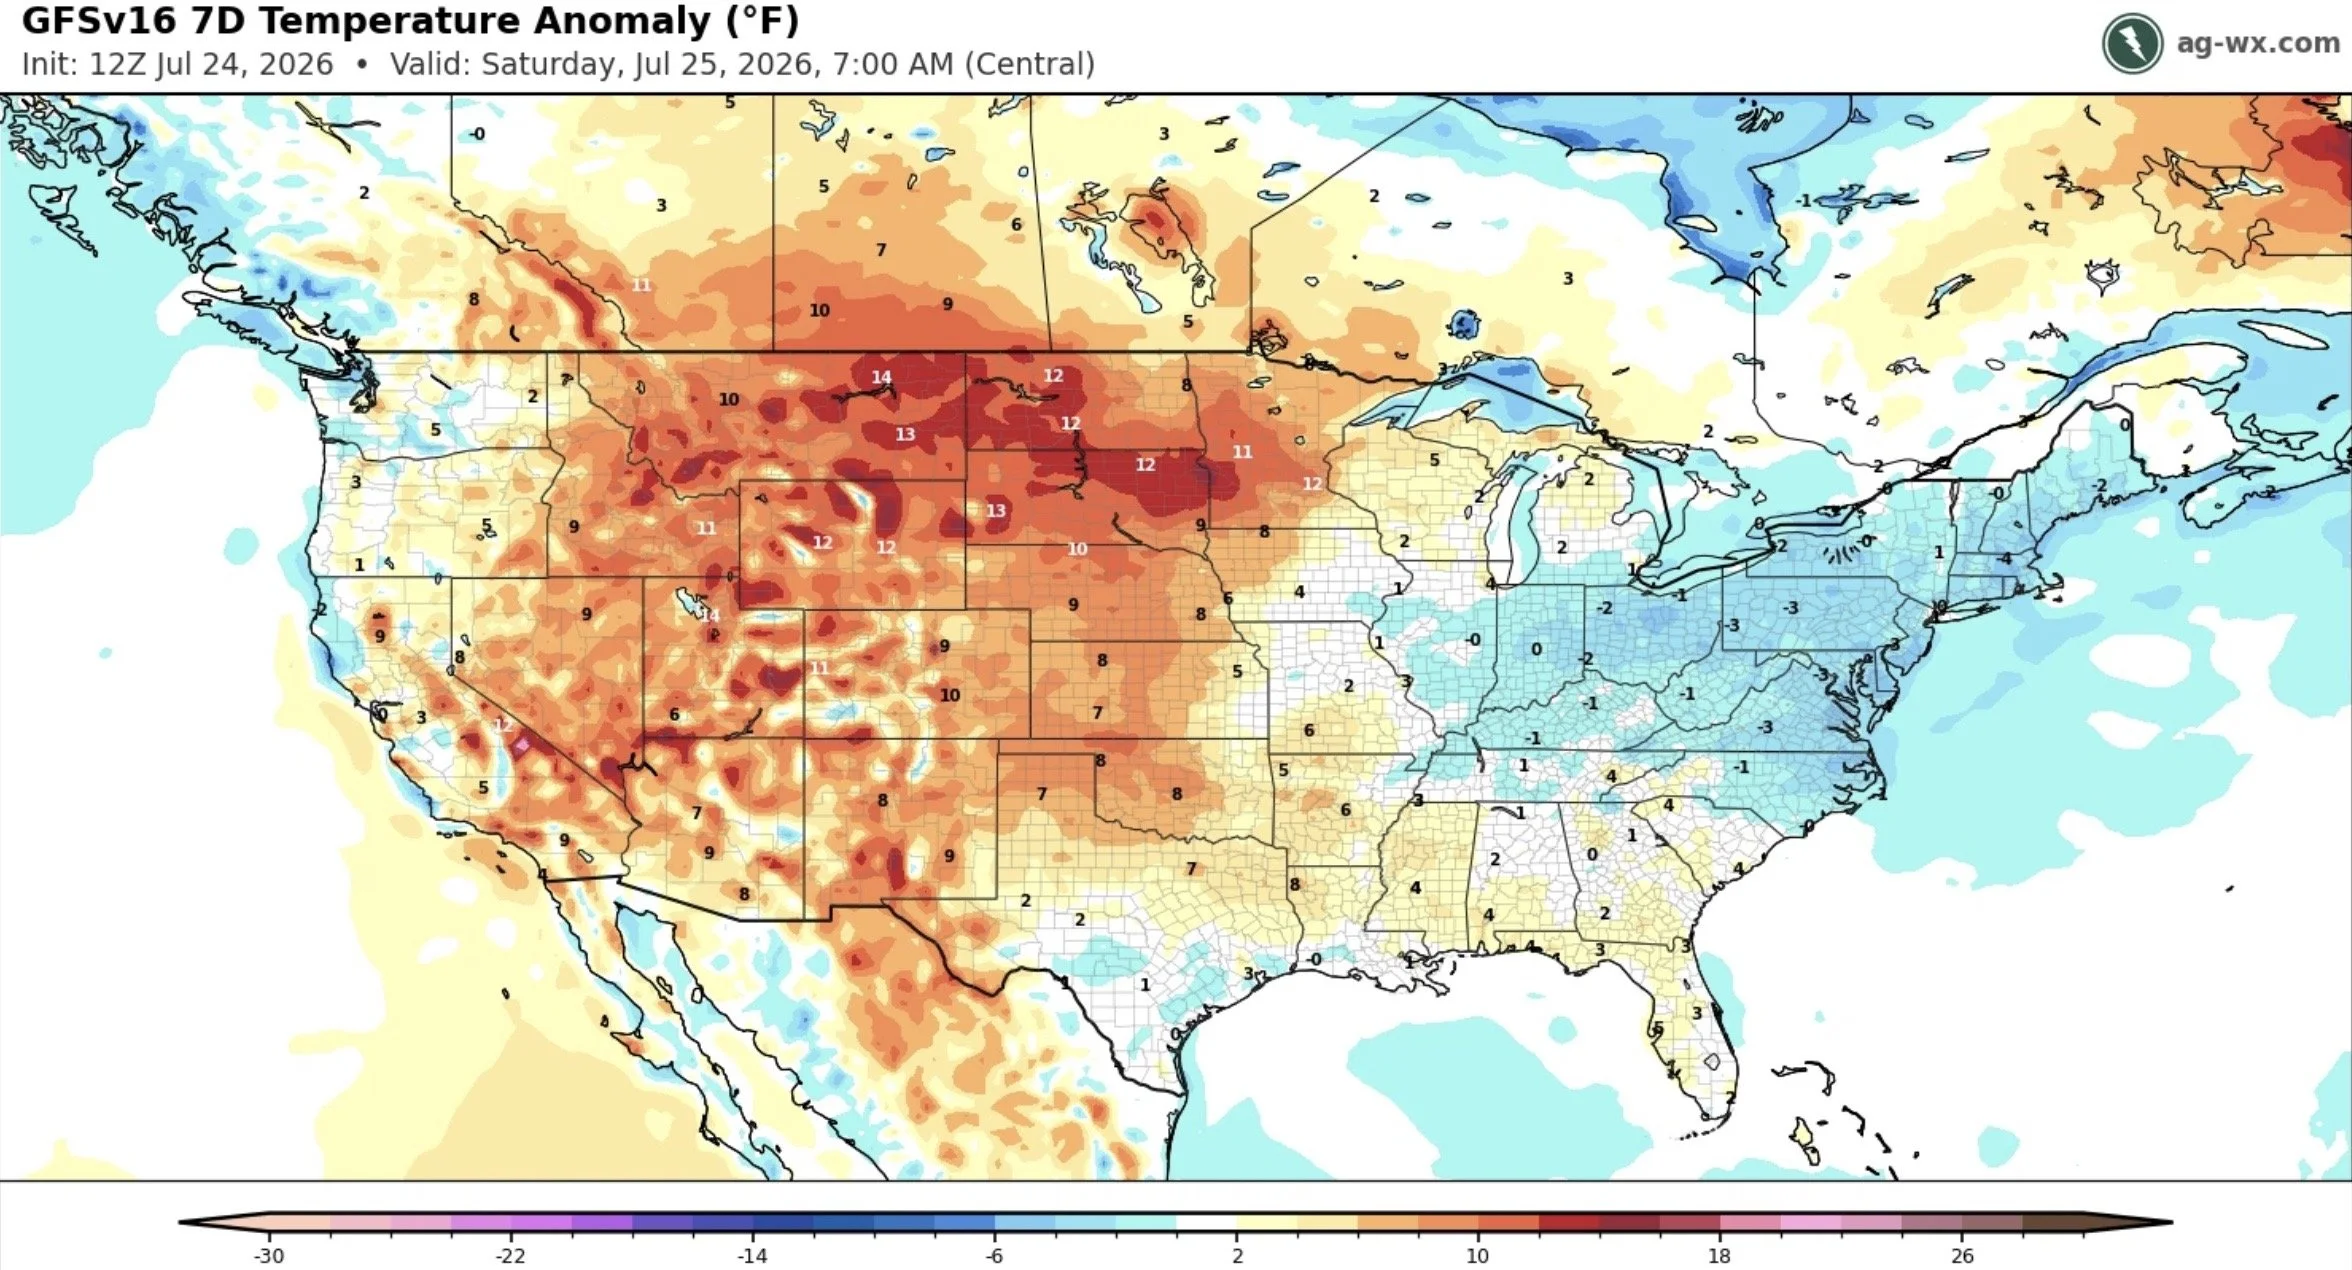
Here is the next 7 days of heat.
The eastern corn belt is suppose to cool down, but the west is still going to be hot. With plenty of areas running over 10 degrees hotter than normal.
If you extend this out to the first week of August, that heat is expected to remain in the western to northern areas.
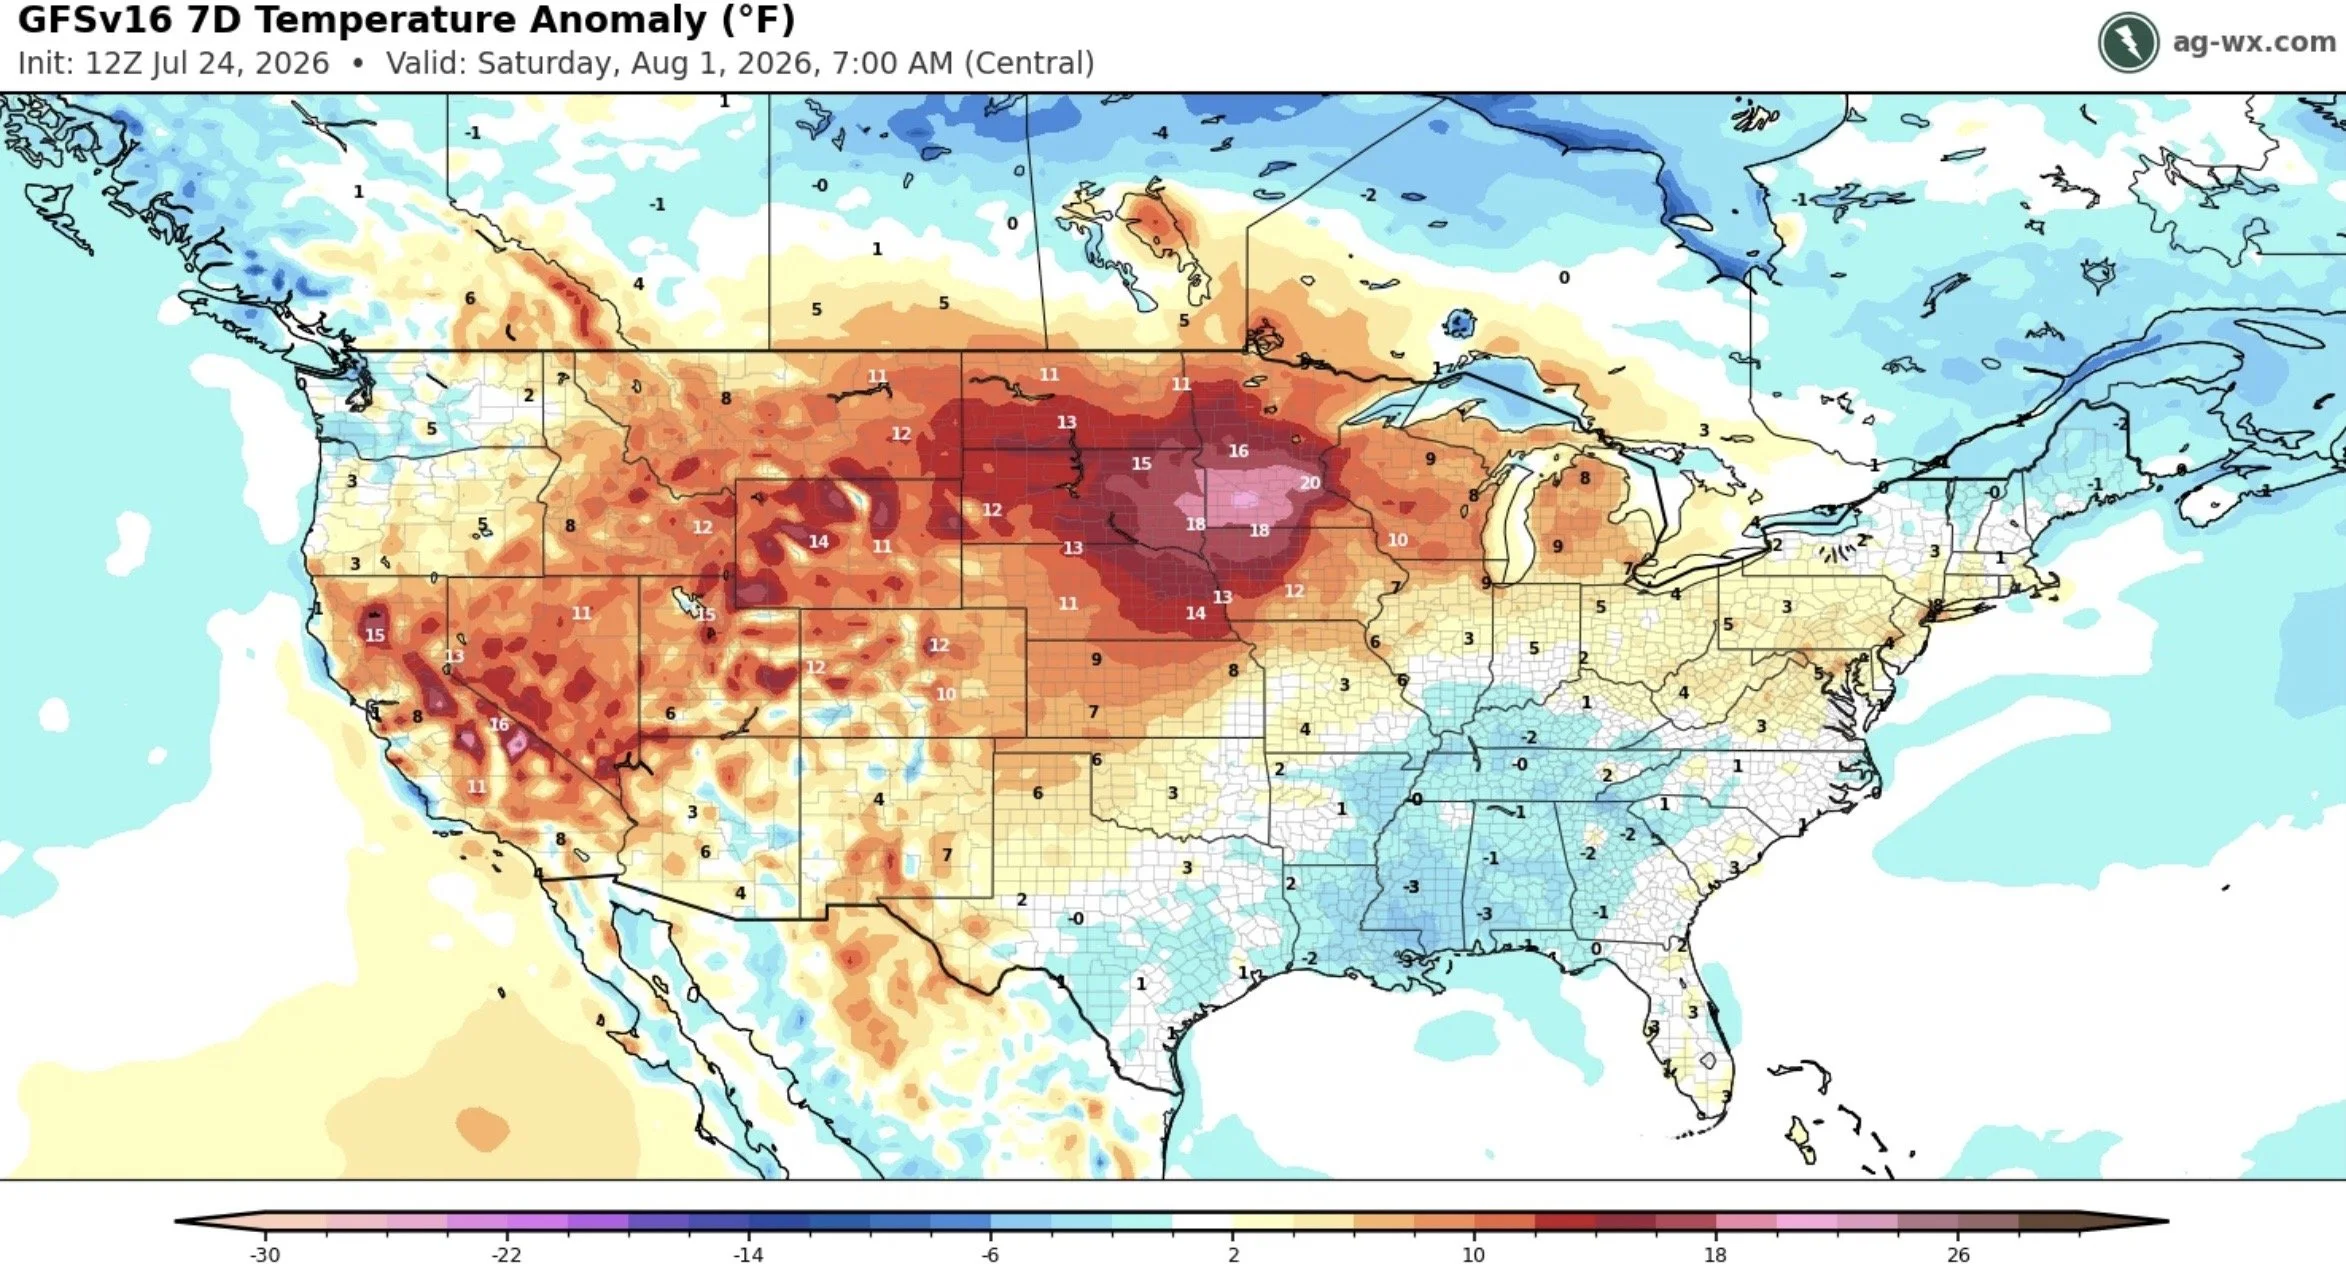
So there are still some concerns surrounding weather. As a result, the market continues to keep putting in that weather premium.
Which is likely why despite the wheat market getting hit hard today, the row crops stayed relatively strong.
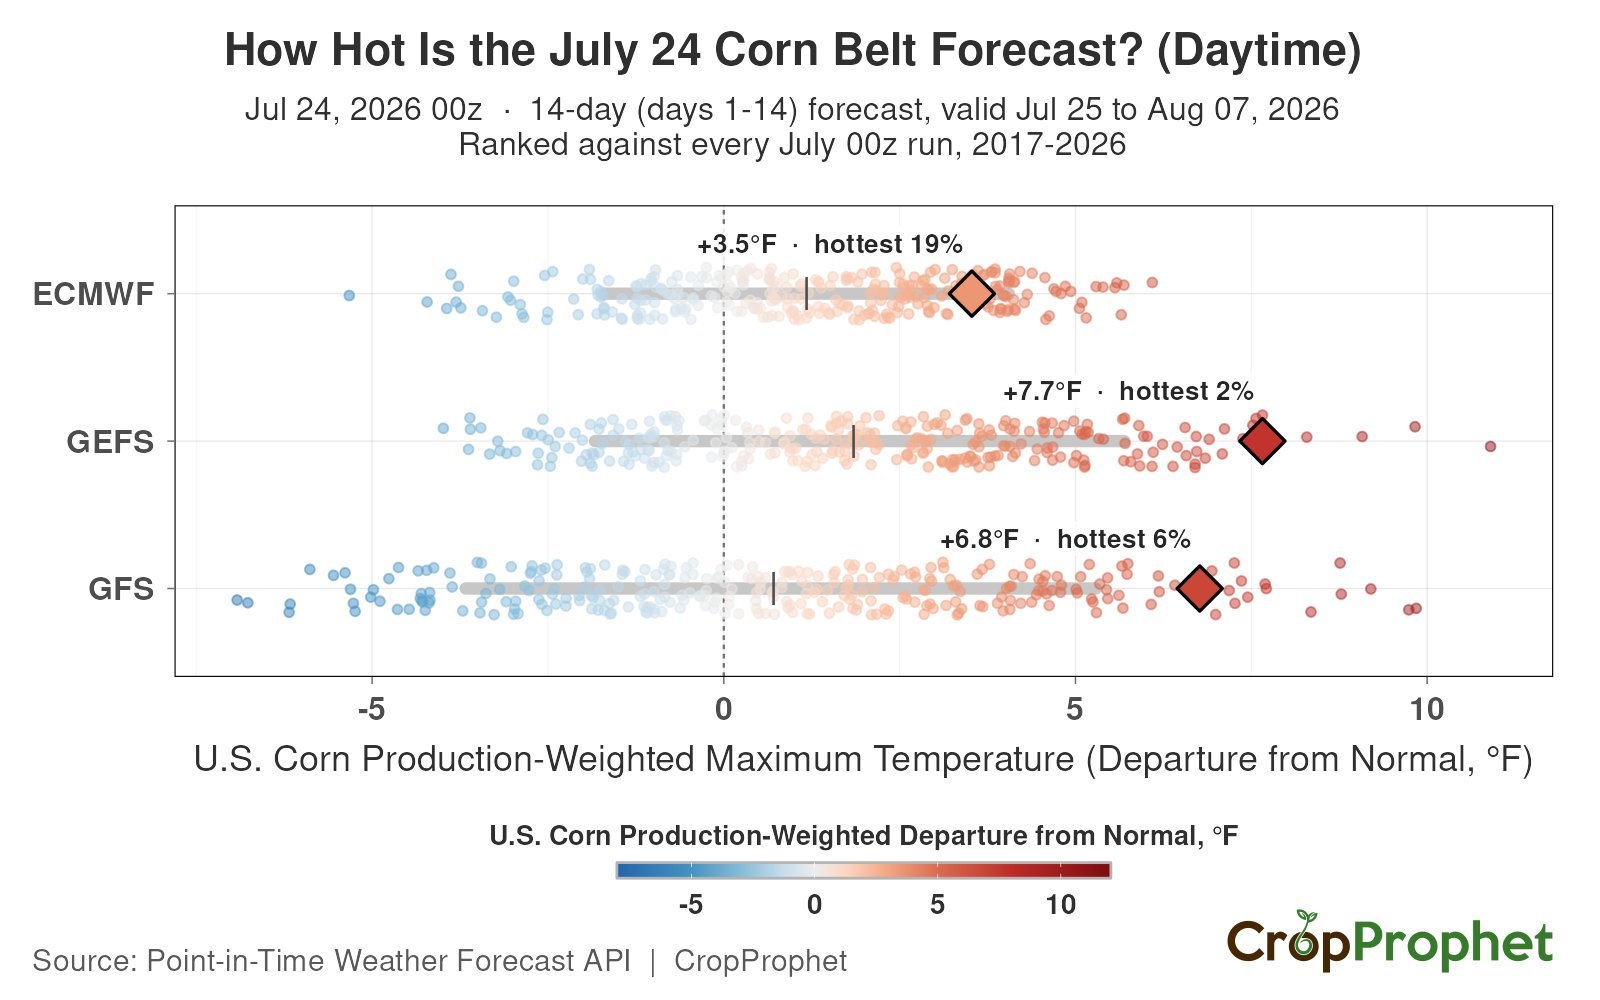
Just how hot and dry are the next two weeks suppose to be?
Here is some good data from Crop Prophet.
The GEFS has us at 59% of normal rainfall for corn regions. Which would be in the top 7% of driest July forecasts since 2017.
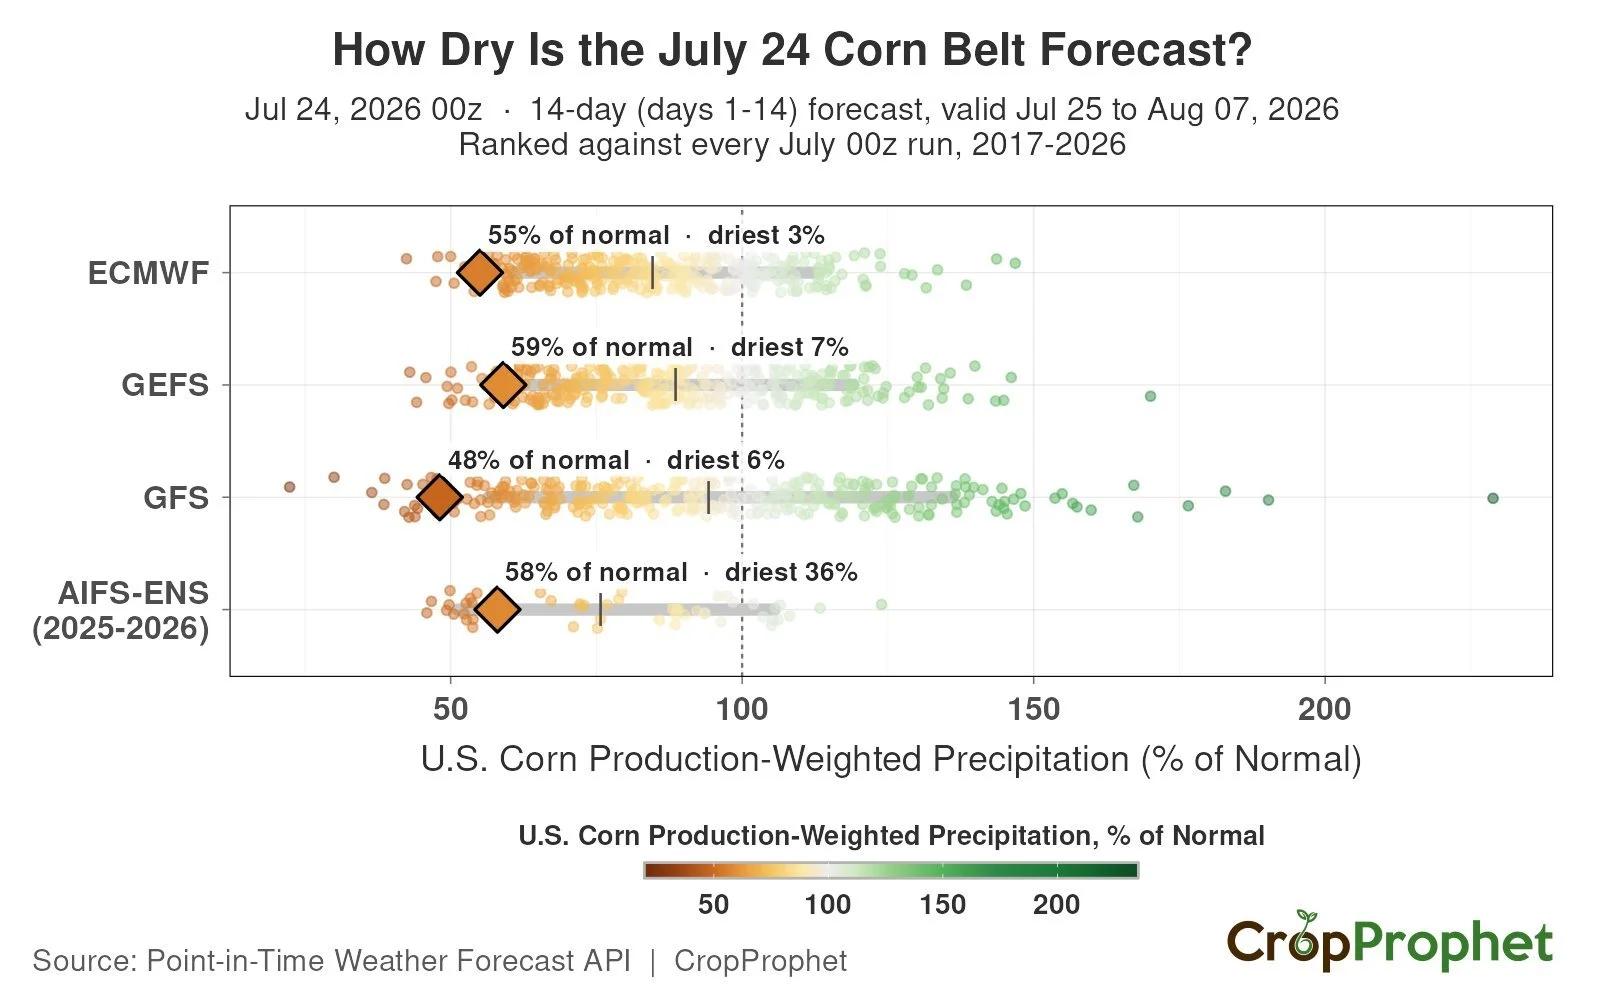
The GEFS also has corn regions sitting 7.7 degrees above normal.
Which would be in the top 2% of hottest July forecasts since 2017.
This hasn’t entirely been a weather driven rally with all of the geopolitical headlines. But a large part of it certainly has been in corn.
If it stays hot and dry, we can of course continue higher.
Just looking at the forecasts, they look do bullish.
But at the same time, we just need to keep in mind that supply rallies run hard fast. They can go alot higher than you originally thought was possible. But when it's over, things can get pretty brutal.
As at a certain point the weather premium will be priced in. Just like a war headline, the forecasts can flip on a dime at any point.
So that does offer downside risk. That doesn’t mean it has to happen next week or soon at all, but it will eventually be priced in.
Unless of course some of the other factors such as the Black Sea do the heavy lifting.
So I think it warrants managing your risk. Catching up on sales if you are behind or simply getting some downside protection if you don’t have any.
Especially those who are short on time or lack storage etc. You just don’t have the same ability to be flexible as those who have plenty of time and don’t need to do anything.
Managing risk doesn’t mean I am bearish on corn. It simply makes sense for some of you.
It's not always being able to outguess the market. It's about managing your risk where it makes sense to do so for you.
Two days ago we sent out a hedge alert in corn where we went over ways you can participate in further upside in the corn market while being able to protect your downside.
If you missed it: Click Here to View
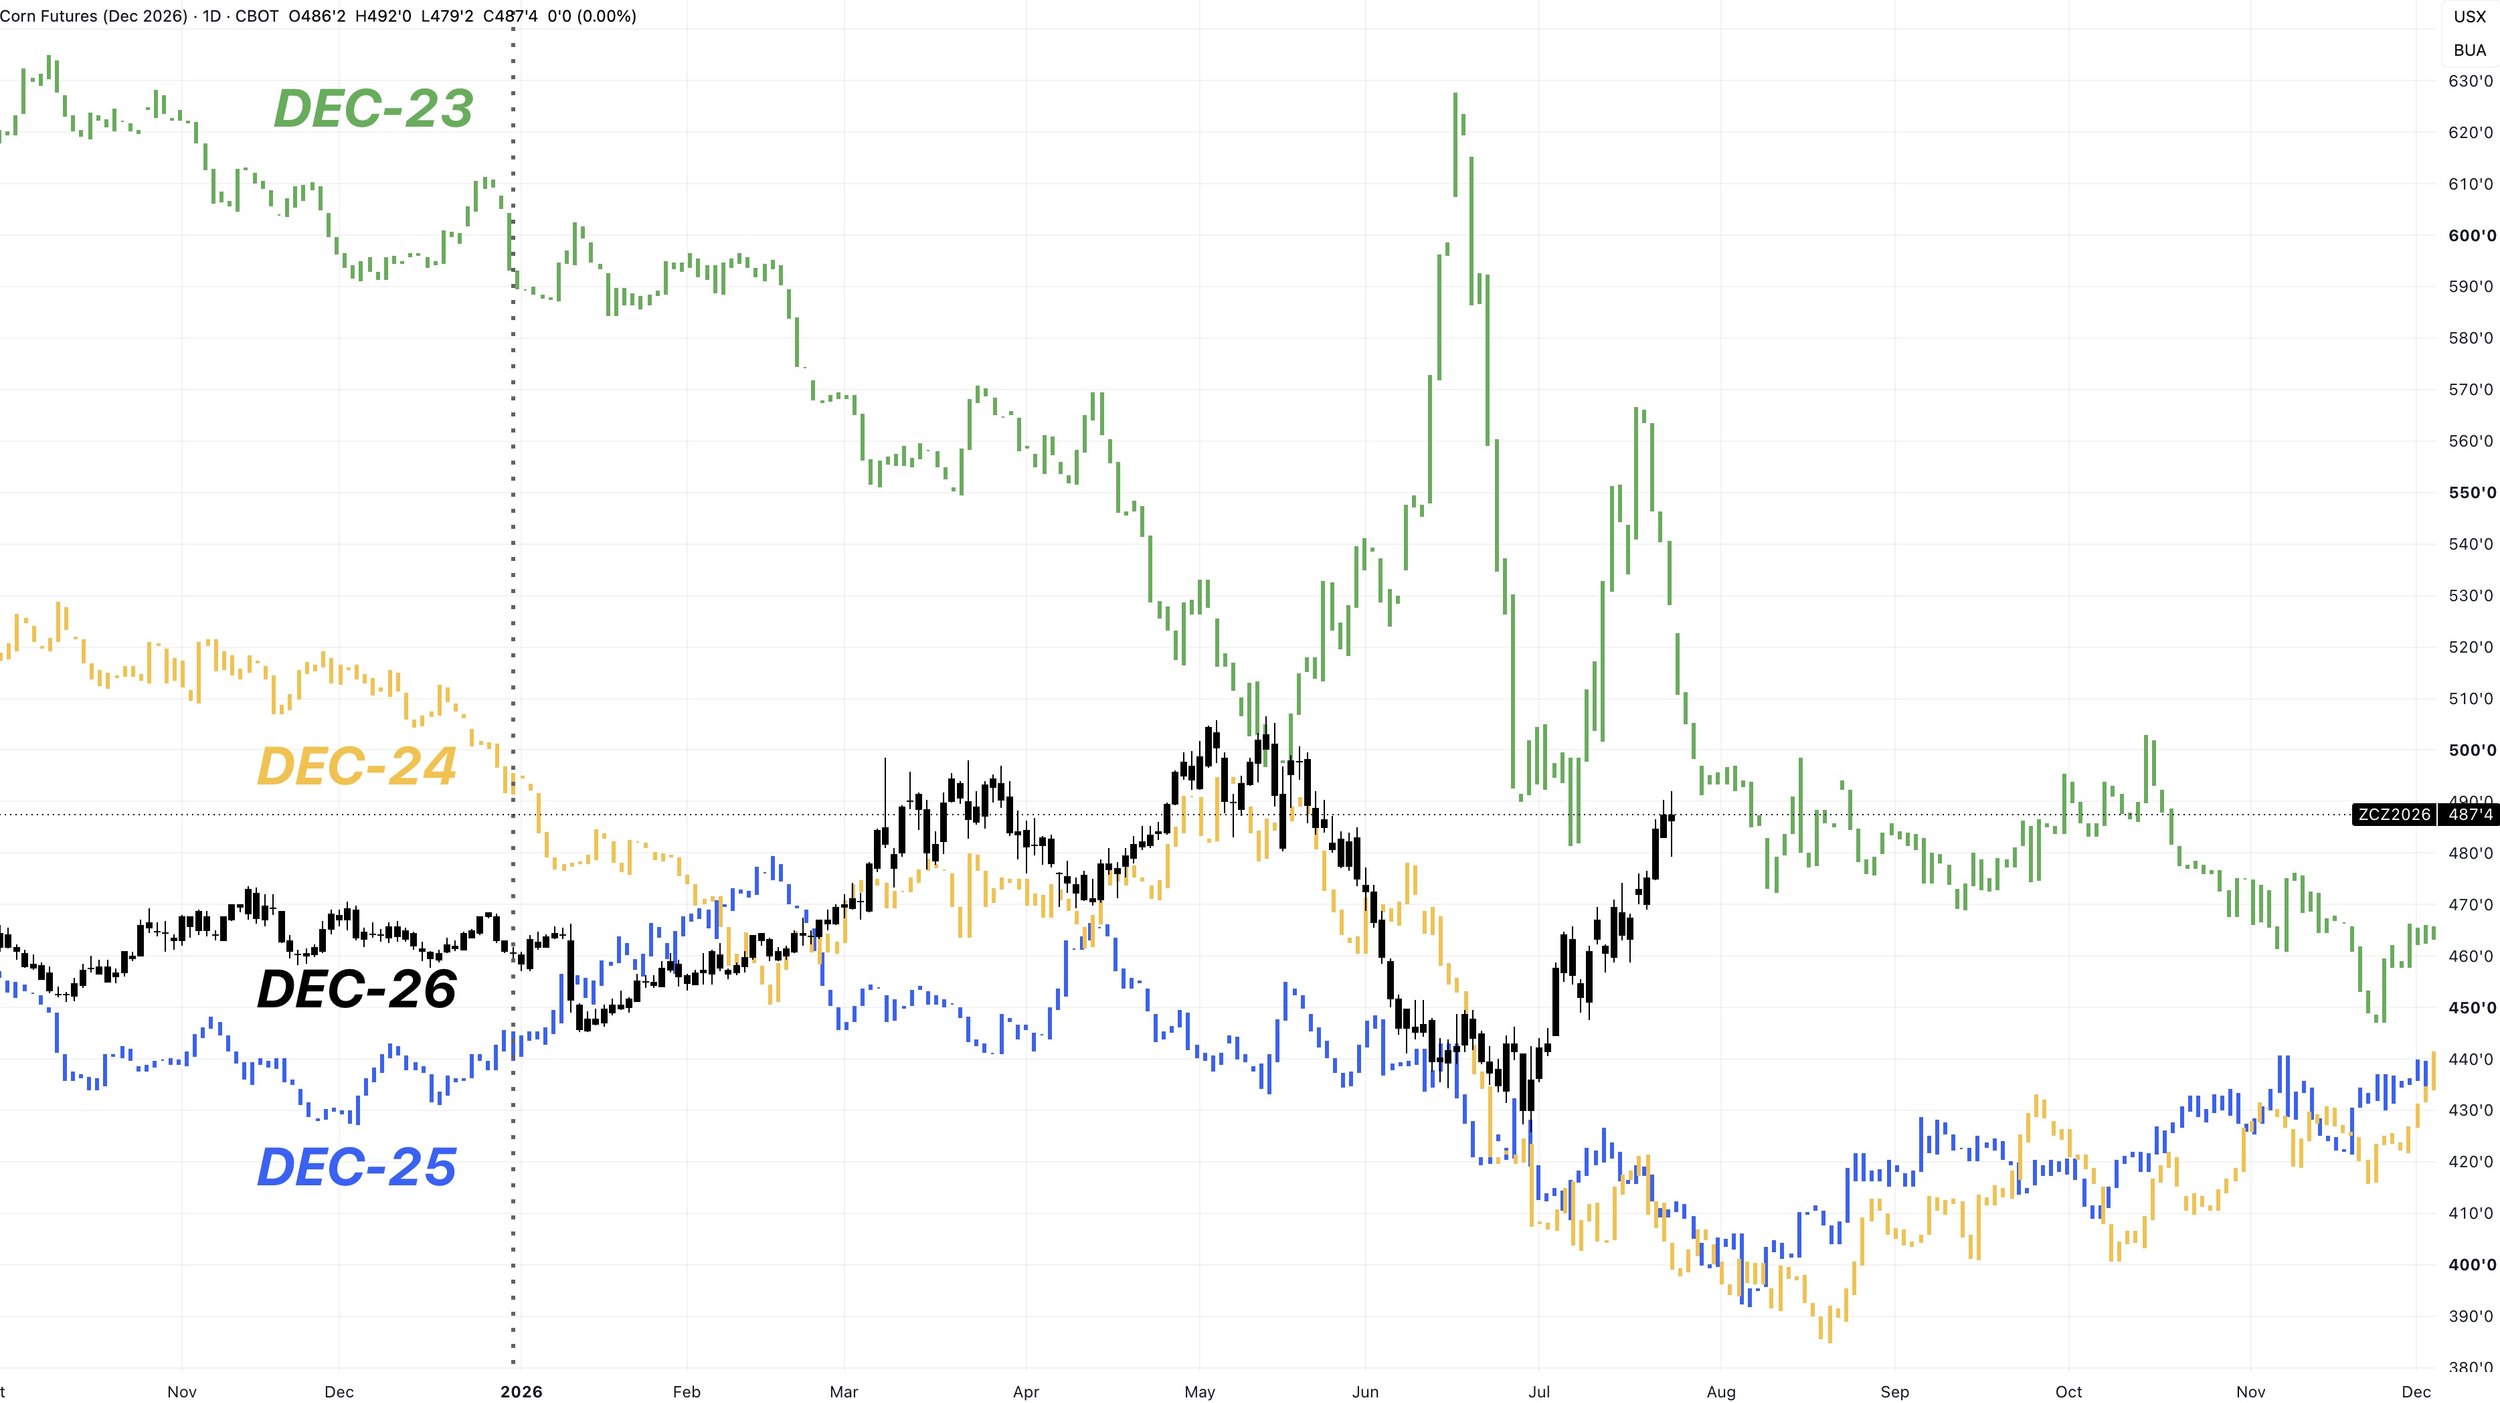
If you compare new crop corn vs the last several years, Dec-26 corn is well above where it was the last two years.
We're nearly +80 cents higher than we were last year at this time, and +90 cents higher than where we were in 2024.
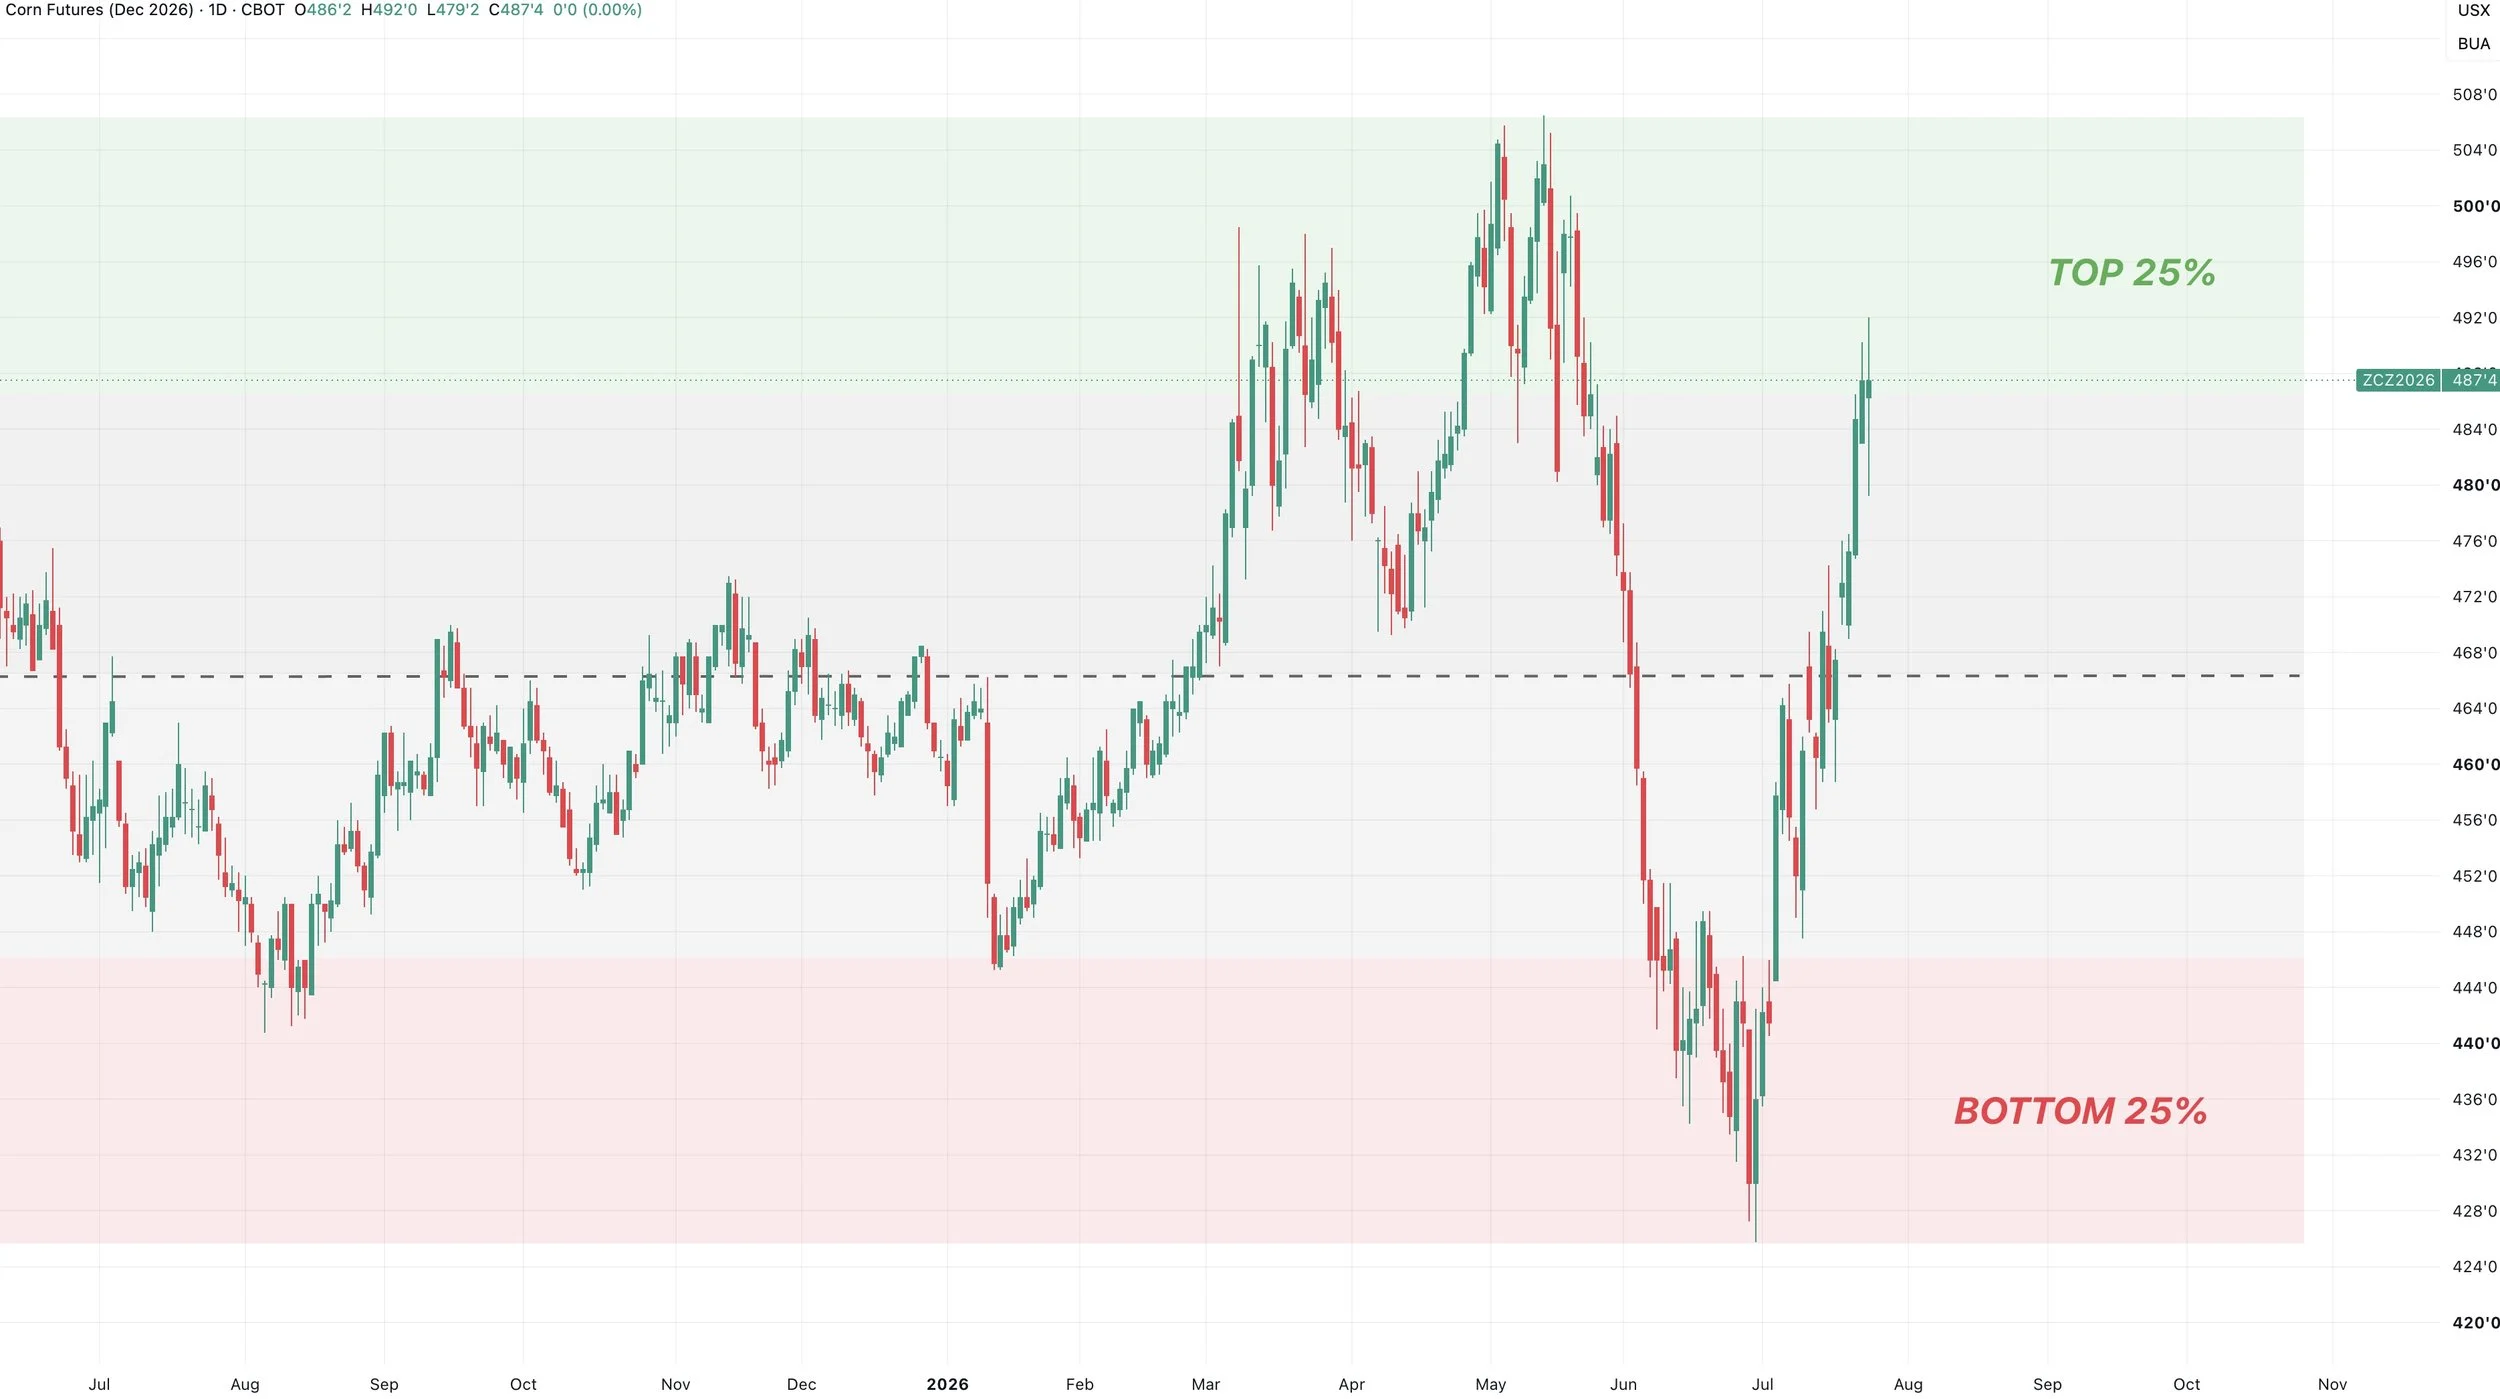
Dec corn is also now sitting in the top 25% of prices we've seen all year long.
So if you are someone who was kicking yourself for not doing anything back in May, you do have another opportunity.
I am not saying to go out and sell everything. At all.
In fact, those with plenty of storage and don’t need cash etc. We do not mind staying patient into later this year and into next.
But those who cannot afford to be patient, this has been a great counter seasonal rally.
Why I think we can still go higher long term:
I've went over the long term fundamentals countless times.
I am not an agronomist. So I am not going to pretend like I know where yield is going to come in at.
However, what I can tell you is that the market cannot really afford a yield below trend.
For starters, the USDA expects our new crop exports to be worse than last year. I wouldn’t say that's a given as demand hasn’t been slowing down.
I'd argue prices need to go higher to incentive losing that demand. It doesn’t just vanish because we have less production vs last year.
You could also argue that our old crop exports need to be bumped even further. We are currently running around 180 million bu ahead of the USDA pace.
If the USDA bumps old crop exports, that lowers the new crop balance sheet even further. Via lowering the beginning stocks.
It takes a trendline yield for us to get an 11% stocks to use.
With plenty of possible ways for that to get tighter.
Let's not forget what happens to the corn market is China starts stepping into what is already record demand.
Not to mention the possible effects from inflation and the whole fertilizer story and on going geopolitics.
I am not usually one to be overly bullish. However, I do think there is the possibility for much higher prices long term if the cards fall right. It doesn’t have to happen, and doesn’t have to happen right away, but the path is there for the first time in a long time.
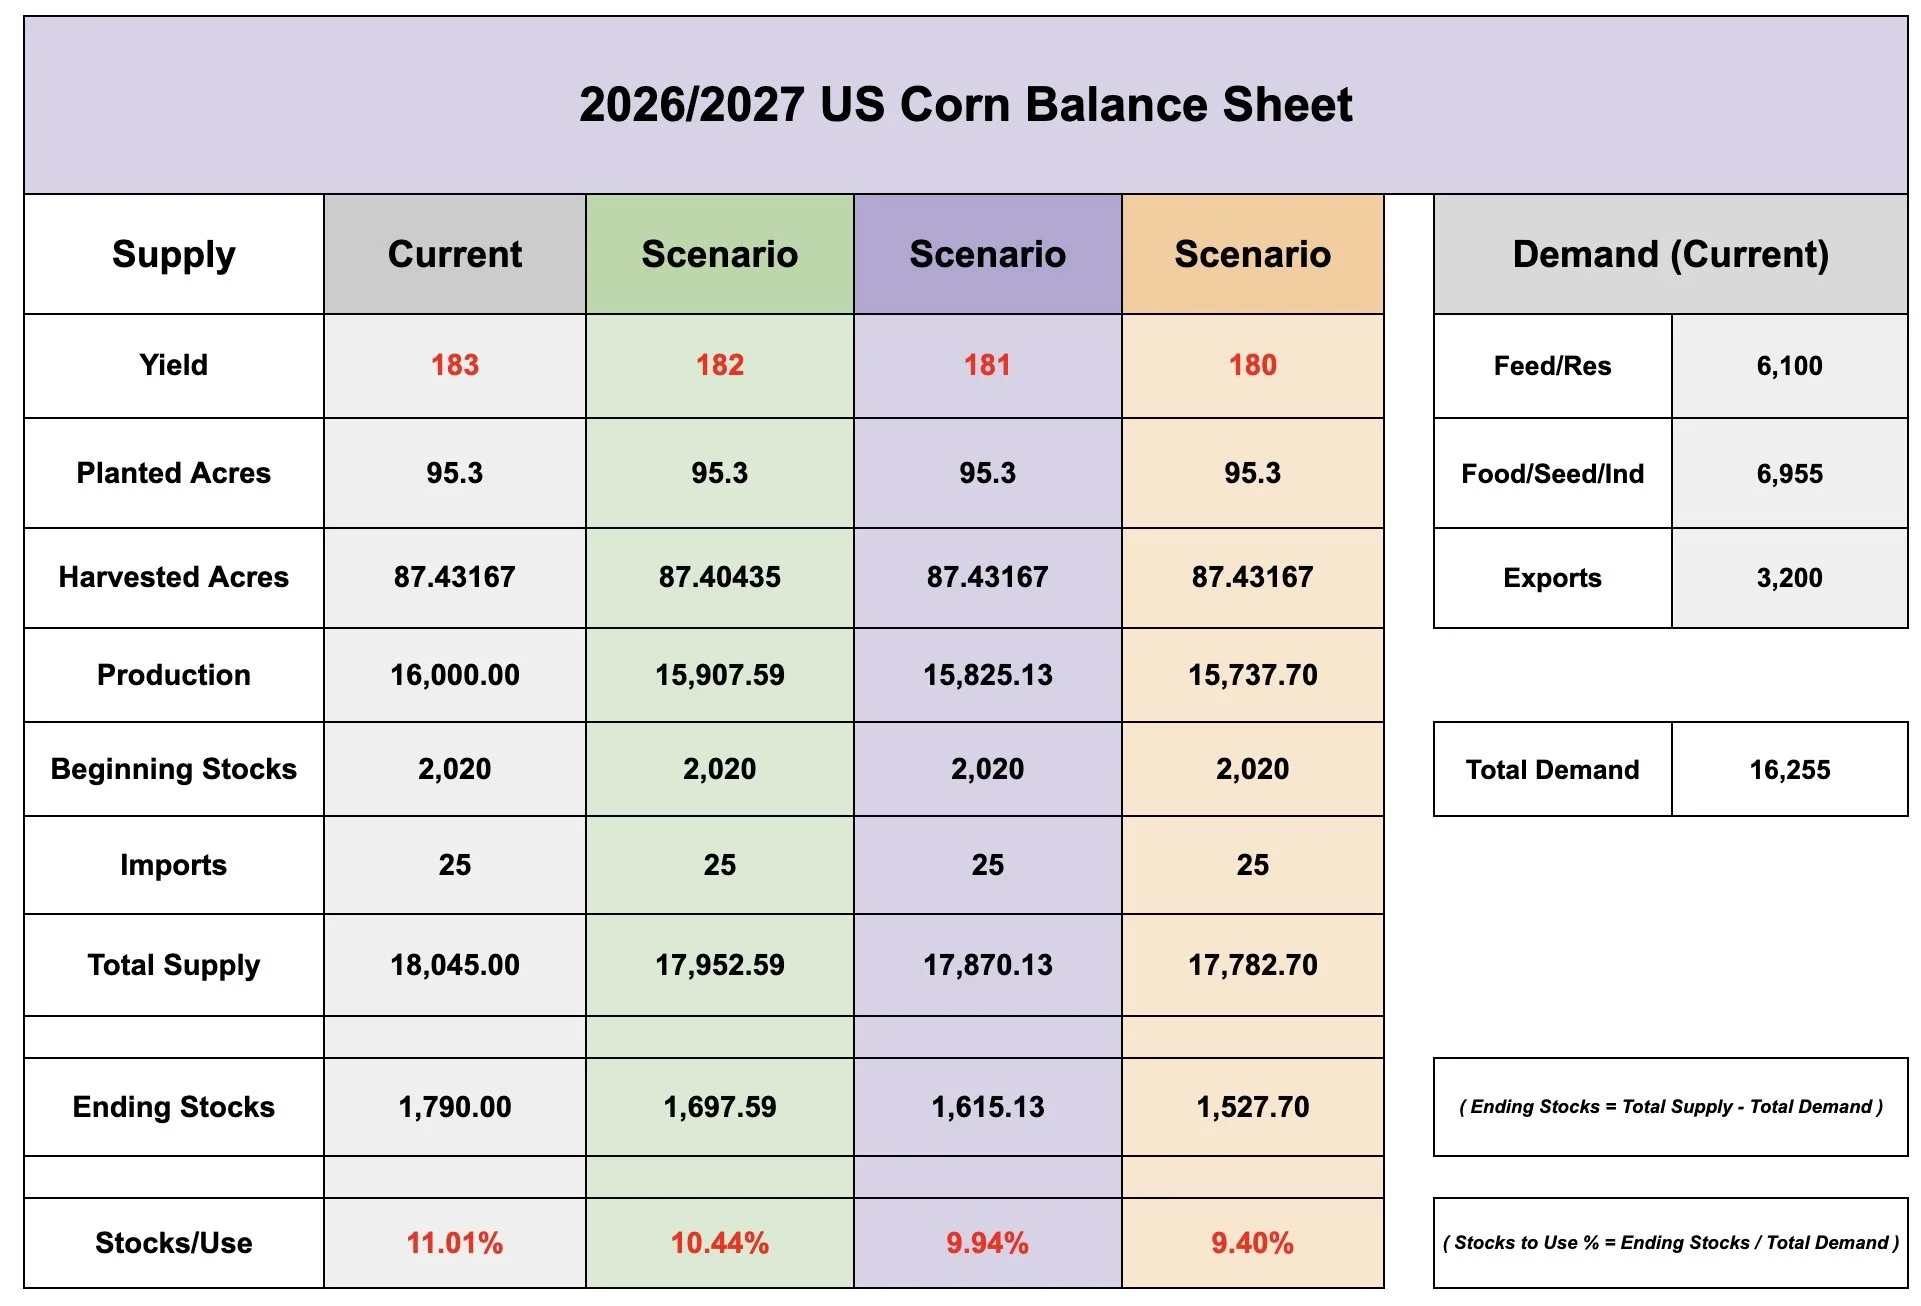
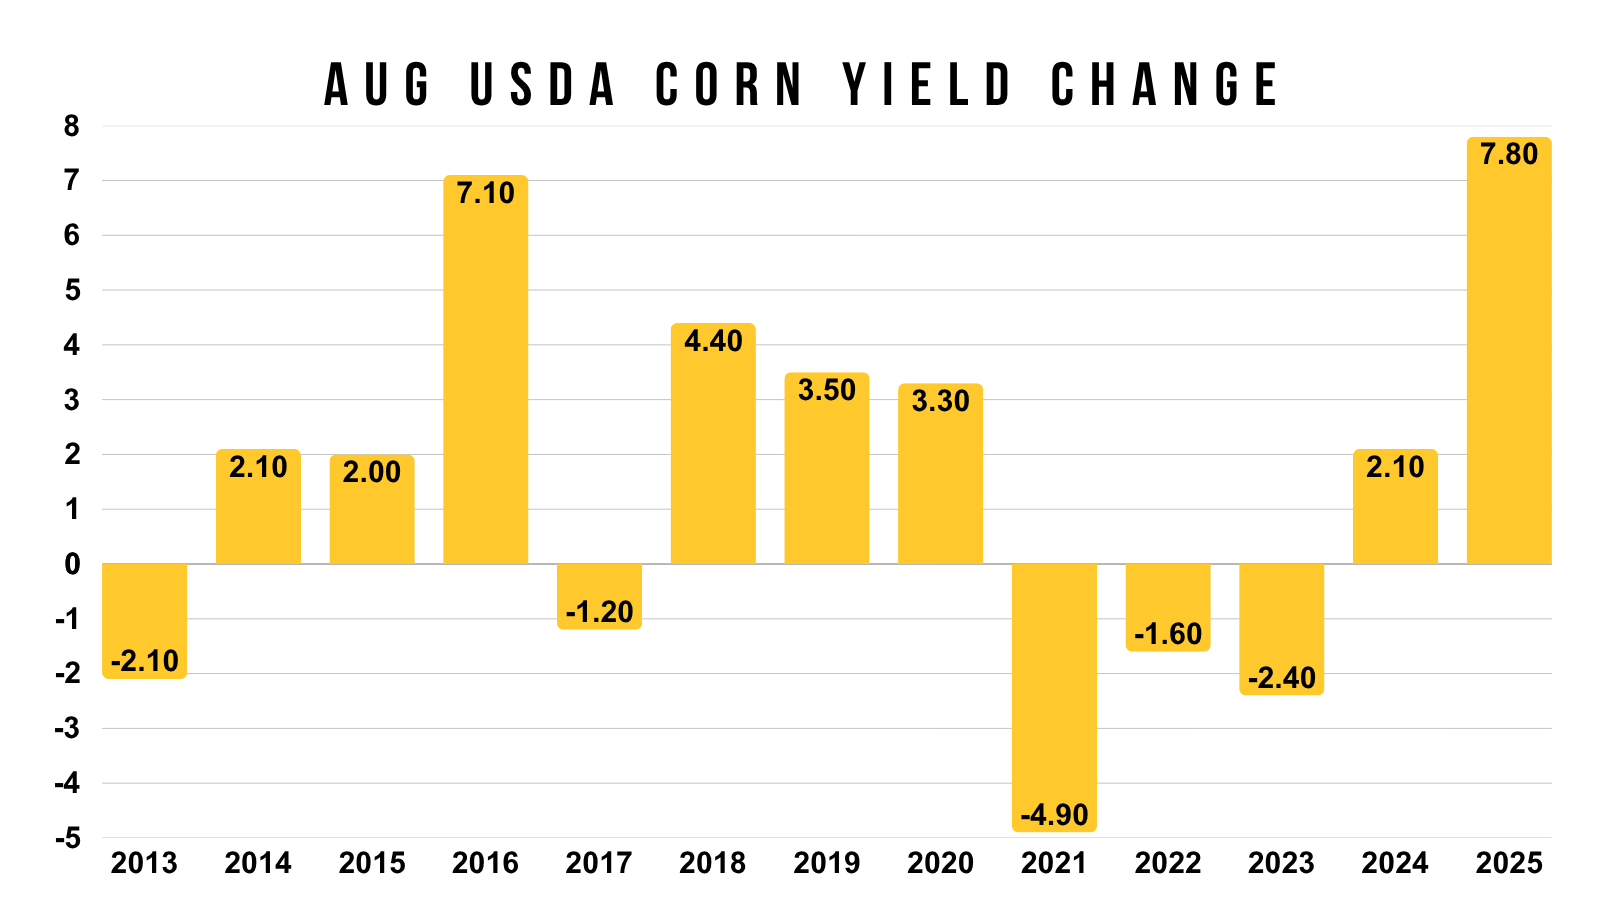
Does USDA change yield or acres in August?
For yield, yes they absolutely do.
In fact, we haven’t seen less than a 1 bpa change in a very long time.
There is several years where it gets moved pretty drastically.
Last year was one of the biggest increases we have ever seen at nearly +8 bpa.
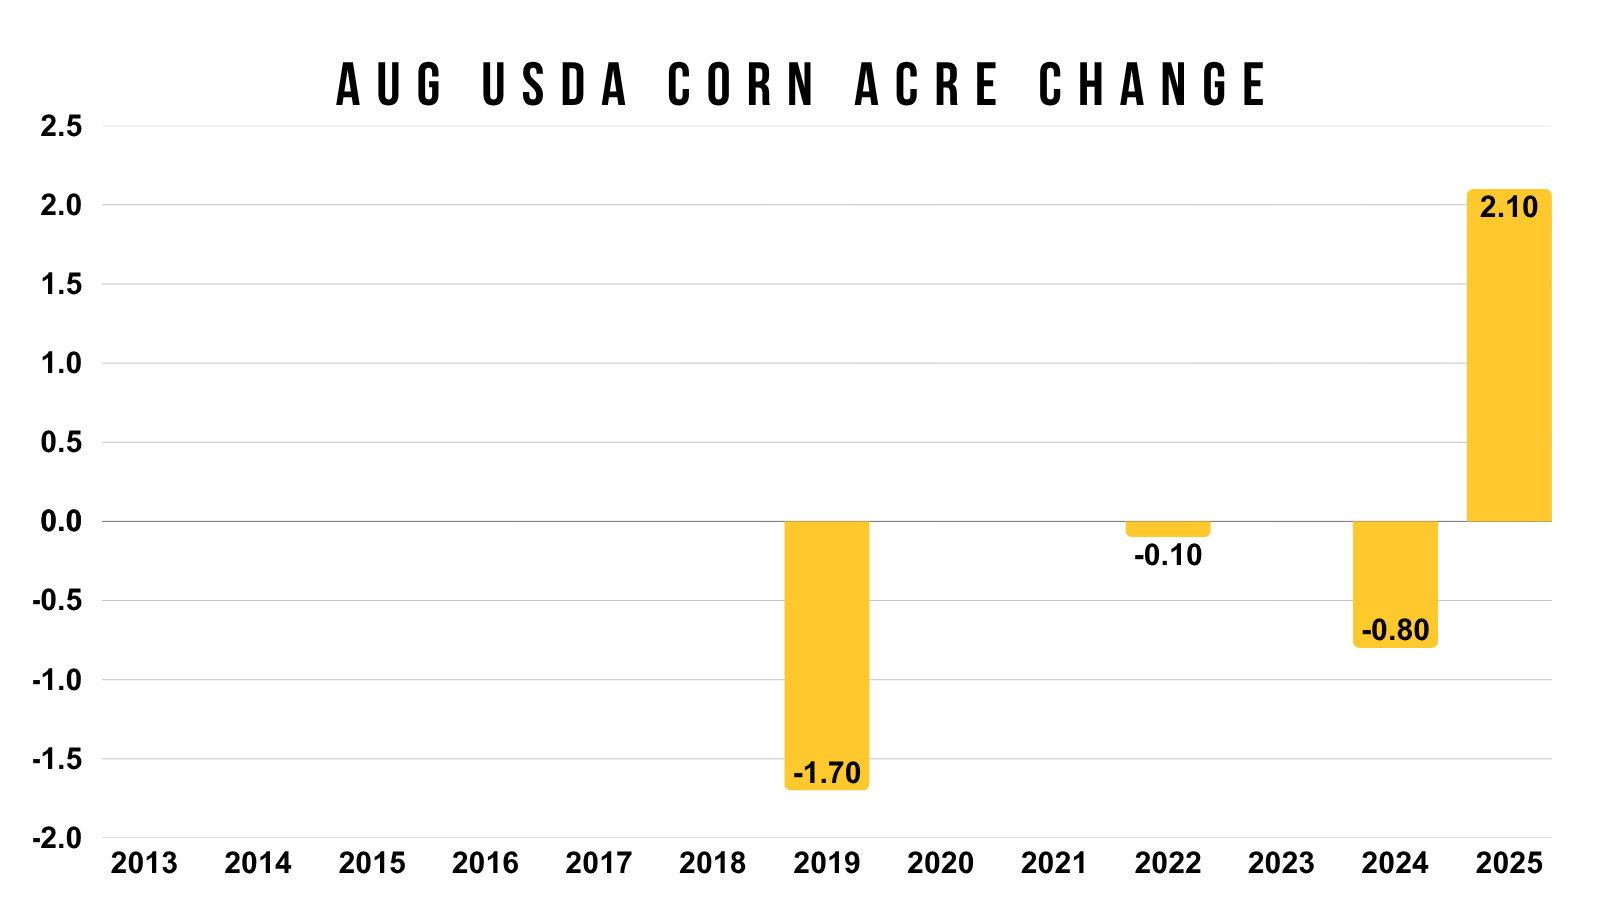
Acres are a different story.
Up until recently, the USDA almost never adjusted acres in August.
The first was in 2019.
But the USDA has made sizable changes in the August report both of the last two years.
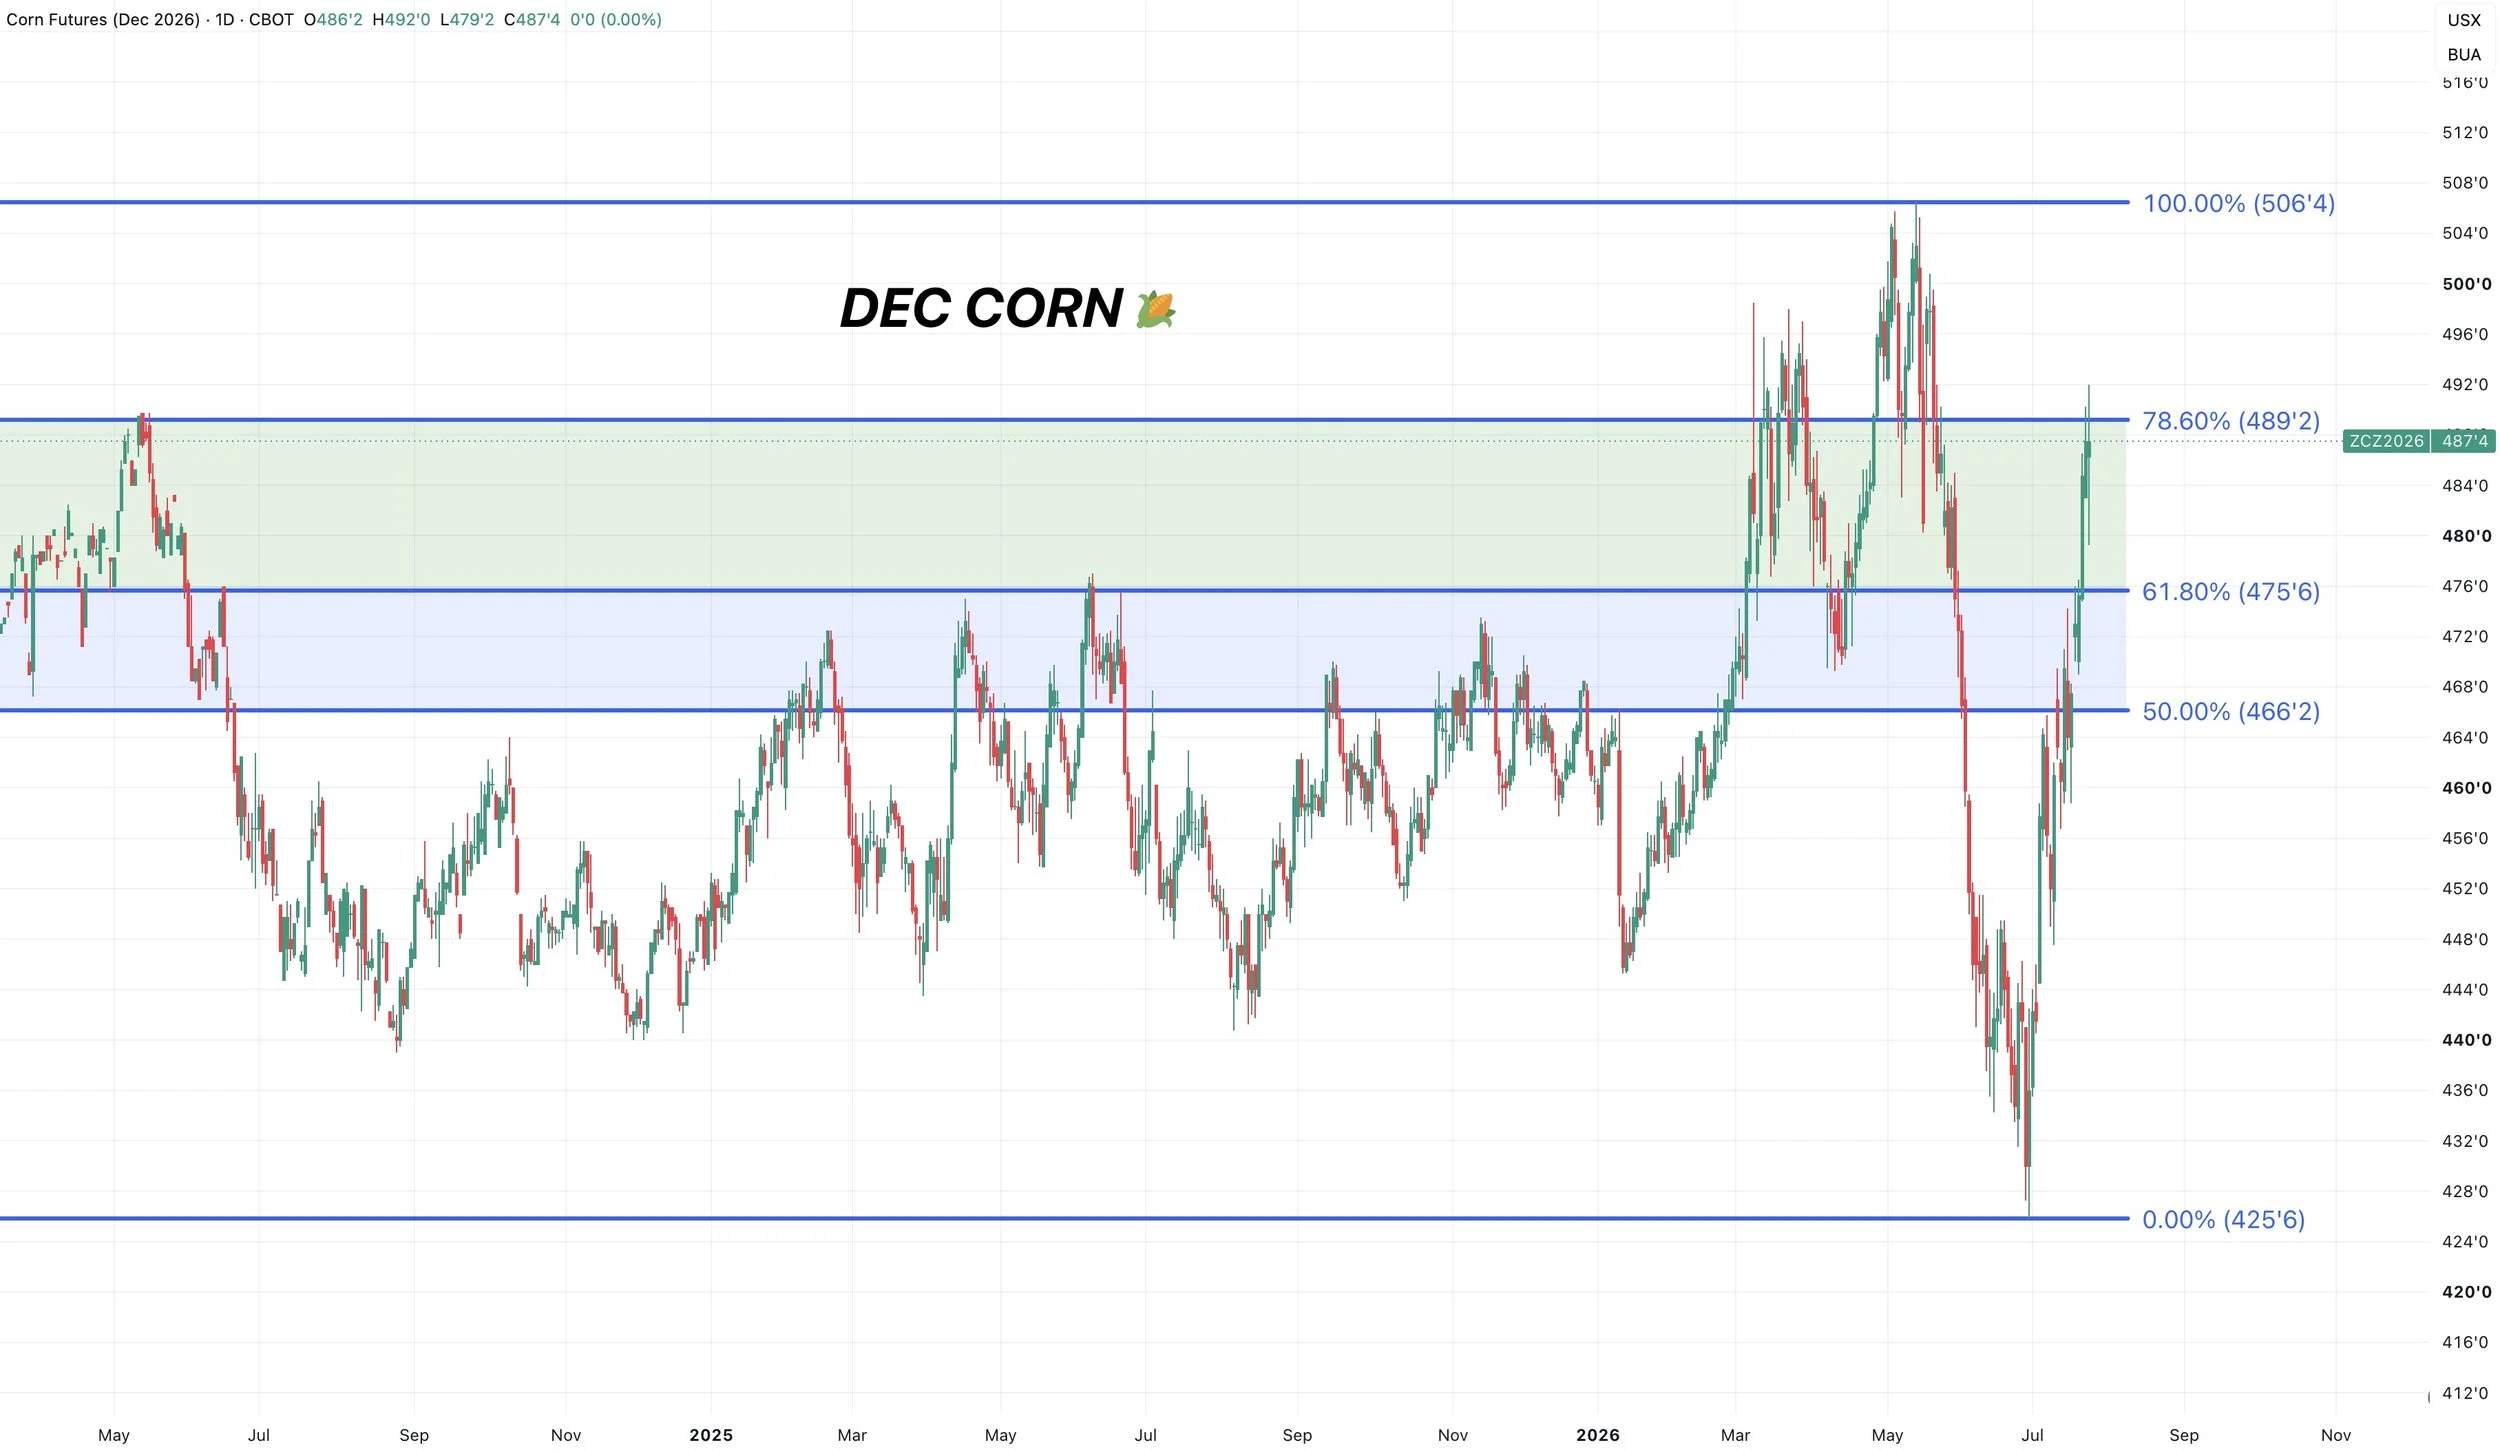
Dec Corn Chart:
We broke above the golden zone which was our first target.
That is a good sign as it means this market may now be in an overall uptrend.
We are now up against the last retracement level.
Which is the 78.6% retracement up to those May highs. So this would be the 2nd target.
Break that level and the next level is those highs.
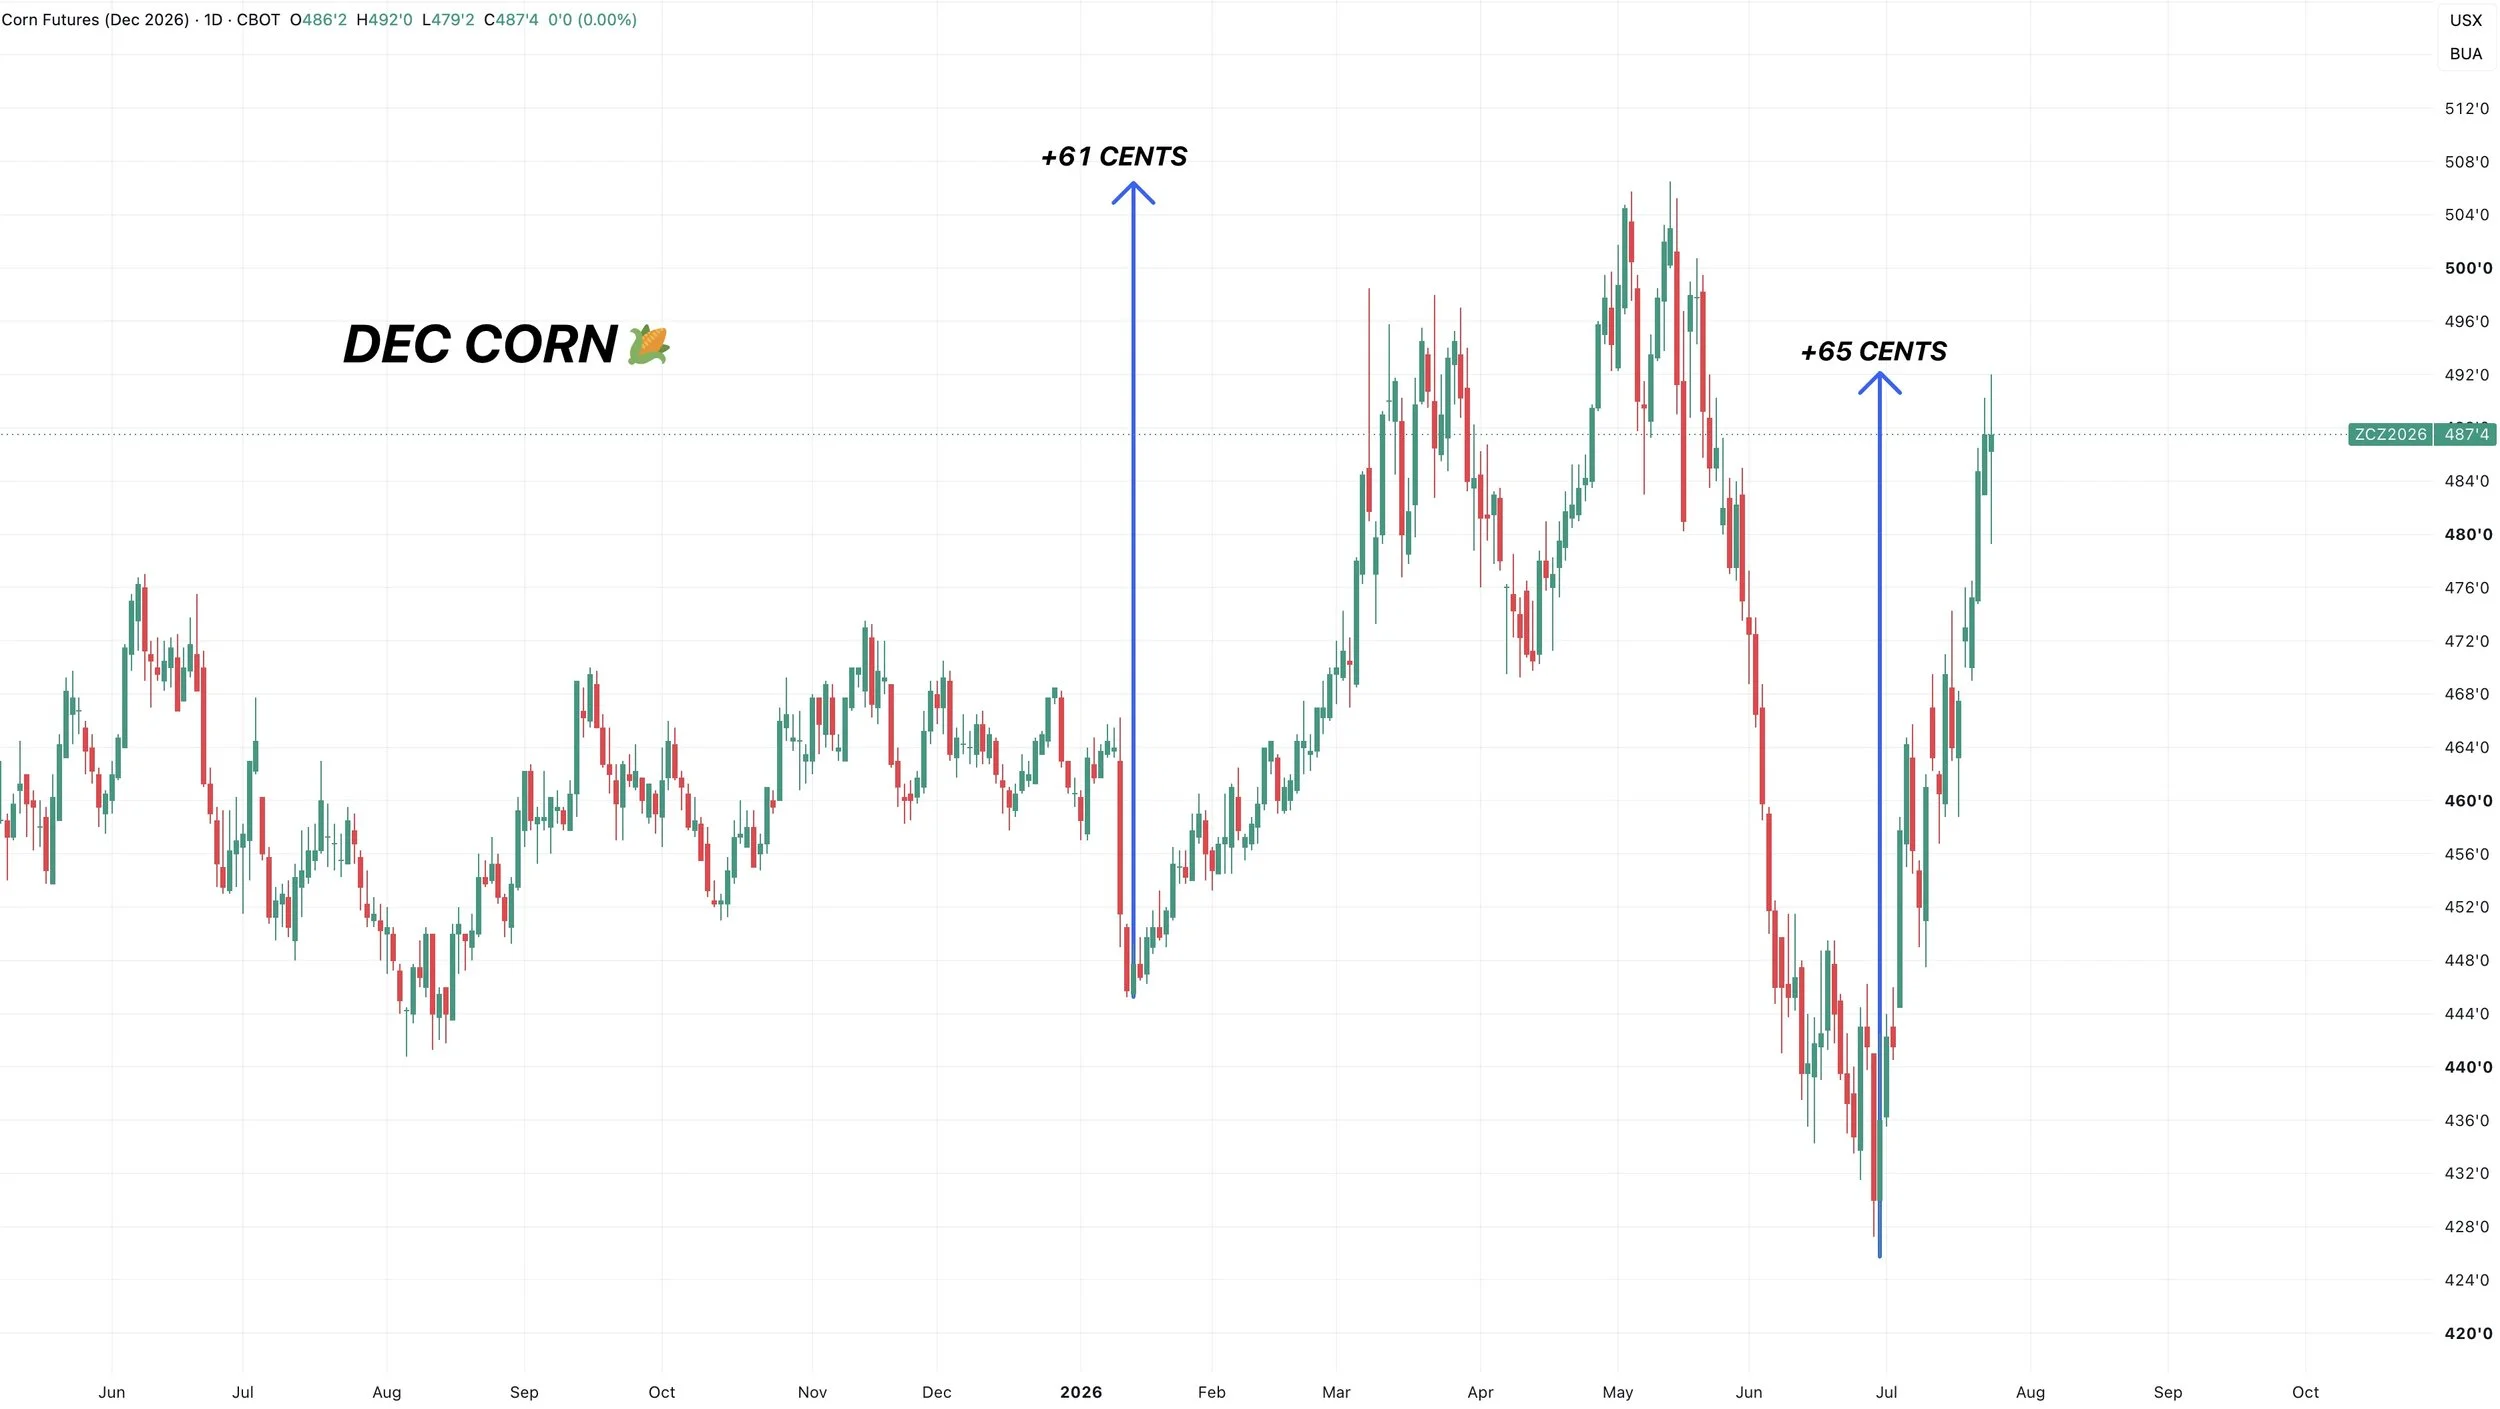
This rally off the lows has been almost the exact same size of rally we saw from January to May.
So we've now seen a 1 to 1 move.
Which may be another reason for some to defend this level.
Sep Corn Chart:
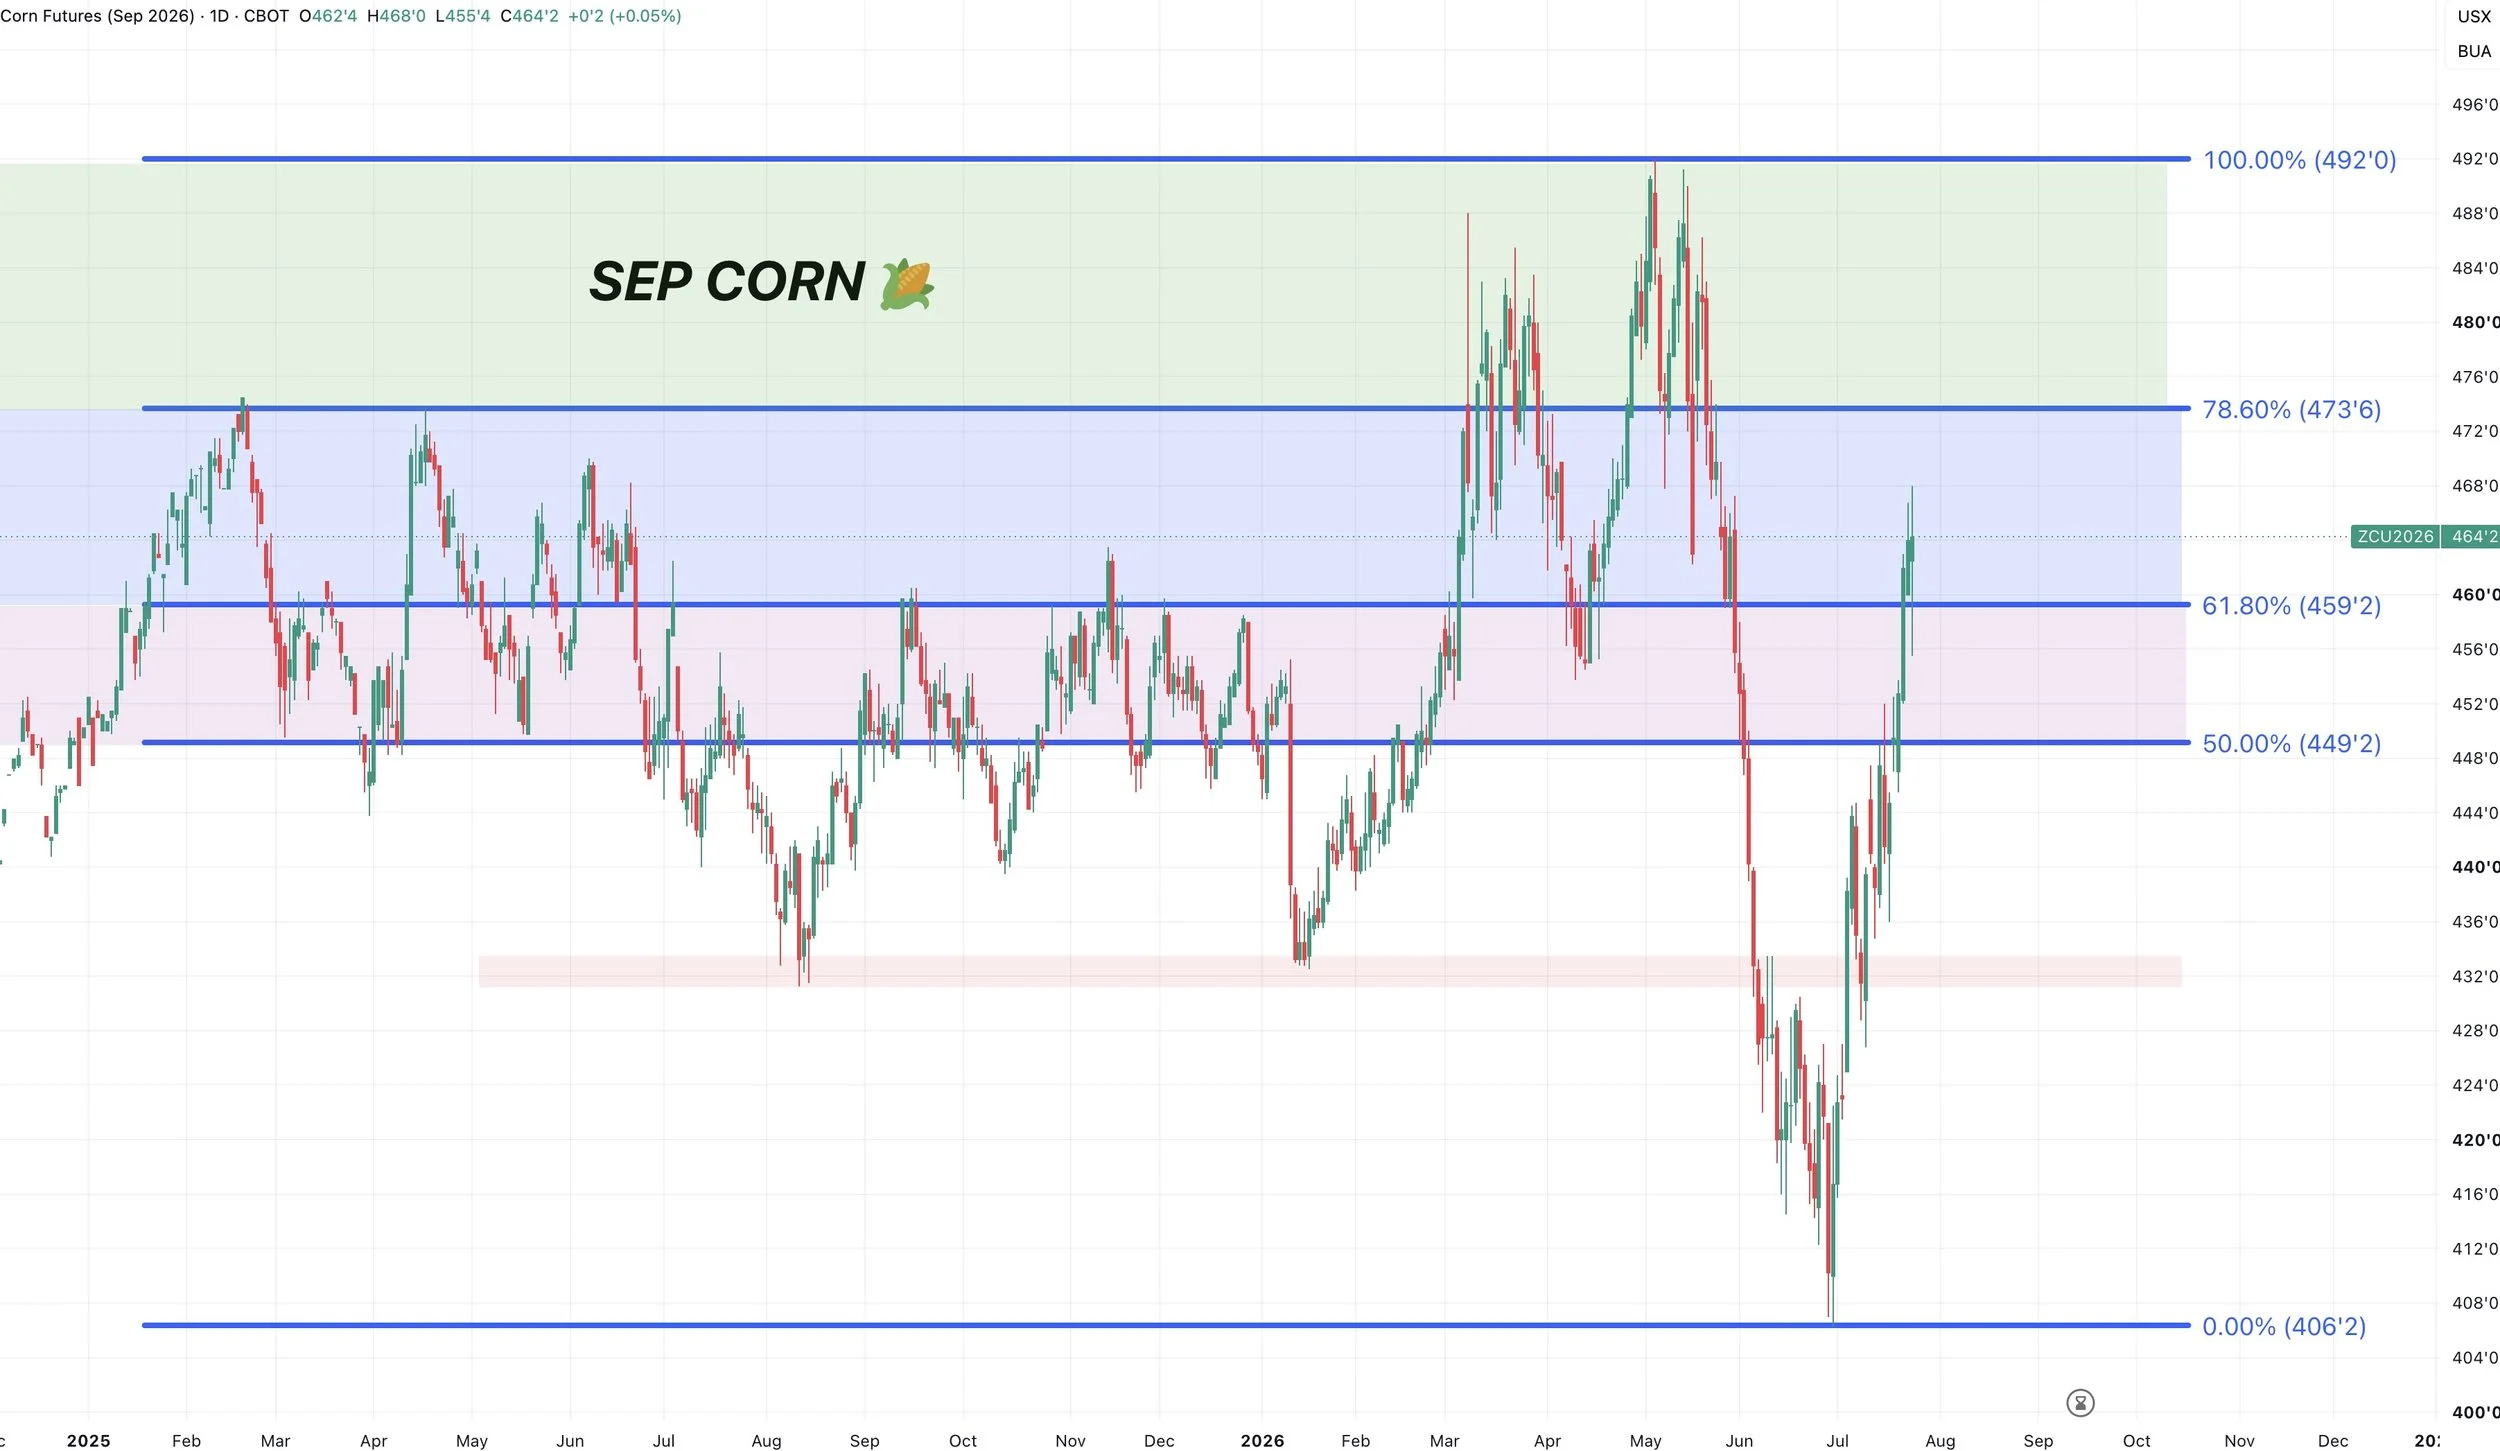
Sep corn also broke the 61.8% retracement which is a good sign.
Now sitting between the 61.8% level and 78.6% level.
This range has provided some stiff resistance in the past.
So not the worst area to defend.
Weekly Sep:
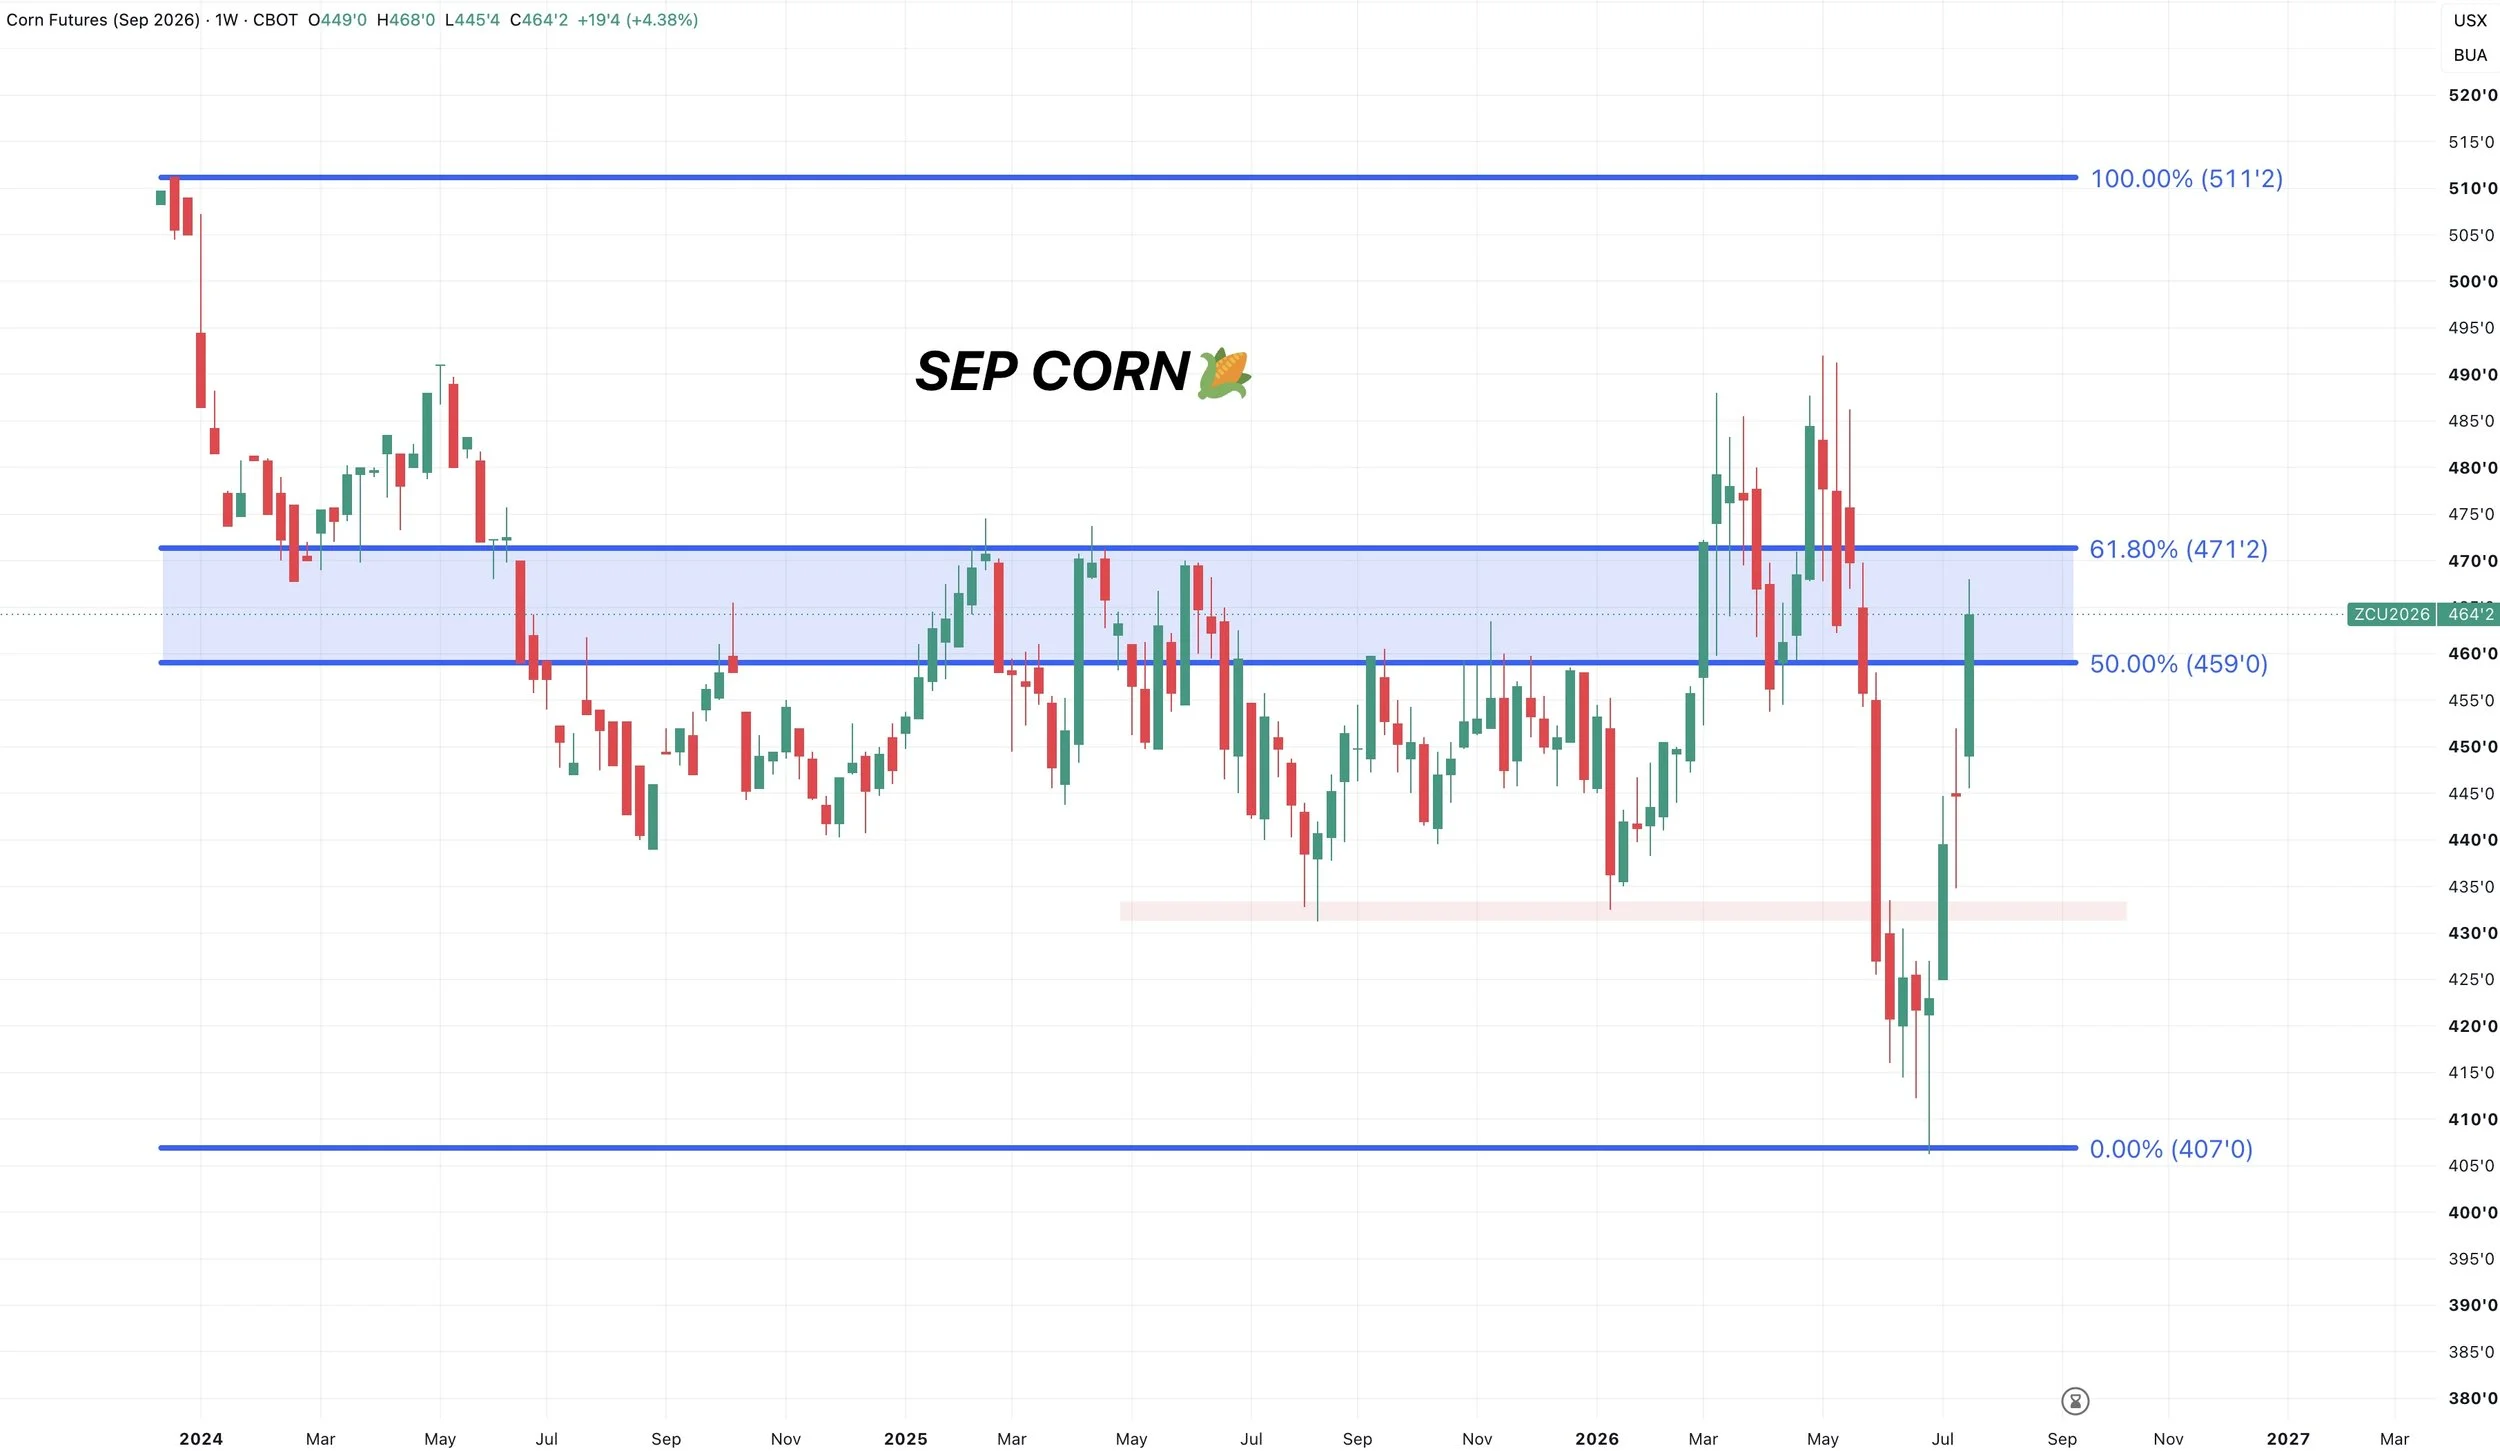
Here is another perspective.
If you take the contract lows to the contract highs, we are sitting right in the golden zone.
That 50% level was big resistance last fall. We broke through.
The 61.8% level was big resistance last spring. So that's our next major level.
So I think it makes sense to defend this area between here and $4.70
Big Picture Chart:
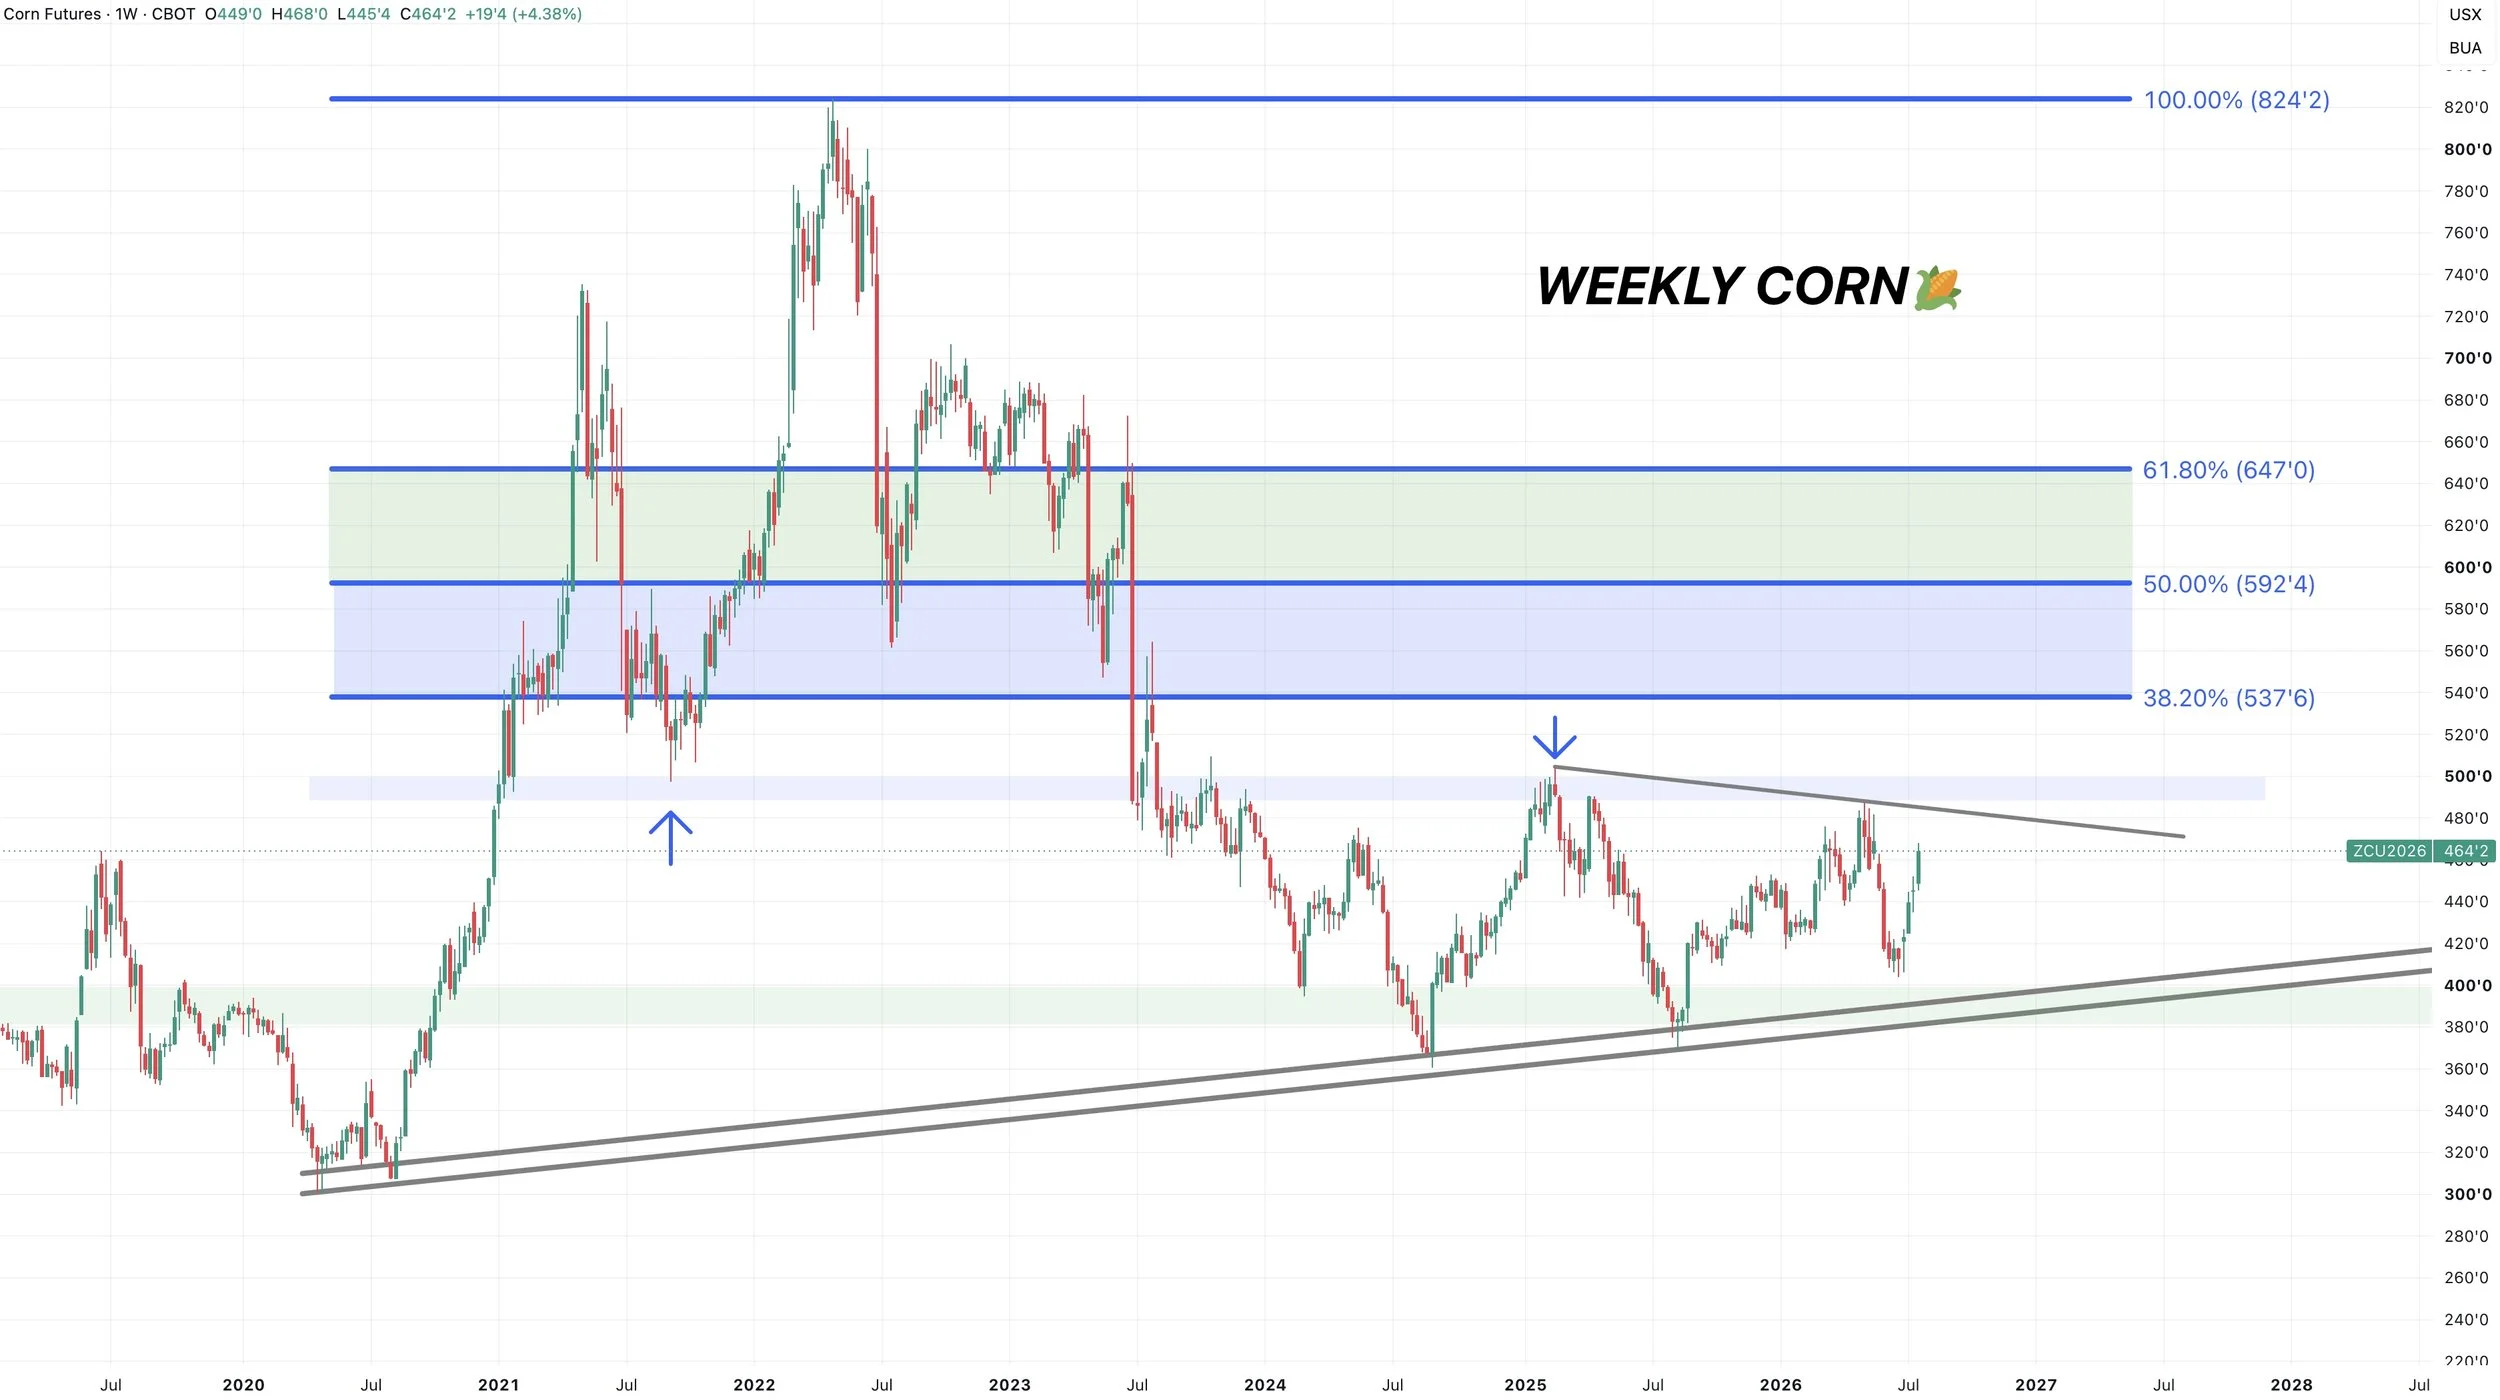
I had some people ask about possible long term targets. So here is the weekly front month chart.
$5.00 still remains the big level. If that level is broken, the long term trend in corn will offically be higher like it is in beans and wheat.
That would be our first higher high of the entire bear market, and would suggest the bear market is potentially over.
If you throw on some simple retracements, the first one is that 38.2% level that comes in at $5.38
The next is the 50% that comes in at $5.92
Then that golden 61.8% fib is at $6.47
So those would all be some long term possible targets that of course could take years to play out if at all. When the time comes, this won’t be the only thing we look at either.
But the biggest thing to watch is that $5.00 level
Soybeans
Soybeans continue to rip higher.
China is buying soybeans.
Weather is hot and dry.
Crude is running and soybean oil is finding life.
The funds are long the entire soybean complex as they continue to see a story.
Short term, weather is going to be the key. If it stays hot and dry heading into August, this thing can go higher than you'd think.
On the flip side, all it takes is one change of the forecasts to spook some selling into this market.
Long term, as I've stated for a long time there is plenty of potential in the soybean market.
I've shown this chart before.
This is our crush demand vs our export demand.
Crush is phenomenal. Exports are not.
But here is another chart.
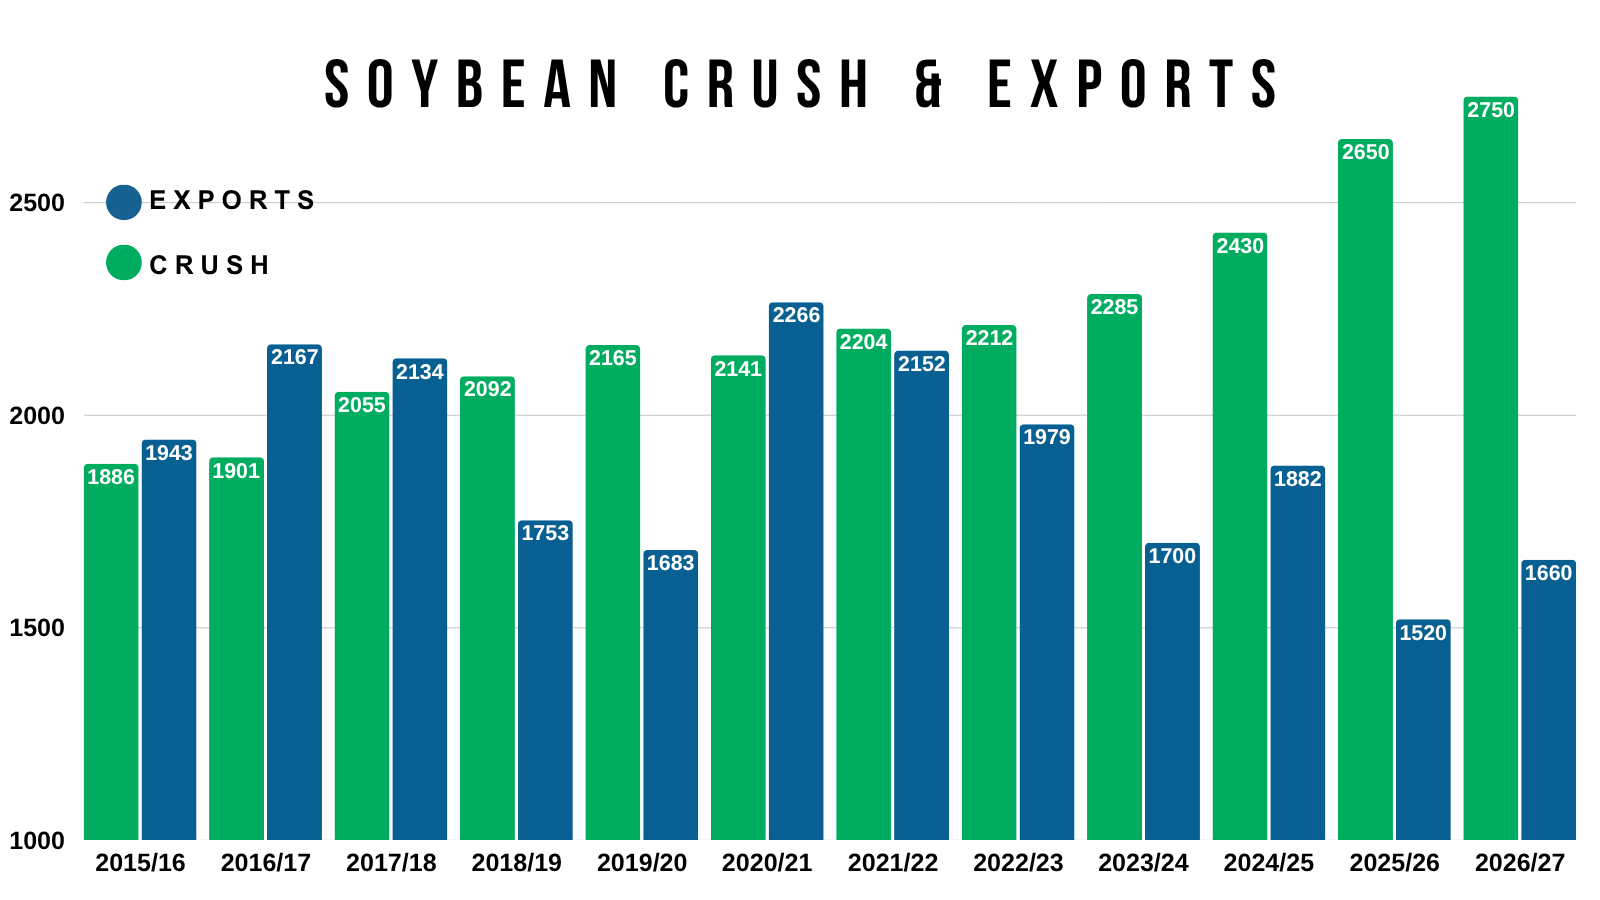
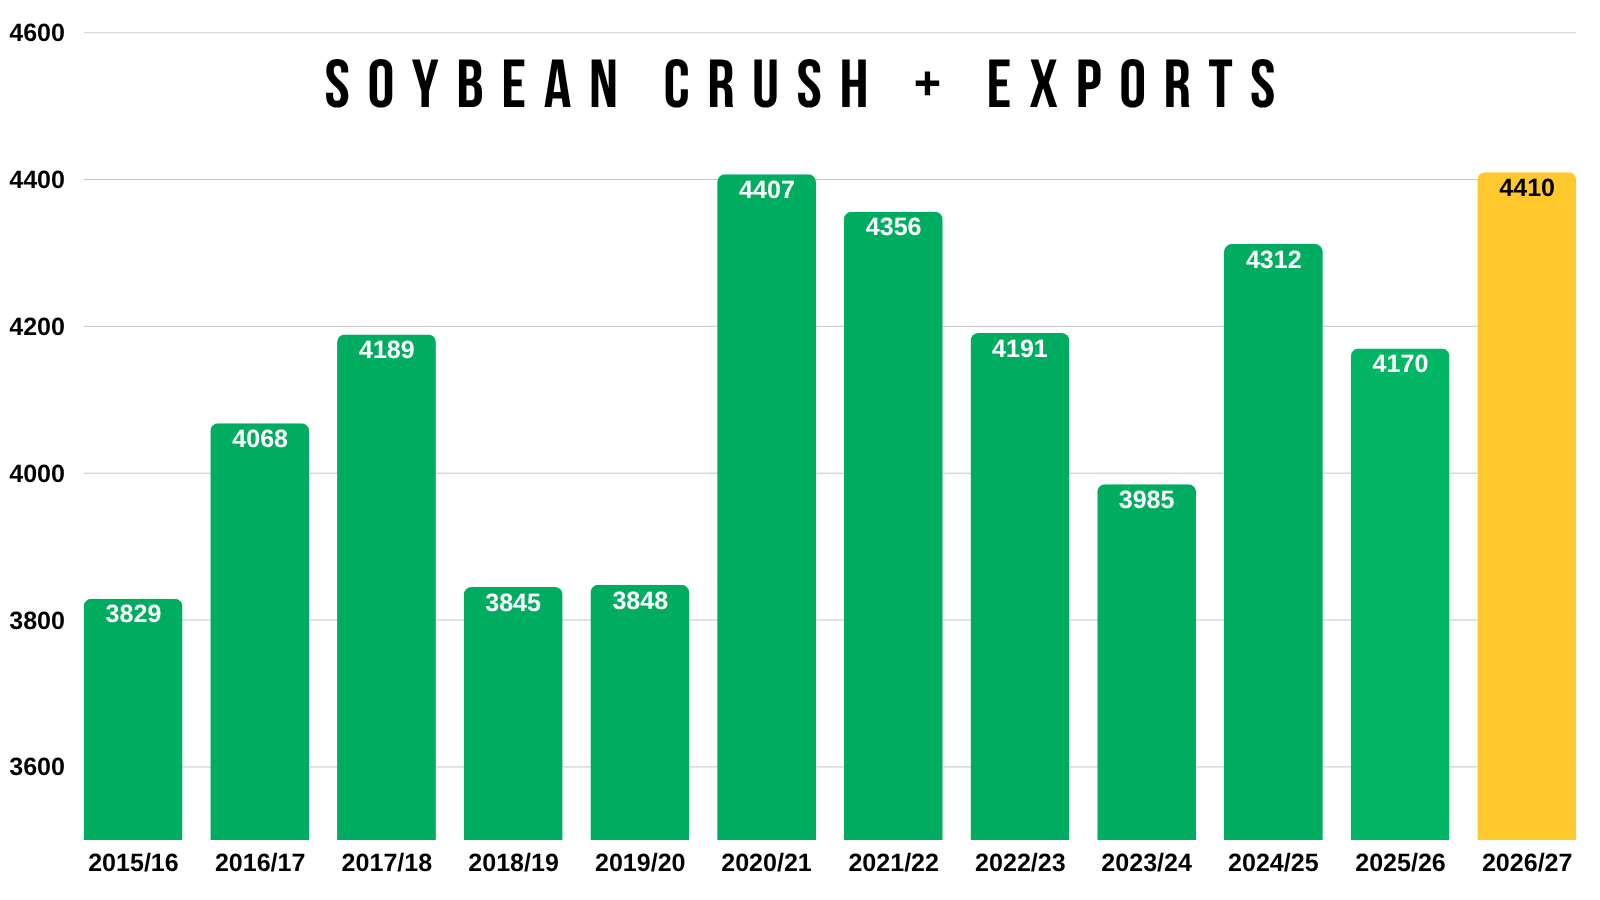
This adds our total crush demand + our export demand for every year.
The total demand between the two is higher than it was in 2021 and 2022 due to crush demand carrying the weight.
As the increase in crush is outpacing the loss in exports.
So even with lousy exports, domestic demand is the best it's ever been.
This has to make you wonder, what happens if export demand improves?
What if exports even return to normal levels?
Crush demand isn’t going anywhere. If exports improve, that would be one possible way you can run into a demand led market.
Demand rallies are rallies that actually last.
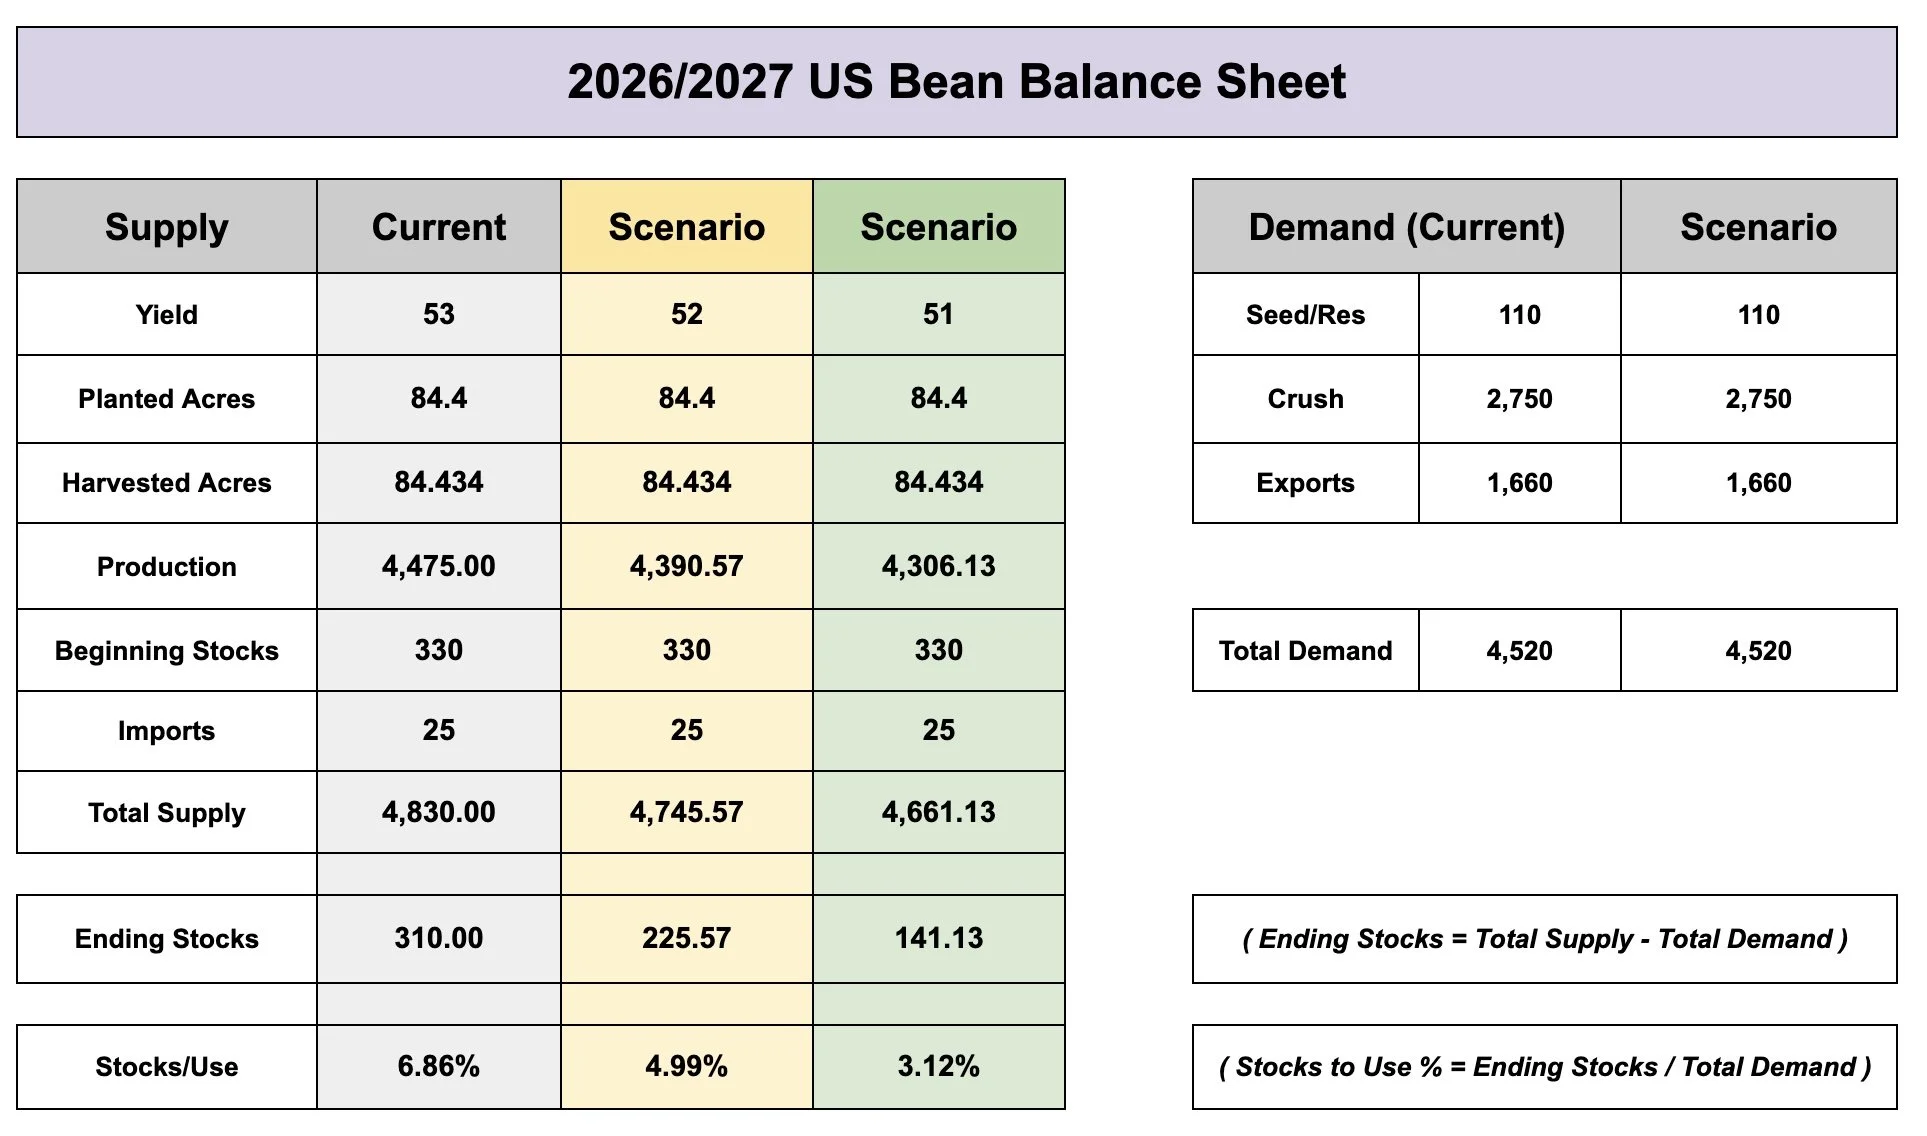
China is suppose to buy 25 MMT of new crop soybeans.
That number is 25 MMT no matter how big or small our crop is.
It's that number whether soybeans are $10 or $13.
Again, I'm no expert when it comes to determining yields.
But even if yield slips just slightly, the soybean situation could flip on it's head and completely change this market.
If we lose supply, the market will be forced to ration demand lower to prevent the balance sheet from getting too tight.
If we already have our exports to China locked in. The market will have to go higher to justify us losing that non-China demand.
Not to mention we have a Super El Nino. From what I've gathered, this could definitely cause some issues down in South America.
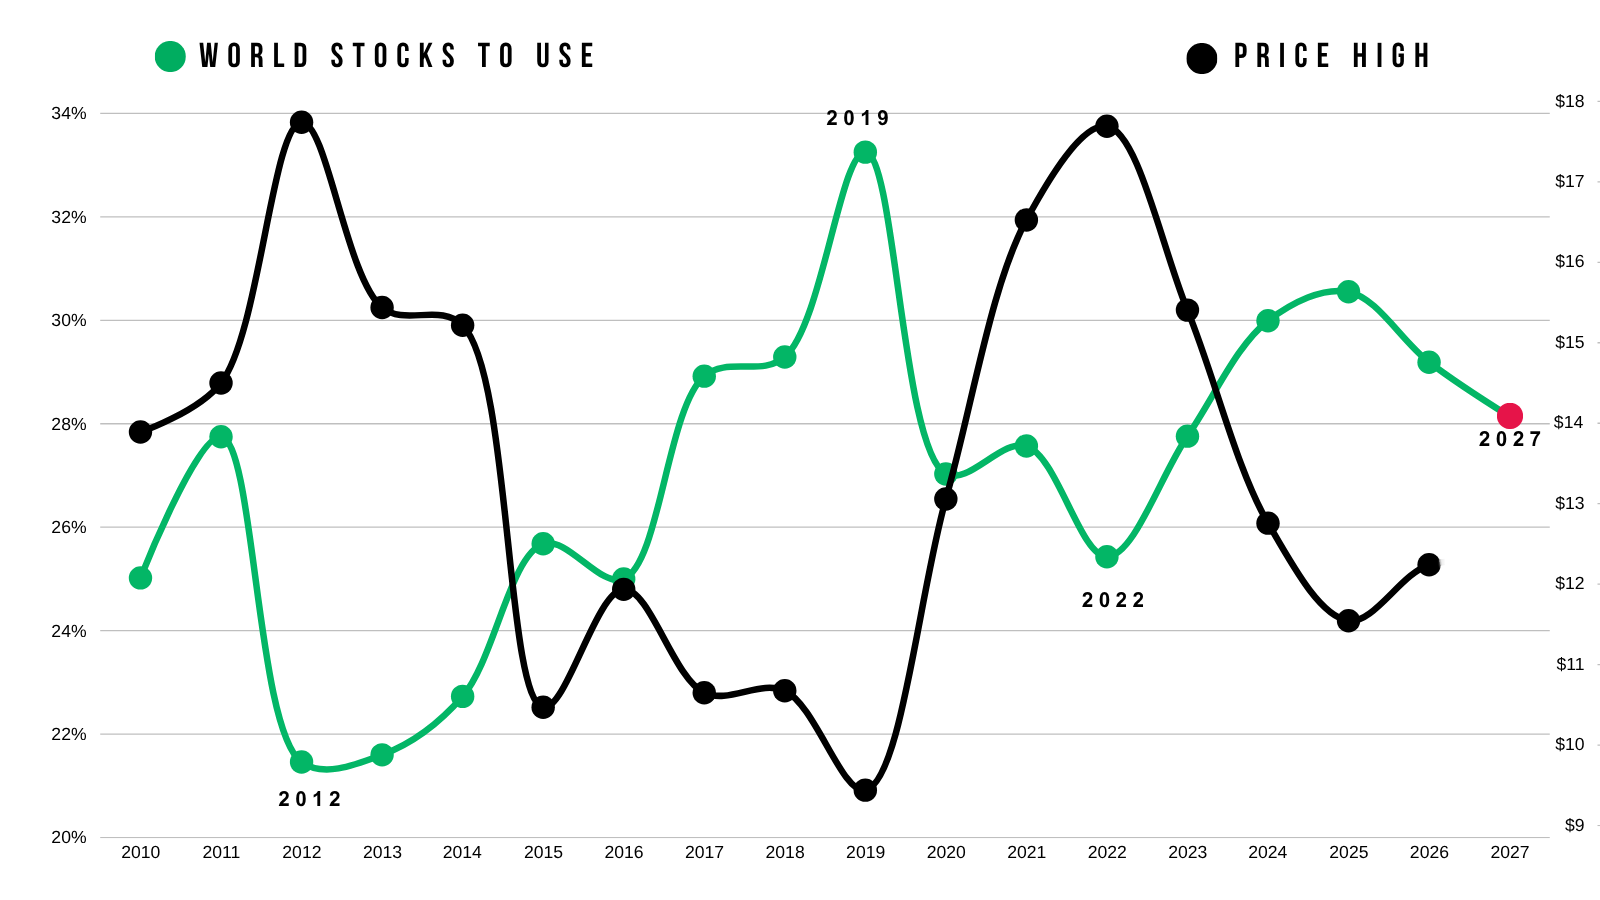
The world story is already the tightest it's been in years.
If South America doesn’t perform, then this chart could get pretty interesting.
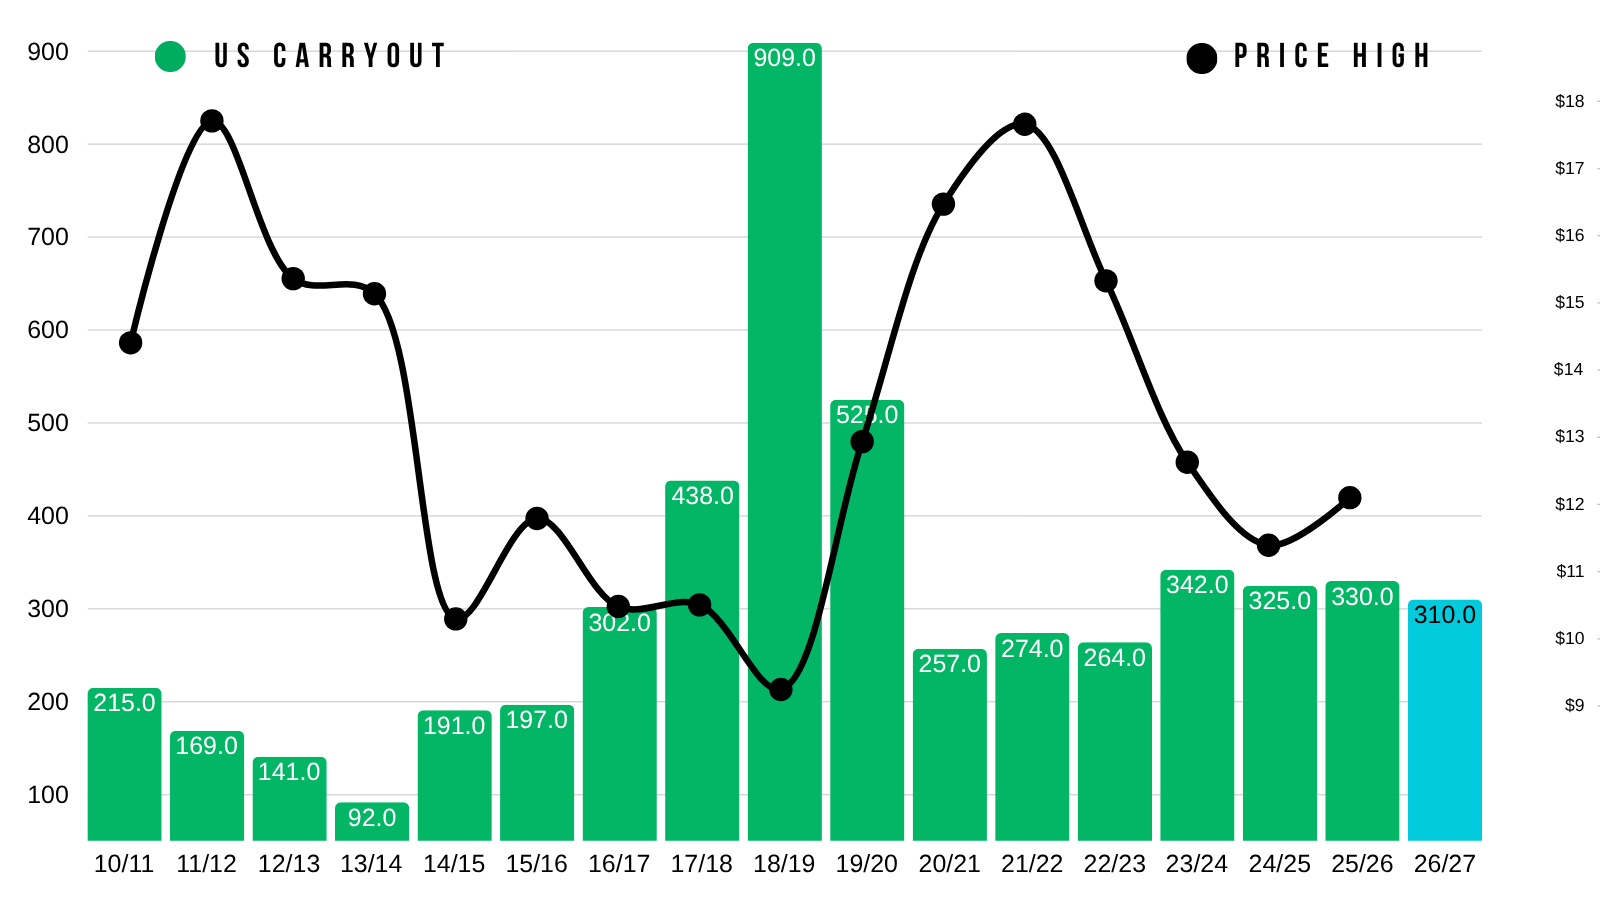
The US situation is also on track to be the tightest in years.
Nov Beans at Multi-Year Highs:
Just because this market has potential, doesn’t mean we have to go higher right away or at all.
All of those reasons above are long term possibilities.
We are still in a weather market, which offers risk.
We can’t ignore the fact that new crop beans are $2.00 to $3.00 higher than we were the last two years at this time.
These are the best prices we've had in a very long time. By a wide margin.
So if you are behind in your marketing, need to do some catching up, or are in a situation where you know you'll be forced to move something.
Sitting at multi-year highs is never the worst spot to do something.
A few days ago we sent out a hedge alert that included some strategies and ways you can protect your downside while keeping your upside open.
Link to Alert
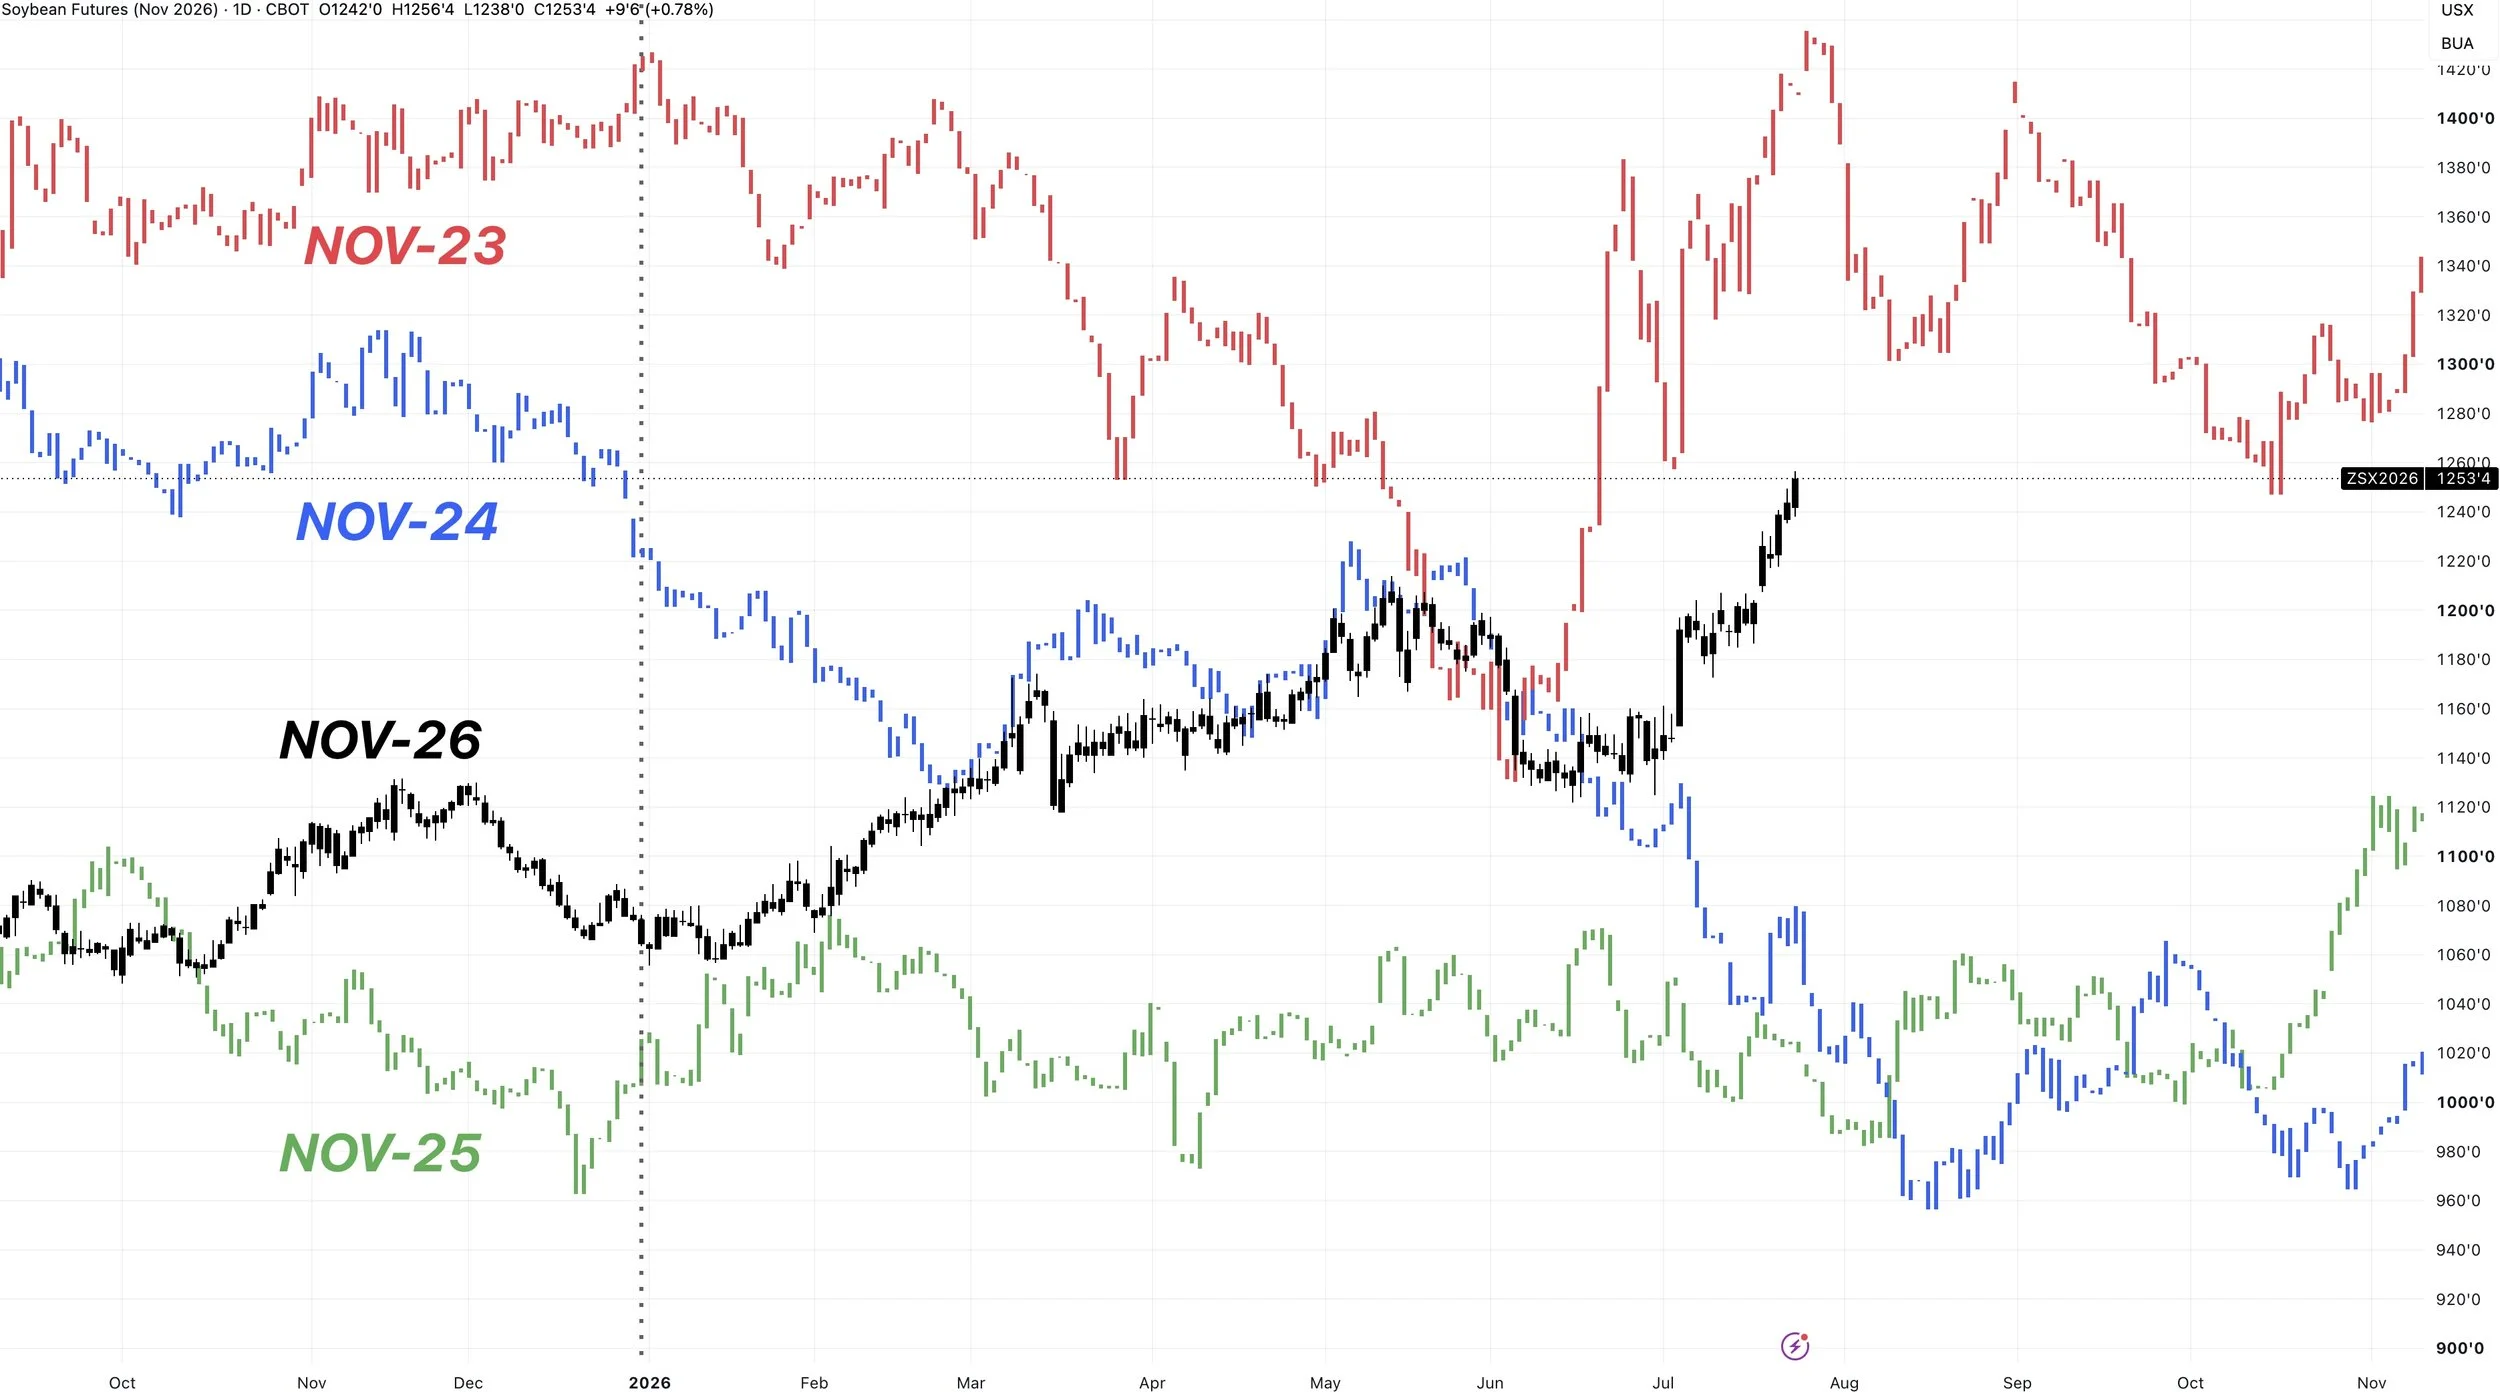
Aug Beans Chart:
Aug beans perfectly tapped contract highs today.
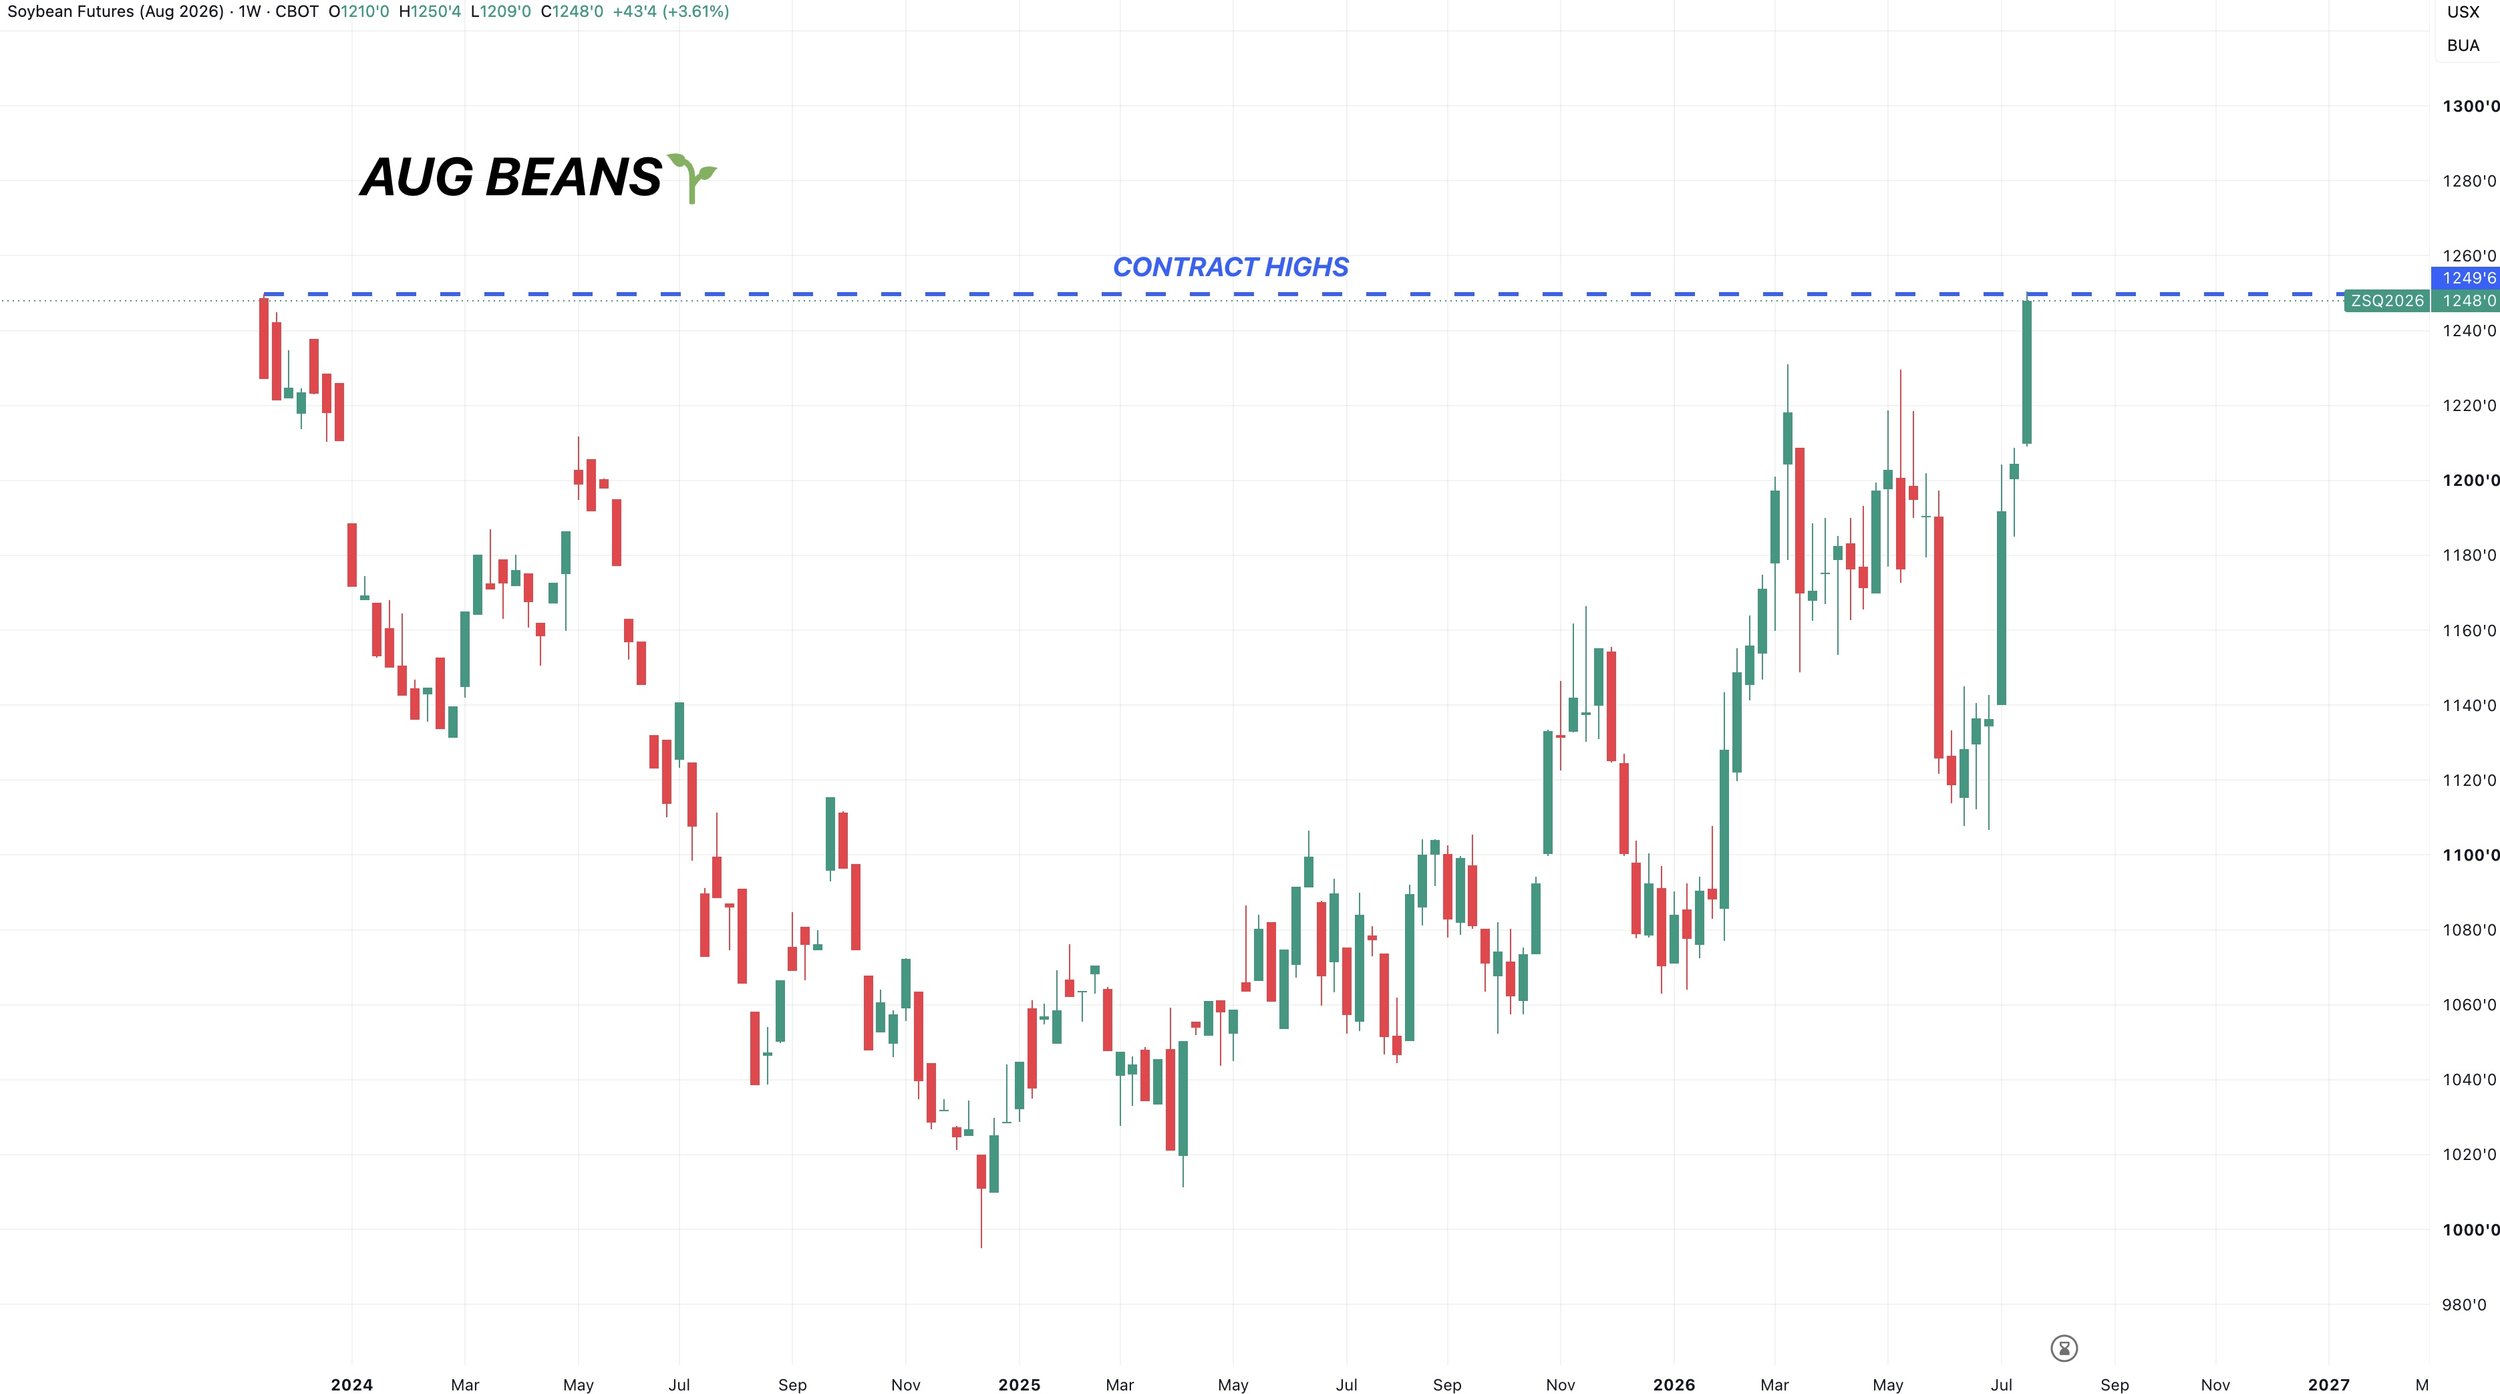
If we look at the continuous chart, this is also a pretty big level.
It's right where we topped out in May 2024.
It's right where we posted our lows in 2023.
So this would be a good spot to take some risk off the table in soybeans.
However, if we are able to pop through this resistance.
There is an unfilled gap on the continuous chart that sits at $13.00
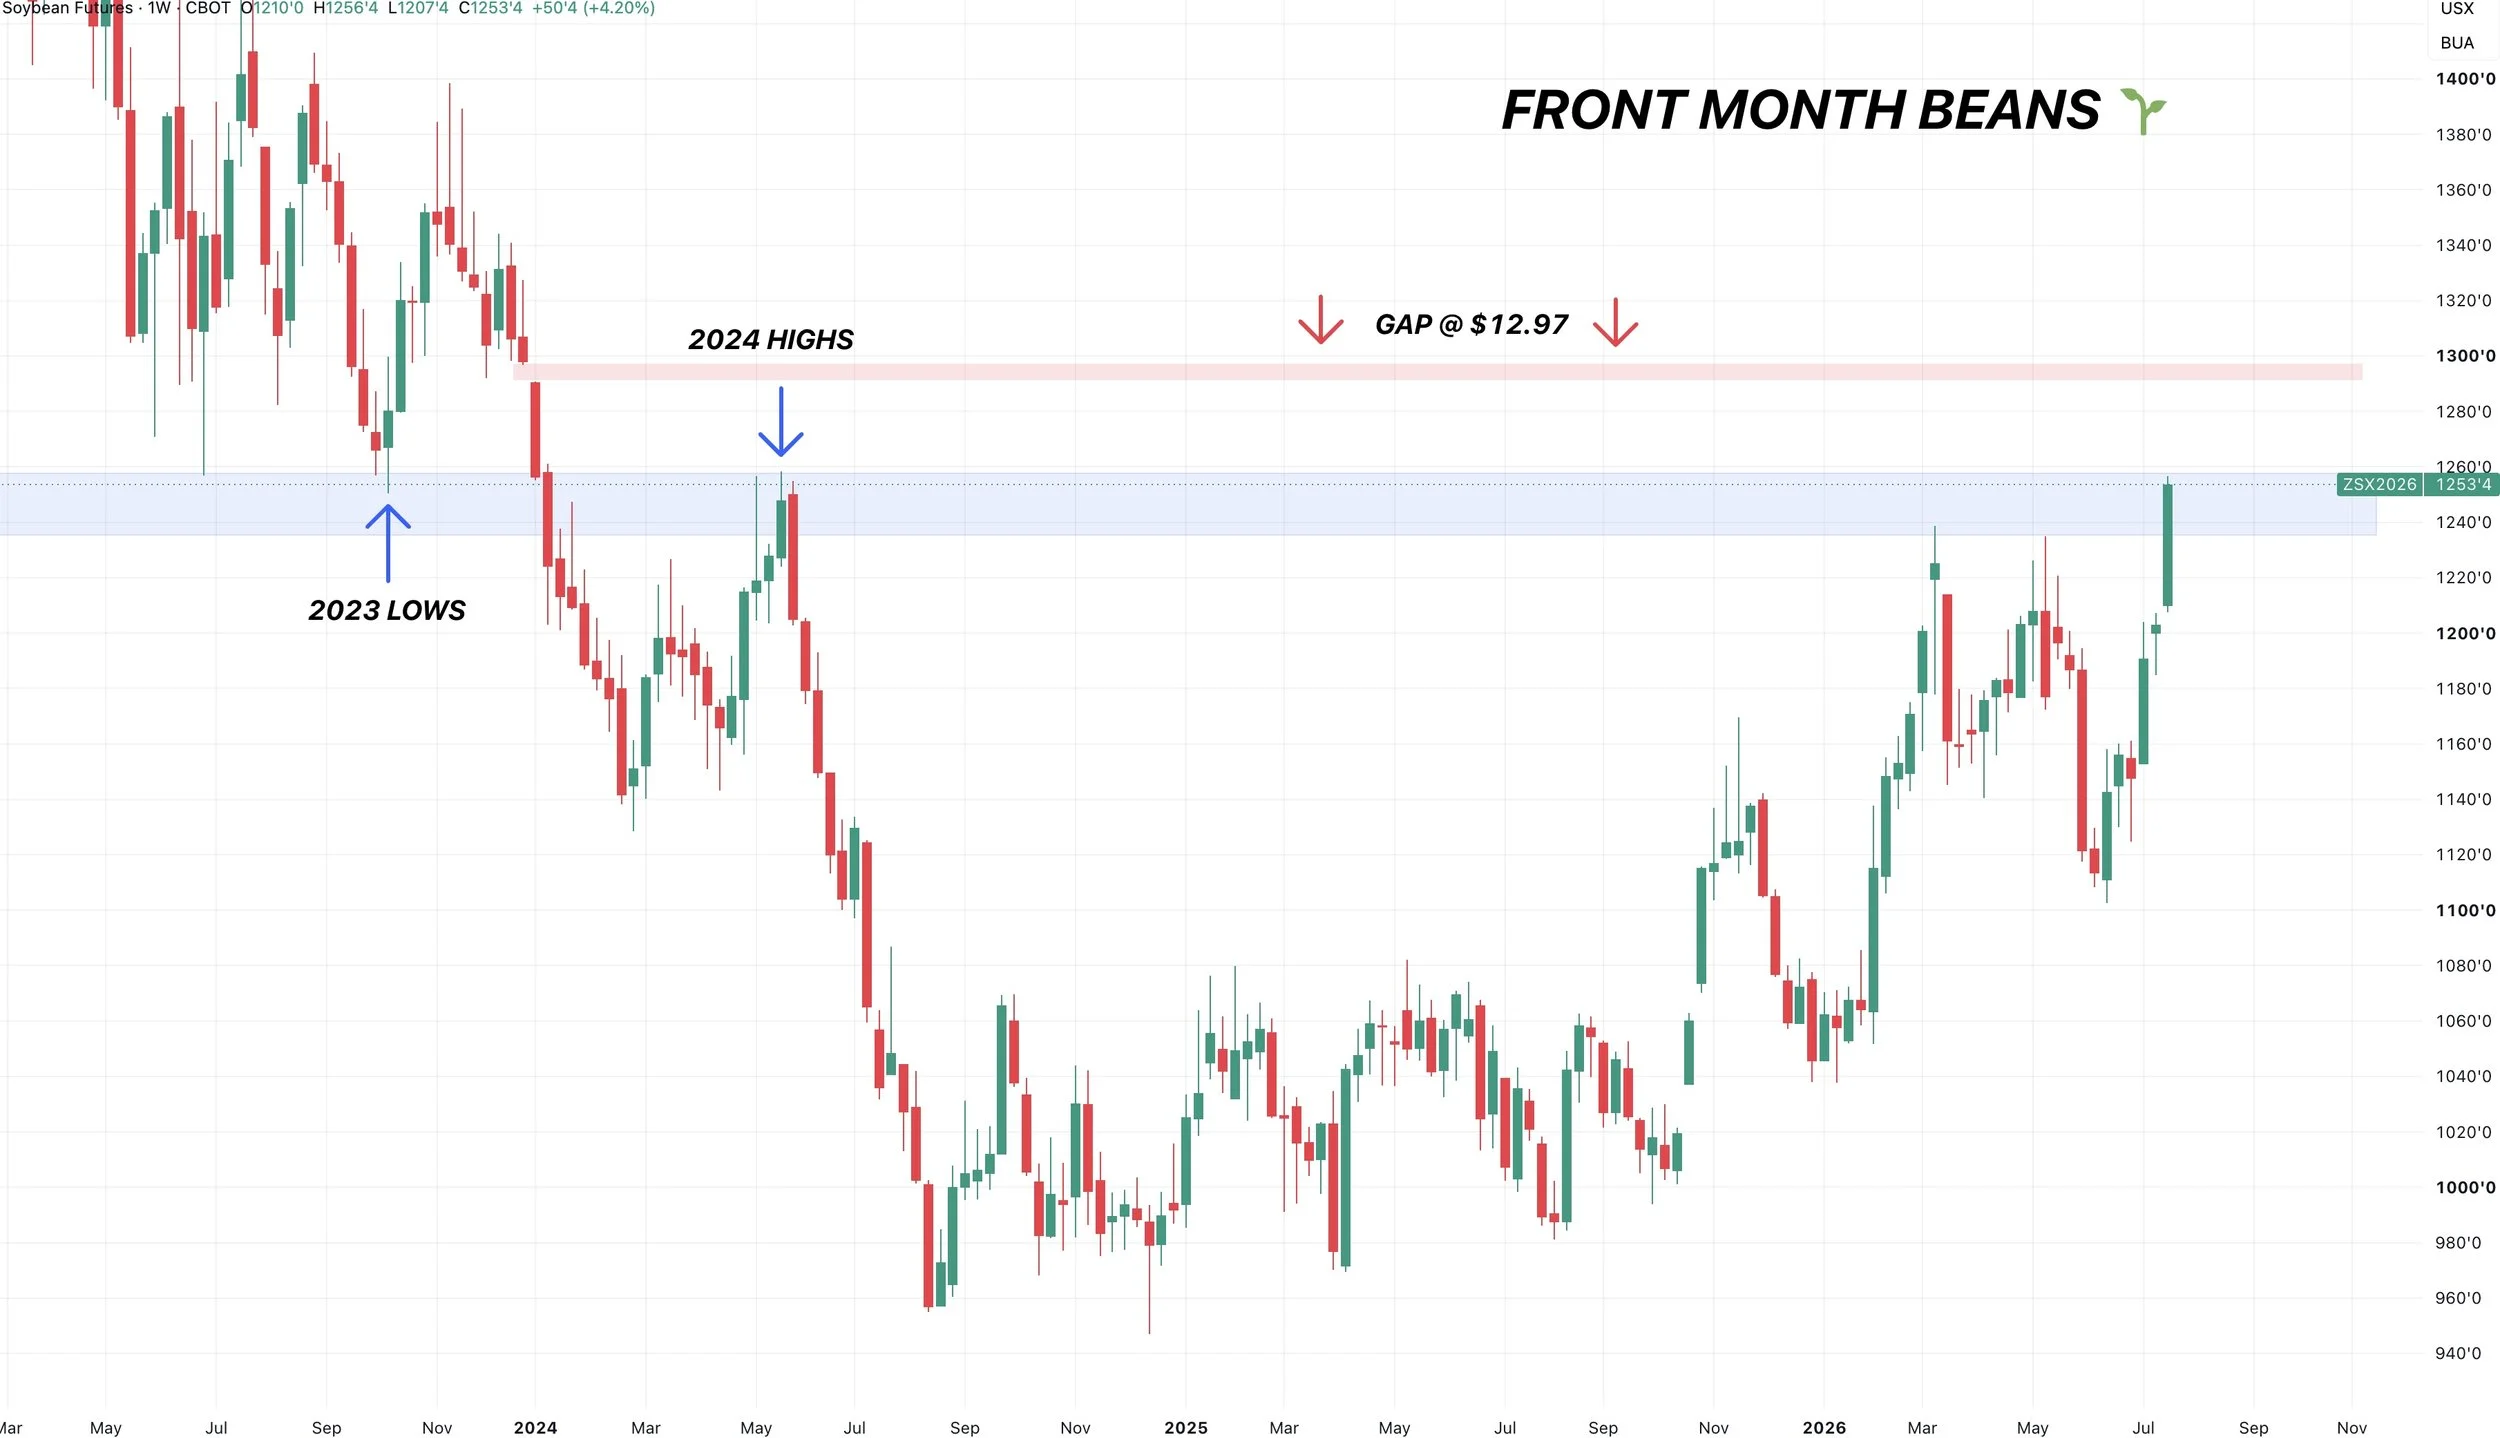
That $13.00 level is also the golden fib on August beans.
So 161.8% of the recent lows, up to those May highs comes in at just about $13.00
So that would be the next target beyond this $12.50 level if it comes.
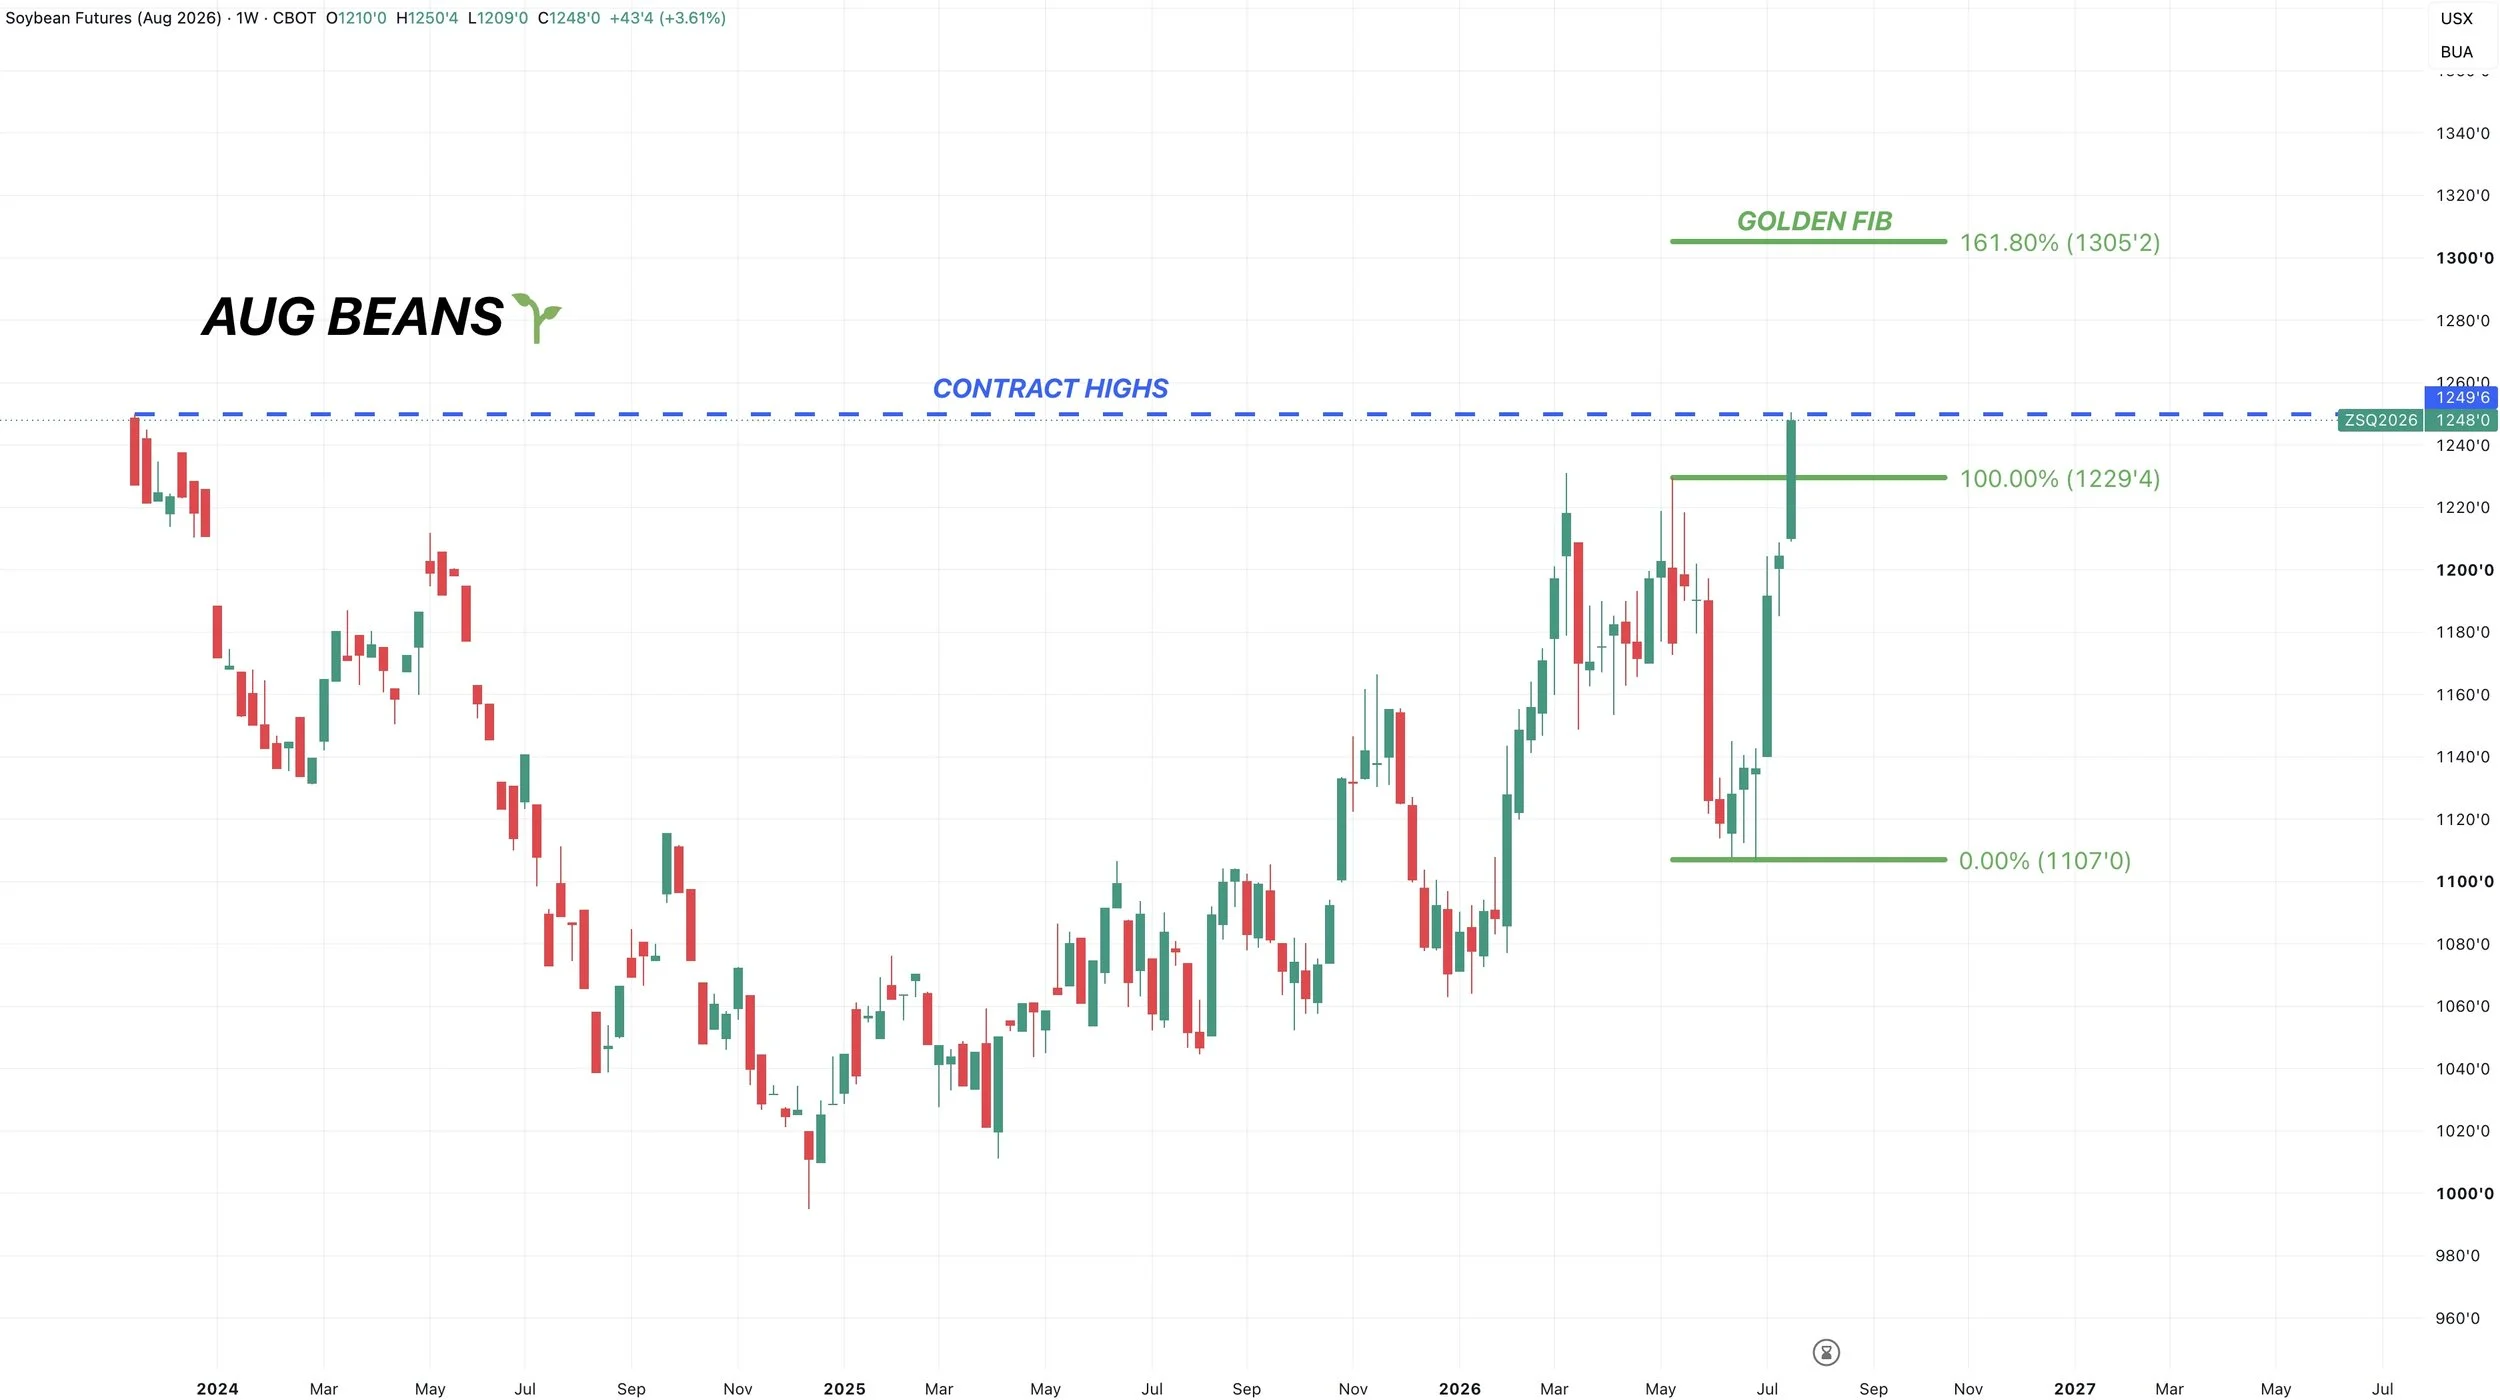
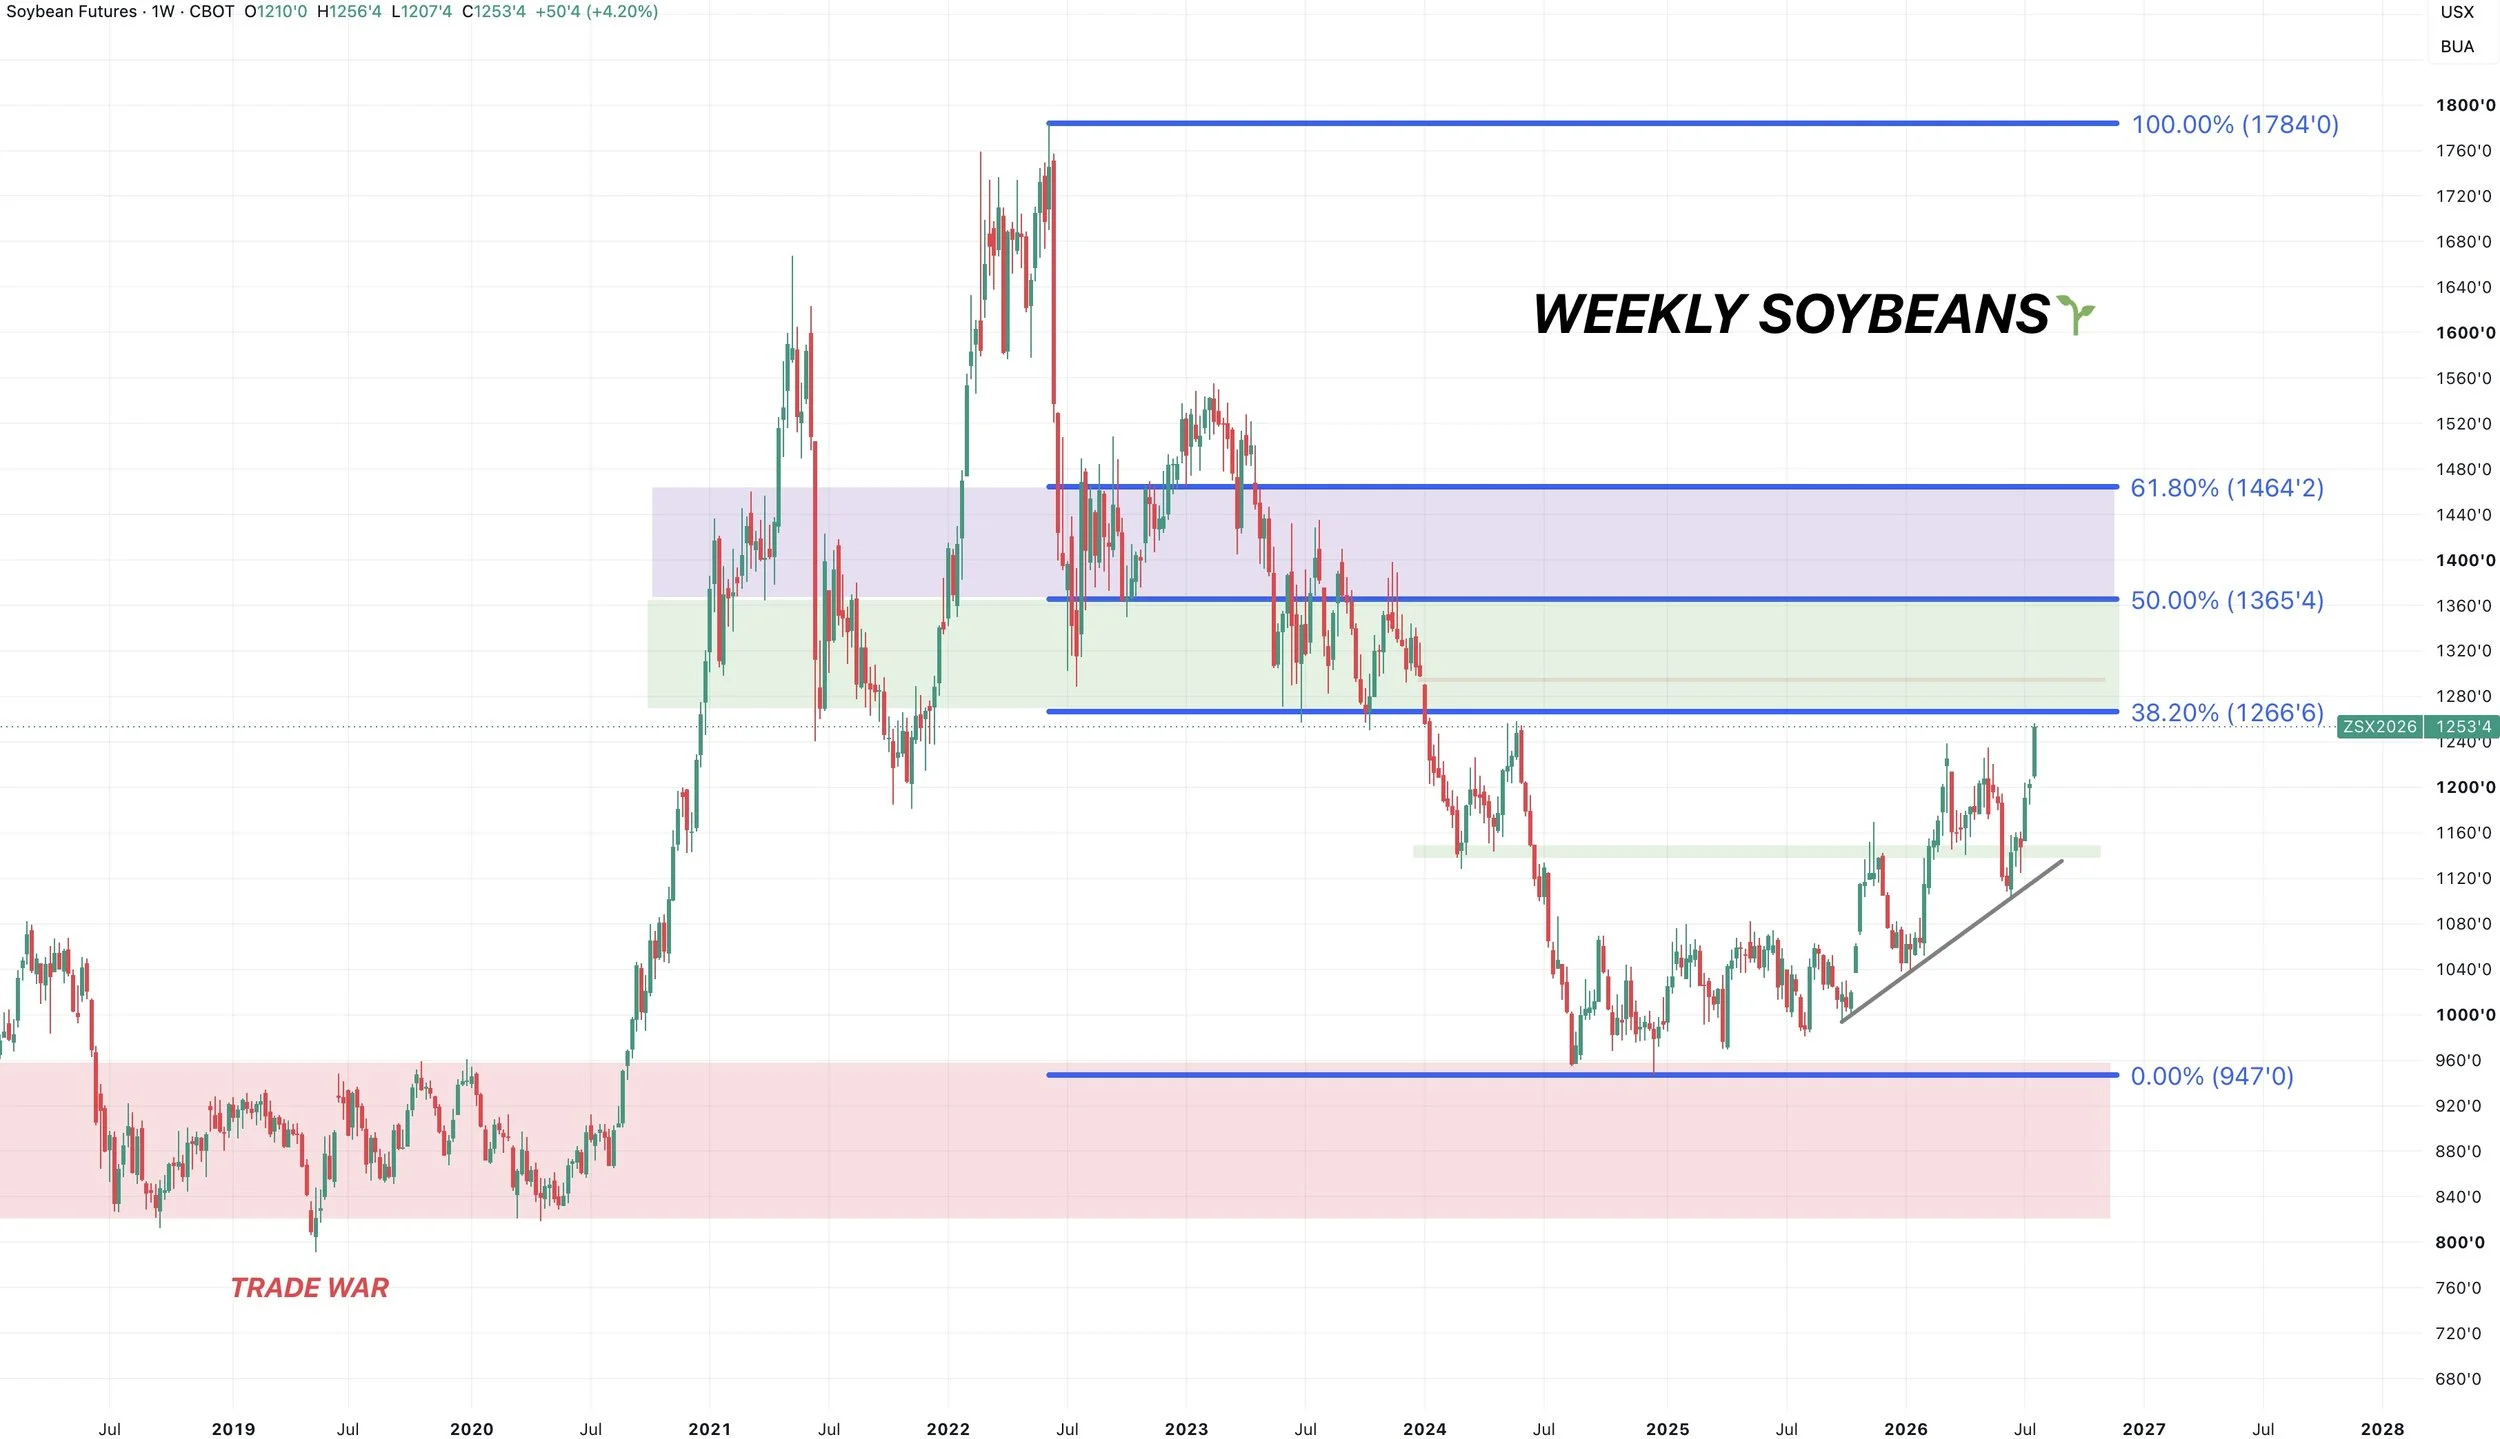
Big Picture Front Month Beans Chart:
If we are able to clear $13.00
Then you open the door to some of those big picture targets.
If you clawed back 50% of the 2022 highs, it would be $13.65
The 61.8% golden fib would be $14.64
So those would be some possible long term targets.
But as always, targets are subject to change.
Nov Beans Chart:
The chart looks good.
We broke above that volume shelf and prior highs so we are running through air.
We posted new contract highs.
We do have some possible trend line resistance I'm watching.
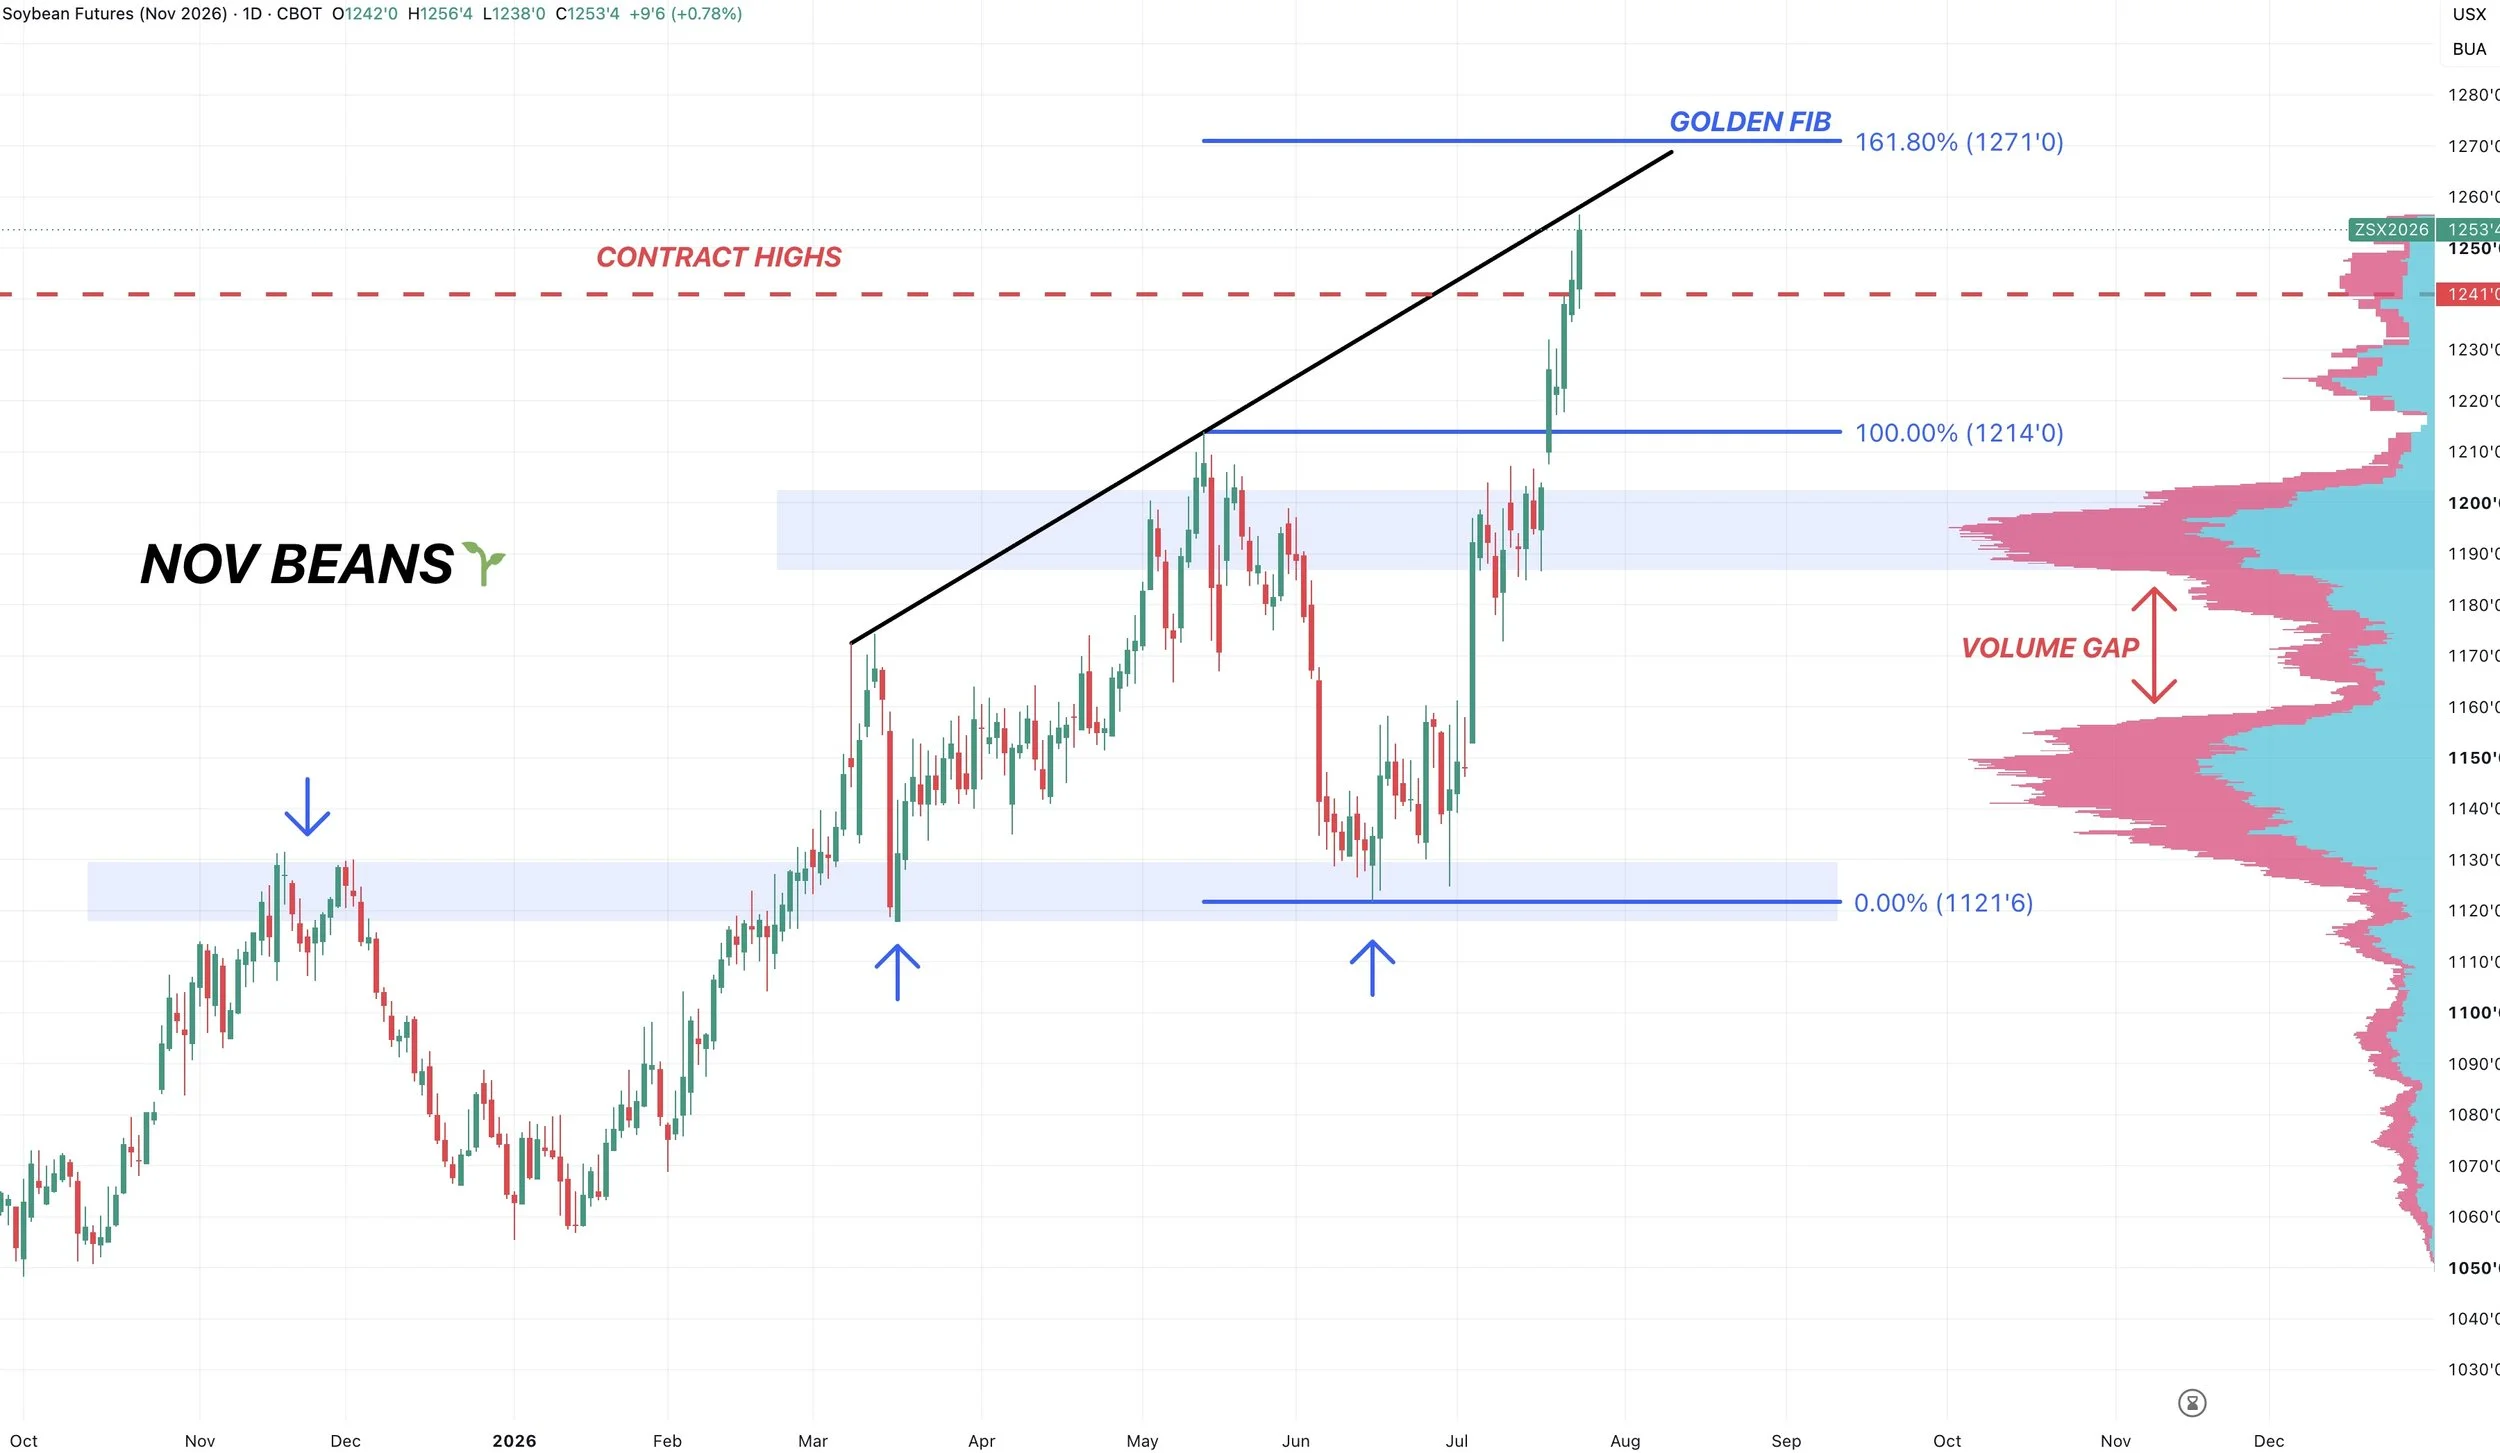
I do still have that $12.70 target.
Which is the golden fib.
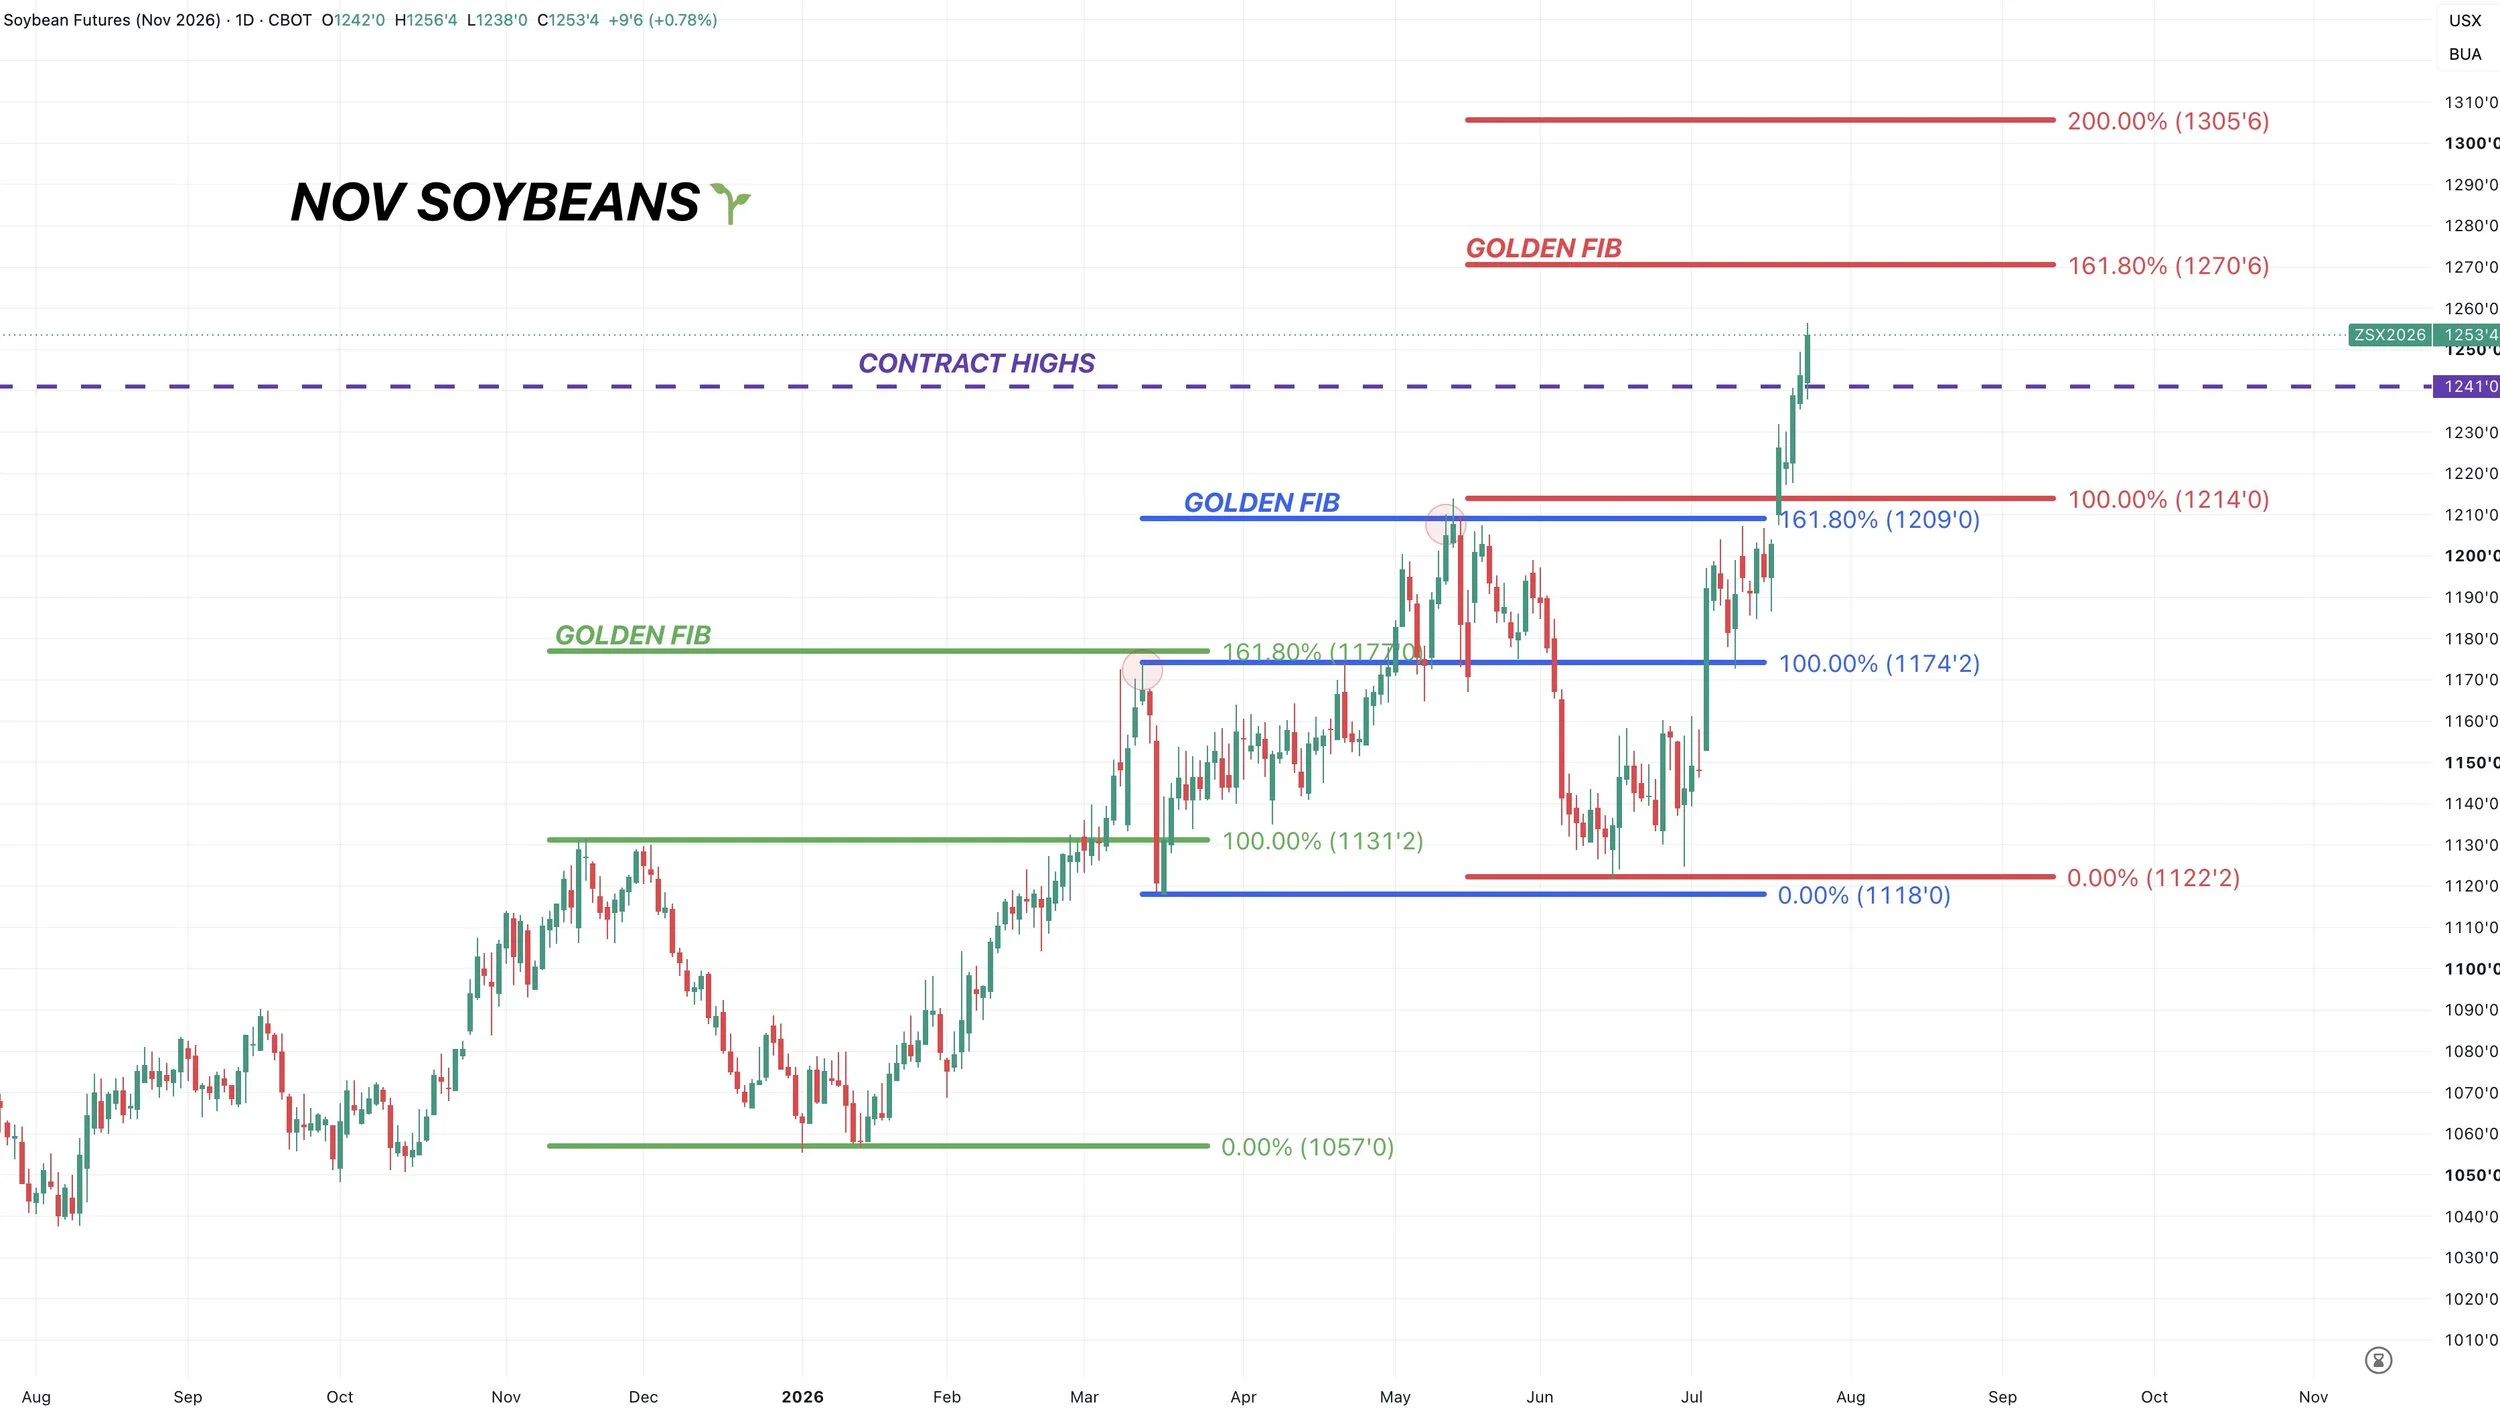
Meaning it equals 161.8% of the recent lows up to those May highs.
The last two major tops in soybeans have occured at the golden fib from the prior rally and sell off.
The May highs were 161.8% of the March lows up to the March highs.
The March highs were 161.8% of the Jan lows up to the November highs from last year.
So between these contract highs and that $12.70 level seems like a good area to reward.
If things get even crazier, the 200% fib comes in at $13.05. Which lines up with that $13.00 target in August beans.
When no one knows how things such as weather are going to play out. The simplest thing to do is simply incrementally reward the rally as we go. Taking some chips off the table at every target. As not every target has to hit.
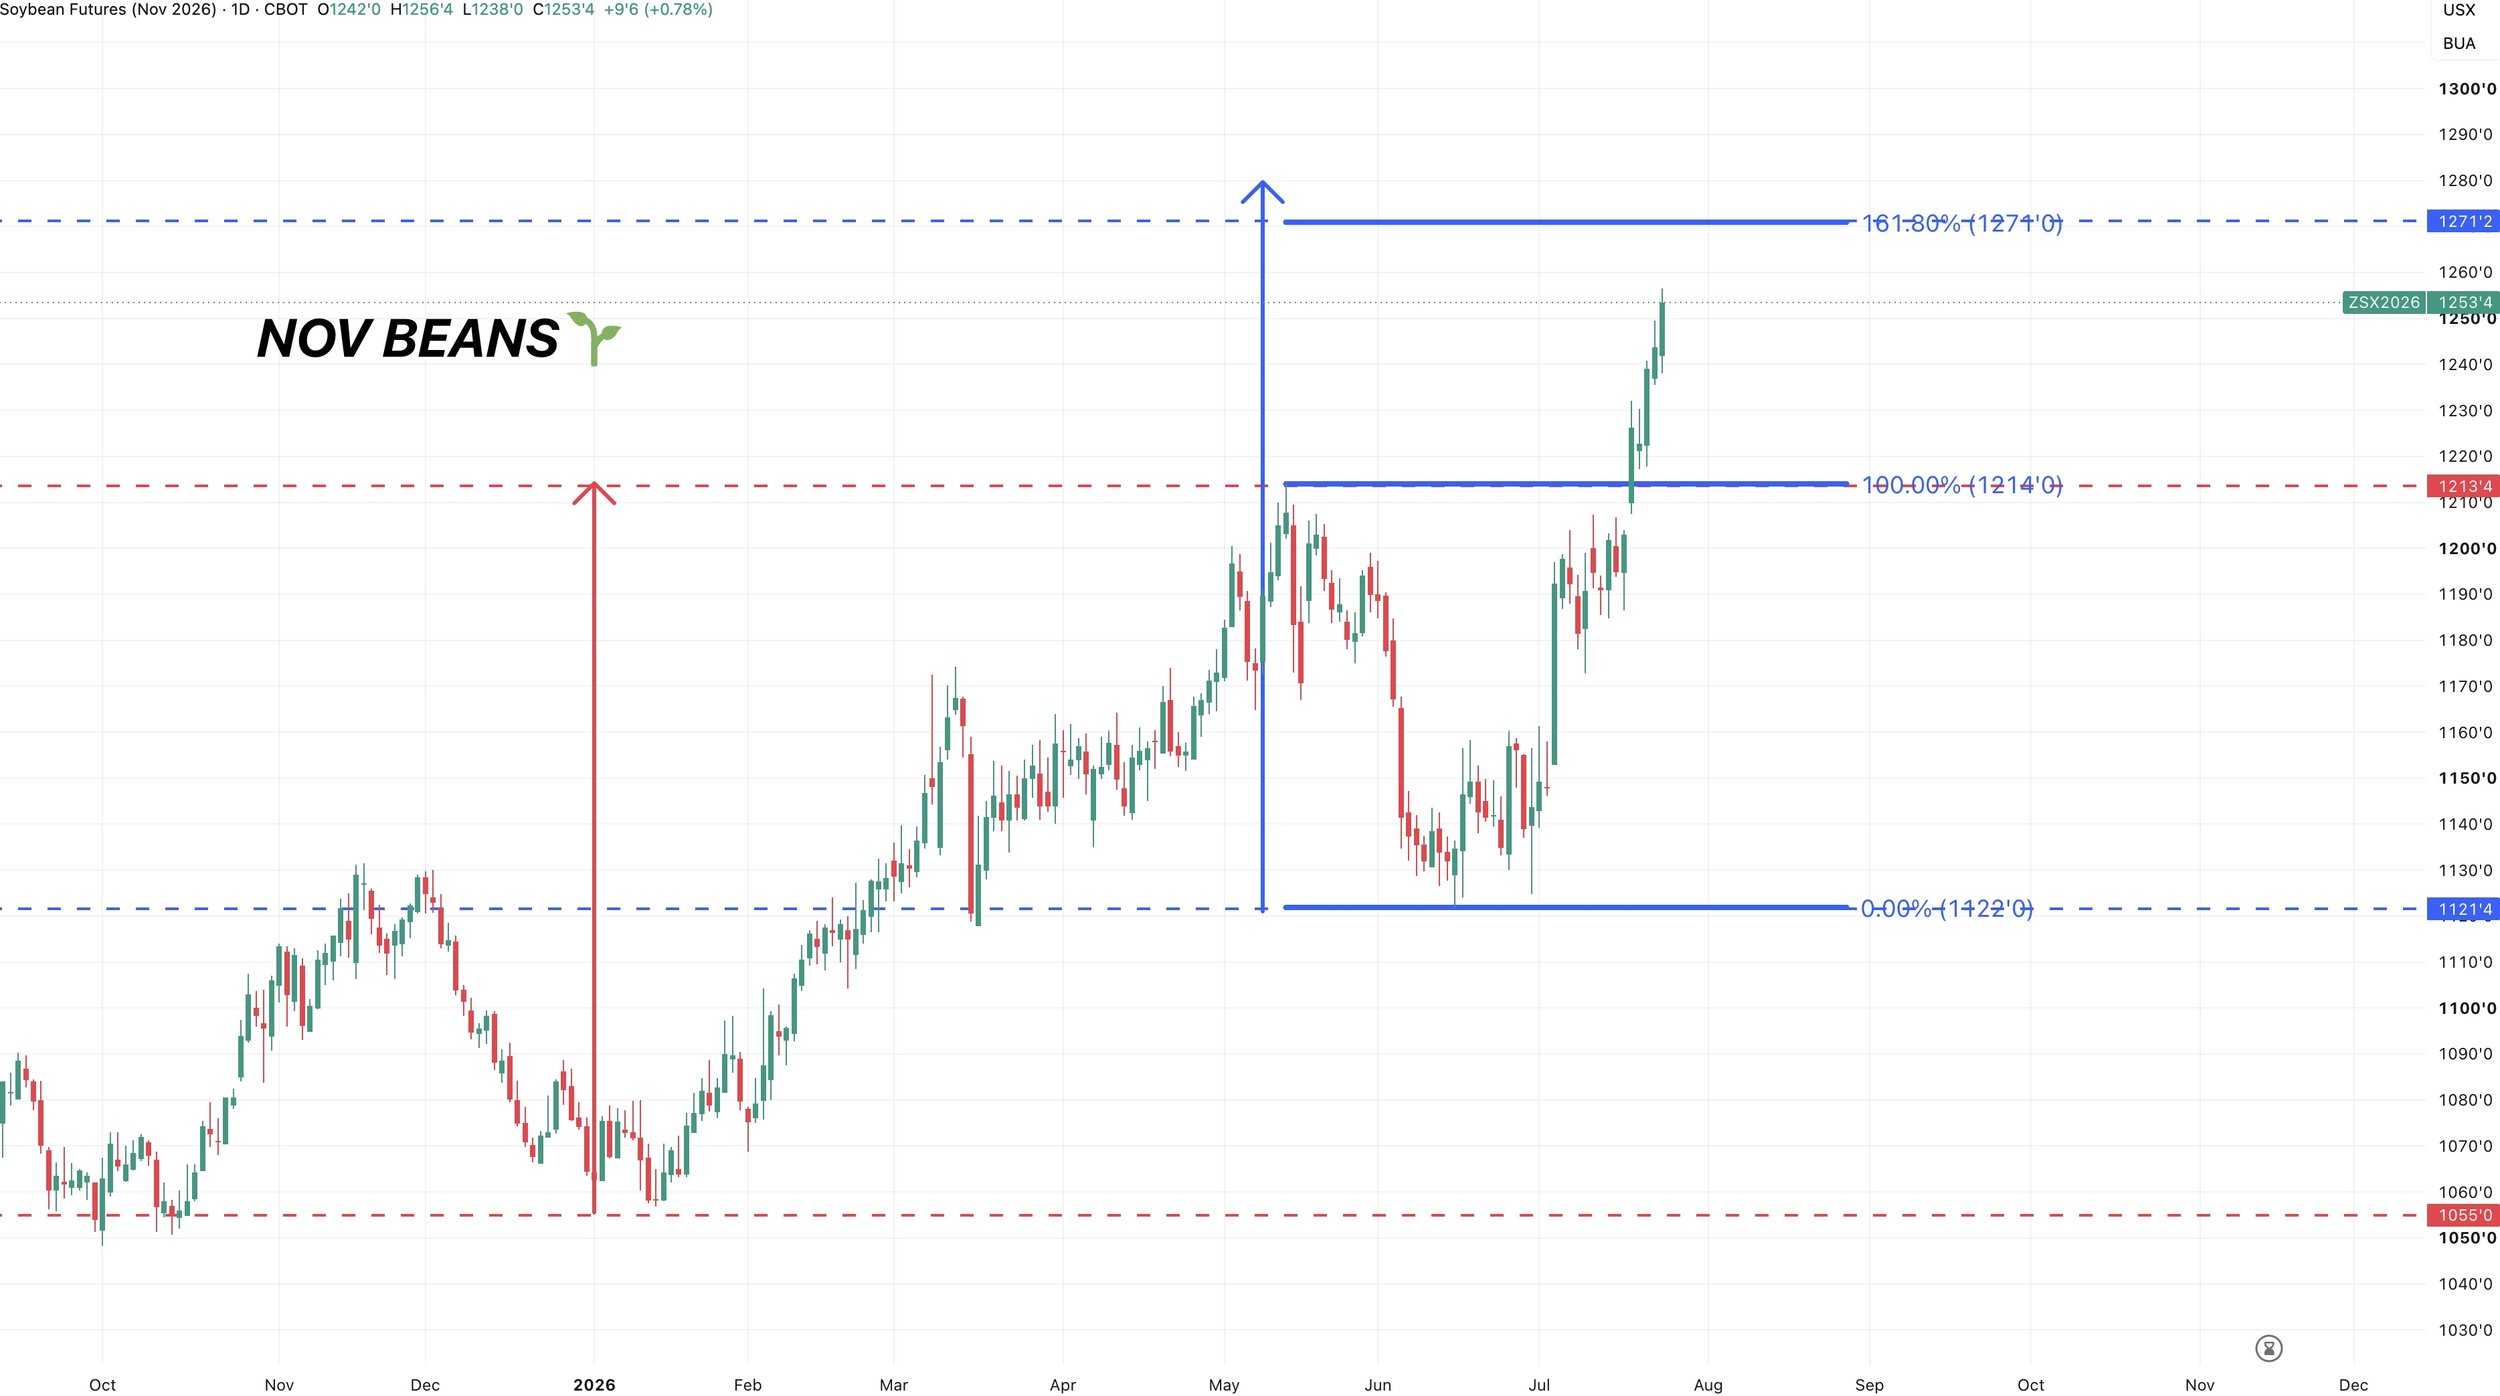
If you take the entire rally from January to May.
The 1 to 1 move from the recent lows also comes in right around that $12.70 range as well.
Meaning this rally would be the same size as the Jan to May rally.
Another reason why that would be an area of interest if it comes.
Wheat
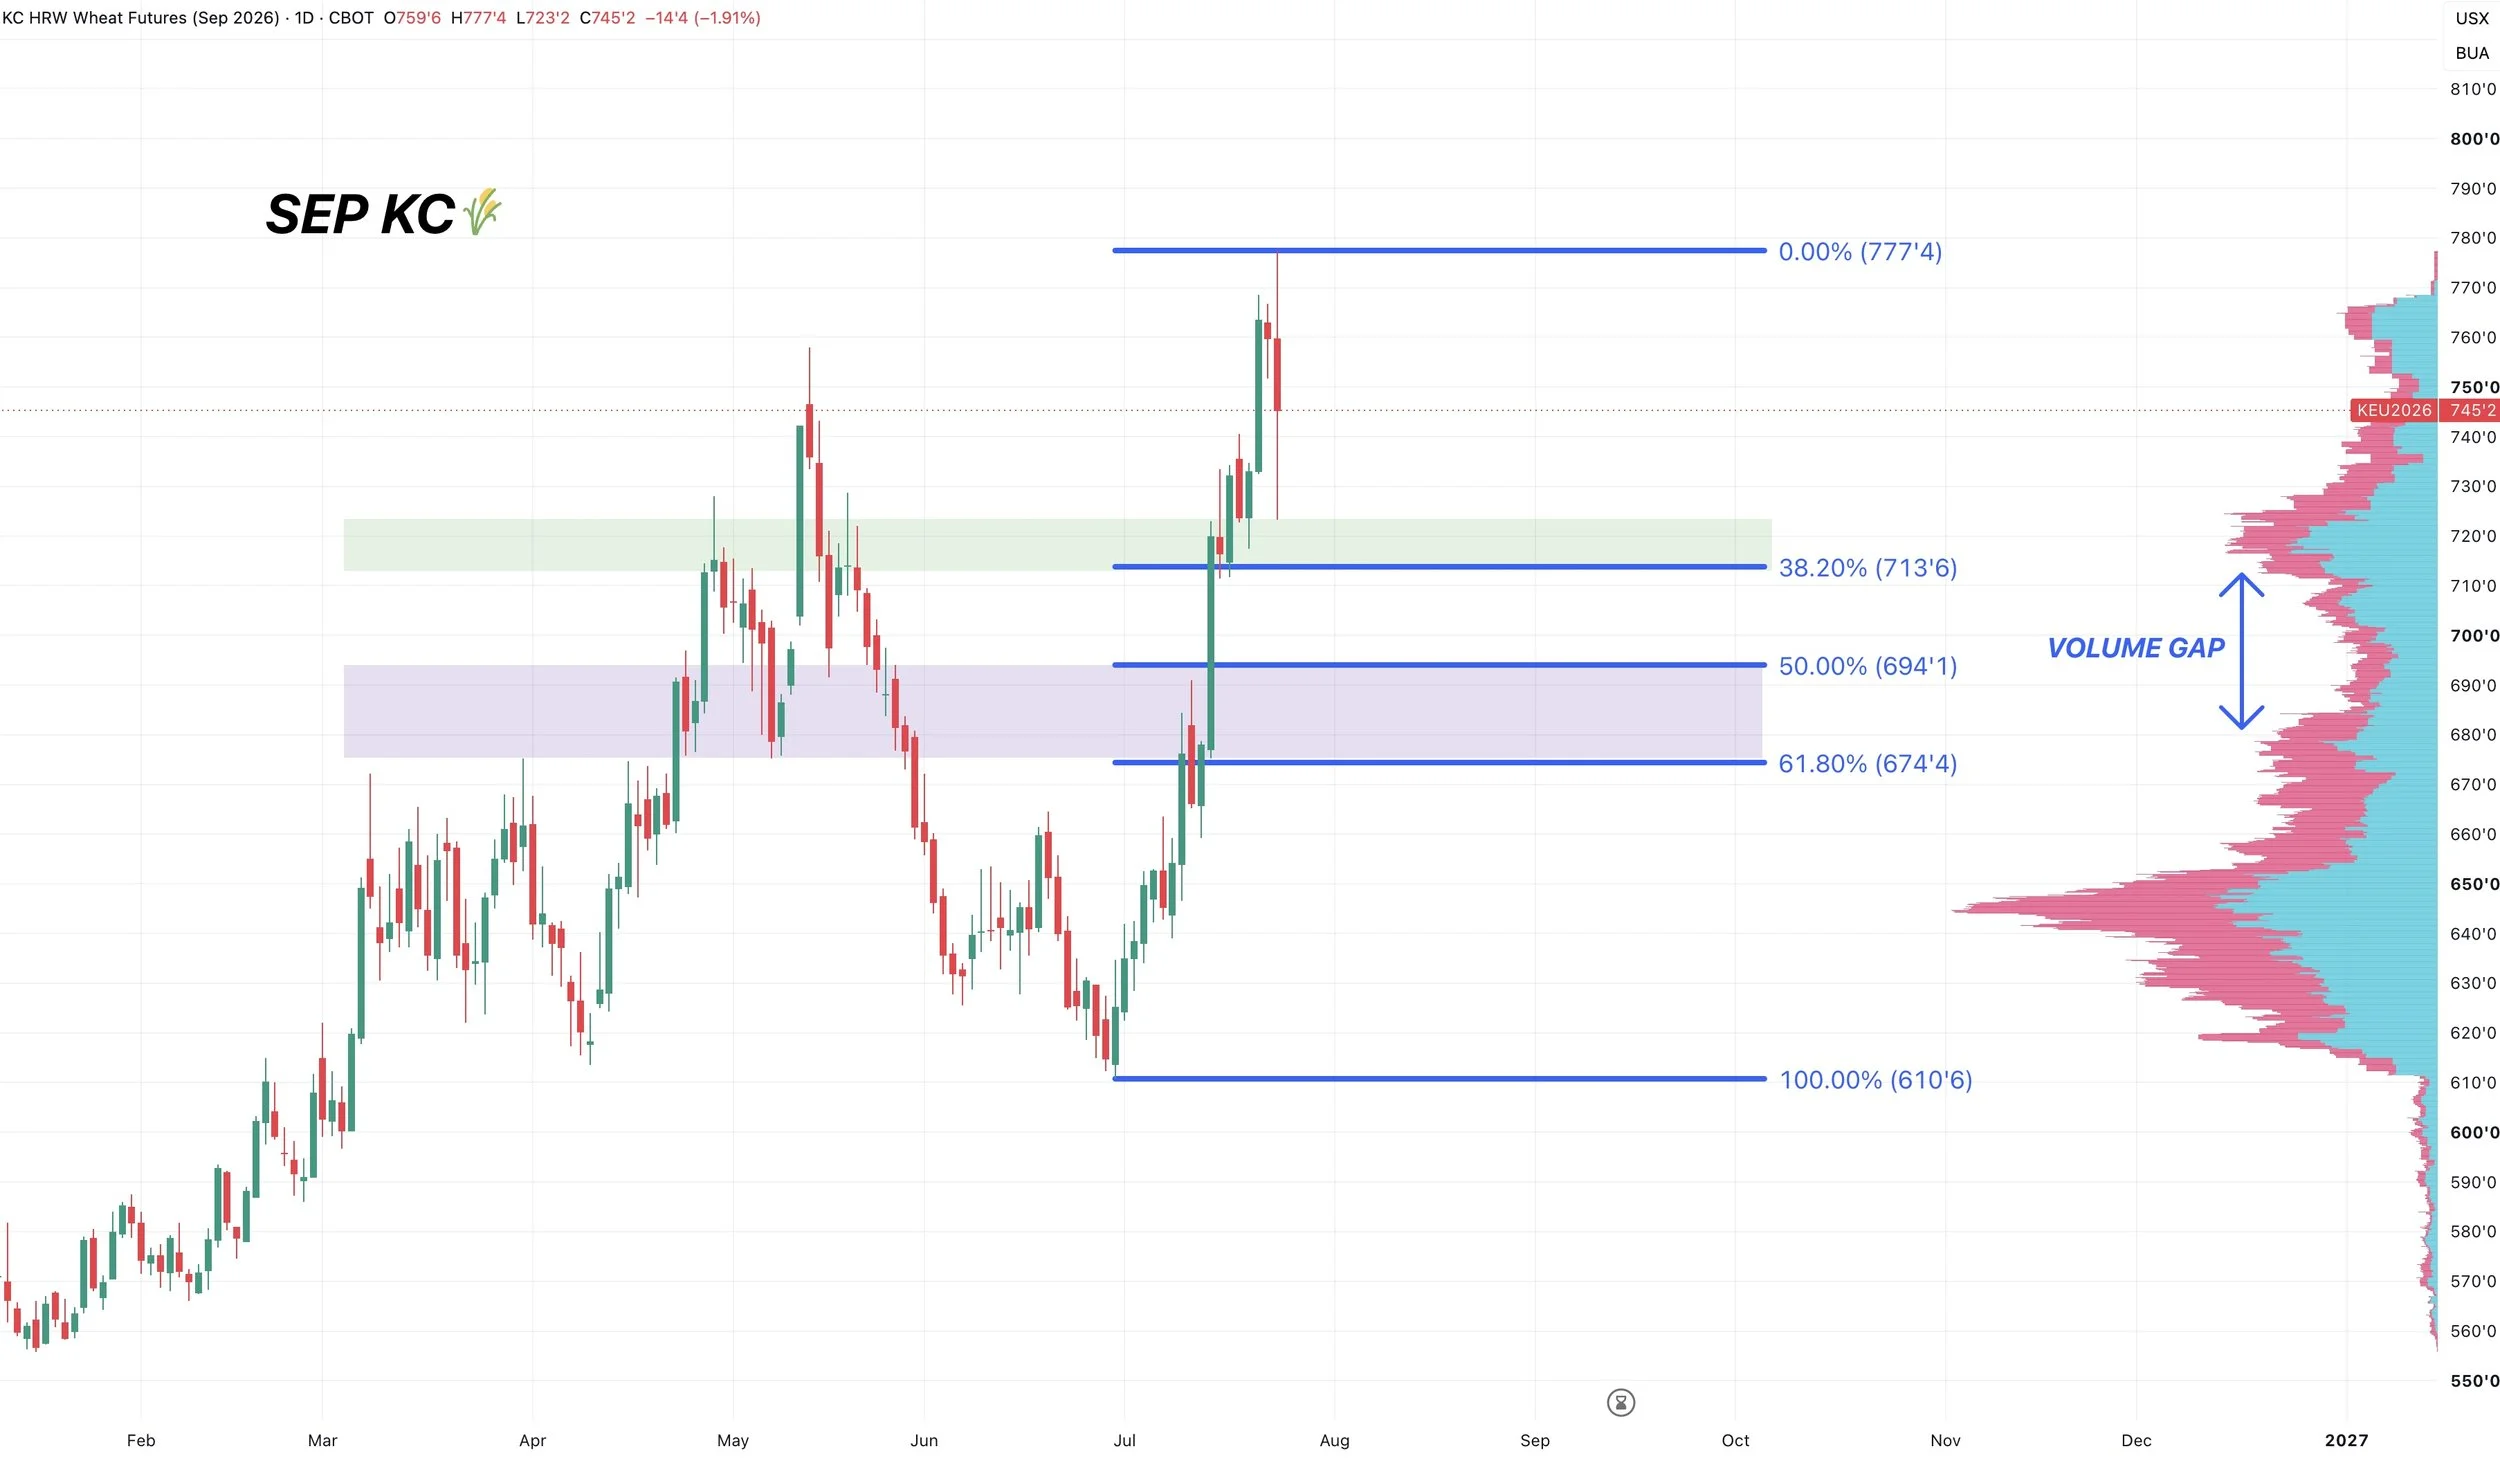
Sep KC Wheat Chart:
No one knows how the Russia situation is going to unfold.
Today KC wheat did post a key reversal lower. So that wasn’t the best sign today.
As we posted new contract highs than closed below yesterday’s lows. So we will have to see if that results in further selling next week.
The trend in this market is clearly higher, but we want to hold that $7.11 level and 38.2% retracement or we could drop towards the 61.8% level at $6.75
As there is a gap or air to the downside and no support until that level.
We had a pretty massive 55 cent range today from the highs to the lows. So basically just waiting to see whether we take out today's highs or lows first. As that could give us the overall next direction.
Continuous Weekly Chart:
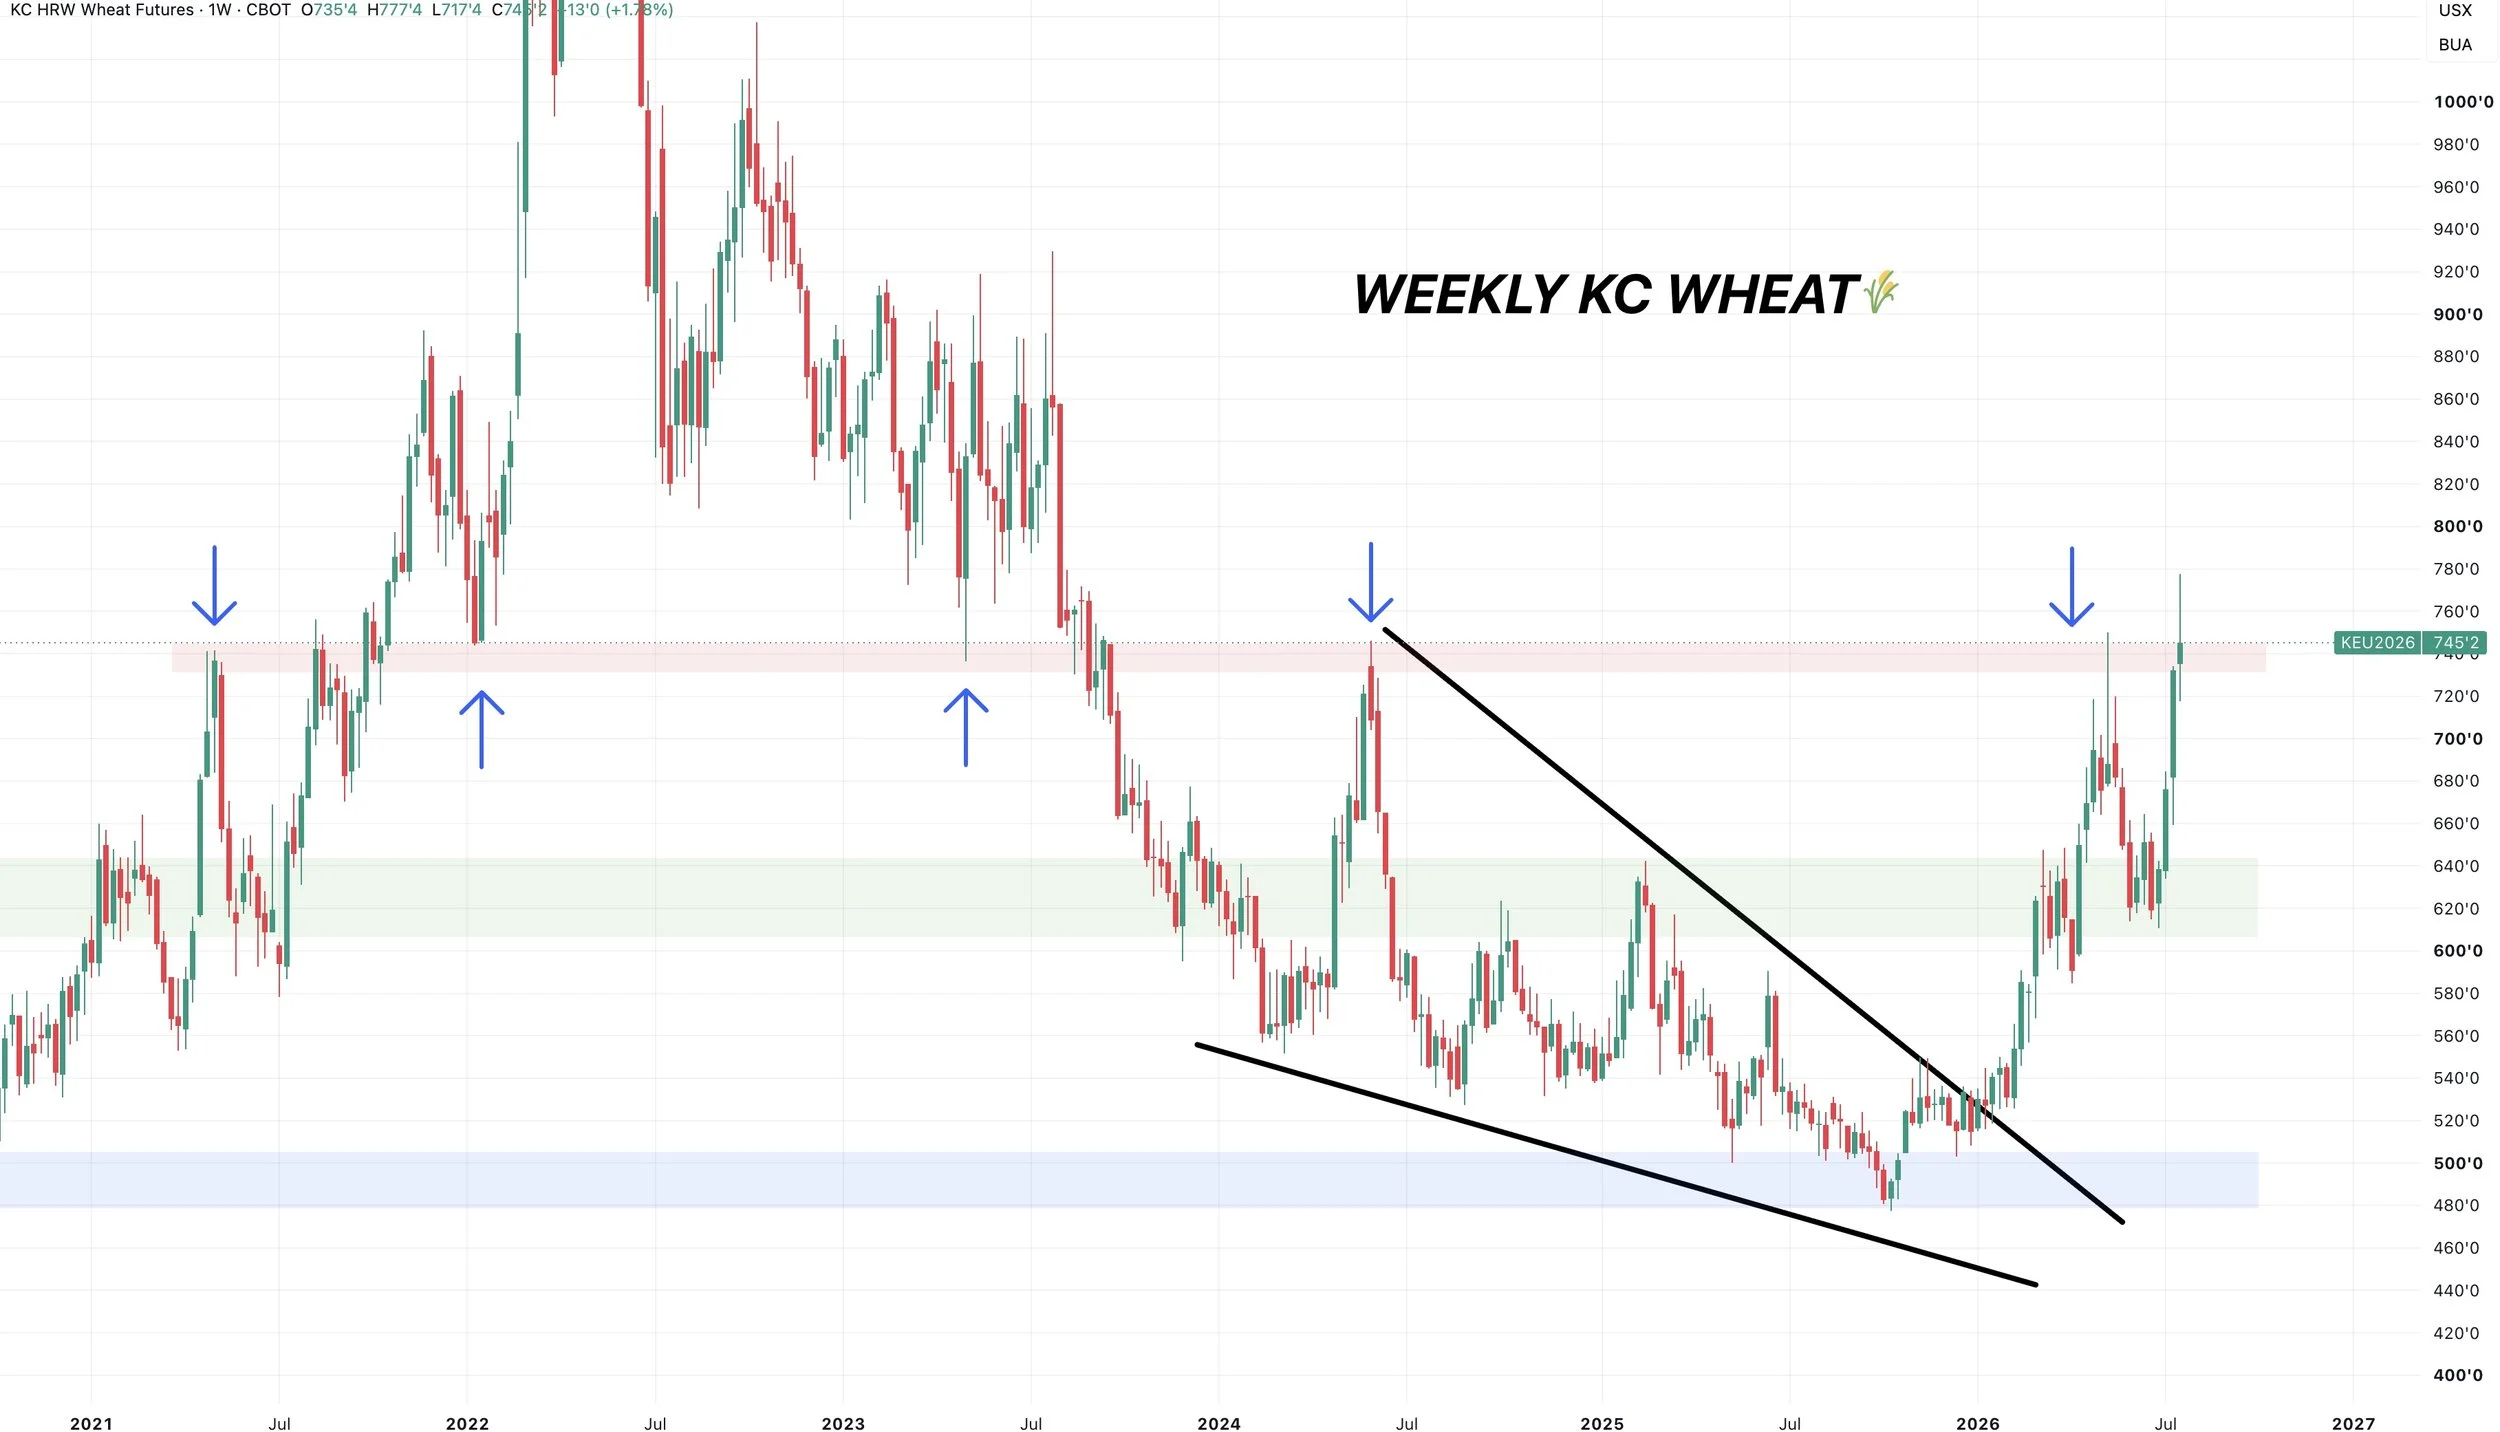
We broke those highs from May 2024, but failed to close above them.
We didn’t leave the best weekly candle today either. Closing well off the highs leaving a possible shooting star
That is still the big level to break through. And a spot where it might make sense to manage some risk.
This is the highs from May. The highs from 2024. The lows from 2023 and 2022. And the highs from 2021. So big spot.
However if we can break through it, it should open the door higher.
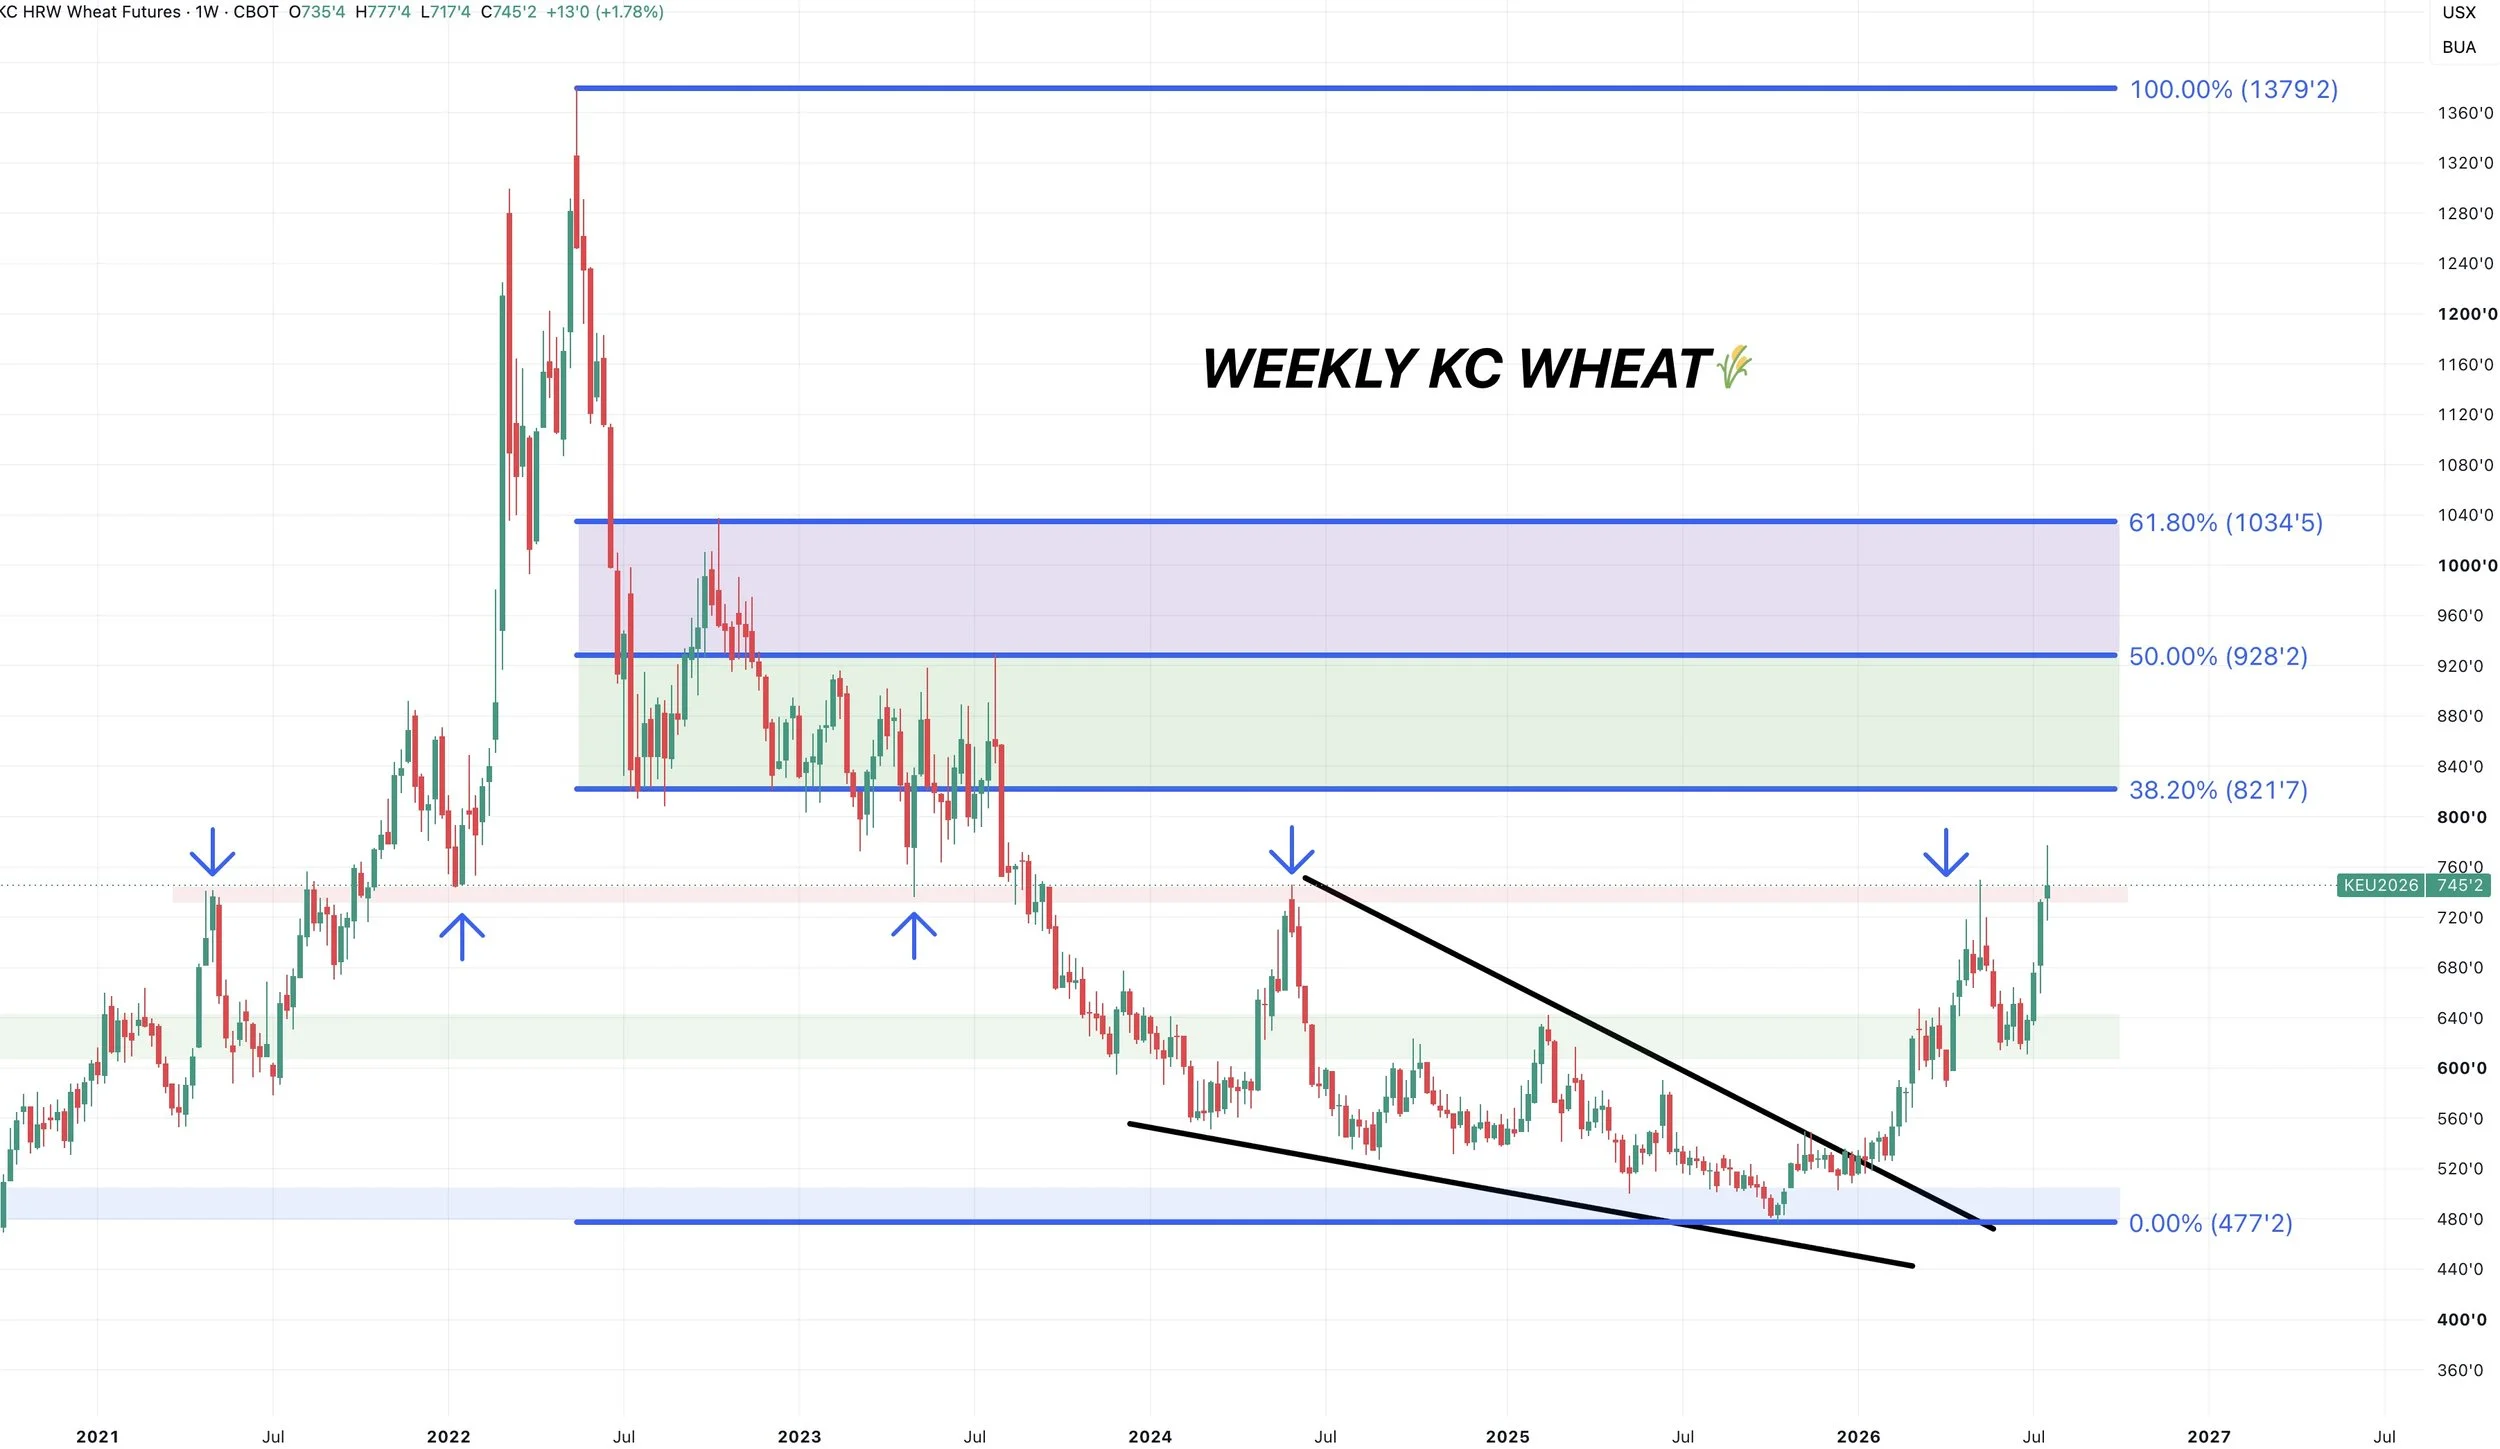
If you look at some simple retracement levels.
The first one comes in around $8.20 which is also the bottom end of that old range from 2022 and 2023.
The 50% level comes in at over $9.00. Which is also the upper end of that same old range.
But first we still need to break above this current resistance we are sitting at on a weekly time frame.
Cattle
COF Report:
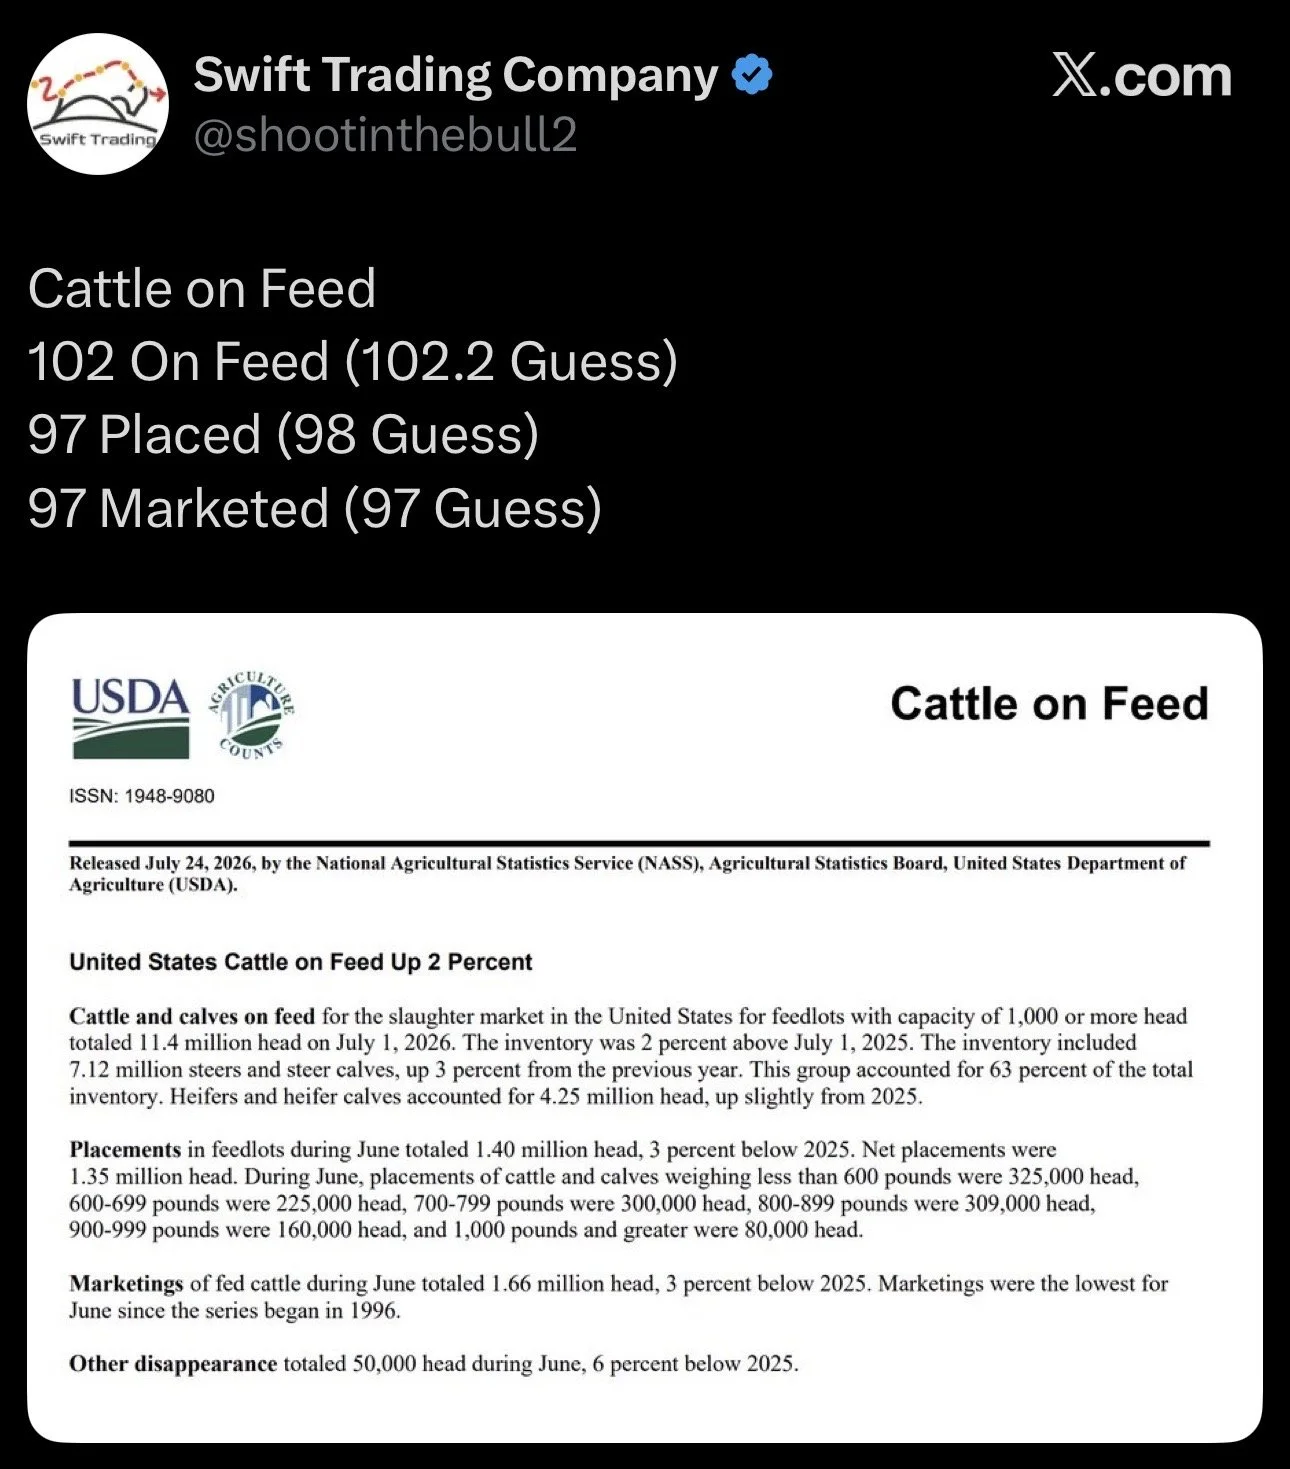
We had a cattle on feed report after the close today.
It was a little bit friendly. As the June placements came in below the estimates, but wasn’t a major miss.
Everything else was in line with the estimates.
The last time June placements were this low was 2009.
Border Re-Opened:
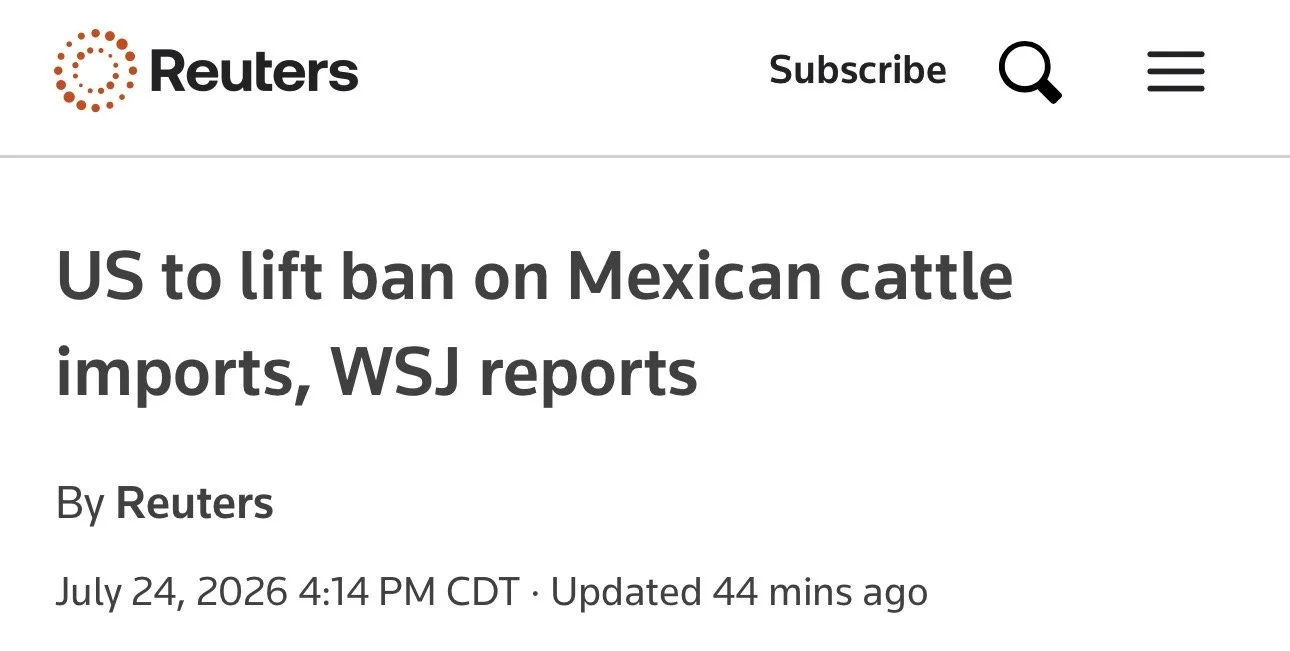
The biggest news came out around 4pm CT.
The US is set to lift the ban on cattle imports, and will be re-opening the border in 30 days.
Your intial thoughts would be this is bearish.
However, it does almost feel like someone knew this was going to happen.
Which would explain the recent sell off. Maybe they were front running this news and some of this was already priced into the market.
So there is always a chance for a sell the rumor buy the fact event next week. But I guess we'll just have to wait and see how the market reacts on Monday.
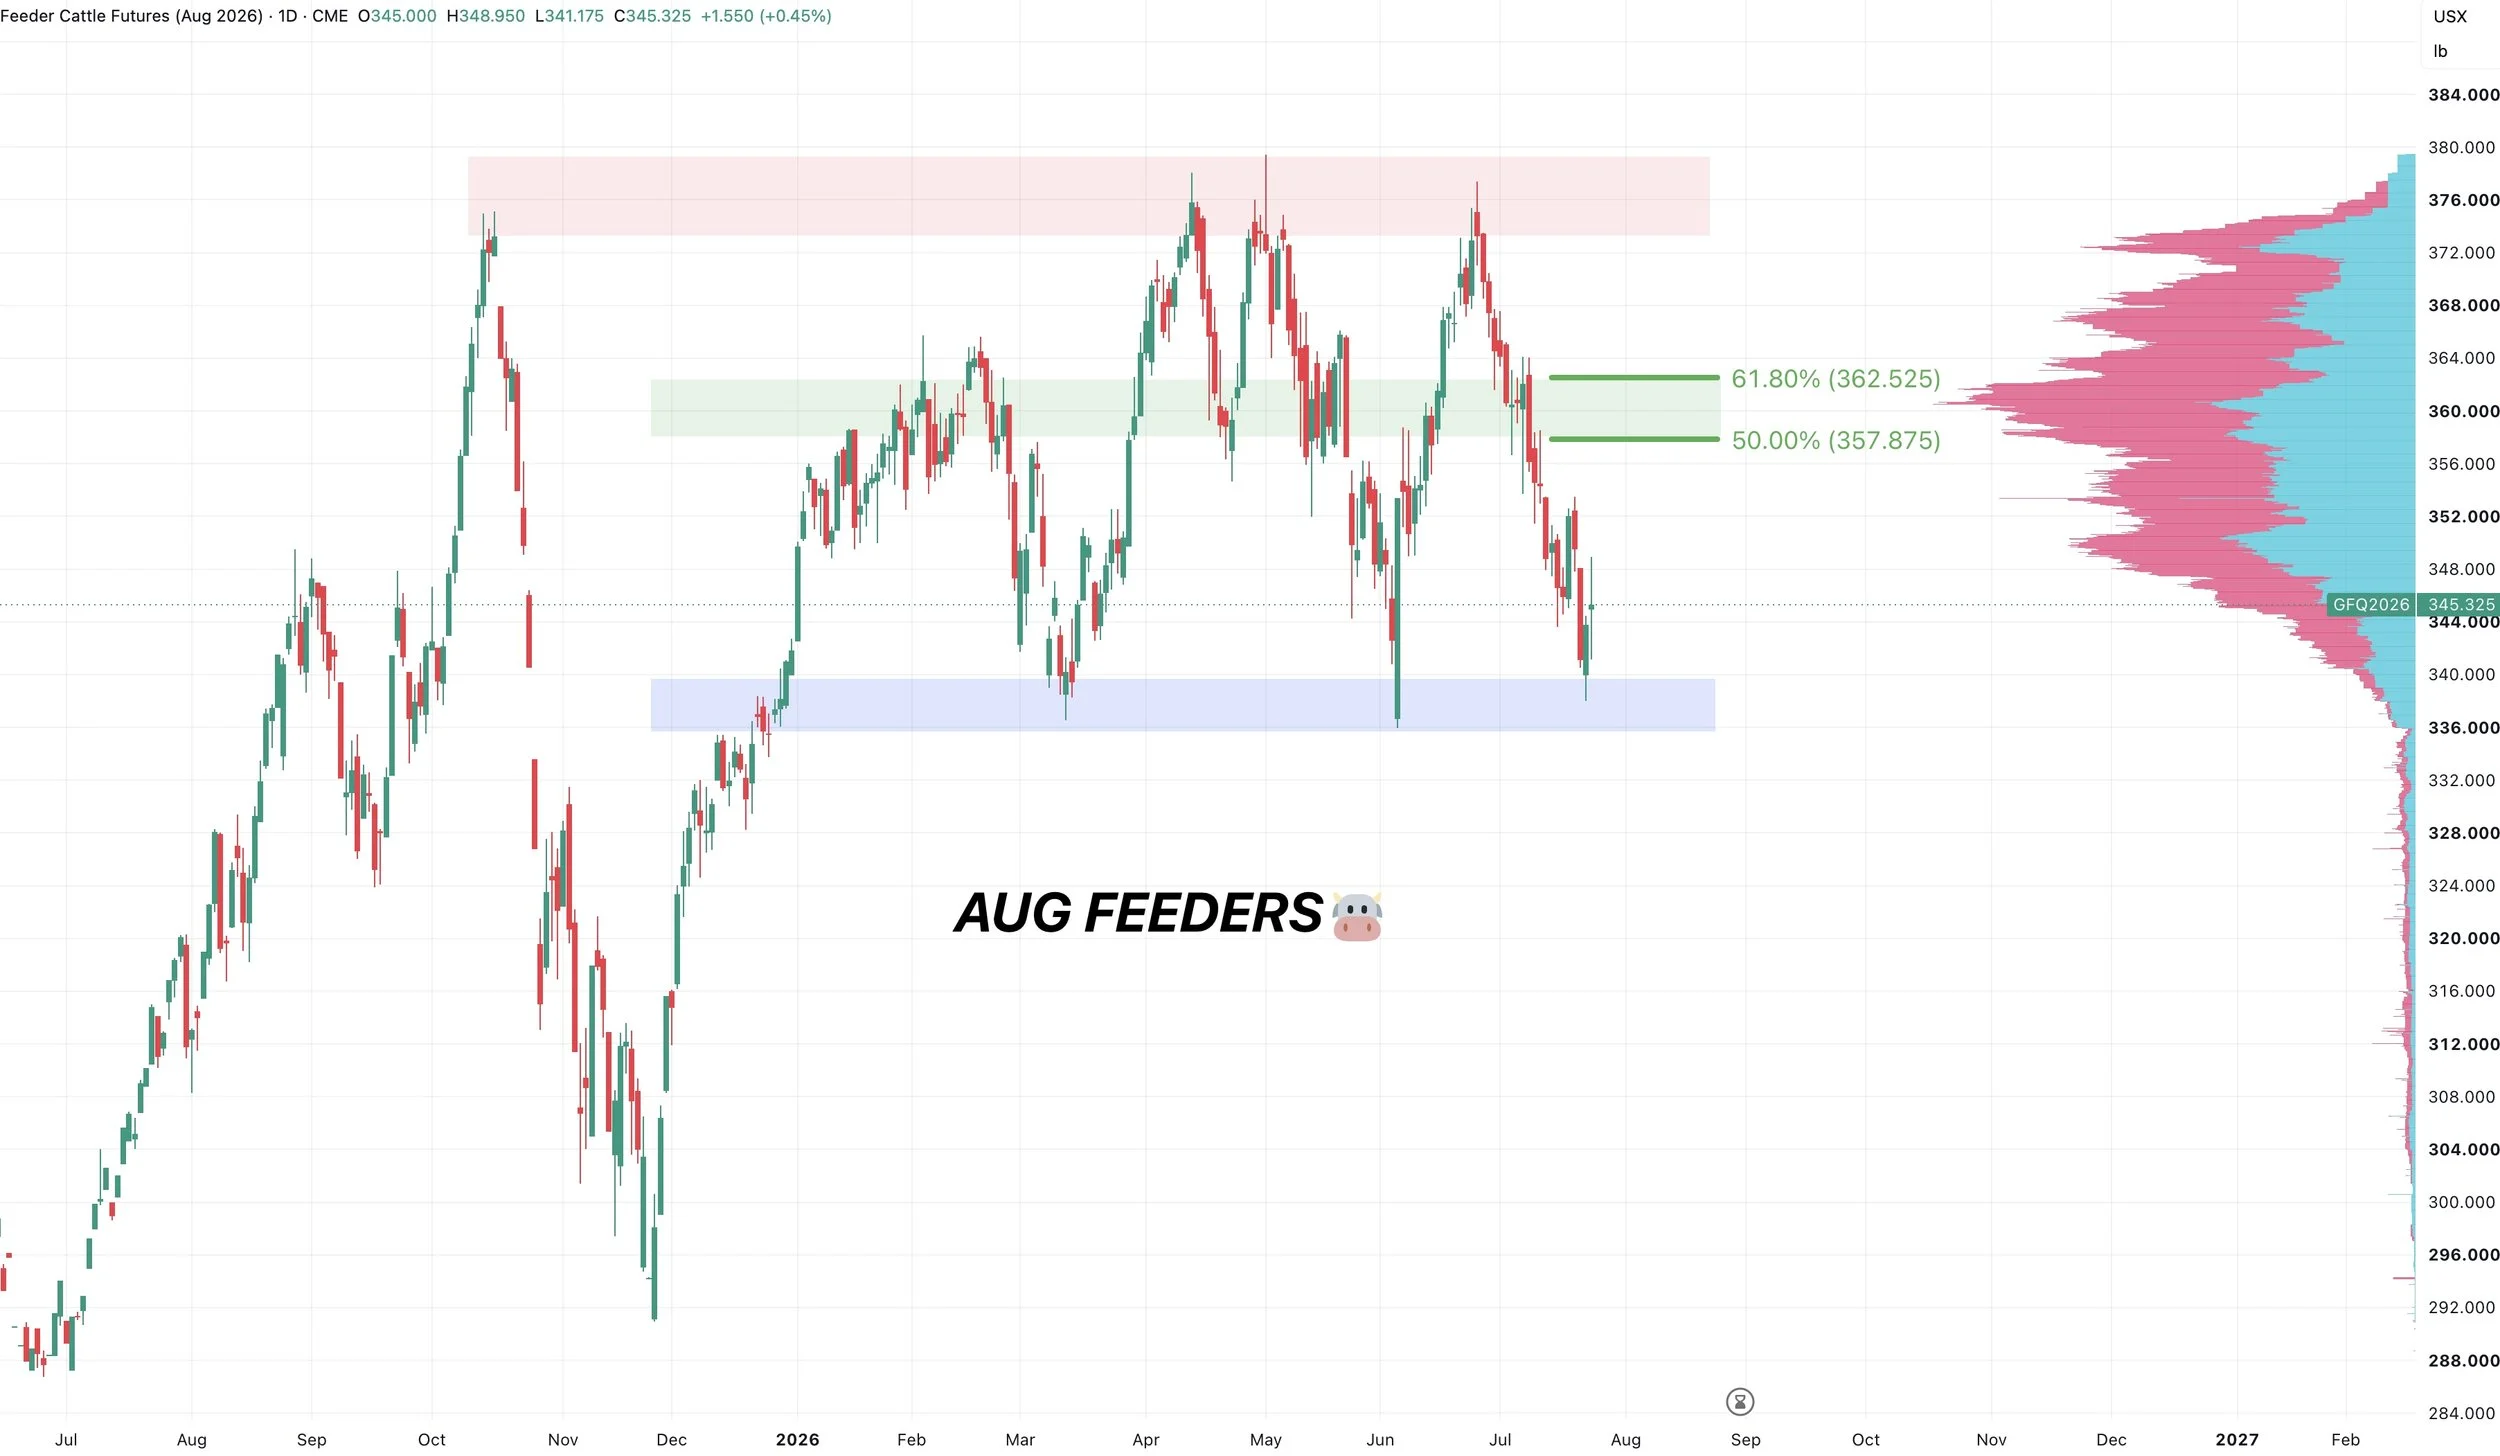
August Feeders Chart:
If we get a bounce towards that golden zone around 357 to 362 I'd look to defend it.
That same area is also peak volume.
If you were looking for a bounce, this would be a good spot for it to happen. We are sitting at some clear key support we'd like to see hold.
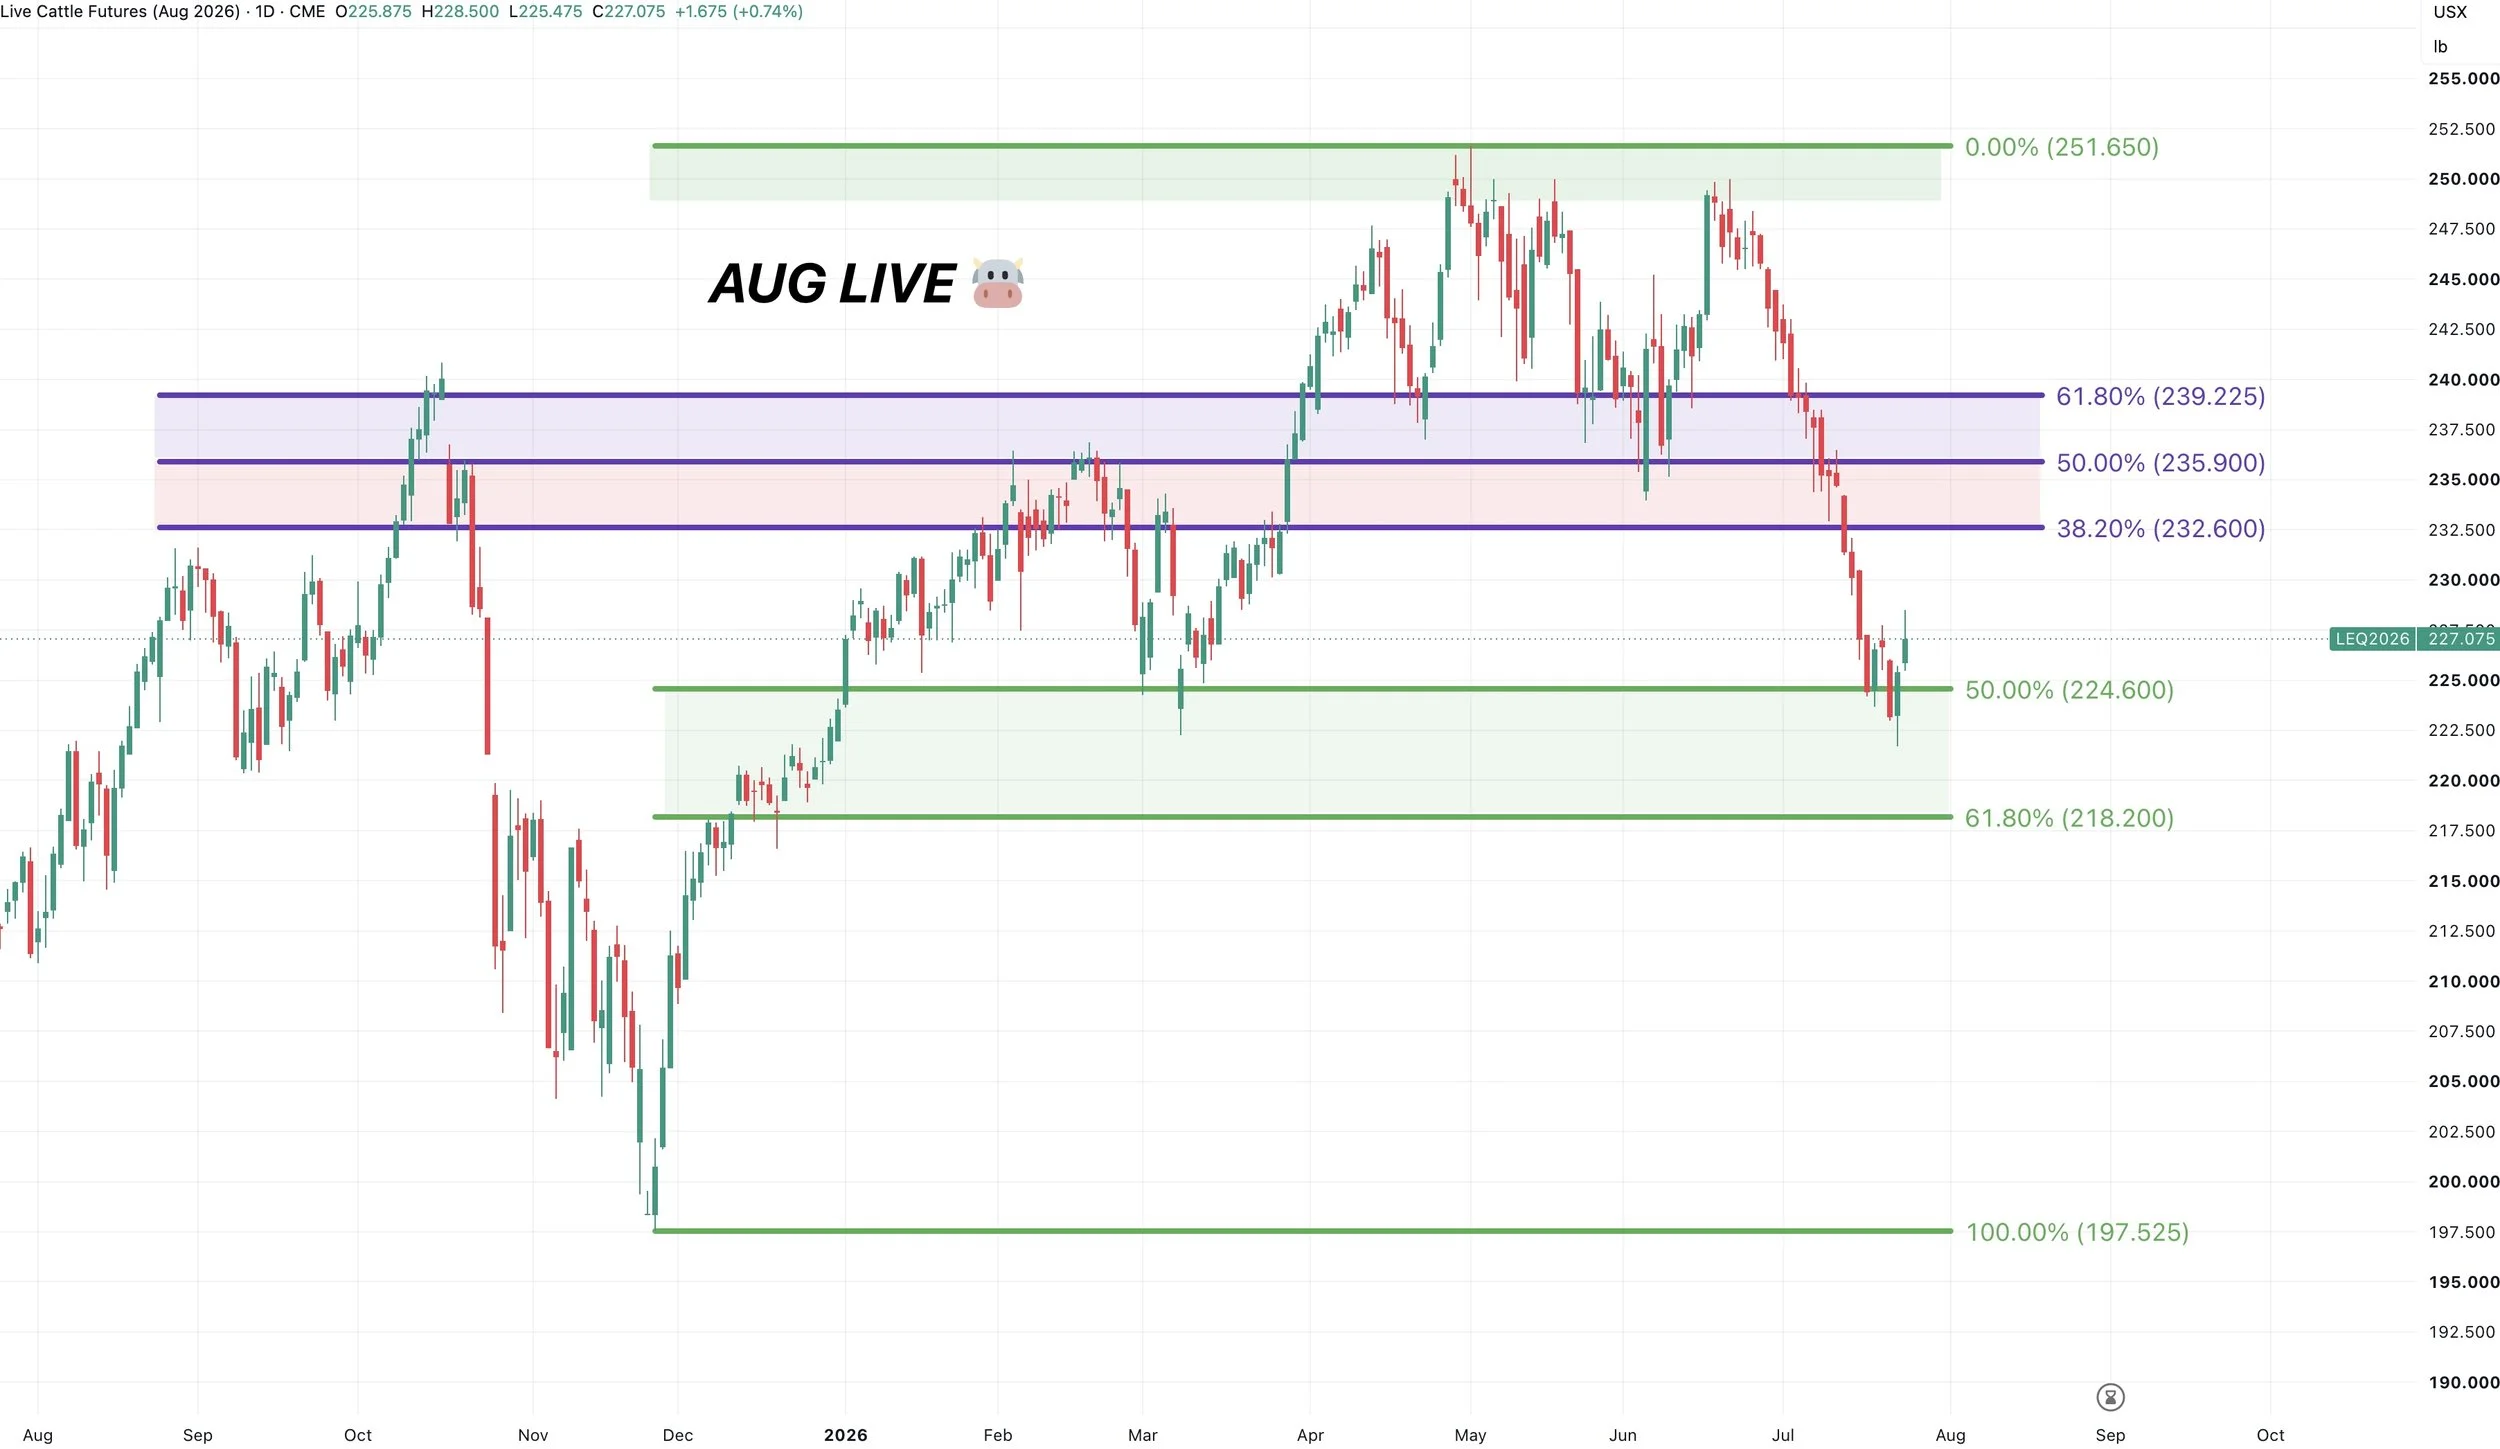
Aug Live Chart:
If we are able to get a bounce out of here, I'd look to defend around that 50% level at 235-236.
That same level is old support and the highs from February.
I'd start getting concerned if we broke below the 61.8% level down to the November lows.
Want to Talk?
Our phones are open 24/7 for you guys if you ever need anything or want to discuss your operation.
Jeremey & Office: (806)484-1214
Sebastian: (605)280-1186
Email: sfrost@dailymarketminute.com
Hedge Account
Interested in a hedge account? Use the link below to set up an account or give us a call.