
GRAINS CONTINUE RUN. TIME TO DE-RISK?
MARKET UPDATE
You can scroll to read the usual update as well. As the written version is the exact same as the video.
Timestamps for video:
Overview: 0:00min
Corn: 1:55min
Beans: 5:15min
Wheat: 11:55min
Cattle: 12:45min
Want to talk about your situation?
(605)295-3100
Futures Prices Close
Overview
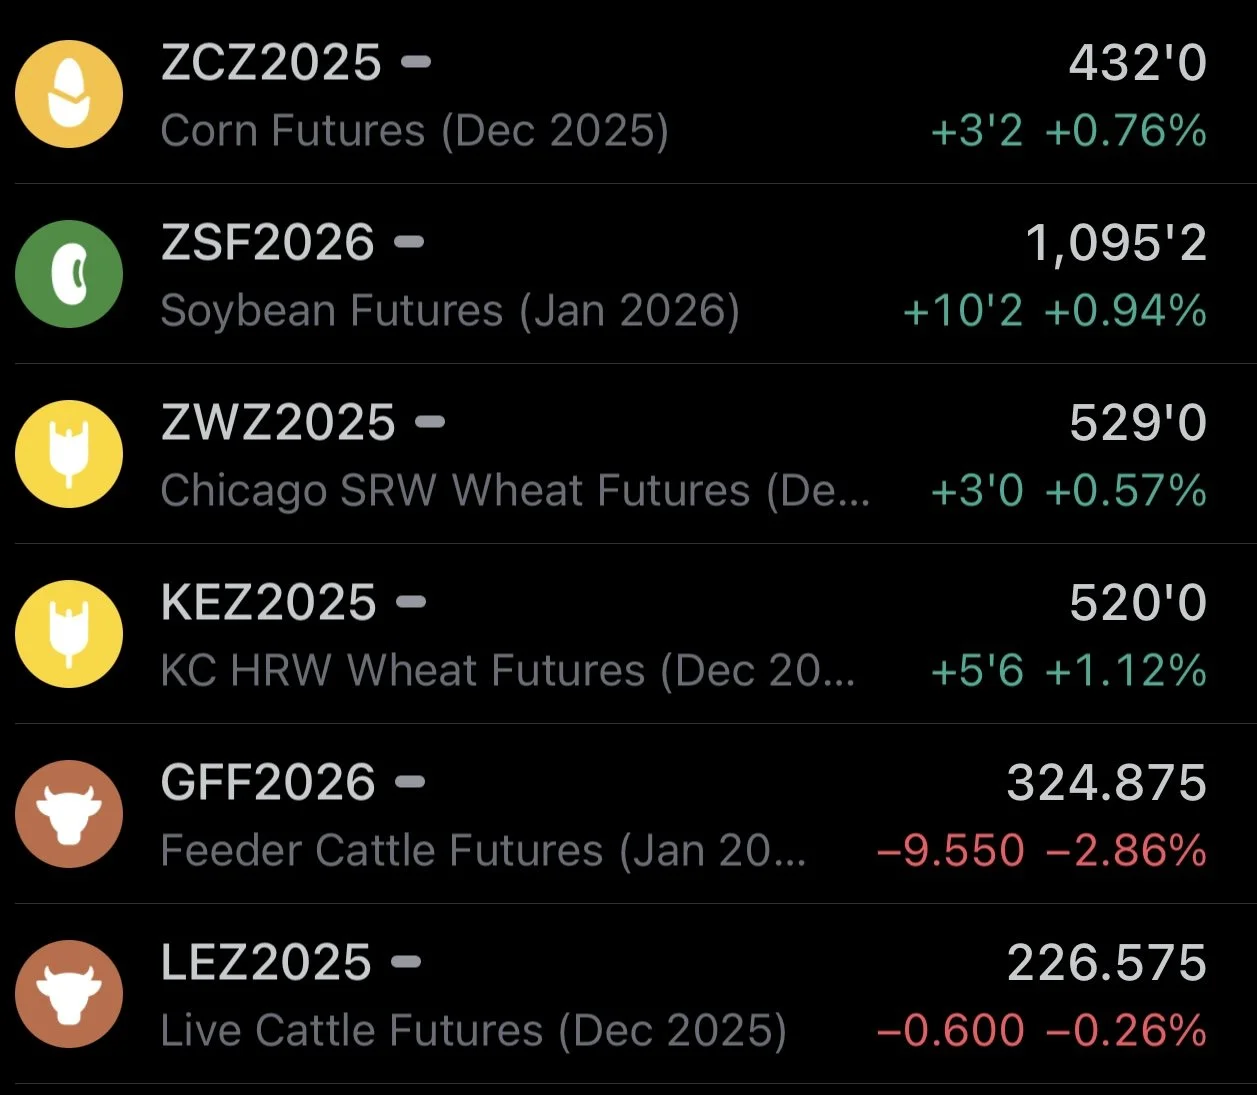
Grains higher across the board once again, although we did fade off the early highs. With soybeans closing over -12 cents off their highs.
However, front month soybeans traded to their highest levels in 477 days. While corn traded at it's highest levels since the 4th of July weekend.
The cattle market continues to fall as managed money hits the exit door.
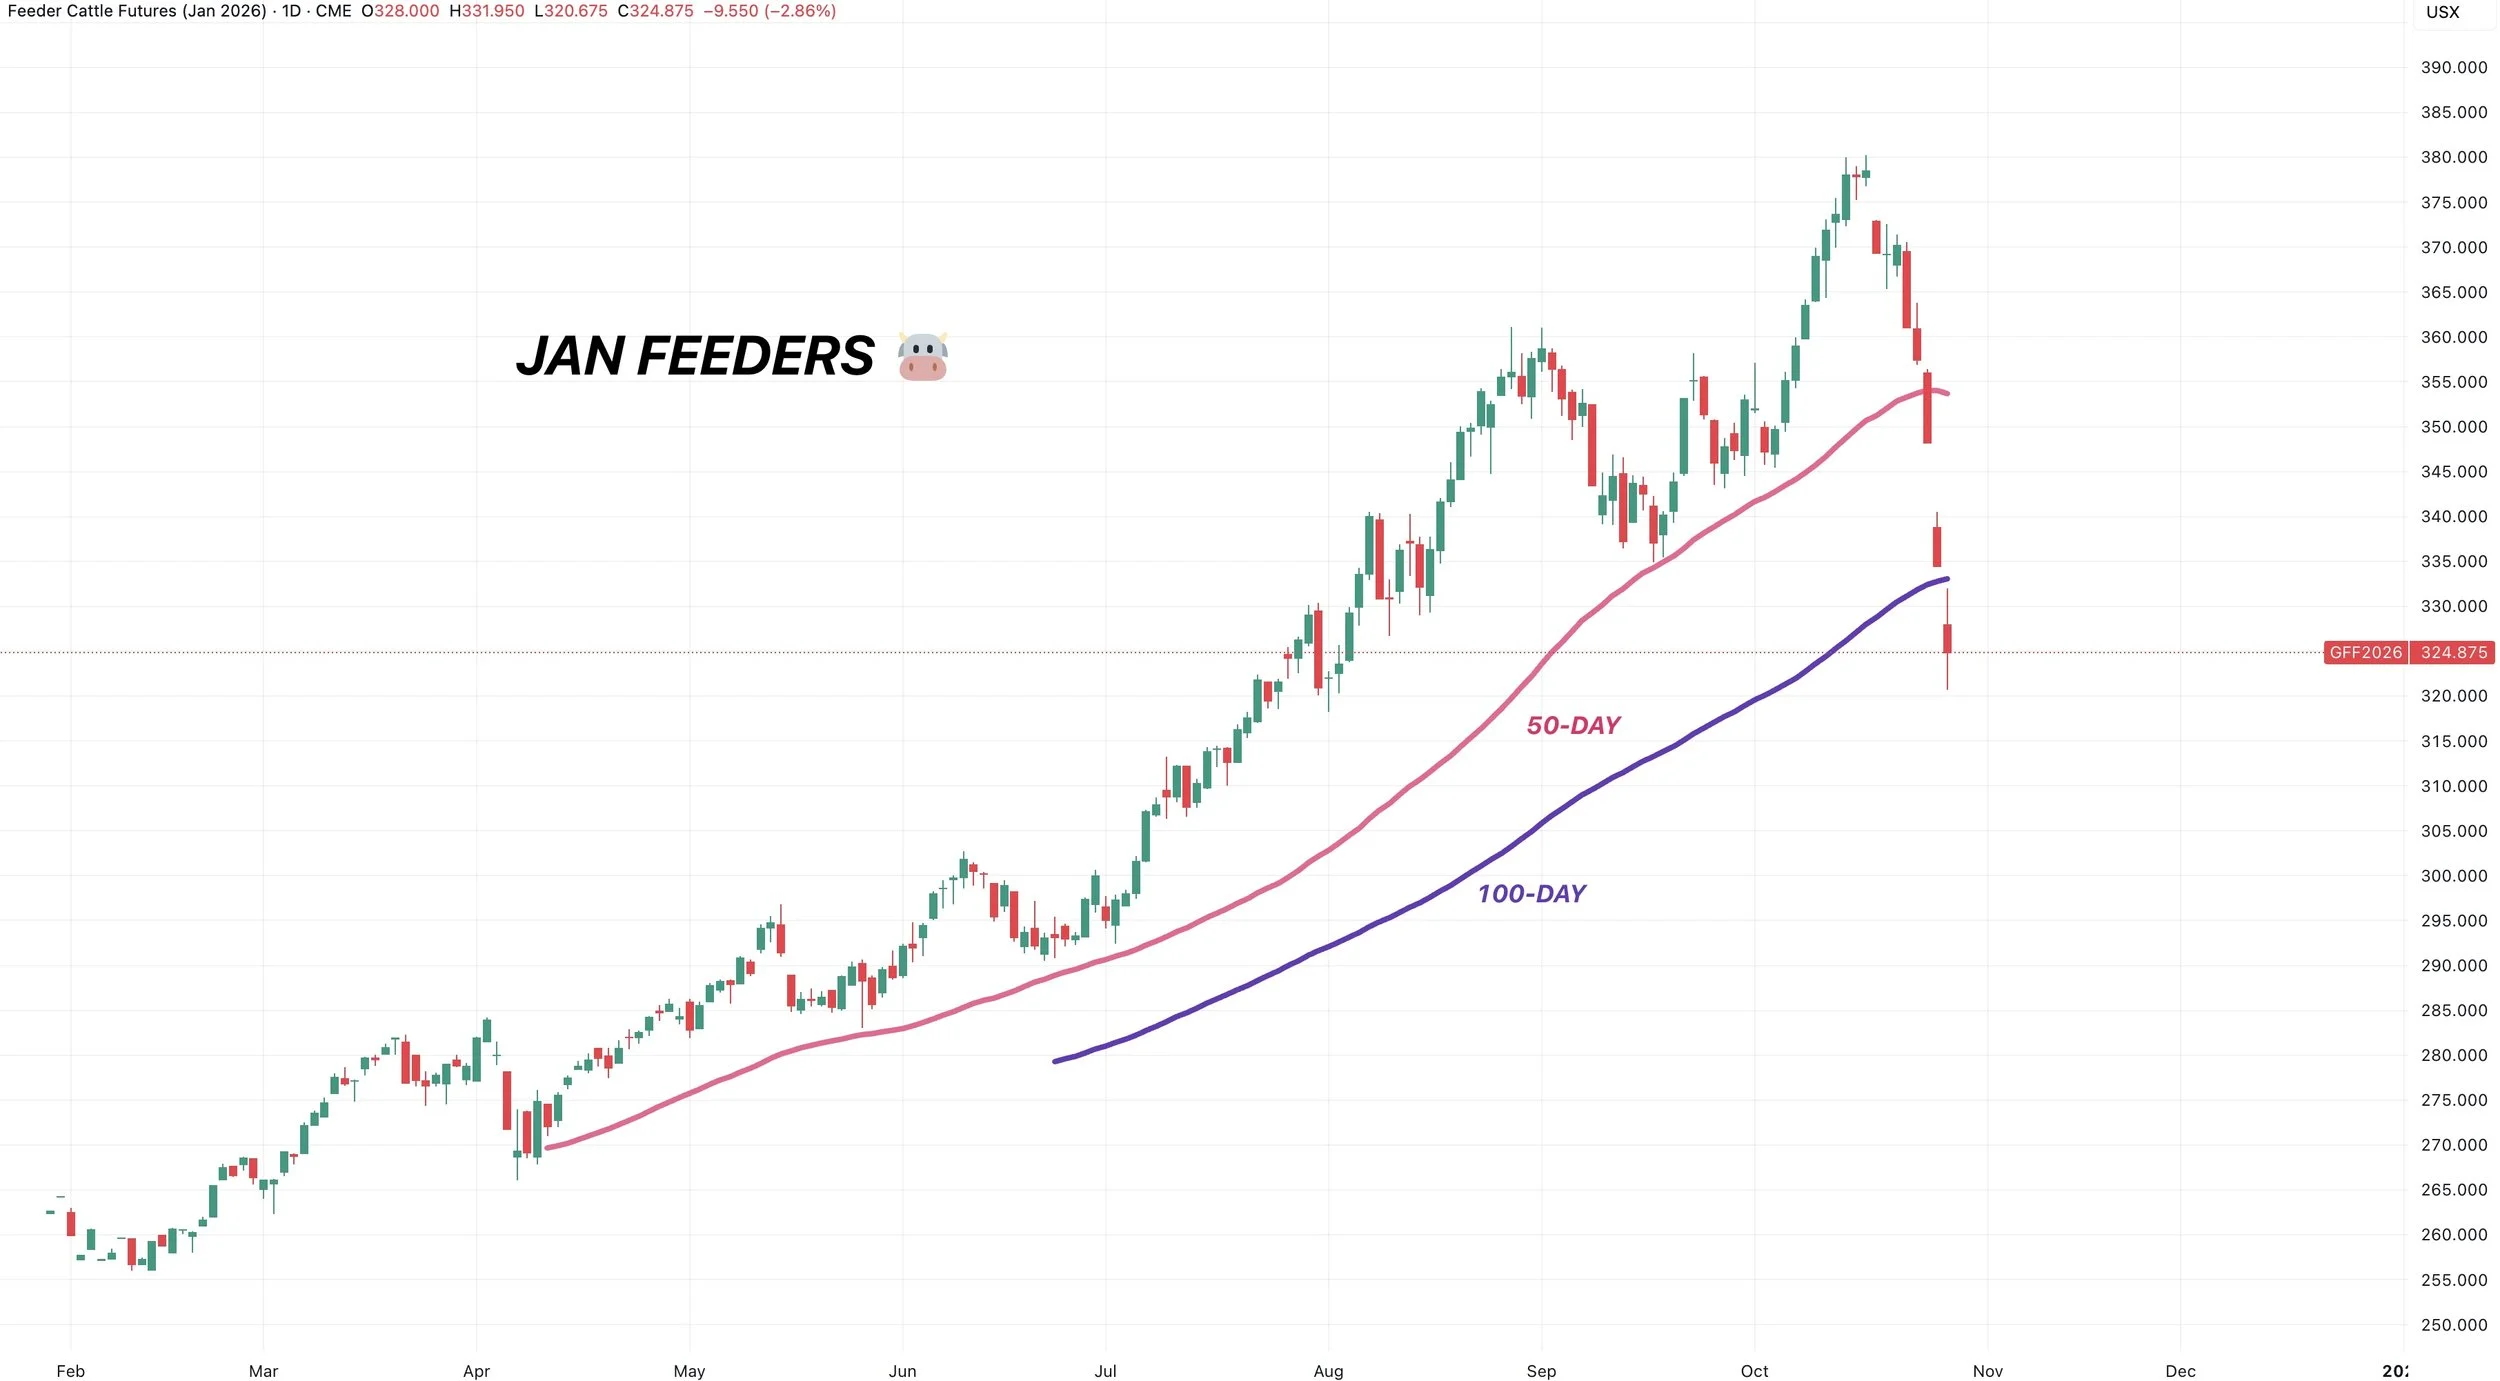
Jan feeders are now down over -55 bucks (-14.5%) in 8 days with Dec live cattle down nearly -22 (-9%). The largest correction we've seen since last year's sell off going into September.
Soybeans continue to catch a bid behind trade deal optimism.
As Trump continues to say we are going to strike a deal with China.
As you probably know, over the weekend Bessent claimed China will buy a "substantial" amount of soybeans.
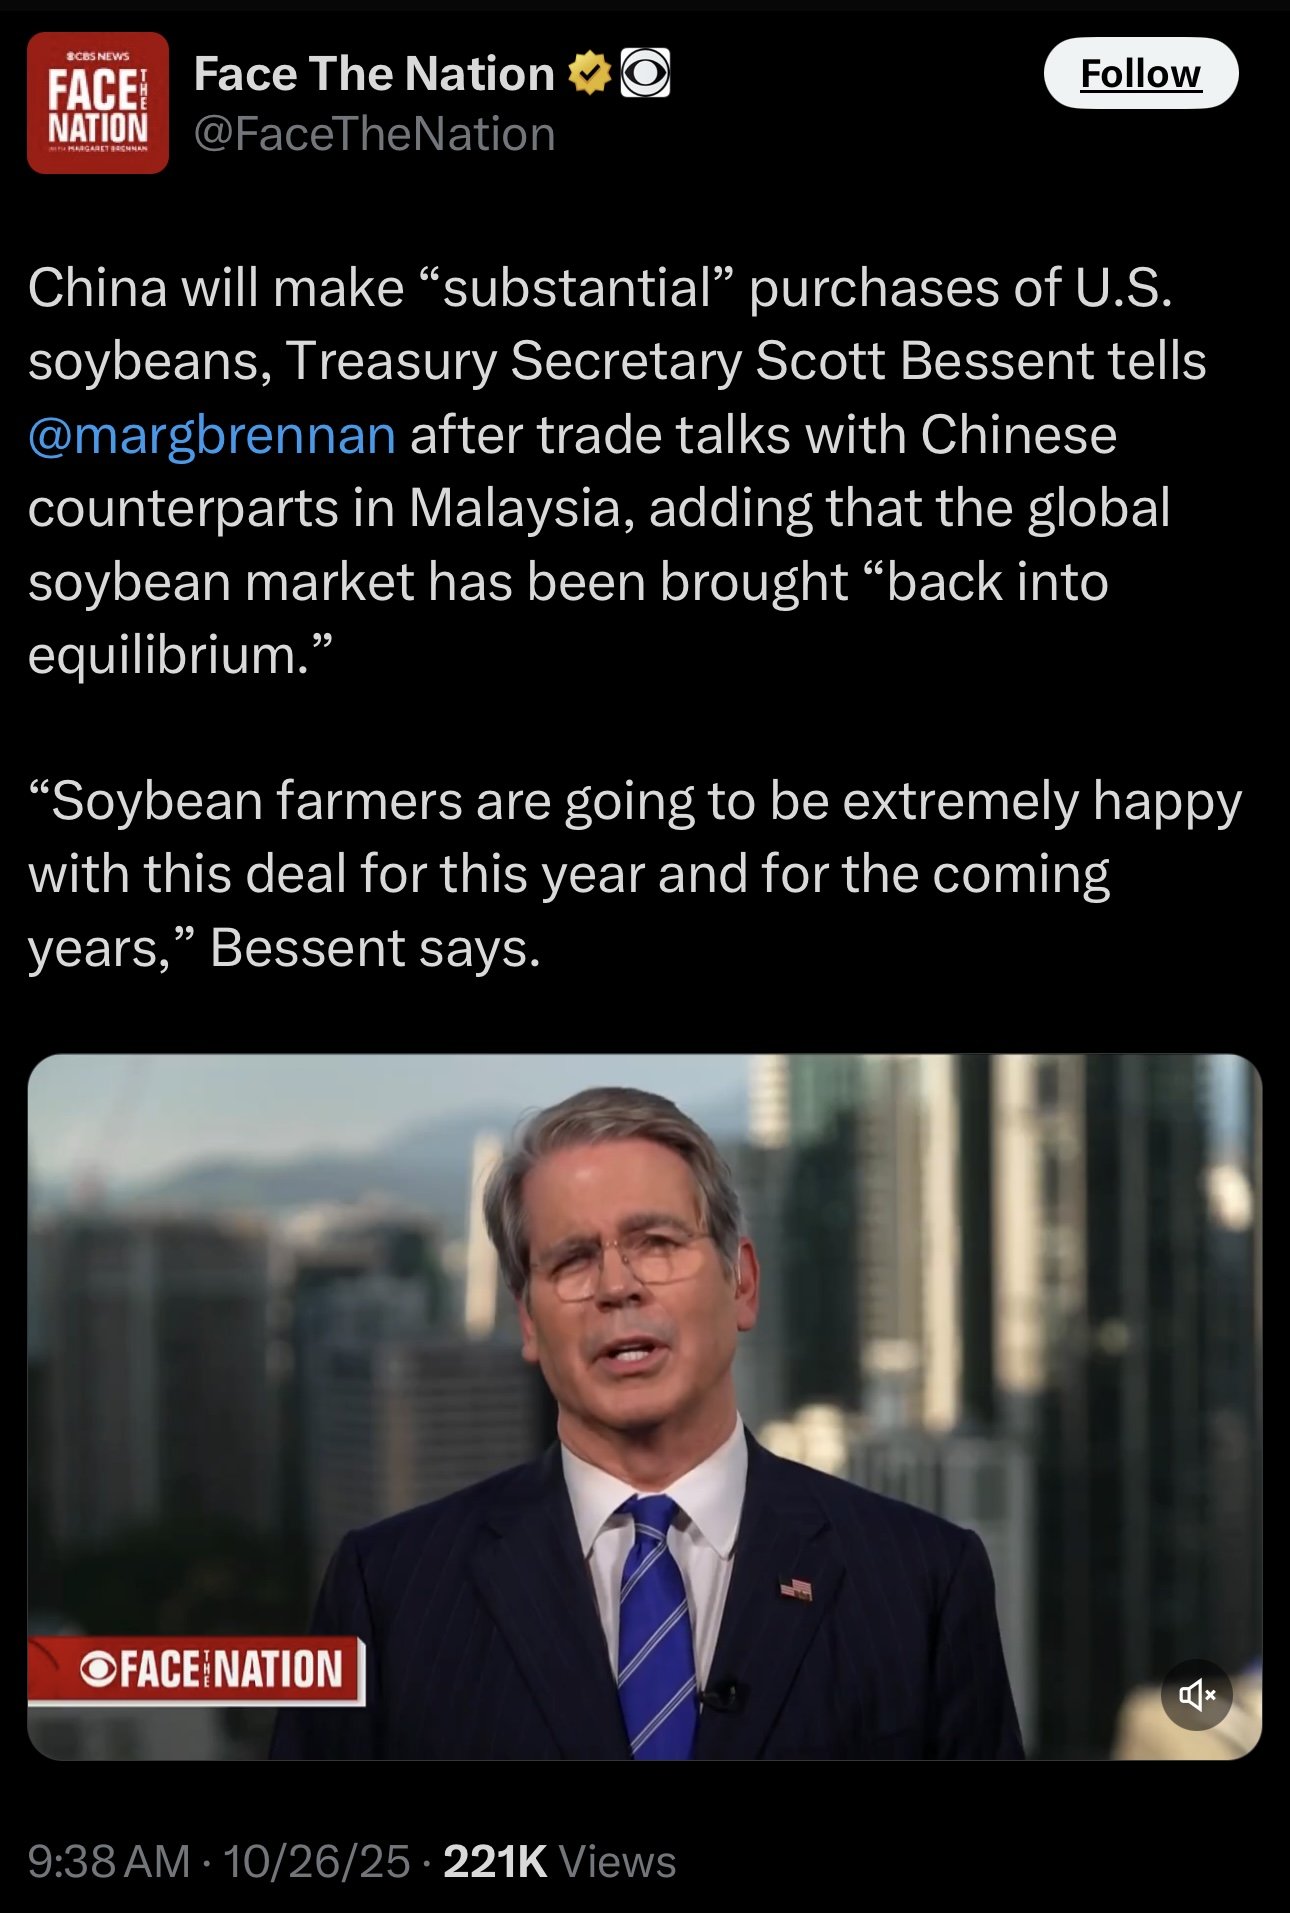
Over the weekend it was also announced that the US and China had come to an early agreement.
We do not know the details of the agreement.
Trump and China are scheduled to meet in 2 days.

There is so much uncertainty in this market.
But right now the market seems to think we are going to get a deal and that China is going to be buying soybeans.
What is the risk?
The clear risk has to be that this is a buy the rumor, sell the fact the type of event.
We rally going into the meeting then sell off once it happens.
Or even worse, if the meeting actually disappoints.
If we do not strike a deal and soybeans are not mentioned at all. That would be worst case scenario for this event.
The odds currently suggest the Government shut down will last 45 days.
It is becoming more and more unlikely that we will not be getting a November USDA report which was originally scheduled for the 10th.
Which means we might have to wait until January to get confirmation that yields are lower.

Today's Main Takeaways
Corn
Todays Sell Signal:
Today we did issue a sell signal and hedge alert.
This was our first one since that April rally.
Here is the link to the signal:
Click Here for Signal
Our generic advise is to simply secure some short term puts to establish a floor in this market if it falls. While keeping your upside open if the market decides it wants to keep running.
If you don’t have a hedge account, then we like simply making a sale between $4.35 and $4.40.
Call us if you have questions or want to talk specifics.
Jeremey: (605)295-3100
I don’t want to get carried away here, but simply a start following a near +50 cent rally.
Fundamentals:
Export demand continues to impress.
We don’t have actual export data due to the shutdown (amount of corn sold).
But we do have export inspections data (the amount of grain that is actually being shipped).
Export inspections are up nearly +60% vs last year.
Up +100% vs the 5-year average.
The best ever up to this point.
Chart from StoneX

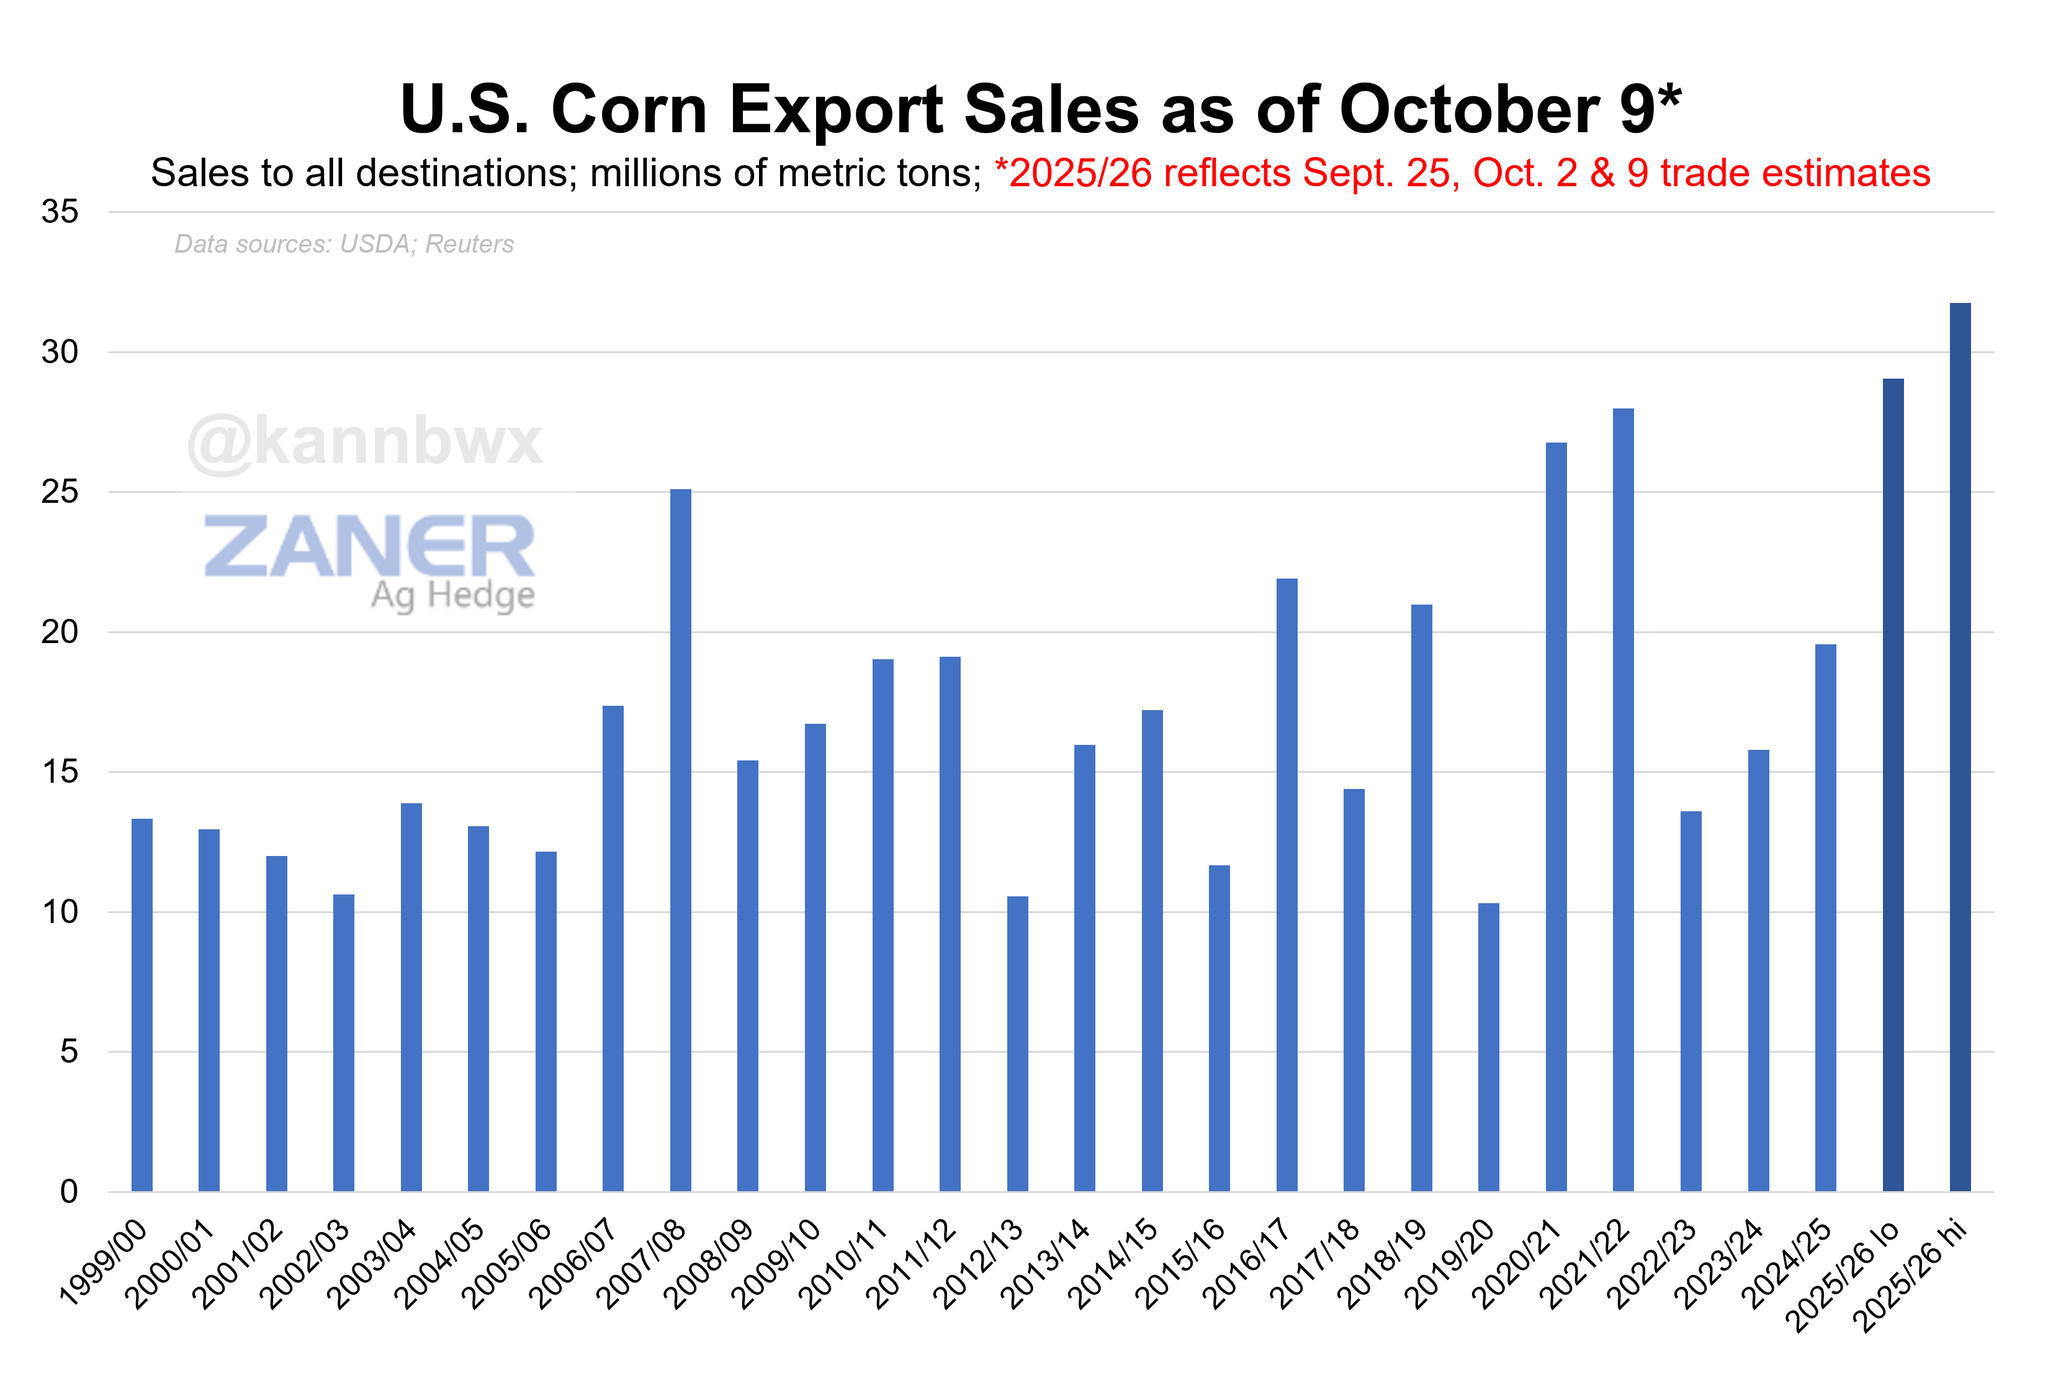
Since we don’t have export sales data.
Here is a chart from Karen Braun from a few weeks ago.
At that point, export sales were record high.
The only years that even comes close were back during the last bull run after the phase 1 trade deal with China.
That bull run and record high exports were almost entirely led by China.
We haven’t sold anything to China this year. Yet export demand is that great.
Now I am not holding my breath on China buying US corn.
However.. you have to imagine what would happen to this market if China did buy US corn with our export program already sitting at a record.
So we have record demand.
Not only that.. but yield coming down.
Most are suggesting 180 or lower.
So I mean there are some friendly things going for the corn market.
This market already priced in a 2.3 billion bu carryout and 189 yield.
We probably won’t get confirmation of lower yields until January.
So perhaps we don’t get that serious opportunity until the end of the year and going into next.
Which is exactly what we saw happen last year when the USDA ultimately lowered yield from 183.8 in October to 179.3 come January and we created demand.
Here is a March-25 vs March-26 comparison if you line up the harvest lows.
We've seen some very similar price action.

Technicals:
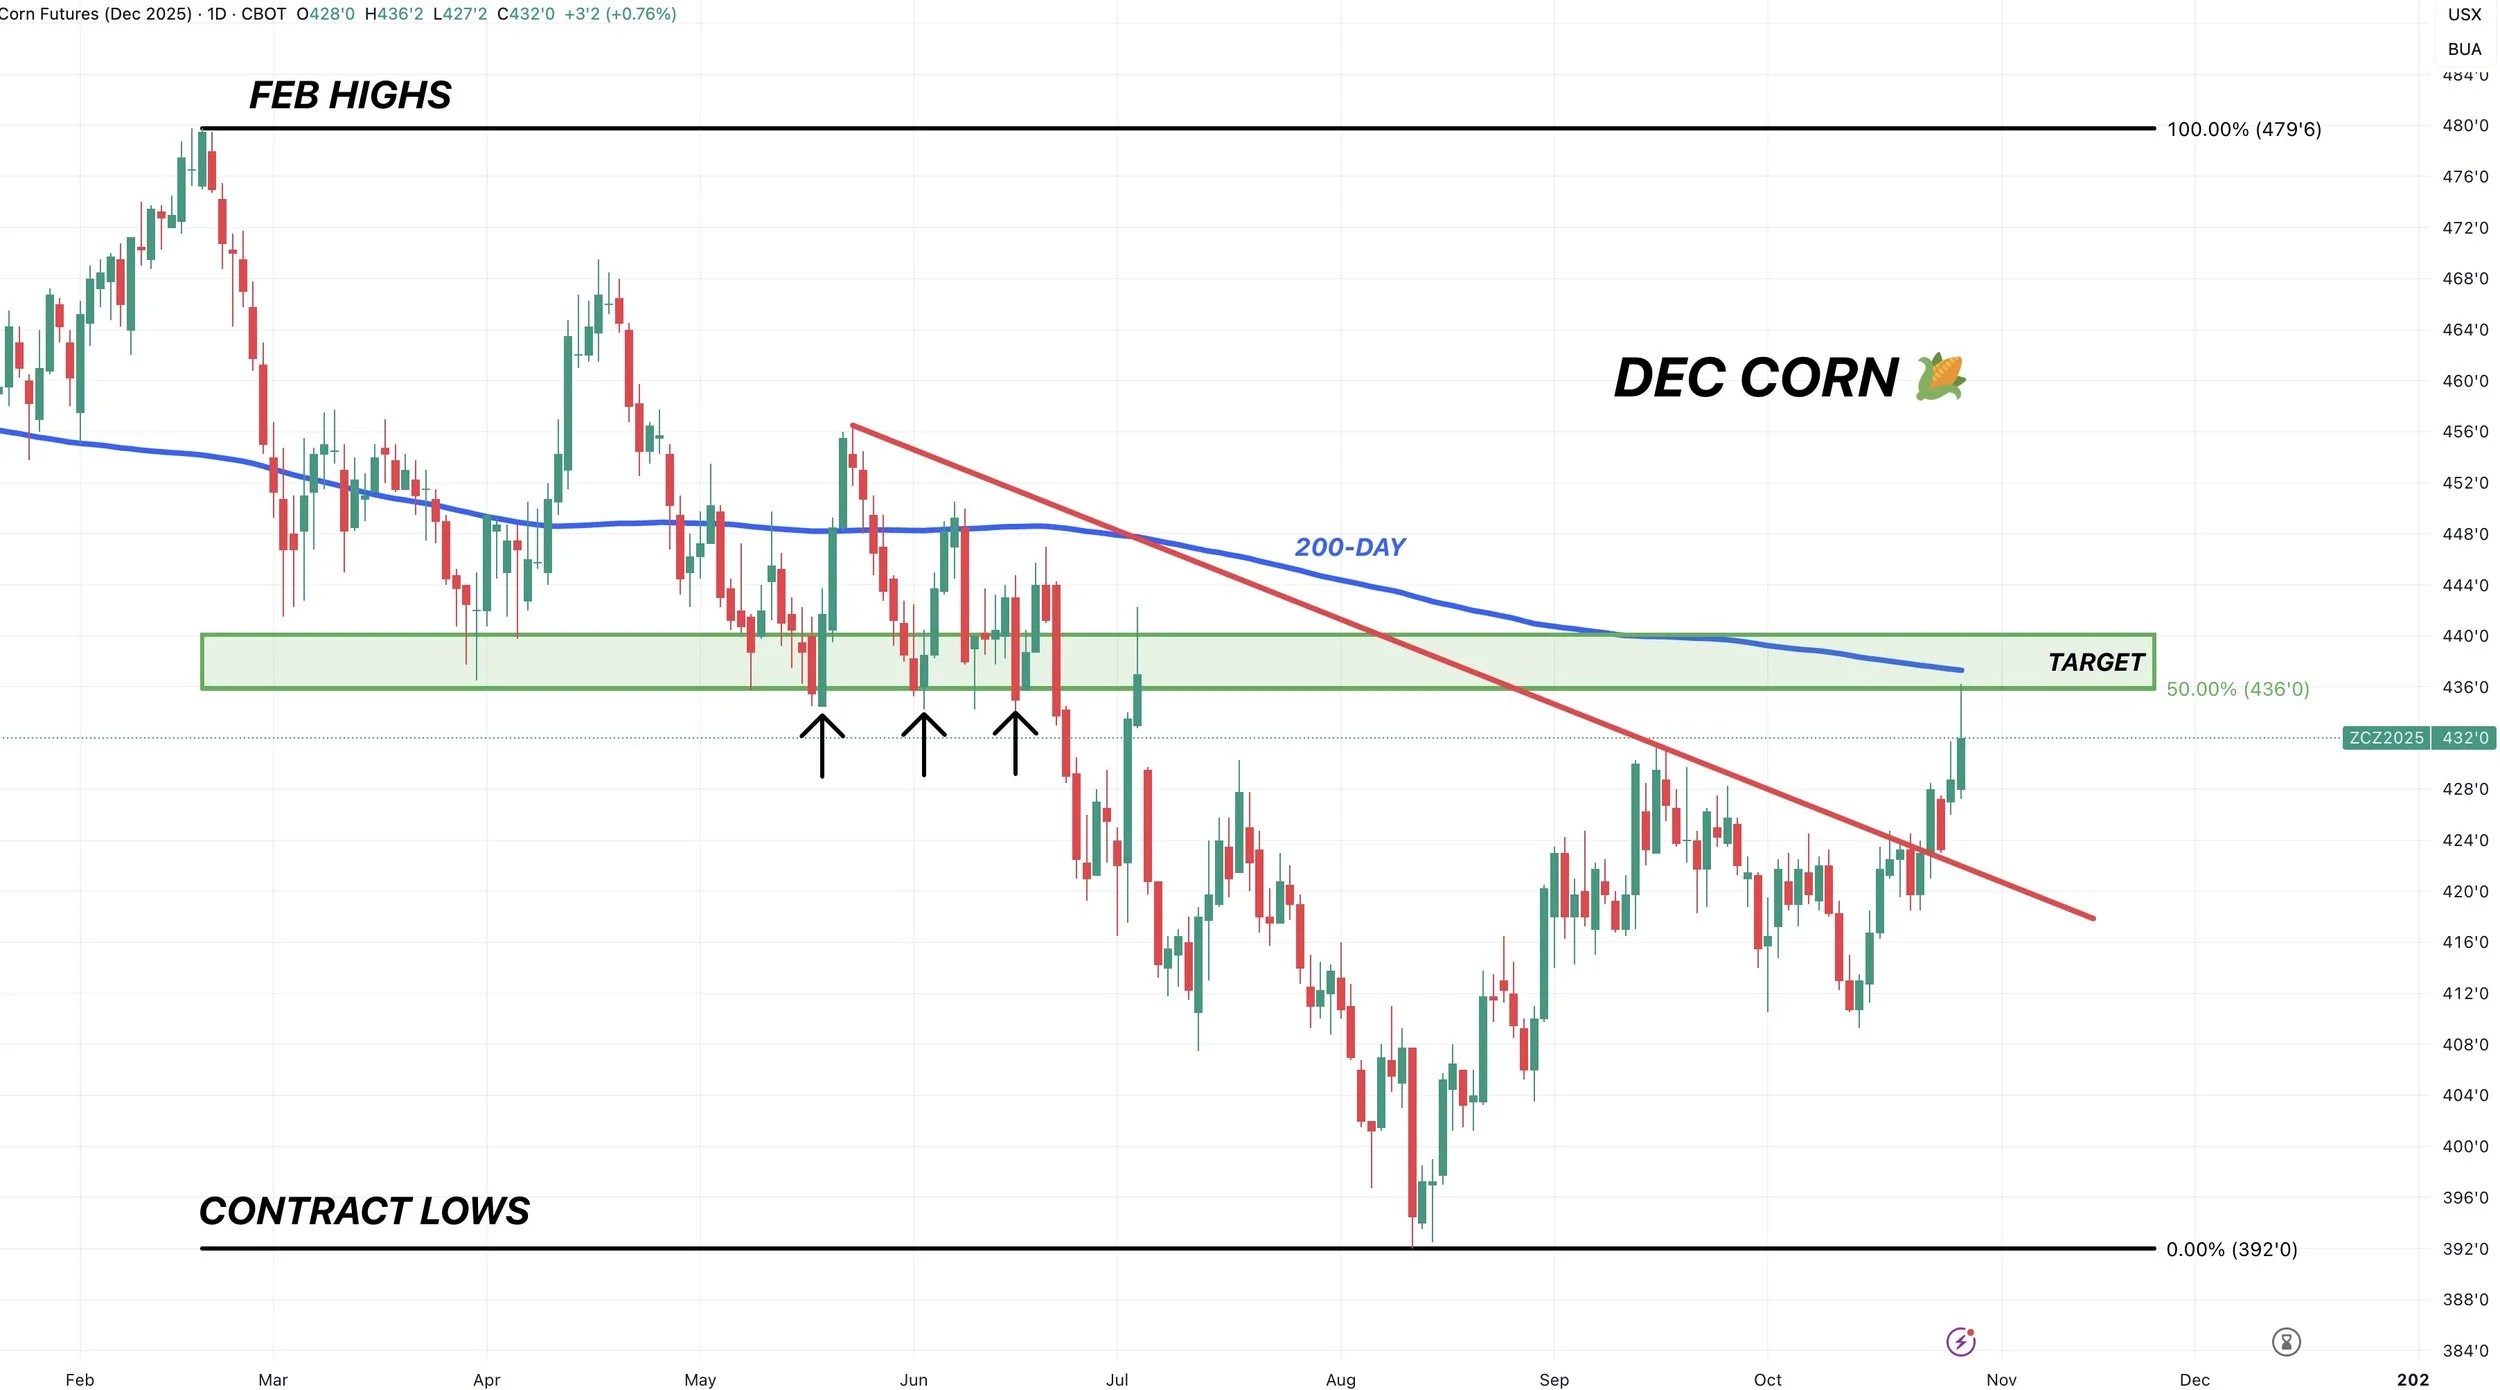
Today we hit my first target in Dec corn that I've had for the last few months.
Which was $4.35 as it gave back 50% of the February highs.
Not only that, but it was old key support from spring.
It was where this market found a floor before falling off in June.
Often times, old support is going to turn into new resistance.
Hence why we issued a sell signal & hedge alert.
The 200-day MA also sits right here. Which we haven’t closed above since May.
If we break above this level, then it could cause more short covering and further upside.
But for now, it is going to be viewed as resistance and our first point of interest.
If you have JFM delivery, we also hit our target March corn.
$4.50 clawed back exactly 50% of the February highs.
It was also old suppport from spring.

Soybeans
Yesterdays Sell Signal:
Soybeans are at their highest levels in over a year.
This entire rally has been purely based on optimism that we are going to land a deal and China is going to buy soybeans.
So there is definitely risk that the market gets disappointed if the talk between China and Trump disappoints.
Which is why we alerted a sell signal & hedge alert yesterday.
It simply makes sense to at least partially manage your risk at the highest prices you've seen in nearly 500 days. It is hard to just shrug off a move like this and not do anything at all.
Our advice was, and still is, to keep a stop order under this market or grab some short term puts if you have a hedge account.
The purpose of this strategy is to establish a floor if we fall, but to keep your upside open.
For those of you who were forced to sell soybeans, you could look at re-owning with a cheap call option. This locks in your price while maintaining upside potential.
For those who have stuff on DP or basis contracts, you could consider selling your beans and re-owning with a call instead. Again, locking in your price while keeping upside exposure.
If you do not have a hedge account, our advice yesterday was to simply spread out a few sales over the next few days.
I am not getting oversold at these levels or getting carried away.
It just makes sense to manage your risk after this size of rally in just 3 weeks, but what happens if yield is 51.5 and China buys soybeans? The upside potential is there.
Call or text us if you have questions:
Jeremey: (605)295-3100
Nobody has any idea how the meeting with Trump and China will turn out.
Maybe they don’t come to an agreement and soybeans tank.
Maybe China agrees to buy a bunch of soybeans are we run to $12.00 from here.
You have to be in a position where you are comfortable with both scenarios.
Fundamentals:
Here are some balance sheet scenarios.
The first one is our most recent USDA report numbers. That features a 53.5 yield, 1,685 for exports, and a 300 million carryout.
Personally, I don’t think yield is 53.5. So in the 2nd and 3rd example I lowered yield to 52.5
What if China doesn’t buy any soybeans?
In the 2nd example, we cut our exports from 1,685 to 1,400. This brings your carryout to 500 million. Which is a bearish number.
What if China agrees to buy soybeans and our exports are actually currently understated?
In the 3rd example we raised exports from 1,685 to 1,745. That would drop your carryout to 160 million, which is amongst some of the tightest levels ever.
So you can see the possibilities for this market.
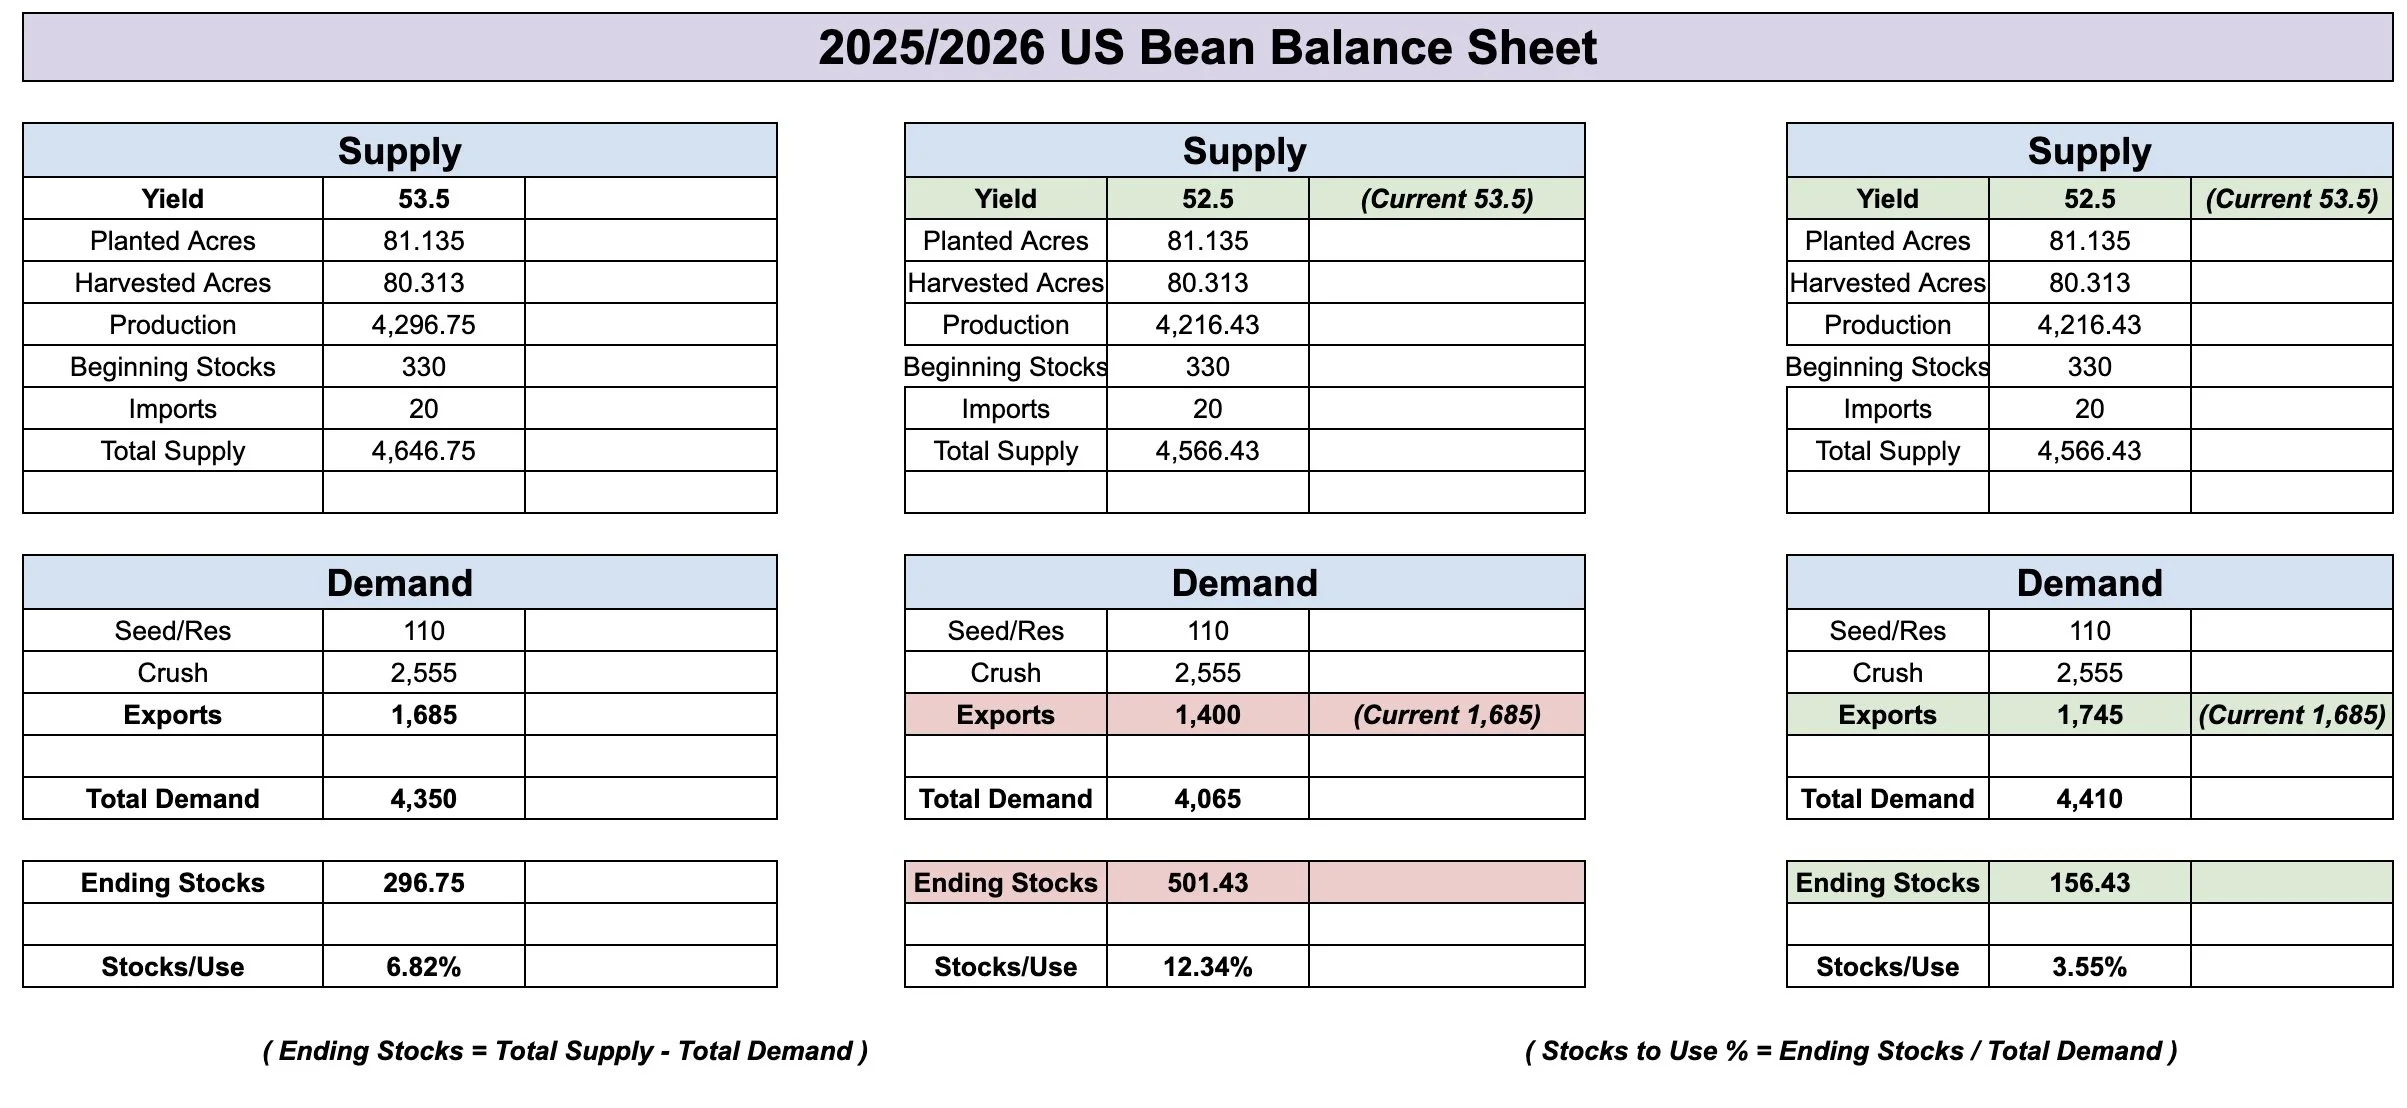
If China decides to buy soybeans, there is simply very little room for error on the balance sheet.
That is how you create a bullish scenario in the soybean market.
On the other hand, until we have clear cut proof that China is going to buy a reasonable amount of beans, it makes sense to protect this rally in some manner.
While at the same time keeping some ammo for later in case we run into one of those extremely bullish scenarios off the back of Chinese demand.
Because if yield isn’t quite there, and China buys soybeans, the sky is really the limit for this market.
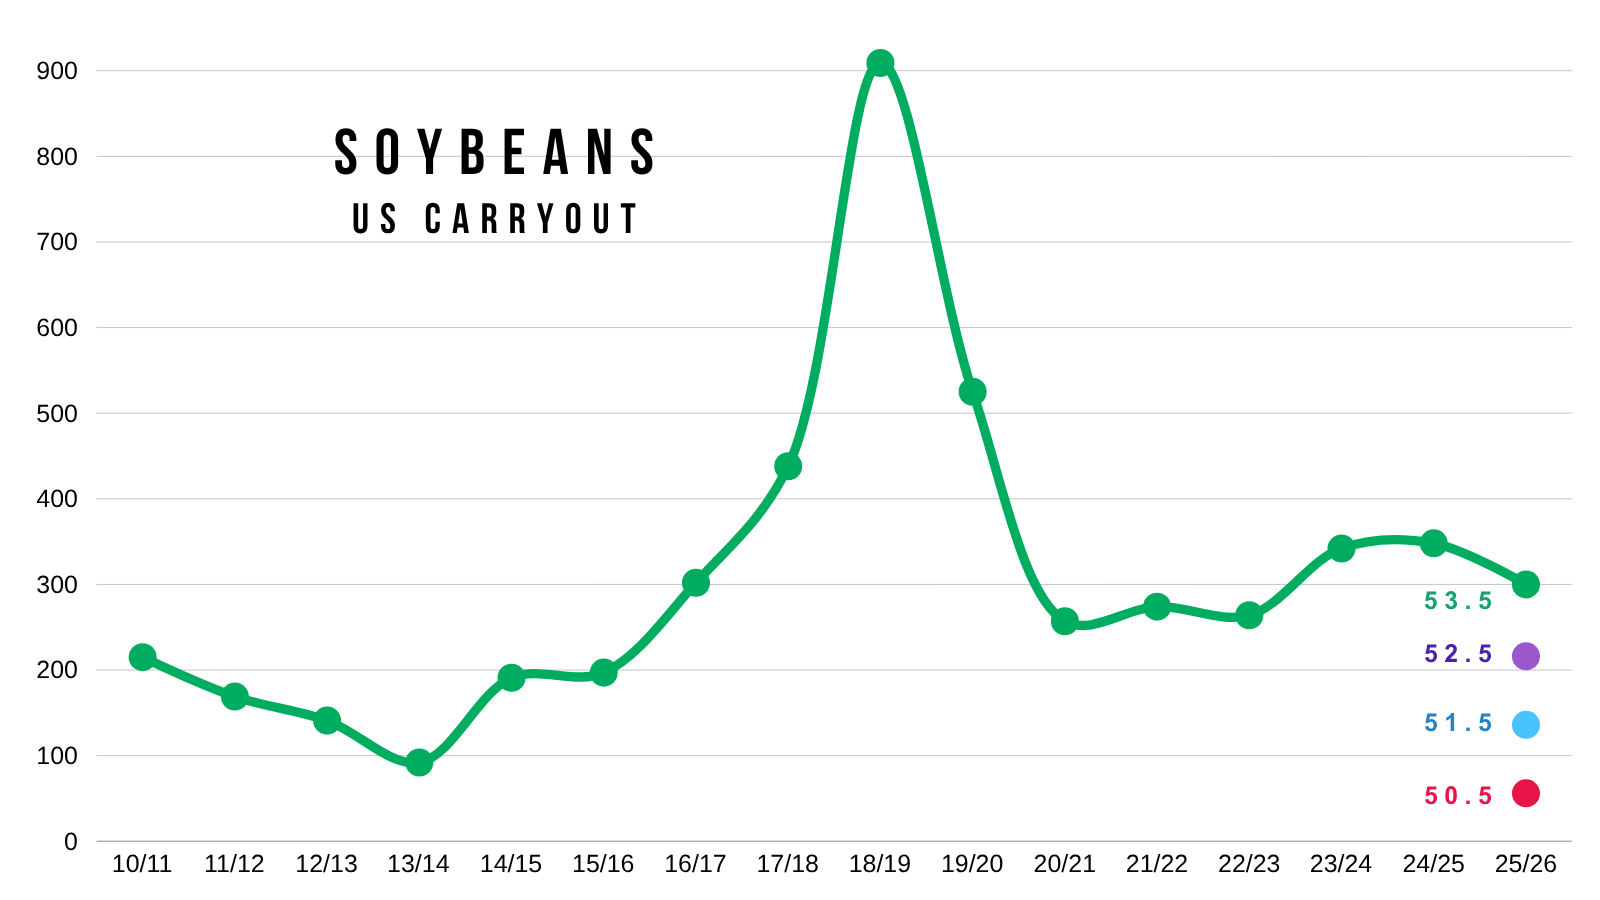
I've shown this chart countless times. But look at what happens to carryout when you start lowering yield.
This doesn’t account for demand changes, but you can see just how tight the room for error is.
If yield drops, the USDA will automatically cut export demand to offset the losses.
However, if you throw some extra Chinese demand on top of this thing, it could get really interesting.
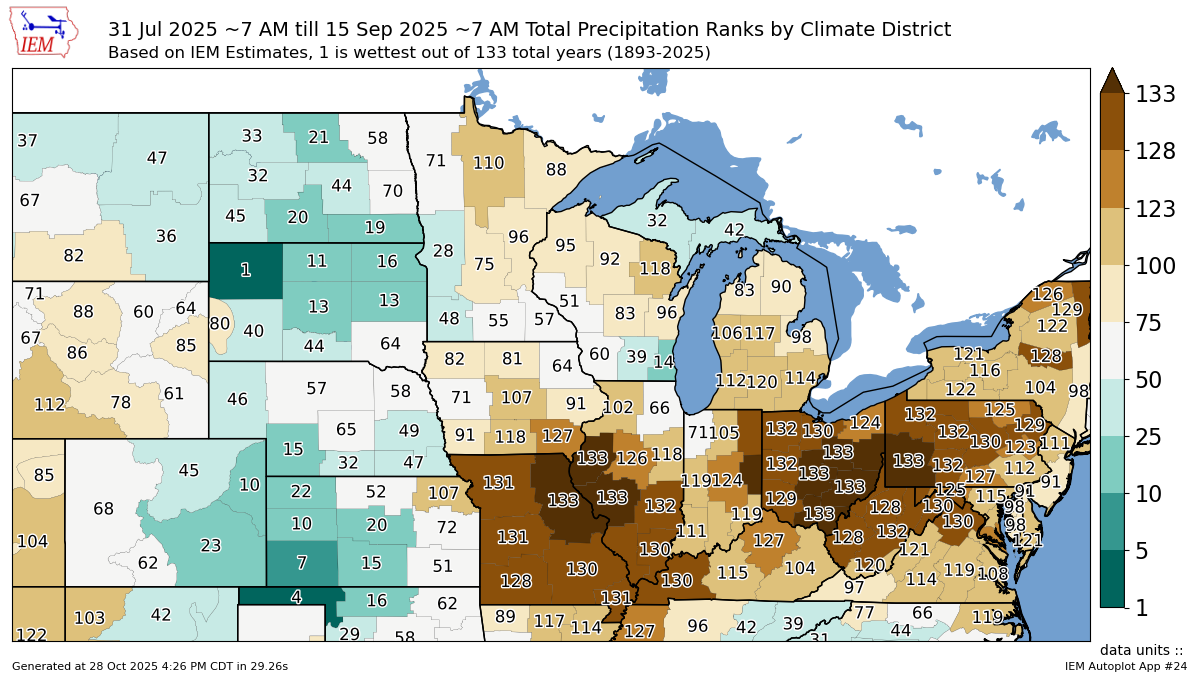
We had an incredibly dry finish.
Here the is August 1st through September 15th precip ranking.
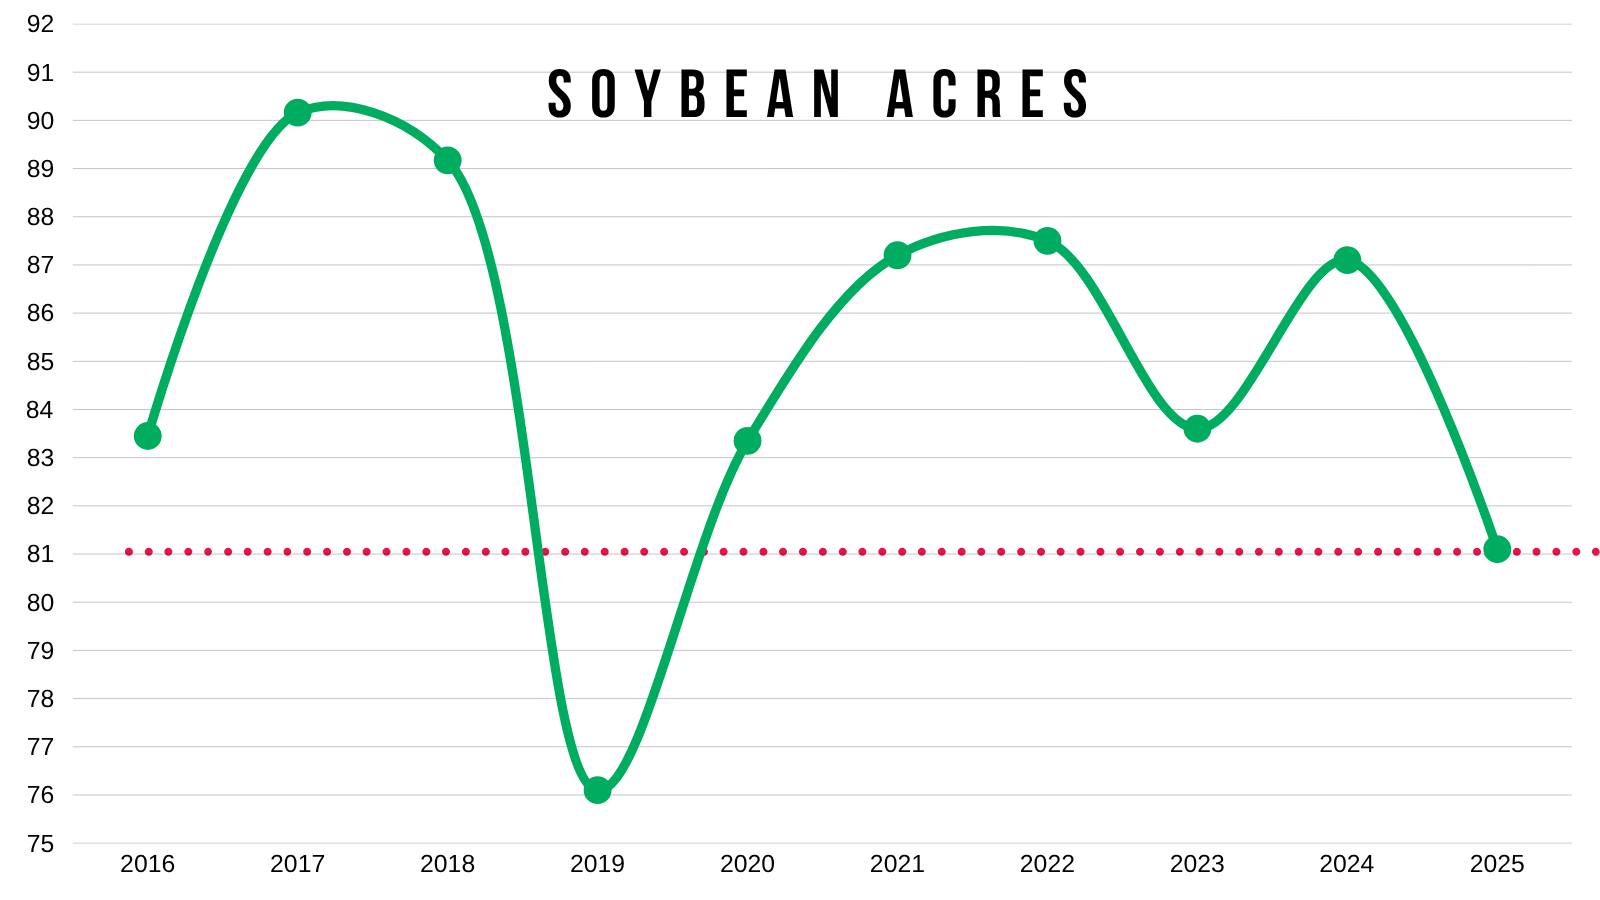
We have drastically lower acres.
Chinese demand might be all you need to create a recipe for higher prices.
Everyone has been told that China is short around 365 million bushels (10 MMT) of soybeans that they need until Brazil's crop becomes available next year.
Last year, China bought around 800 million bushels.
So even if we are able to secure those needed bushels, it would still be less than last year. But that amount might be enough to prevent the US balance sheet from growing due to other countries stepping up.
If we do get a trade deal done. Does China buy soybeans now? If so, how much? Or do they wait until year?
Maybe this doesn’t turn into a major game changing factor until next year. It is impossible to know today.
We should know this week whether this is the real deal or not.
Technicals:
Jan Beans
We are at our highest levels in over a year.
We did leave a disappointing candle today closing well off the highs.
So we will have to see how we follow it up tomorrow.
If the rally continues, our next target is $11.20 to de-risk a little more.
$11.20 gives back 50% of the contract highs.
The June rally rejected off the 38.2% level at $10.85. The next fib is the 50%.
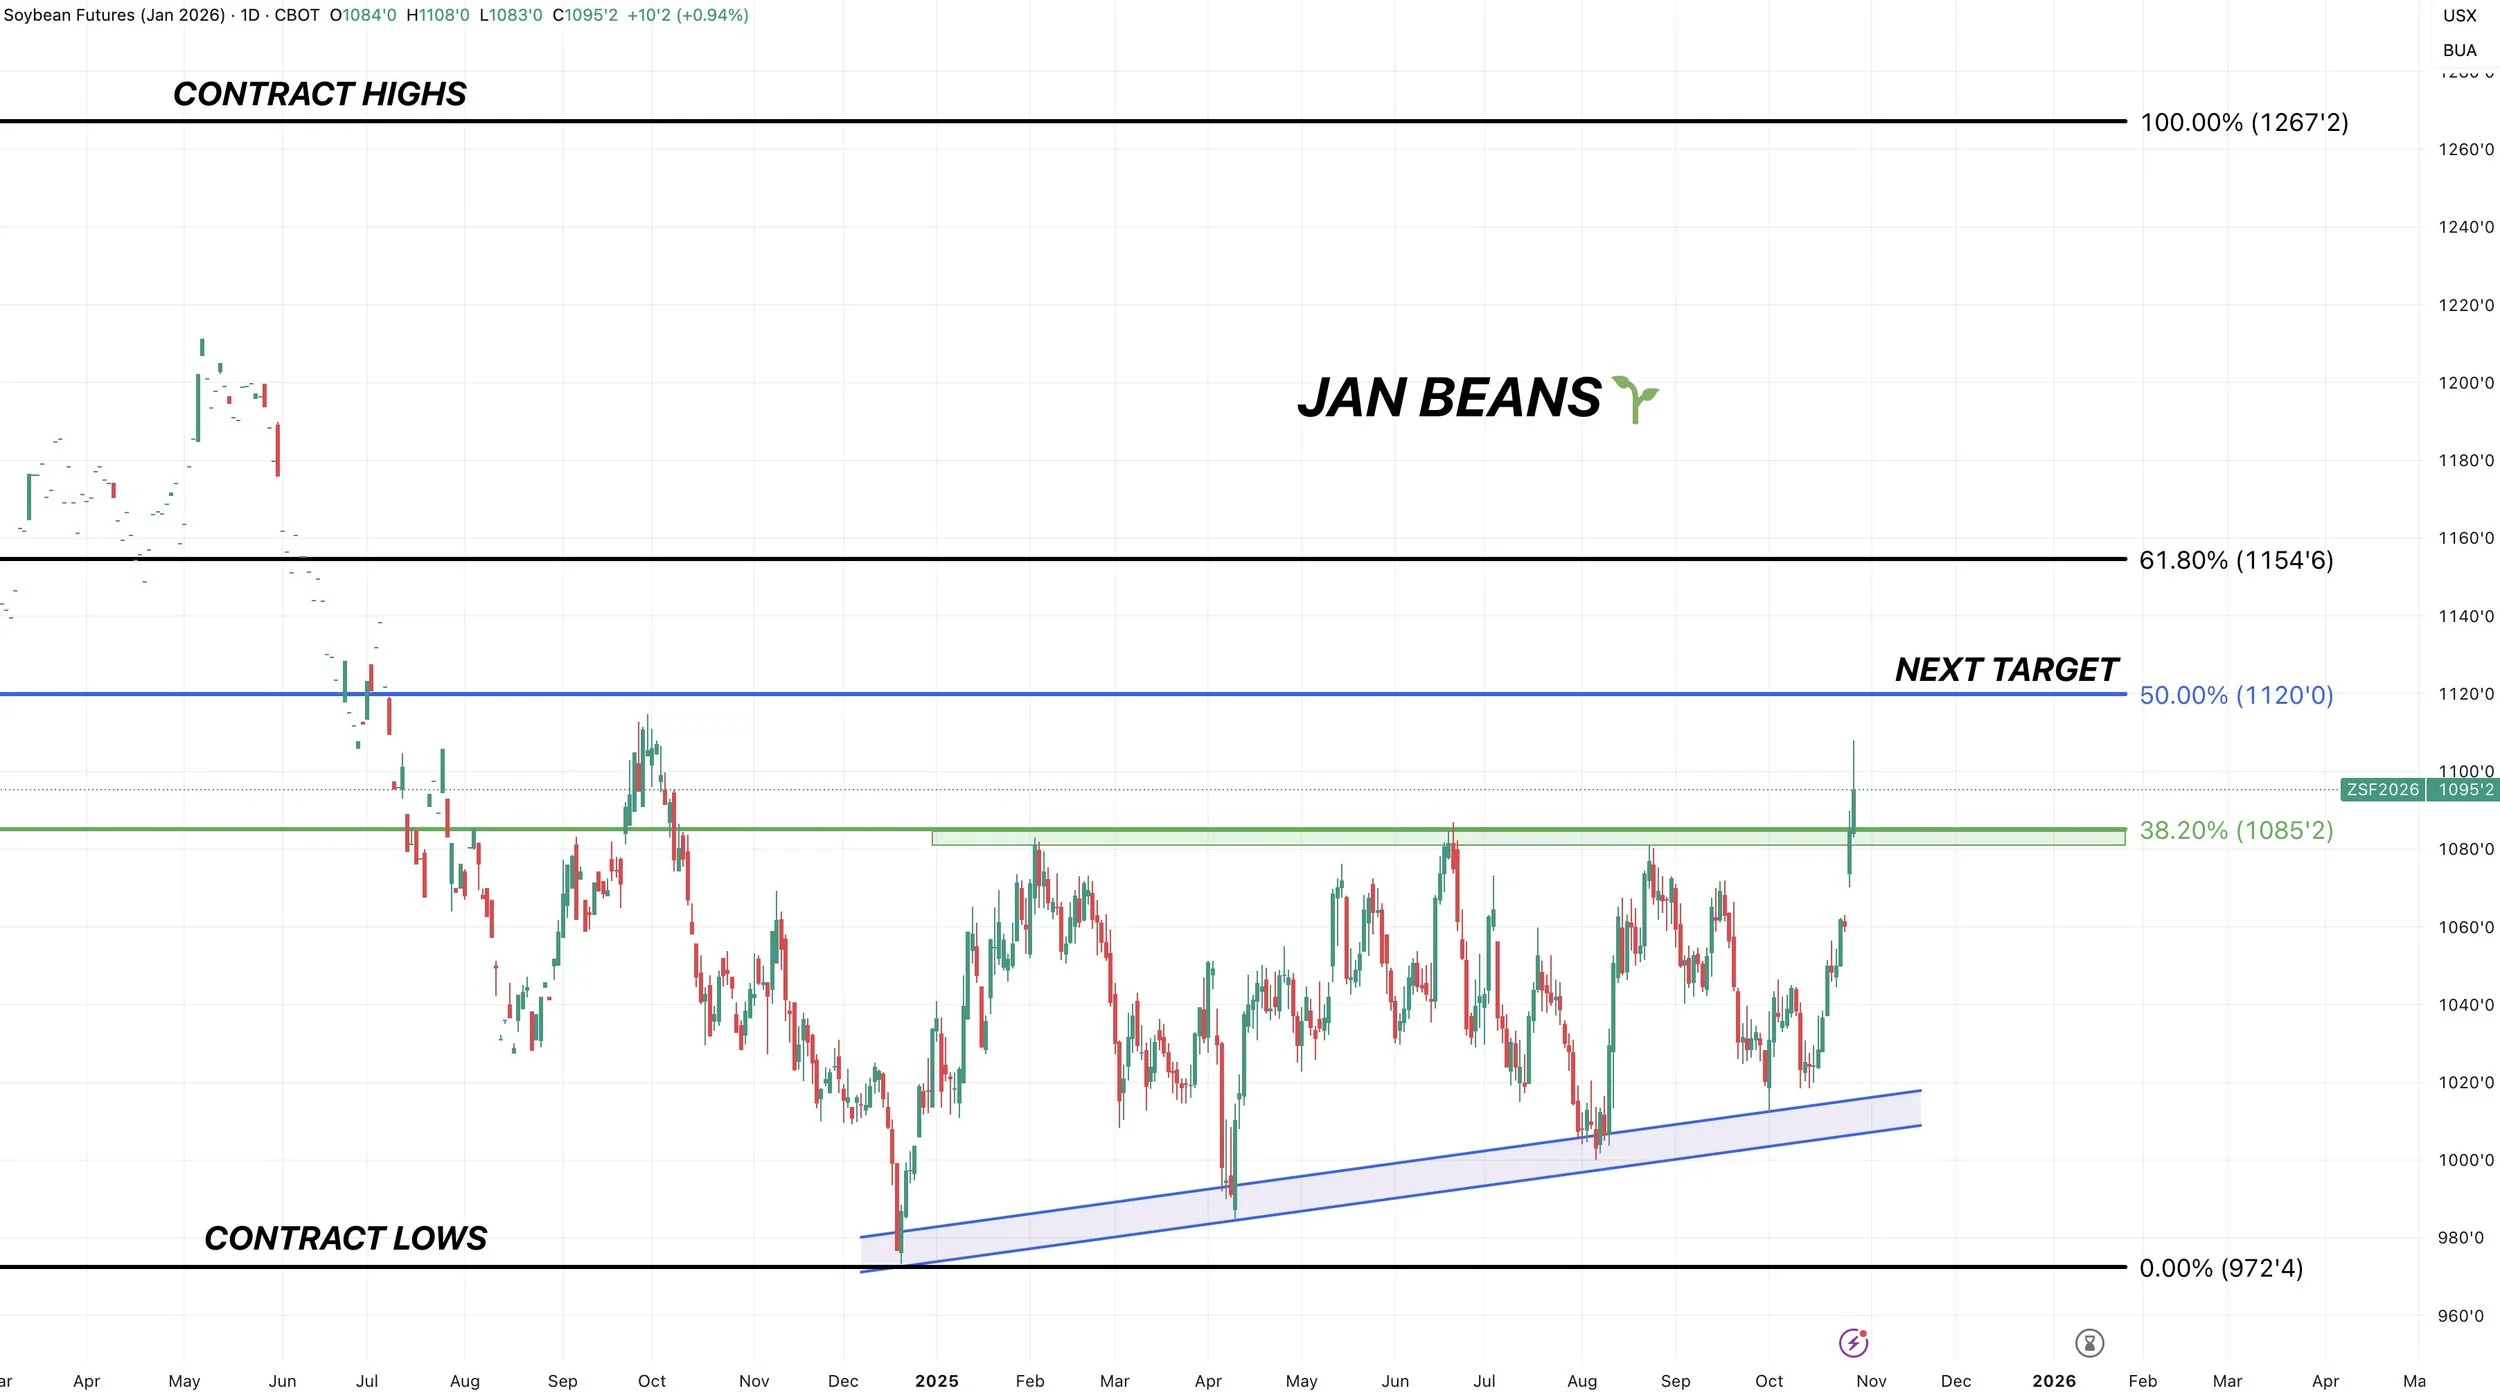
If we look at the RSI, it is the most overbought it has ever been for this contract.
So that is a reason to be cautious up here.

Continuous Beans
The continuous chart is the most interesting.
This chart shows the contract that has the most volume. So it currently uses Jan beans.
We cleary broke out of the range we've been trapped in all year long.
There is a possible gap of air towards $11.44
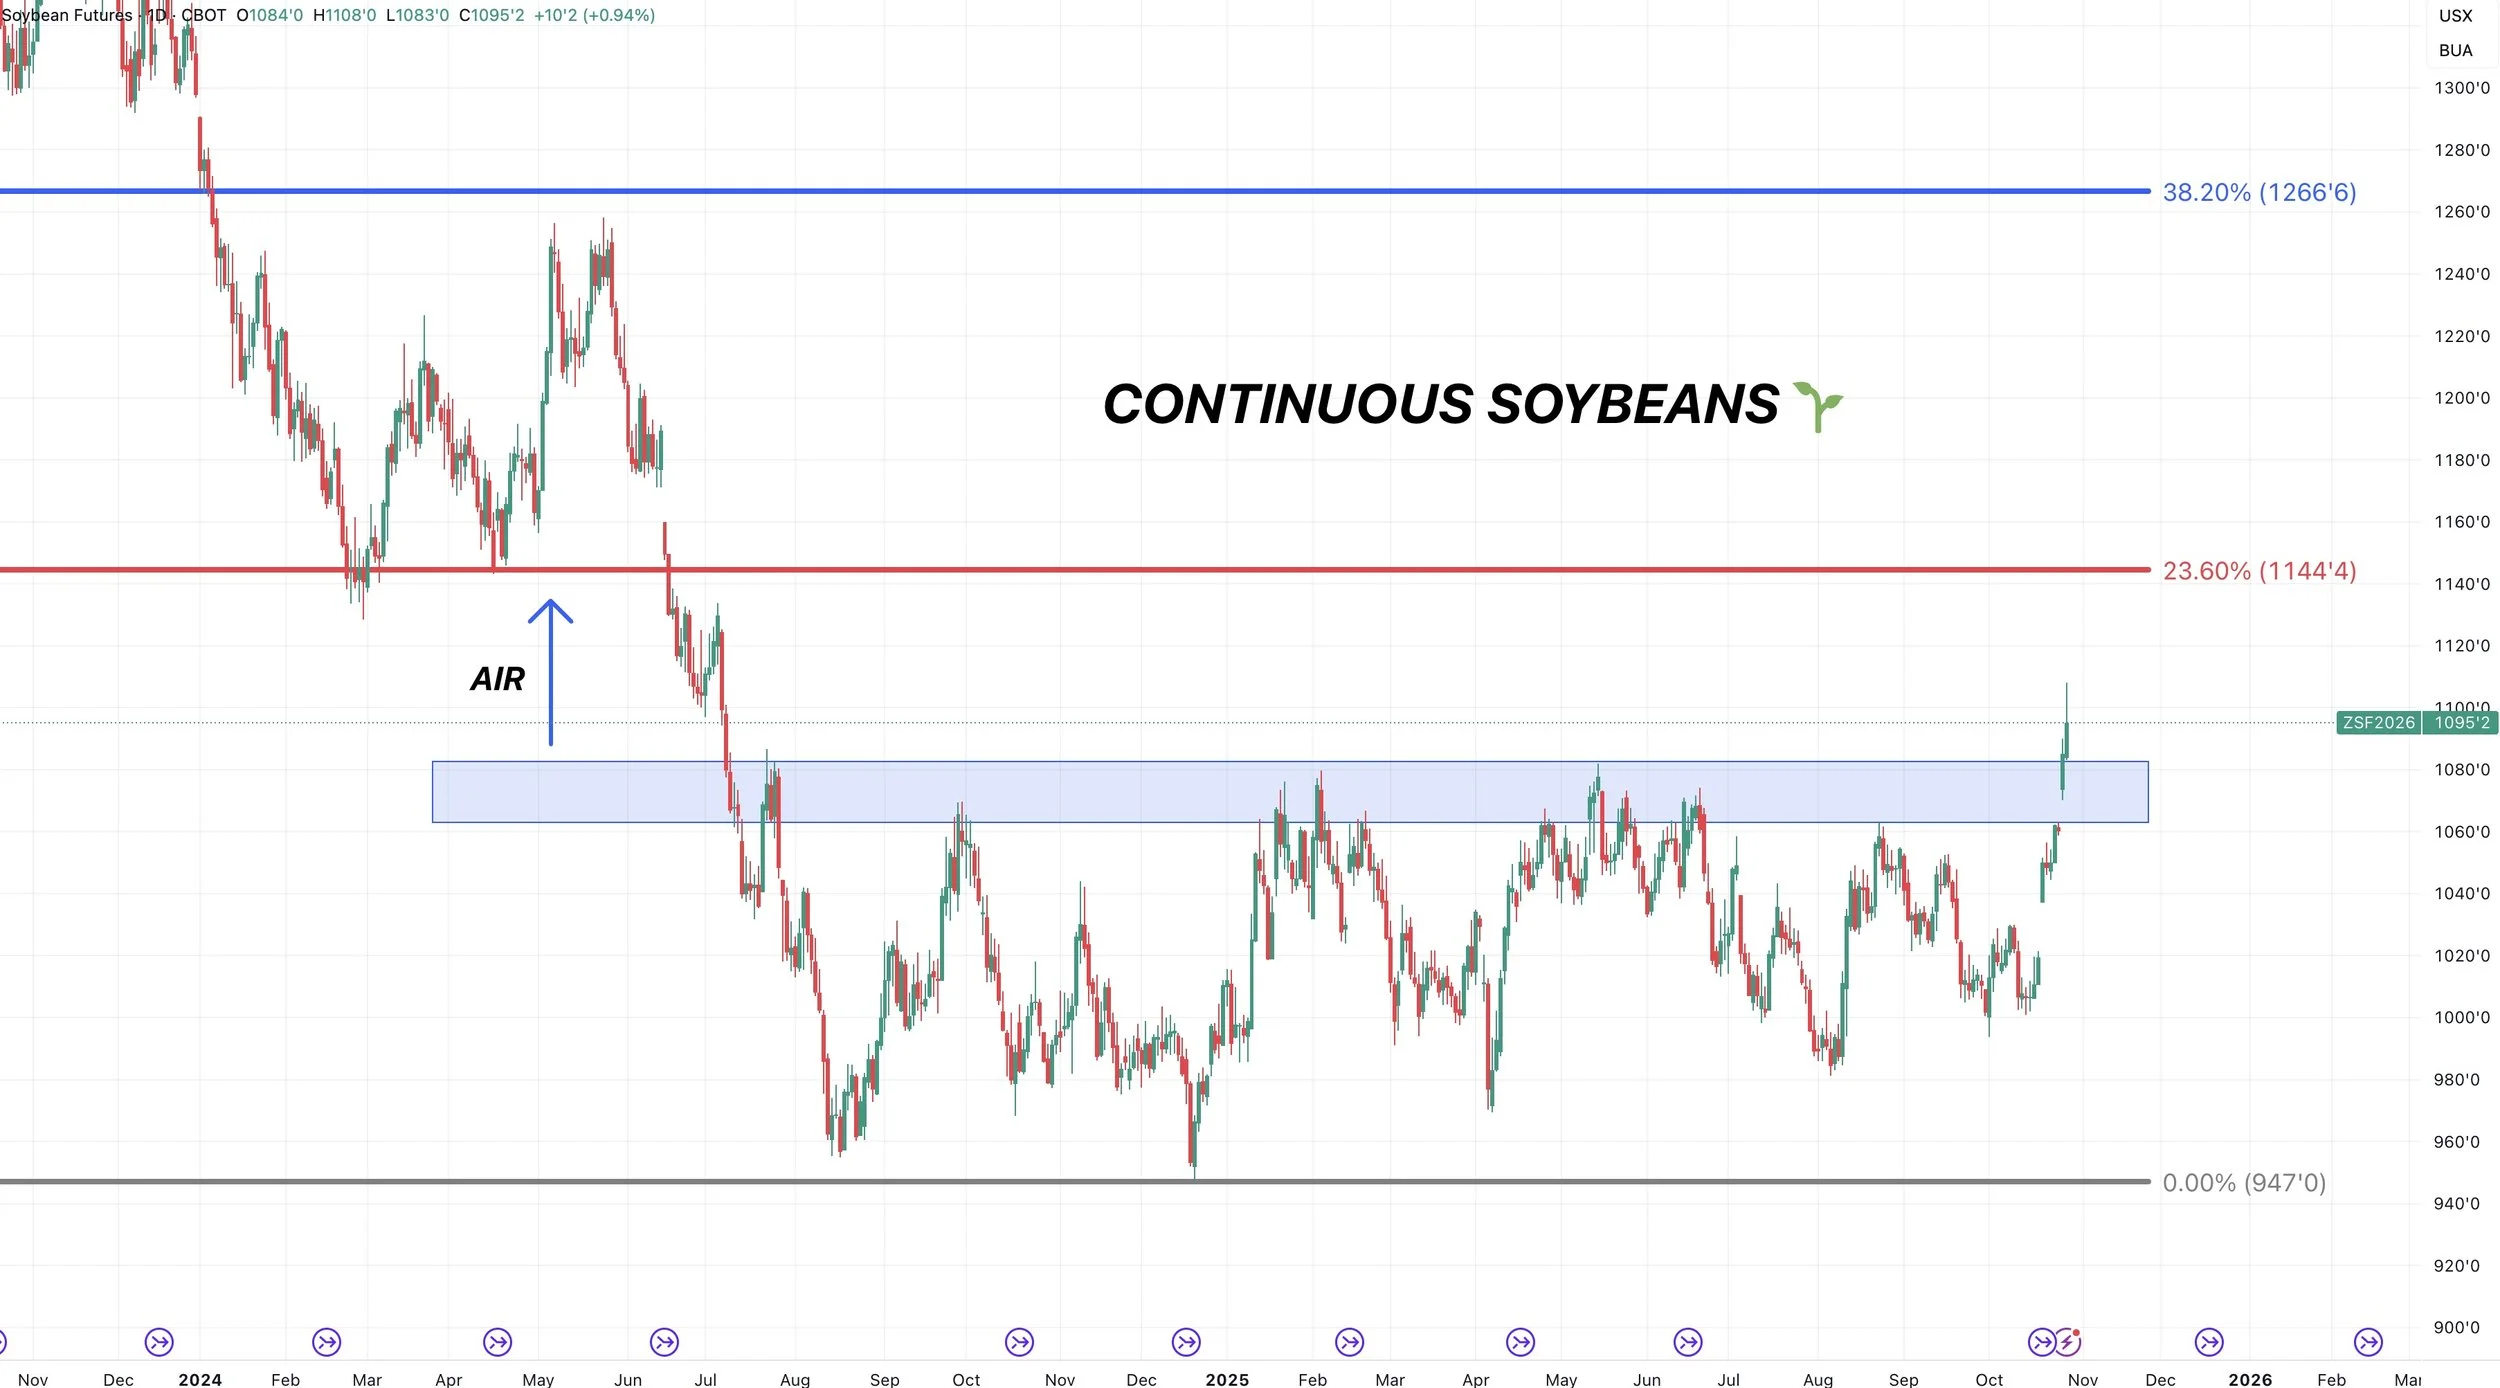
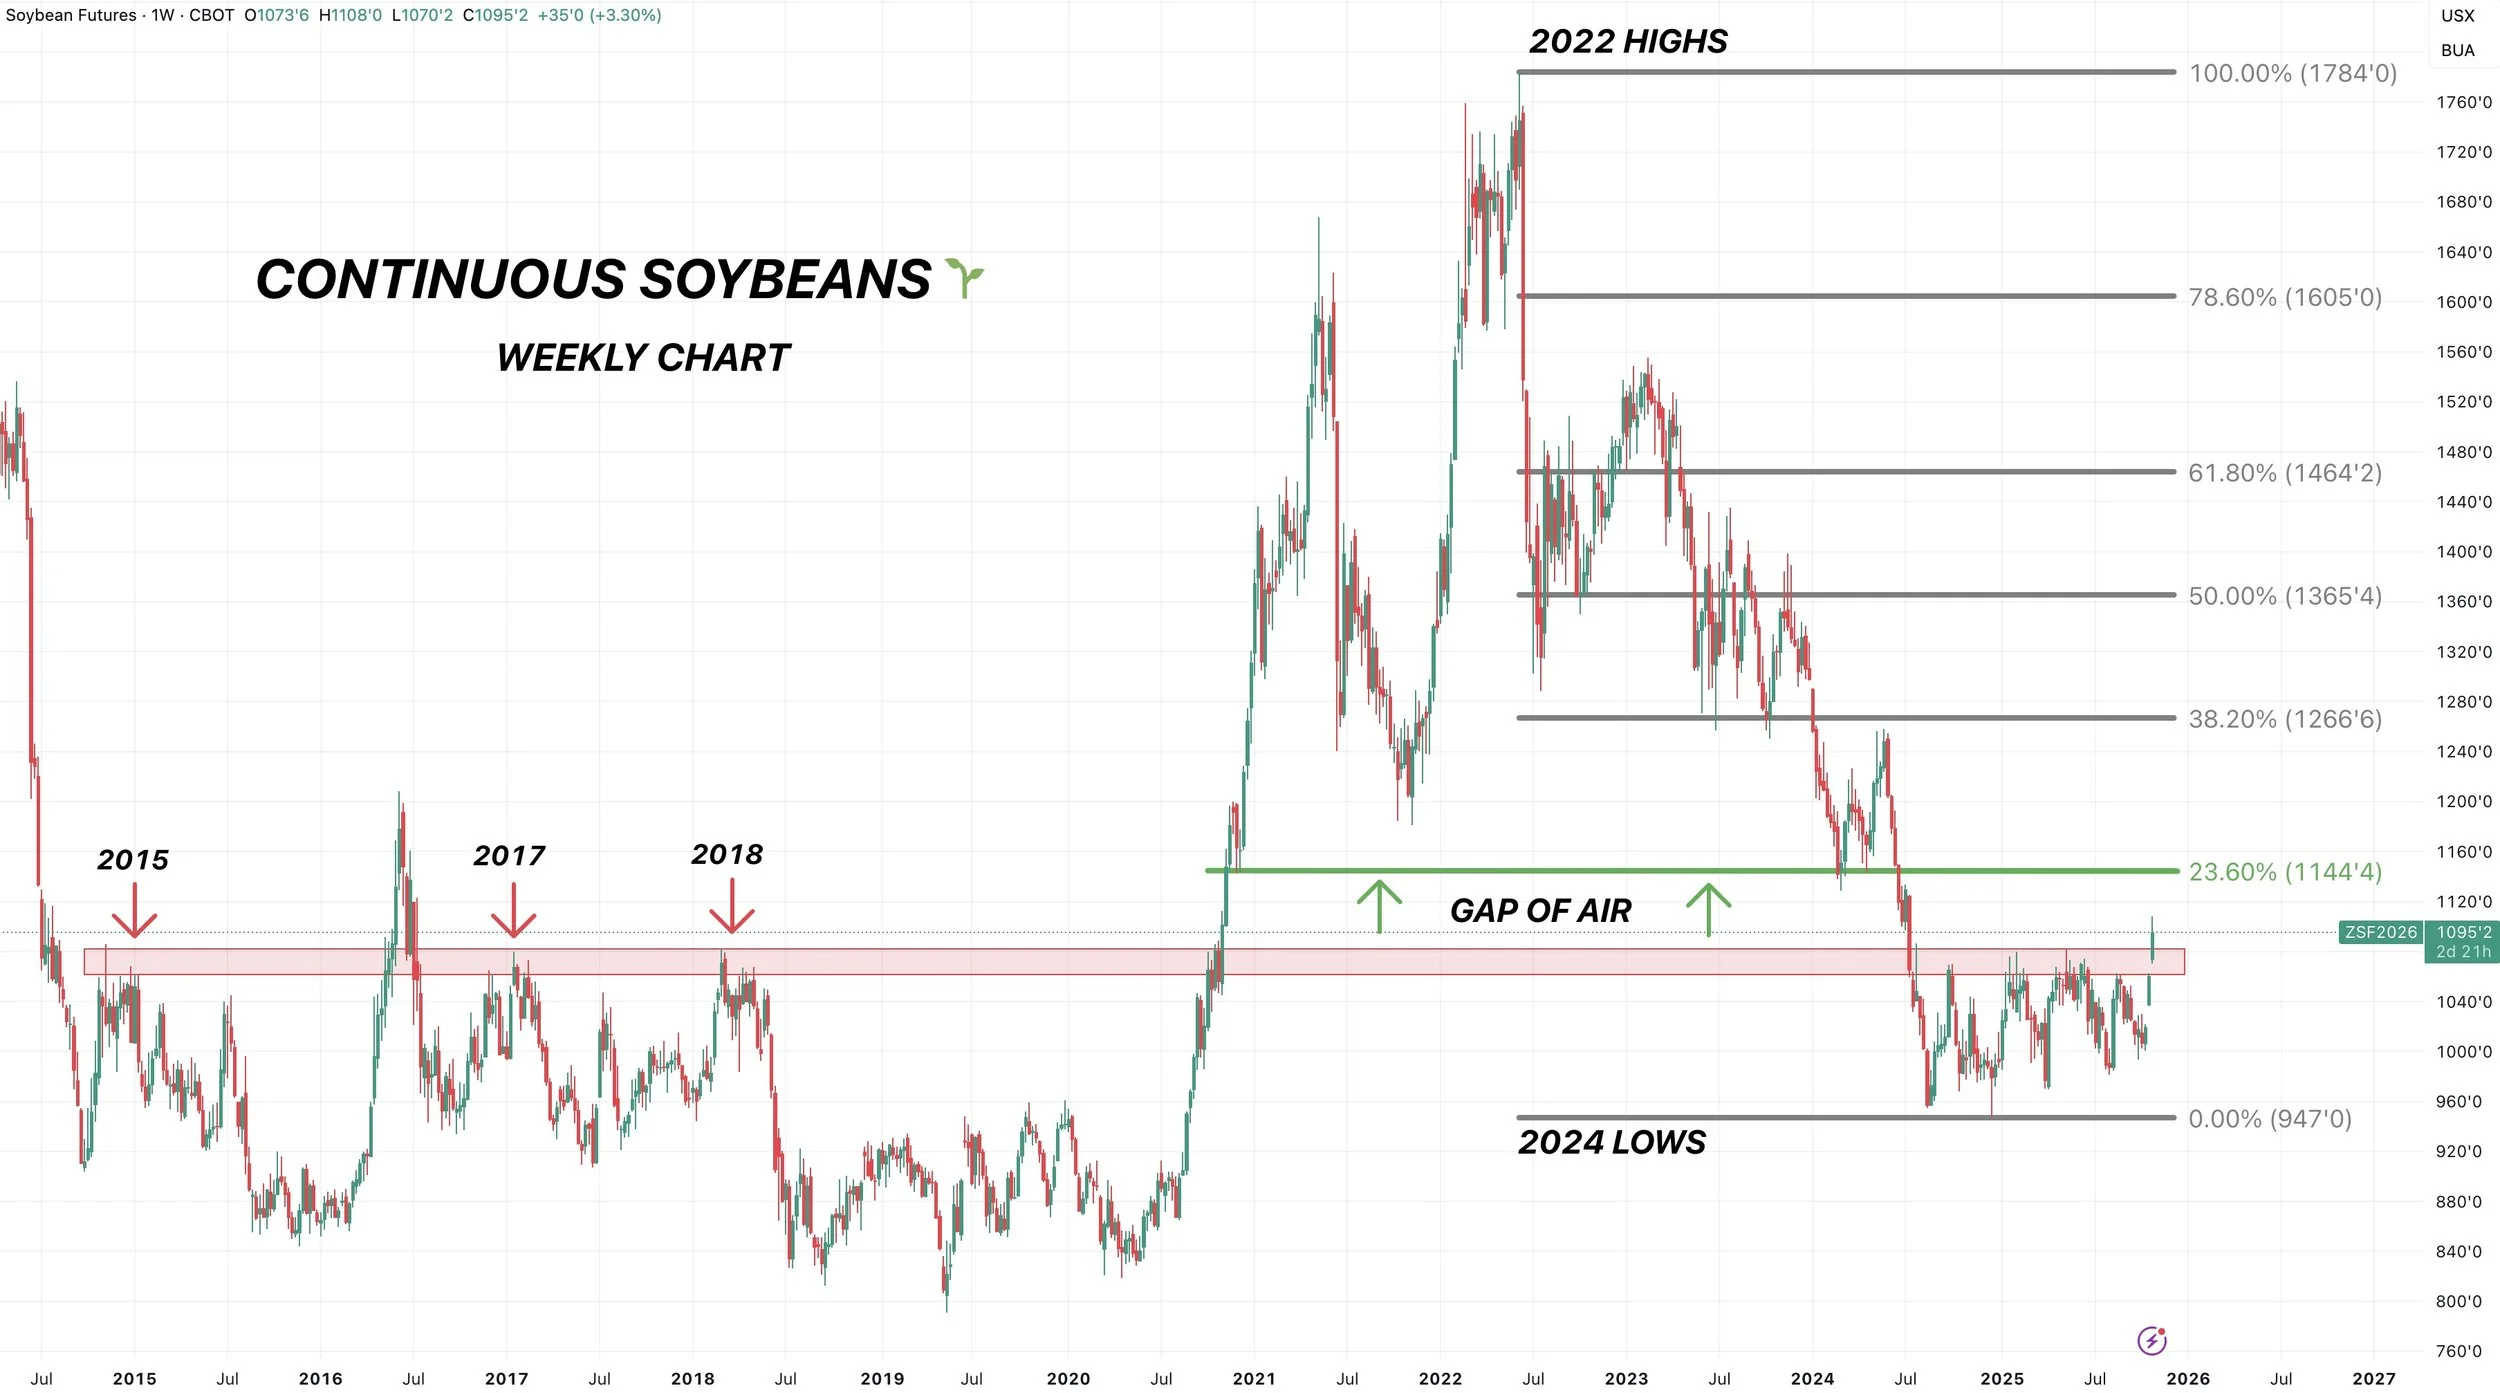
Here is a zoomed out look.
$11.44 is the first retracement level up to those 2022 highs.
It is also where the market previously found support.
When the market fell apart last summer, it was fast and hard. Which left no support between here and $11.44. The market simply hasn’t traded between these levels leaving a gap or air.
So the upside potential is certainly there. But we need some cards to fall right between Trump and China.
Here is another look at continuous beans.
This is the monthly chart.
The blue box highlights $11.00 to $12.00
Soybeans very rarely trade in the $11.00's.
Most of the time, we either rally right to $12.00 or come falling down below $11.00. Rarely is the market ever sitting in the $11.00's.
So IF the cards fall right. I don’t see why soybeans couldn’t go to $12.00.
Today we failed to close above $11.00

Wheat
Fundamentals:
The recent wheat rally appears to be mostly short covering and technical buying, following the rest of the grains higher.
There really isn’t any major news.
The market still lacks a true catalyst outside of technical buying and being cheap.
Demand however, does remain very solid.
As export inspections are up +20% vs last year.
The best in at least a decade.
Chart from StoneX

Dec Wheat Technicals:
We finally got that breakout.
If we take out today's highs I think we could have more room to run.

Dec KC Wheat Technicals:
KC also got the break out.
If we take out today's highs we could see more upside.

Cattle
Trump continues to pressure this market.
He once again posted a statement about cattle today.
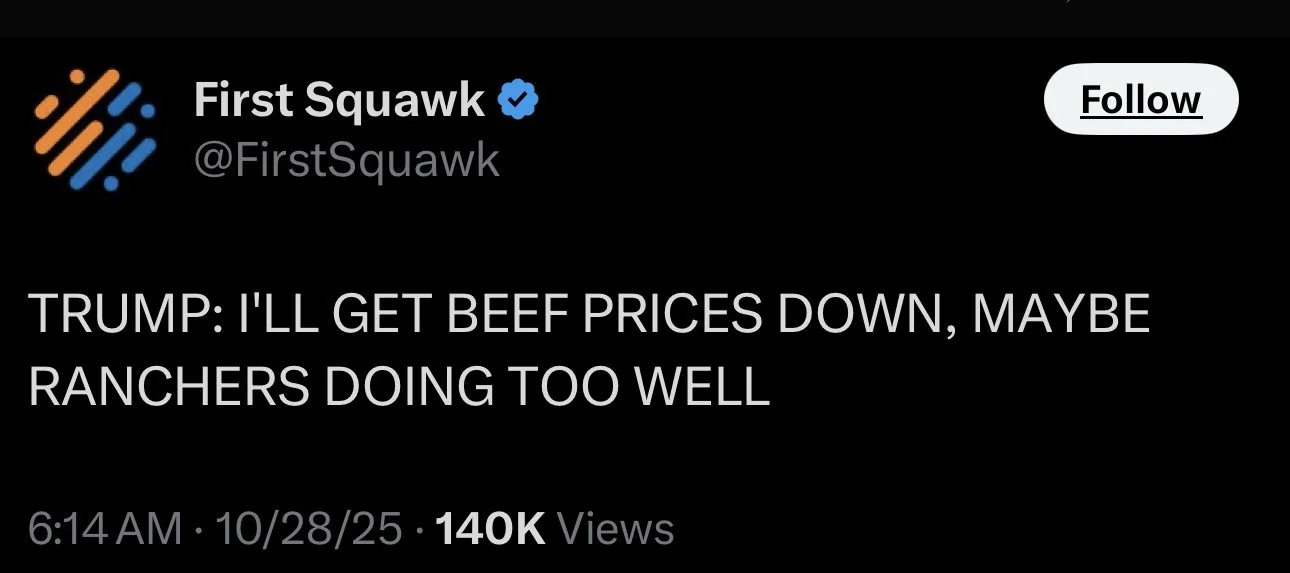
This price action is purely based on headlines and what Trump has said.
Fundamentally, nothing has changed.
However, when the President says he is actively trying to lower beef prices, it scares the market. Even if it is going to take more than a tweet to fundamentally change the market.
Not too long ago the funds were holding a record large position.
If I were the funds, I would be nervous holding a record-long position with the government saying they will be getting prices lower.
We have been very vocal about keeping protection in this market.
There was news that people from Mexico are visiting DC this week to discuss the potential to open up the border.
I don’t know how far this market will fall. But there are certain things the government can do to continue to add pressure to this market.
Such as re-opening the border or starting to import from Brazil.
Dec Live Cattle:
Not a good look here.
We are now below the 50-day and 100-day MA's.
That 50-day was the must hold level. Failing to hold it sparked even more downside.
If we get a relief bounce, it should be viewed as a hedging opportunity.

Jan Feeder:
Feeders are also below the 100-day and 50-day MA for the very first time in the life of this contract.
I am not going to try and catch a falling knife trying to time a bottom.
Continuous Feeder:
Could the bull run be over?
It's possible, but impossible to know. We probably won’t know until well after the fact.
This has been a large correction. But if you zoom out, we saw about the same size of corrections the last two years.
So still a little early to say the run is 100% over.
The government is trying to lower beef prices, but it won’t happen overnight.

Past Sell or Protection Signals
Oct 28th: 🌽
Corn sell signal & hedge alert.
Oct 27th: 🌱
Soybean sell signal & hedge alert.
Oct 13th: 🐮
Cattle sell signal & hedge alert.
Aug 22nd: 🌱
Soybean sell signal & hedge alert.
July 31st: 🐮
Cattle sell signal & hedge alert.
July 10th: 🐮
Cattle sell signal & hedge alert.
CLICK HERE TO VIEW
June 5th: 🐮
Cattle sell signal & hedge alert.
June 2nd: 🌾
MPLS wheat sell signal.
April 10th: 🌽
Old crop corn sell signal.
March 19th: 🐮
Cattle hedge & sell signal.
Feb 18th: 🌽 🌾
Old crop KC wheat & old crop corn signal.
Jan 23rd: 🌽 🌱
Corn & beans old crop sell signal.
CLICK HERE TO VIEW
Jan 15th: 🌽 🌱
Corn & beans hedge alert/sell signal.
Jan 2nd: 🐮
Cattle hedge alert at new all-time highs & target.
Dec 11th: 🌽
Corn sell signal at $4.51 200-day MA
CLICK HERE TO VIEW
Oct 2nd: 🌾
Wheat sell signal at $6.12 target
Sep 30th: 🌽
Corn protection signal at $4.23-26
Sep 27th: 🌱
Soybean sell & protection signal at $10.65
Sep 13th: 🌾
Wheat sell signal at $5.98
May 22nd: 🌾
Wheat sell signal when wheat traded +$7.00
Want to Talk?
Our phones are open 24/7 for you guys if you ever need anything or want to discuss your operation.
Hedge Account
Interested in a hedge account? Use the link below to set up an account or shoot Jeremey a call at (605)295-3100.