
VIDEO CHART UPDATE
*Only the charts today instead of the normal market update. Normal videos will resume next week.
You can scroll to read the written version as well.
Time Stamps for Video:
Corn: 0:00min
Beans: 2:10min
Wheat: 5:05min
Cattle: 6:05min
Want to talk? (605)295-3100
Written Version
Dec Corn 🌽
Still battling this resistance box and our first target of $4.35-40 after last week's sell signal & hedge alert. As this gives back 50% of the Feb highs and was our key support during spring.
Until we break above, it is viewed as resistance.
On the other hand, if we break above, it does open the door higher.
To the downside, if we do get a pullback I am looking for that red box. Which gives back 50-61.8% of the recent rally.
$4.20 is going to be the spot we want to hold.

Now if we do get a break above that $4.35-40 resistance, we do still have this inverse head & shoulders pattern as well. That has been pretty text book this far.

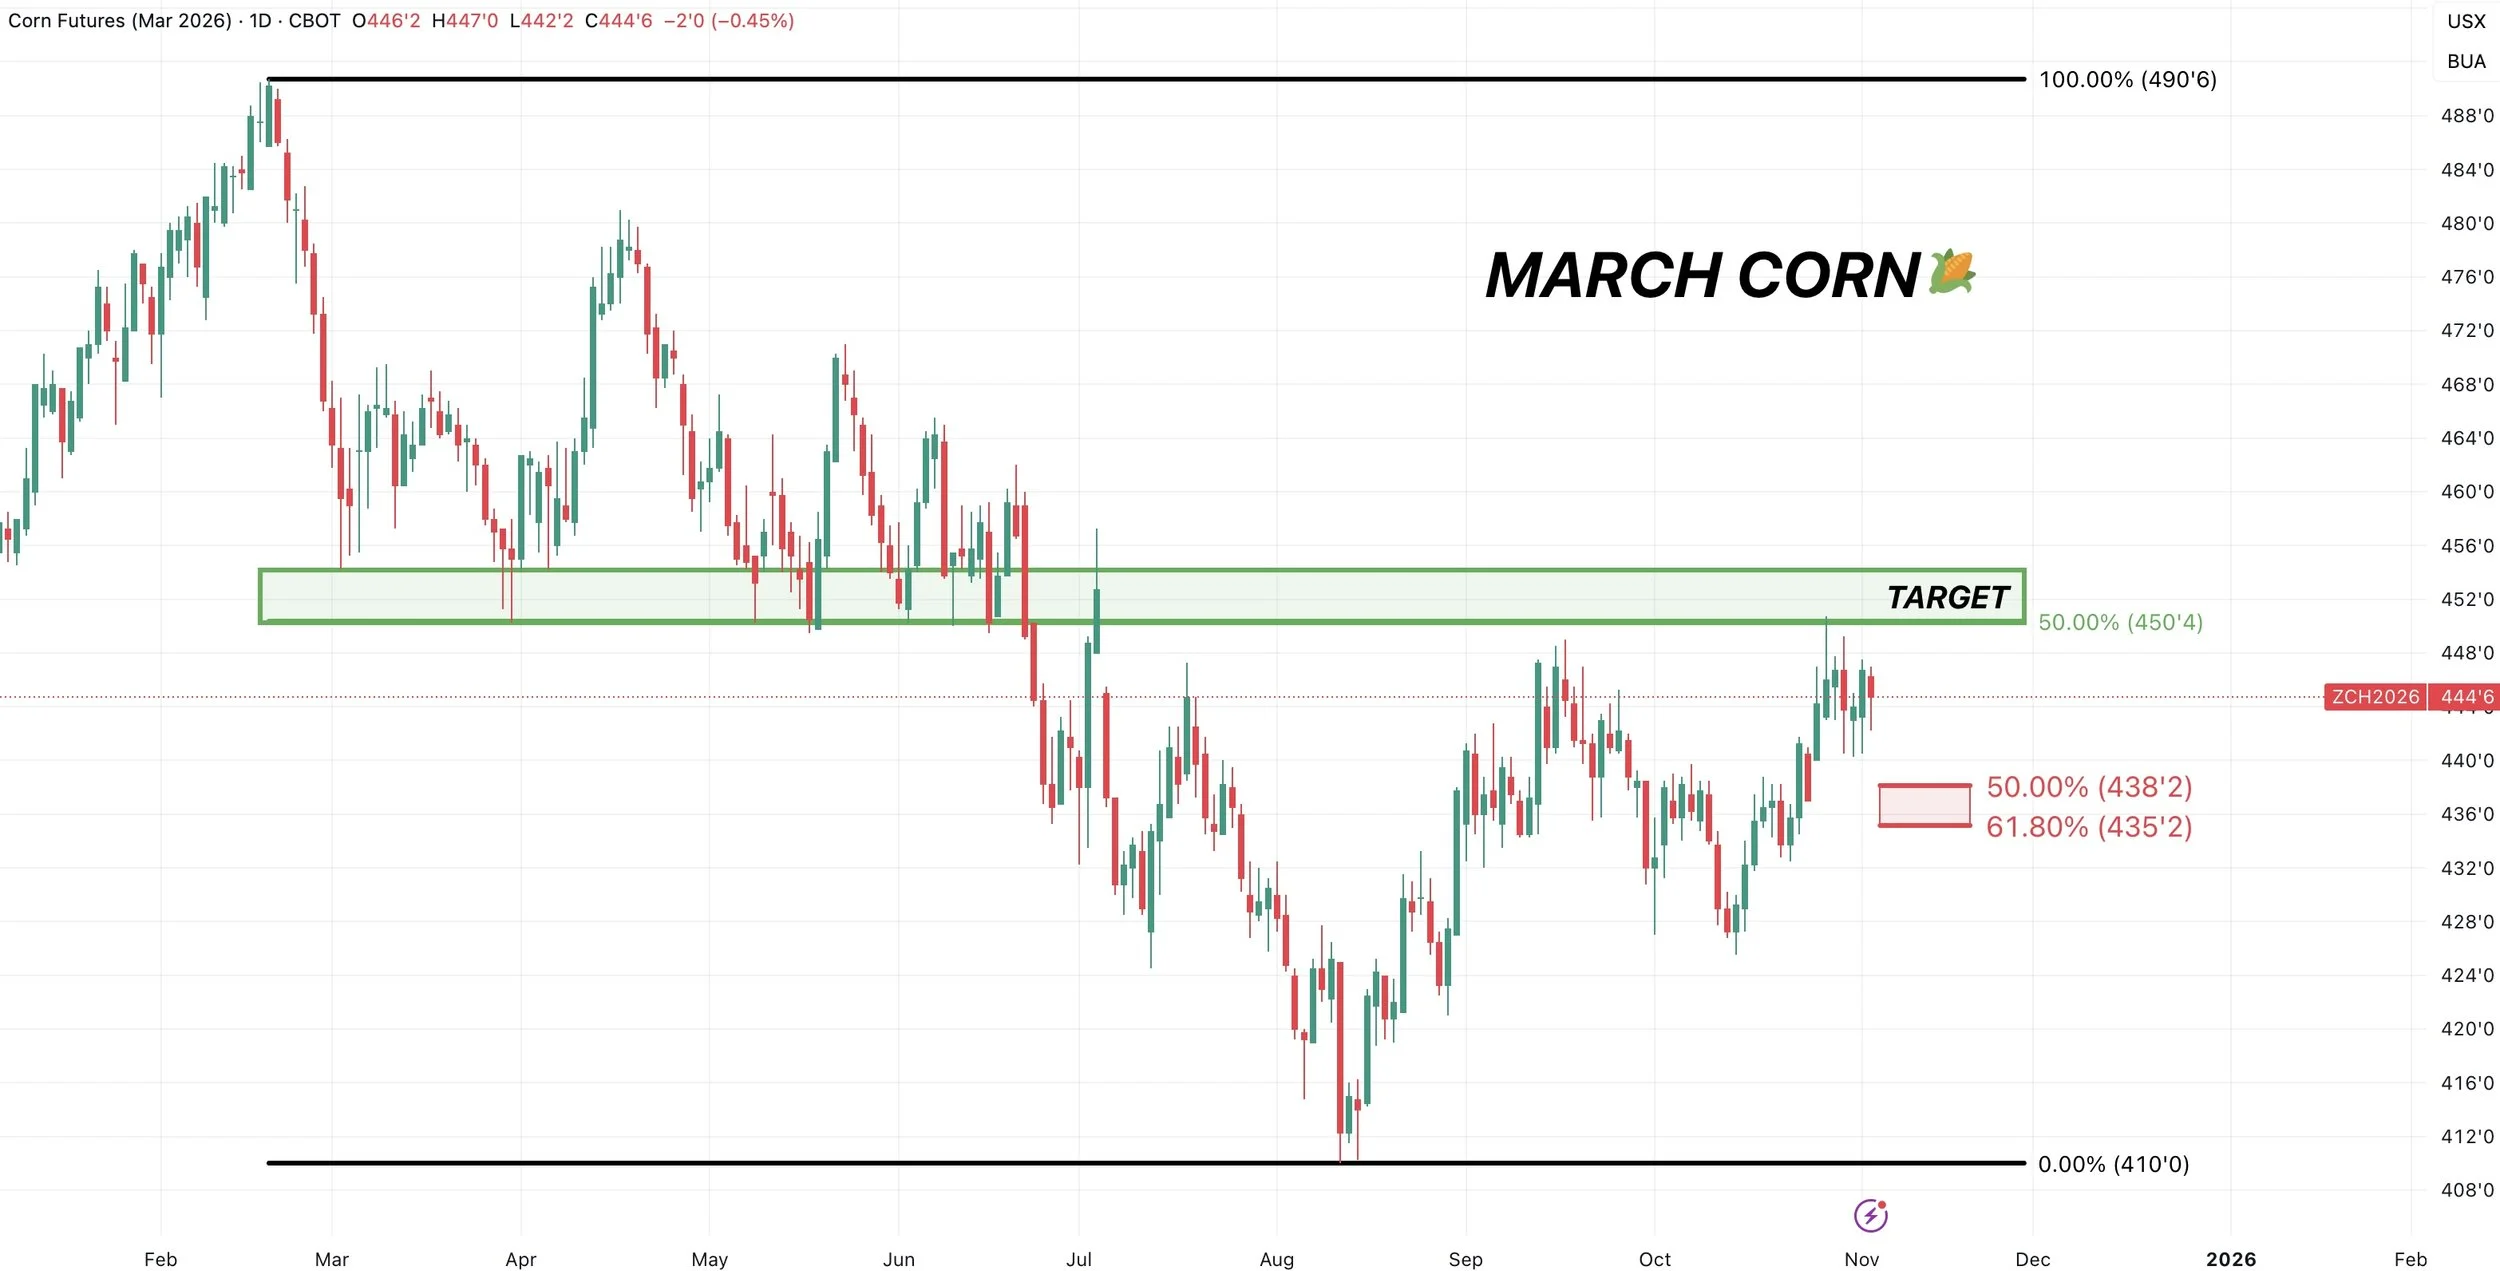
March Corn 🌽
Very similar set up as Dec.
$4.50 is our resistance. Need a break above to spark more upside.
To the downside, we need to hold the red box.
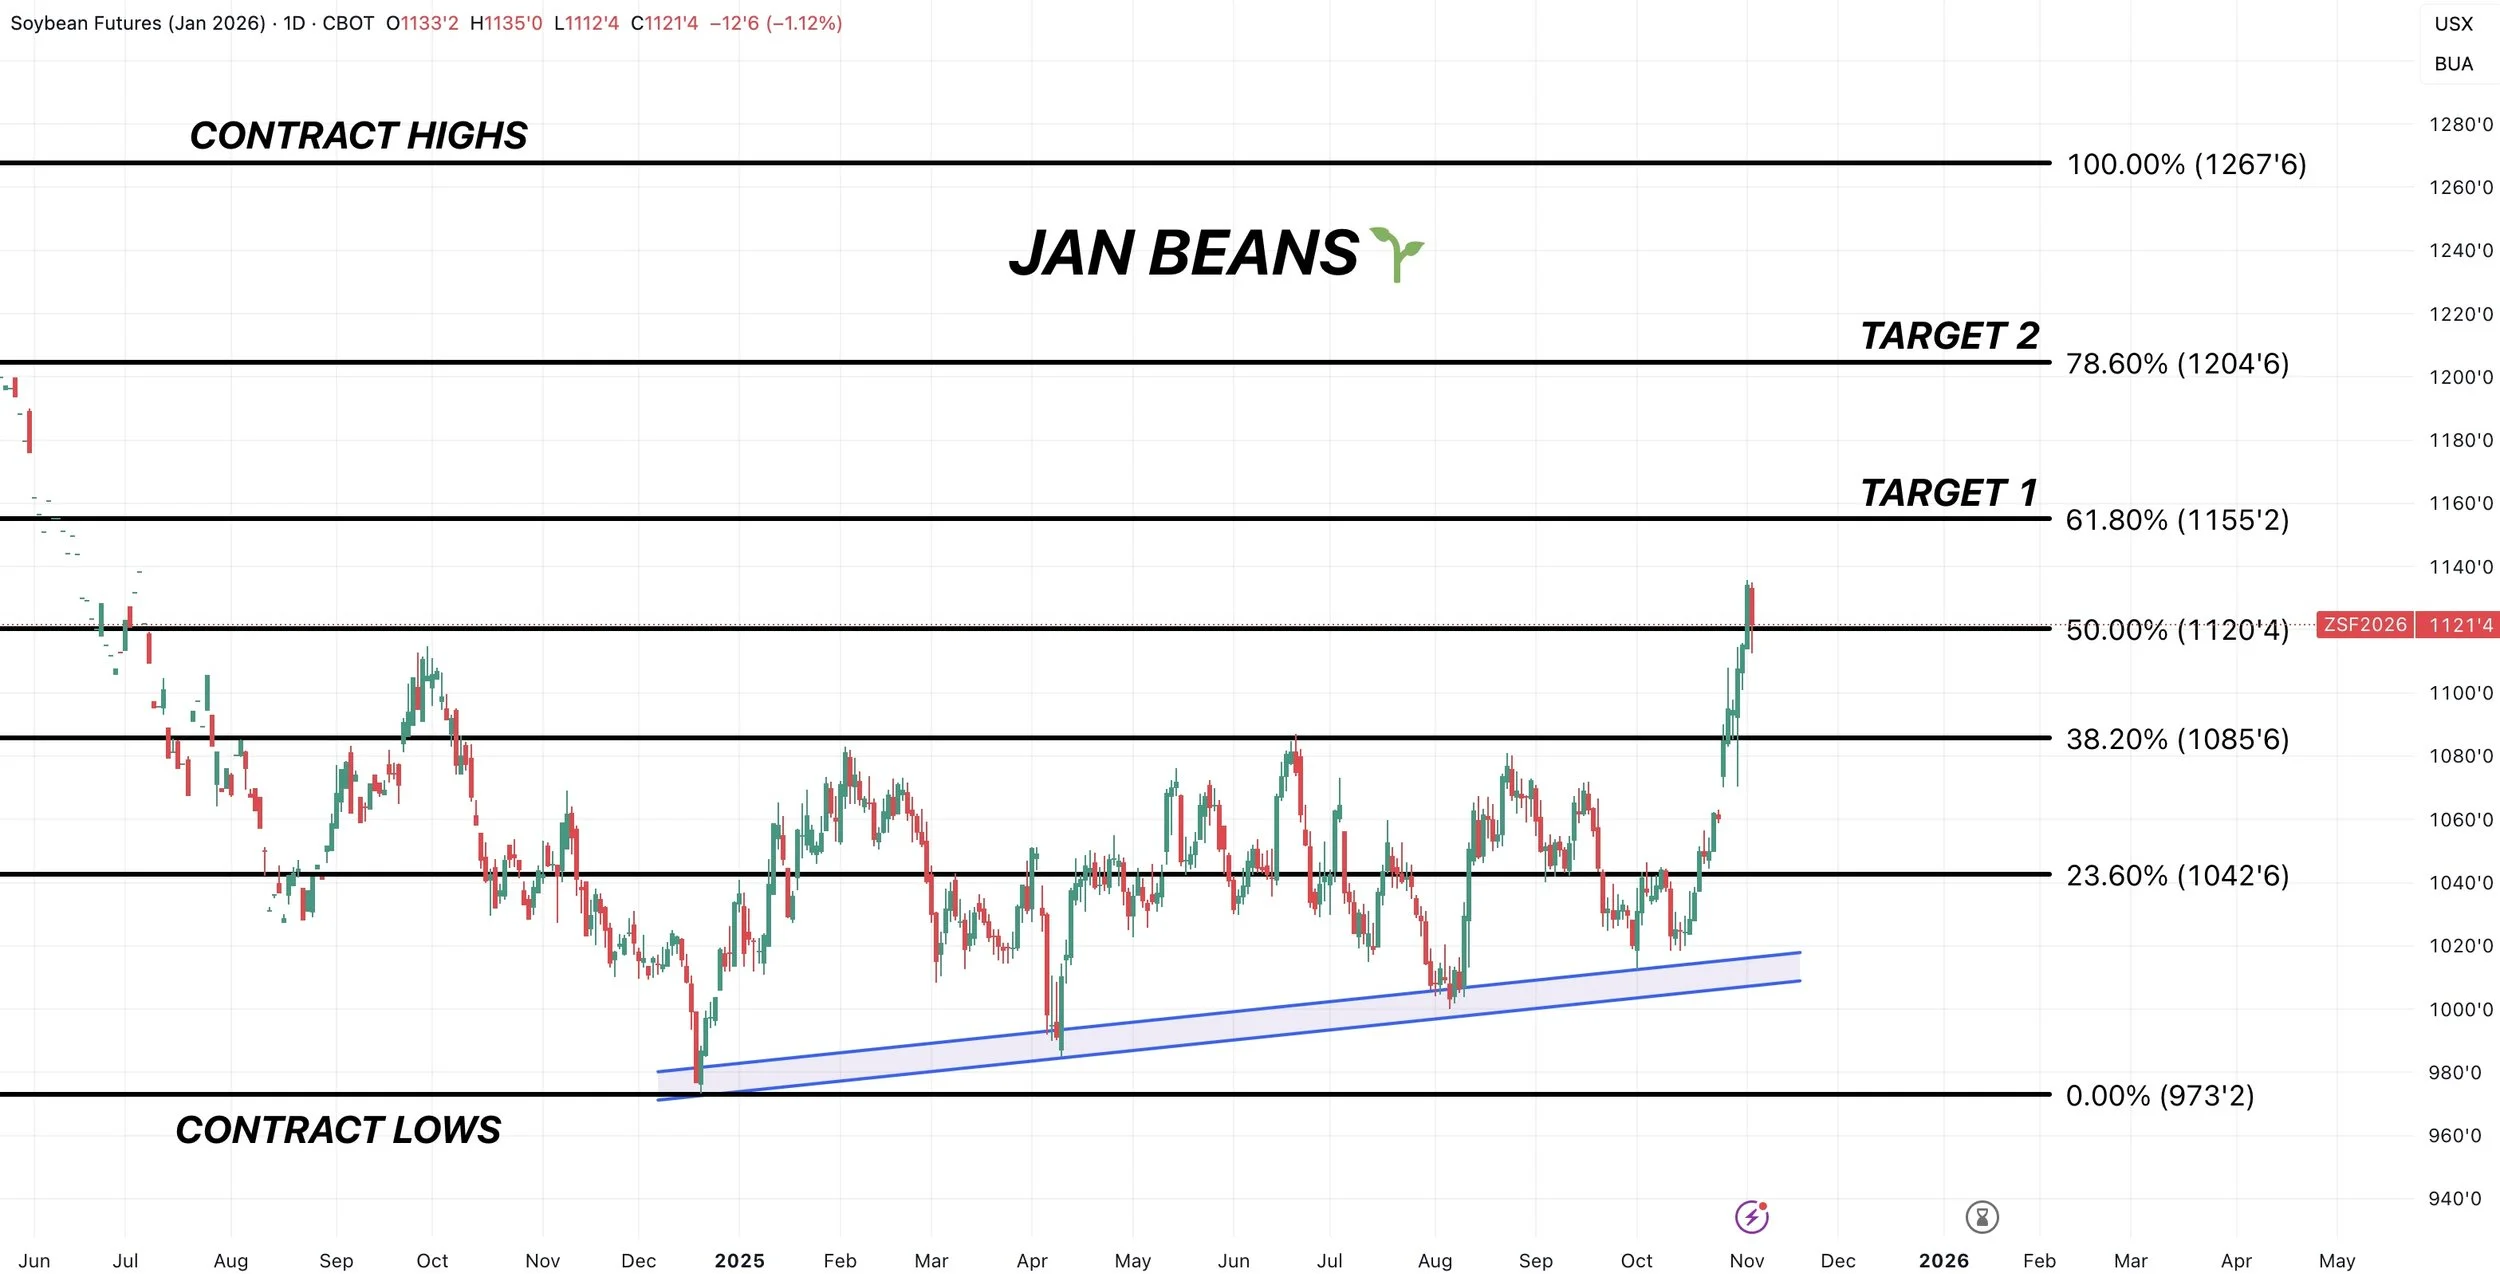
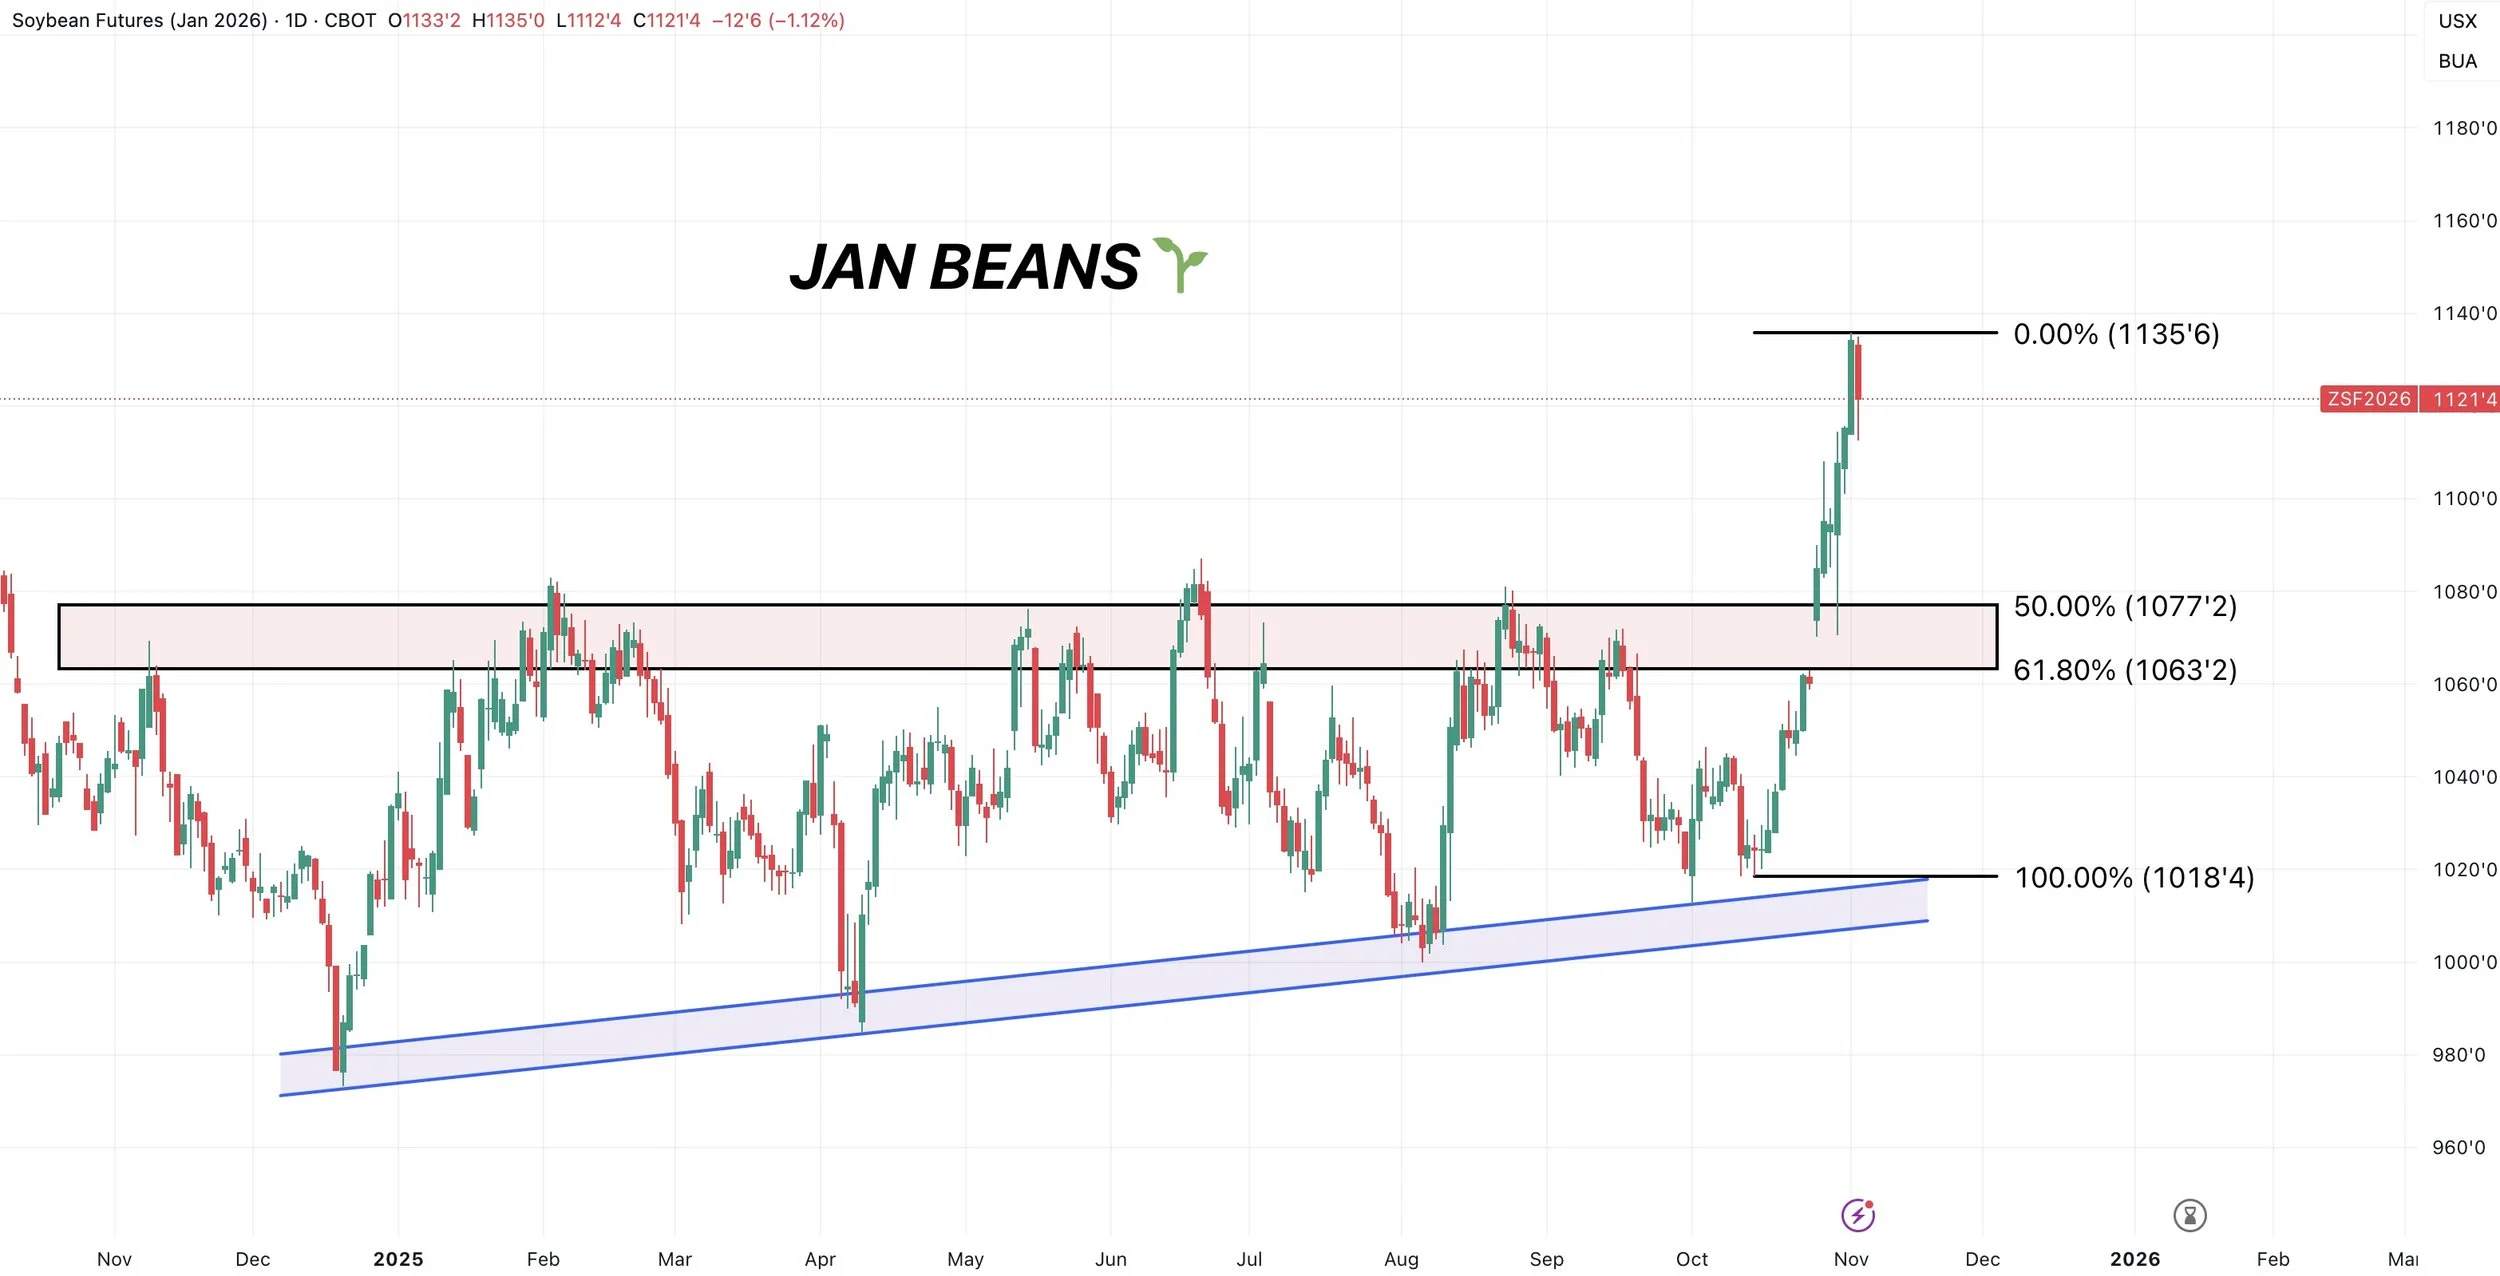
Jan Beans 🌱
Our next target is $11.55
That is the 61.8% retracement to the contract highs from the contract lows. We are above the 50% level, so the next level is the 61.8%.
Our summer highs topped out at the 38.2%.
Our second target is going to be right about at $12.00 That is the 78.6% retracement to the contract highs.
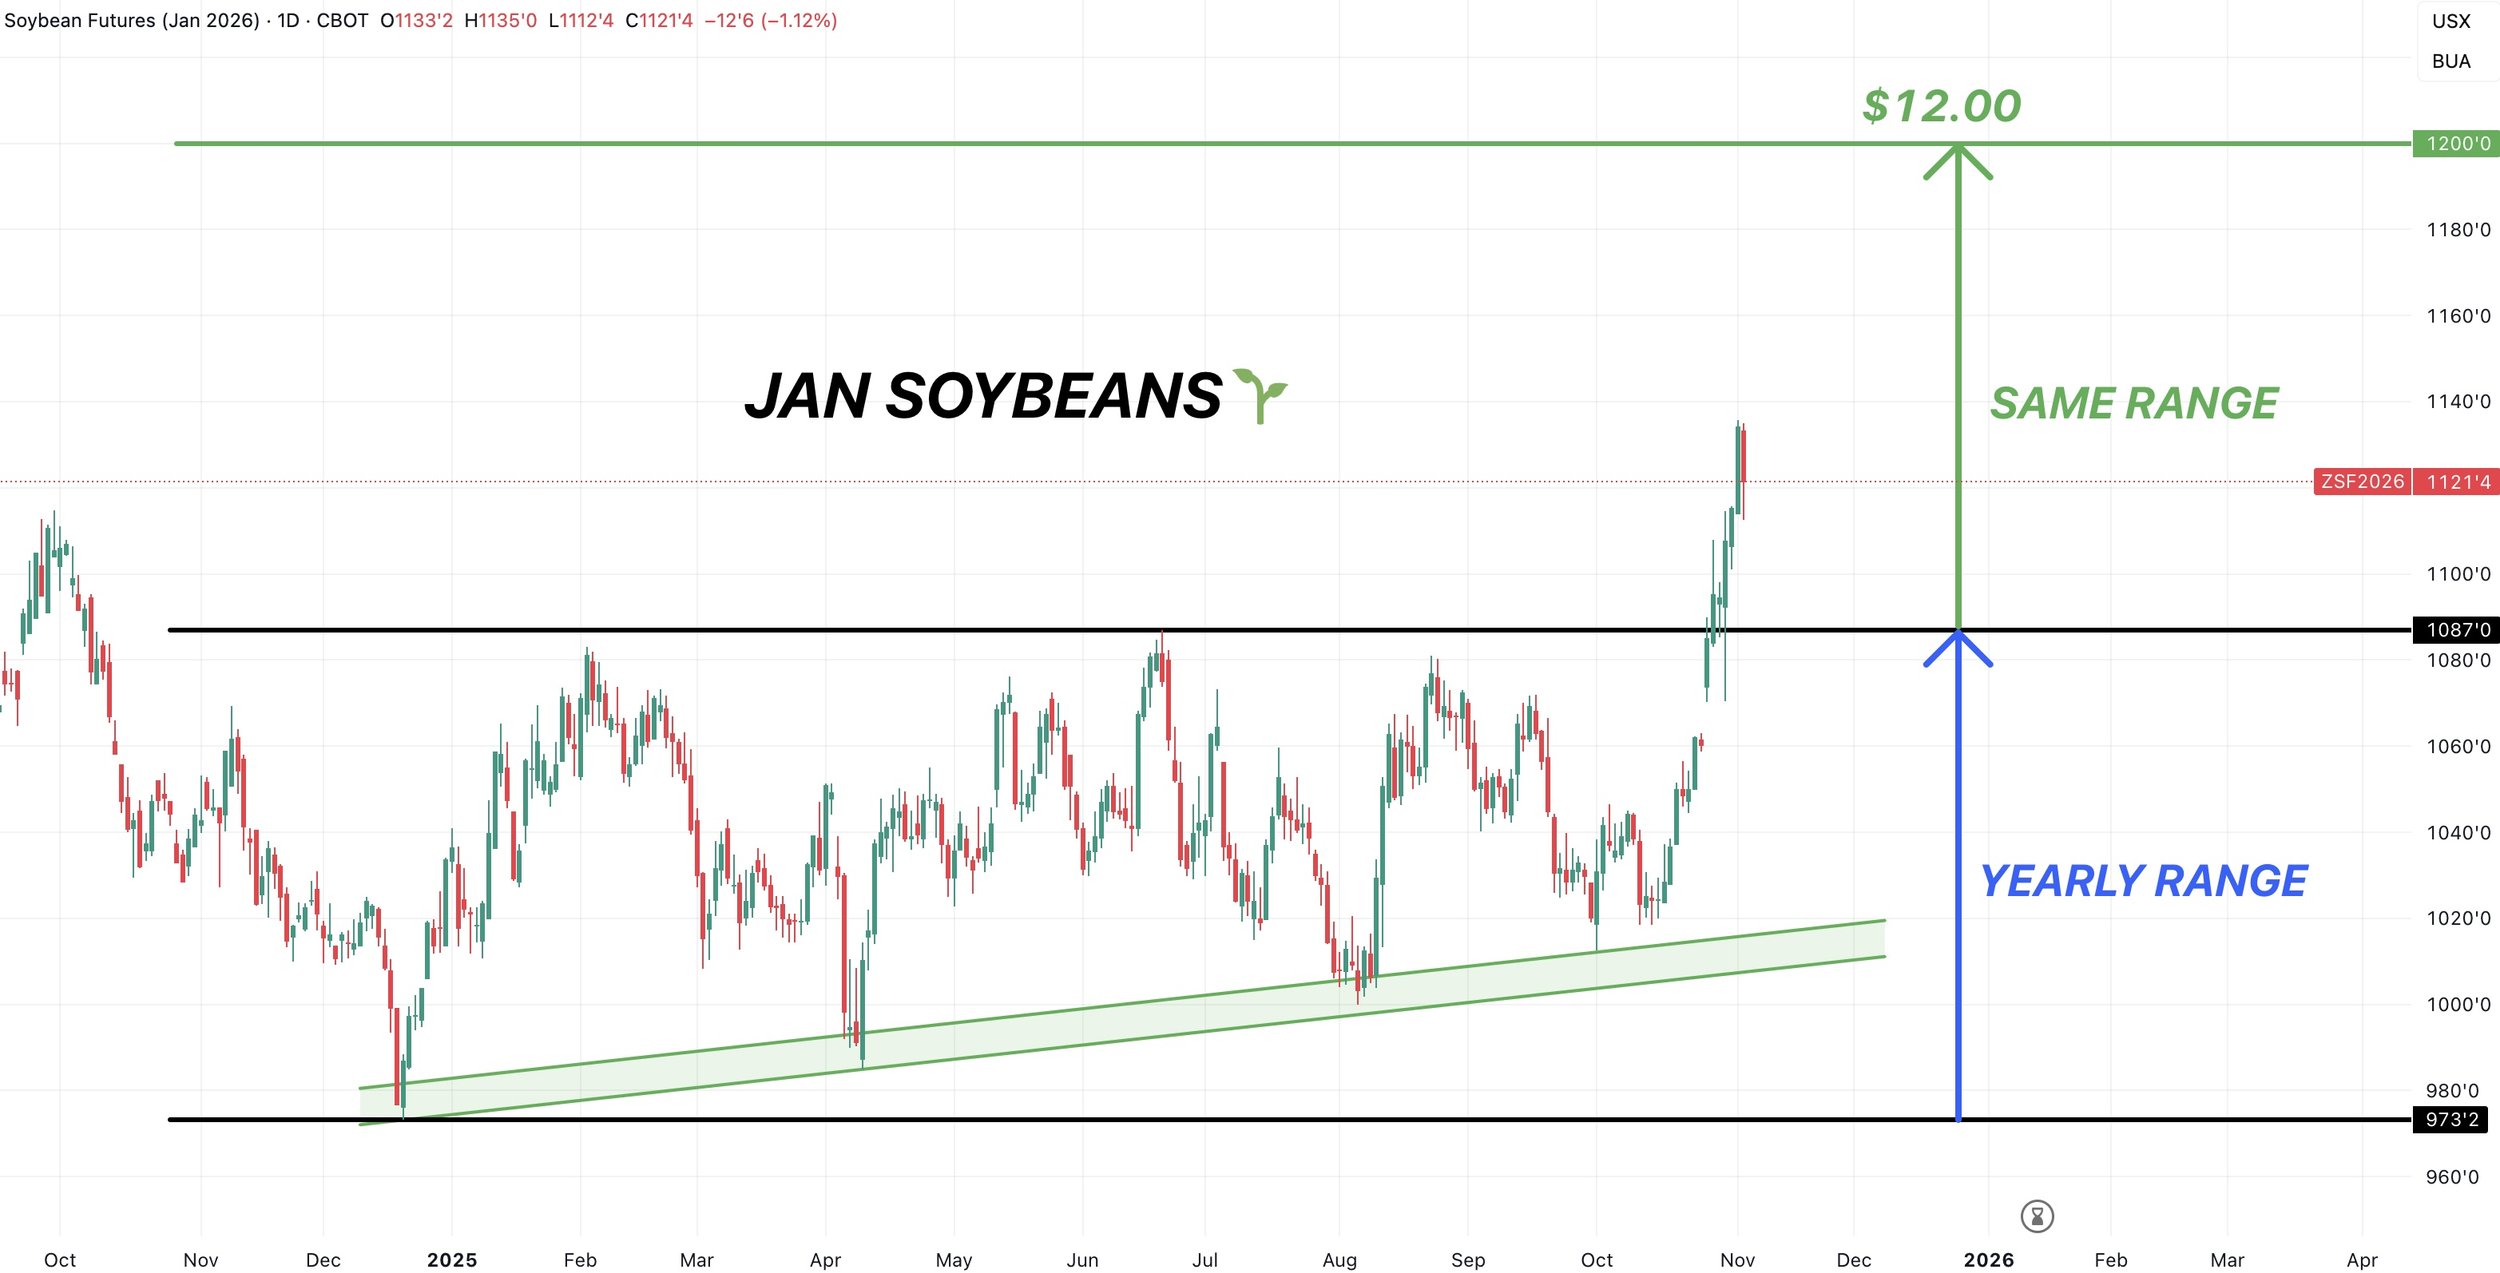
Here is another reason why soybeans have the "potential" to go to $12.00
We were trapped in a $1.14 range for over a year.
We recently broke out of that range.
If you add that $1.14 range on top of the point of where we broke out of that range ($10.87) it gives you right about $12.00
($10.87 + $1.14 = $12.01)
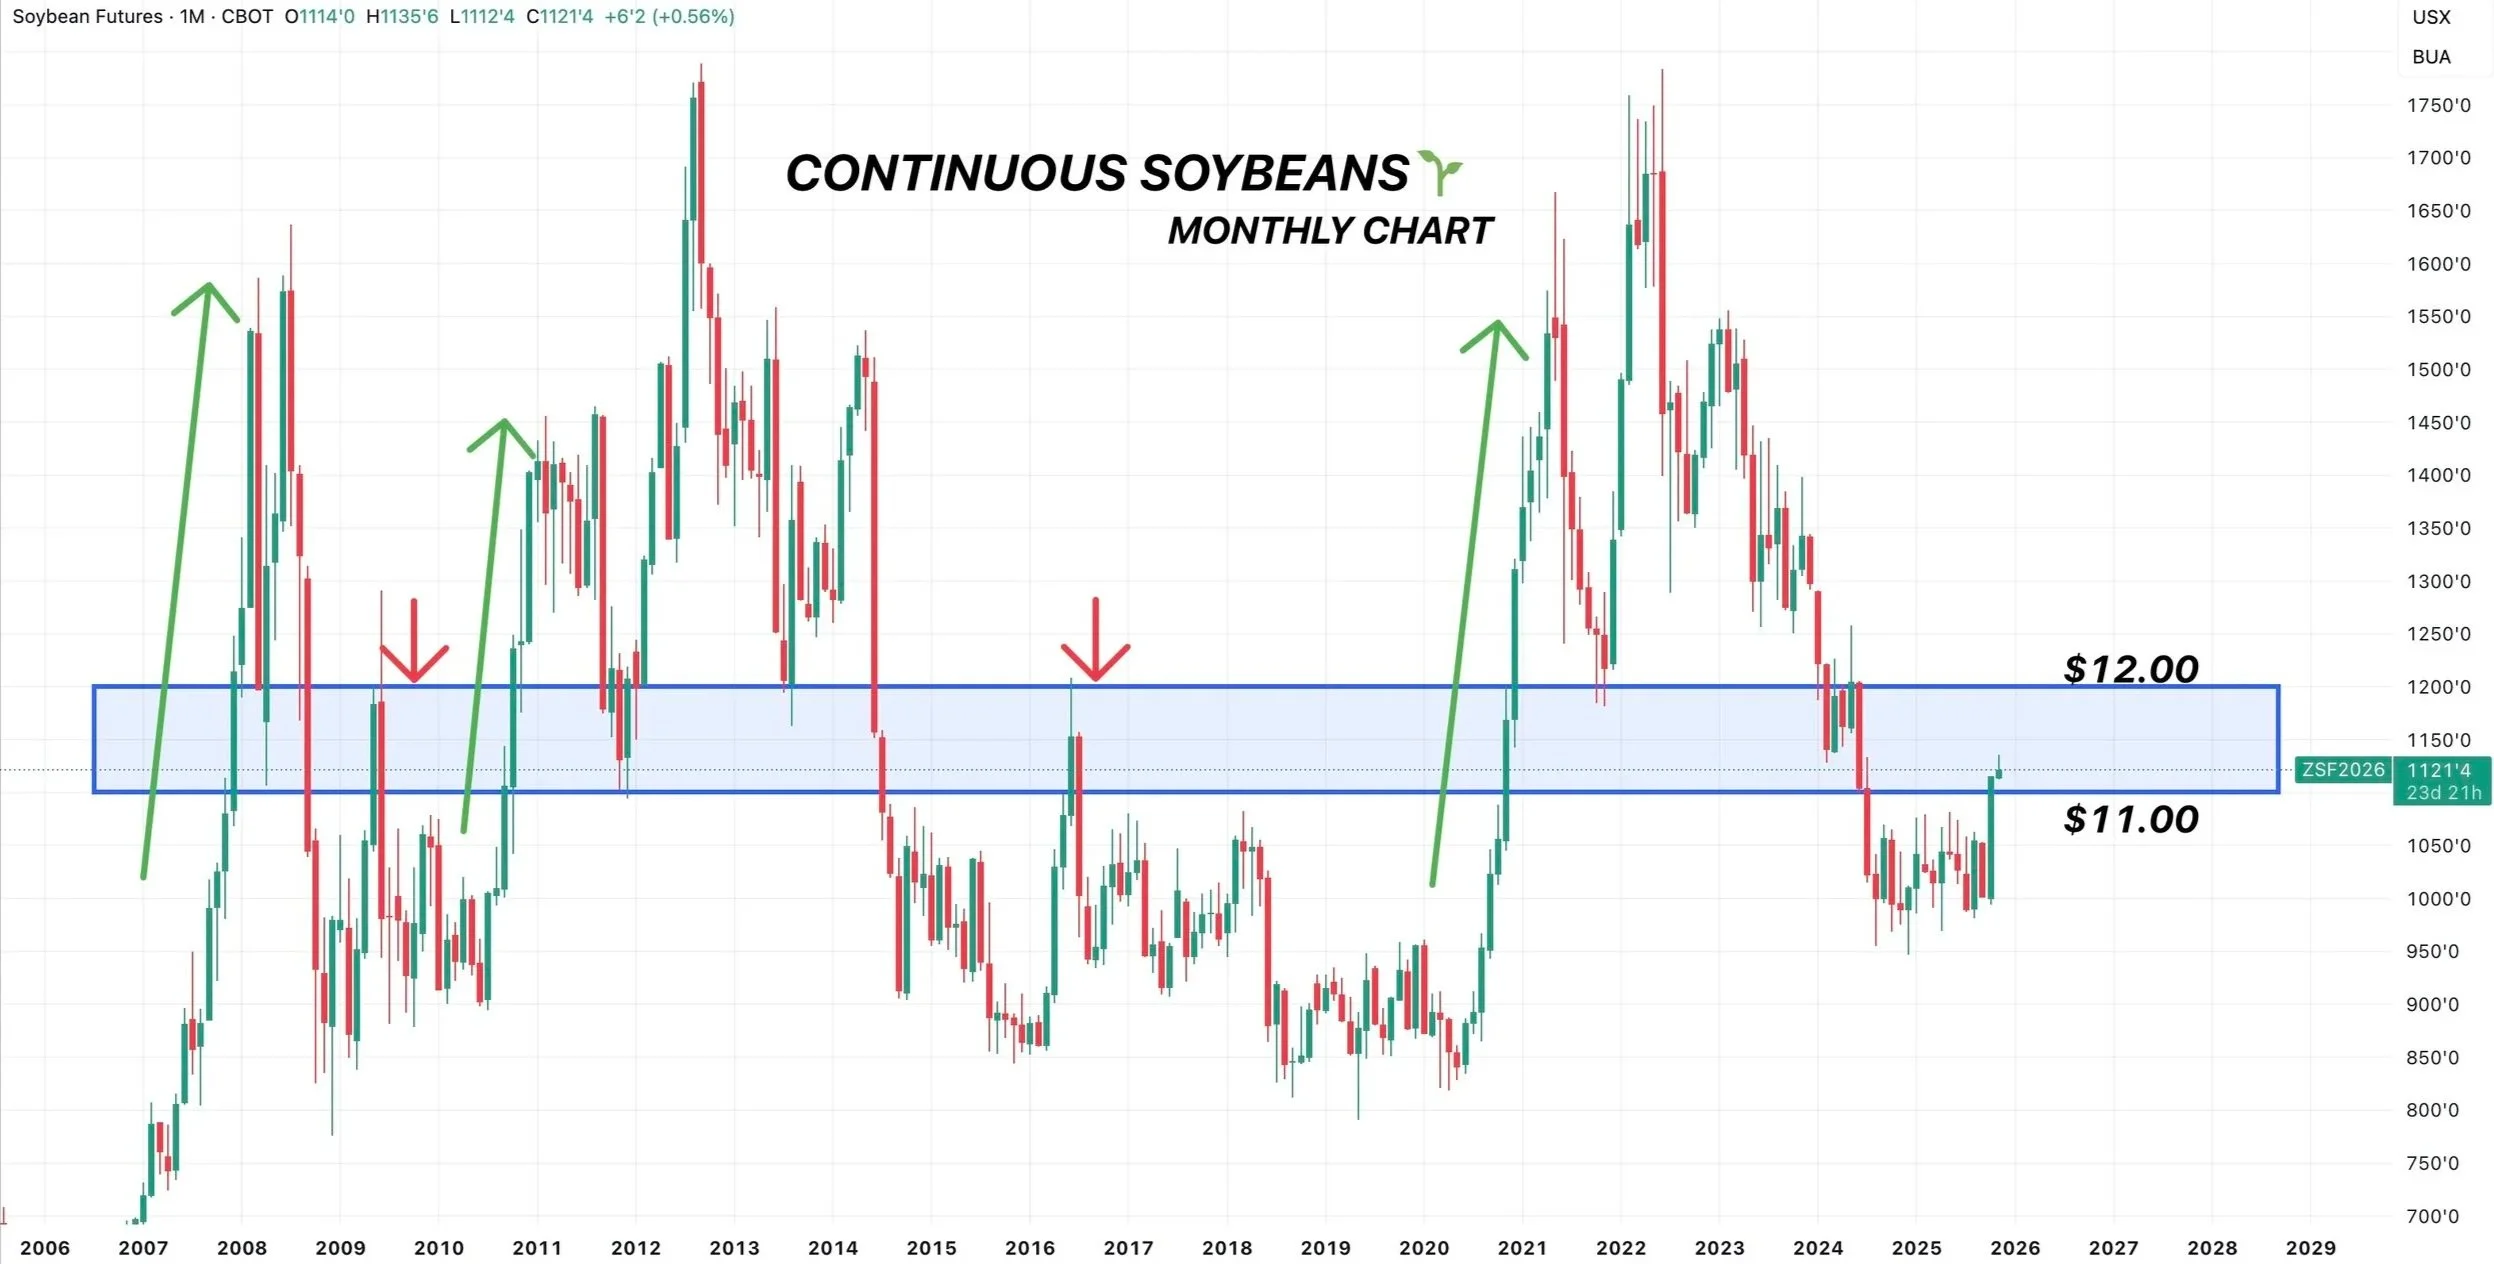
The monthly chart also paints a pretty compelling arguement for $12 beans.
We rarely ever trade between $11.00 and $12.00. Most of the time we fall below $11.00 or rally to $12.00 or higher.
As of a matter of fact, when soybeans are below $11.00 and rally above $11.00, we have never once just simply stopped in the $11.00’s.
Every single time so far, we have either rallied to $12.00 and stopped there, or continued a lot higher.
We’ve never stopped in the $11.00’s. If it happened this time, it would be a first.
Something to keep in mind is that soybeans might be due for a pullback.
Today was our first red day in 2 weeks.
The RSI is at it's most overbought levels ever for this contract. As it hit extreme overbought.
Another thing to potentially watch is the MACD. It has not yet crossed bearish. But the last two times it crossed bearish after a run, it marked the top. Just something to keep your eye on. As if it crosses, it could be a possible warning sign.
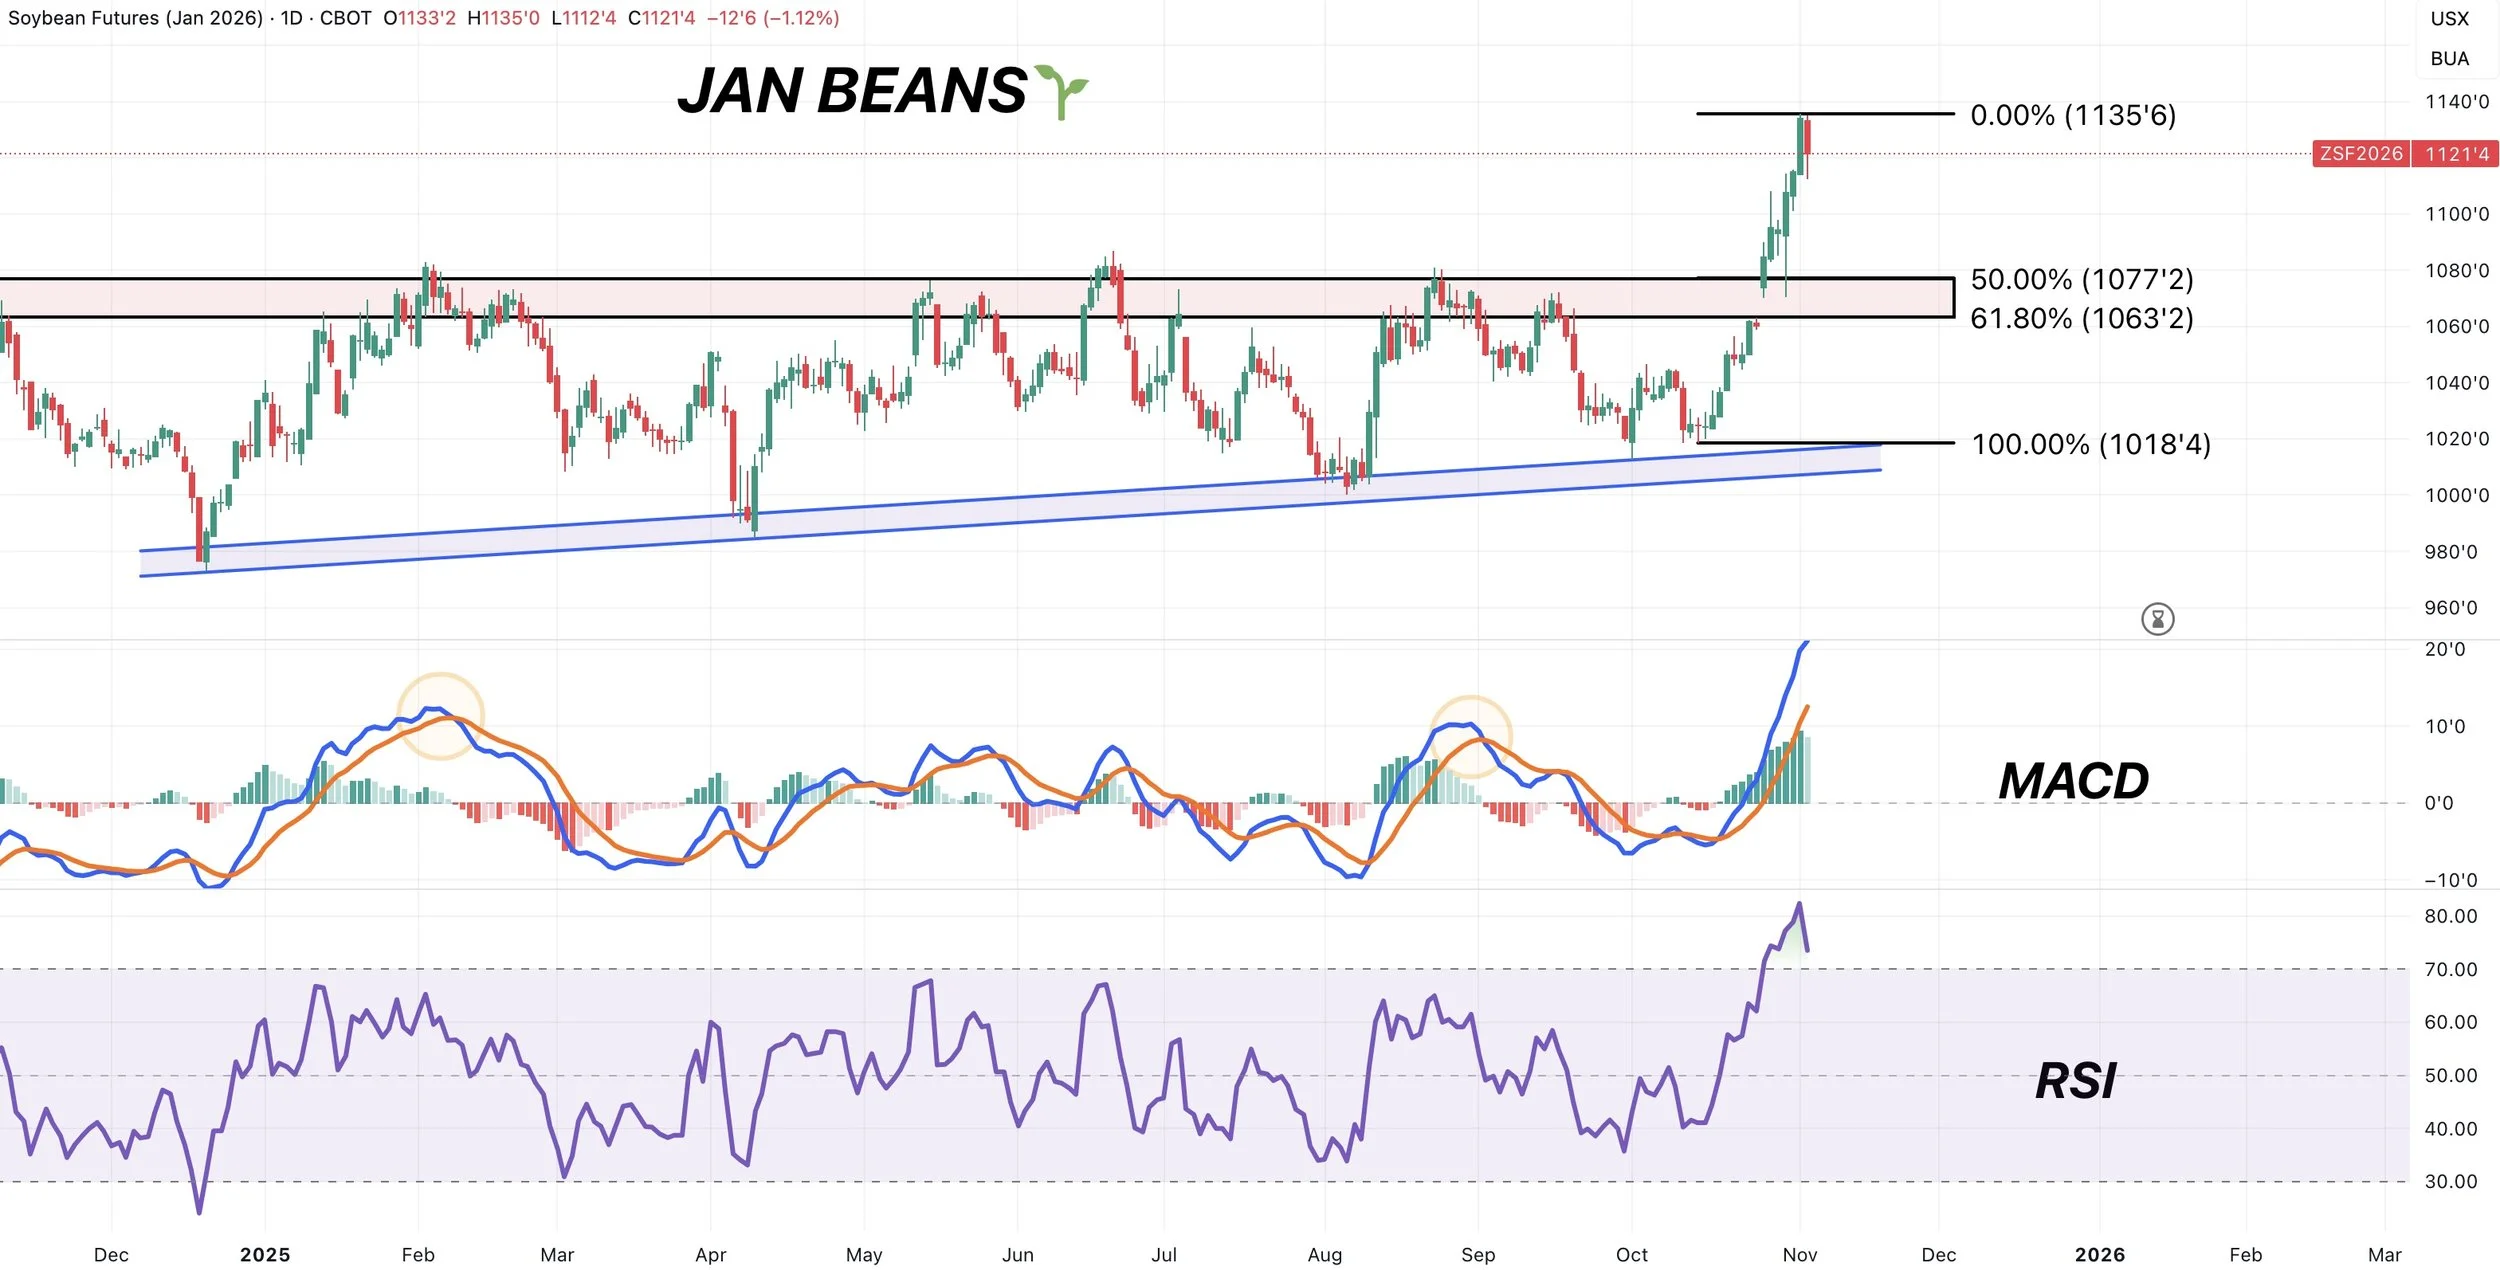
How far could we pullback?
50-61.8% of the recent rally does line up right with our yearly resistance.
Which is noramlly viewed as a standard correction.
That 61.8% level comes in right at that open gap.
I am not saying we have to fall down there at all.
I am just saying that we could fall all the way down there and the structure of the chart still wouldn’t be broken.
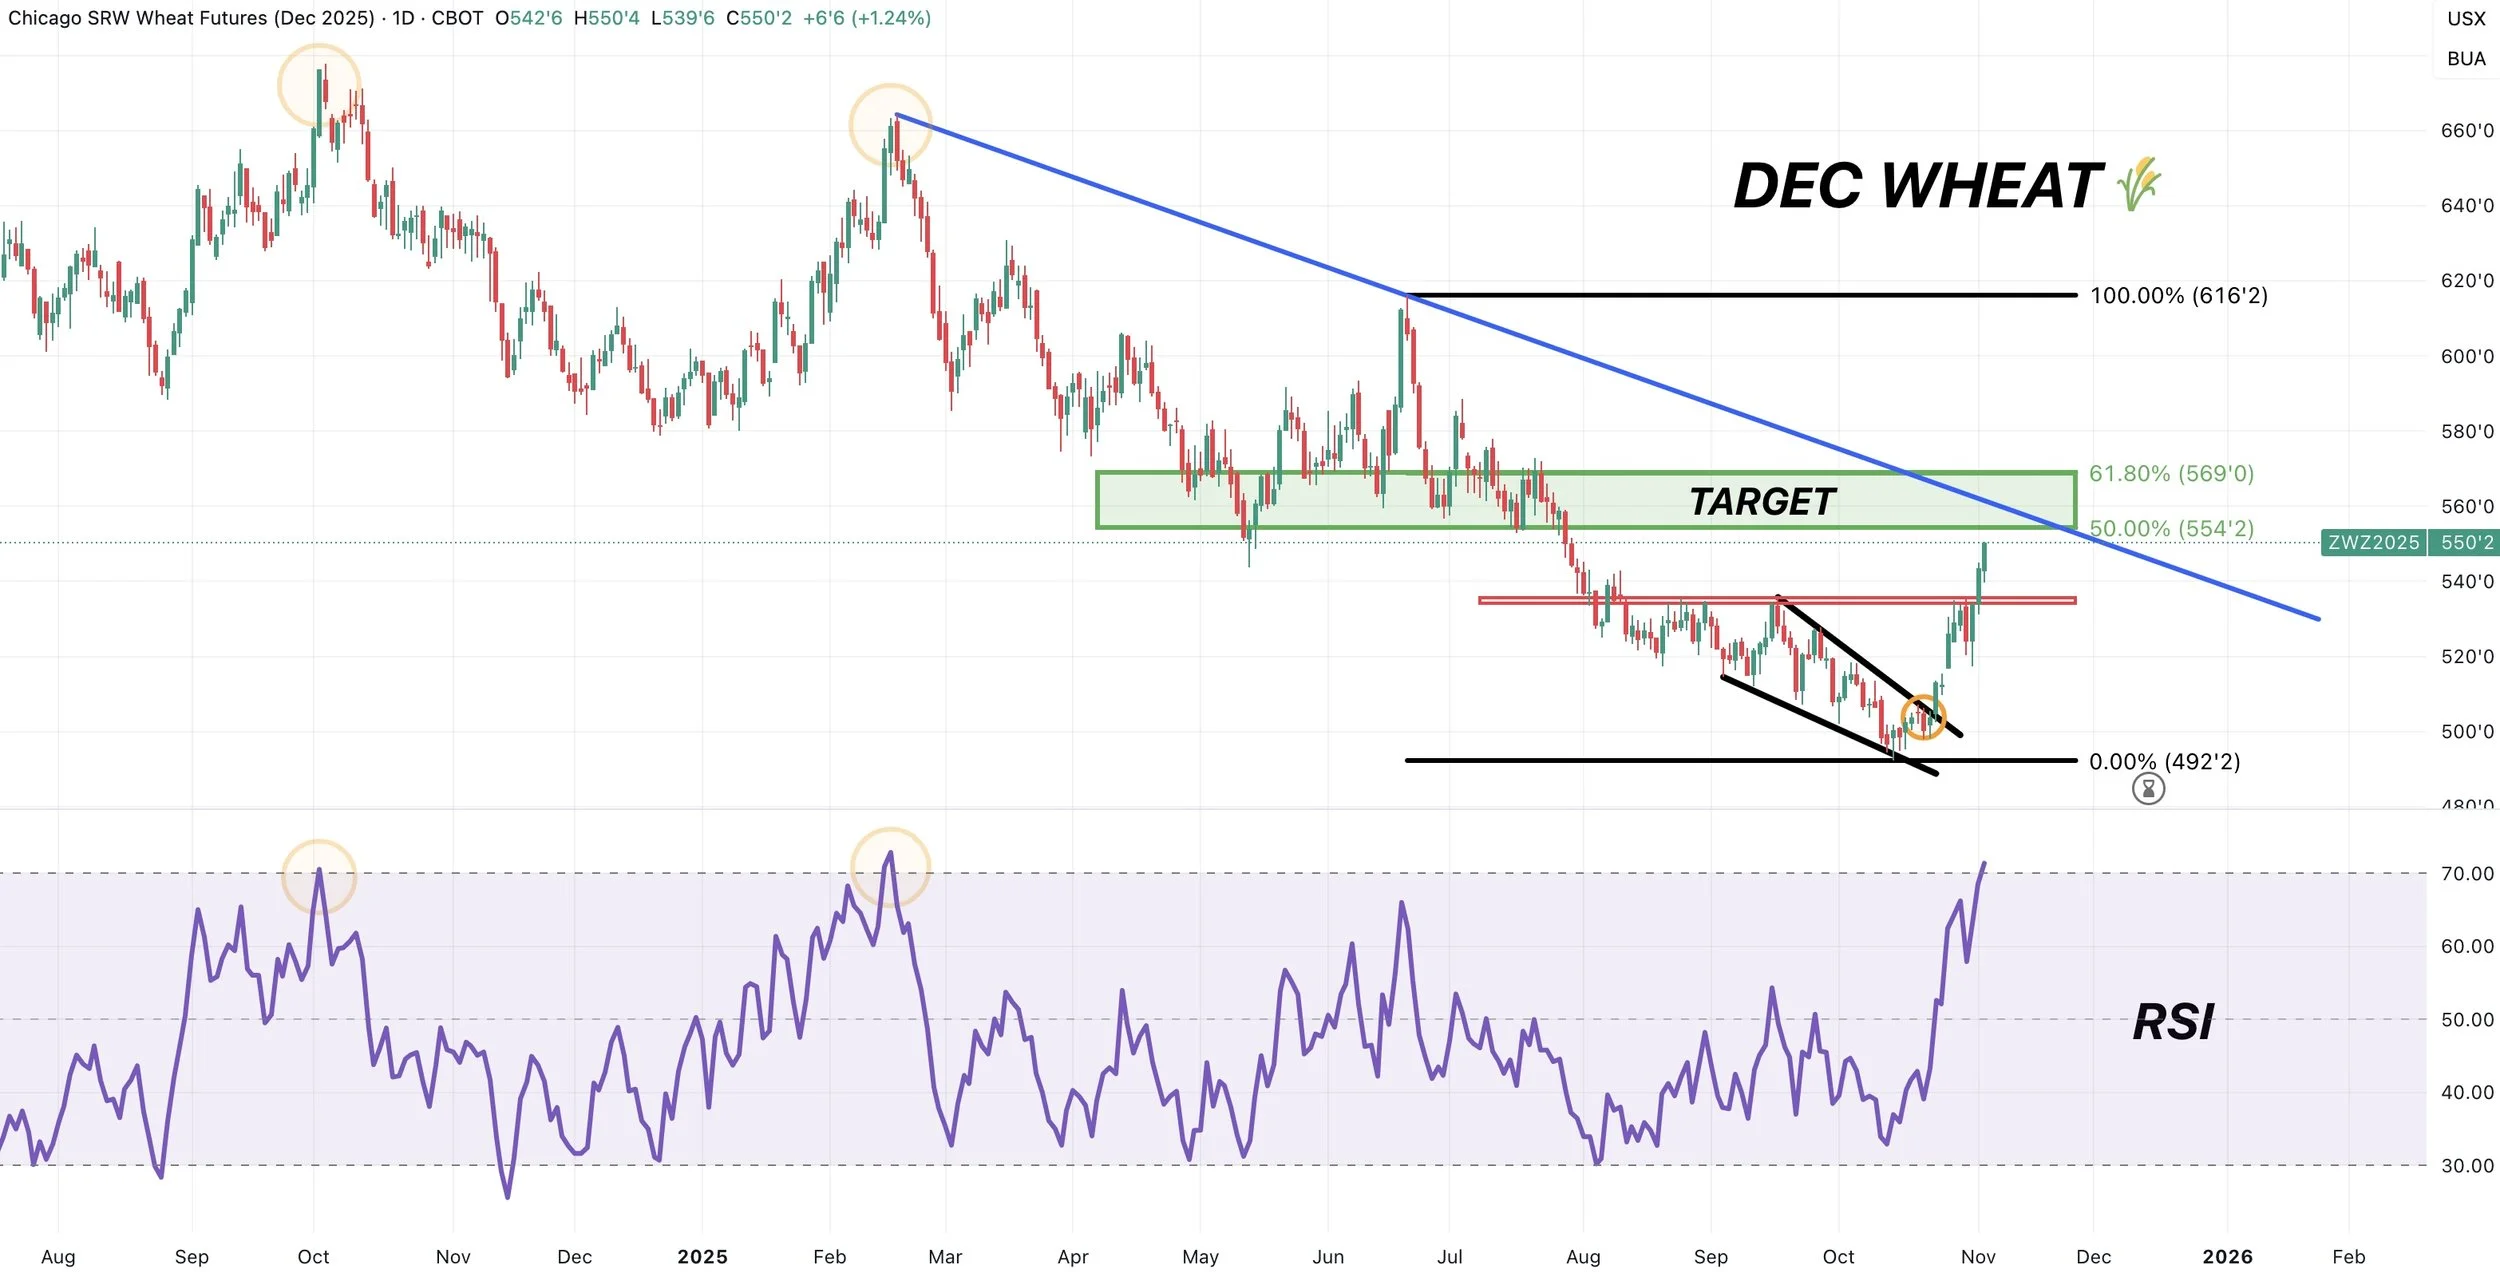
Dec Wheat 🌾
We broke above that Sep resistance box and are running.
We are approaching our first target.
Which is the 50-61.8% retracements up to those June highs.
I like starting to de-risk there.
Not only that, but we have some trendline resistance there as well.

The RSI is getting pretty overbought.
The last two times it was this overbought, it did mark a significant top.
Another reason we want to be de-risking soon.
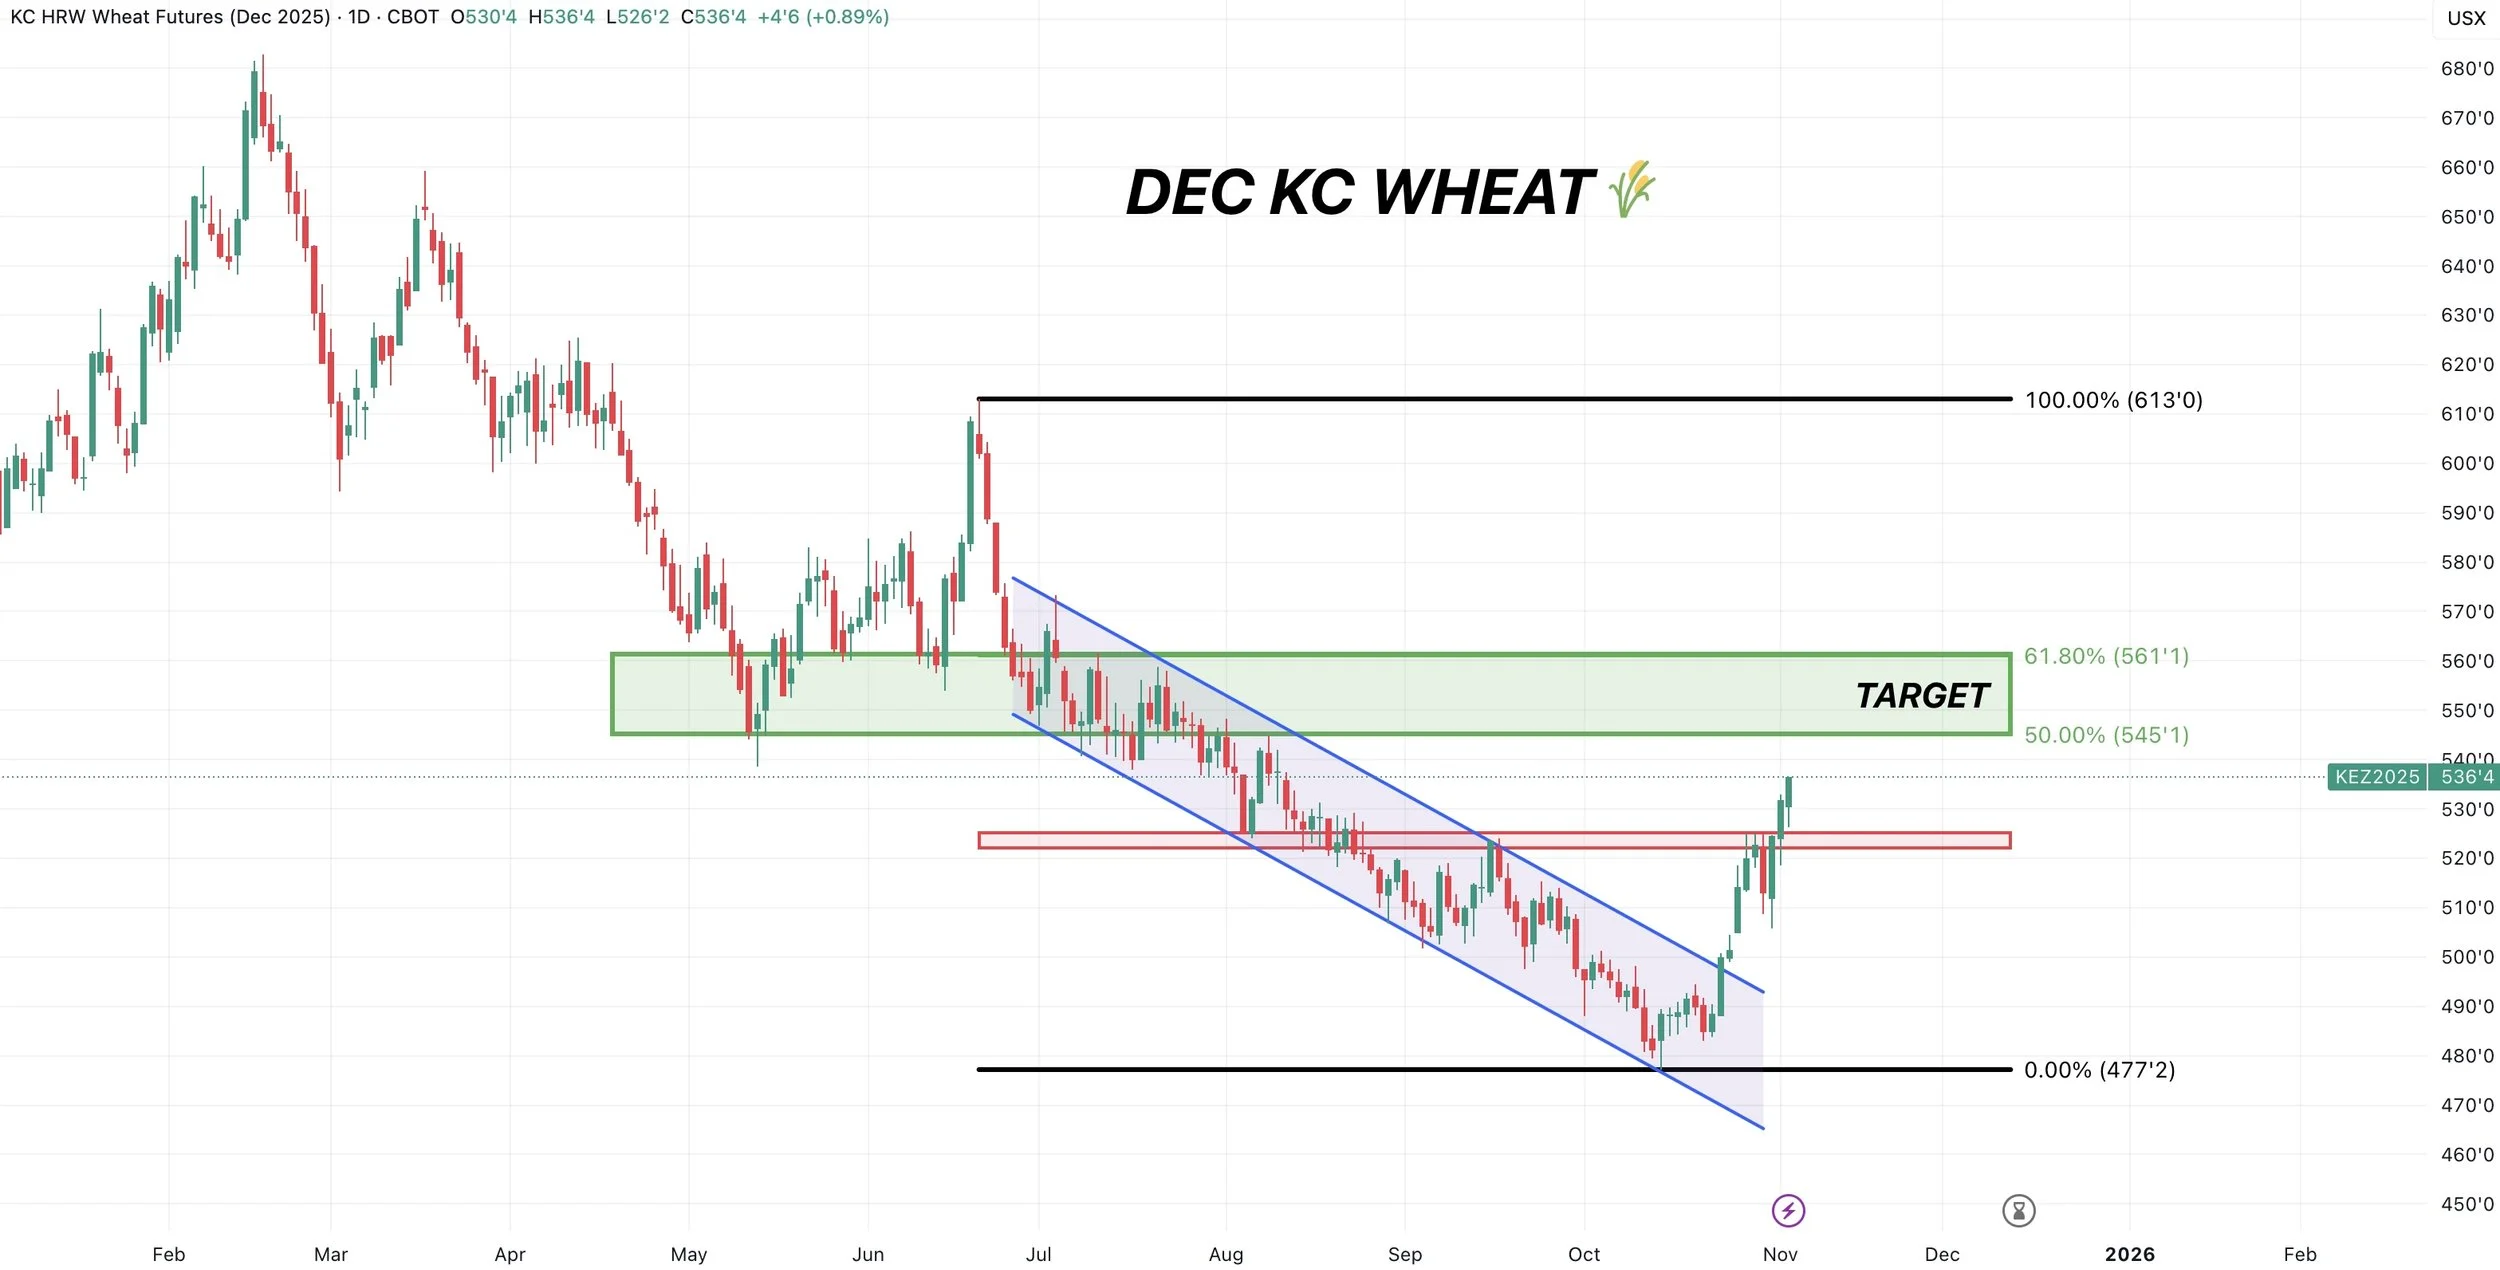
Dec KC 🌾
Same set up as Chicago.
Got the break above Sep resistance.
Now approaching that target box where we want to de-risk.
As it claws back 50-61.8% of the June highs.
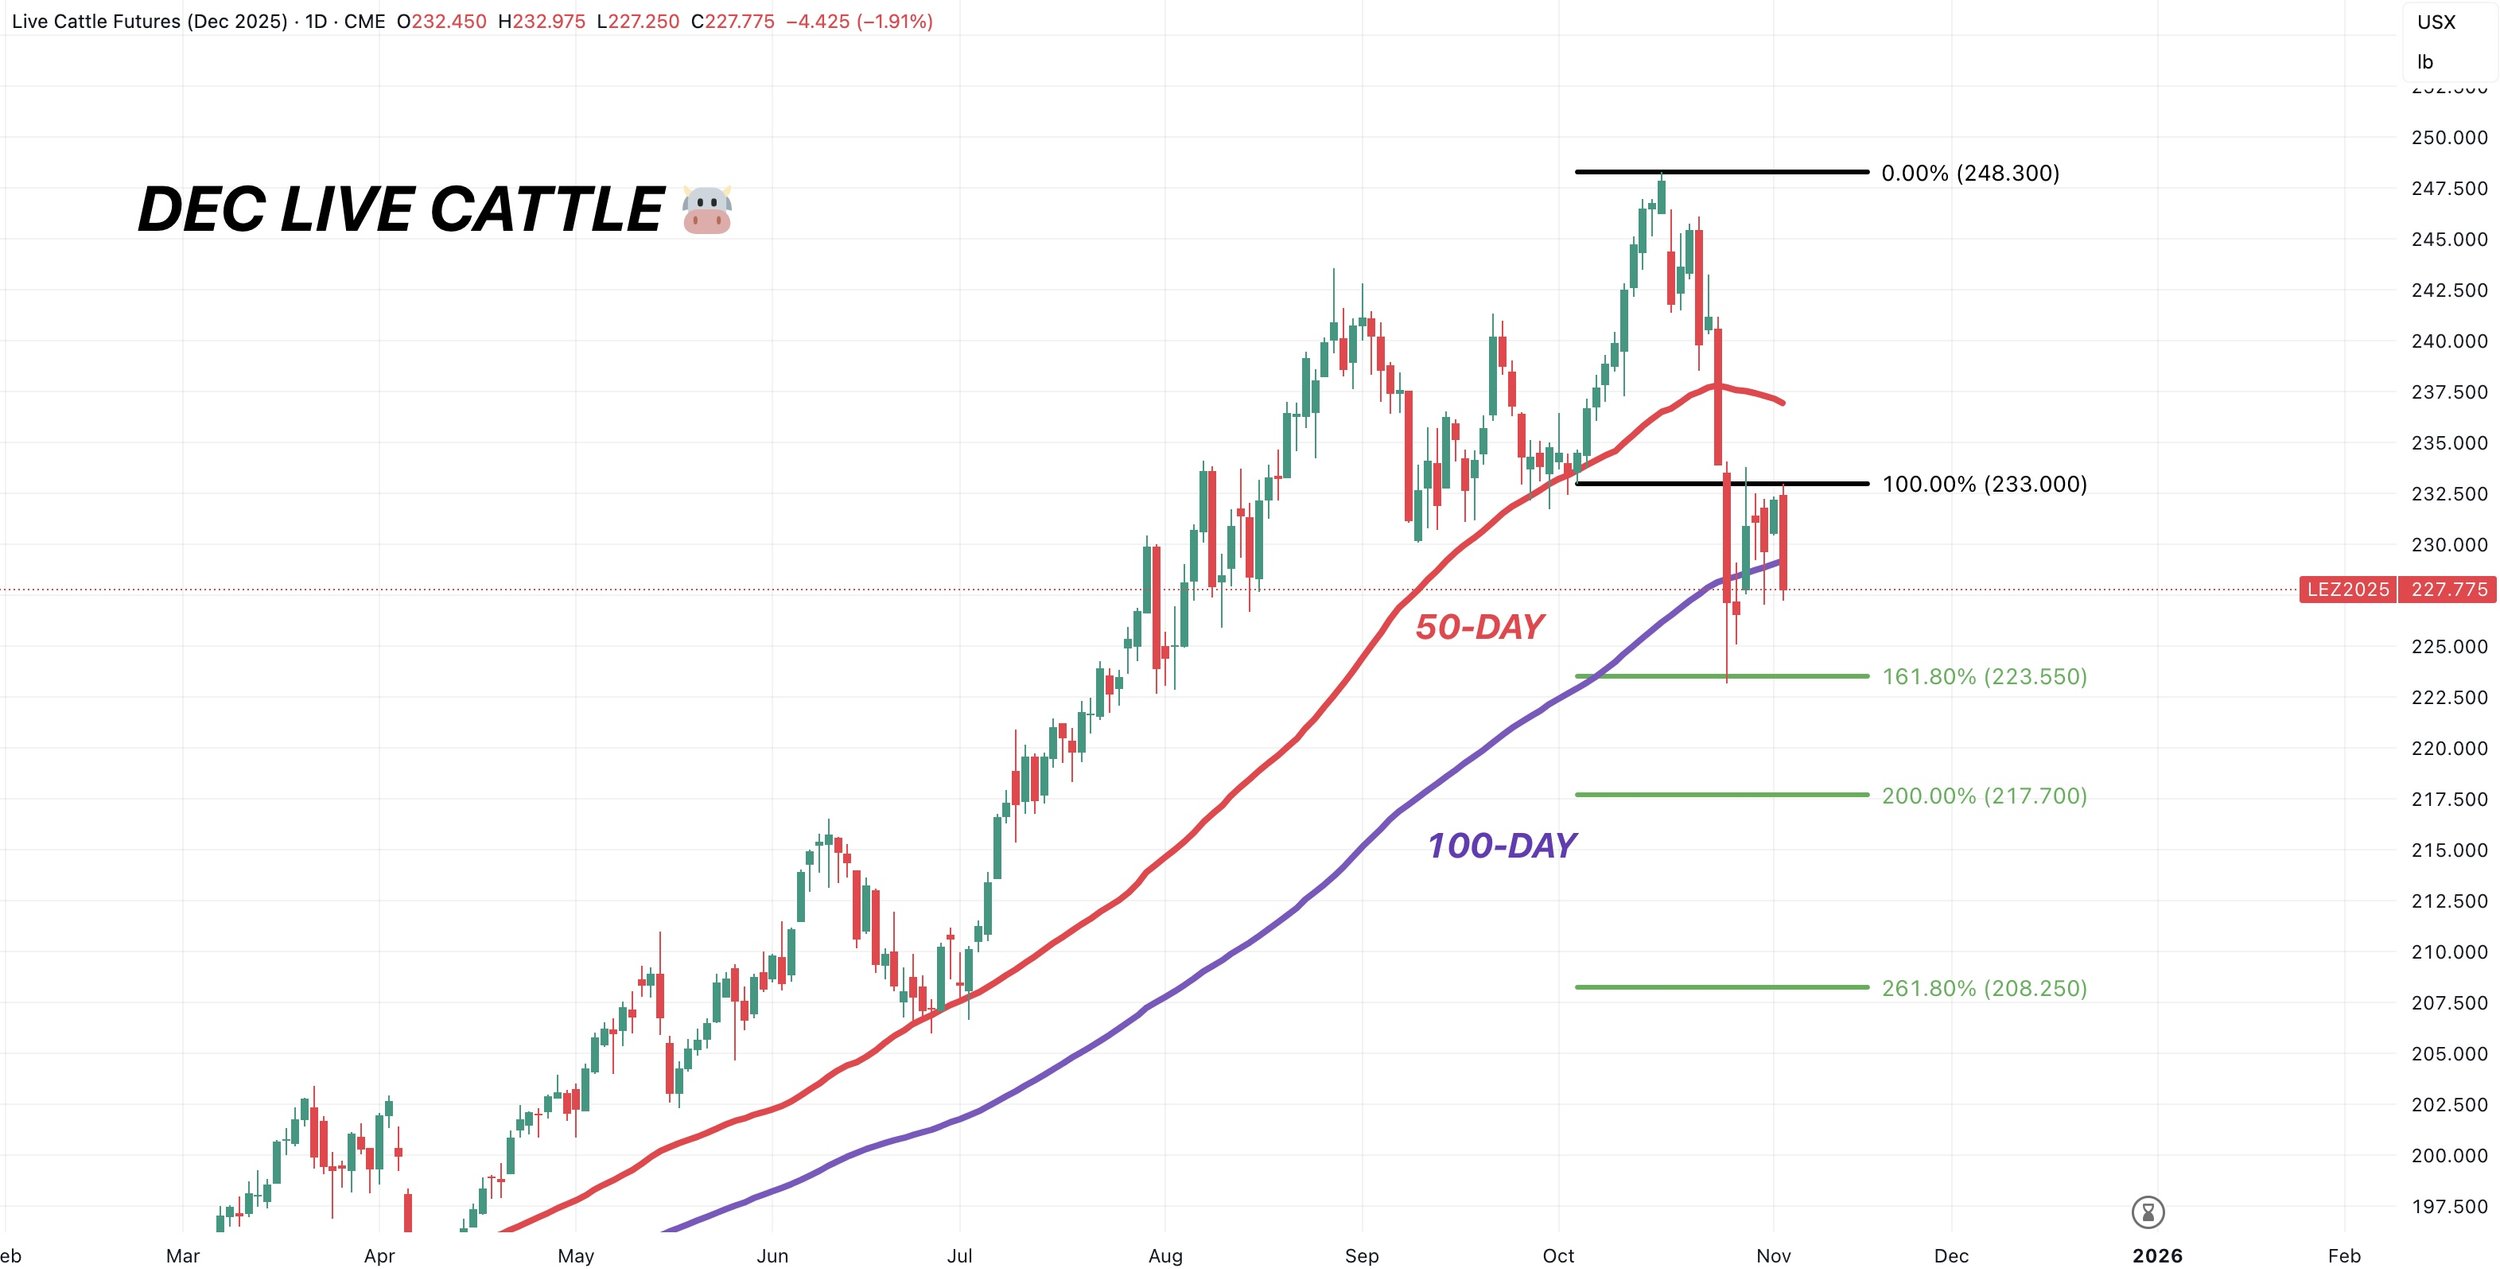
Live Cattle 🐮
Currently we are consolidating in this range, waiting for a decision to be made.
If we get a bounce up to the 50-day MA we want to reward it. That was previously major support the entire run. If we run up there, it will be viewed as resistance.
To the downside, if we break below this range, our downside objective is going to be the 200% retracement from the last time we touched the 50-day up to the contract highs. (Marked with black lines)
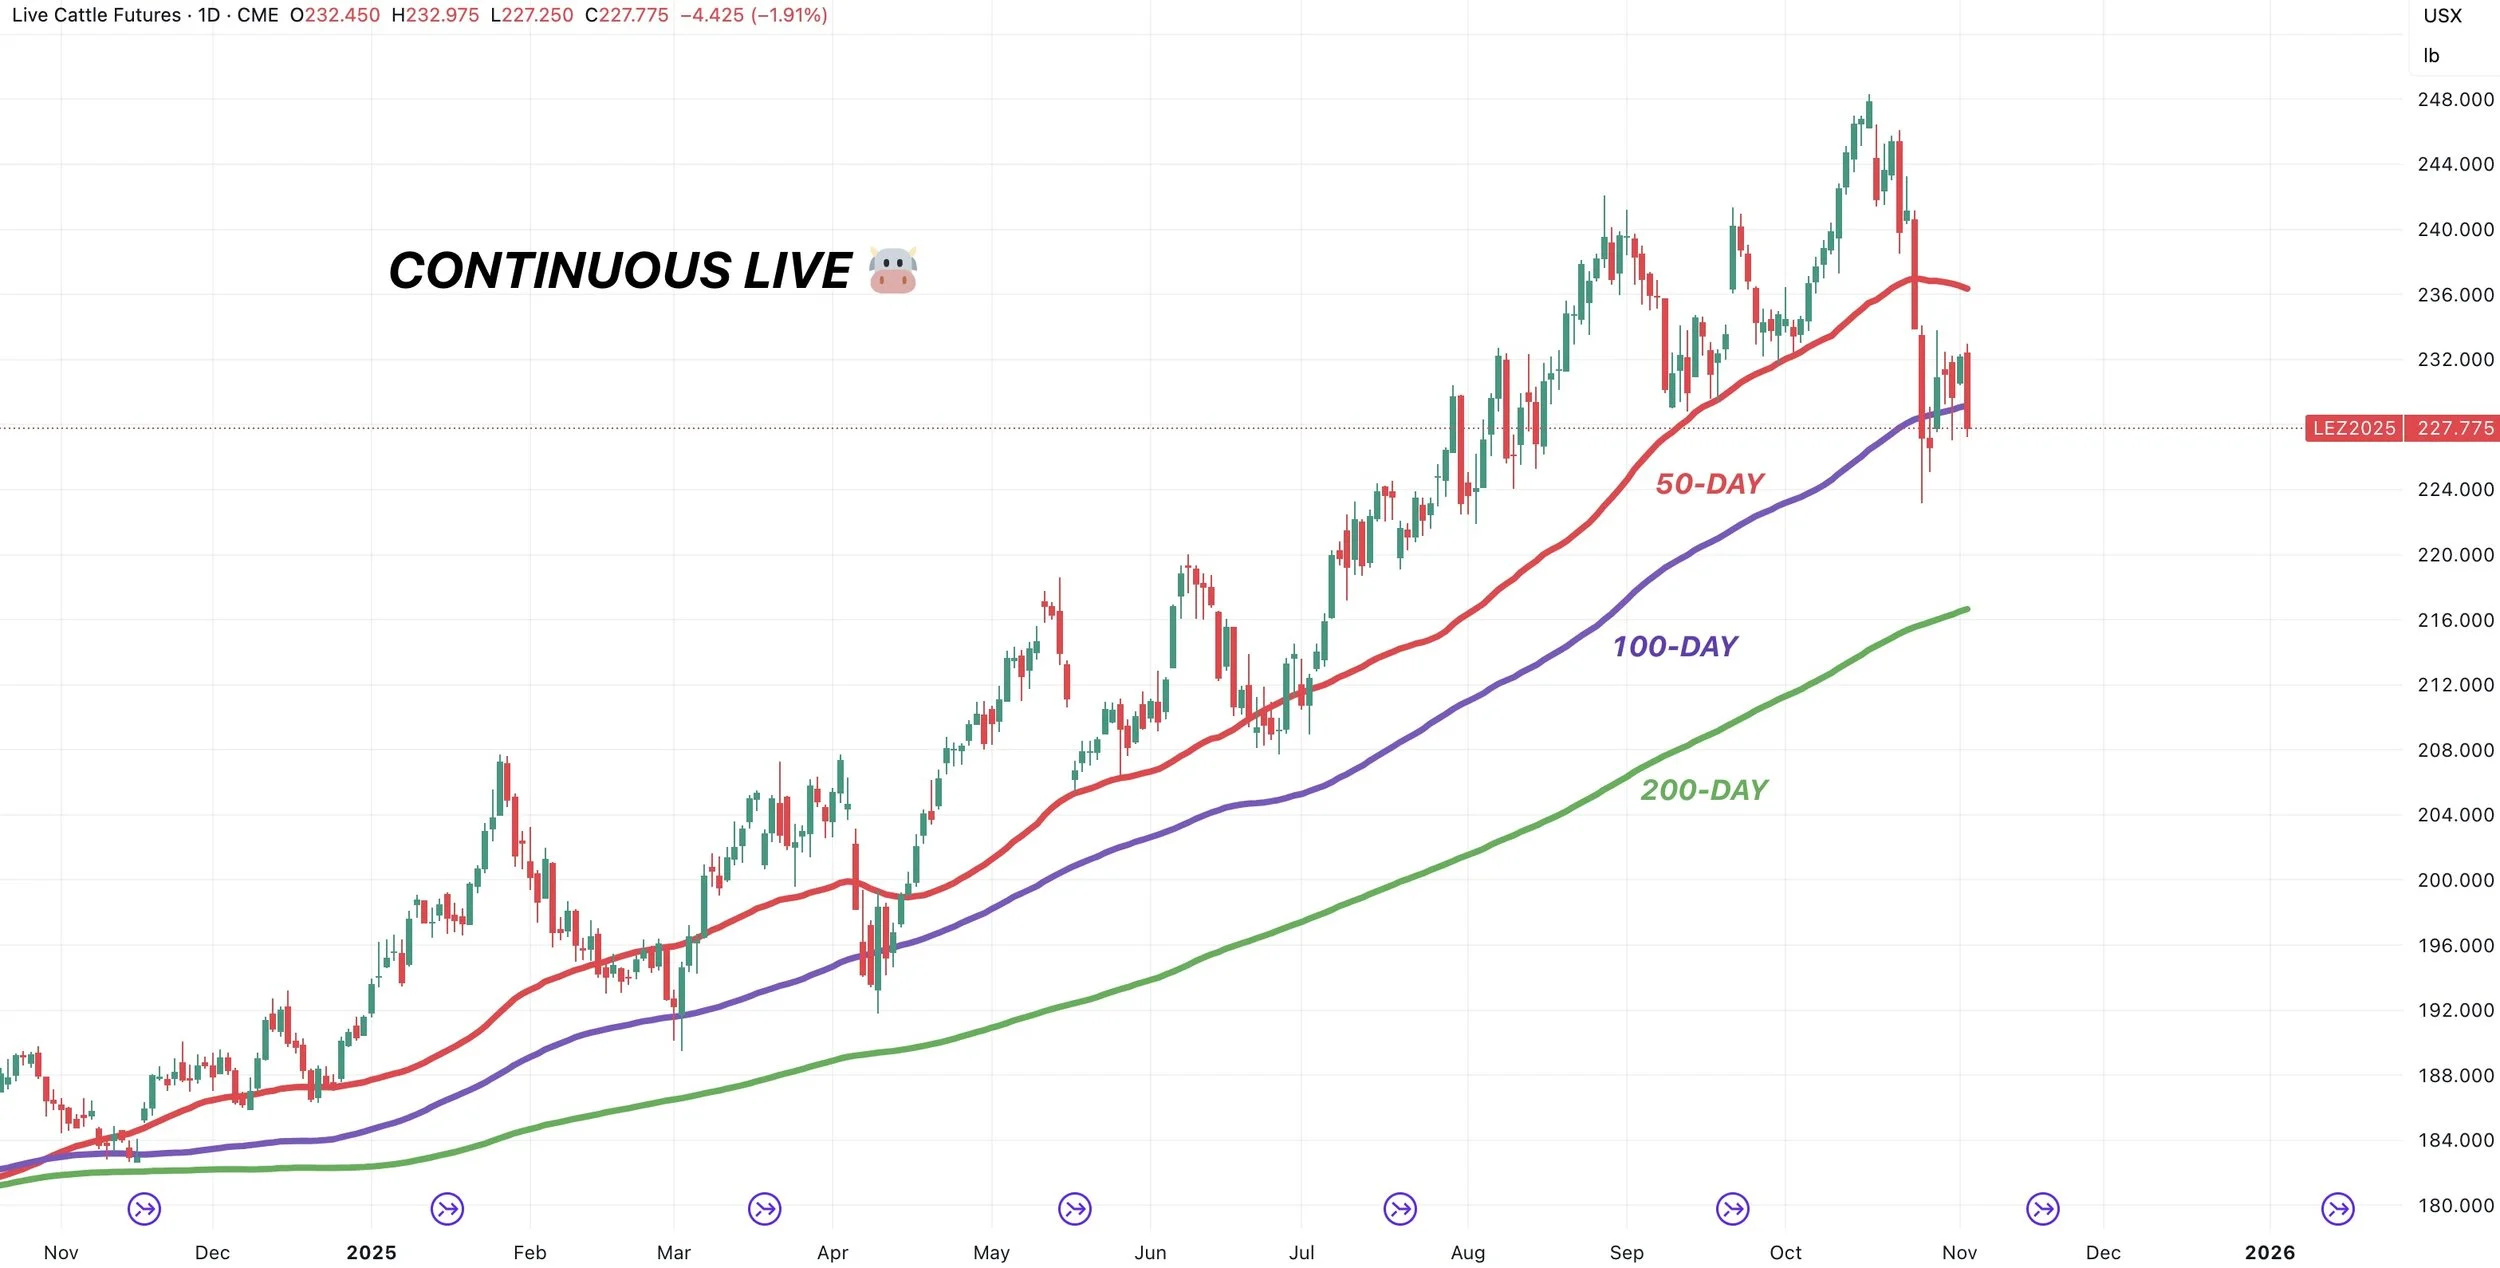
This level also lines up with the 200-day MA on the continuous chart.
That is where we want to look at buying calls, rolling down hedges etc, to give yourself some upside potential. But it depends on your situation so give us a call if you have questions.
(605)295-3100
(Scroll for continuous chart)
Here is the continuous chart.
That 200-day MA lines up with that 200% retracement on the Dec live chart.
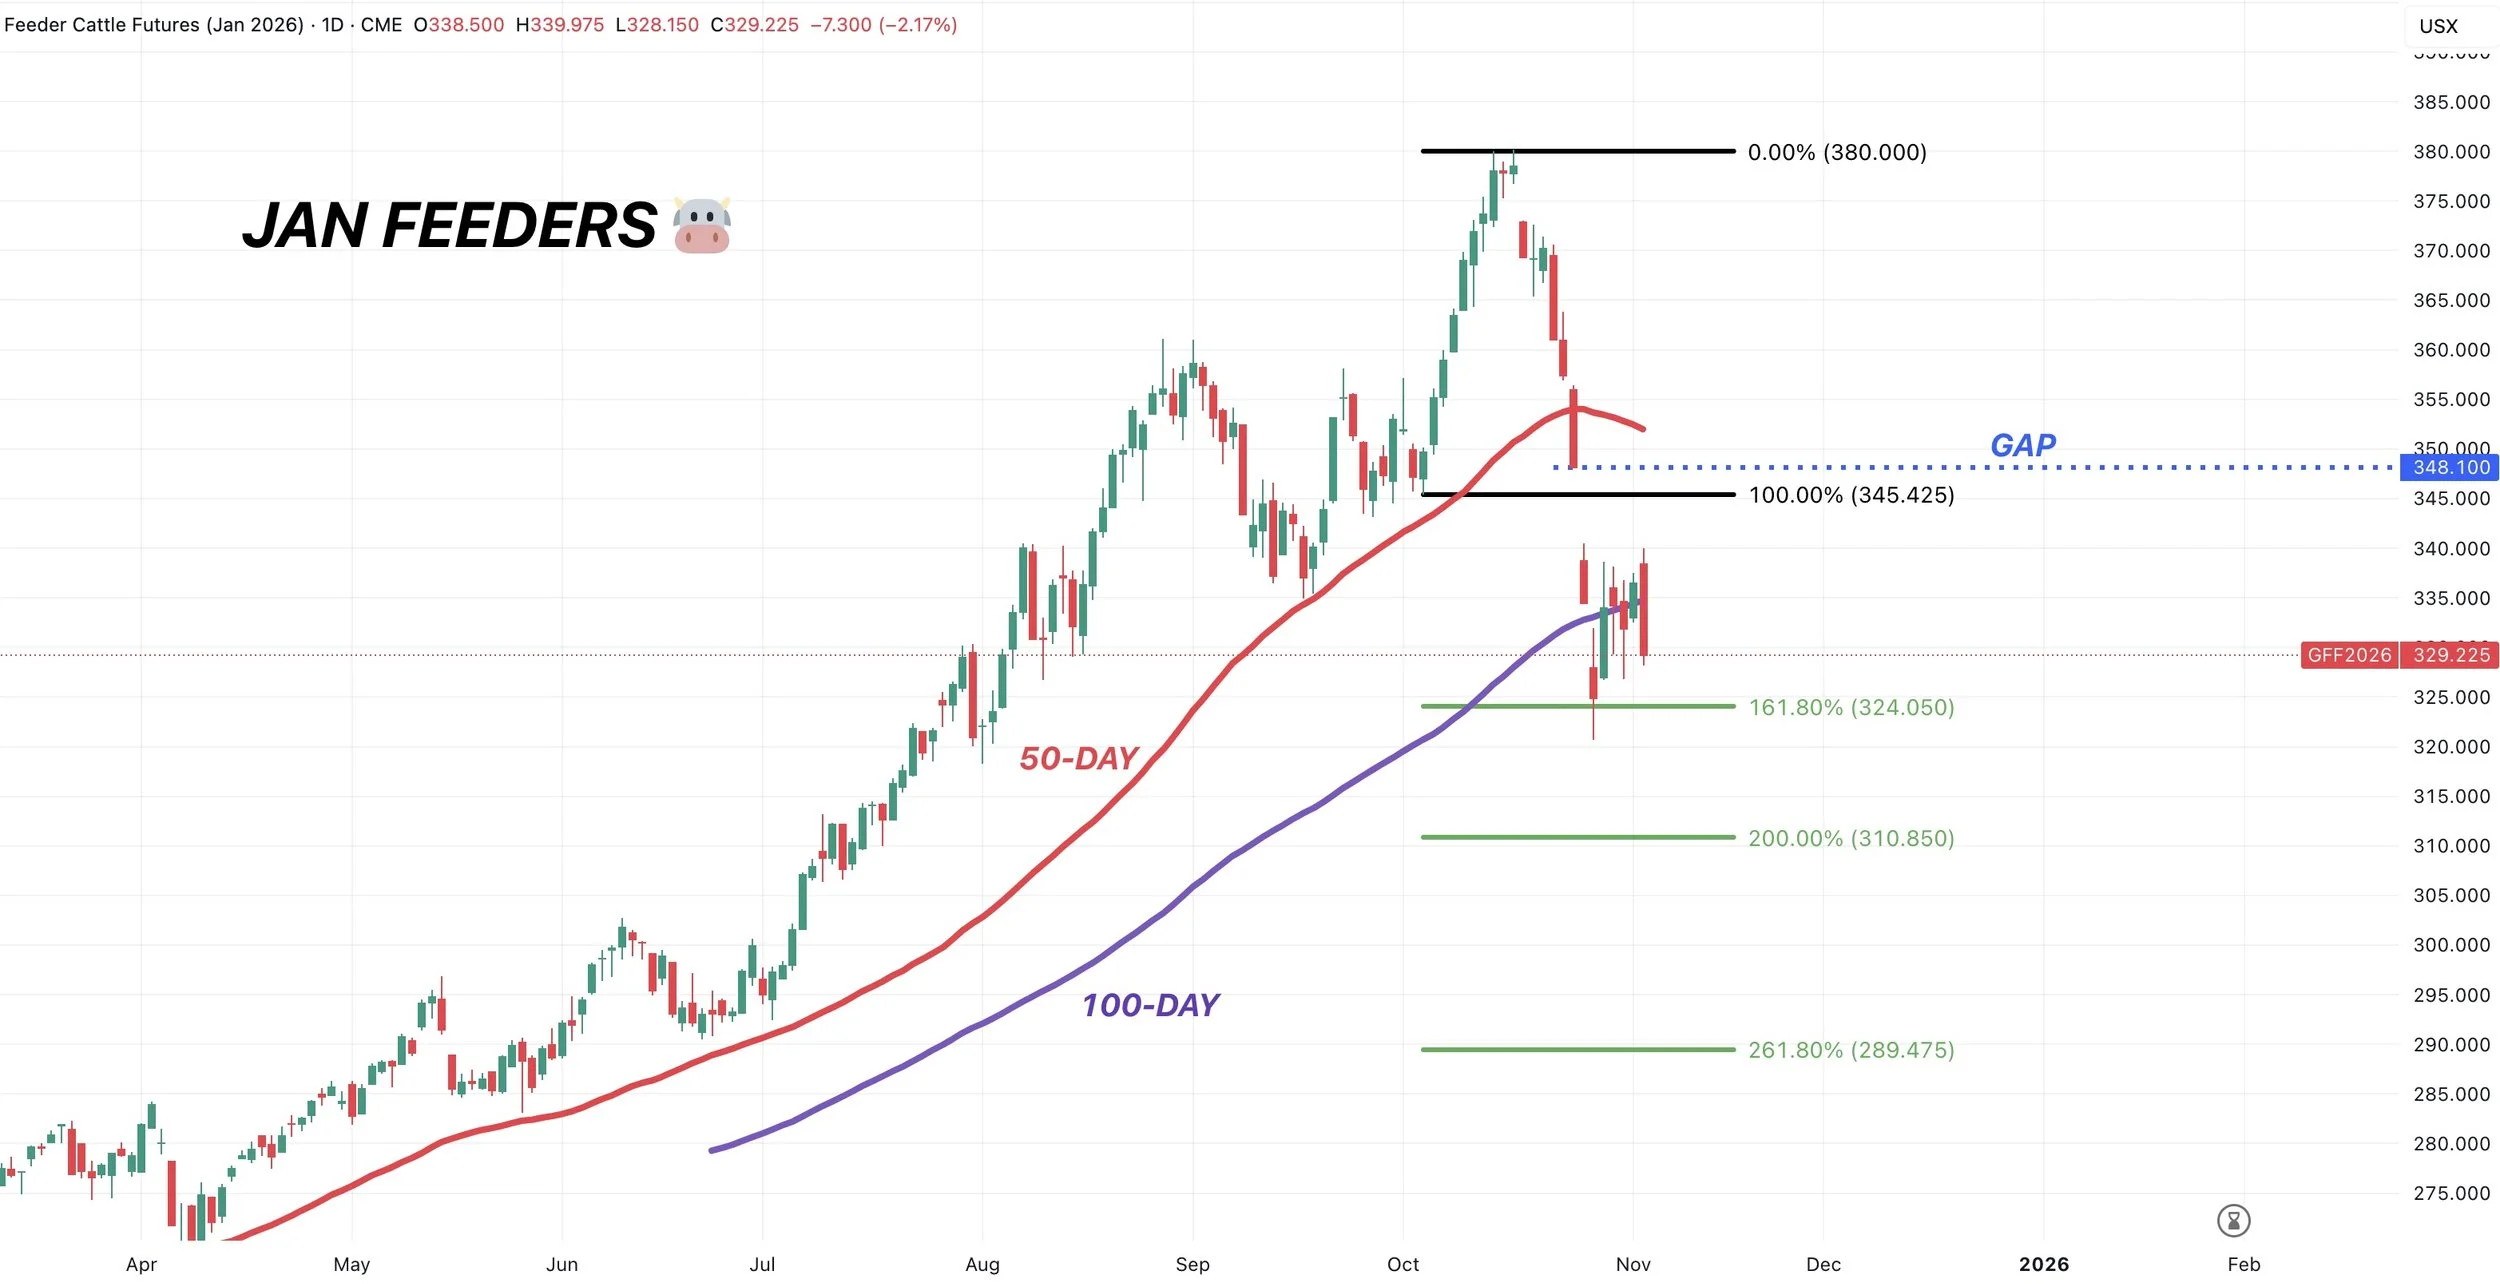
Feeder Cattle 🐮
Ugly day today.
If we get a bounce up to that gap, we want to reward it.
To the downside, our objective is that 200% level.
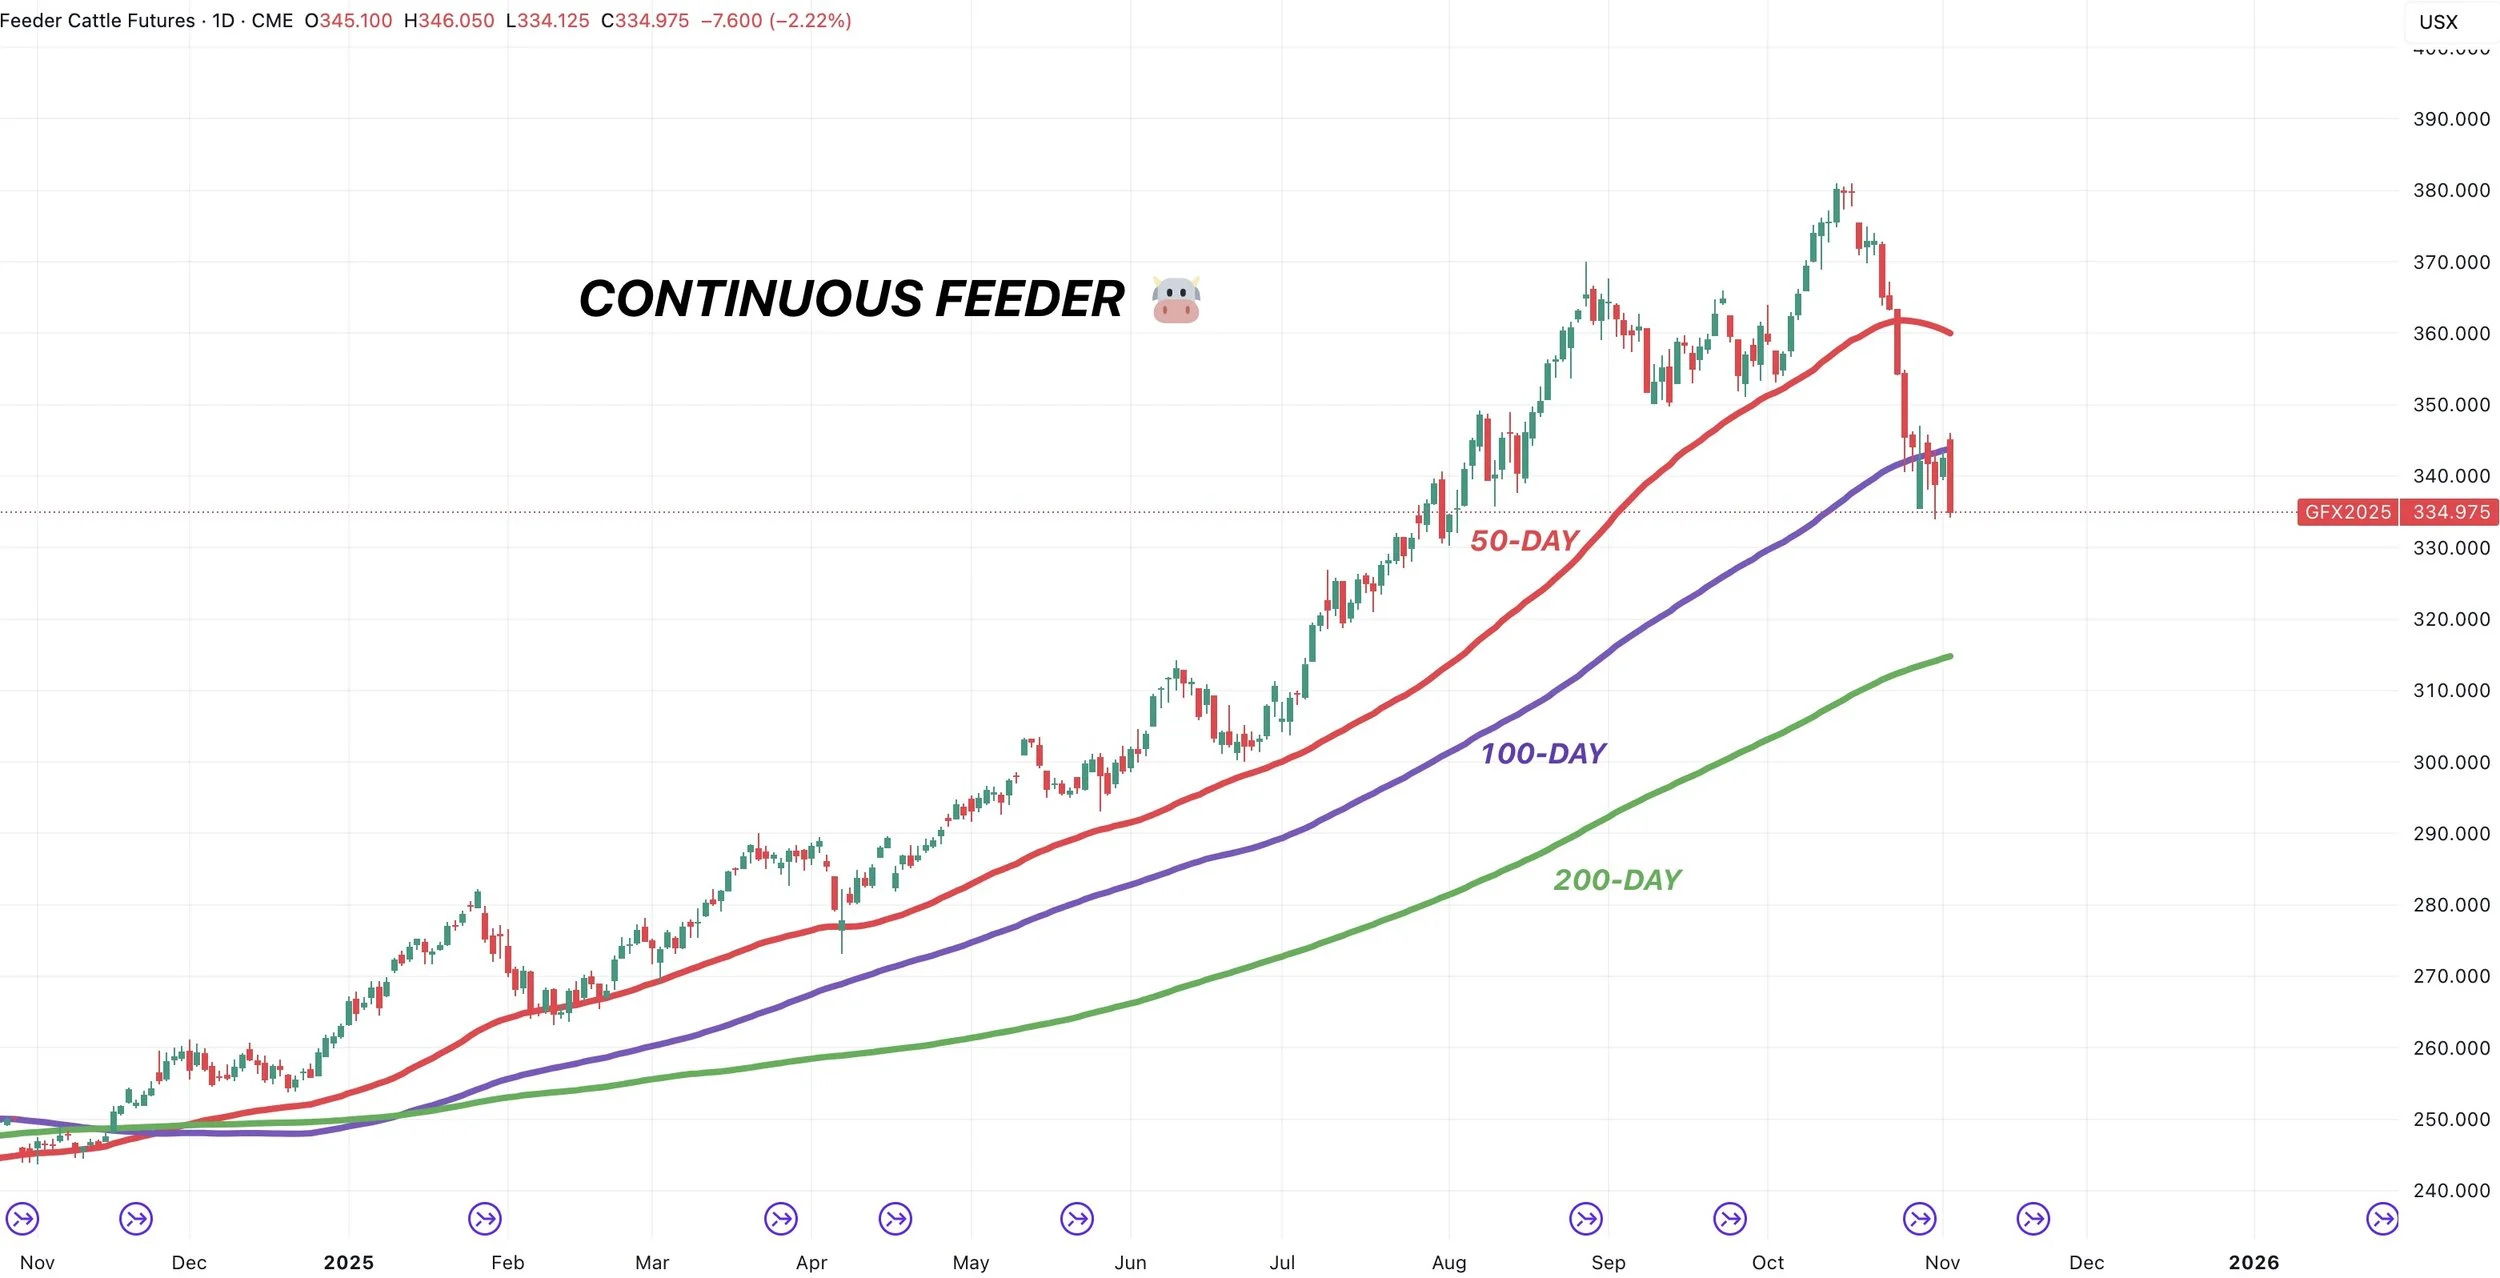
Which lines up closely to the 200-day MA on the continuous chart.
(Scroll for continuous chart)
Here is the continuous chart.
Past Sell & Protection Signals
We recently incorporated these. Here are our past signals.
Oct 28th: 🌽
Corn sell signal & hedge alert.
Oct 27th: 🌱
Soybean sell signal & hedge alert.
Oct 13th: 🐮
Cattle sell signal & hedge alert.
Aug 22nd: 🌱
Soybean sell signal & hedge alert.
July 31st: 🐮
Cattle sell signal & hedge alert.
July 10th: 🐮
Cattle sell signal & hedge alert.
June 5th: 🐮
Cattle sell signal & hedge alert.
June 2nd: 🌾
MPLS wheat sell signal.
April 10th: 🌽
Old crop corn sell signal.
March 19th: 🐮
Cattle hedge & sell signal.
Feb 18th: 🌽 🌾
KC wheat & corn signal.
Jan 23rd: 🌽 🌱
Corn & beans sell signal.
Jan 15th: 🌽 🌱
Corn & beans hedge alert/sell signal.
Jan 2nd: 🐮
Cattle hedge alert at new all-time highs & target.
CLICK HERE TO VIEW
Dec 11: 🌽
Corn sell signal at $4.51 200-day MA
Oct 2nd: 🌾
Wheat sell signal at $6.12 target
Sep 30th: 🌽
Corn protection signal at $4.23-26
Sep 27th: 🌱
Soybean sell & protection signal at $10.65
Sep 13th: 🌾
Wheat sell signal at $5.98
May 22nd: 🌾
Wheat sell signal when wheat traded +$7.00
Want to Talk?
Our phones are open 24/7 for you guys. If you need help with anything at all, don’t hesitate to shoot us a call, text, or email.
Hedge Account
Interested in a hedge account? Use the link below to set up an account or shoot Jeremey a call at (605)295-3100