
CHINA BUYING WHEAT? GRAIN RALLY CONTINUES
AUDIO COMMENTARY
Very volatile day in grains
New highs in beans & wheat
Rumors China buying wheat
China hasn’t bought wheat in over a year
What if China buys corn & wheat?
USDA scheduled for 14th if gov open
Price action looks like China buying beans
Balance sheets change drastically if yield slips like some suggest it could
Sue Martin says much higher beans
How to use stops & puts in beans
Letting soybeans ride higher with a hedge account
Soybeans rarely stop at $11.00’s
There is still black swan risks
Some argue this bean demand just shifted more demand back to Brazil
Who should reward the wheat rally soon?
Corn re-ownership strategy
What to do if you’re forced to sell corn
Still see downside risk in cattle
Wheat breaking out (chart below)*
Soybean targets (chart below)*
Listen to today’s audio below
Want to talk? (605)295-3100
CHARTS
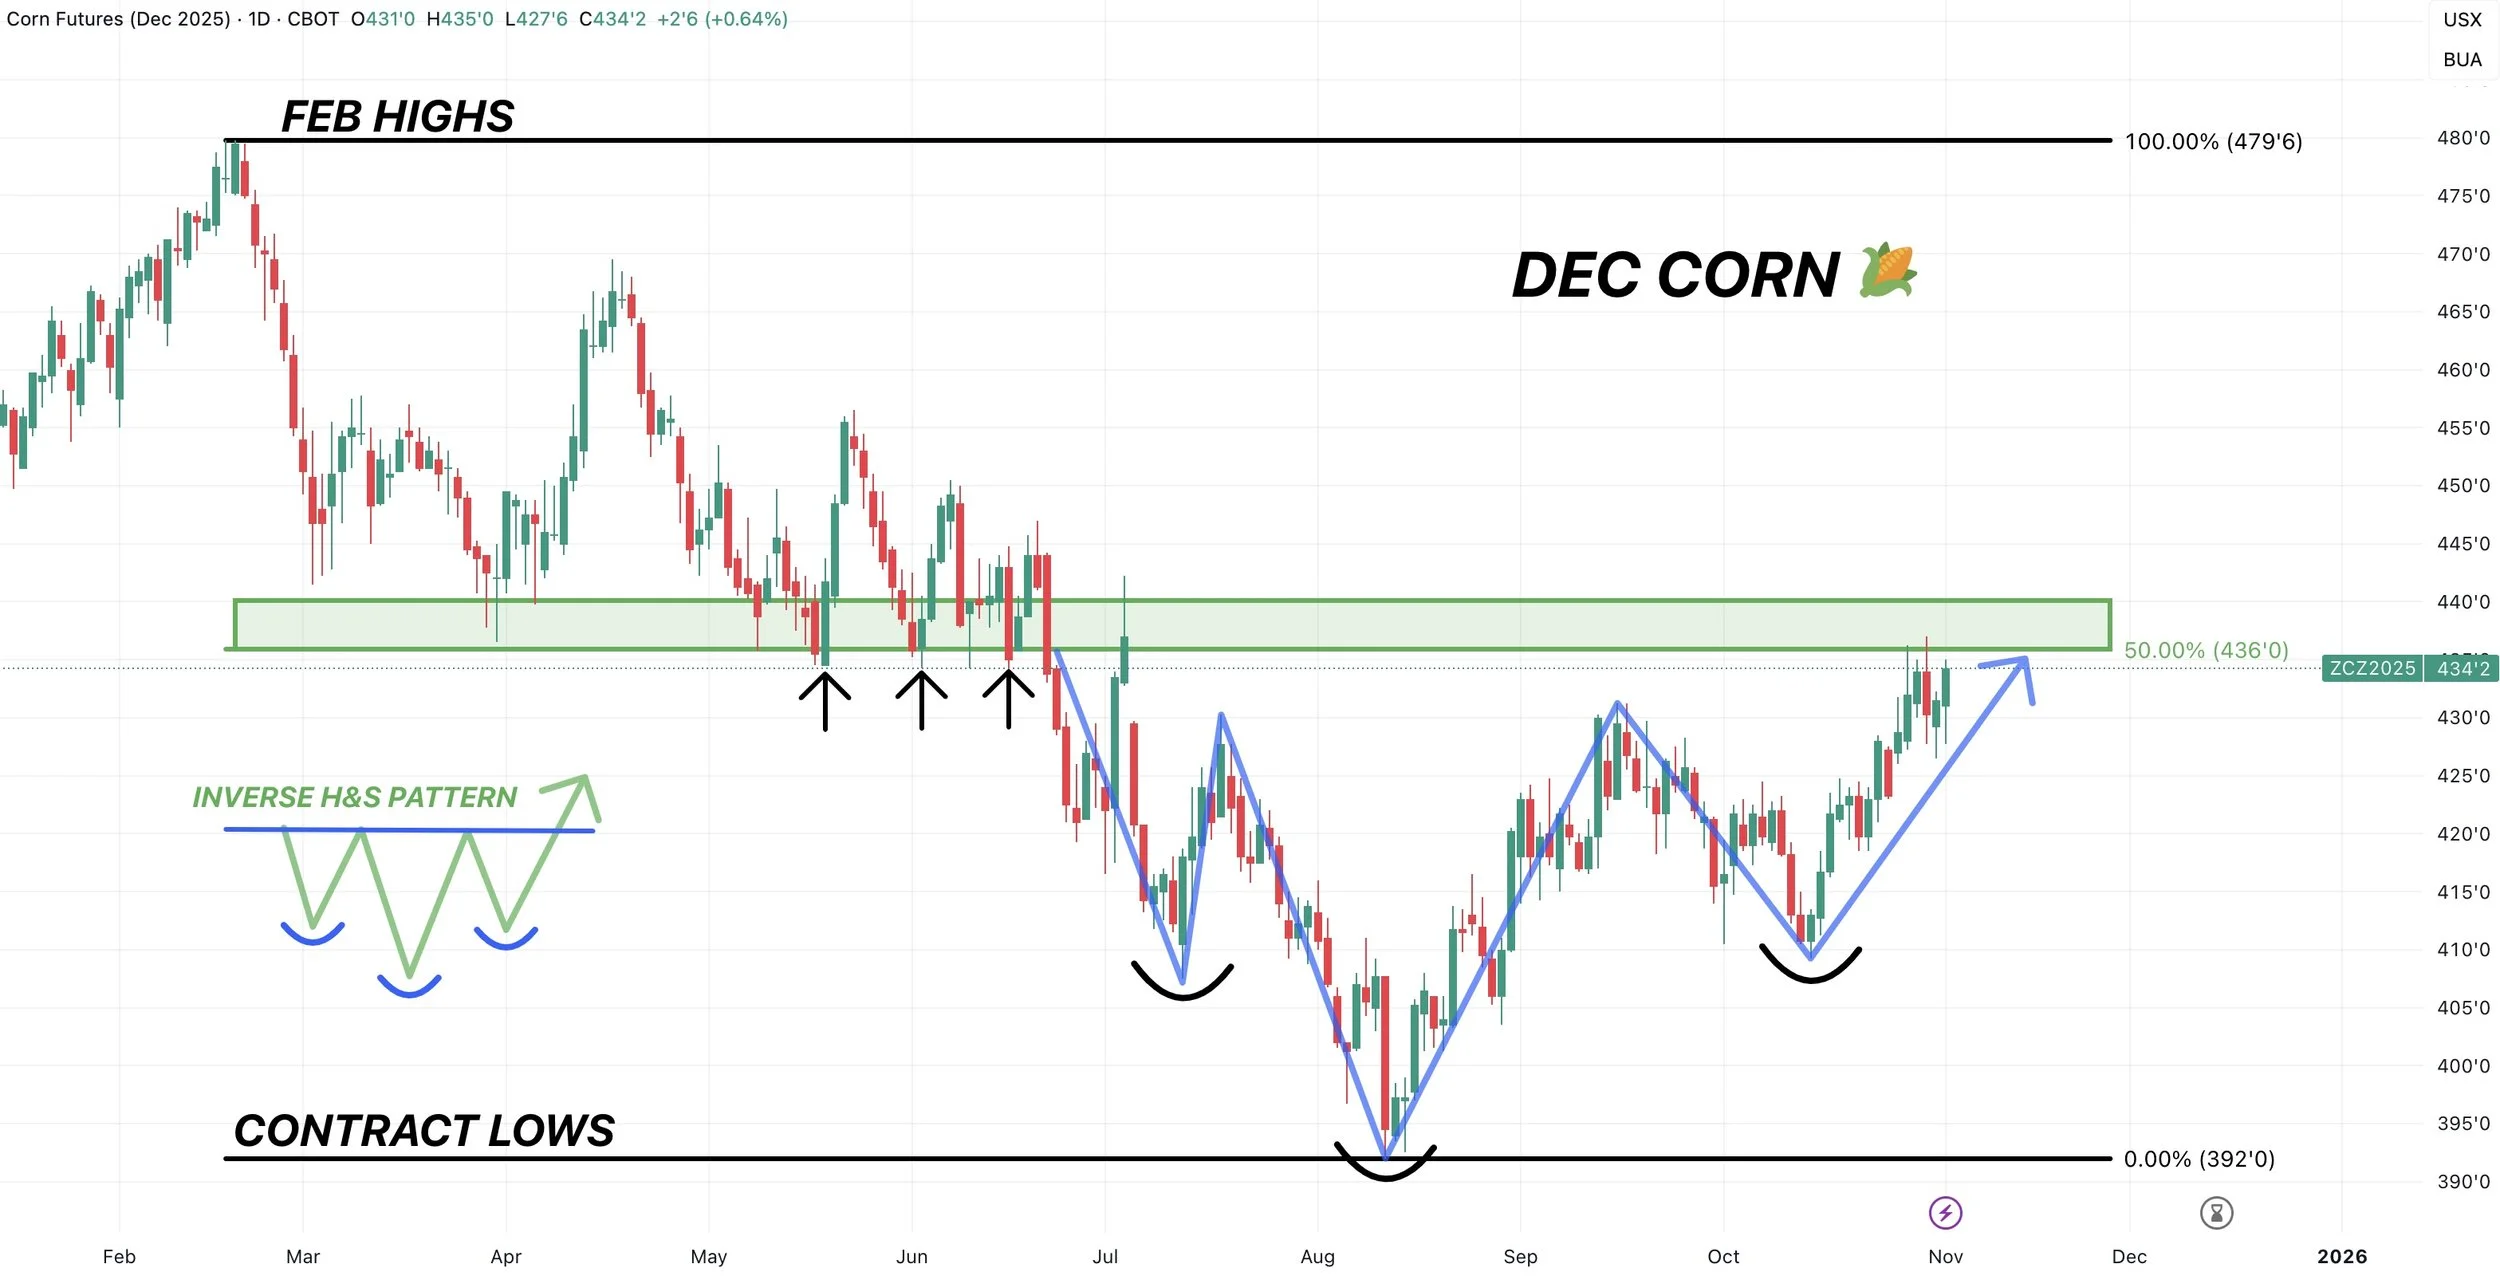
Dec Corn 🌽
Still battling this resistance box and our first target of $4.35-40.
Until we break above, it is viewed as resistance.
On the other hand, if we break above, it does open the door higher.
As we have a pretty clear text book inverse head & shoulders pattern as well.
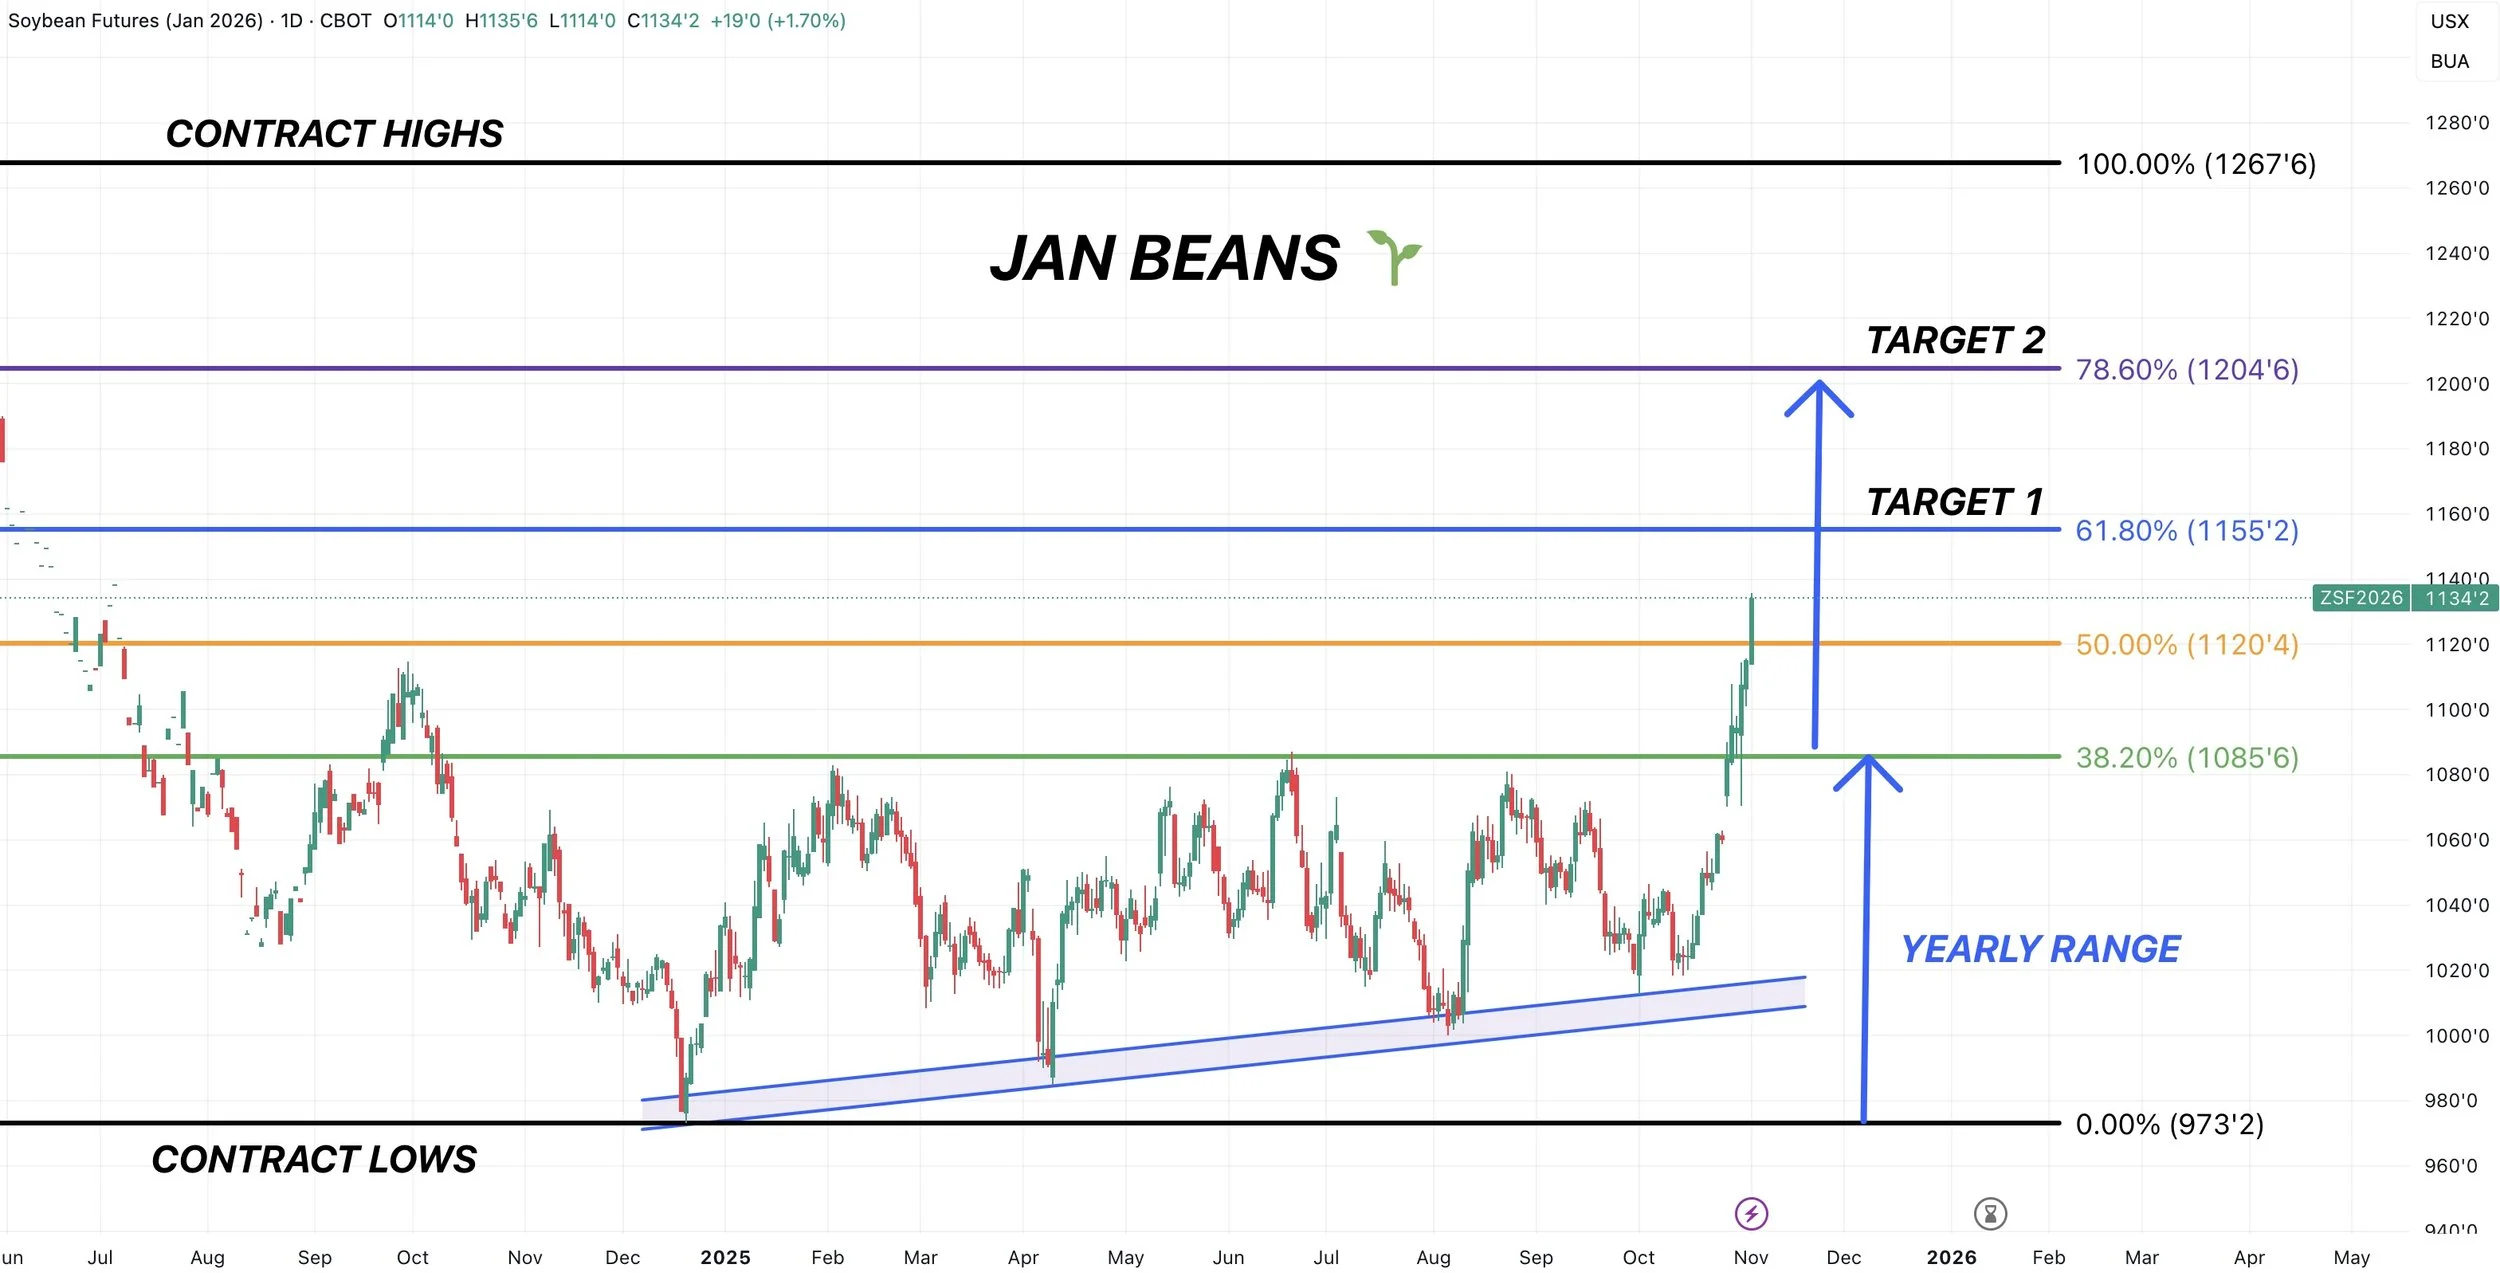
Jan Beans 🌱
Our first target is $11.55
That is the 61.8% retracement to the contract highs from the contract lows. We are above the 50% level, so the next level is the 61.8%.
Our summer highs topped out at the 38.2%.
Our second target is going to be right about at $12.00
That is the 78.6% retracement to the contract highs.
Not only that, but if you were to take the entire range we were trapped in all year, and then added that range to the point of breakout. It spits out $12.00 as well.
The monthly chart also suggests $12.00 as a possible target which we will talk about sometime this week in my video update.
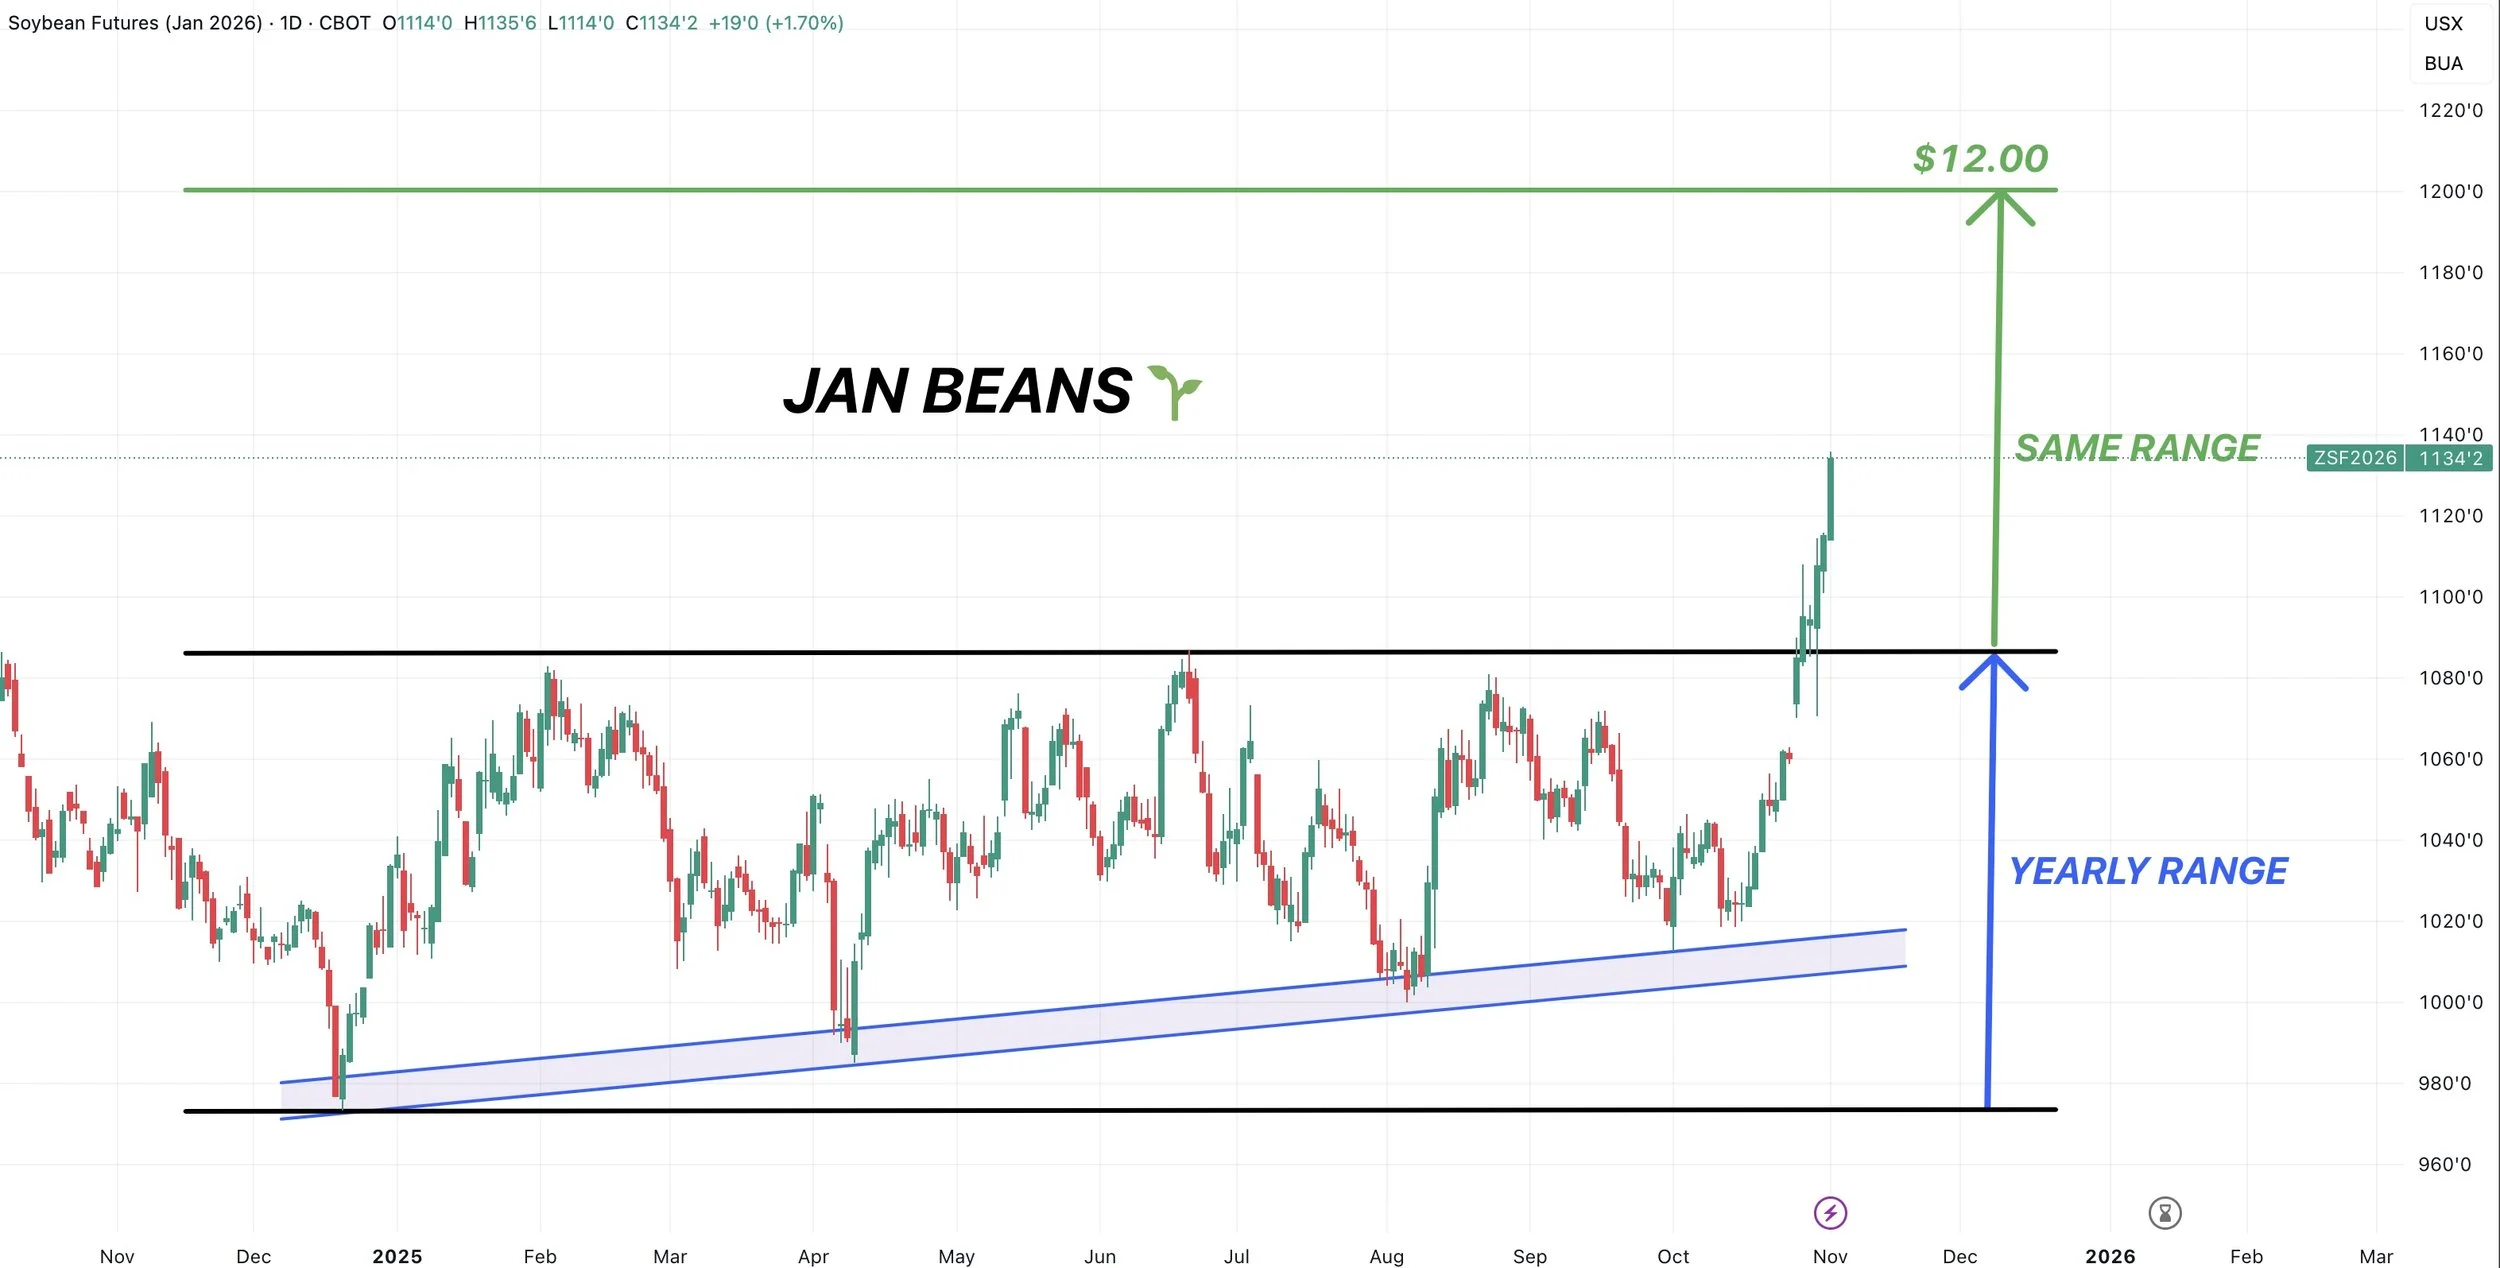
Here is a more simple visual of that range.
We were trapped in a $1.14 range for a year.
We broke out.
If you add $1.14 to the point of breakout, you get $12.00
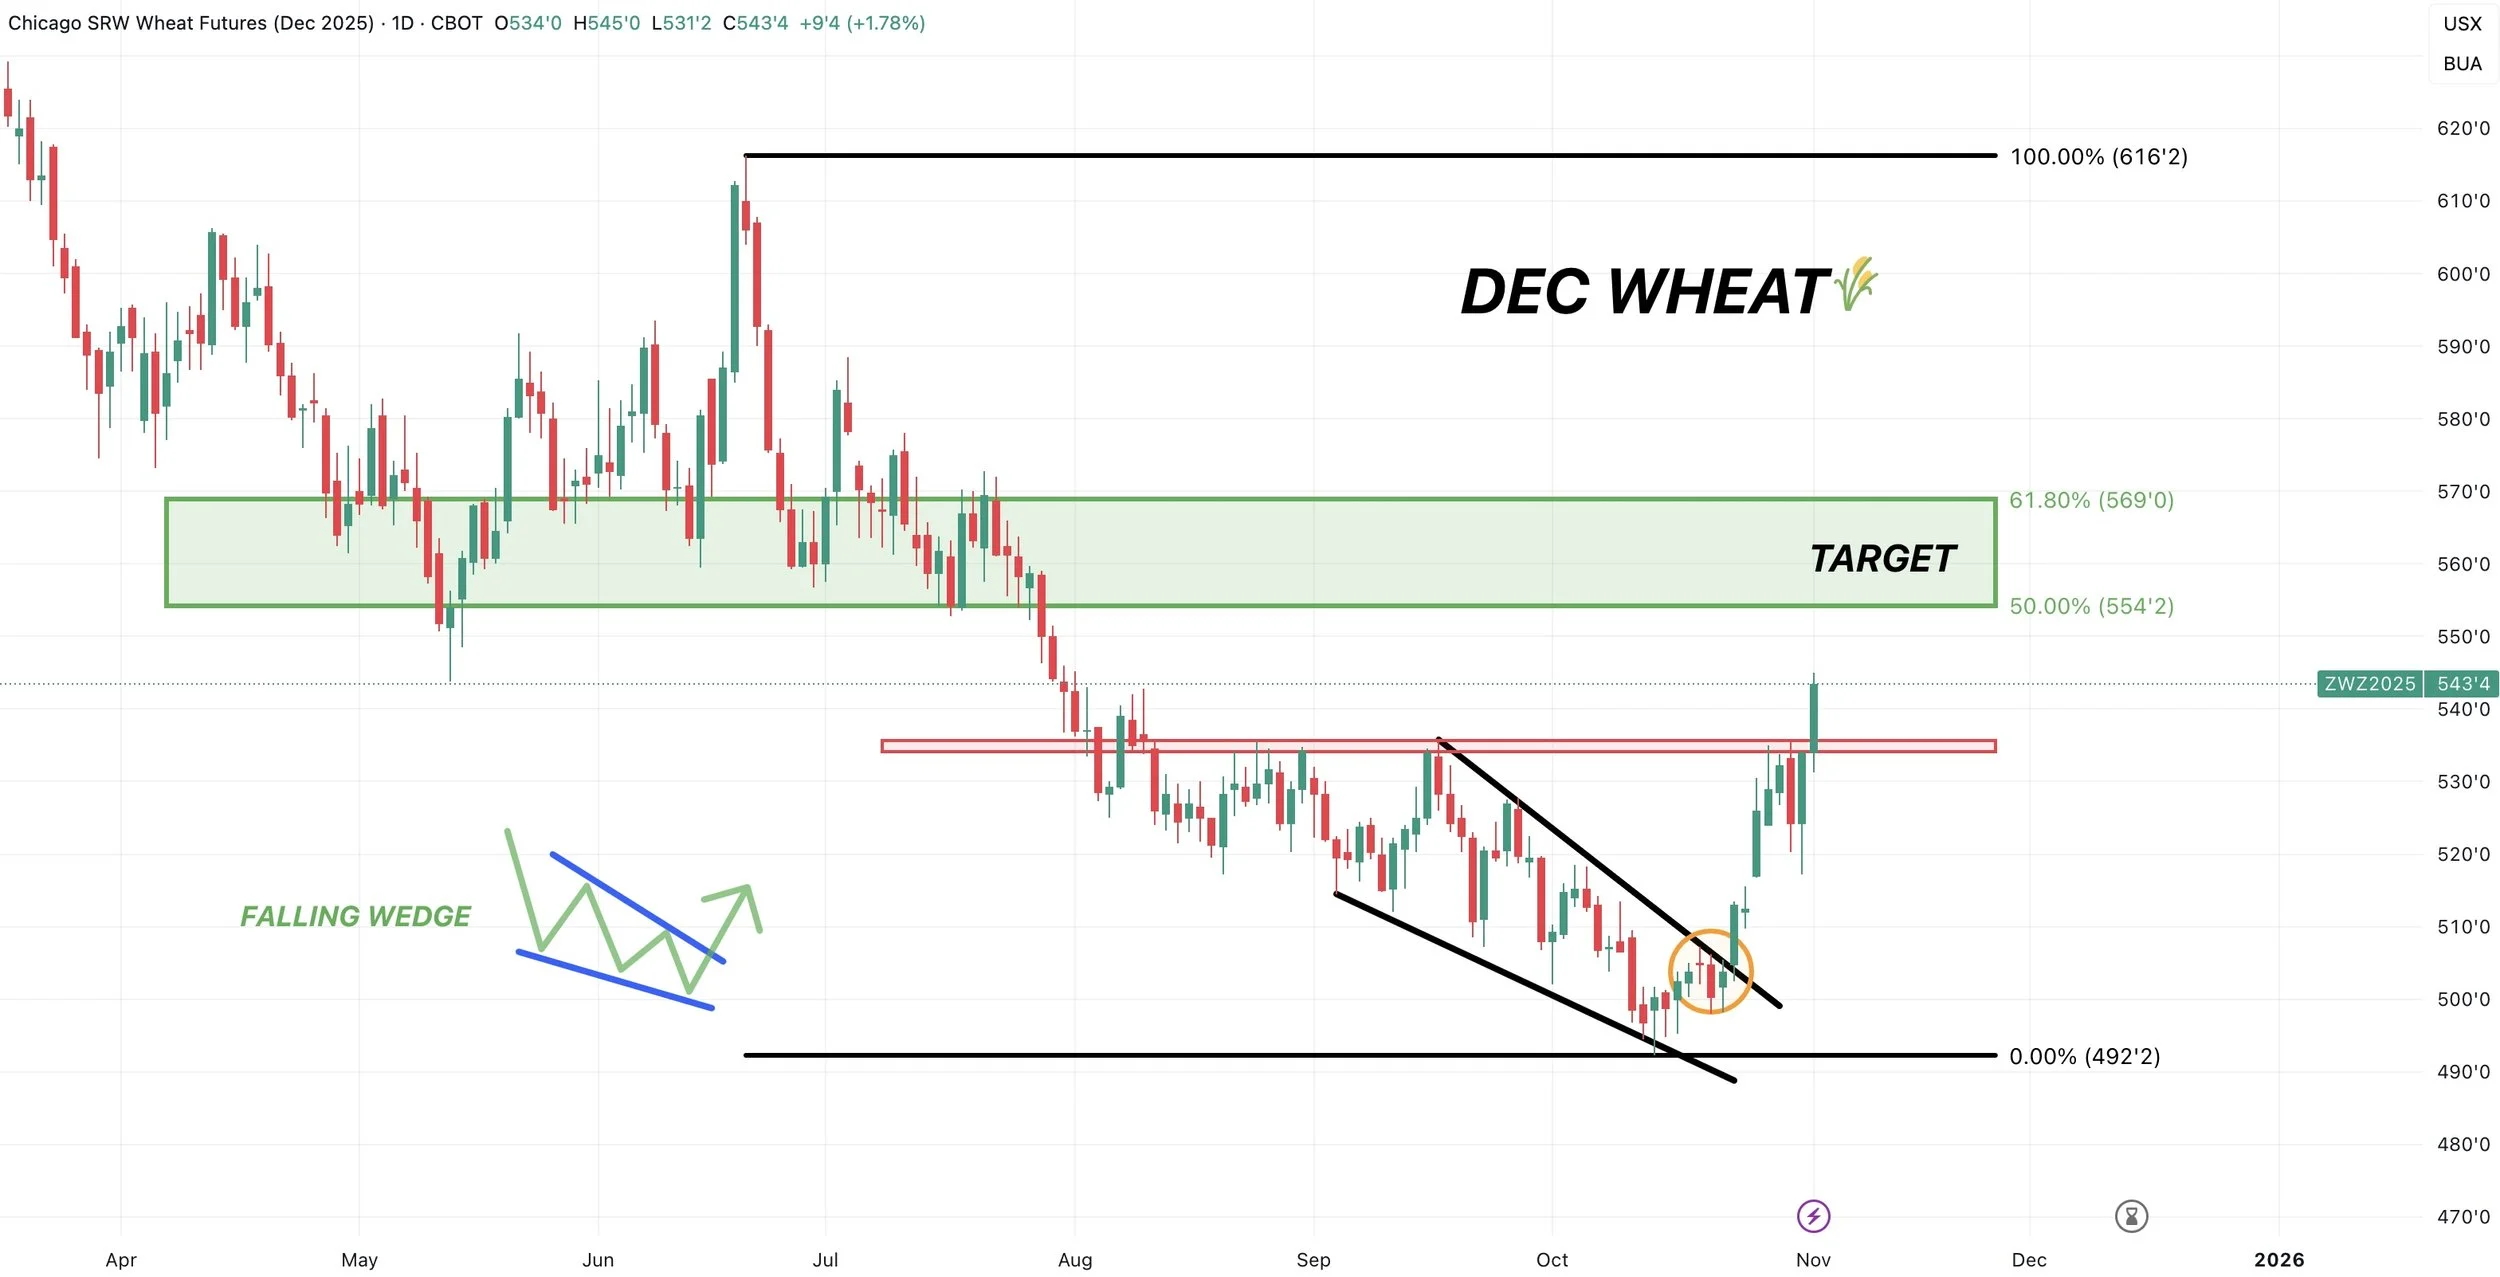
Dec Wheat 🌾
We got a clear breakout.
As we broke above those Sep highs.
Which should offer more potential upside towards that green box.
That green box is the golden zone. It claws back 50-61.8% of the June highs. The most common spot for prices to revert back to.
Past Sell or Protection Signals
Oct 28th: 🌽
Corn sell signal & hedge alert.
Oct 27th: 🌱
Soybean sell signal & hedge alert.
Oct 13th: 🐮
Cattle sell signal & hedge alert.
Aug 22nd: 🌱
Soybean sell signal & hedge alert.
July 31st: 🐮
Cattle sell signal & hedge alert.
July 10th: 🐮
Cattle sell signal & hedge alert.
CLICK HERE TO VIEW
June 5th: 🐮
Cattle sell signal & hedge alert.
June 2nd: 🌾
MPLS wheat sell signal.
April 10th: 🌽
Old crop corn sell signal.
March 19th: 🐮
Cattle hedge & sell signal.
Feb 18th: 🌽 🌾
Old crop KC wheat & old crop corn signal.
Jan 23rd: 🌽 🌱
Corn & beans old crop sell signal.
CLICK HERE TO VIEW
Jan 15th: 🌽 🌱
Corn & beans hedge alert/sell signal.
Jan 2nd: 🐮
Cattle hedge alert at new all-time highs & target.
Dec 11th: 🌽
Corn sell signal at $4.51 200-day MA
CLICK HERE TO VIEW
Oct 2nd: 🌾
Wheat sell signal at $6.12 target
Sep 30th: 🌽
Corn protection signal at $4.23-26
Sep 27th: 🌱
Soybean sell & protection signal at $10.65
Sep 13th: 🌾
Wheat sell signal at $5.98
May 22nd: 🌾
Wheat sell signal when wheat traded +$7.00
Want to Talk?
Our phones are open 24/7 for you guys if you ever need anything or want to discuss your operation.
Hedge Account
Interested in a hedge account? Use the link below to set up an account or shoot Jeremey a call at (605)295-3100.