
CORN AT BIG SPOT. BEANS BOUNCING. NEXT TARGETS & MORE
VIDEO CHART UPDATE
You can scroll to read the usual update as well. As the written version is the exact same as the video. The video may be easier to follow along with the charts.
Timestamps for video:
Beans: 0:40min
Corn: 5:20min
Cattle: 7:45min
Wheat: 8:30min
Want to talk about your situation?
(605)250-3863
Overview
Today, we are only going to be going over the charts and some things we're watching as there is very little fresh fundamental news with the holidays.
Soybeans are seeing a nice bounce right at those downside targets. Corn is up against some pretty key resistance bulls would like to break. The wheat market is starting to look a little more optimistic. Cattle is still consolidating at our upside targets.
The usual full video updates will resume next week. Where we'll look at seasonals and do some fundamental digging.
Here are the chart breakdowns:
Soybeans
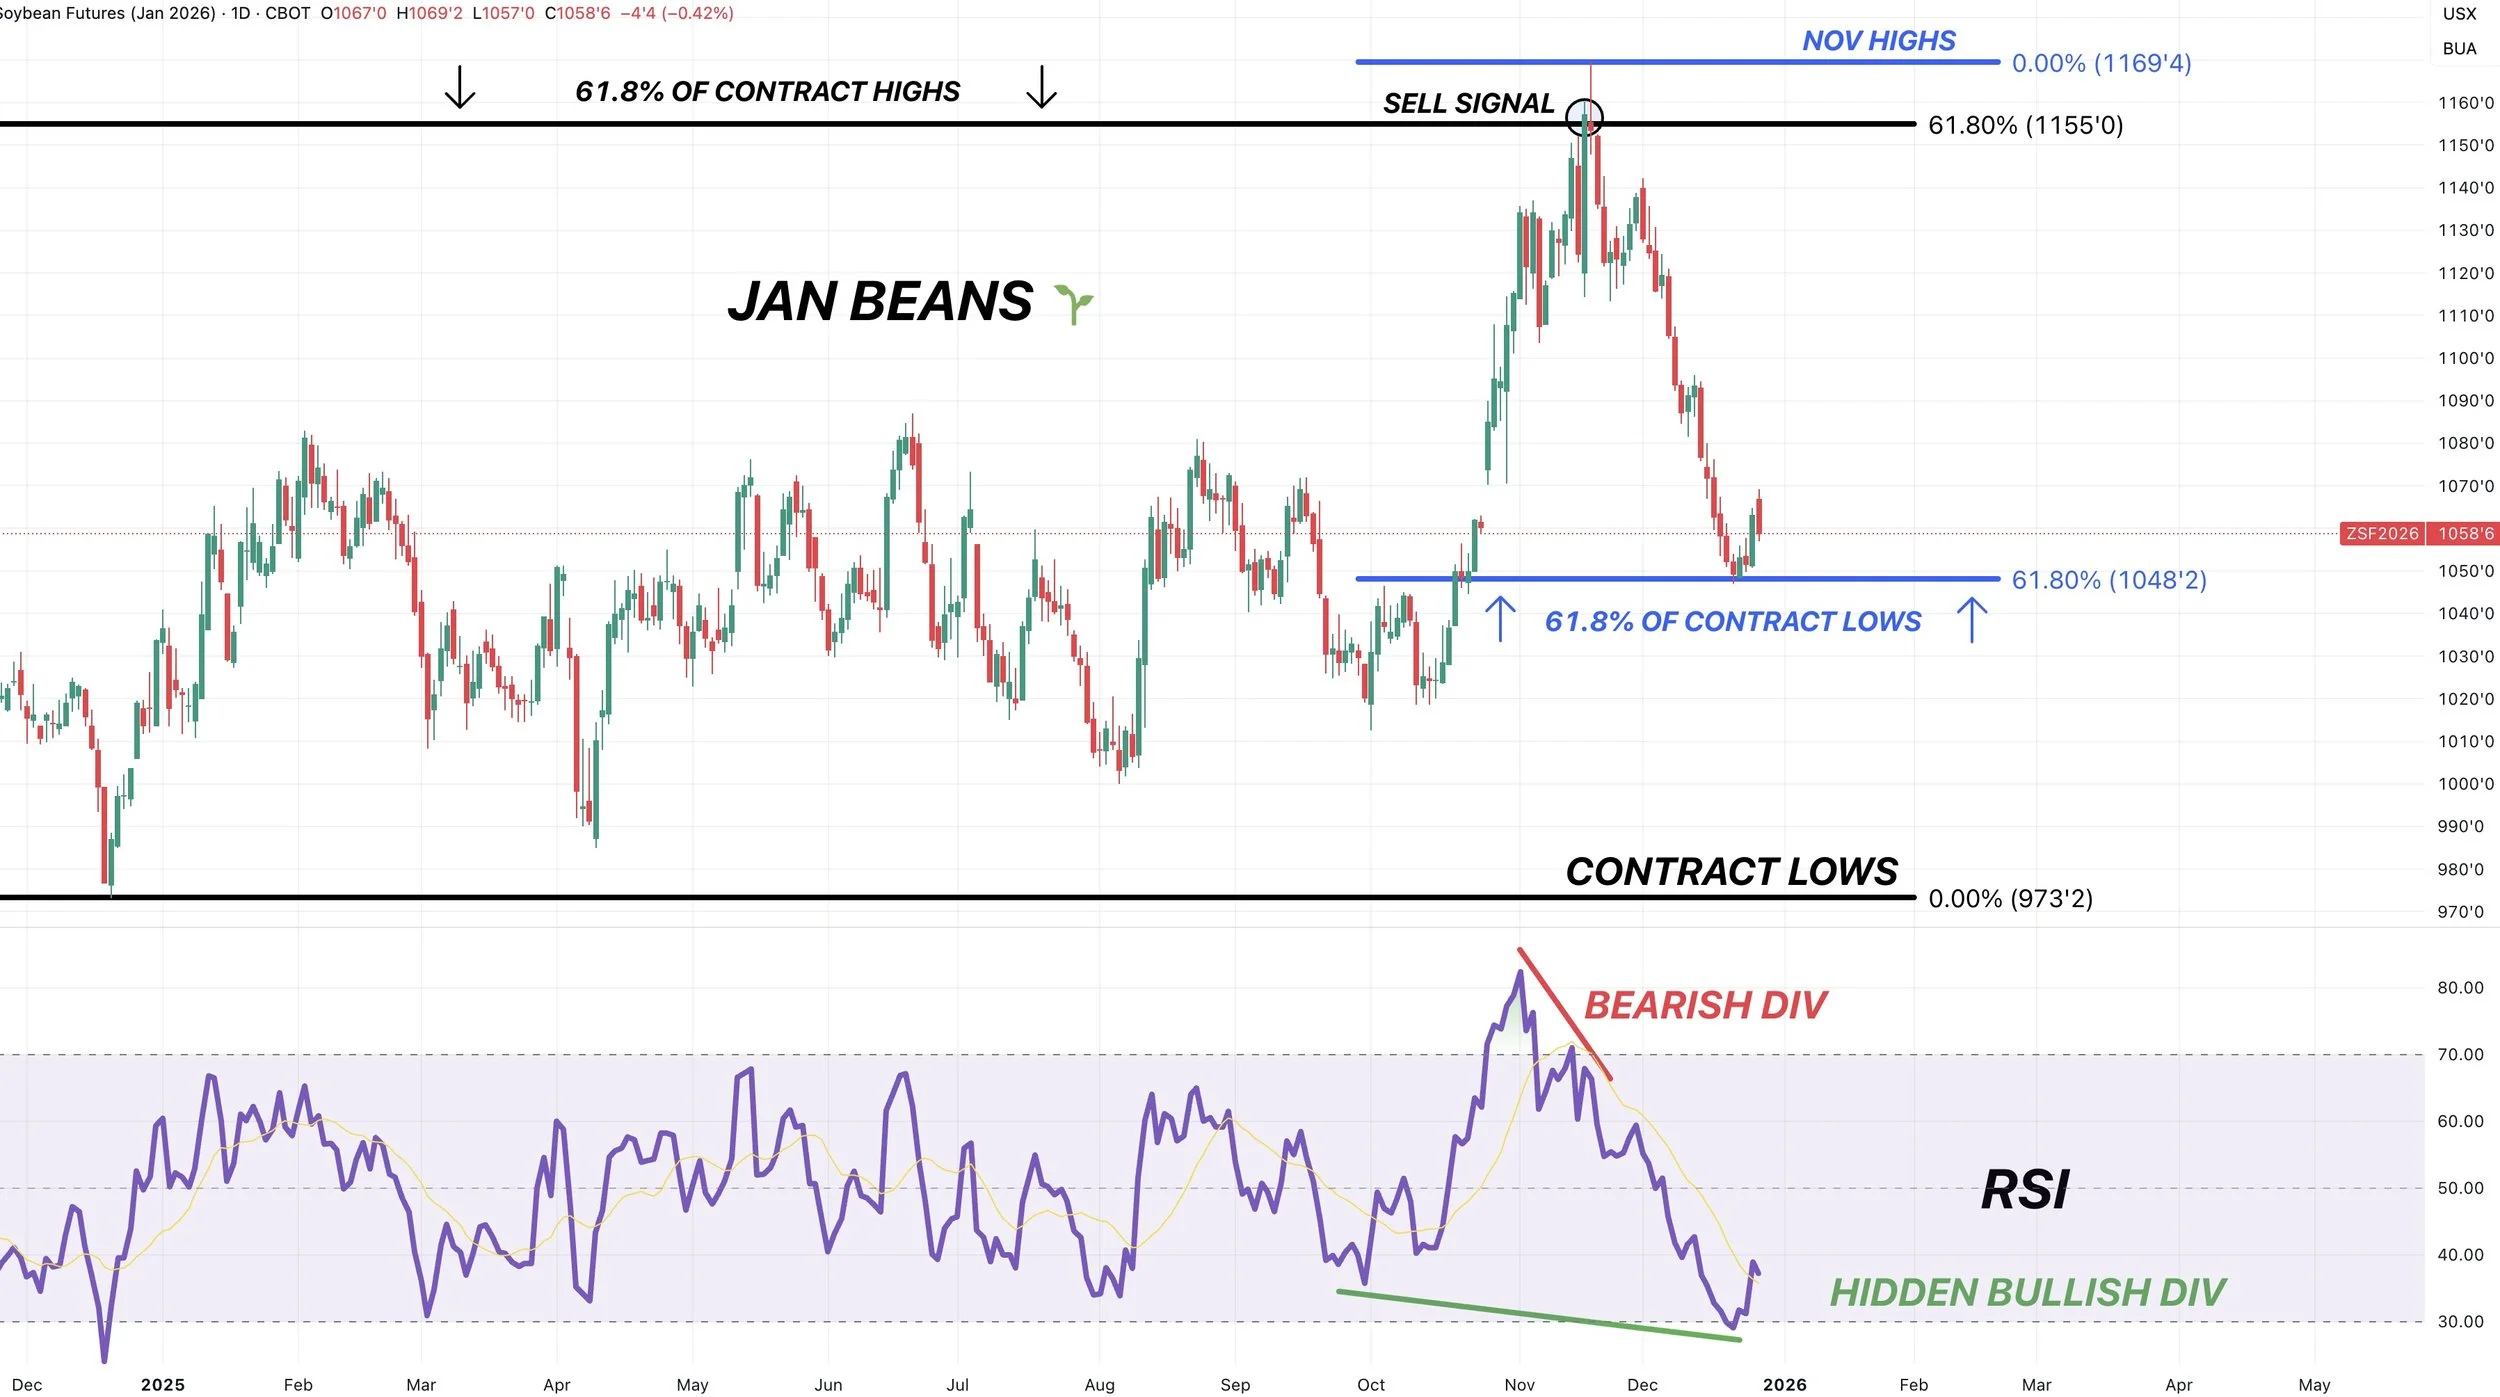
Jan Beans
We are going to start off with soybeans, as we alerted that buy zone alert late last week.
If you missed it, check out last week's video where we went over the methodology behind it.
Click Here to View
So far, we have perfectly bounced off those downside targets we sent out in both Jan and March beans.
We will be switching over to March as the main focus, but I wanted to include Jan beans because they were a large reason for that buy alert.
On Nov 17th we issued that sell signal. Which was because we simply reclaimed 61.8% of the contract highs and were showing bearish divergence.
Late last week, we gave back 61.8% of the contract lows off those Nov highs, and were showing hidden bullish divergence. So we alerted the buy signal at $10.48
It's still too early to say that we found a bottom, but so far we've seen a great reaction off that level.
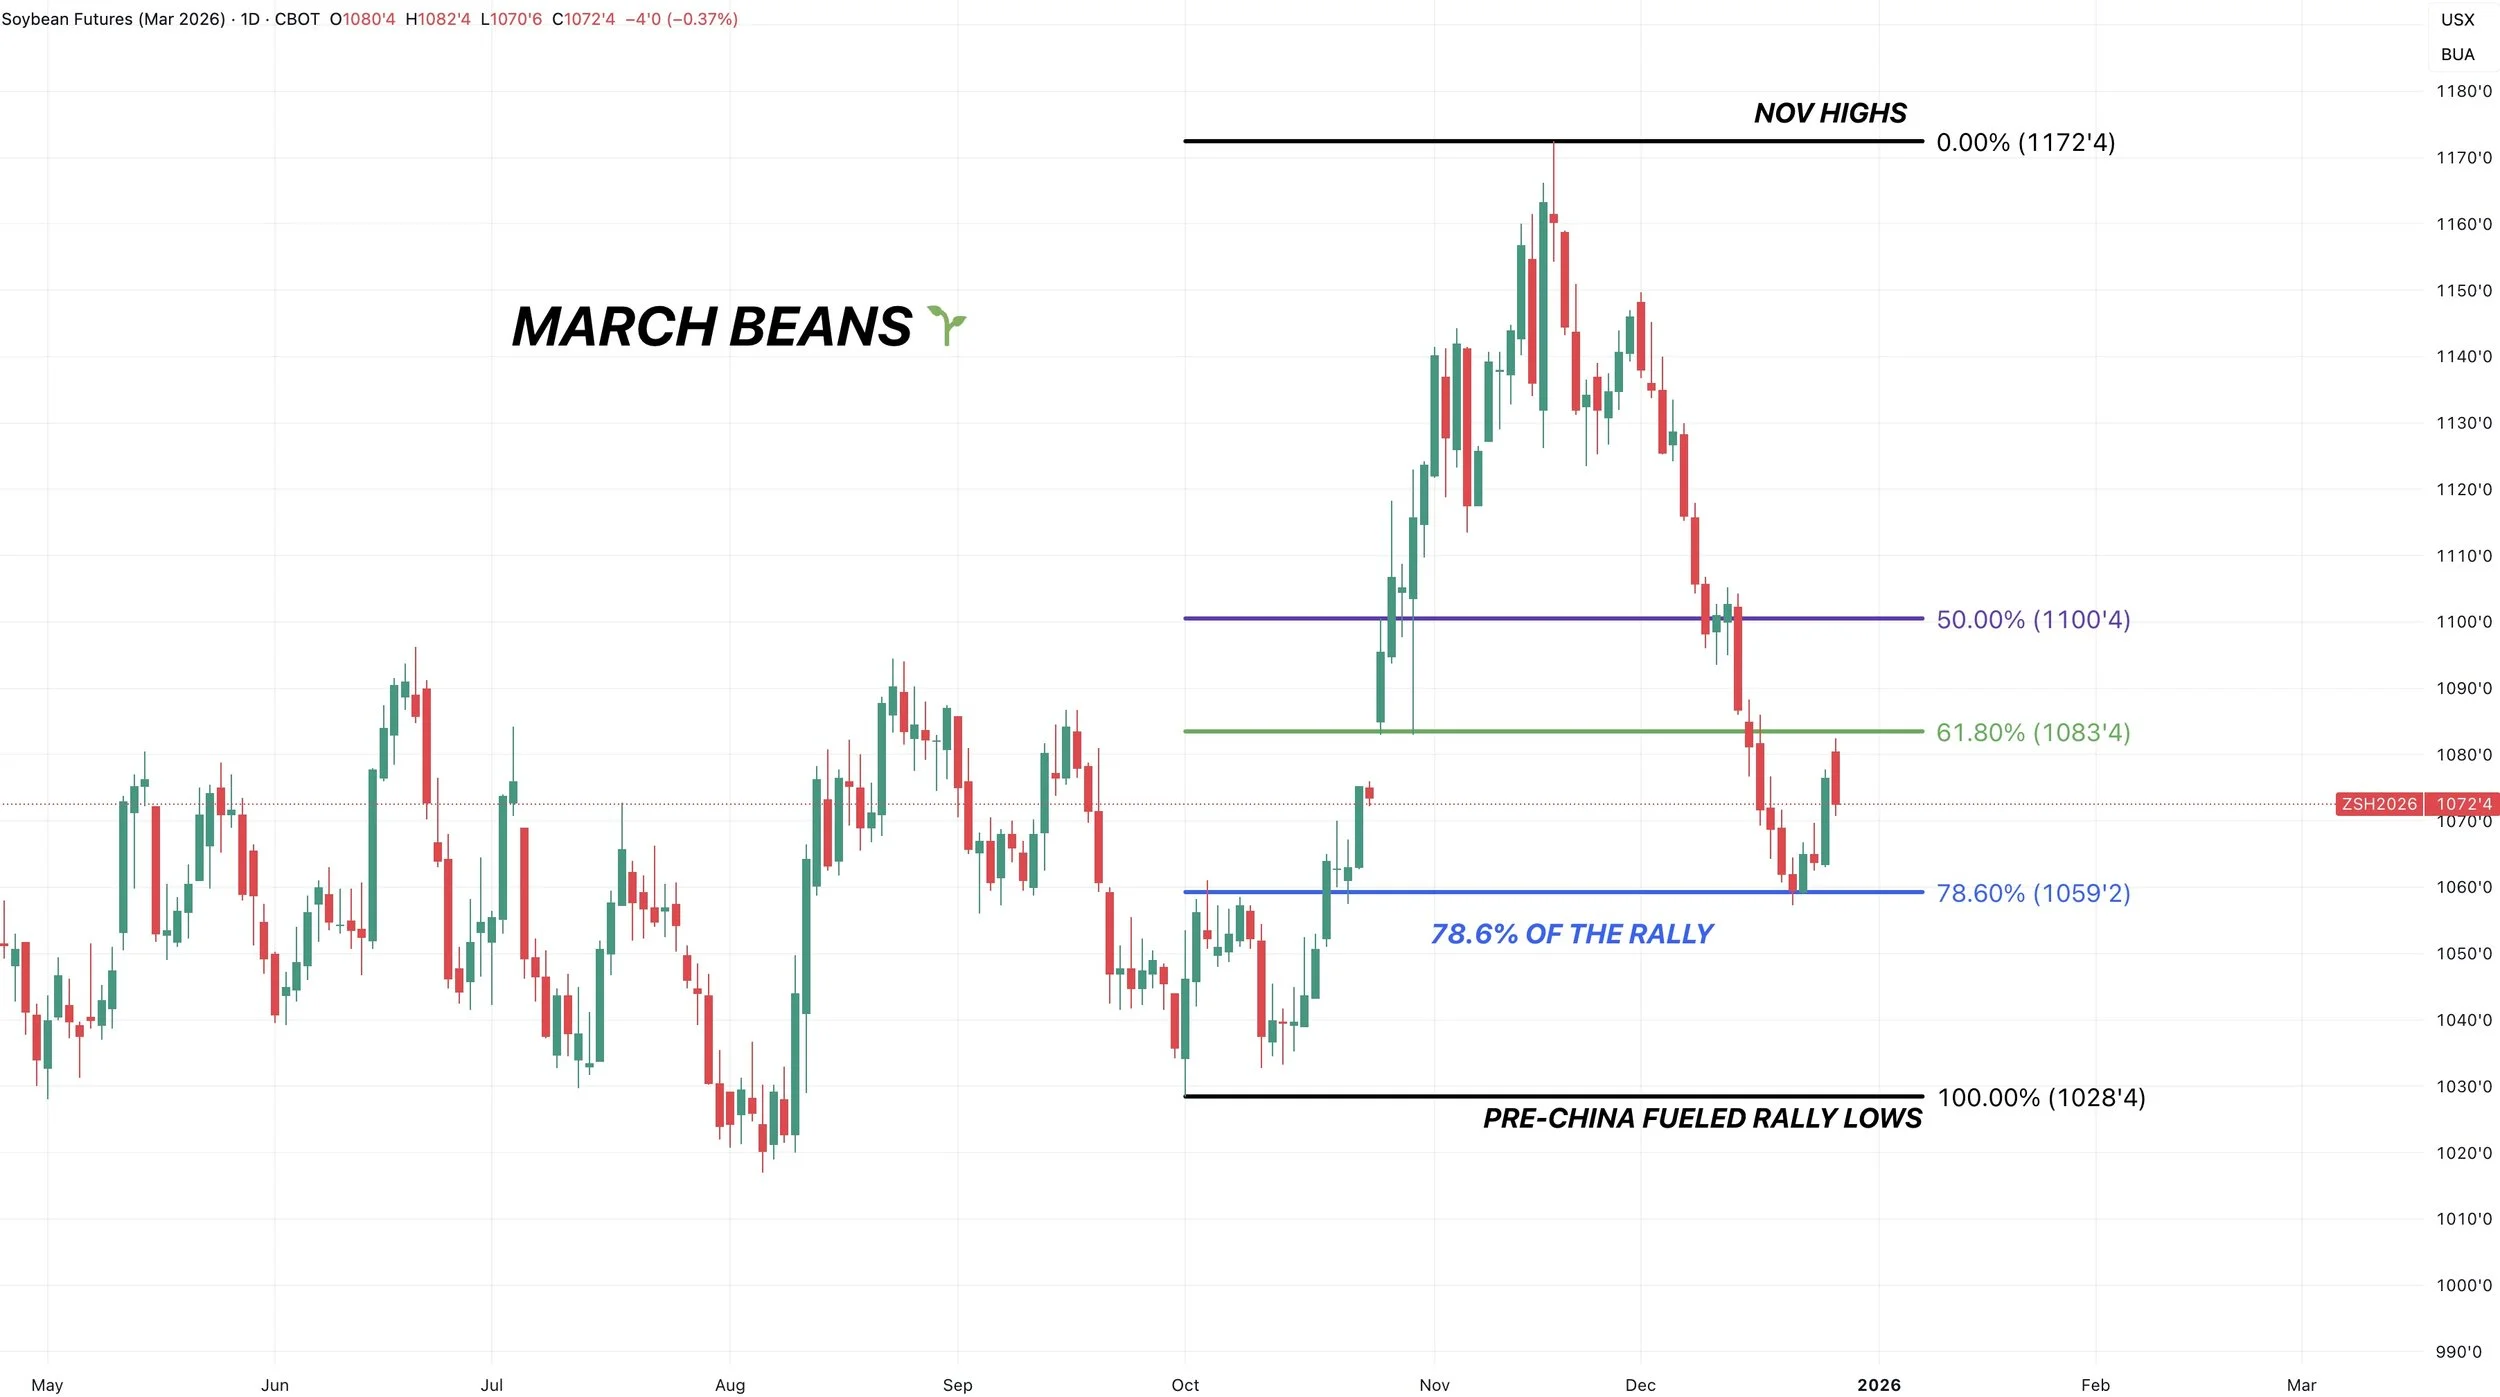
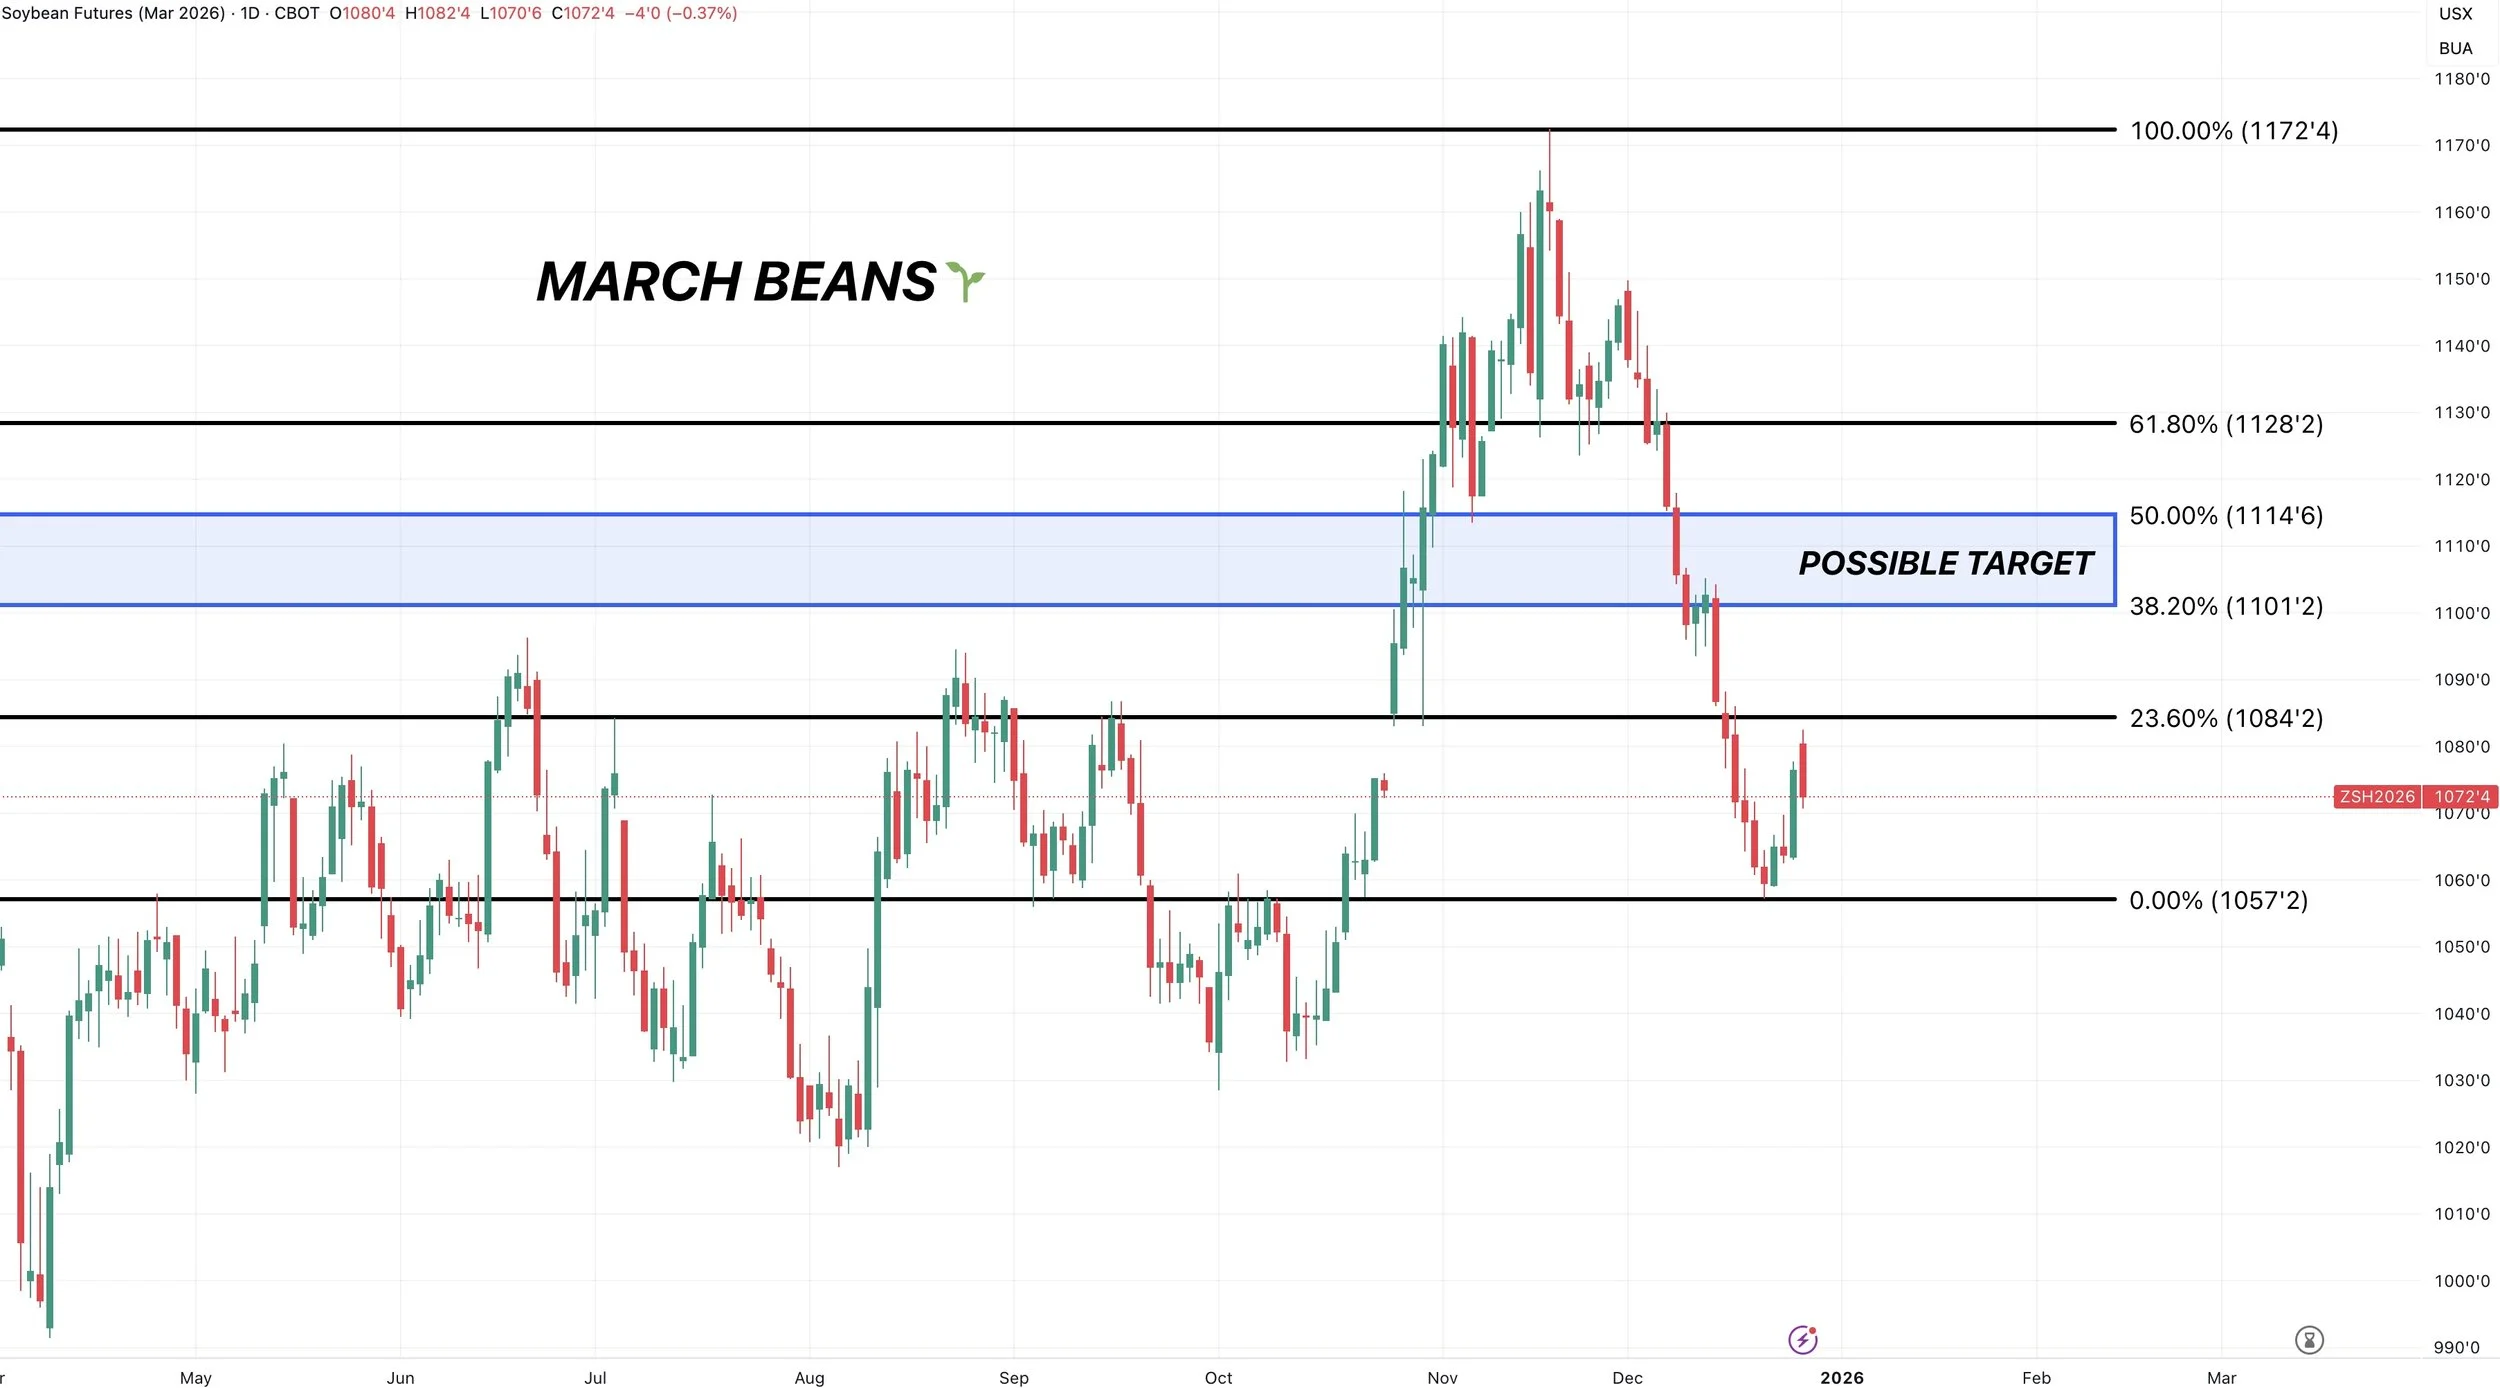
March Beans
Jumping over to March.
That buy signal came at $10.59
We broke the 61.8% level of the entire China fueld falled. The next level was the 78.6% level at $10.59
When you pair it with Jan beans approaching the 61.8% level down to contract lows, it was enough to trigger a buy signal and take profits off the shorts.
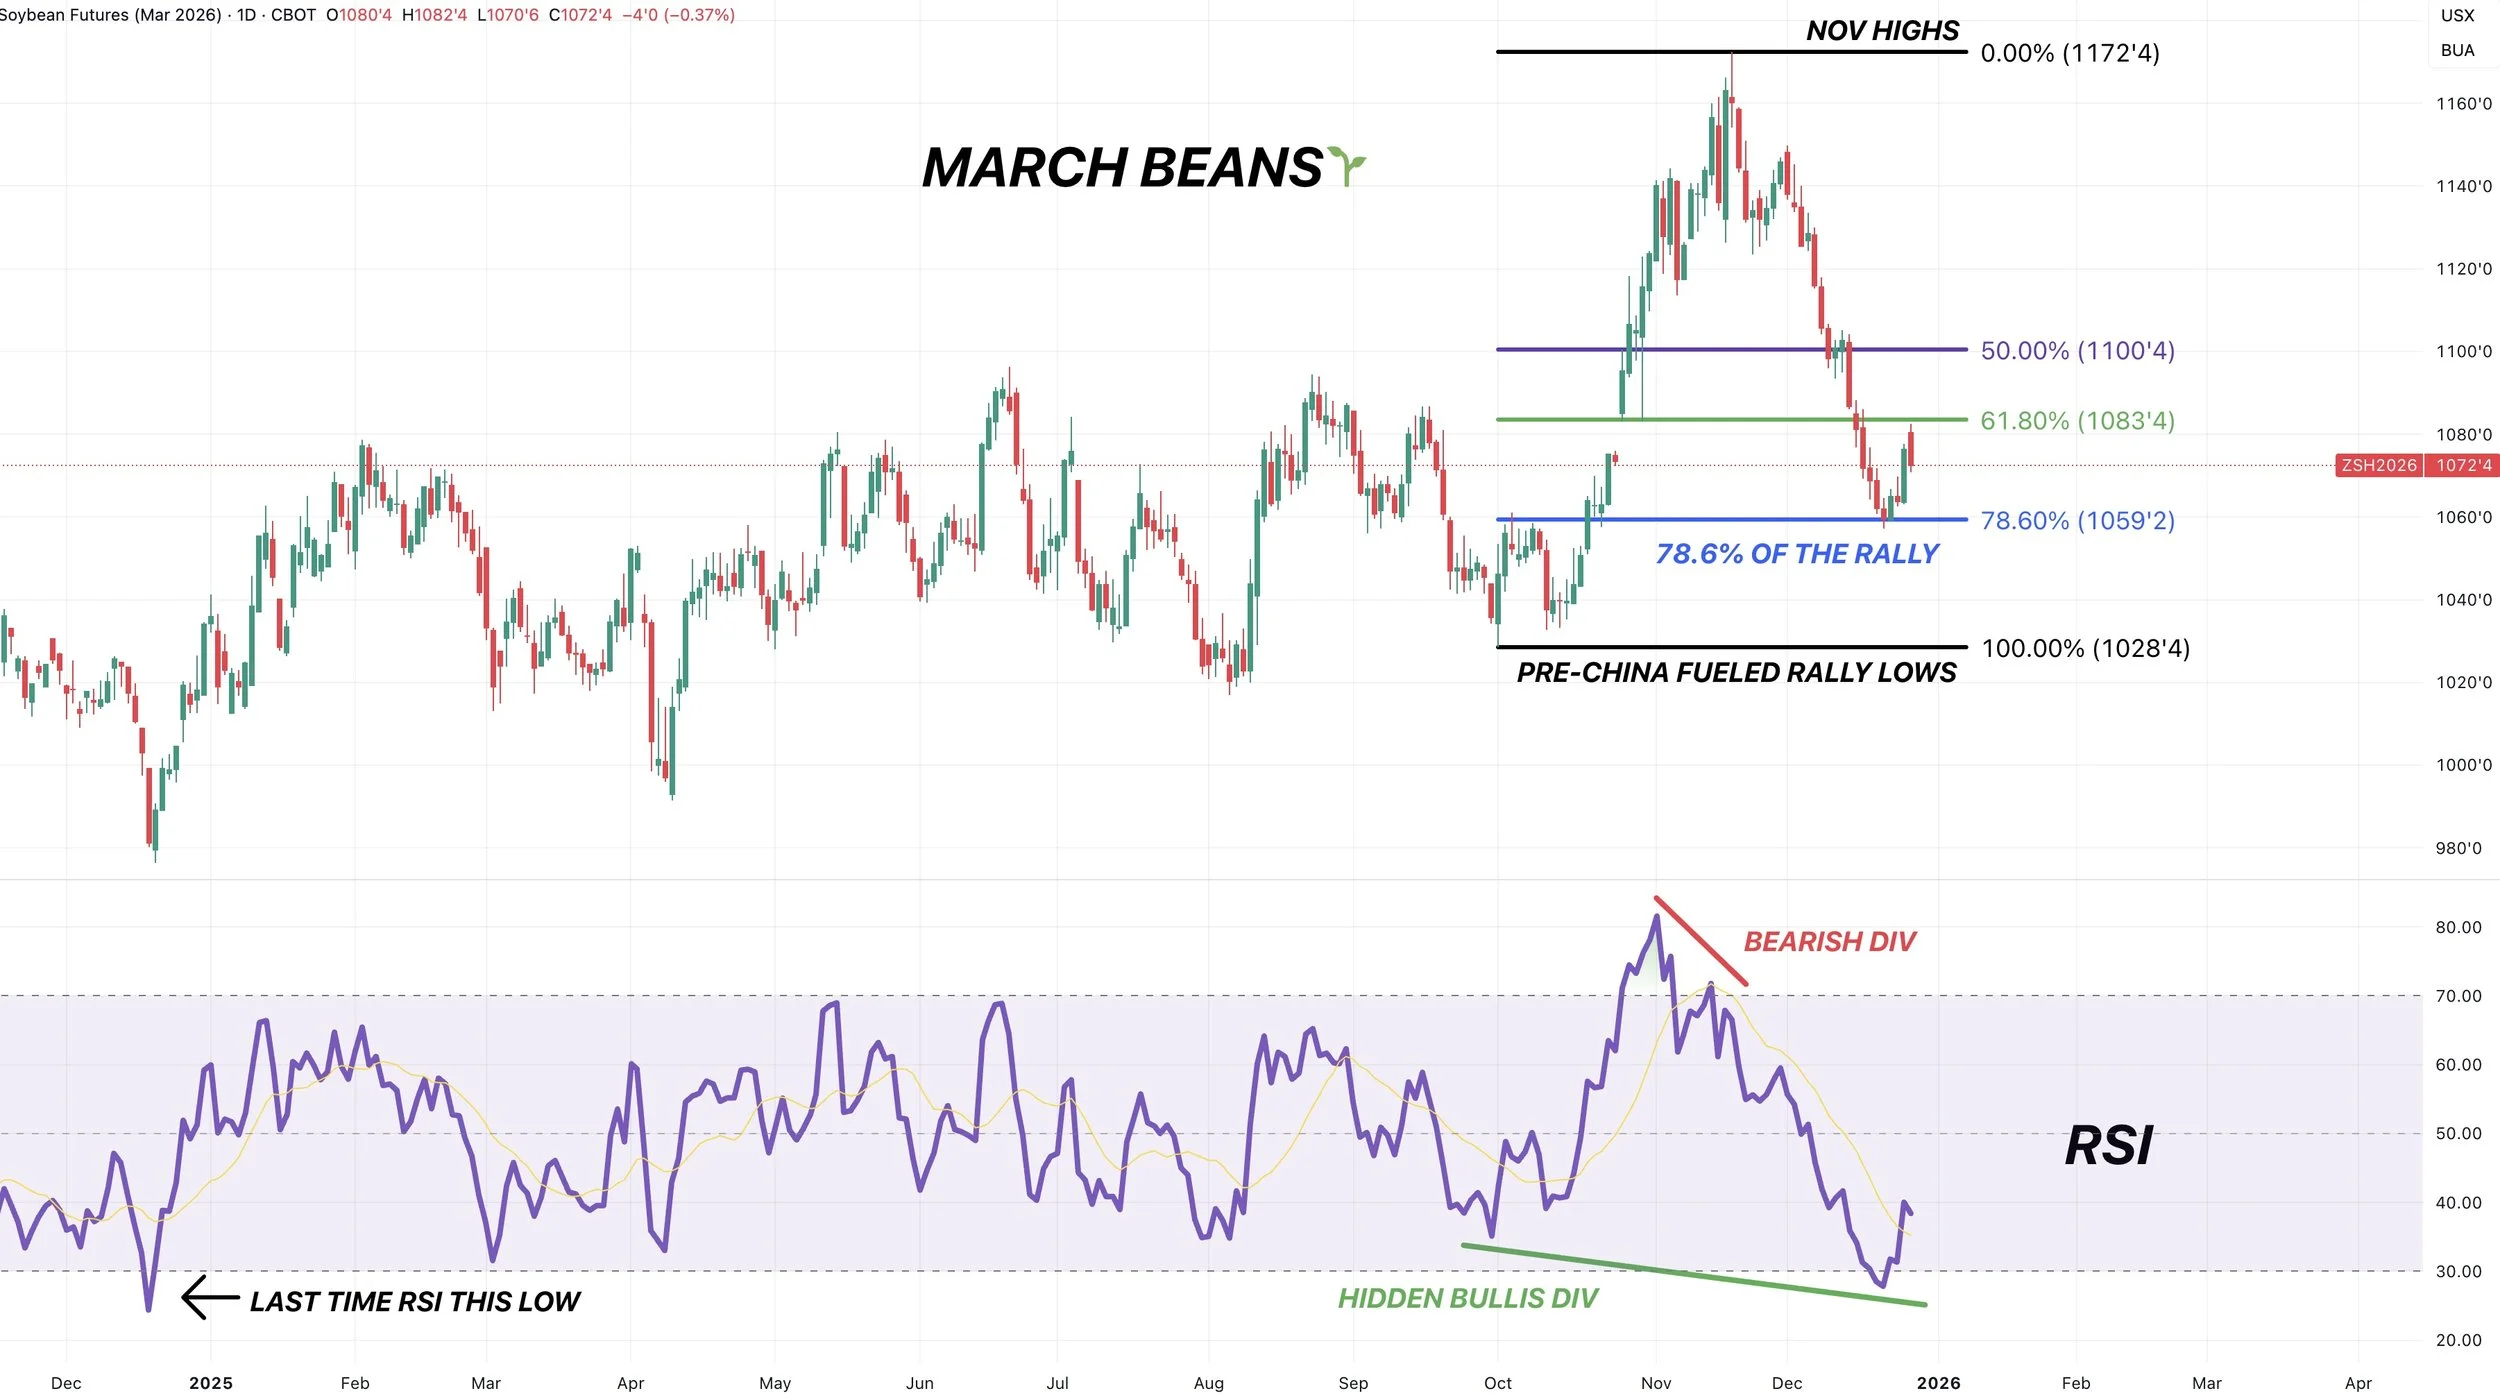
We were also the most oversold we've been in over a year.
At the same time, we were showing hidden bullish divergence here as well.
The RSI was very oversold, yet prices were much higher than the last time it was this oversold.
This doesn’t mean prices "have" to rally. It simply told us downside momentum might be getting weak.
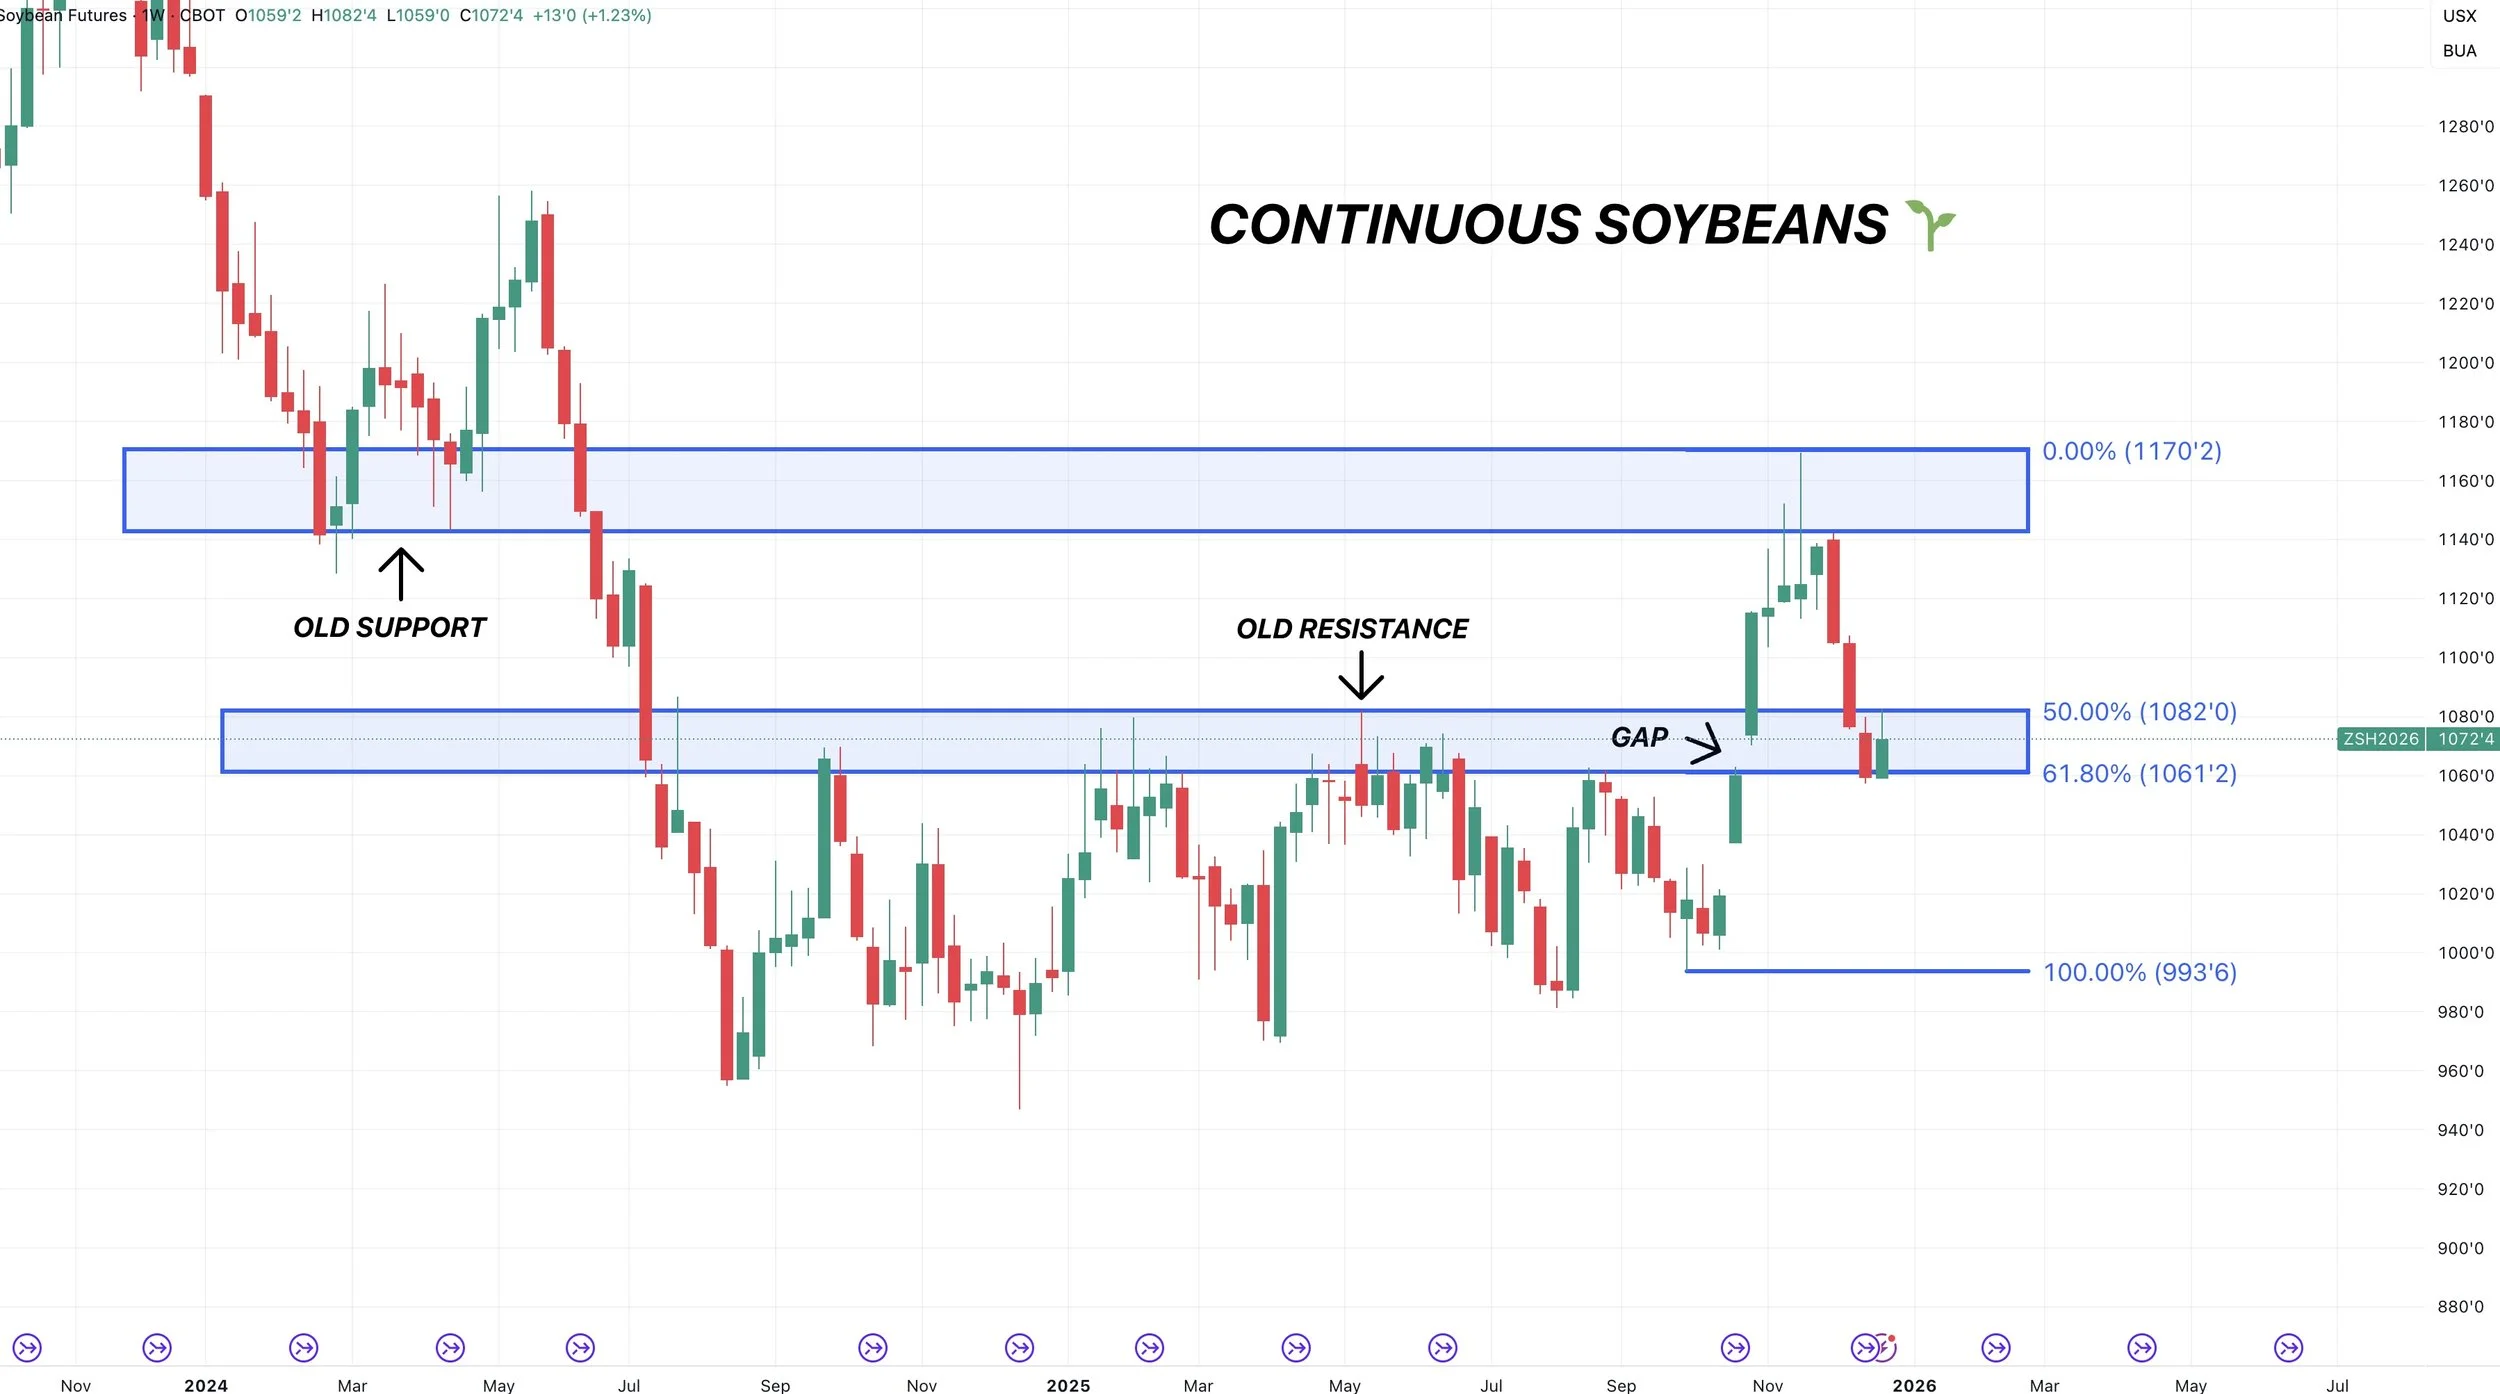
Continuous Weekly Chart
This is the continuous chart and shows the contract with the most volume.
We had a clear area of resistance all year long.
We got the break out in October.
We've now came down and tested that point of break out. Often times, old resistance becomes new support and vice versa.
A perfect example of this would be the highs we just posted. We happened to fail right at those old support levels from 2024.
At the same time, this chart had a gap left open.
Last week we filled that gap, which perfectly lined up with the old resistance. Along with the 61.8% retracement level down to the Sep lows.
So finding life here makes sense.
March Beans Target:
Well, now how high can we go?
Since this correction was so deep, it appears unlikely that this market is going to go and post new highs. If it did, I think it would take a larger outside factor. Such as an issue in Brazil or China buying more beans than the market has currently priced in. But for now, neither of those seem all that likely.
So if we found our local bottom here, we are going to want to be looking to reward this relief bounce.
The golden zone is the 50-61.8% levels. However, I have my doubts that this market has enough steam to get that high given the size of the sell off.
So I am looking to de-risk in the $11.00 to $11.15 area as of now, but is of course subject to change as the chart develops.
That level claws back 38.2% to 50% of the entire sell off.
Past Relief Bounces
Like we talked about last week.
When a market posts a major high, often times it will give some sort of relief bounce. Not every time, but a lot times.
It's typically not just a straight sell off that goes to zero.
This is because the most common correction pattern is markets is called an ABC correction.
You get the intial A wave down. The B wave relief bounce. Then the last C wave down.
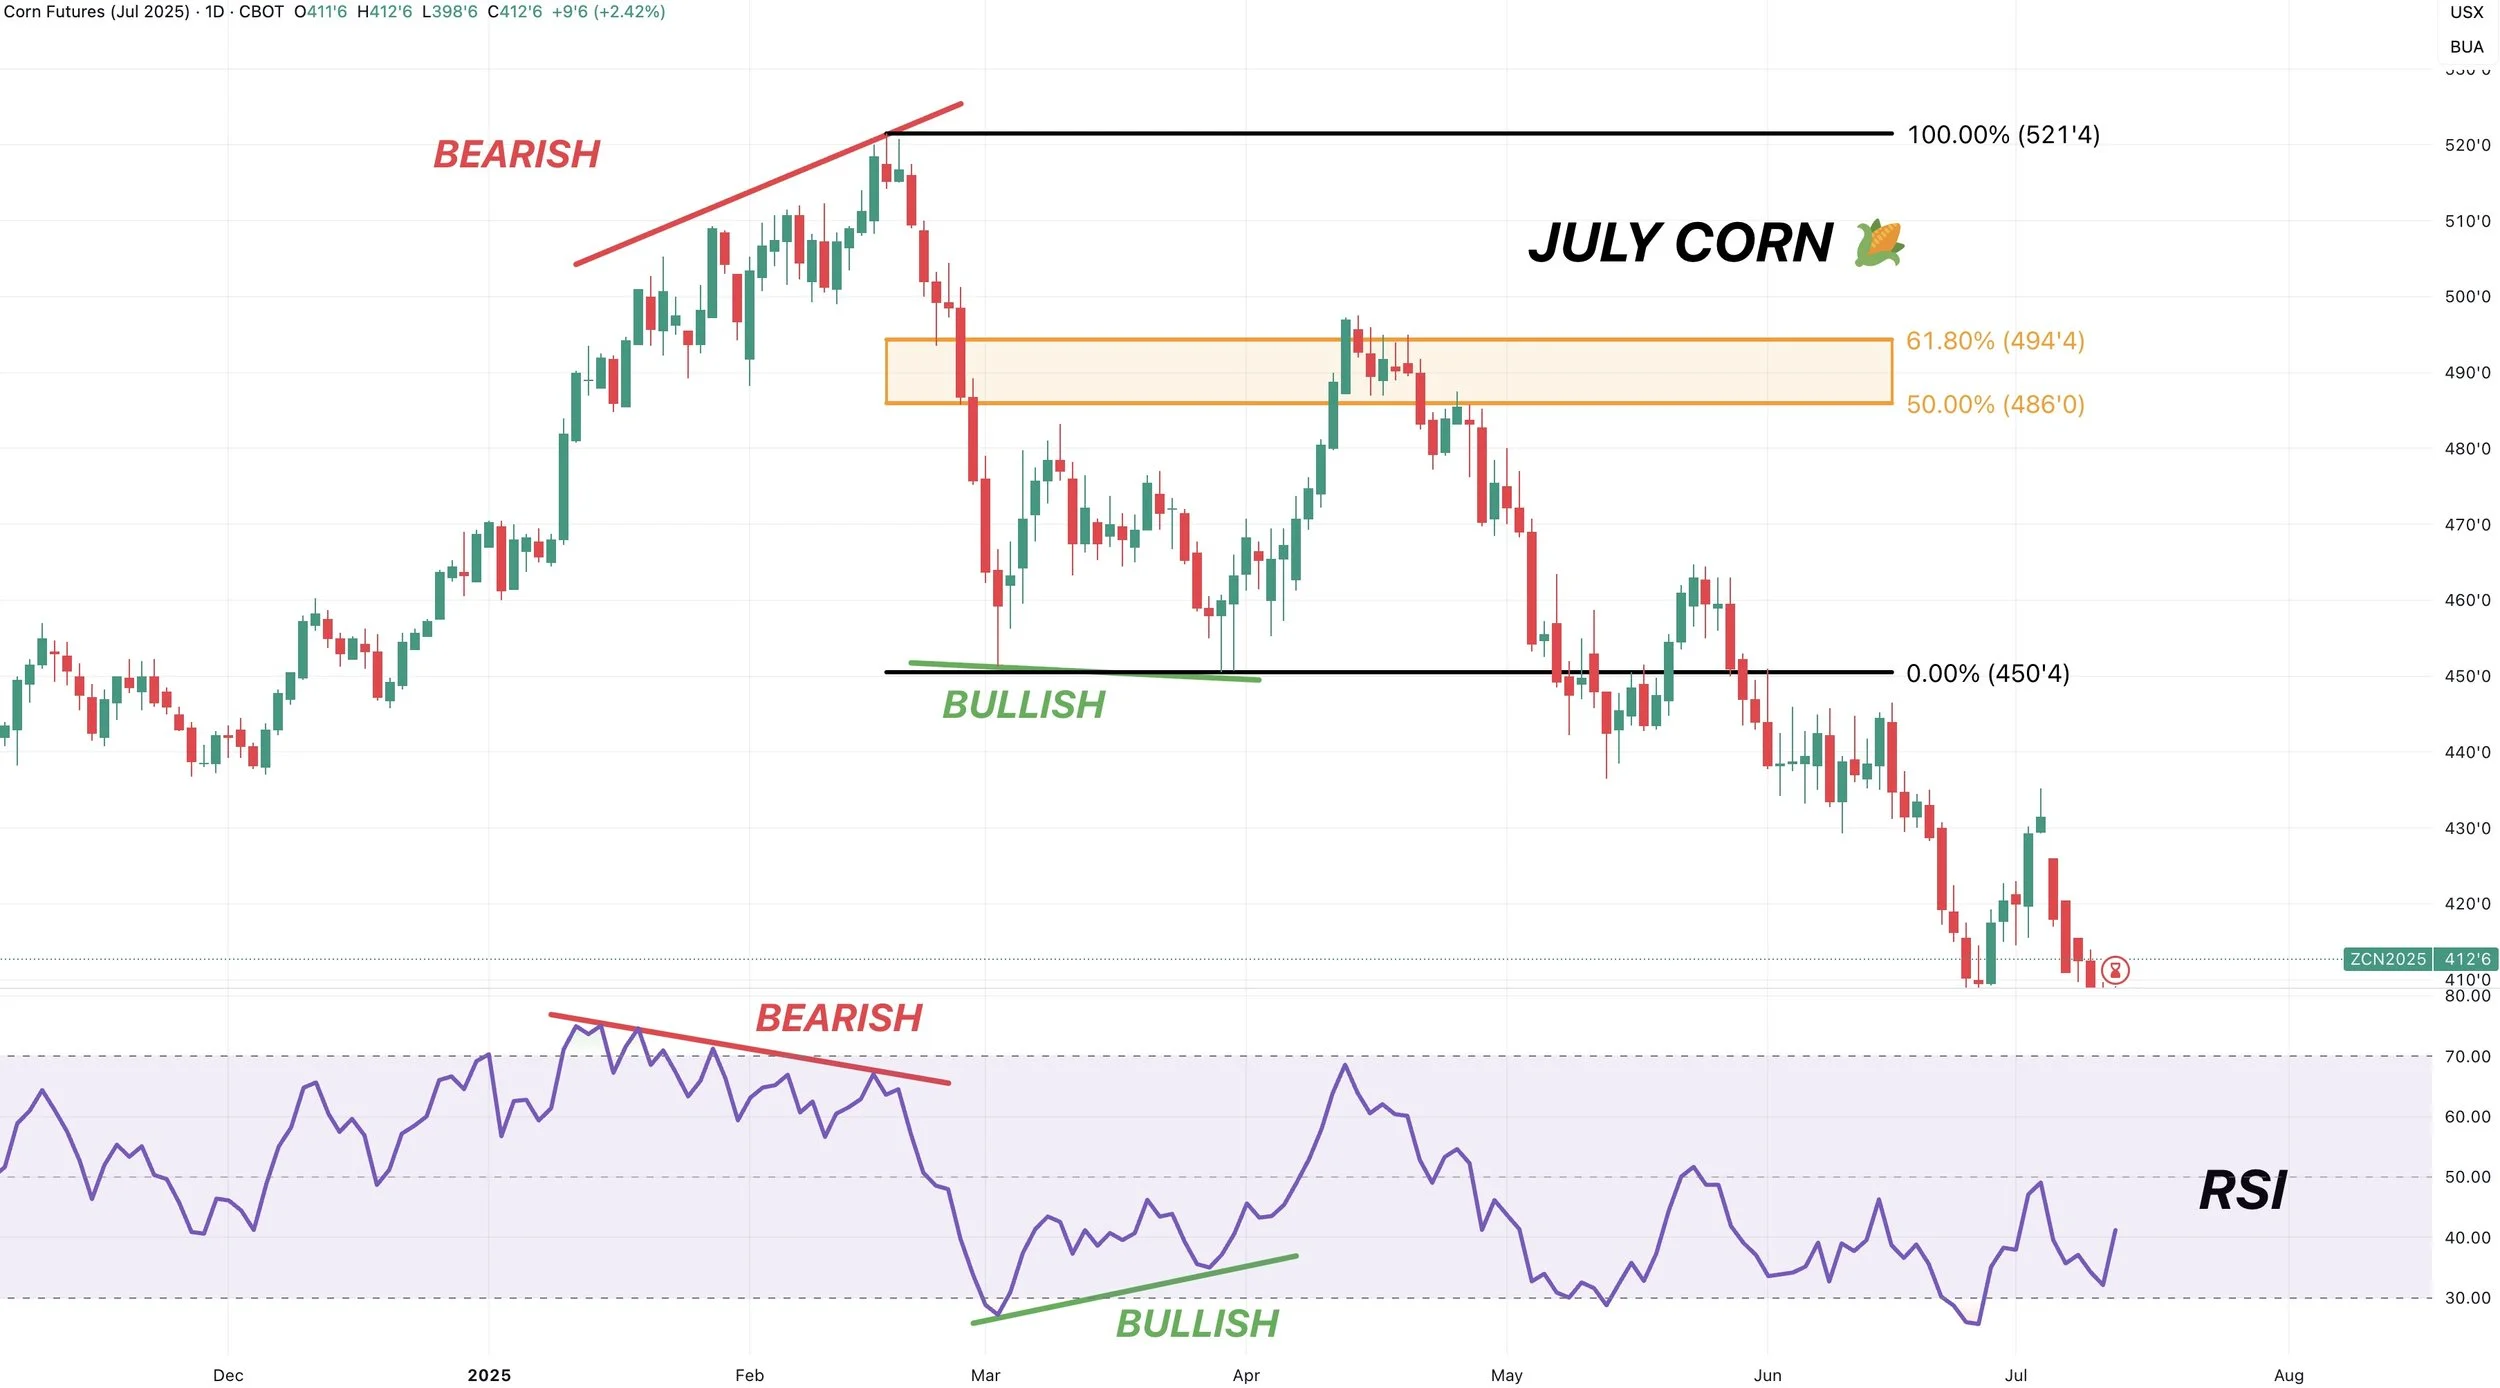
We showed this last week. But an example of this is July corn from earlier this year.
We got the initial sell. We then got a relief bounce up to the golden zone. We then went a lot lower.
Interestingly enough, the top was marked with bearish divergence. The bottom of the relief bounce was marked with bullish divergence.
So some similarities there to what we are currently seeing in soybeans.
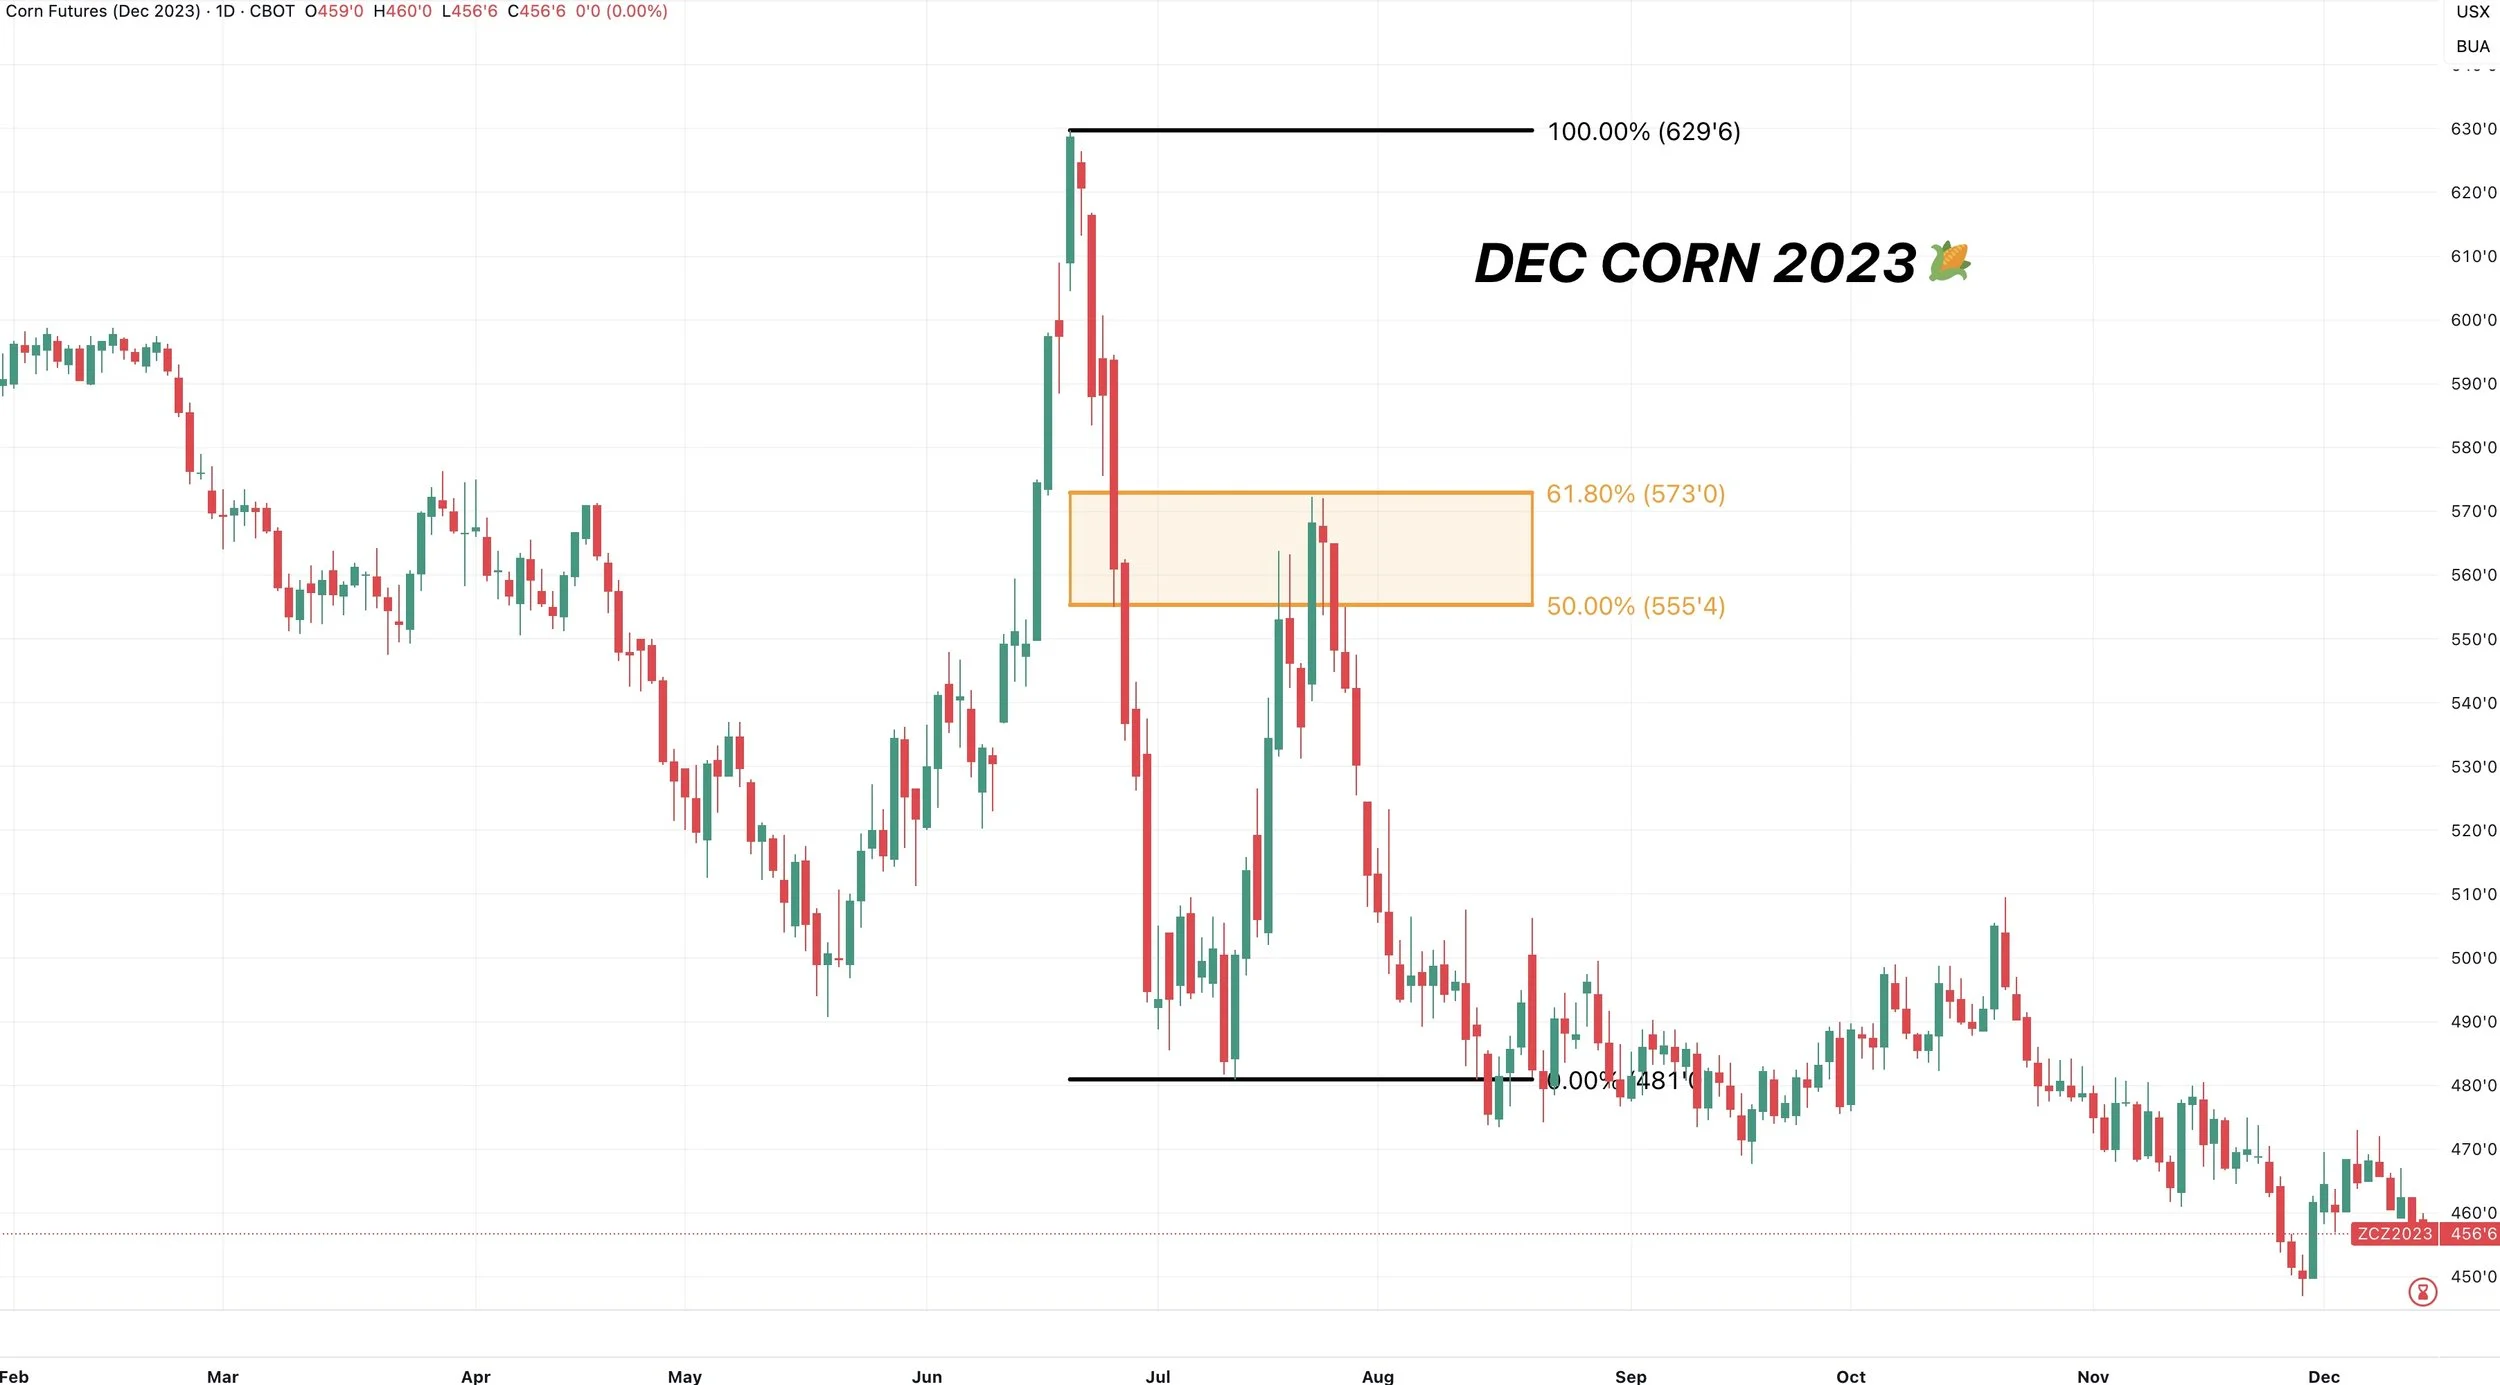
Here is another great example of a relief bounce.
This one is Dec-23 corn.
We had that weather scare rally that took corn from $4.90 to $6.30 in a few weeks.
Corn then gave it all back in just a matter of days.
But the market did offer a relief bounce before ultimately falling apart.
The relief bounce failed once again right in that golden zone.
The point is, relief bounces are common. But we want to reward it if it comes. Just like we rewarded the April bounce in corn this year.
As they are often opportunities when they present themselves.
Corn
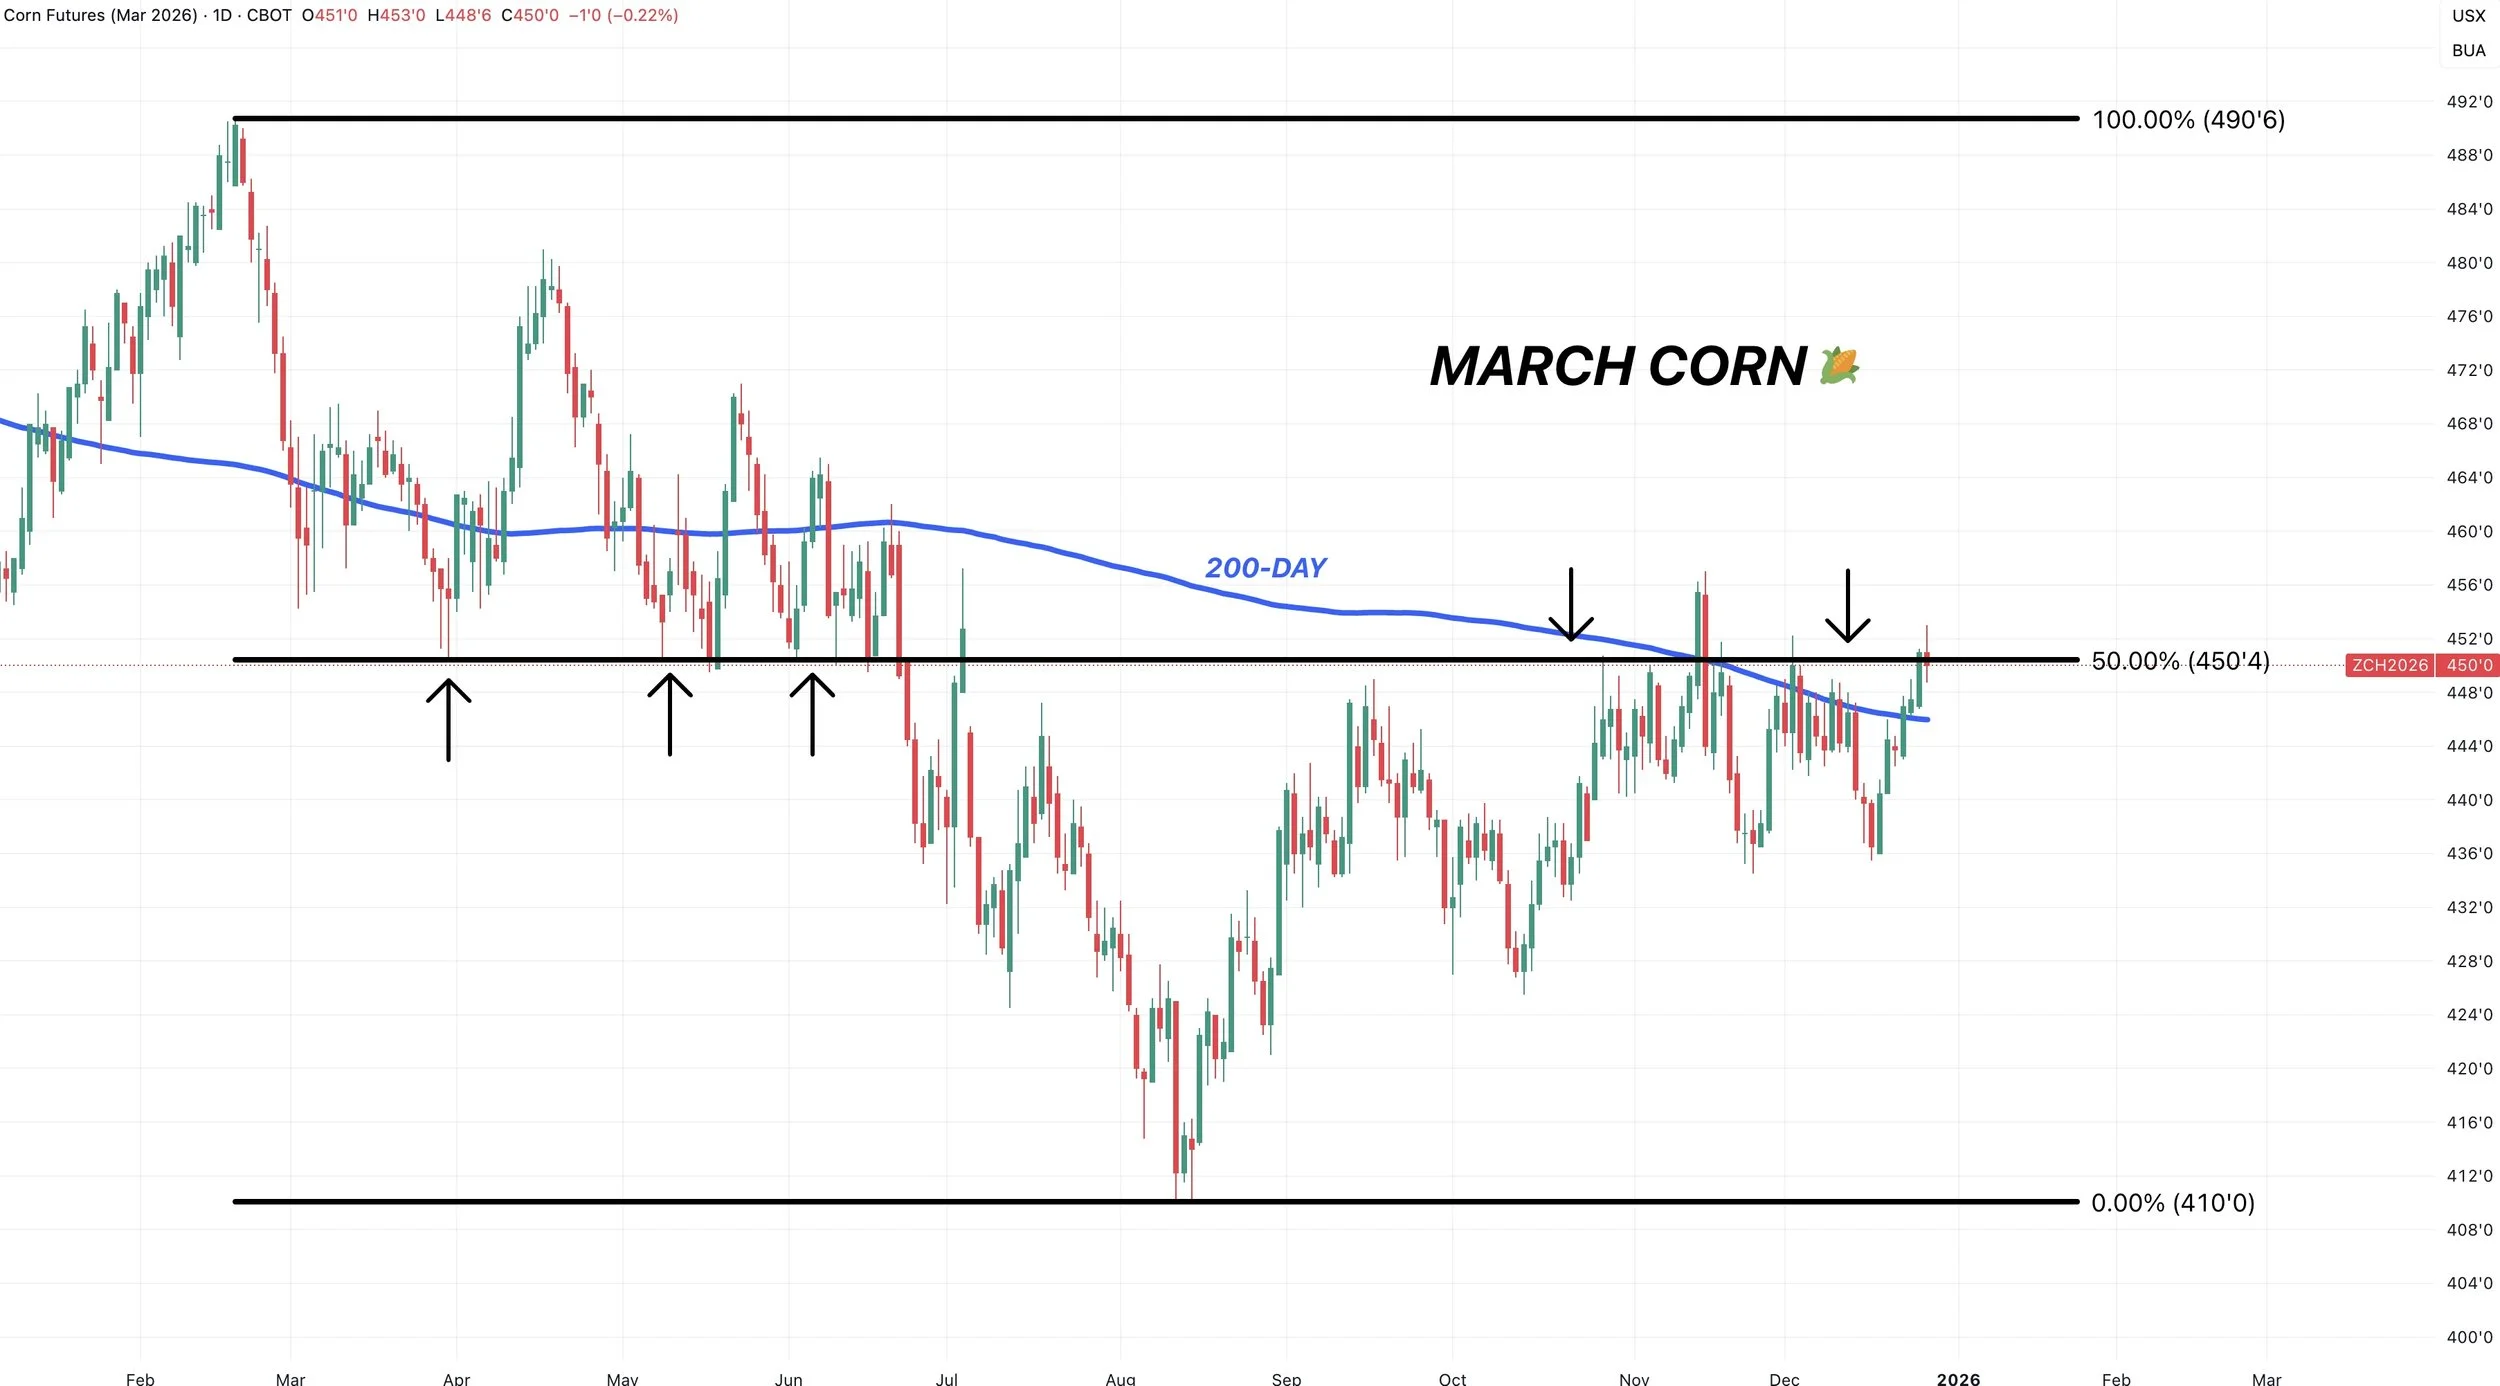
March Corn
March corn is currently battling some big resistance we've continue to struggle at for months now.
This is a big spot for corn, as we are flirting with a breakout if we can clear this level.
It was support from spring, we've rejected this level a dozen times since October.
If we get a break above, it should result in further upside.
We are also above the 200-day for the 3rd day in a row. Which is something we haven’t seen since summer.
Being above the 200-day after being below it for so long, can often be a sign that a market's long term momentum is shifting higher. So it's nice to see that.
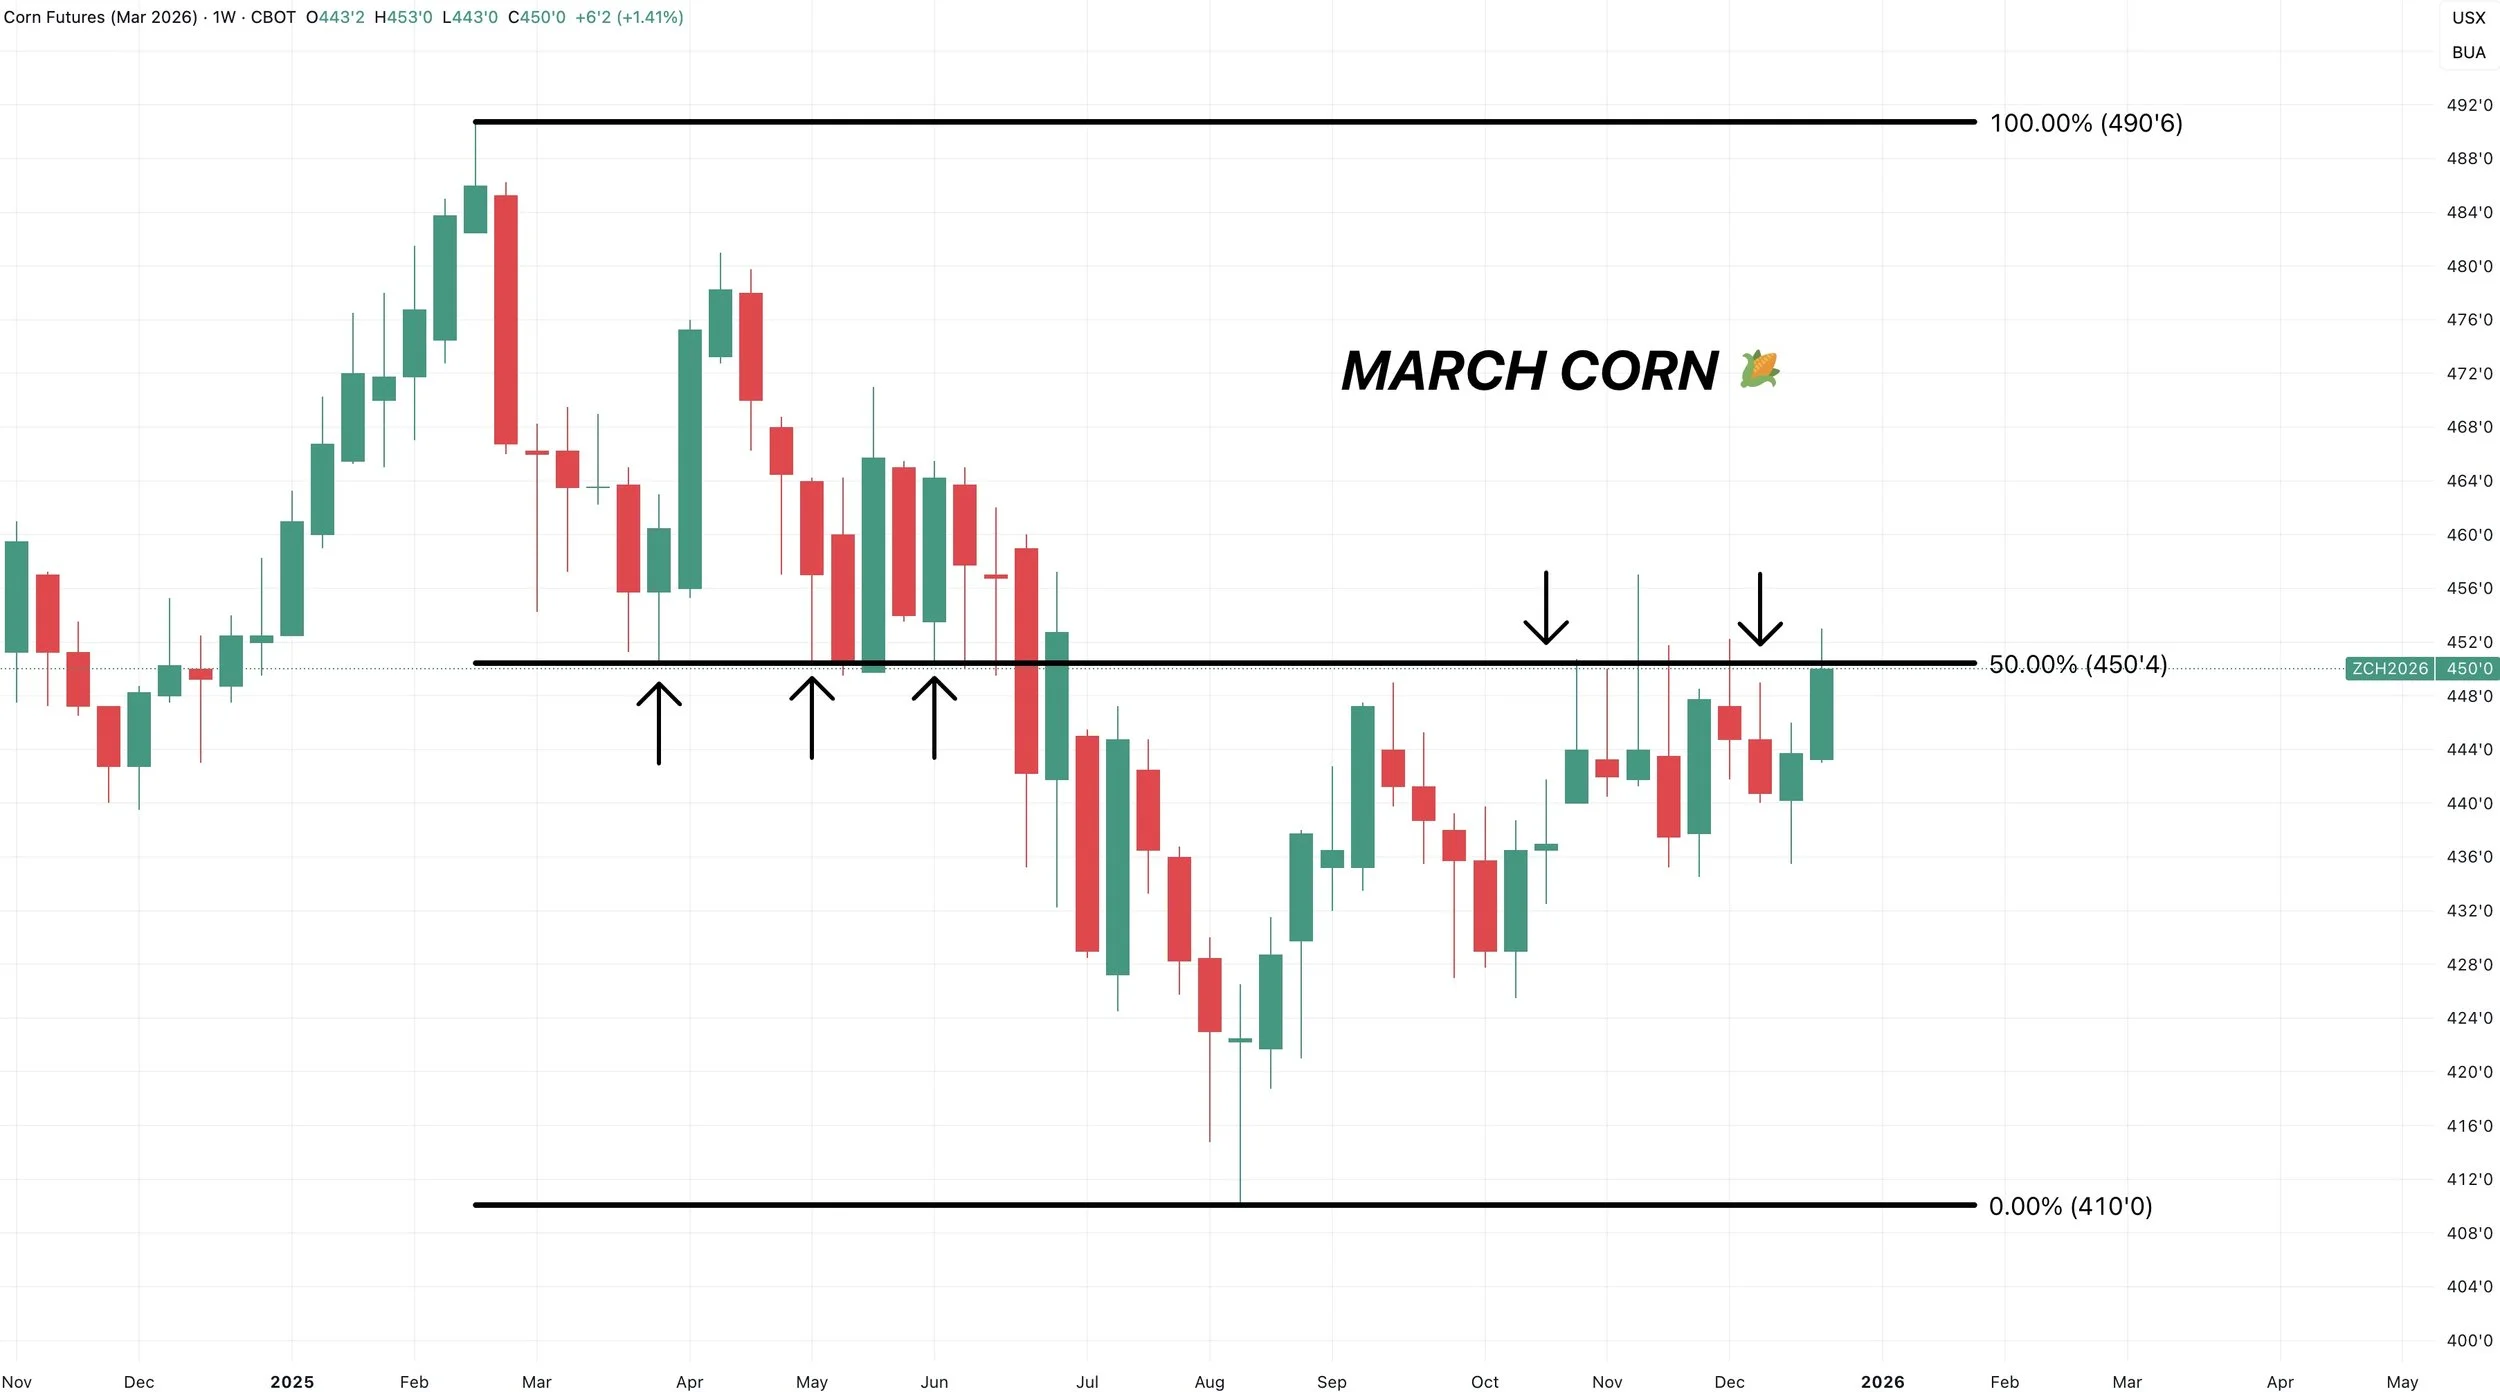
March Weekly Chart
Here is the weekly chart.
We had our highest weekly close since June today.
This chart shows you just how big of resistance that $4.50 level is.
We bounced there on 8 separate weeks this spring.
We've now failed that level 5 weeks the last two months.
Big spot to clear.
Upside Targets
We alerted our first sell signal and take risk off the table for the first time since April we hit that intial $4.50 target.
If you haven’t taken any risk off the table at all, taking a small amount off while we are sitting at our highest levels since July and some key resistance isn’t the worst idea in the world.
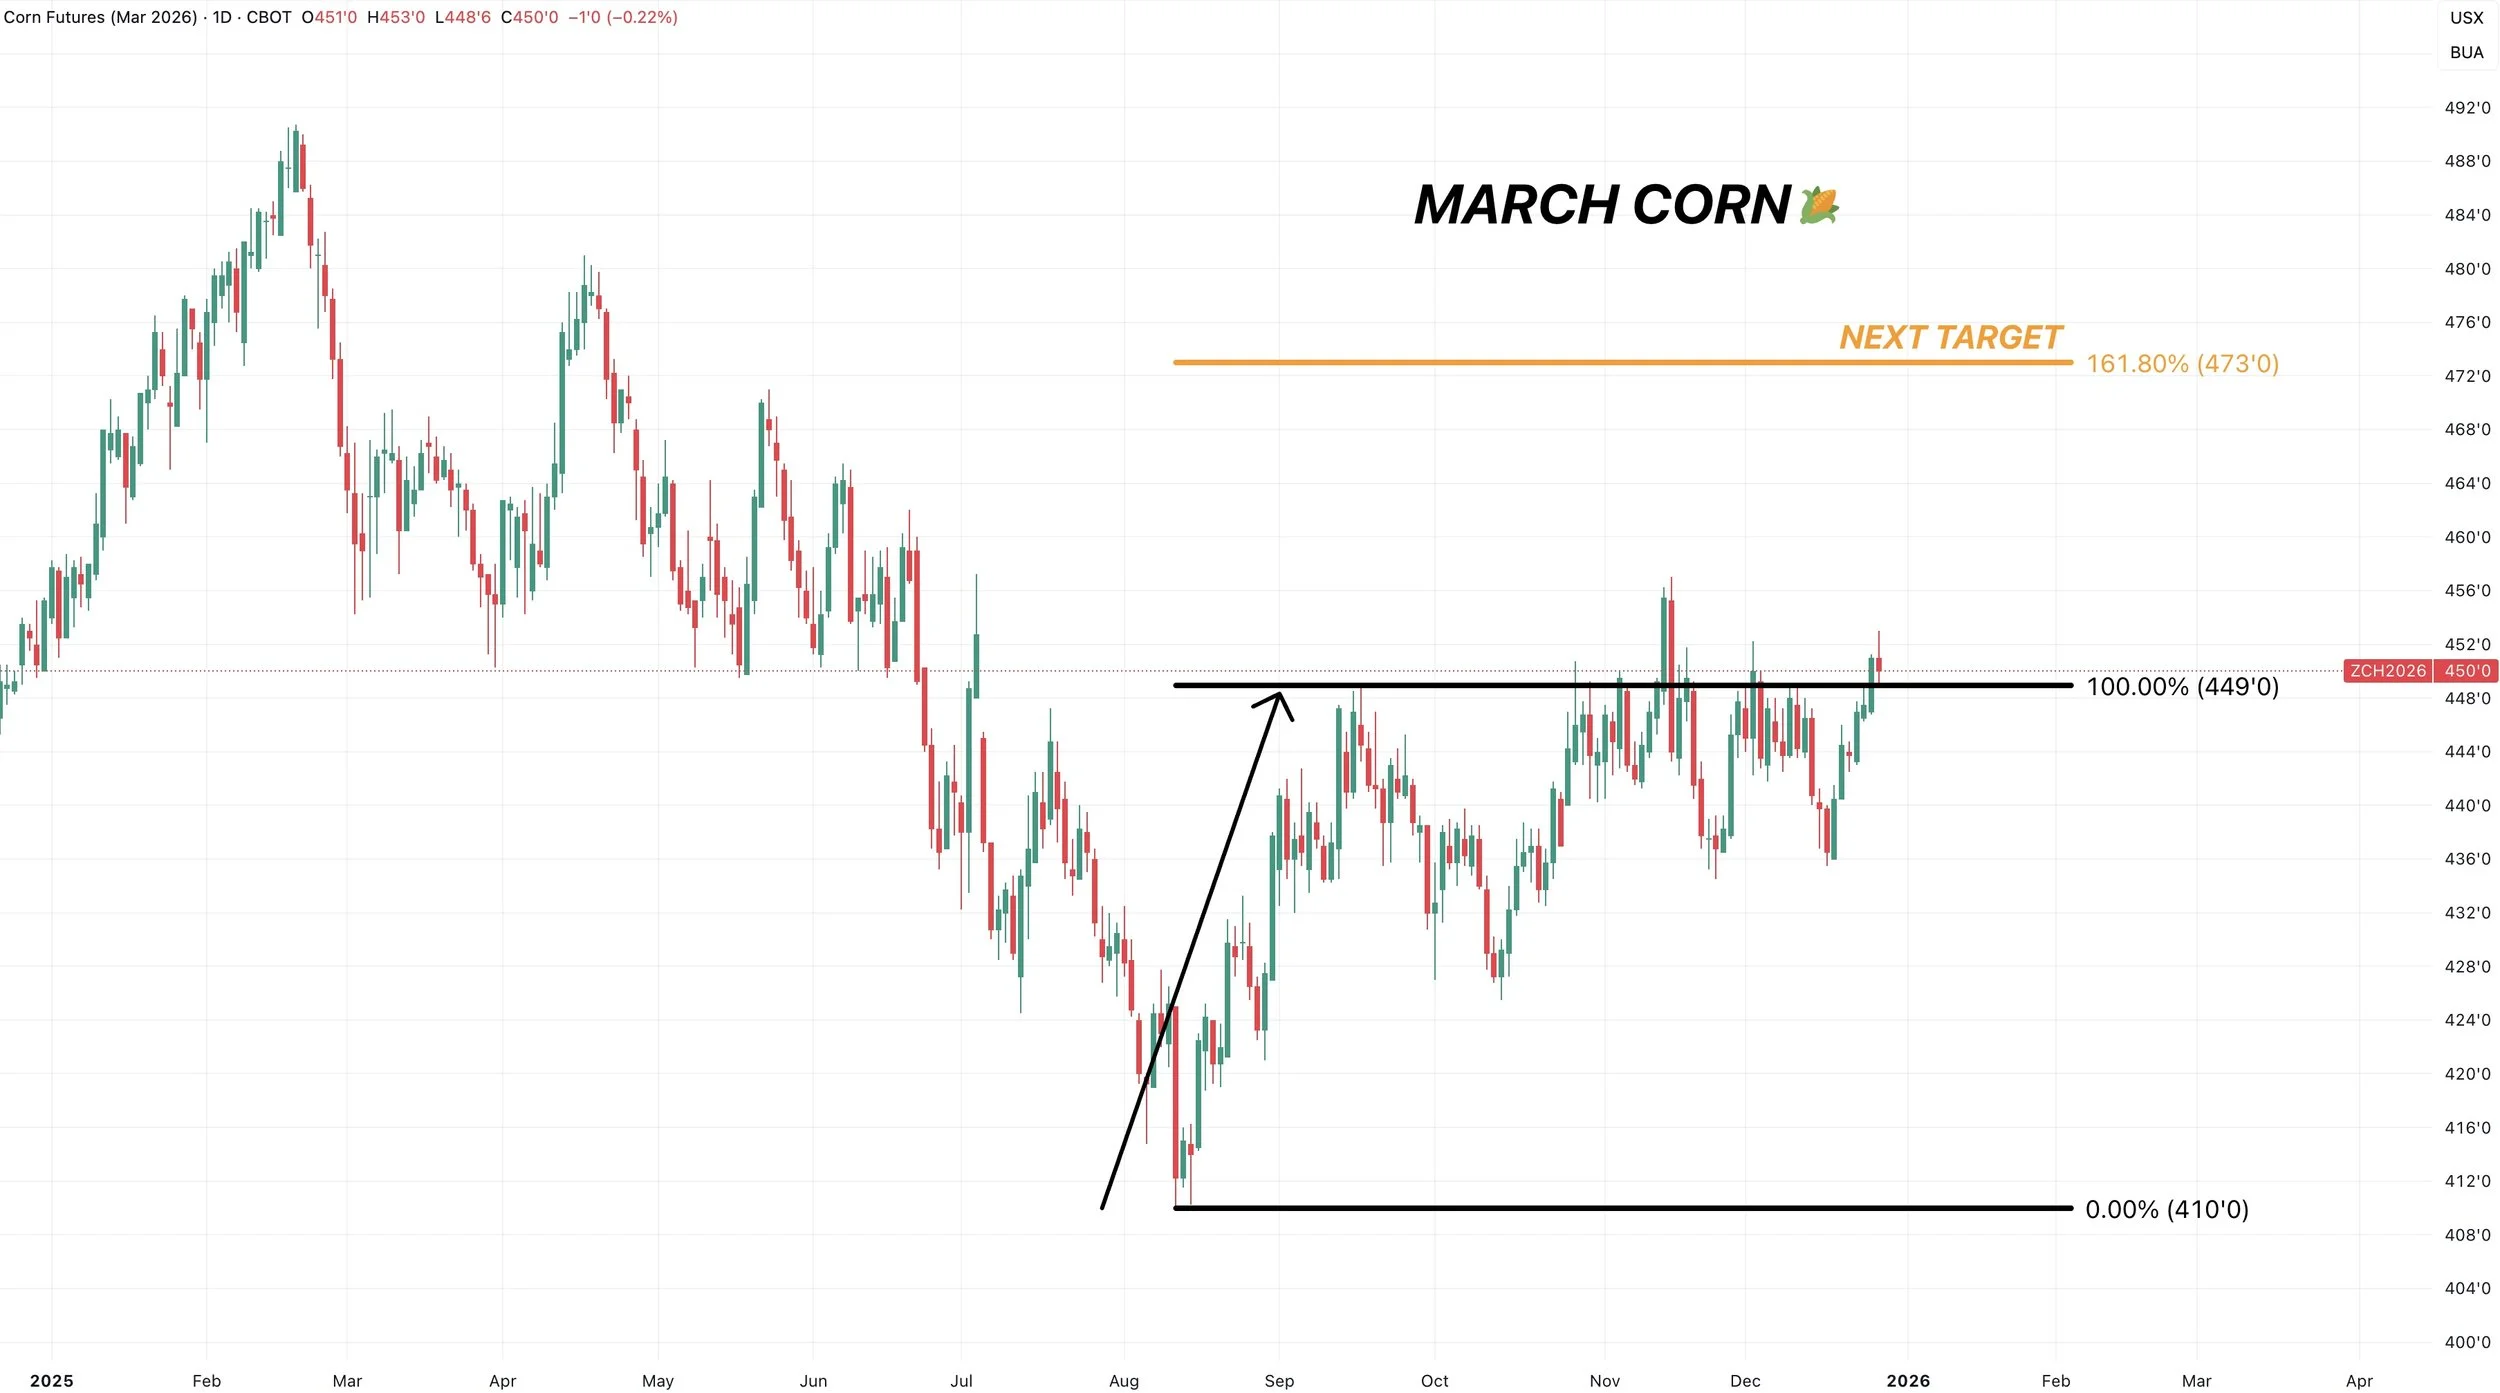
Since we already took some risk off, my eyes are set on the next target.
Which comes in at $4.70 to $4.75
Reason 1:
When you take the very first impulse off contract lows, up to the September highs.
And measure that move, 161.8% of that entire rally comes in at $4.73
This is a common spot for a second rally to end.
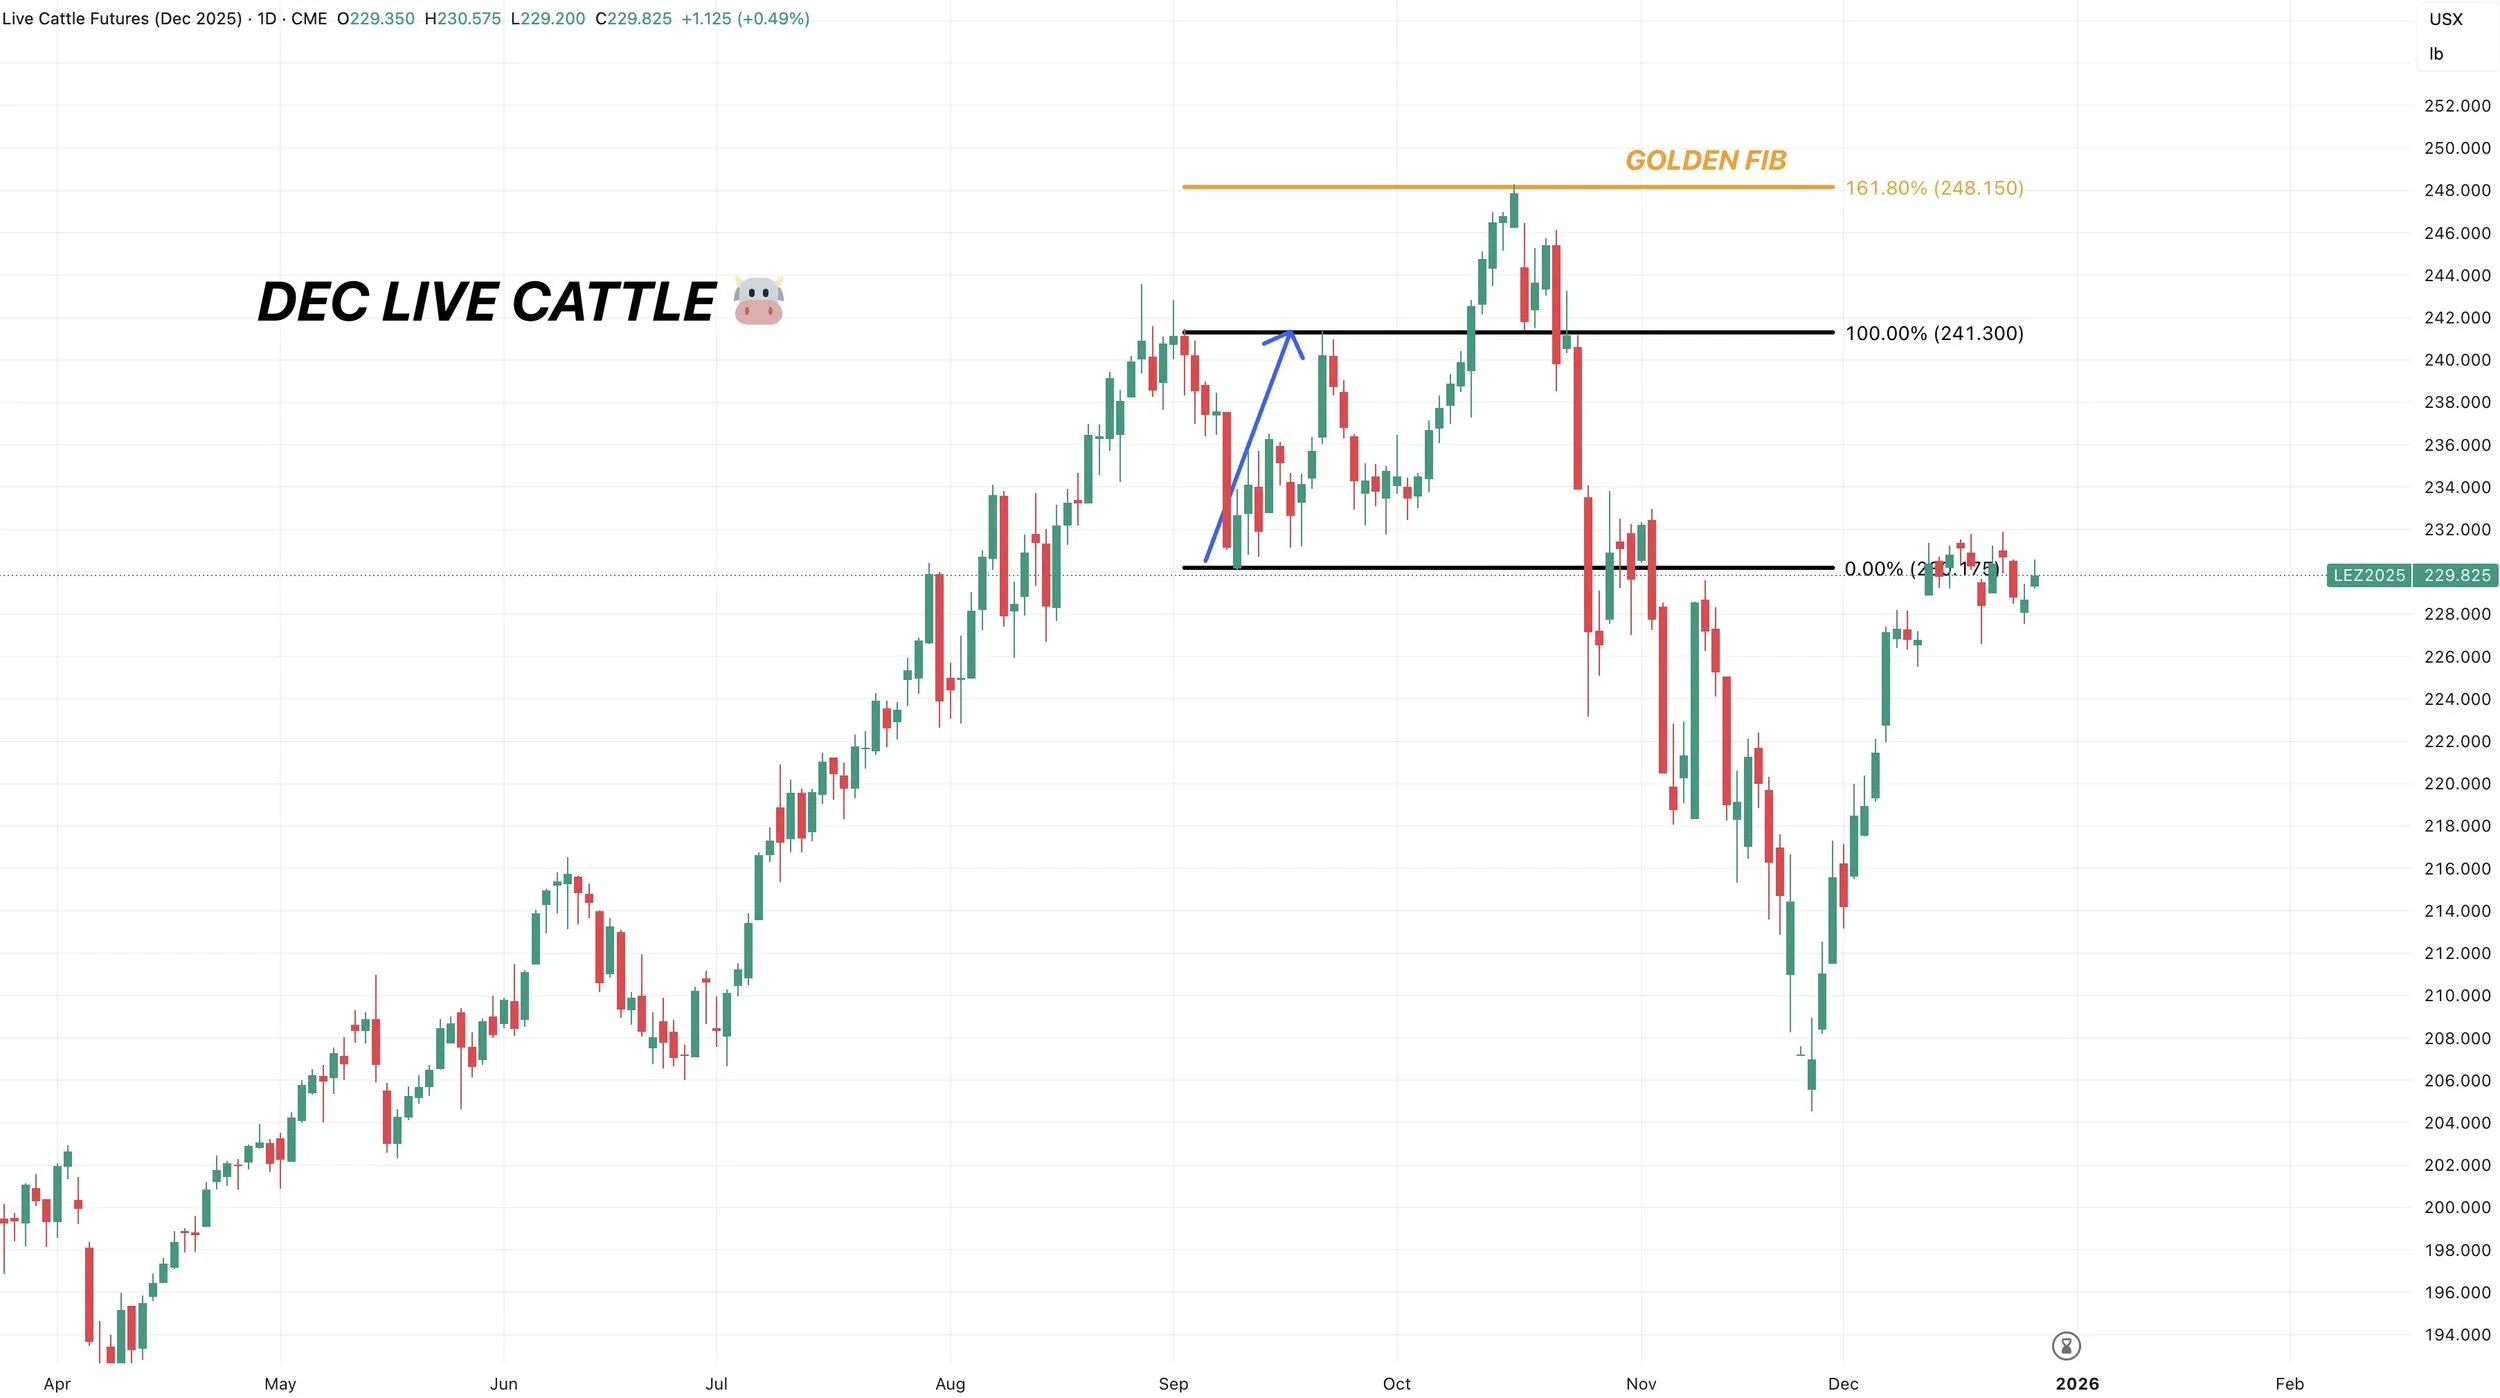
The most recent example of this would be the cattle market either this year.
This is a smaller time frame, but the same concept.
This was our reason for the sell signal back in October for cattle.
We had that first mini rally. We then pulled back.
The second rally then stopped right at that 161.8% level. Also known as the golden fib.
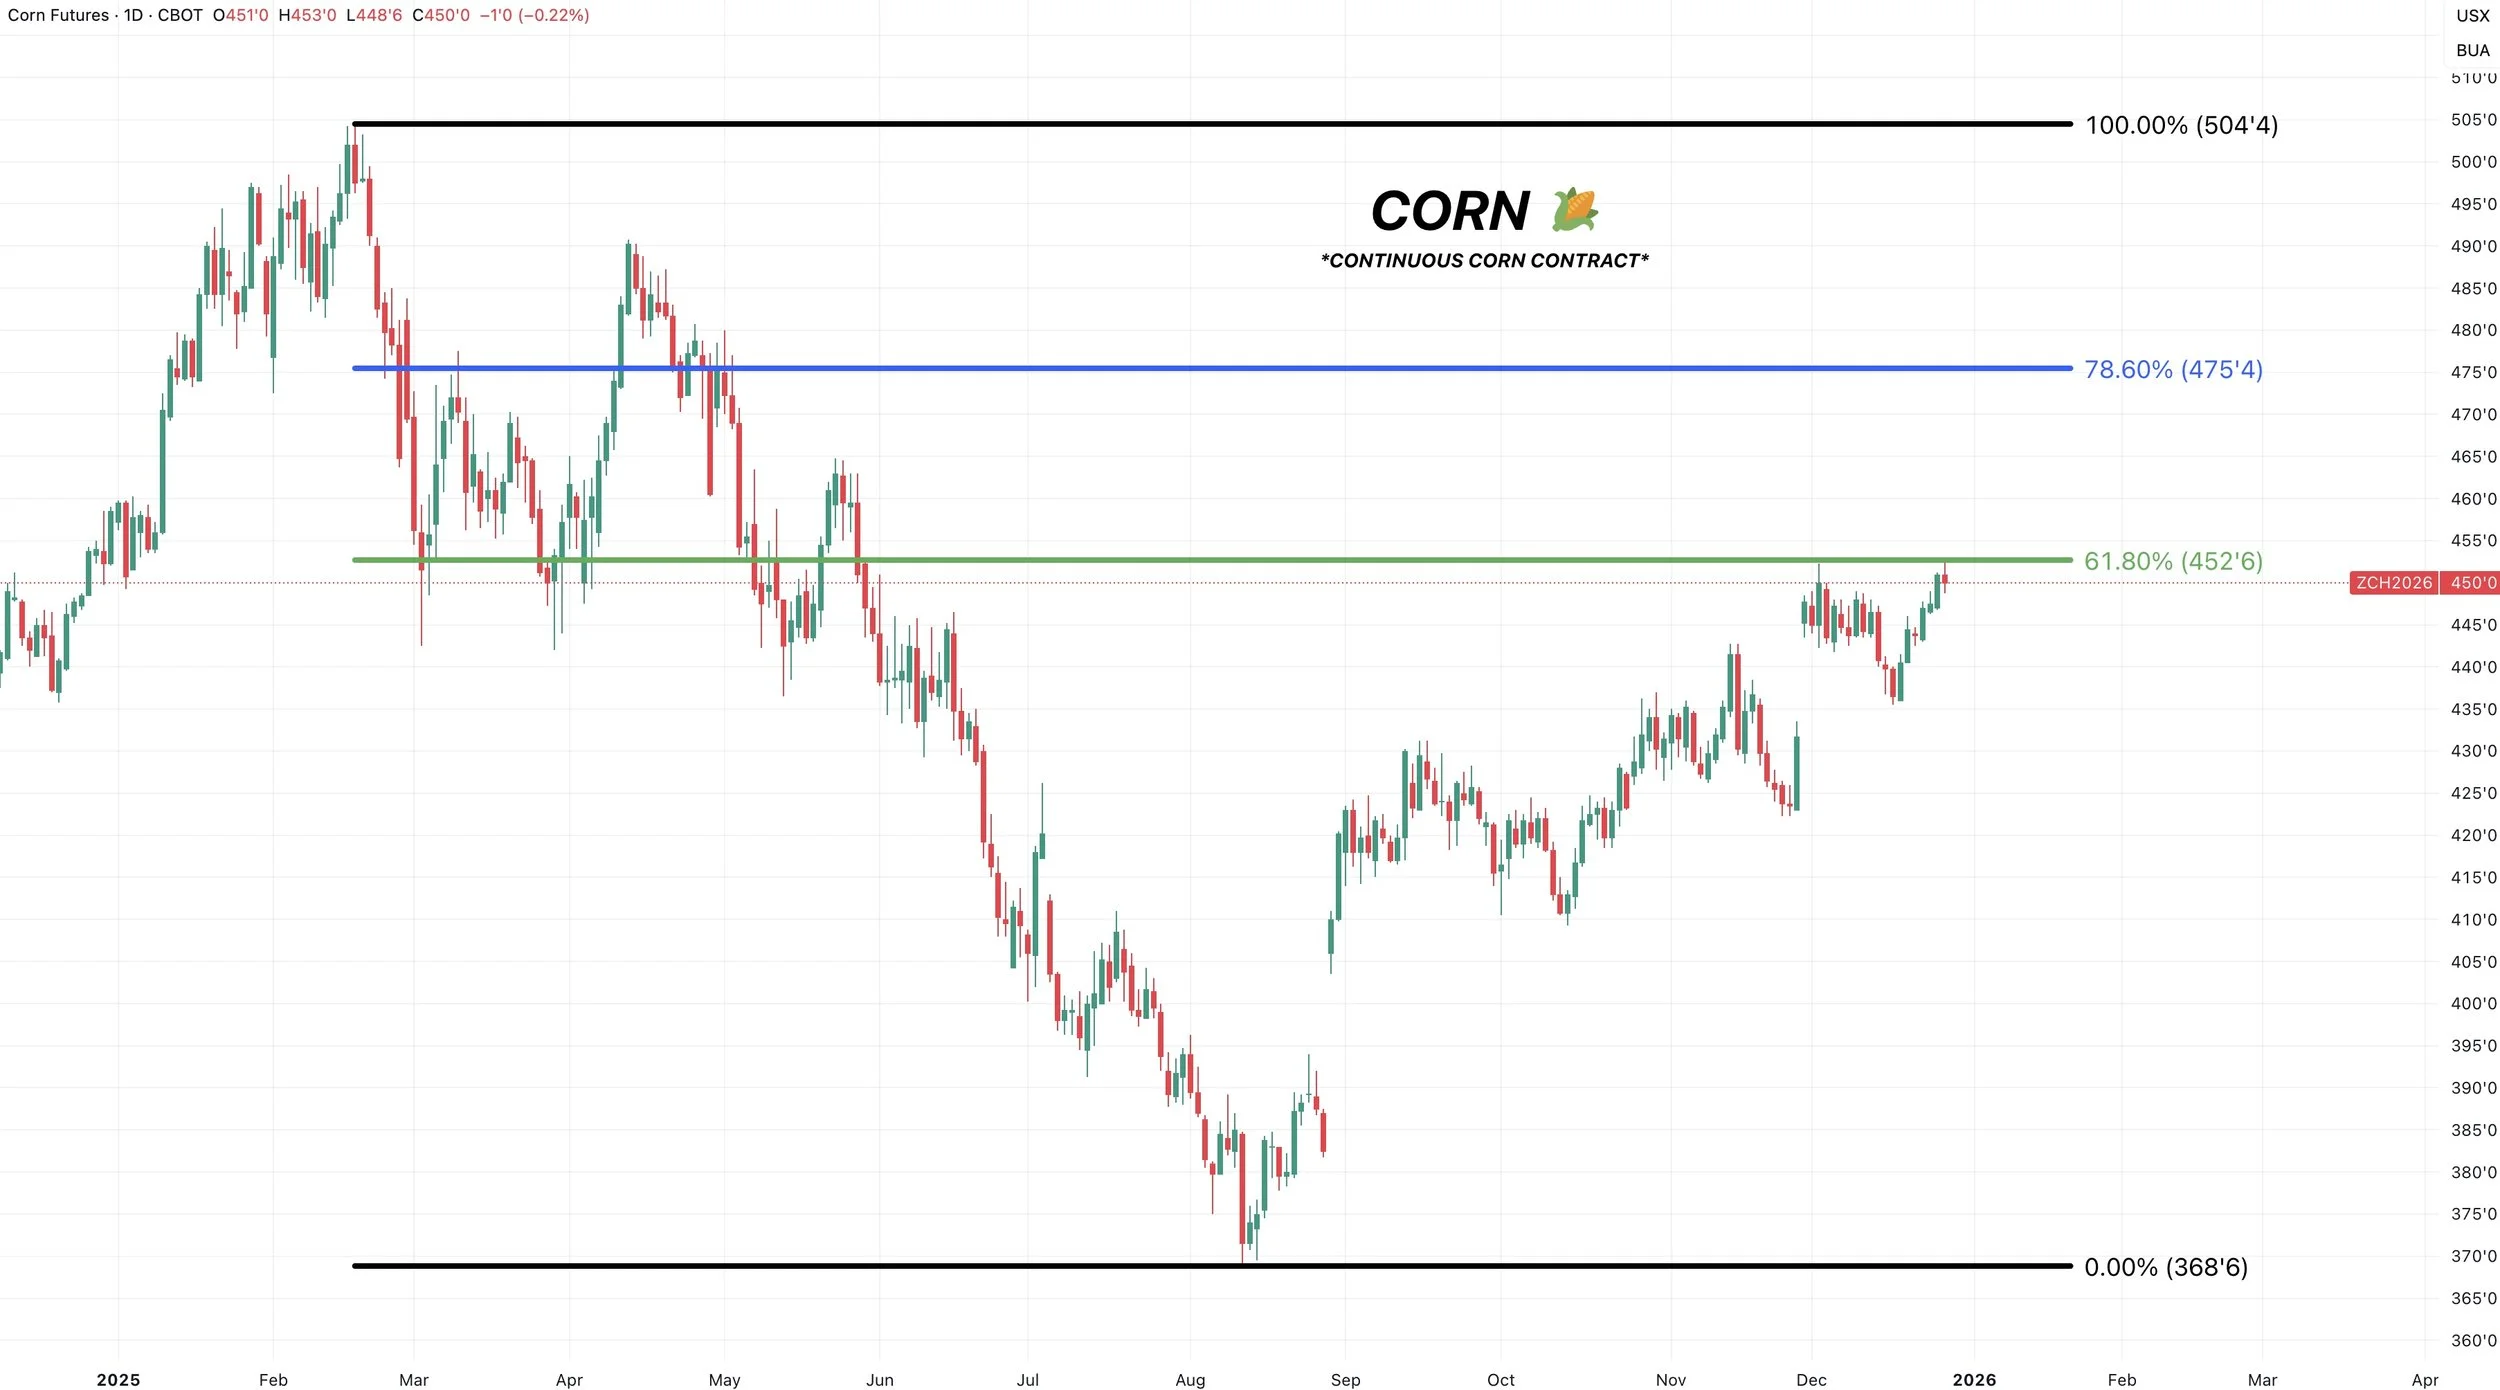
Reason 2:
This is the continuous chart.
When you take the August lows, up to the Feb highs.
So far the market reclaimed 61.8% level of that entire sell off. Which is why it makes perfect sense the market has struggled to bust above this level.
The next level is the 78.6% level which sits at $4.75
Cattle
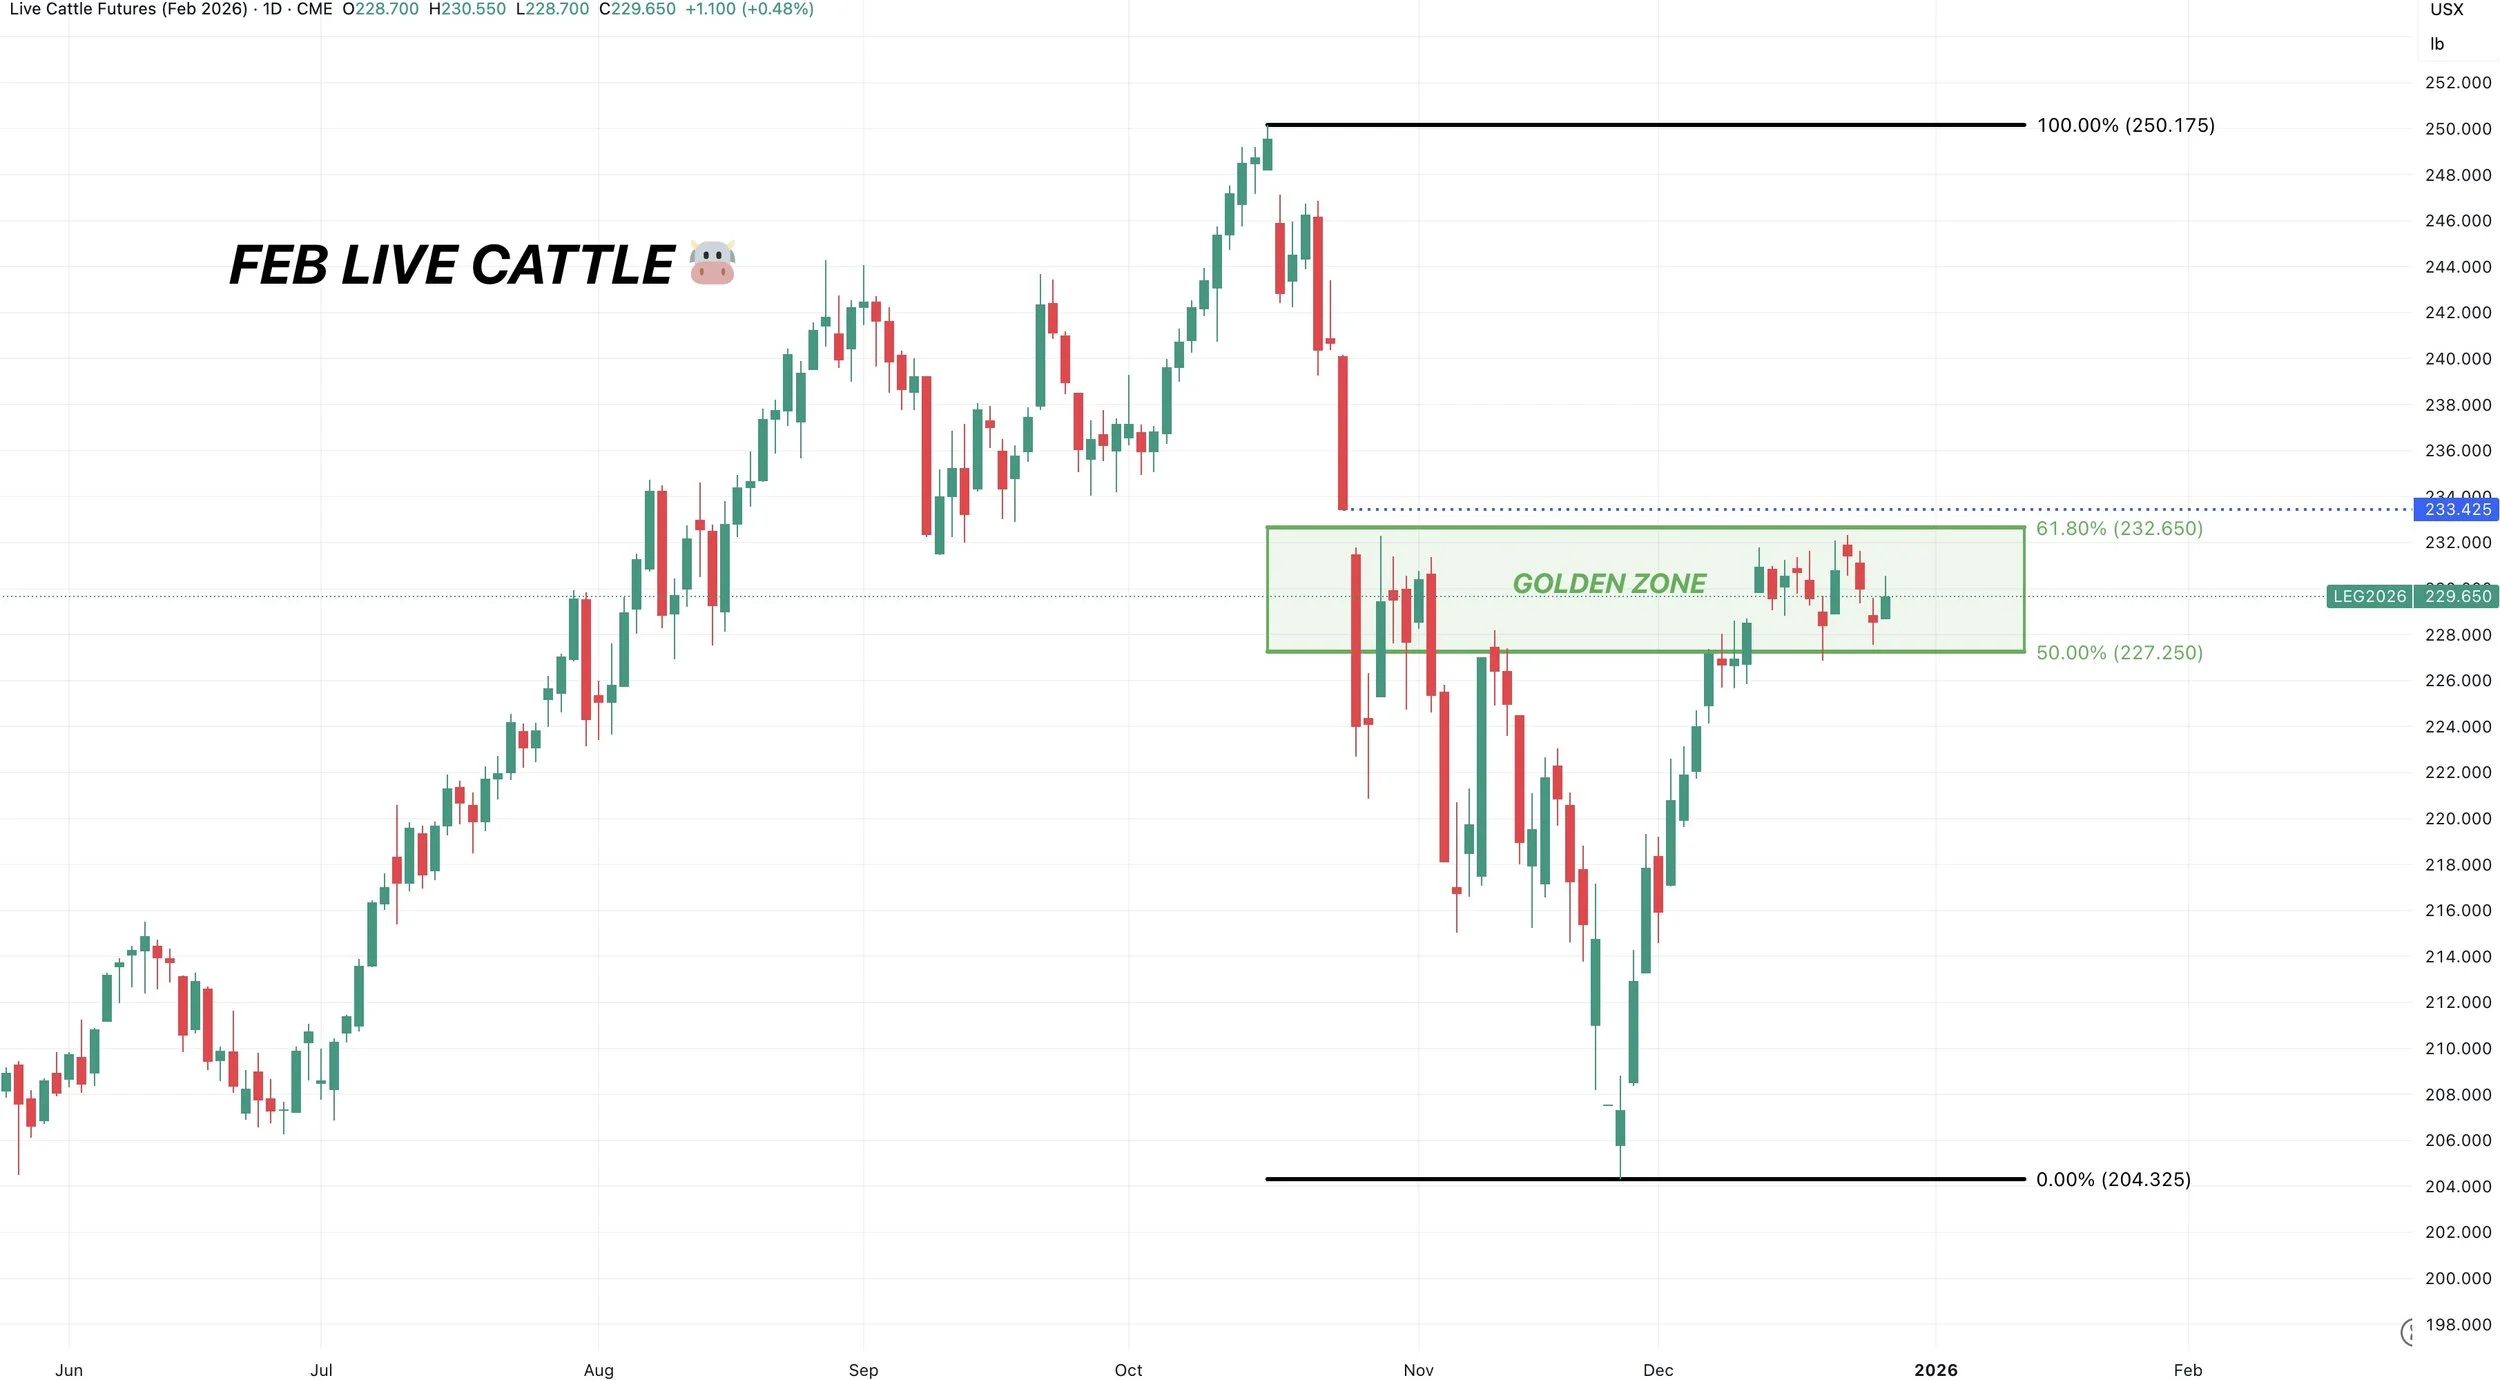
Feb Live
Not much to update on cattle.
We've traded pretty much sideways for two weeks.
We continue to sit in this golden zone.
Which was our upside target and where we alerted a hedge signal.
We still like keeping those, as there is still risk in this market.
If the market is going to fail, most relief bounces tend to fail here.
Break above the green box and we might have a different story. But for now, it makes sense to defend this level.
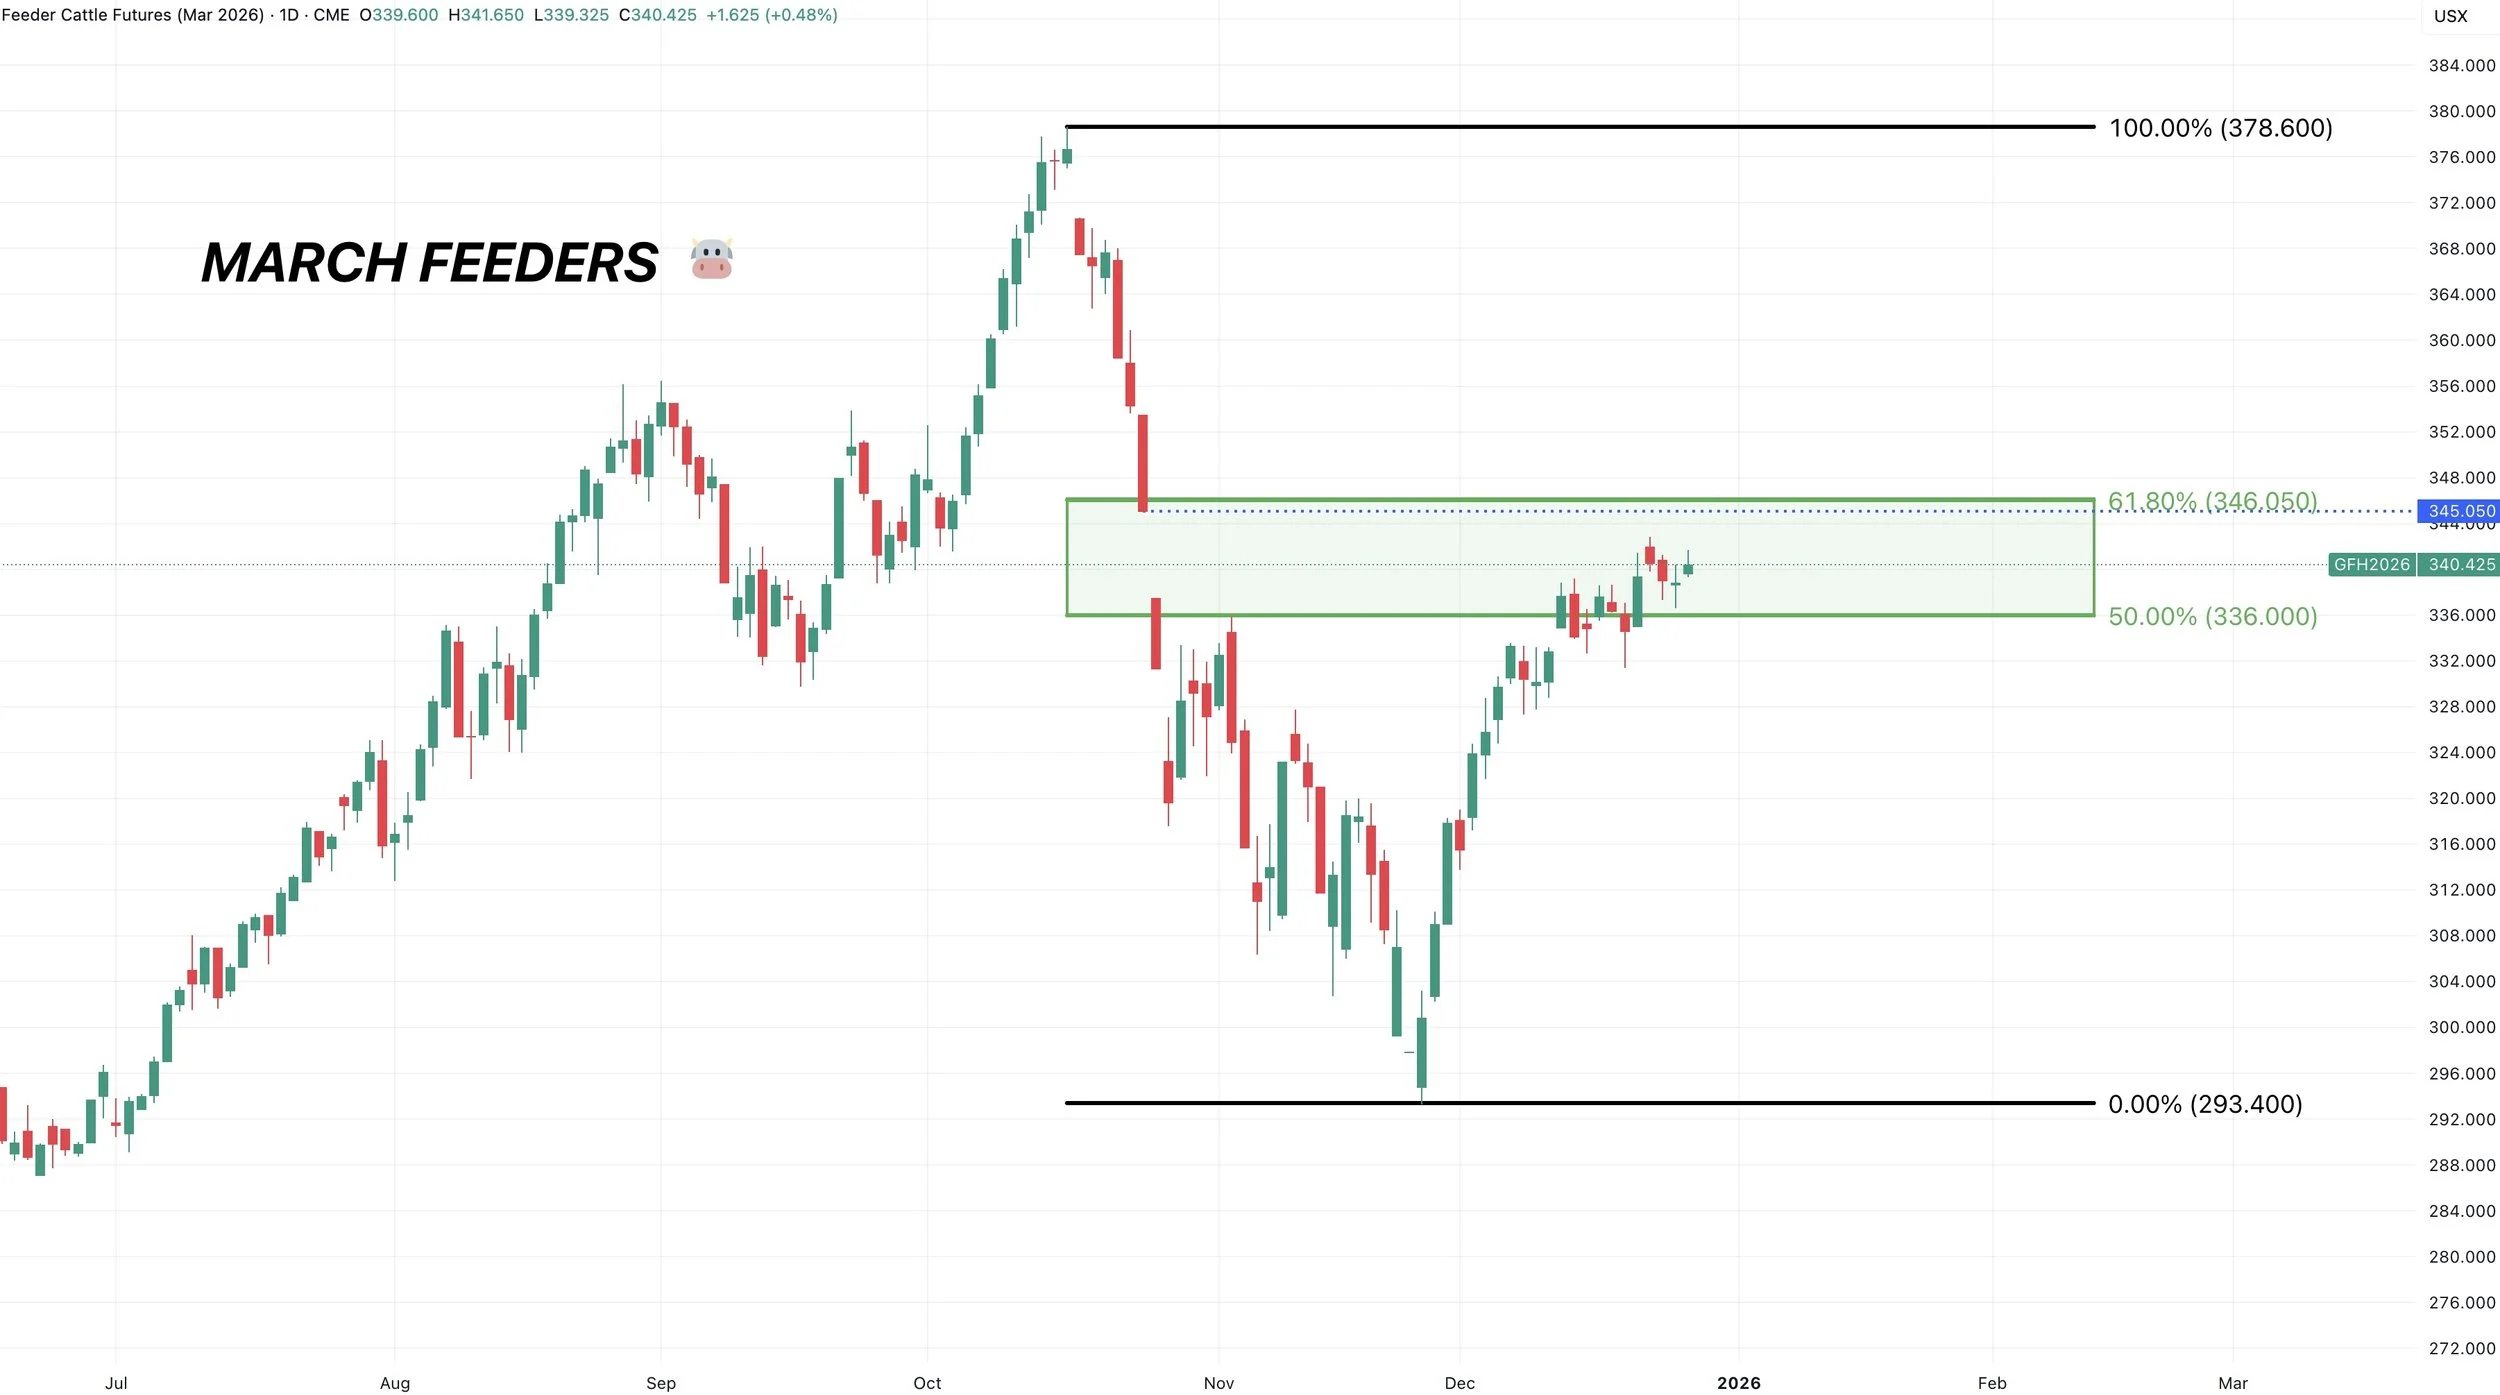
March Feeders
Same set up here.
Still sitting in the golden zone.
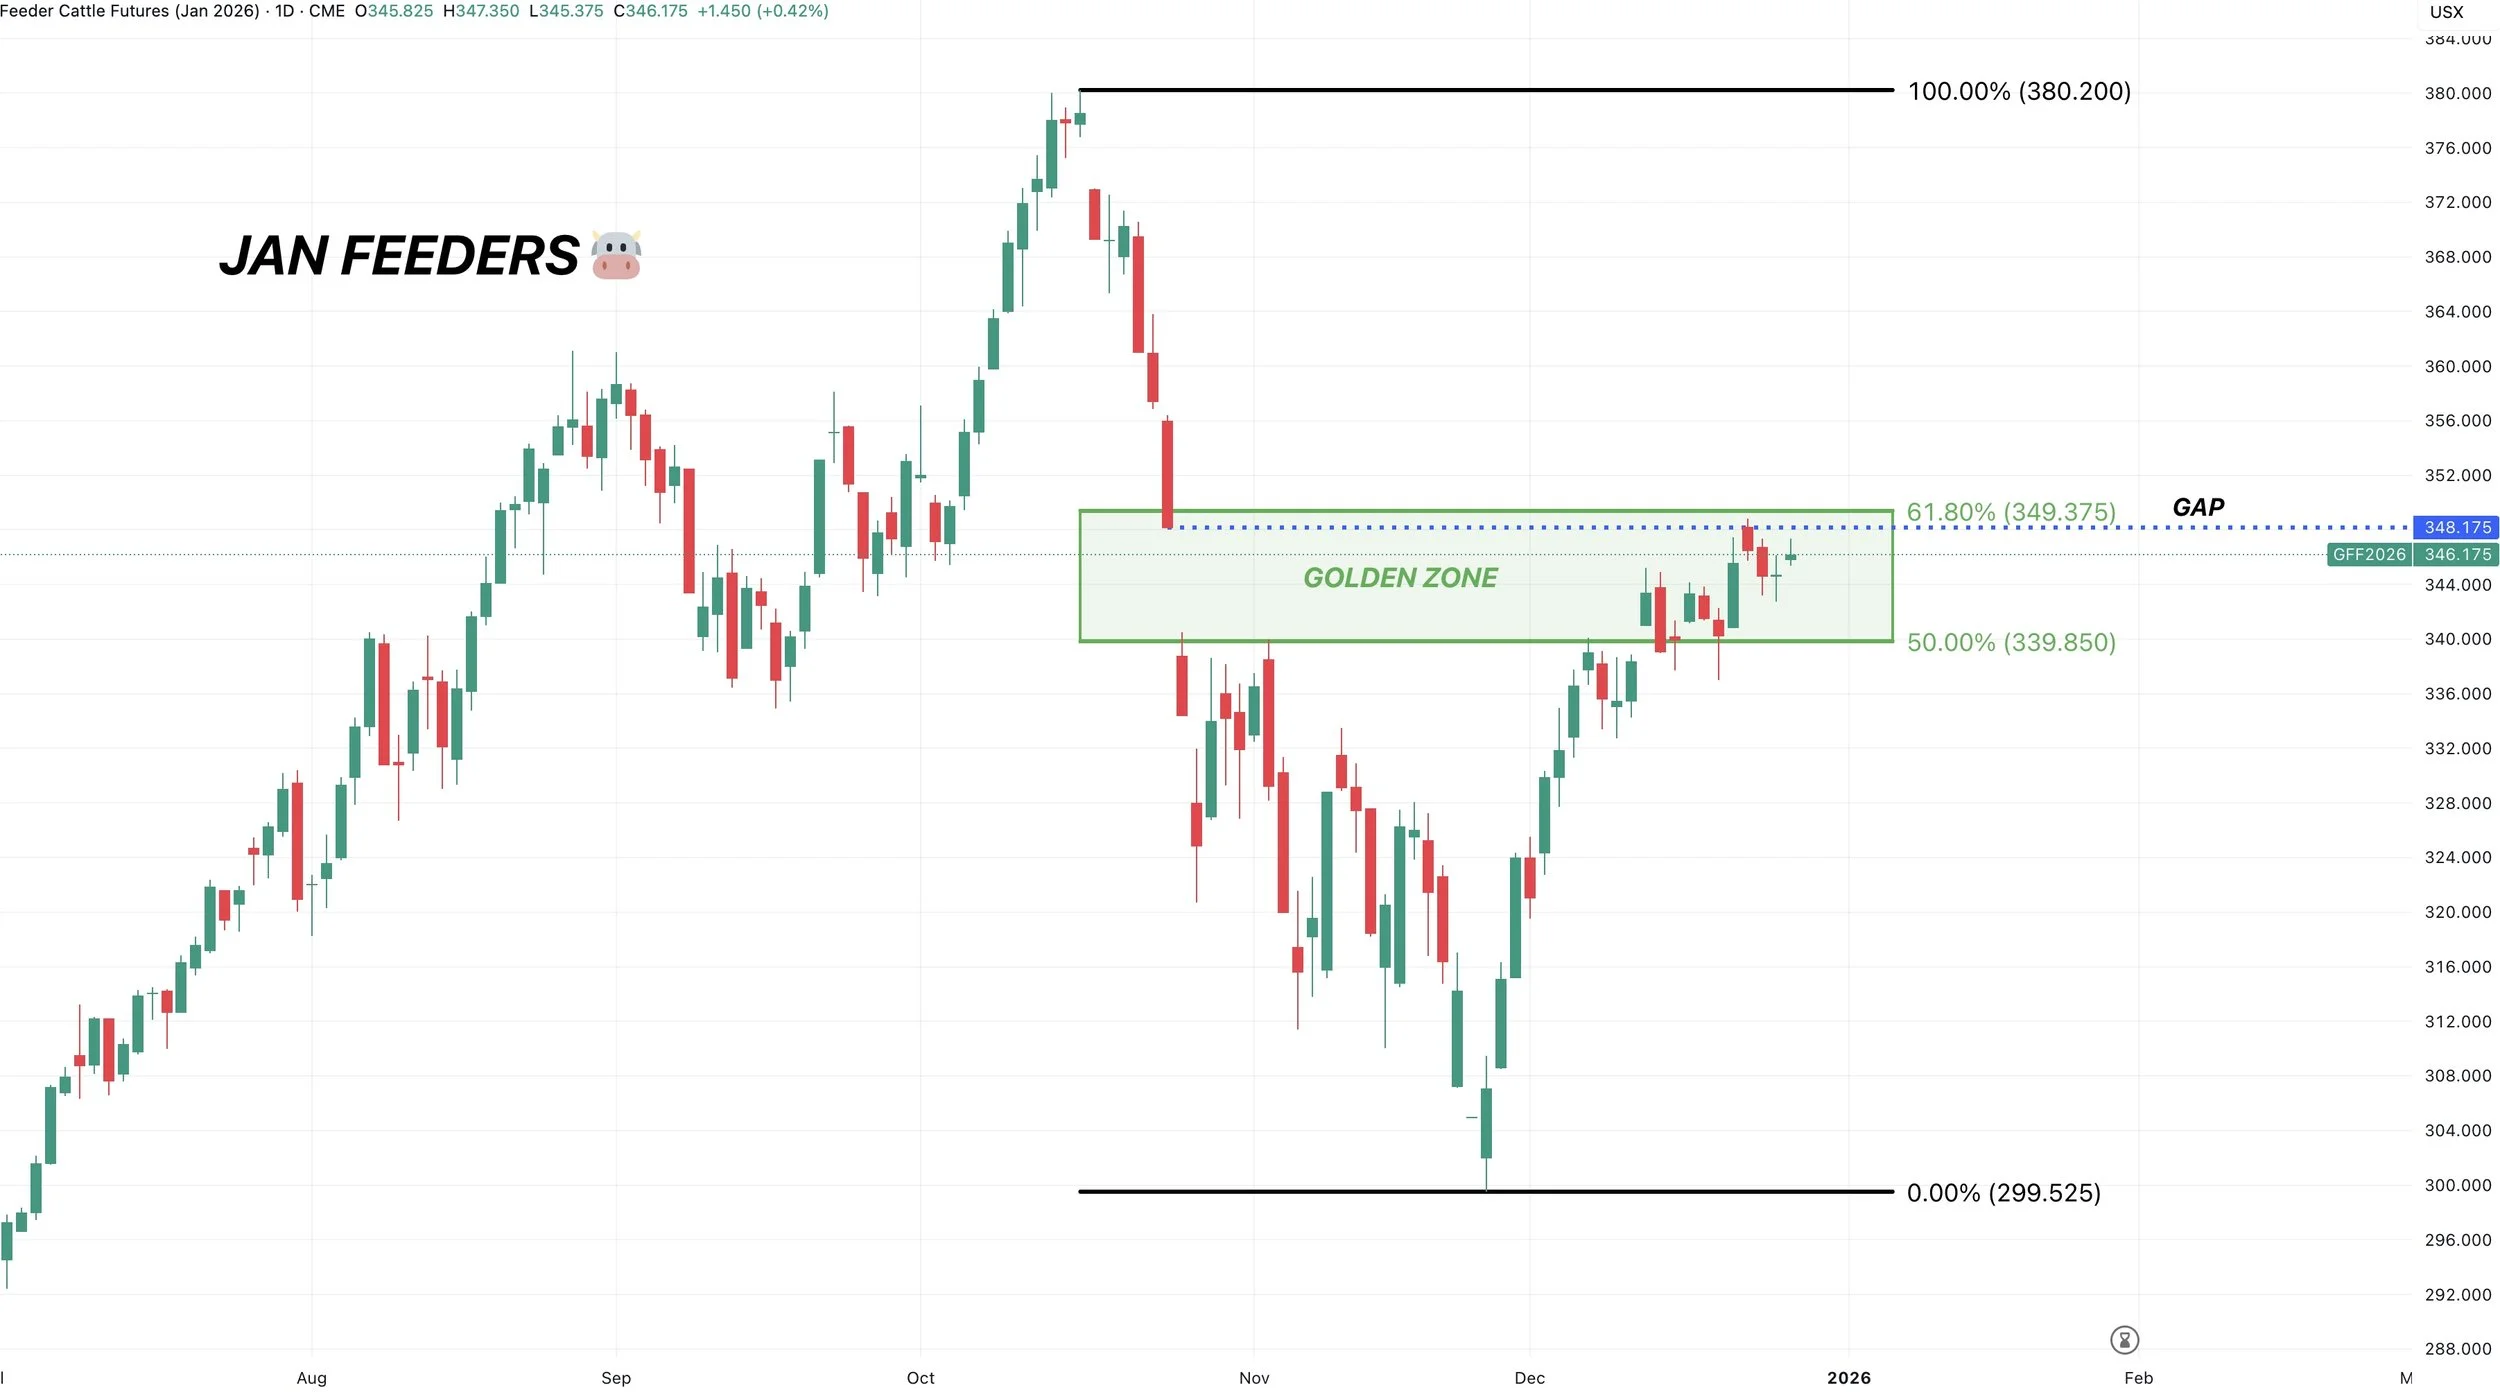
Jan Feeders
Volume has switched to March.
But Jan feeders perfectly filled that gap we left.
We also nearly tapped that 61.8% level of the entire sell off.
Both of those were pretty big points of interest.
Wheat
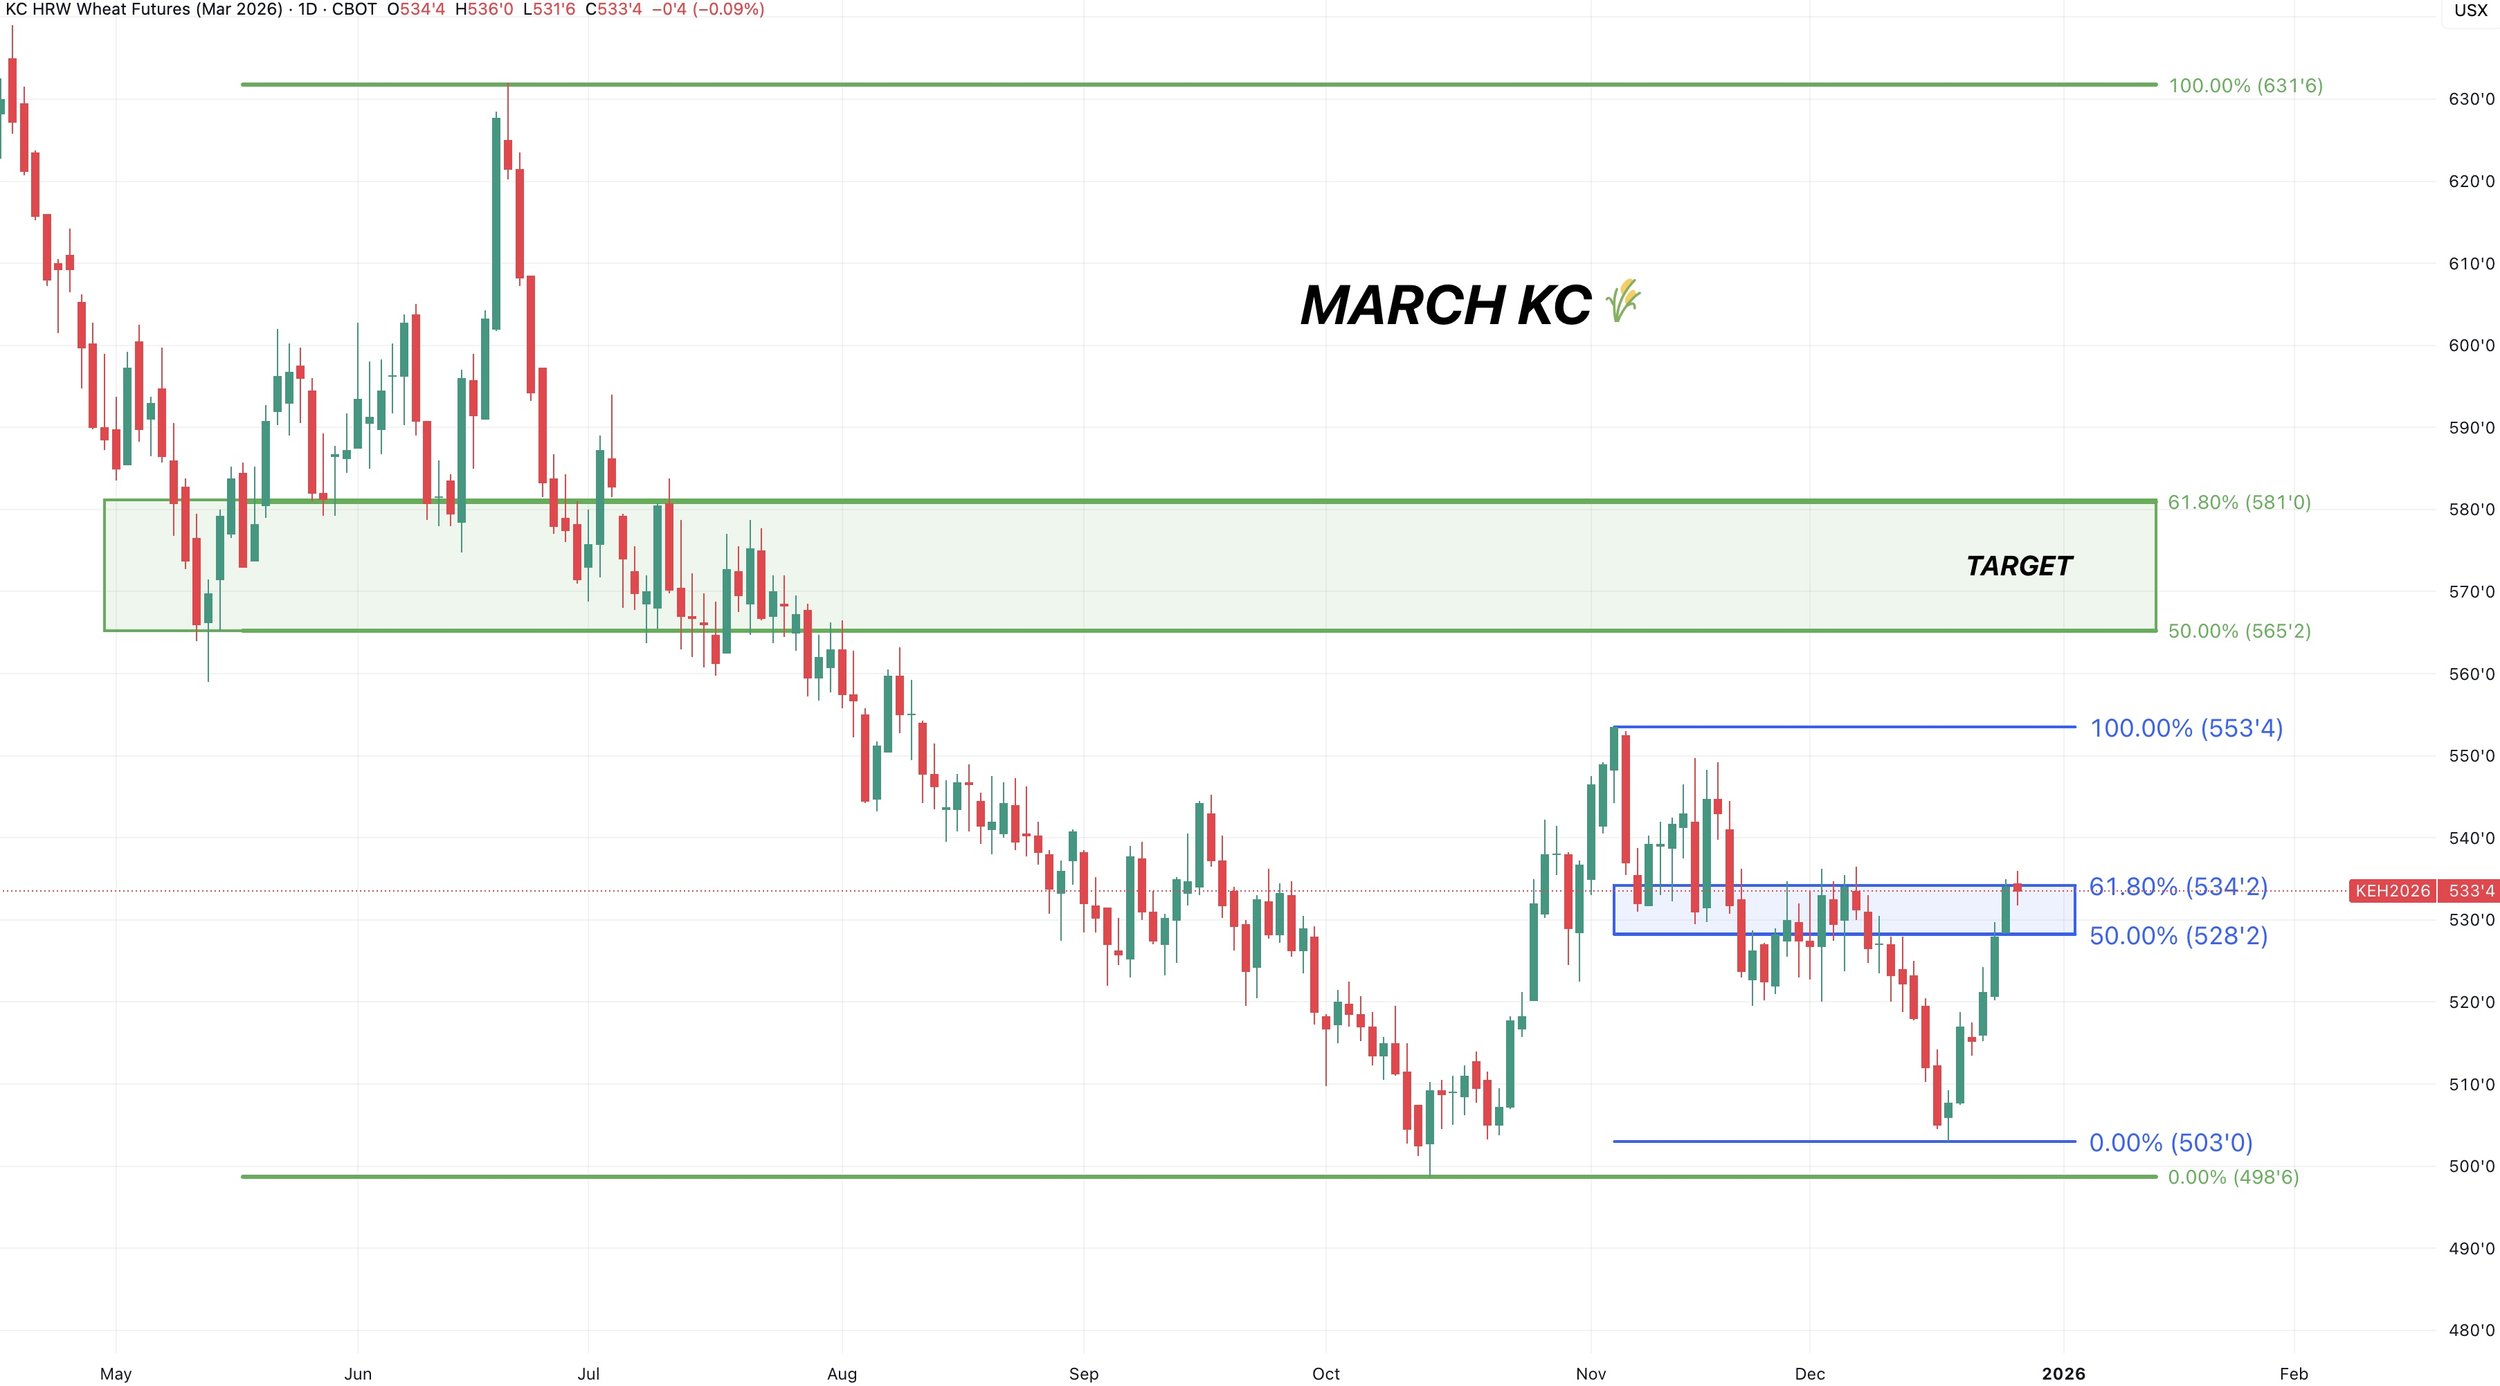
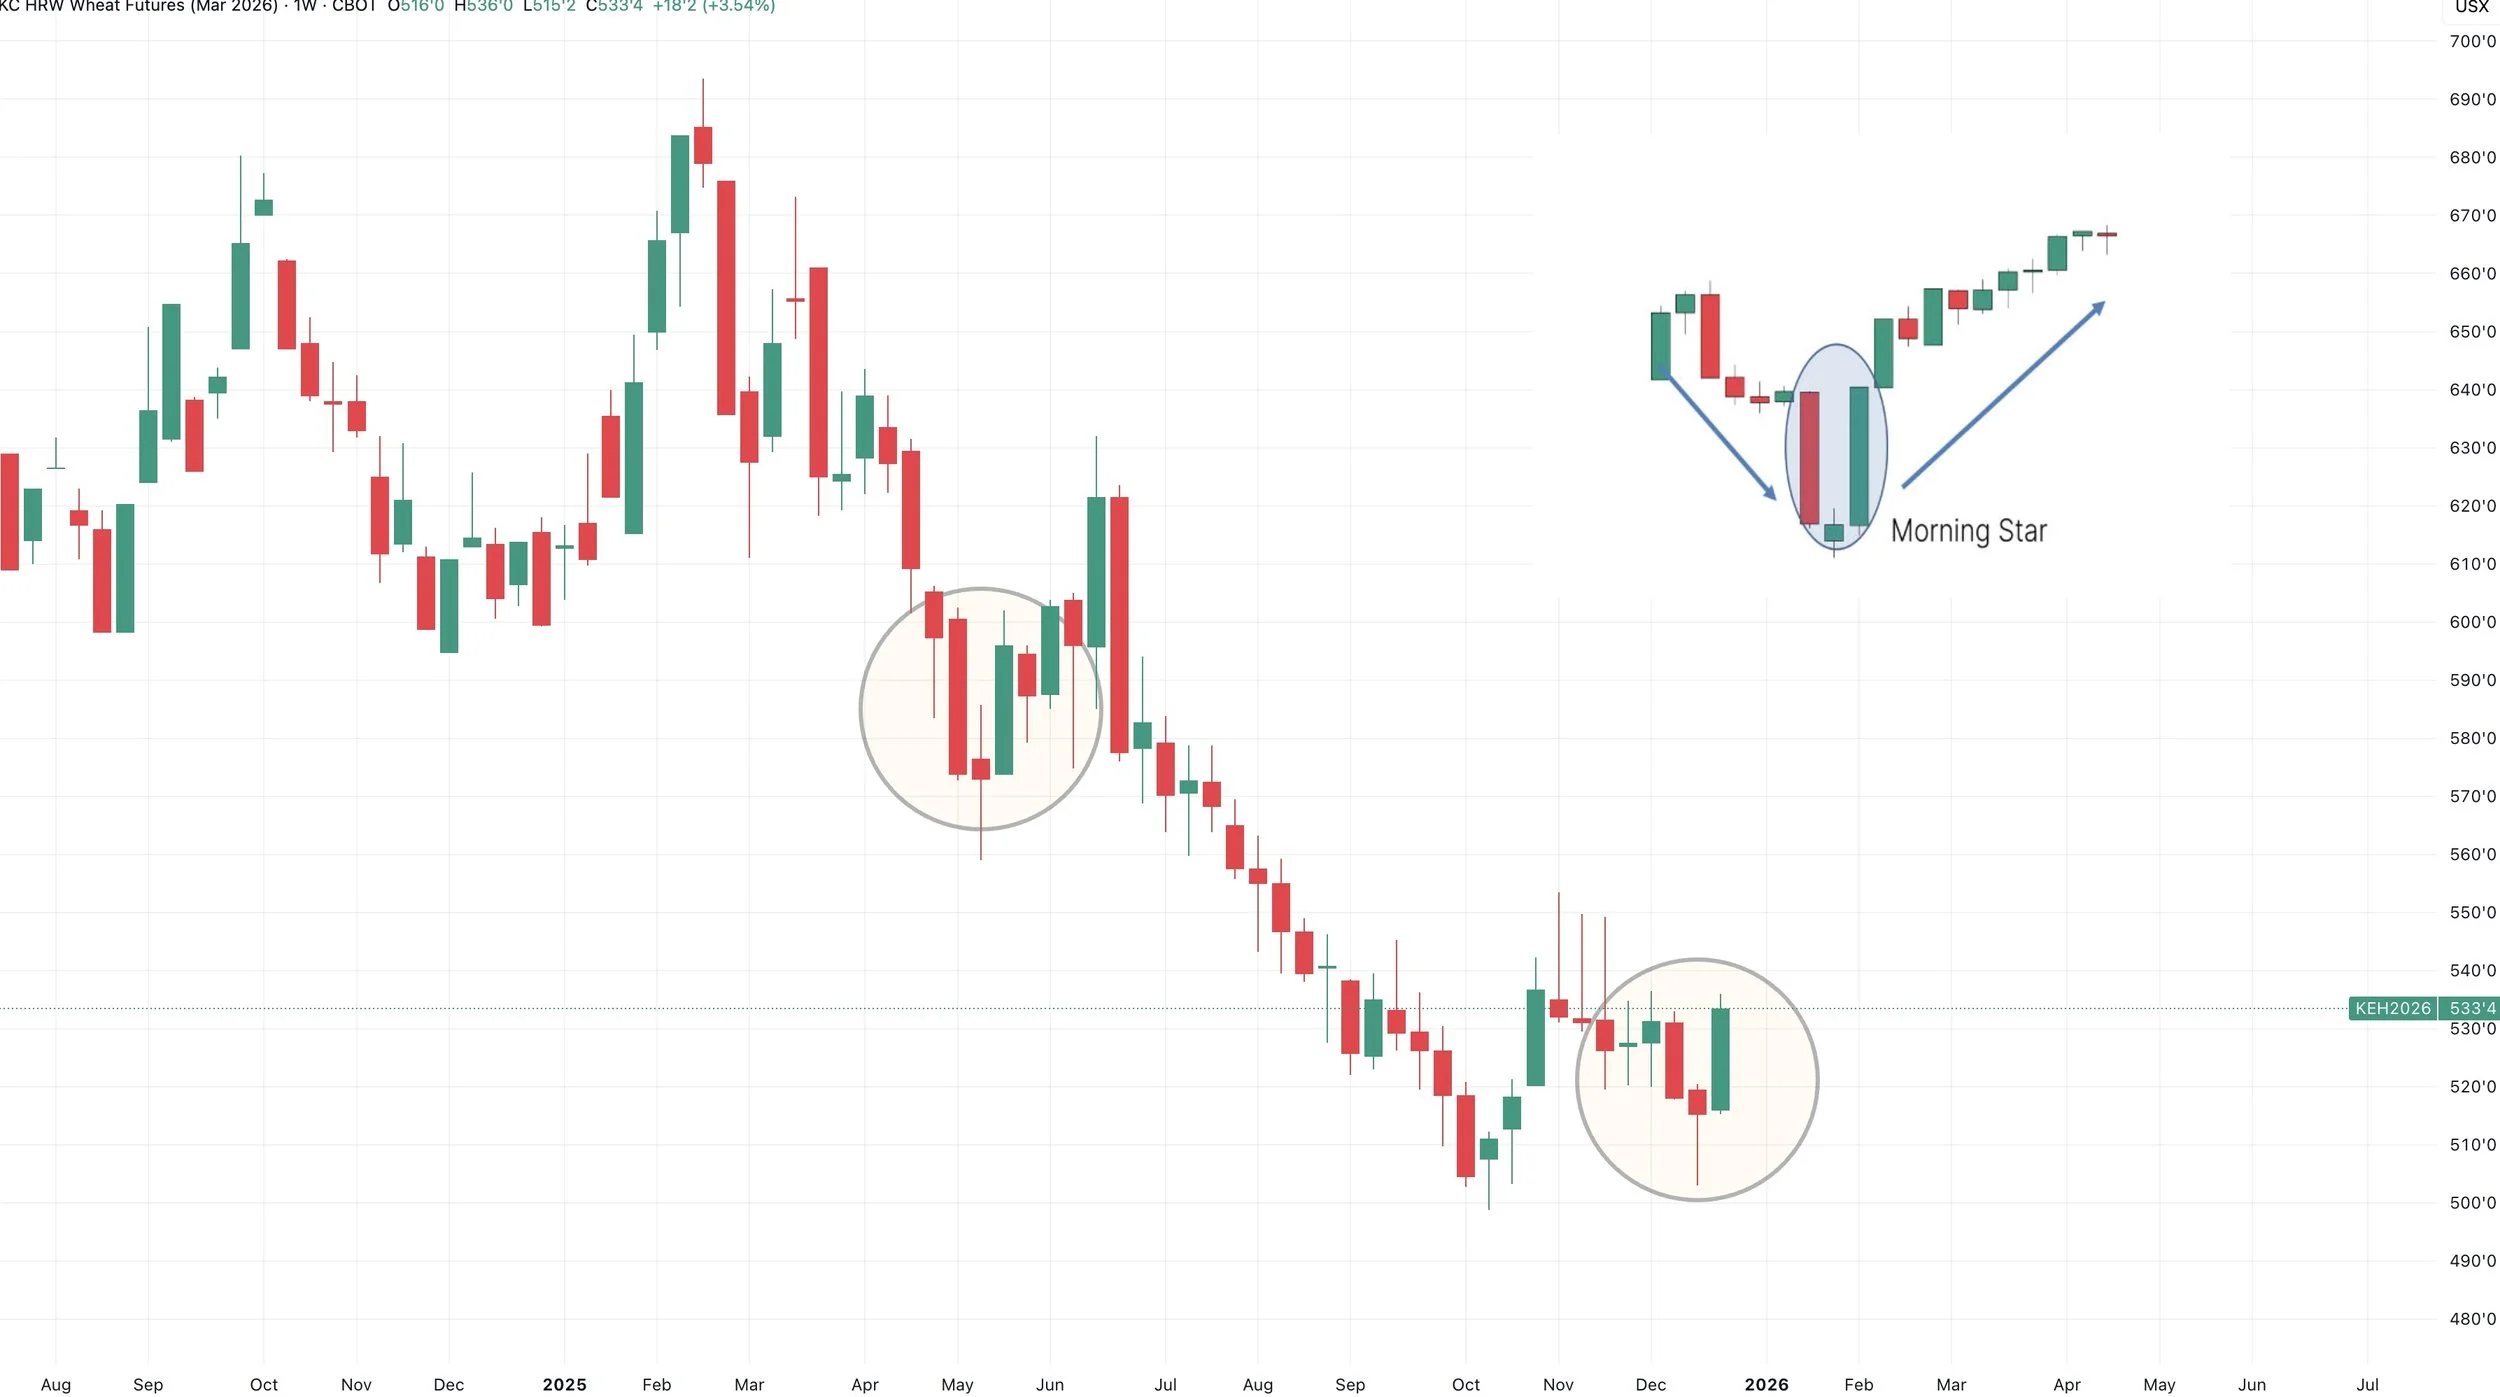
March KC Wheat
KC has perfectly clawed back 61.8% of the entire sell off.
Pretty important spot here.
It's where the market typically decides if this is simply a dead cat bounce of the start of something bigger.
It's where bounces tend to fail, but if we break above this level it would be our first sign that this market is potentially ready for a real move higher.
Still targeting the golden zone up to those June highs if it comes.
KC March Weekly Chart
The weekly chart does look pretty optimistic here.
We had the doji last week.
Followed it by strength this week.
Some would call this a morning star. Which is a pretty common reversal pattern.
We saw a very similar pattern on the June rally.
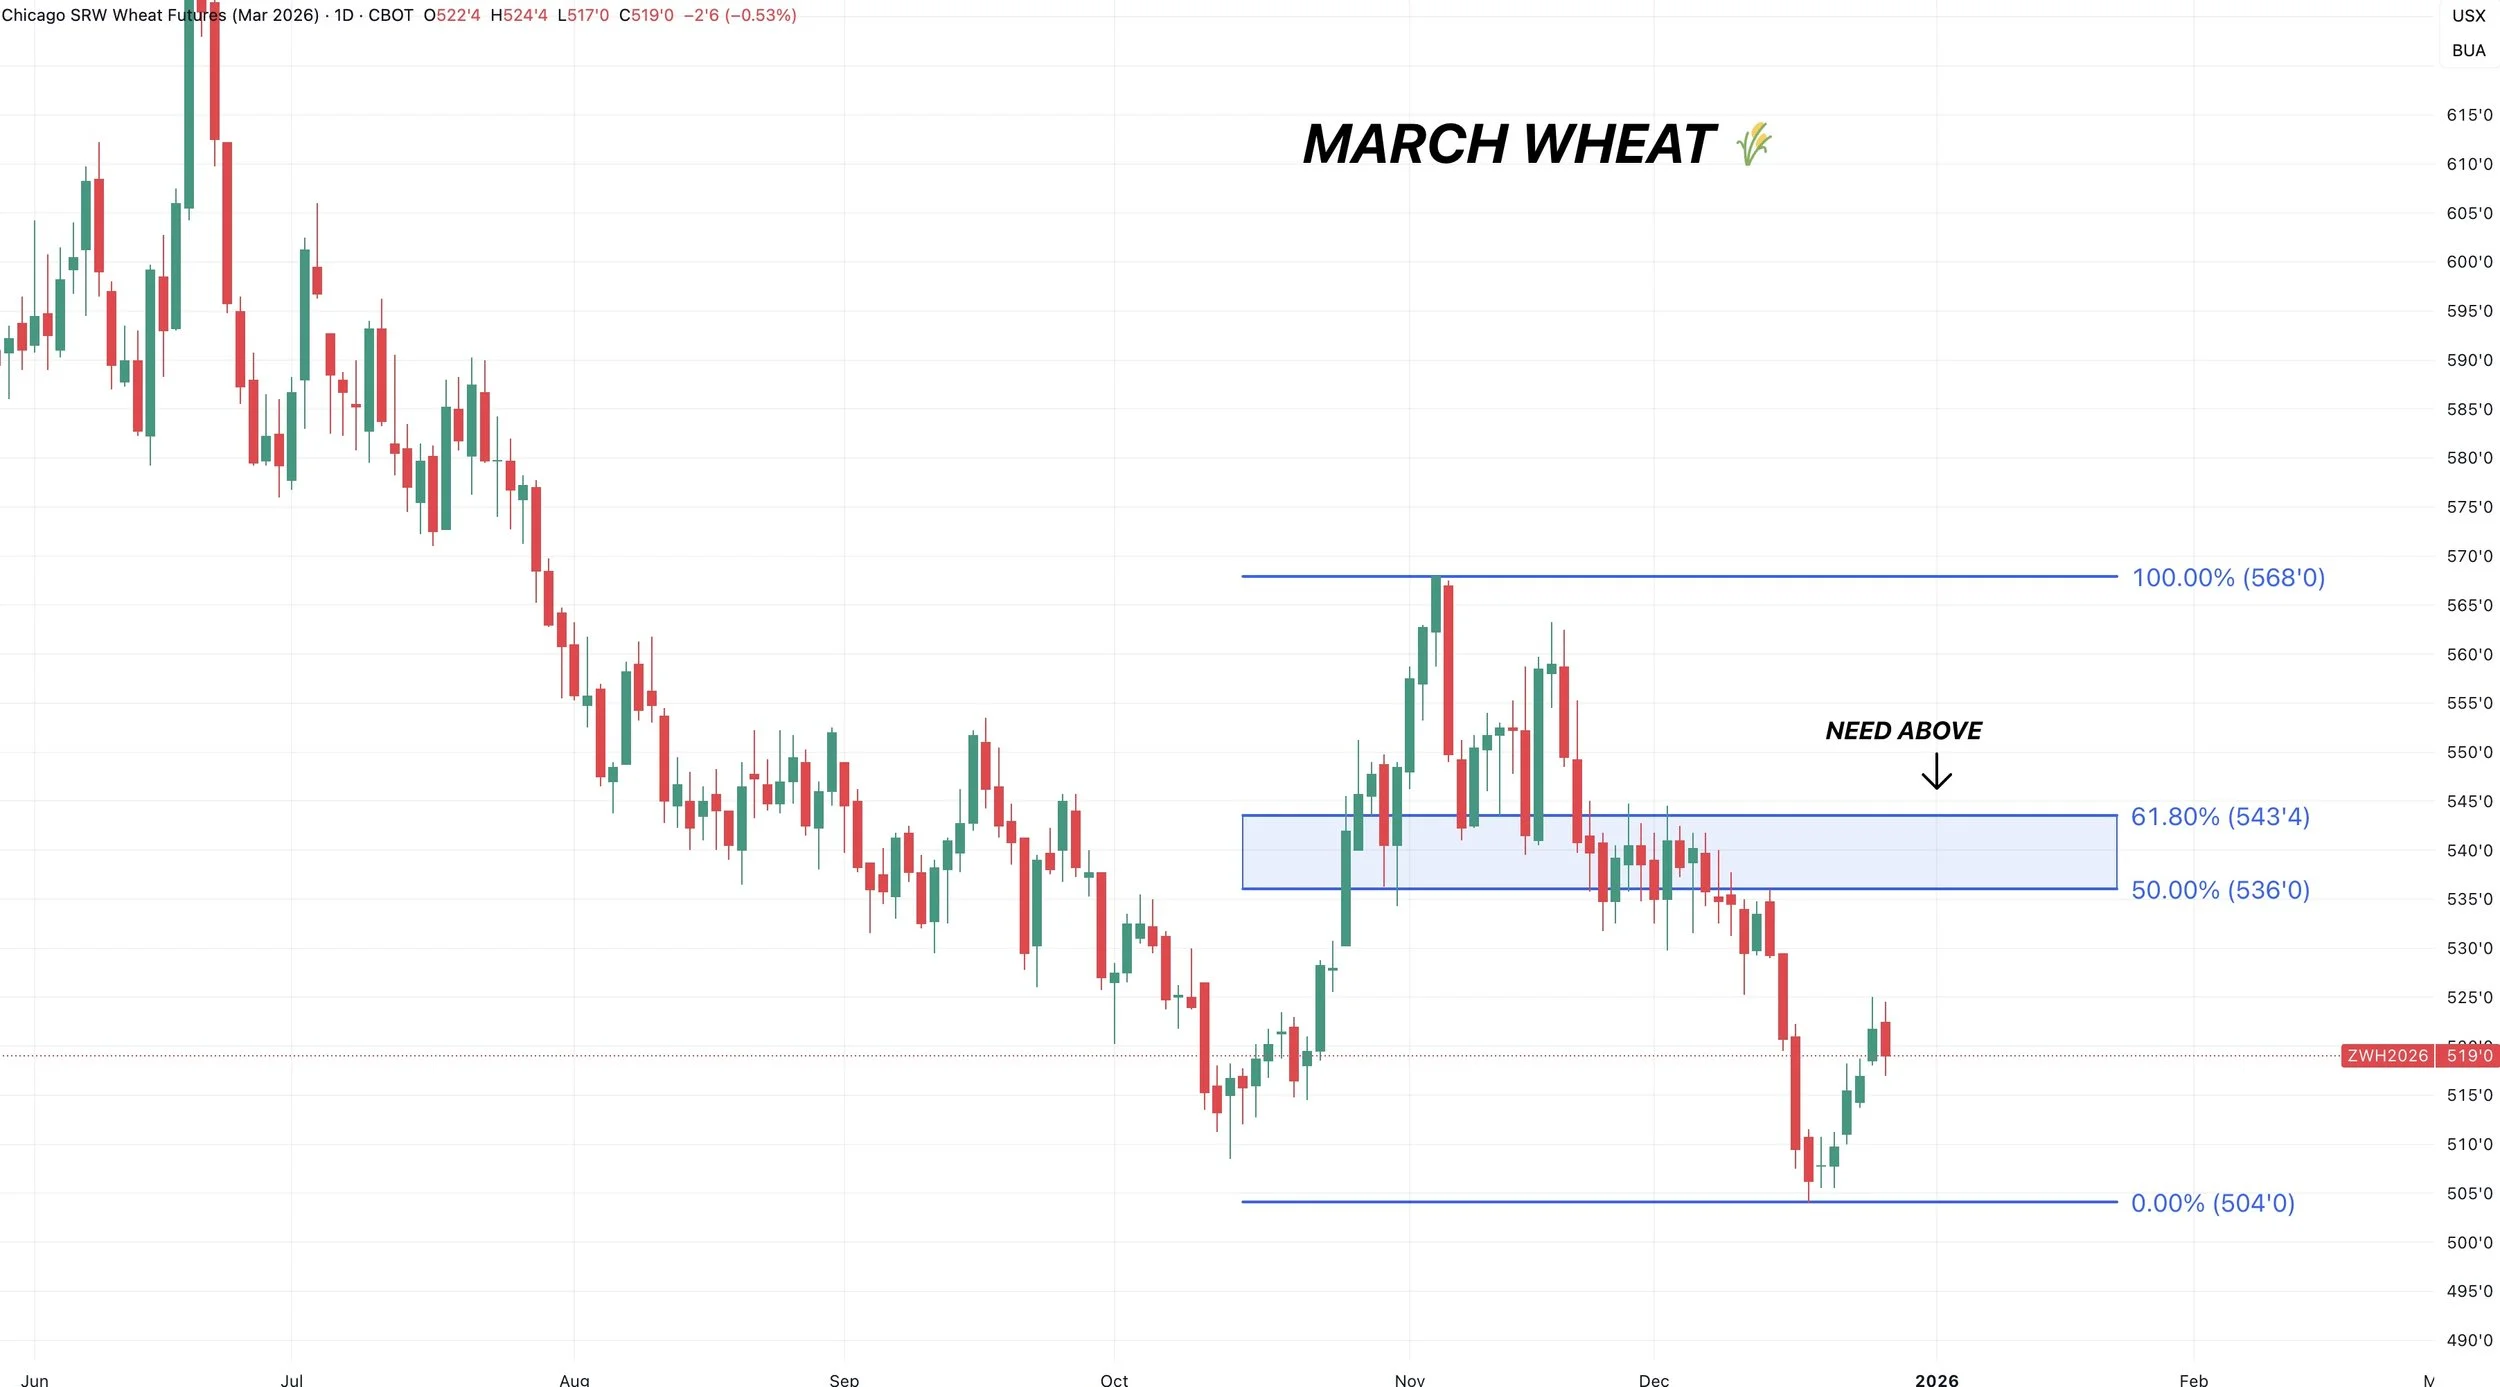
Dec Chicago Wheat
Not nearly as strong as KC.
Still need to clear the golden zone up to the recent highs to be confident we've posted some longer term lows and are ready for a real move higher.
We've seen a nice move, but need to see some more concrete evidence to believe this was truly the bottom.
Past Sell or Protection Signals
Dec 11th: 🐮
Cattle sell signal & hedge alert.
Dec 5th: 🐮
Cattle sell signal & hedge alert.
Nov 17th: 🌱
Soybean sell signal & hedge alert.
Nov 13th: 🌽 🌱
Managing risk in corn & beans ahead of USDA report.
Oct 28th: 🌽
Corn sell signal & hedge alert.
Oct 27th: 🌱
Soybean sell signal & hedge alert.
Oct 13th: 🐮
Cattle sell signal & hedge alert.
Aug 22nd: 🌱
Soybean sell signal & hedge alert.
July 31st: 🐮
Cattle sell signal & hedge alert.
July 10th: 🐮
Cattle sell signal & hedge alert.
CLICK HERE TO VIEW
June 5th: 🐮
Cattle sell signal & hedge alert.
June 2nd: 🌾
MPLS wheat sell signal.
April 10th: 🌽
Old crop corn sell signal.
March 19th: 🐮
Cattle hedge & sell signal.
Feb 18th: 🌽 🌾
Old crop KC wheat & old crop corn signal.
Jan 23rd: 🌽 🌱
Corn & beans old crop sell signal.
CLICK HERE TO VIEW
Jan 15th: 🌽 🌱
Corn & beans hedge alert/sell signal.
Jan 2nd: 🐮
Cattle hedge alert at new all-time highs & target.
Dec 11th: 🌽
Corn sell signal at $4.51 200-day MA
CLICK HERE TO VIEW
Oct 2nd: 🌾
Wheat sell signal at $6.12 target
Sep 30th: 🌽
Corn protection signal at $4.23-26
Sep 27th: 🌱
Soybean sell & protection signal at $10.65
Sep 13th: 🌾
Wheat sell signal at $5.98
May 22nd: 🌾
Wheat sell signal when wheat traded +$7.00
Want to Talk?
Our phones are open 24/7 for you guys if you ever need anything or want to discuss your operation.
Hedge Account
Interested in a hedge account? Use the link below to set up an account or shoot Jeremey a call at (605)295-3100.