
DOES HISTORY SUGGEST HIGHER CORN? COULD SOYBEANS HAVE BOTTOMED?
MARKET UPDATE (PREVIEW ONLY)
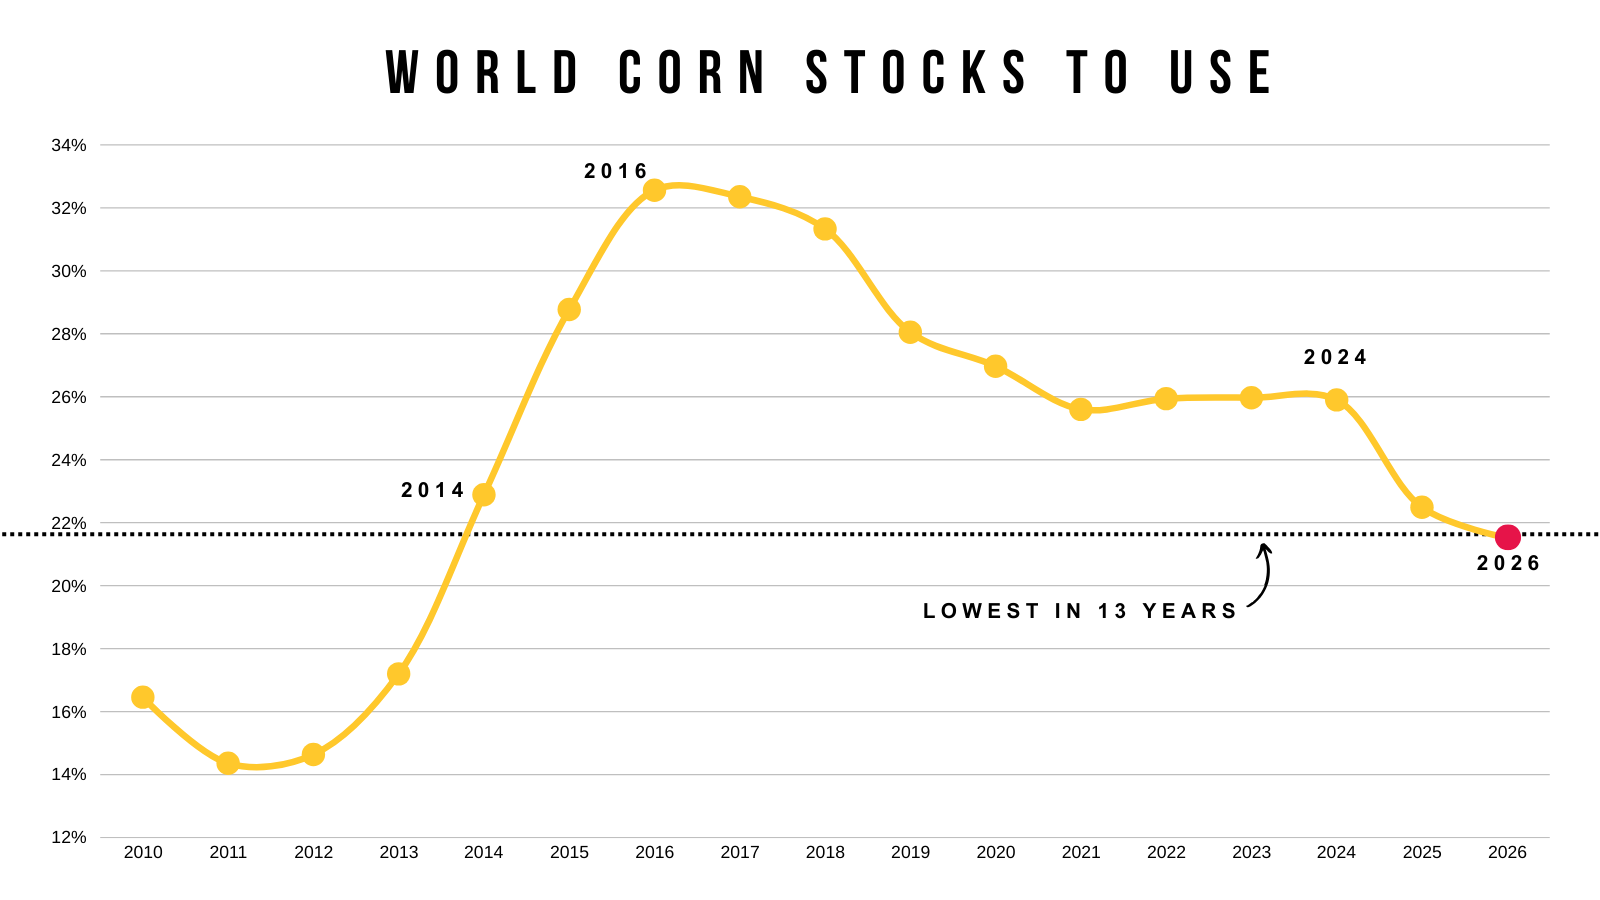
The world corn situation continues to be interesting.
It’s still the tightest in over a decade.
But this doesn’t really matter today.. given the US has a record crop.
However.. let’s just say we run into a weather scare next summer, well this chart would amplify the effects of that even more.
The world absolutely needs our corn.
Seasonally, we are entering a pretty friendly time frame for corn.
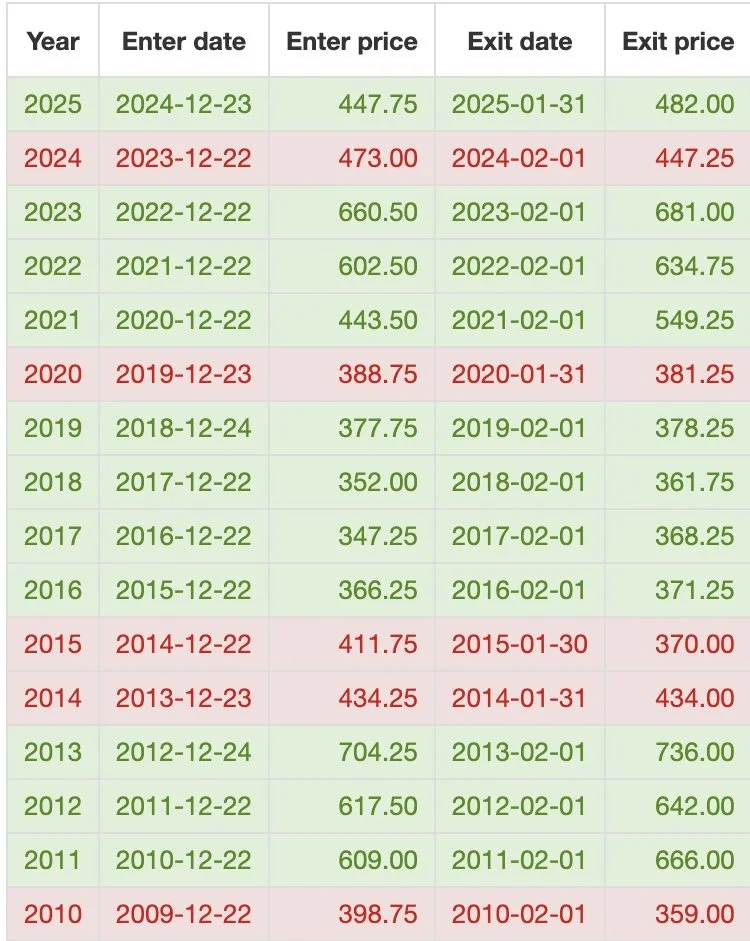
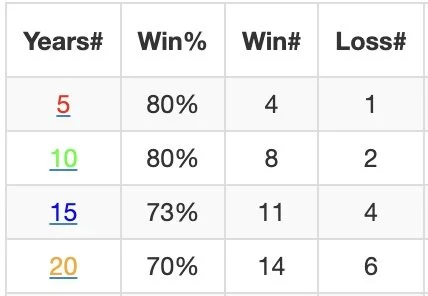
How often does corn trade higher from today until February 1st?
Here is the data:
We’ve traded higher..
The last 4 of 5 years.
The last 8 of 10 years.
The last 11 of 15 years.
The only two losers were 2020 and 2024.
So historically, the corn market does tend to trade higher from now until February.
Late last week we issued a buy zone alert for soybeans that was sent to subscribers.
Click Here: Breakdown of that Signal
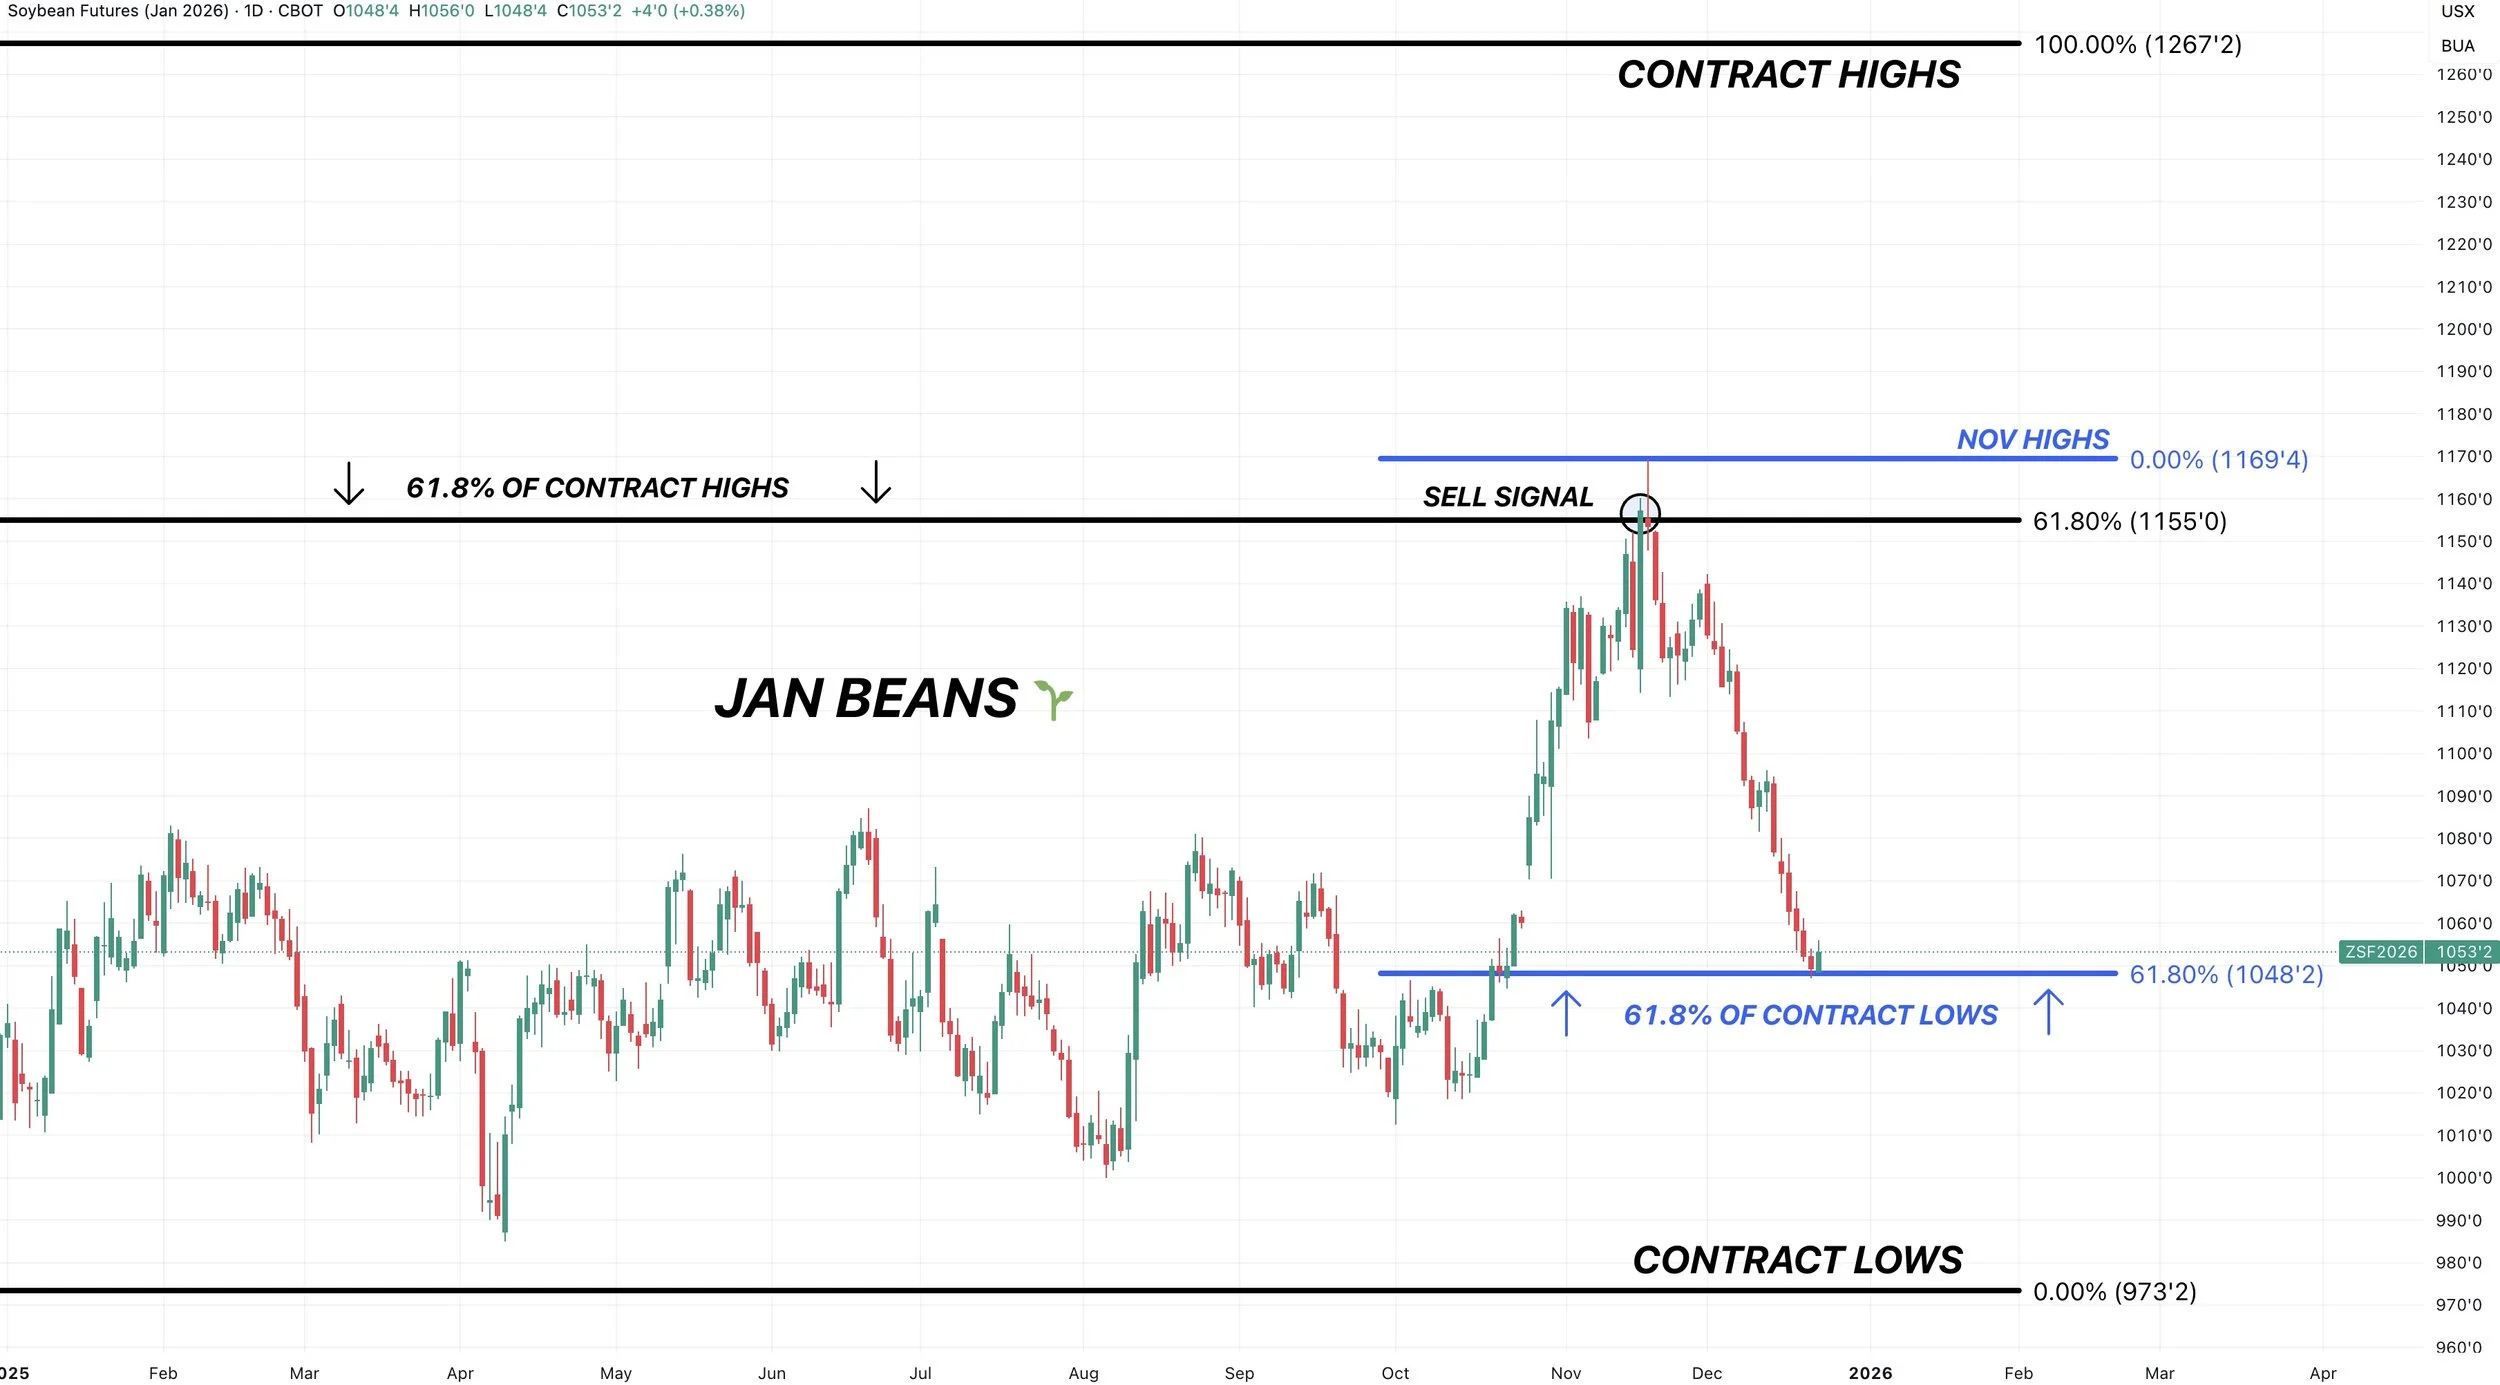
It was for those that took advantage of our $11.55 sell signal. This is where we liked taking profit and was an area to consider re-owning for those that have interest in doing so.
The downside targets were $10.48 for Jan and $10.59 for March soybeans.
Why did we alert this?
The top in Jan soybeans occured after clawing back 61.8% of the contract highs.
Which is where we ultimately failed at.
We’ve now sold off and given back 61.8% of the contract lows.
The level the market often reverts back to before making a decision.
Let’s say this was the bottom. How high of relief bounce could we expect?
Currently soybeans are showing……….
Today’s full update & video is for subscribers only.
This was only a small portion of today’s update.
Today we go over:
How high does corn seasonally go?
Could soybeans have posted their local lows?
Fundamental & technical breakdowns
Subscribe if you’d like to gain full access to our updates & signals.
For the holidays we are offering our biggest discount of the year.
Past Sell or Protection Signals
Dec 11th: 🐮
Cattle sell signal & hedge alert.
Dec 5th: 🐮
Cattle sell signal & hedge alert.
Nov 17th: 🌱
Soybean sell signal & hedge alert.
Nov 13th: 🌽 🌱
Managing risk in corn & beans ahead of USDA report.
Oct 28th: 🌽
Corn sell signal & hedge alert.
Oct 27th: 🌱
Soybean sell signal & hedge alert.
Oct 13th: 🐮
Cattle sell signal & hedge alert.
Aug 22nd: 🌱
Soybean sell signal & hedge alert.
July 31st: 🐮
Cattle sell signal & hedge alert.
July 10th: 🐮
Cattle sell signal & hedge alert.
CLICK HERE TO VIEW
June 5th: 🐮
Cattle sell signal & hedge alert.
June 2nd: 🌾
MPLS wheat sell signal.
April 10th: 🌽
Old crop corn sell signal.
March 19th: 🐮
Cattle hedge & sell signal.
Feb 18th: 🌽 🌾
Old crop KC wheat & old crop corn signal.
Jan 23rd: 🌽 🌱
Corn & beans old crop sell signal.
CLICK HERE TO VIEW
Jan 15th: 🌽 🌱
Corn & beans hedge alert/sell signal.
Jan 2nd: 🐮
Cattle hedge alert at new all-time highs & target.
Dec 11th: 🌽
Corn sell signal at $4.51 200-day MA
CLICK HERE TO VIEW
Oct 2nd: 🌾
Wheat sell signal at $6.12 target
Sep 30th: 🌽
Corn protection signal at $4.23-26
Sep 27th: 🌱
Soybean sell & protection signal at $10.65
Sep 13th: 🌾
Wheat sell signal at $5.98
May 22nd: 🌾
Wheat sell signal when wheat traded +$7.00
Want to Talk?
Our phones are open 24/7 for you guys if you ever need anything or want to discuss your operation.
Hedge Account
Interested in a hedge account? Use the link below to set up an account or shoot Jeremey a call at (605)295-3100.