
AREAS TO CONSIDER DE-RISKING & WHY
MARKET UPDATE
You can scroll to read the usual update as well. As the written version is the exact same as the video.
Timestamps for video:
Overview: 0:00min
Corn: 7:15min
Beans: 10:15min
Wheat: 12:00min
Cattle: 13:00min
Want to talk about your situation?
(605)250-3863
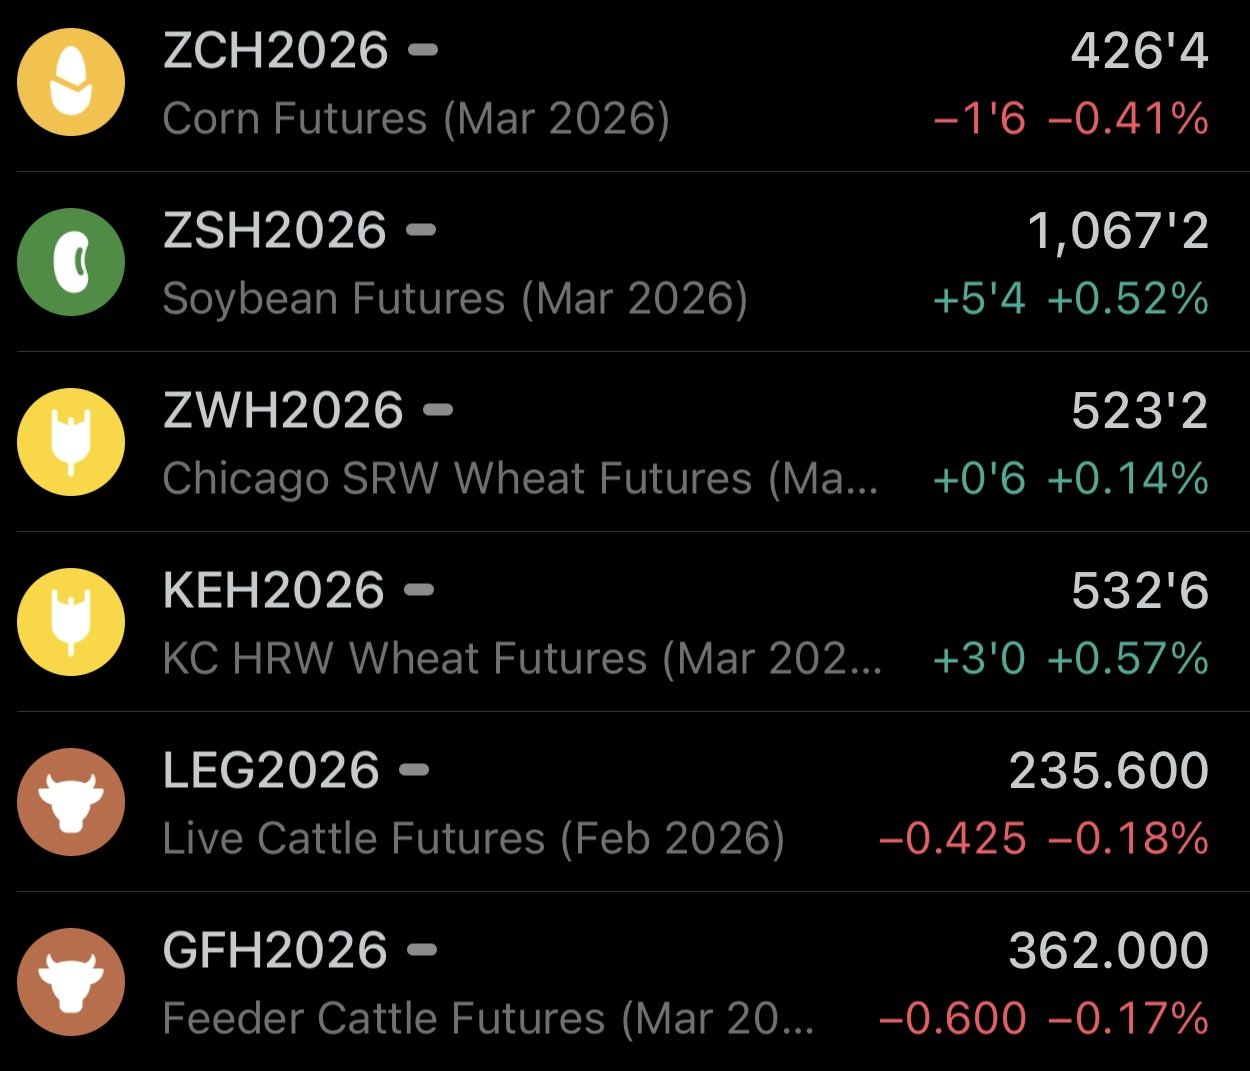
Futures Prices Close
Overview
Grains mixed with soybeans leading the way higher.
News in the grains has been somewhat quiet, with silver and gold stealing most of the show.
Trump will be talking in Iowa this afternoon.
By the time this video is out, he may have already given his speech, but we'll have to wait and see if he has anything to say regarding ethanol or biofuels.
My personal hopes aren’t too high. Last time he spoke, we had those rumors about a China deal that was ultimately a flop.
Today's update is going to be in a little different format than usual.
We are mainly going to be going over the charts, as there haven’t been any major changes fundamentally.
We'll be going over things we are watching on the charts and how we decide when it's a good area to be taking some risk off the table. As we are sitting at some key levels and or nearing some target areas on a few of them.
But first, let's jump into a little bit of the news and a few fundamental factors.
Another Gov Shutdown?
Like we talked about yesterday, the odds for another government shutdown on Jan 31st (this Saturday) skyrocketed over the weekend.
This weekend, the odds were 9%.
They are now sitting at 79%.

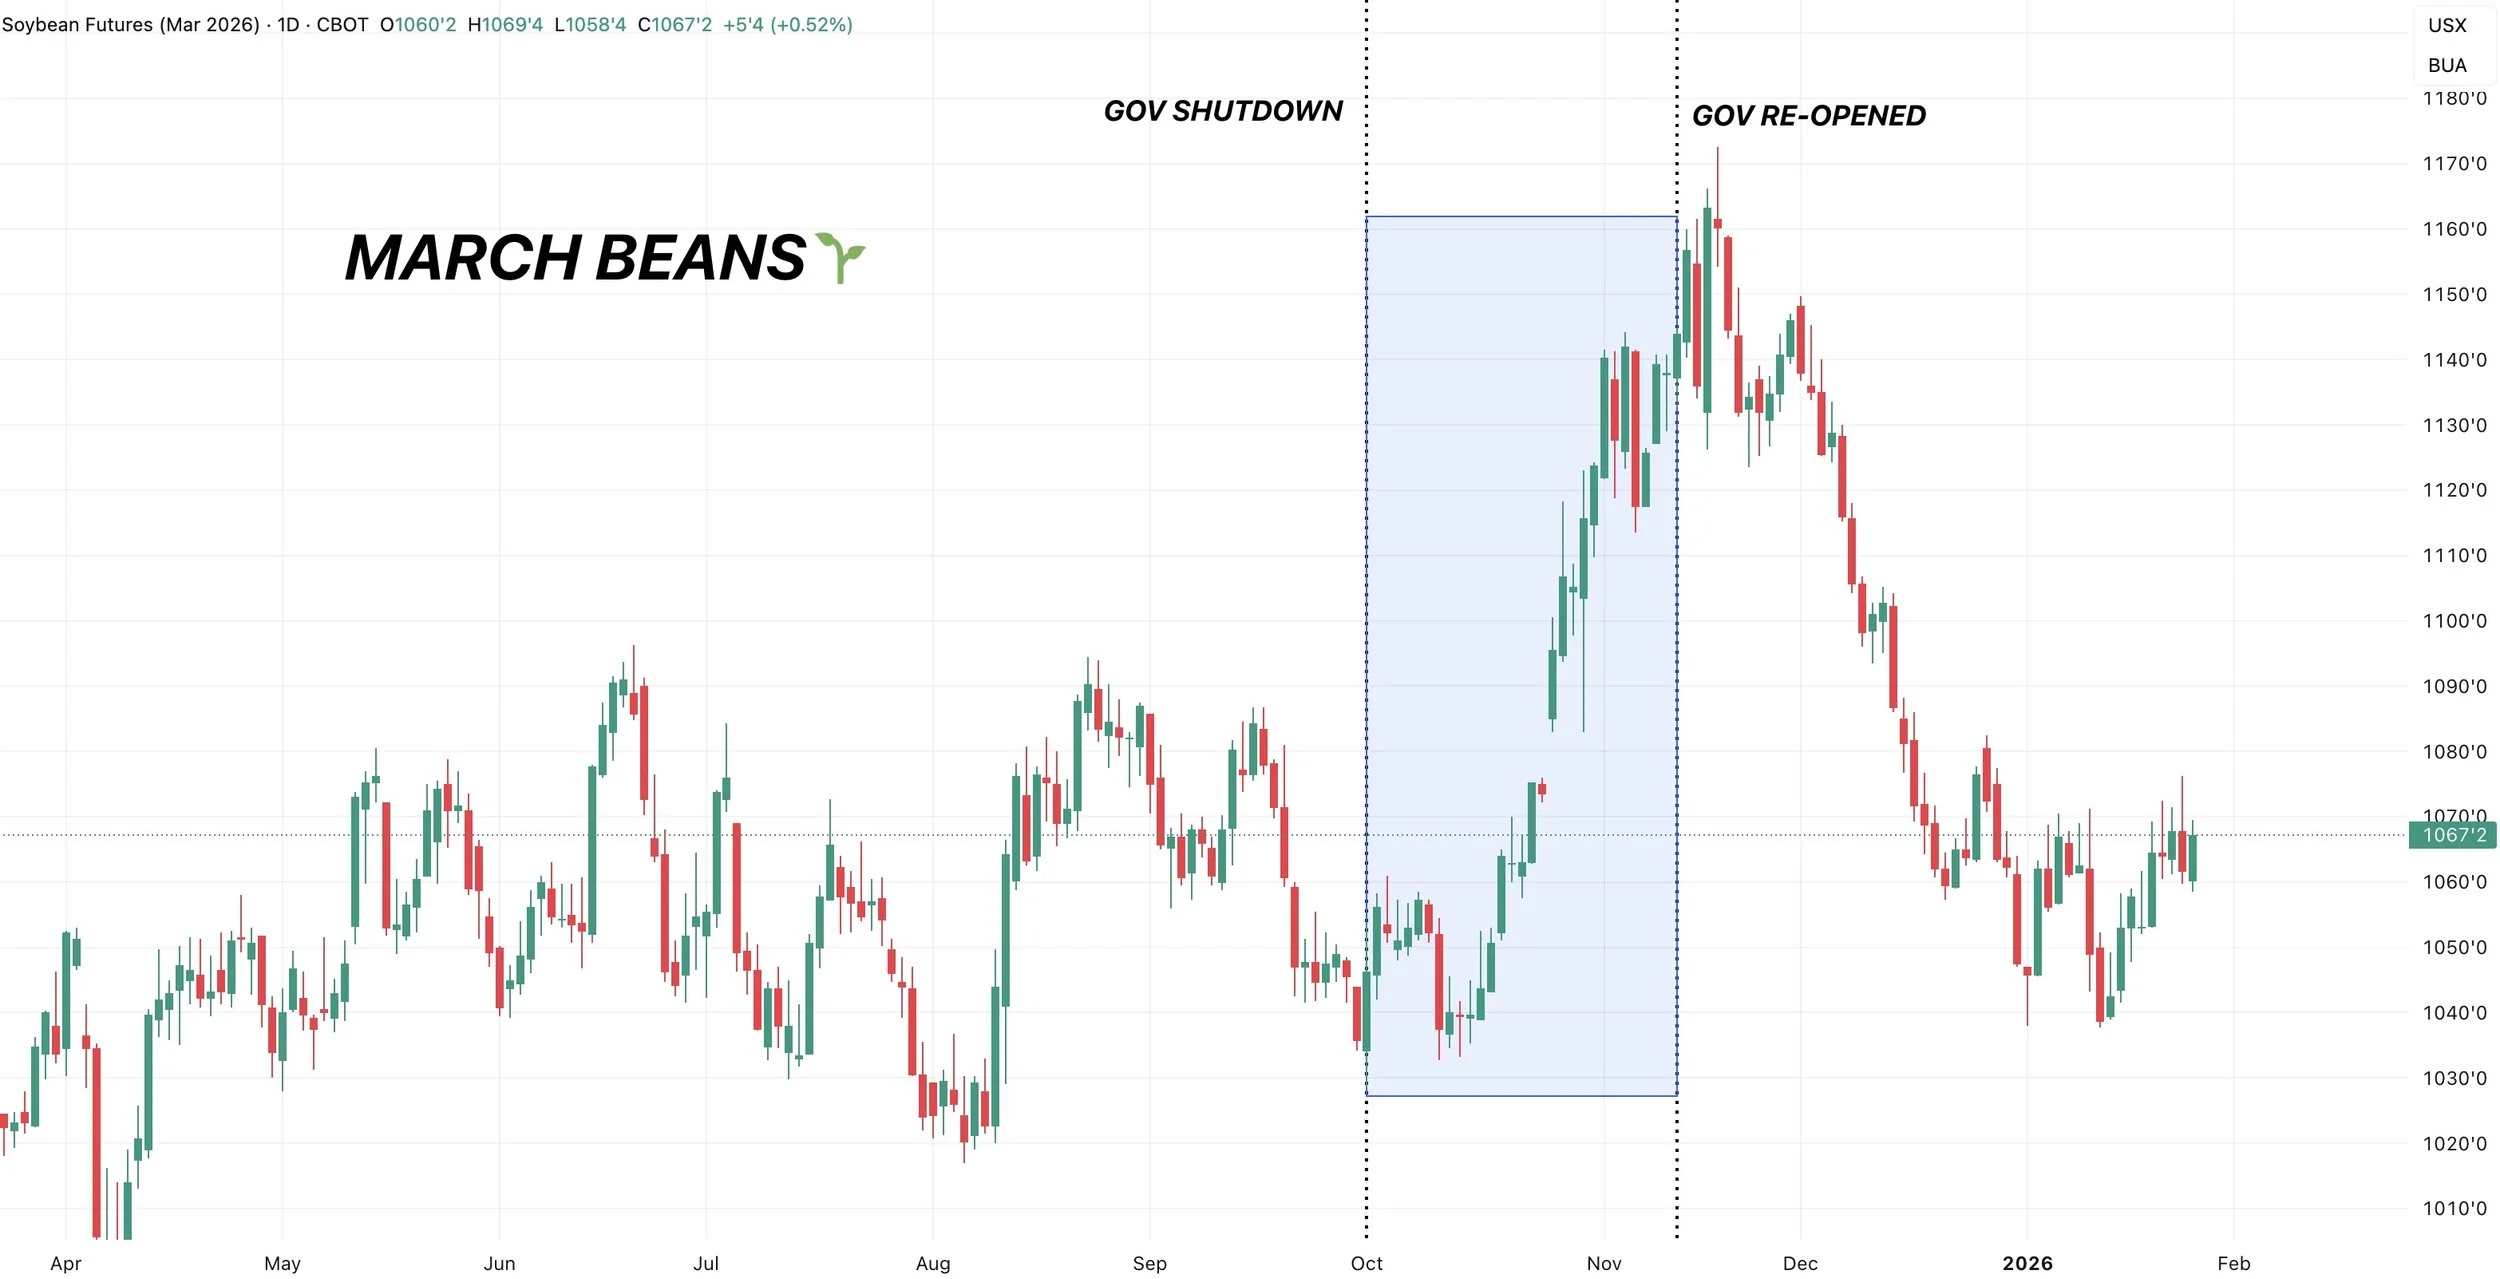
Some are arguing that this is bullish for grains because last time the government shutdown, we rallied.
The moment the government reopened, prices sold off. Soybeans specifically.
Fair argument, but it's not that black and white.
The market is working with a lot of different sets of data now, given that we got that January report.
Last time the market was pricing in cuts to corn yield. We were still receiving export inspections, which were great for corn. Meanwhile, soybeans were rallying off the back of the China news.
There was a lot of unanswered questions back then.
A government shutdown now could arguably do more harm than good here.
As if the government shuts down again this weekend, the big issue would be those bridge payments.
Those were expected to be sent at the end of February. If they shut down, those payments could be delayed.
If the payments get delayed, not only will the guys not be getting the money at the time they expect, but this could impact farmer selling as well.
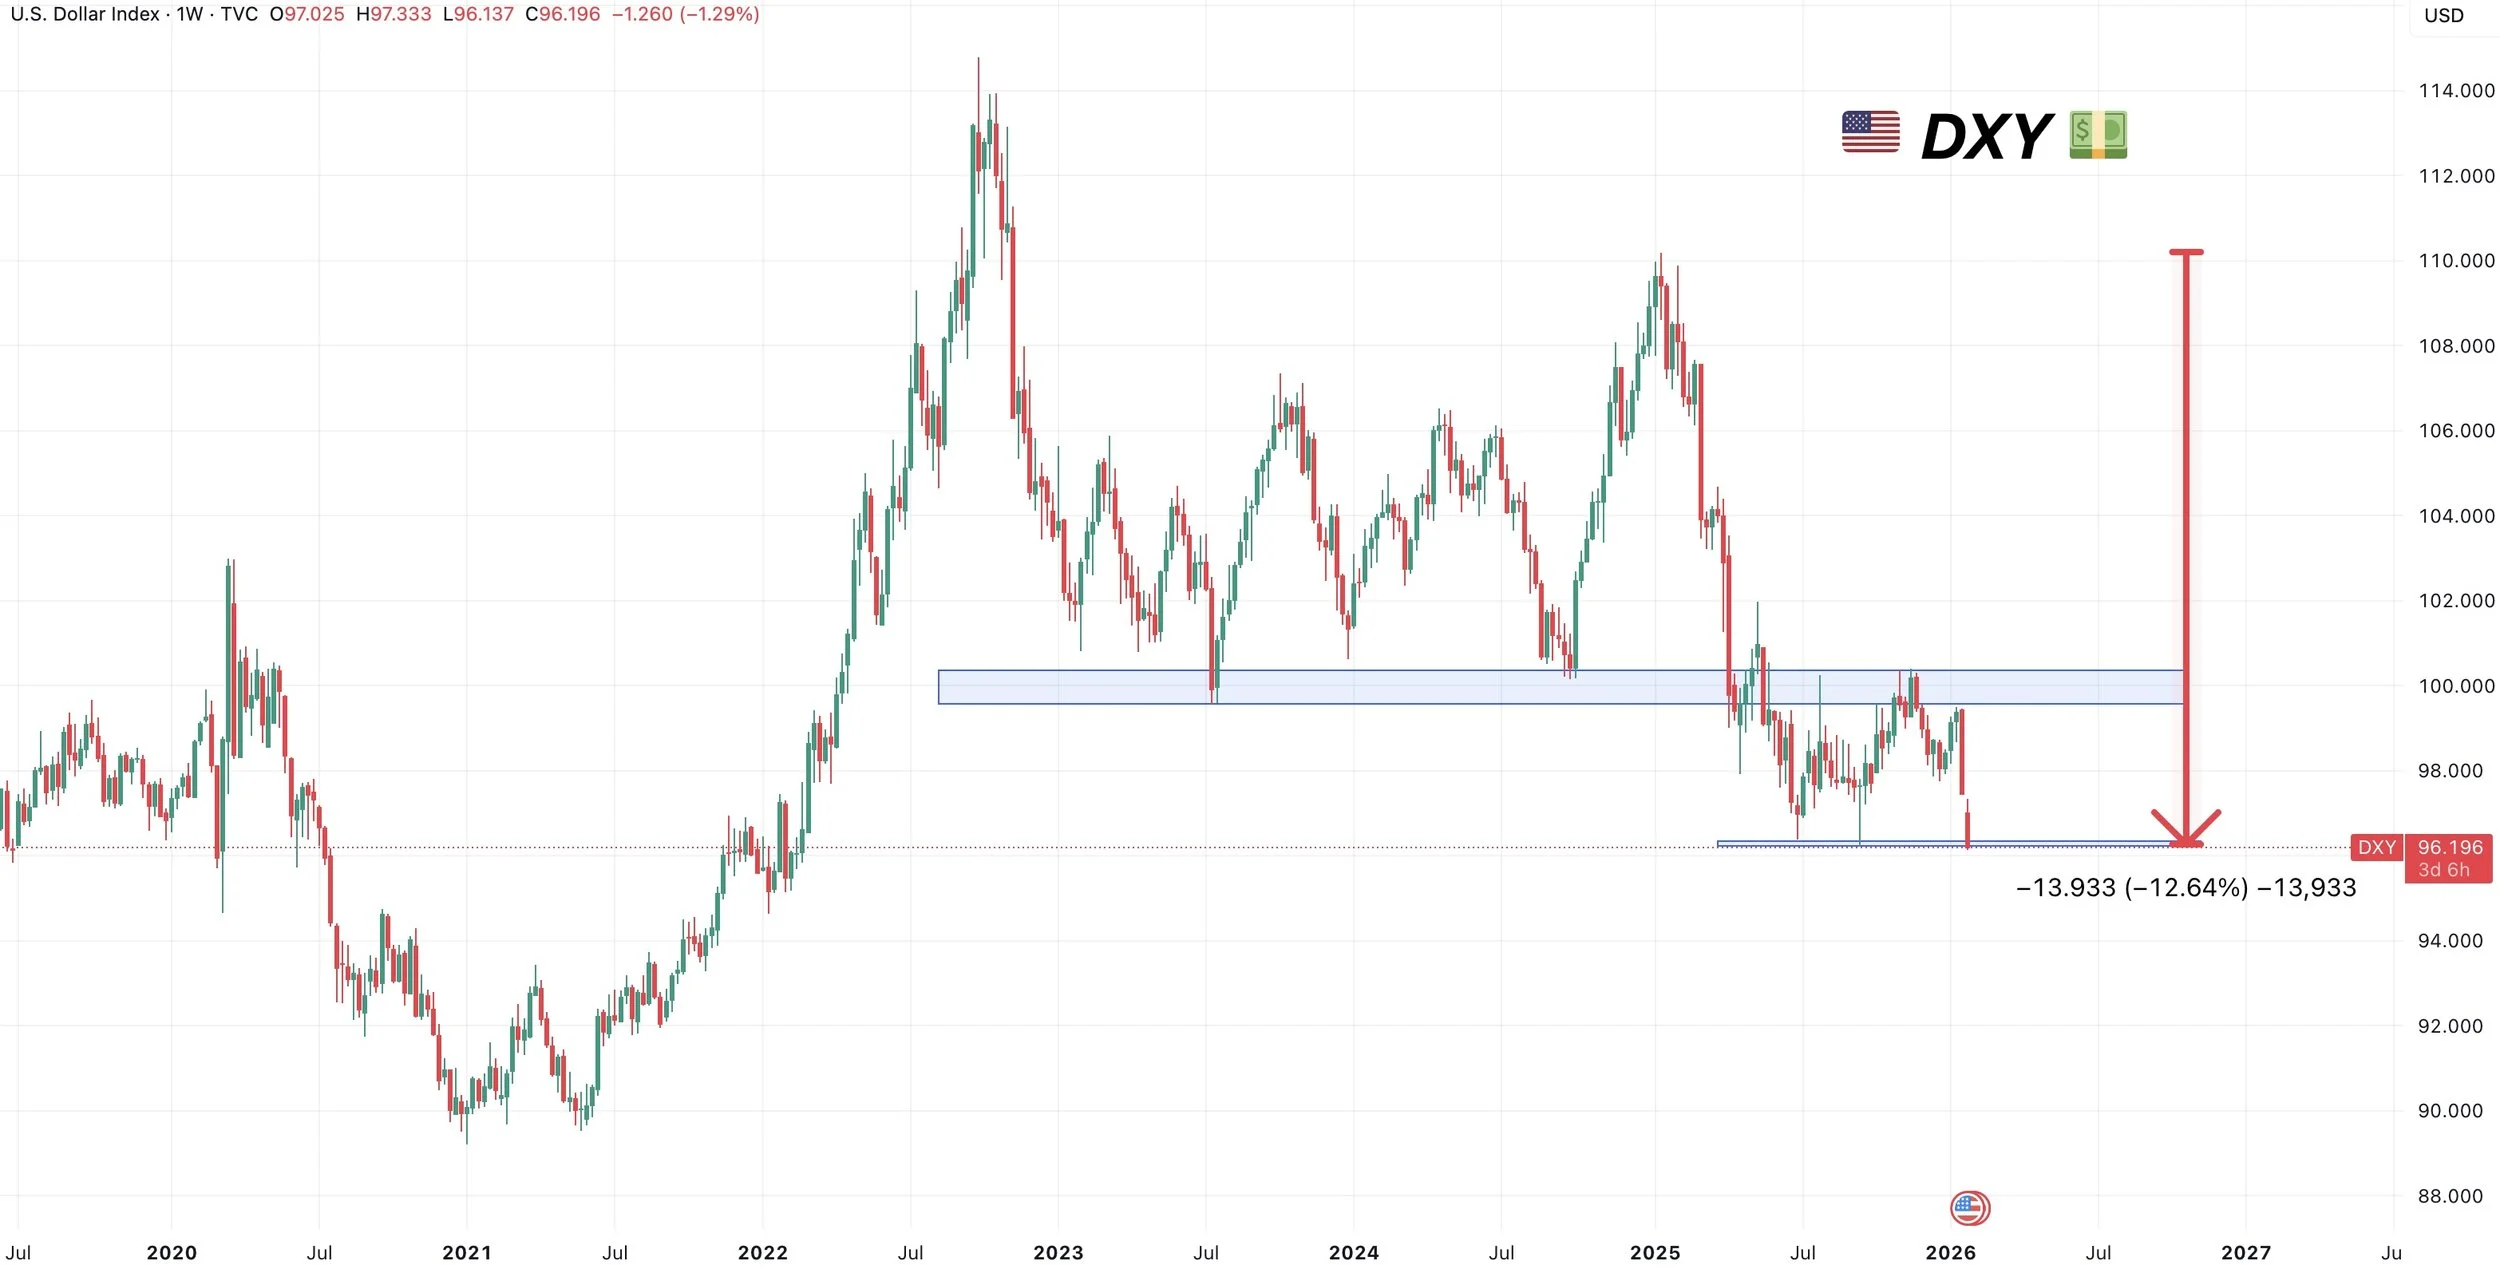
US Dollar Tanking
The US dollar is down almost -13% since the start of 2025.
Sitting at it's lowest levels in 4-years.
A complete falling knife and free fall.
We are about to breach some pretty important support, so it looks like this should continue to head lower.
This should help demand even further and continue to keep the US that much more competitive.
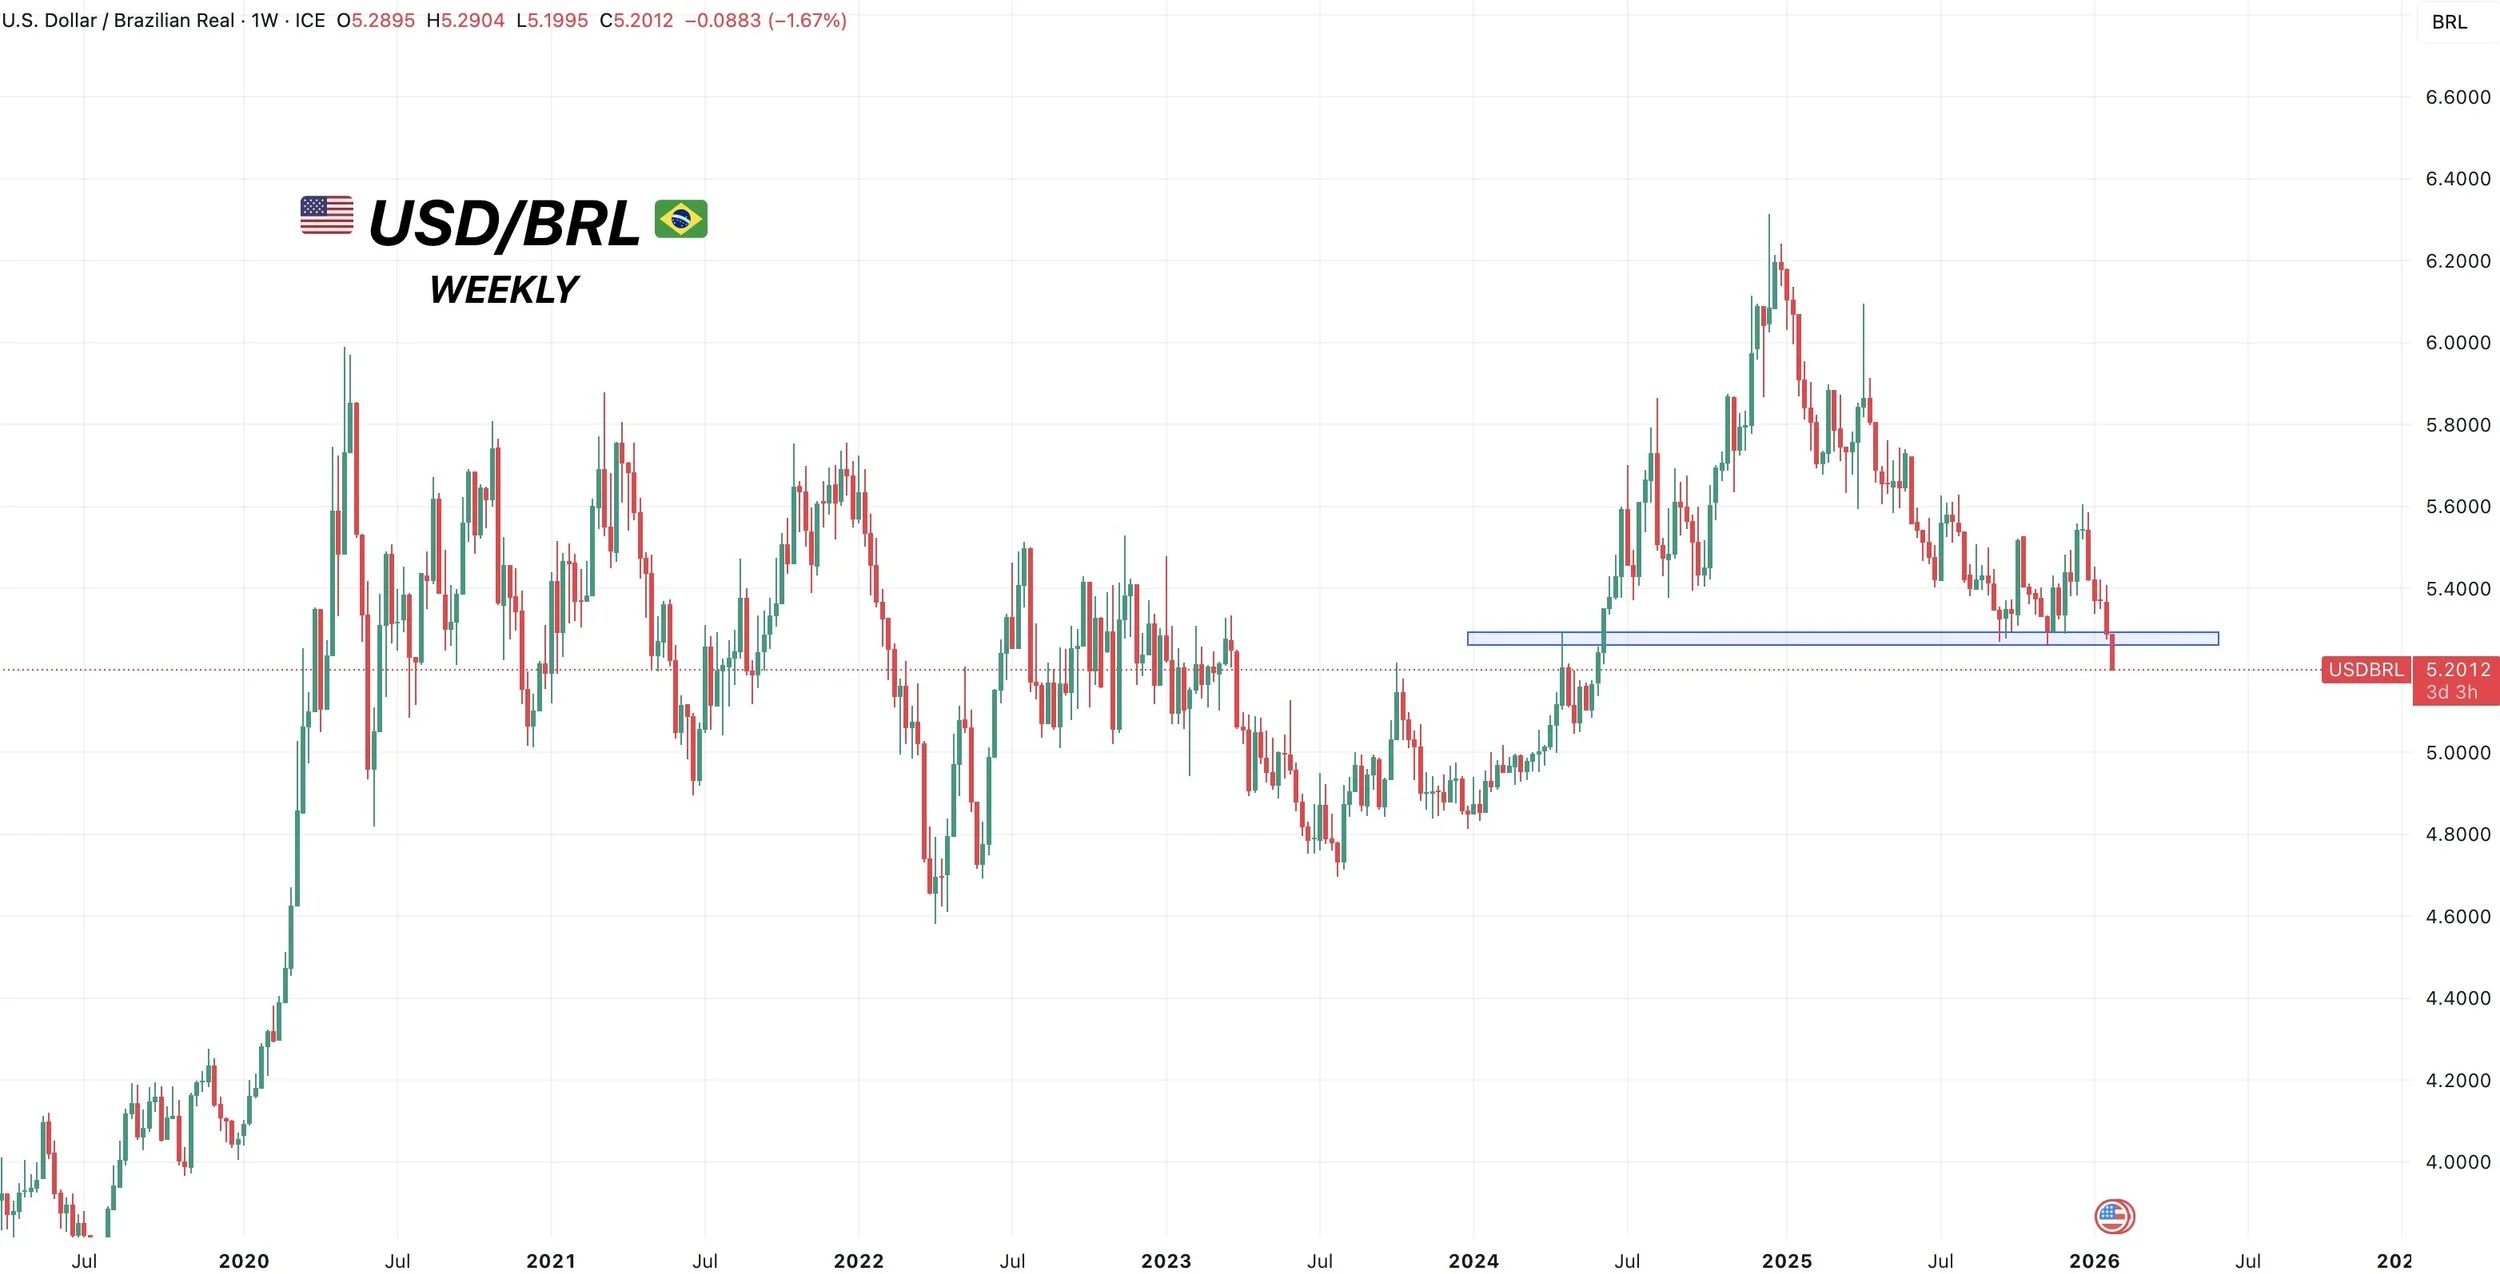
Here is the US dollar vs the Brazilian Real.
The US dollar is the weakest it's been in years, at the same time the Brazilian Real is strong due to high interest rates in Brazil.
As a result, this chart broke some pretty clear key support, and it looks like it should continue to fall.
This is supportive for soybeans.
It's declined heavily since last year. If it weren’t for this, soybeans could arguably be decently lower than they are today.
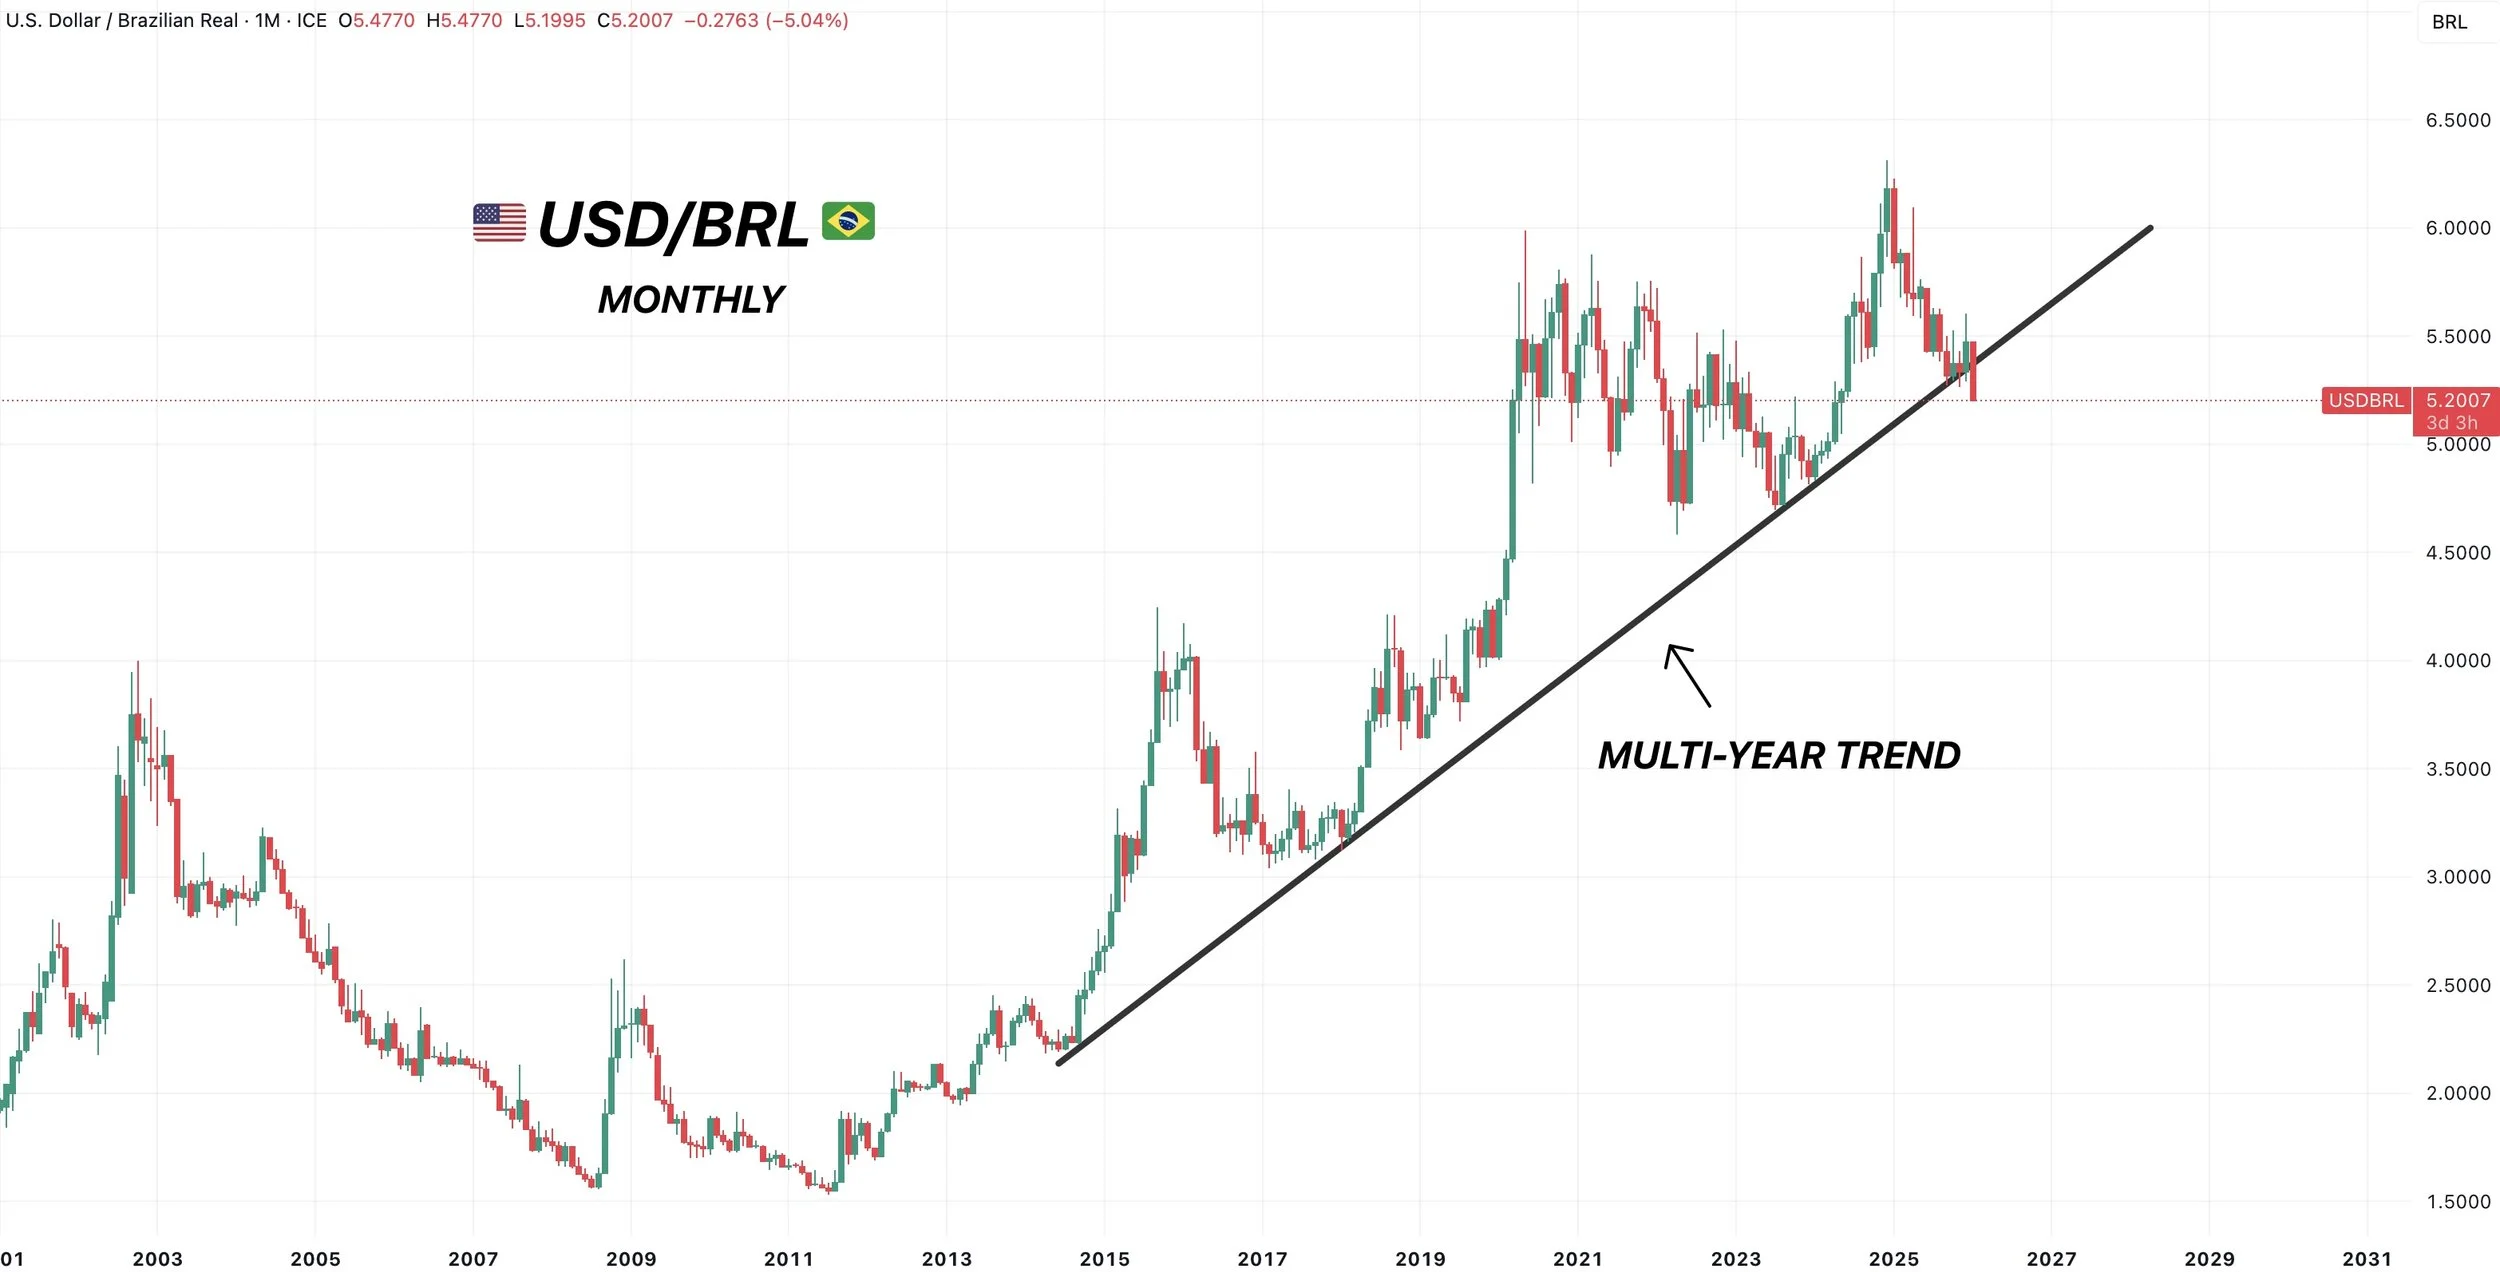
Yes, Brazil has a monster crop coming online here soon.
Yes, Brazil's soybeans are a lot cheaper than ours.
Yes, China seasonally pivots to buying Brazil soybeans vs ours.
But seeing the US dollar to Brazil Real drop helps offset some of that negativity and helps stop their record crop from completely flooding the market. Because this helps narrow Brazil's advantage and discourages farmer selling.
It's not some factor that is going to make soybeans rally $1.00 out of nowhere, because Brazil has a massive supply. But it's supportive and helps make that massive supply less bearish.
Weekly Chart
Monthly Chart
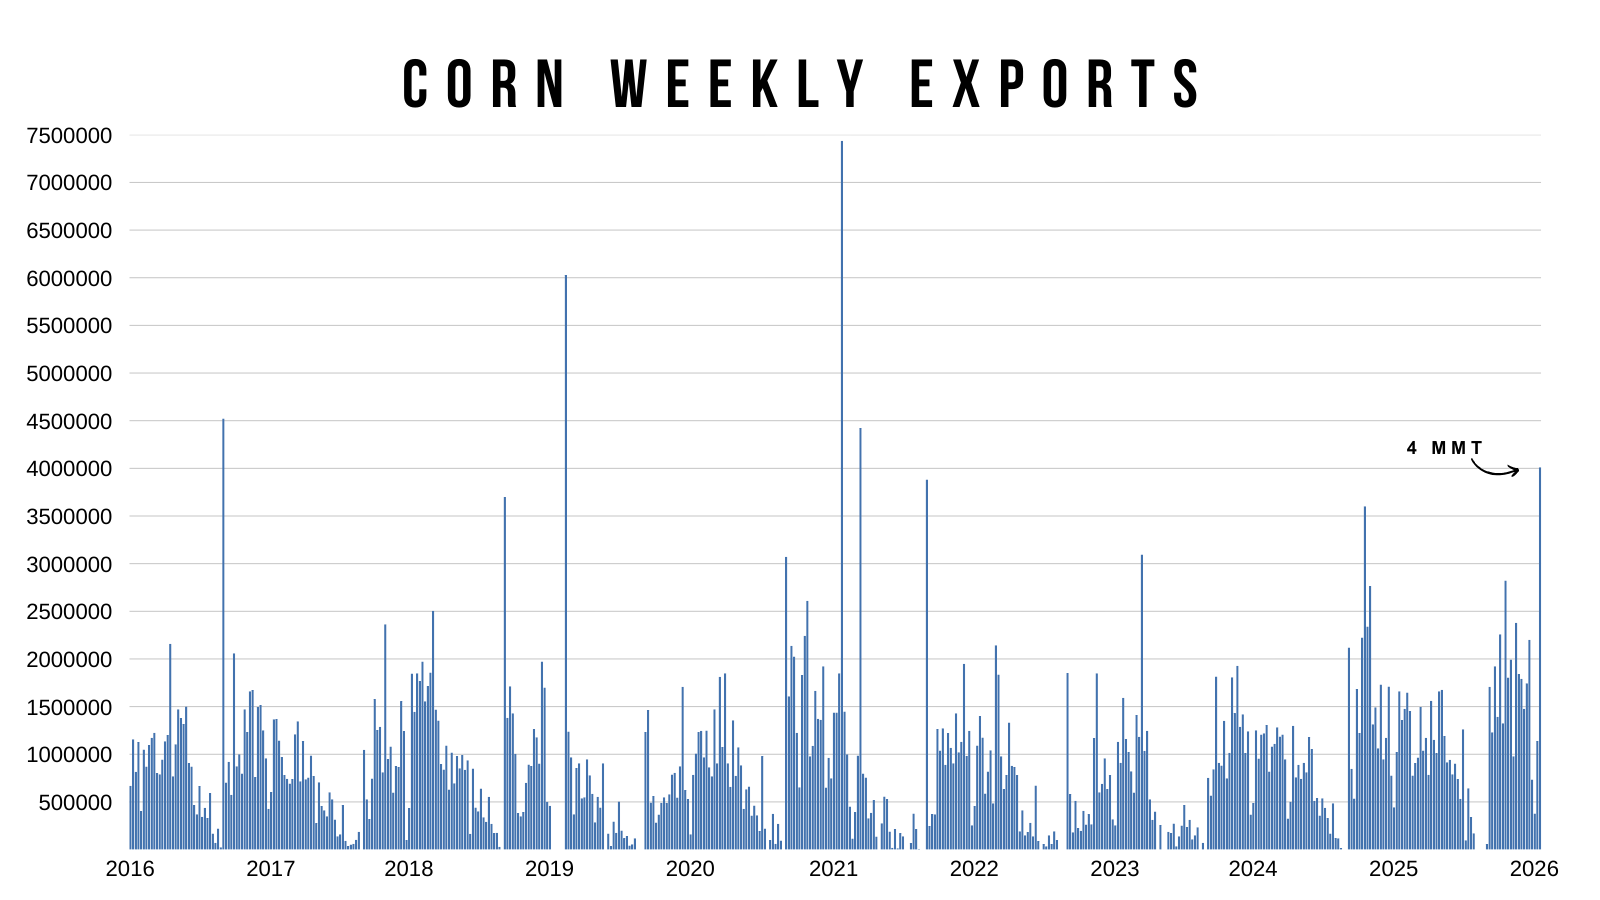
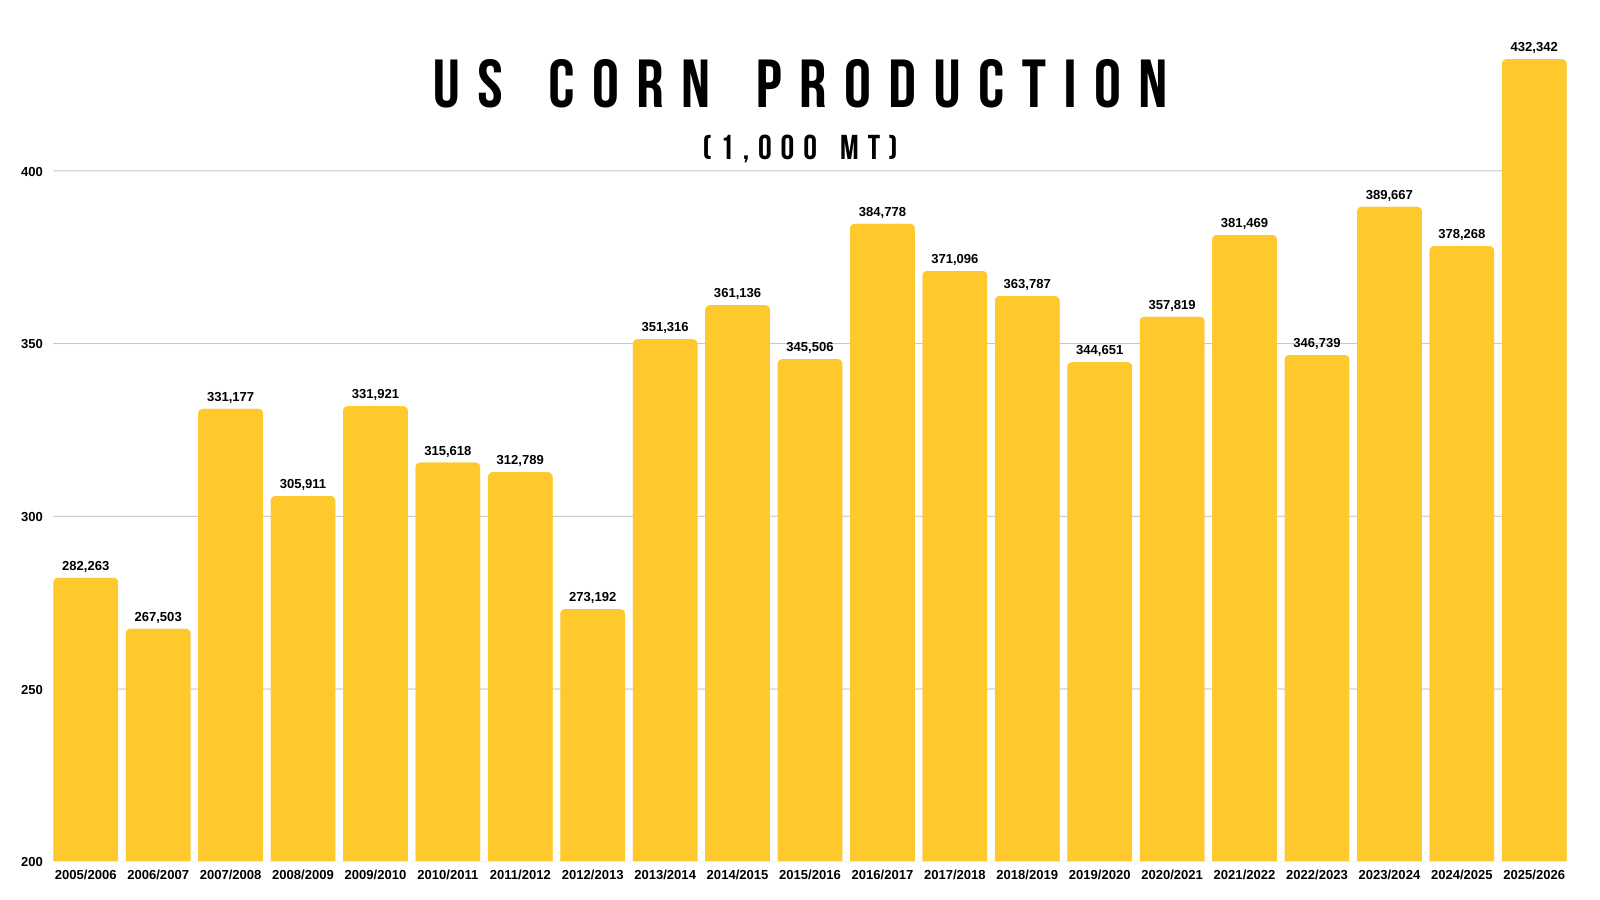
Record Corn Exports
Jeremey already touched on this Friday, but export sales last week were some of the best of all-time.
Corn's 4 million metric ton week was the largest week since 2021.
If you exclude China.. it was the largest ever.
Maybe we're seeing some bargin buying on the export market following the USDA sell off.
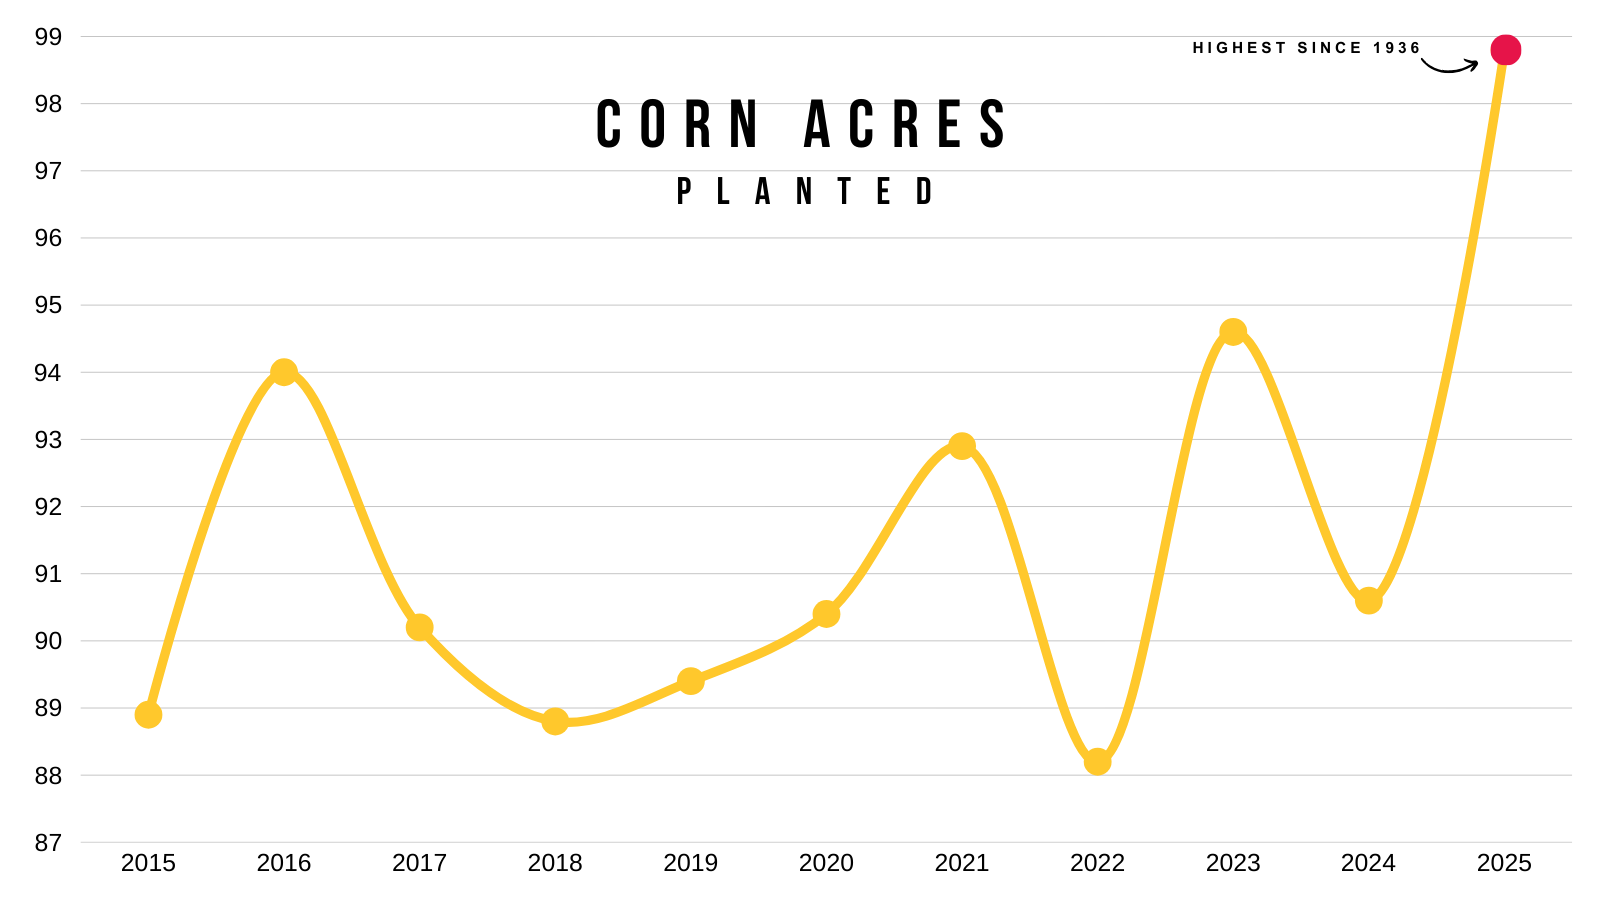
Acres: Corn vs Soybeans?
This is going to be a bigger topic of discussion later on, but I thought we'd take a look at some visuals.
Are we still going to plant a lot of corn acres following last year's record?
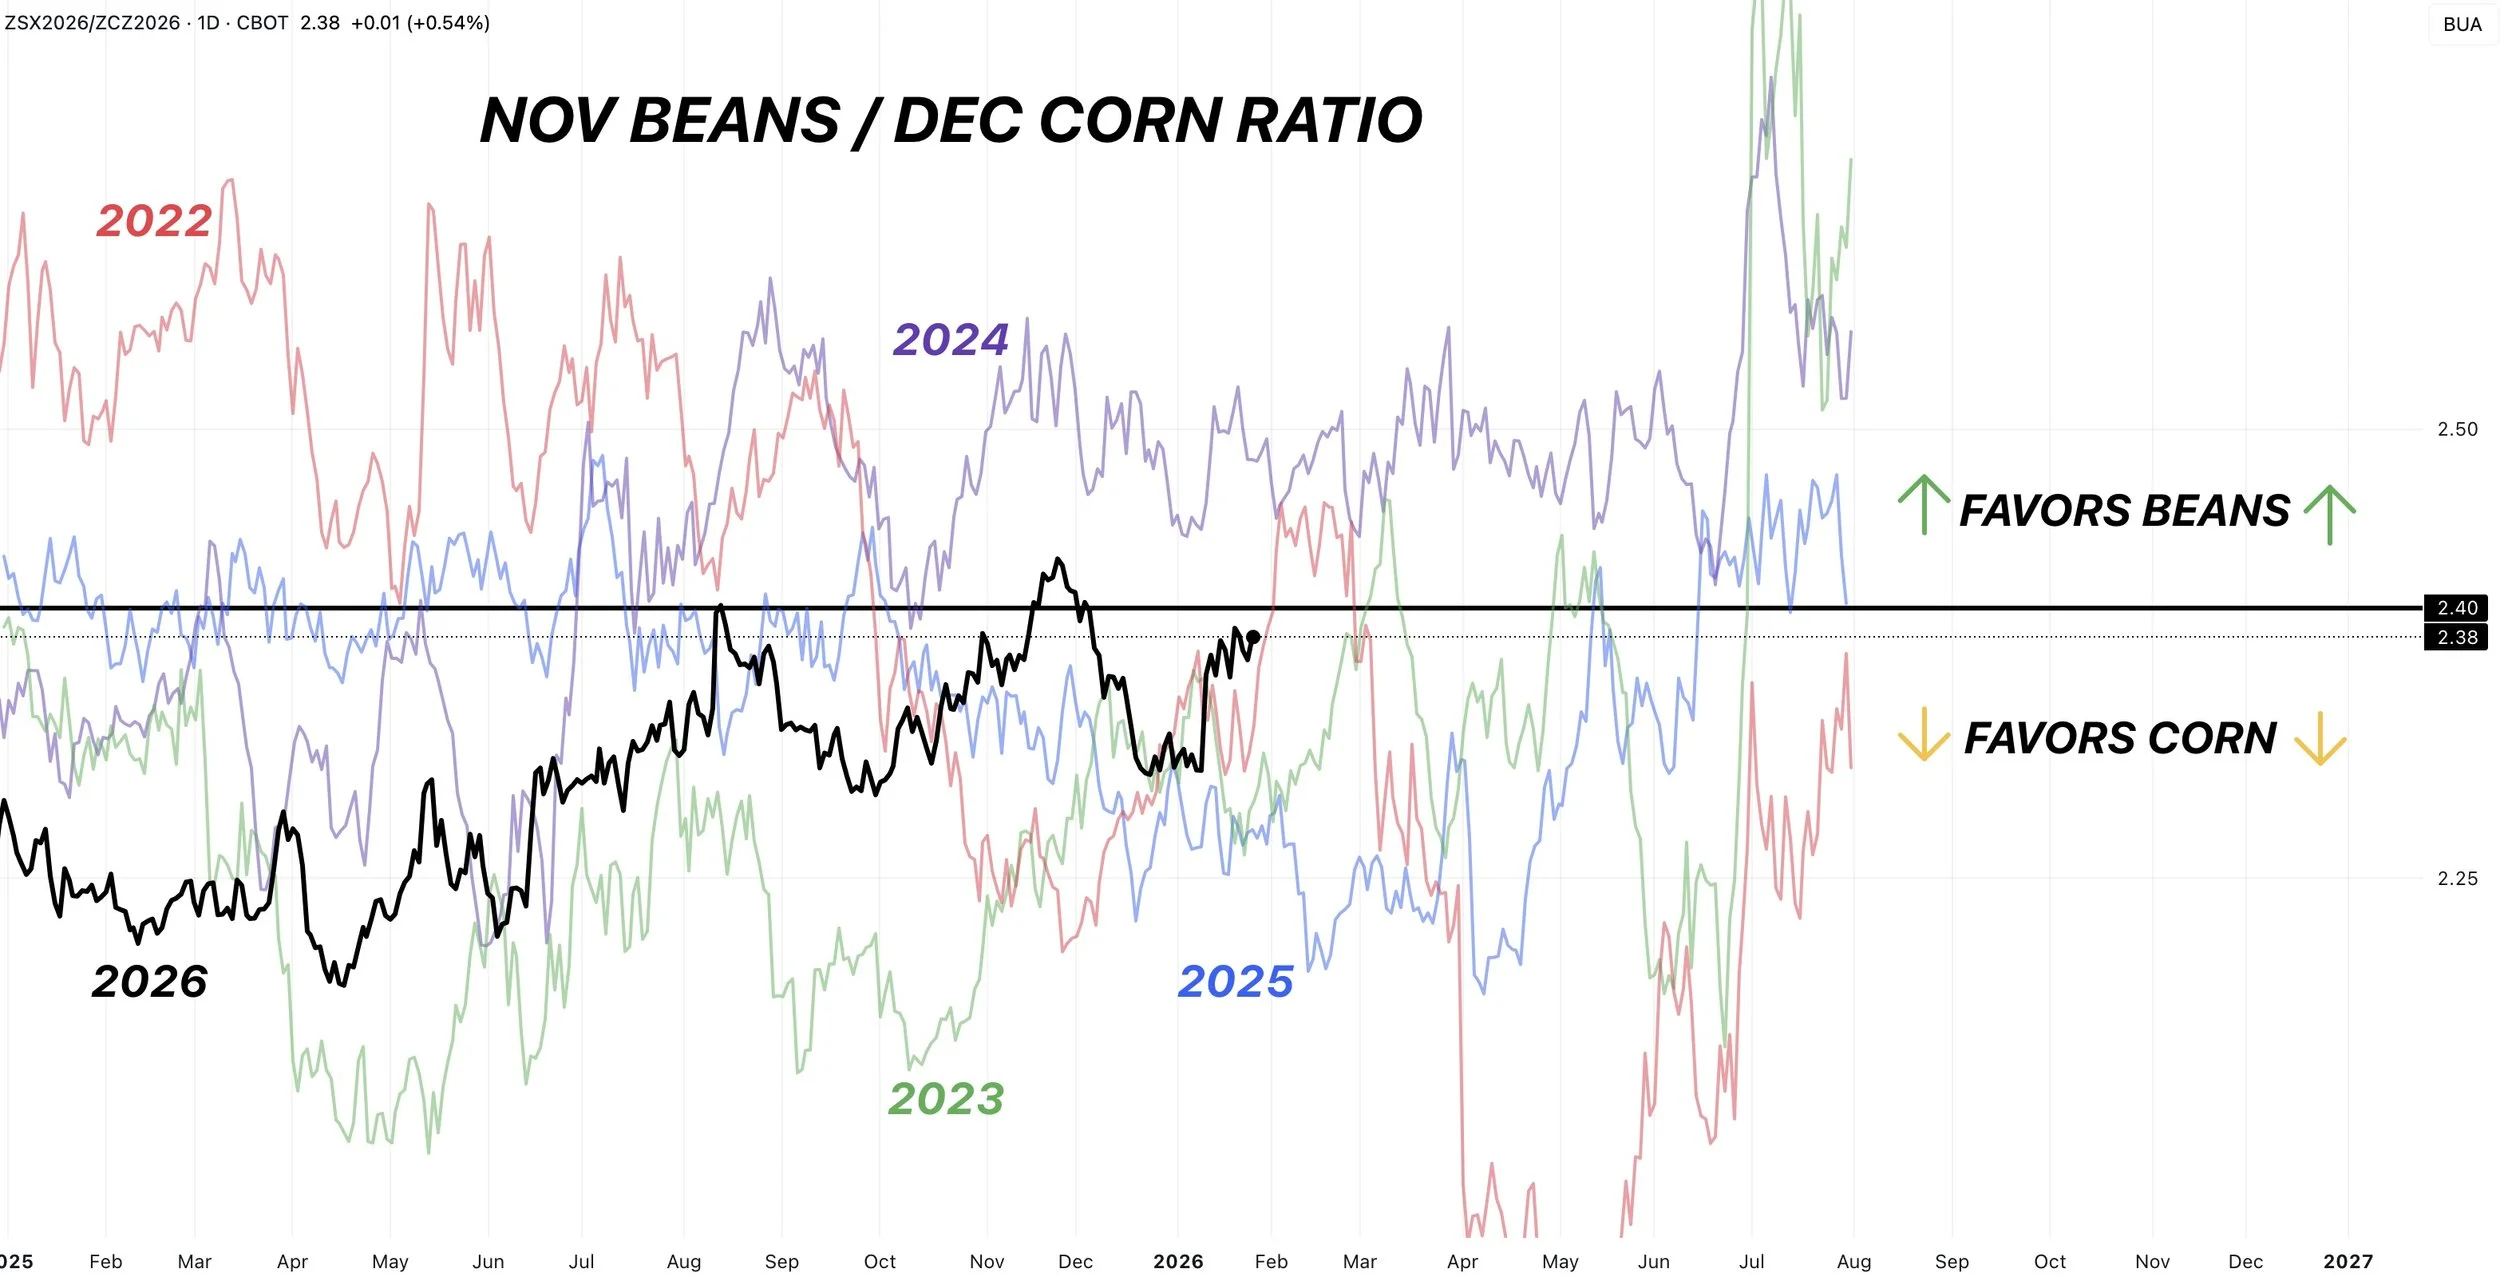
First let's look at the ratio.
When you divide soybeans by corn, the average over the last 10 years or so is around 2.40
So when the ratio is above 2.40 it favors more soybean acres.
When the ratio is below 2.40 it favors more corn acres.
Last year for example, we were well under. The smallest the ratio had been in a few years. Hence the jump in acres.
This year, we do still favor corn acres slightly, but not to the extent as last year.
For the ratio to truly favor some more bean acres, we would need to see this move beyond 2.40
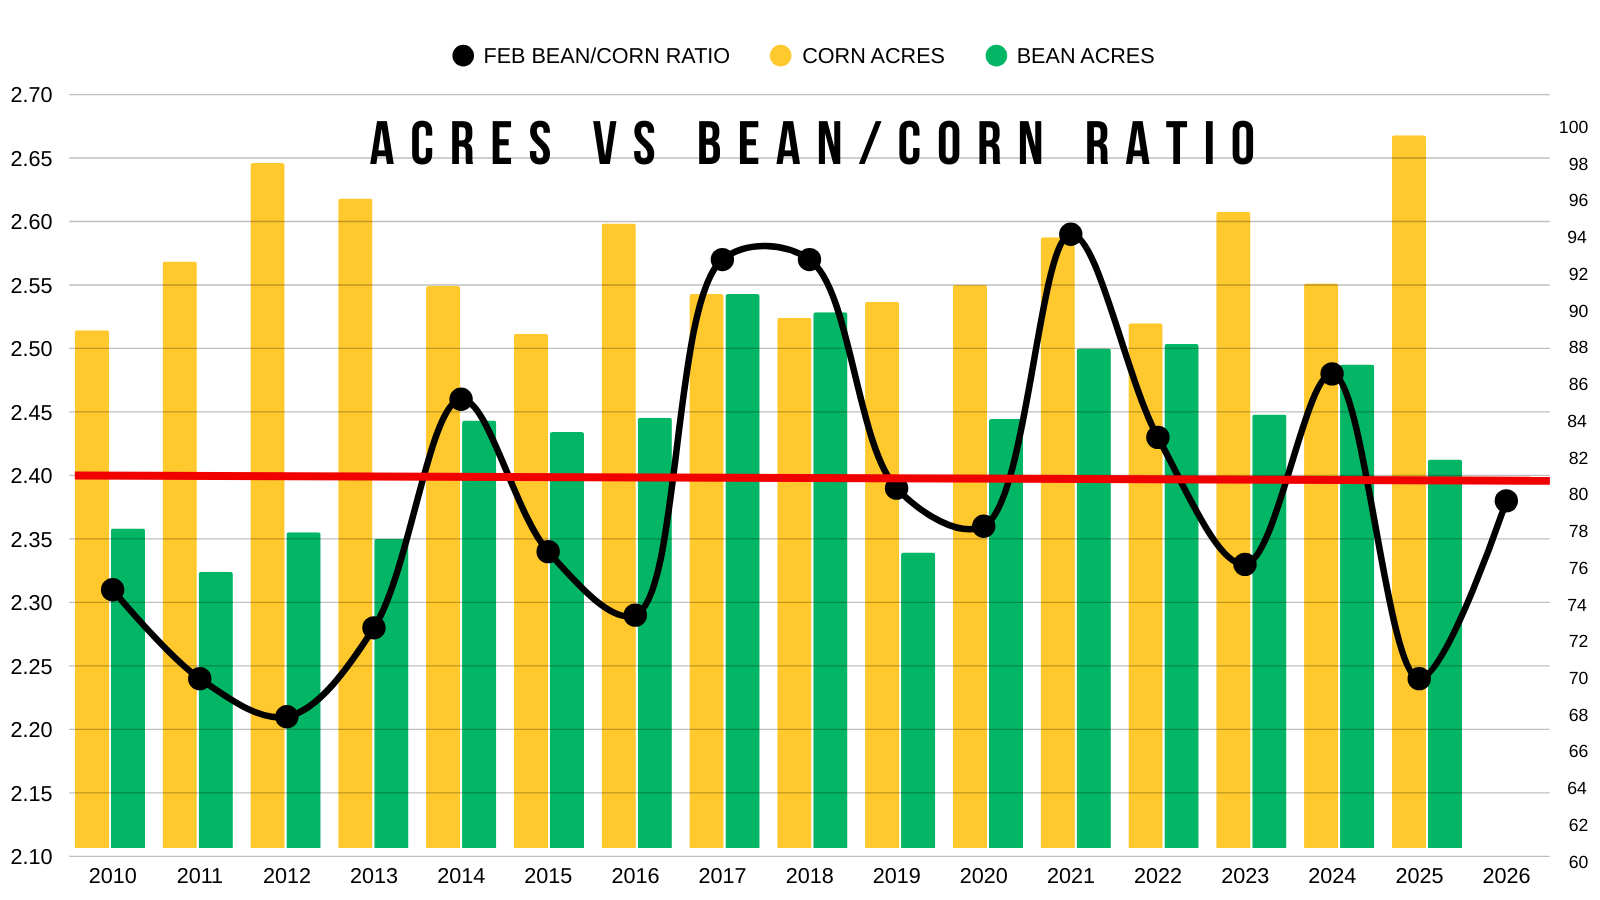
Here is another perspective.
This shows the ratio during the month of February.
Along with corn and soybean acres that year.
Anytime that ratio is below 2.40 we tend to see more corn acres.
For soybeans to close the gap on acres, typically the ratio needs to be above 2.40.
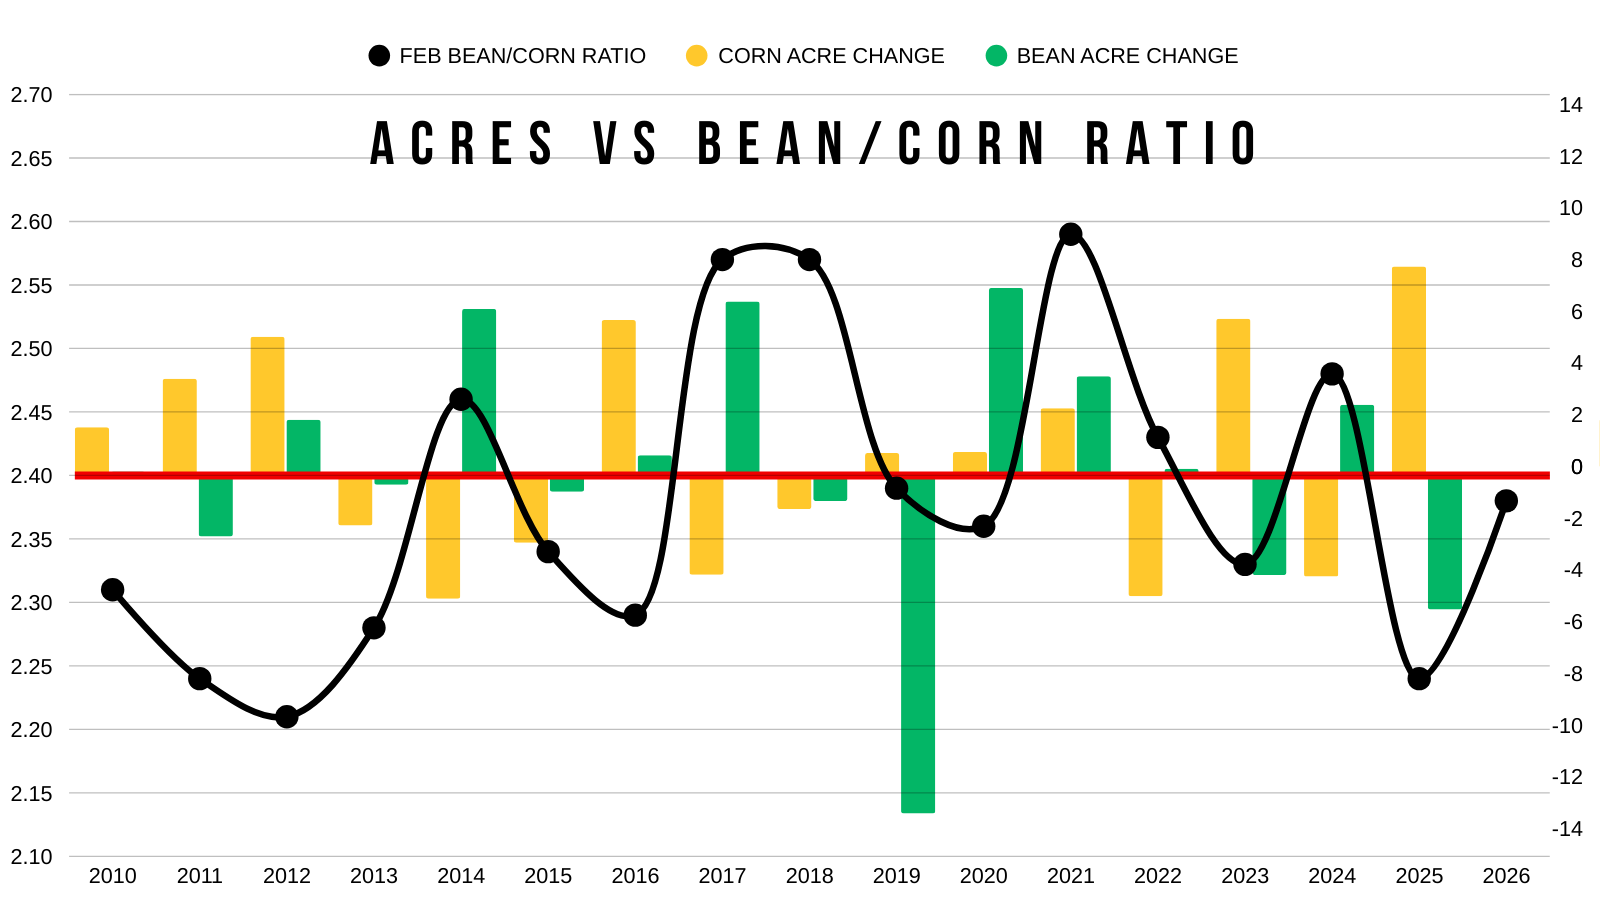
Here is one last perspective.
This shows the ratio along with how corn and soybean acres changed vs the prior year.
Last year for example, we saw a huge jump in corn. Because the ratio was some of it's lowest ever.
Most of the time for us to see a dramatic shift to soybean acres, the ratio needs above 2.40
Examples of this would be 2014, 2017, and 2024.
So for now, although corn acres should naturally come down. Given that last year was a record and the ratio has shifted less heavily corn, it does still favor us planting a good amount of corn.
Something we are going to be watching closely here soon as we get into planting intentions etc.
We will have to see if soybeans try to buy any acres here.
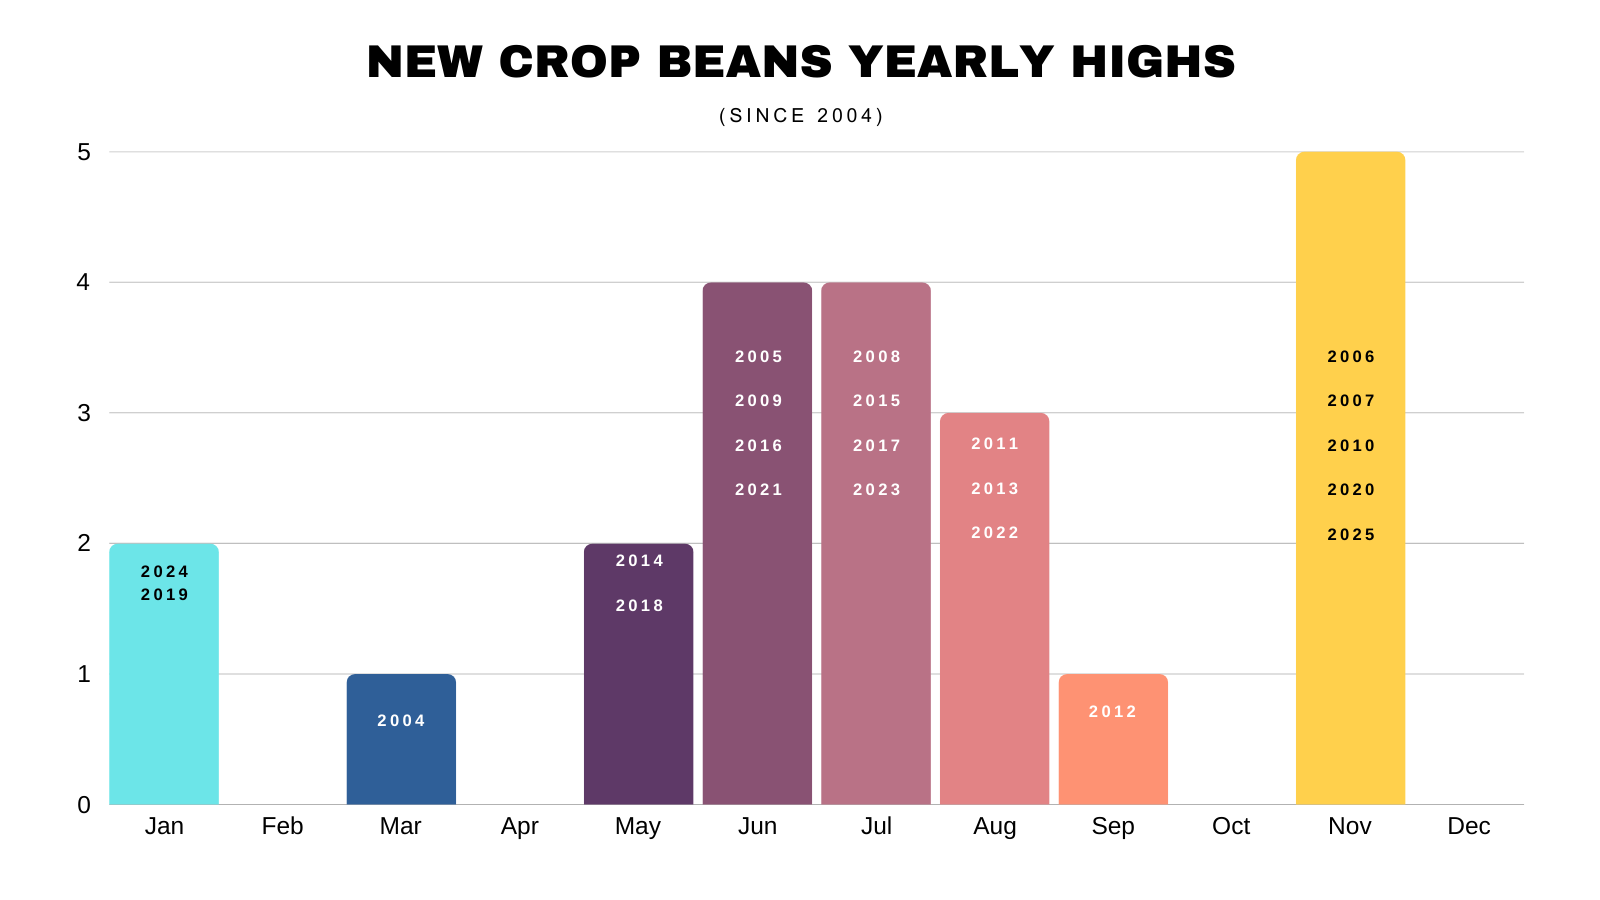
New Crop Yearly Highs by Month
Here are two charts to provide some optimism this year.
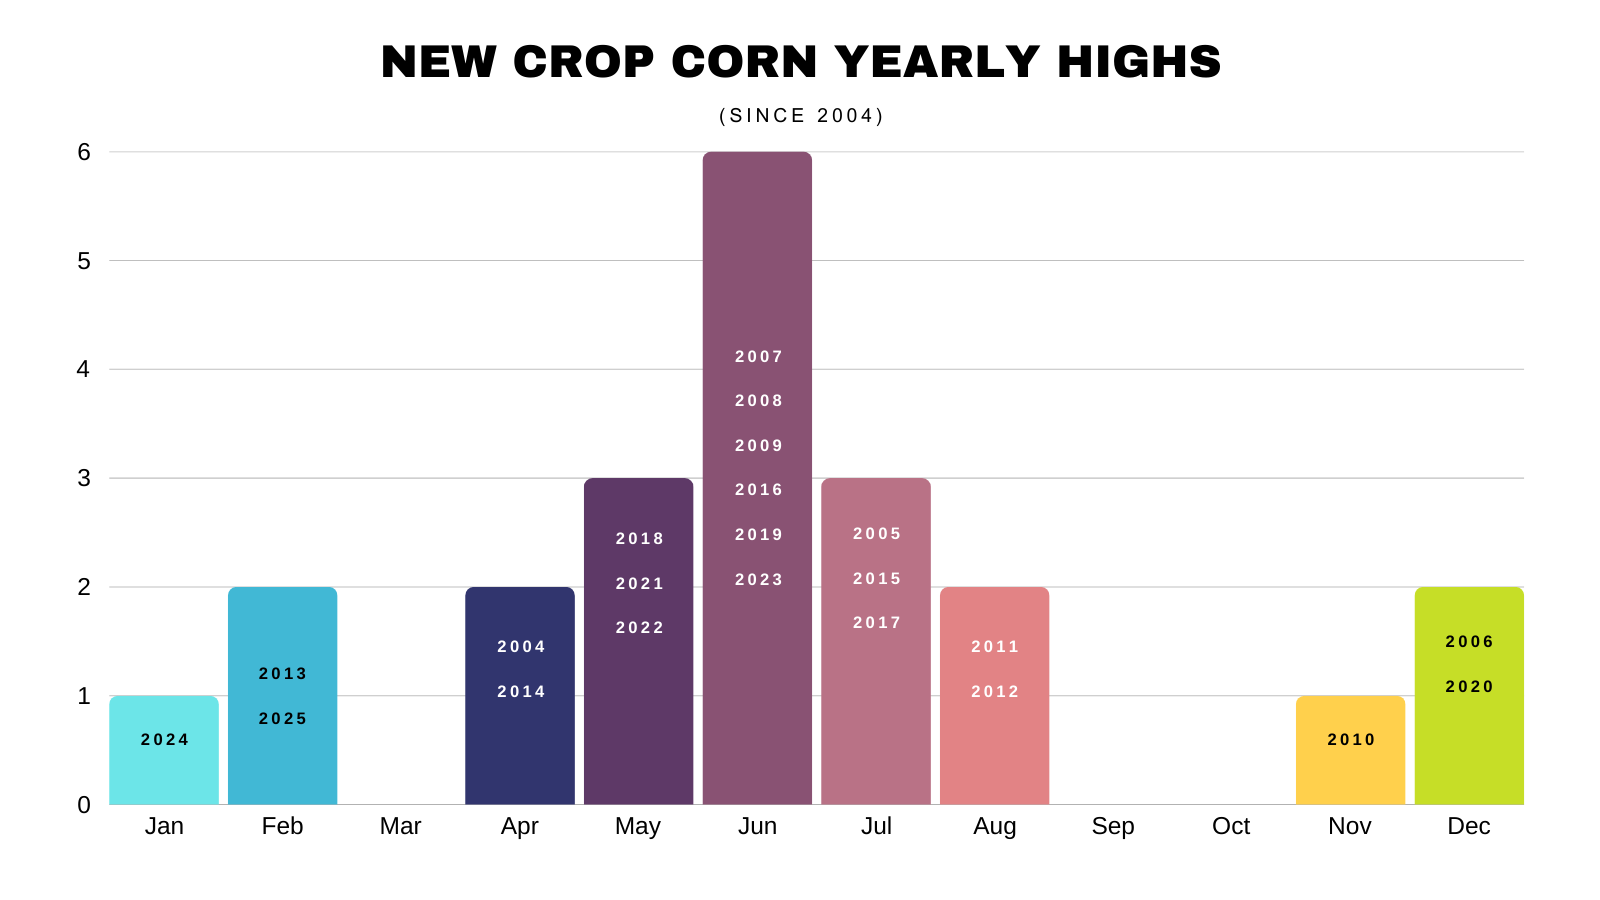
These are when new crop corn and new crop soybeans have posted their highs for the year since 2004.
First for corn.
We typically get some sort of opportunity and don’t see our highest price for the year in January.
More often than not, that opportunity comes during the spring and summer. Because we usually get some sort of weather scare.
For the last 22 years, our top has come in January once (2024) and February twice (2013, 2025).
The interesting part is that two of those three came over the last two years. As we simply did not get any sort of weather scare.
January: 1
February: 2
March: 0
April: 2
May: 3
June: 6 (27.2%)
July: 3
August 2
September: 0
October: 0
November: 1
December: 2
Same story for soybeans.
We've only printed our highs for the year in January twice (2019, 2024).
January: 2
February: 0
March: 1
April: 0
May: 2
June: 4
July: 4
August: 3
September: 1
October : 0
November: 5
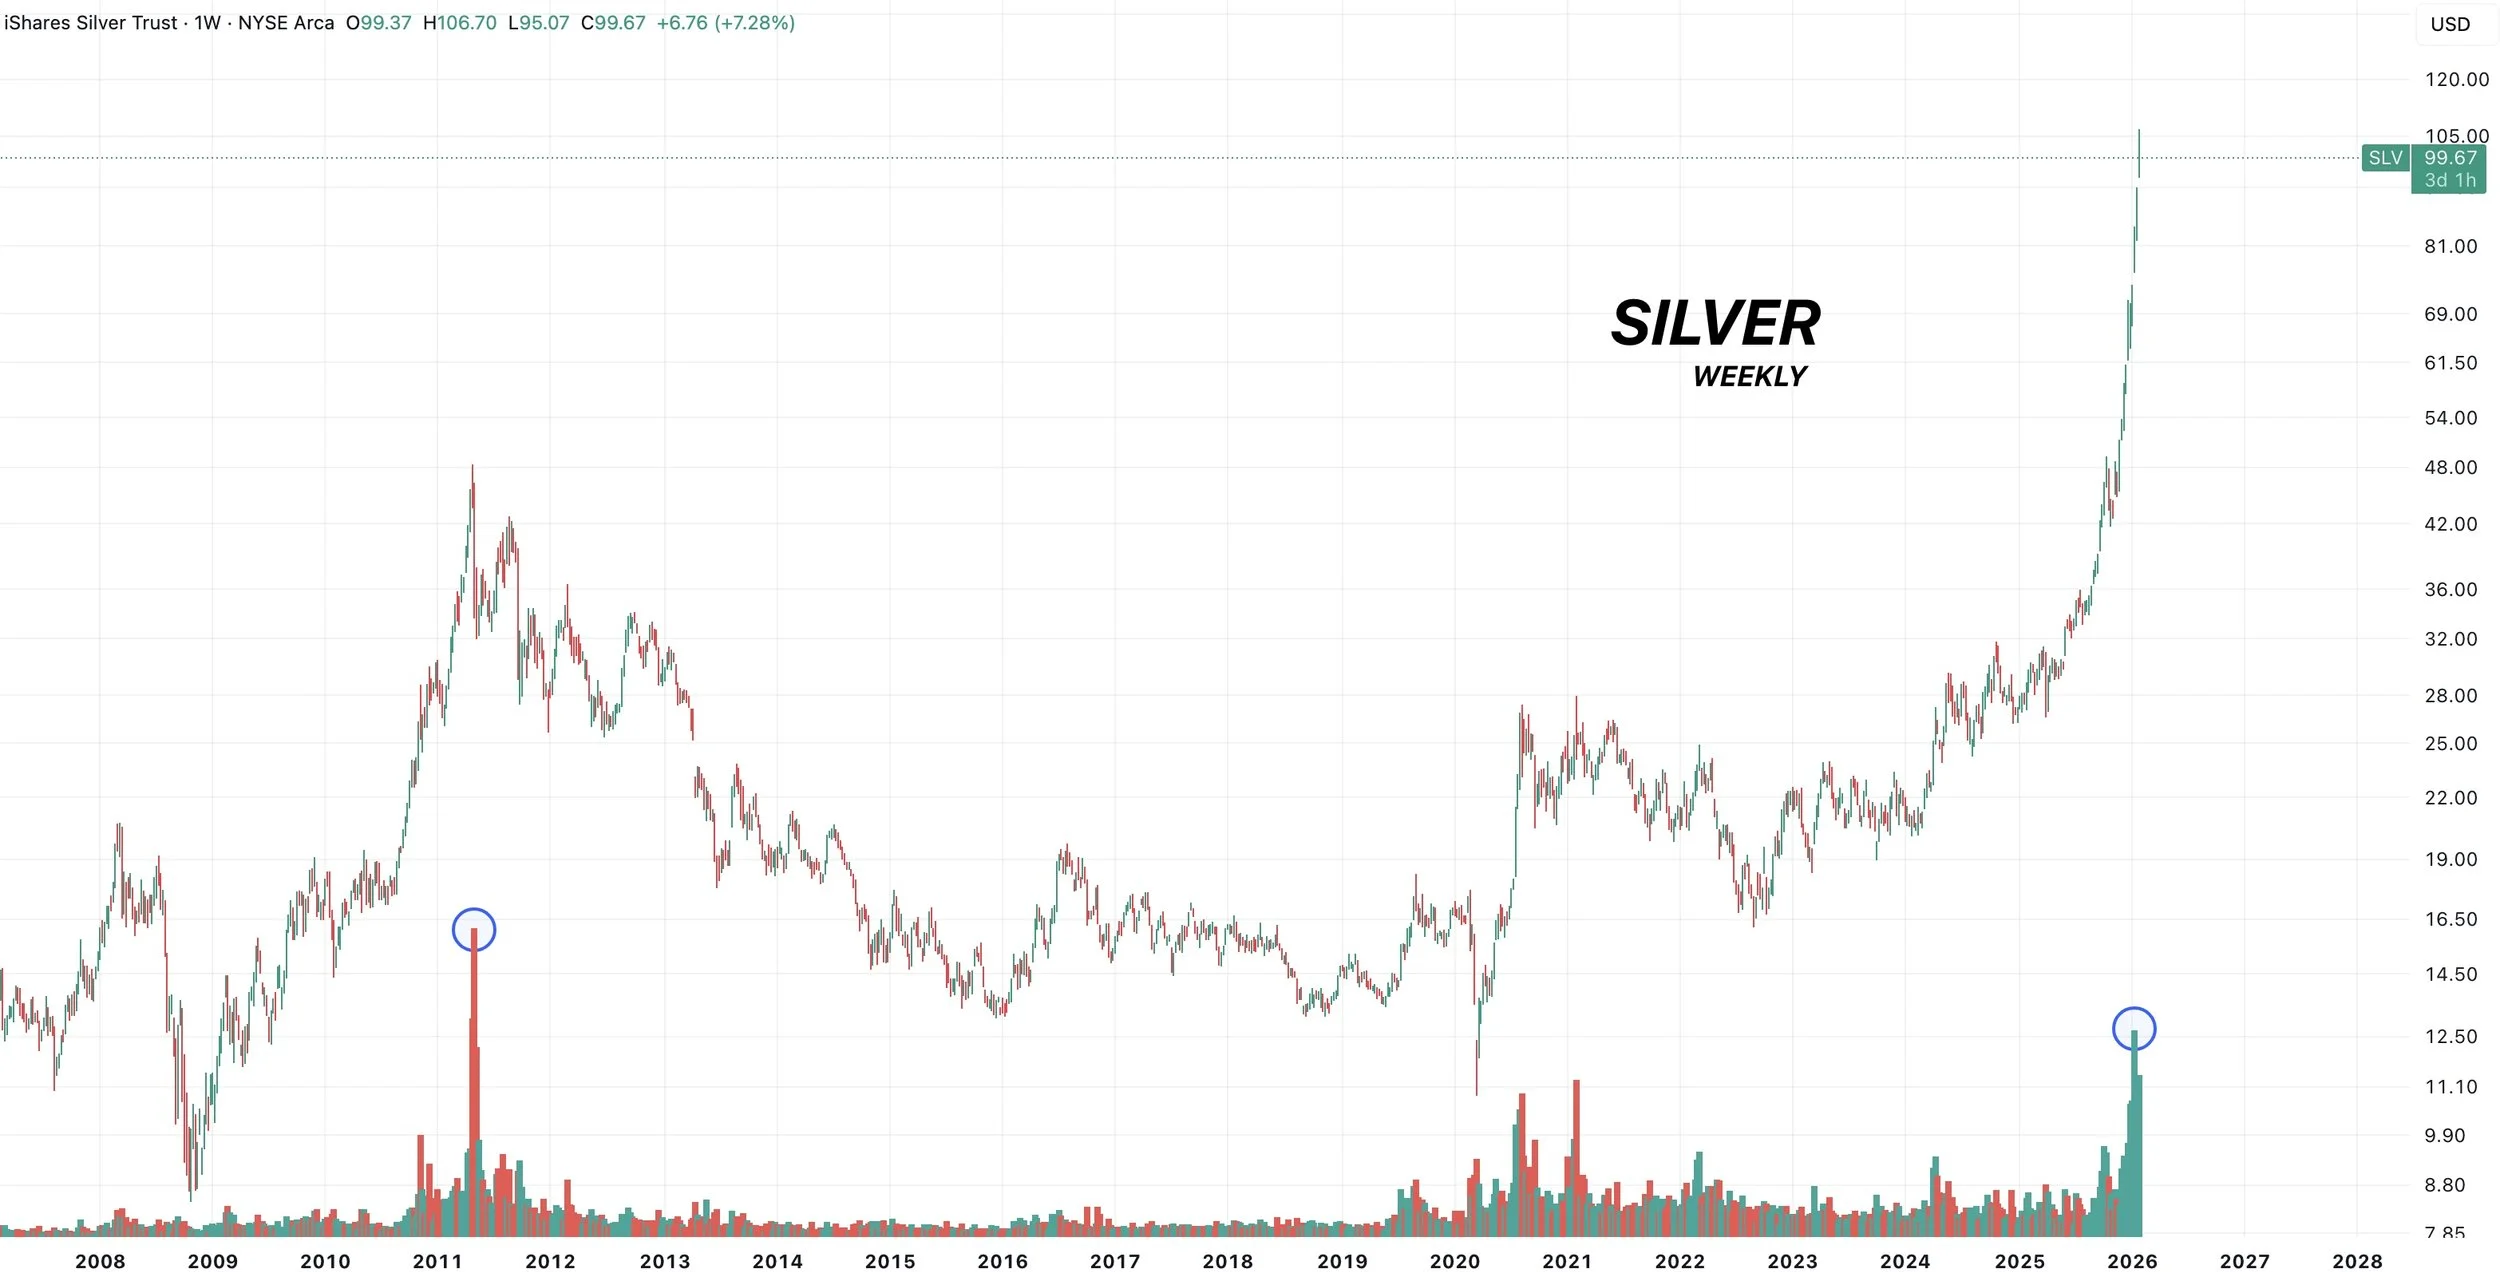
Silver Blow Off Top?
I don’t usually talk about metals or other commodites.
However, silver just saw it's largest single trading day range in history yesterday.
Yesterday, the silver ETF had it's largest volume day in history.
Here is a weekly view of the chart.
I do not have any skin in the game and I'm not calling a top, but last time we saw a volume spike like this, it marked the top.
Blow off tops are often associated with record volume.
Today's Main Takeaways
Corn
Fundamentals:
As I mentioned, today is mainly going to be focused on the charts as we are nearing a point of interest on the charts.
Overall I still believe demand should keep a floor under this market and prevent us from getting too cheap.
At the same time, you can’t forget we have a monster amount of supply to chew through.
So we will want to be rewarding the market where it makes sense to do so, especially if you are going to be forced to move corn soon.
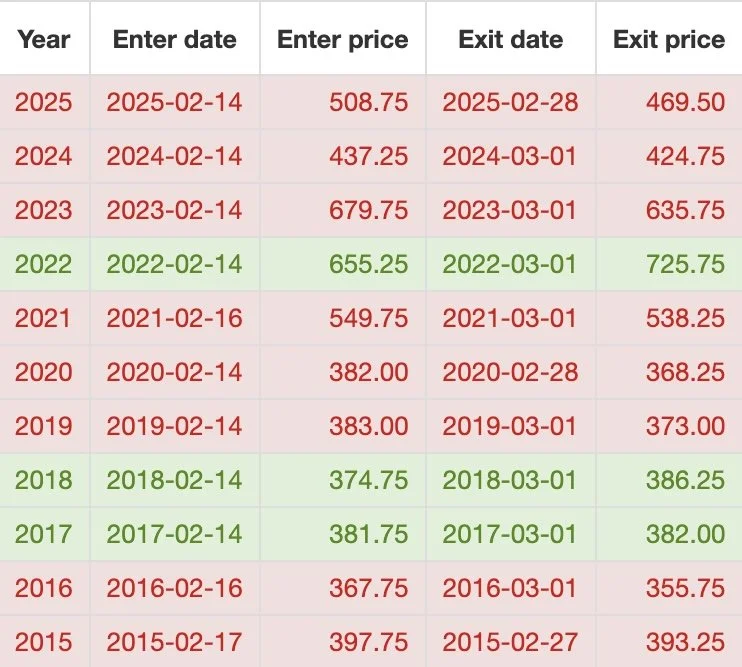
We do have first notice day coming at the end of February.
This does tend to be bearish.
Especially when the market is at a carry like we are.
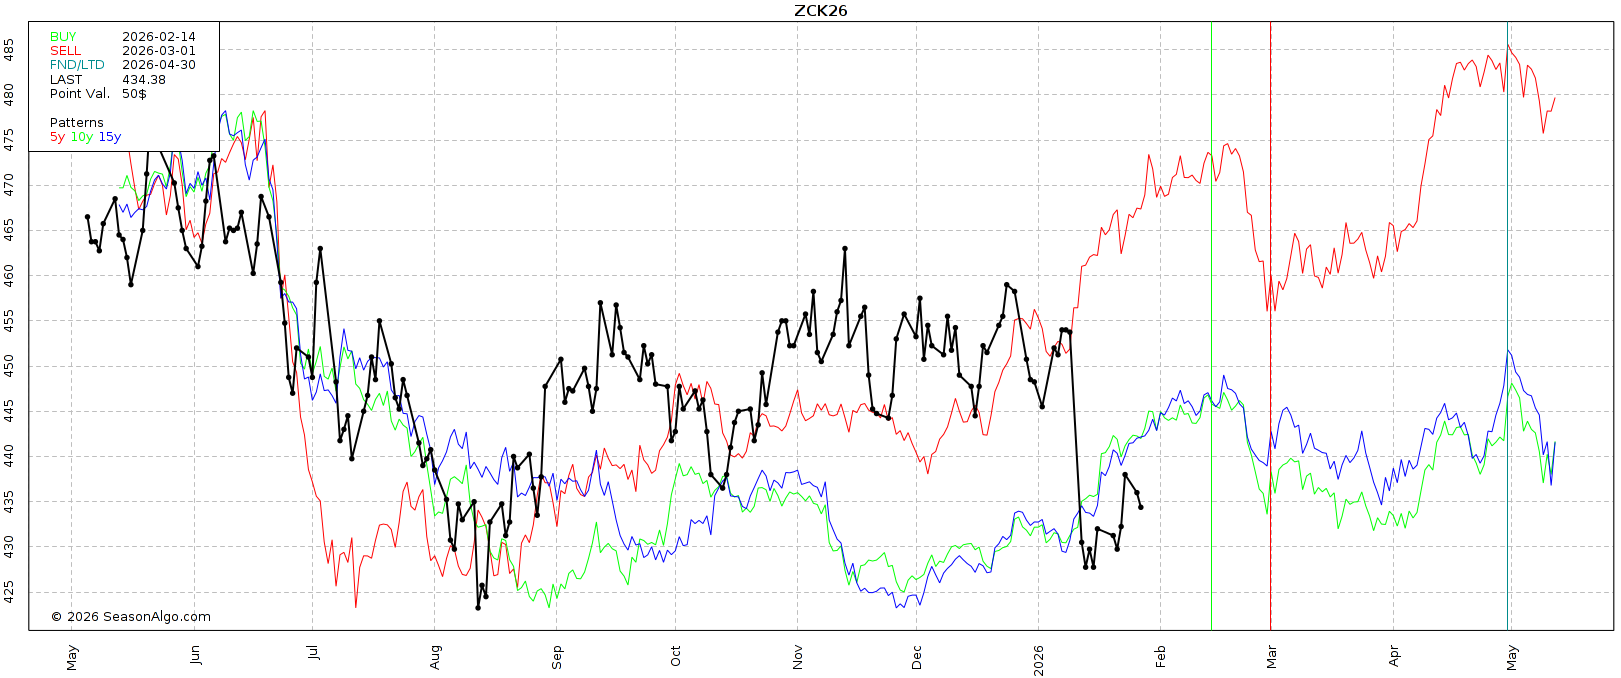
Here is the data for May corn from Feb 14th to Feb 28th.
We've traded lower the last 8 of 11 years.
Something we have to be cautious of heading into February.
This is also another reason why you want to avoid basis contracts in a carry market.
They know you'll be forced to sell it, and oftentimes we bottom after first notice day.
Here is the seasonal pattern.
Again, we tend to be weak heading into the end of February before finding strength heading into spring.
Green Line = Feb 14th
Red Line = Feb 28th
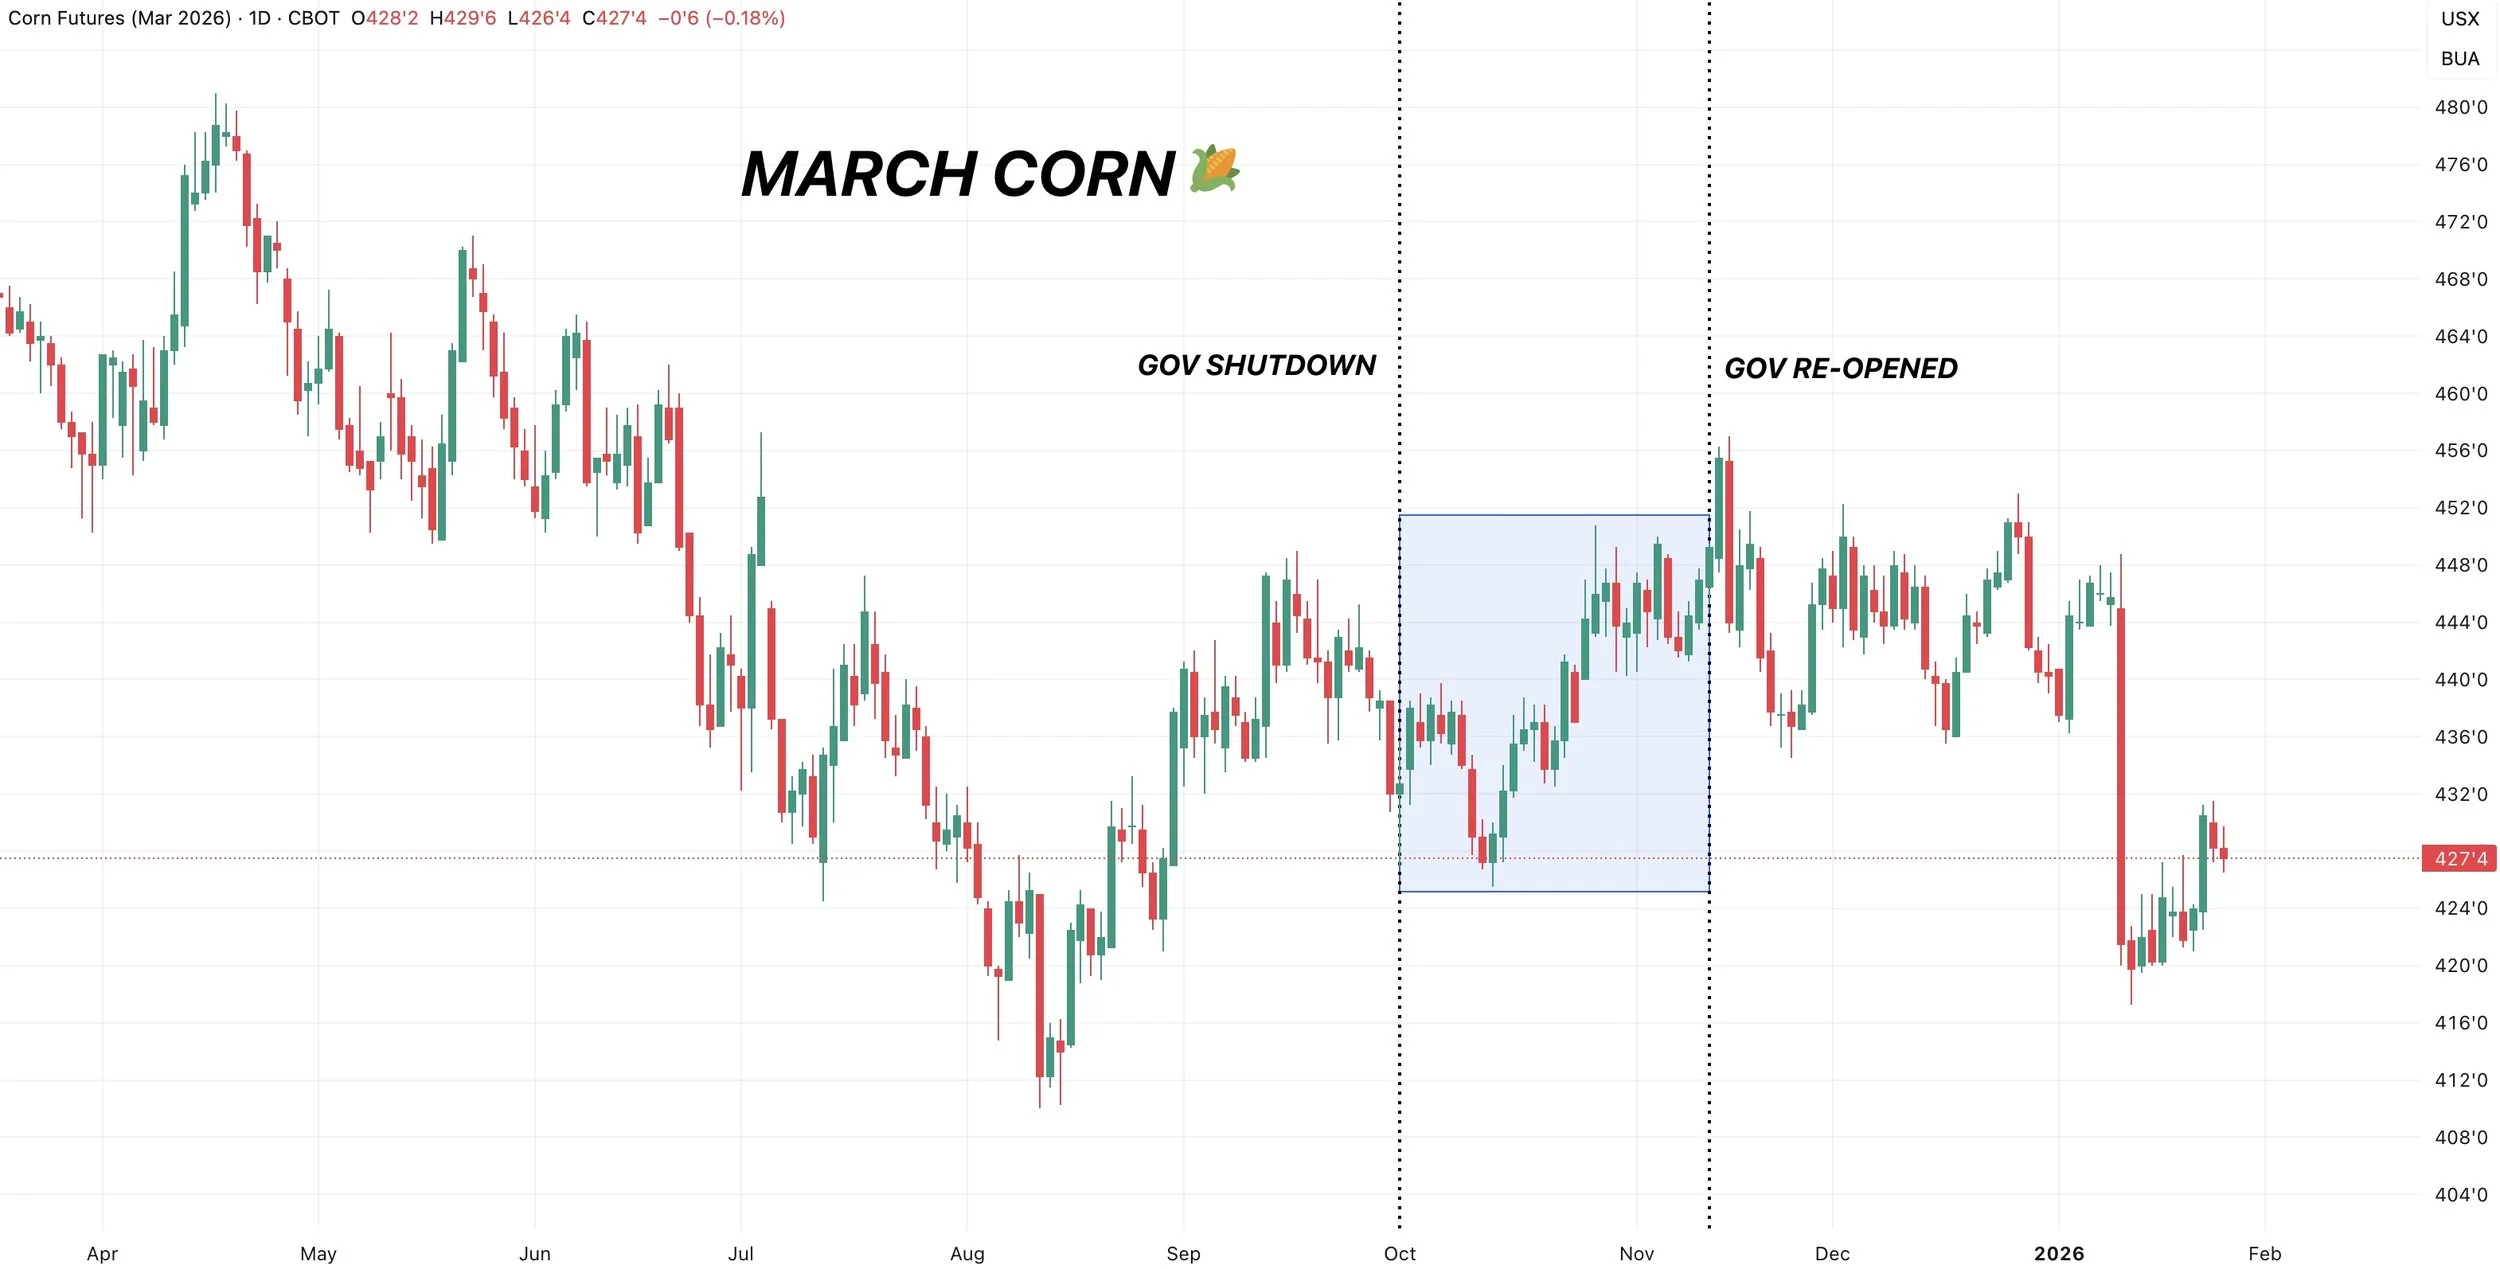
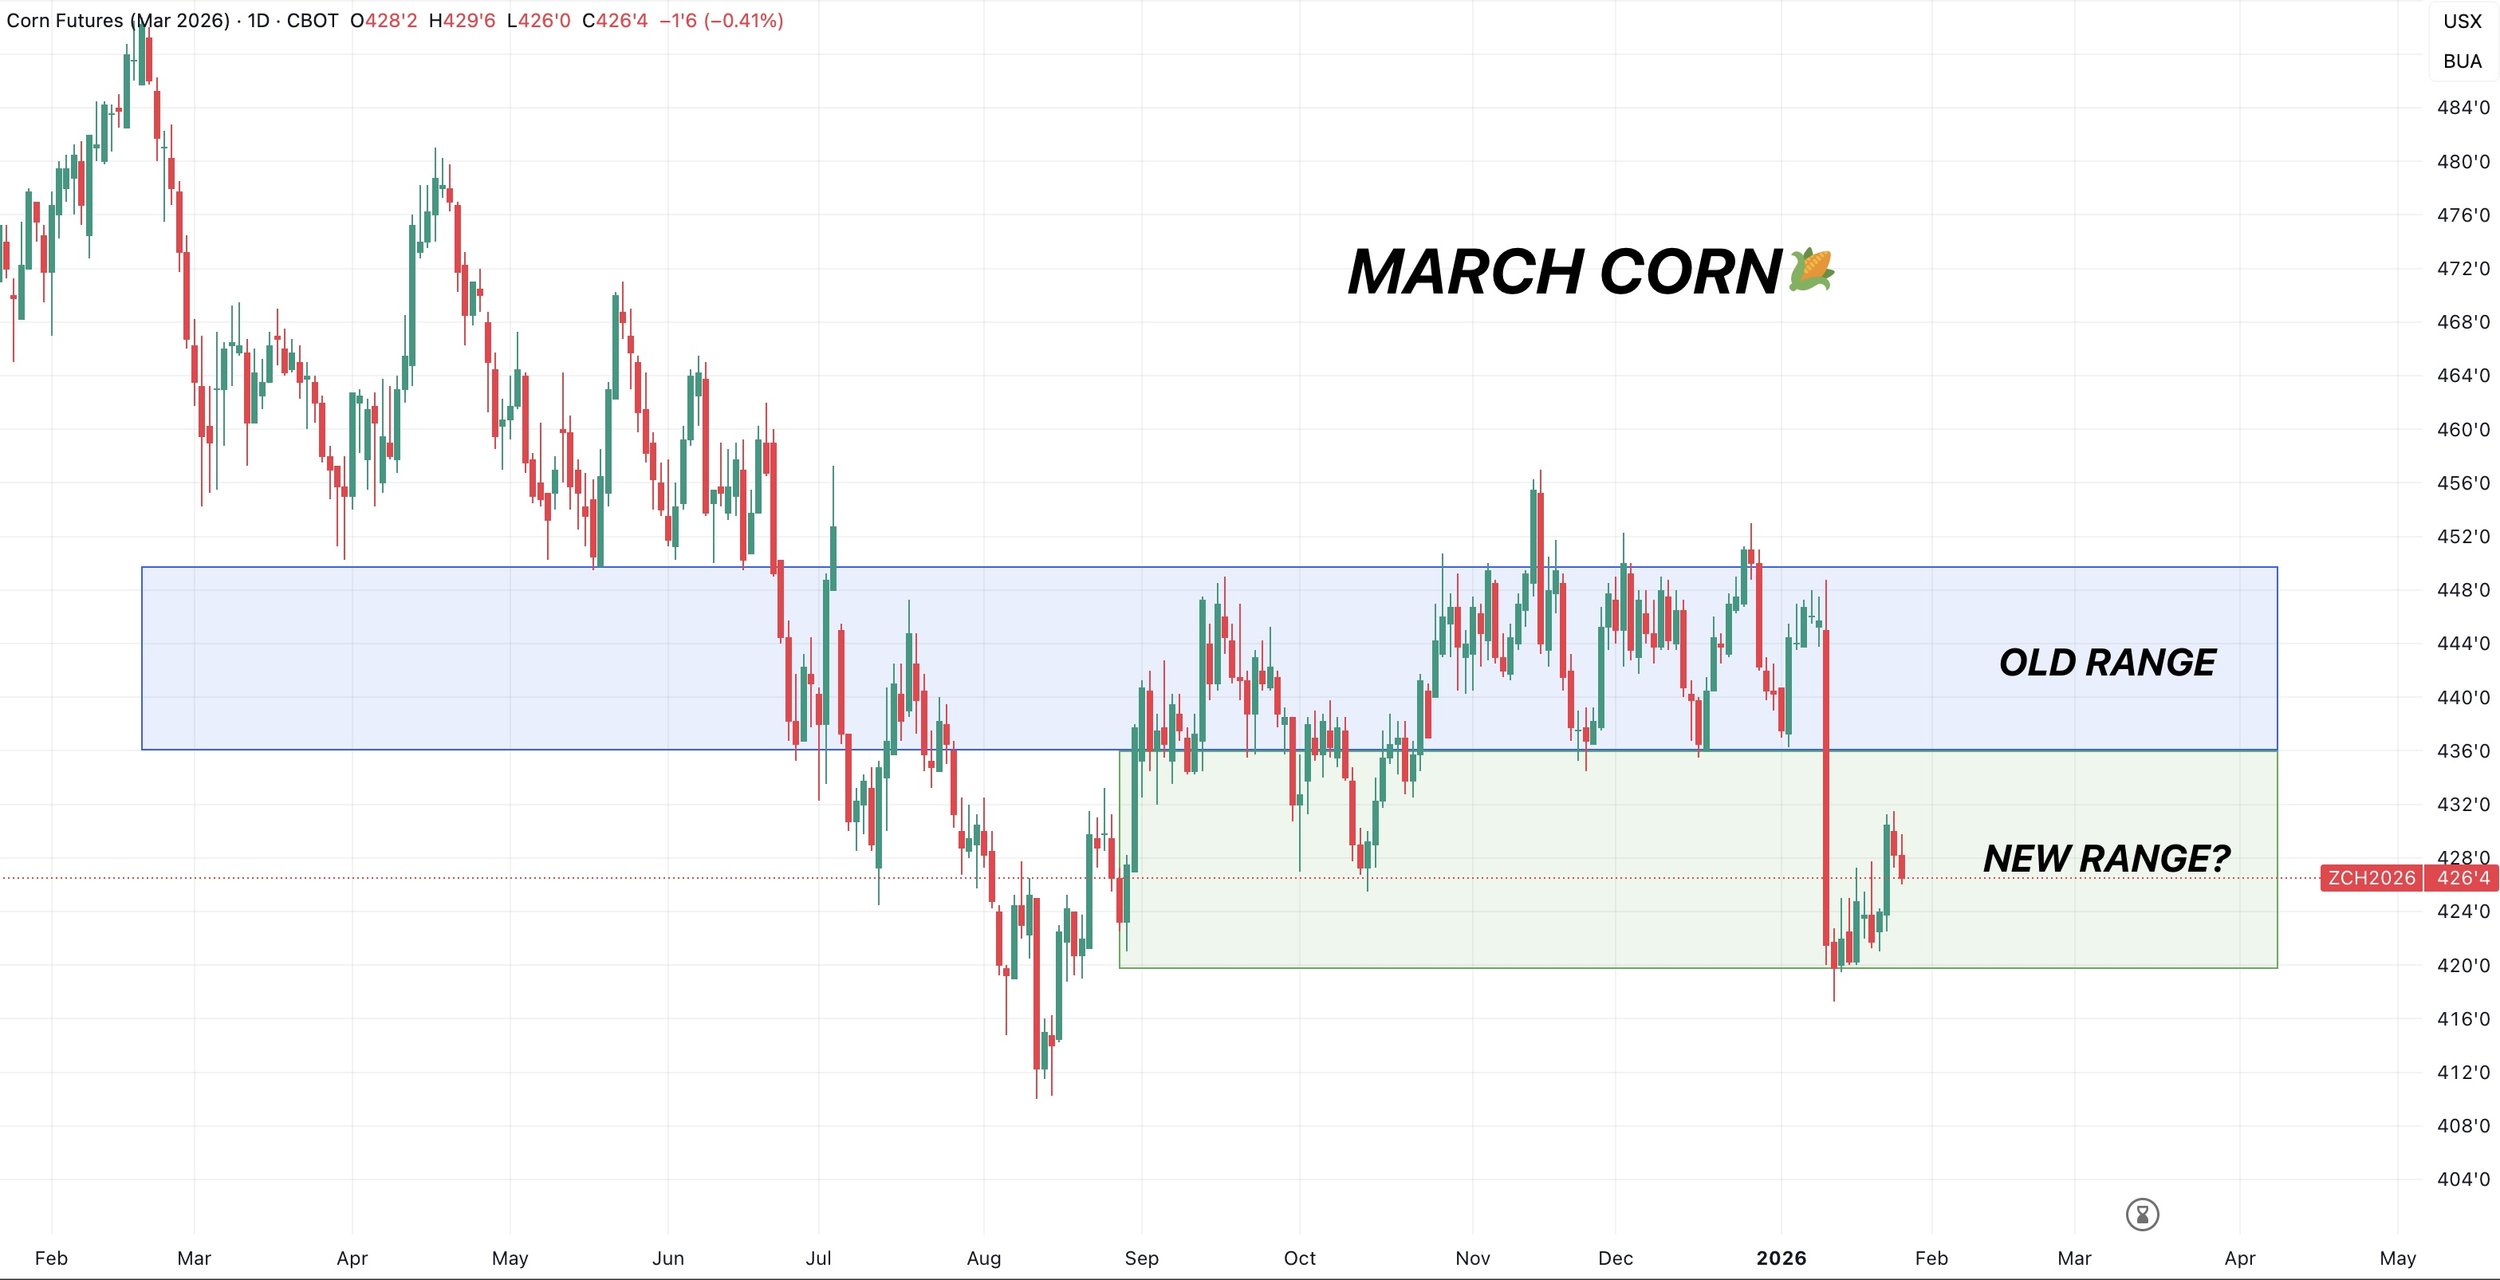
March Corn
Technicals:
Following the USDA sell off, corn was trapped in a tight brutal range.
We've now broken out of that range.
Now what?
We want to be rewarding a move towards $4.36 to $4.37 especially if you have corn to move.
Here are a few reasons why:
It claws back 61.8% of the USDA sell off.
It's also our old support from last year.
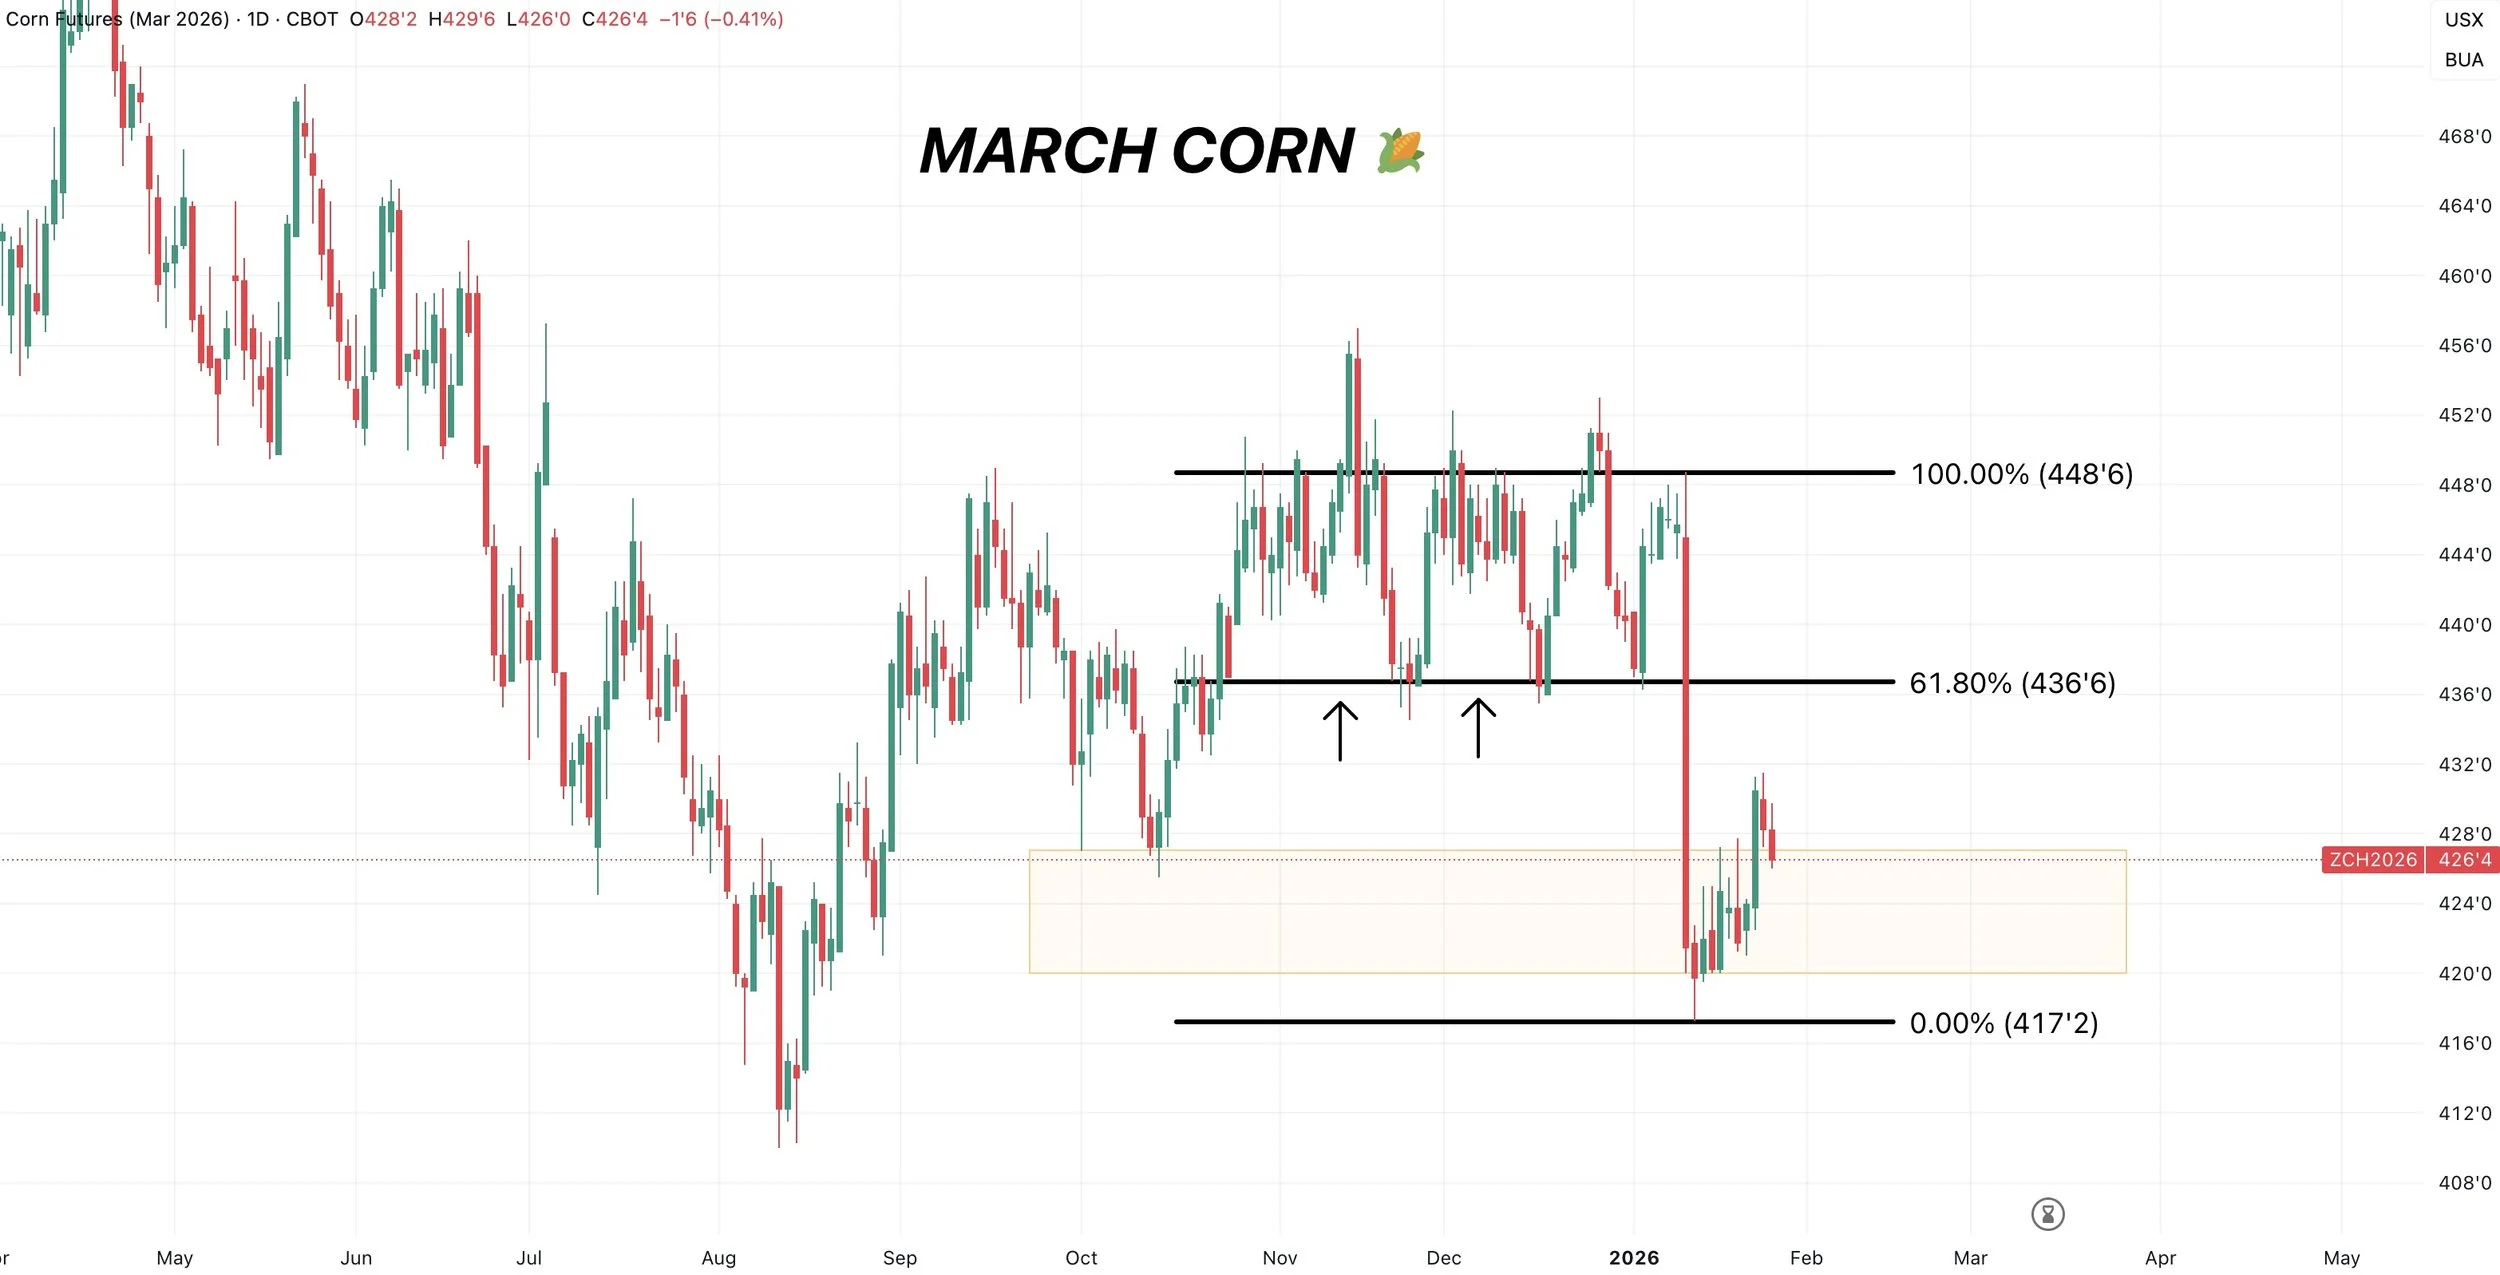
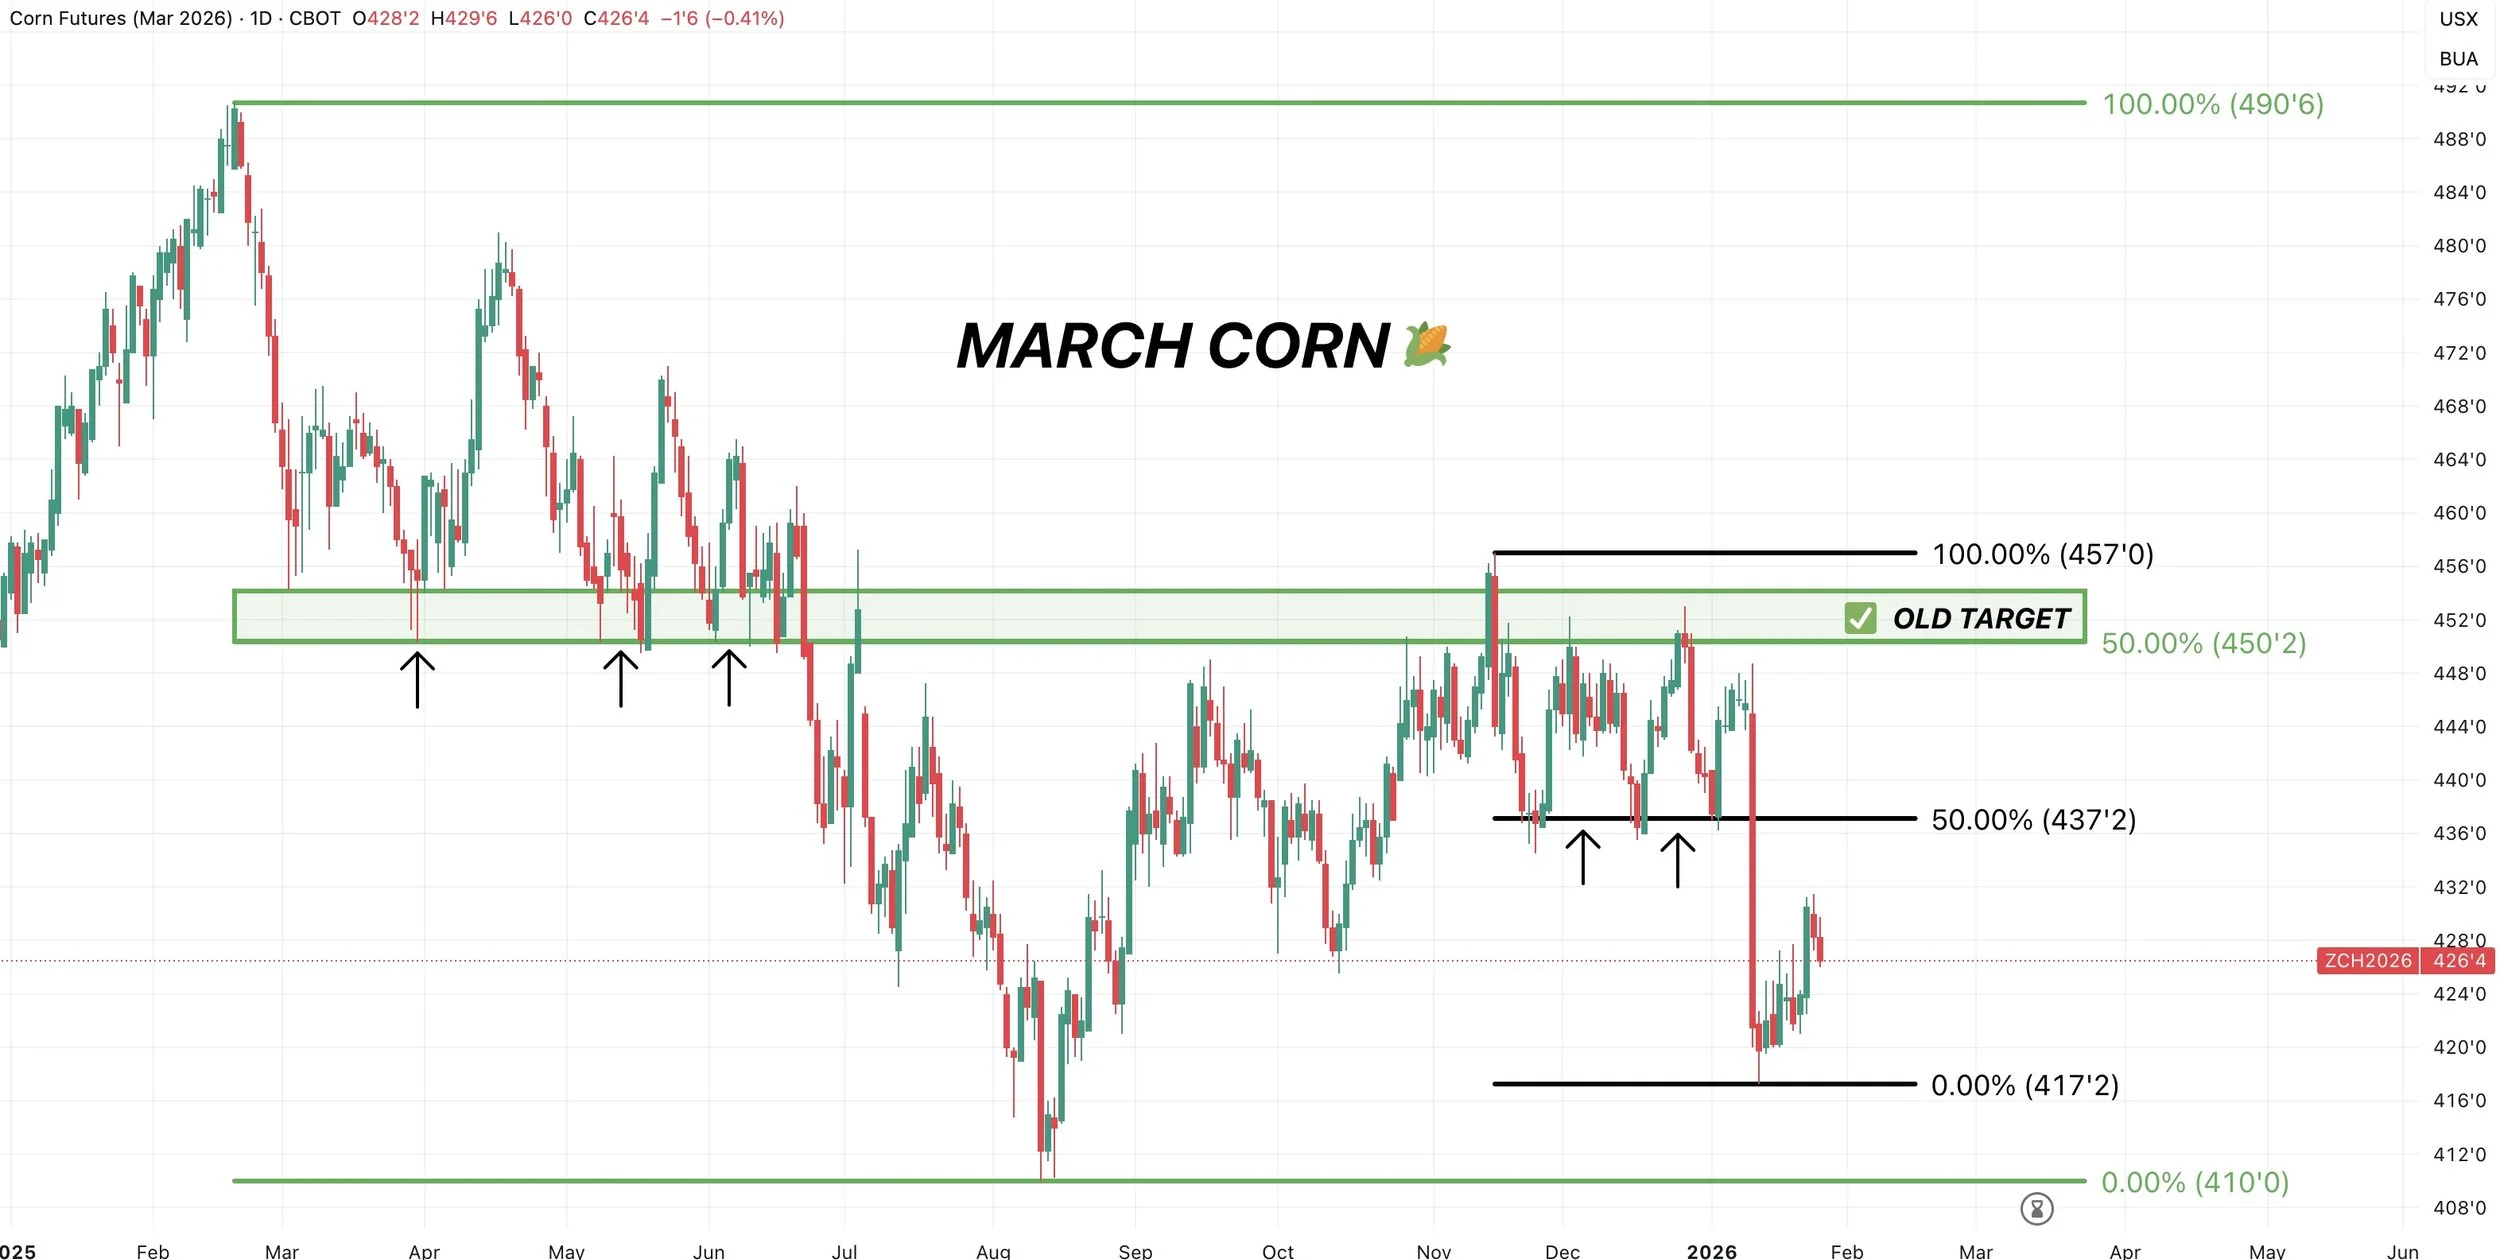
It also claws back 50% of the November highs.
The rally off harvest lows failed after clawing back 50% of the February highs.
That same level was key support from spring.
When retracement levels line up with past support or resistance, it adds even more interest.
The same methodology behind the $4.50 sell signal, just on a smaller scale.
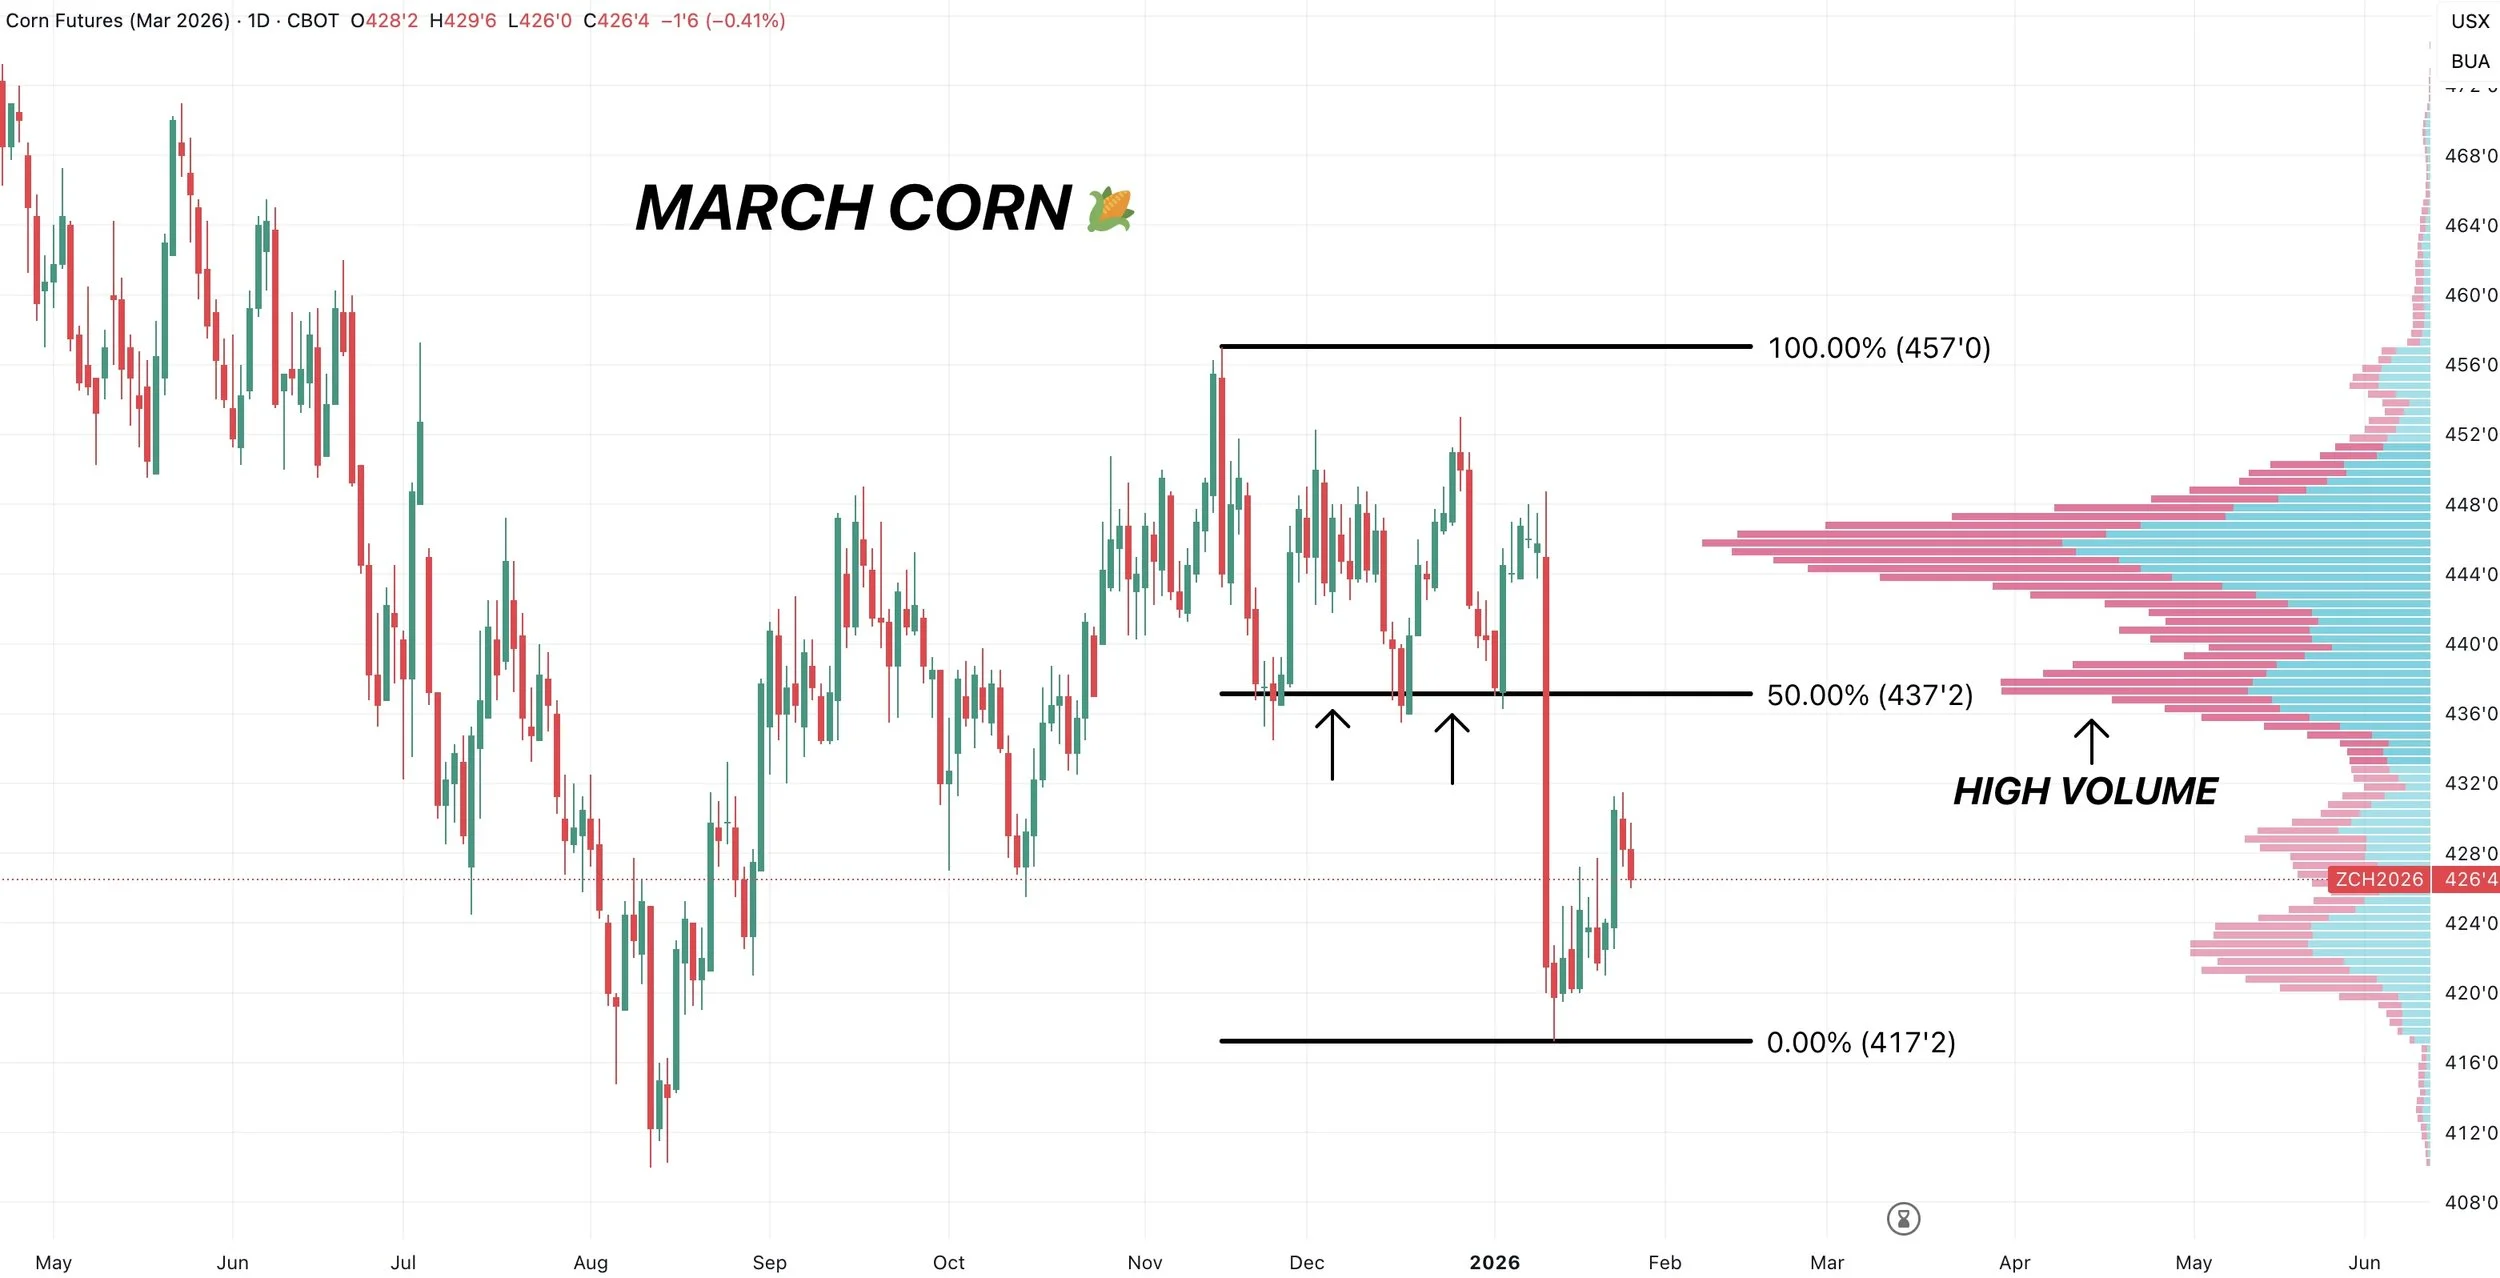
Area of High Volume
I haven’t shown volume profiles in a while.
Here is a chart that also shows volume.
How many contracts of corn has been traded at each price level.
Areas of high volume can act as heavy support or resistance levels. They often act as magnets.
Areas of low volume can often be sliced through more easily.
If you notice, that old support is an area of high volume.
So that level is a key retracement level, it is old support, and an area of high volume.
Which is why some of you may want to look to reward a move at that level if it comes.
Range Bound?
I still think there is a decent chance the corn market is simply range bound until getting new fresh data and planting intentions etc.
Trapped between the recent lows and the bottom of our old range.
As I just don’t see anything short term that would break us out of the range.
Soybeans
Technicals:
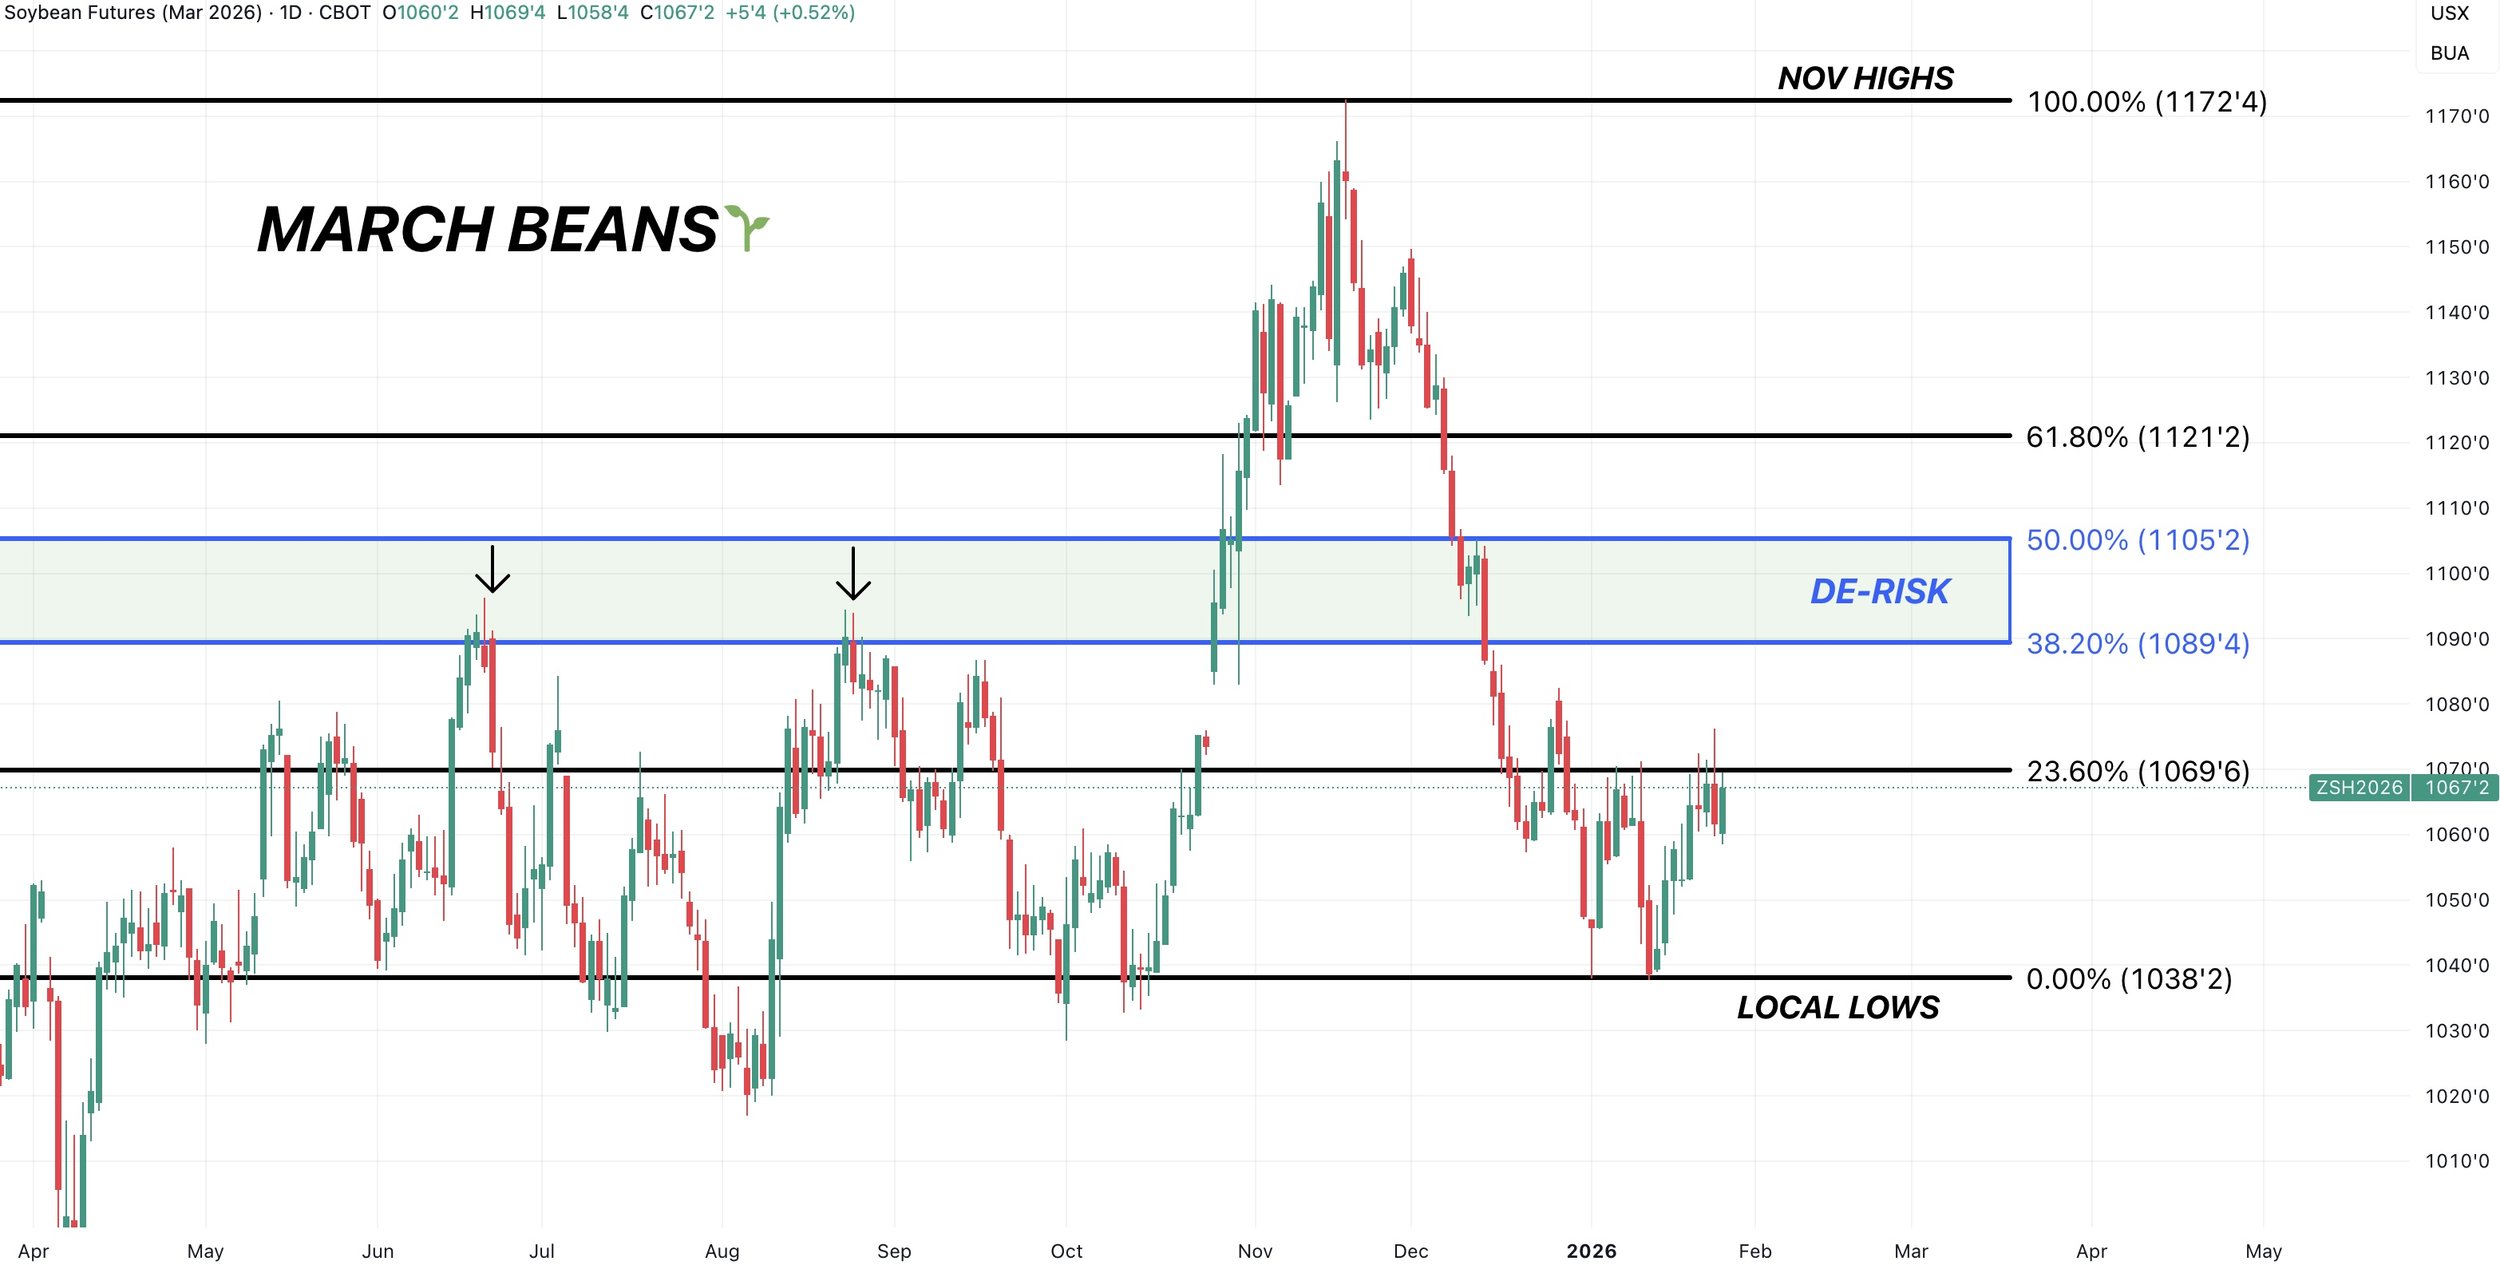
March Beans
Soybeans are still battling some very key resistance.
If we can break above this level, it should spark further upside.
We've failed to break through here 5 days in a row now.
This is the first retracement up to those November highs. The 23.6% level.
A break above should result in a move towards the next levels.
The 38.2% and 50% levels ($10.89 to $11.05).
That is where we will be looking to reward this market if it comes.
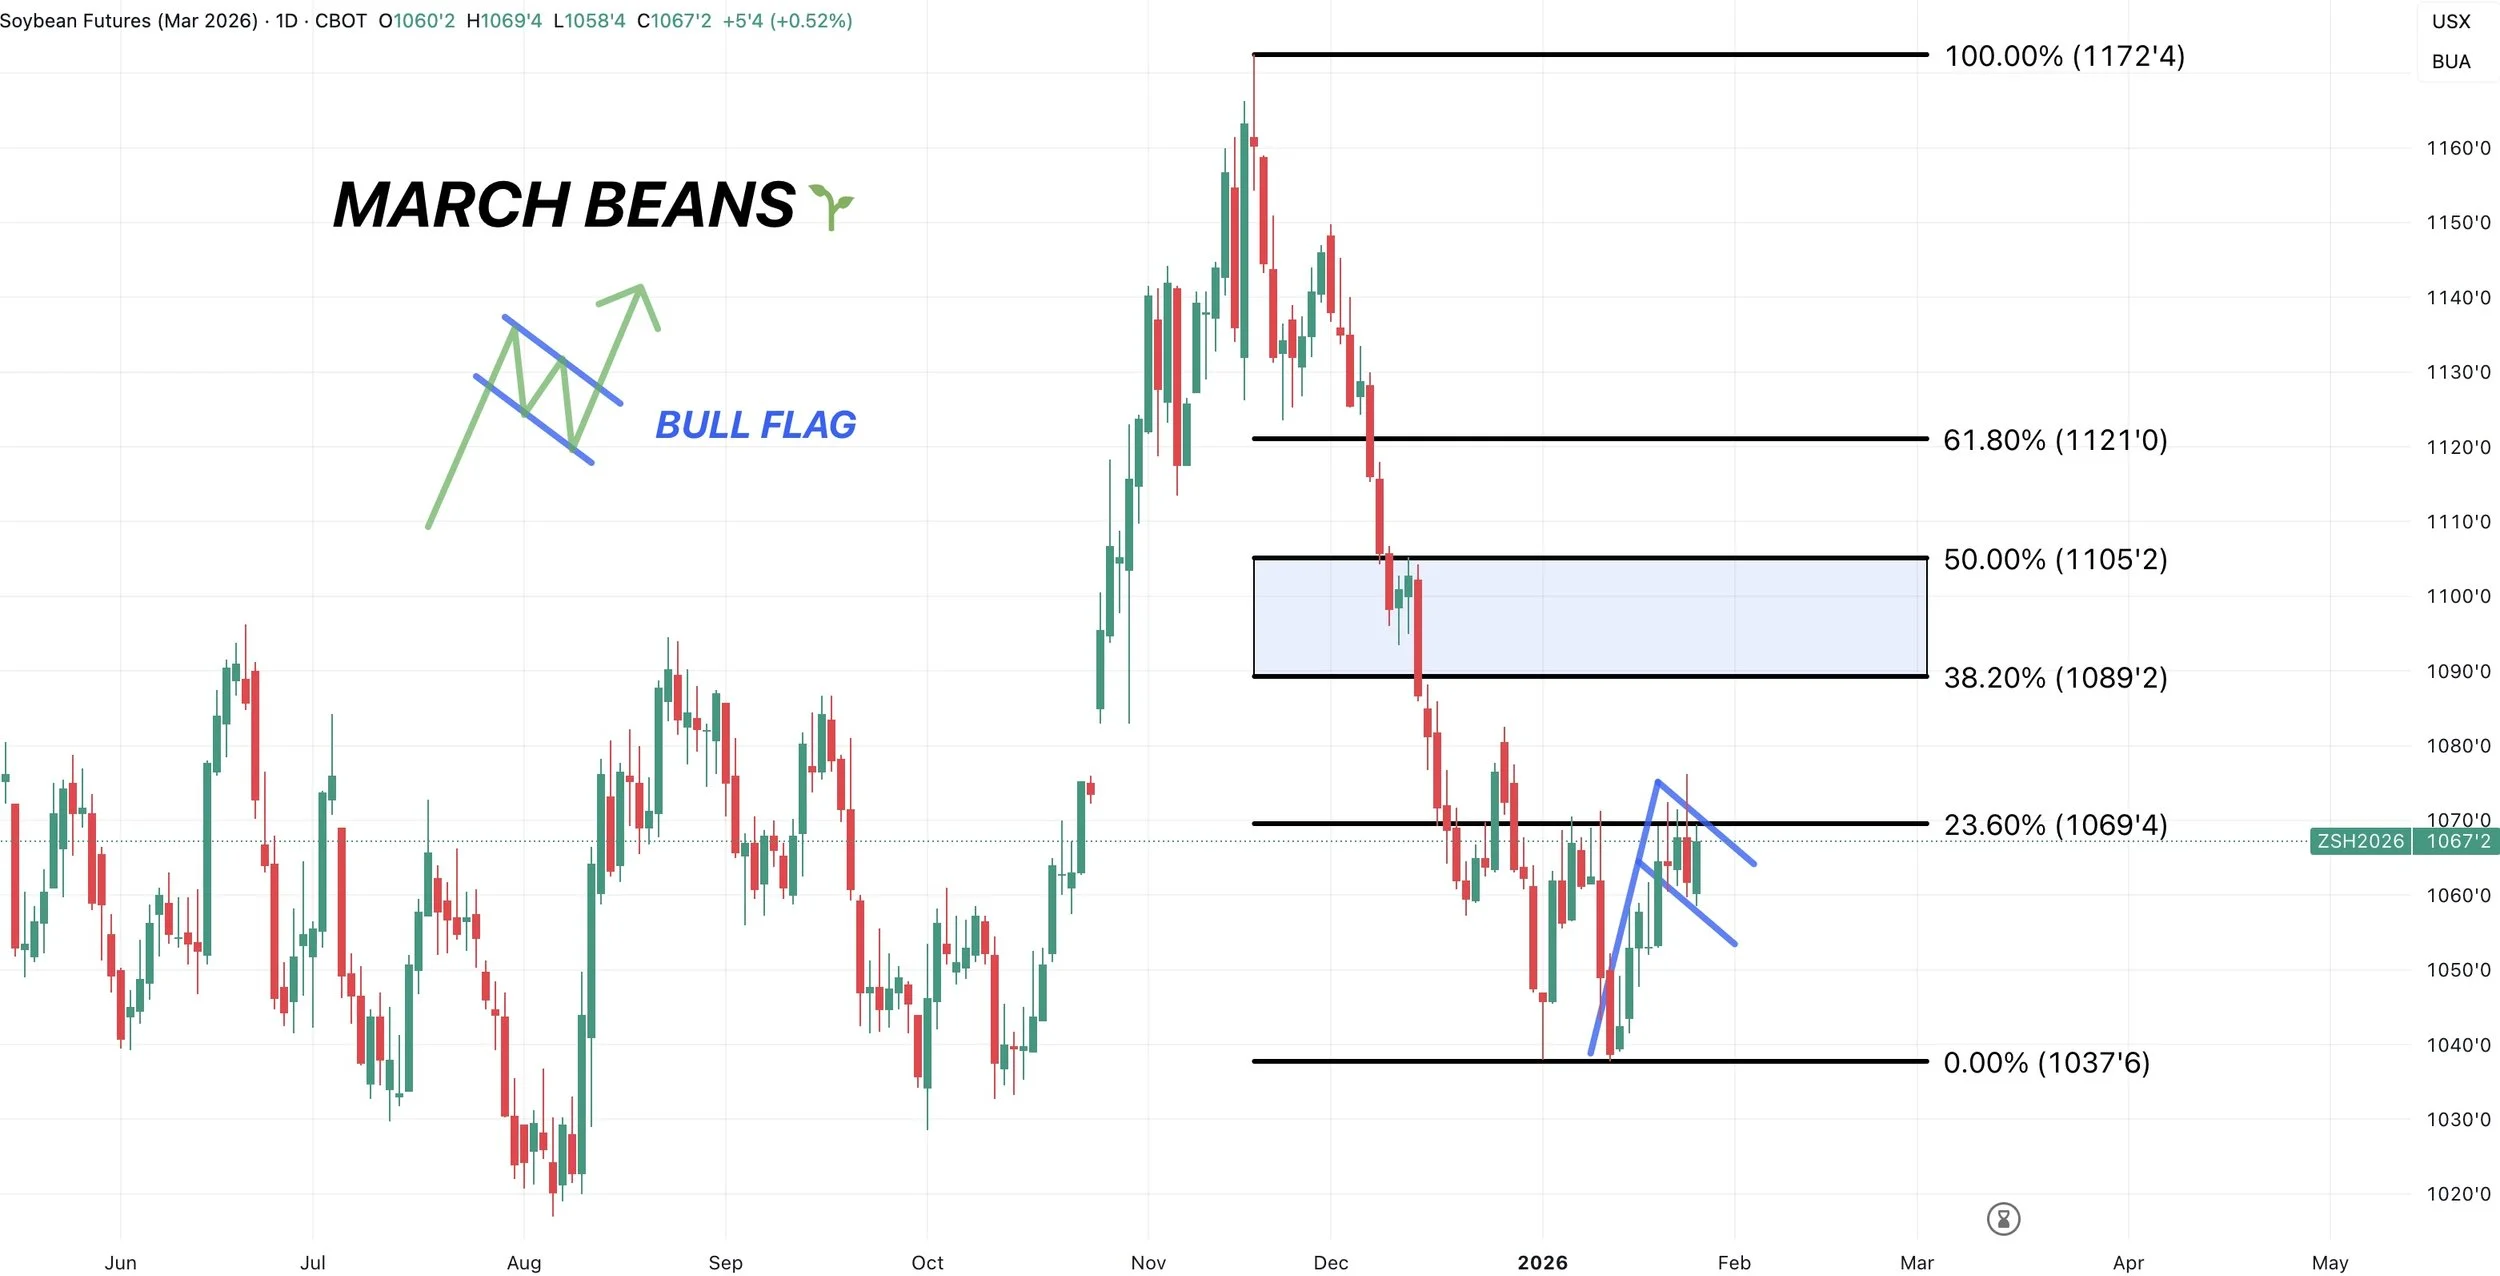
We are sitting in a potential bull flag here.
A very common bullish pattern.
The measured move takes you into the box.
So my bias does lean towards a break out. As it does look like we are potentially coiling up for a move higher.
But we need a close above $10.70 for confirmation.
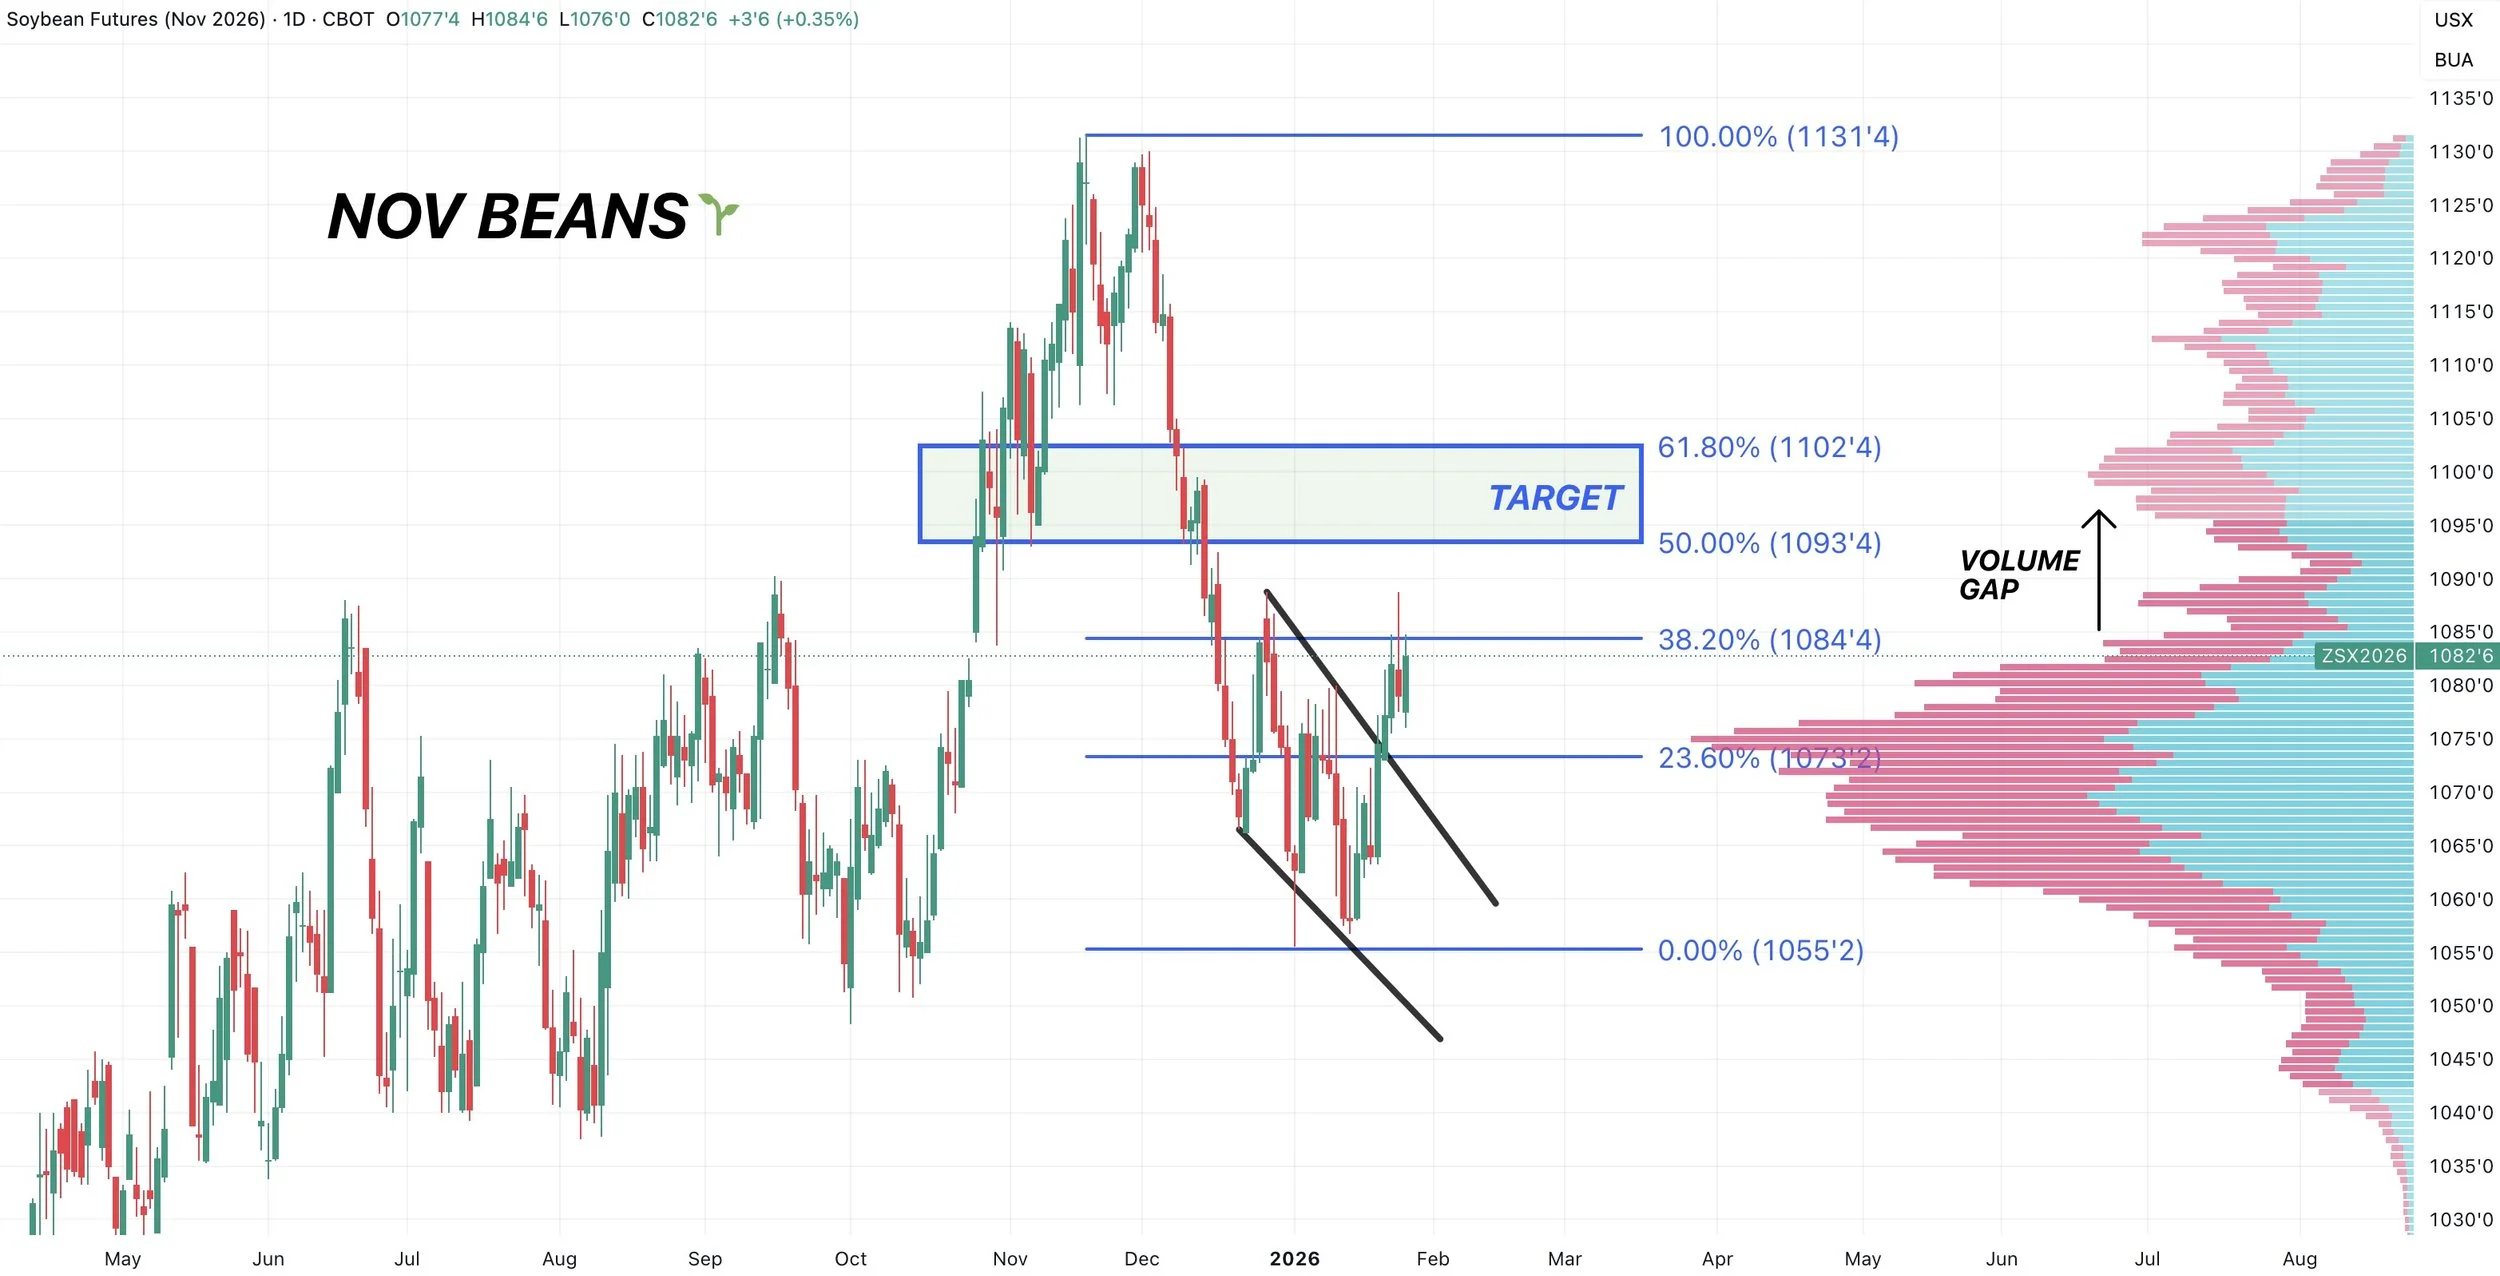
Nov beans are also close to breaking some key resistance, but no confirmation yet.
We are still battling the 38.2% retracement up to the November highs.
Like in March beans, if we break above this level it should result in a leg higher towards the next levels.
In this case, that target is the golden zone. The most common level for prices to revert back to.
That comes in at $10.93 to $11.00
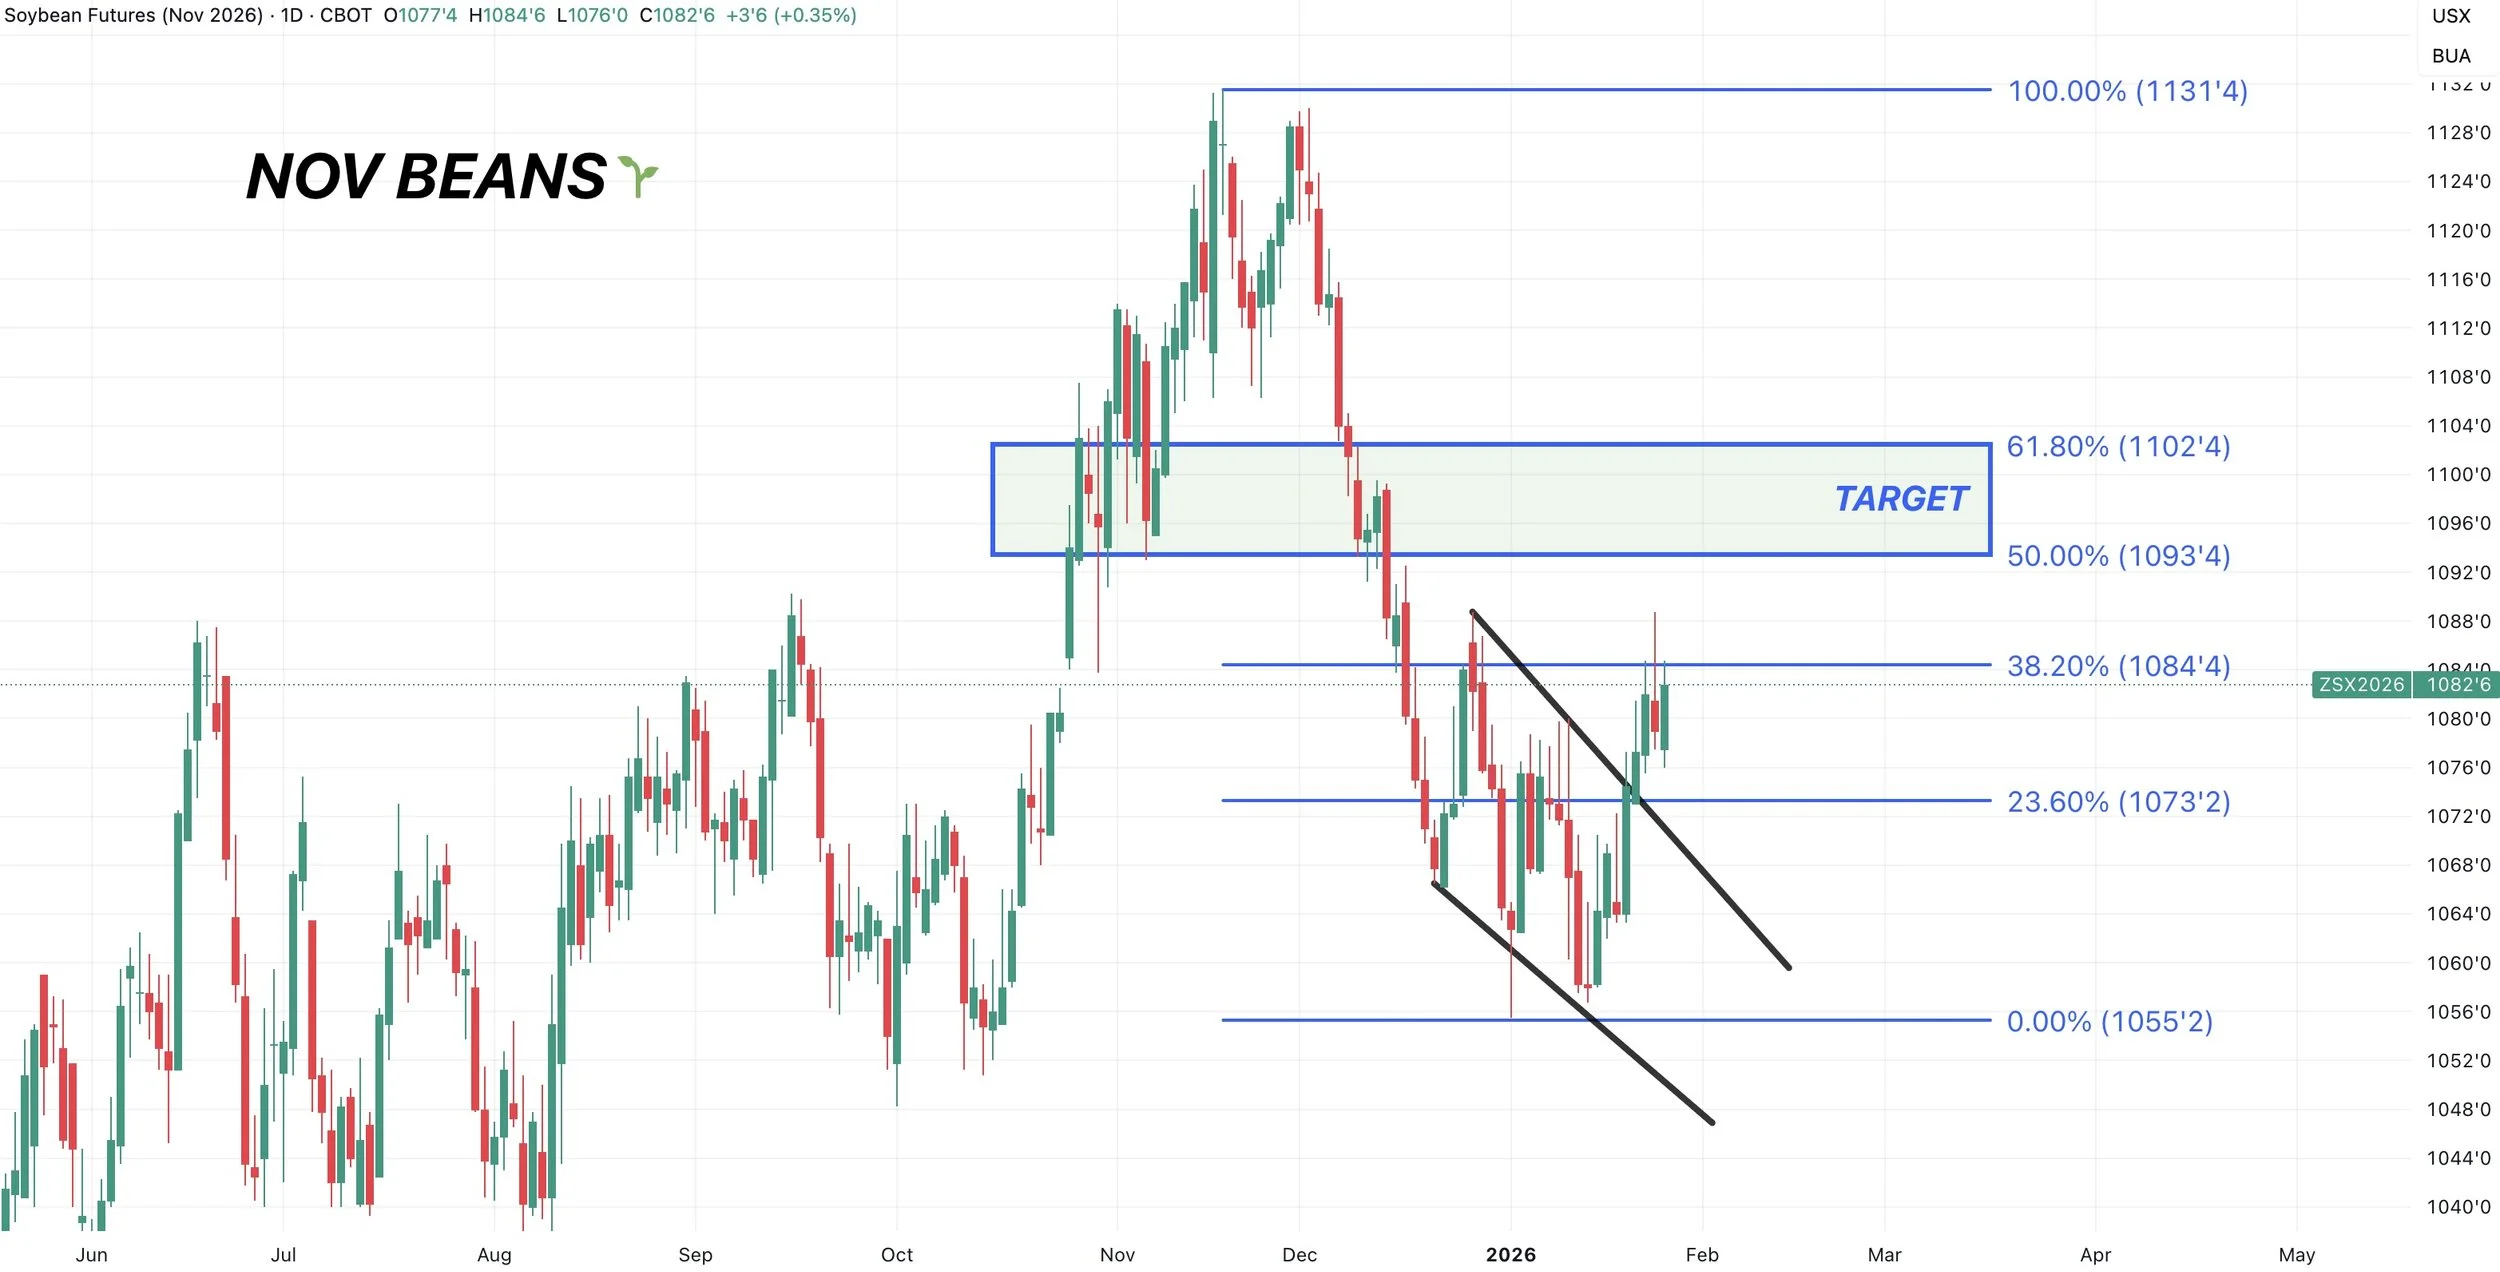
Not only that, but that target is also an area of high volume.
We are sitting at an area of high volume right now.
If we break above, we have a volume gap. With the next area of high volume coming in right at the golden zone.
Adding even more interest if we get there.
Wheat
Technicals:
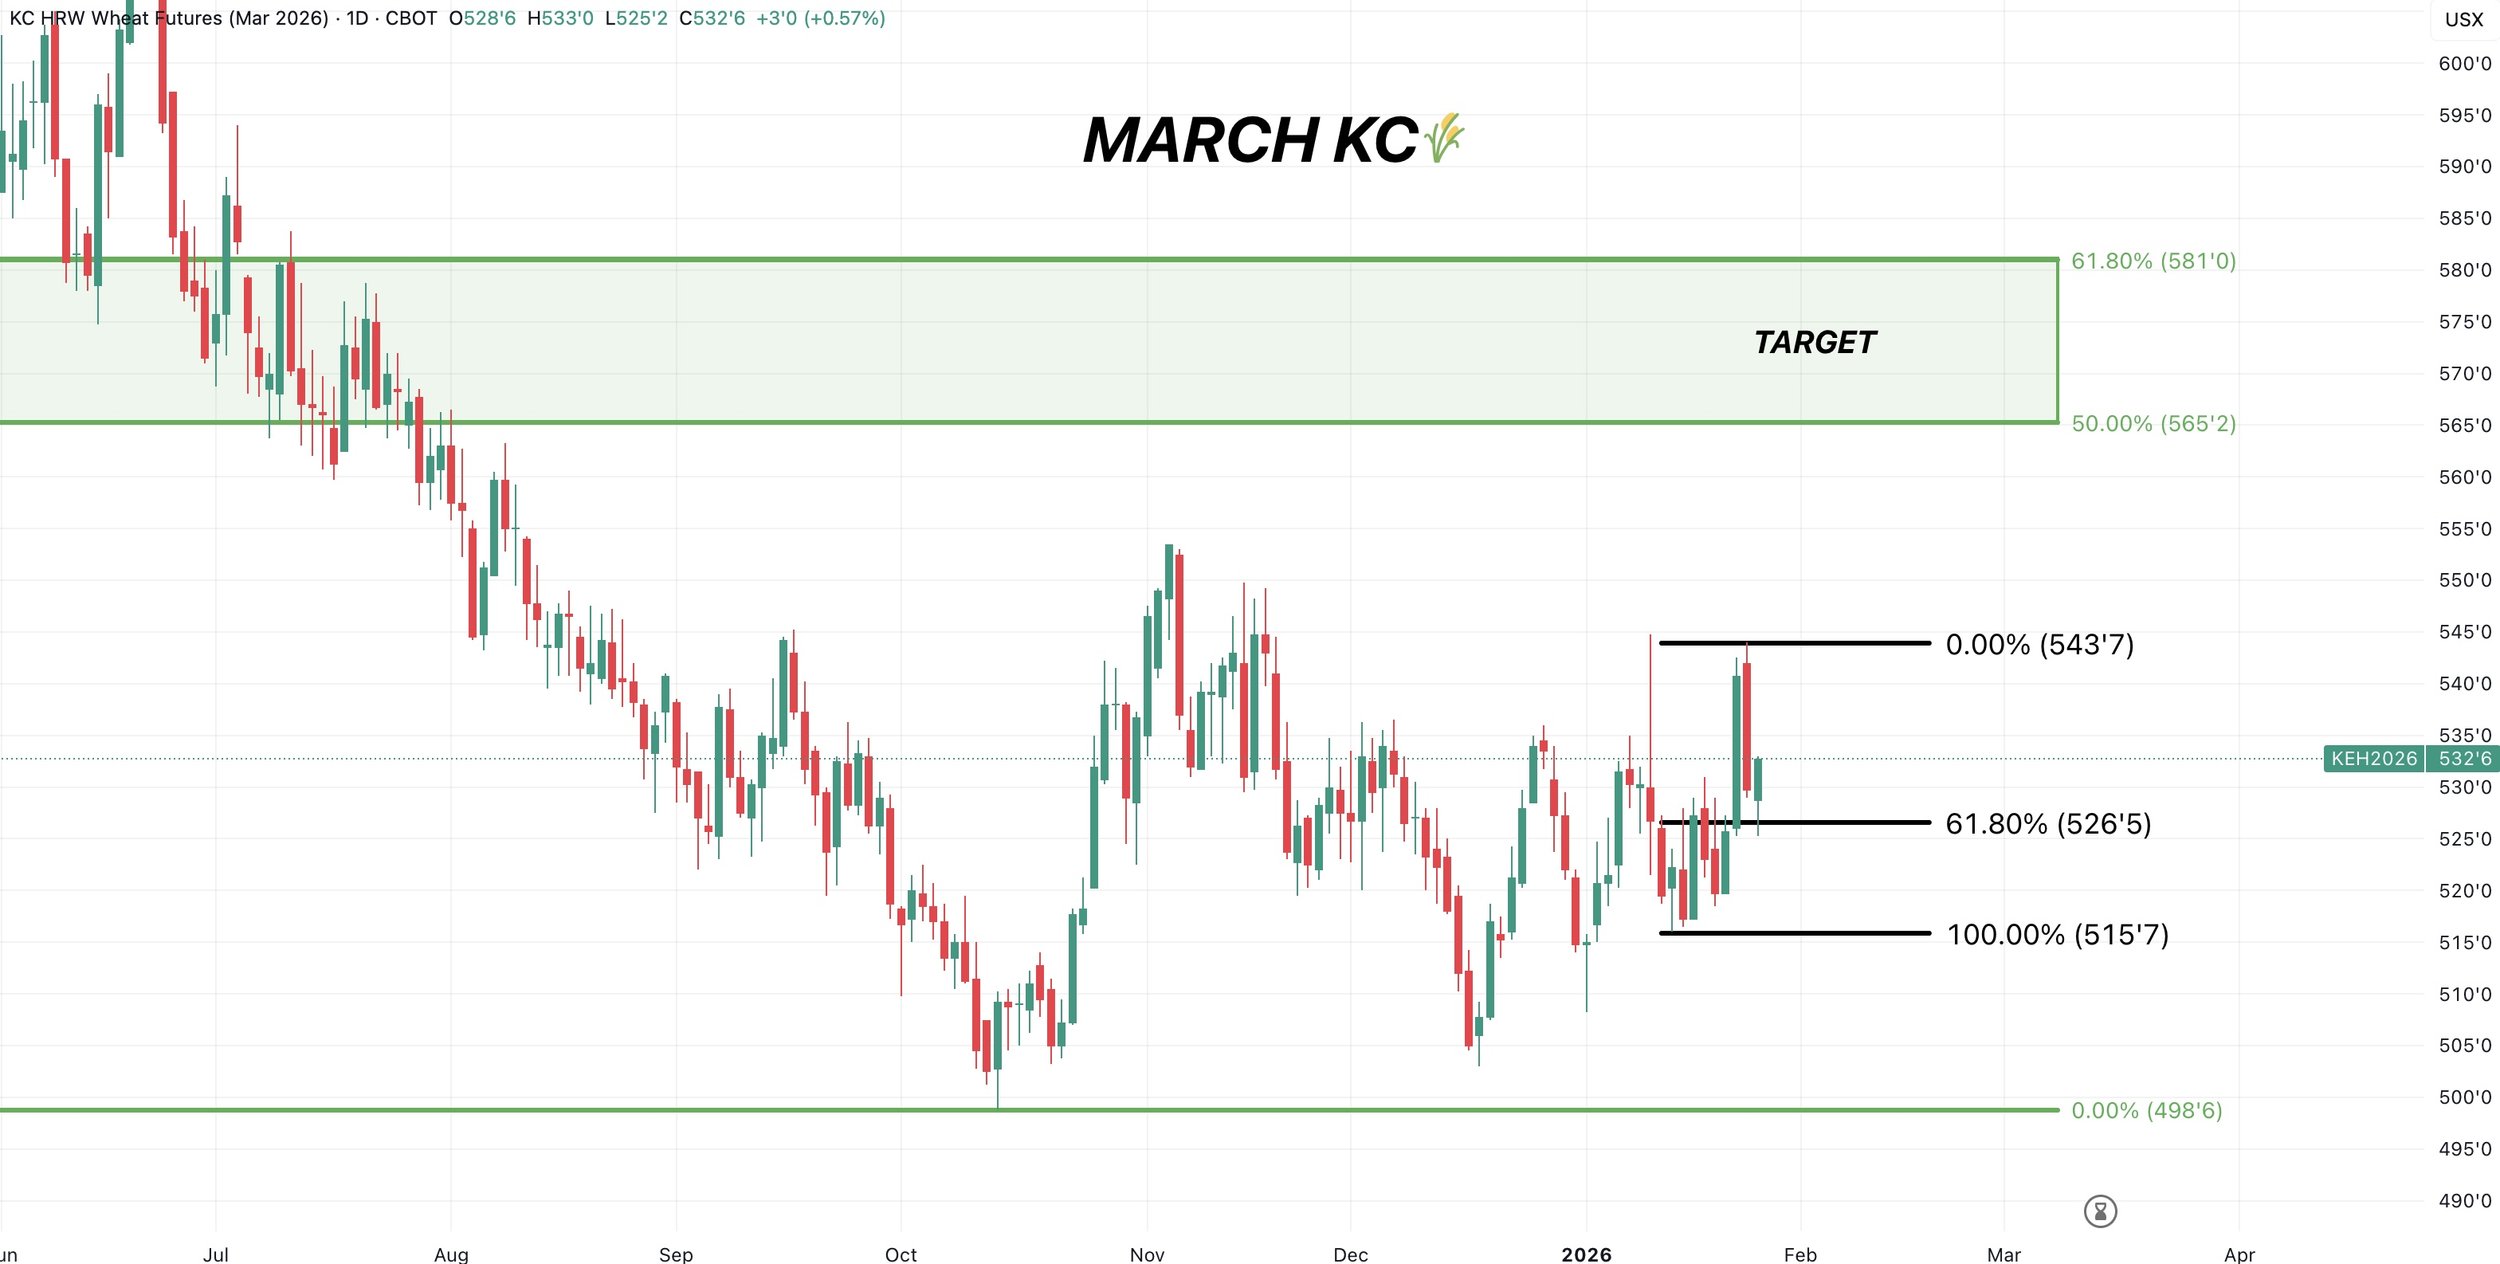
March KC
We broke out of the wedge pattern. It now looks like we are possibly back testing it as support.
We broke above the golden zone but fell back in it on yesterday’s sell off.
If we can bounce back out, it should result in some room higher.
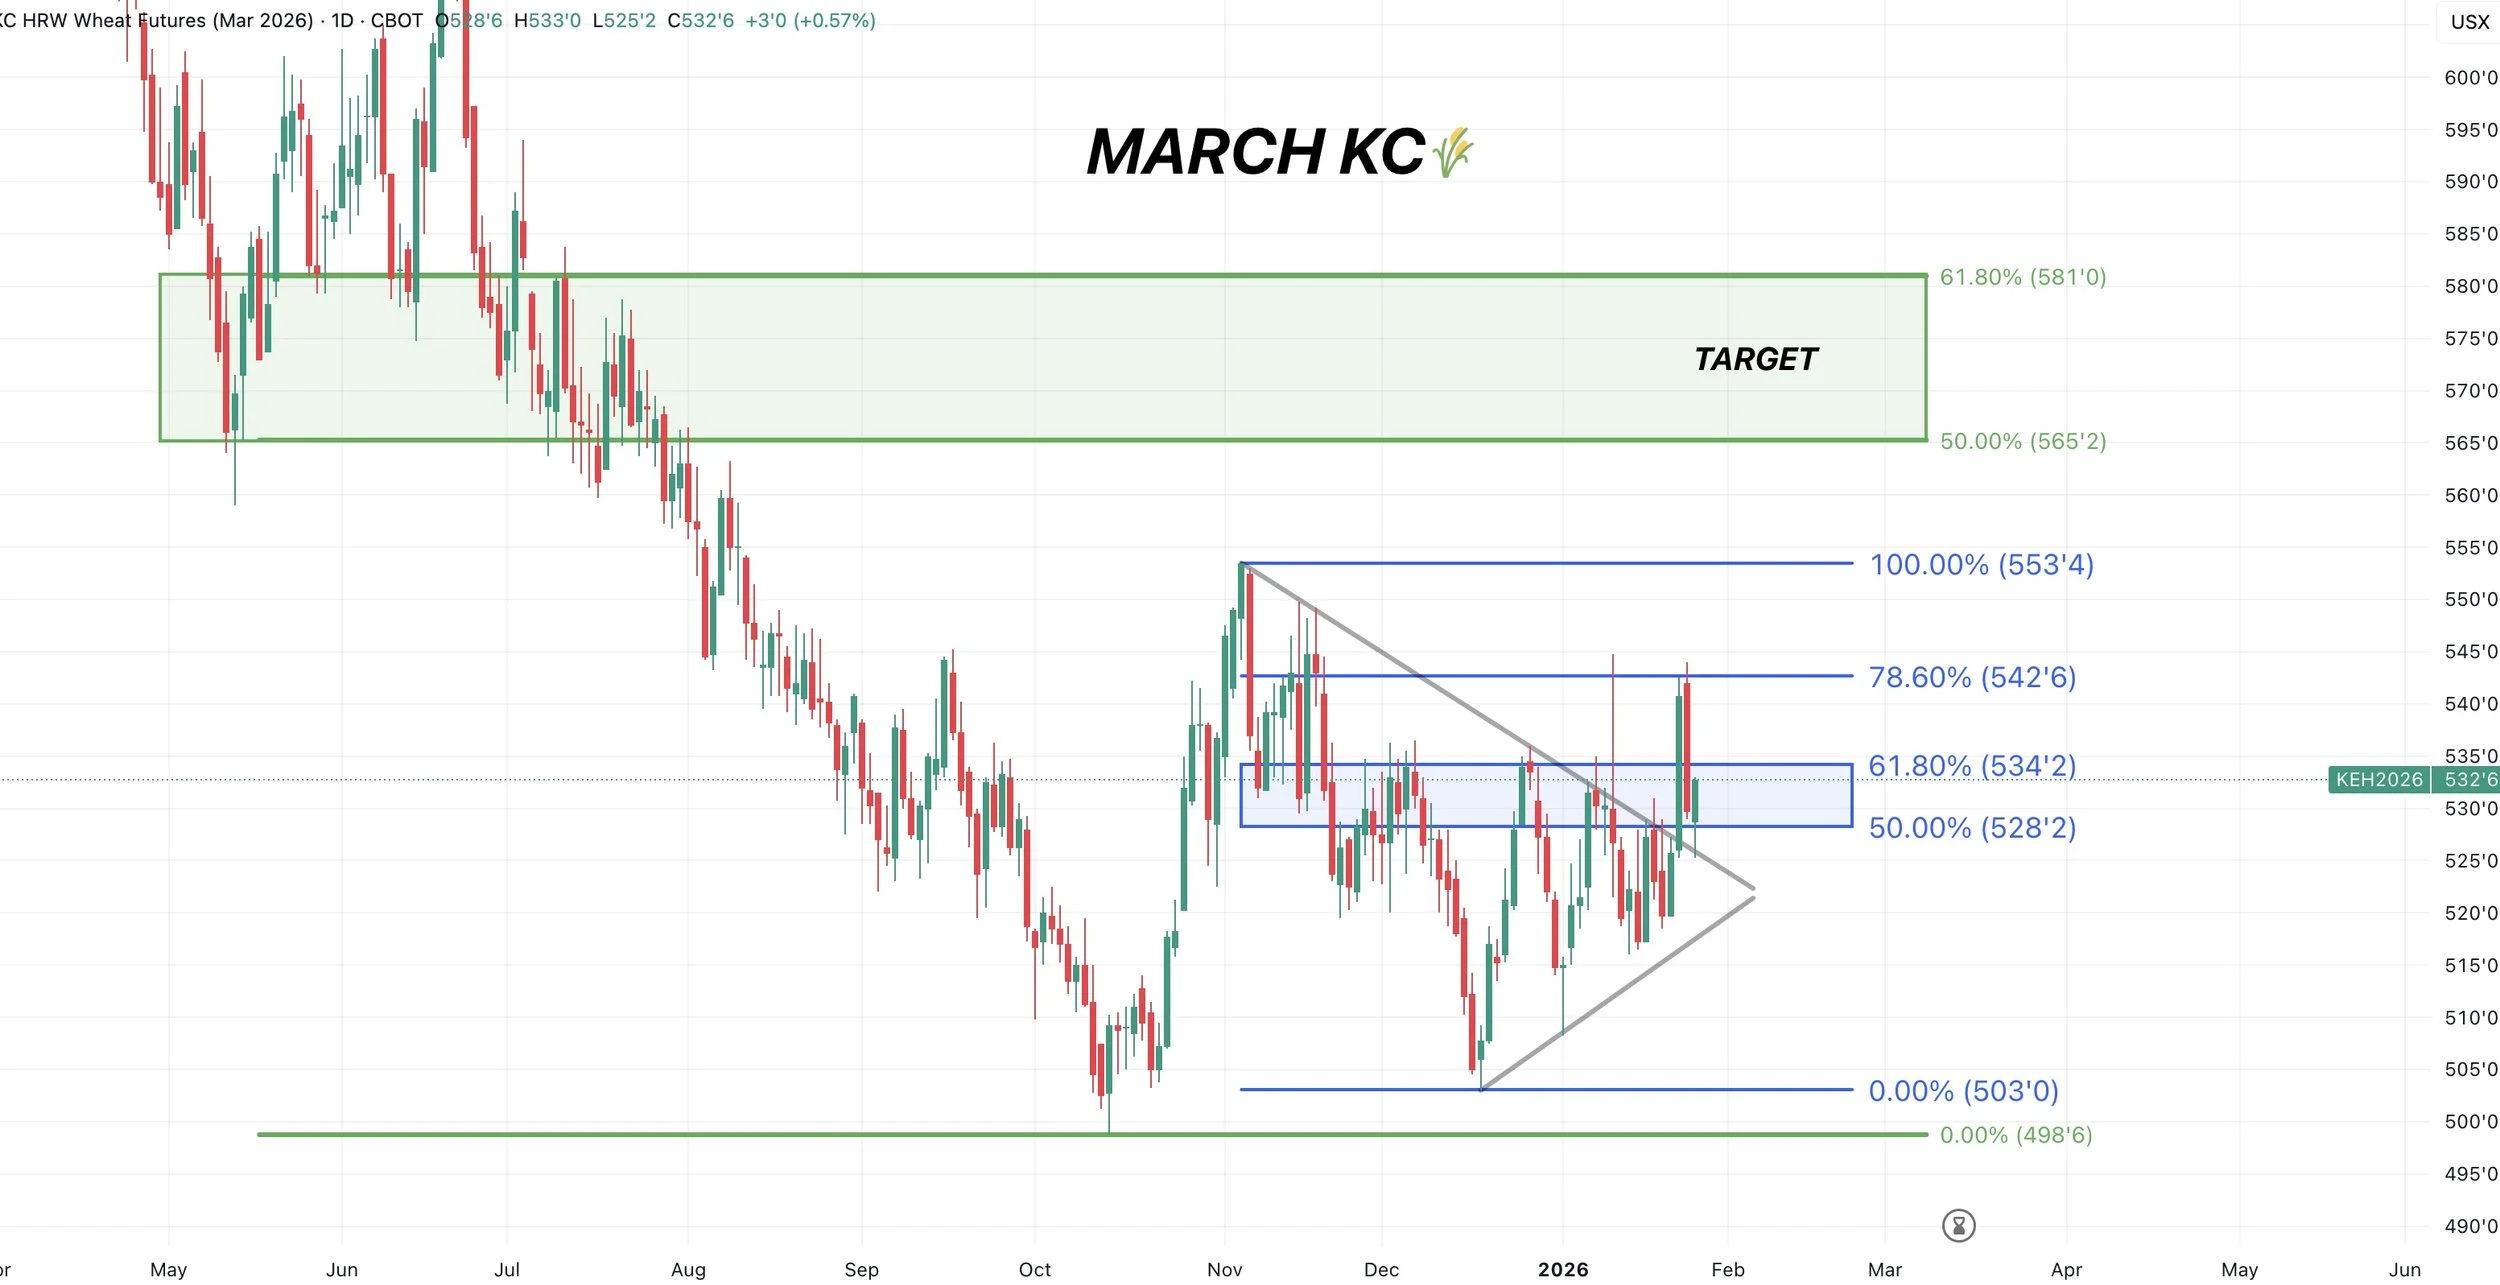
On yesterday’s sell off, we gave back 61.8% of the recent bounce.
The exact level we needed to hold and we did.
That is going to be the key level to hold moving forward. Failure to hold will let us know if we are in for a deeper pullback.
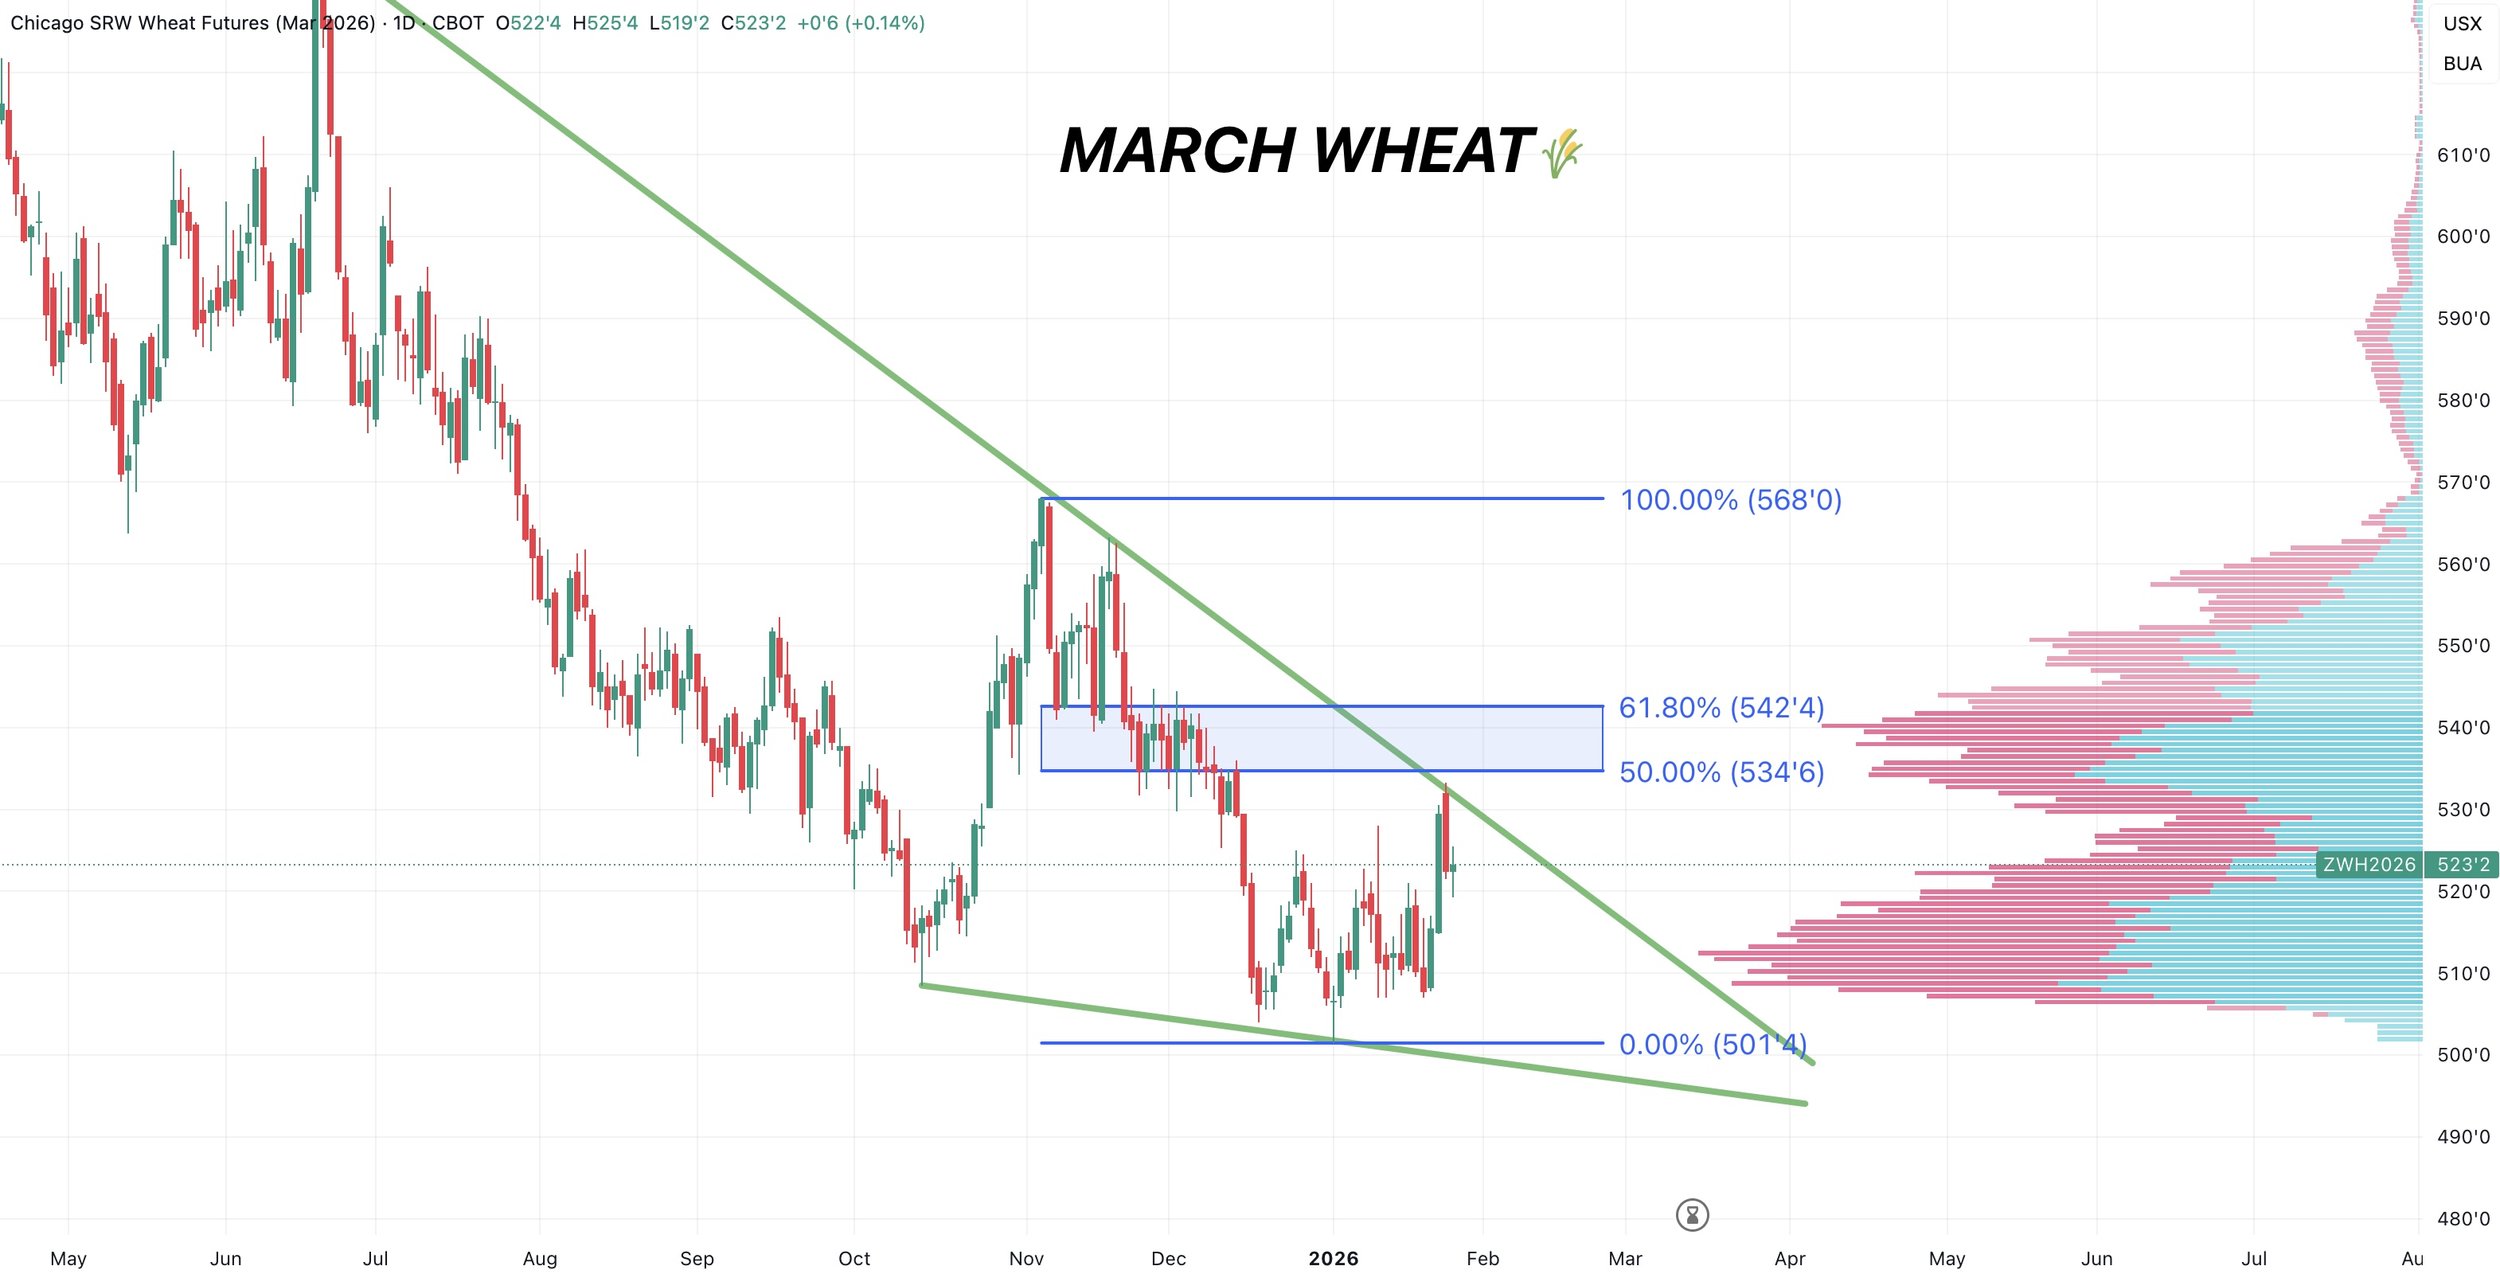
March Chicago
We've got a multi-month wedge pattern we've been trapped in.
We failed right at trend line resistance once again.
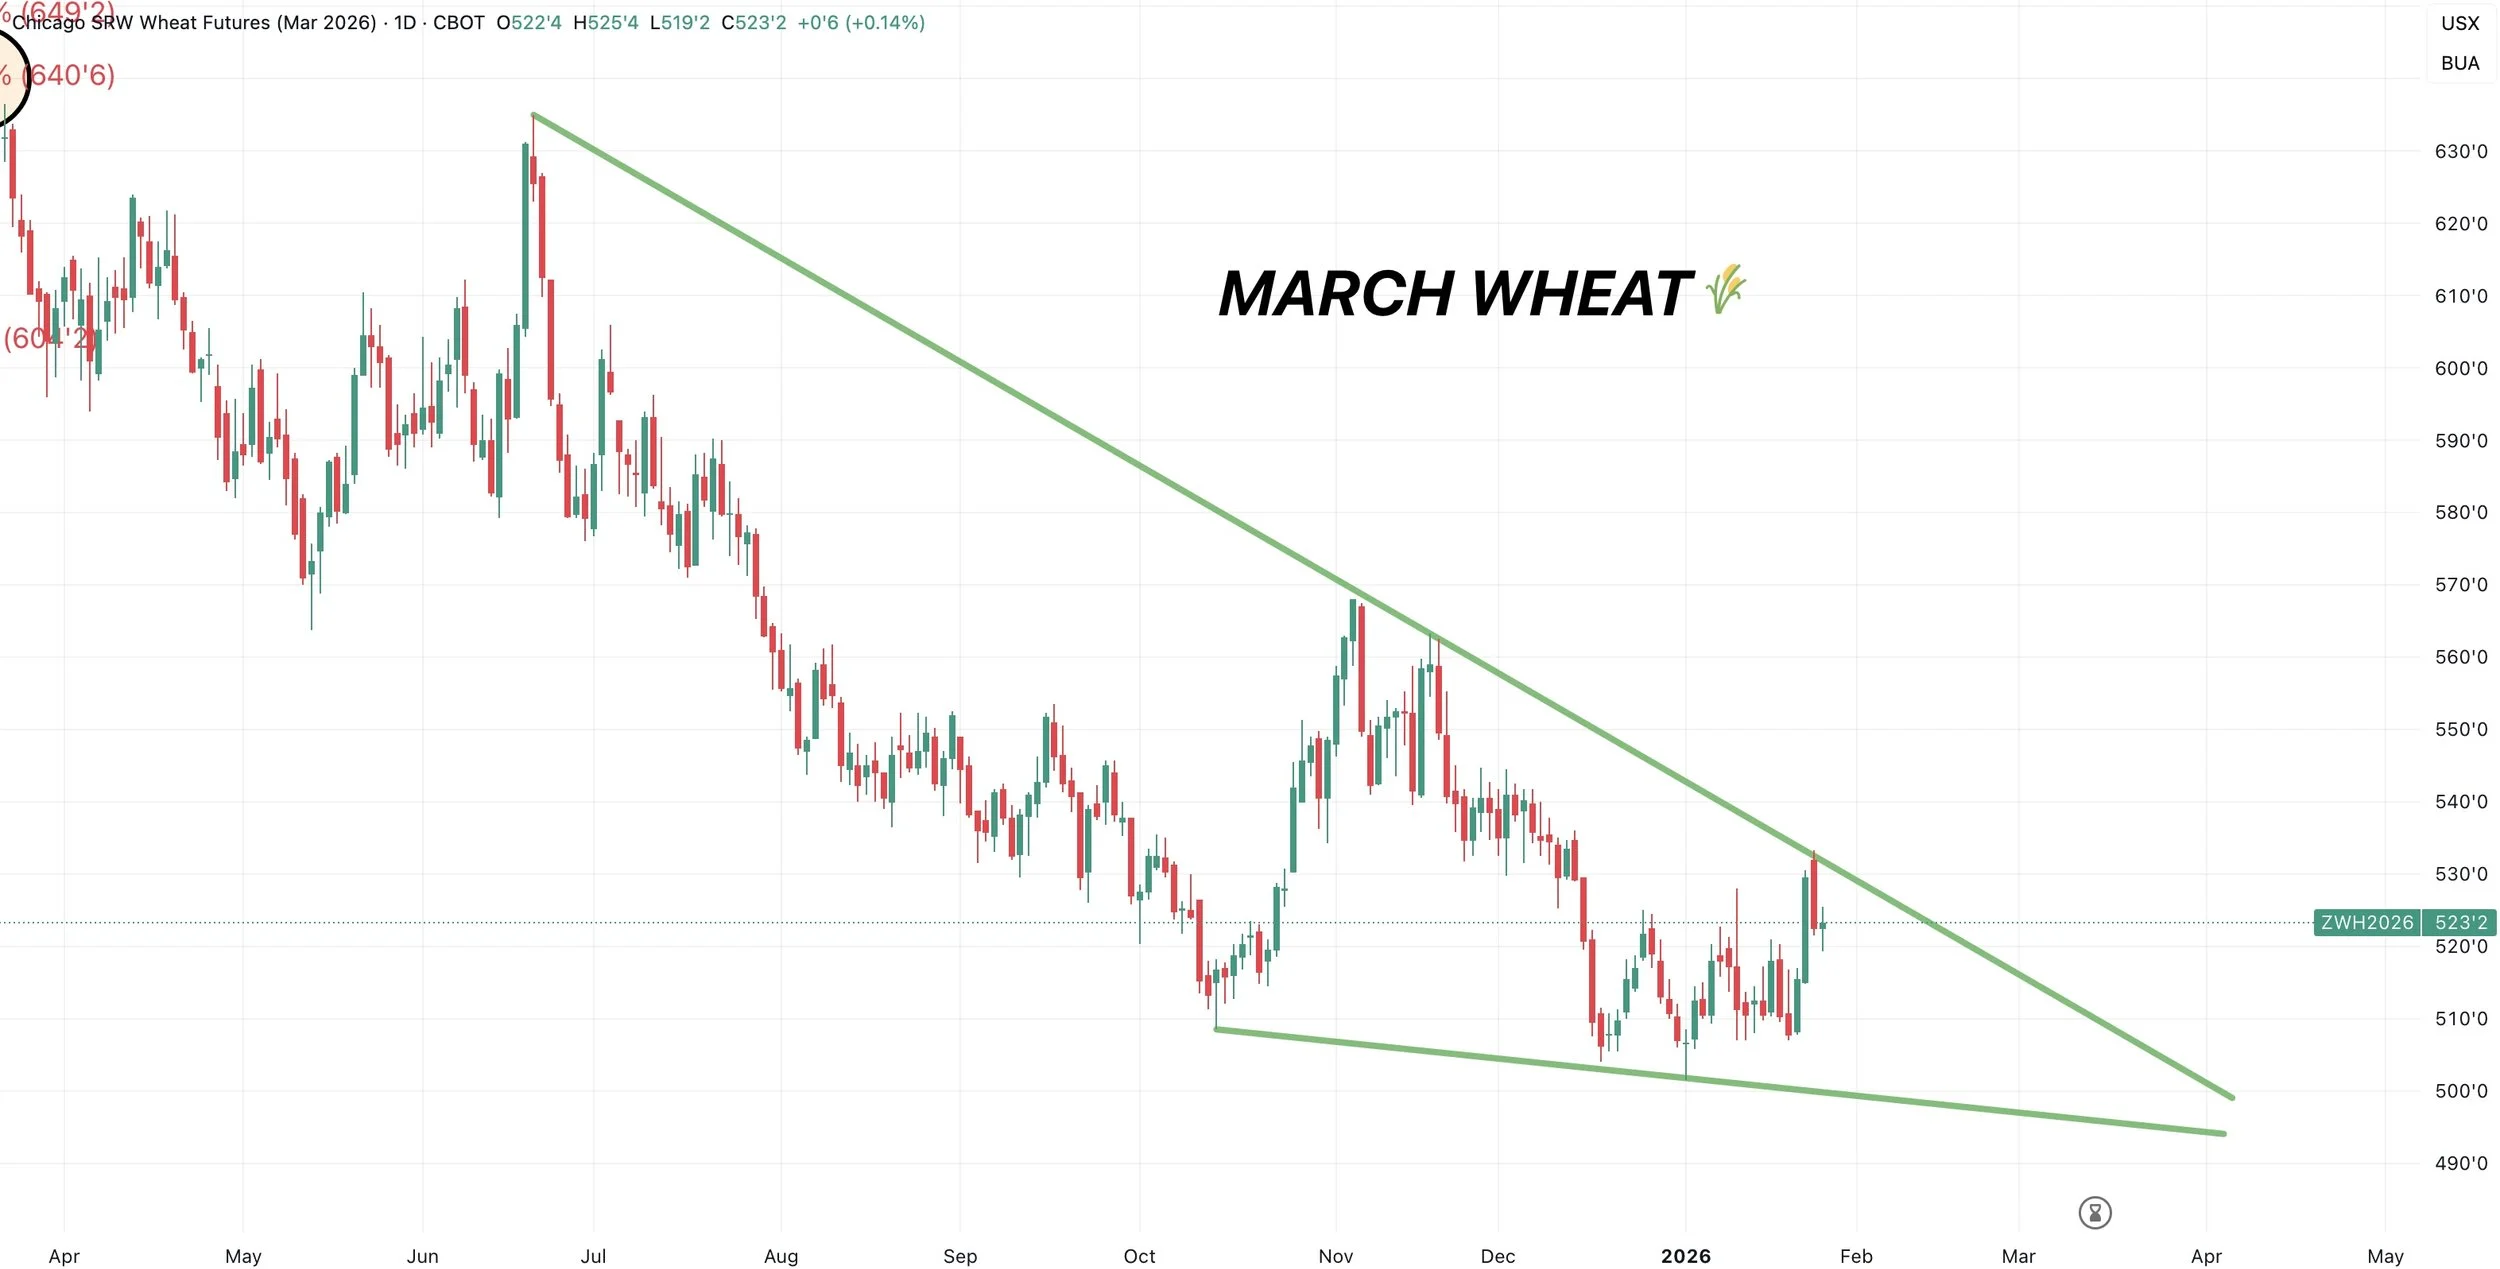
It would not be surprising to see this market struggle between $5.35 to $5.42
That’s the golden zone up to the November highs.
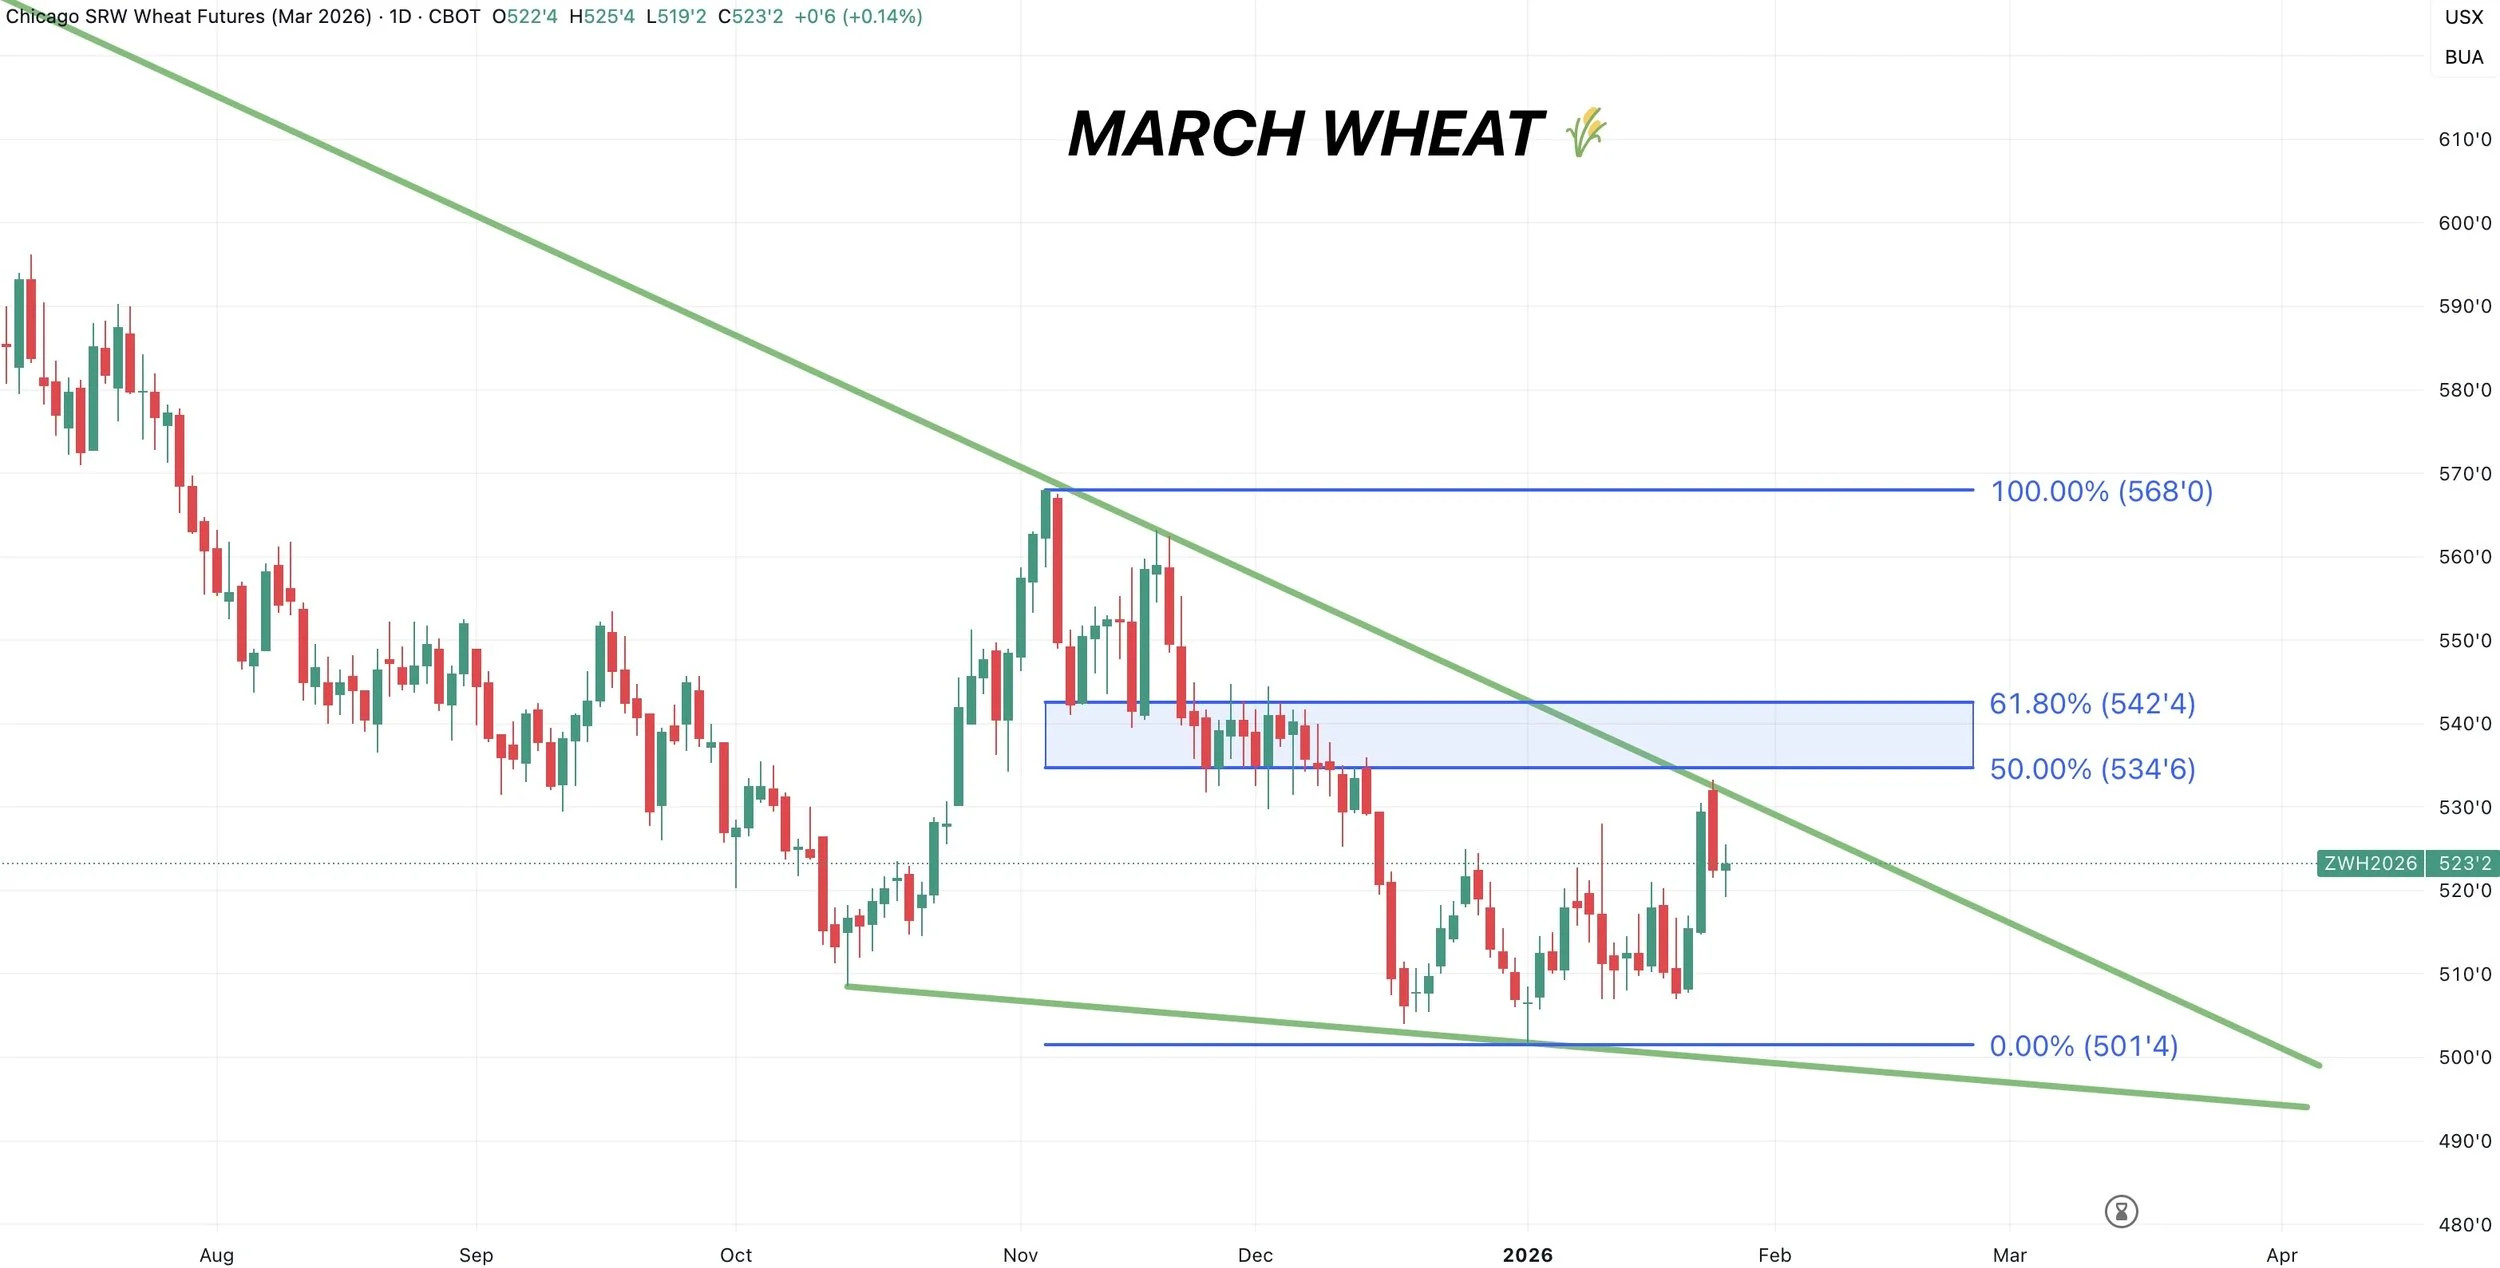
It's also an area of high volume.
Break above and it should result in a leg higher. But for now, struggling there would make sense.
Cattle
Technicals:
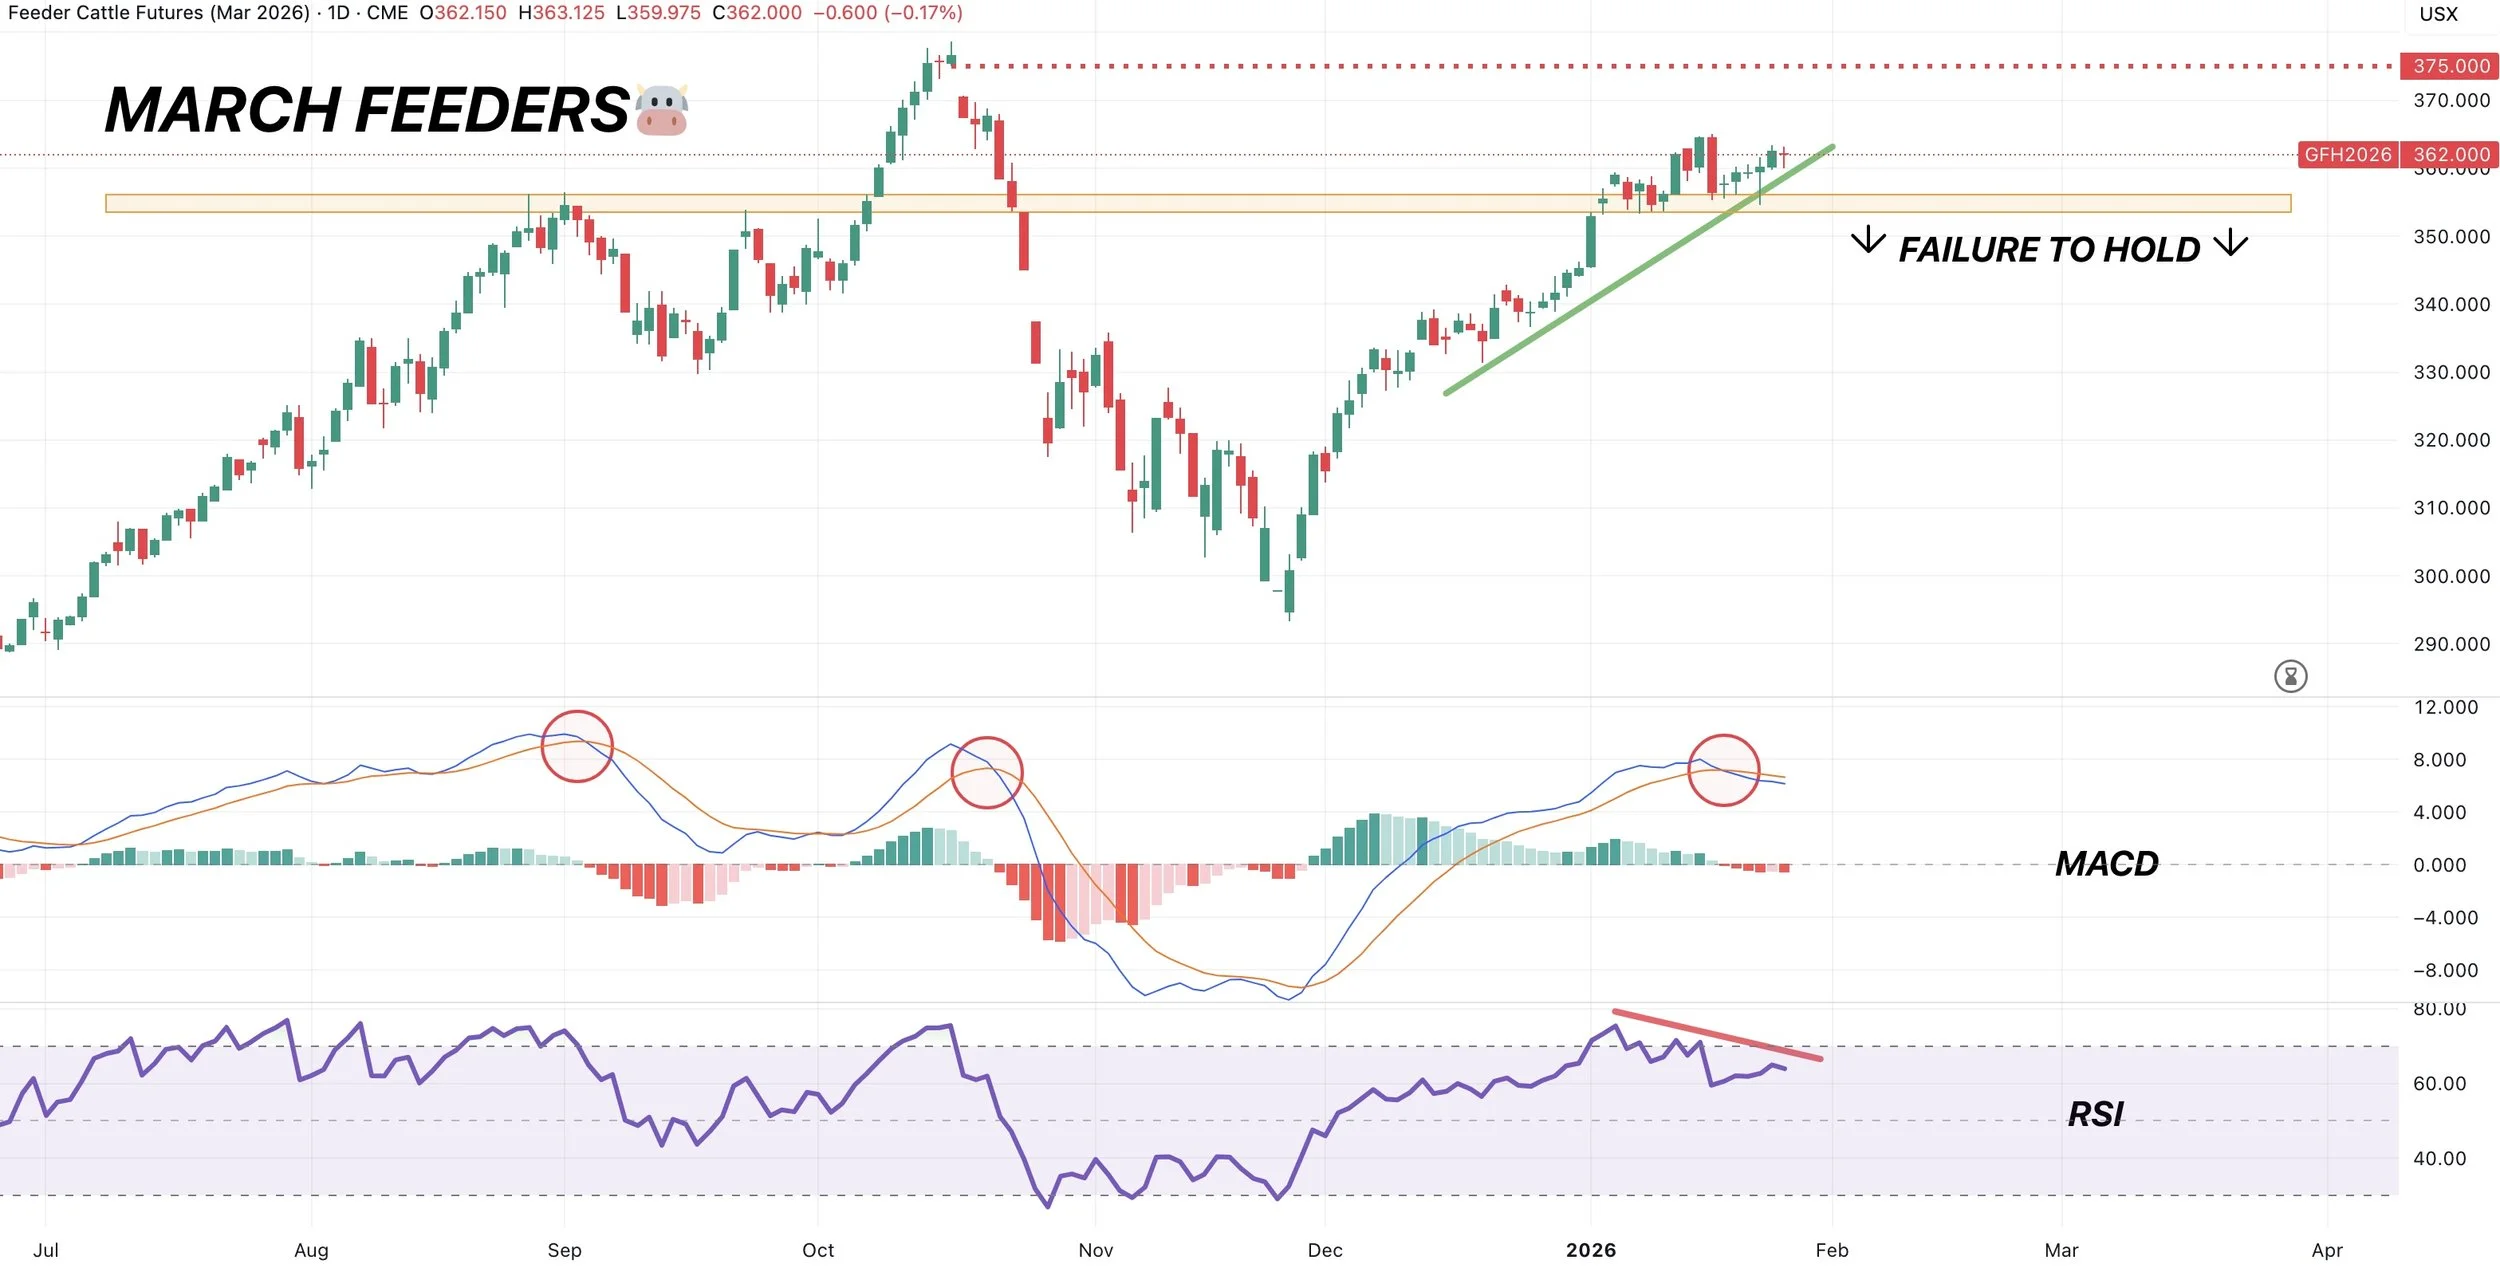
March Feeders
We are still in a clear uptrend.
That yellow support and resistance box is going to be the level to hold.
Failure to hold could result in a leg lower.
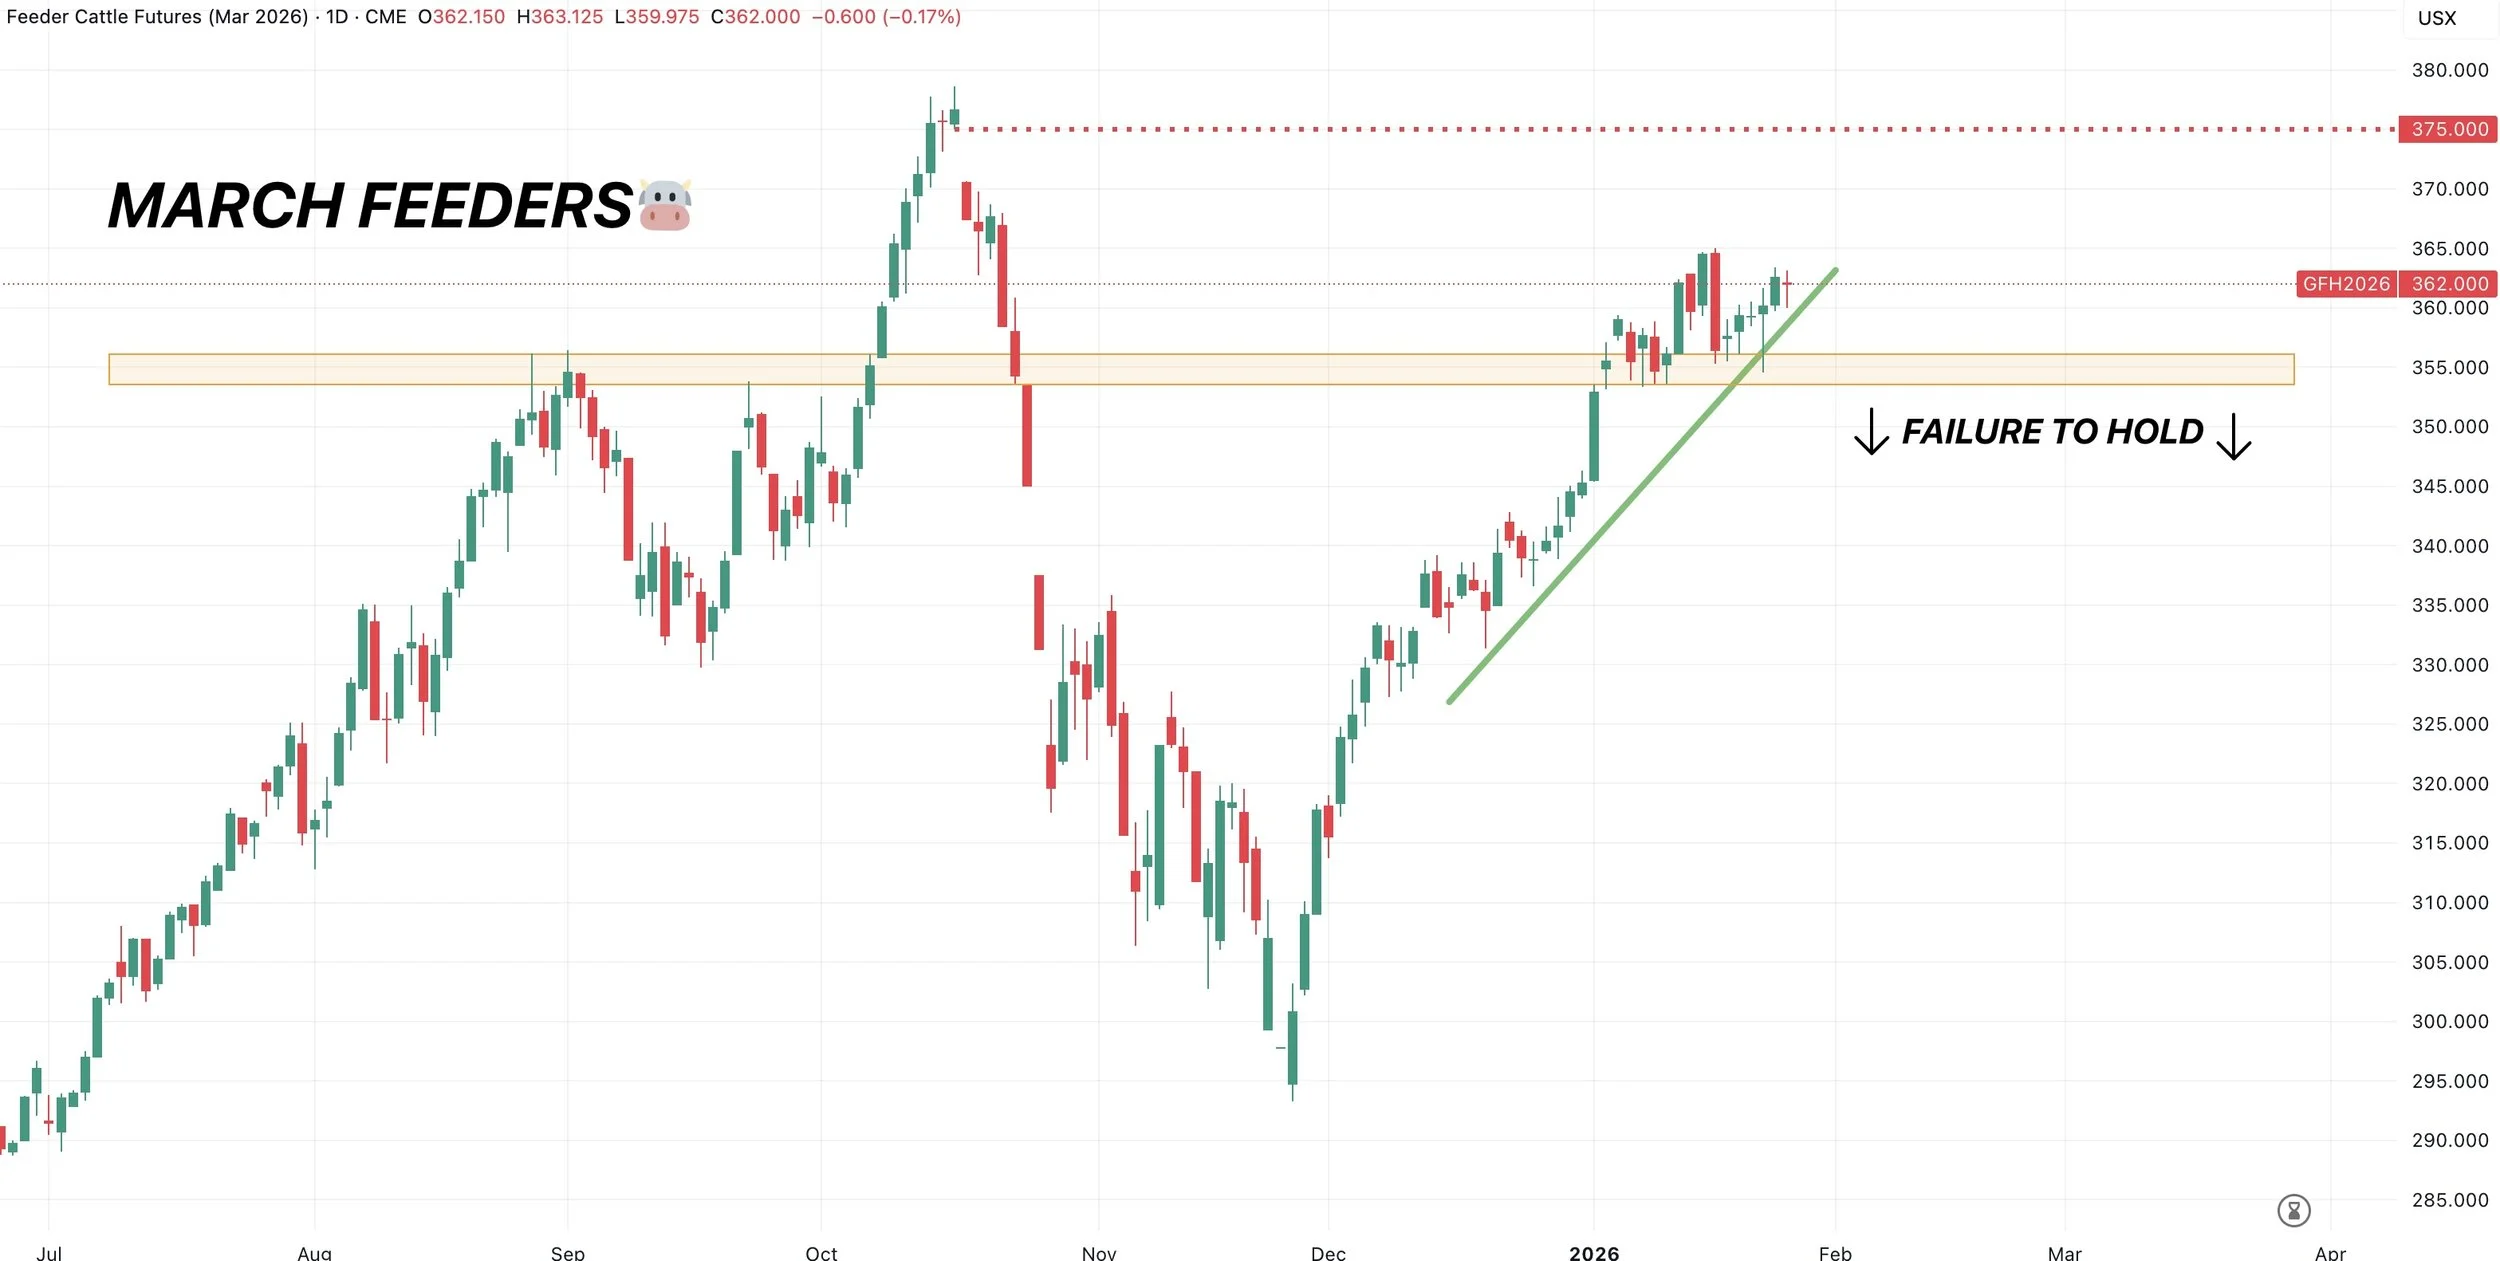
We have bearish divergence on the RSI and the MACD also flipped bearish.
A few reasons to have some caution.
We still like defending these levels if you have not.
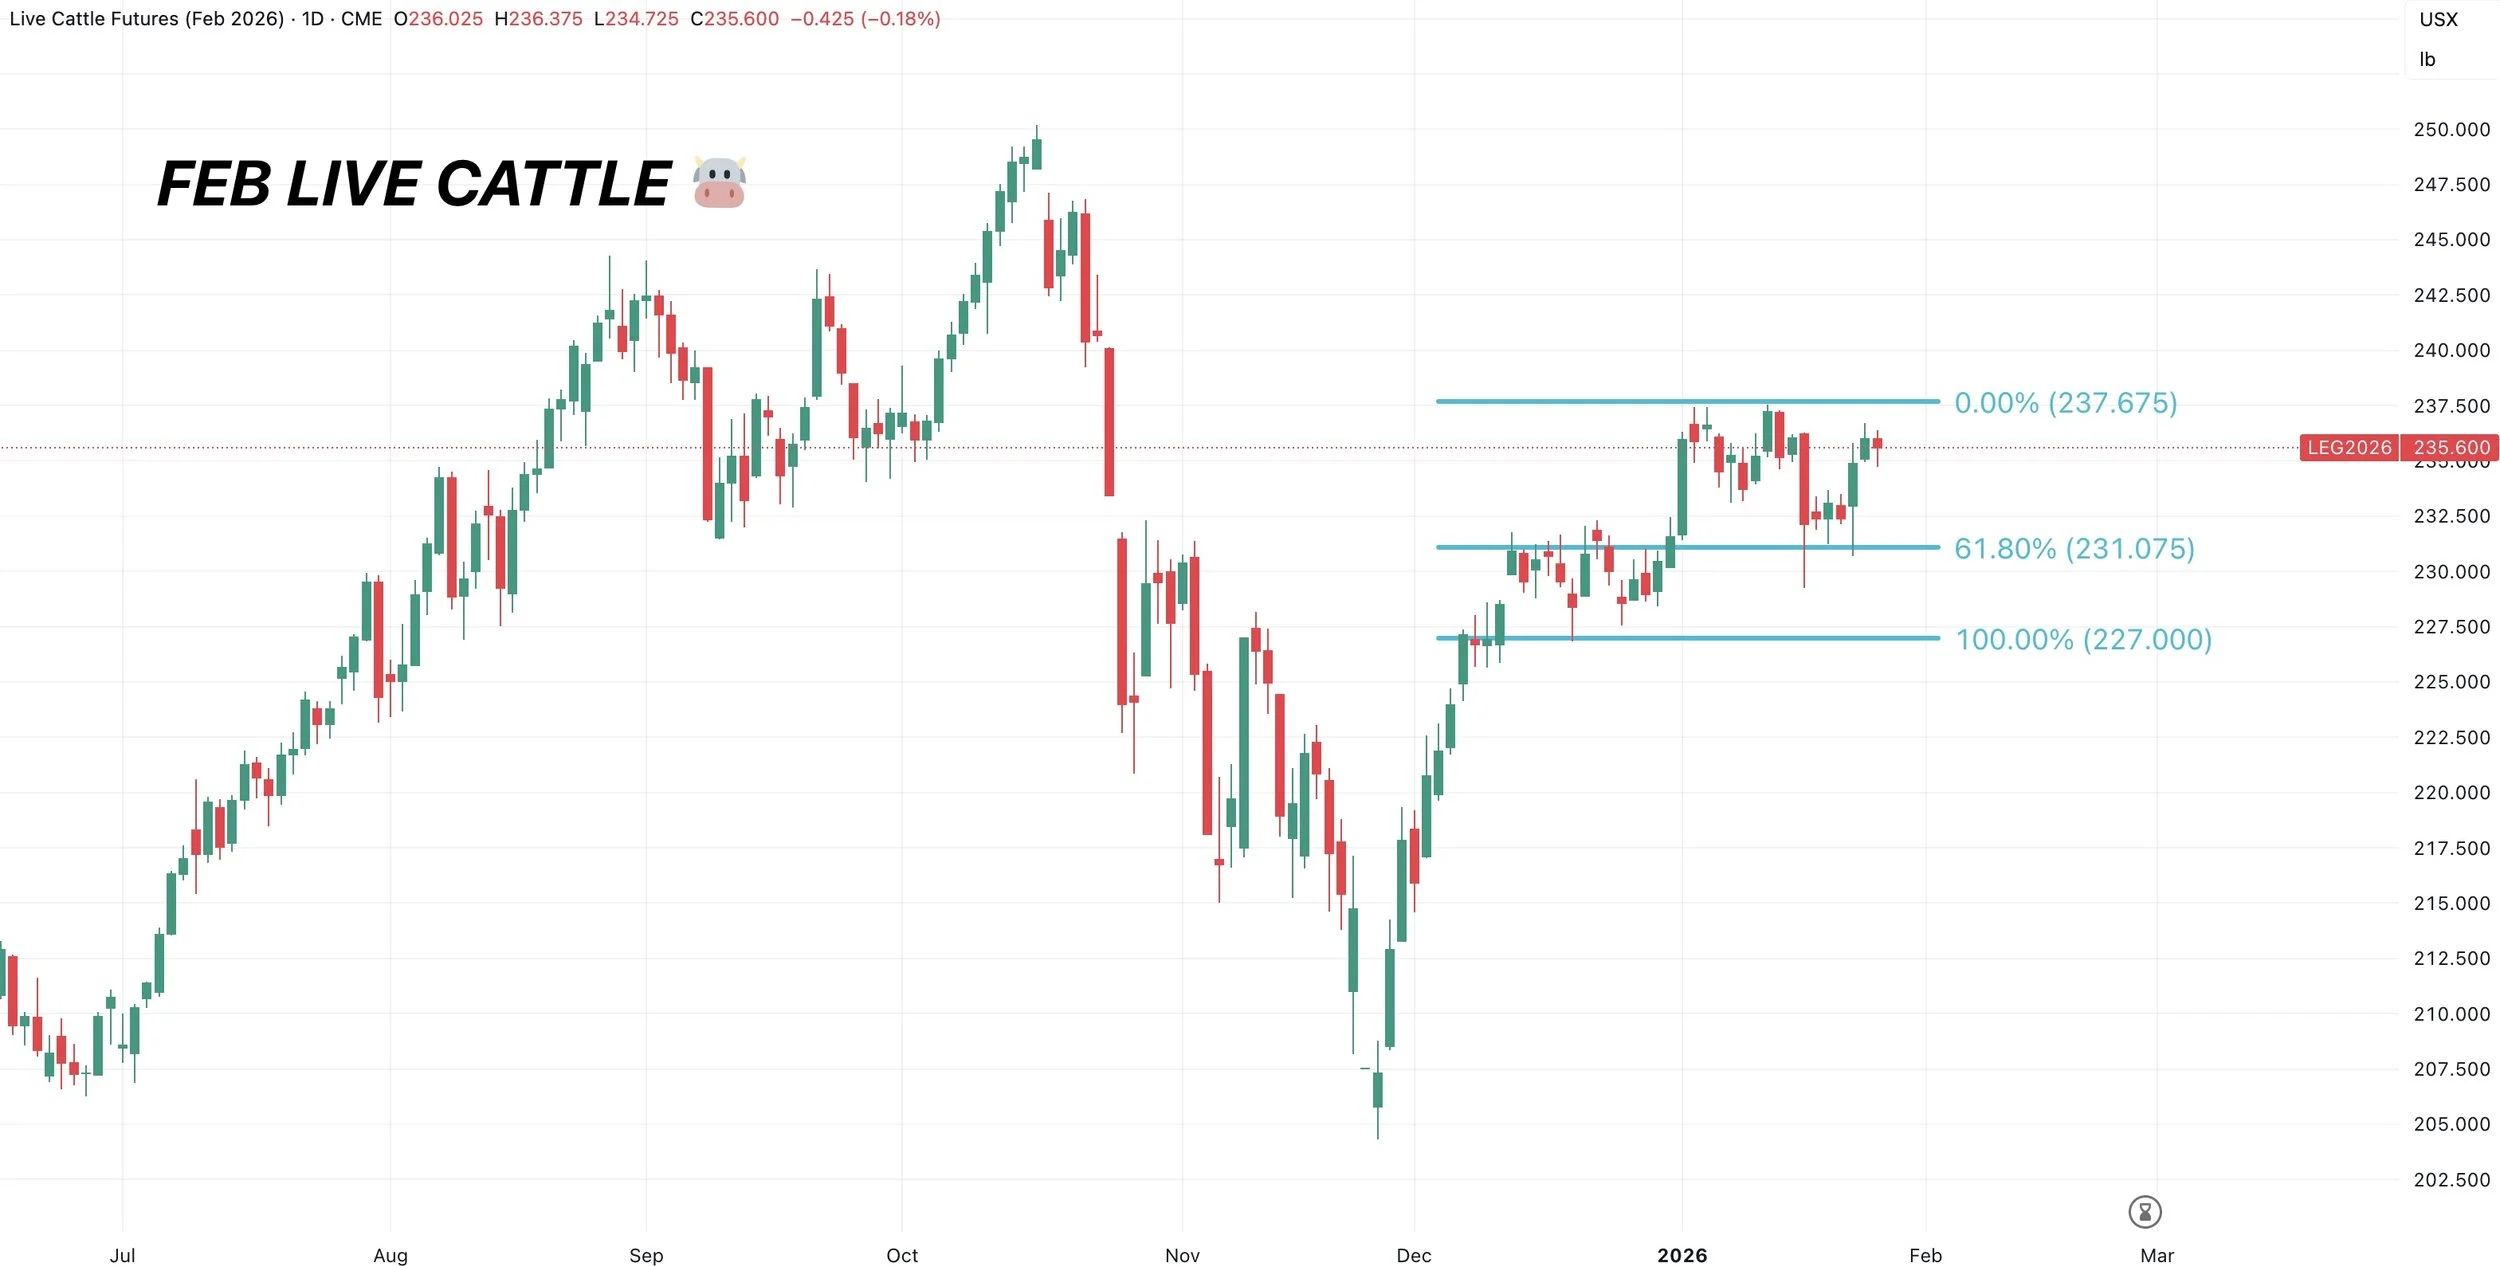
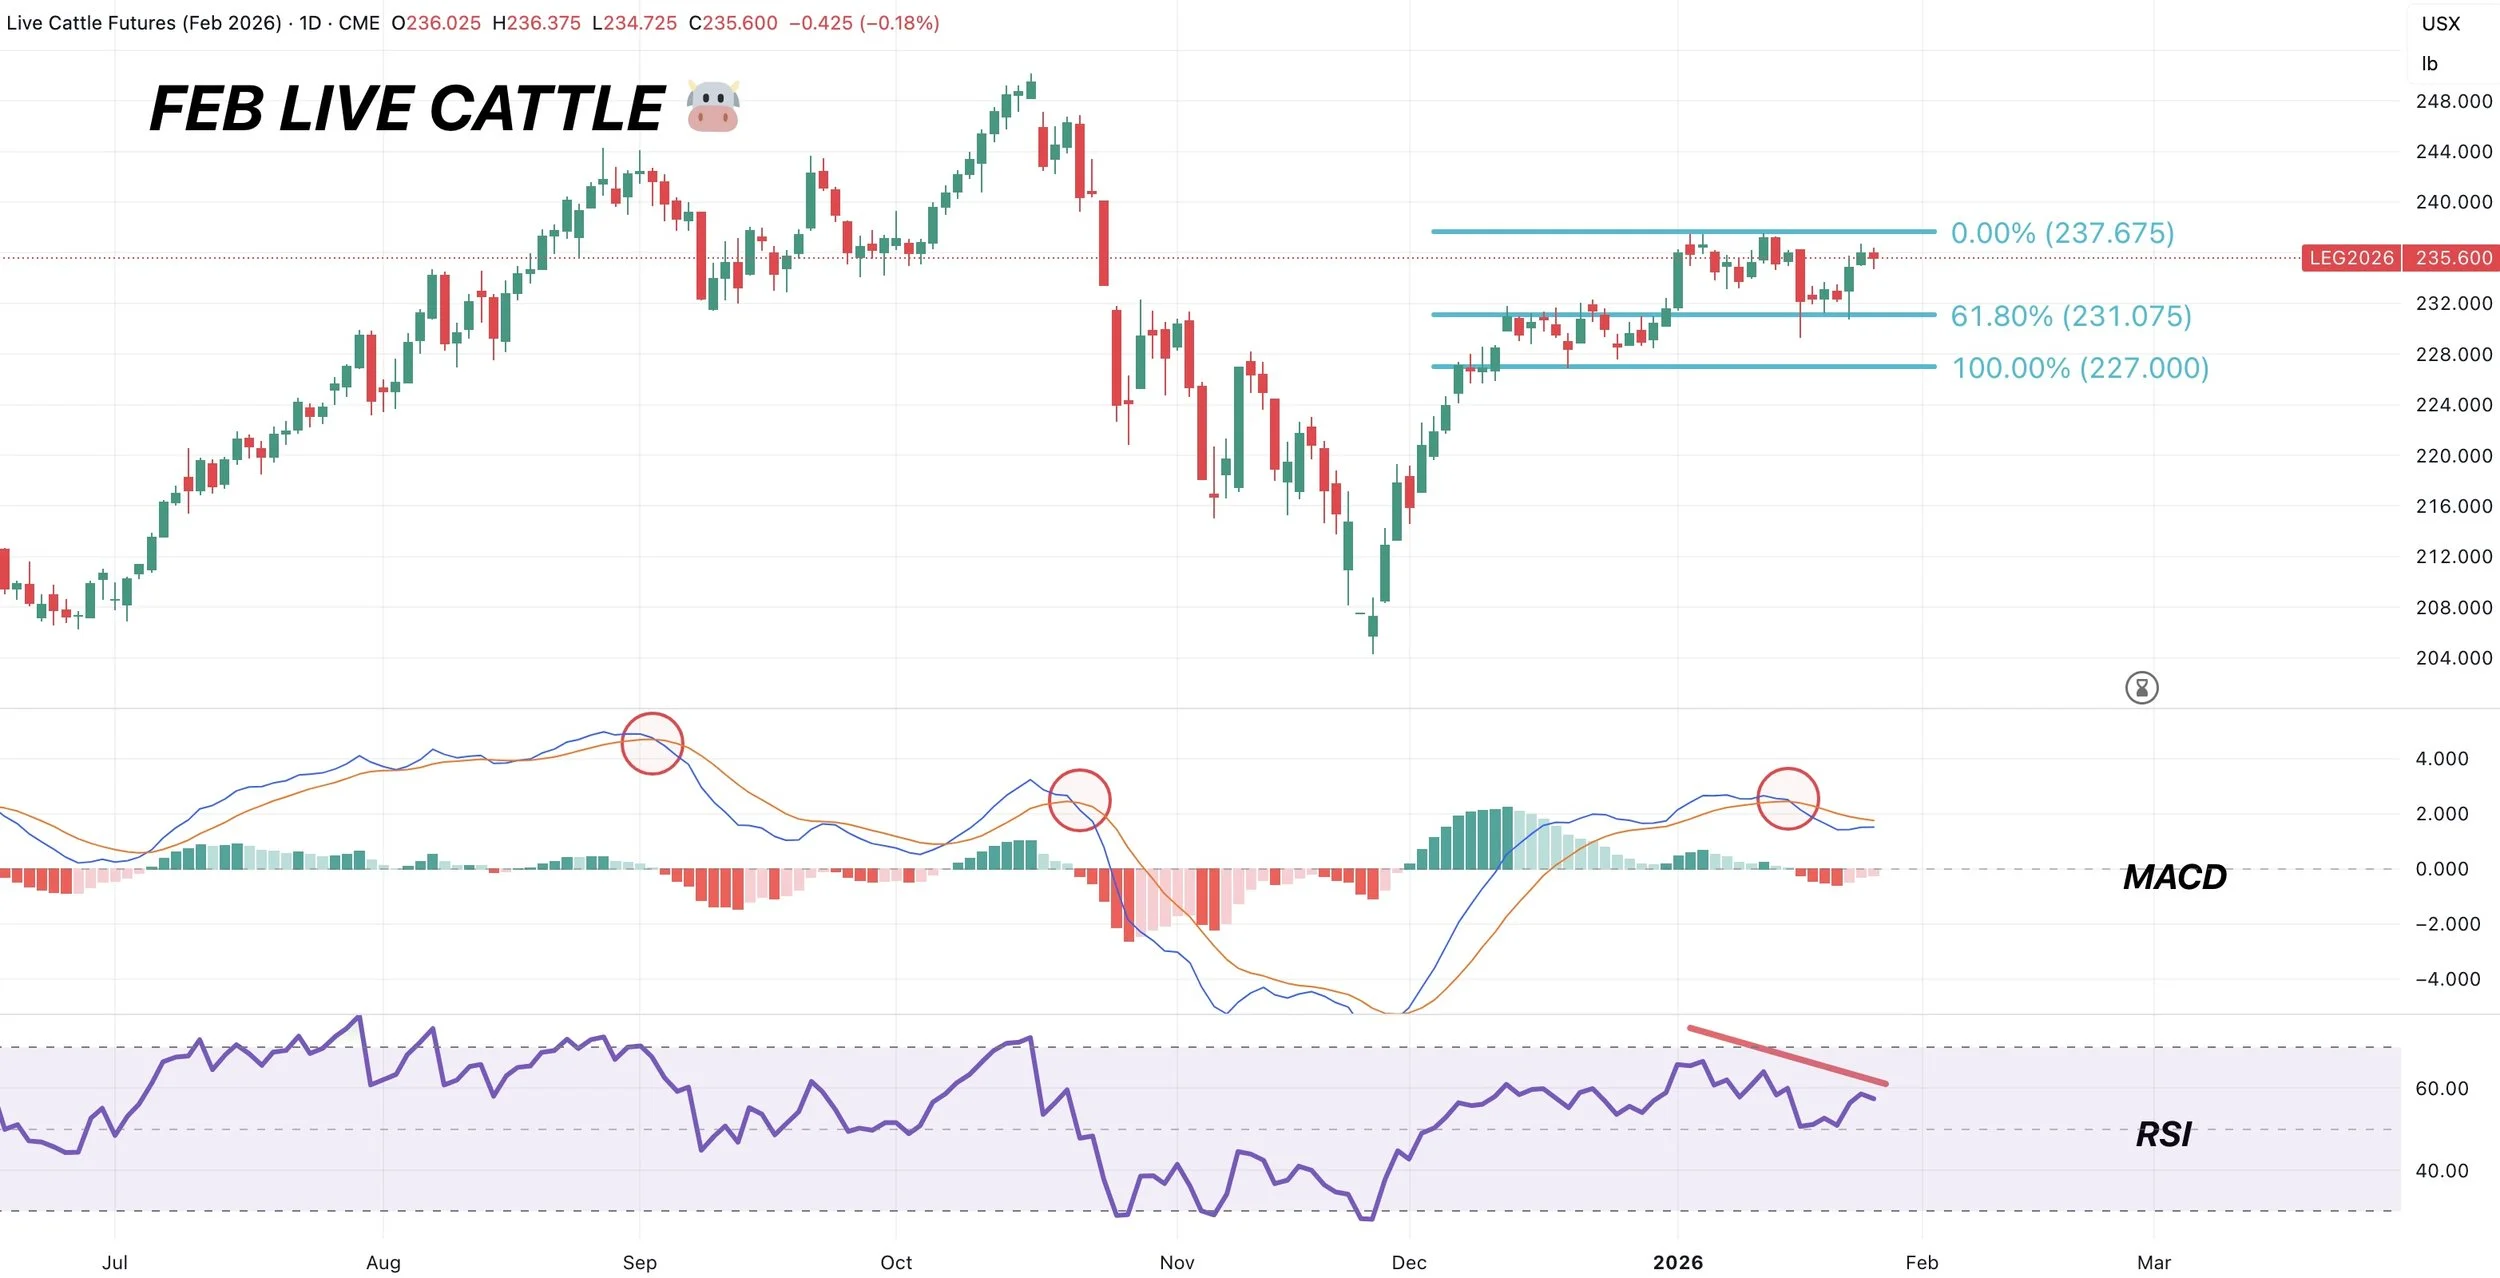
Feb Live
We held that golden fib perfectly.
Failure to hold will be our first warning sign we might be due for a deeper pullback.
Also showing bearish divergence along with a bearish cross on the MACD.
Neither of these mean we "have" to go lower.
They are both indications that upside momentum might be getting weaker here. Just a reason to be cautious.
Past Sell or Protection Signals
Dec 11th: 🐮
Cattle sell signal & hedge alert.
Dec 5th: 🐮
Cattle sell signal & hedge alert.
Nov 17th: 🌱
Soybean sell signal & hedge alert.
Nov 13th: 🌽 🌱
Managing risk in corn & beans ahead of USDA report.
Oct 28th: 🌽
Corn sell signal & hedge alert.
Oct 27th: 🌱
Soybean sell signal & hedge alert.
Oct 13th: 🐮
Cattle sell signal & hedge alert.
Aug 22nd: 🌱
Soybean sell signal & hedge alert.
July 31st: 🐮
Cattle sell signal & hedge alert.
July 10th: 🐮
Cattle sell signal & hedge alert.
CLICK HERE TO VIEW
June 5th: 🐮
Cattle sell signal & hedge alert.
June 2nd: 🌾
MPLS wheat sell signal.
April 10th: 🌽
Old crop corn sell signal.
March 19th: 🐮
Cattle hedge & sell signal.
Feb 18th: 🌽 🌾
Old crop KC wheat & old crop corn signal.
Jan 23rd: 🌽 🌱
Corn & beans old crop sell signal.
CLICK HERE TO VIEW
Jan 15th: 🌽 🌱
Corn & beans hedge alert/sell signal.
Jan 2nd: 🐮
Cattle hedge alert at new all-time highs & target.
Dec 11th: 🌽
Corn sell signal at $4.51 200-day MA
CLICK HERE TO VIEW
Oct 2nd: 🌾
Wheat sell signal at $6.12 target
Sep 30th: 🌽
Corn protection signal at $4.23-26
Sep 27th: 🌱
Soybean sell & protection signal at $10.65
Sep 13th: 🌾
Wheat sell signal at $5.98
May 22nd: 🌾
Wheat sell signal when wheat traded +$7.00
Want to Talk?
Our phones are open 24/7 for you guys if you ever need anything or want to discuss your operation.
Hedge Account
Interested in a hedge account? Use the link below to set up an account or shoot Jeremey a call at (605)295-3100.