
BULLS VS BEARS
MARKET UPDATE
You can scroll to read the usual update as well. As the written version is the exact same as the video.
Timestamps for video:
Overview: 0:00min
Corn: 2:00min
Beans: 6:25min
Wheat: 11:30min
Cattle: 12:20min
Want to talk about your situation?
(605)250-3863
Black Friday Sale
Enjoying your free trial?
Take advantage of our Black Friday sale before it ends so you don’t miss out on future updates or signals
Futures Prices Close
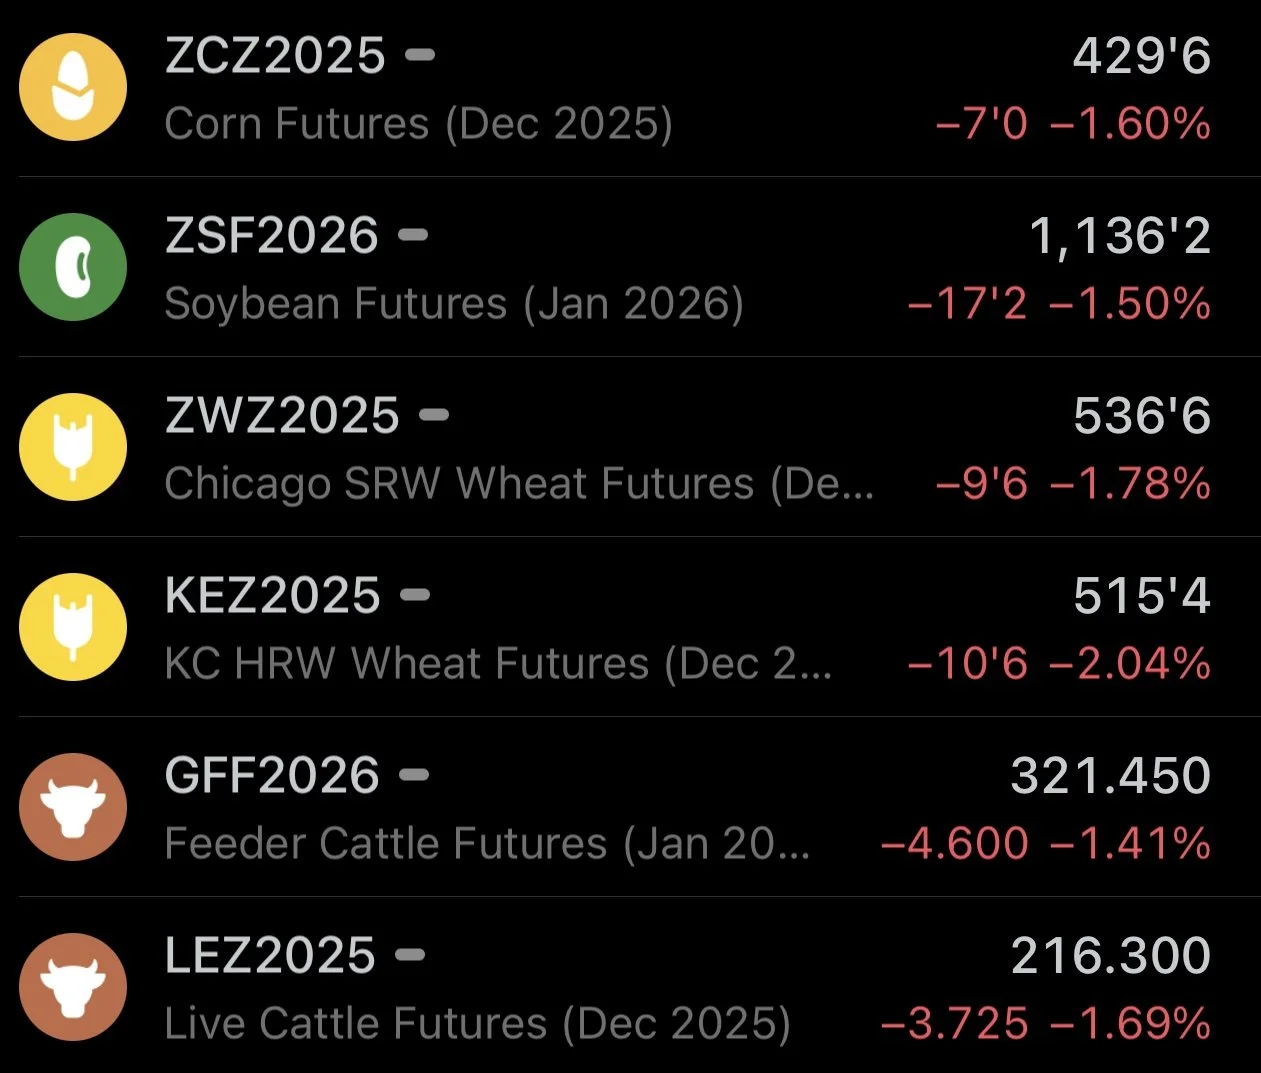
Overview
Grains and cattle all lower today.
It was announced that the CTFC funds position data will resume today.
However.. it was reported that they will not be totally caught up until the end of January. So the data is kind of pointless.
For example here is what we received today.
This is their positions from the end of September.
When the funds were short almost -40k contracts of beans.
Chart from GrainStats
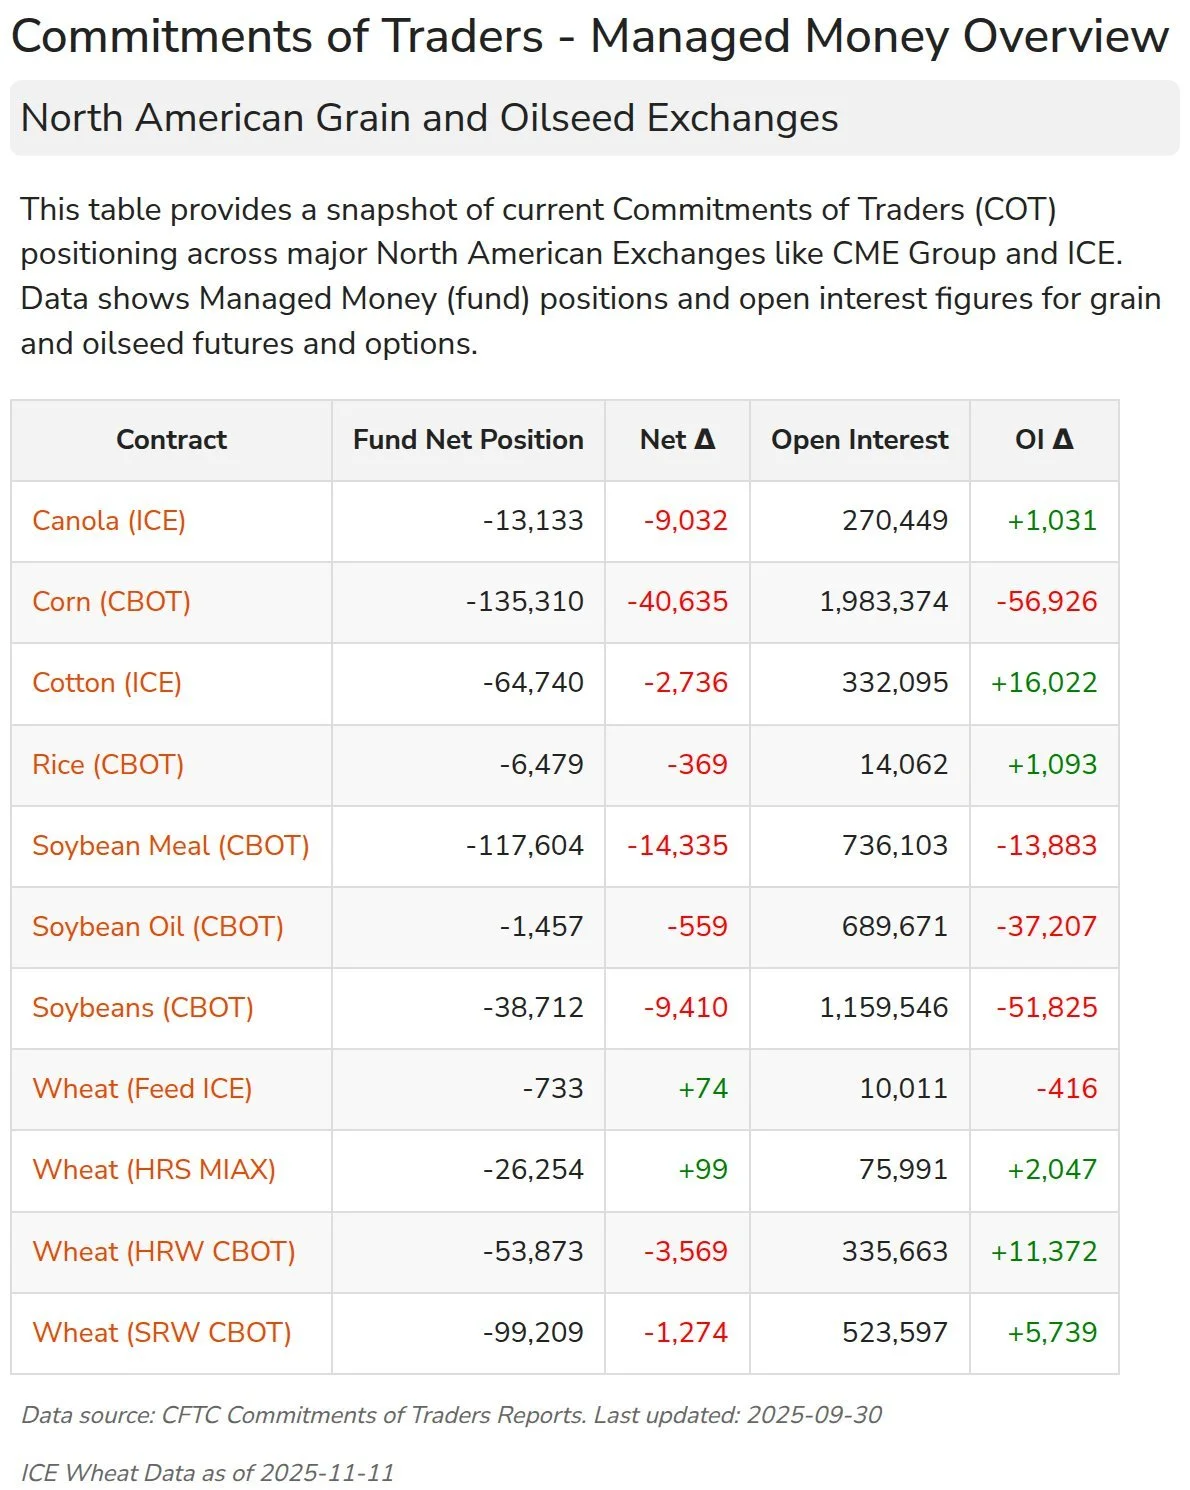
It doesn’t make any sense at all really. The big players know what the data actually says, but they are going to release the data slowly over the next few months. By the time they are caught up, the data will no longer be relevant. So that was disappointing to hear.
As it would be great to see what the funds have been up during the entire government shut down.
Because we saw massive moves since the last time we had the updated funds positioning.
We saw soybeans rally over +$1.50 since the shutdown.

We saw the cattle market drop nearly -20% from it's highs.

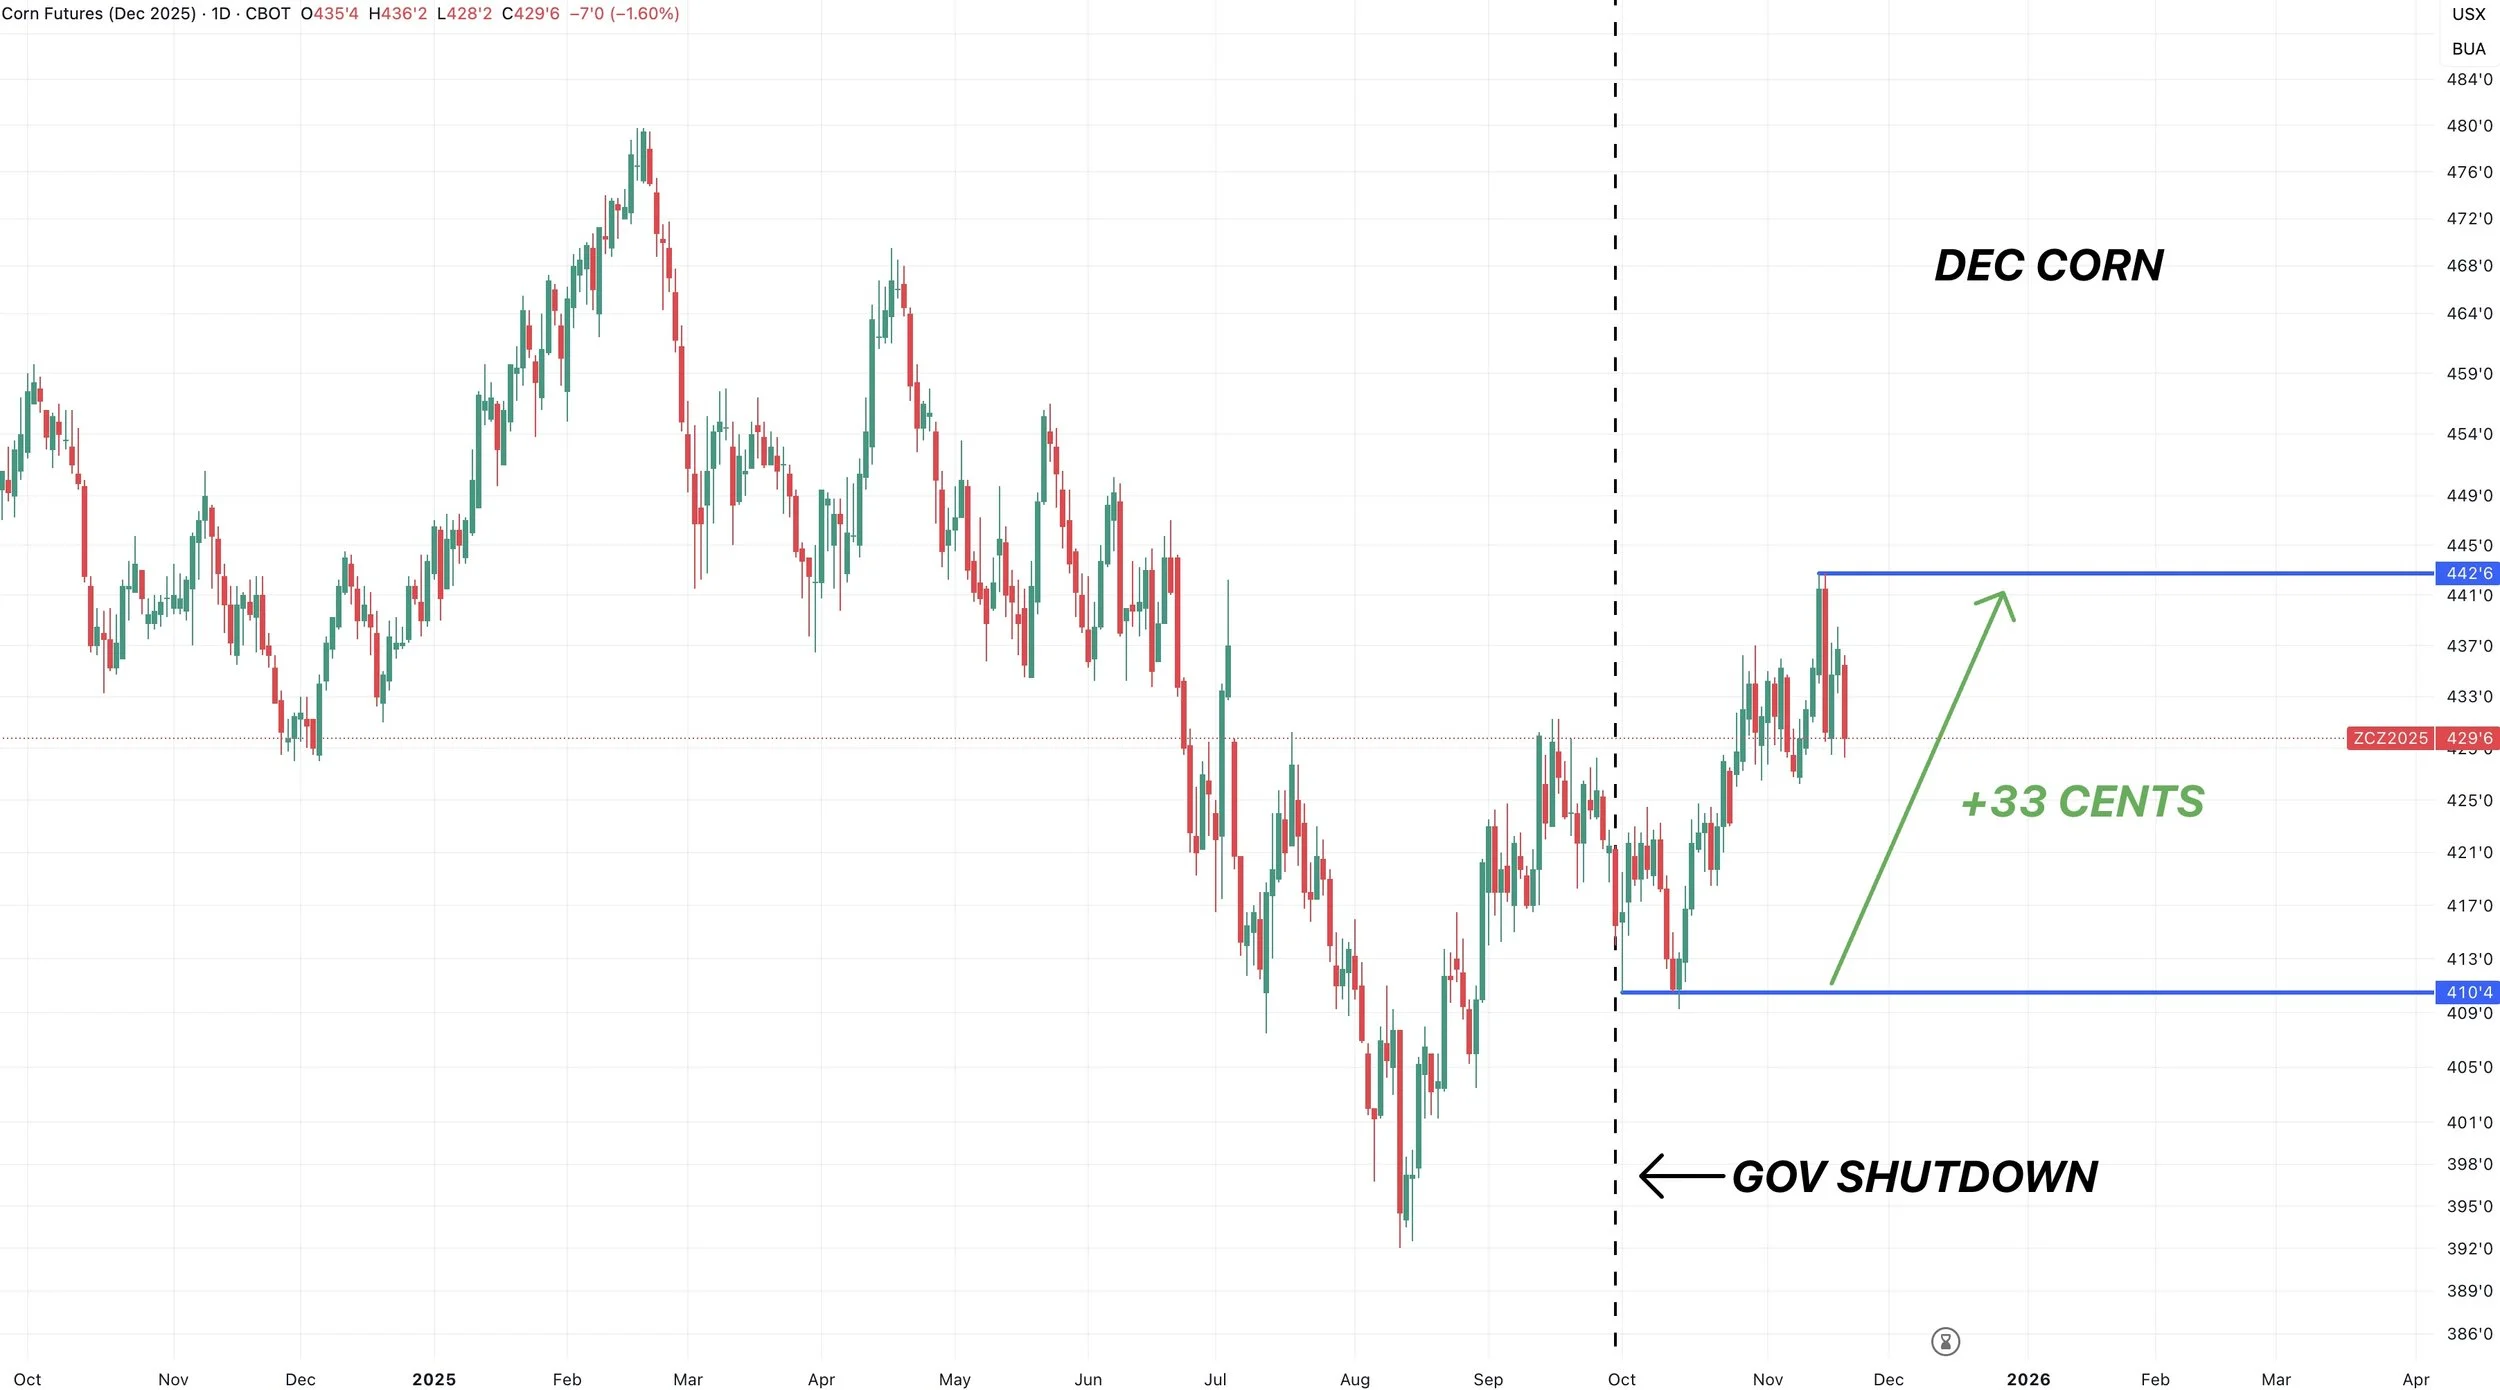
Even the corn market ran +30 cents during the shutdown.
They know what the positions are, but won’t be caught up with them until the data doesn’t really matter anymore.
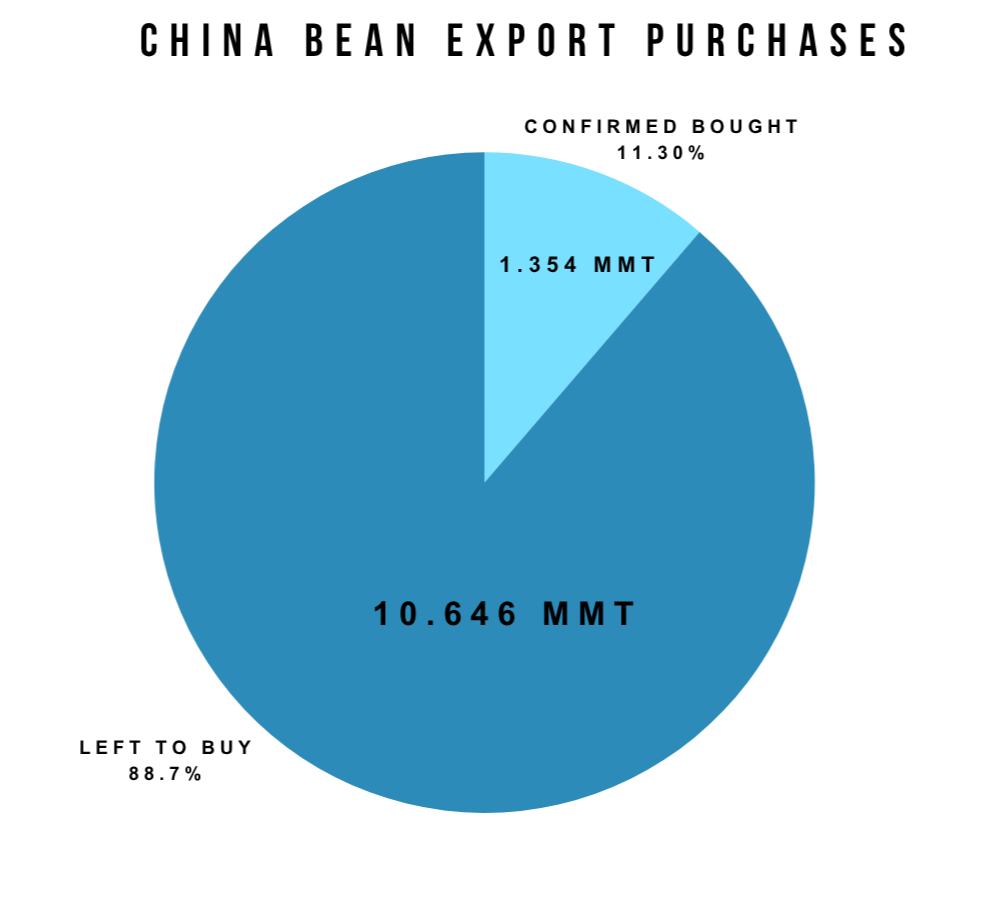
The other big news was we saw another flash sale of soybeans to China this morning.
This time we saw 330k MT. Yesterday we saw a flash sale of 792k MT.
They have now bought a confirmed 1.354 million MT of soybeans.
This equals 11.30% of the total 12 million MT they agreed to buy.
We still cleary have a long ways to go. But it's nice to see they are buying.
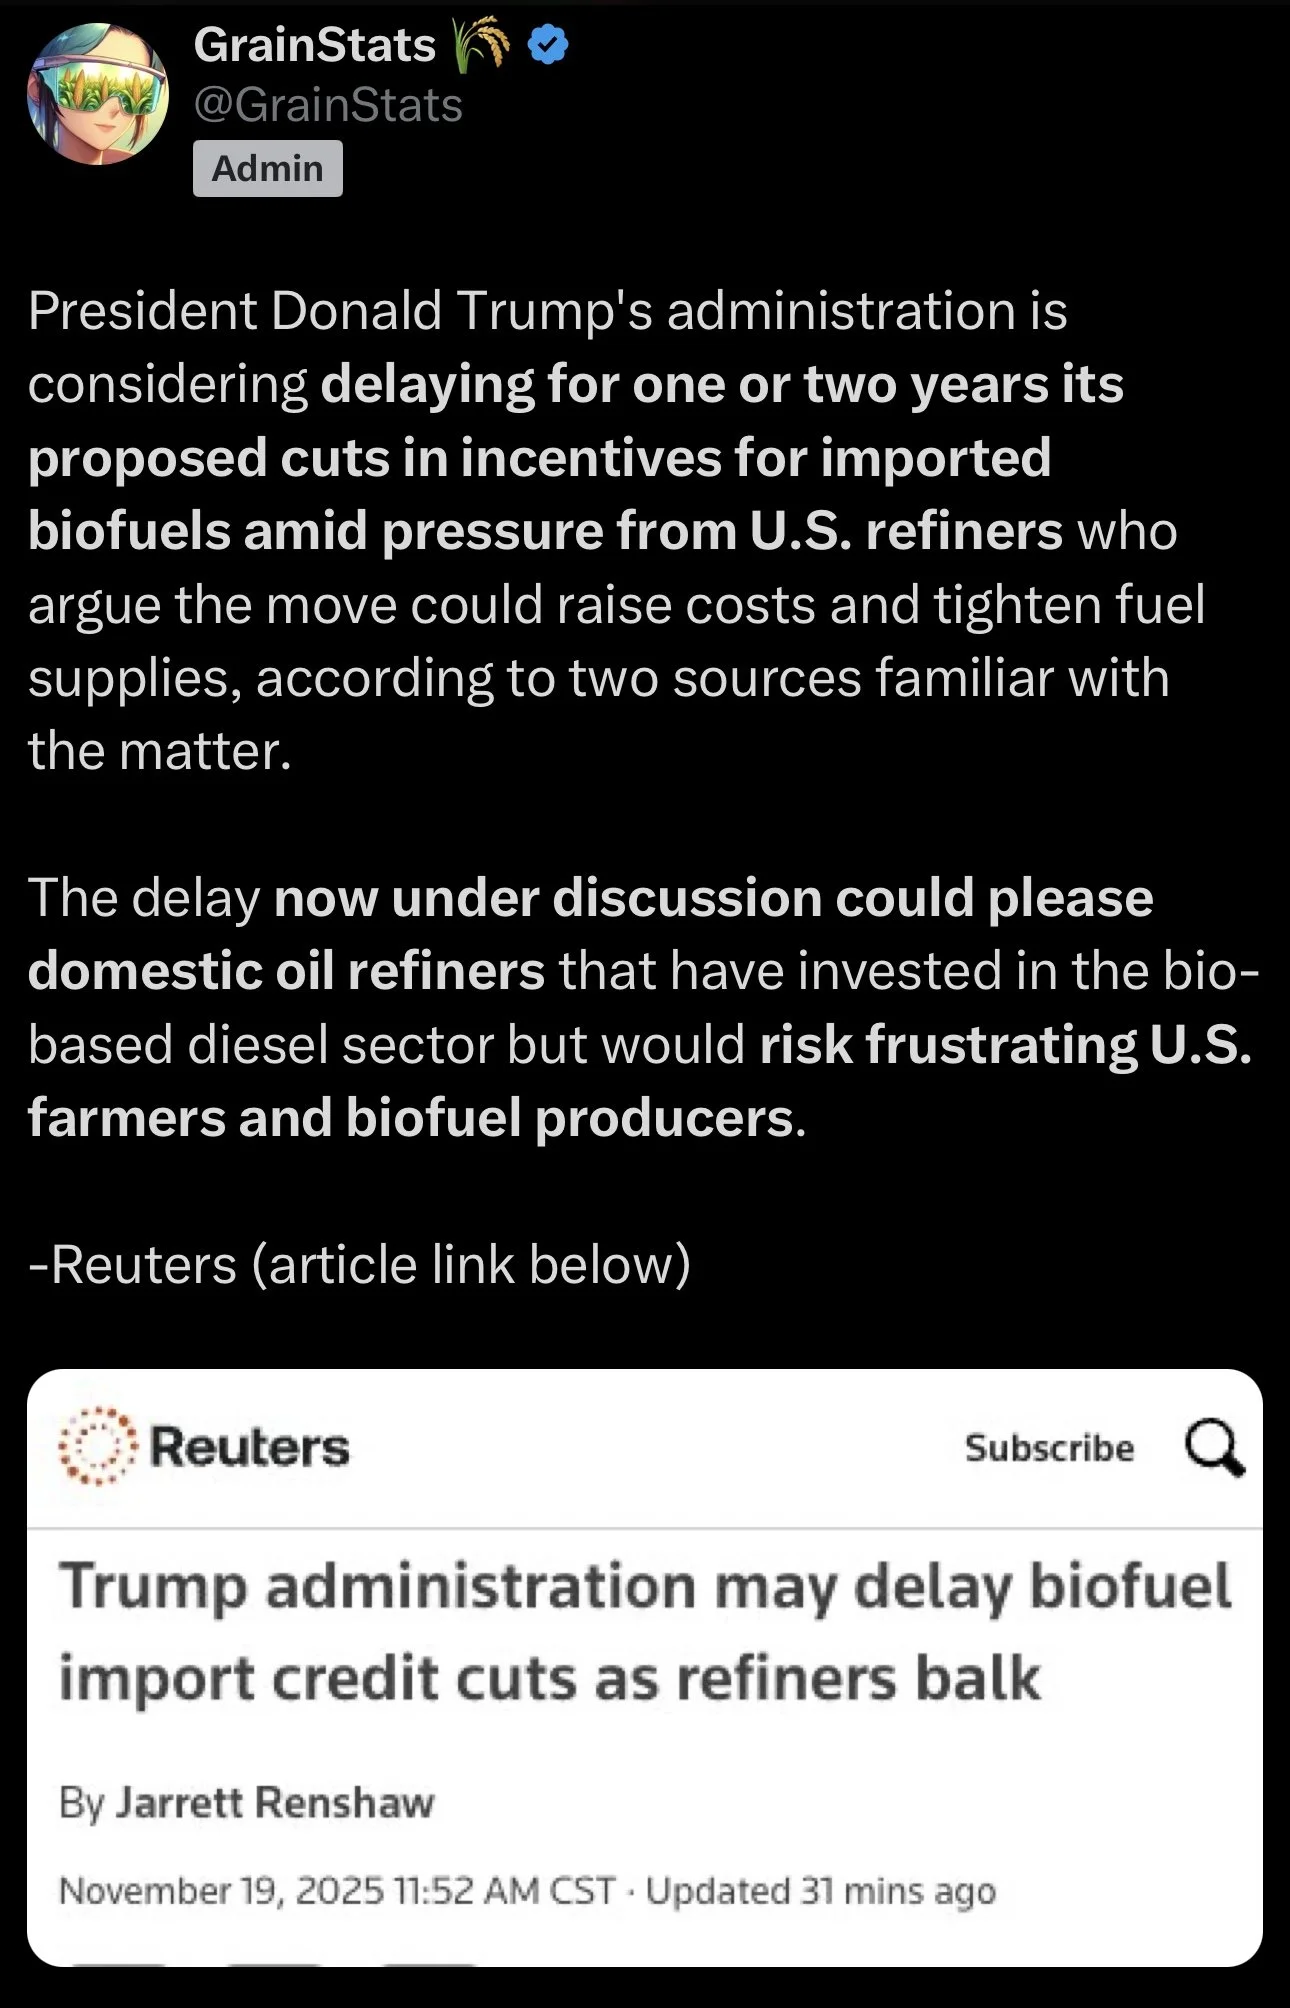
The last headline we saw today was a biofuel one.
It was reported that Trump is considering delaying the biofuel credit cuts by 1-2 years amid pressure from US refiners who argue the move could raise costs and tighten fuel supplies.
The soybean oil market didn’t like this and dropped over -1% right after the news.
Today's Main Takeaways
Corn
Fundamentals:
Nothing has changed from my update on Monday.
We have too much supply to get super bullish.
We have too great of demand to get bearish.
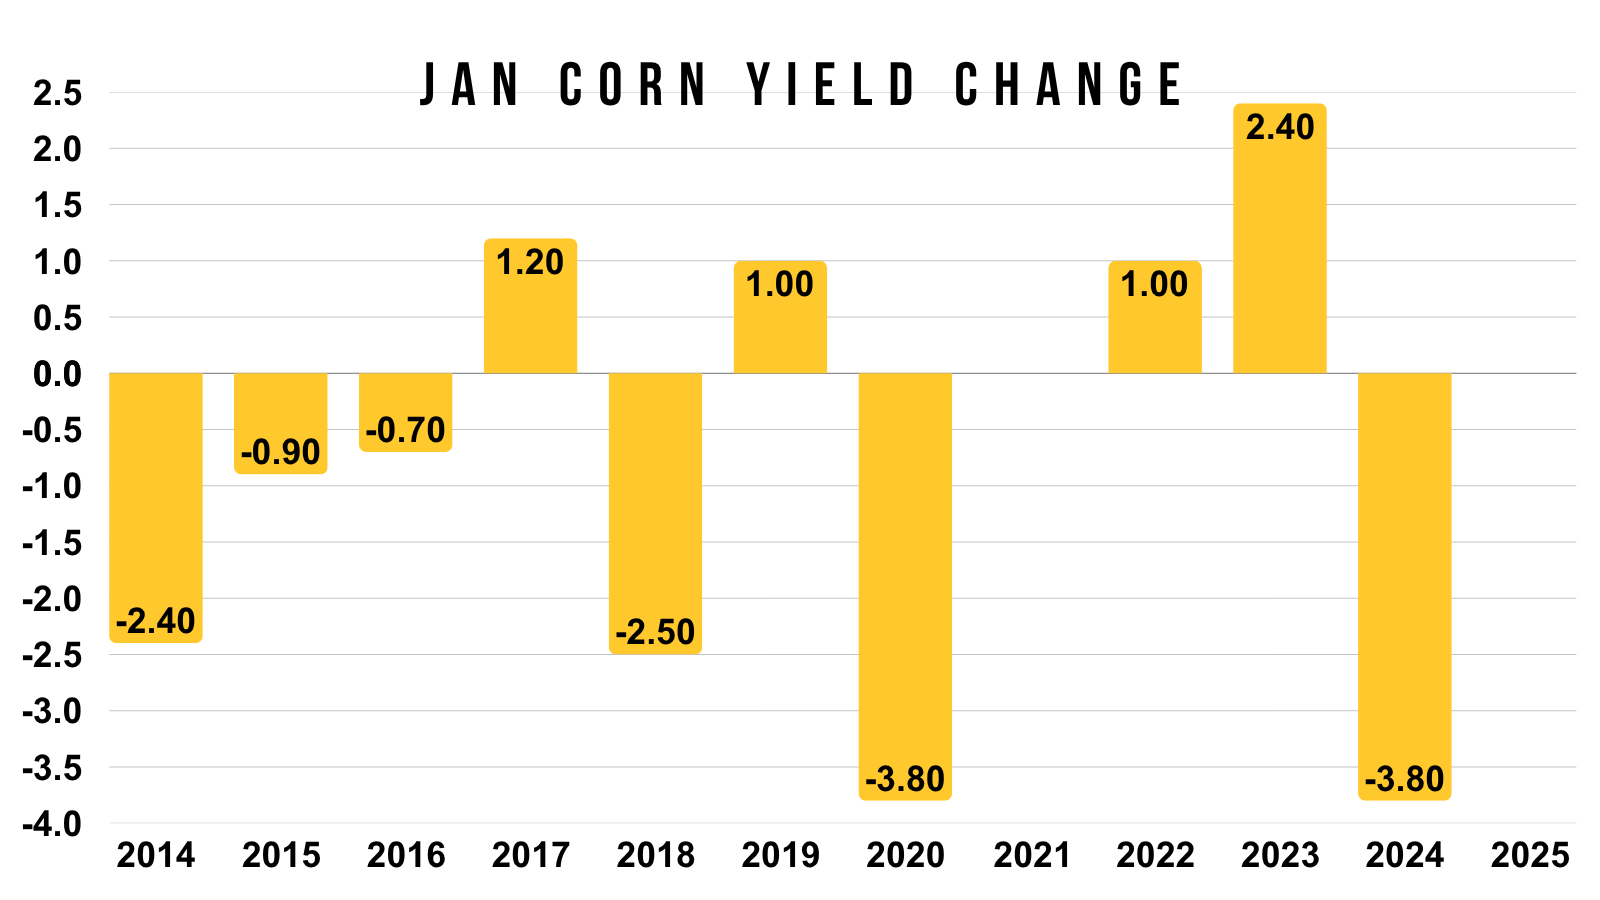
I want to believe yield is in the 180 range.
However.. the biggest cut we've seen in the Jan report the last decade was -3.80.
Which would put our yield at 182.. not 180 or lower.
So it would be reasable to expect the USDA to drop yield down to the 182-183 range.
Could it come down to 180 or lower? Sure it is possible. But historically we don’t see that large of cuts.
Here is their past Jan cuts.
Here was the cliffnote included in the USDA report.
They basically said that they did not have all the available info they usually have.
So there is always the chance we get a bigger change than normal in Jan report due to them not having all of the data for the Nov report.
But who knows. Really impossible to say.
Let's say yield came in at 182, and the USDA did not touch demand at all.
It would spit out a 1.80 billion bushel carryout and an 11.10% stocks to use ratio.
Neither of those numbers are wildly bullish.
This is without lowering the feed and demand numbers, which most argue are going to have to come down.
Which is why it's hard to paint a "mega" bullish corn situation.

Here is the current balance sheet for reference.
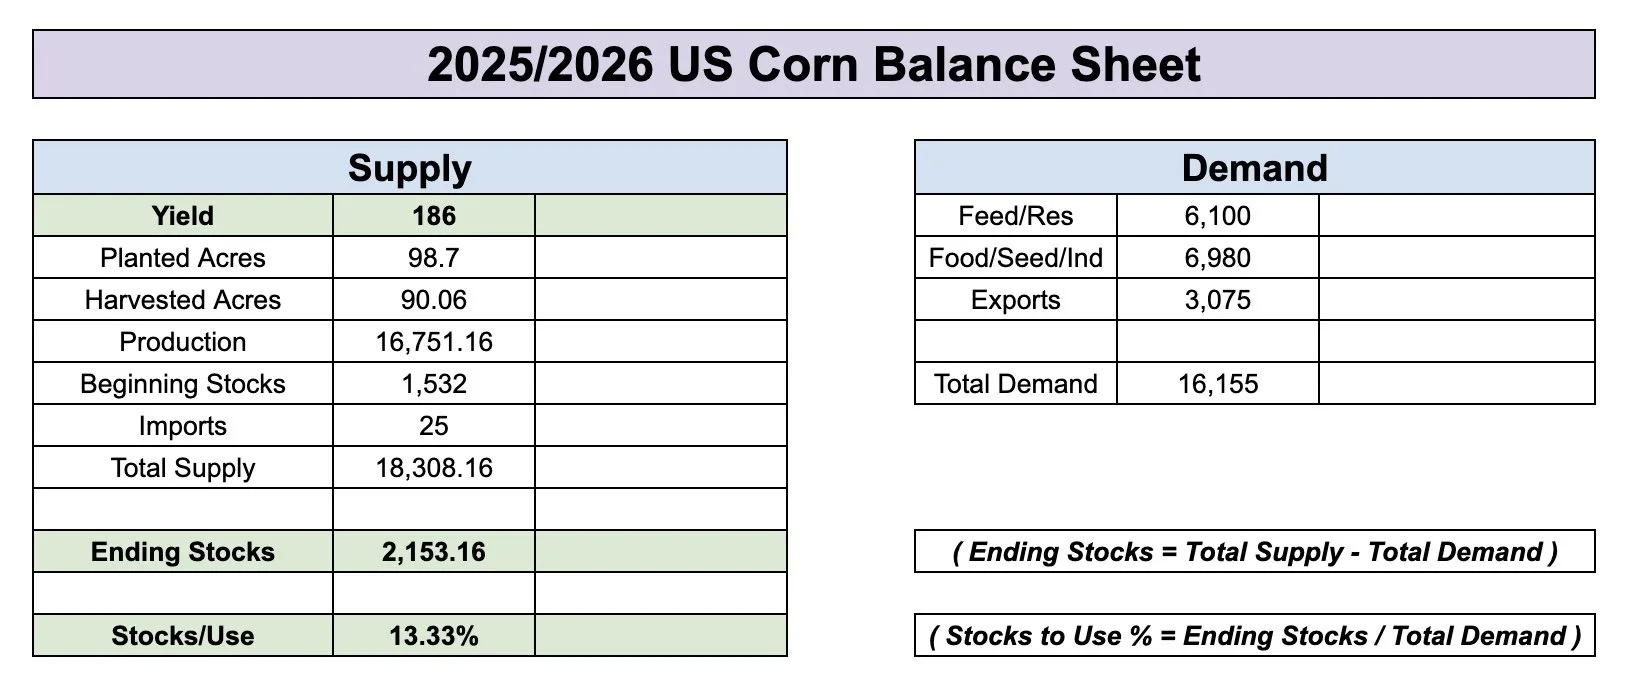
Currently, the USDA is projecting a pretty massive carryout.
Even if we dropped to that 1.80 billion in the example, it would still be about on par with the 23/24 marketing year.
However, the market cleary doesn’t believe we are actually at the carryout or yield the USDA is projecting as of today.
(Purple dot = 1.80 billion)

That doesn’t mean I'm bearish at all.
I just think our utterly large supply could put somewhat of a lid on our upside here.
At the same time, I think the downside in corn is limited. Especially compared to a market like soybeans that have ran five times harder.
Record demand should continue to help keep a floor under this market.
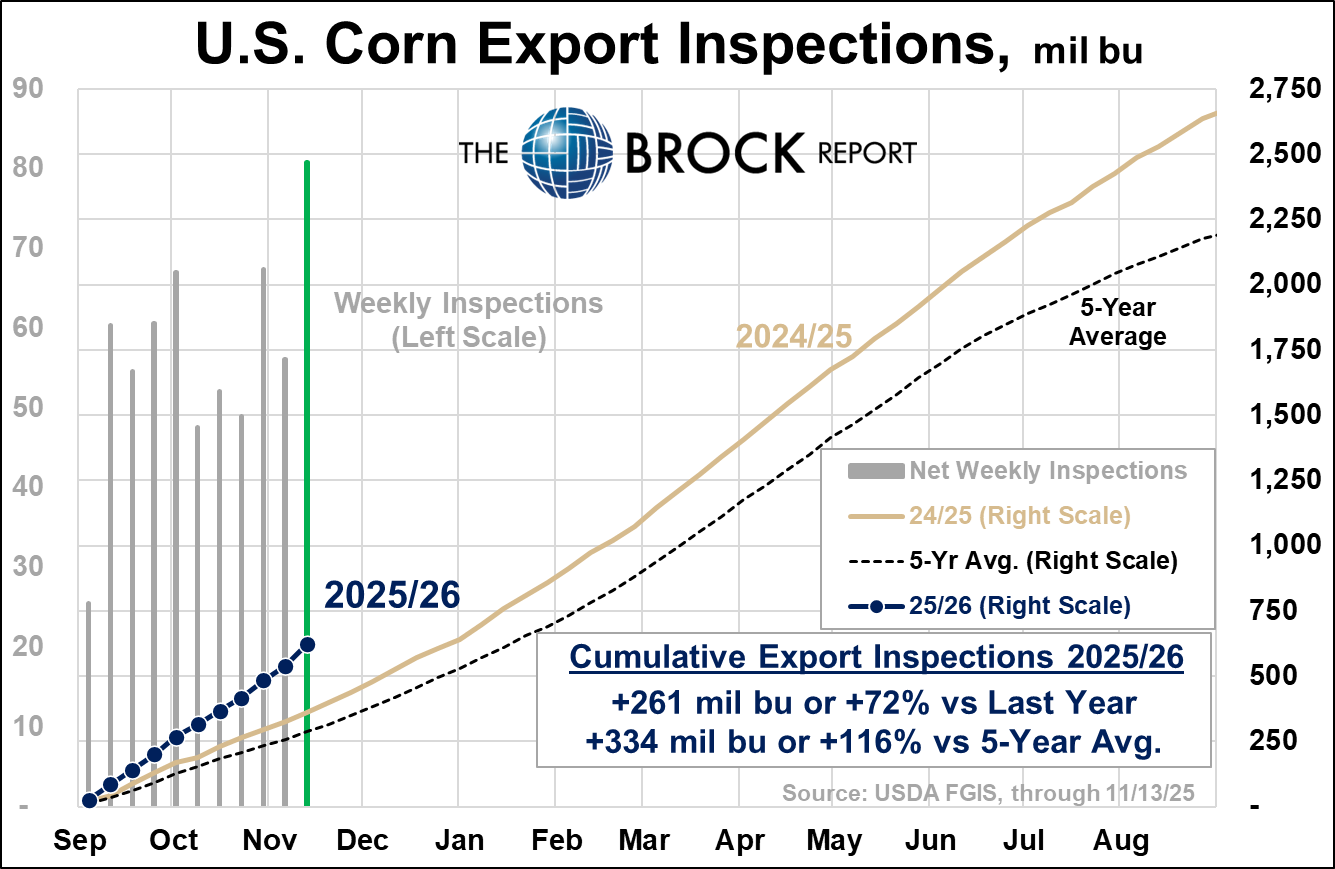
Like we talked about on Monday, export inspections are up +72% vs last year.
Here is a chart from the Brock Report showcasing that.
If we look towards next year, given the run soybeans have had. That soybean to corn ratio has rallied.
So we could naturally we looking at less corn acres and more bean acres next year.
Which could be a story for next year given we just saw record corn acres this year.

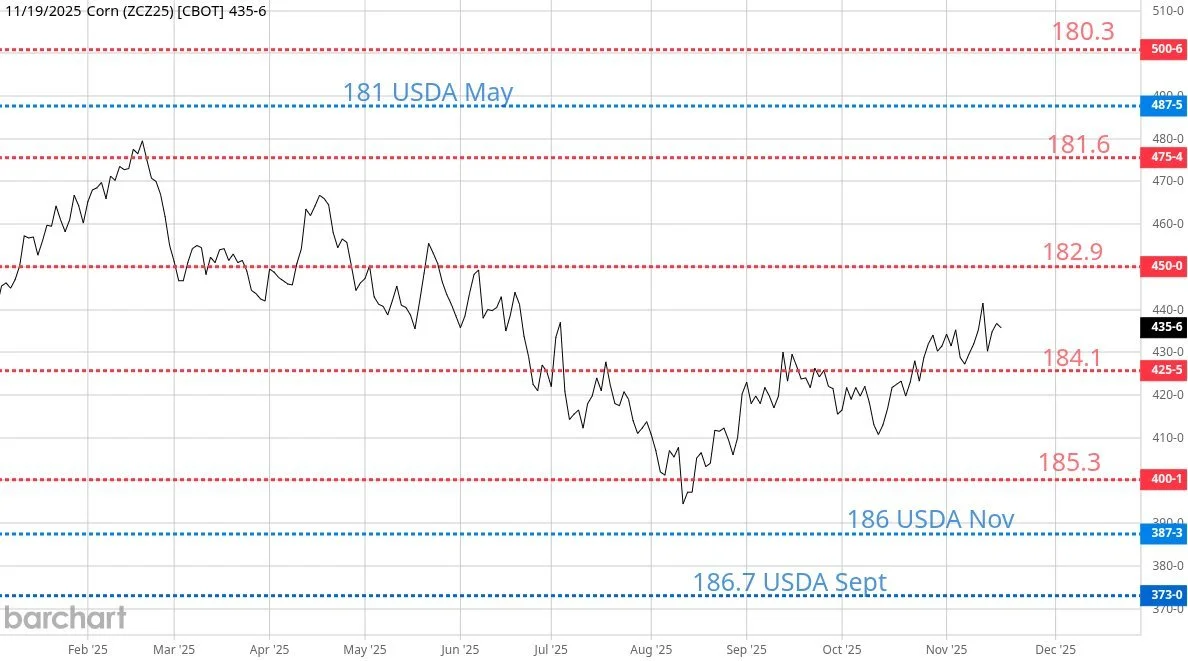
Lastly I wanted to show this nice chart from @BradyD78 on Twitter.
So shout out to Brady.
On this chart he made, it represents approximately where the market had traded based on where expected yield was.
So near those contracts, we were pricing in a 186 yield.
Currently, based on his chart, he believes we are priced between a 183-184 yield.
A yield of 181.5 being priced in, would result in a futures price of roughly $4.75 based on his analysis.
Technicals:
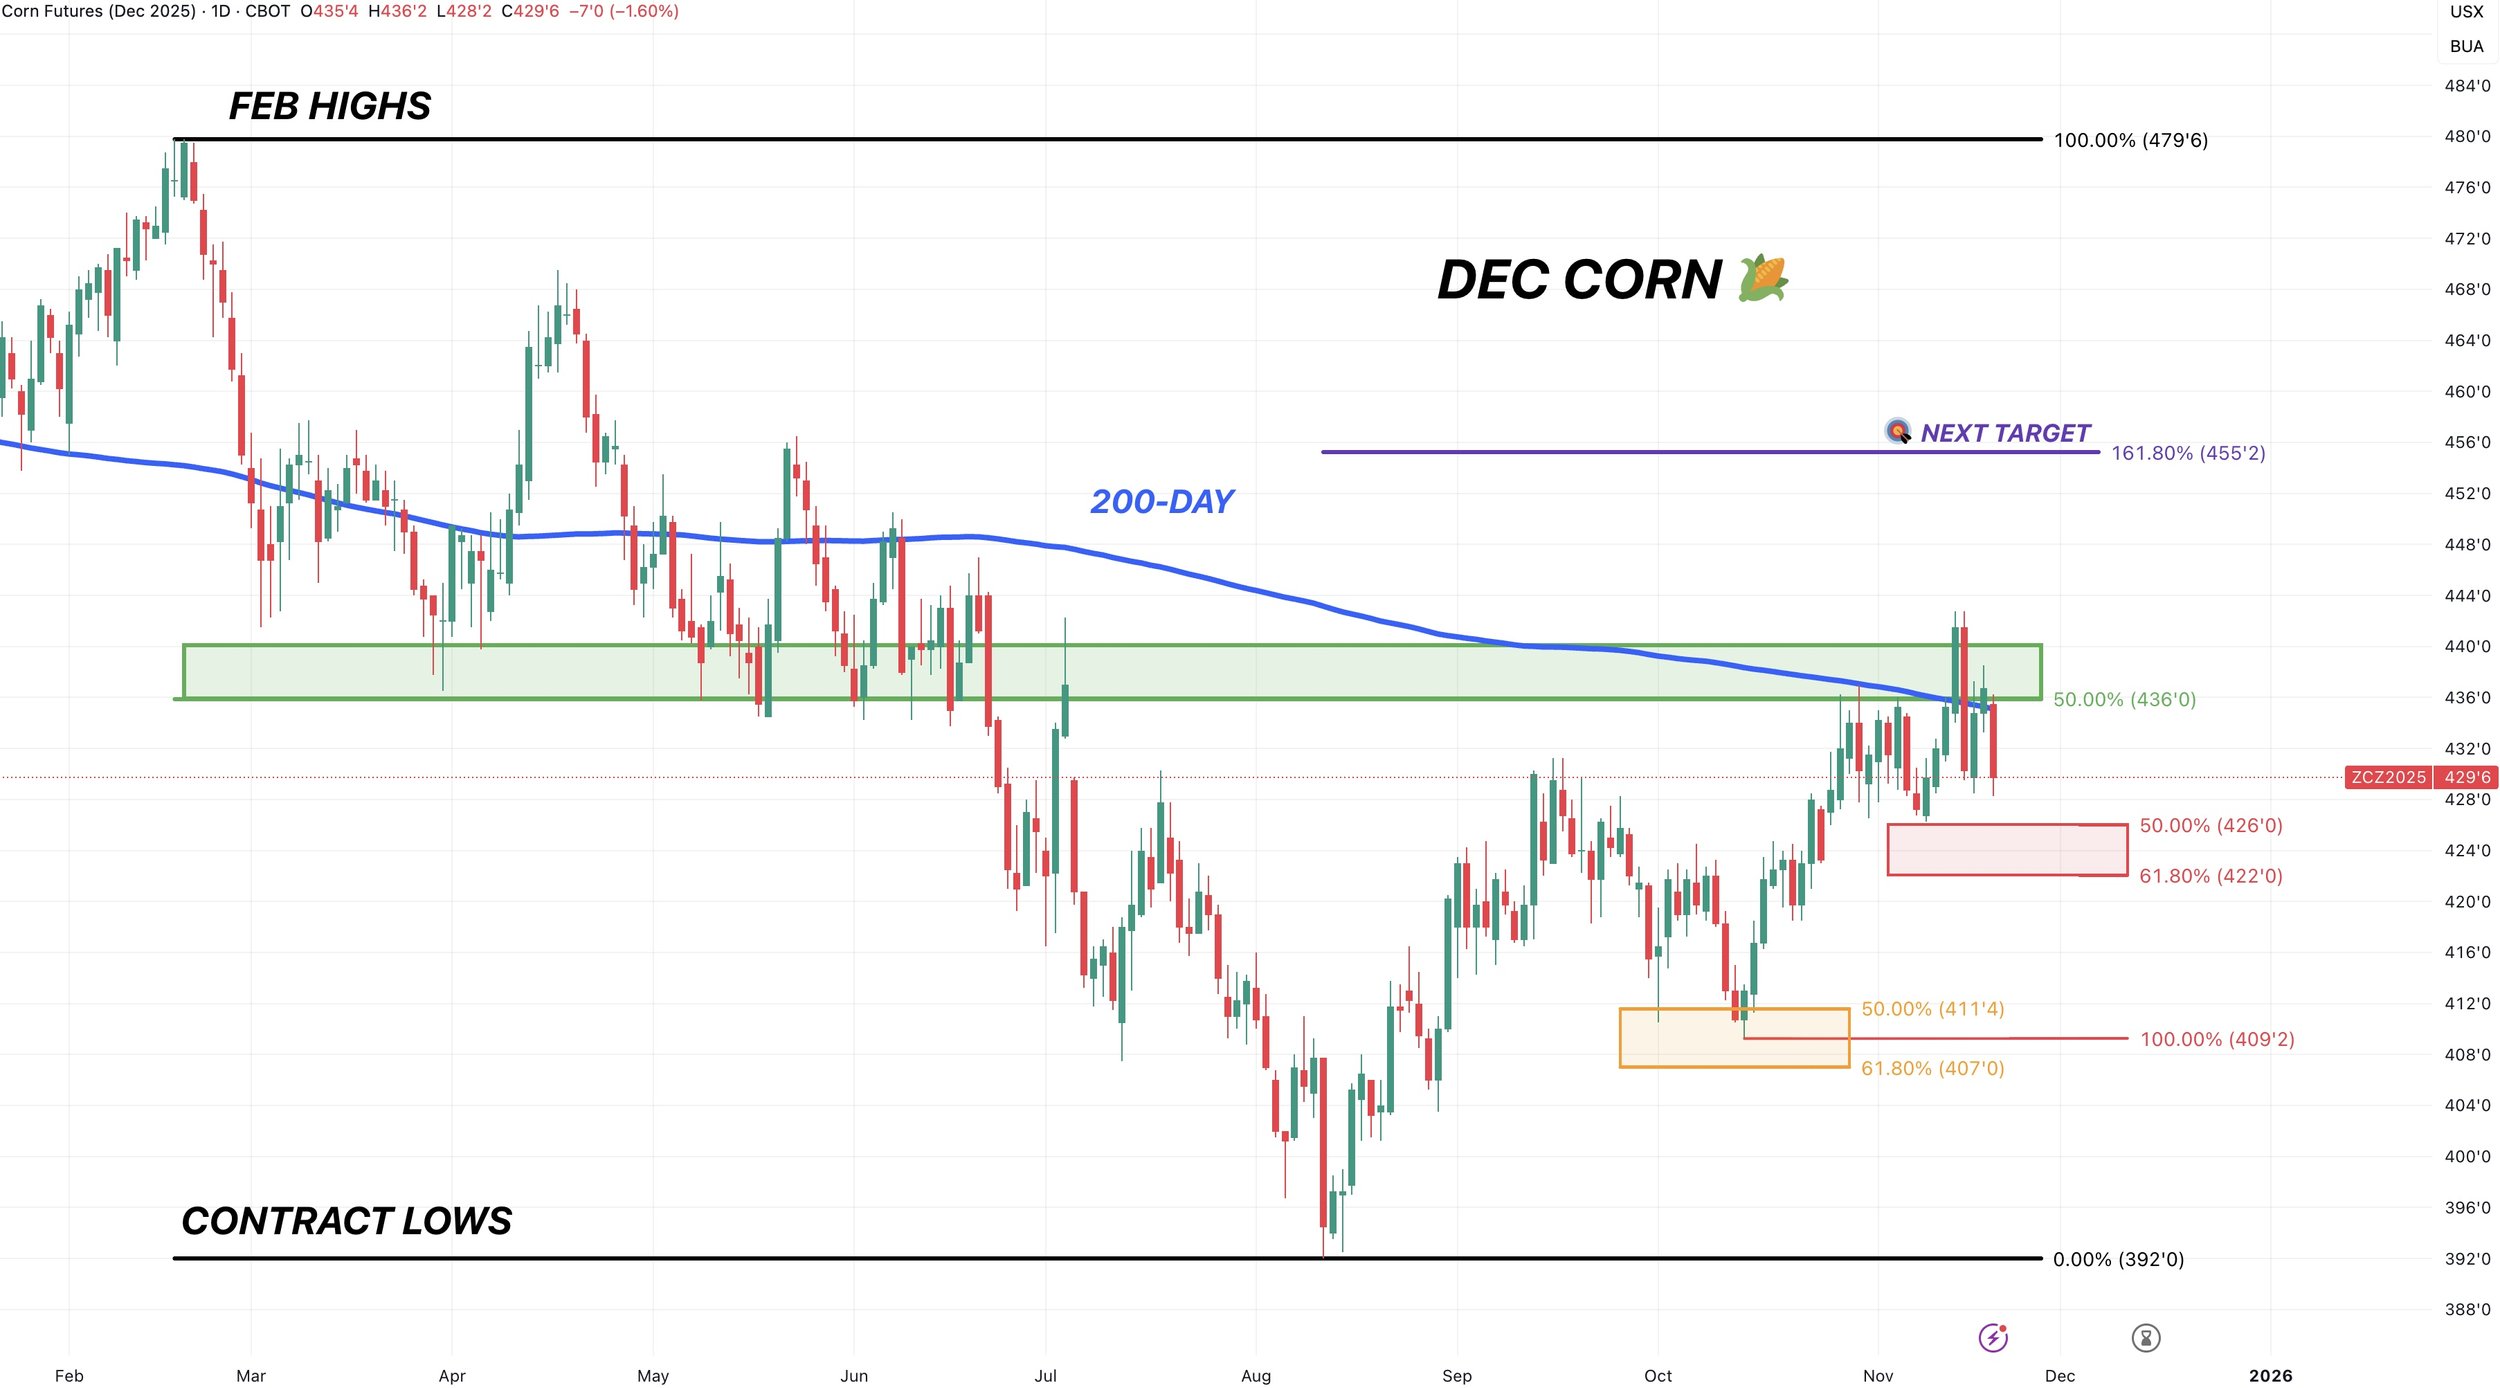
Dec Corn
Not much to update on the corn chart.
We are really watching two things here.
If we can break above the 200-day MA for consecutive days, it could be a sign we are ready for the next leg higher.
In the meantime, we want to hold the red box. That is where I am looking for a bounce if we fall there.
As that gives back 50-61.8% of the rally from October.
The September sell off also gave back 50-61.8% of the rally off contract lows before finding a bottom.
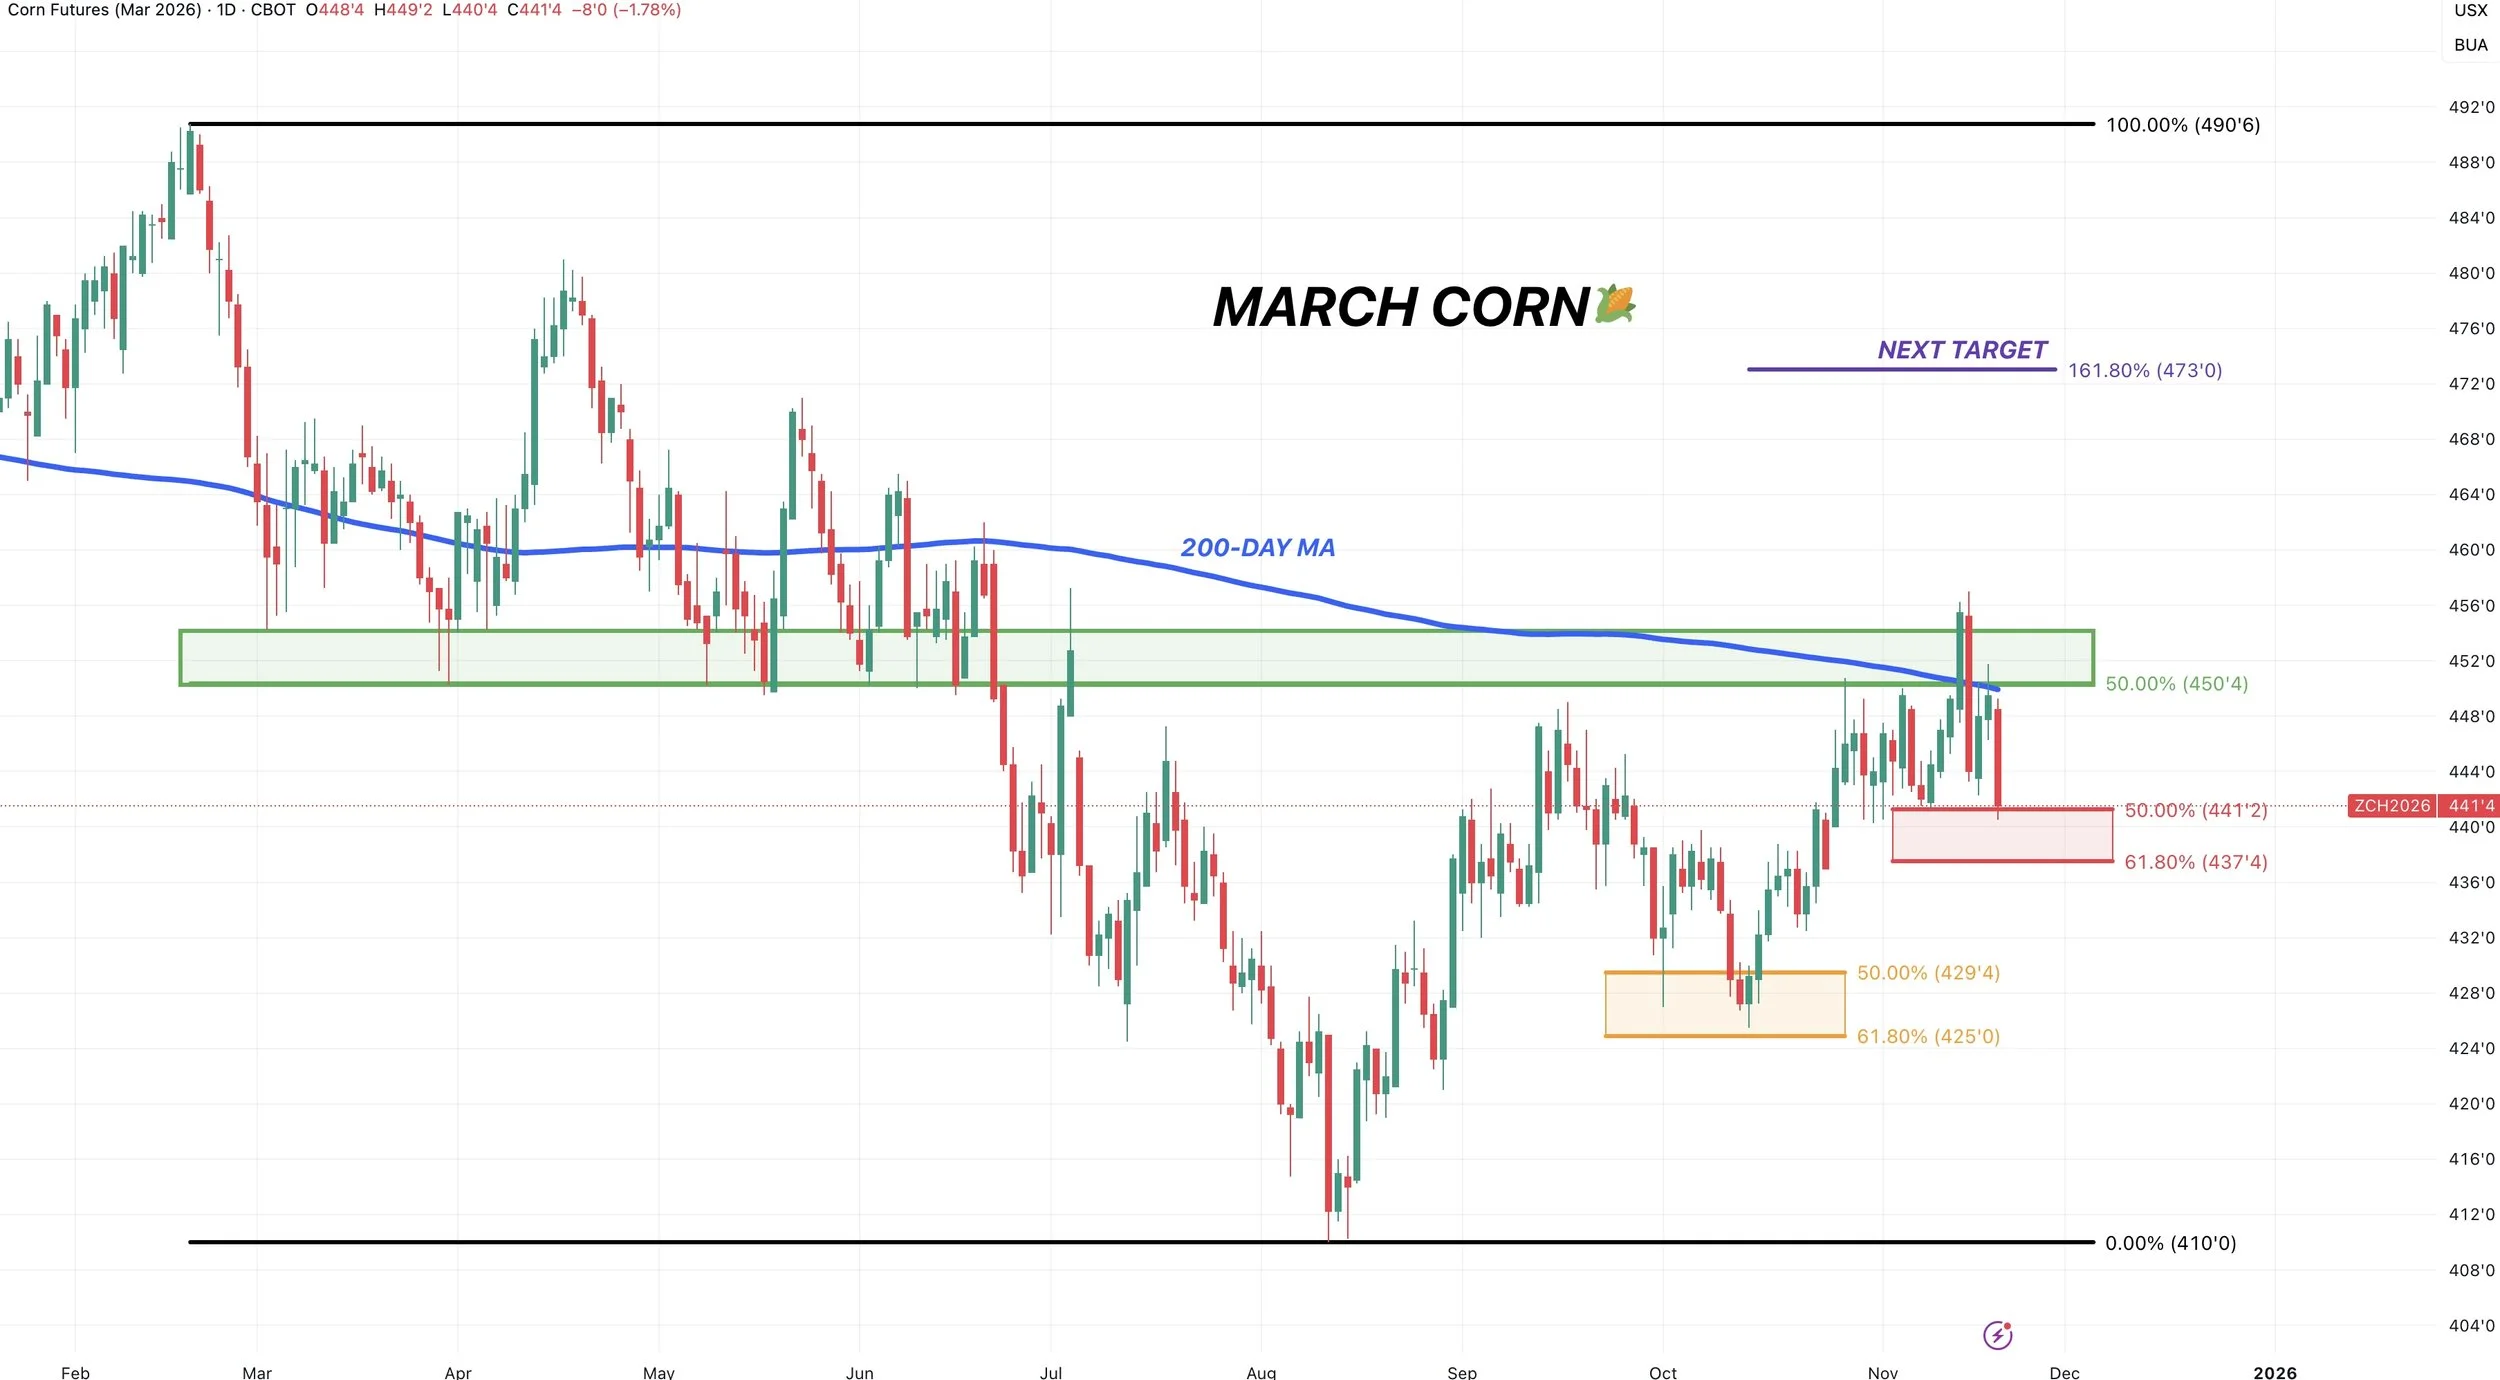
March Corn
March corn also needs above the 200-day MA.
At the same time, we want to hold the red box.
Like in Dec corn, on the Sep sell off we also bottomed in that golden zone. So a bounce between here and $4.37 would make sense.
Since we issued a sell signal & hedge alert at that $4.50 target, our next target to take more risk off the table is going to be $4.73 if we get there.
That equals 161.8% of the rally from contract lows to the September highs. Known as the golden fib.
Soybeans
Fundamentals:
It appears that the recent flash sales to China were a buy the rumor sell the fact type of event.
As we rallied hard on Monday over the optimism that China was going to buy.
Then once it was announced that they bought, we gave back a good portion of the rally.
As soybeans are now -33 cents off their highs from yesterday.
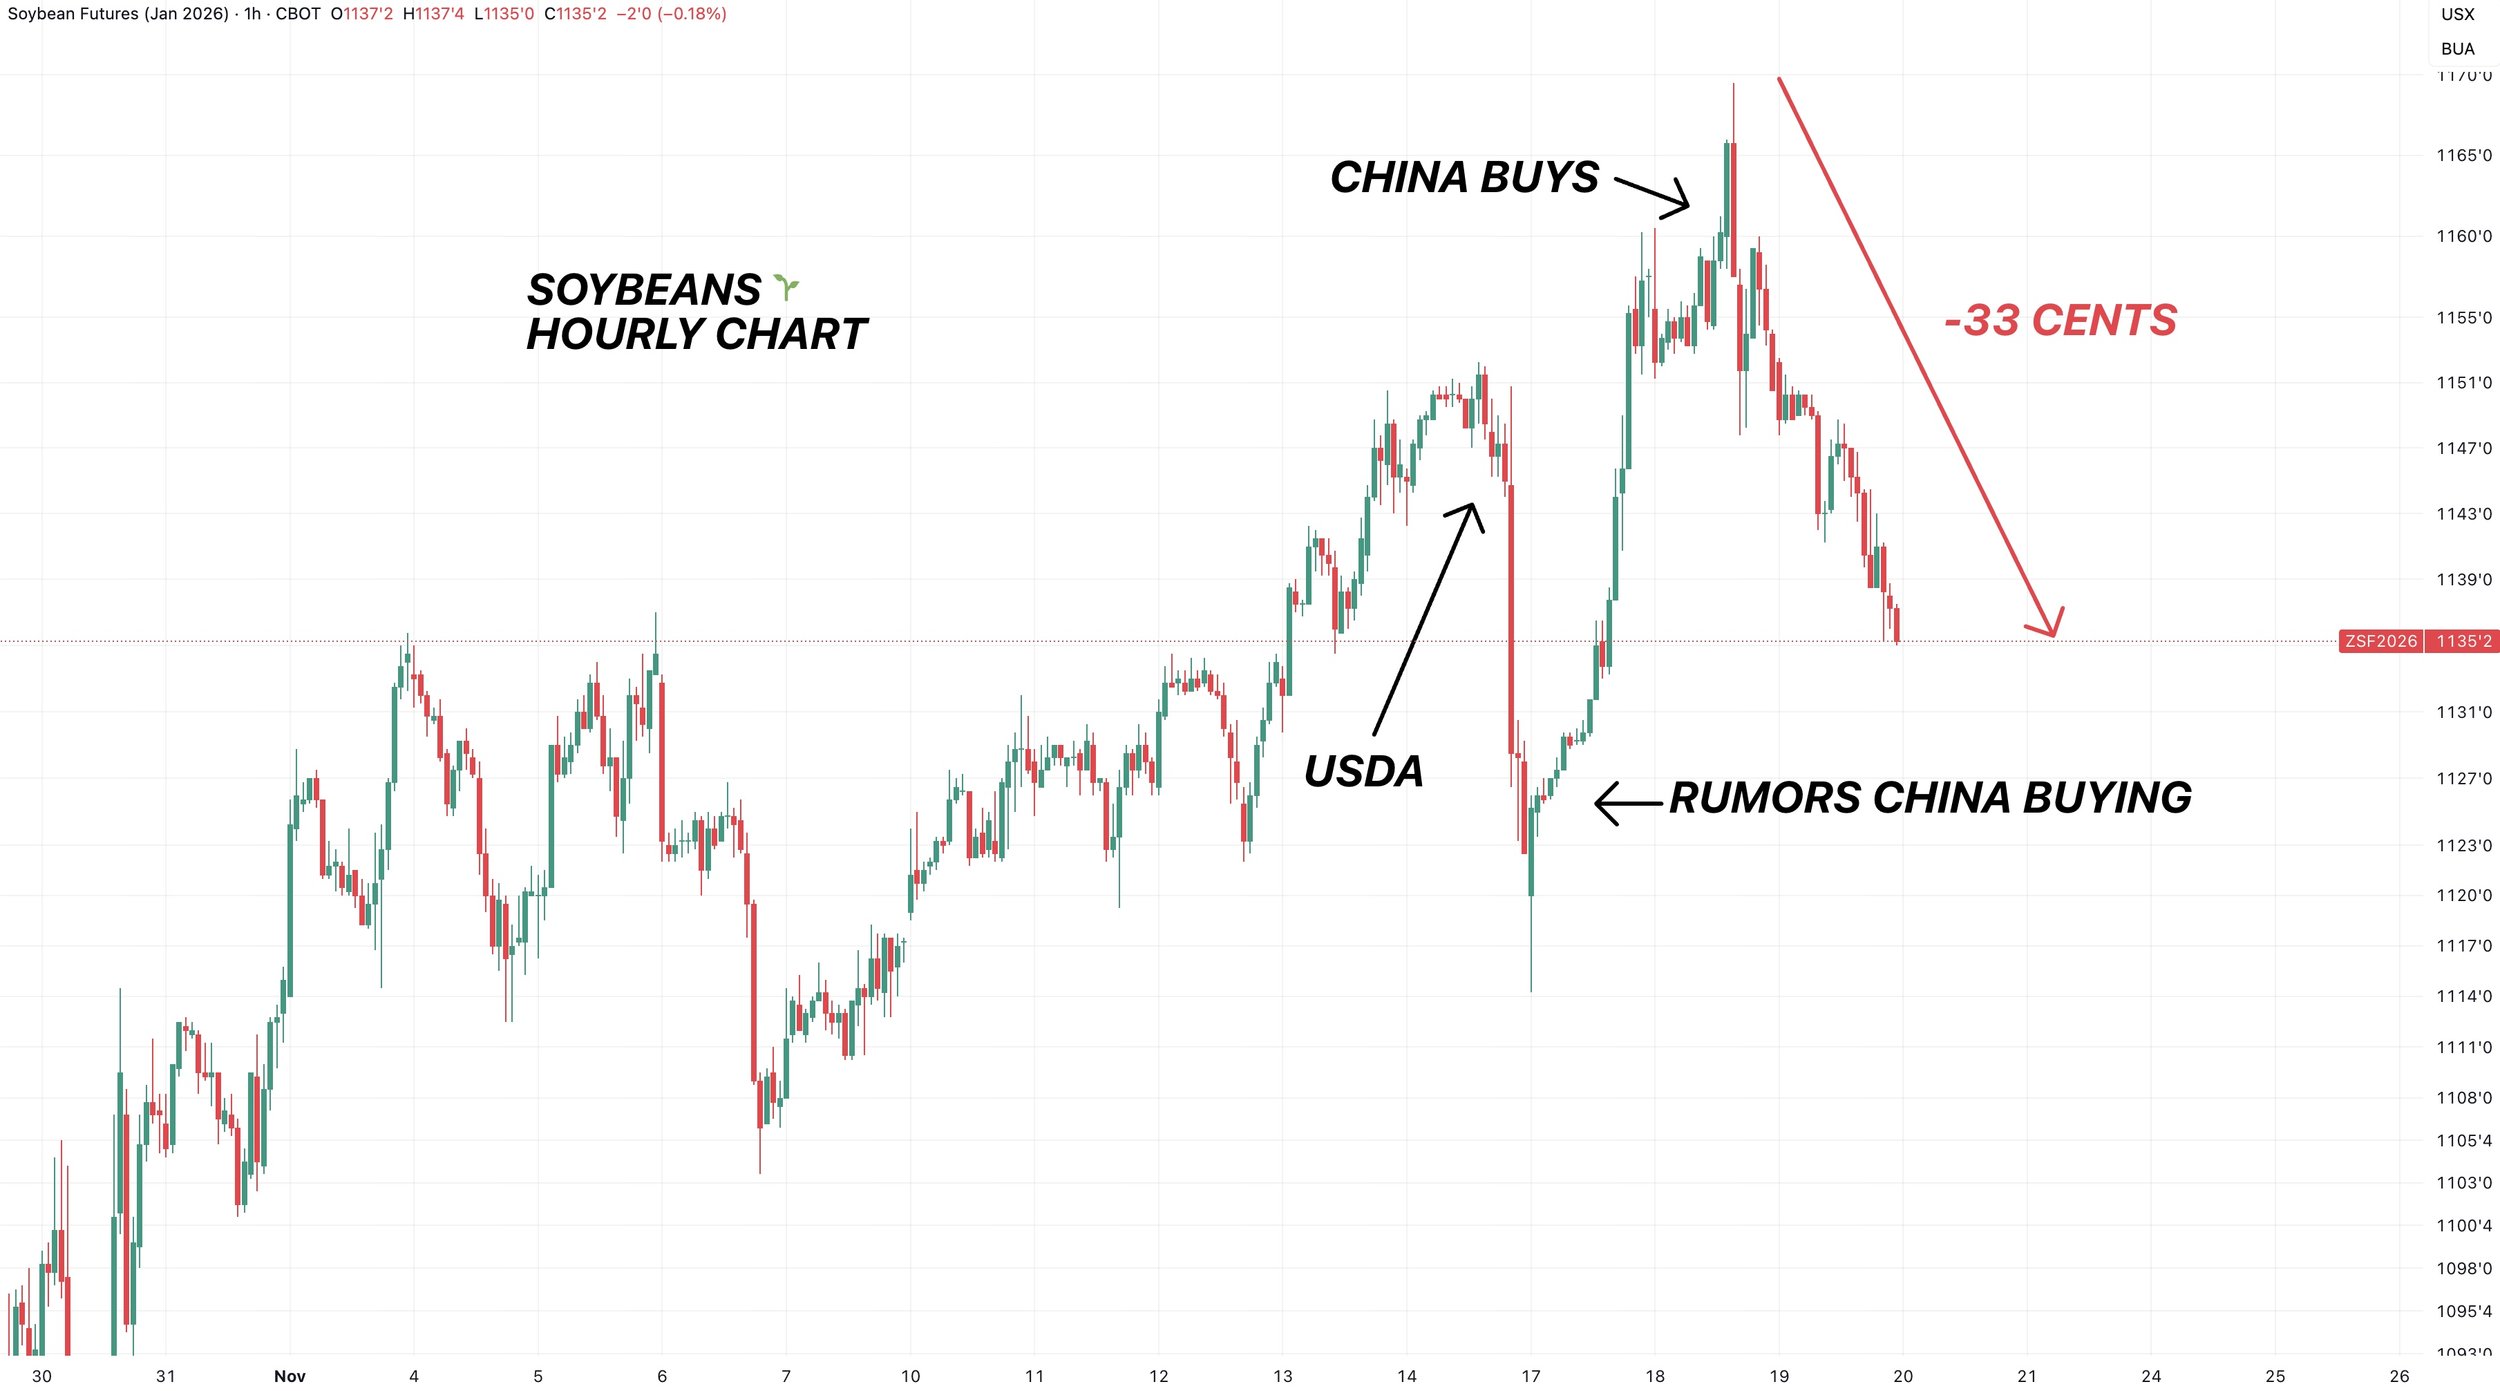
It has been nice to see China stepping up to buy, but we are going to need them to continue to step up and buy to keep the bull fed.
I don’t know exactly how the situation will play out.
I think soybeans have all of the potential in the world, but it made sense to take risk off the table at 17-month highs.
Hence why we issued that sell signal & hedge alert on Monday.
If you haven’t, you can check that out here:
CLICK HERE TO VIEW
In the signal, our preferred strategy was to use options. As you can keep your upside open while also protecting your downside.
(Chart is our signals this year)

Let's play some devils advocate here.
Bears argue that US soybeans are expensive globally.
Yes, this is true.
They argue that even if China is forced to buy our soybeans, it doesn’t fundamentally change anything.
Because that might simply result in us losing business elsewhere, given that our soybeans are now far more expensive than Brazil's soybeans.
Basically, their thought process is that since we are more expensive than Brazil, the China business we are receiving.. will be offset with losses in business to non-China destinations.
Essentially, they argue we are shifting around the chess pieces, not removing them from the board.
They argue that we still have ample world supplies, and China buying our soybeans doesn’t change that.
Which is true. As our world stocks to use ratio is lower than last year as well as the last trade war, but it's not exactly a super tight situation.
What could change that?
A supply scare or hiccup in Brazil would be the biggest one.
Because if you look at this chart, 2022 was when we had a bull market. It is also when world stocks to use was at it's tightest.

On the flip side..
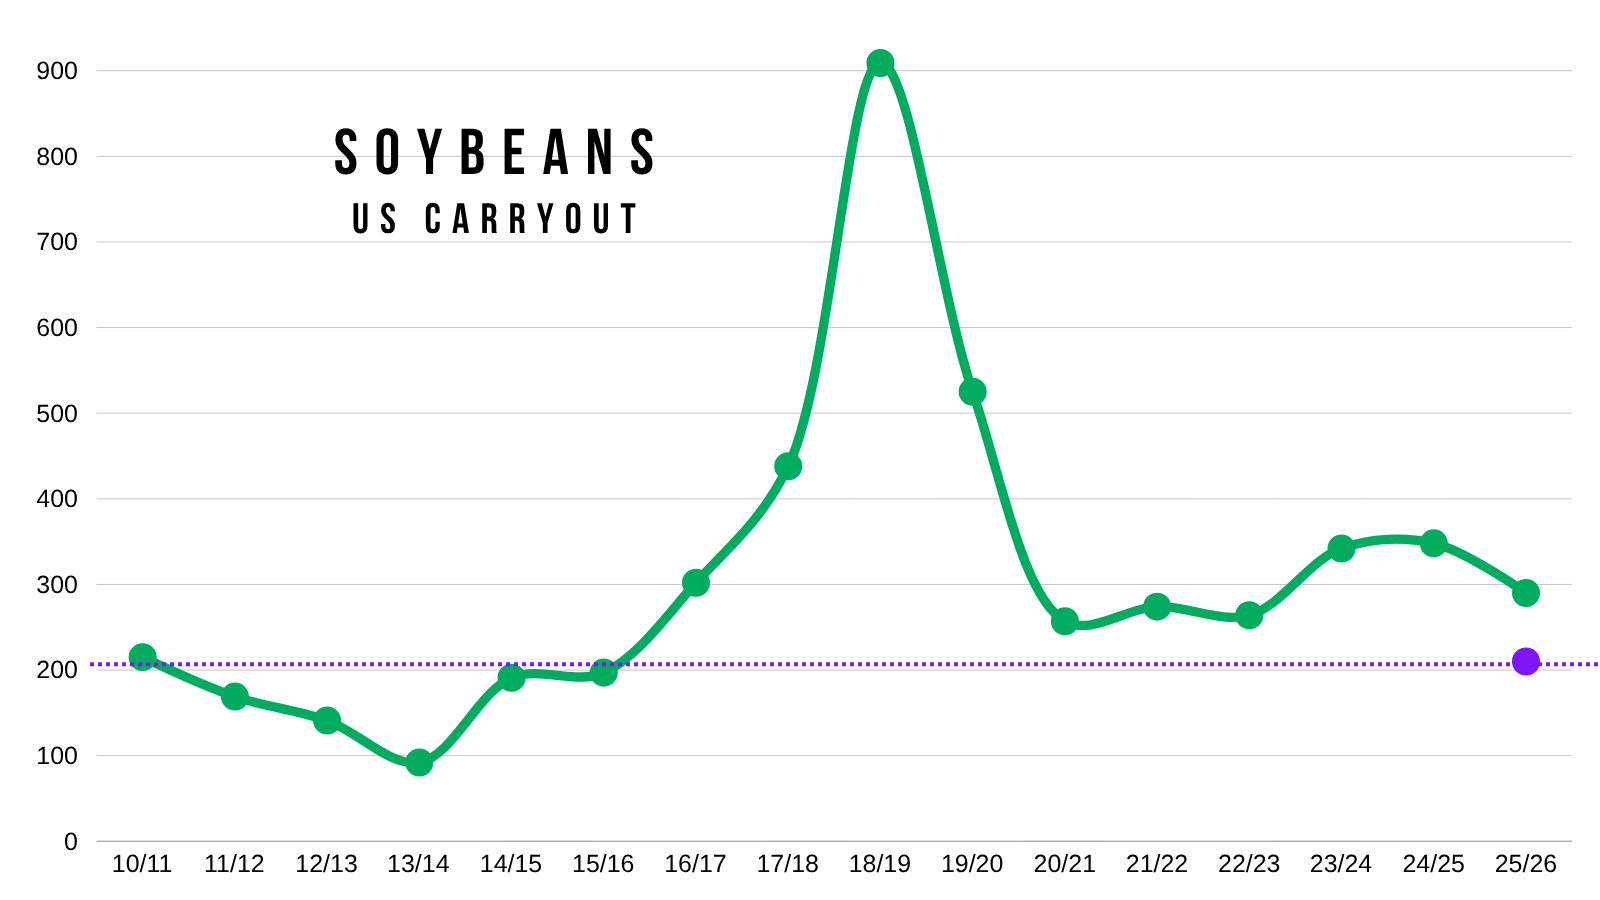
Bulls argue that a 290 million bushel carryout on the US balance sheet is not bearish by any means.
Because it's not.
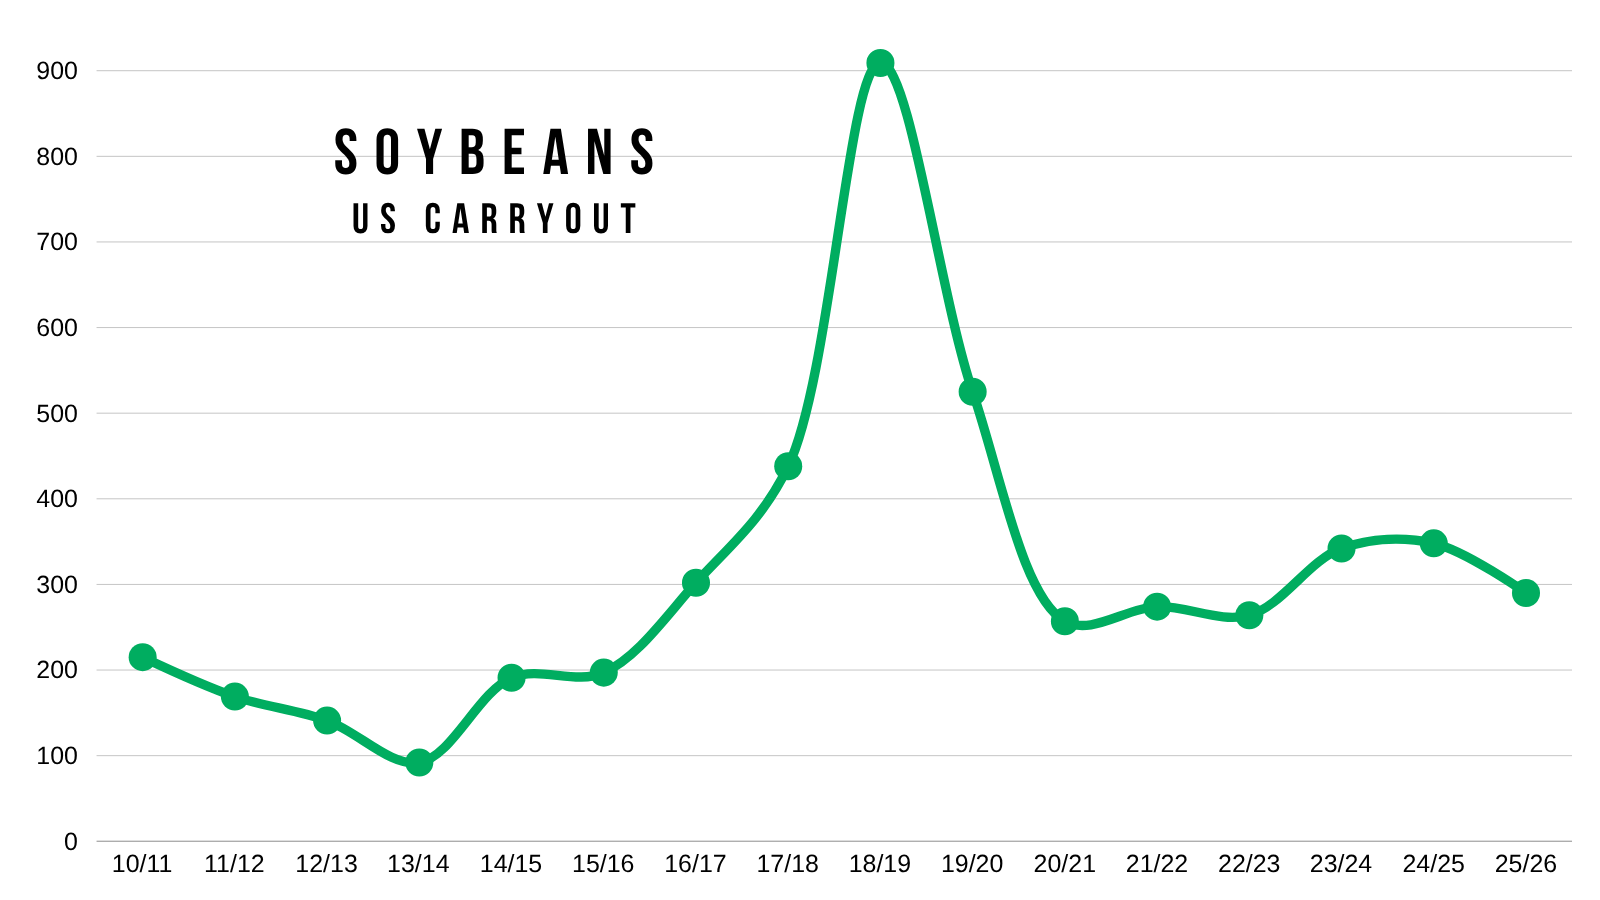
So what happens if yield in the US isn’t quiet 53 bpa..?
We might have to ration demand lower. To justify rationing demand lower.. you might have to ration prices higher.
You can’t cut crush demand. It’s been outstanding.
Historically, the last decade the USDA has tended to cut yield in January.
I would expect the same thing this year.
However, the largest cut we've seen in the last decade was last year. Which was -1 bpa.
That would put us at a yield of 52 bpa.

Here is what the balance sheet looks like if you dropped yield to 52 but left the demand side of the balance sheet completely unchanged.
It does drop carryout down to near 200 million bushels.
If demand remains unchanged.. that is how little room for error is on the supply side.
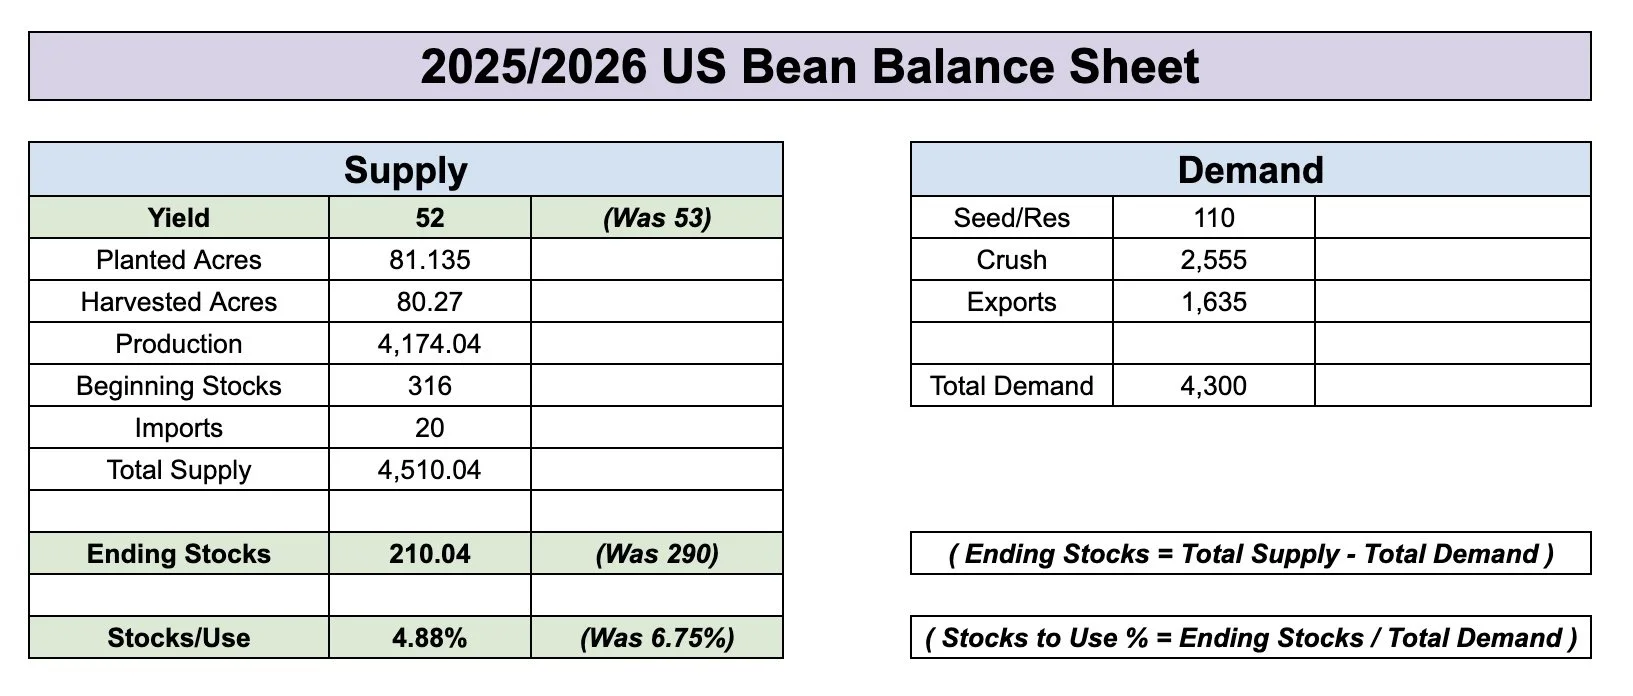
Here is the current balance sheet for reference.

A carryout of 210 million bushels would be the tightest in a decade.
(Purple dot = 210 million)
Here is a 5 and 10 year seasonal pattern.
Both of them having us topping out in that Jan to Feb timeframe.
I could pretty easily see a similar pattern this year.
We are entering Brazil's growing season. Whether they get a weather scare or not is going to play a huge role in where we go from here.
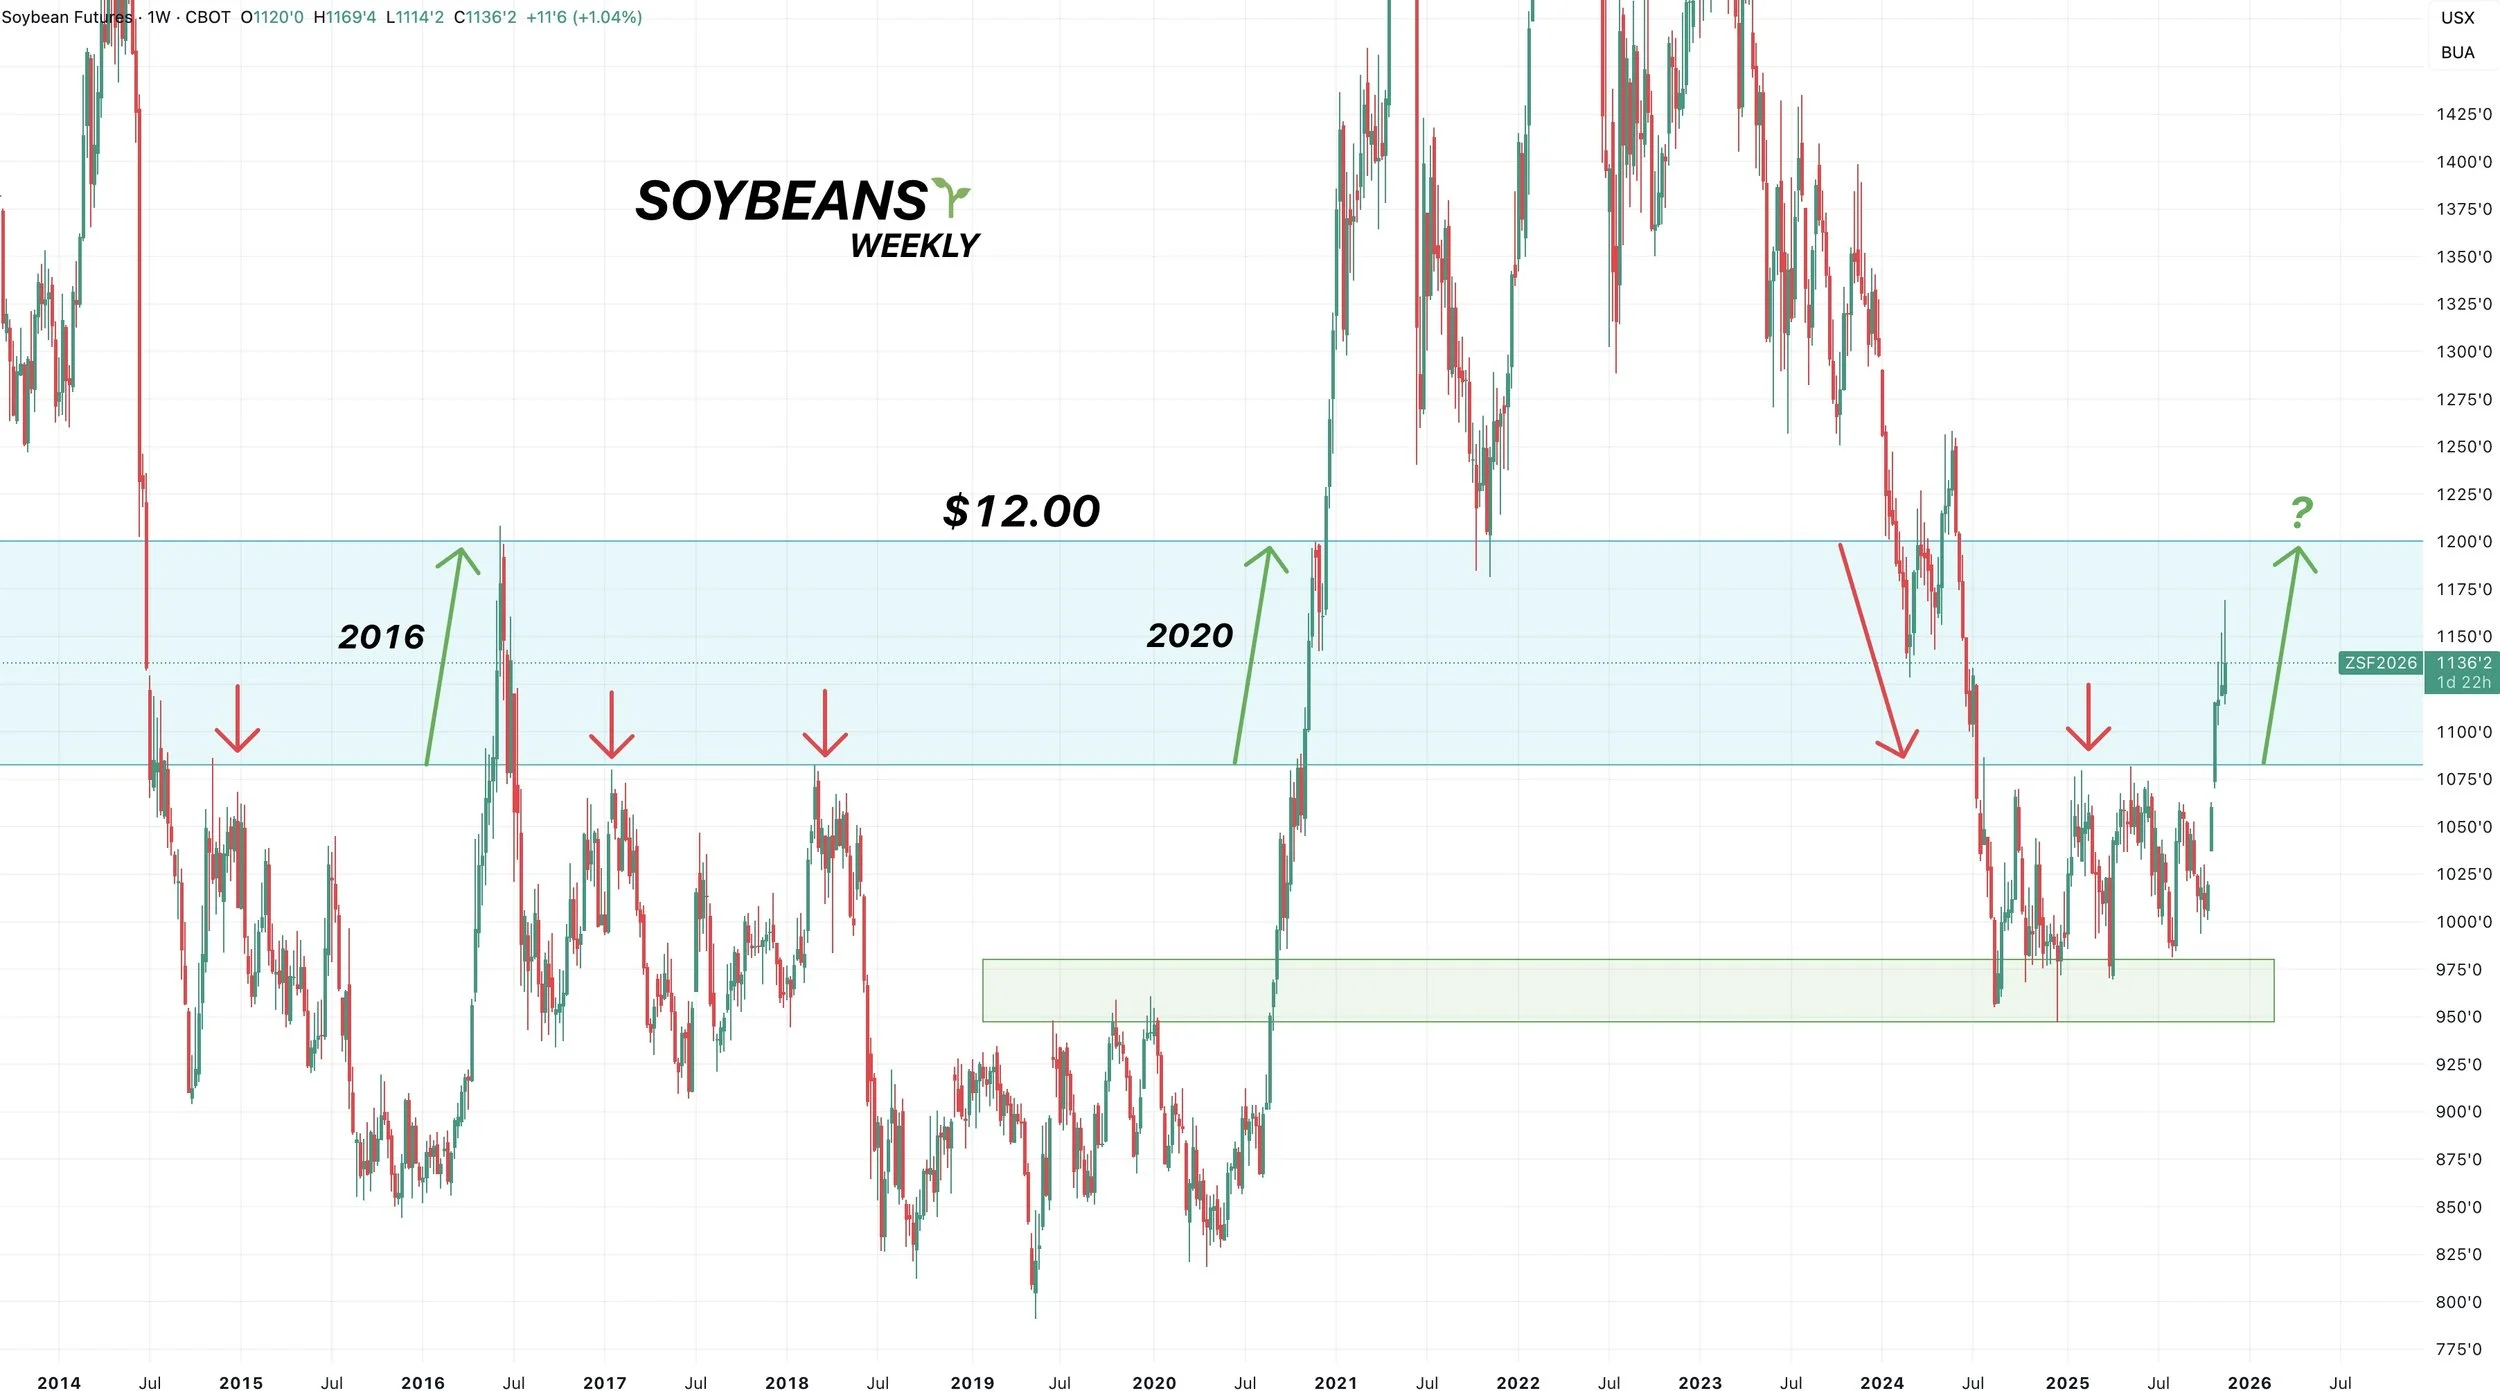
A Brazil hiccup is realistically probably the only path where we get a shot at over $12.00 beans, $13, $14 etc.
If Brazil has a monster crop, I don’t know if we will have the story to go tremendously higher.
This seasonal pattern also lines up with the fact that Brazil's crop doesn’t come online and become available until Jan-Feb.
So if China is going to start to come in and buy heavily, you'd assume it would be before then.

Technicals:
Jan Beans
Not the greatest price action the last two days.
As yesterday we closed well off the highs leaving a disappointing candle.
$11.28 gives back 61.8% of those Nov 6th lows. Bulls would like to hold there or it could open the door lower.
We have seen two +30 cent corrections in the market the last few weeks. Both of them were bought. So I am not too concerned just yet.
From a technical standpoint, we are still in a clear uptrend. We could fall a long ways and still be in an upward market.
Since we issued that sell signal & hedge alert on Monday, our next target is going to be $12.00 to further de-risk.

I still think soybeans have a solid chance at $12.00 for a variety of reasons like we've talked about before.
The biggest one is the simple fact that we've created zero resistance or support between $11.00 and $12.00
We've never broken the $11.00 resistance and stop in the $11.00's.
It could happen this time, but so far it has not.
Wheat
Dec Wheat
I am still eyeing the green box to take risk off the table.
The 200-day MA also sits in that box.
The 200-day MA has acted as some pretty major resistance over the course of the last year or so.
To the downside, we essentially need to hold today's lows or we could fall into that orange box.
Today's lows gave back 61.8% of the recent bounce we just had.
The orange box gives back 50-61.8% of the entire rally from contract lows.

Dec KC Wheat
KC wheat has been weaker than Chicago.
I still want to de-risk if we climb into the green box.
To the downside, we need to hold that orange box and golden zone.

Cattle
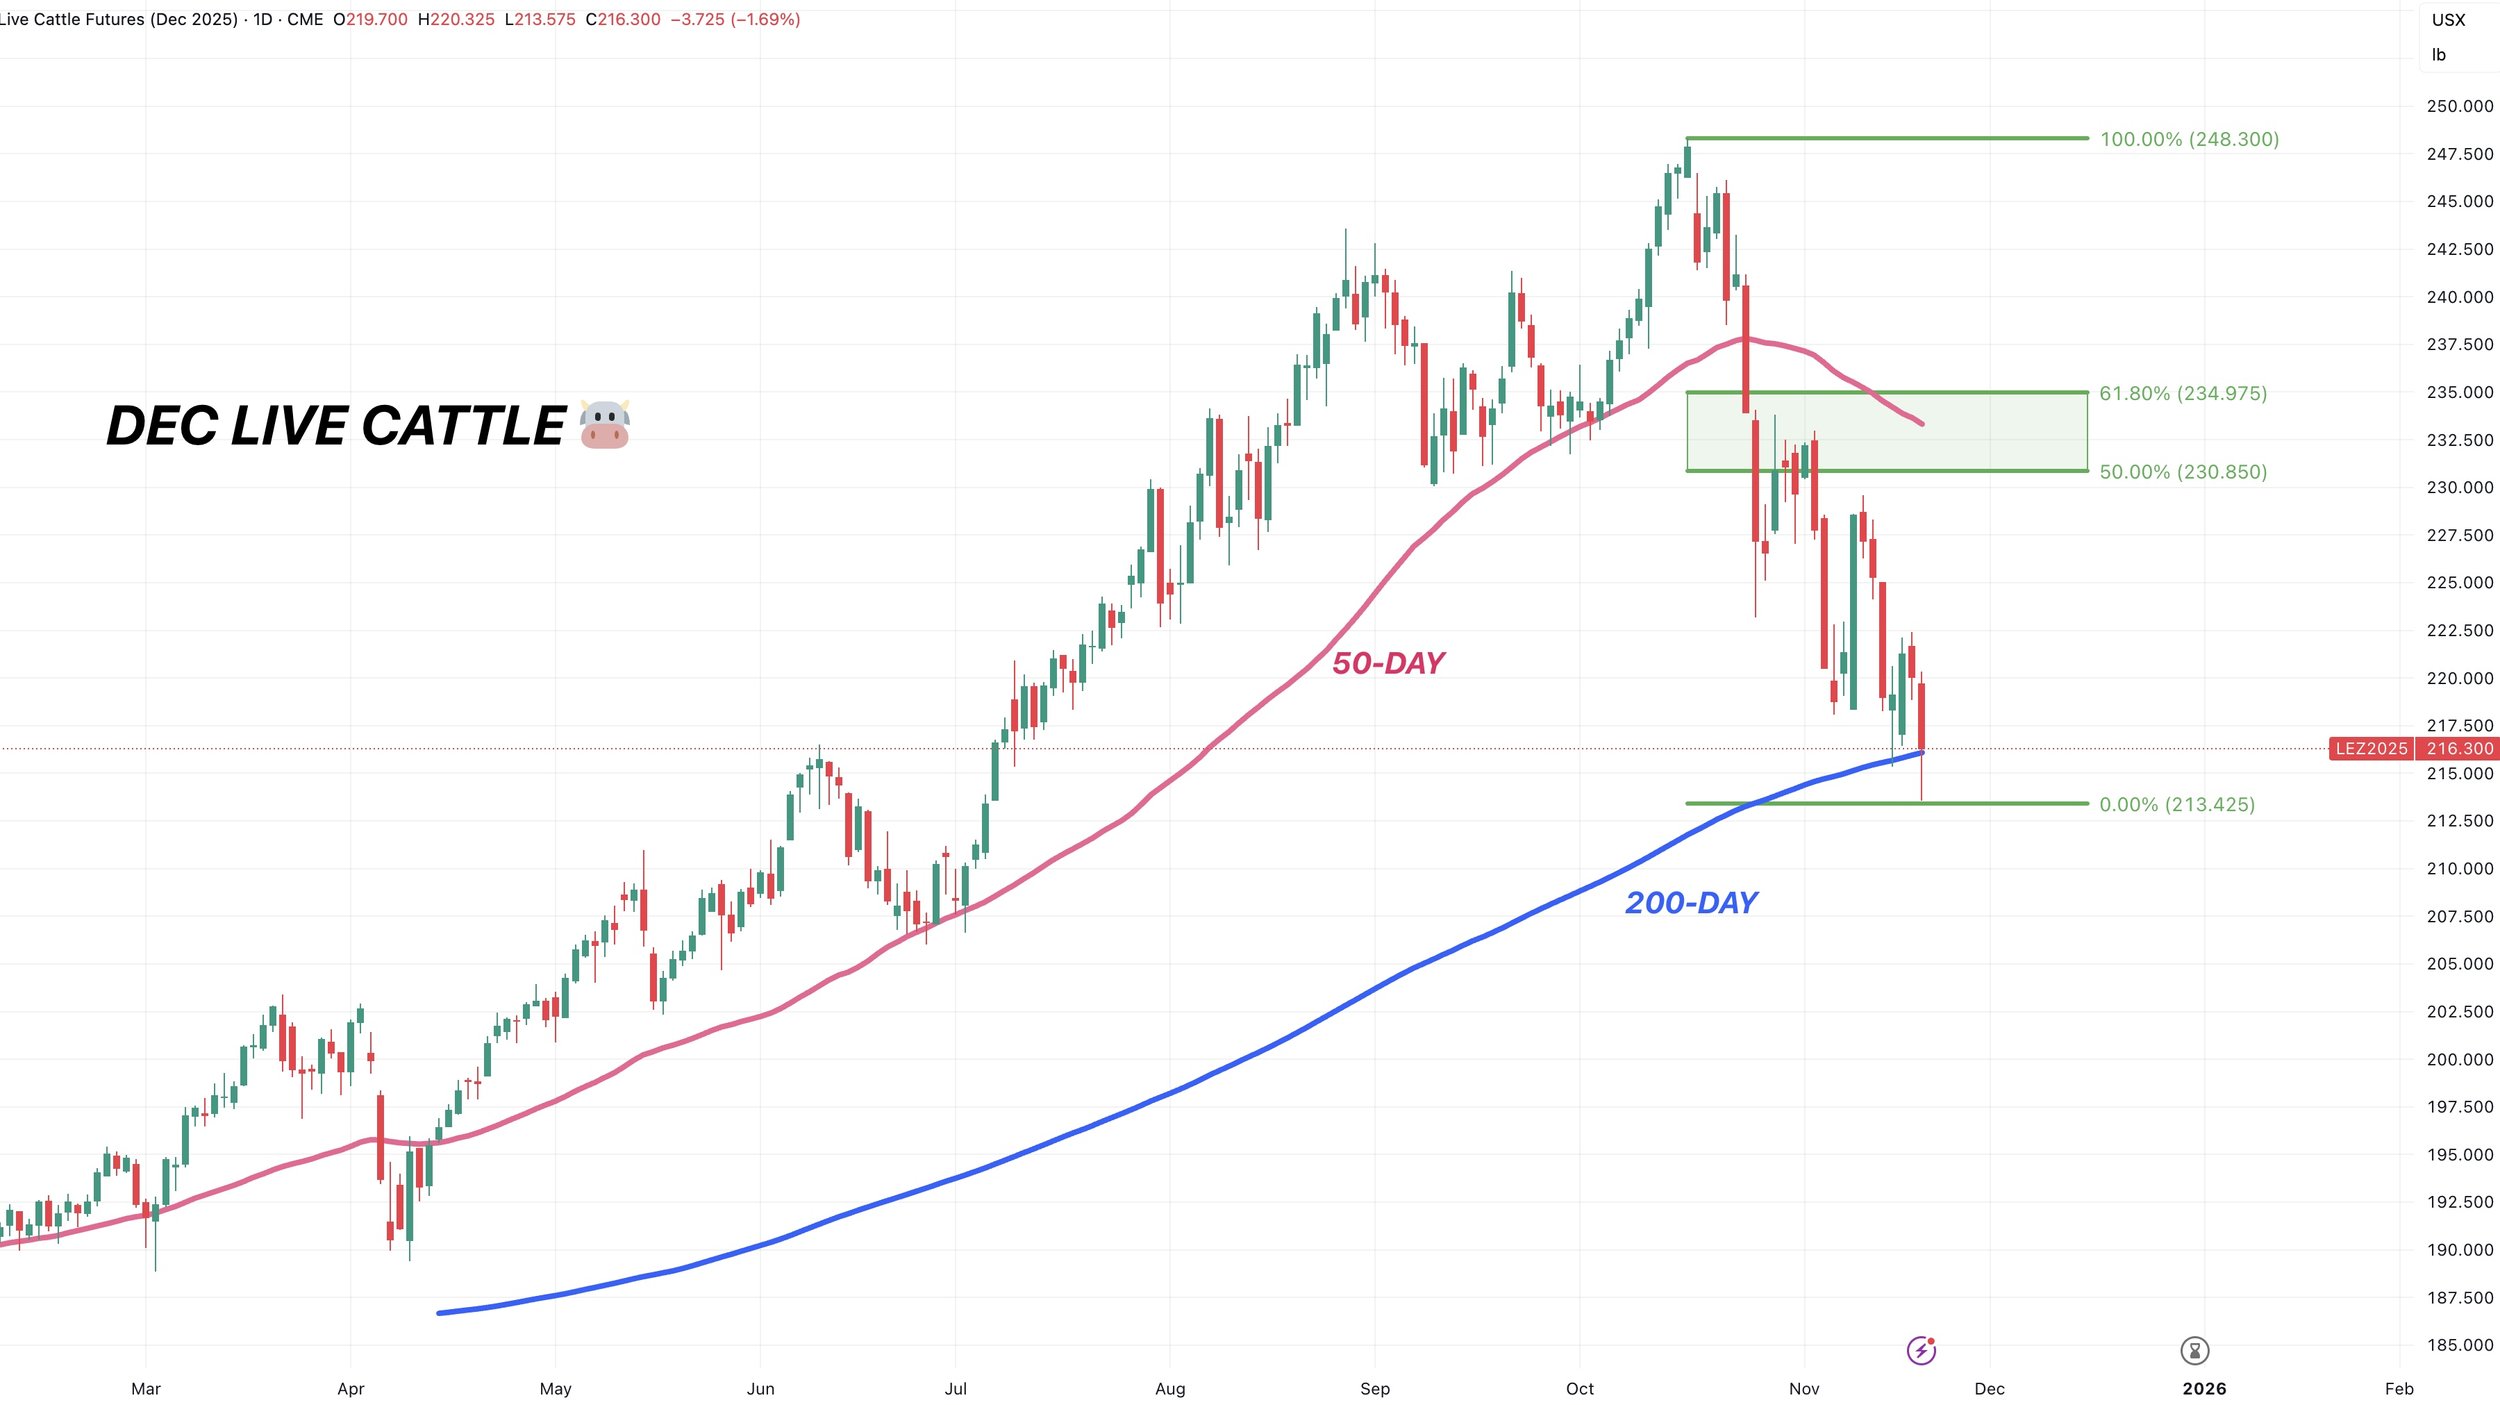
Dec Live Cattle
Nothing fundamentally to update here.
The government is still trying to get prices lower so we are going to want to reward a bounce if it comes.
We are barely hanging on to the 200-day MA today.
This is a pretty important spot to hold.
If we break below, it could give the algos another reason to sell this thing even further.
If for whatever reason we get some sort of correctional bounce, we want to be rewarding the rally. Especially if we climb into the green box.
As that reclaims 50-61.8% of the sell off and the 50-day MA sits there. The 50-day MA used to be big support, it is now resistance.
Jan Feeders
Feeders are holding up better than live cattle.
We need to hold those recent lows to prevent further downside.
If we get a bounce towards the green box we want to reward it.

Past Sell or Protection Signals
Nov 17th: 🌱
Soybean sell signal & hedge alert.
Nov 13th: 🌽 🌱
Managing risk in corn & beans ahead of USDA report.
Oct 28th: 🌽
Corn sell signal & hedge alert.
Oct 27th: 🌱
Soybean sell signal & hedge alert.
Oct 13th: 🐮
Cattle sell signal & hedge alert.
Aug 22nd: 🌱
Soybean sell signal & hedge alert.
July 31st: 🐮
Cattle sell signal & hedge alert.
July 10th: 🐮
Cattle sell signal & hedge alert.
CLICK HERE TO VIEW
June 5th: 🐮
Cattle sell signal & hedge alert.
June 2nd: 🌾
MPLS wheat sell signal.
April 10th: 🌽
Old crop corn sell signal.
March 19th: 🐮
Cattle hedge & sell signal.
Feb 18th: 🌽 🌾
Old crop KC wheat & old crop corn signal.
Jan 23rd: 🌽 🌱
Corn & beans old crop sell signal.
CLICK HERE TO VIEW
Jan 15th: 🌽 🌱
Corn & beans hedge alert/sell signal.
Jan 2nd: 🐮
Cattle hedge alert at new all-time highs & target.
Dec 11th: 🌽
Corn sell signal at $4.51 200-day MA
CLICK HERE TO VIEW
Oct 2nd: 🌾
Wheat sell signal at $6.12 target
Sep 30th: 🌽
Corn protection signal at $4.23-26
Sep 27th: 🌱
Soybean sell & protection signal at $10.65
Sep 13th: 🌾
Wheat sell signal at $5.98
May 22nd: 🌾
Wheat sell signal when wheat traded +$7.00
Want to Talk?
Our phones are open 24/7 for you guys if you ever need anything or want to discuss your operation.
Hedge Account
Interested in a hedge account? Use the link below to set up an account or shoot Jeremey a call at (605)295-3100.