
NUMEROUS FACTORS STILL AT PLAY
AUDIO COMMENTARY
Crazy volatile day in crude oil
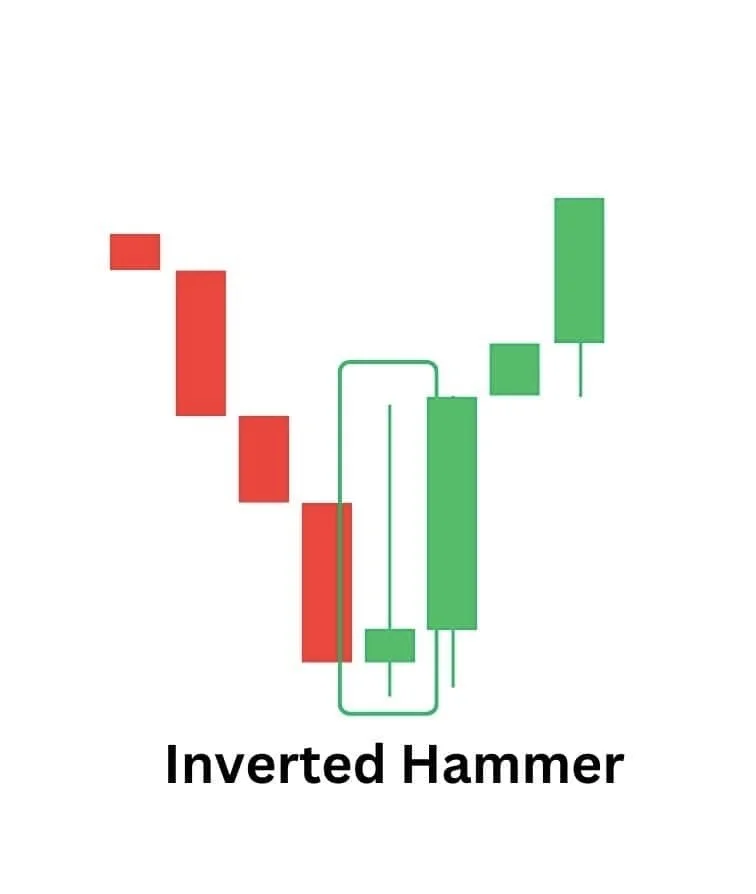
Inverted hammer in corn at trend support. Need a bounce now for a reversal (chart below)*
Don’t let emotions get the best of you
We don’t know the outcome of several factors
Crop size, war & China all big factors
June is starting off dry
How long will fertilizer be impacted?
Are the highs in or not?
What happens if China buys corn and we don’t raise a bumper crop?
Need to hold China meeting lows
Divergences in the charts
Why traps can often happen in these markets
If we can’t bounce soon, wouldn’t look great
Seasonals going to start to work against us
Drought scare still possible?
Upcoming June USDA reports
Don’t want to chase higher or fear sell
Options have gotten cheaper. They are cheap enough to lock in a floor
Need to see China in some flash sales
Today’s highs and lows could be key for corn
Chart breakdowns below audio*
Listen to today’s audio below
Want to talk?
Office: (806)484-1214
CHARTS
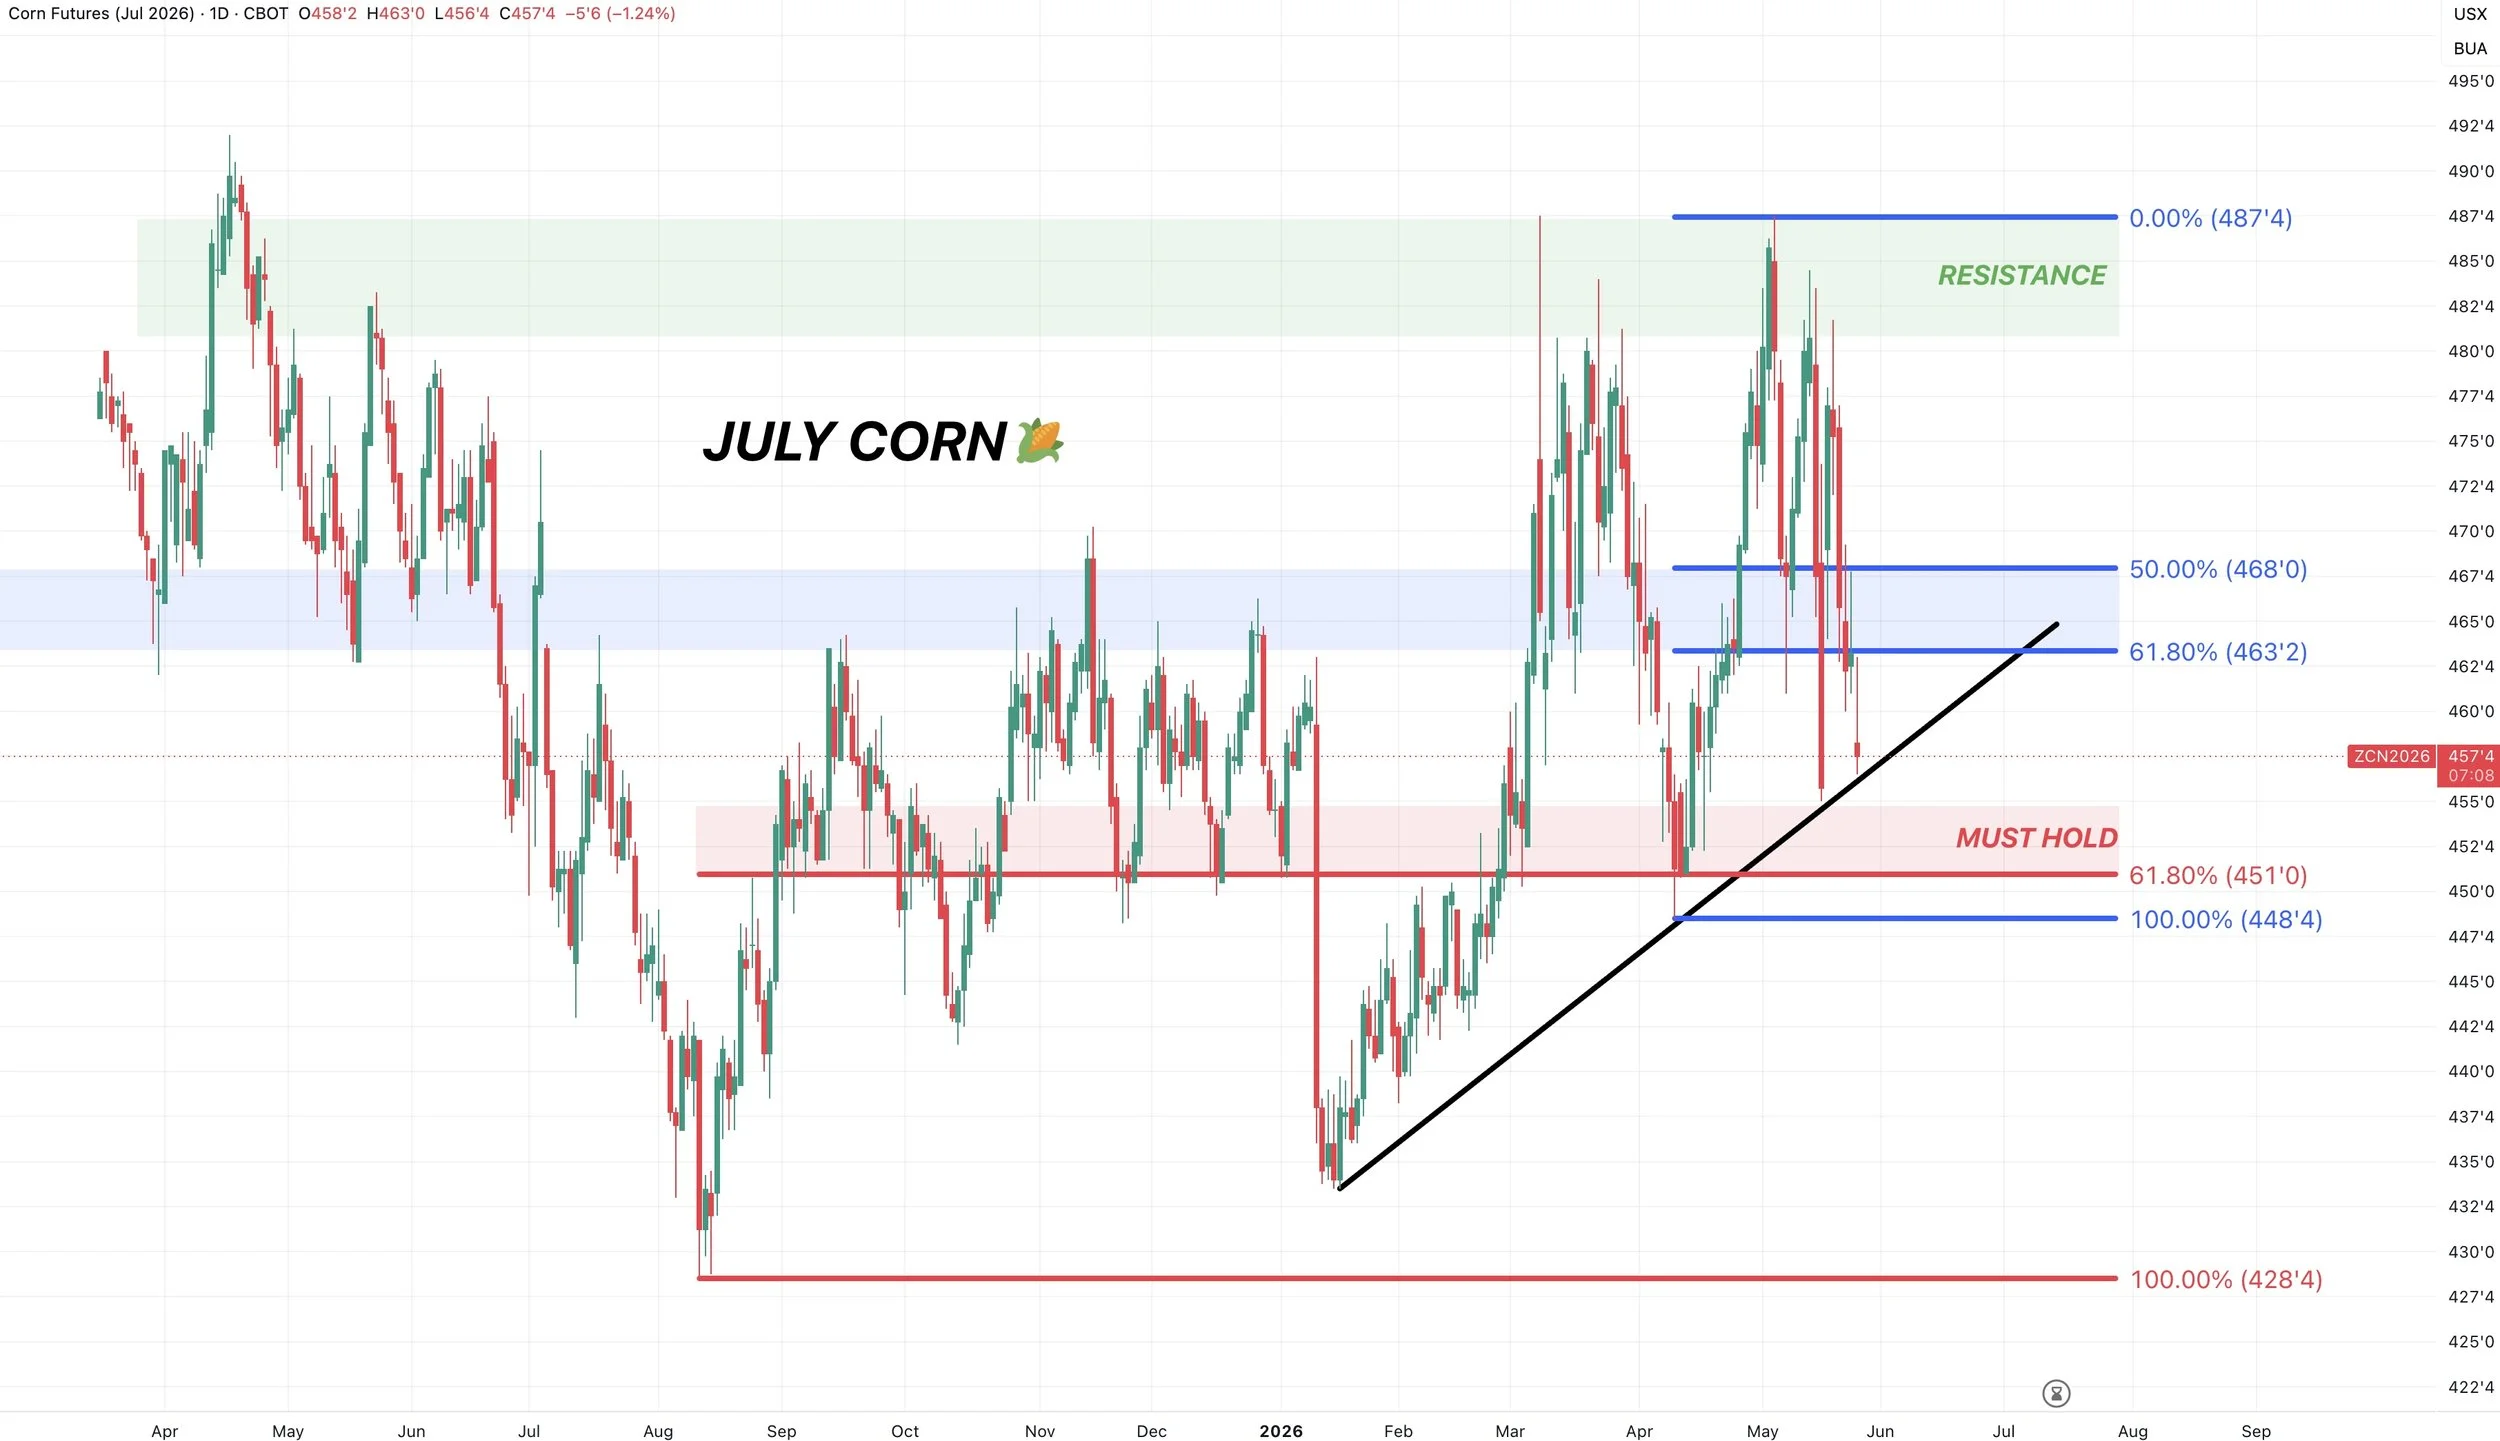
July Corn 🌽
We broke below the golden zone down to the April lows. Objectively that’s a bad sign as it tells us this is no longer viewed as your normal correction before resuming the uptrend. The chart would’ve been in a more clear friendly trend if we would’ve held the blue box.
However, we did leave an inverted hammer today.
Normally, when you close well off the highs on a rally, that is viewed as bearish. But it’s the opposite when it occurs during a sell off.
It tells us that the buyers “tried” to push the market higher.
I will include an example of this pattern below this chart.
But essentially, if we follow today up with a green candle, it can often be a potential sign of a reveral. Follow through is key though. If we sell off tomorrow then this candle of course does not matter.
So tomorrow’s price action will be very important.
This candle also happened right on the upward trendline support.
So if we fail here, we likely test the April lows.
That $4.50 level remains the line in the sand. If you lose that level the chart would be considered broken in my opinion and it opens the door lower. That is 61.8% of the entire rally off contract lows. It was key support from fall and exactly where we bounced in April.
Here is an example of an inverted hammer.
Again, this pattern requires follow through to the upside or it does not matter.
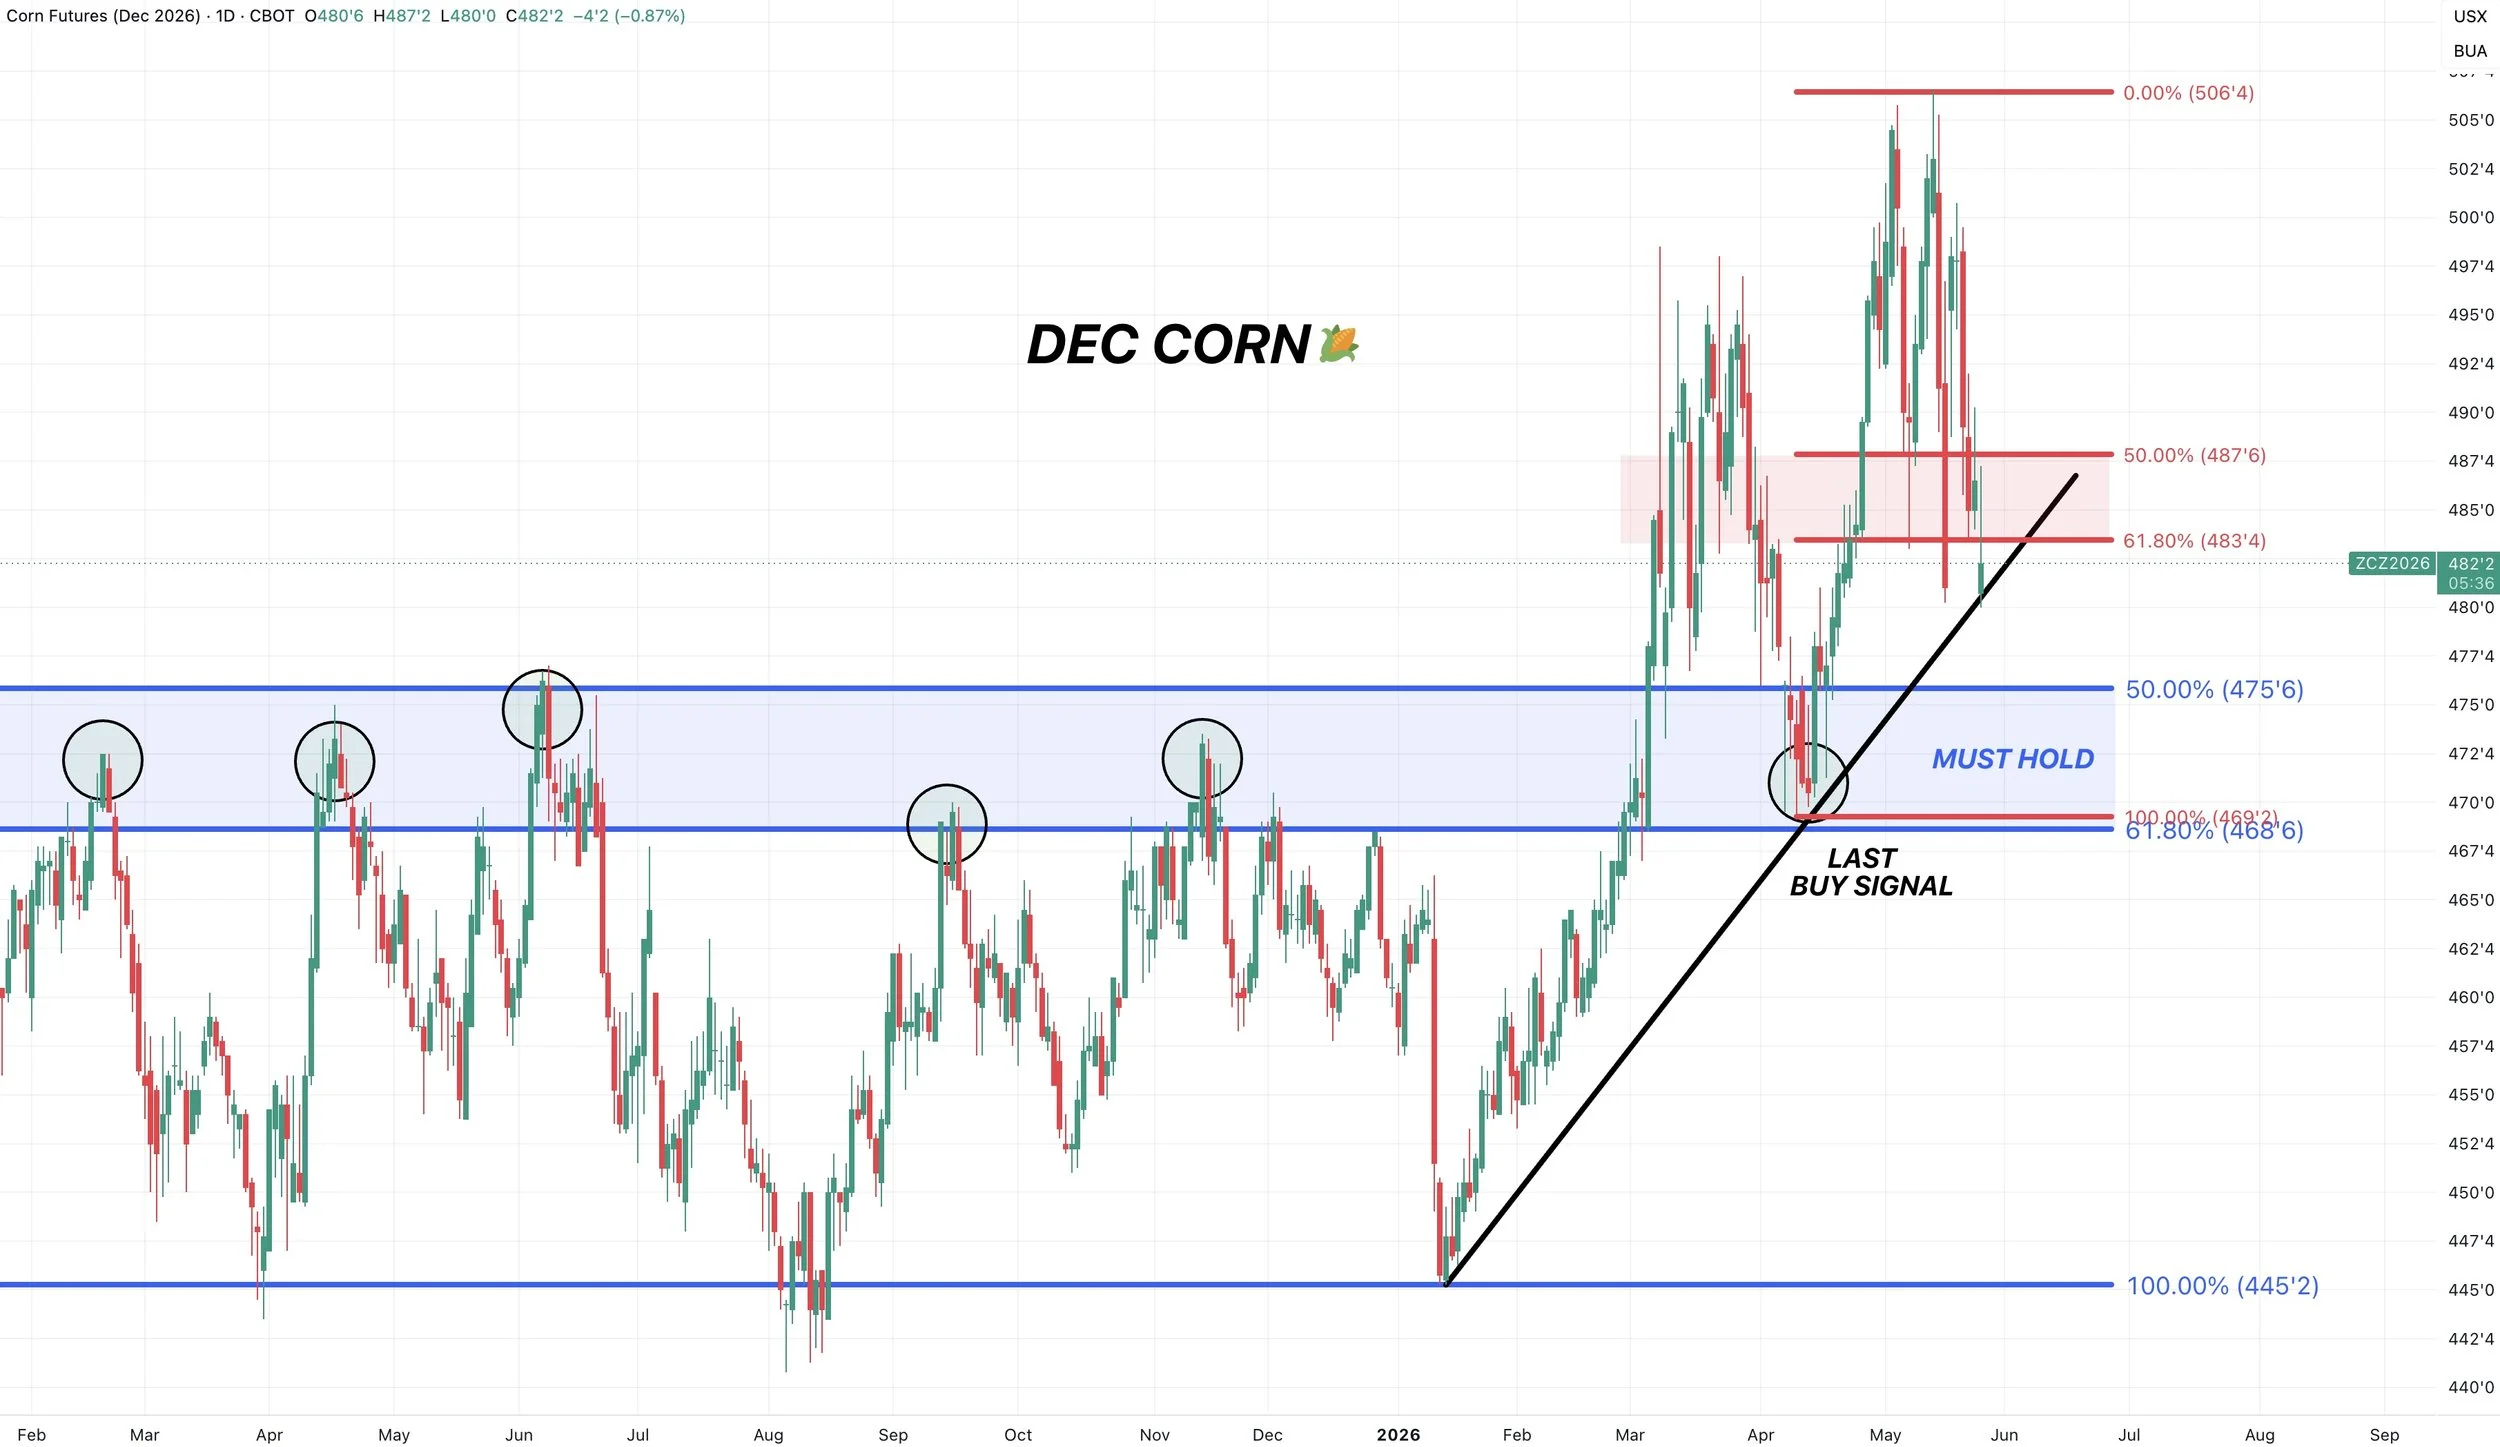
Dec Corn 🌽
We also failed to hold the golden zone.
However, we are still holding that upward trendline support.
Similar to July corn, we also left an inverted hammer candle.
So tomorrow’s price action will be important.
Follow it up with a green candle and we could be due for at least a relief bounce.
Follow it up with a red day and we break this trendline support, it could open the door towards the April lows.
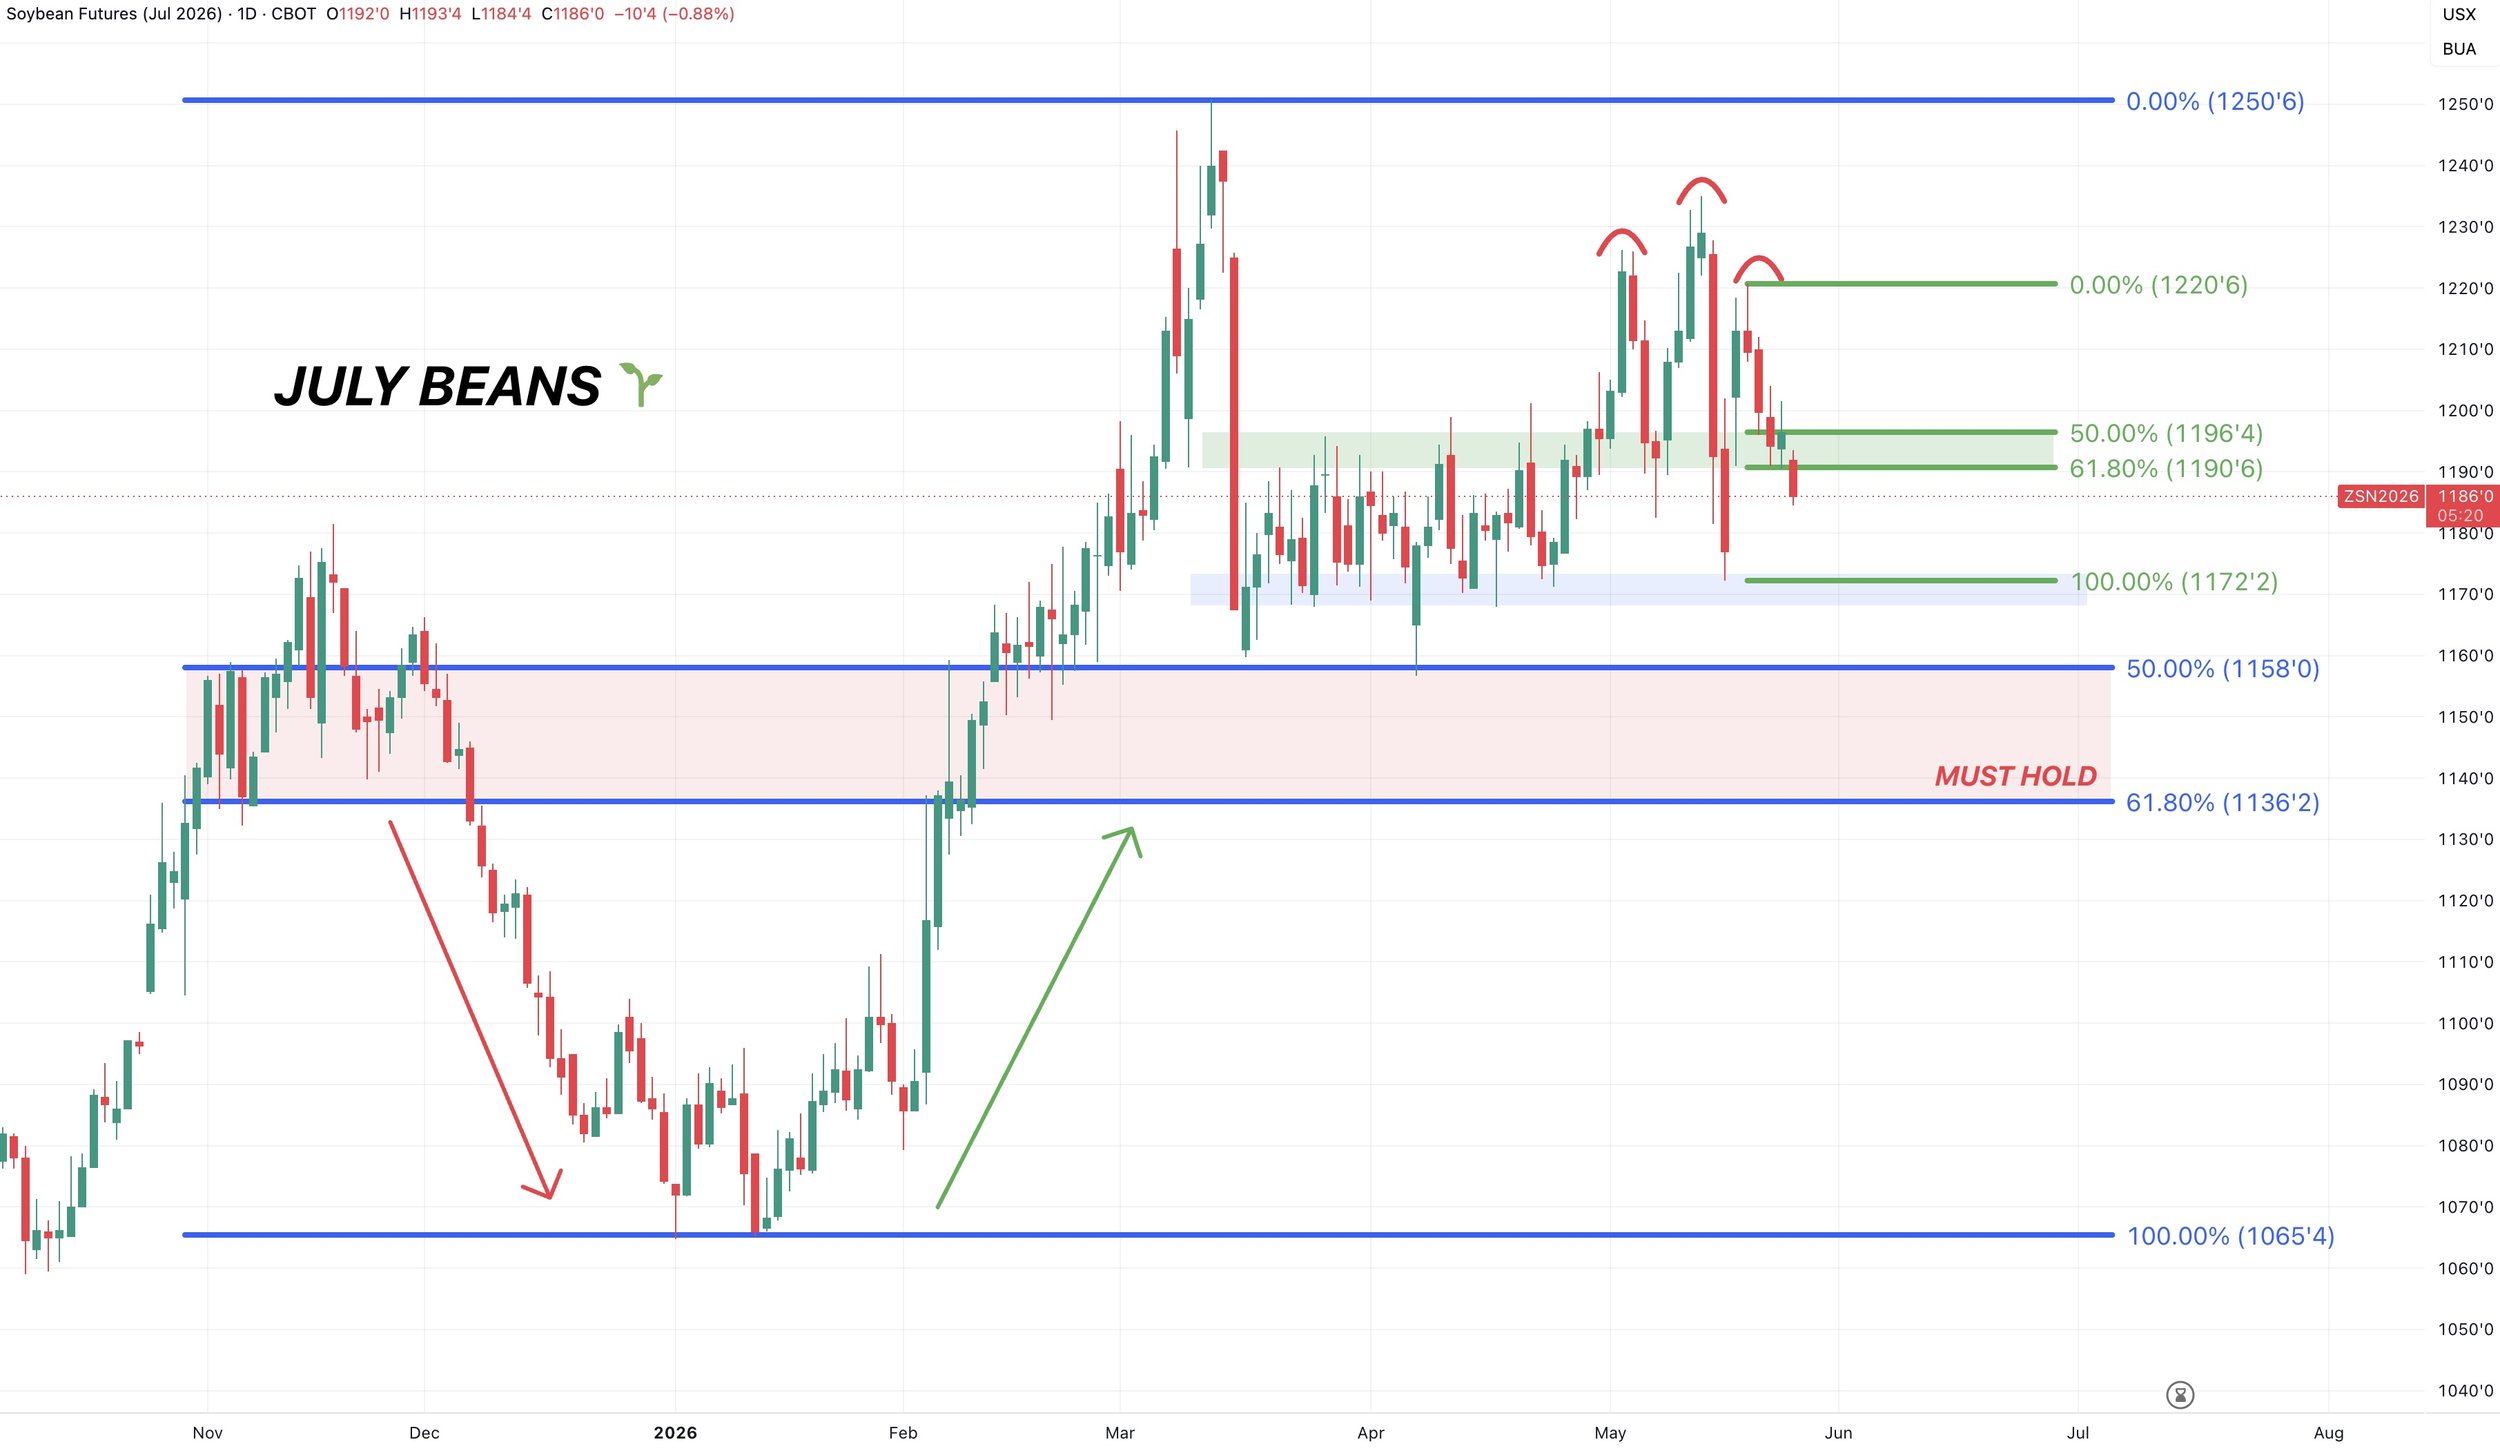
July Beans 🌱
We failed to turn that old resistance into support.
That same area was the golden zone.
So objectively, not the best sign.
We also have this head & shoulders pattern.
So we could go down and test the bottom of the range.
Really anything in this old range is simply noise.
The overall long term trend is still higher unless we break below $11.36. If we break that, it would be bad news.
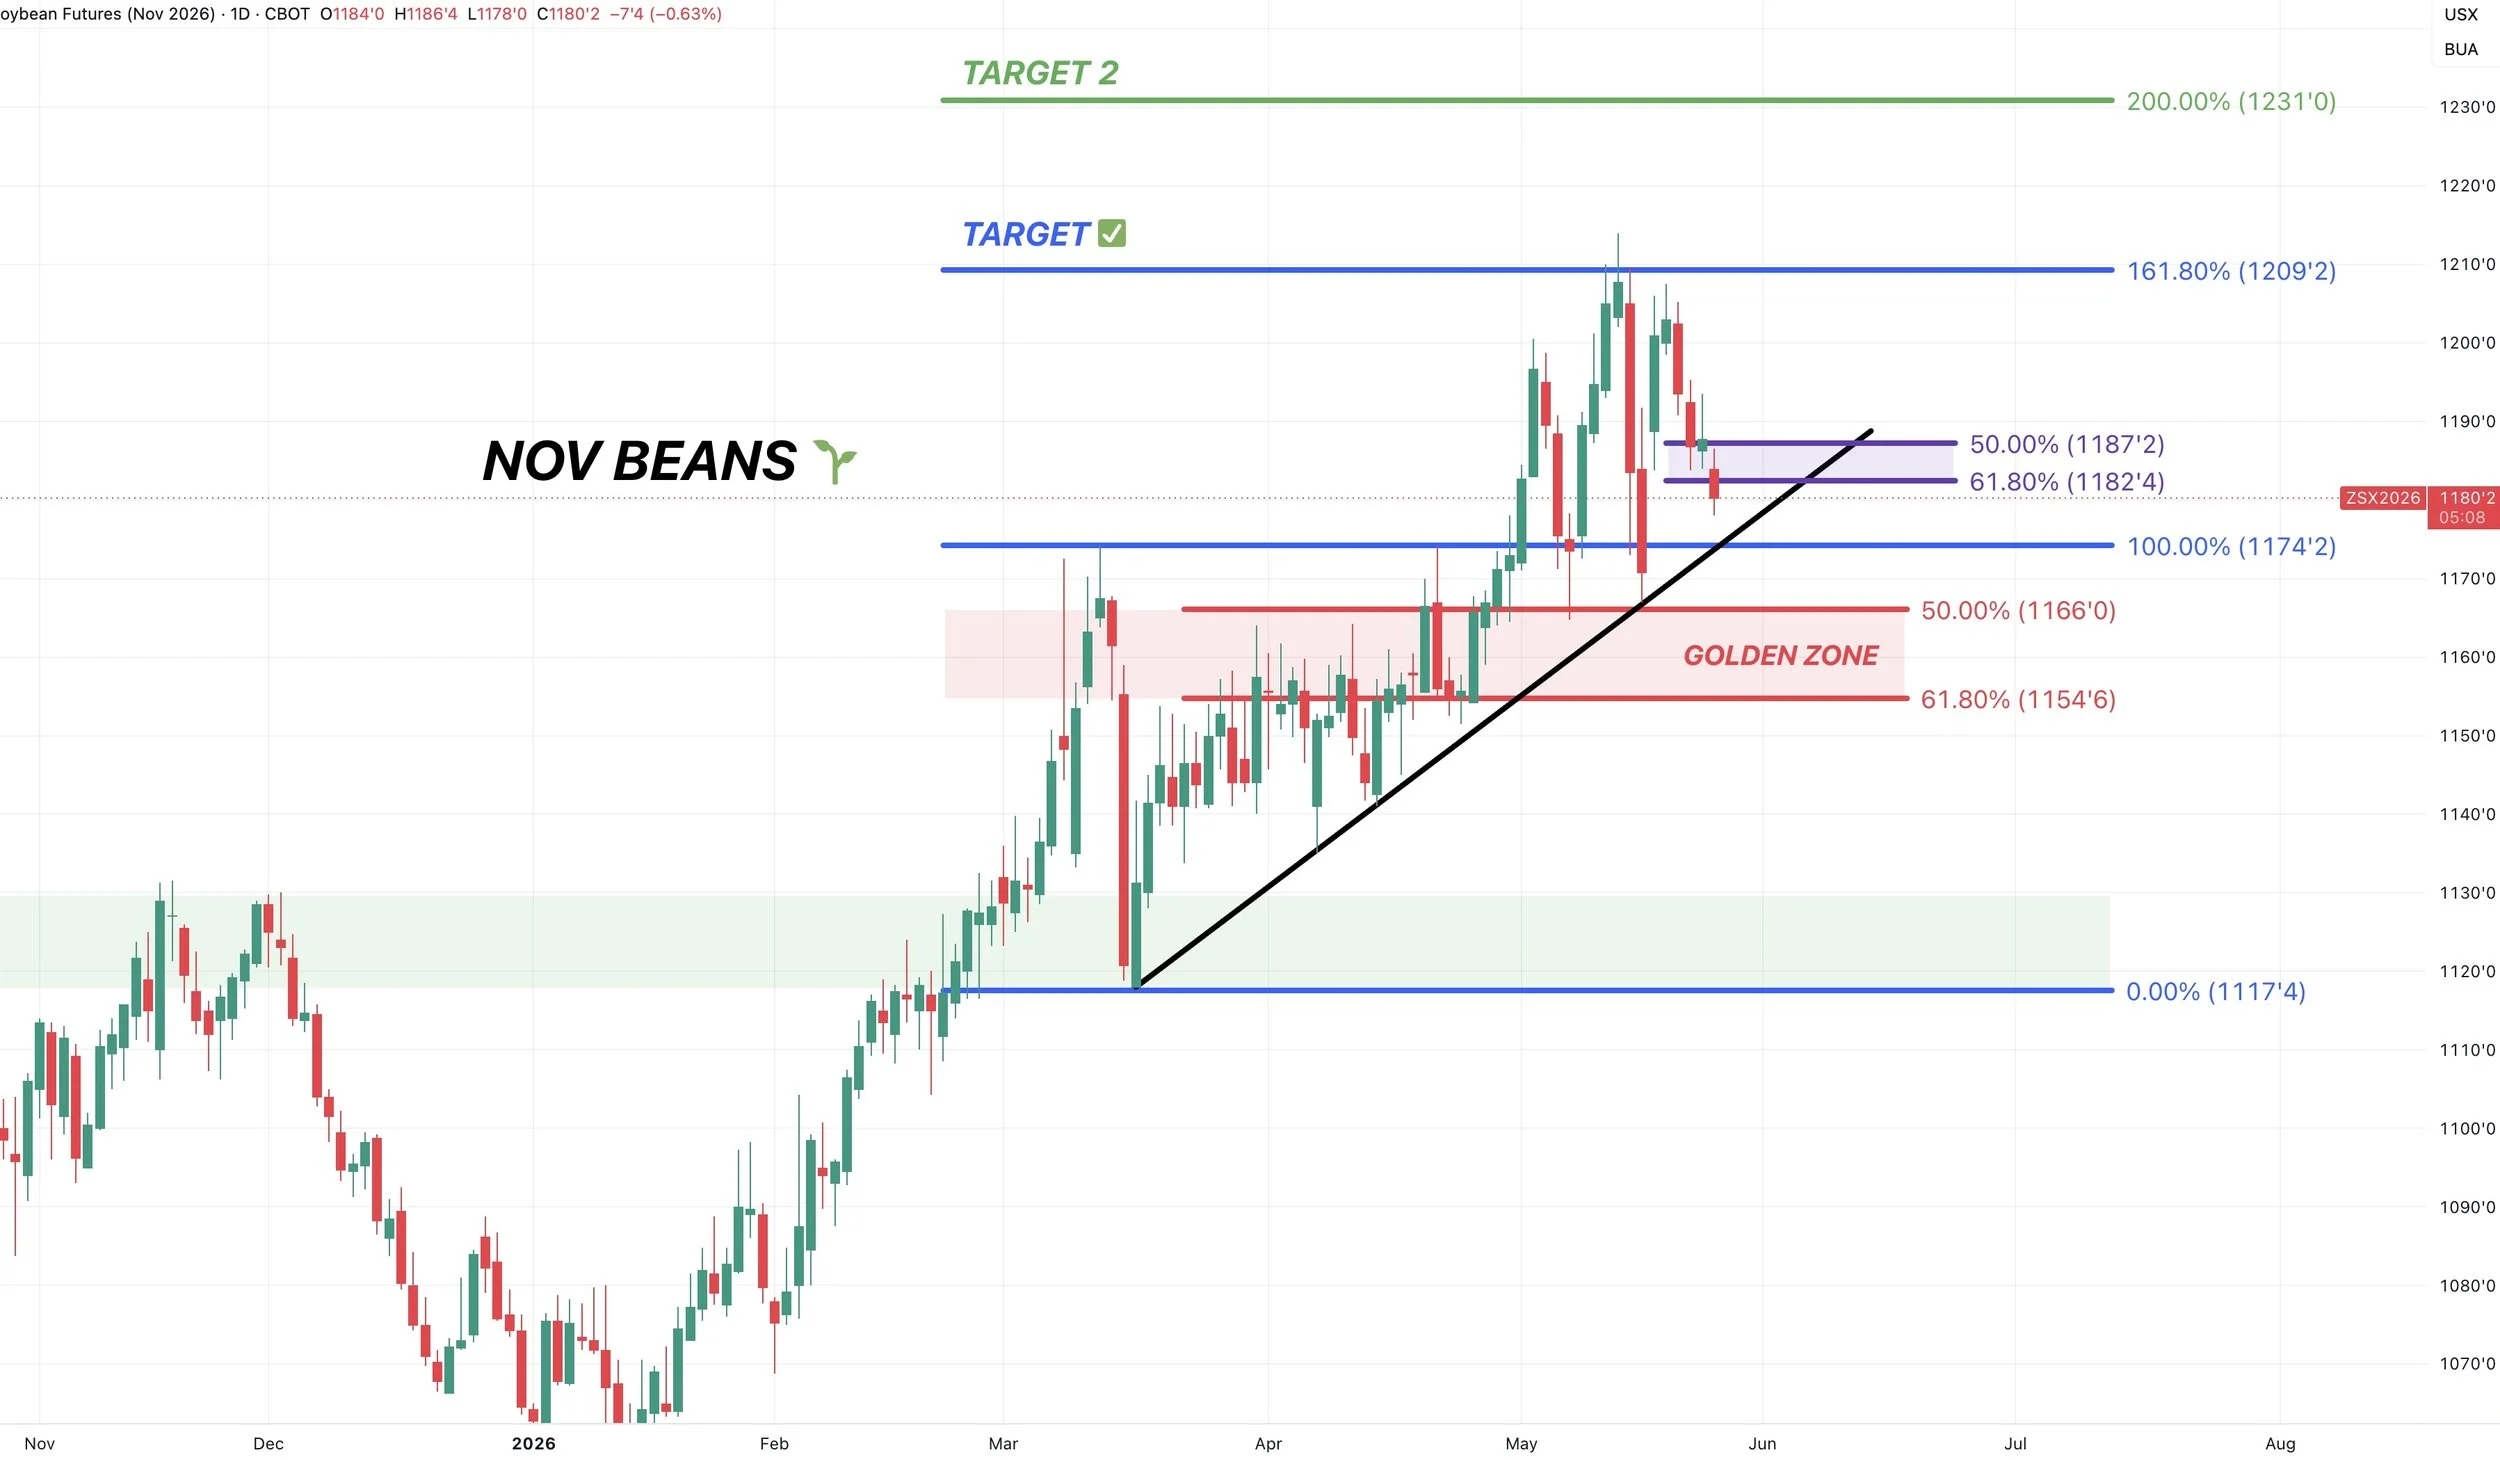
Nov Beans 🌱
Hit that $12.09 target two weeks ago.
We failed to hold the first golden zone from last weeks highs down to the prior weeks lows.
However, we still in a clear uptrend and holding trendline support for now.
Overalll, the structure is bullish unless we break below $11.54
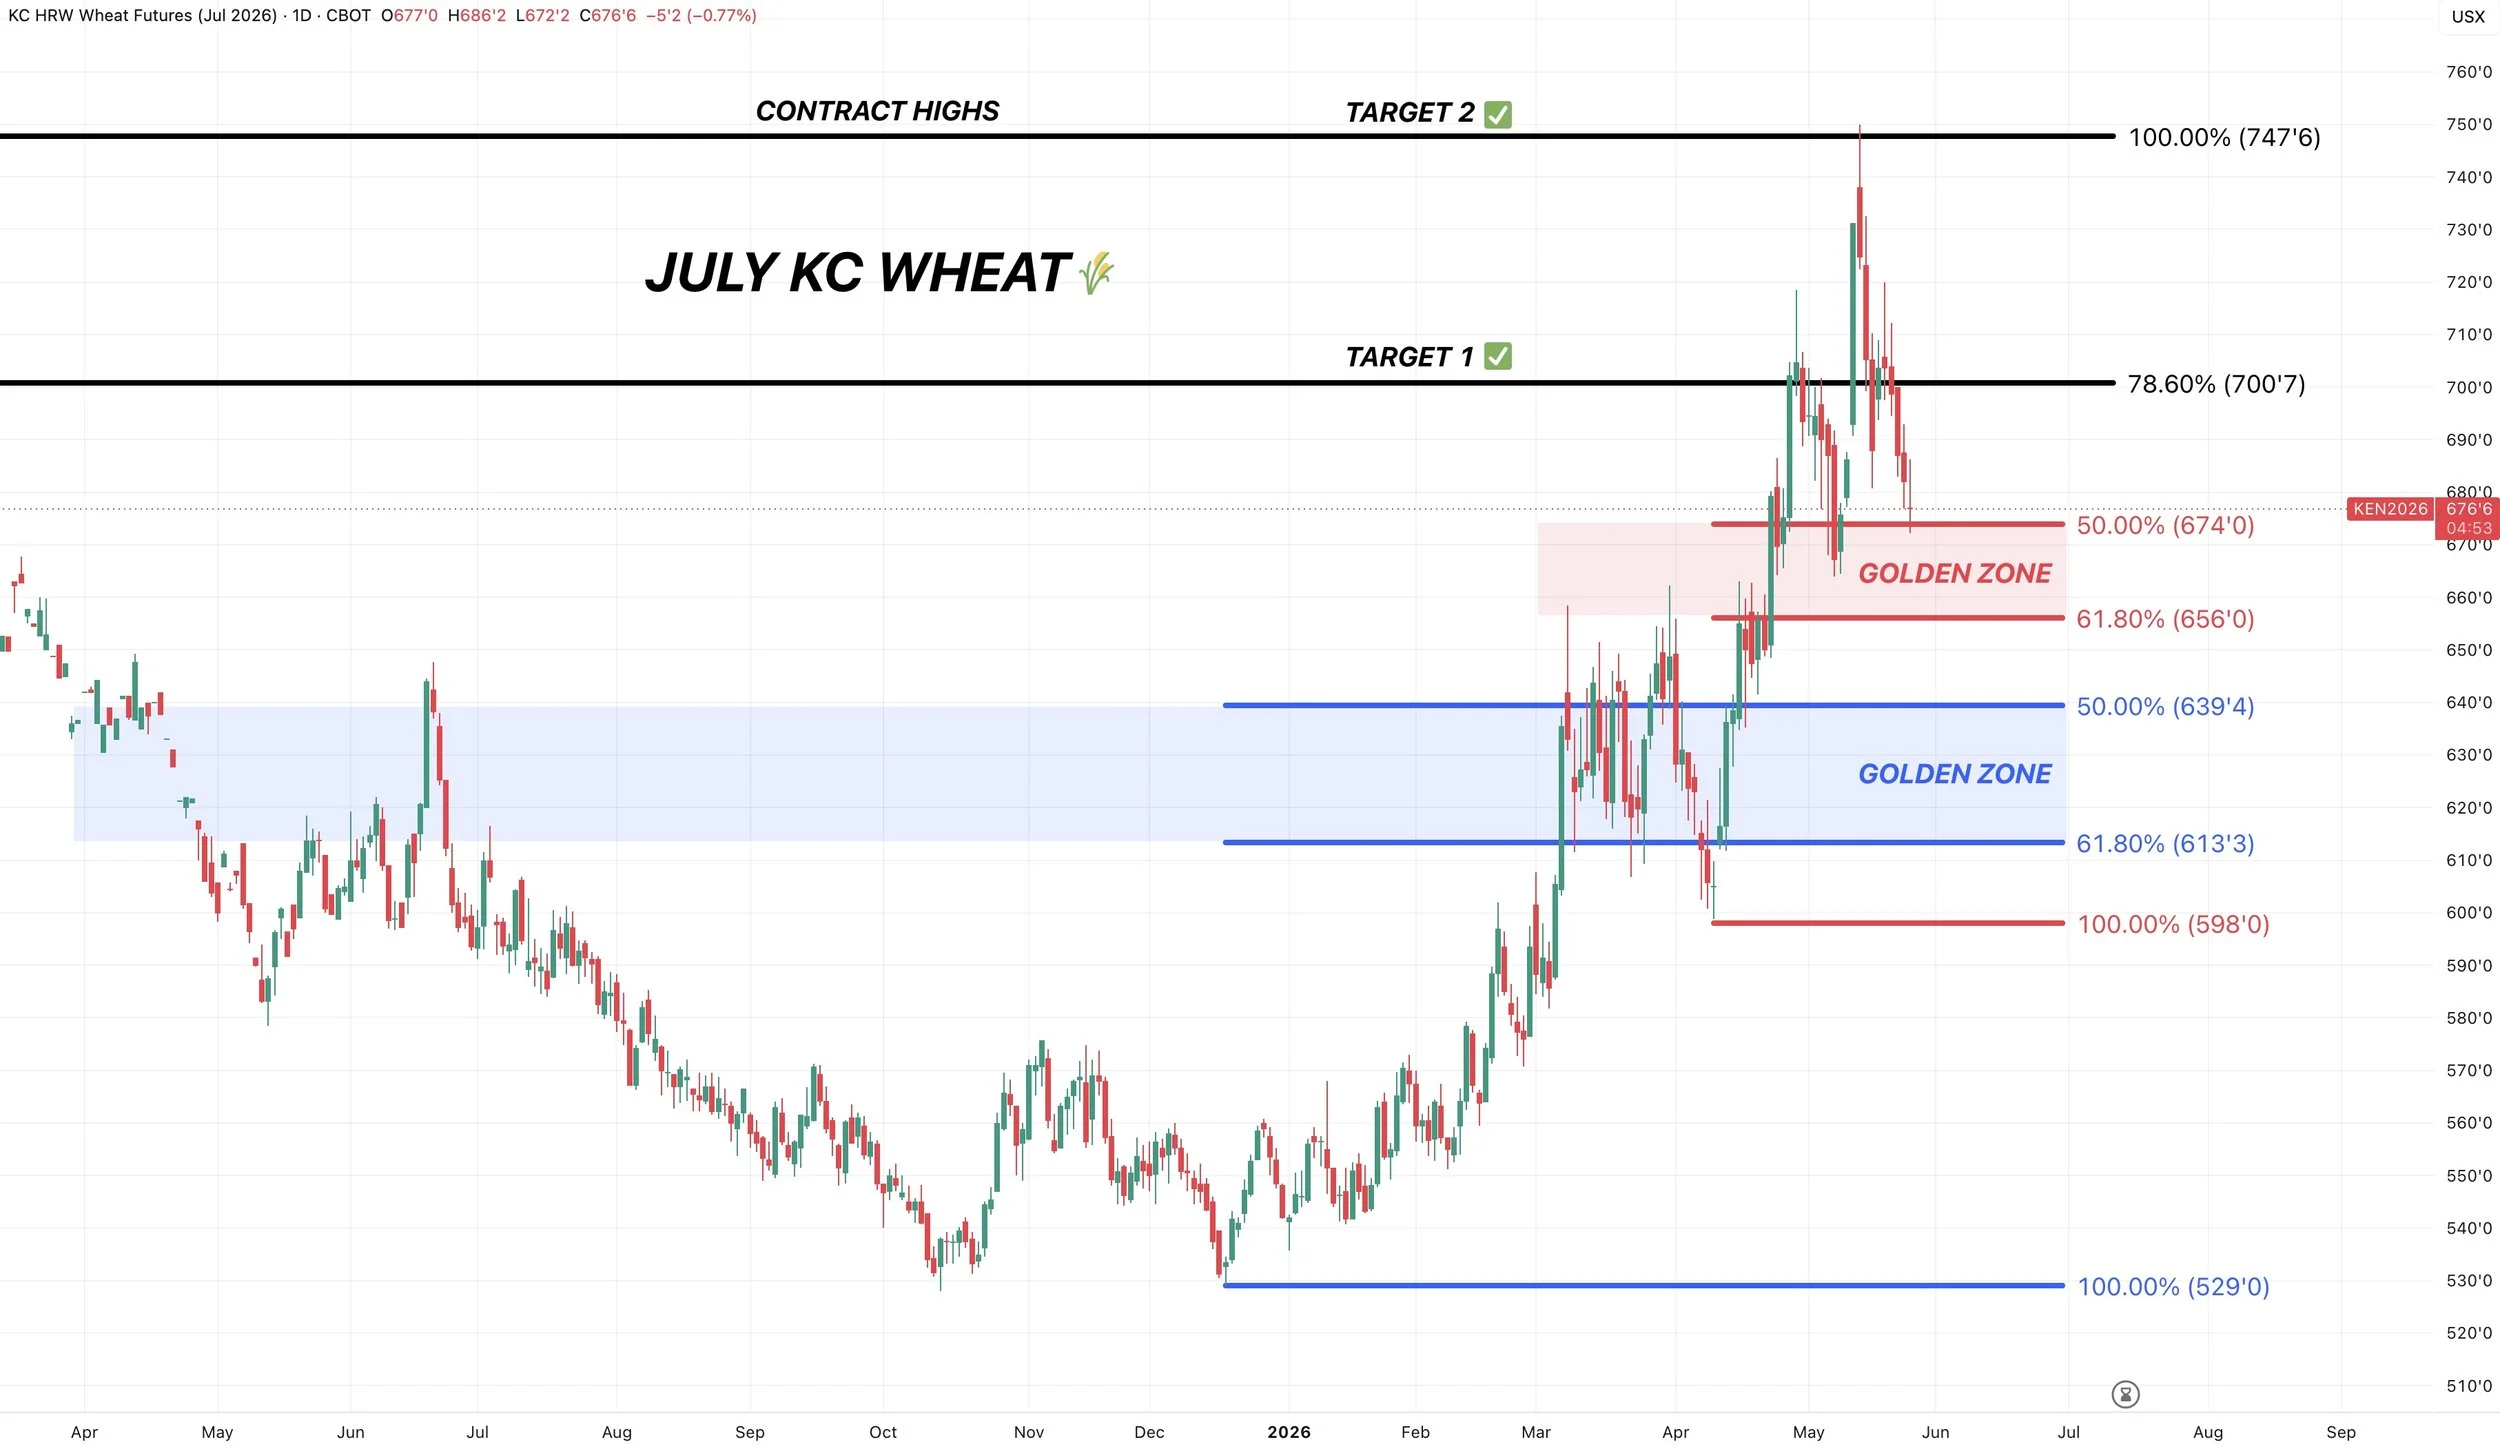
July KC Wheat 🌾
Approaching the first possible support zone. However, I am not trying to catch a falling knife.
We need to hold the red box to keep the short term trend higher.
If we fail the red box, we could make our way to the blue box.
We need to hold the blue box to keep the long term trend higher.
I don’t think we go below the blue box.
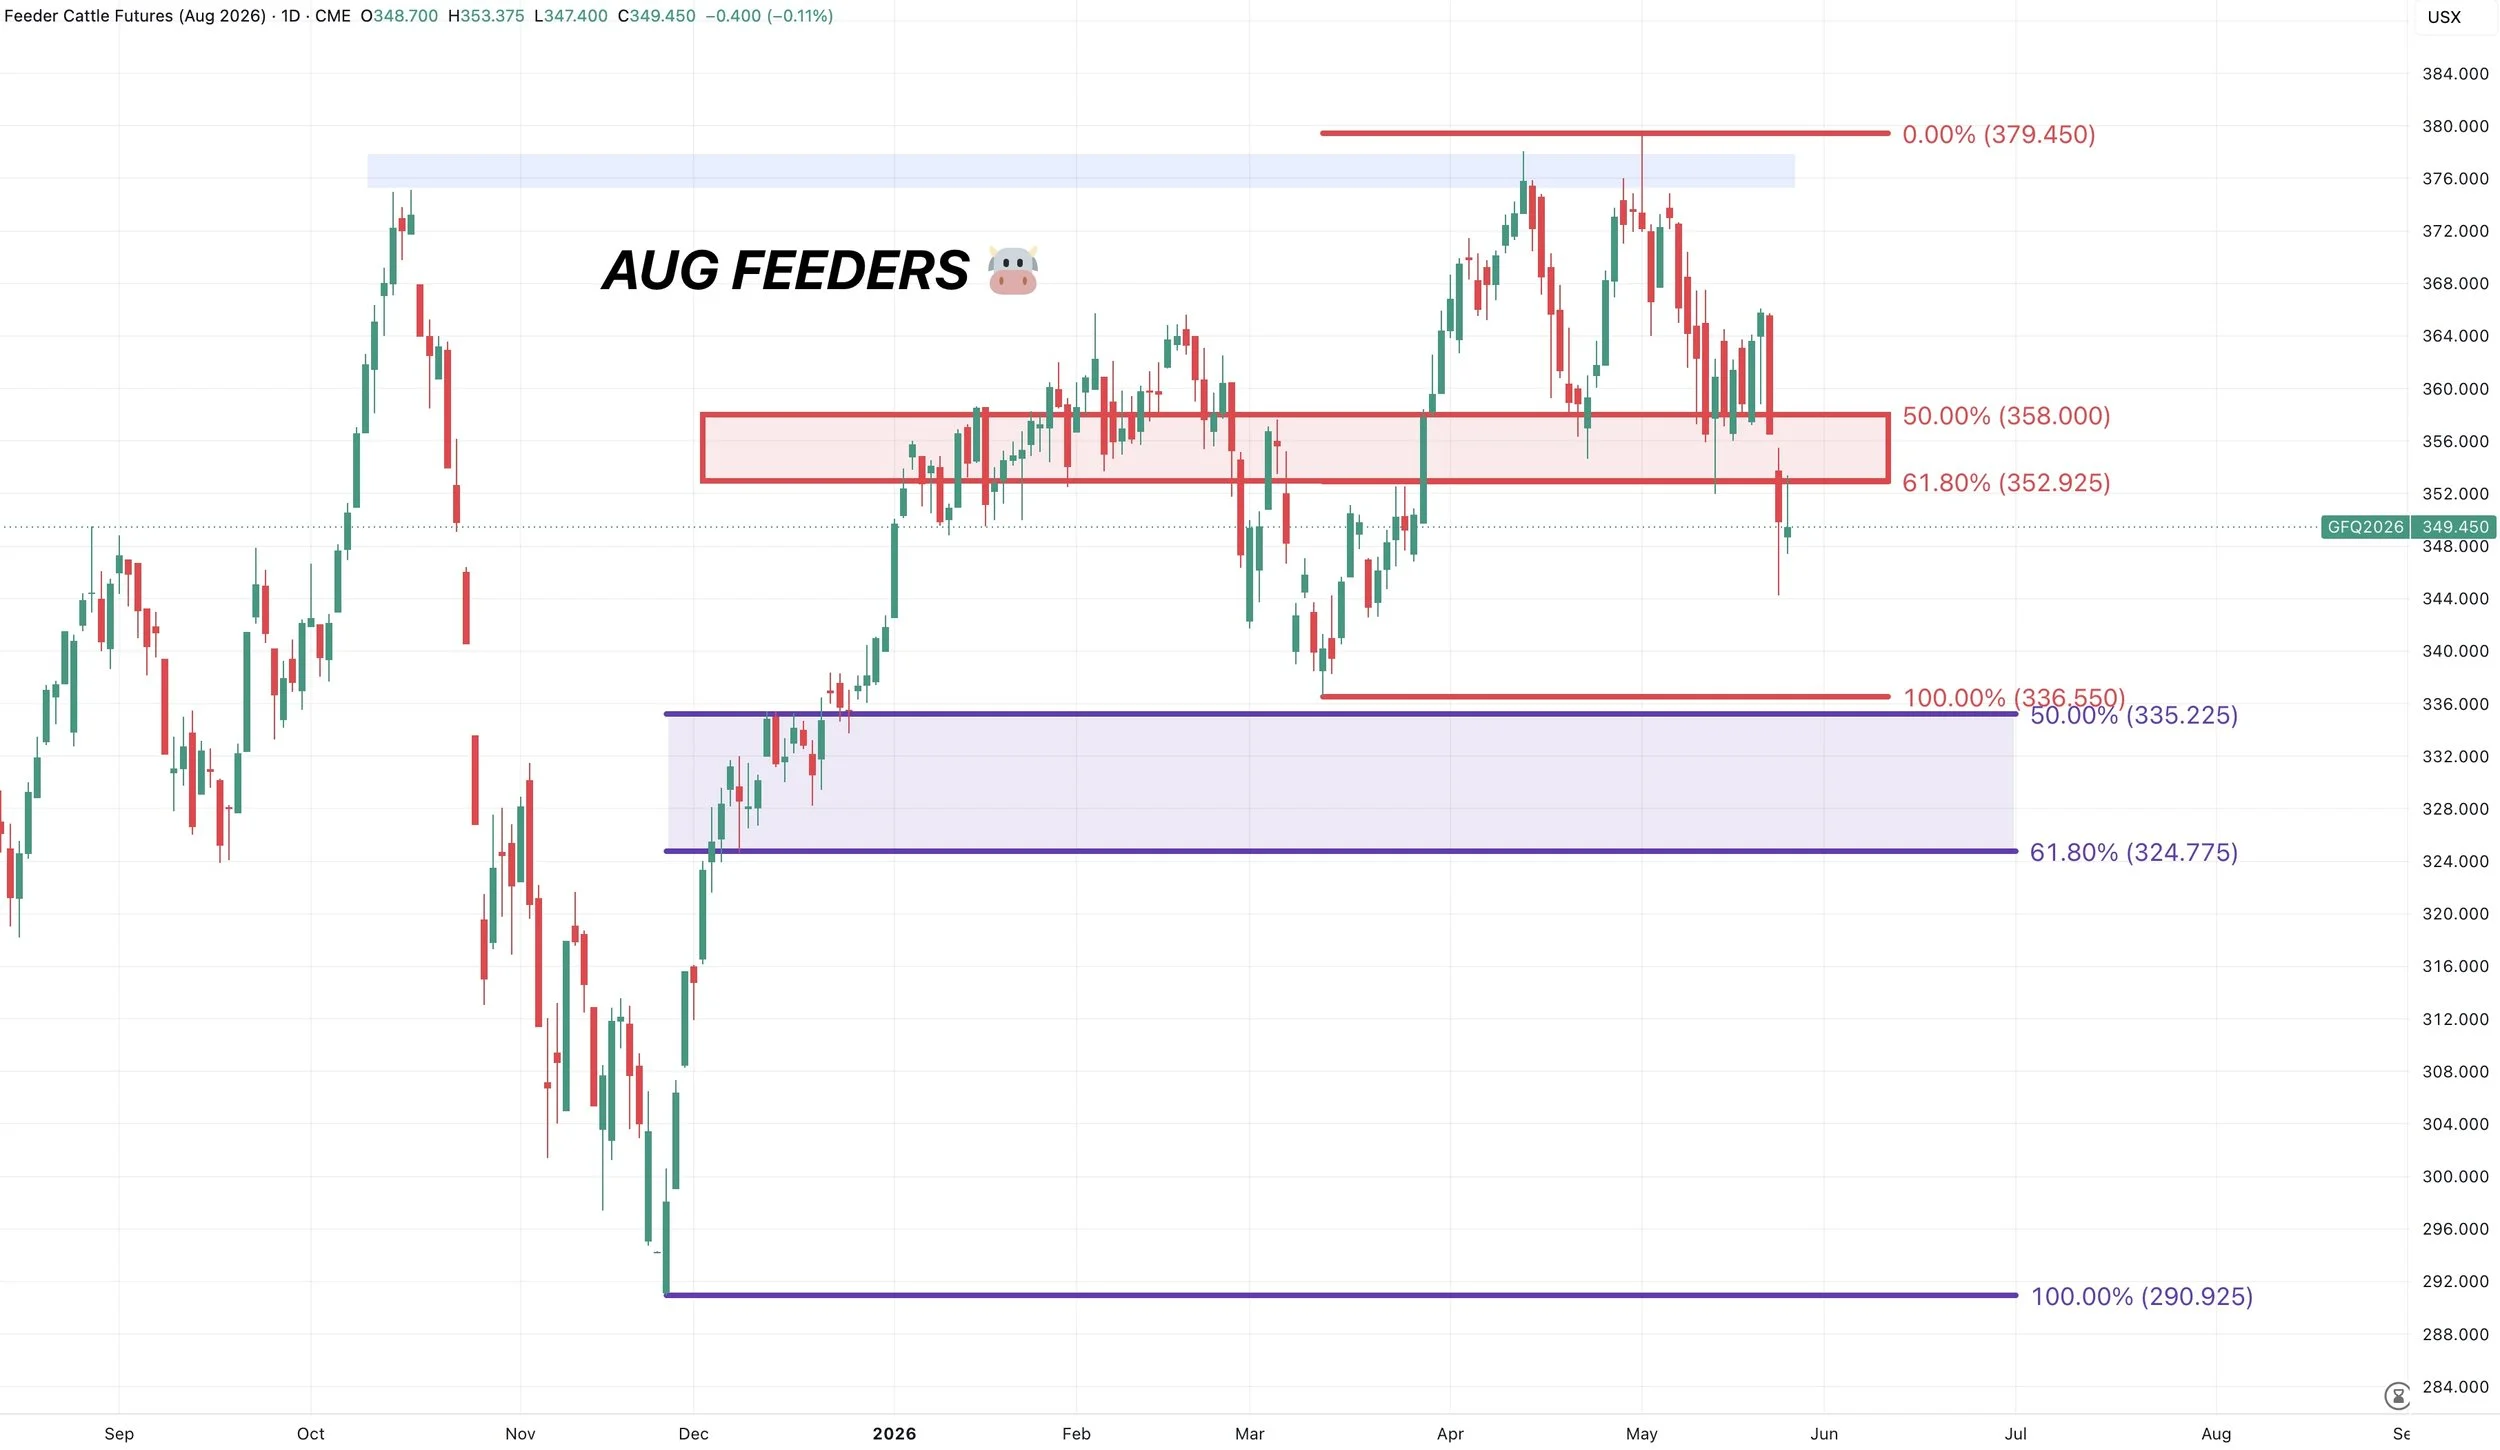
August Feeders 🐮
Broke the golden zone and key support.
Not a great look.
We could be in for some further technical selling given we broke key support.
Want to Talk?
Our phones are open 24/7 for you guys if you ever need anything or want to discuss your operation.
Jeremey & Office: (806)484-1214
Sebastian: (605)280-1186
Email: sfrost@dailymarketminute.com
Hedge Account
Interested in a hedge account? Use the link below to set up an account or give us a call.
Recent Signals
May 13th, 2026: 🌱
Soybean sell signal & hedge alert.
CLICK HERE TO VIEW
April 28th, 2026: 🌾
KC wheat sell signal & hedge alert.
CLICK HERE TO VIEW
April 27th, 2026: 🌽
Corn catch up sell signal.
CLICK HERE TO VIEW
April 10th, 2026: 🌽
Corn buy signal.
CLICK HERE TO VIEW
March 19th, 2026: 🌱
New crop soybeans signal & hedge alert.
CLICK HERE TO VIEW
March 9th, 2026: 🌱
Soybeans signal & hedge alert. Sent via text.
CLICK HERE TO VIEW
March 6th, 2026: 🌽 🌾
Corn & wheat sell signal & hedge alert.
CLICK HERE TO VIEW
March 3rd, 2026: 🌽
Old crop & new crop corn sell signal & hedge alert.
CLICK HERE TO VIEW
Feb 26th, 2026: 🌱
Old crop & new crop beans sell signal & hedge alert.
CLICK HERE TO VIEW
Feb 19th, 2026: 🌾
KC wheat sell signal & hedge alert.
CLICK HERE TO VIEW
Feb 6th, 2026: 🌽 🌱
Old crop corn & soybean sell signal & hedge alert.
CLICK HERE TO VIEW
Feb 4th, 2026: 🌱
Soybean sell signal & hedge alert.
CLICK HERE TO VIEW
Nov 17th, 2025: 🌱
Soybean sell signal & hedge alert.