
BLOOD BATH CONTINUES IN GRAINS
MARKET UPDATE
You can scroll to read the usual update as well. As the written version is the exact same as the video.
Timestamps for video:
Overview: 0:00min
Corn: 3:45min
Beans: 12:20min
Wheat: 14:45min
Cattle: 17:15min
Want to talk?
Office: (806)484-1214
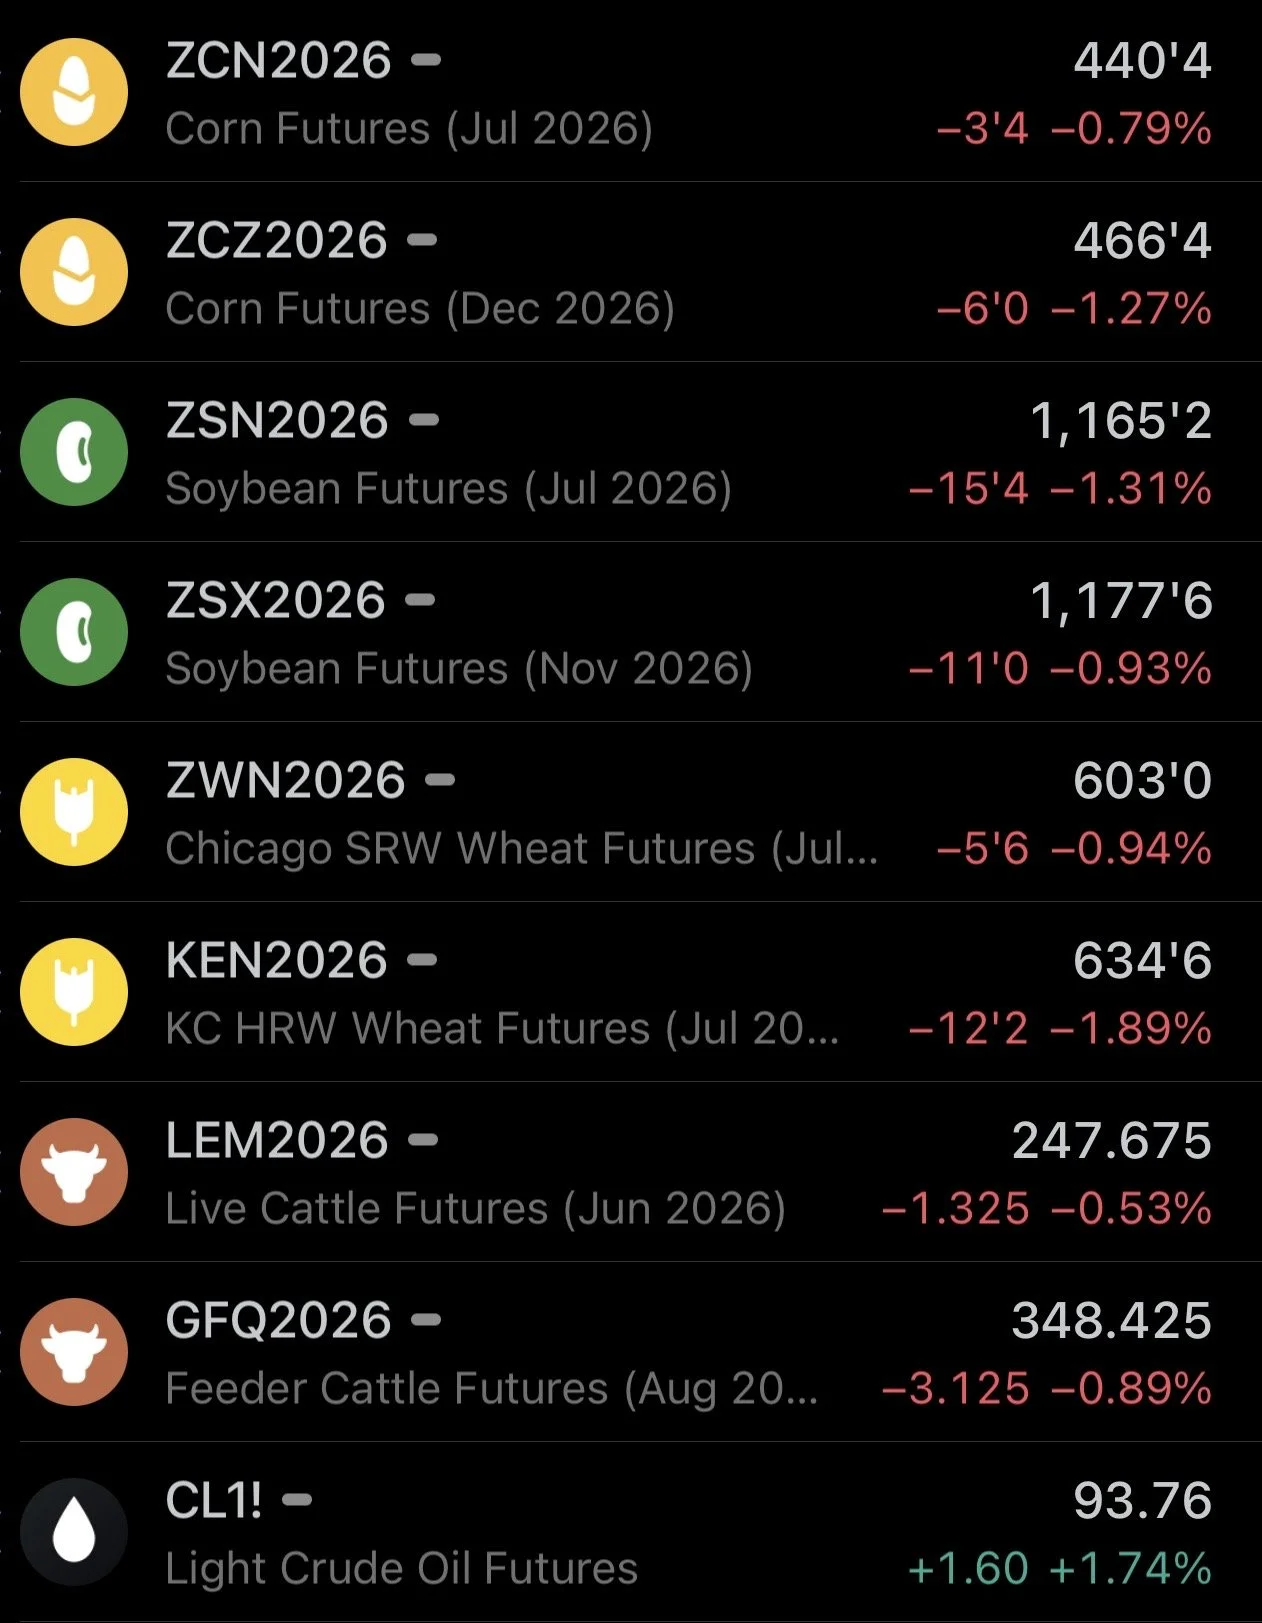
Futures Prices Close
Overview
The blood bath continues, as grains continue to remove both weather and war premium.
The market's focus has started to shift from the macro and war-driven headlines, to focusing more on the beneficial weather and simply a lack of friendly catalysts. As this is that time of year where if we don’t see a weather scare, we tend to struggle for the month of June and July.
Corn has been lower the last 8 of 10 days.
We'll take a look at a look at the charts, but corn specifically has broken below some very key levels.
Wheat has traded lower for 10 straight days in a row. Now lower the last 13 of 14 days.
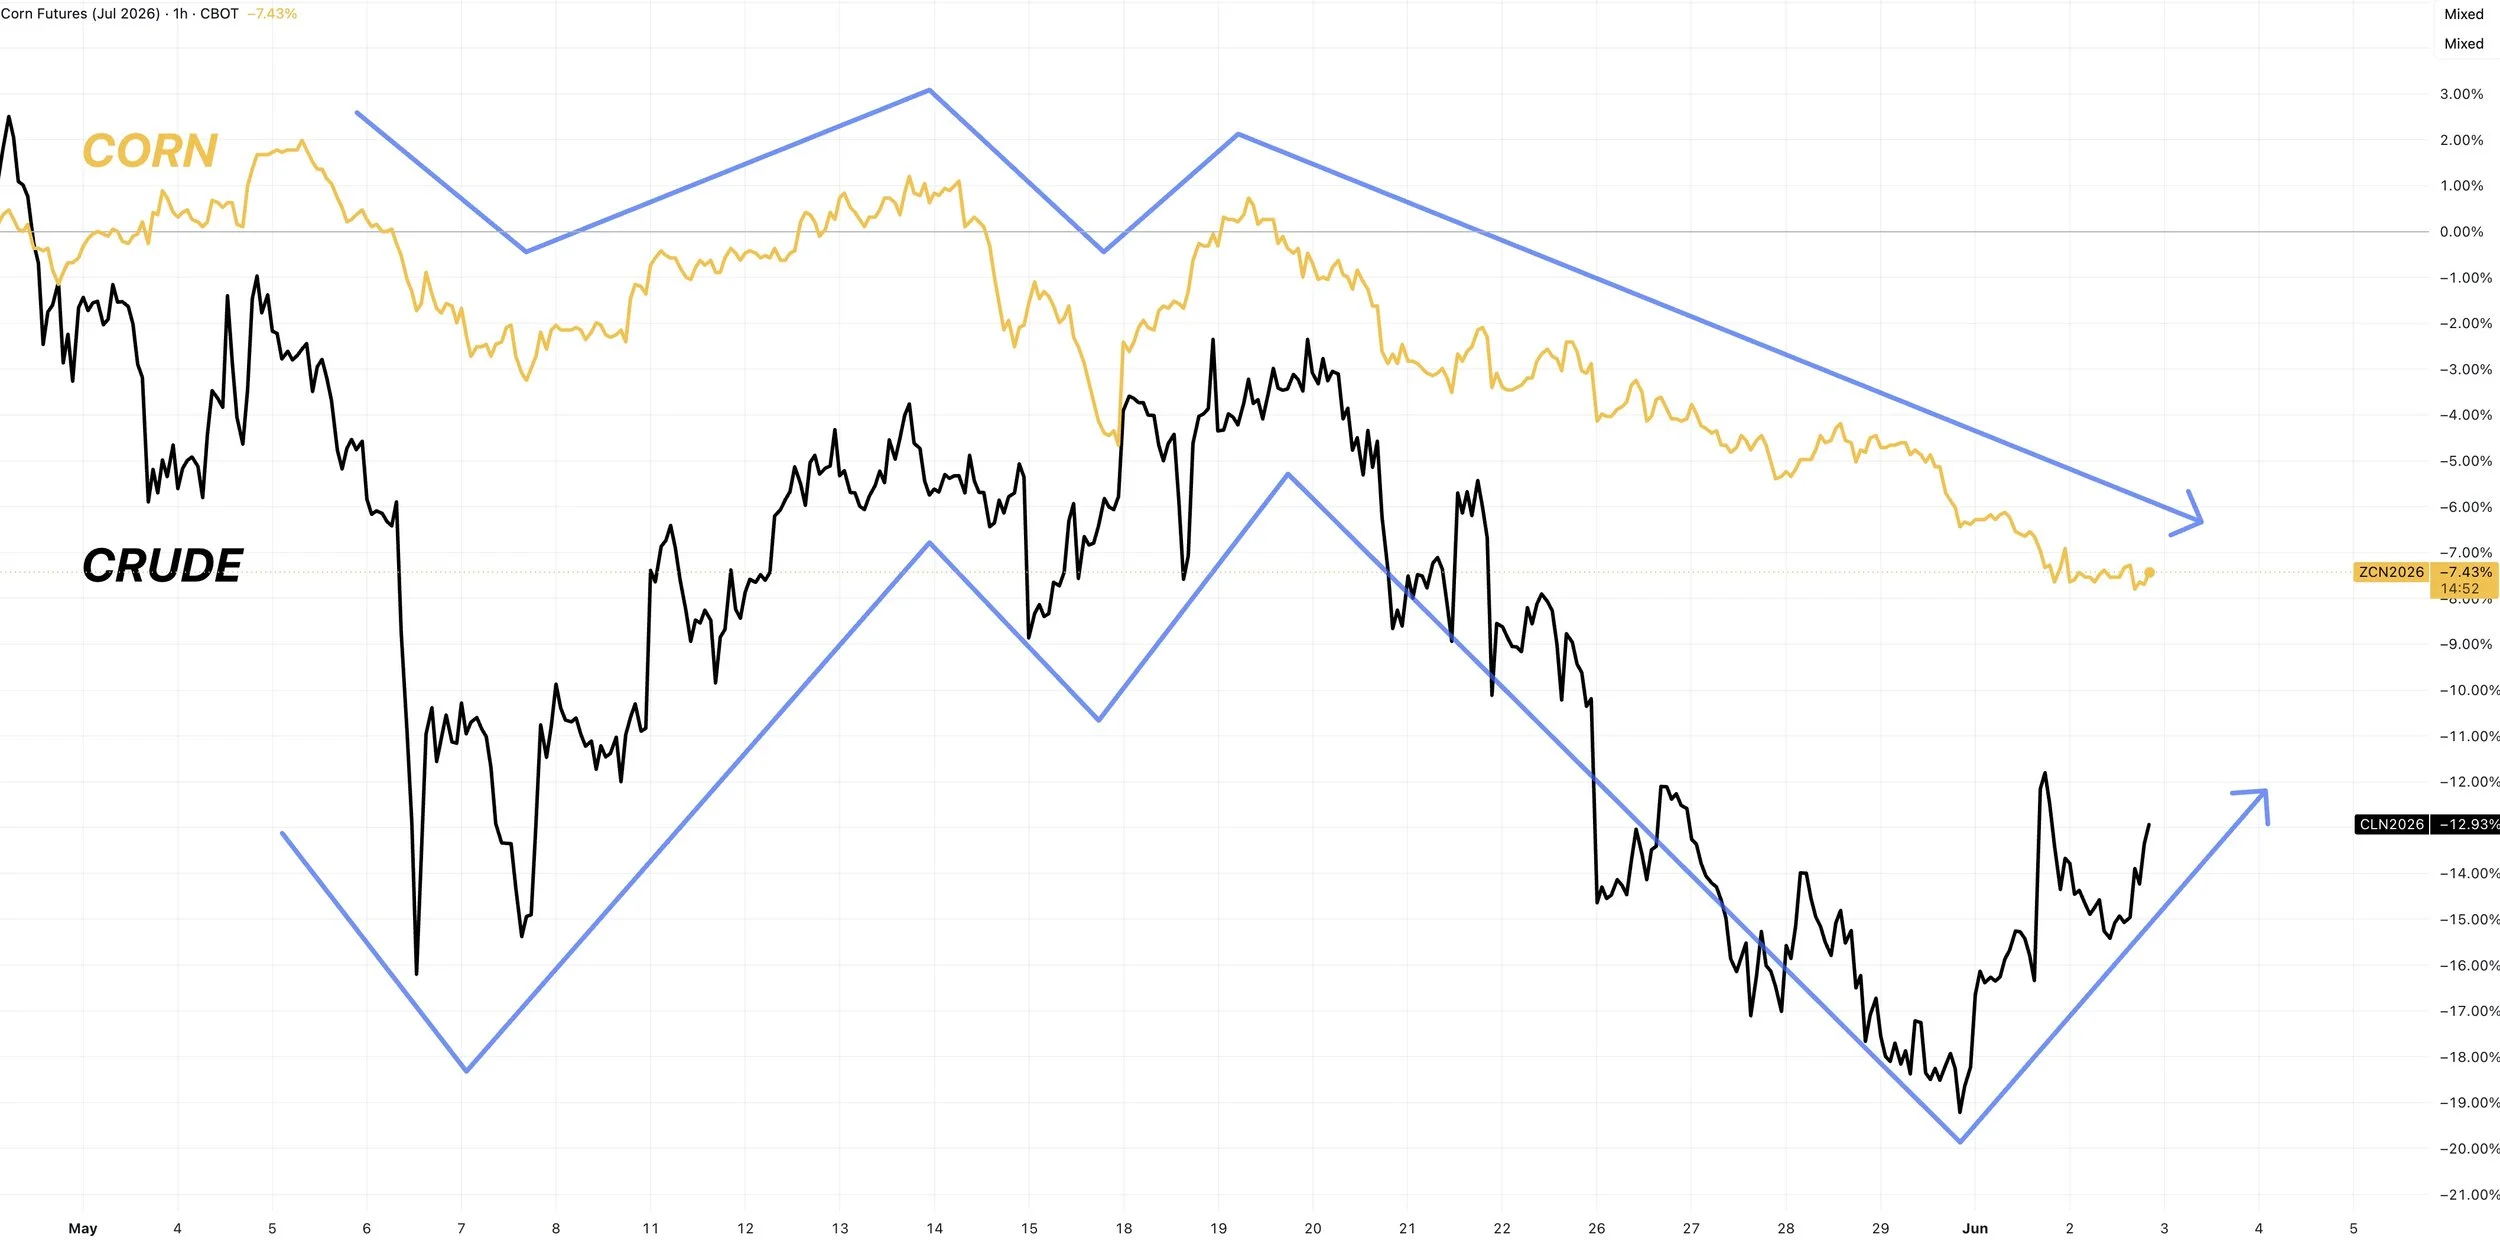
It looks like we might’ve partially divorced from crude oil for the time being.
Here is corn vs crude from May 1st to today.
We had been tracking very closely all month long.
The last two days crude put together a nice bounce, meanwhile corn continues to drop.
First Crop Conditions
Yesterday we got our first crop conditions for corn and soybeans.
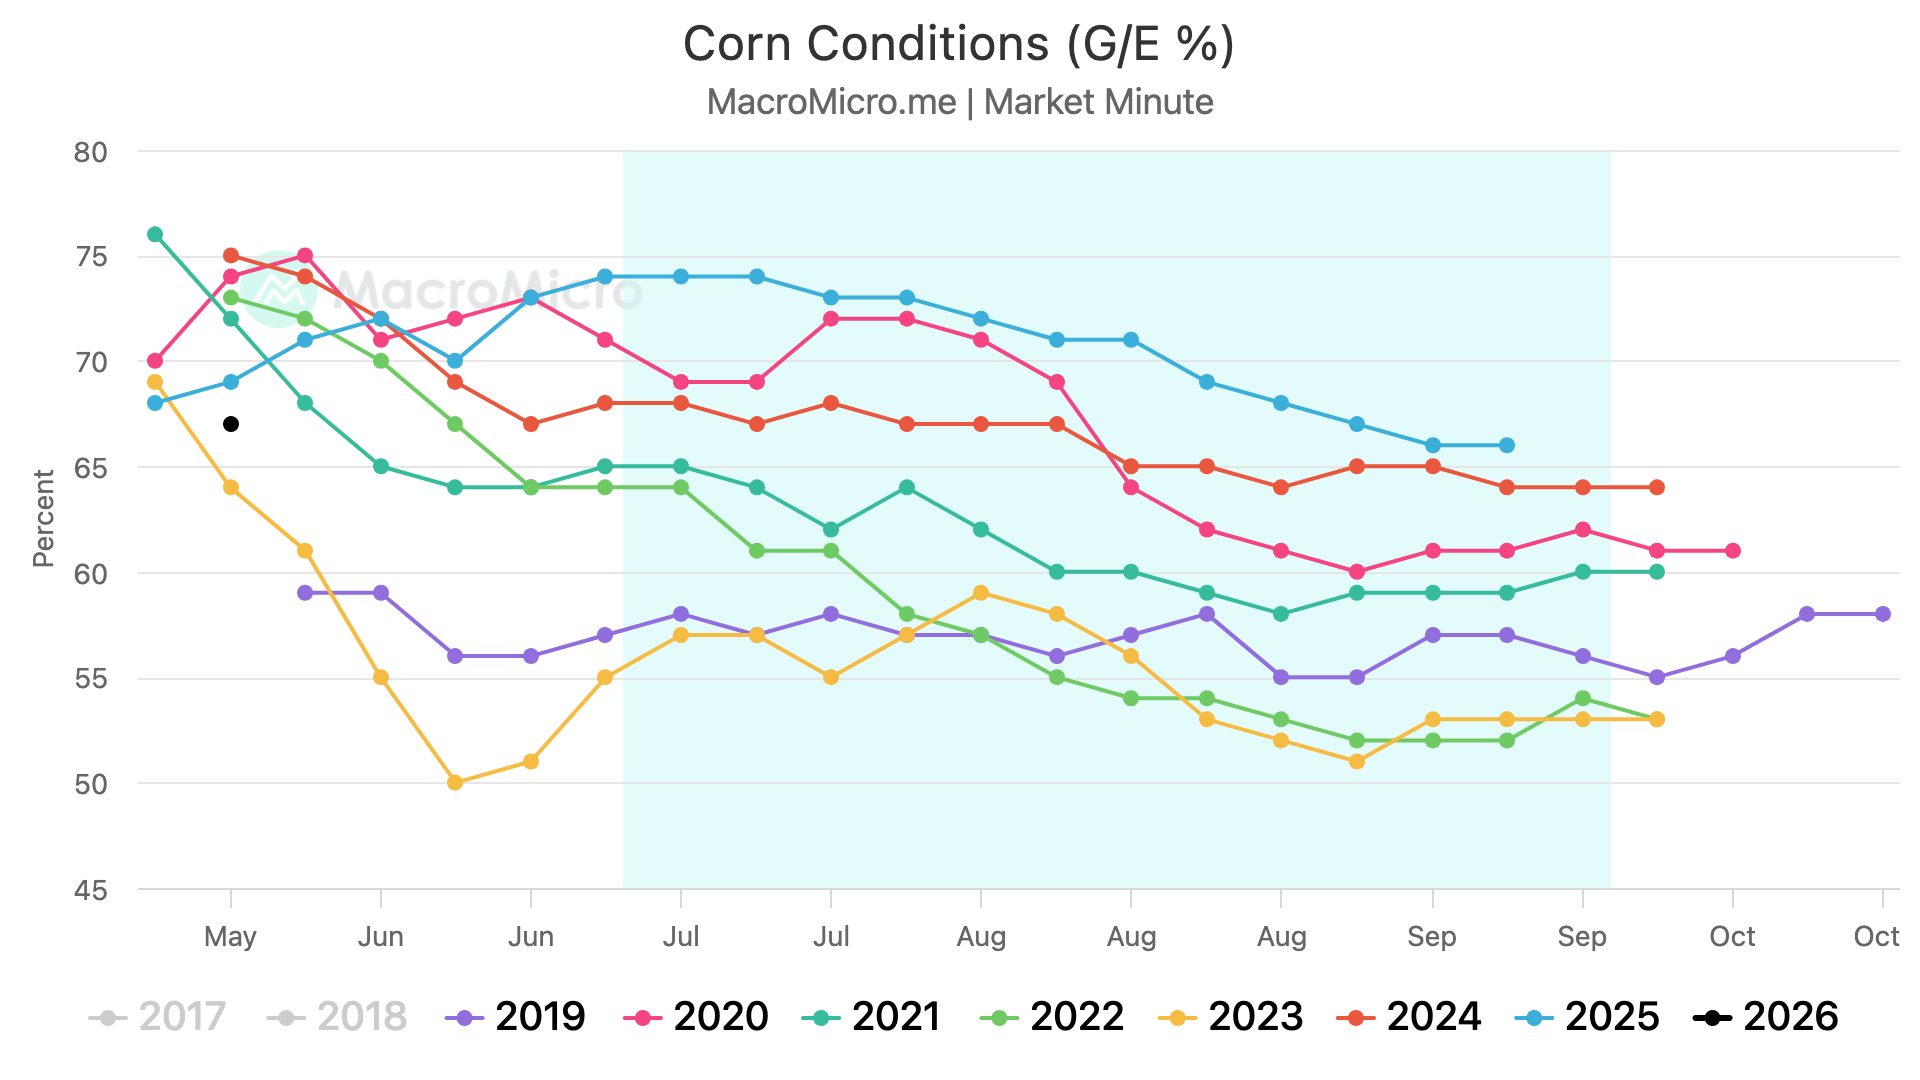
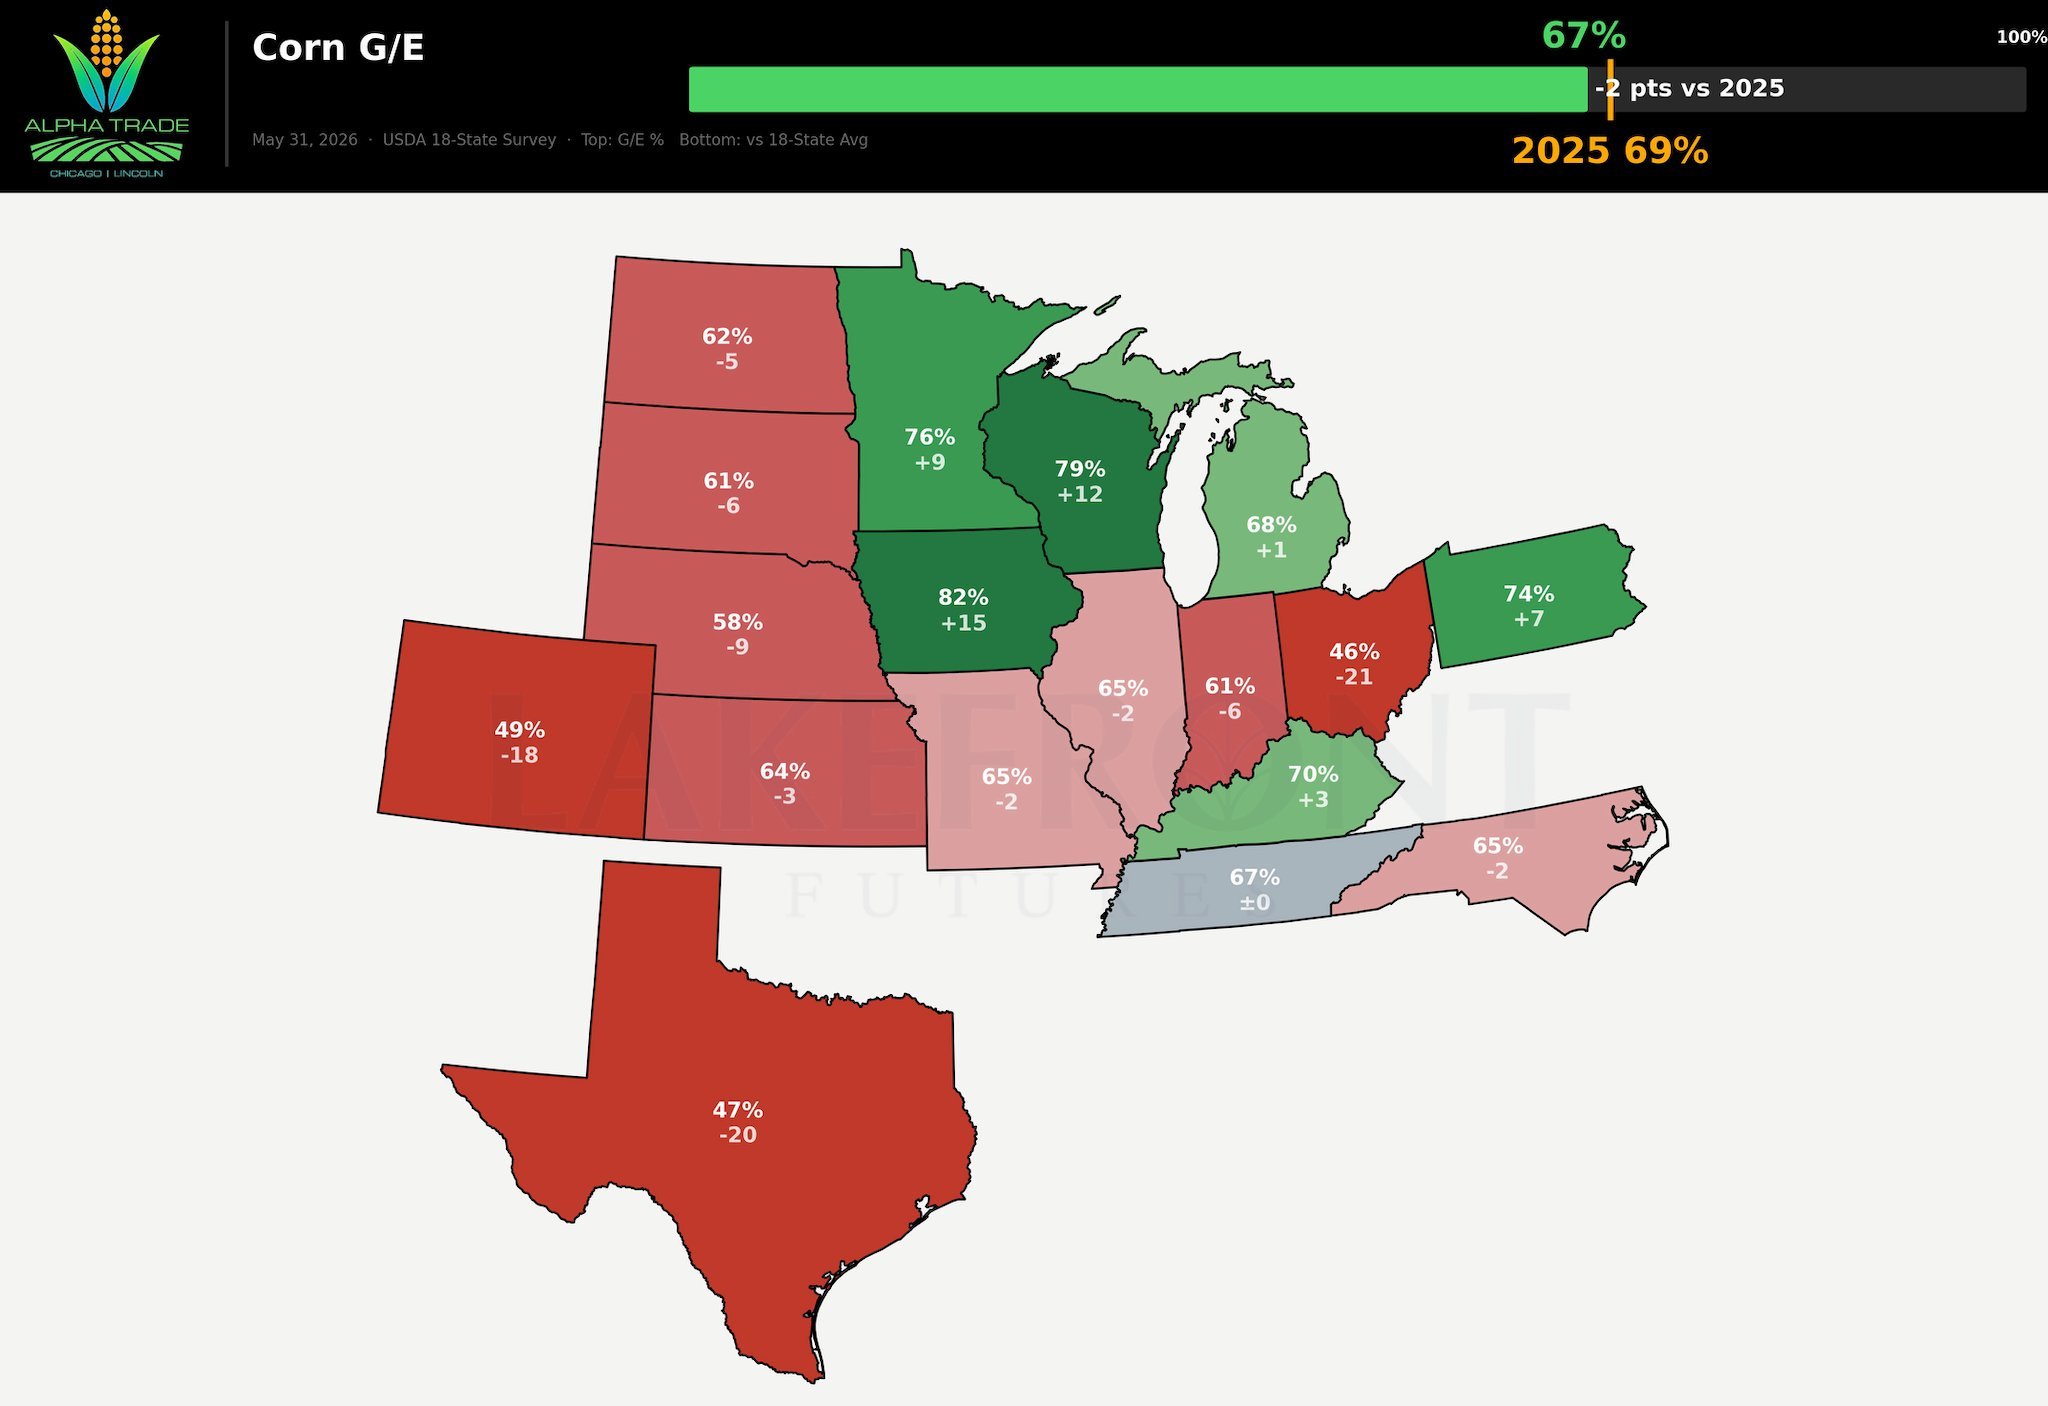
Corn
Good/Excellent: 67%
Trade Estimate: 70%
Last Year: 69%
5-Year Avg: 71%
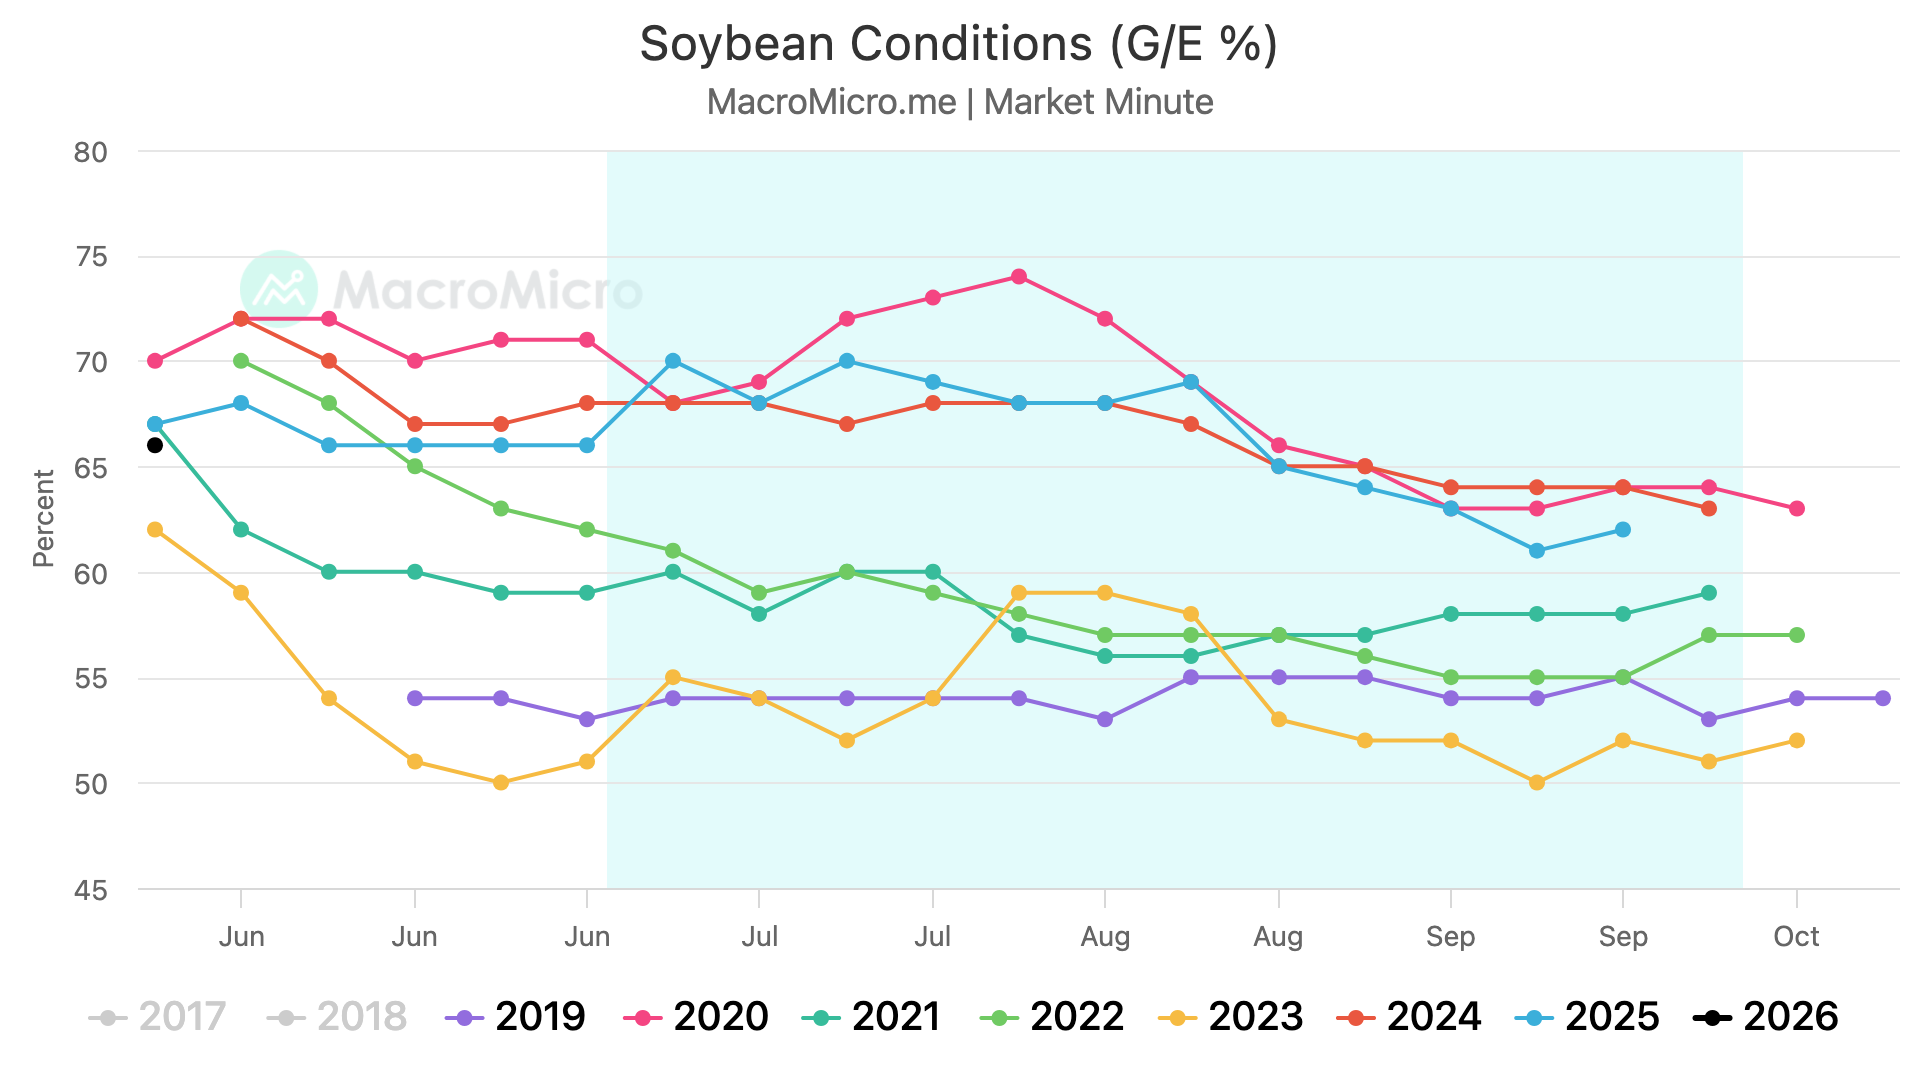
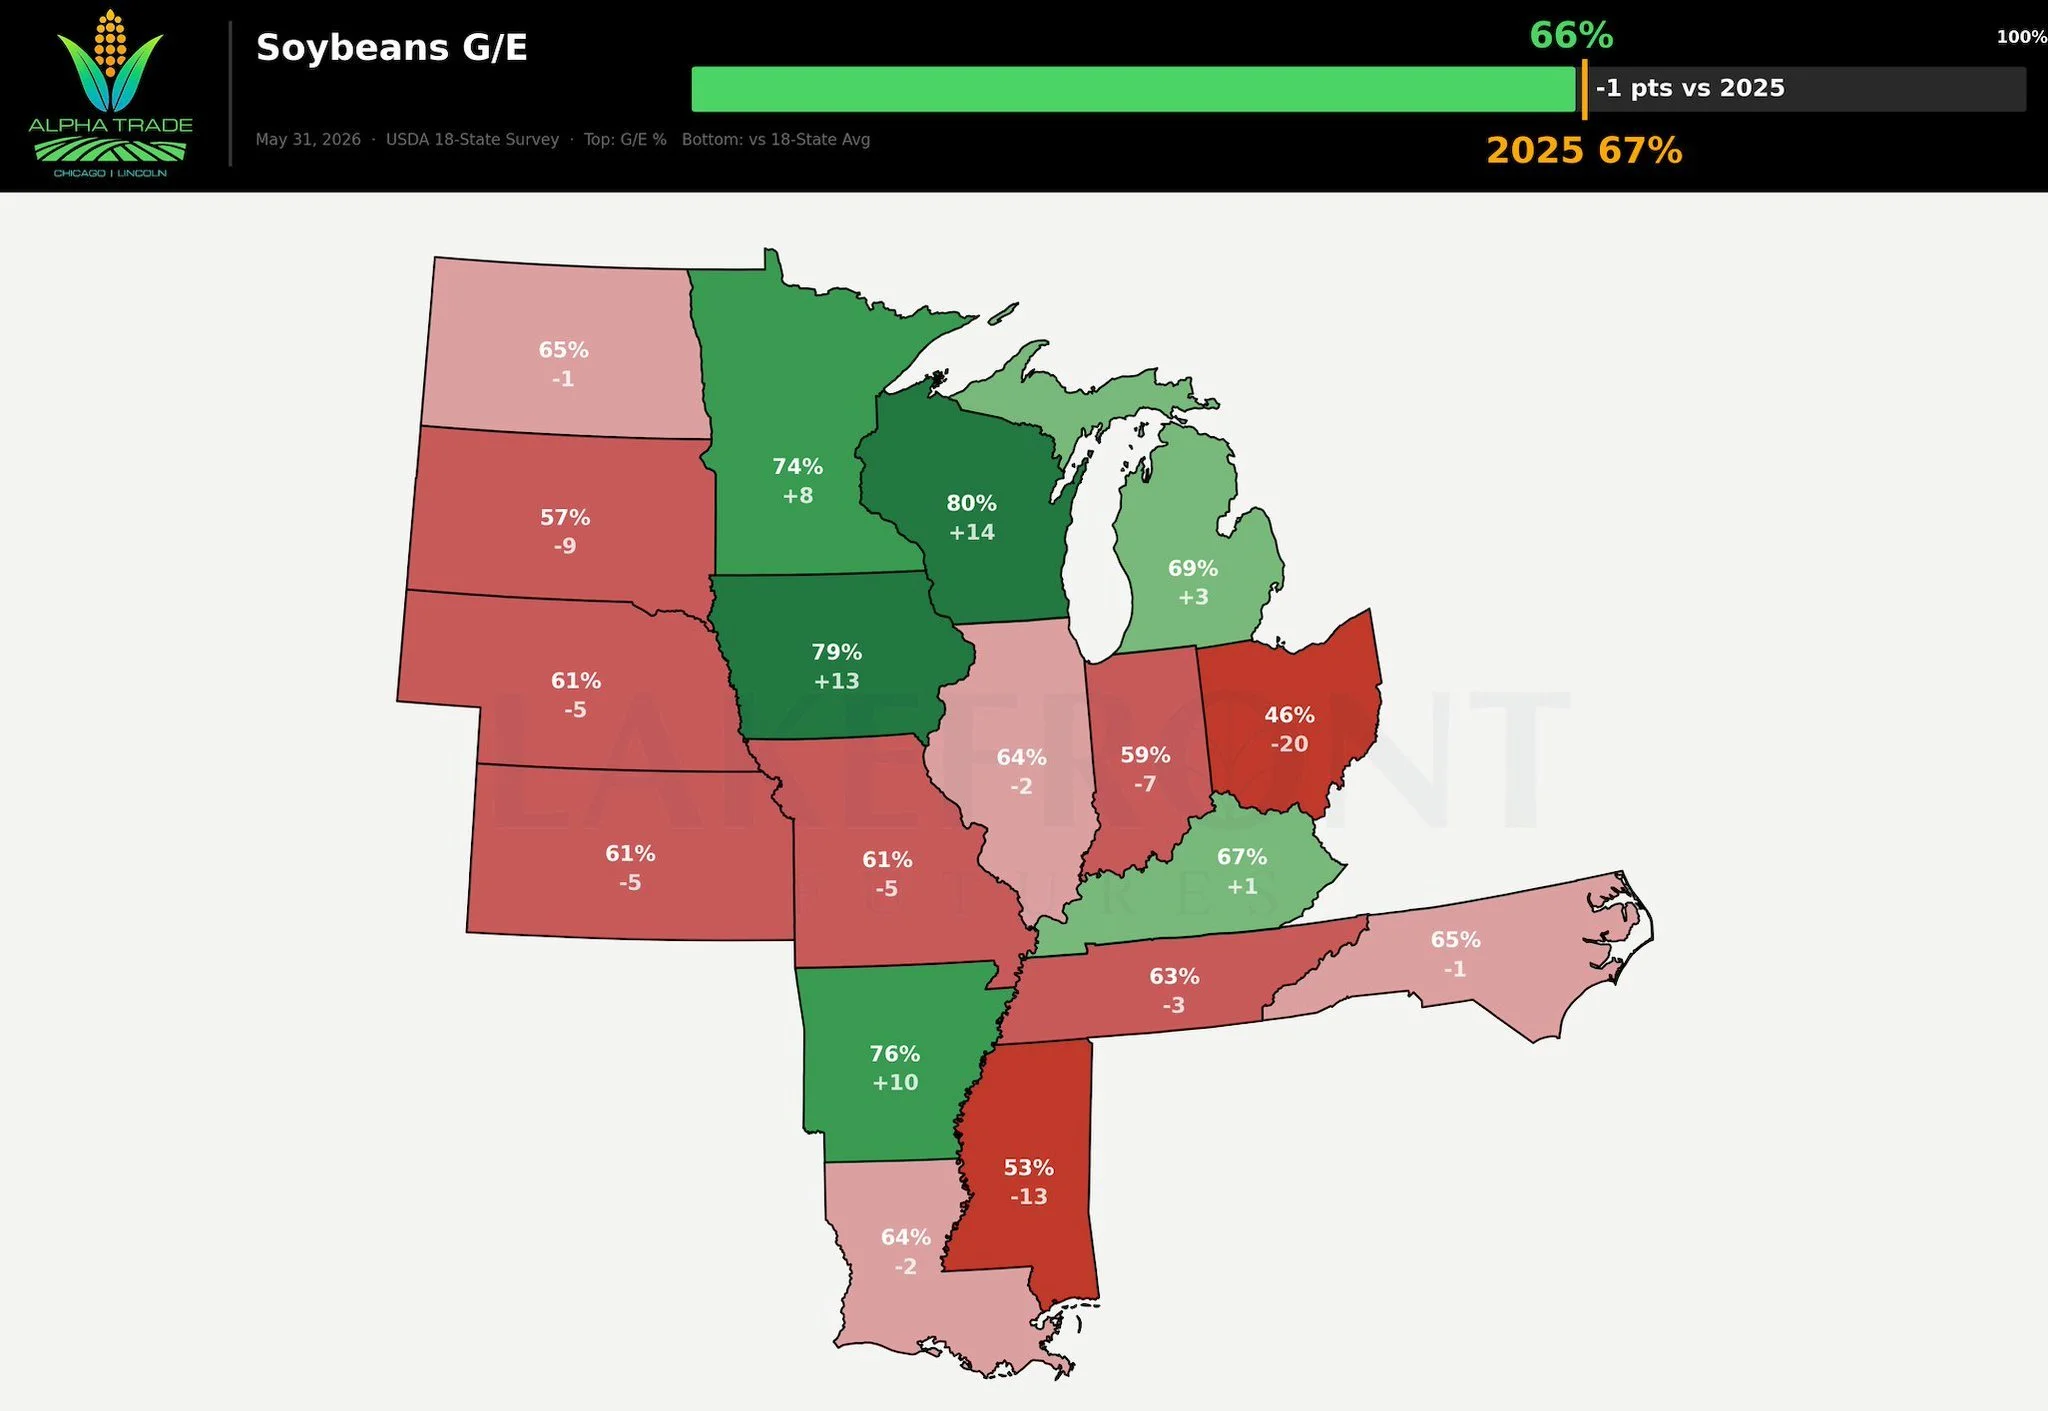
Beans
Good/Excellent: 66%
Trade Estimate: 68%
Last Year: 67%
5-Year Avg: 65%
So the ratings came in slightly worse than the trade was expecting, but this wasn’t enough put any excitement into the market as the forecasts appear non-threating for now.
How do these ratings stack up vs prior years?
First for corn.
This is the worst intial rating in the last 4 of 5 years.
Since 2019, this starting rating is only better than 2023 and 2019, but isn’t drastically worse than those other years either.
Crop ratings have a tendency to drop through summer, although last year was the first time we've actually seen crop ratings improve until July.
Here is soybeans.
Nothing too noteworthy.
As we sit right around in the middle of the pack.
State by State Ratings
Here is a state by state break down for corn that shows each states ratings and how it stacks up vs last year.
There are some pretty wide variations.
States such as Iowa, Minnesota, and Wisconsin have some great ratings.
All around double digits better than last year.
Those three are pretty much carrying the rest of the states.
On the other hand states such as Ohio and Indiana aren’t doing great.
Ohio is -21% worse than it was last year. As they've continued to be pummled with rain.
Then you of course have those states to the west that have struggled with drought for a while.
Chart from Darrin Fessler (@DDFalpha on X)
Here is soybeans.
Same story here.
Iowa, Minnesota, and Wisconsin are carrying the national average.
Most states outside of them are worse than last year.
With Ohio being the one who is far worse than last year (-20%).
Chart from Darrin Fessler (@DDFalpha on X)
Weather
The next few days don’t offer a crazy amount of rain the corn belt.
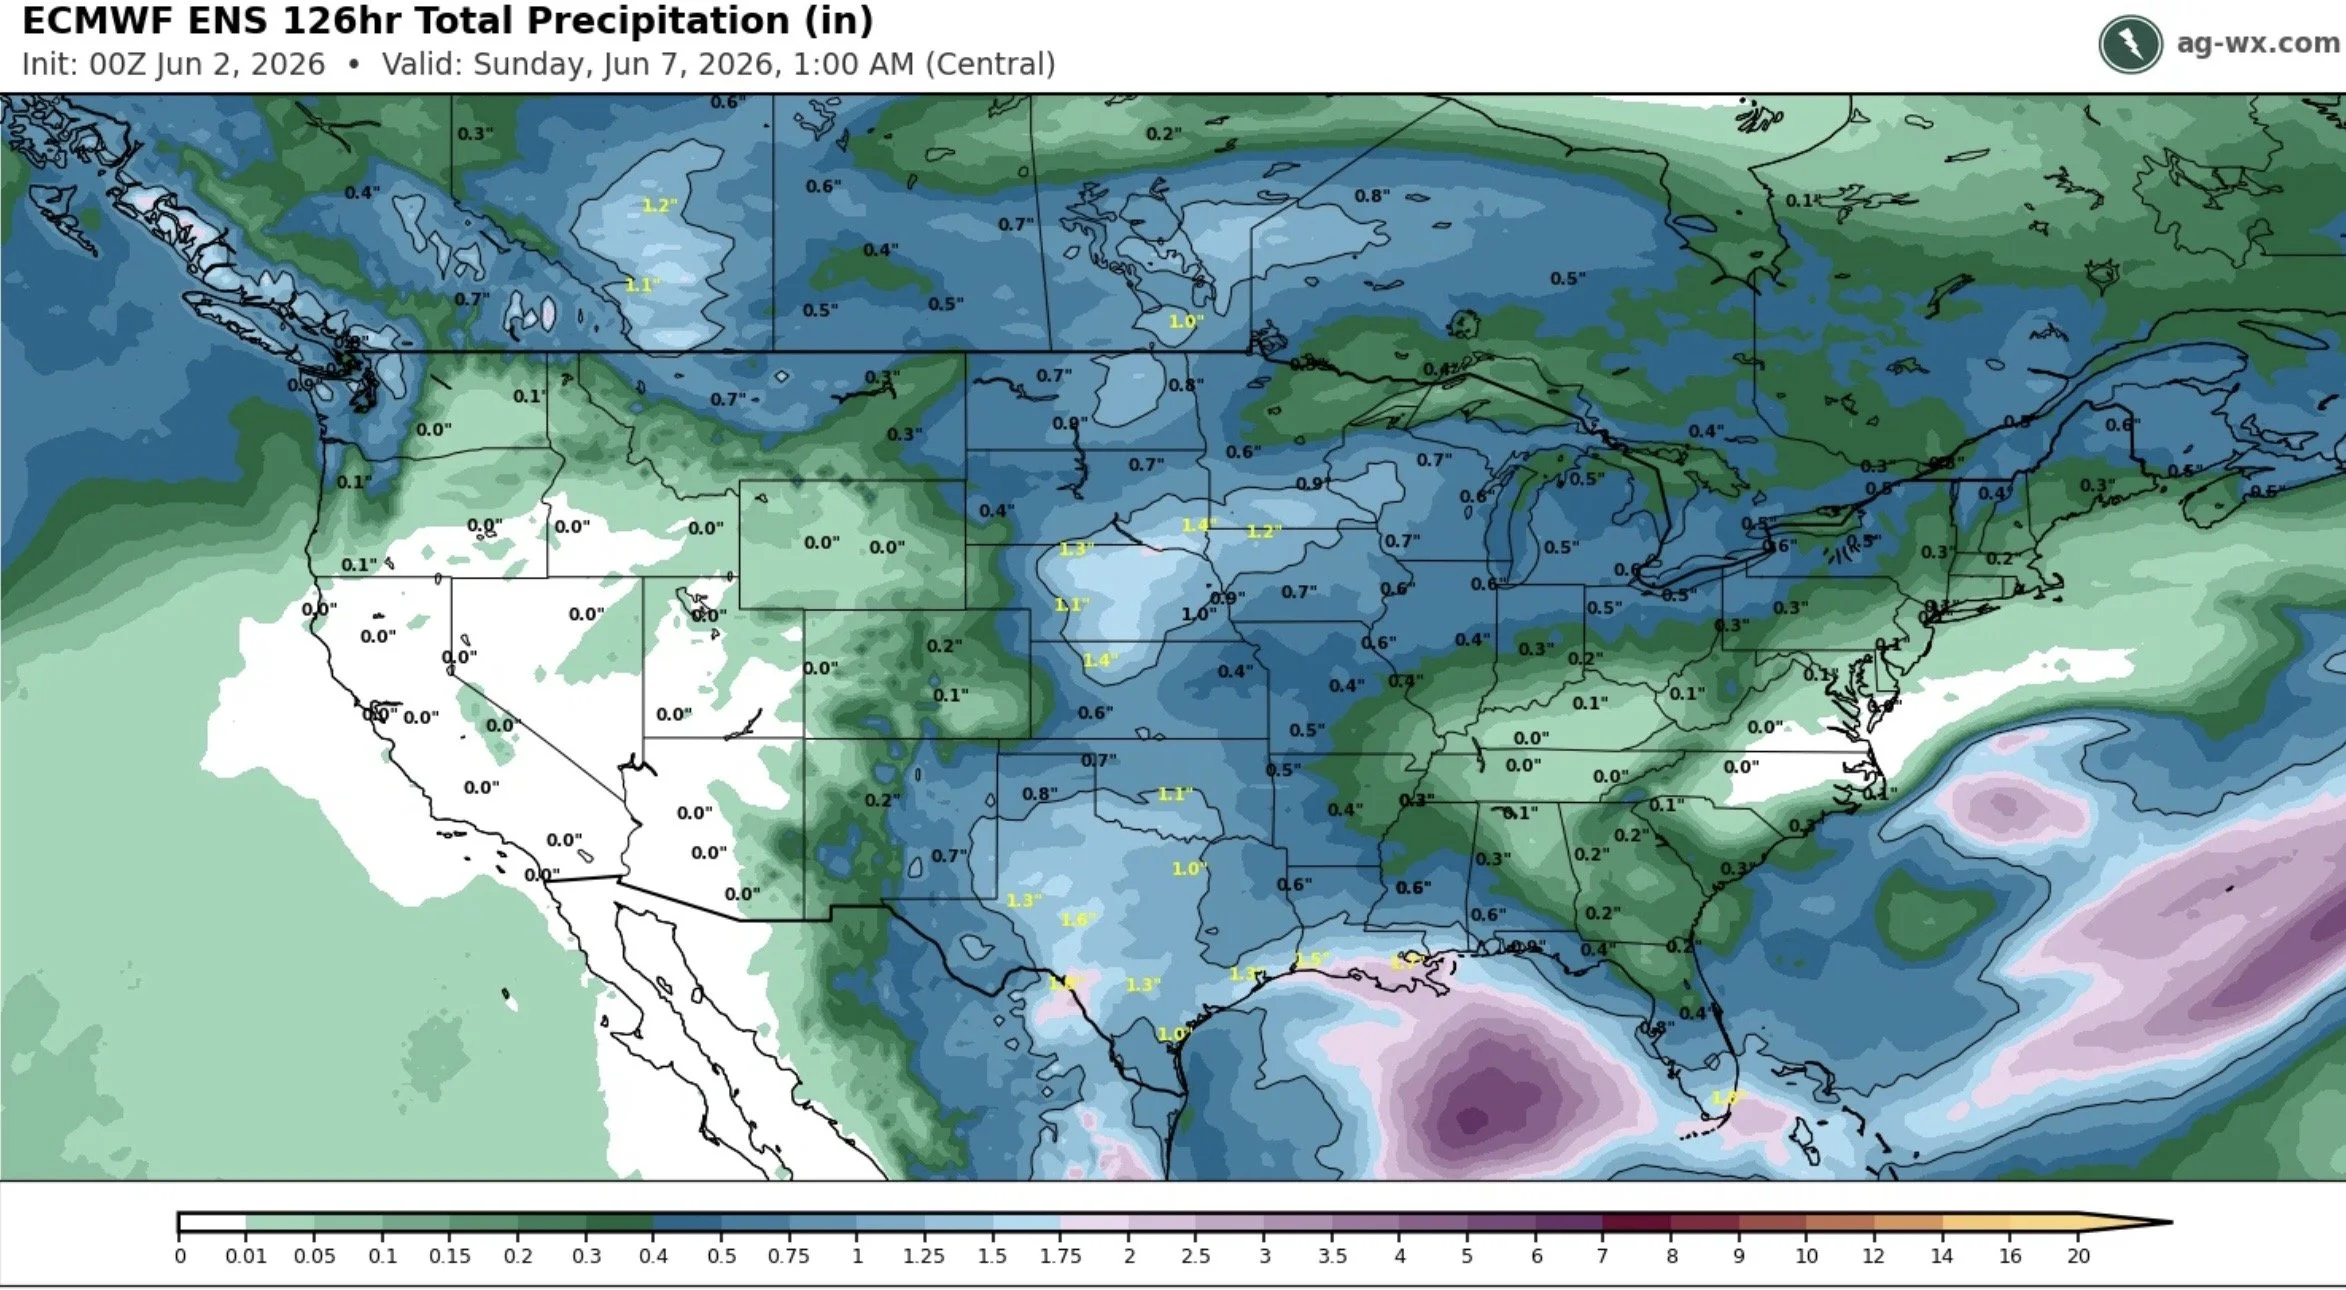
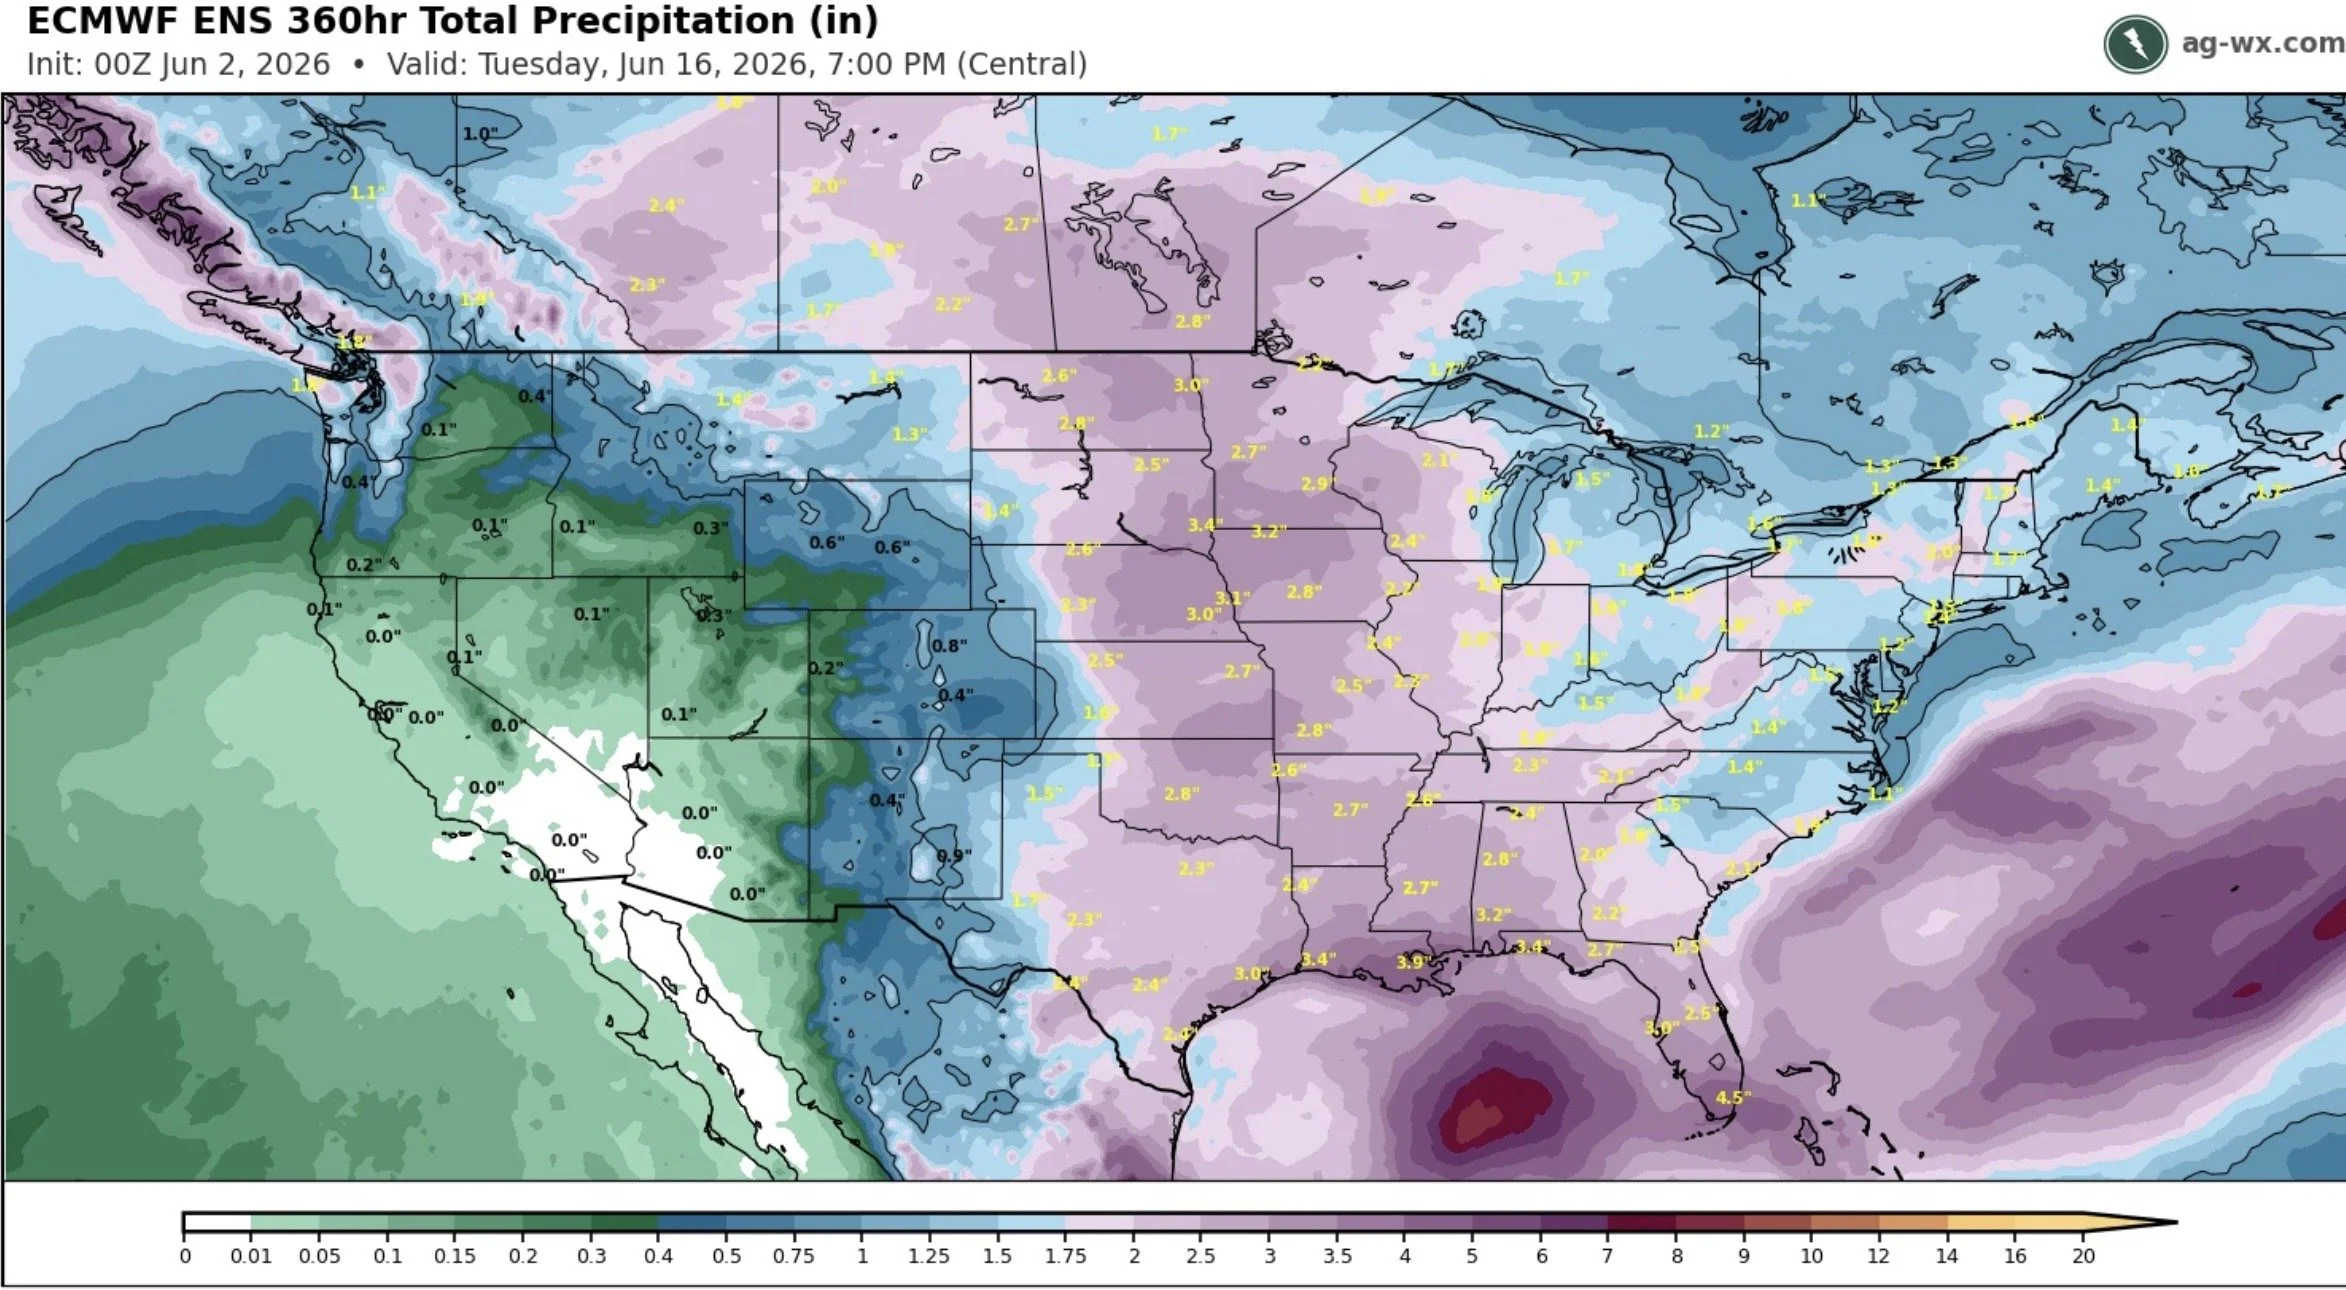
However, as you extend the forecast out to the middle of June, things do look pretty wet.
This was a large part of the weakness to start the week.
The market sees rain, so it views it as bearish.
As there are no real threats.
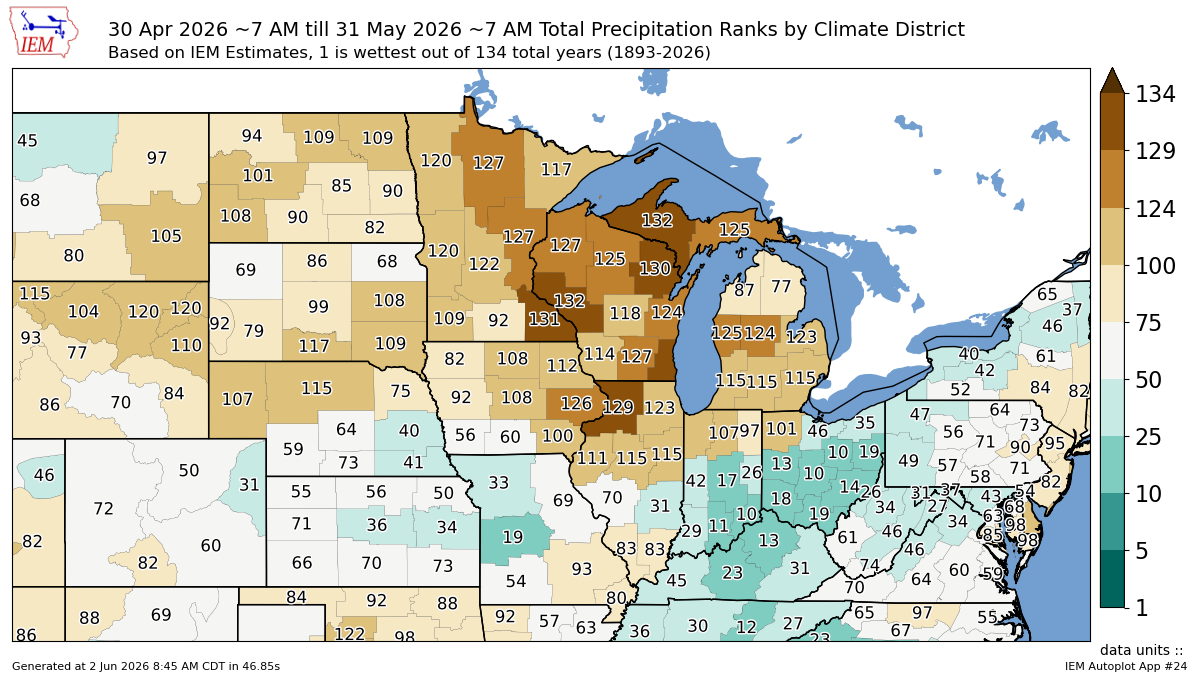
Here is the month of May's precip ranks.
The central to northern corn belt could use some rain.
Then you have areas such as Ohio and southern Indiana who could use a breather from the rain.
Hence why Ohio has the worst crop ratings of any state. They've been getting too much rain.
Too much rain usually isn’t going to result in a weather rally like a drought story will.
Damage to production from rain is something that won’t show up until later down the road.
So for now, rain is bearish. If they continue to throw rain into the forecasts, it might be hard to put together or hold a major rally.
Today's Main Takeaways
Corn
There is rain in the forecast.
We've already priced in most of that war premium.
Seasonally as I talked about for a long time, this was the time of year where we post our highs before heading lower into July and August.
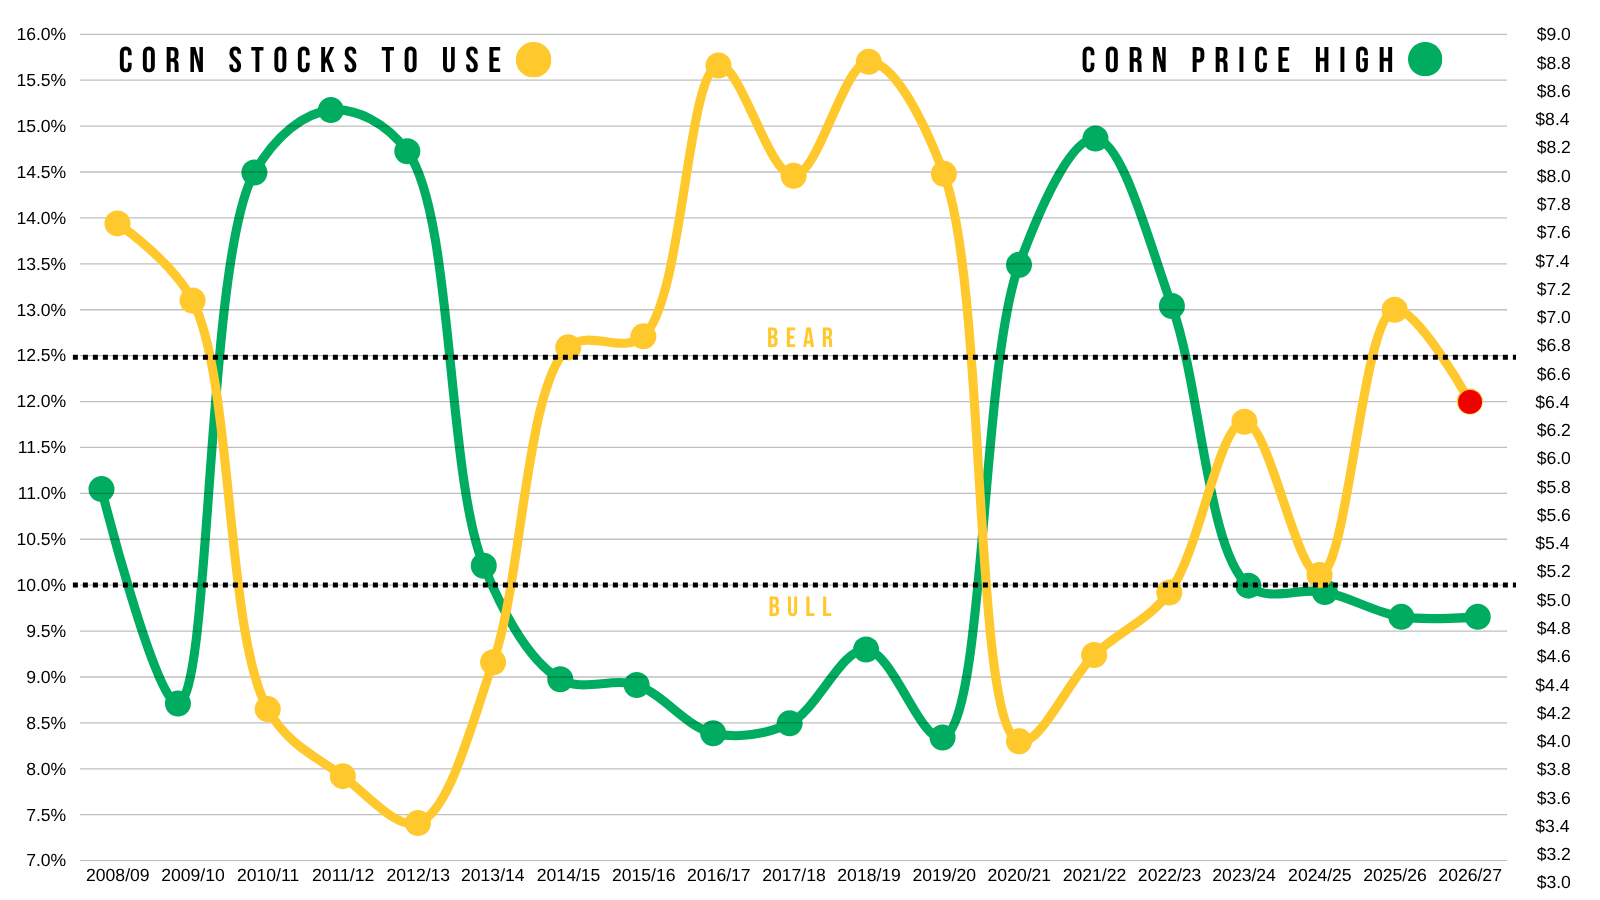
I've talked a lot about how fundamentally, no corn didn’t have a reason to be as high as it was.
As the balance sheets clearly didn’t scream $5 corn. The rally was driven by macros, crude, and the inflation story.
Long term, I am talking late this year and into next year, I do still think corn has a lot of potential.
All of the possible bullish factors are not factors for today, they are factors for this fall and into next year.
The fertilizer situation isn’t going to improve overnight.
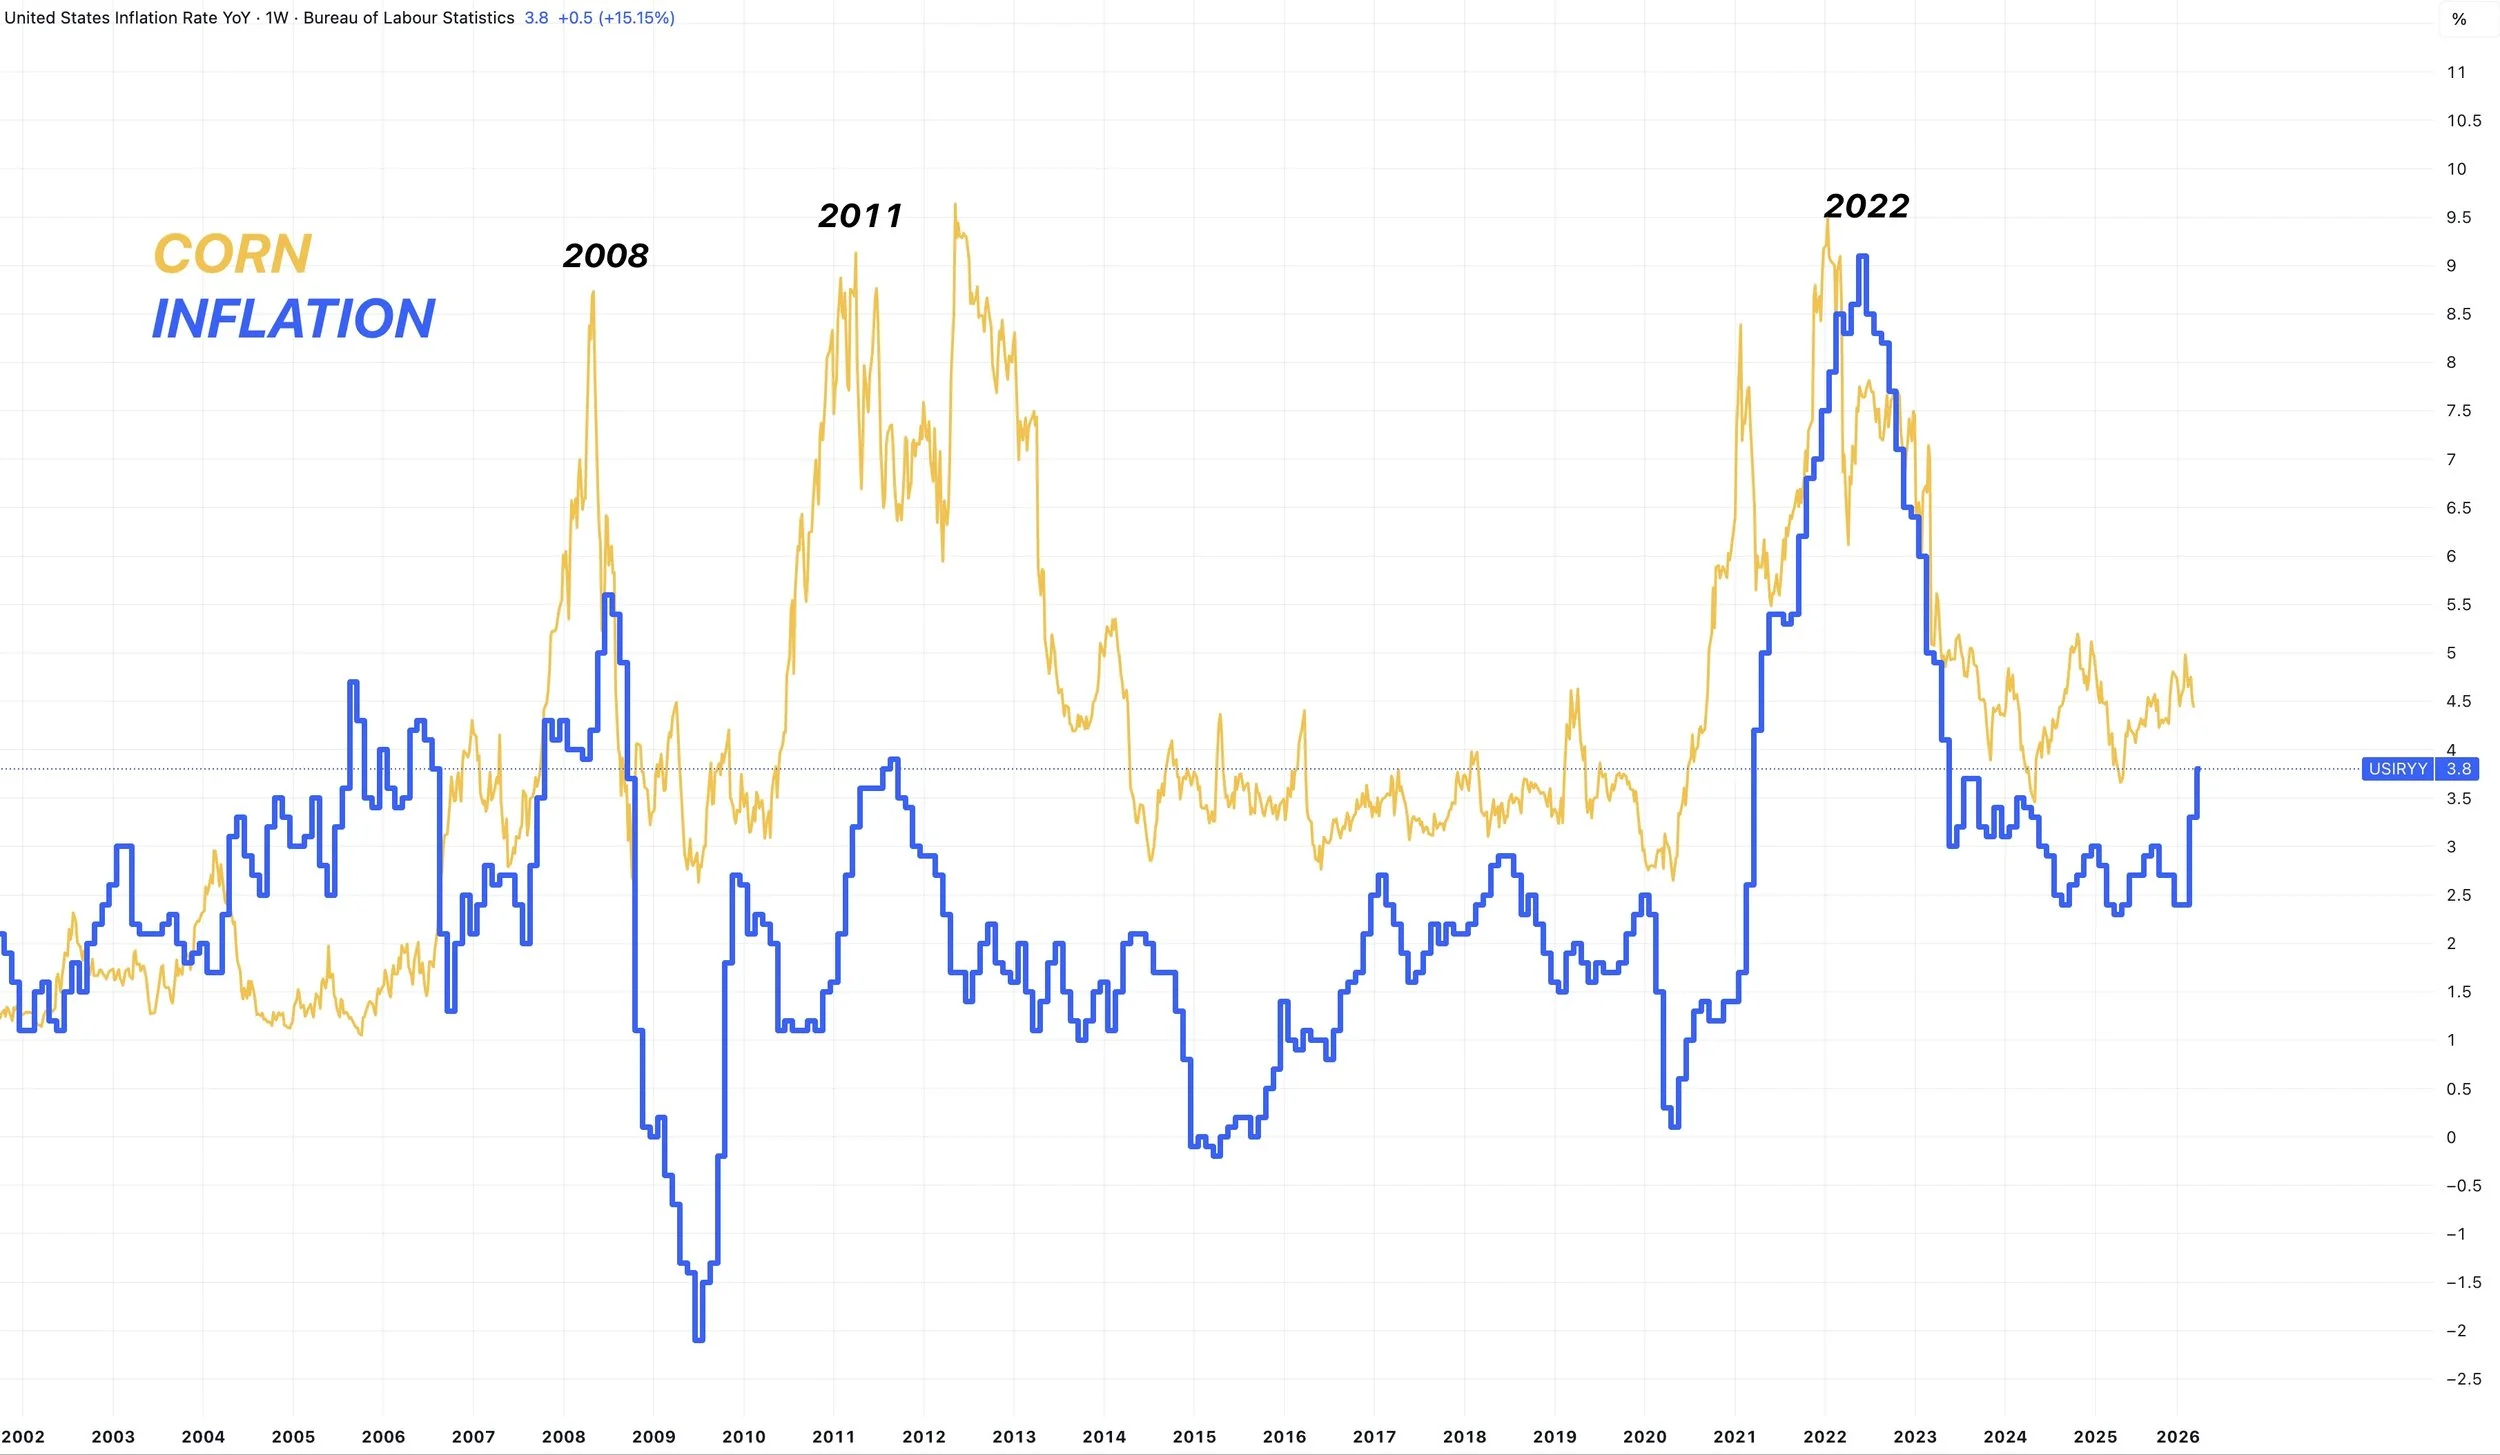
You still have the possible inflation story.
I believe acres will be coming down.
The USDA probably won’t be changing yield until August, unless we get a weather scare.
All of these can make a big impact down the road, but just not right now which is the part that sucks.
As none of these are likely going to be making an impact until later on.
But short term, there isn’t much going for this market.
Unless we see one of the following happen:
We get a weather scare
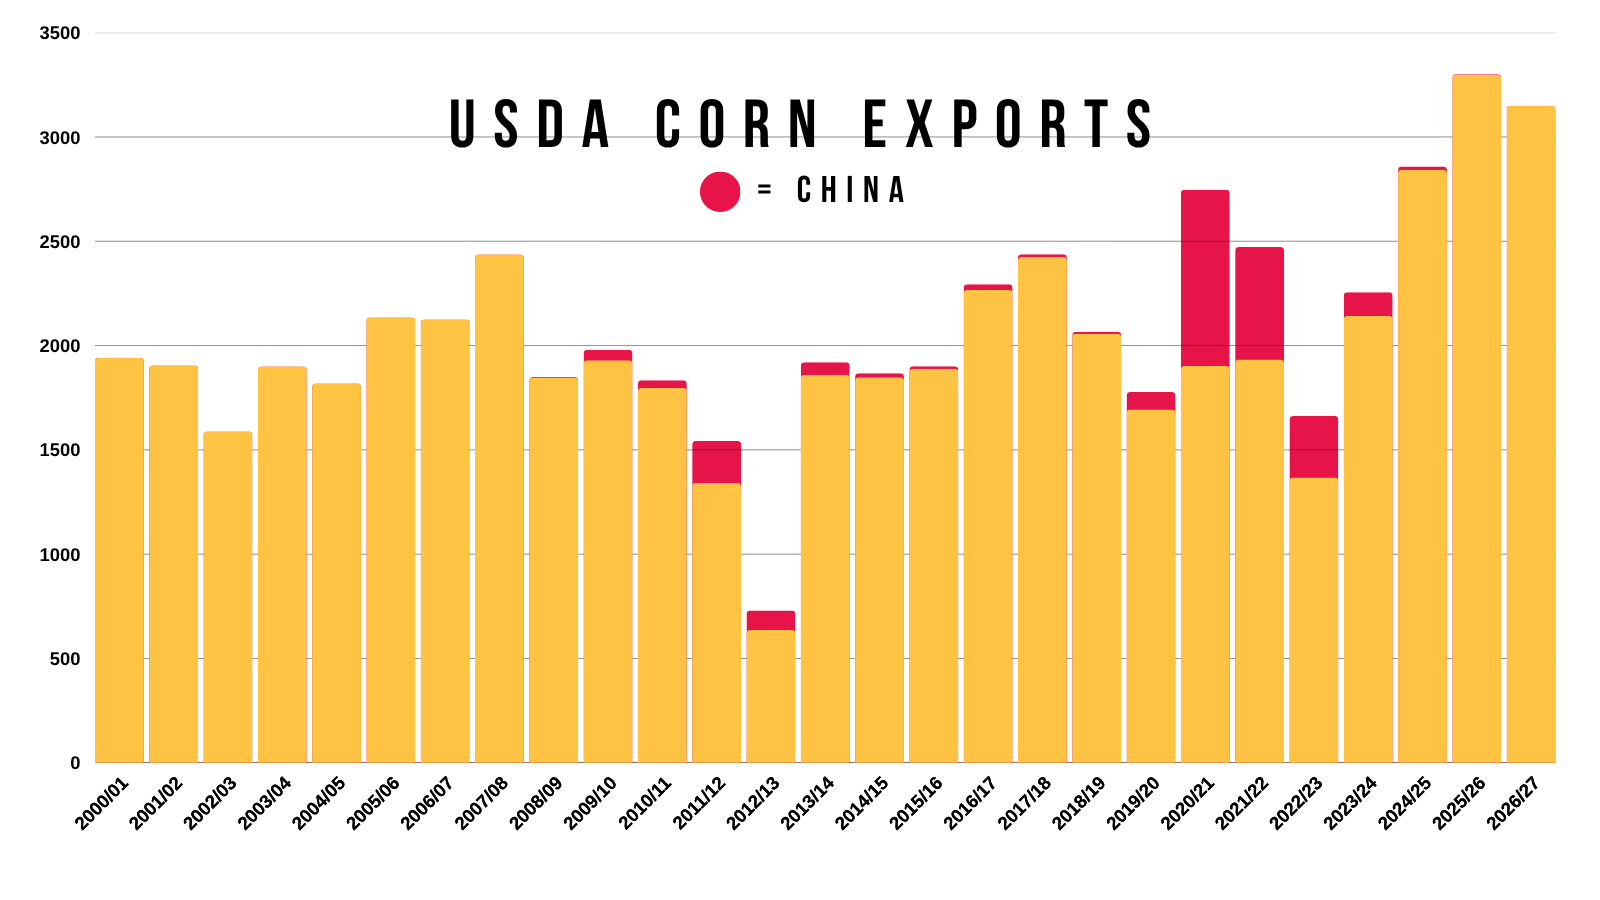
China buys corn now
Crude goes on a major rally
Unless one of those happen, we simply lack a catalyst to go on some massive rally.
There is talk about this "Super El Niño". Who knows how that will impact things. All we know is that short term the forecasts are not threatening.
I am very very confident China will eventually buy corn.
However, it probably makes the most sense for them to buy closer to harvest time. If I had to guess, I'd say they don’t buy until around August.
Harvest would be the perfect time for China to buy. When do you buy something? When it has the most supply and when prices are their cheapest.
But you can’t tell me that China buying corn isn’t a major long term friendly factor given that demand is the best it's ever been, and this recent sell off certainly isn’t removing demand.
So that is again another long term factor that might not matter to this market until later on.
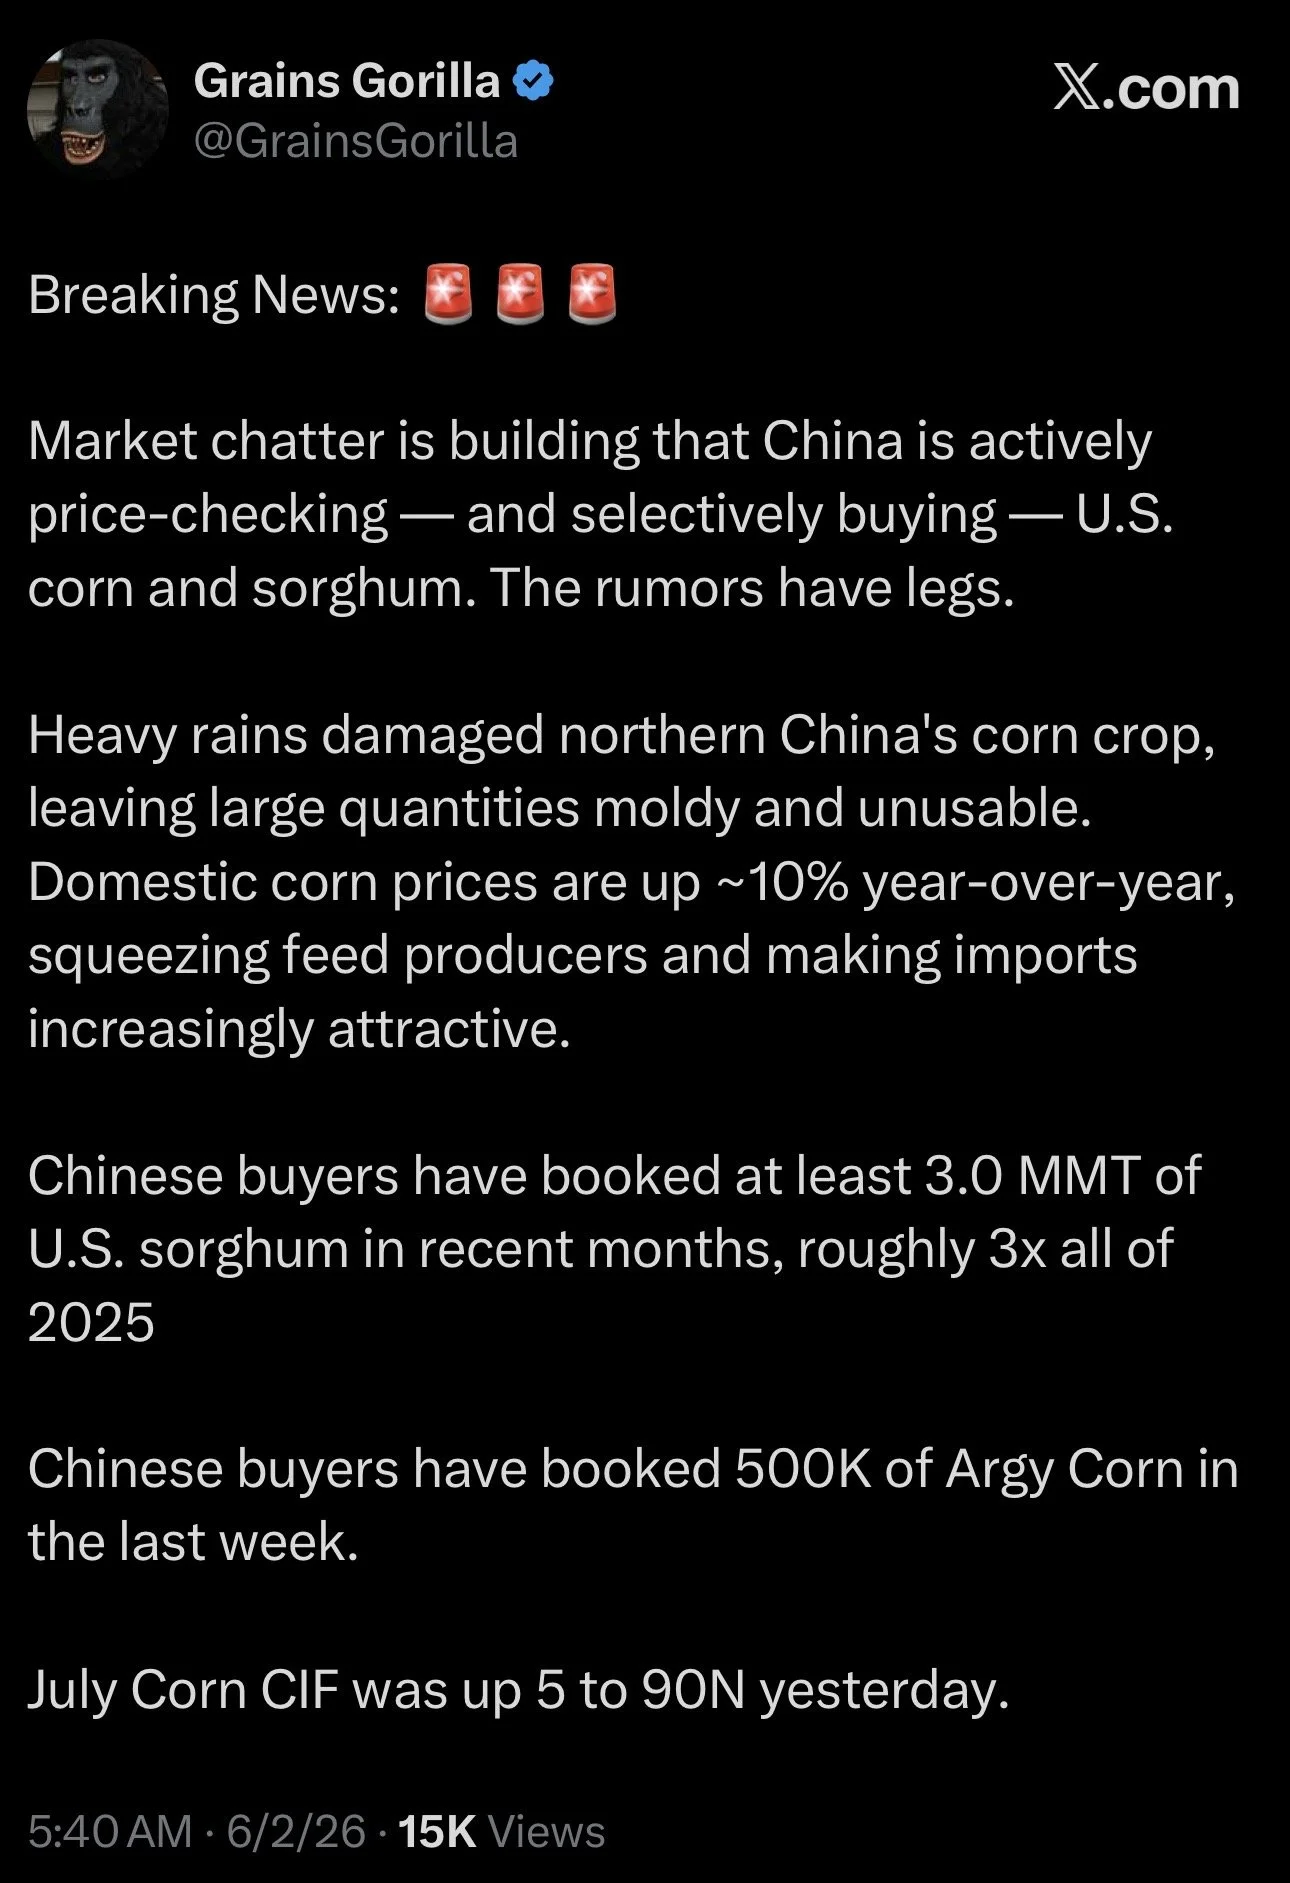
There is some rumors that China might even be more interested in our corn due to heavy rain damaging their corn crop domestically.
Along with the fact that domestically, their prices have risen. Which makes ours more attractive.
More reason to believe China eventually steps in, even if it isn’t for a few months.
When could we bottom?
Let's take a look at the seasonals.
Over the past 2 months, I went over these very heavily, and how we are typically lower by July from the start of May.
Although no, I wasn’t expecting the market to fall out of bed this hard this fast.
But what does the historical data tell us now?
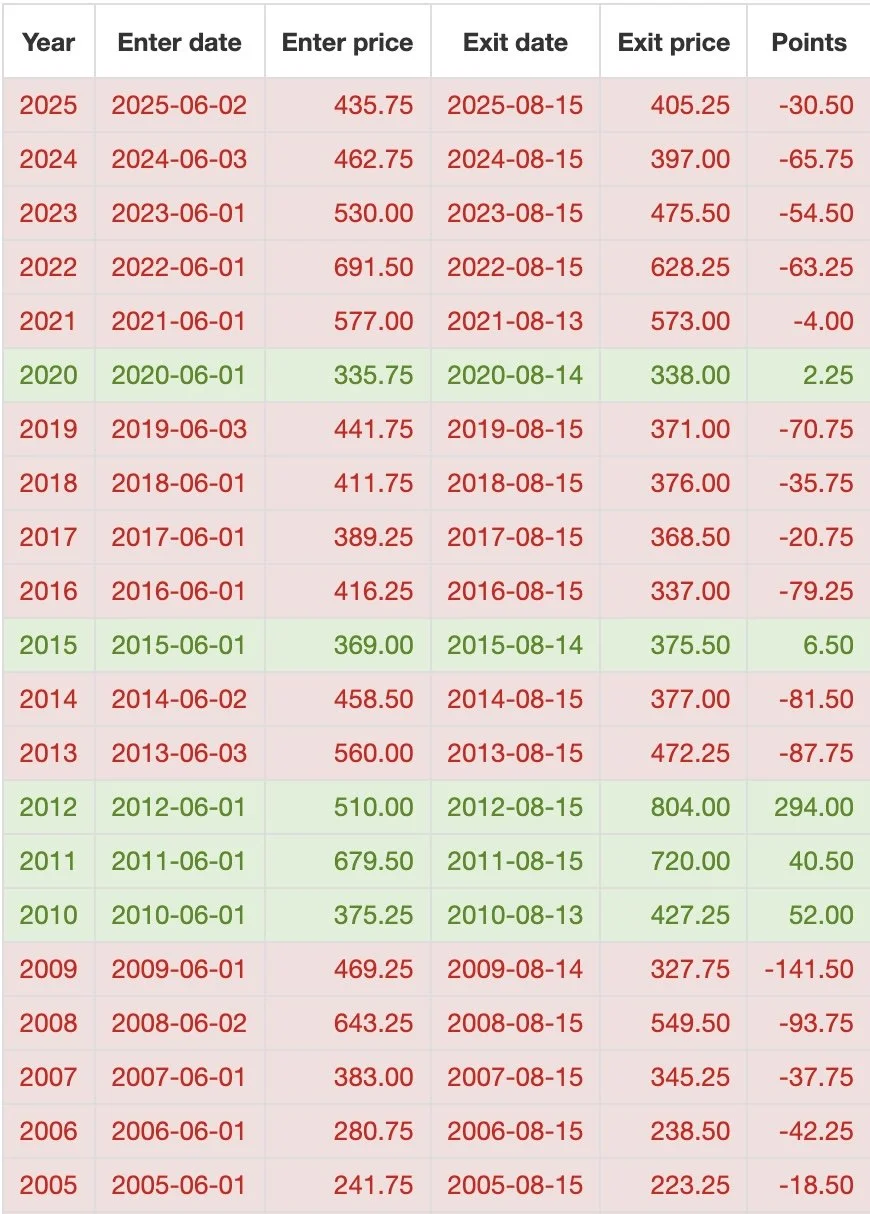
From today by August 15th, we've been lower the last 9 of 10 years.
So odds are, we will be lower than we are today over the course of the next 1-2 months.
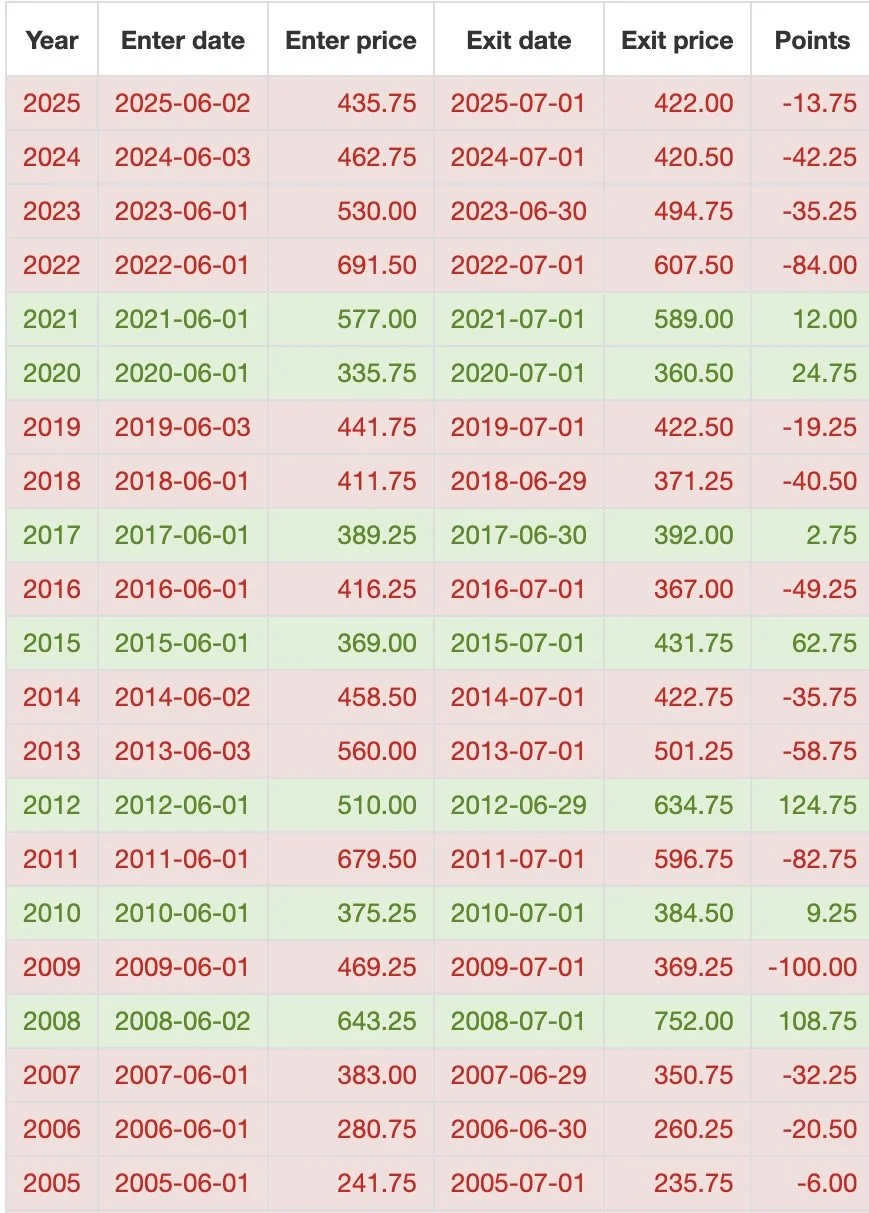
Here is the data for the month of June.
From June 1st to July 1st.
We have been lower in the month of June for 4 years in a row.
Lower 7 of the last 10 years.
The only years we were not lower, were mostly bull markets or when we had a true drought scare.
So without a weather scare, odds favor lower by July.
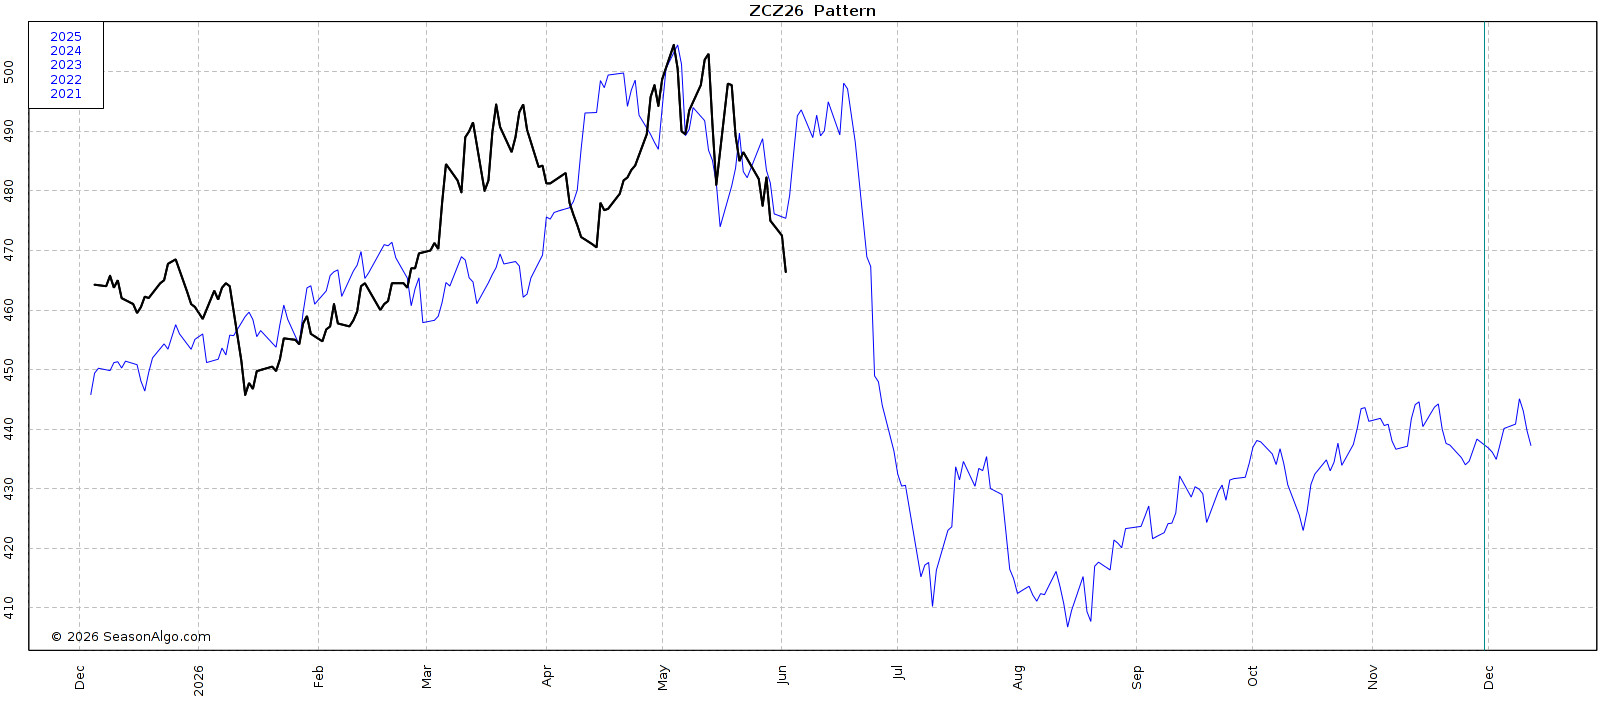
Now let's look at the actual seasonal patterns.
Here is the 10-year.
It has us free falling until the middle of August.
However, I don’t think it plays out this way.
This data is skewed due to years where there was weather scares.
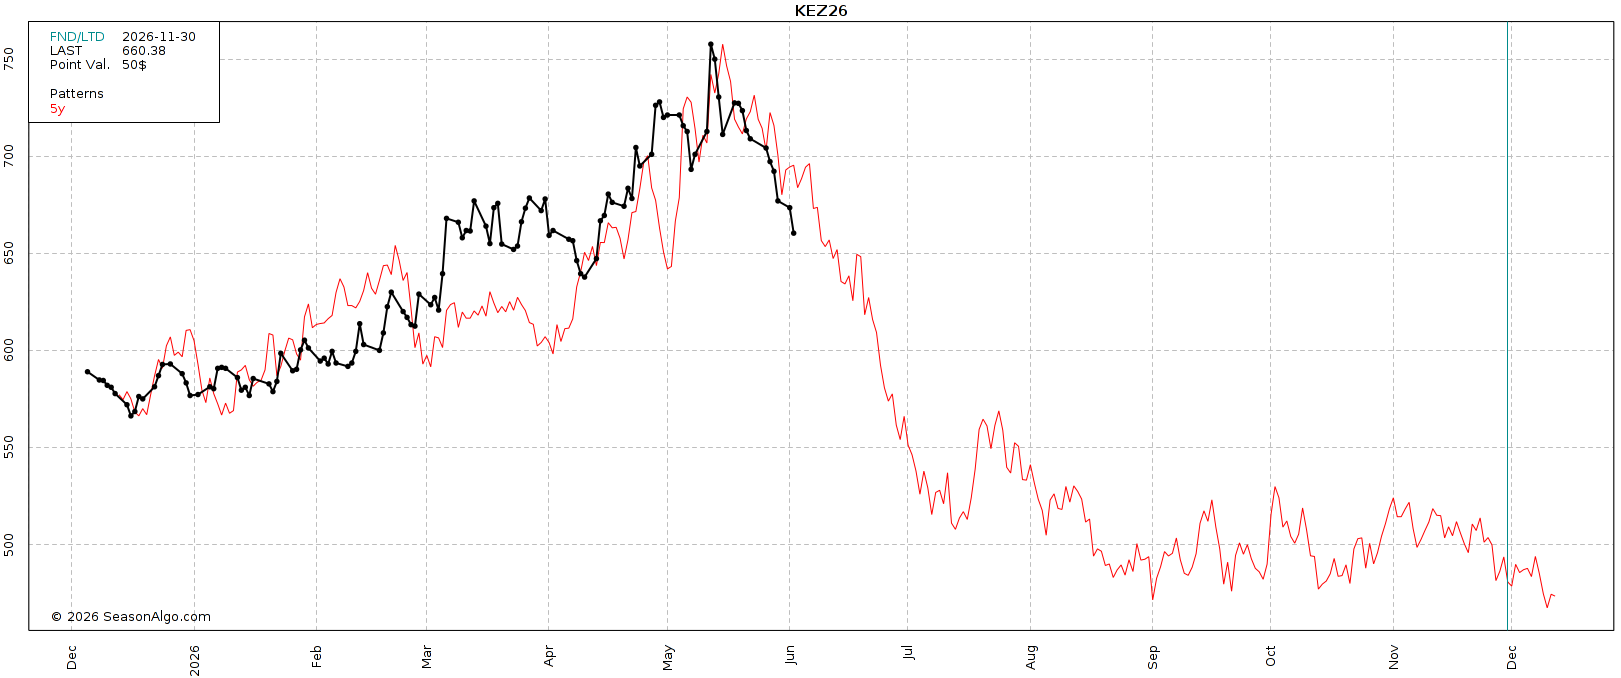
So let's look at the 5-year seasonal.
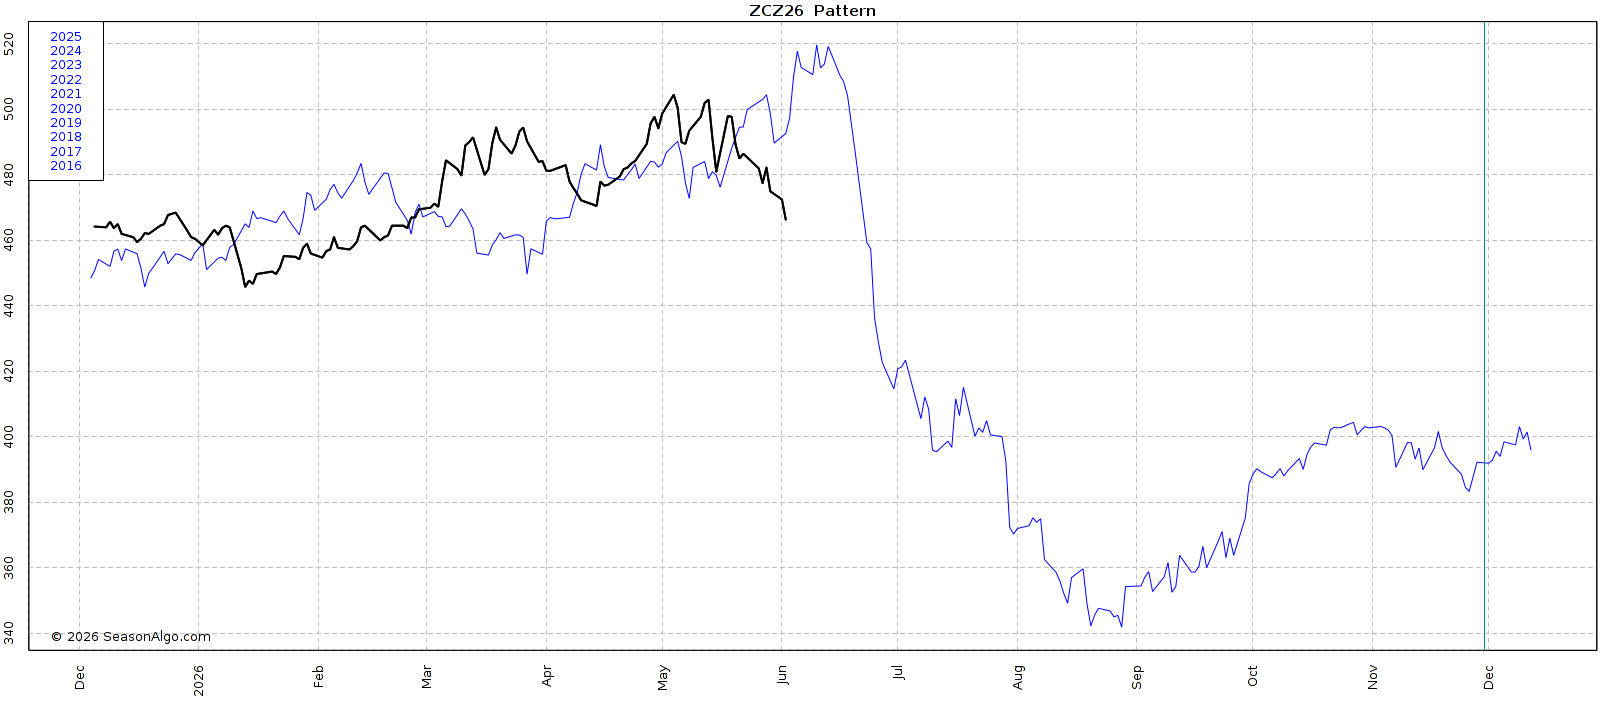
Here is the 5-year seasonal.
In this one, we continue to fall lower until early July.
Before then consolidating and once again posting the lows in August.
The difference between this 5-year pattern and the 10-year pattern, is that over the last 5-years we tend to not venture very far below those July lows like we do in the 10-year pattern.
So basically, in the 10-year we free fall until August. In the 5-year we fall until July.
But in both, we don’t carve out a meaningful bottom and head higher until August.
The Funds:
The funds just had their largest week of selling in over a year.
They are still long a good amount of corn, which does offer risk.
As they could continue to exit that long position.
The biggest question is, will they actually flip short, or will they continue to defend that long position?
We do know that they tend to stabilize their position around the beginning of July.
Which lines up with that 5-year seasonal as well.
Given the inflation story and everything else, I would argue they don’t want to get too short despite us lacking an immediate bullish catalyst.
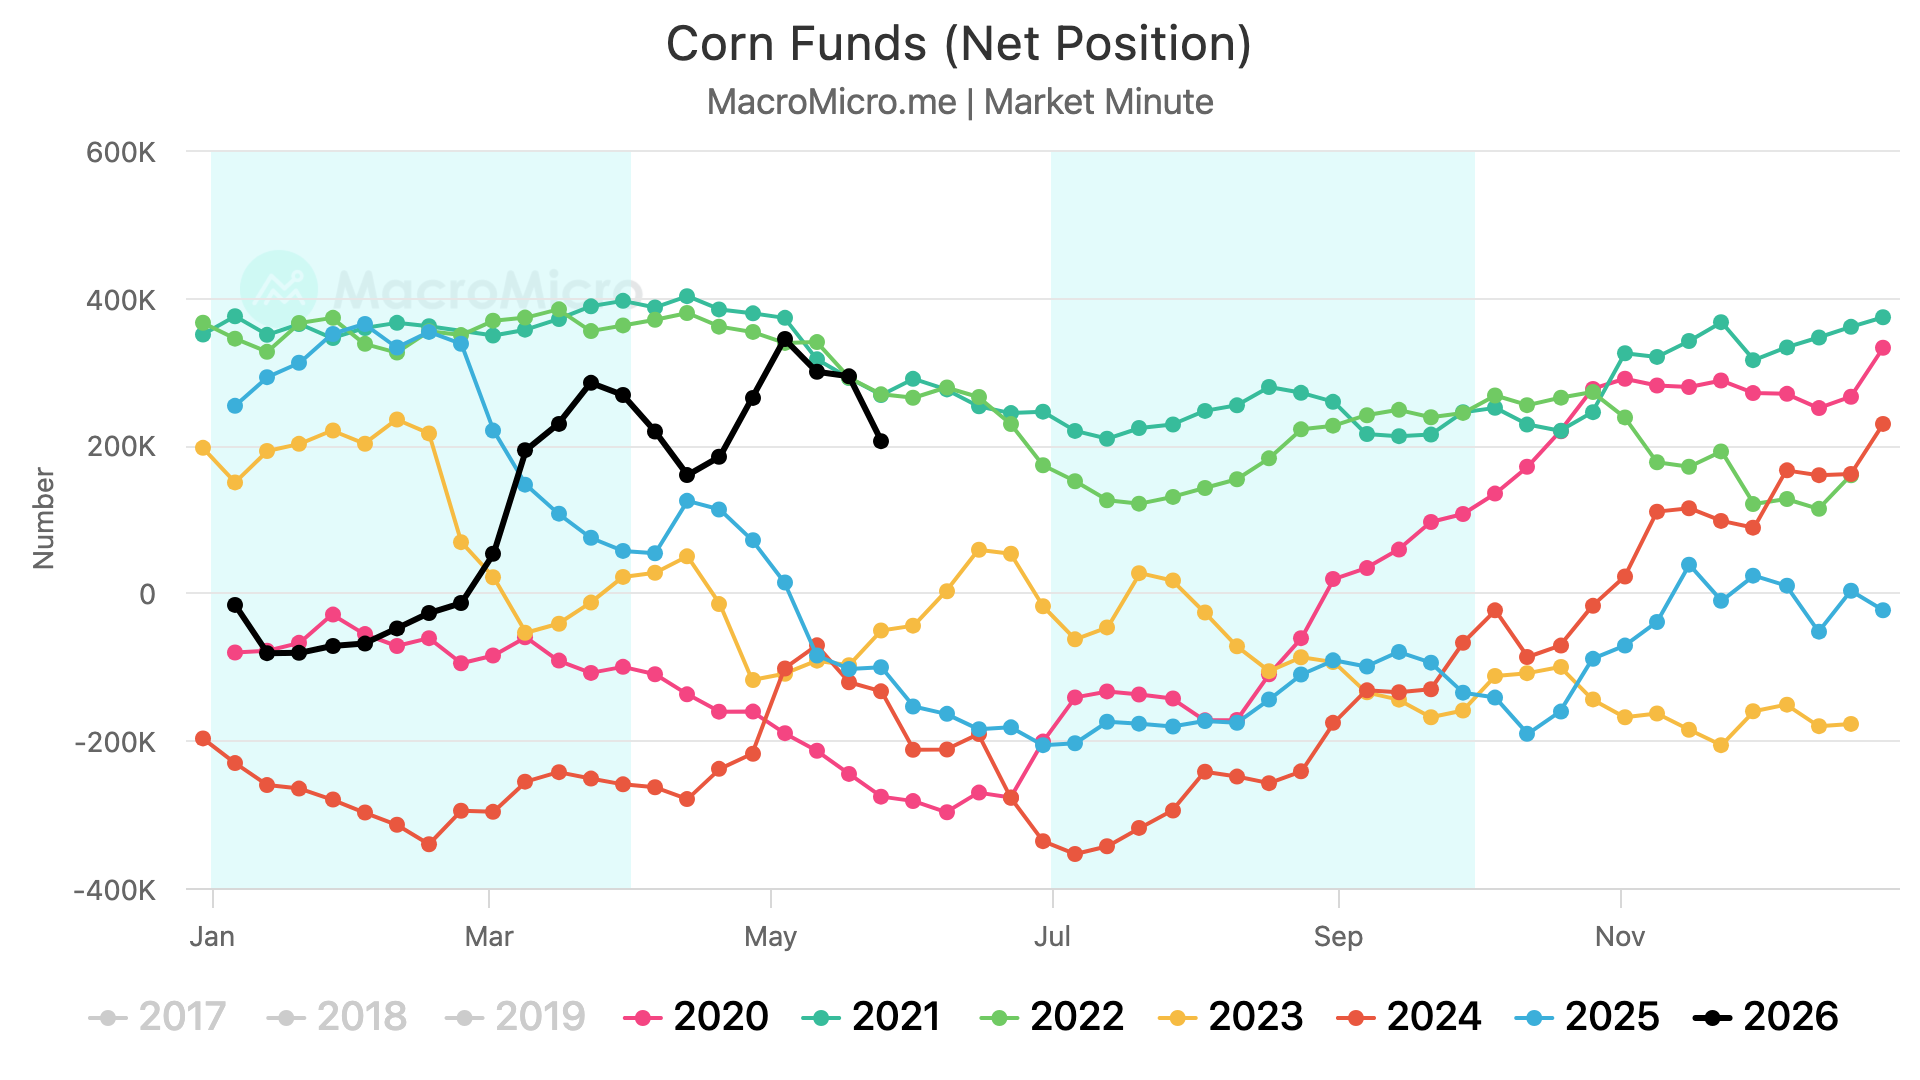
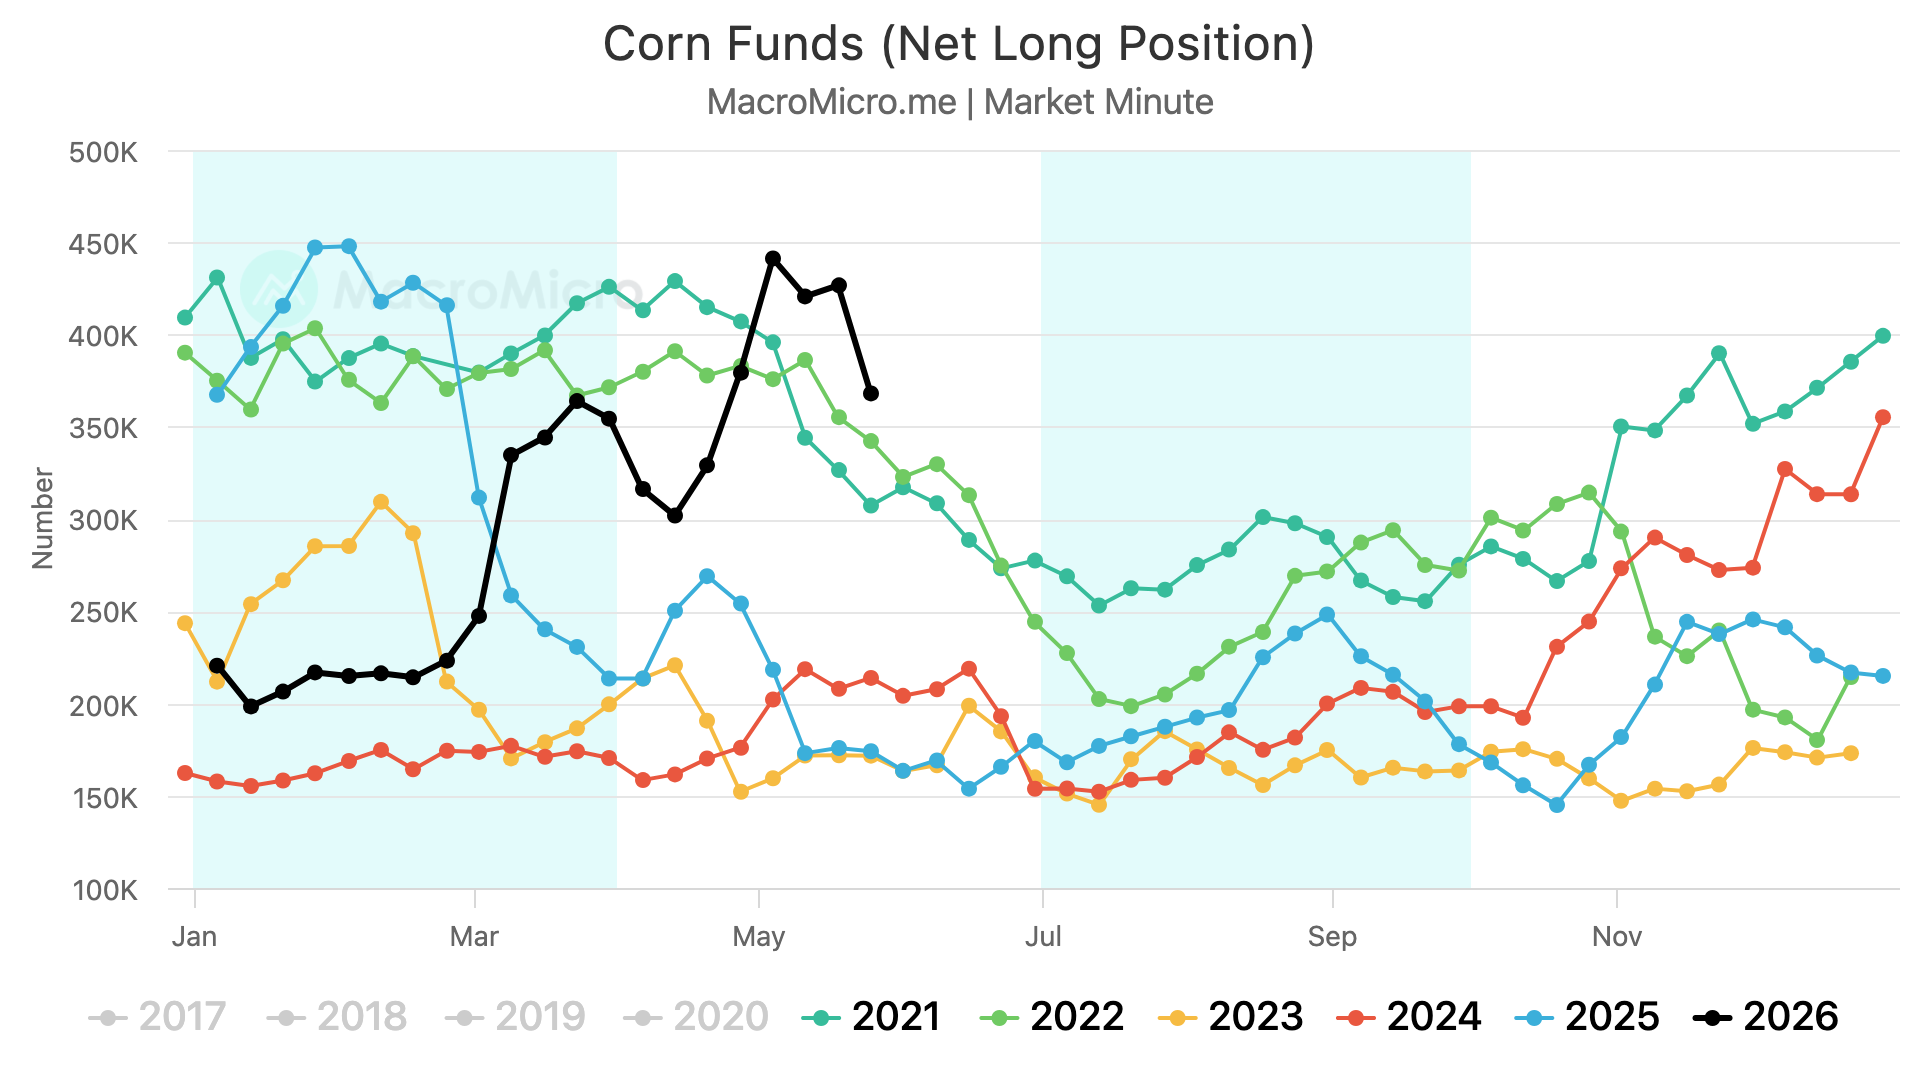
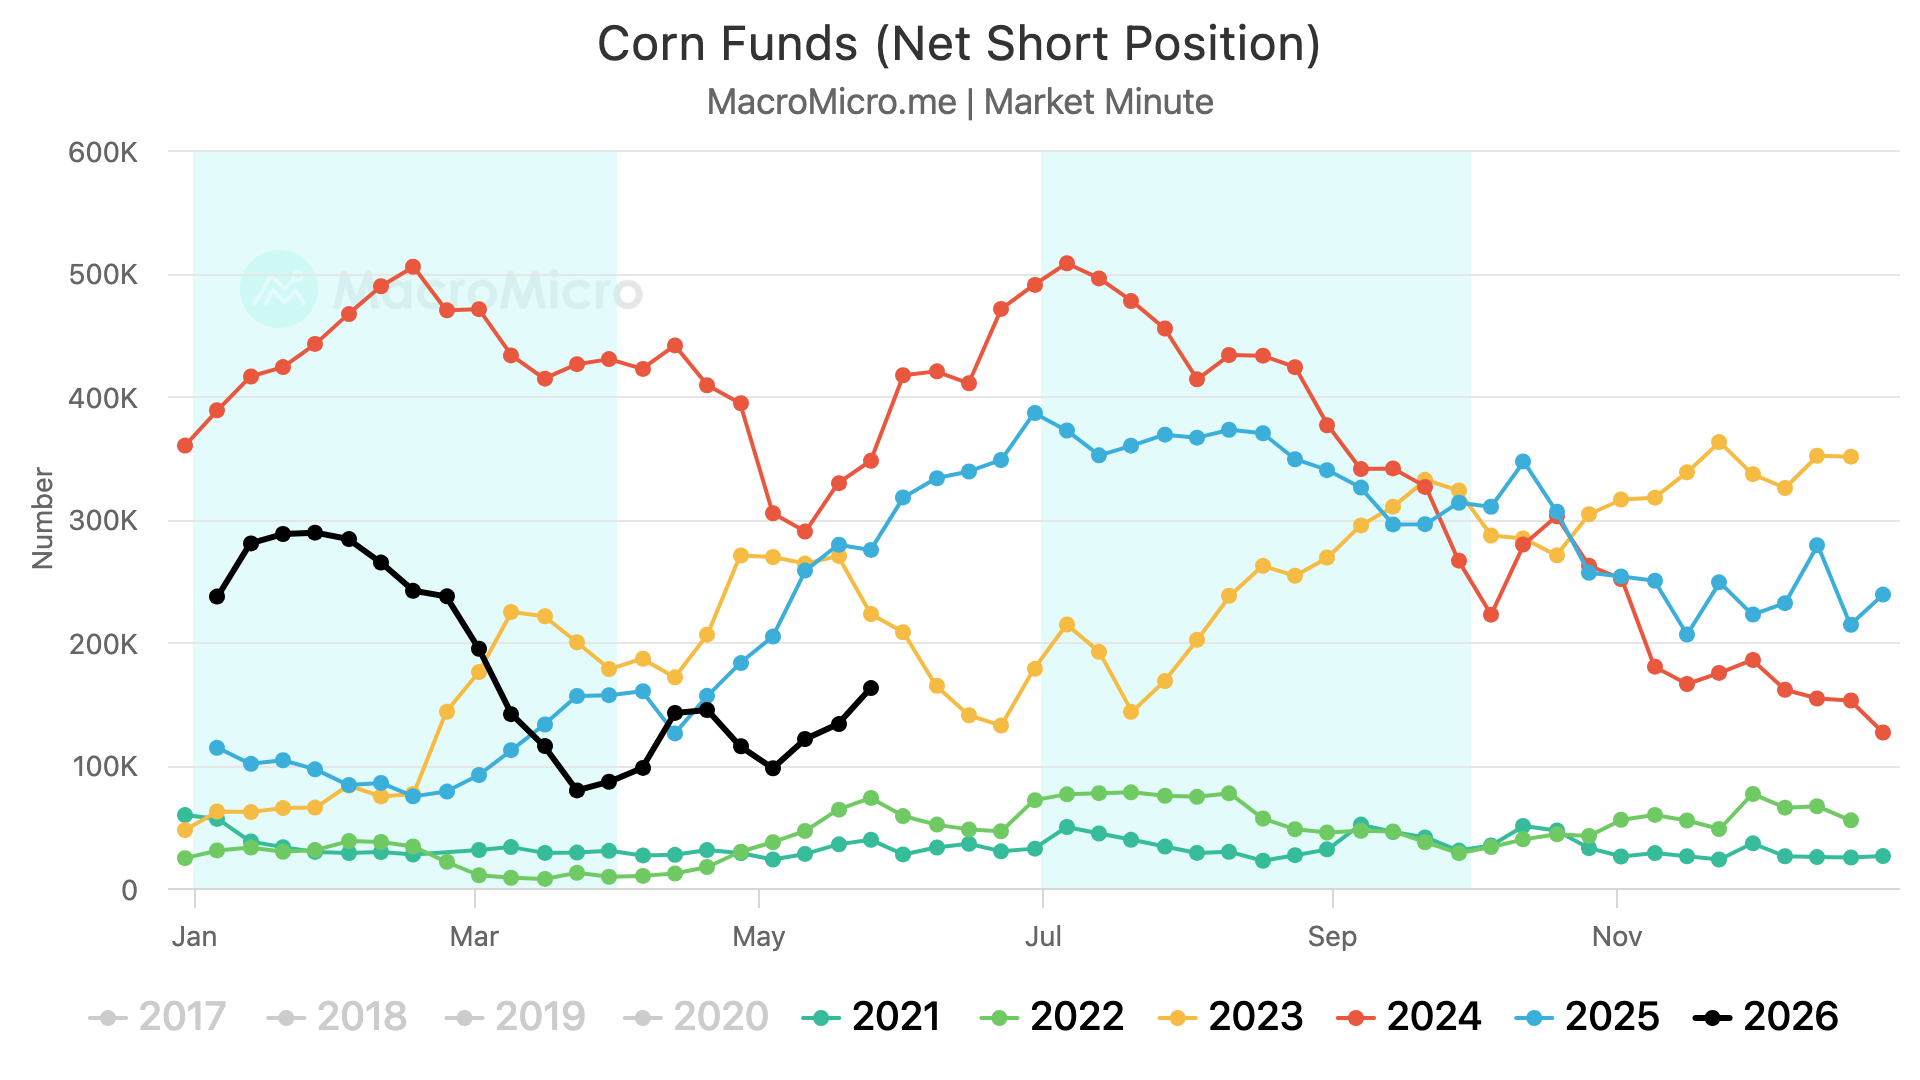
Here is their long and short positions.
The net long position saw a very large decrease.
On the other hand, the amount of short positions did not see a massive increase.
What does this mean?
It means that the funds are simply exiting their long position and decreasing their upside exposure.
But they are not flipping short and betting against the market trying to play it from the short side.
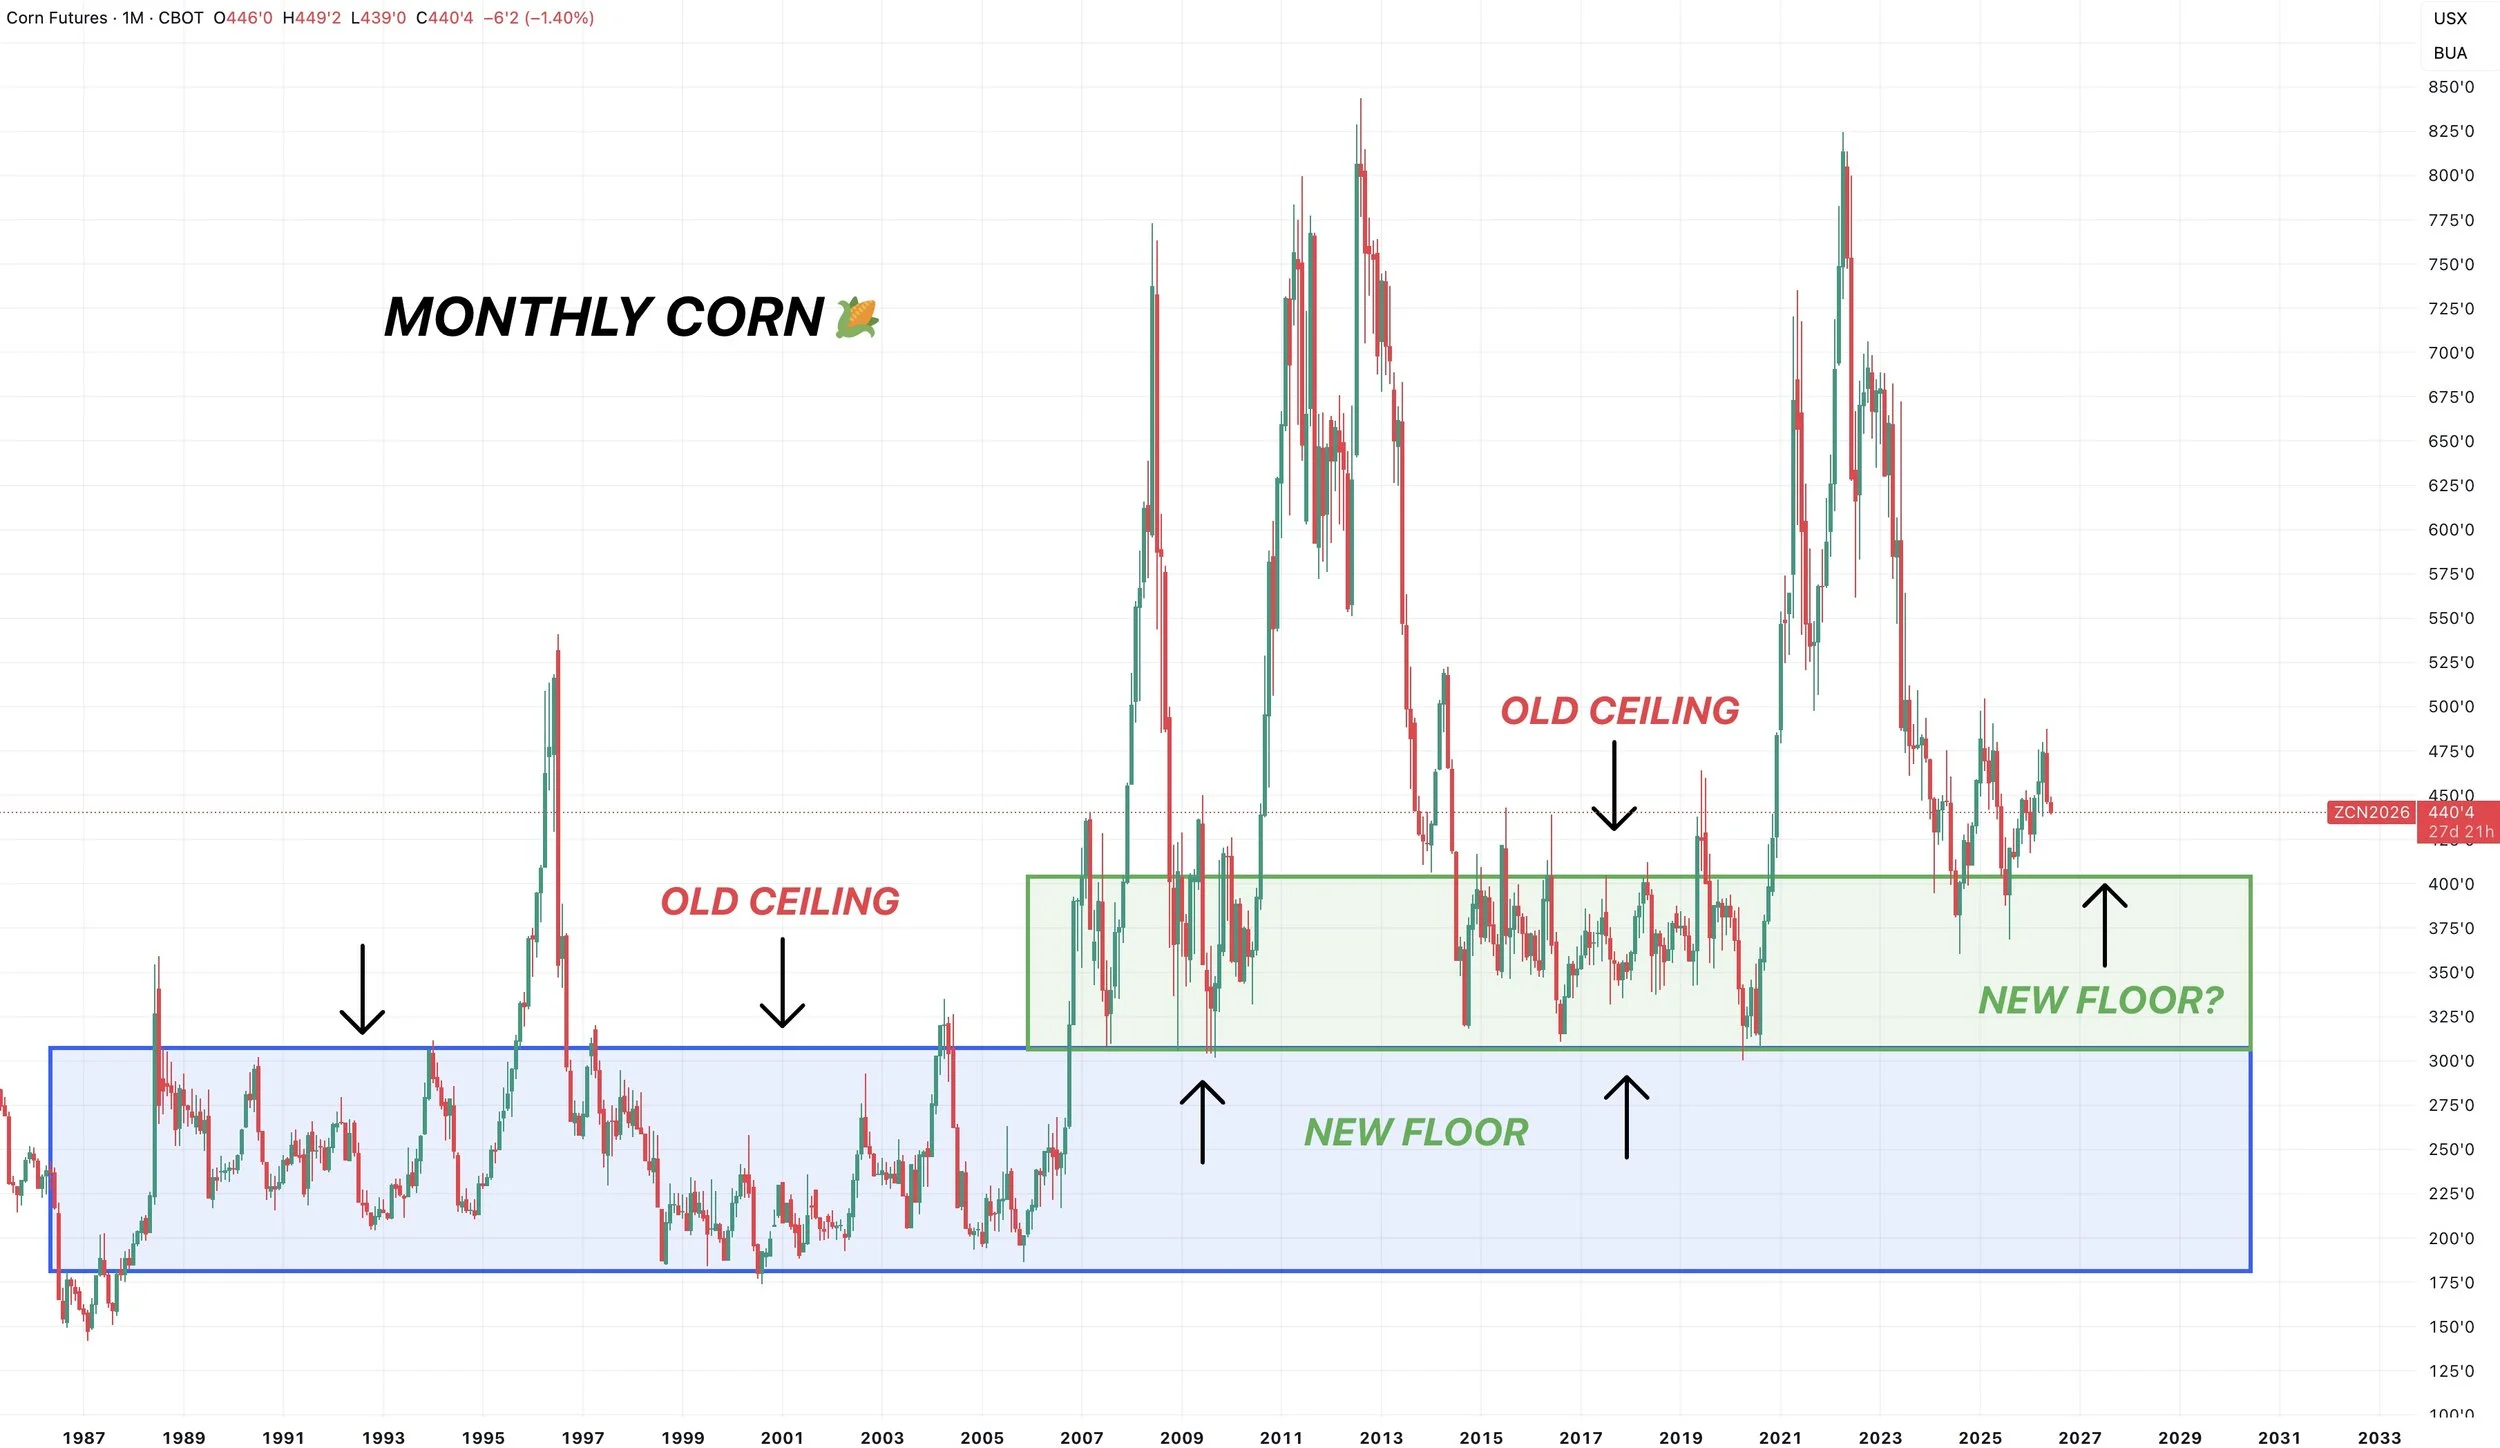
Monthly Corn Chart:
The first chart I wanted to show is the monthly chart.
As there has been a lot of talk that corn is going to nothing.
Based on this chart, how low could we actually go?
From the 1980's to 2006, corn's ceiling was $3.00
From 2007 to 2020, that old ceiling of $3.00 then become corn's new floor.
From 2014 to 2020, corn's ceiling was $4.00
So it would be reasonable to think that our new floor in corn is $4.00
The last two years, we did ultimately venture below $4.00 in August of both years. However, neither trip below $4.00 lasted longer than a month.
The point is, I do not think we're going back to the days of sub $4.00 corn.
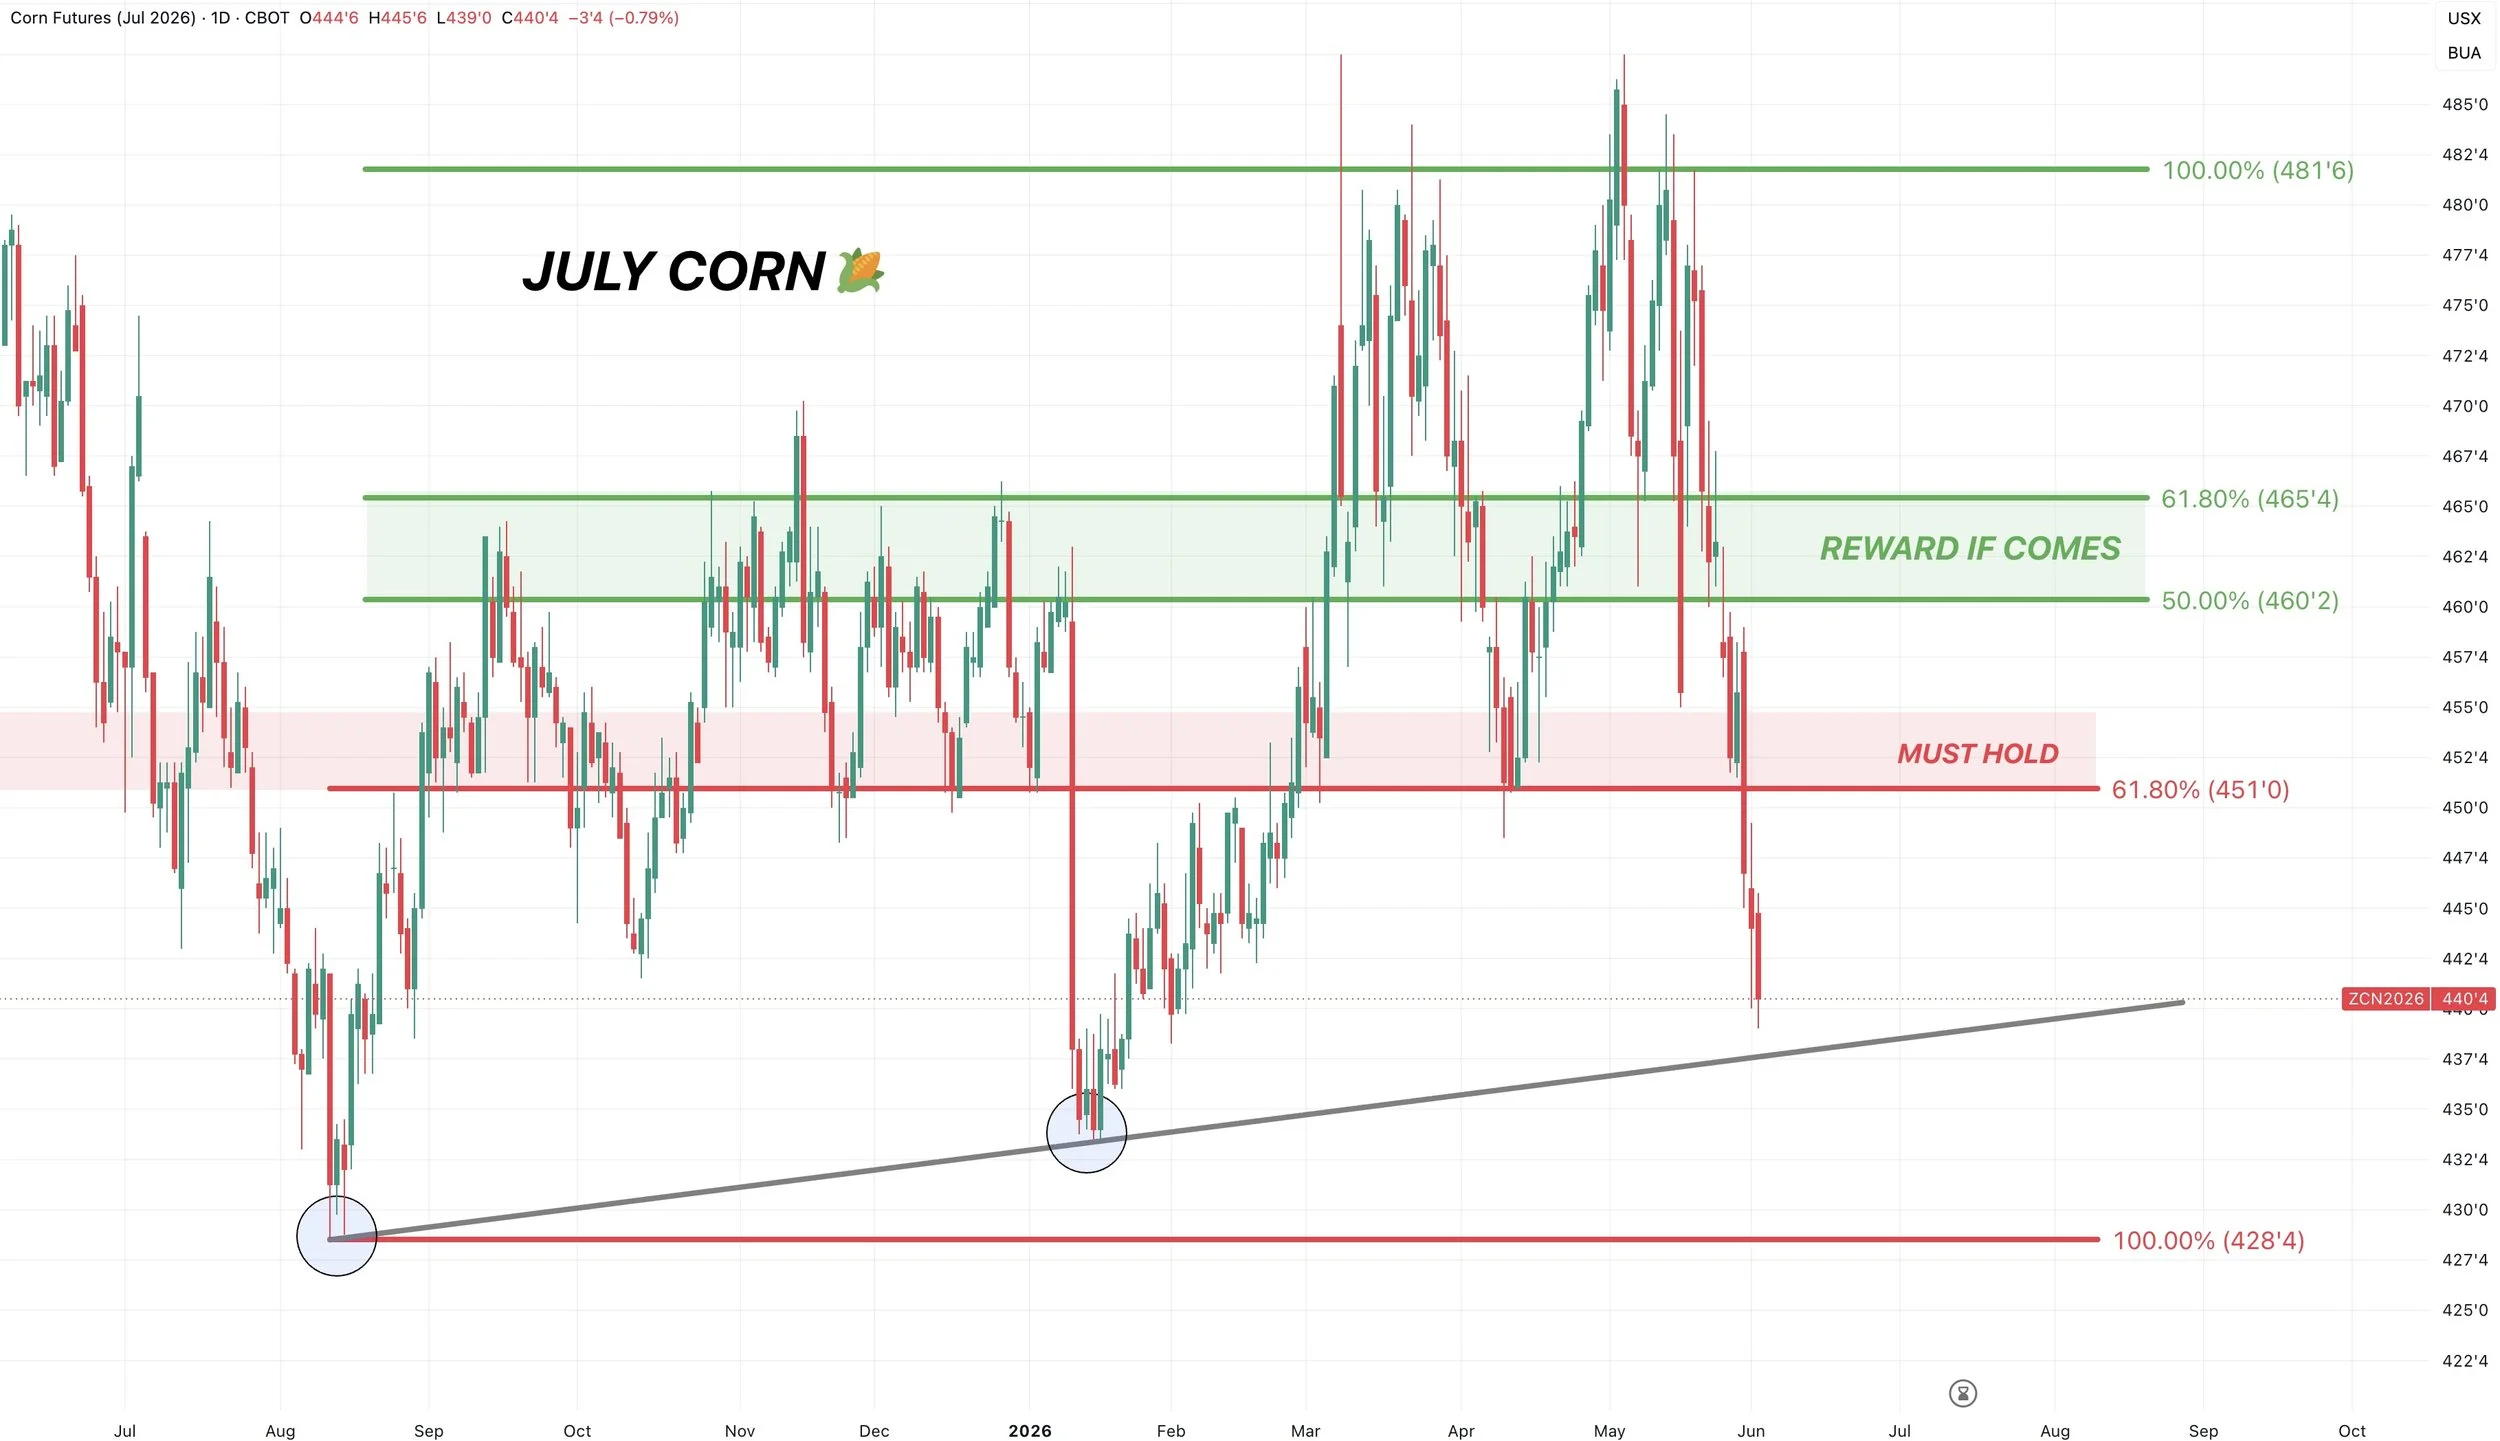
July Corn Chart:
The old crop chart is ugly.
We broke that key support at $4.50
As a result, it opened the door lower.
We are now within striking distance of those January lows.
Now what?
We do have some potential trendline support from both of the major lows. So perhaps that could provide a little bit of relief. If that fails, the next real support is contract lows.
To the upside, we want to be looking to reward any sizeable relief bounce if we get one.
$4.60 to $4.65 would claw back 50% to 61.8% of the recent sell off. This box moves lower if we continue lower.
We don’t have to bounce that high, or bounce at all, but if we do that is the area we want to look to reward. Since we broke that key support, the trend has shifted lower and we want to reward a rally.
Although it is possible, I would like to think that we don’t continue to simply fall off a cliff in a straight line we have been.
Essentially, breaking that support tells us the overall trend is now lower, but I'd like to think we're almost due for a relief bounce.
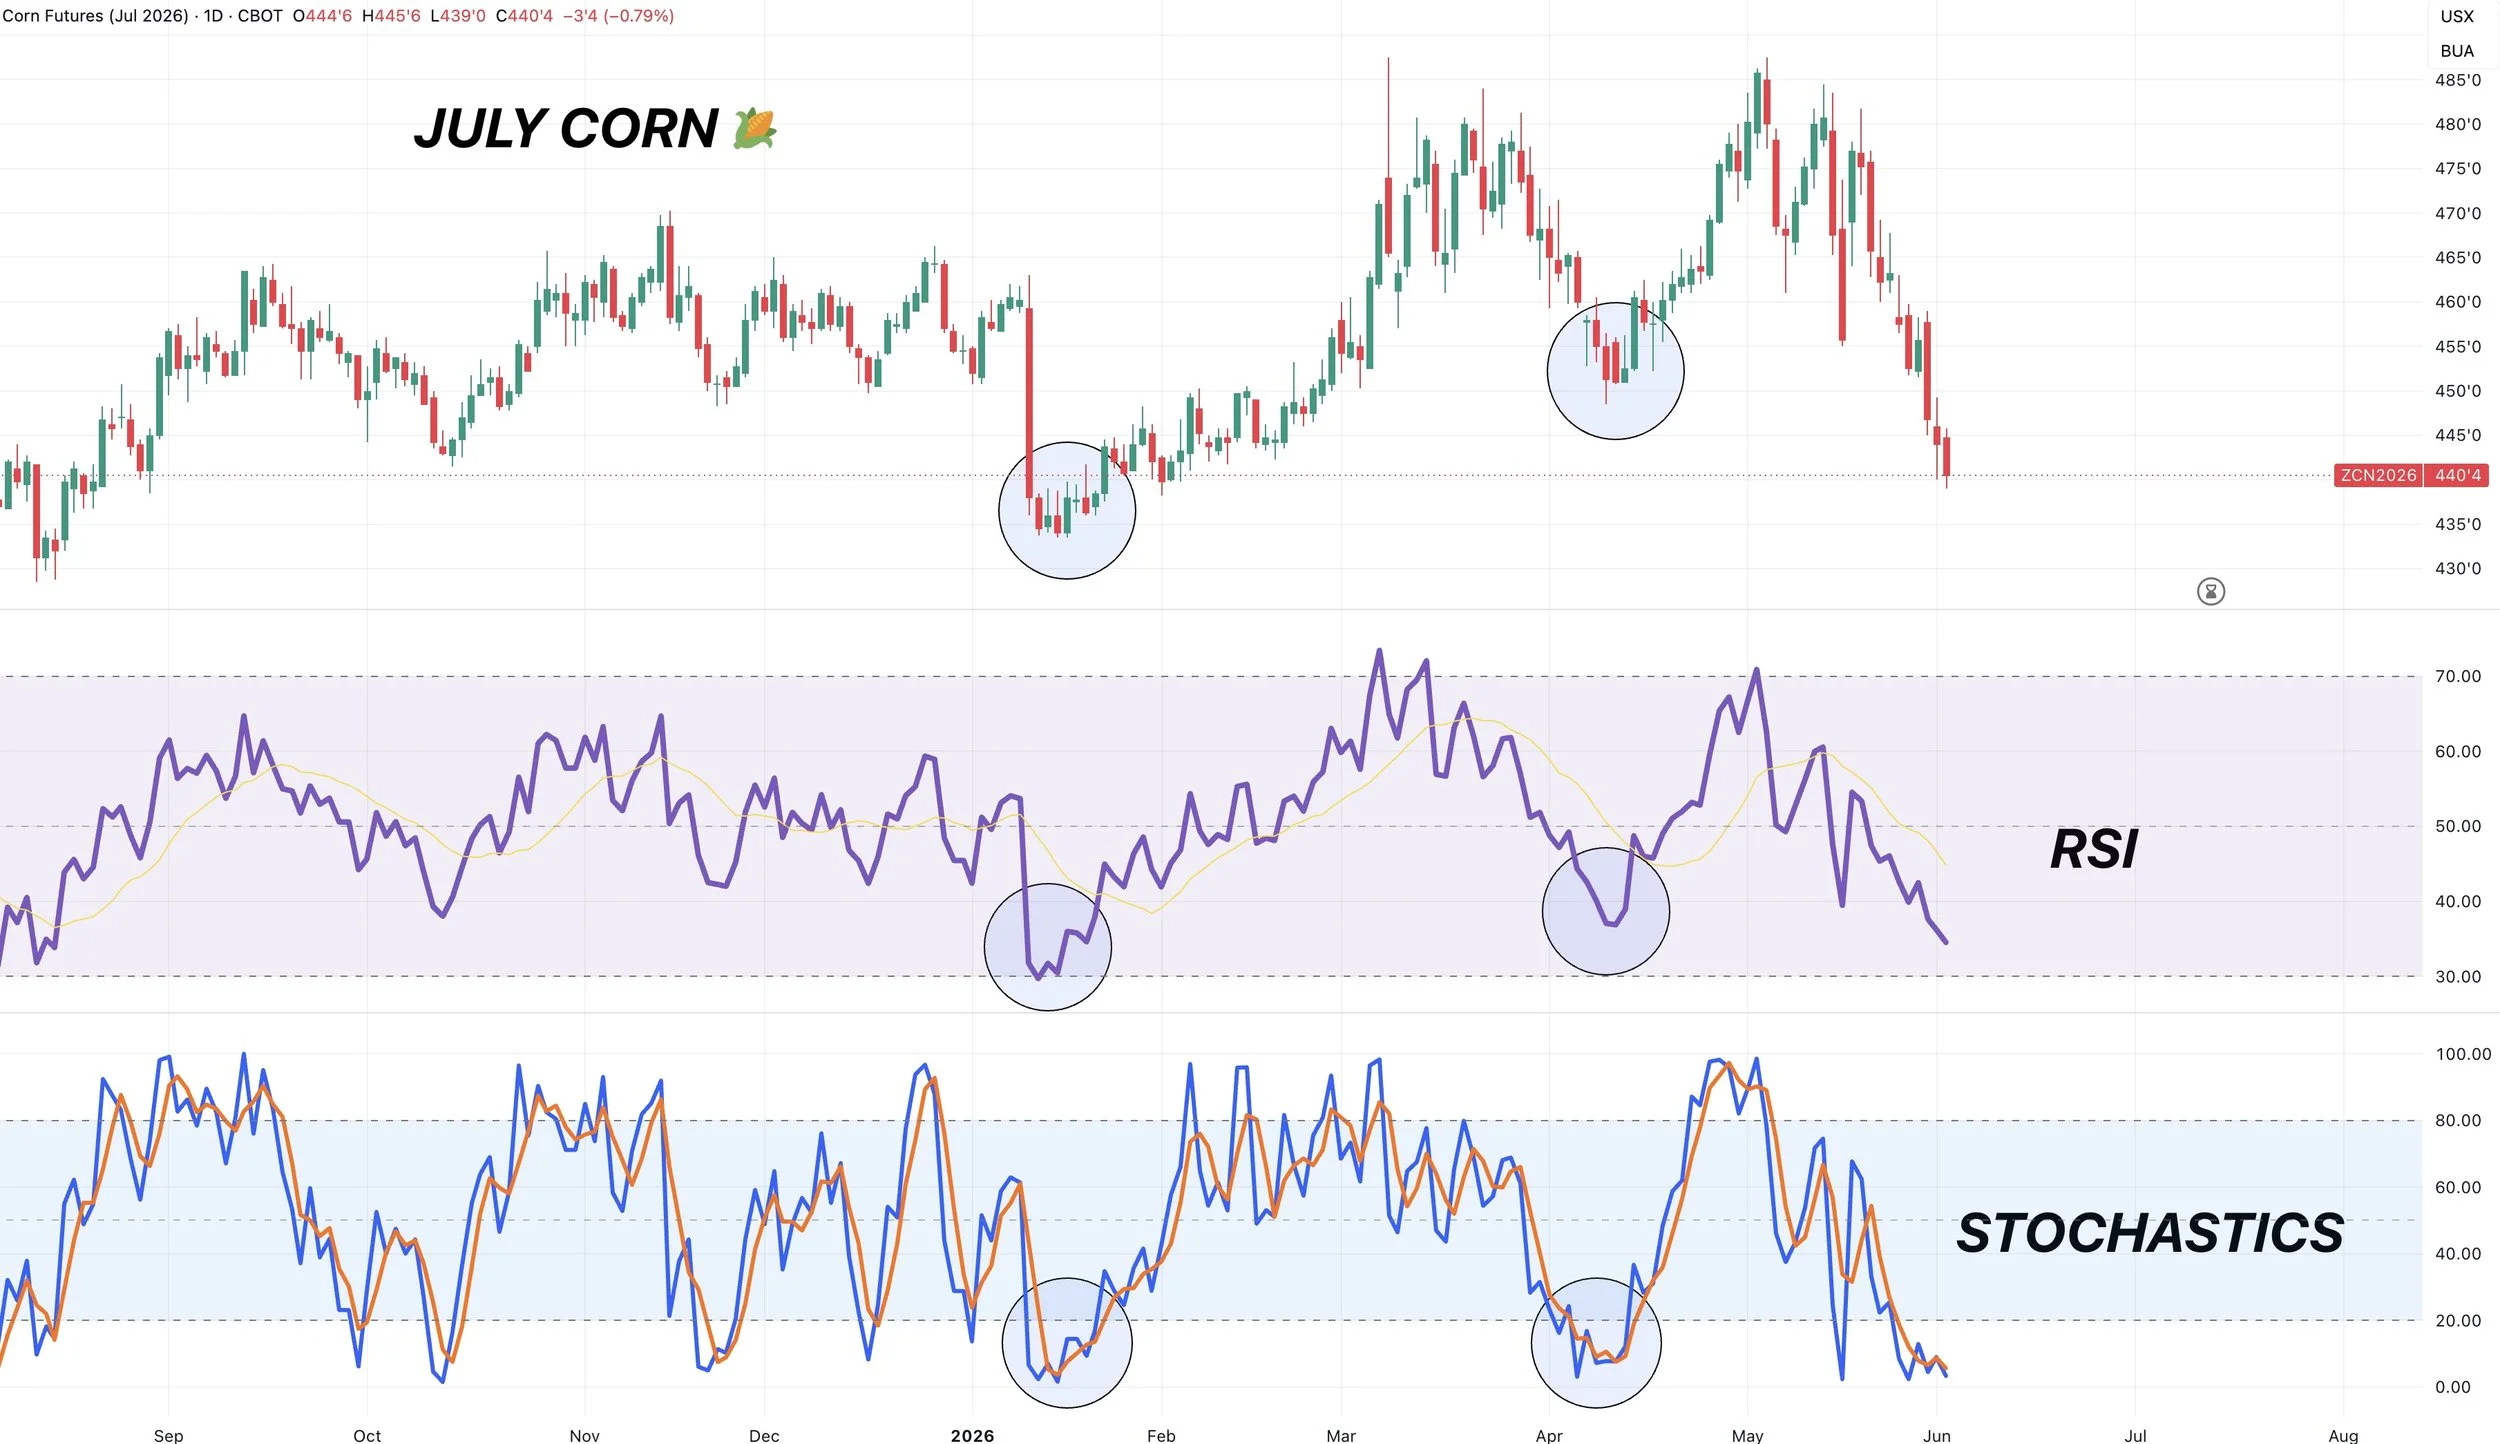
The last time the indicators were this oversold, it did mark a local bottom.
Another reason to believe we could be due for a bounce soon.
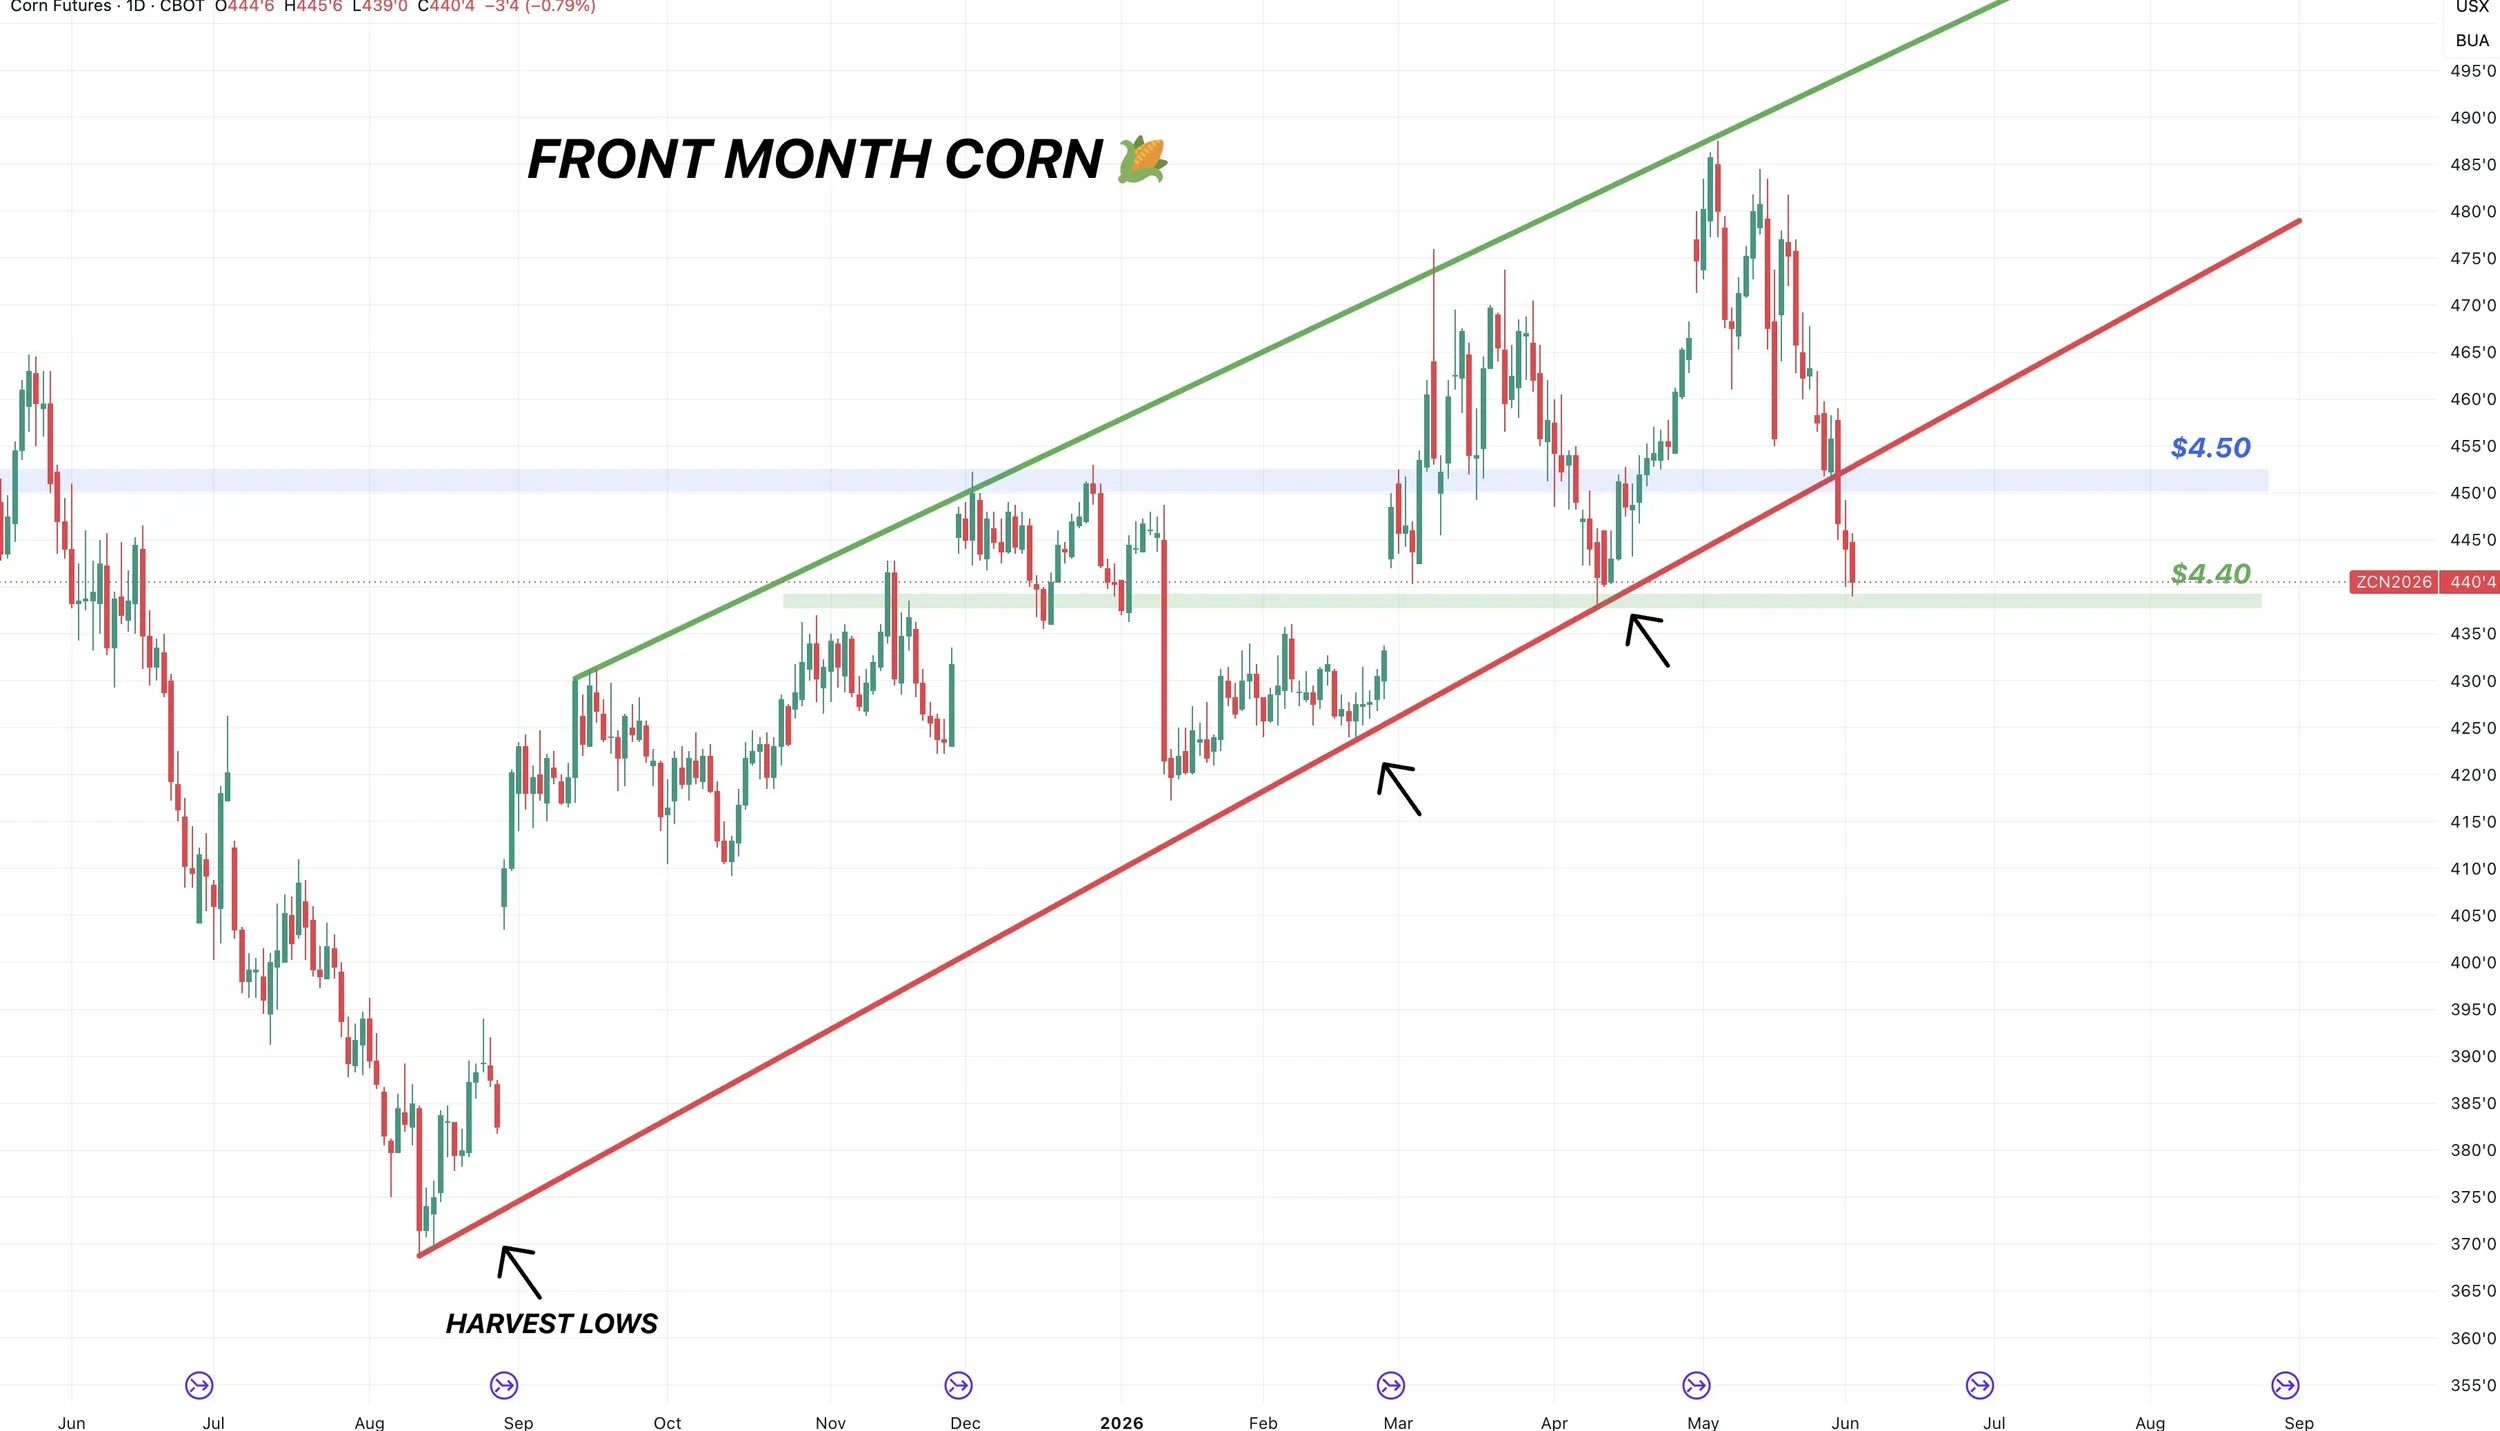
Front Month Corn Chart:
On the front month chart, we broke that uptrend we had respected since those harvest lows.
Not a good sign, as it might mean the structure has shifted lower from now until the harvest lows. And there is a chance we are starting that seasonal sell off.
But that doesn’t mean we can’t get a dead cat bounce out of here before hand.
We are sitting at some support here around this $4.40 level that we'd like to see hold to prevent us from making an even larger leg lower.
So this would be a good spot for a relief bounce, but again the overall trend is likely lower unless an outside factor such as weather changes things.
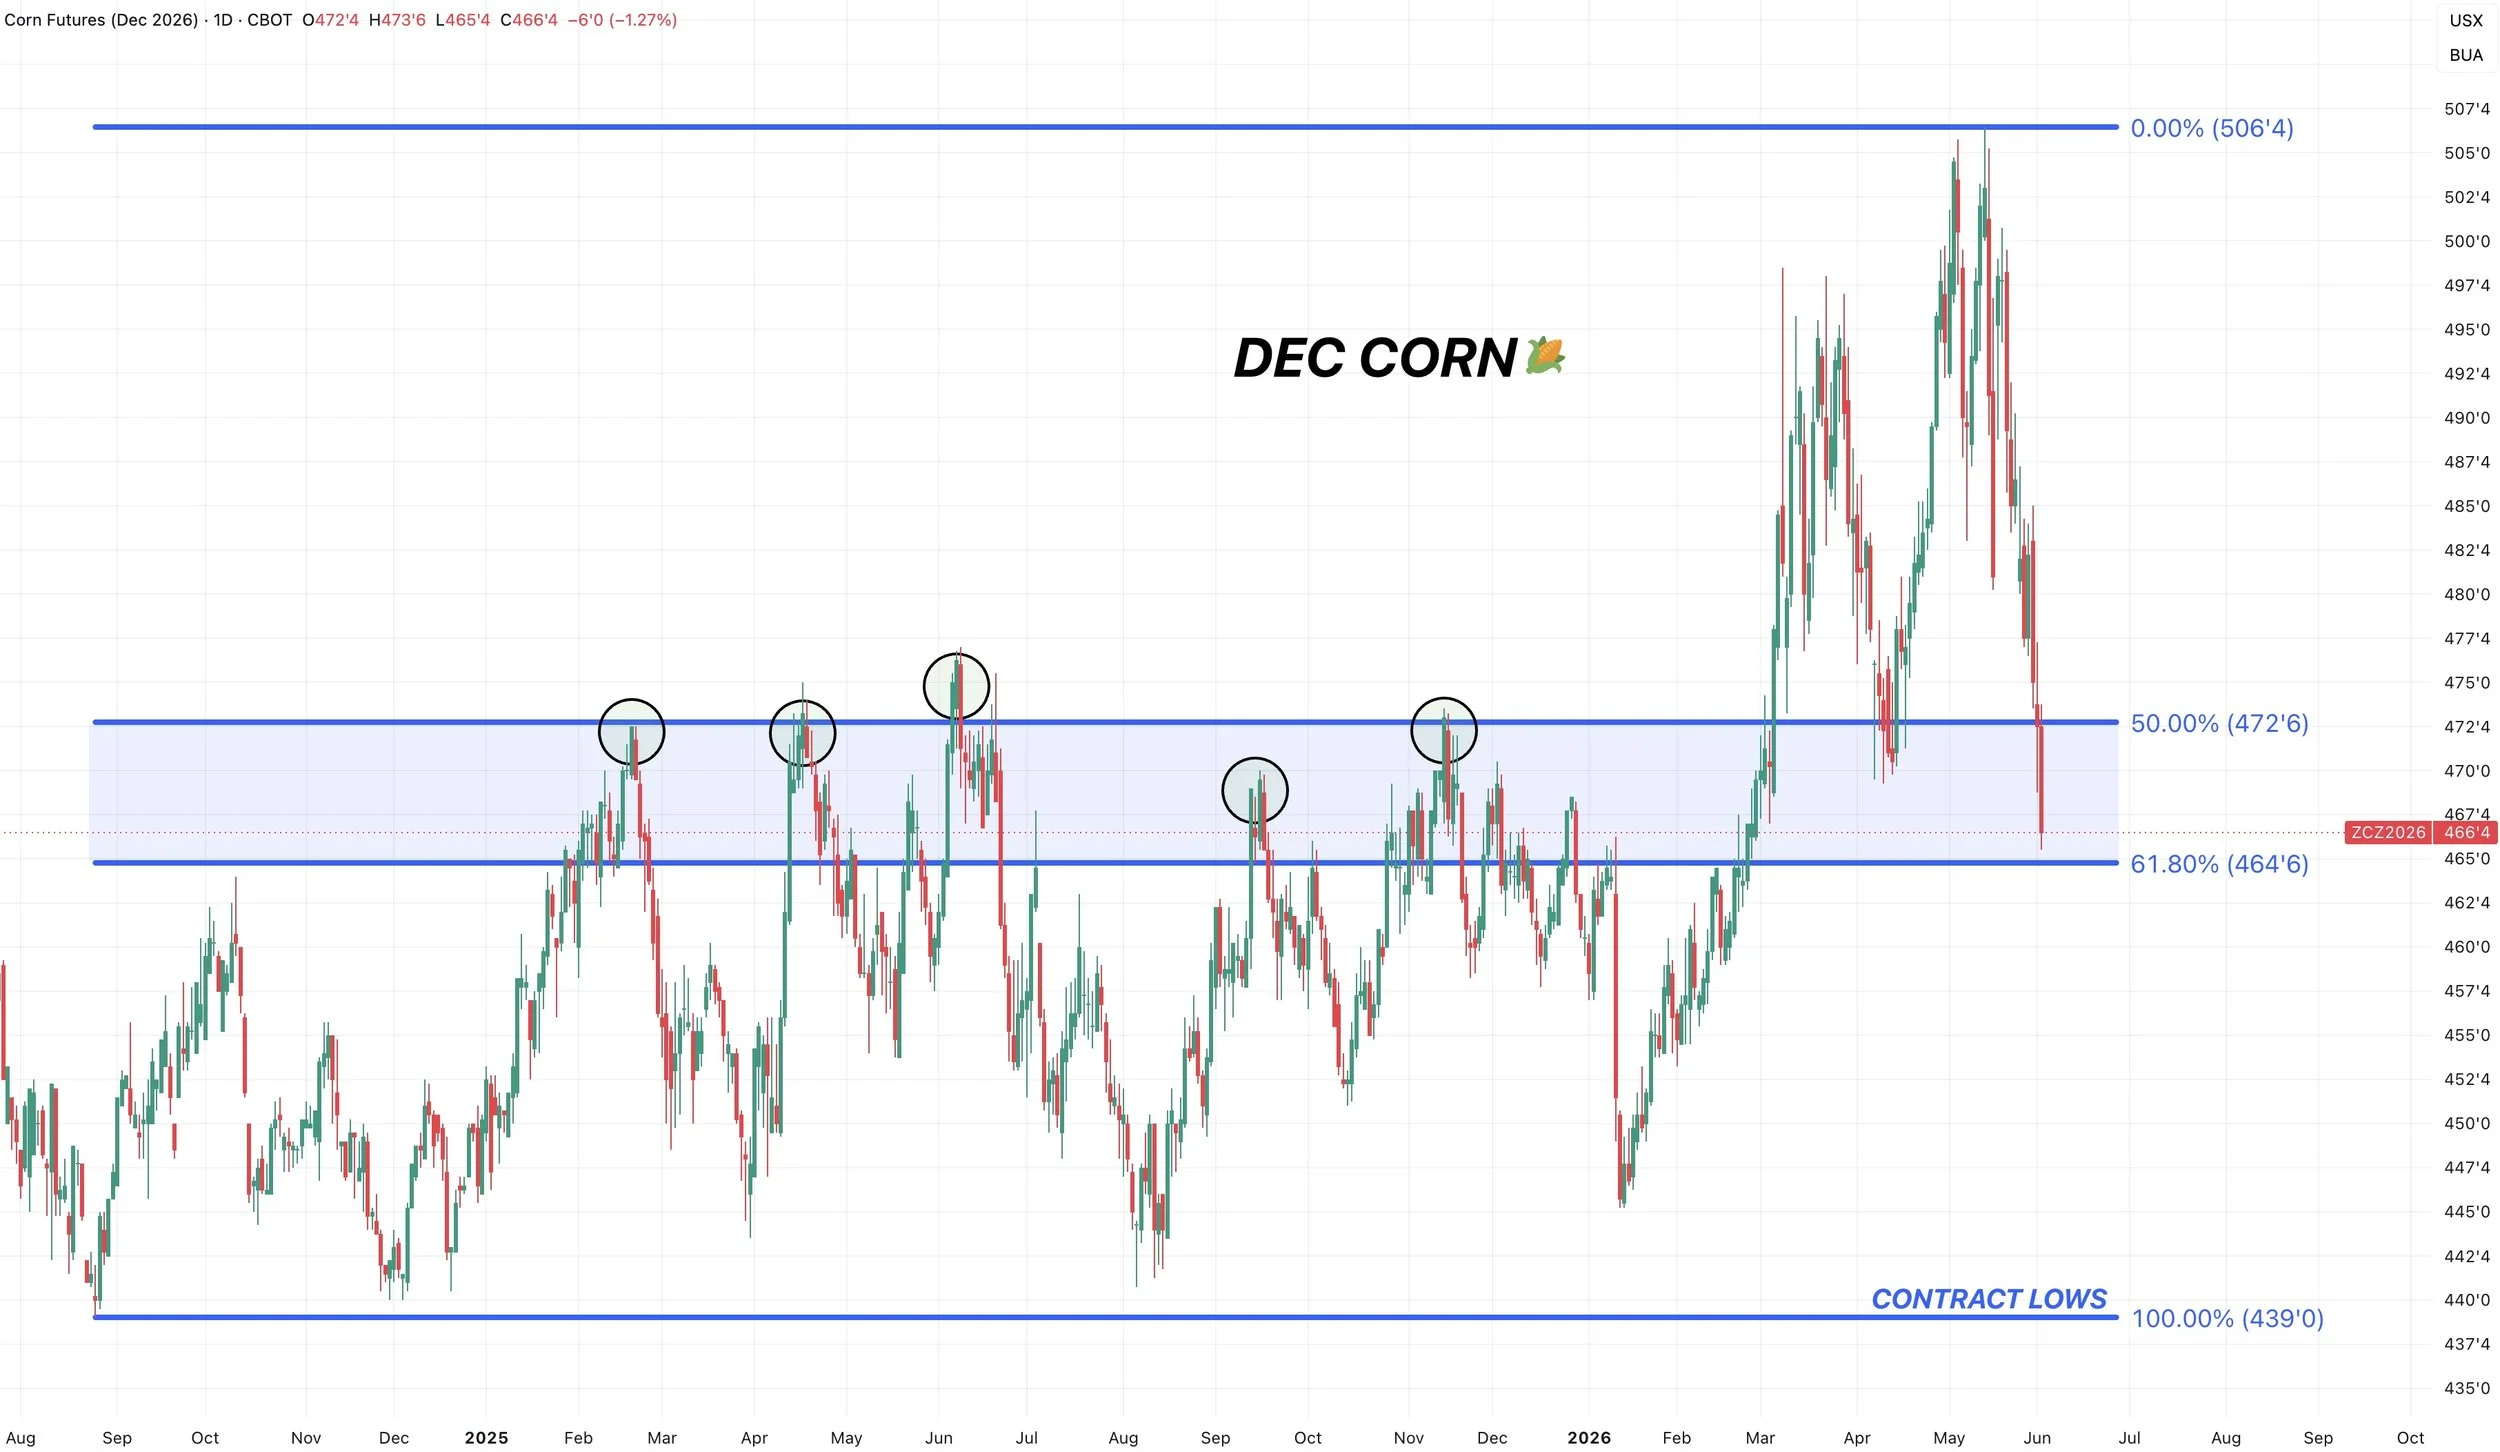
Dec Corn Chart:
Dec corn also broke some key support.
As we broke below those April lows.
Which also gave back 61.8% of the highs down to those January lows.
This tells us that the structure and trend has likely overall shifted lower.
We've actually now given back the entire war rally. Lower than where we were before it all started.
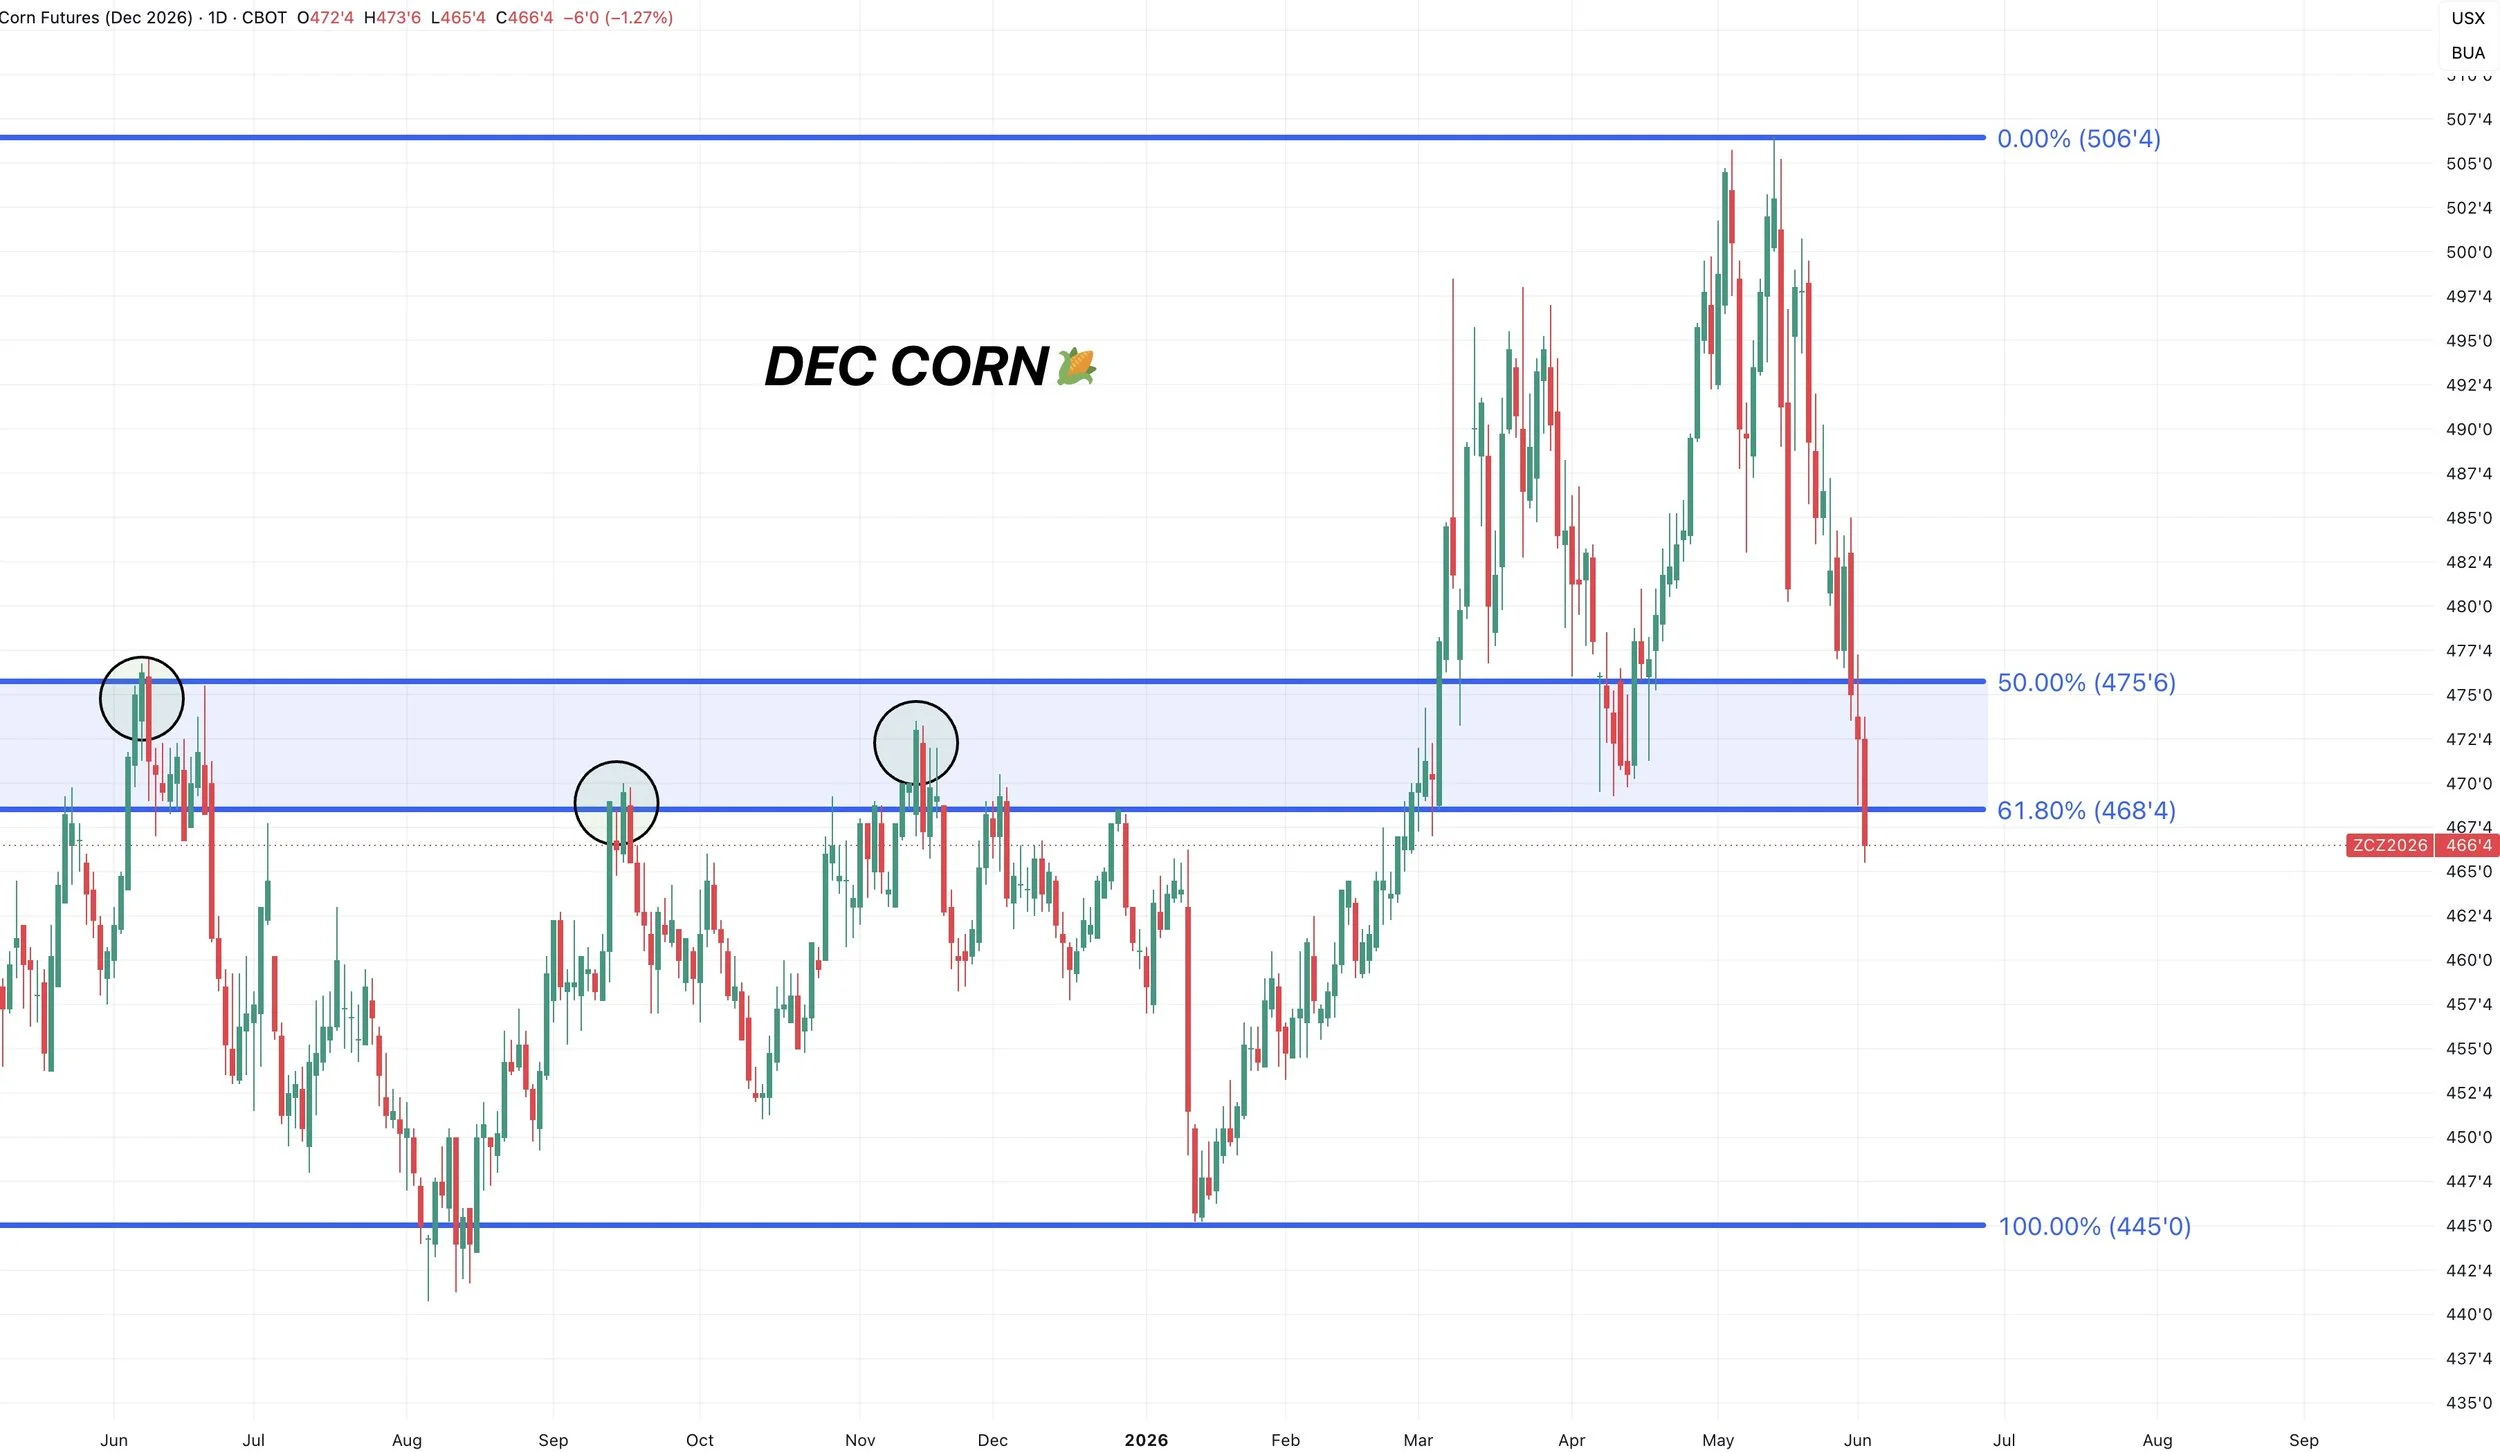
But that also does not mean we cannot receive a bounce out of here.
If you take the recent highs, all the way down to the contract lows, we are sitting right at the 61.8% level.
So we'd like to see a relief bounce soon or it does open the door even lower.
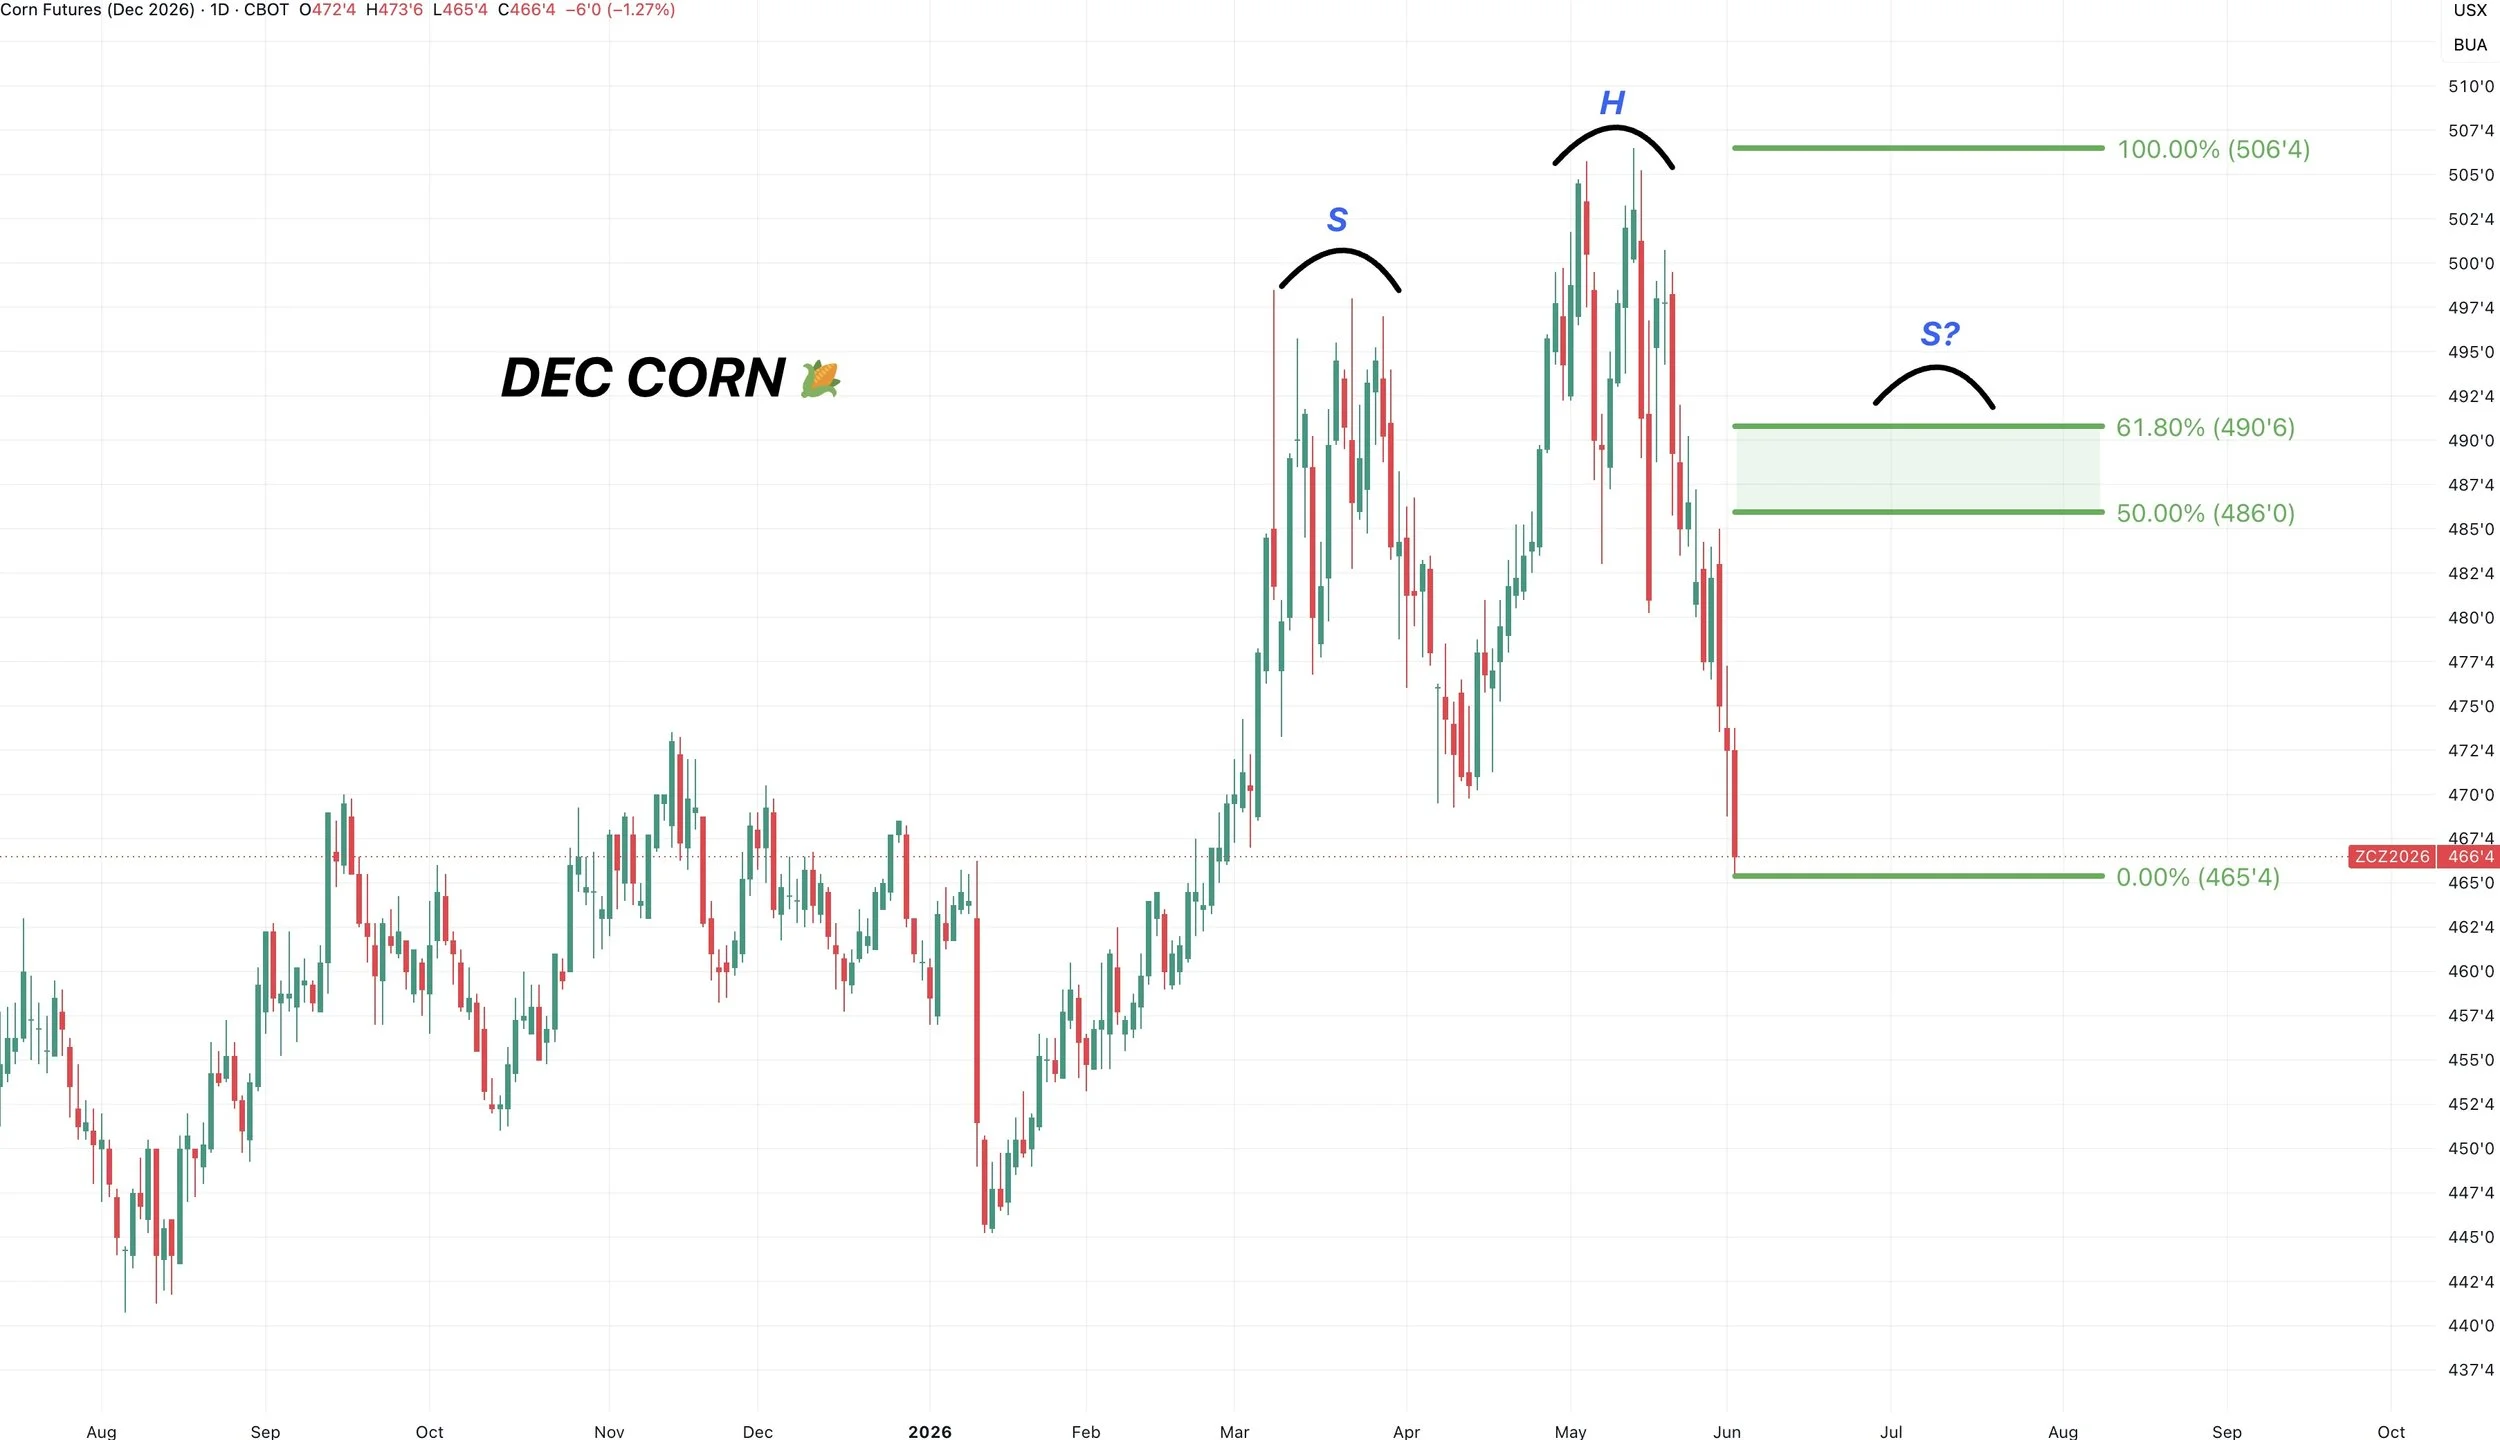
If we happened to get a relief bounce here, we again want to look to reward it. Especially those who move off the combine.
If we clawed back 50% to 61.8% of the sell off, it would put us around $4.85 to $4.90
That is going to be the most common spot for a relief bounce.
That would also set up a potential head and shoulders pattern as well.
Soybeans
Soybeans tend to hold up better than corn does in June and sometimes extends that seasonal pressure window further out comapred to corn.
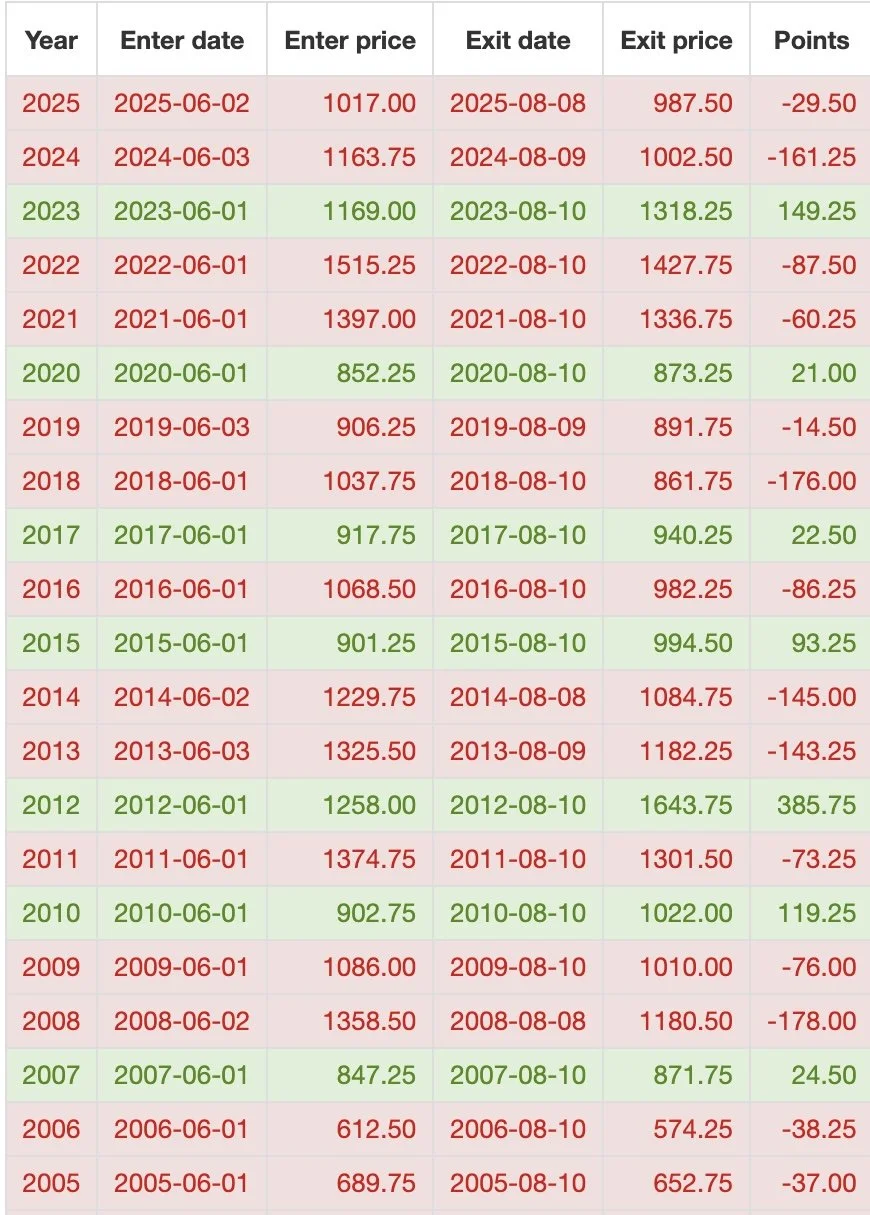
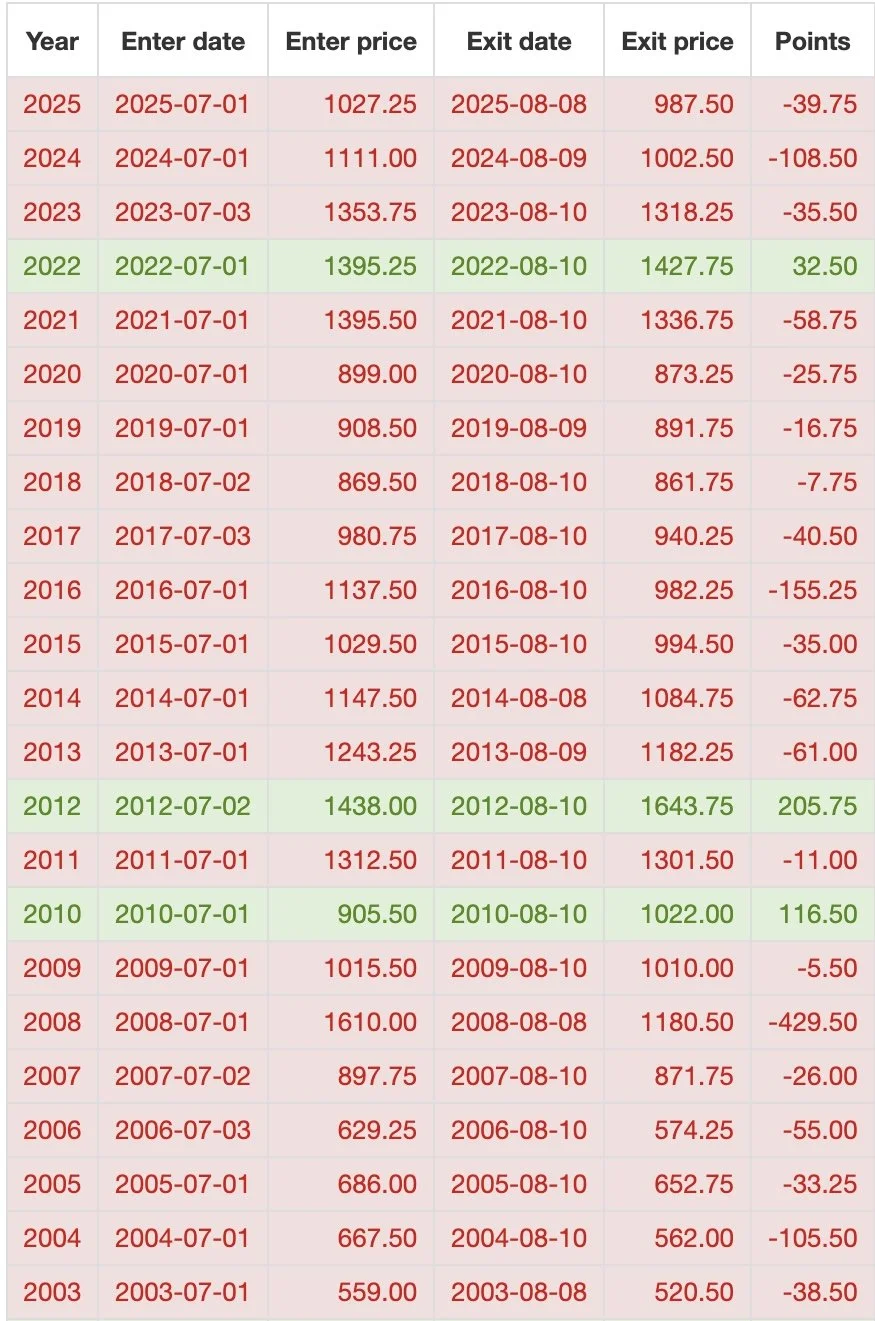
Here is the seasonal data for soybeans from today by August 10th.
We've been lower the last 4 of 5 years.
Lower the last 7 of 10 years.
Now here is some more seasonal data.
Here is soybeans on July 1st to August 10th.
Lower the last 13 of 14 years.
Lower the last 20 of 23 years.
That is some pretty powerful data.
So July tends to be pretty negative for soybeans.
Fundamentally, there isn’t a ton of fresh news.
We haven’t seen China step in and buy yet.
Weather isn’t providing any threats as of right now, but that doesn’t mean we are going to raise a perfect crop. There is still an entire growing season ahead of us.
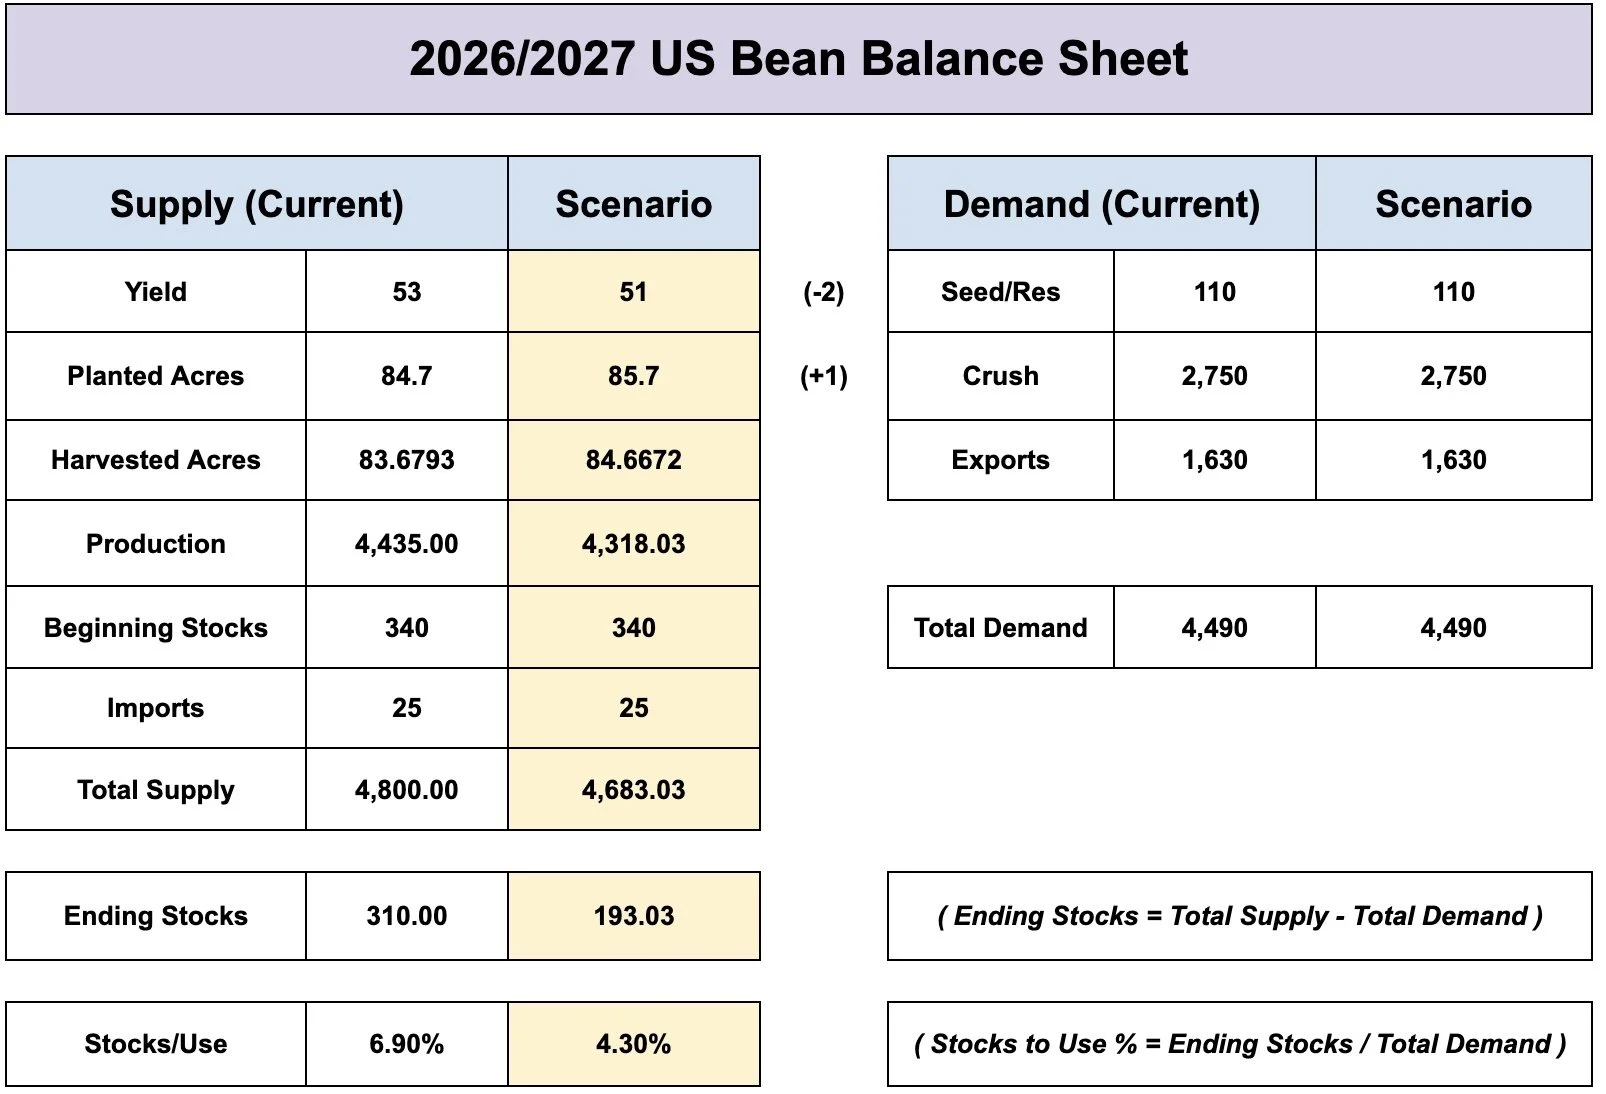
The new crop soybean balance sheet still doesn’t offer a ton of wiggle room even if acres end up being raised like I think they will.
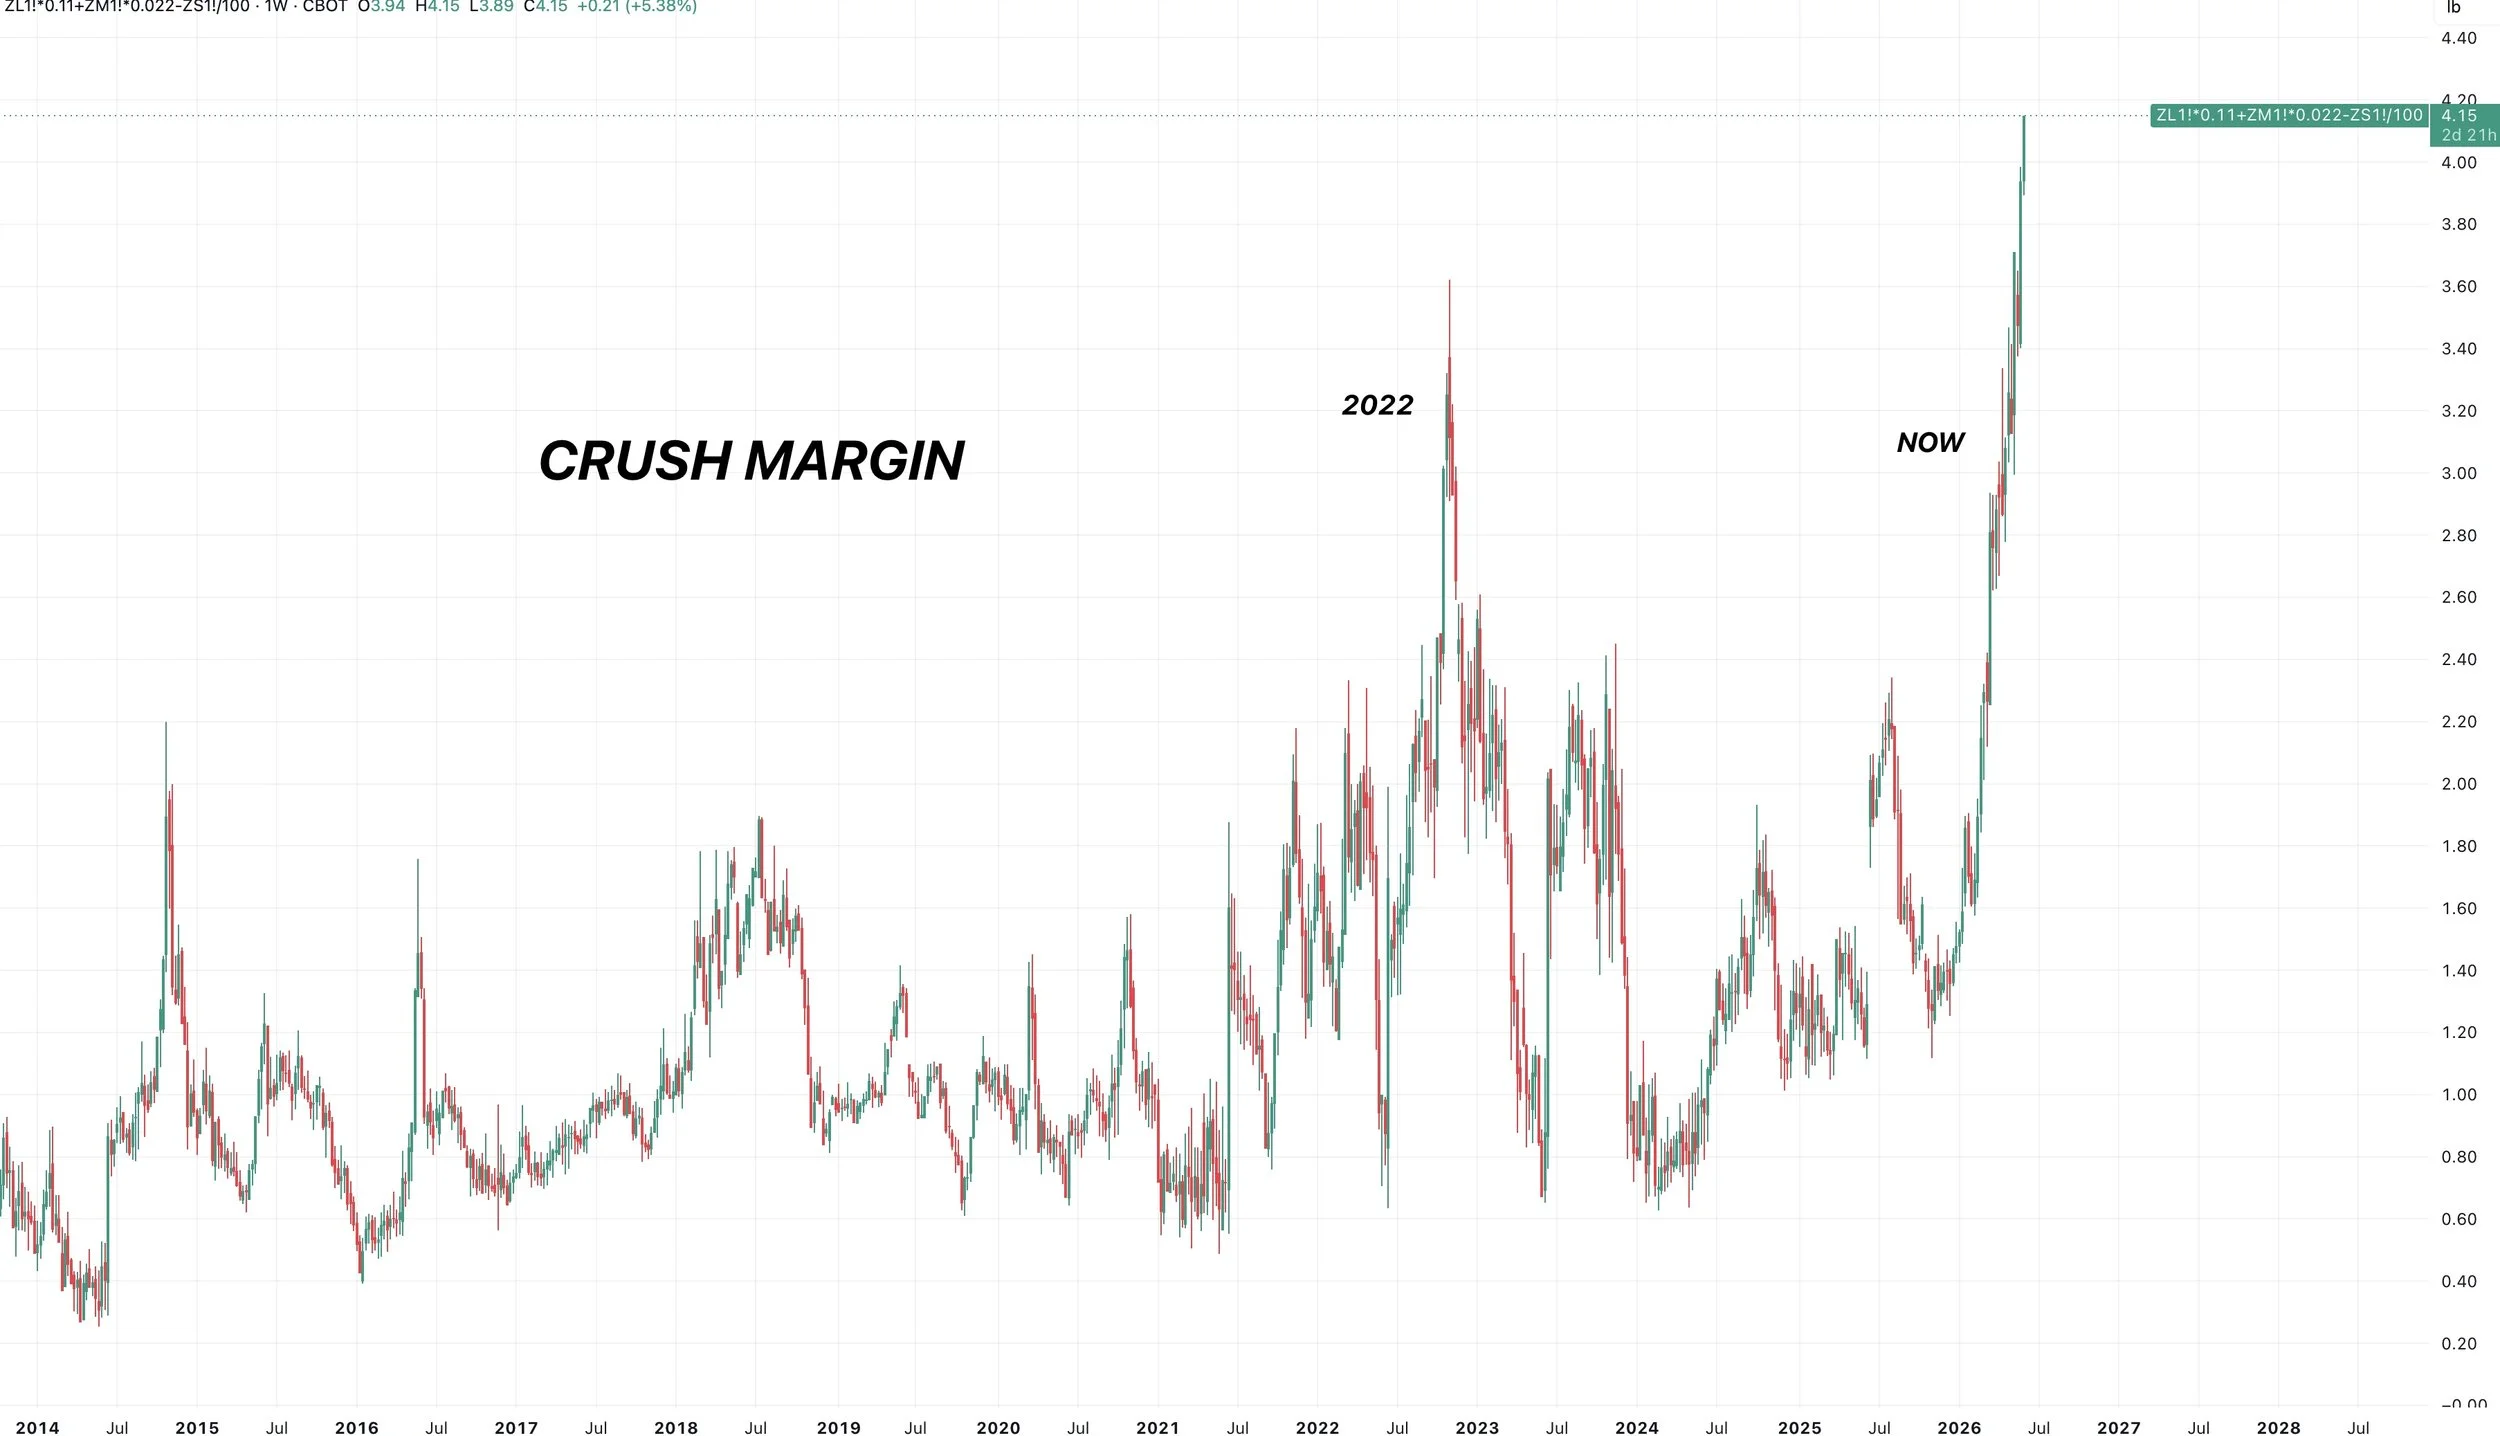
Exports suck but crush demand remains phenomenonal
Look at the crush margins.
They continue to be on a tear. Sitting at record highs.
This is bullish for soybean demand and the best thing soybeans have going for them.
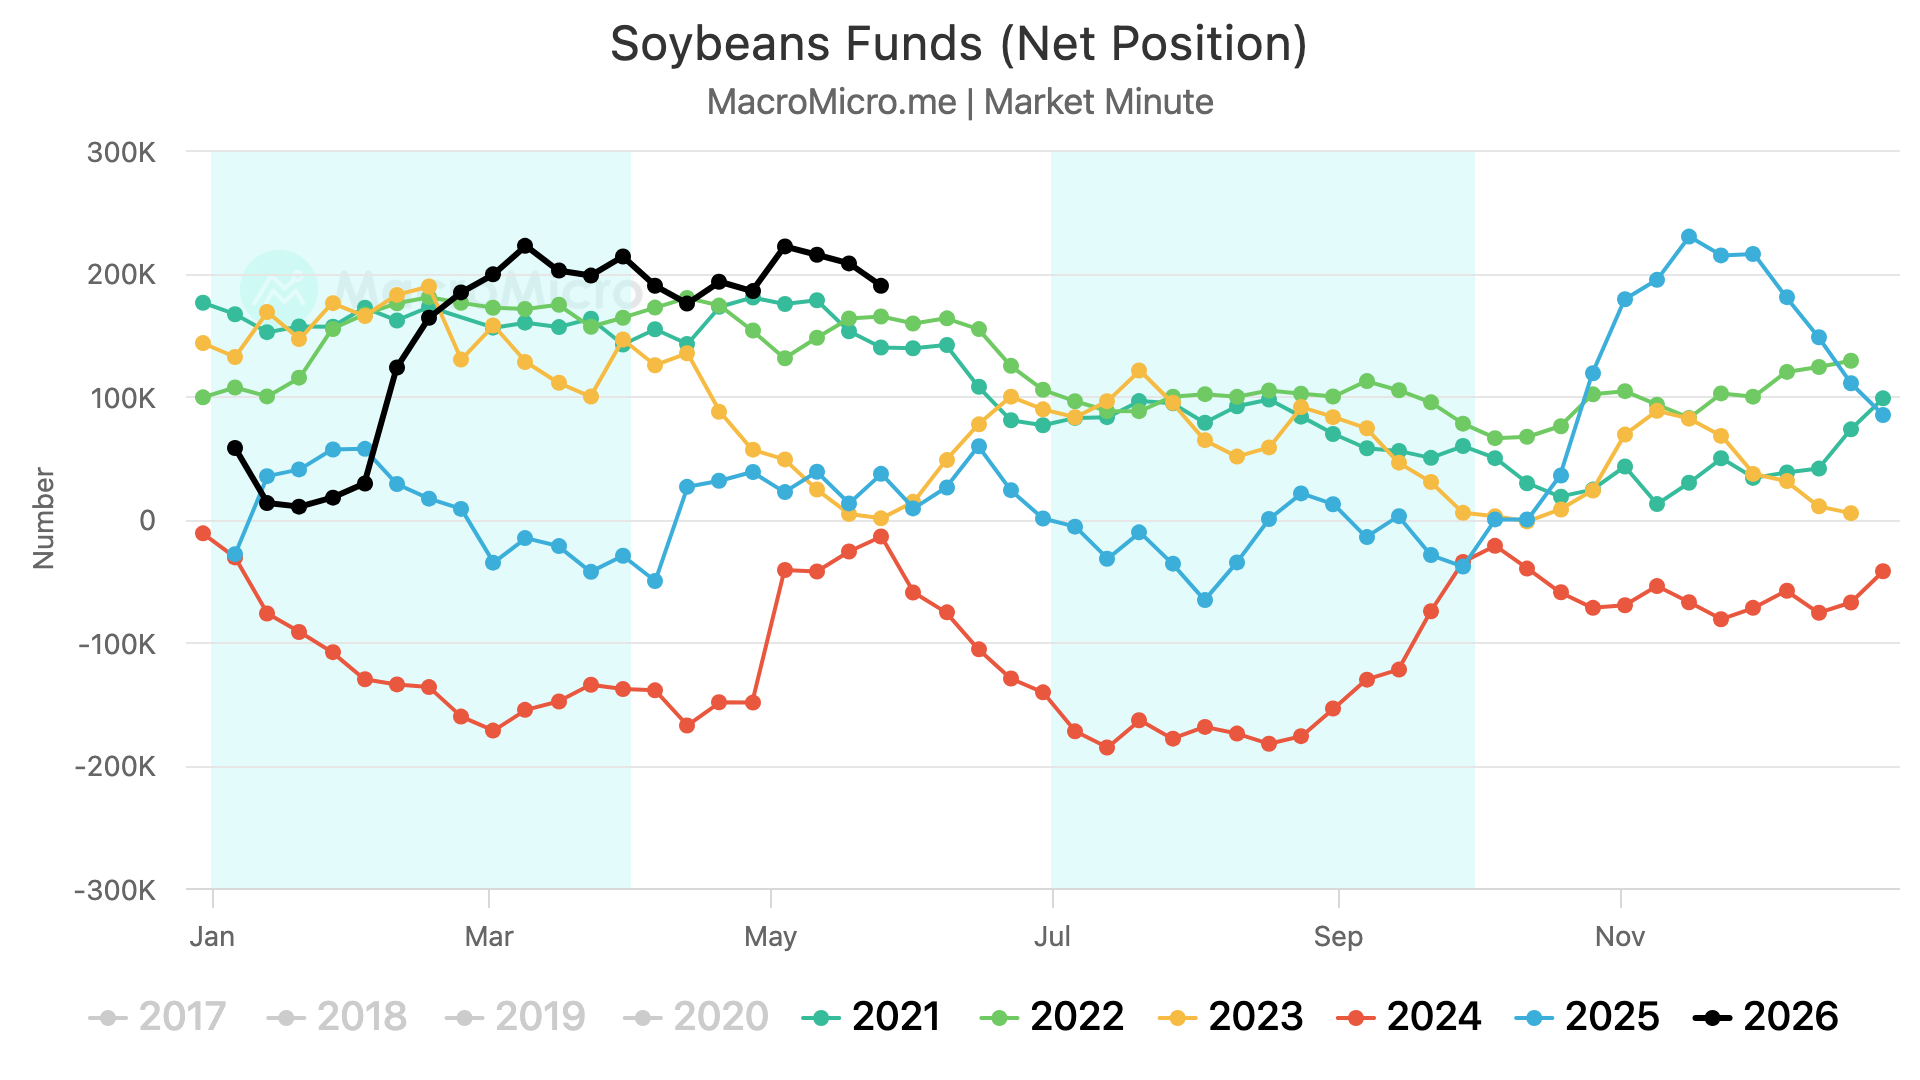
One thing that has to make a guy nervous is the funds.
They are record long the entire soybean complex.
They sold a large chunk of their corn position, but are still holding a rather large soybean position.
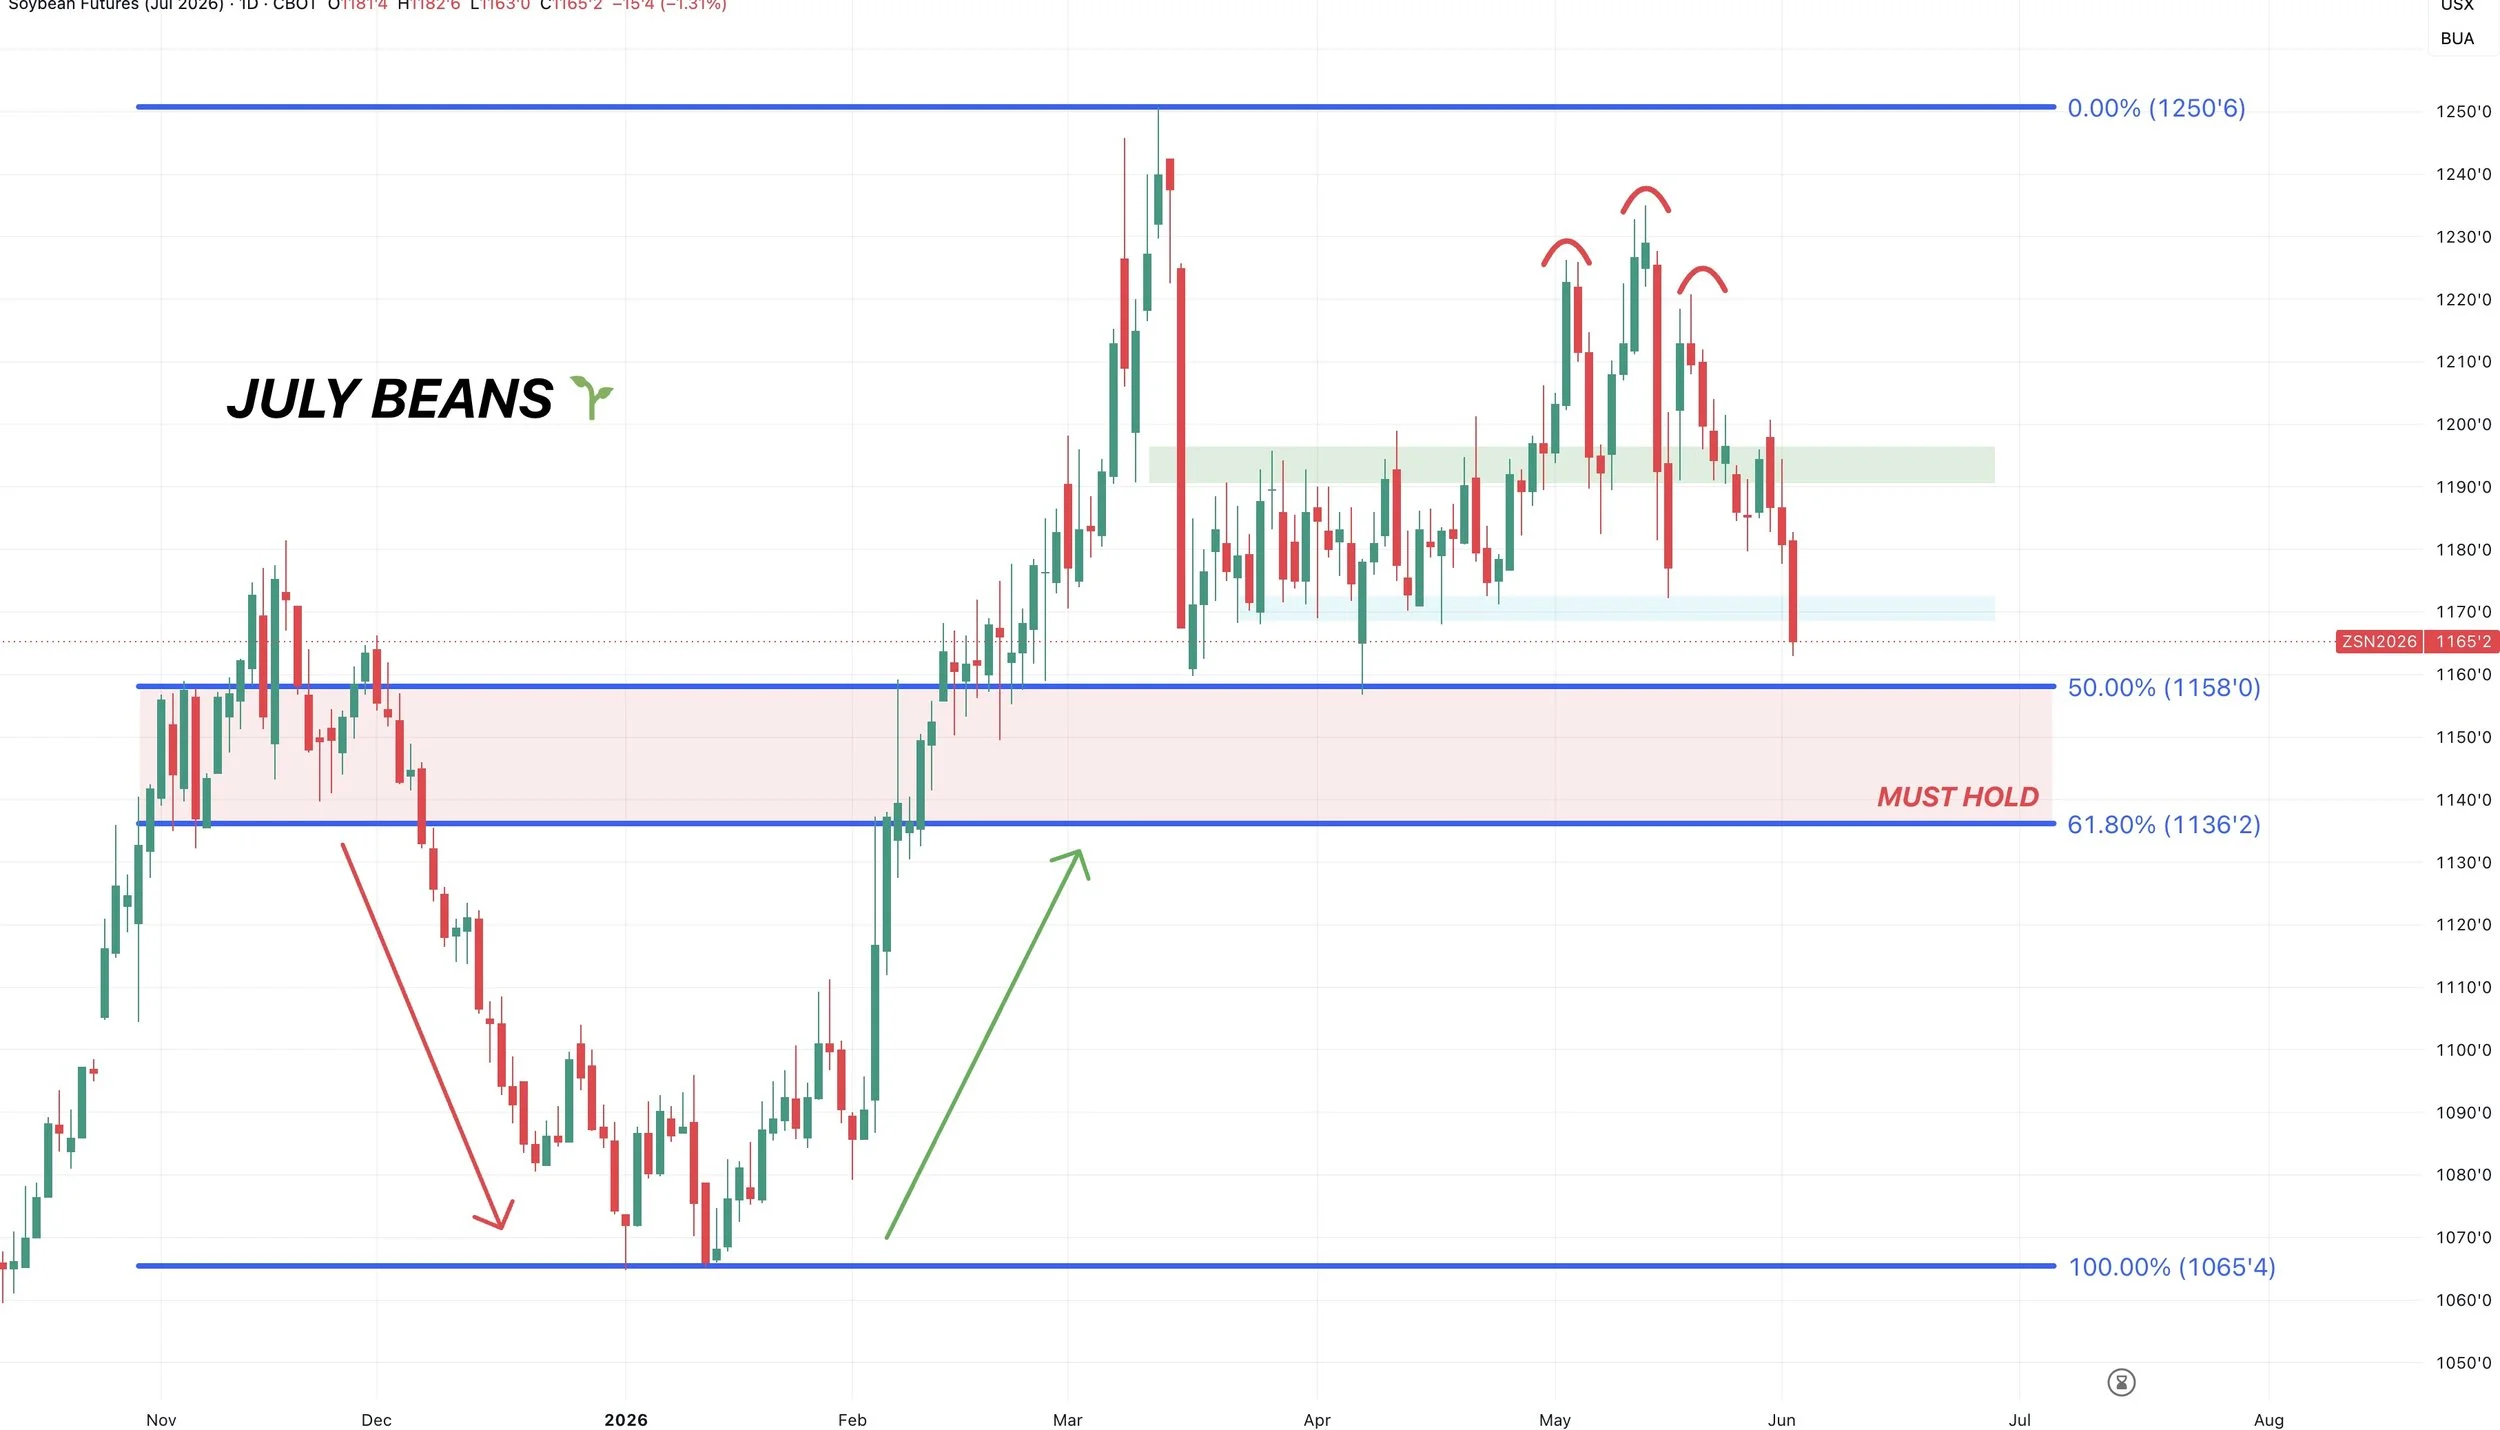
July Beans Chart:
We are right at the bottom of the range now.
Fulfilling that head and shoulders pattern.
If we break below $11.60 we could very head into the red box.
The must hold level to keep the bias higher long term is $11.36
That gives back 61.8% of the entire rally from January.
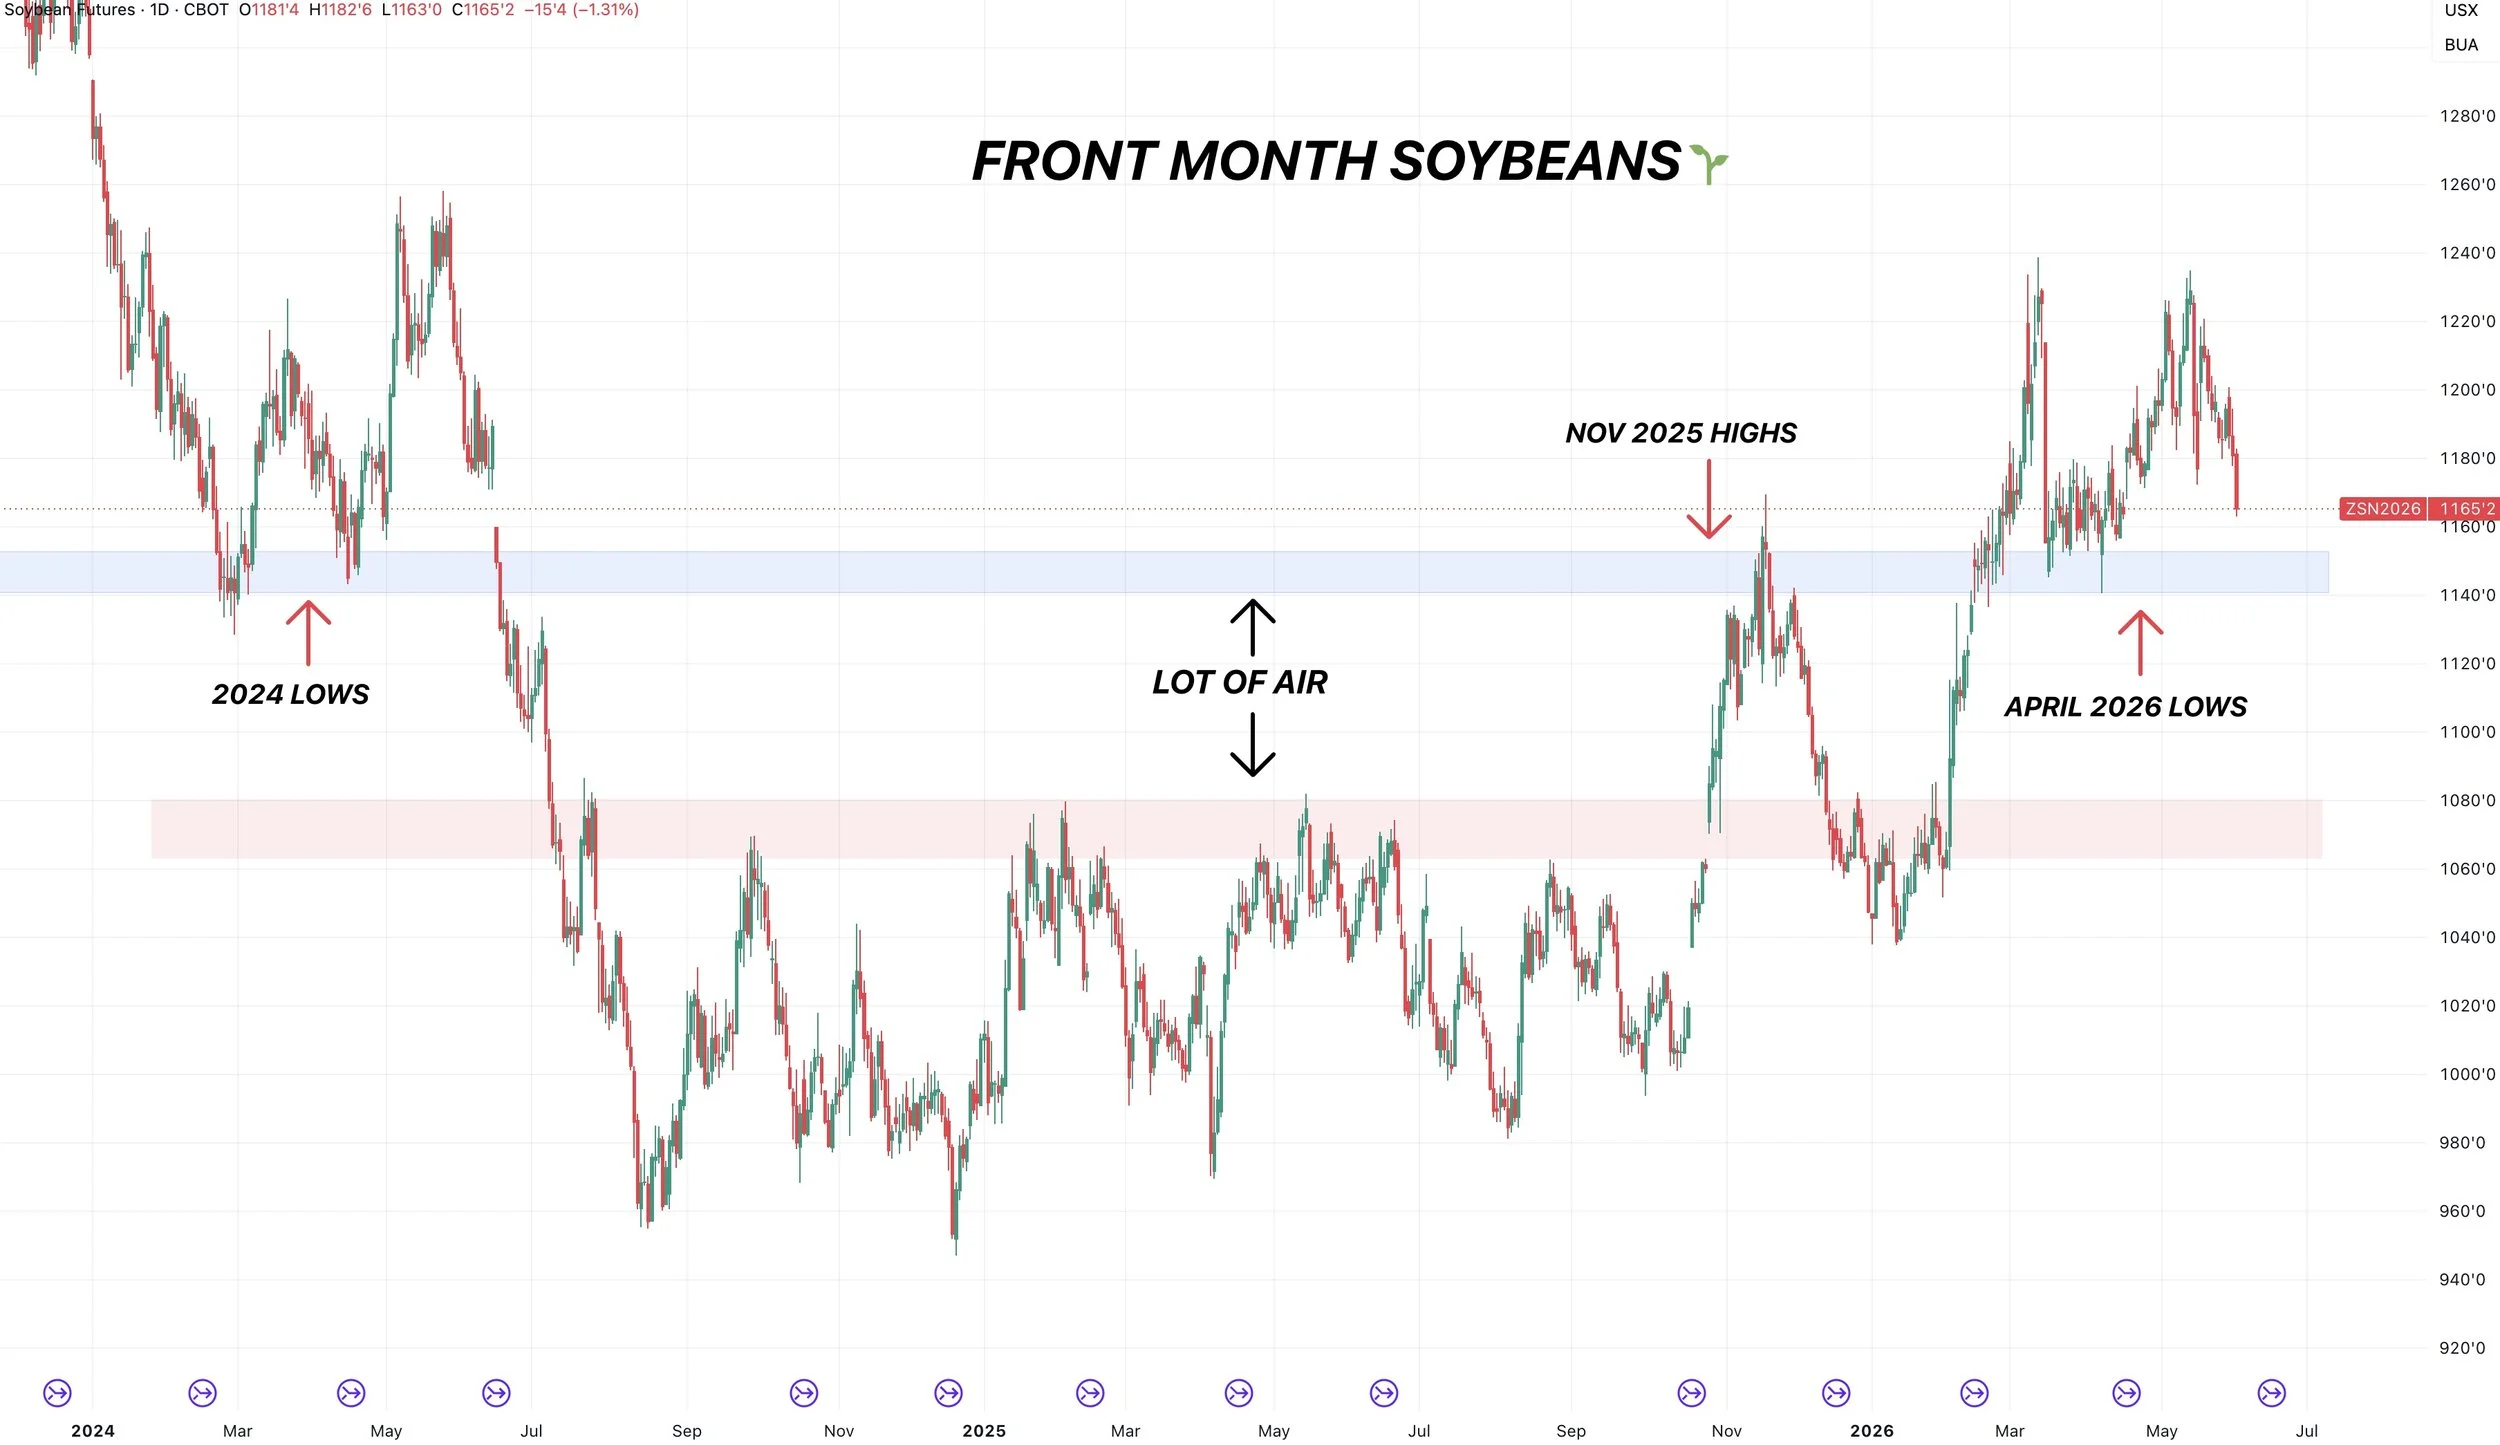
Front Month Beans Chart:
Here is more evidence as to why that $11.35 to $11.40 level is so crucial.
On the front month chart, there is some major air beneath that level.
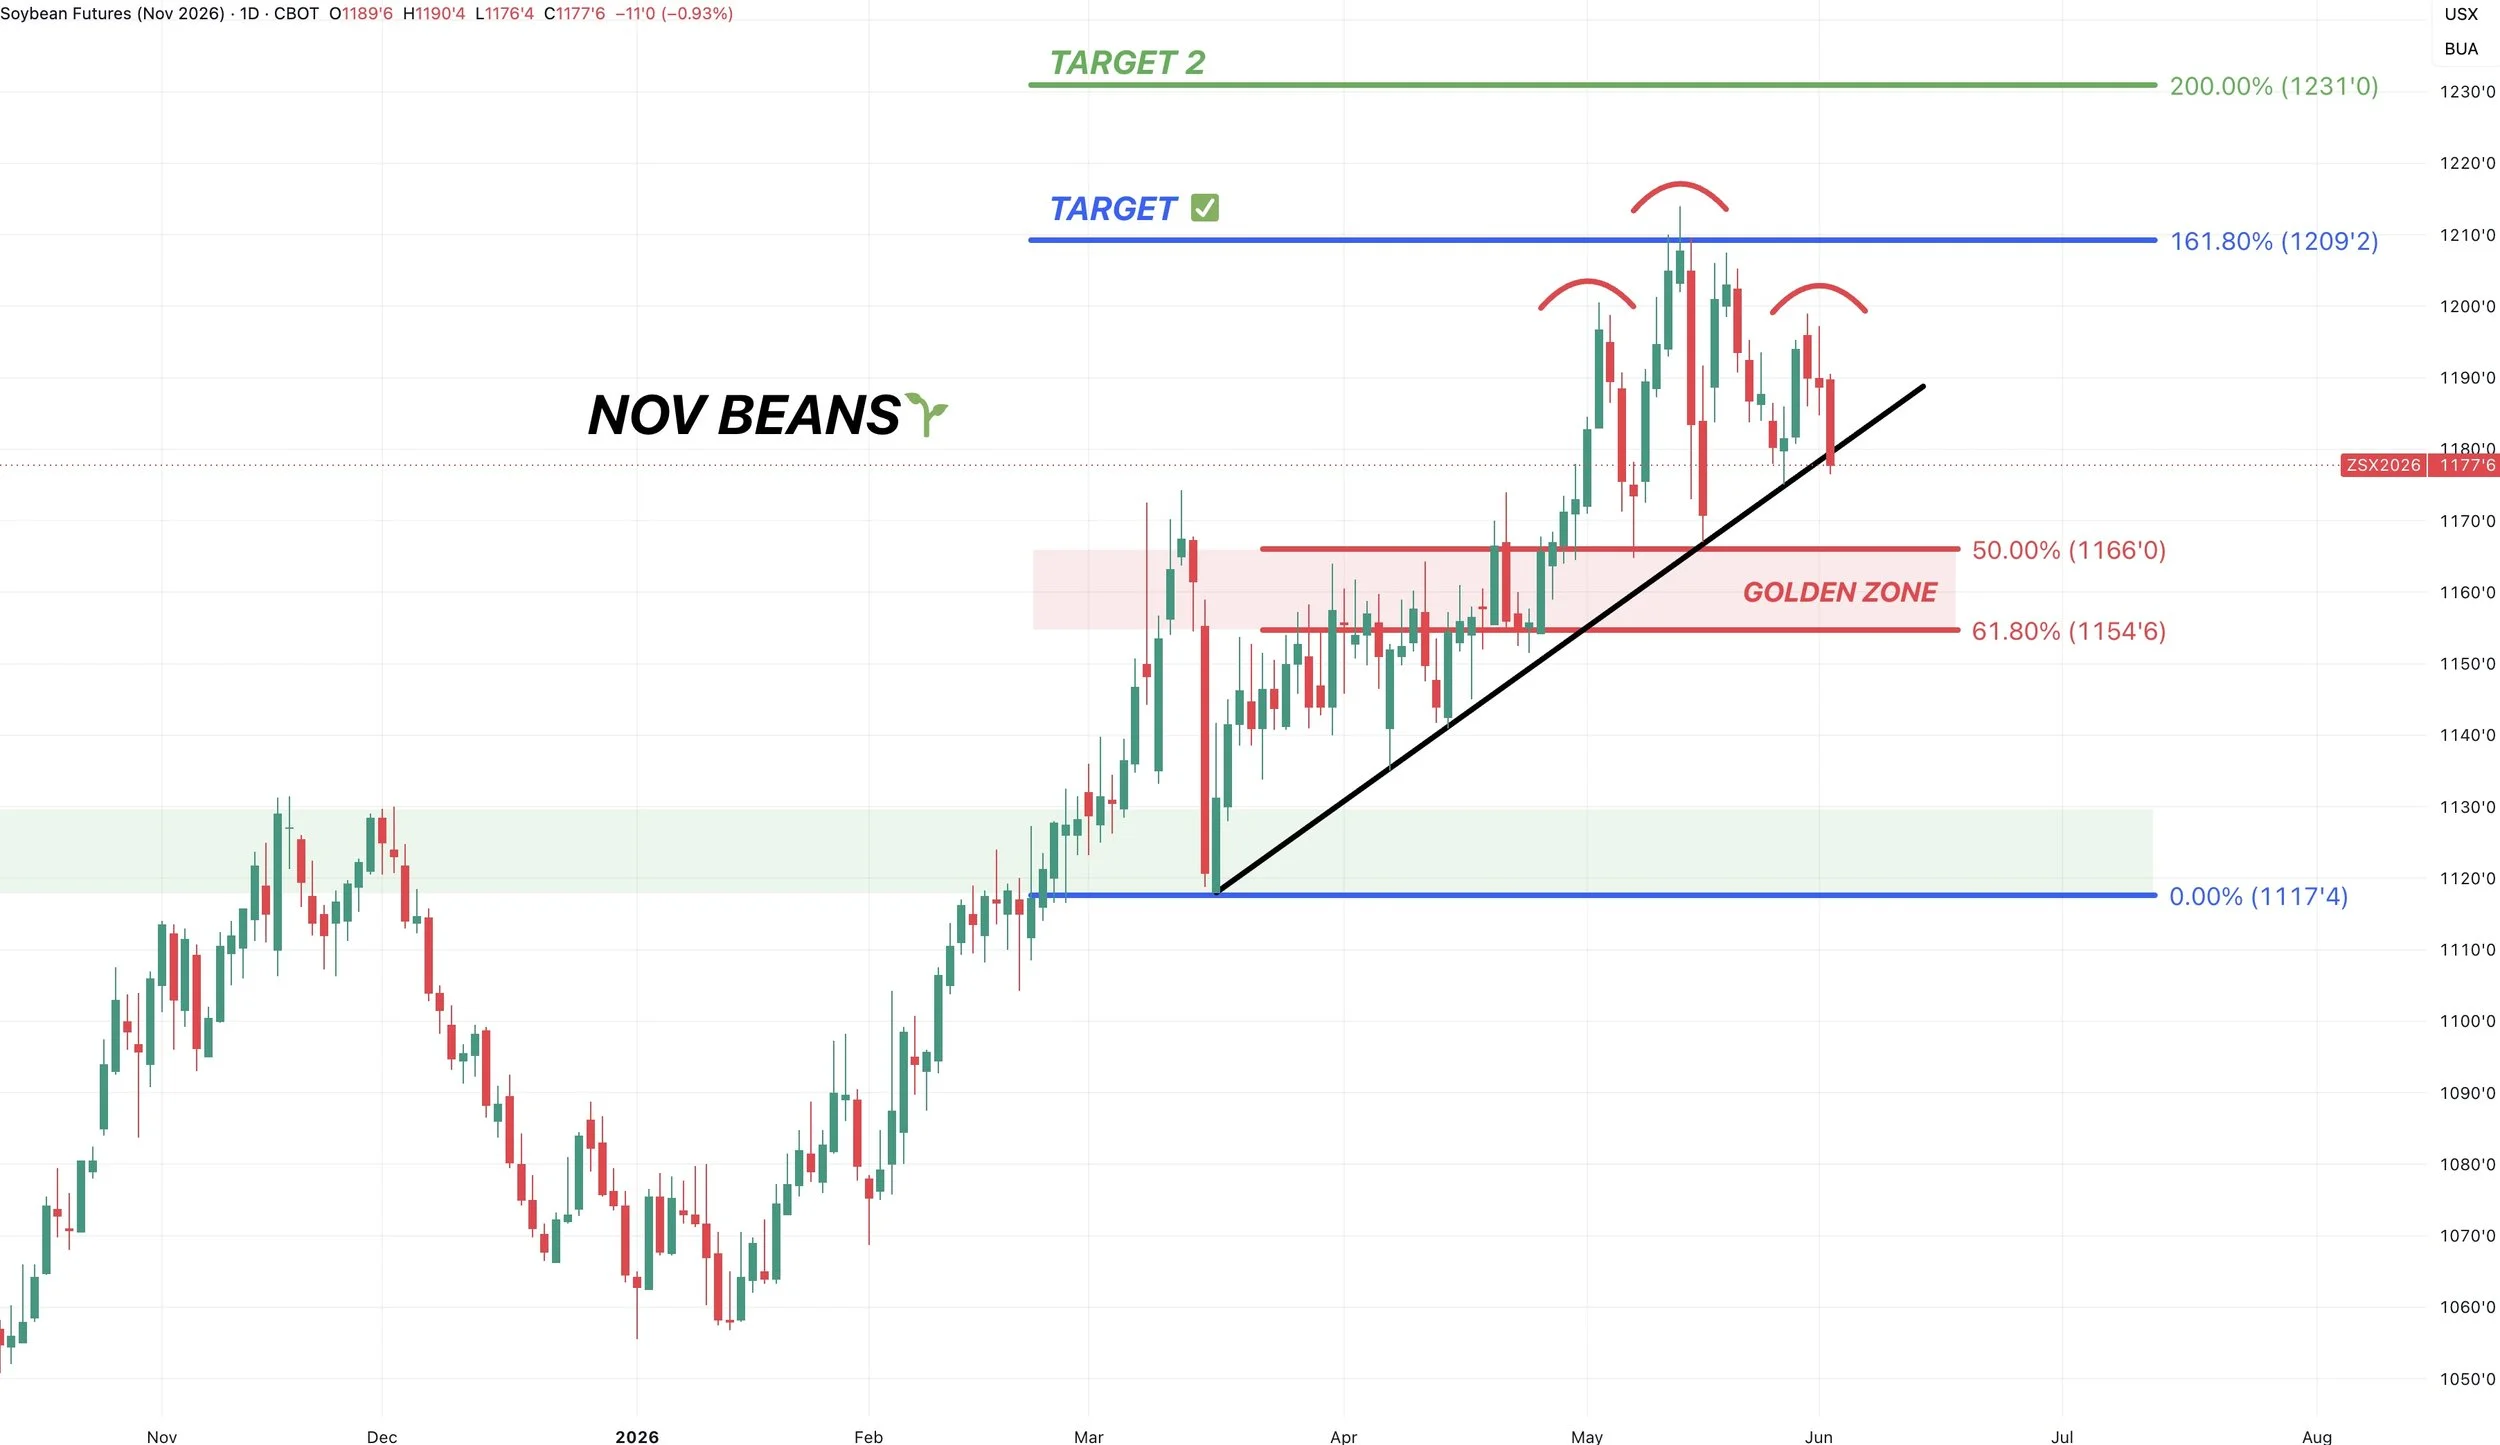
Nov Beans Chart:
We had that sell signal at $12.09
Nov beans are still one of the strongest charts of all the grains.
However, we are starting to possibly break below this uptrend we've held since March.
If we start to break below, we could head towards the red box.
The must hold spot is $11.55. Which gives back 61.8% of the rally from March.
One thing I'm being cautious of is the potential head and shoulders pattern we have.
Wheat
The drought story has clearly been priced in for now.
The wheat market has been lower all but ONE singular day since that limit up move back on May 12th nearly a month ago.
Seasonally, we see pressure heading into harvest, which we are seeing.
Typically, that pressure continues before lightening up in July, before fully carving out some lows in the fall
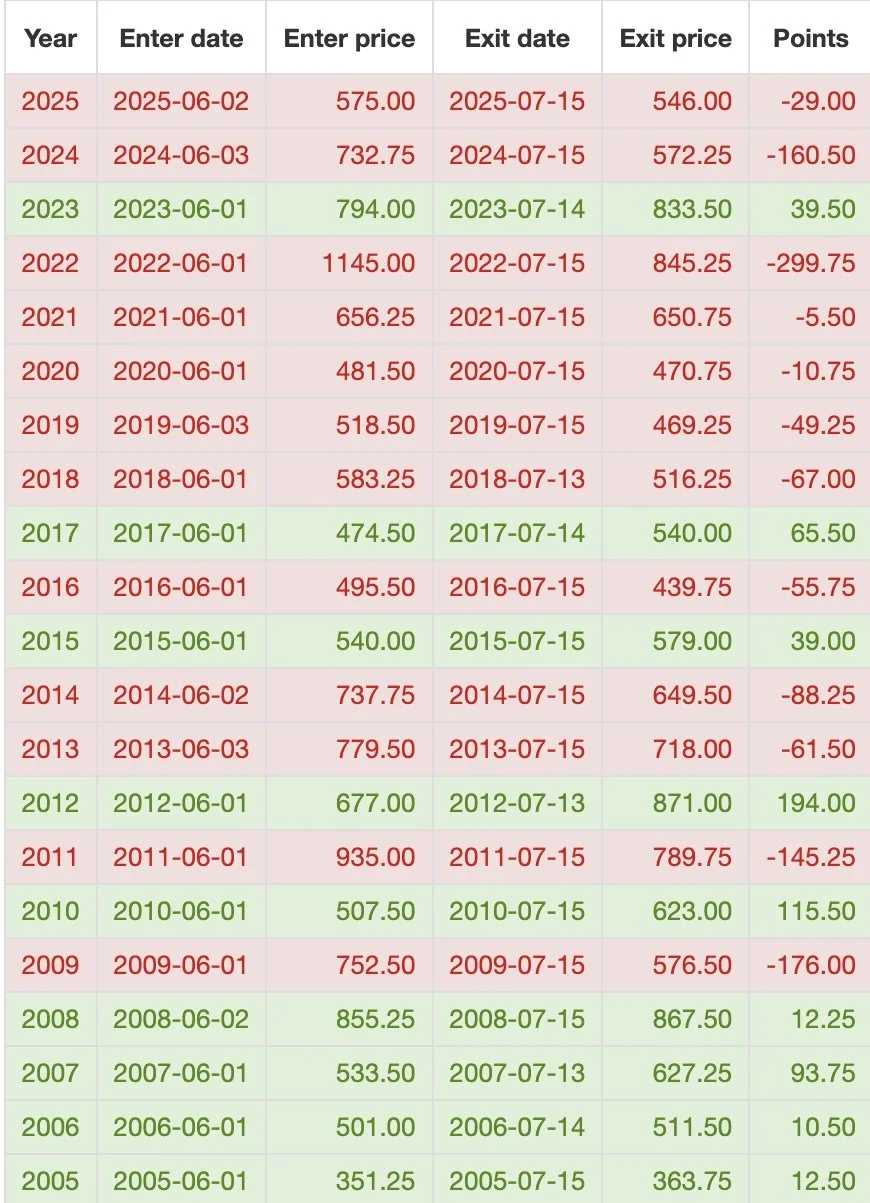
From today by July 15th, the wheat market has traded lower the last 8 of 10 years.
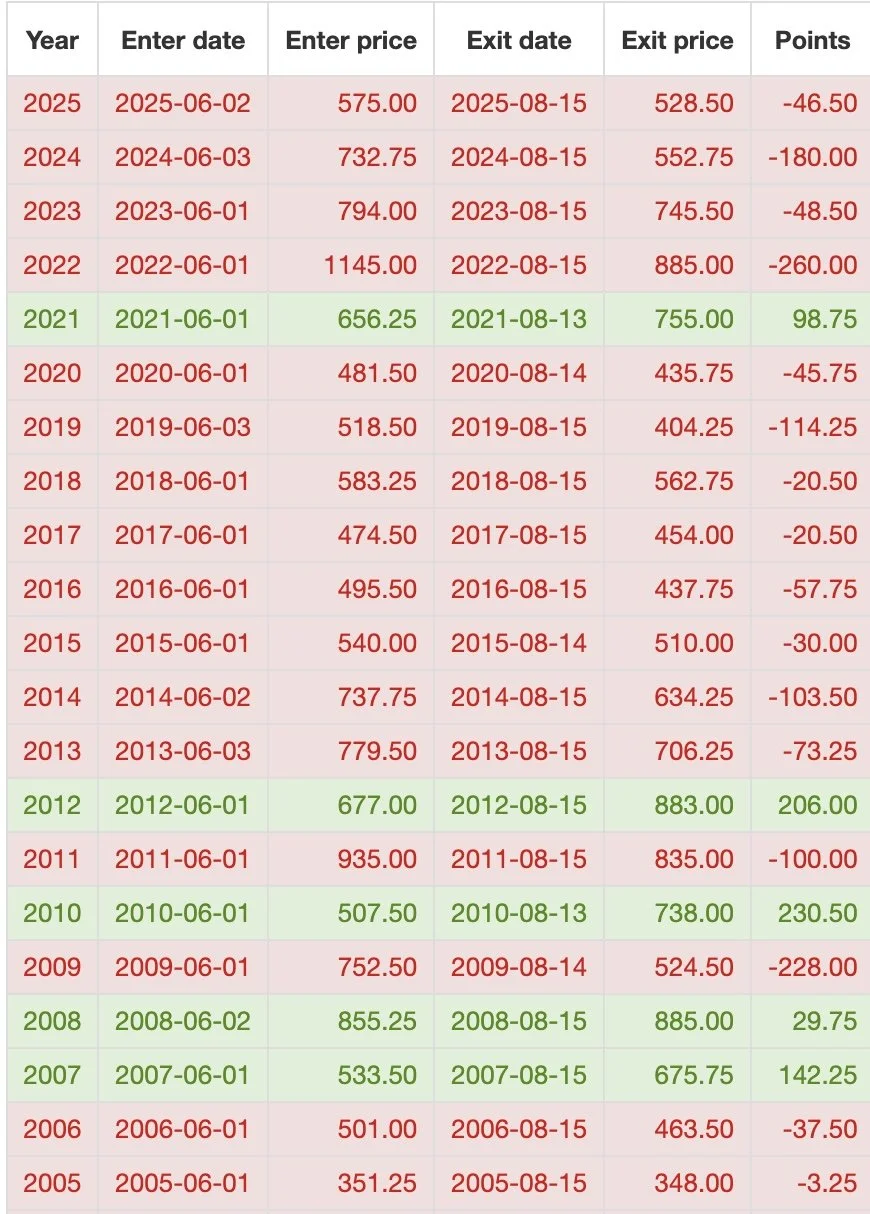
From today by August 15th, wheat has traded lower the last 12 of 13 years.
So seasonally, this is a bearish time frame for wheat.
That doesn’t mean it has to be a free fall like it's been the last few weeks, but that's the data by mid-August.
Short term, there is no real story now that we've priced both drought and the war premium.
There really isn’t a reason to justify us going much higher right now.
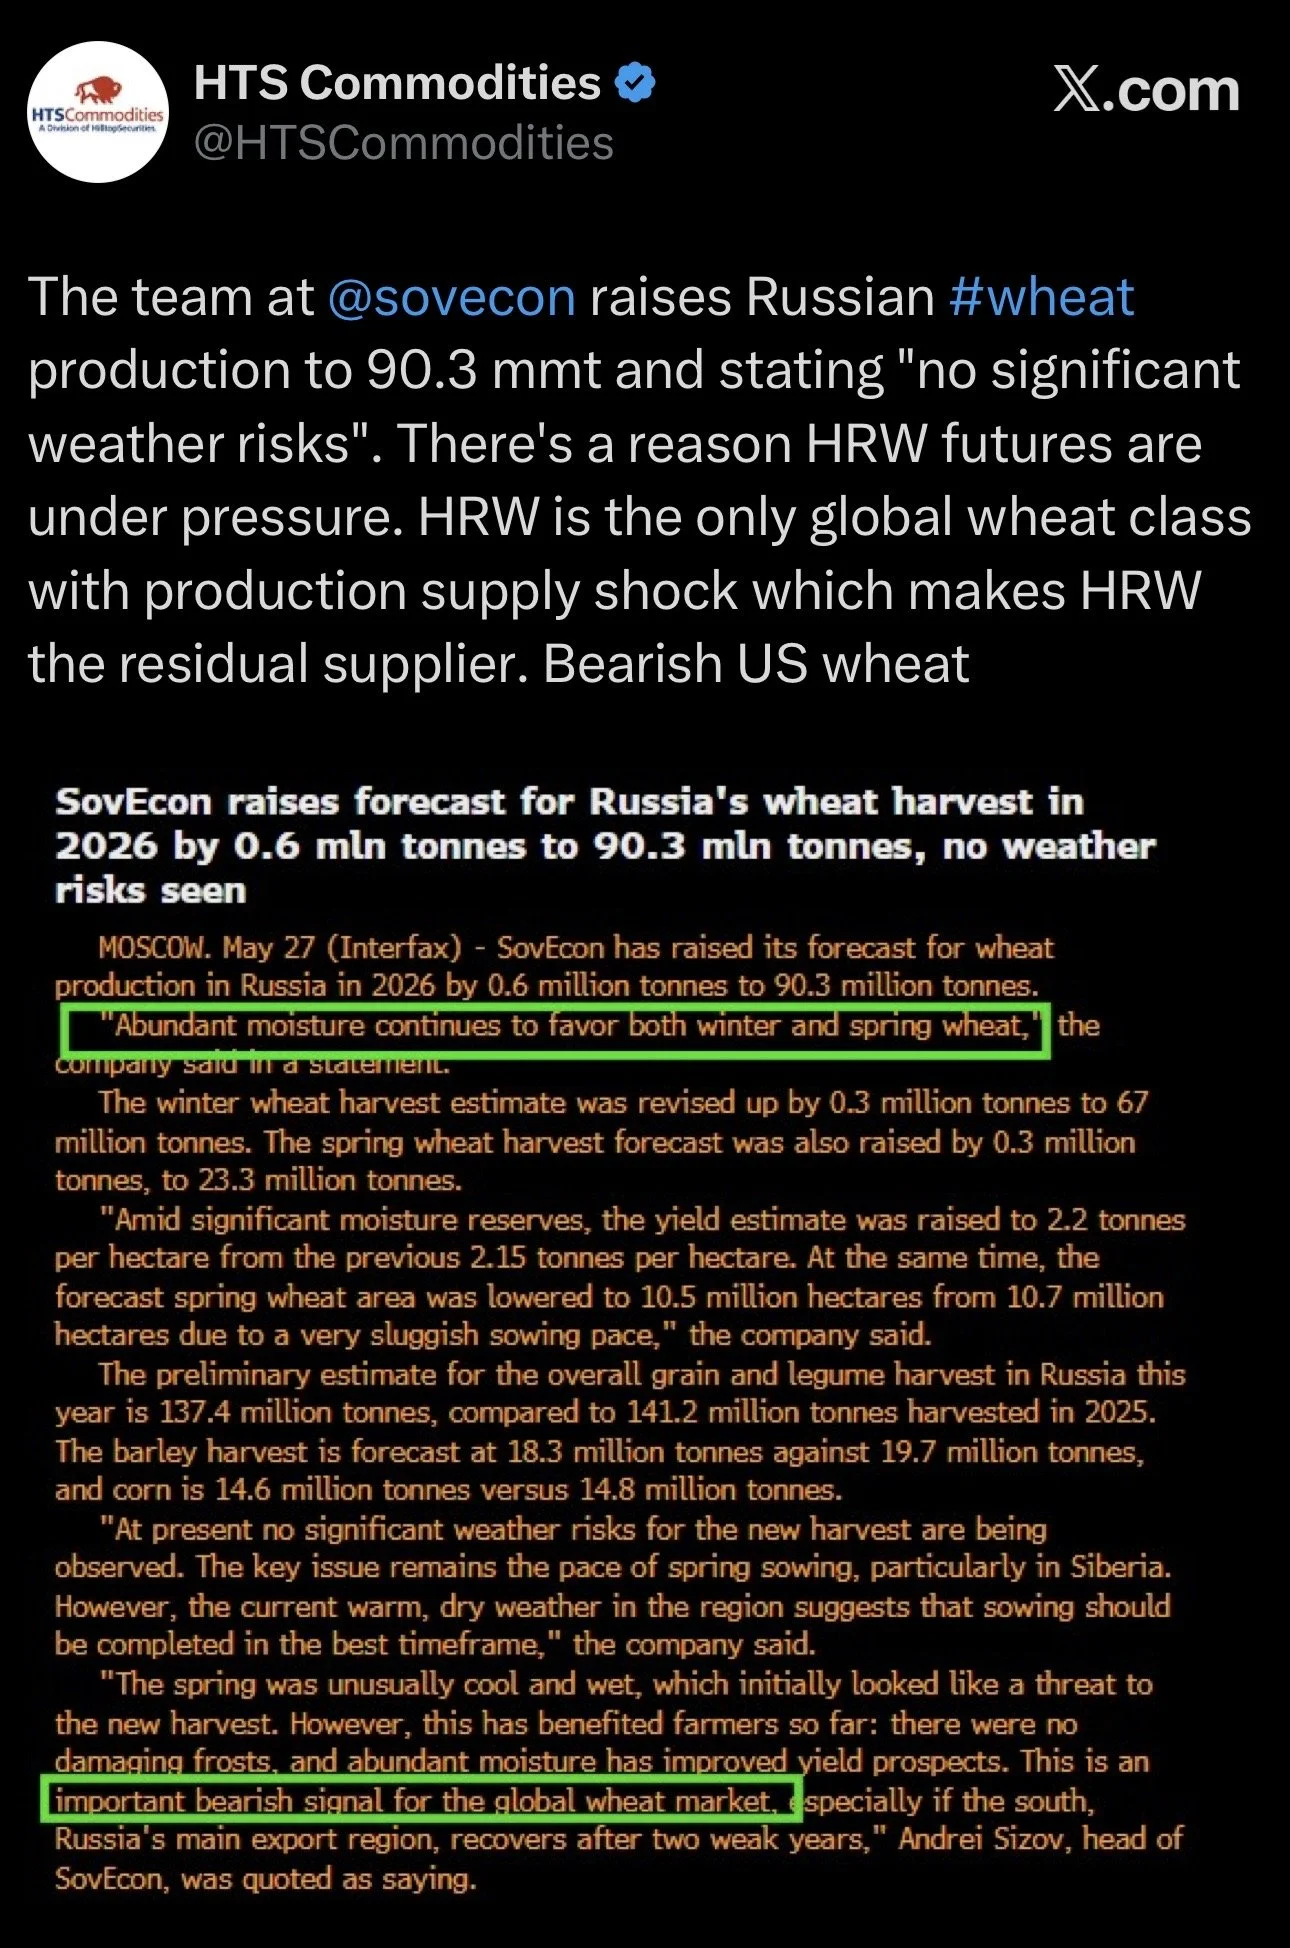
You have major countries such as Russia who aren’t seeing any sort of weather scares at all.
Which would be viewed as a bearish factor when looking at the global wheat market as whole.
But long term, wheat still has a story looking towards next year.
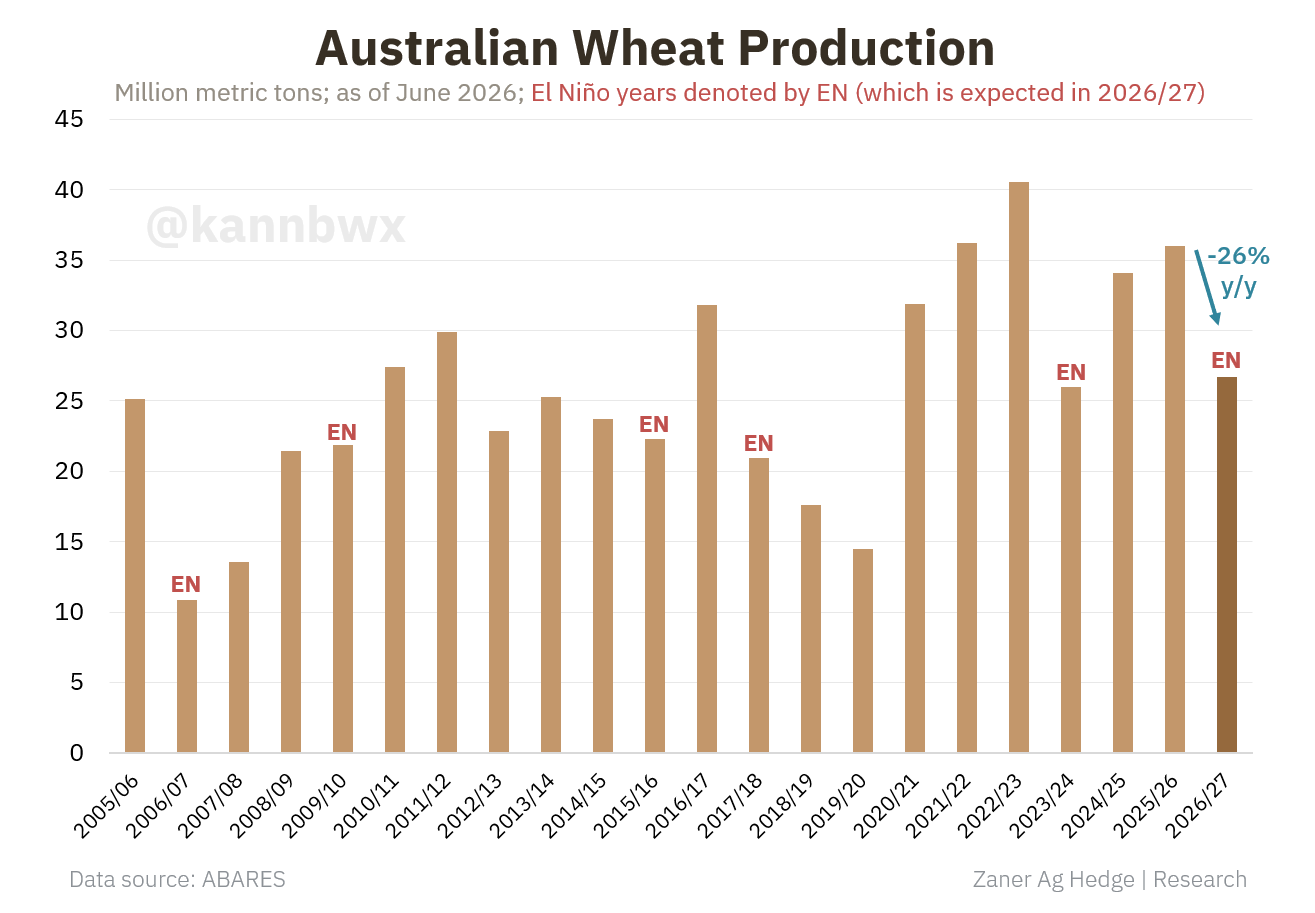
Australia is already expected to lose 1/4 of their crop vs last year simply due to the cost of production.
Here is a nice chart from Karen Braun showing Australia's wheat production, along with highlighting other El Nino years.
El Ninos years often lower production. So Australia could lose even more on top of what was lost due to the high cost of production.
I'd have to imagine cost of production is going to be an issue in other parts of the world as well.
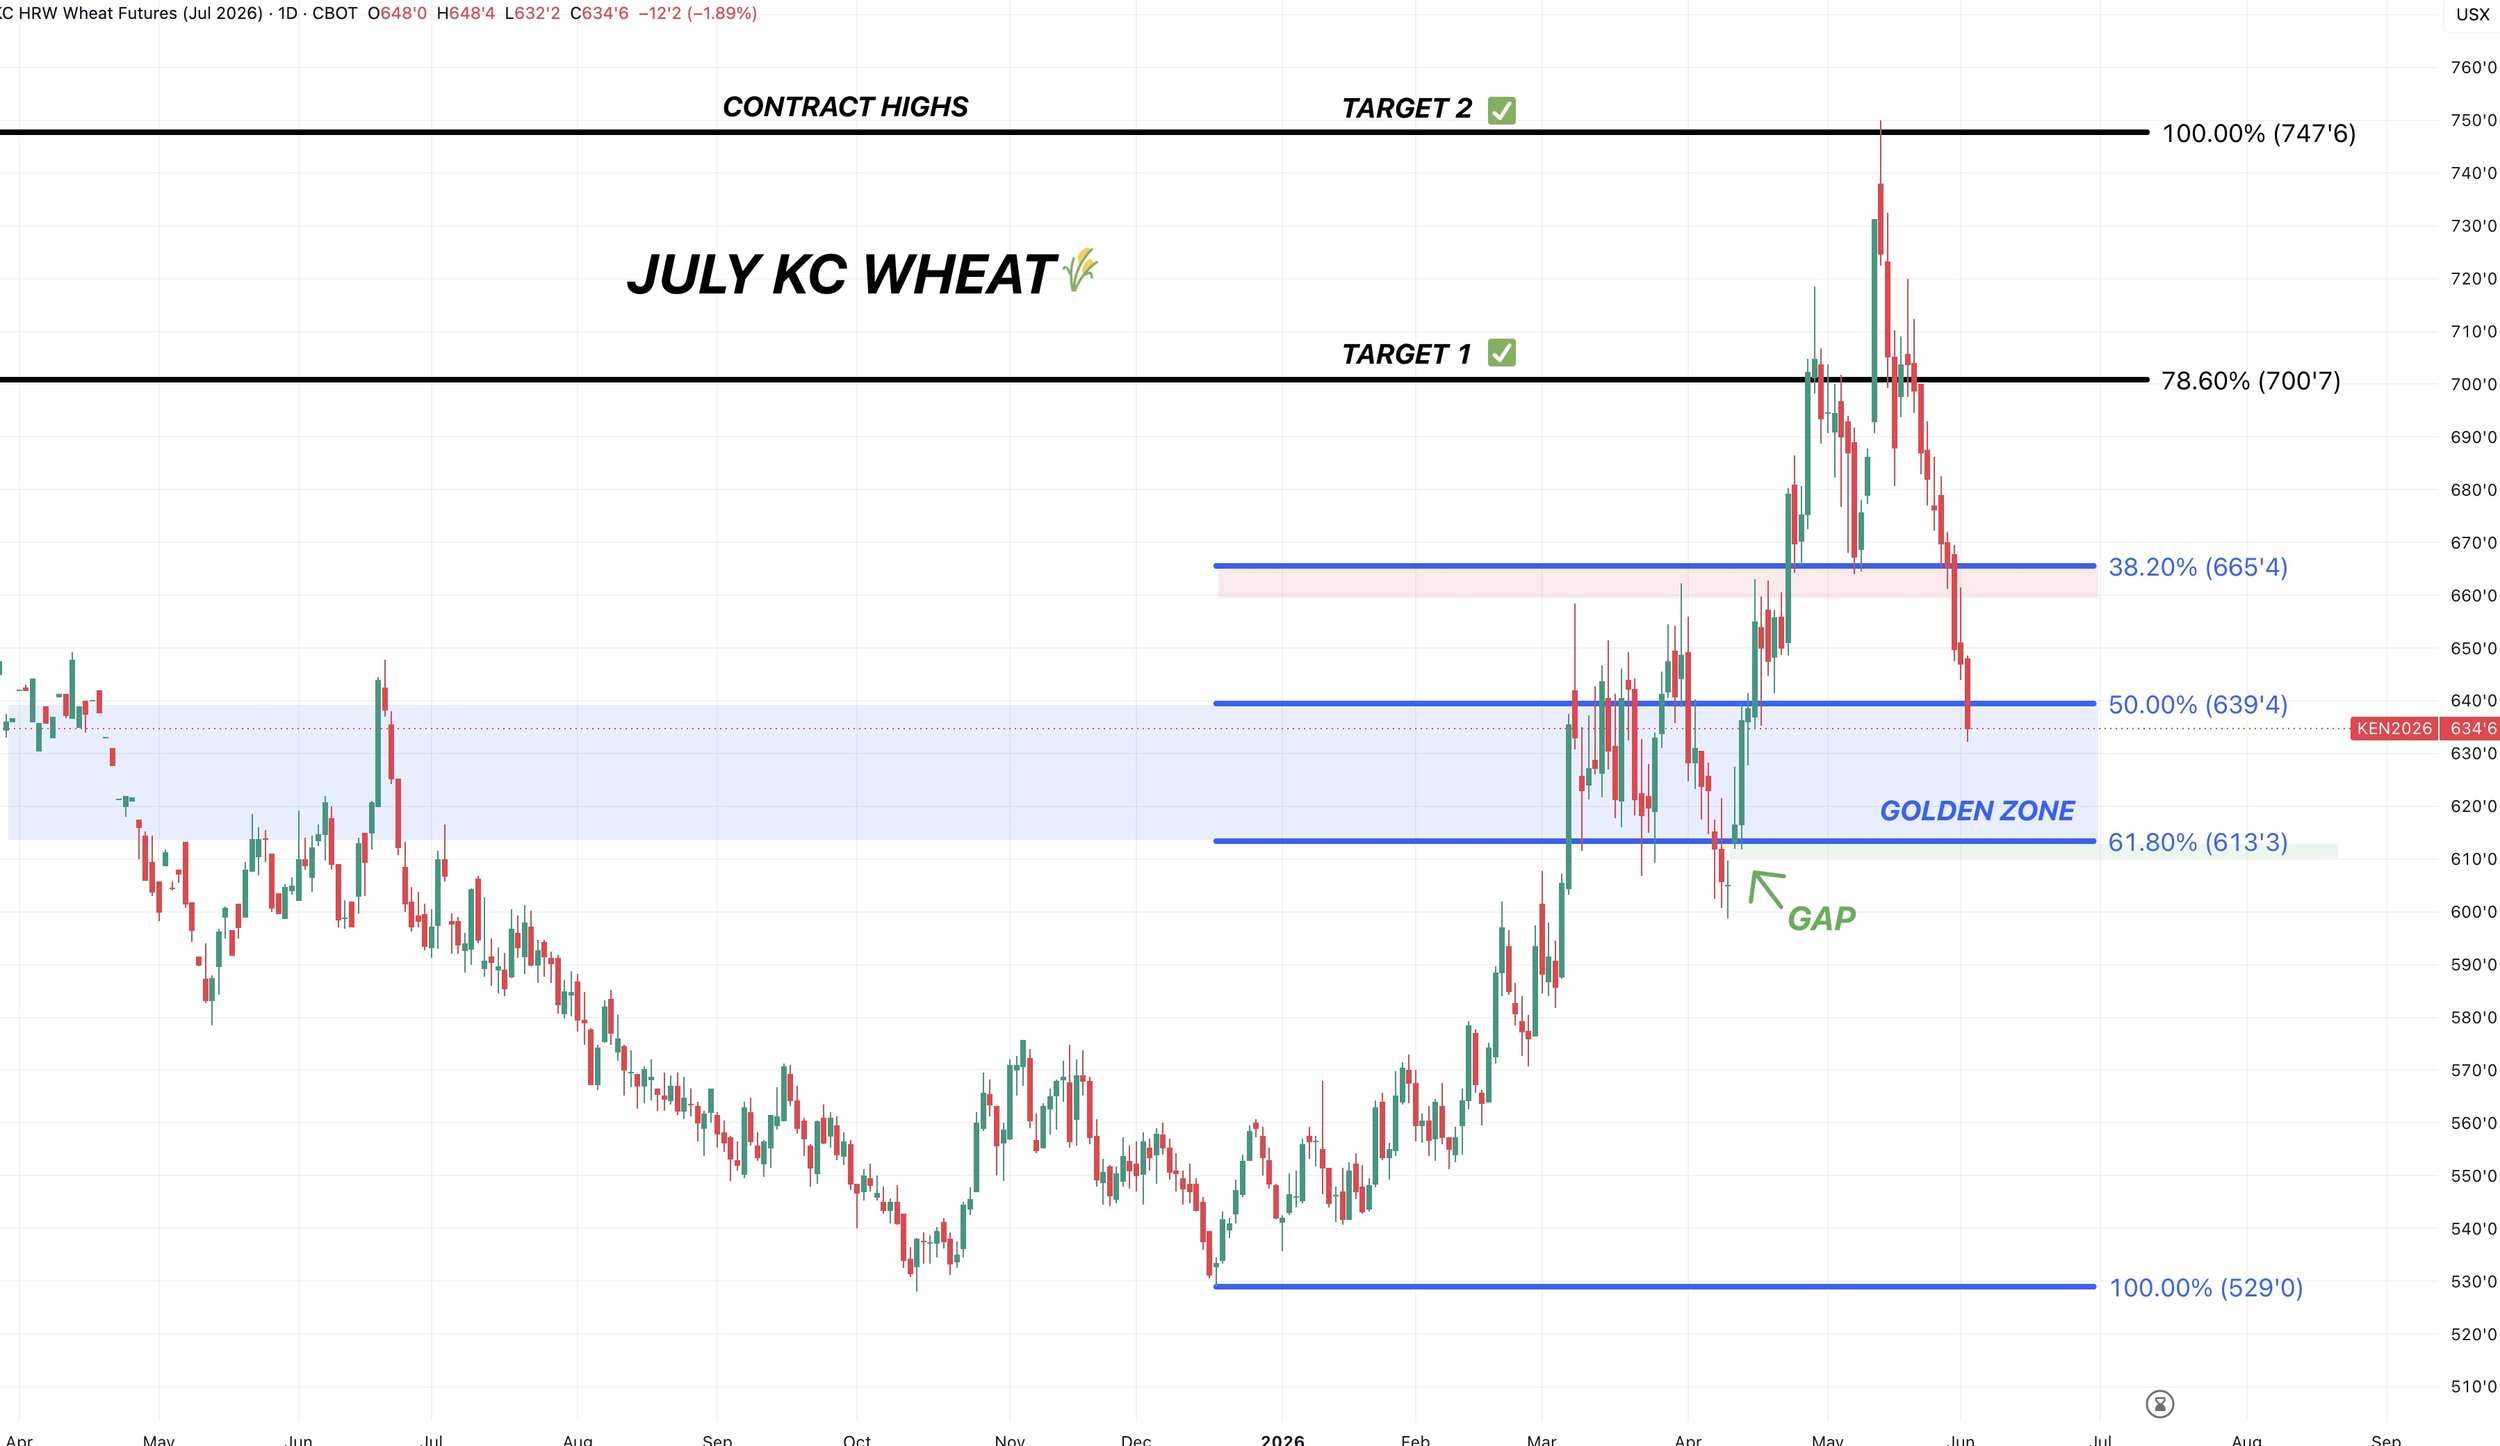
July KC Chart:
We are entering that golden zone.
Bulls want to hold $6.13
That gives back 61.8% of the contract highs all the way down to contract lows.
There is an open gap that sits there as well.
We want to hold that level to keep the trend higher.
Front Month Chart:
If you zoom out, this pullback is still considered perfectly healthy.
We rallied from $4.78 to $7.50
Nearly $3.00
On this chart, we could simply be attempting to turn that old resistance into new support.
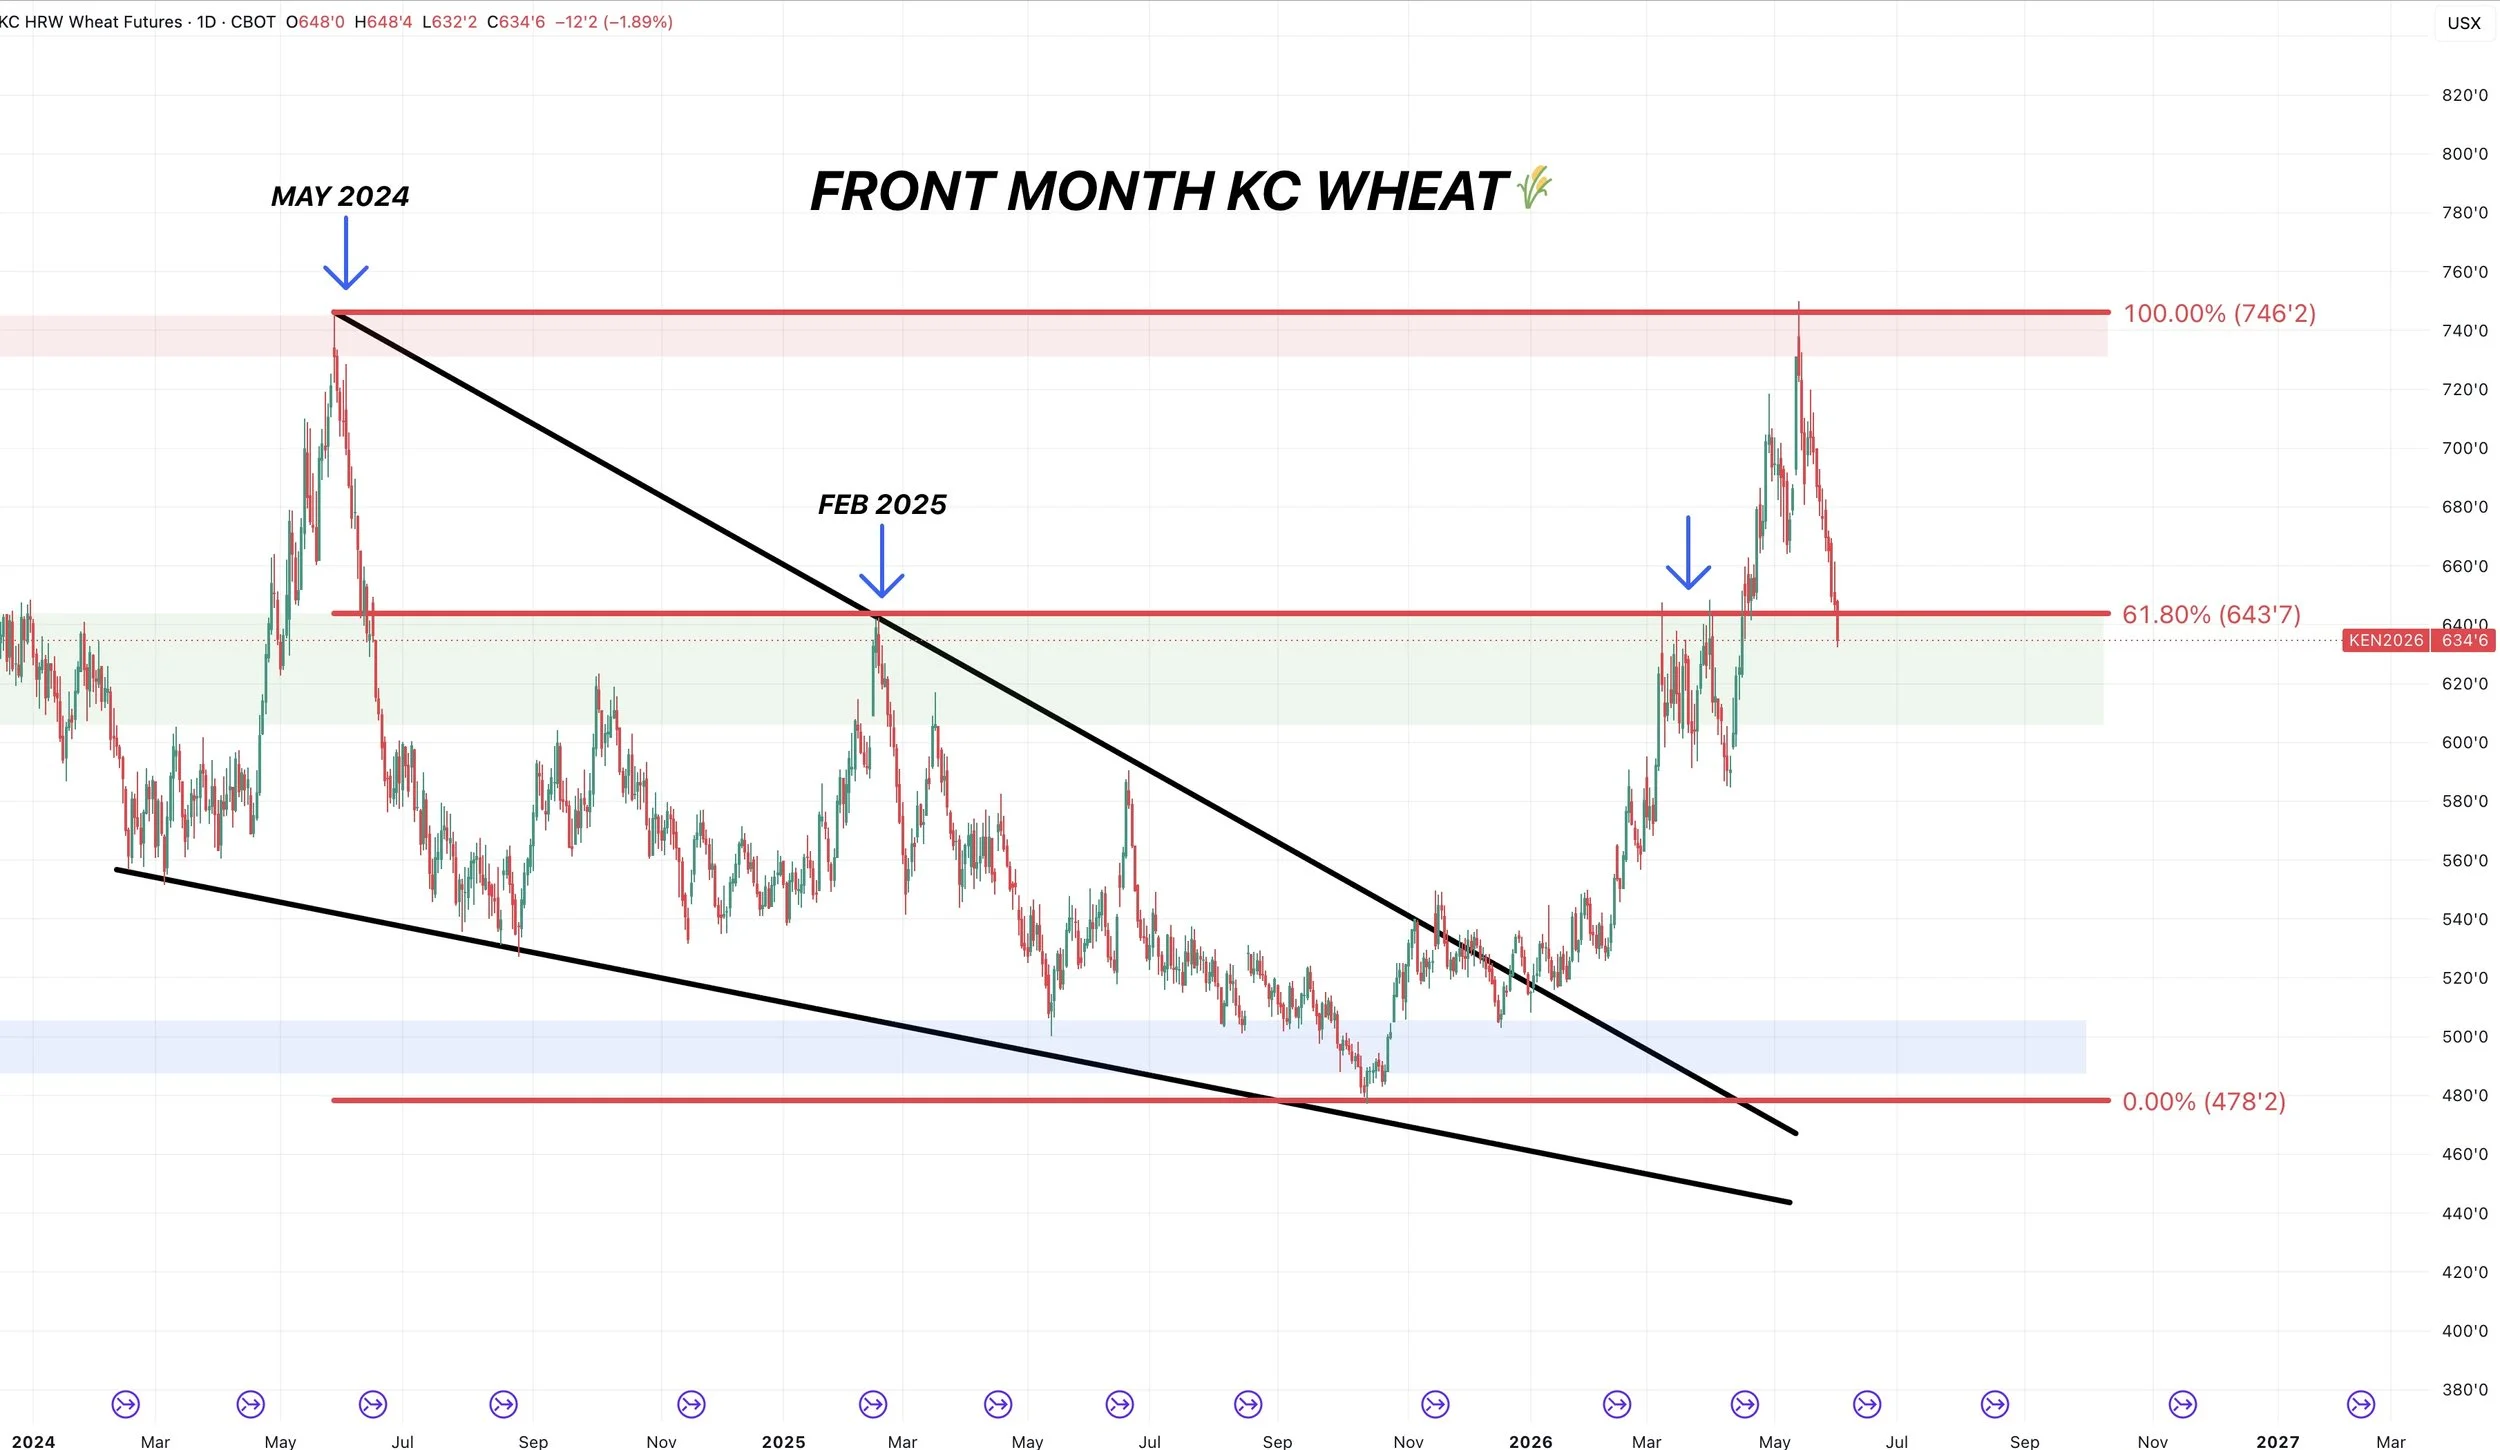
I still think the long term trend has shifted higher in wheat.
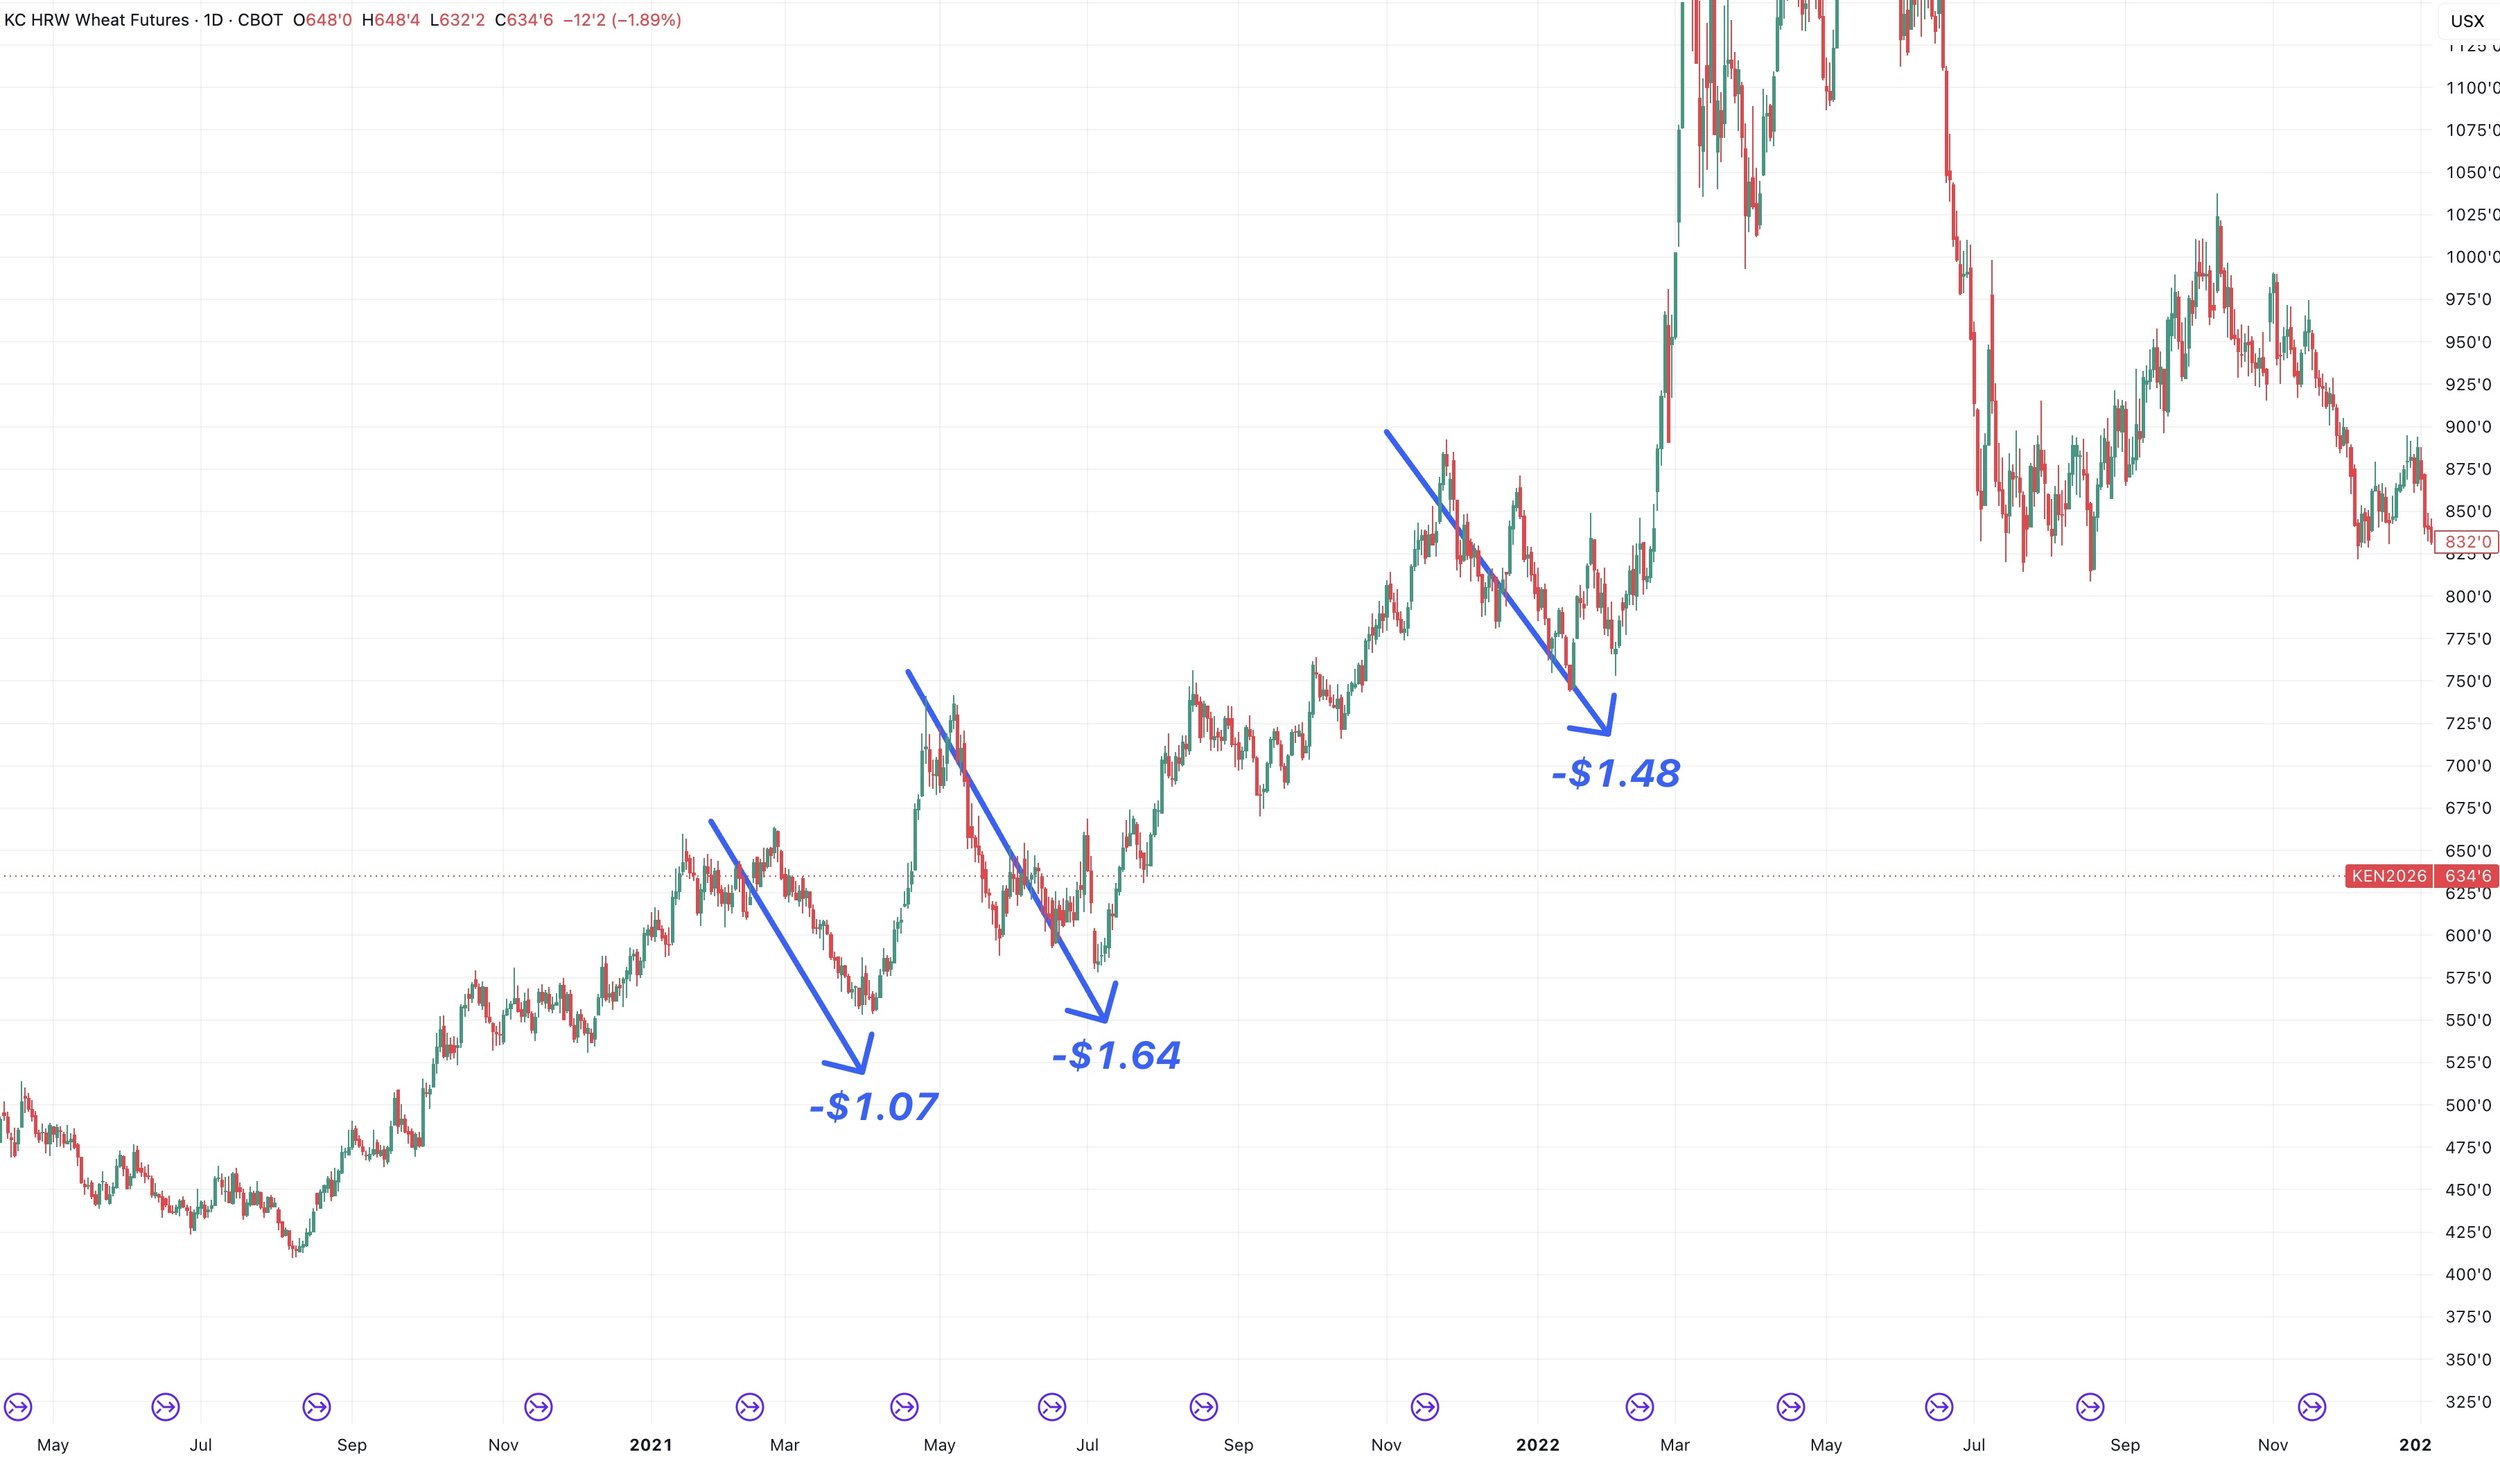
I'm not saying we have to go higher now or even within the next several months.
Just look at that run from 2020 to 2022 for example.
It was accompanied by multiple $1.00 to $2.00 pullbacks.
Cattle
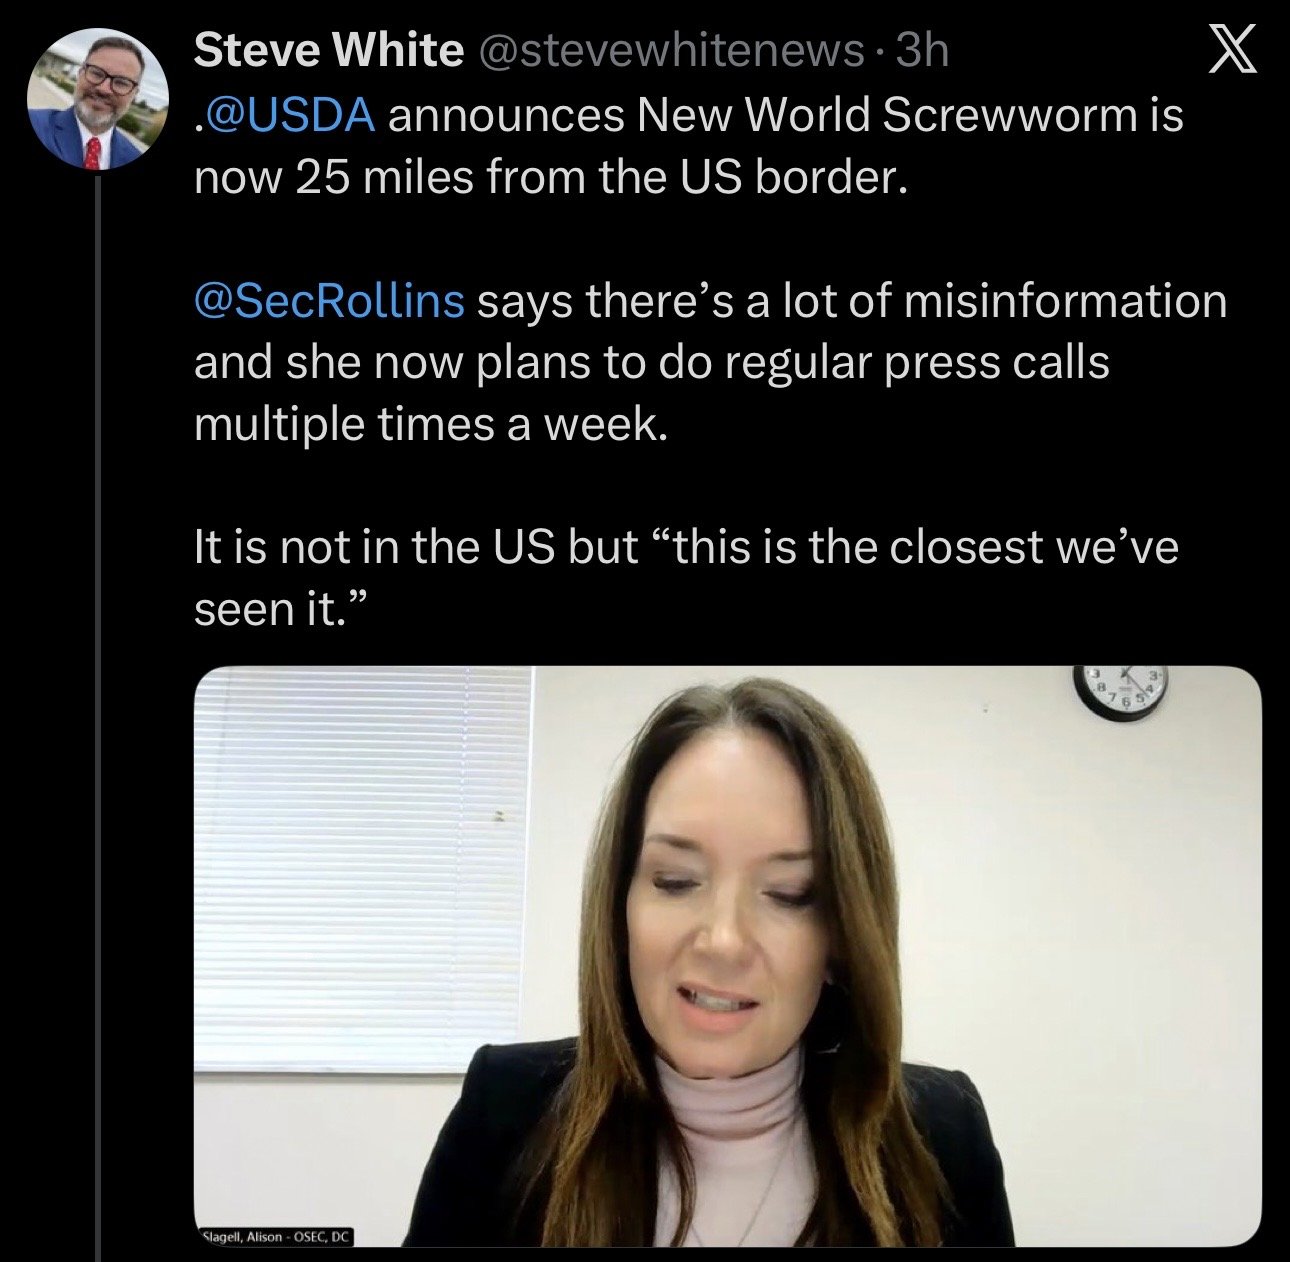
Yesterday after the markets closed, there were rumors that screwworm was found within 1 mile of the US border, and that the USDA was doing emergency meetings to announce screwworm was here and how they were going to handle it.
Today the USDA then came out and said that those rumors were false.
It was not within a mile of the border, and it wasn’t in cattle.
It was in sheep around 30 miles away.
So the USDA debunked the rumors, but it does feel like that is definitely a headline risk if it makes its way to the US.
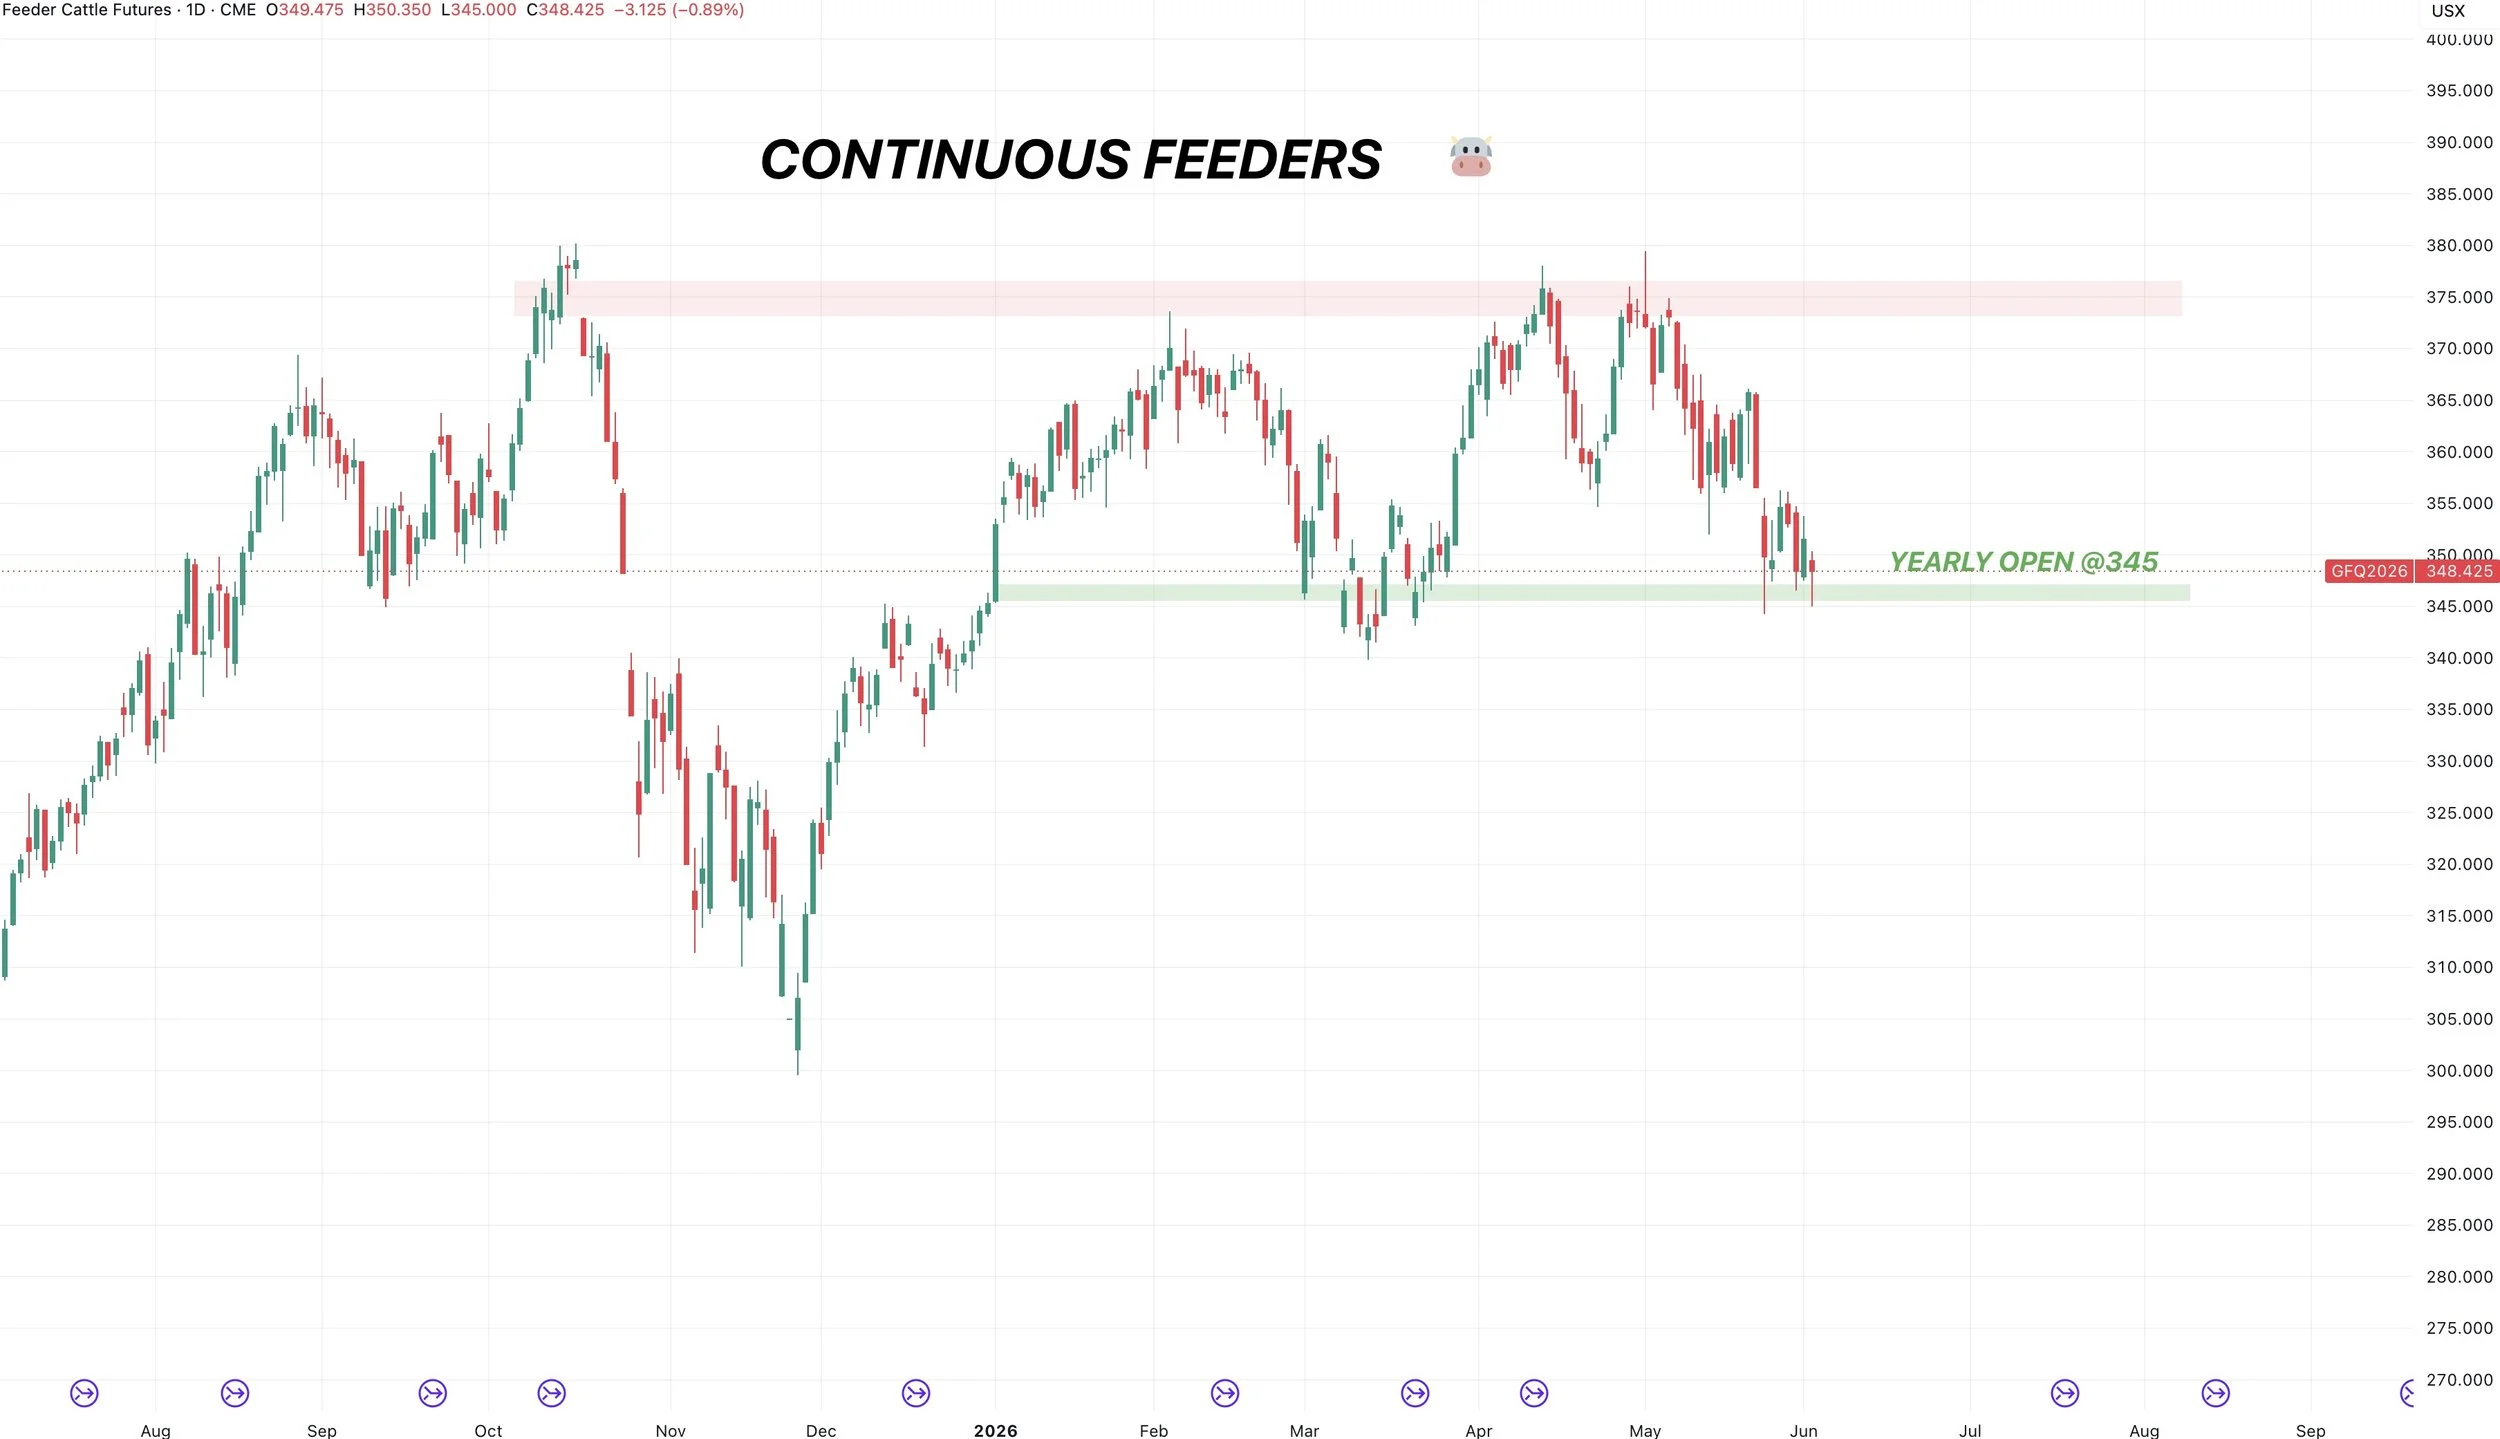
Continuous Feeders Chart:
The yearly open is at 345, which is right where we found support.
Big money pays attention to these levels.
So this is likely going to be a pivot point.
As long as we hold that level, we could be sideways to higher.
If you break below the yearly open, and those recent lows, it does open the door lower and would be a warning sign.
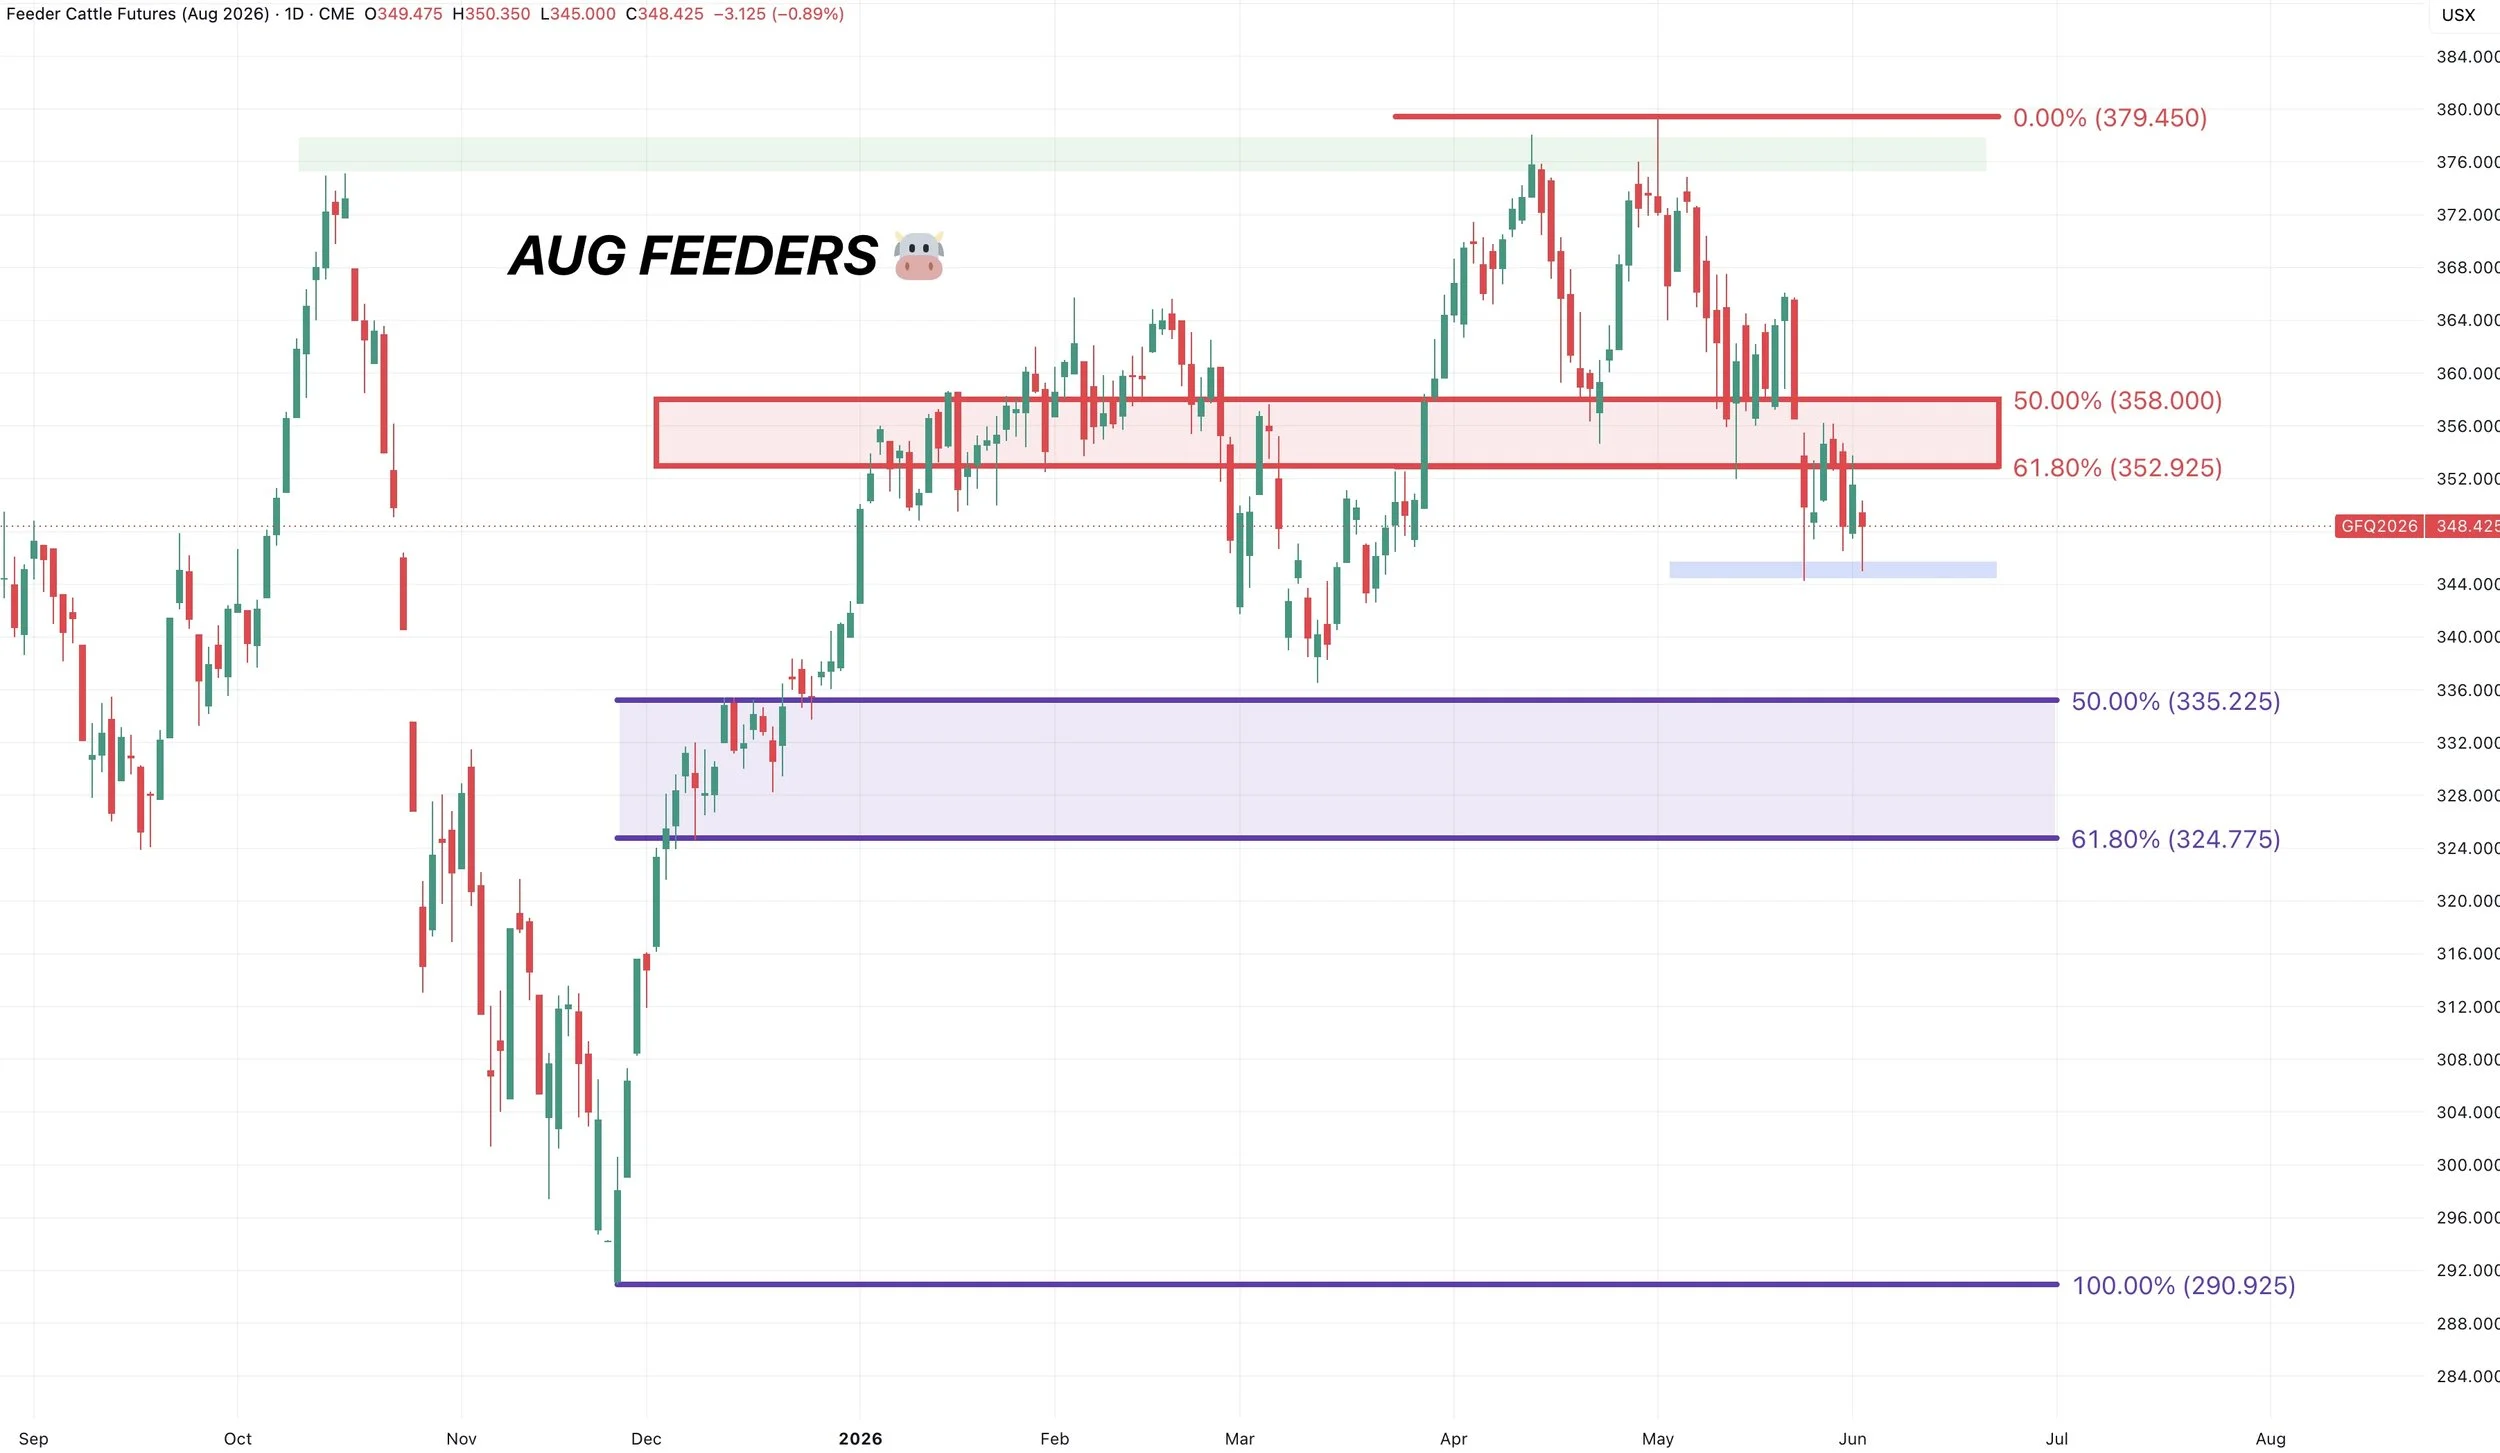
Aug Feeders Chart:
If we take out that yearly open and the recent lows, we could work our way towards the purple box. Which is the golden zone retracement from the entire rally since December.
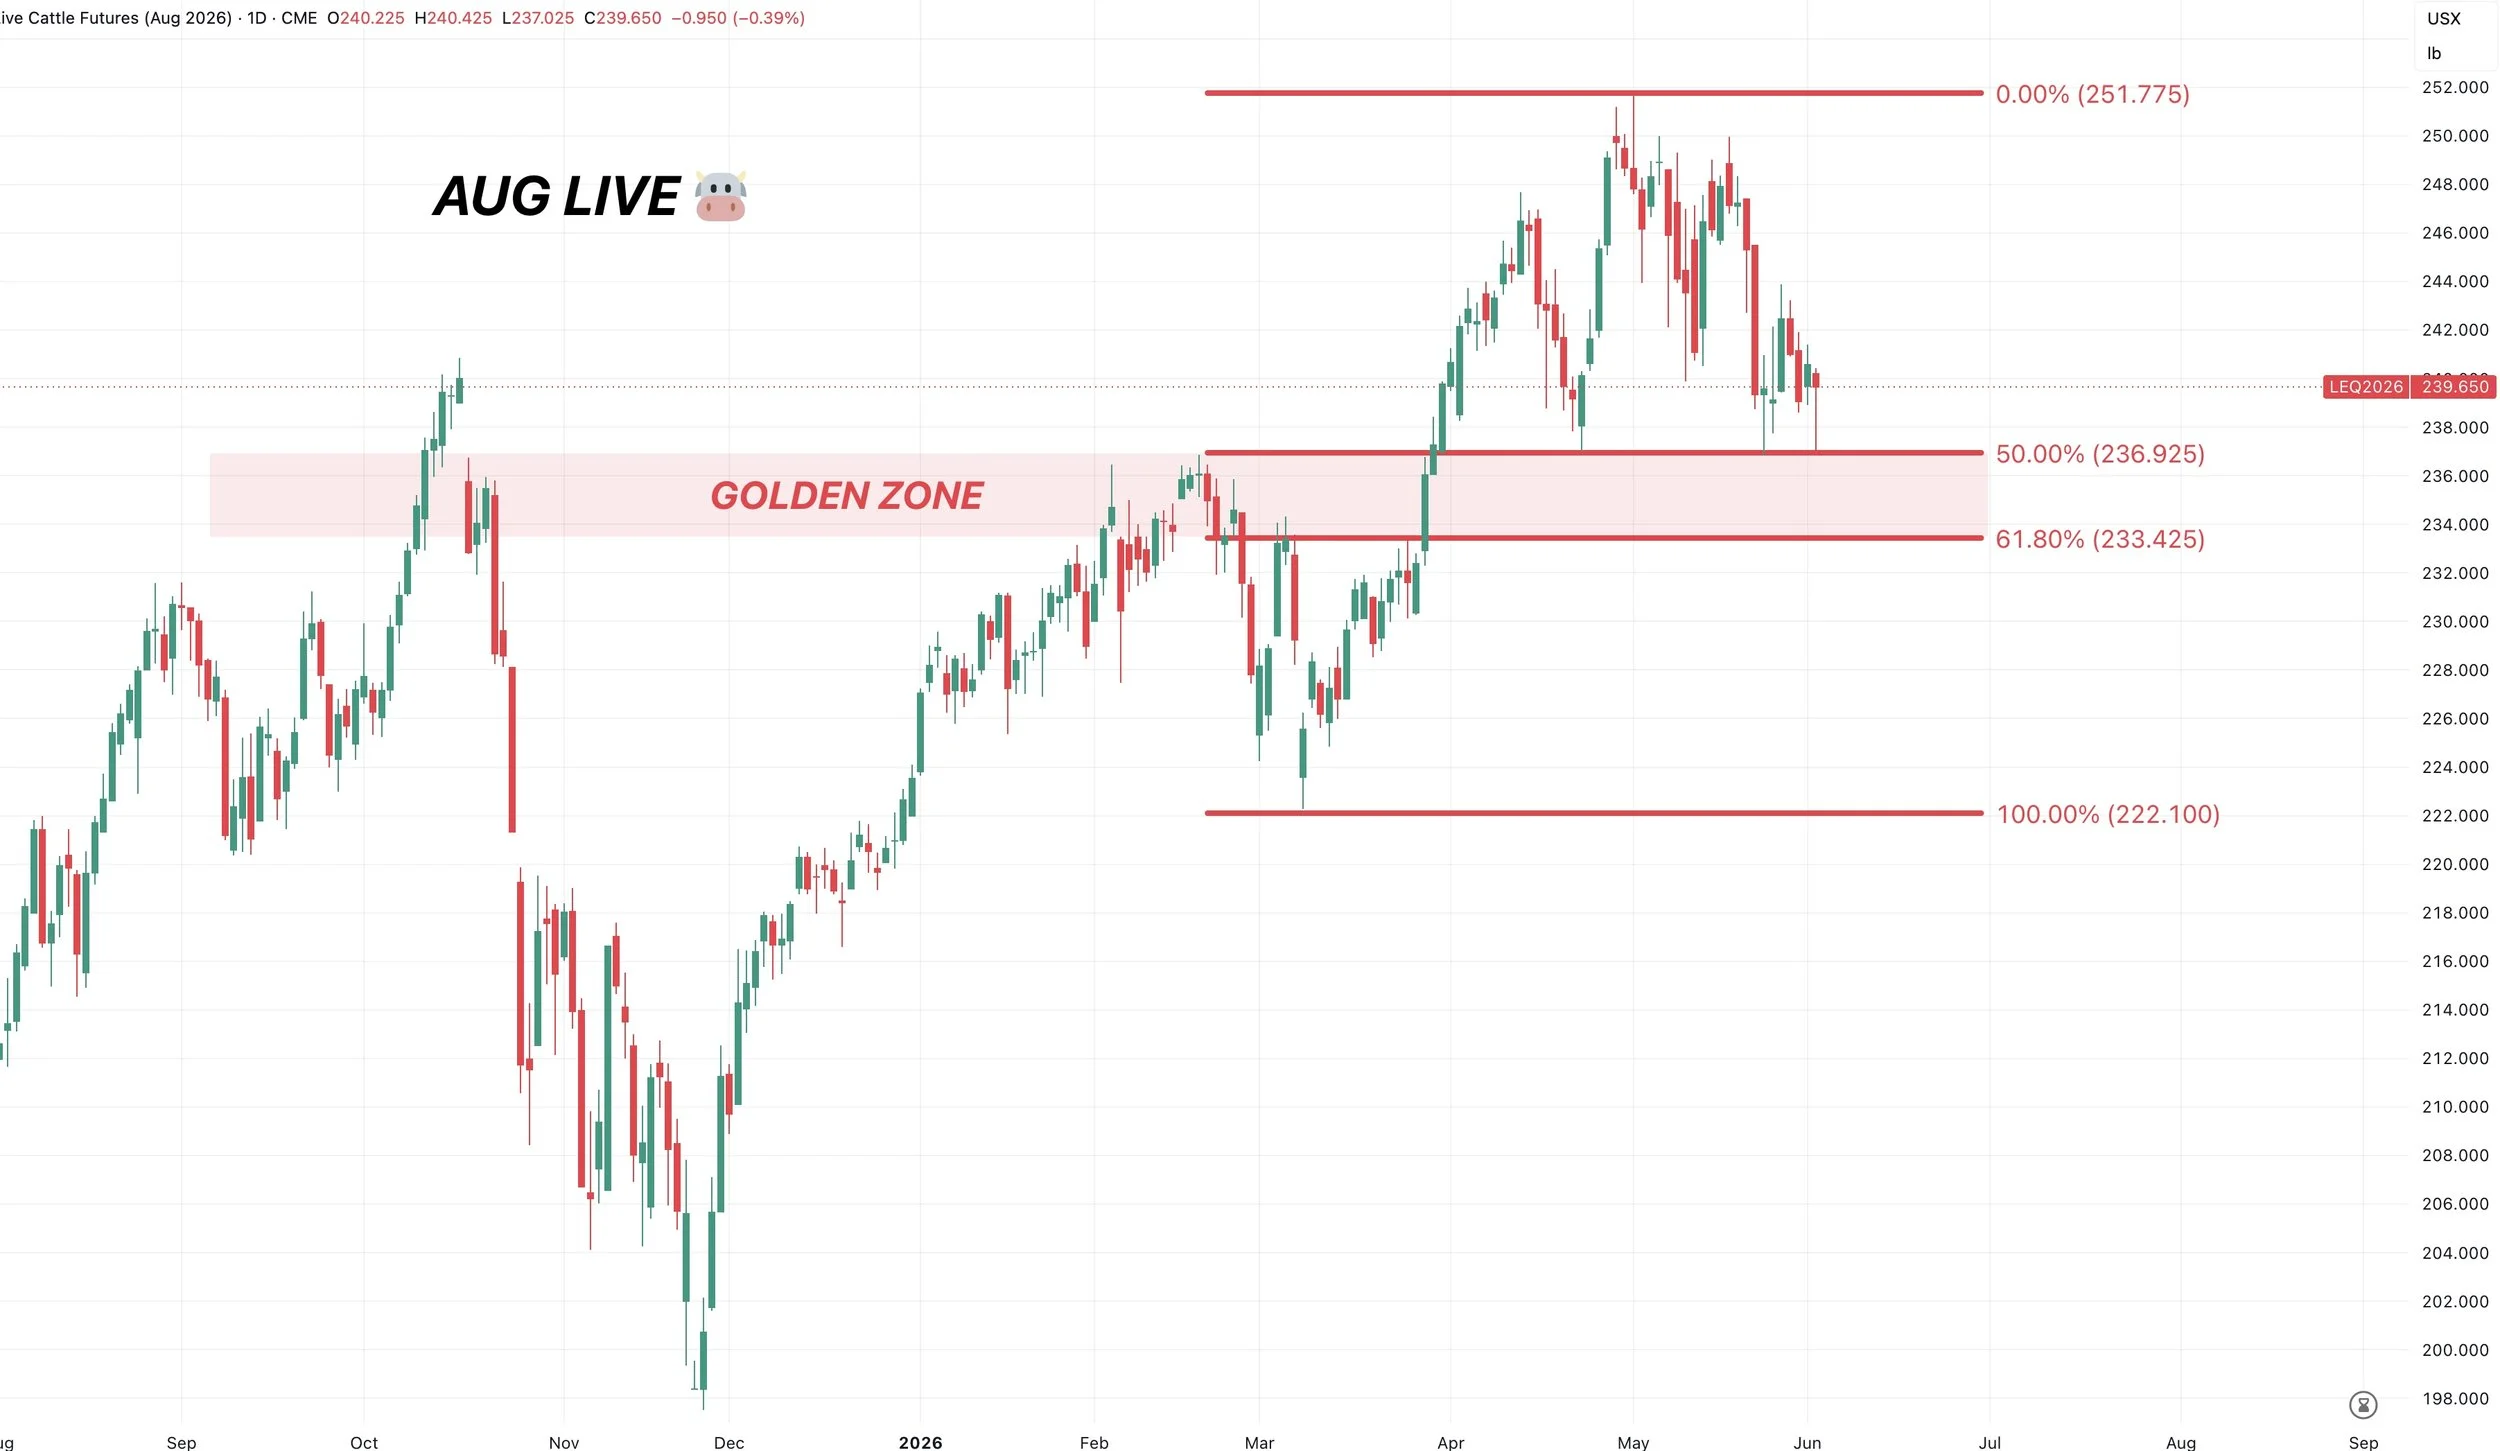
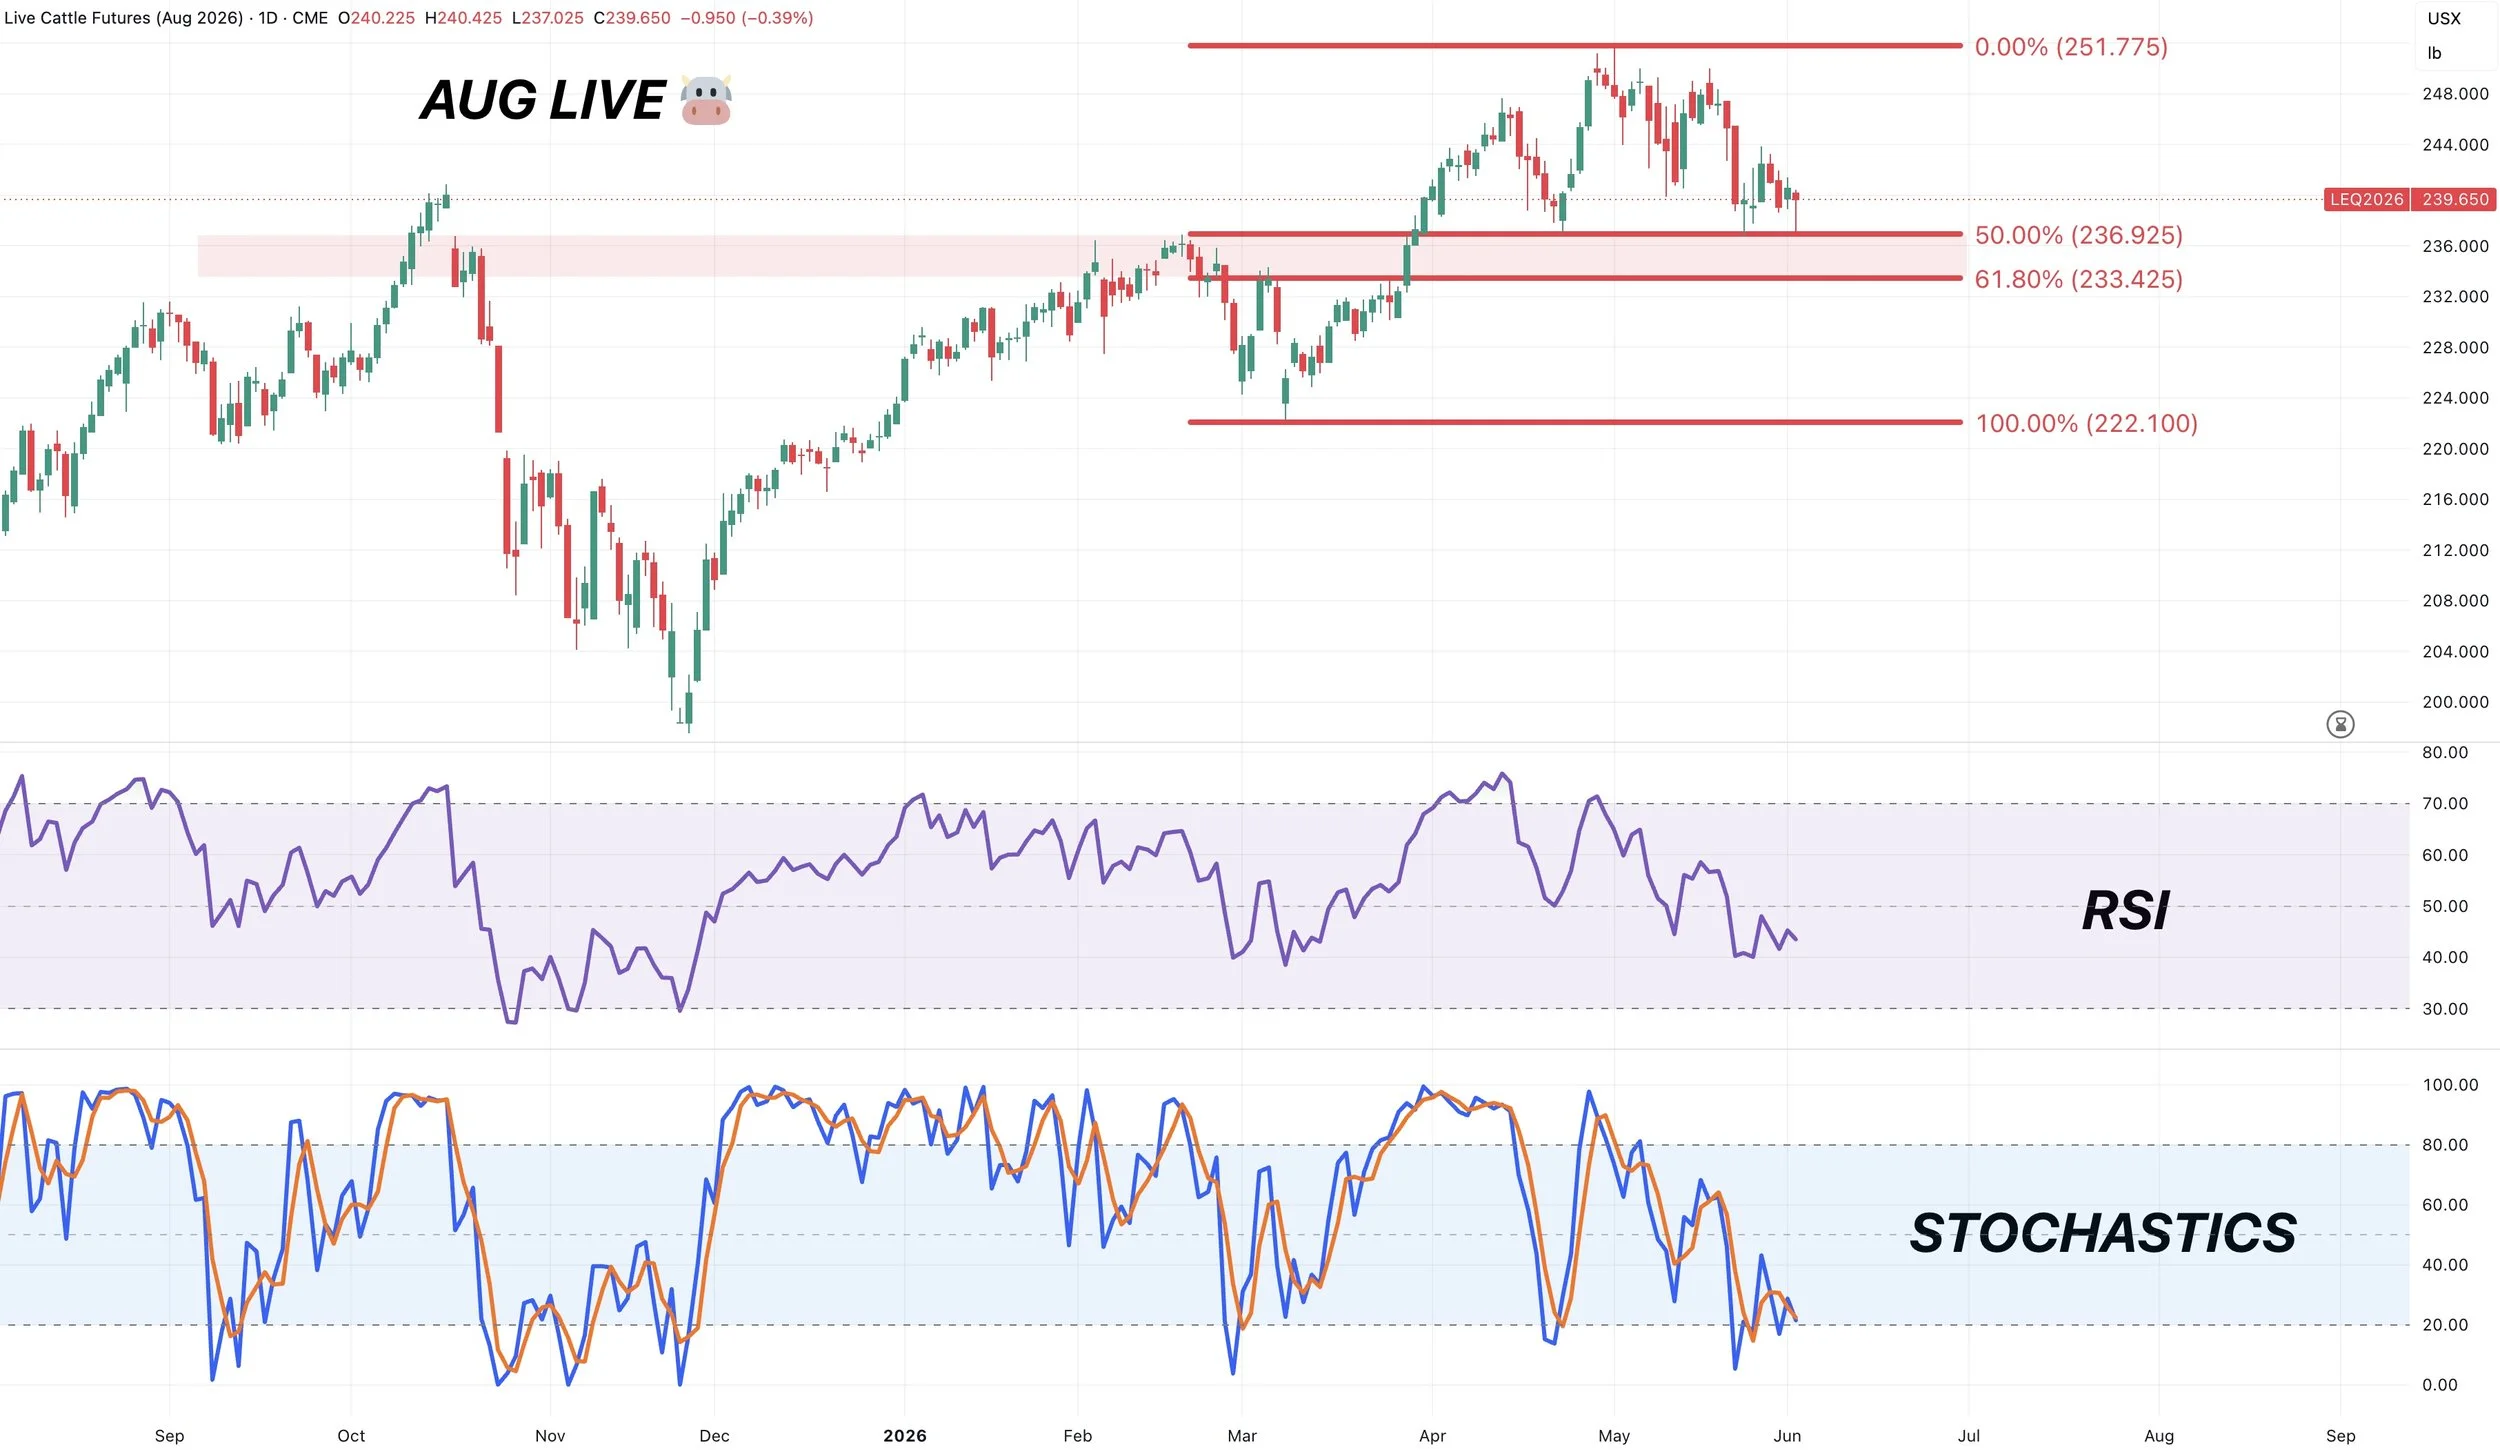
June Live Chart:
Live cattle continues to hold support.
So far we've found support after giving back 50% of the rally from March.
This same level was prior resistance.
The must hold level is going to be 233. As that gives back 61.8% of the rally.
If you break below that level, it would be a warning sign.
Something to note is that we are getting somewhat oversold across the cattle complex on the indicators.
So, barring headline risk such as a screwworm story, or a complete risk off attitude from the funds, you could argue we are oversold here.
However, momentum has seemed pretty weak.
So currently waiting to see if we can hold those key levels.
Want to Talk?
Our phones are open 24/7 for you guys if you ever need anything or want to discuss your operation.
Jeremey & Office: (806)484-1214
Sebastian: (605)280-1186
Email: sfrost@dailymarketminute.com
Hedge Account
Interested in a hedge account? Use the link below to set up an account or give us a call.
Recent Signals
May 27th, 2026: 🌽
Corn conditional buy signal.
CLICK HERE TO VIEW
May 13th, 2026: 🌱
Soybean sell signal & hedge alert.
CLICK HERE TO VIEW
April 28th, 2026: 🌾
KC wheat specific signal.
CLICK HERE TO VIEW
April 27th, 2026: 🌽
Corn catch up sell signal.
CLICK HERE TO VIEW
April 10th, 2026: 🌽
Corn buy signal.
CLICK HERE TO VIEW
March 19th, 2026: 🌱
New crop soybeans signal & hedge alert.
CLICK HERE TO VIEW
March 9th, 2026: 🌱
Soybeans signal & hedge alert. Sent via text.
CLICK HERE TO VIEW
March 6th, 2026: 🌽 🌾
Corn & wheat sell signal & hedge alert.
CLICK HERE TO VIEW
March 3rd, 2026: 🌽
Old crop & new crop corn sell signal & hedge alert.
CLICK HERE TO VIEW
Feb 26th, 2026: 🌱
Old crop & new crop beans sell signal & hedge alert.
CLICK HERE TO VIEW
Feb 19th, 2026: 🌾
KC wheat sell signal & hedge alert.
CLICK HERE TO VIEW
Feb 6th, 2026: 🌽 🌱
Old crop corn & soybean sell signal & hedge alert.
CLICK HERE TO VIEW
Feb 4th, 2026: 🌱
Soybean sell signal & hedge alert.
CLICK HERE TO VIEW
Nov 17th, 2025: 🌱
Soybean sell signal & hedge alert.