
GRAINS BREAK OUT
MARKET UPDATE
You can scroll to read the usual update as well. As the written version is the exact same as the video.
Timestamps for video:
Overview: 0:00min
Corn: 3:00min
Options vs DP: 5:00min
Beans: 9:10min
Wheat: 14:10min
Cattle: 15:00min
Want to talk about your situation?
(605)295-3100
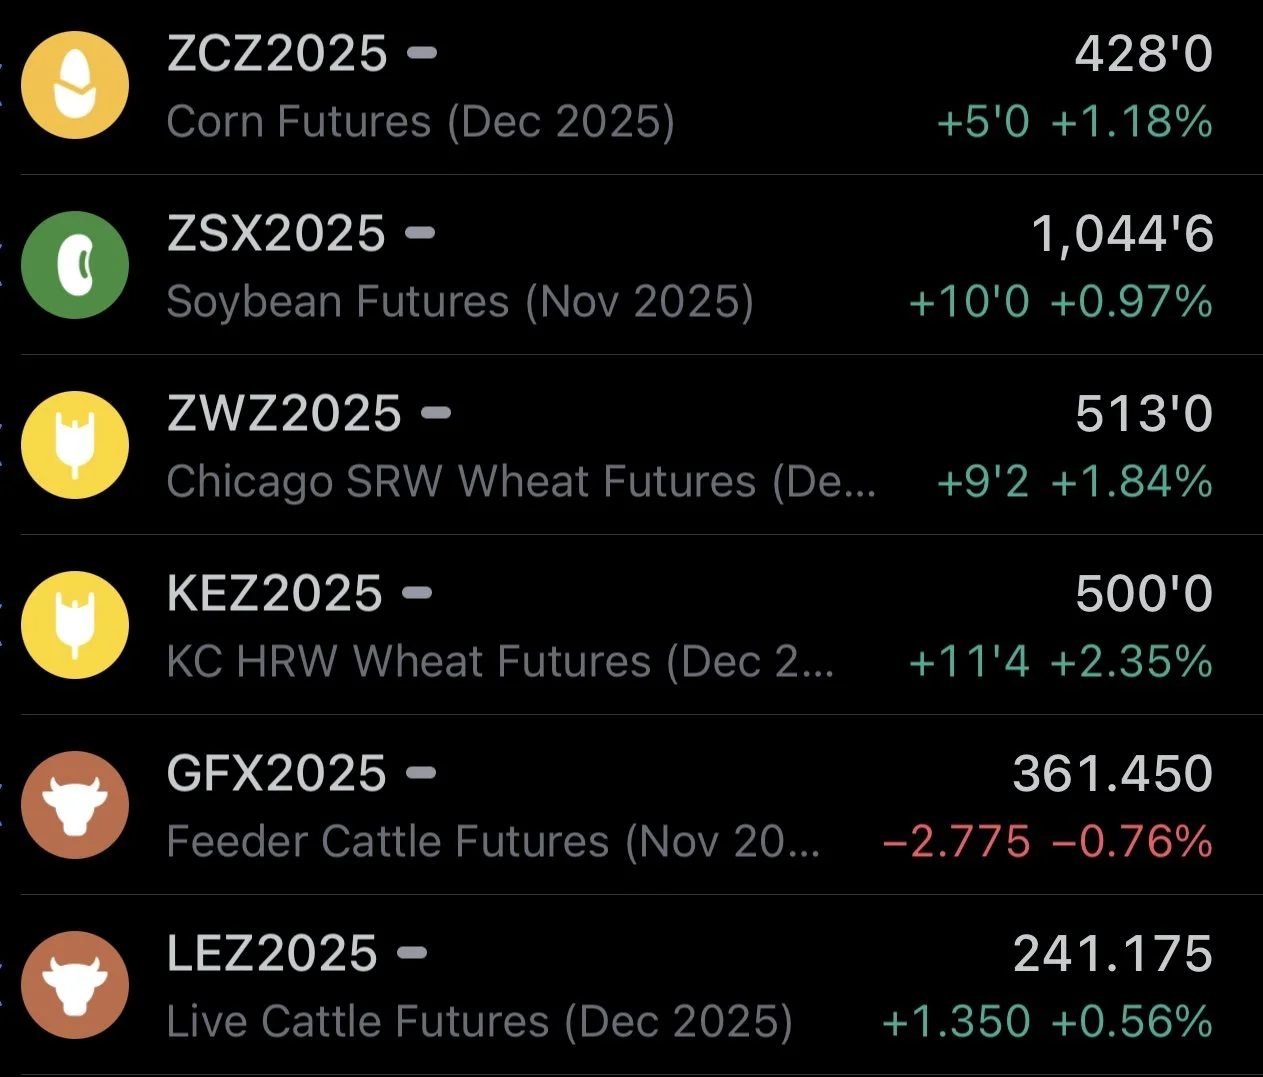
Futures Prices Close
Overview
Great day across the grain markets with the wheat market leading the way higher as soybeans continue to catch a bid from trade deal optimism.
The cattle market was mixed. Feeder cattle led this move higher while live cattle lagged behind. We are now seeing that feeder to fat spread get back in line as live cattle has held up better on this sell off.
Today is a longer update. We go over a ton of charts, targets, the math behind delayed price vs options and what the right move might be in the corn market.
Let's dive right into the news before we jump into the good stuff.
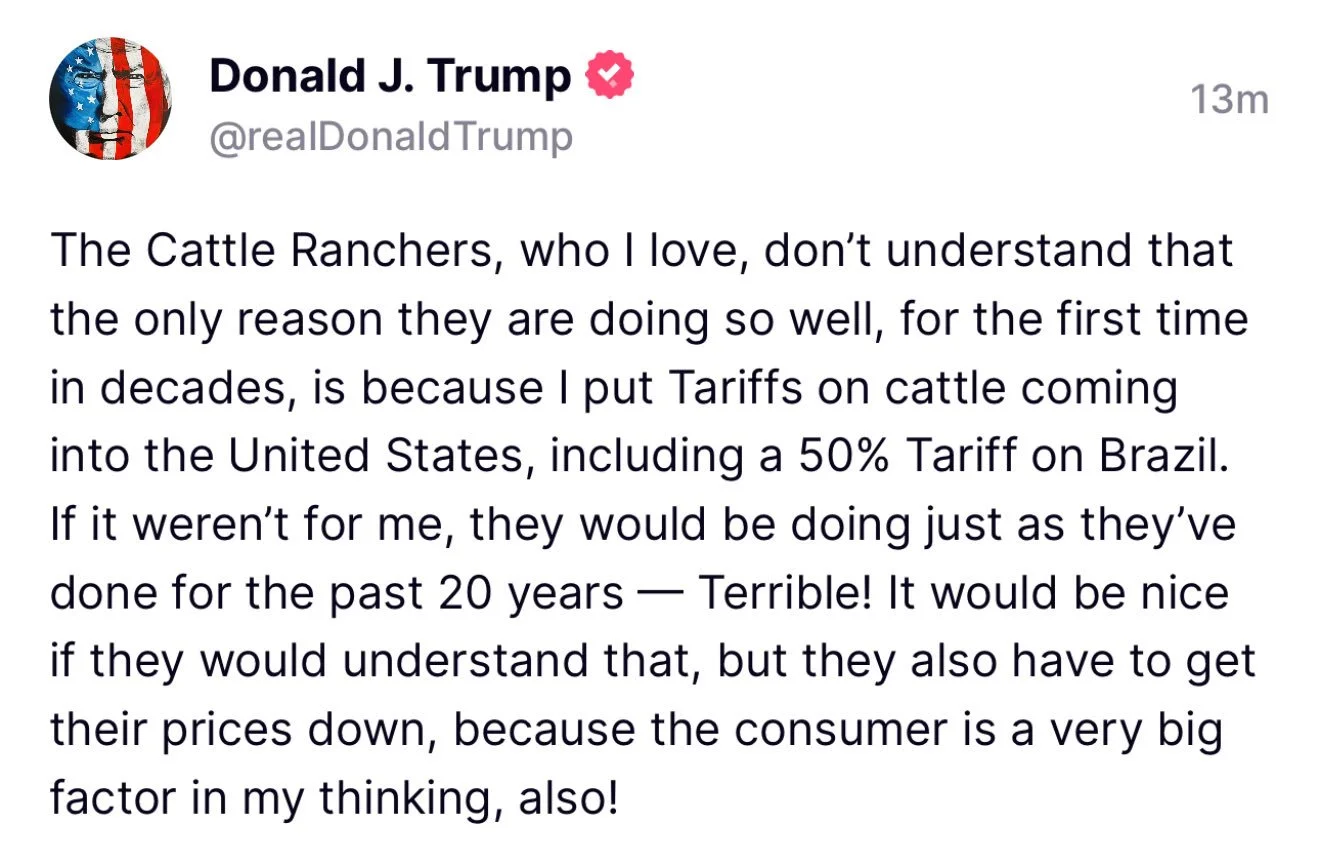
Trump Cattle News
Trump made quiet a few comments yesterday.
The one that stirred the most controversy and upset many was these tweets about the cattle market.
He claimed that he is "the only reason cattle ranchers are doing so well" and that they "have to get their prices down" as the consumer is a big factor.
A few days ago, he said they are going to start importing Argentine beef, but that really doesn’t change anything.
Brazil is the one you have to be worried about. If he removes that tariff on Brazil beef that could add some pressure to this market and be a bearish factor. I believe he is scheduled to meet with Brazil next week, so that is going to be something to watch closely.
Regardless of the tariffs, cattle herds are at their lowest levels of all-time. That is the biggest reason why this market is higher. Supply is the tightest it has ever been.
Yes, the government shut down the Mexican border, amongst other things that helped fuel this rally. But tariffs alone aren’t the reason for the high prices.
There are certainly risks in this market which we'll touch on later.
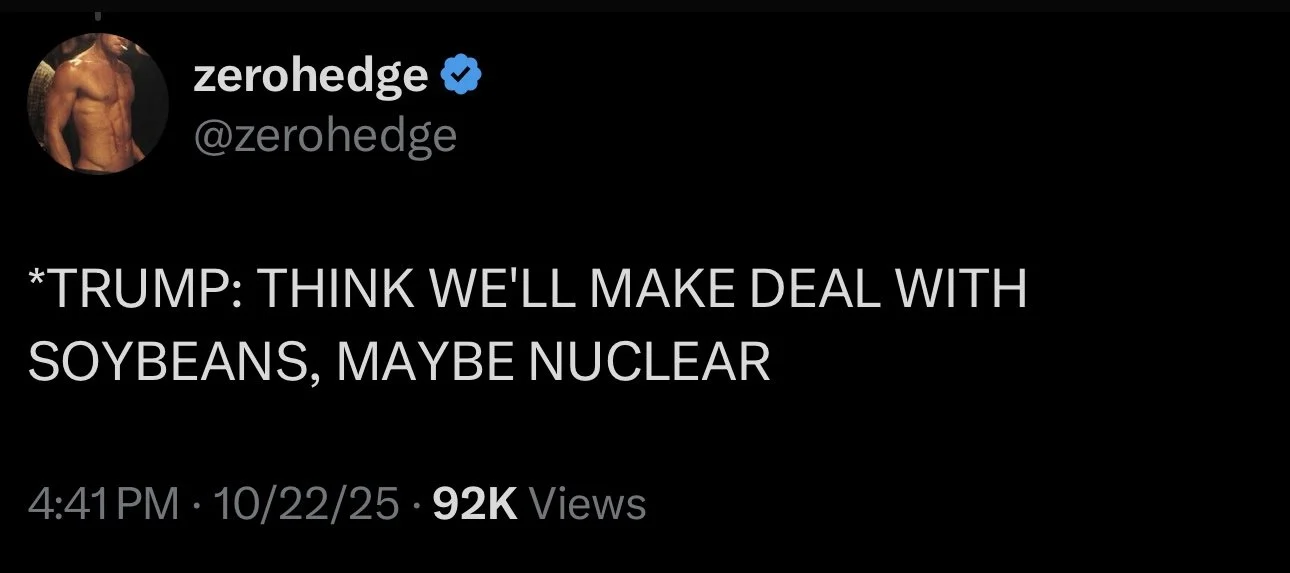
Trump Soybean News
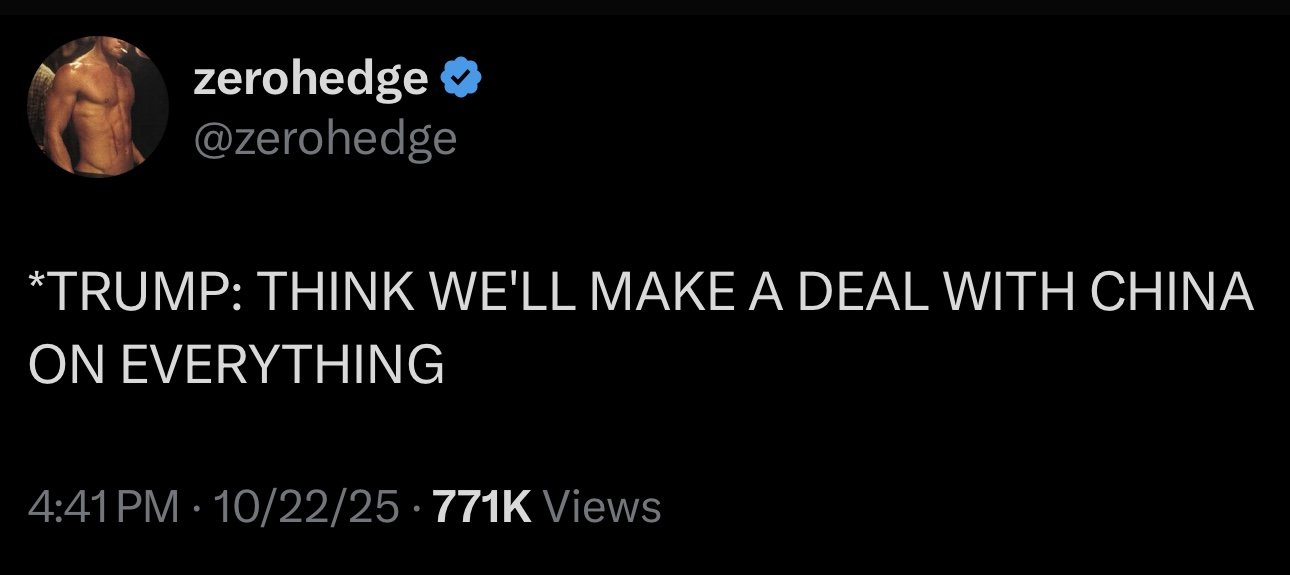
On a more positive note, yesterday Trump said the following:
"We will make a deal on everything."
"I think we are going to make a deal in soybeans."
Optimism of a deal has been the biggest reason for the recent rally in soybeans.
Gov Shut Down Odds
I've been including this in most of my recent updates, but the betting markets date for the government shut down continues to grow longer.
It is now estimated to last 44 days.
Which puts us well into the middle of November (Nov 14th).
As a reminder, the Nov USDA is suppose to be Nov 10th.

Rate Cuts
I've been talking about this for months and how this could be a potentially friendly factor for the grains.
There is currently an 80% chance we see 3 rate cuts this year.
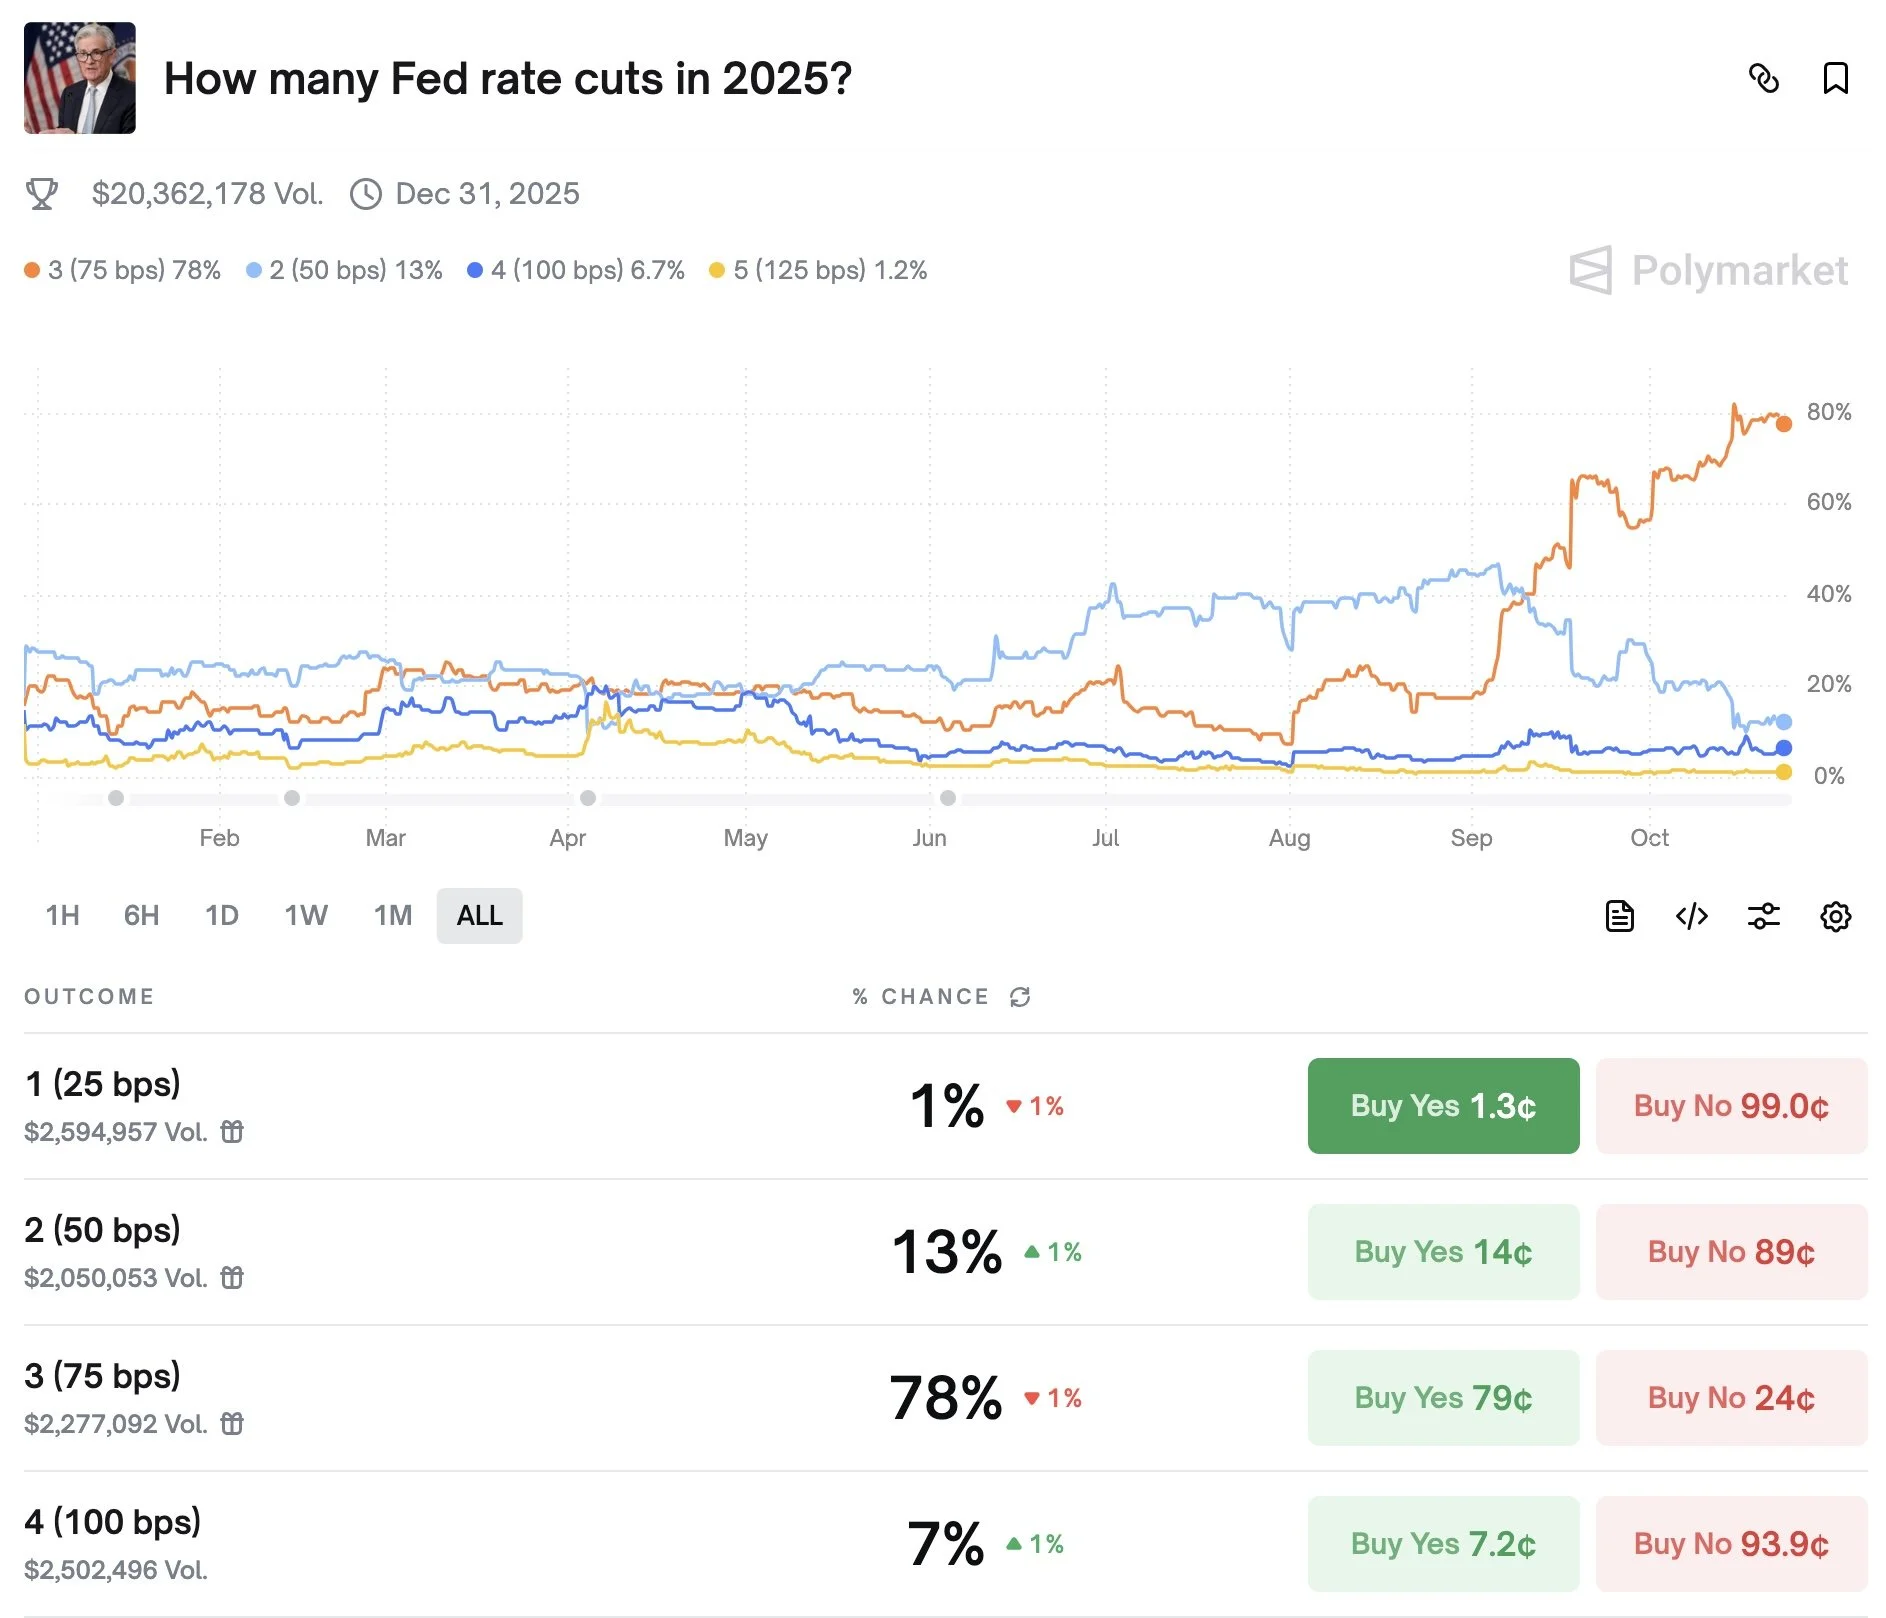
Rate cuts lead to higher inflation and often higher-priced commodities.
Rate hikes lead to lower inflation and often cheaper commodities.
I've shown this before, but here is a chart that shows corn and soybean prices along with the feds rate cuts & hikes as well as inflation.
Interestingly enough, corn & soybean prices tend to follow inflation higher or lower.
Our last rate hikes marked the top of the bull market in 2022.
Last fall, our first rate cuts since 2020 coincidentally happened right before corn's most sustained rally of the entire bear market.
It does not mean grains "have" to go higher. Maybe it’s simply a coincidence. But you can’t deny the resemblance.

Today's Main Takeaways
Corn
Fundamentals:
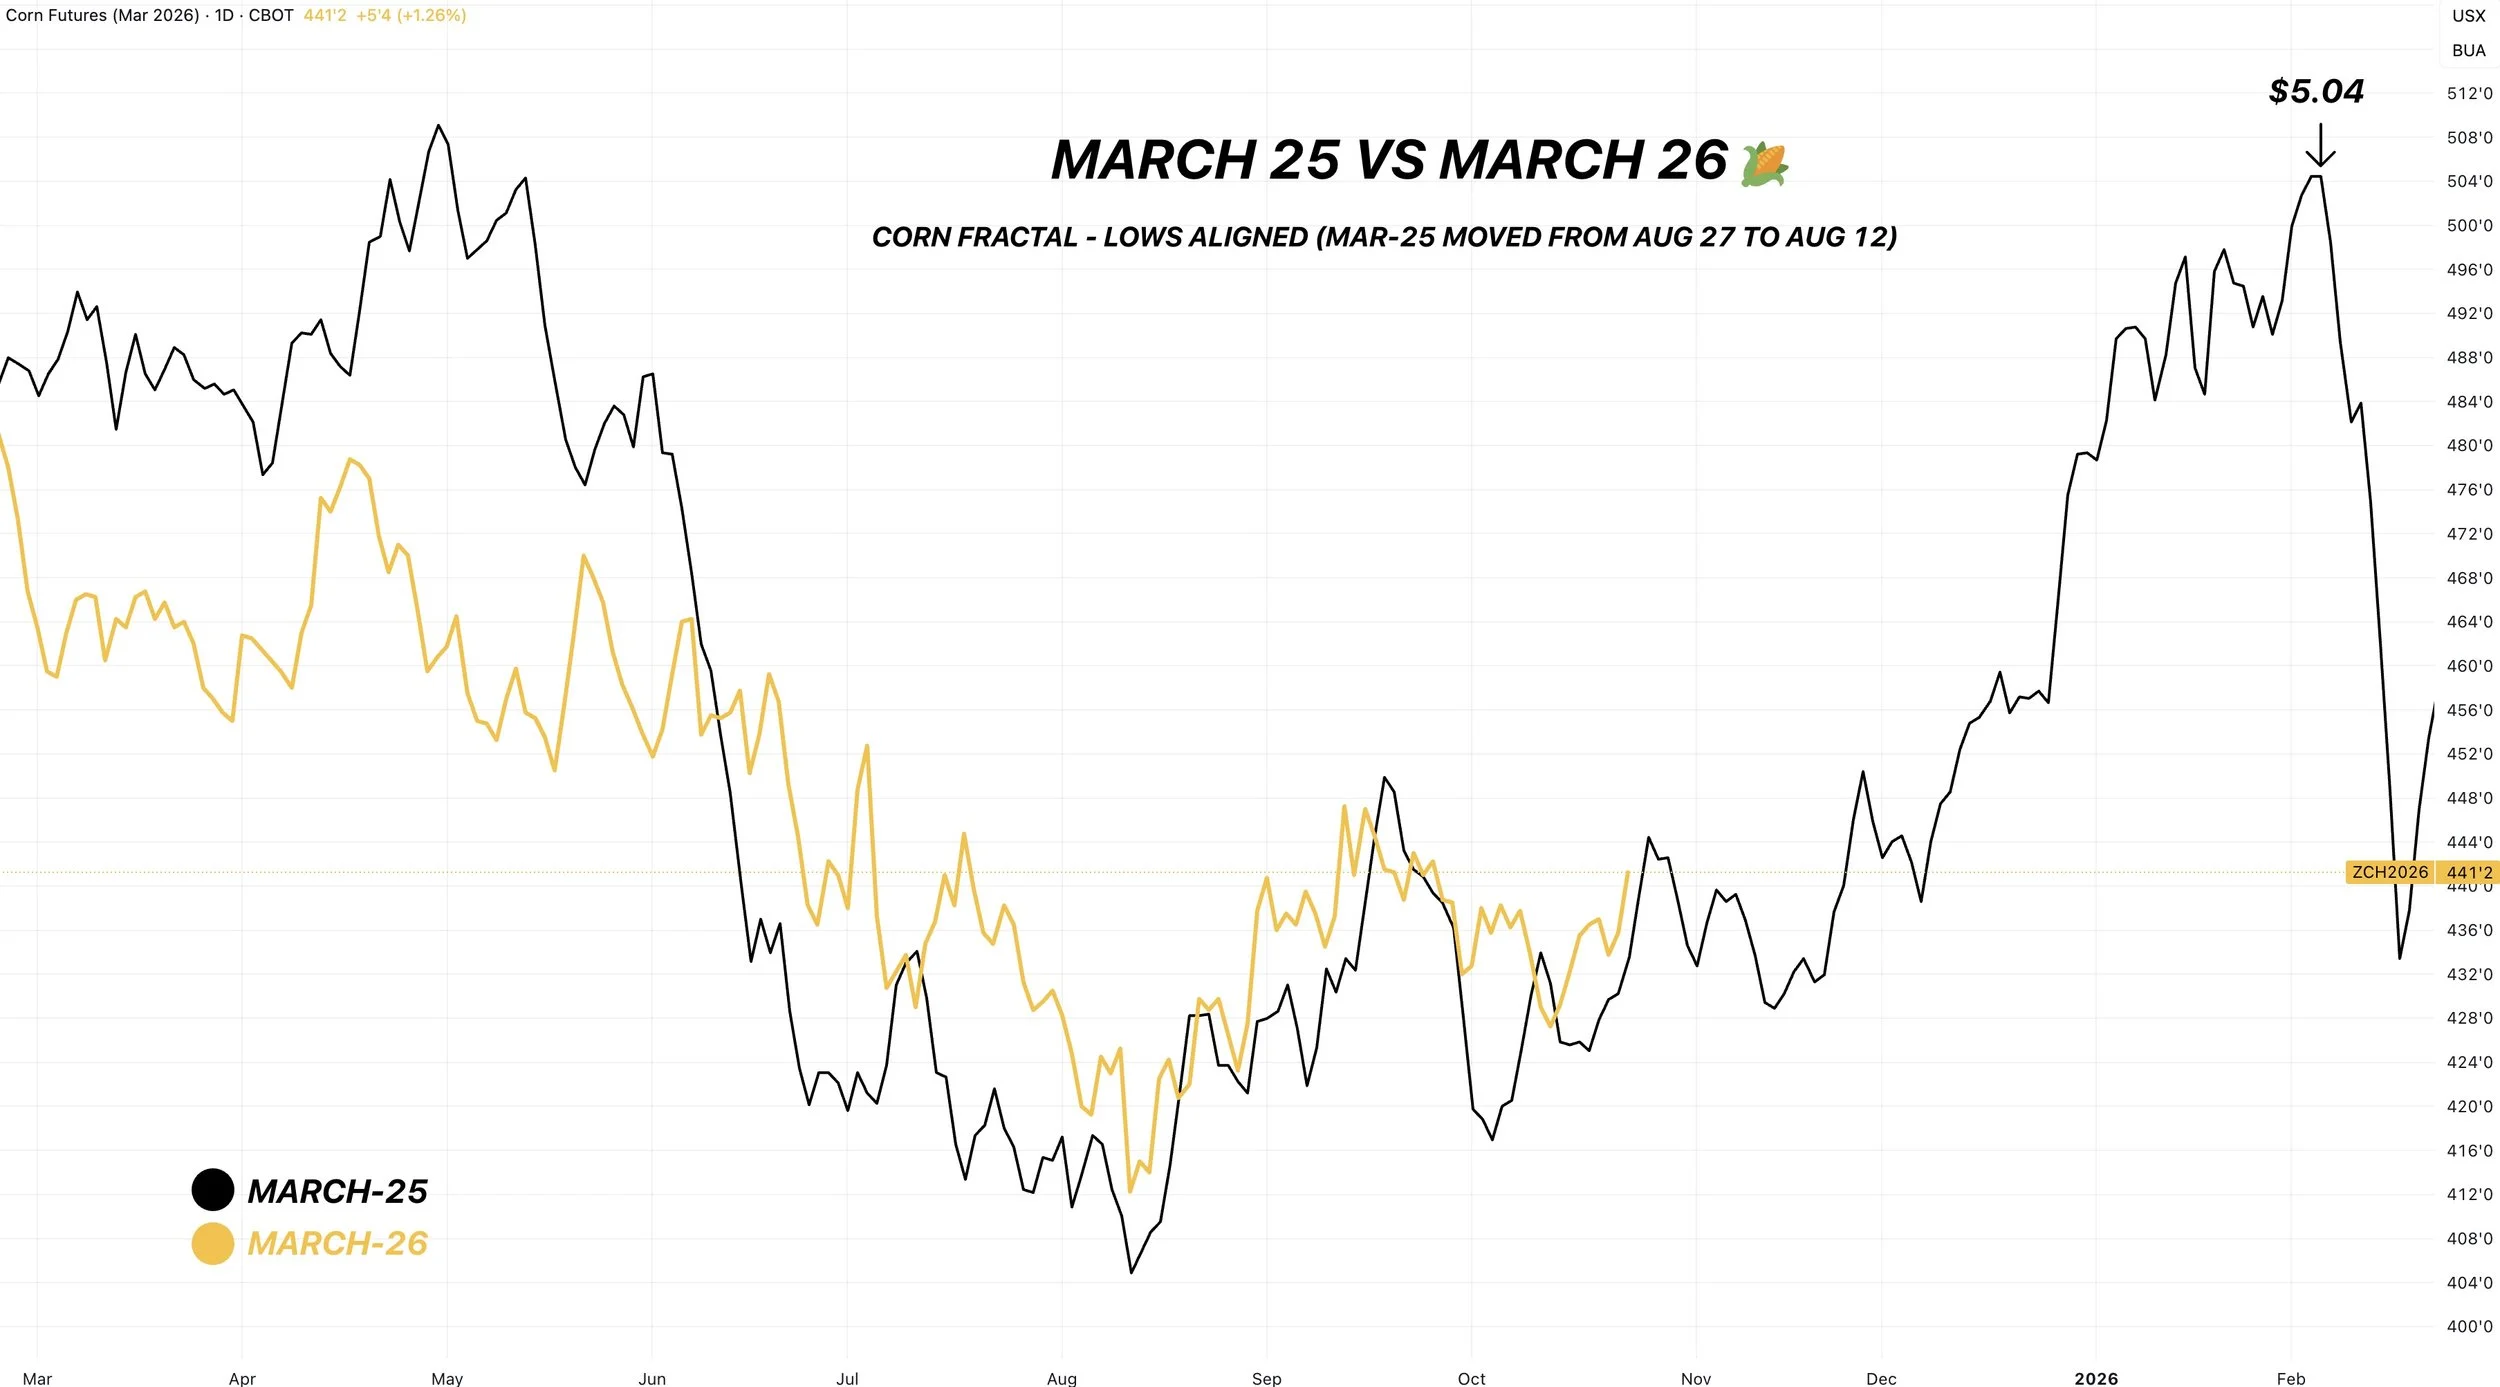
I showed this chart on Tuesday but wanted to include it again.
This is March-25 vs March-26 corn if you align our harvest lows.
So far, the two years have seen very similar price action.
Summer sell off.
August harvest low.
Rally off the harvest lows going into September.
Even the size of the rally off the harvest low was almost the exact same size.
Now seeing a correction and stabilization.
The years are not going to follow each other exactly.
But I could see us following a similar path.
Where we don’t get that real opportunity until late 2025 or early 2026.
China News:
There was a headline that said China is receiving too much moisture and that they may be facing a corn shortage due to this.
China is the world's 2nd largest corn producer.
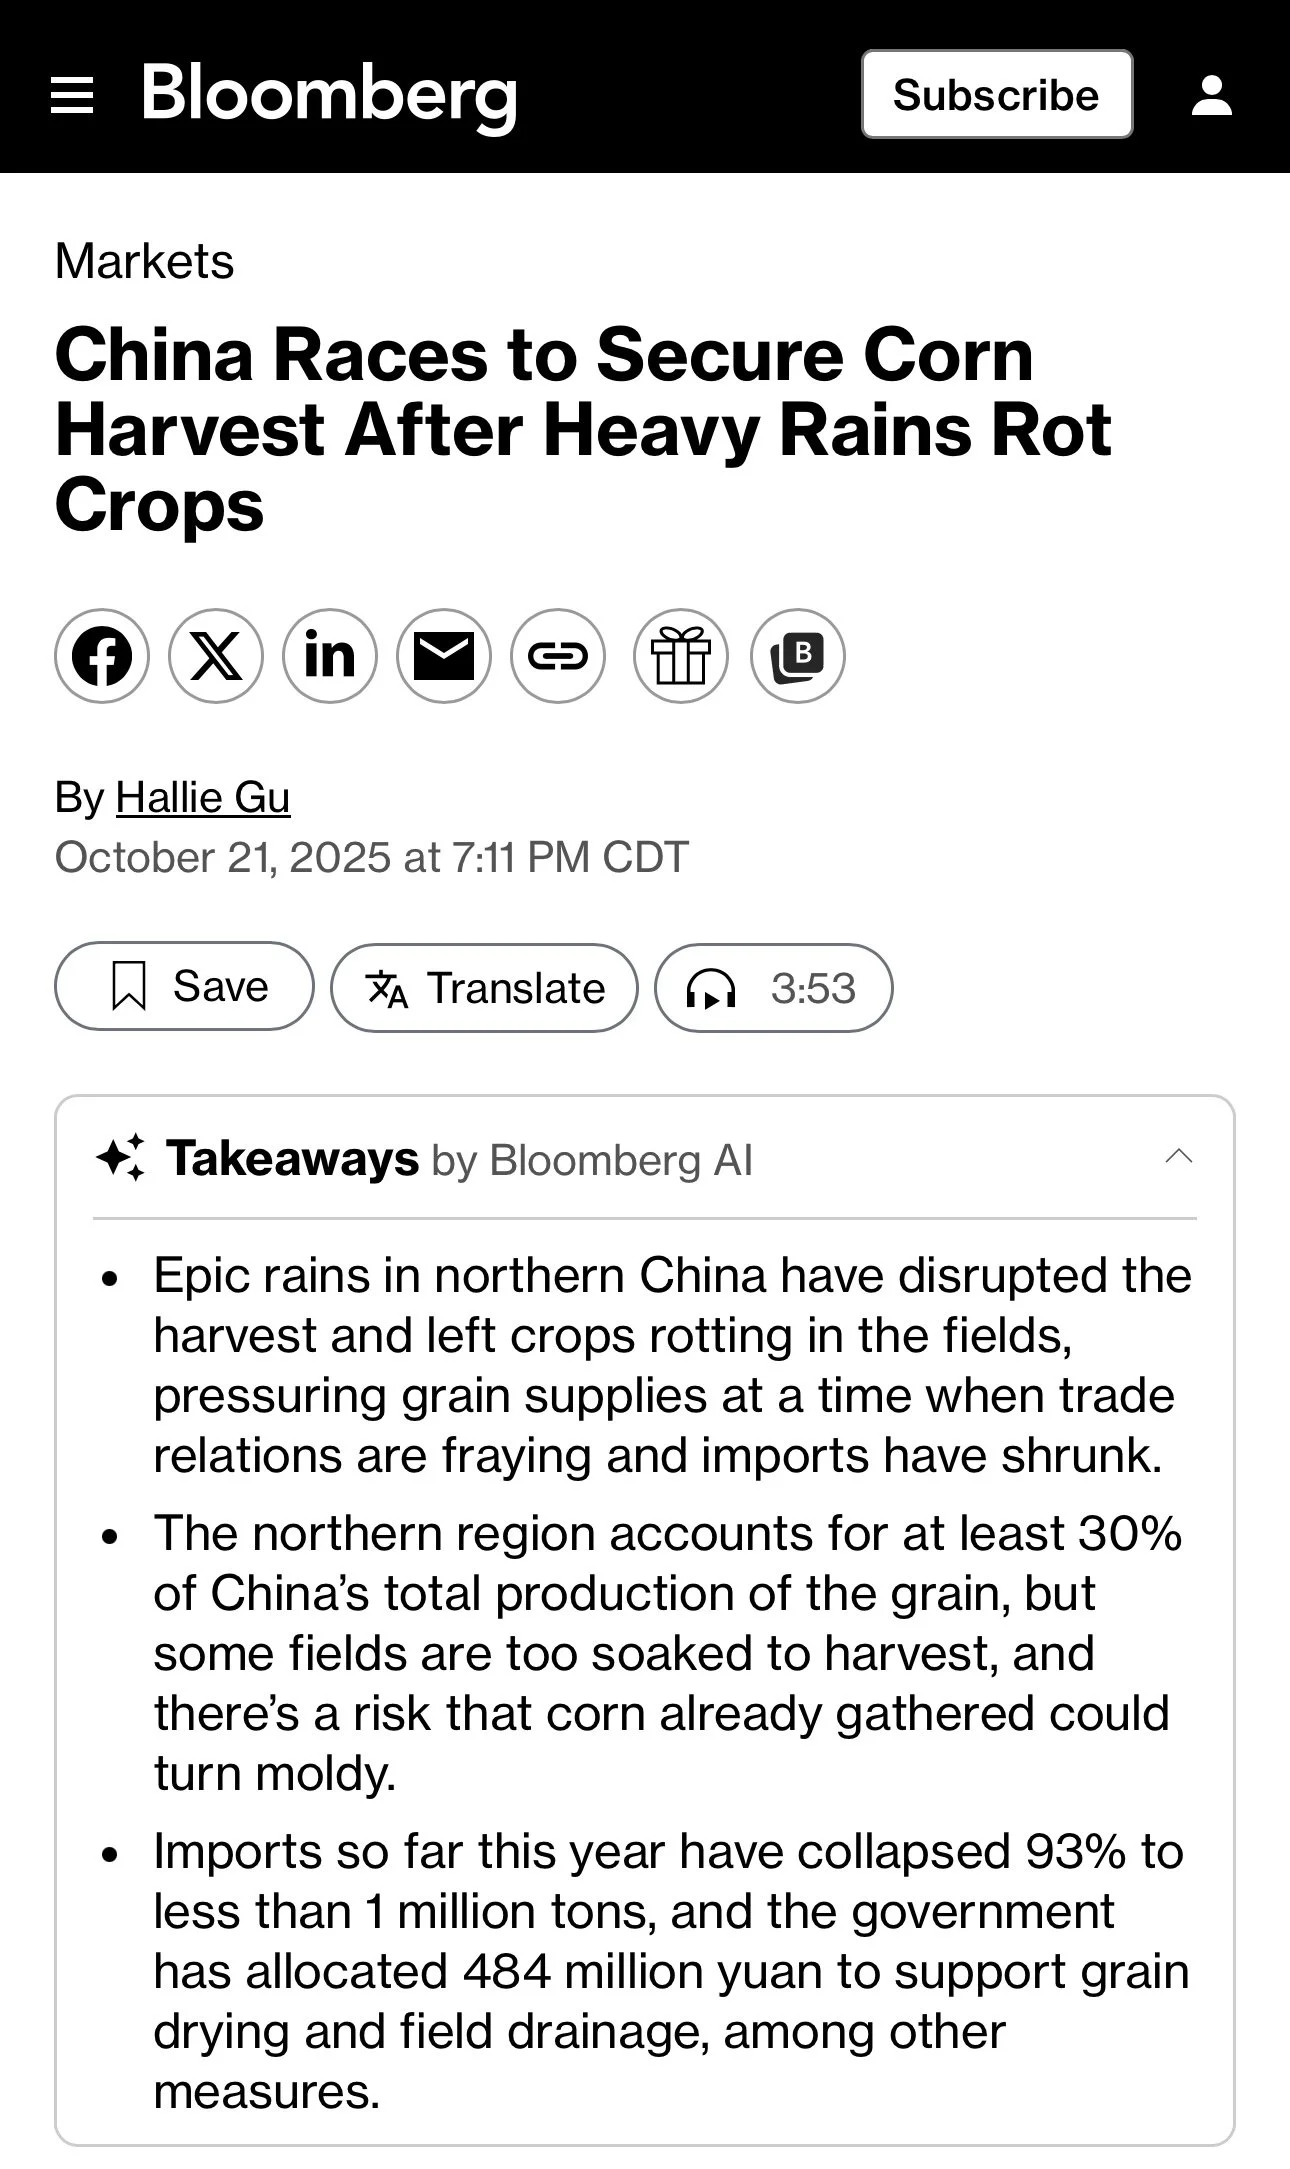
China has not bought any US corn in a very long time.
Their US corn imports have continued to shrink since the phase 1 trade agreement.

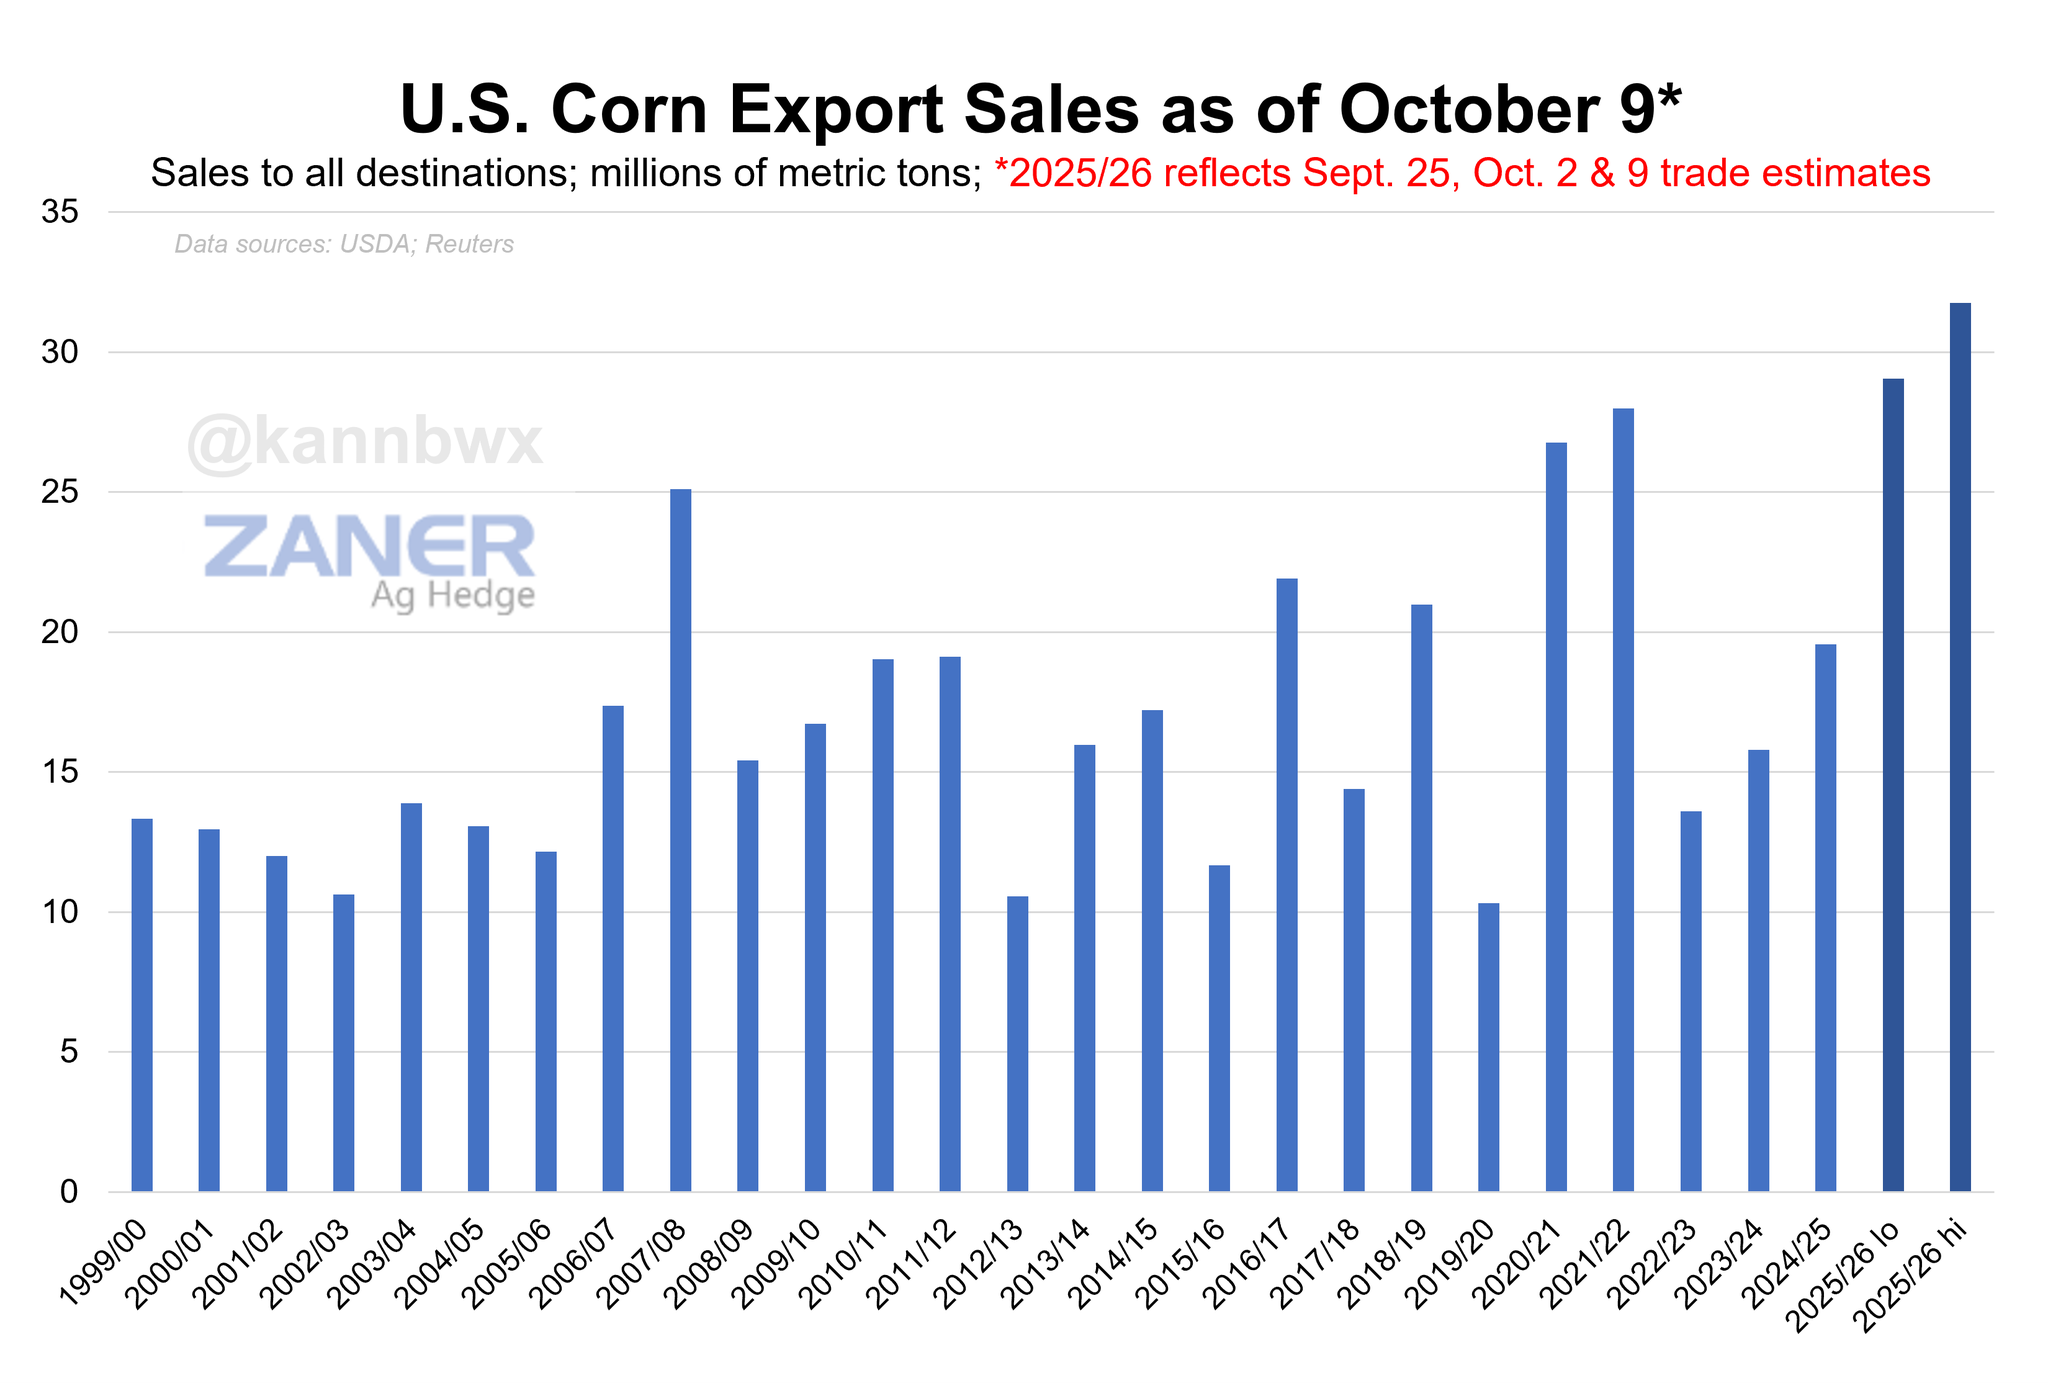
The last bull run in corn was largely due to the demand we saw from China buying US corn.
Even with zero business to China, corn demand is at a record.
Surpassing the demand we saw during the last bull run.
Who knows if China will actually buy US corn. They do have large corn stocks they can tap into, but nobody knows how accurate the data actually is.
However, you can only imagine how friendly it would be for this market if China did come in and buy US corn.
I'm obviously not getting my hopes up and betting the house on this happening.
But what if China has to buy US corn? Or what if we sign a trade deal where they agree to buy some corn? We already have record demand without them.
Chart from Karen Braun
Options vs DP
Many of you have asked about DP charges and what you should do.
Here is a good article that Jeremey and Lauren at Texas Hedge Risk put together:
Many farmers face a critical decision. Should they pay DP charges for stored corn, or explore a different strategy?
The answer is clear for most.
You're likely better off with selling corn and re-owning it will call options.
This approach can save you significant money while keeping your upisde potential.
Here is the math behind it:
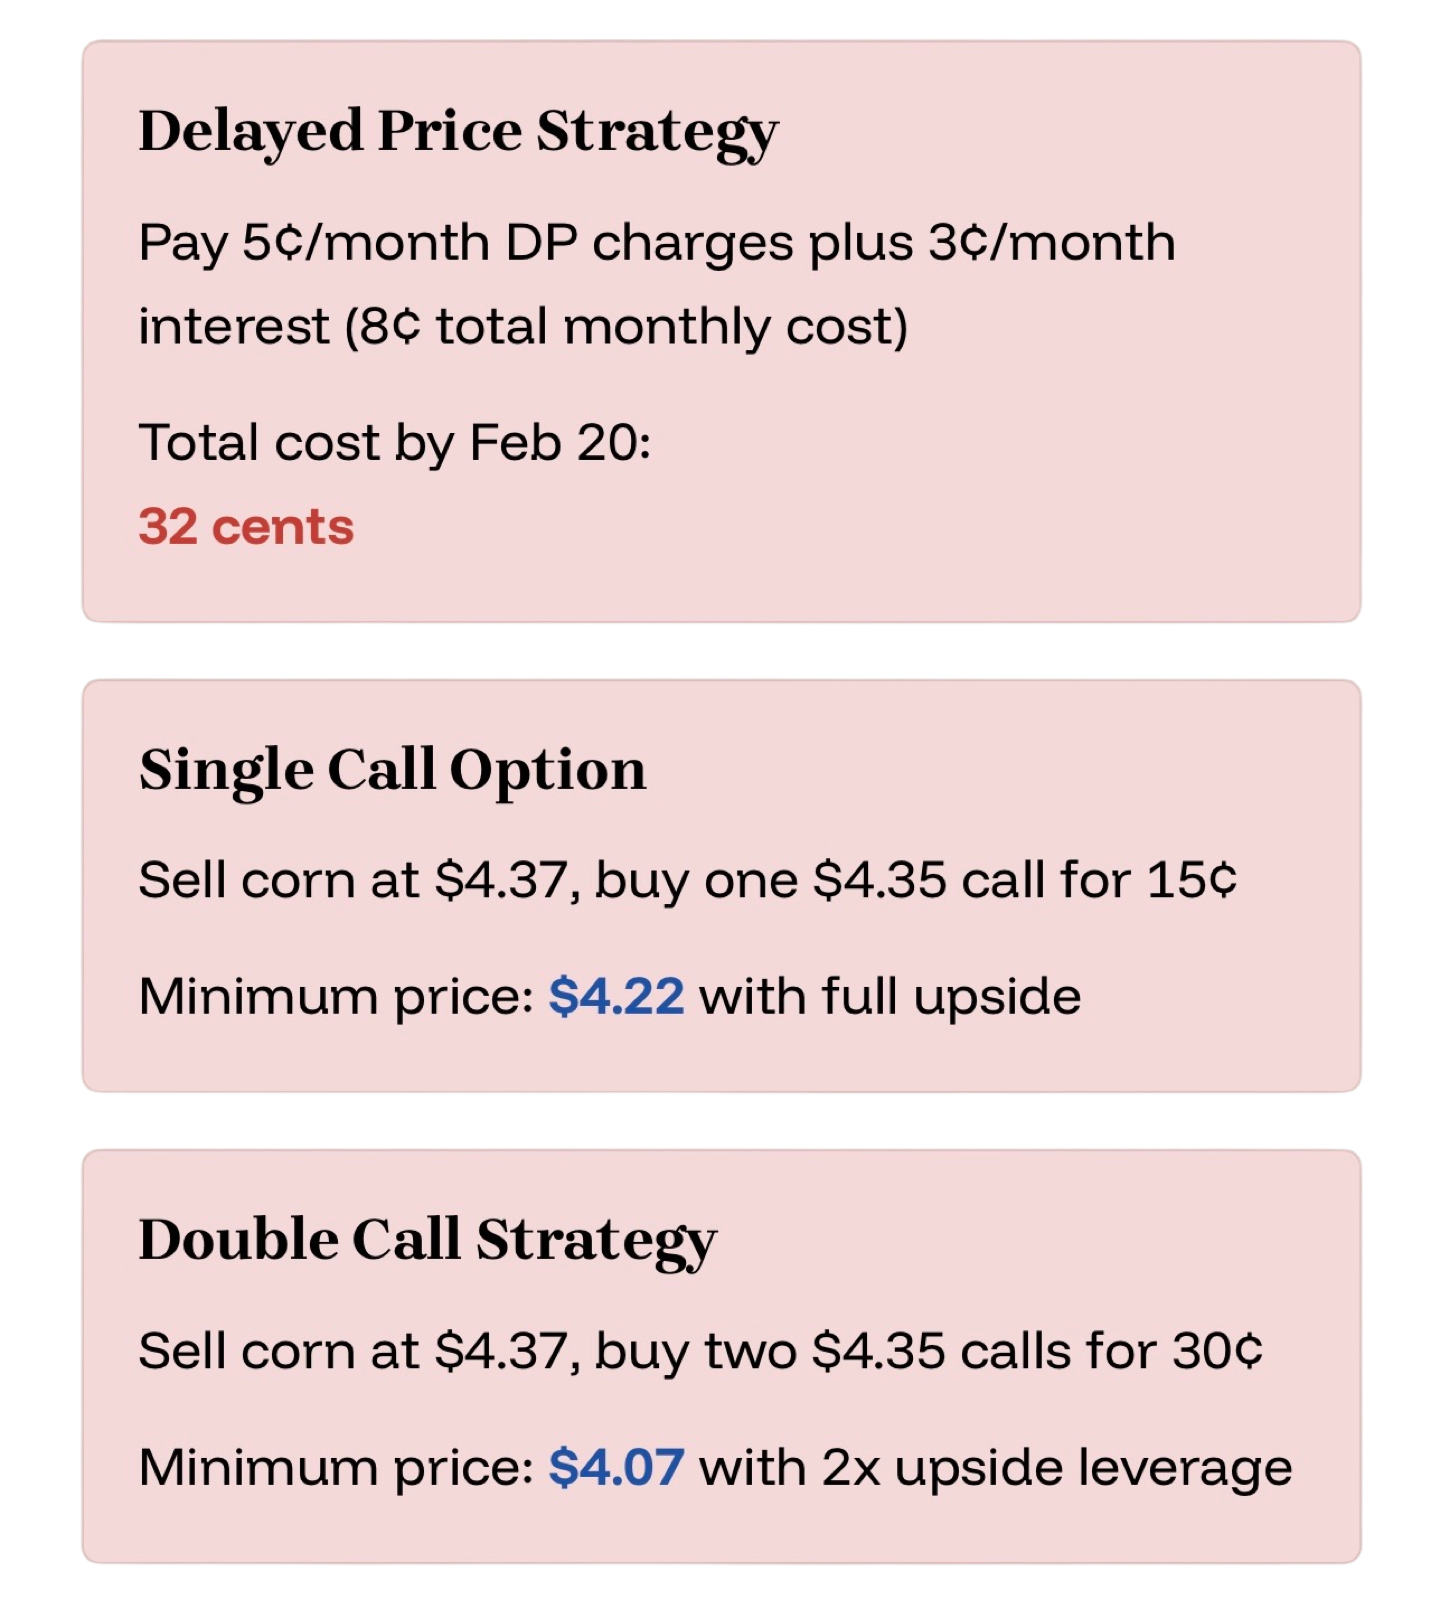
Assume you are paying 5 cents per month in DP charges. Plus 8% interest on a line of credit.
At $4.50 corn, interest costs run you 3 cents a month.
For a total of 8 cents every month when you combine the DP and interest.
By February 20th, holding corn on DP would cost you 32 cents in total.
Here is an alternative:
March futures are trading at $4.37
The March $4.35 call options cost only 15 cents.
This presents a compelling opportunity.
You could sell your physical corn, buy one call option to protect your upside, and still come out ahead.
Even better.. you could buy two call options for 30 cents.
This 30 cents for the options would still be less than your total carrying costs.
While leaving you with exposure to the upside if we were to rally.
Here is a visual of the strategies and their minimum prices etc.
Now let's compare the outcomes based on various price scenarios.
In this scenario we used $4.00 to $5.65 corn, assuming you must sell by February 20th when the options expire.
This visual comparion reveals a striking difference in outcomes depending on where the market goes.
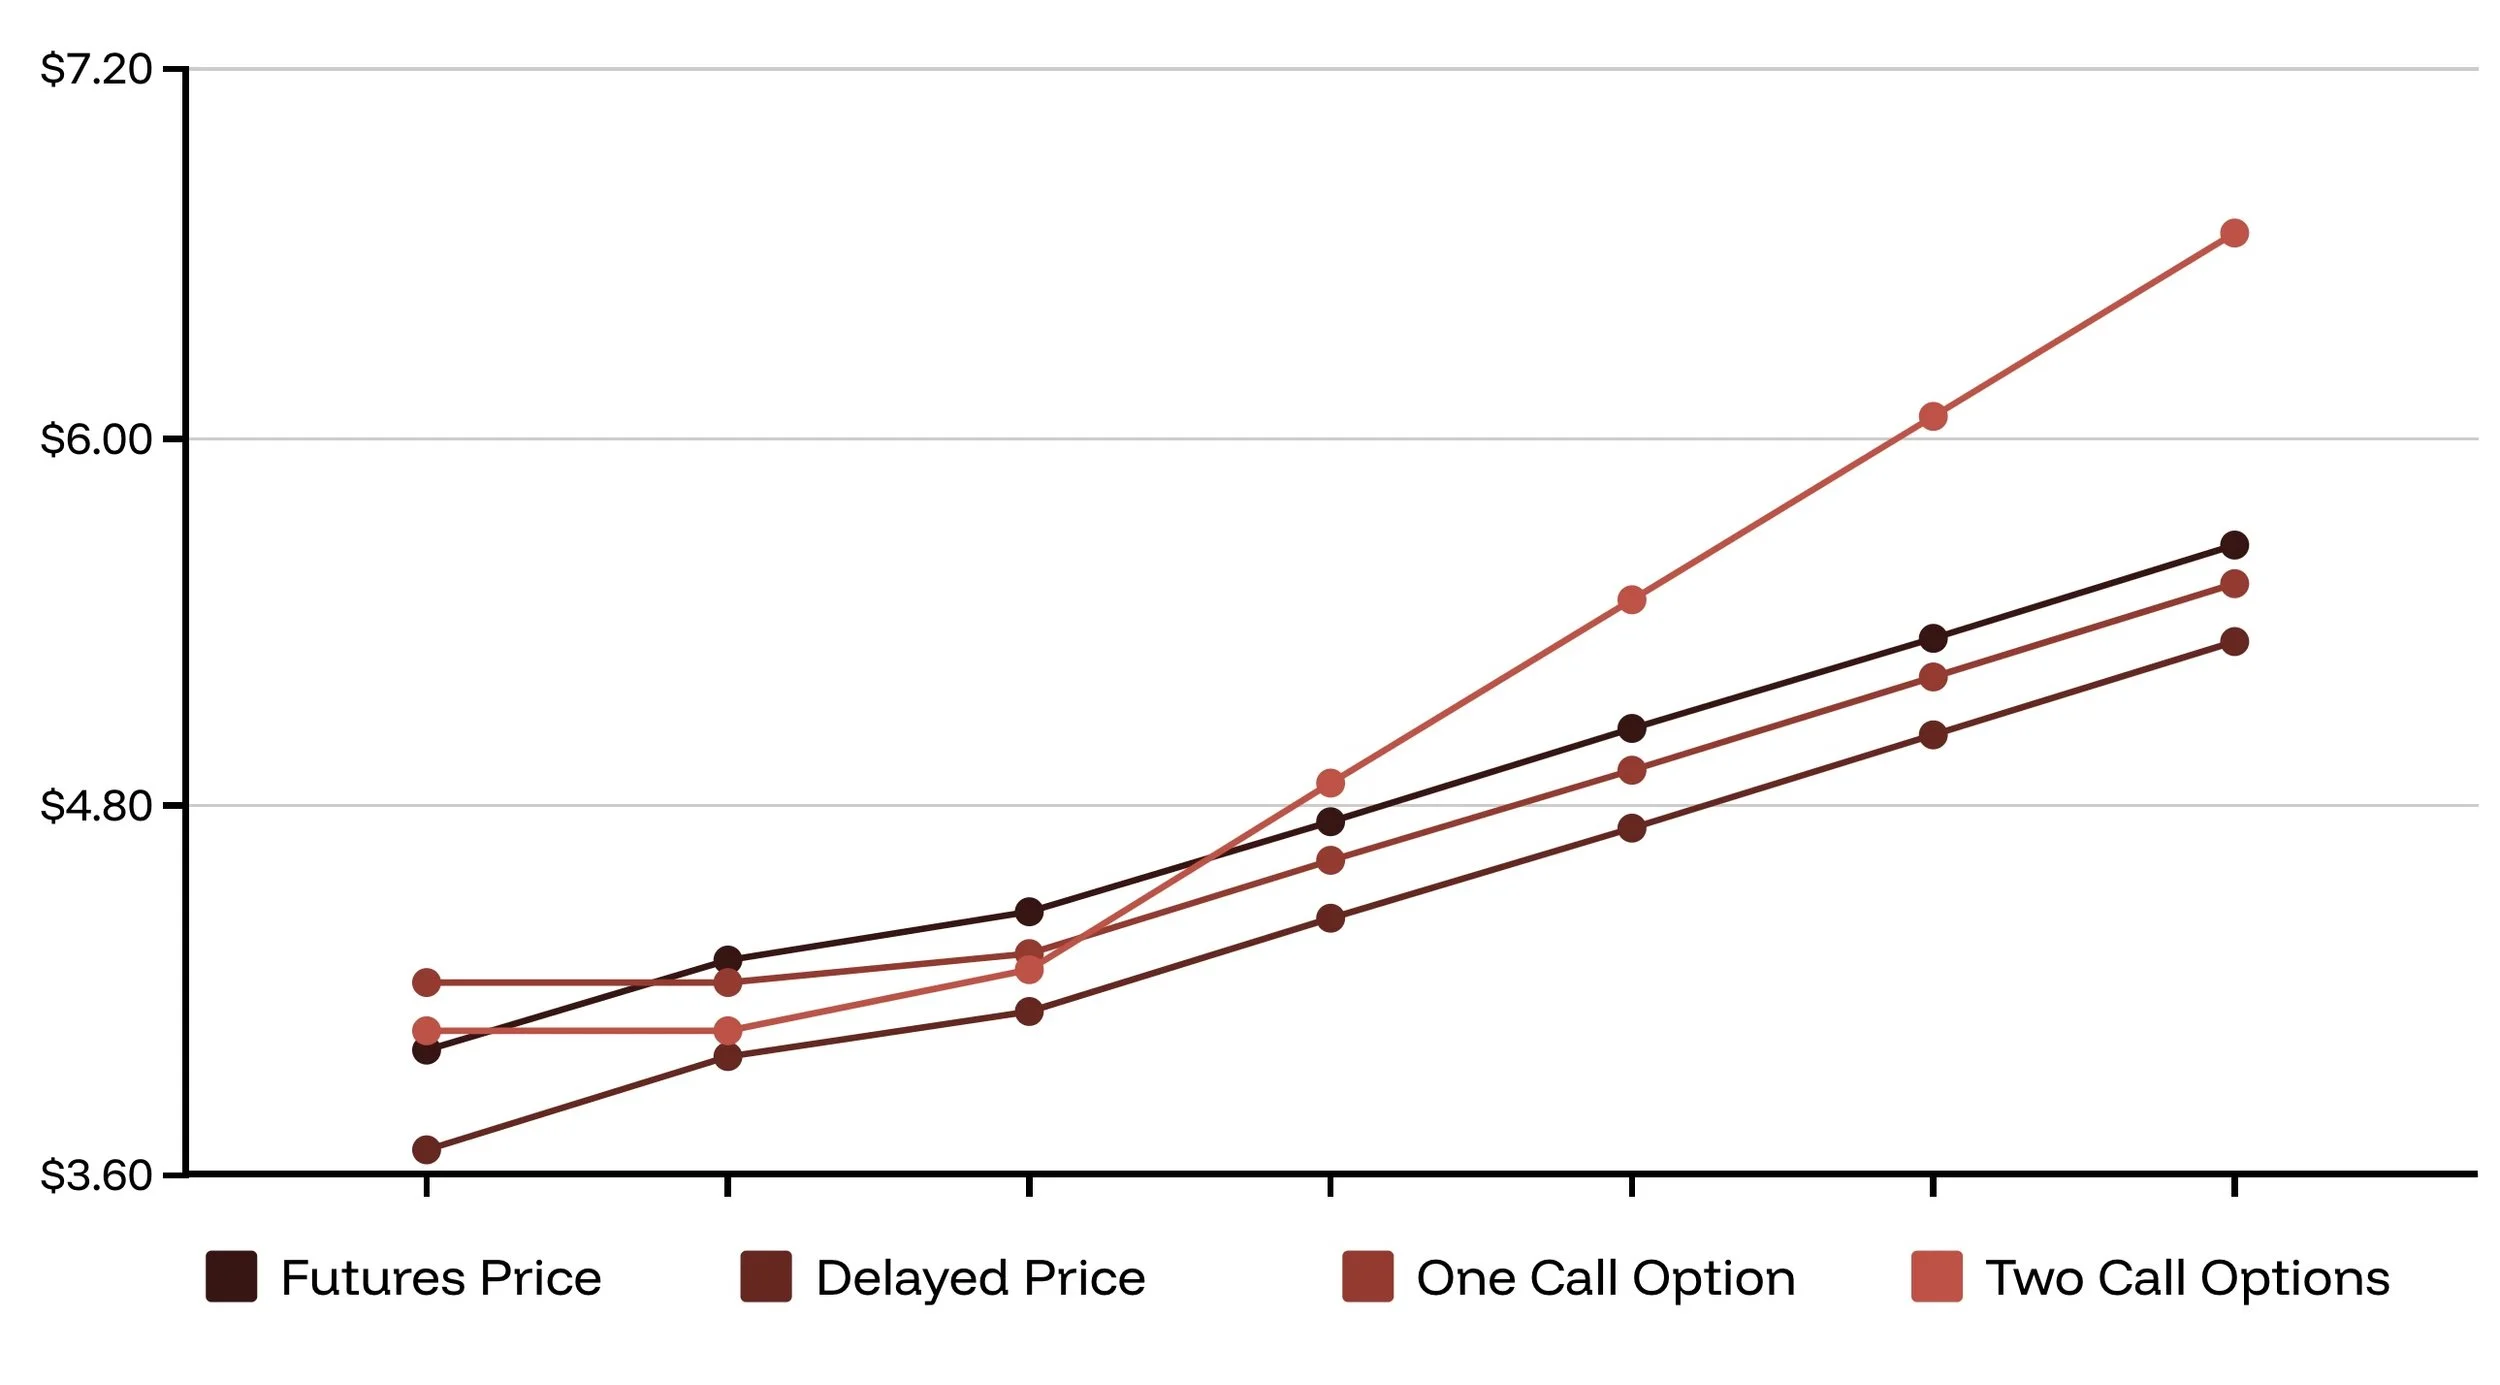
Here is a table of the outcomes.
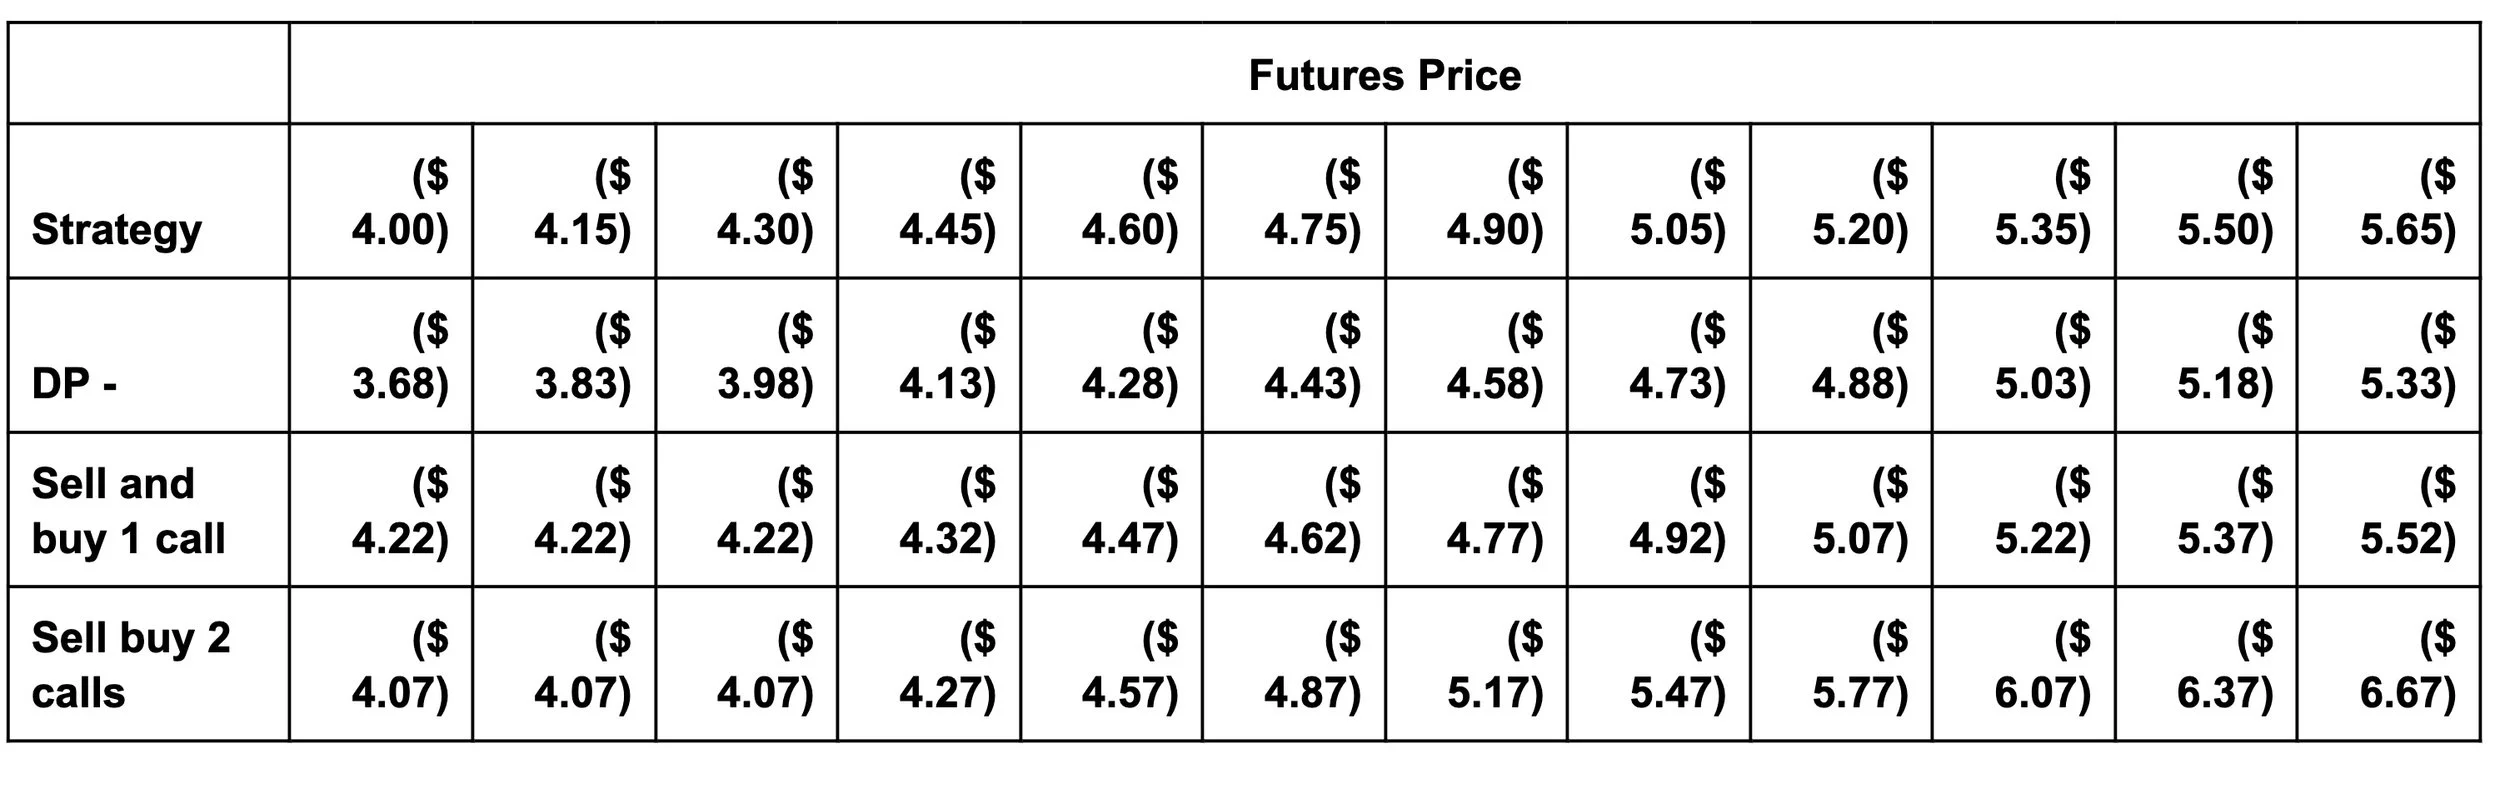
The DP strategy simply delivers the futures price minus 32 cents in total carrying costs.
The one call option strategy provides a floor of $4.22 by ($4.37 futures price minus 15 cents for call option). While keeping your upside open.
The double call strategy provides a floor of $4.07 ($4.37 futures price minus 30 cents for both call options). While keeping your upside open by twice as much.
For example, if corn were to rally to $5.05 like we did last year. You would receive $5.47. Which is a full 74 cents above the DP outcome.
So should you pay DP charges?
Probably not in this current environment.
However, this analysis does NOT account for basis appreciation or extreme market moves in either direction.
Remember, you can always make marketing decisions and defer payment until January 1st. The right pricing decision and the right cash flow decision don’t have to align.
The bottom line: If your elevator will improve basis even on DP corn, you might justify paying DP. But right now, options are simply too cheap and DP charges are too expensive to ignore this strategy.
Give us a call or a text if you want to talk through this or have any questions at all.
(605) 295-3100
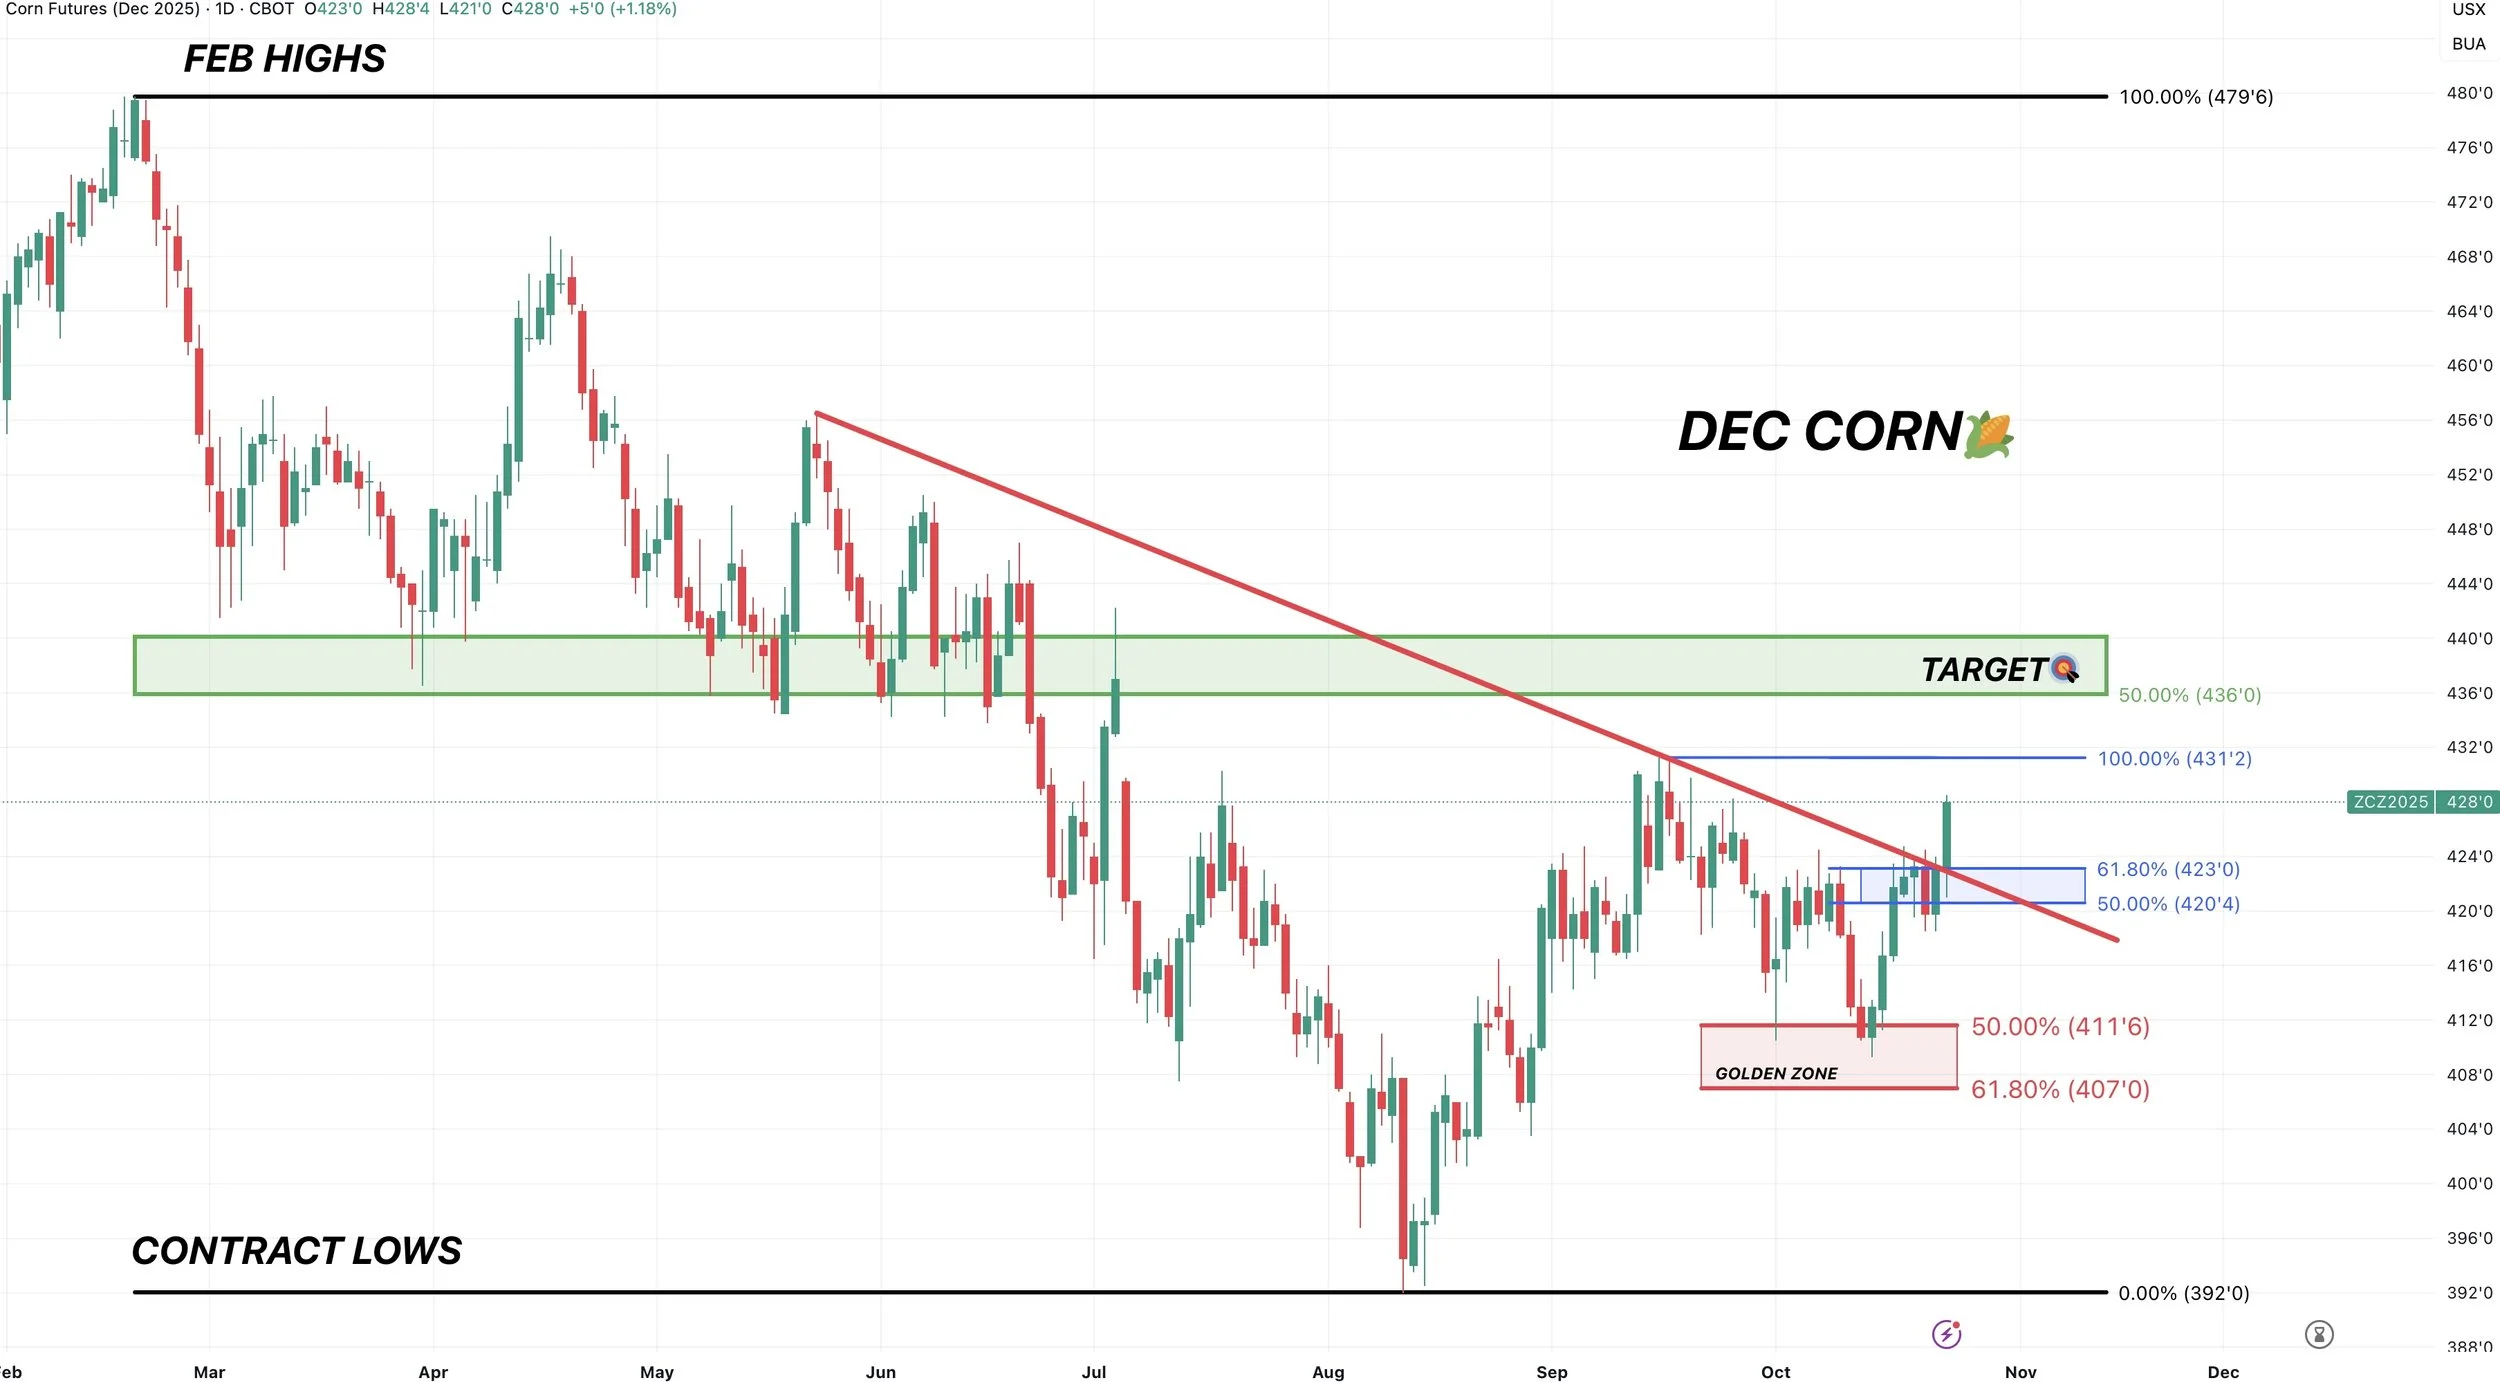
Technicals:
I really like what I am seeing out of corn.
We finally broke that $4.23 level we had been talking about.
$4.23 clawed back 61.8% of the Sep highs.
That is where most relief bounces fail.
Since we are above that level, it tells us this is no longer seen as just a small bounce. It could very well be the start of something bigger.
More often than not.. it is a sign we are in for some more upside.
Our first target is still $4.35.
That gives back 50% of the Feb highs. It is also old key support from spring, now viewed as resistance.
That is a good spot to start to de-risk.
Soybeans
Fundamentals:
Today it was confirmed that Trump and China are scheduled to meet in exactly a week.
48 hours before those 100% tariffs on China are set to go into effect.
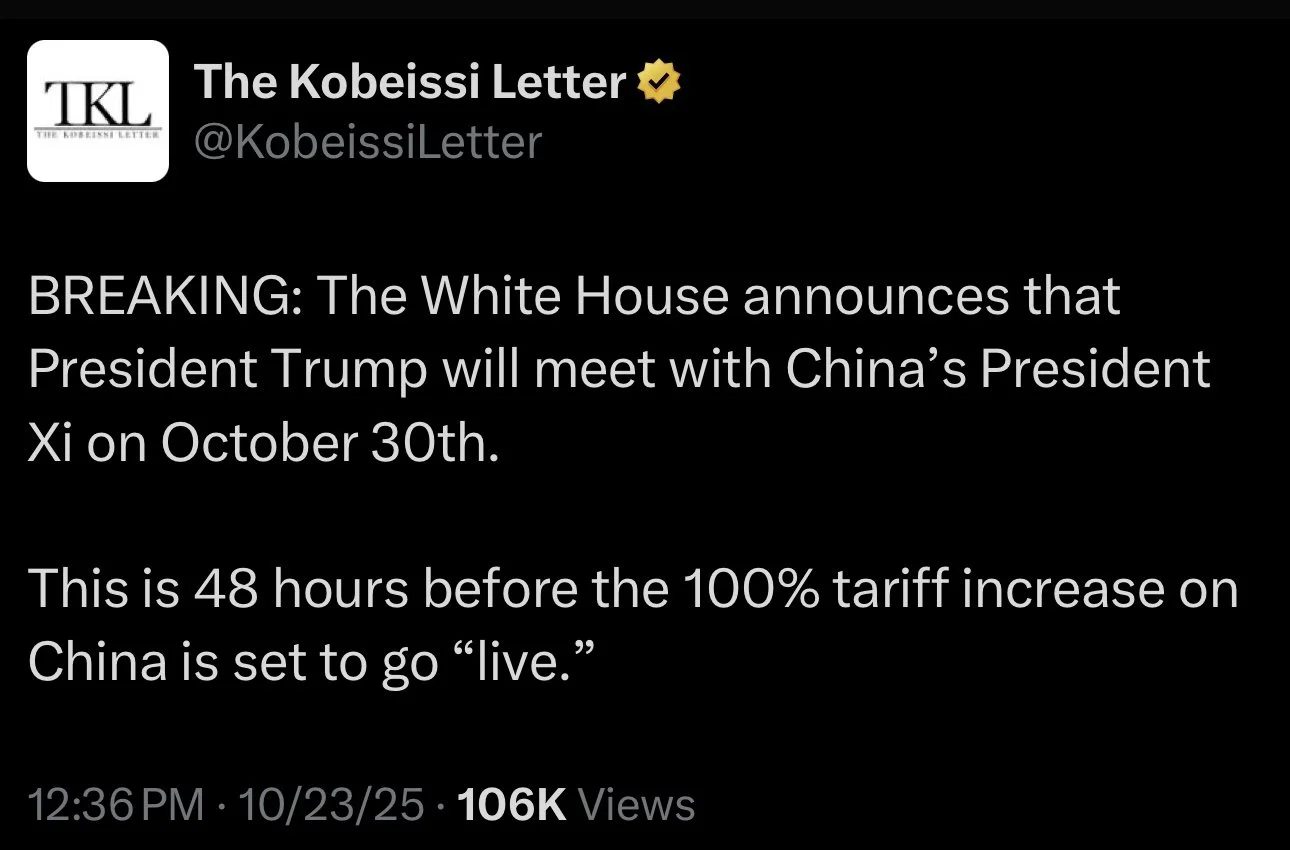
Where this market decides to go will likely stem from what happens between them.
This market continues to trade headlines.
If we strike a deal, there is incredible upside.
If the meeting is a flop, we probably sell off.
One negative headline could very easily kill this rally.
On the other hand, if we do end up making a deal with China and they come in and buy our soybeans.. this market has some insane upside potential.
I have no idea where soybean exports will end at. Rumors are that China is still going to need around 300 million bu of soybeans to meet their needs until Brazil's crop comes online.
Last year China bought 800 million bu from us. So if we secured that 300 million bu worth of demand, we would still be -500 million bu short of last year. But other countries have been stepping up to offset those losses.
If demand is fine, or if China actually buys soybeans. The supply side of the balance sheet is still razor thin.
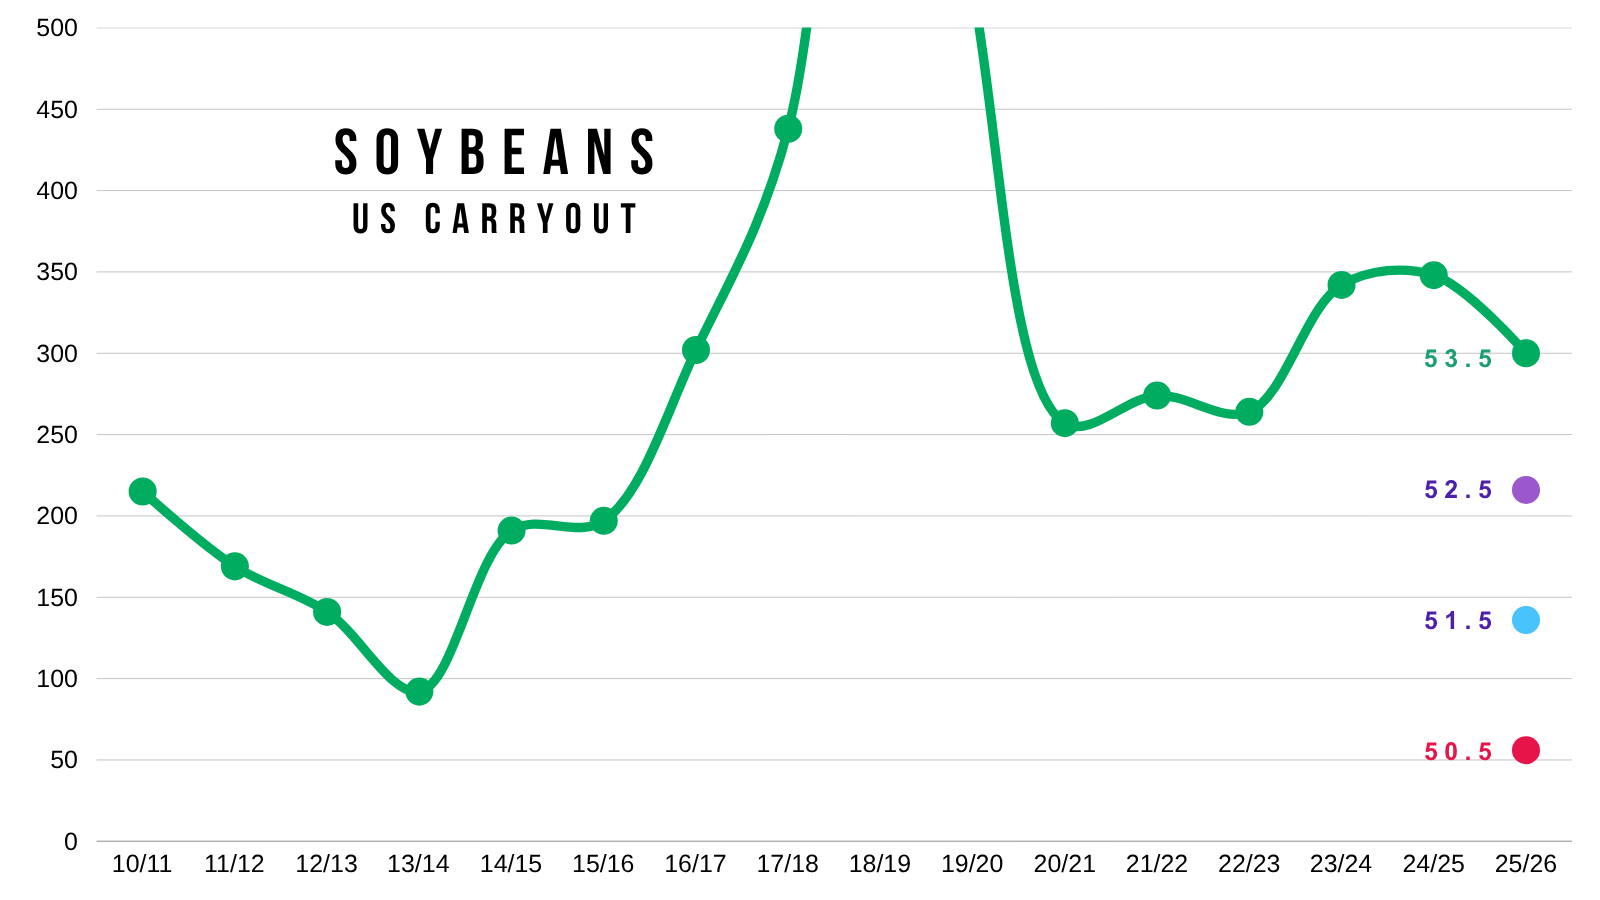
The chart below is where would carryout would come in at based on different yield numbers while using the current demand numbers the USDA has.
As always, if supply drops, the USDA will lower demand and offset some of the supply loss. So the chart isn’t fully accurate. But you get the idea. No room for error on yield.
That is why this market has potential. What if yield isn’t there? What if China buys soybeans?
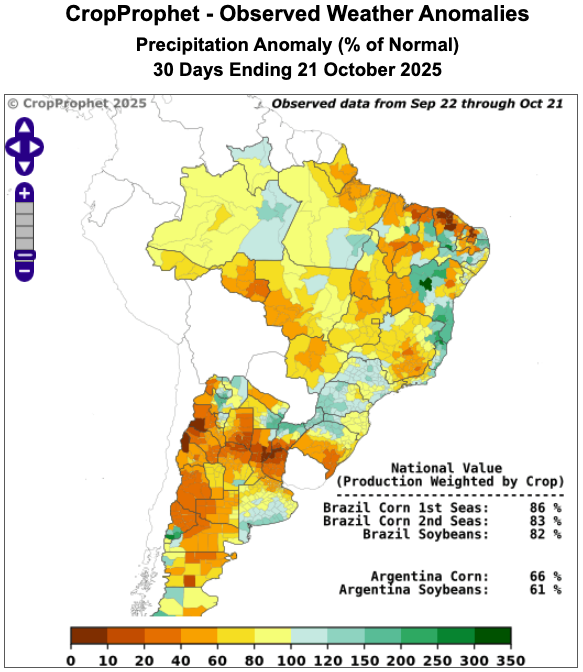
Currently, China is placing a pretty big bet on Brazil weather.
If Brazil has any production issues at all, China will almost be forced to come to the US.
It is still too early to be calling for some drastic drought or production problem in Brazil, but the last 30 days have been pretty dry.
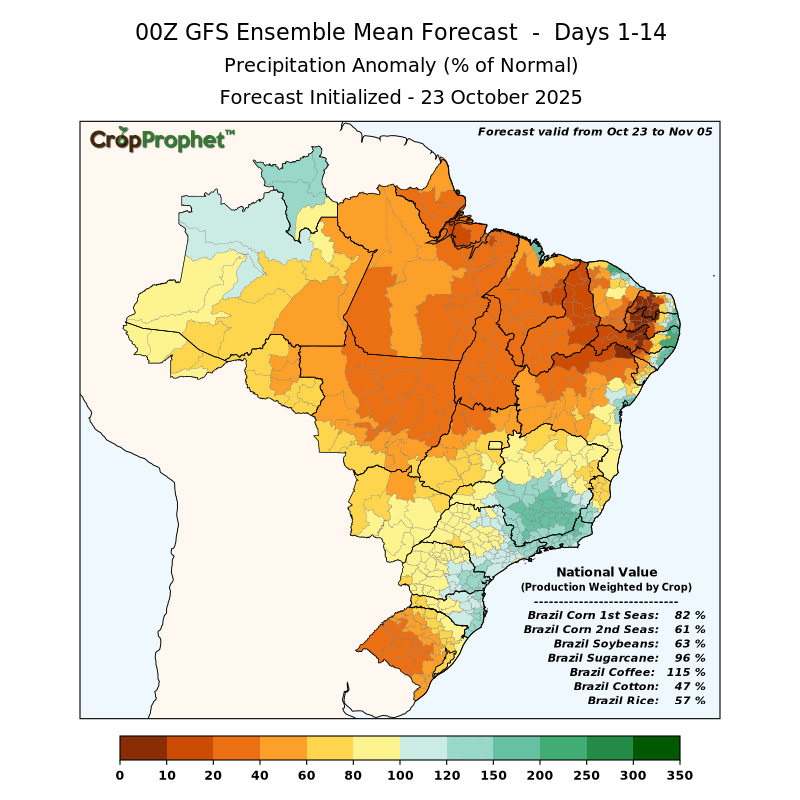
Here are maps from Crop Prophet that show Brazil's rainfall based on the percentage of normal.
Last 30 Days: 82% of normal
Last 14 Days: 63% of normal
Technicals:
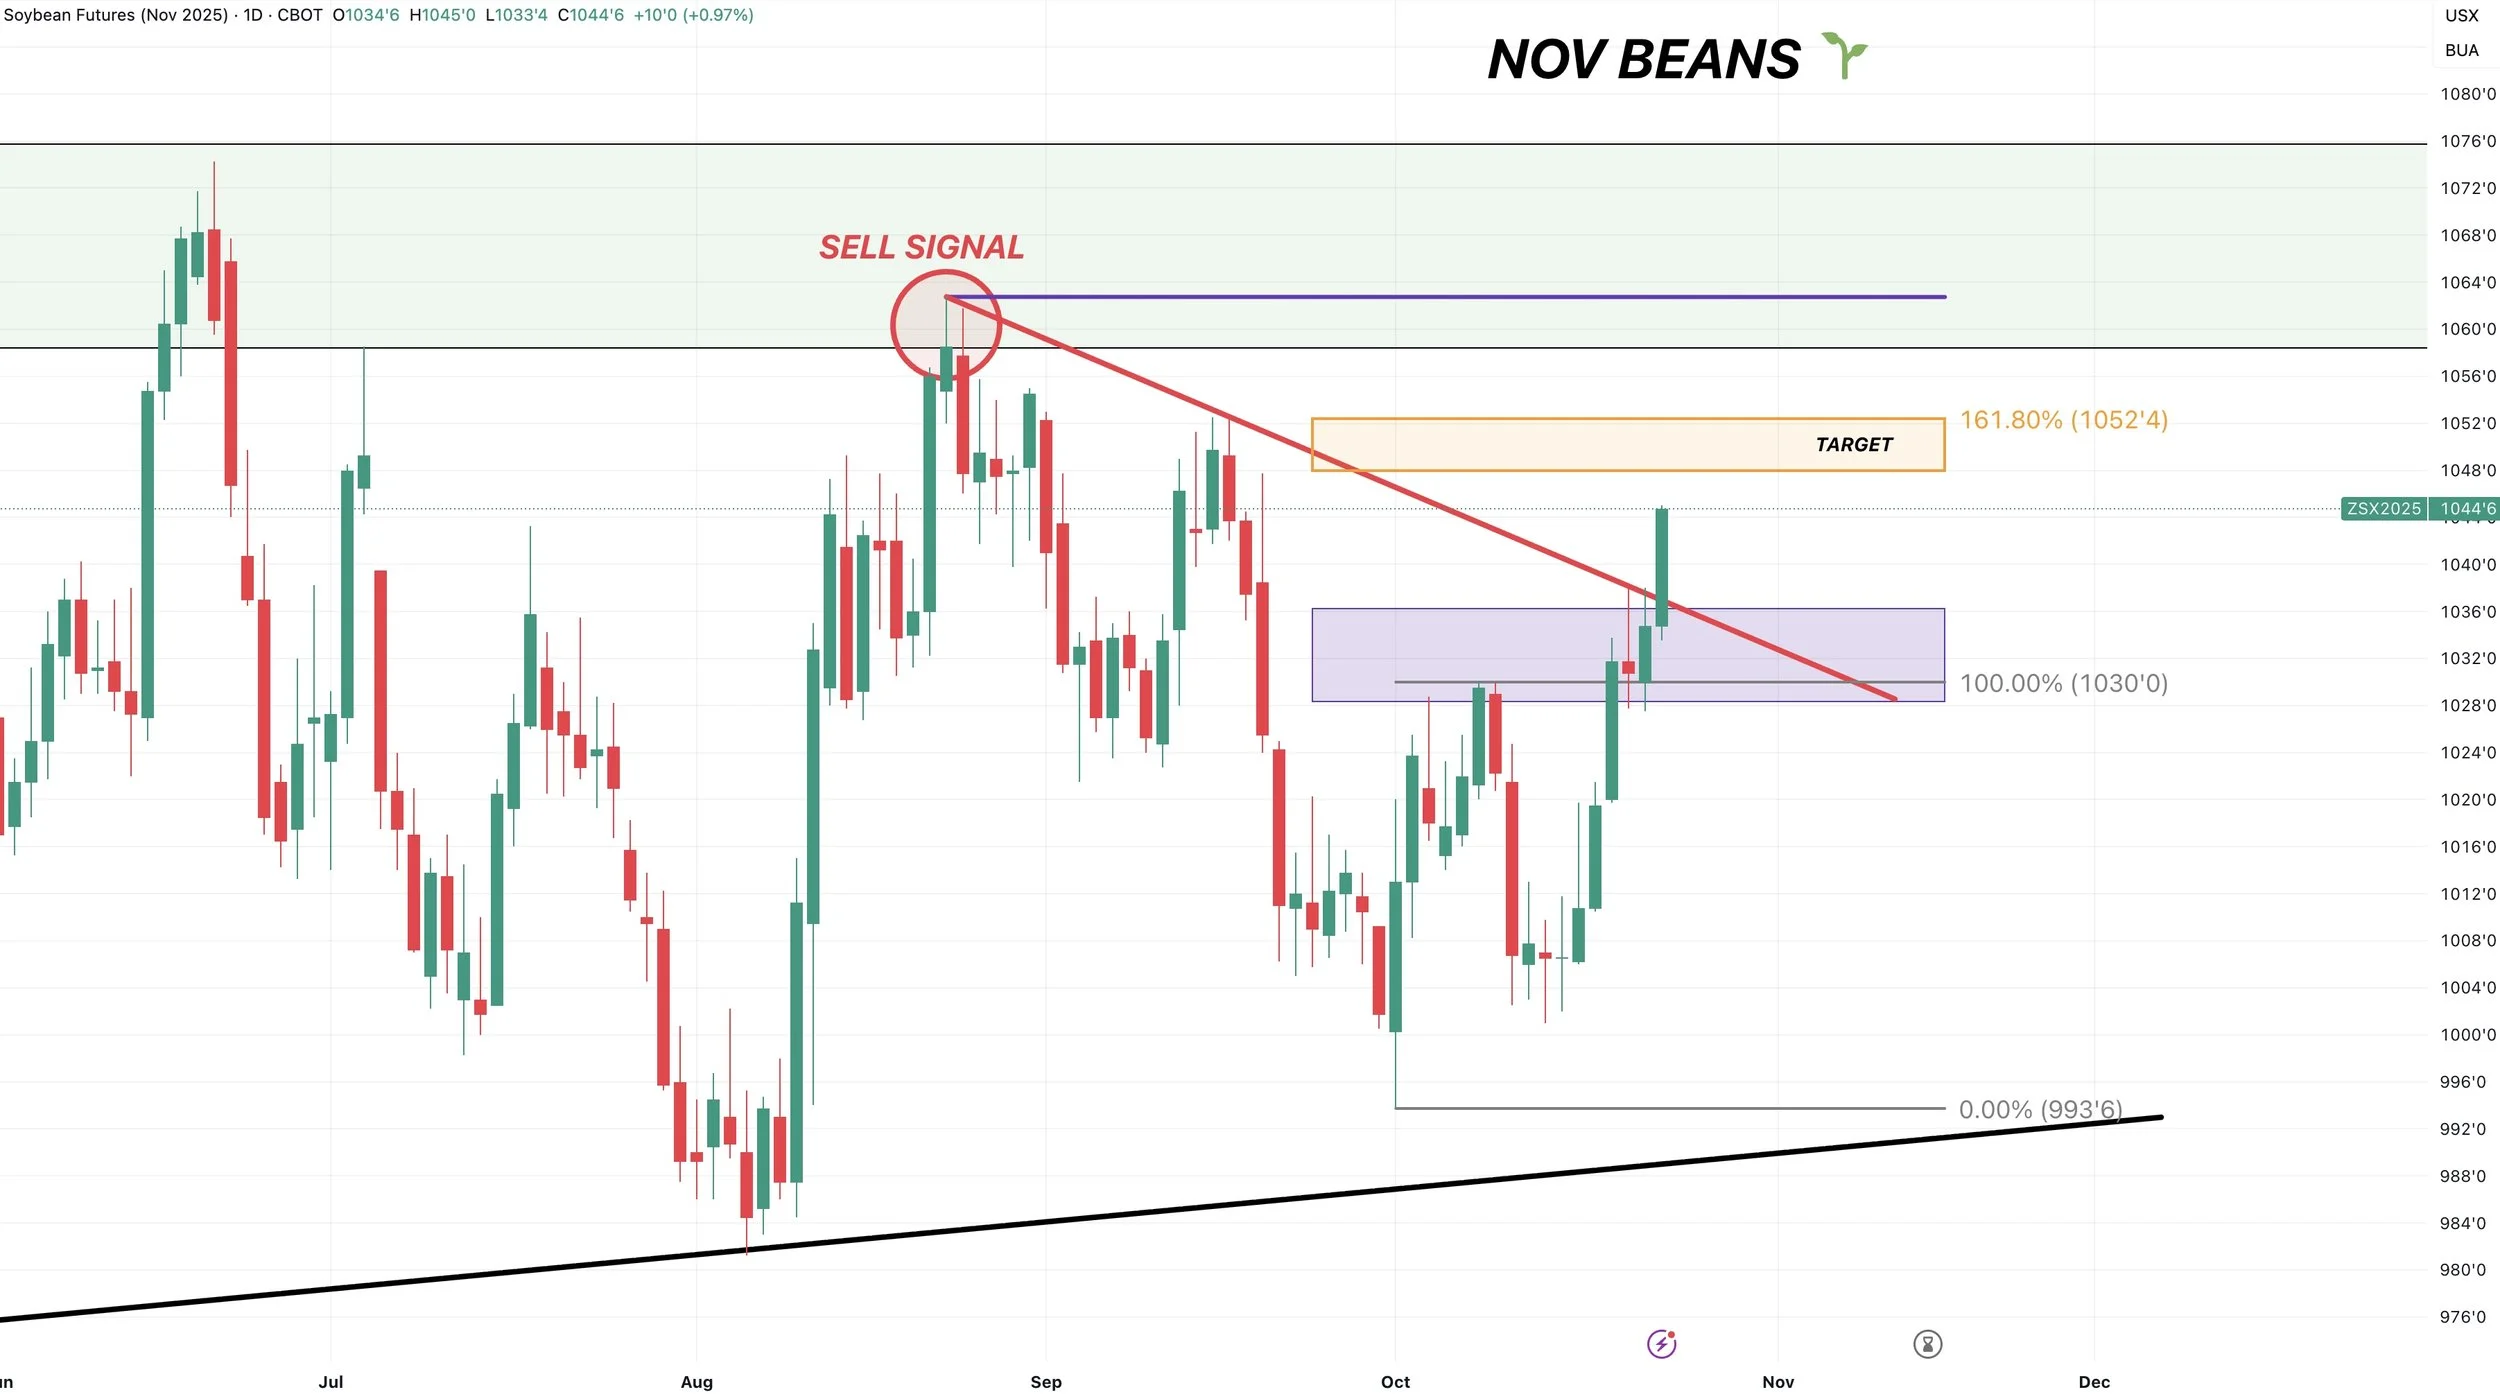
Nov Beans
Great price action in soybeans.
We broke above $10.37 which was the 61.8% retracement up to those August highs.
Like in corn, when you break above this level, it oftens tells us that this is no longer a relief bounce and indicates there is more upside from here.
Not everytime.. but most of the time.
We also busted above downtrend resistance that marked the August and September highs.
We are now approaching my first target since our sell signal on August 22nd at $10.60
Next Target: $10.48 to $10.52
Why here?
$10.48 is the 78.6% retracement up to the August highs. It is the next fib level after the 61.8% one.
$10.52 is the golden fib (161.8%) of the first rally we saw off the lows. A common spot for a rally to pause.
In my next chart a give a better visual as to how the golden fib is calculated.

Here is how the golden fib target is calculated.
You simply take that first rally we saw, and $10.52 equals 161.8% of that the size of that first rally.
Which is marked with the gray lines.
Jan Beans
Jan beans have almost an idential set up to Nov beans.
We shattered that 61.8% level and downtrend resistance.
That first target is $10.66 to $10.67.
Which is the 78.6% level and the golden fib from the first rally.

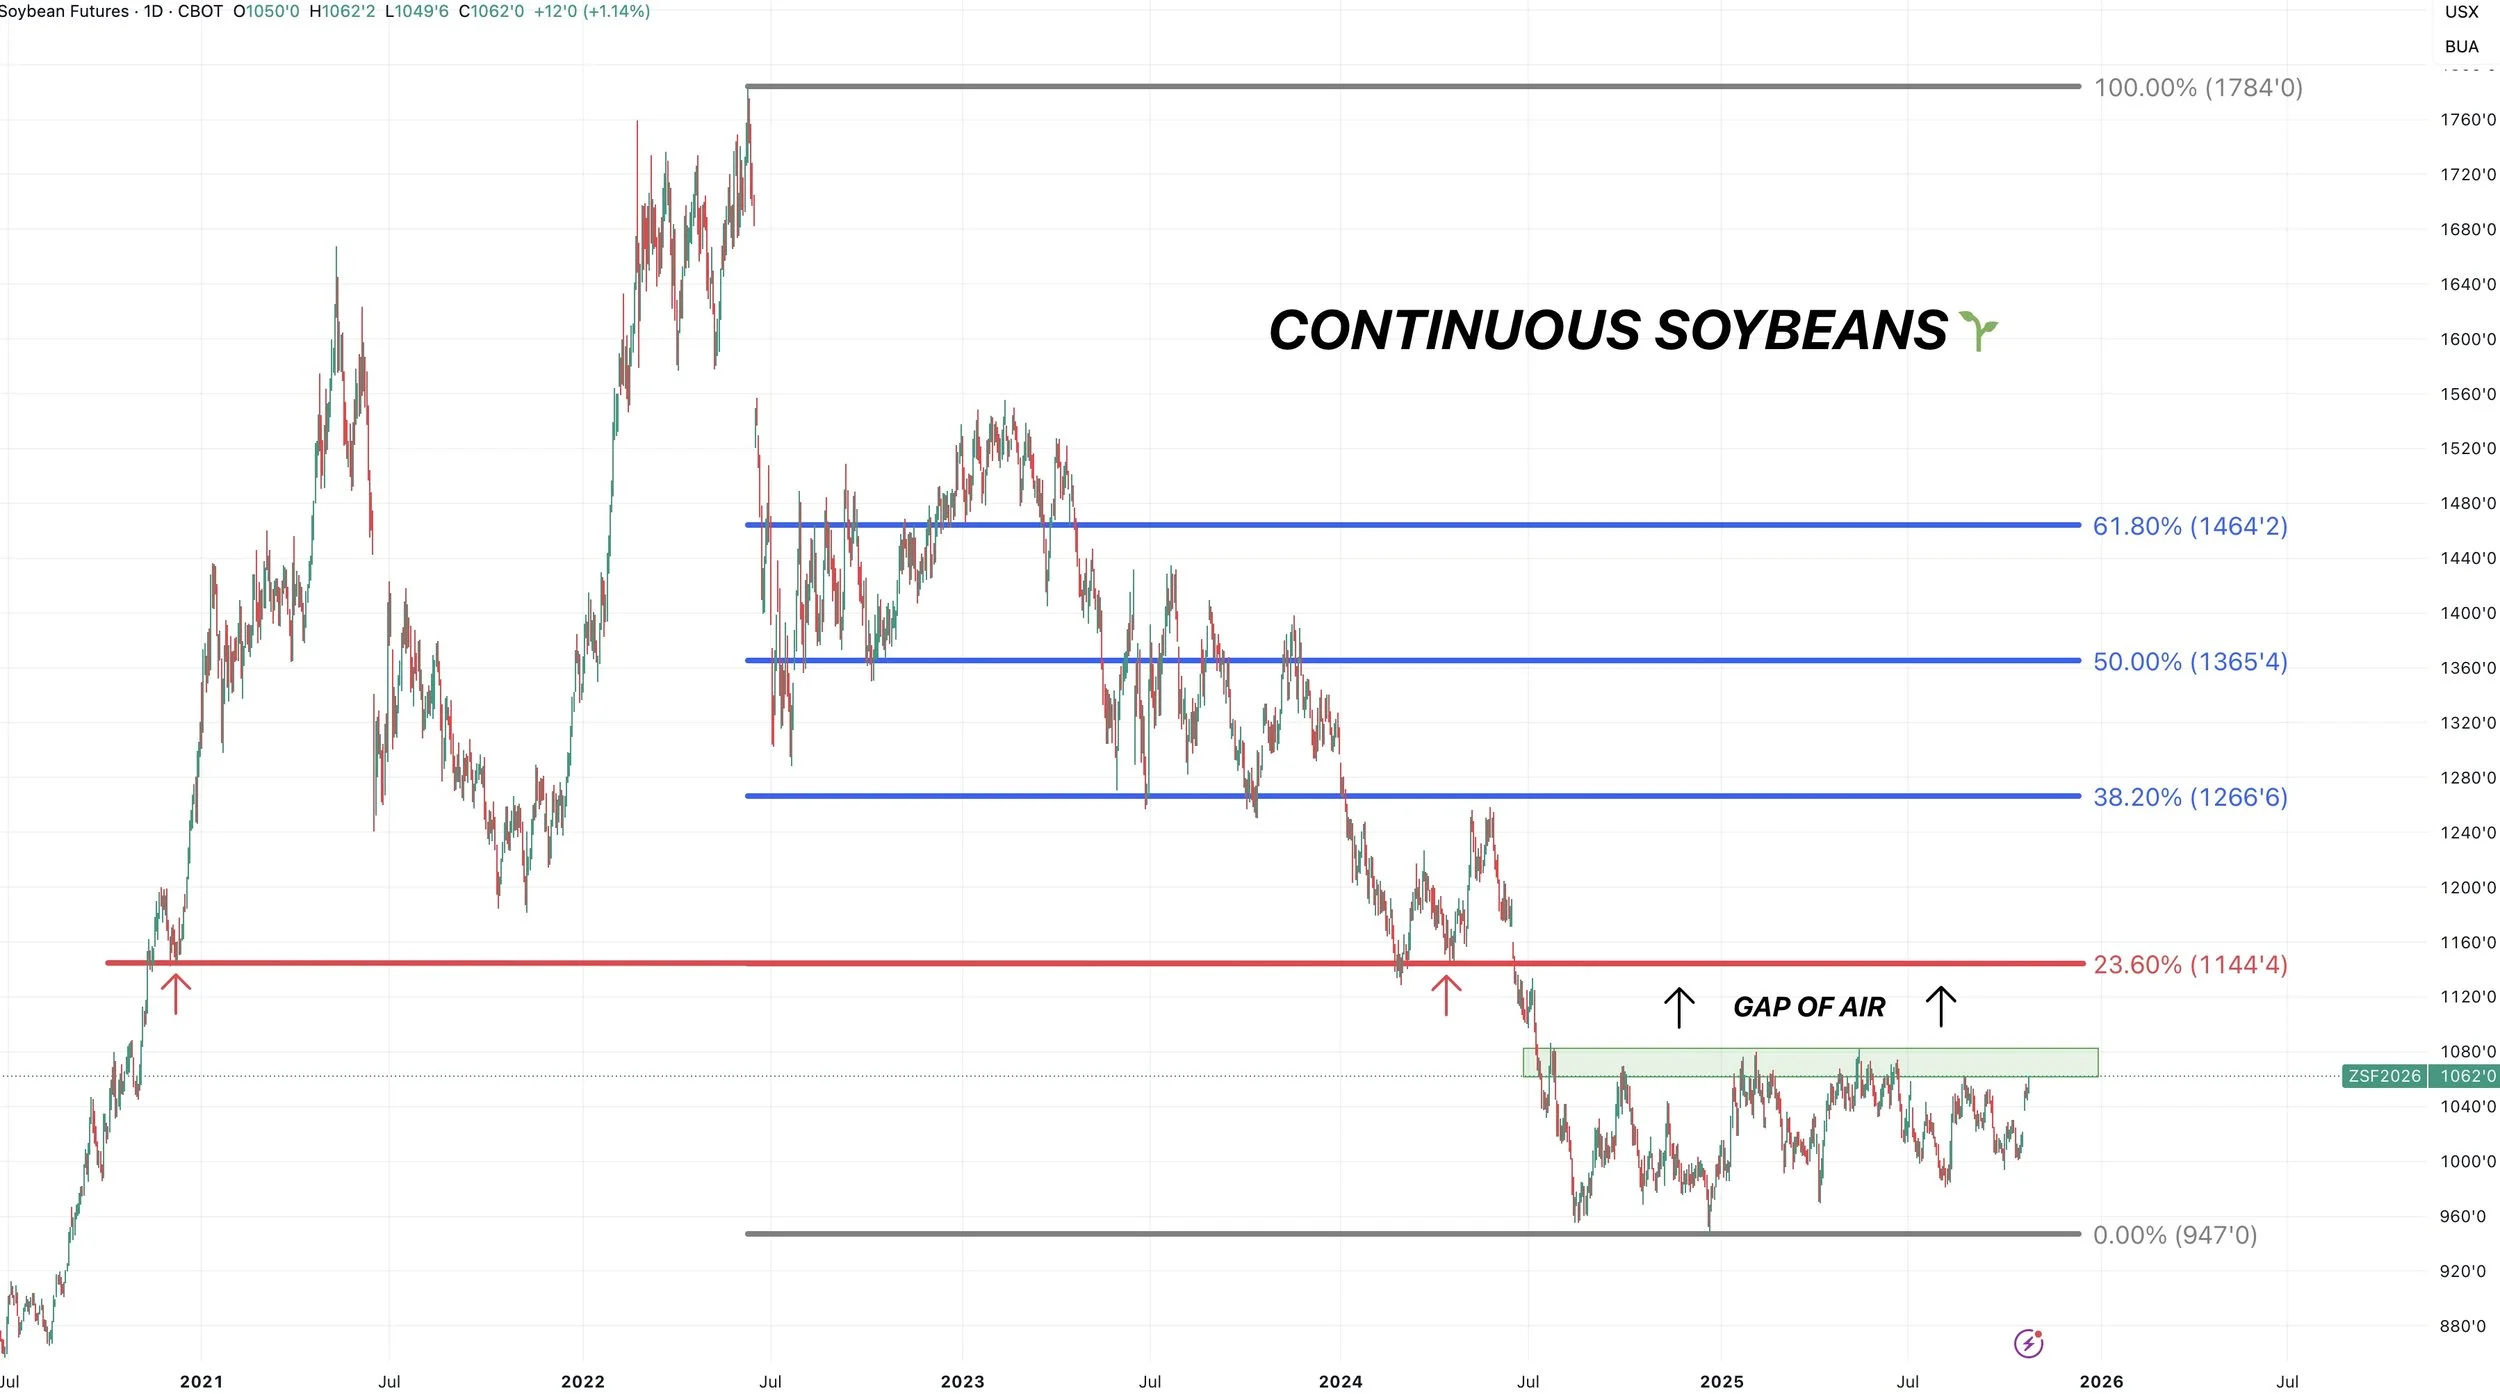
Continuous Beans
Here is a big picture look on soybeans.
Right now we running up into the same area where we've found resistance for a now year.
However.. if soybeans ever clear that $10.80 there is a ton of upside.
For starters, the very first retracement level from the 2024 lows up to the 2022 highs is the 23.6% level. Which comes in at $11.44
Not only that.. but we have a gap of air to upside. Where this market has previously found support. That also perfectly lines up with that $11.44 level.
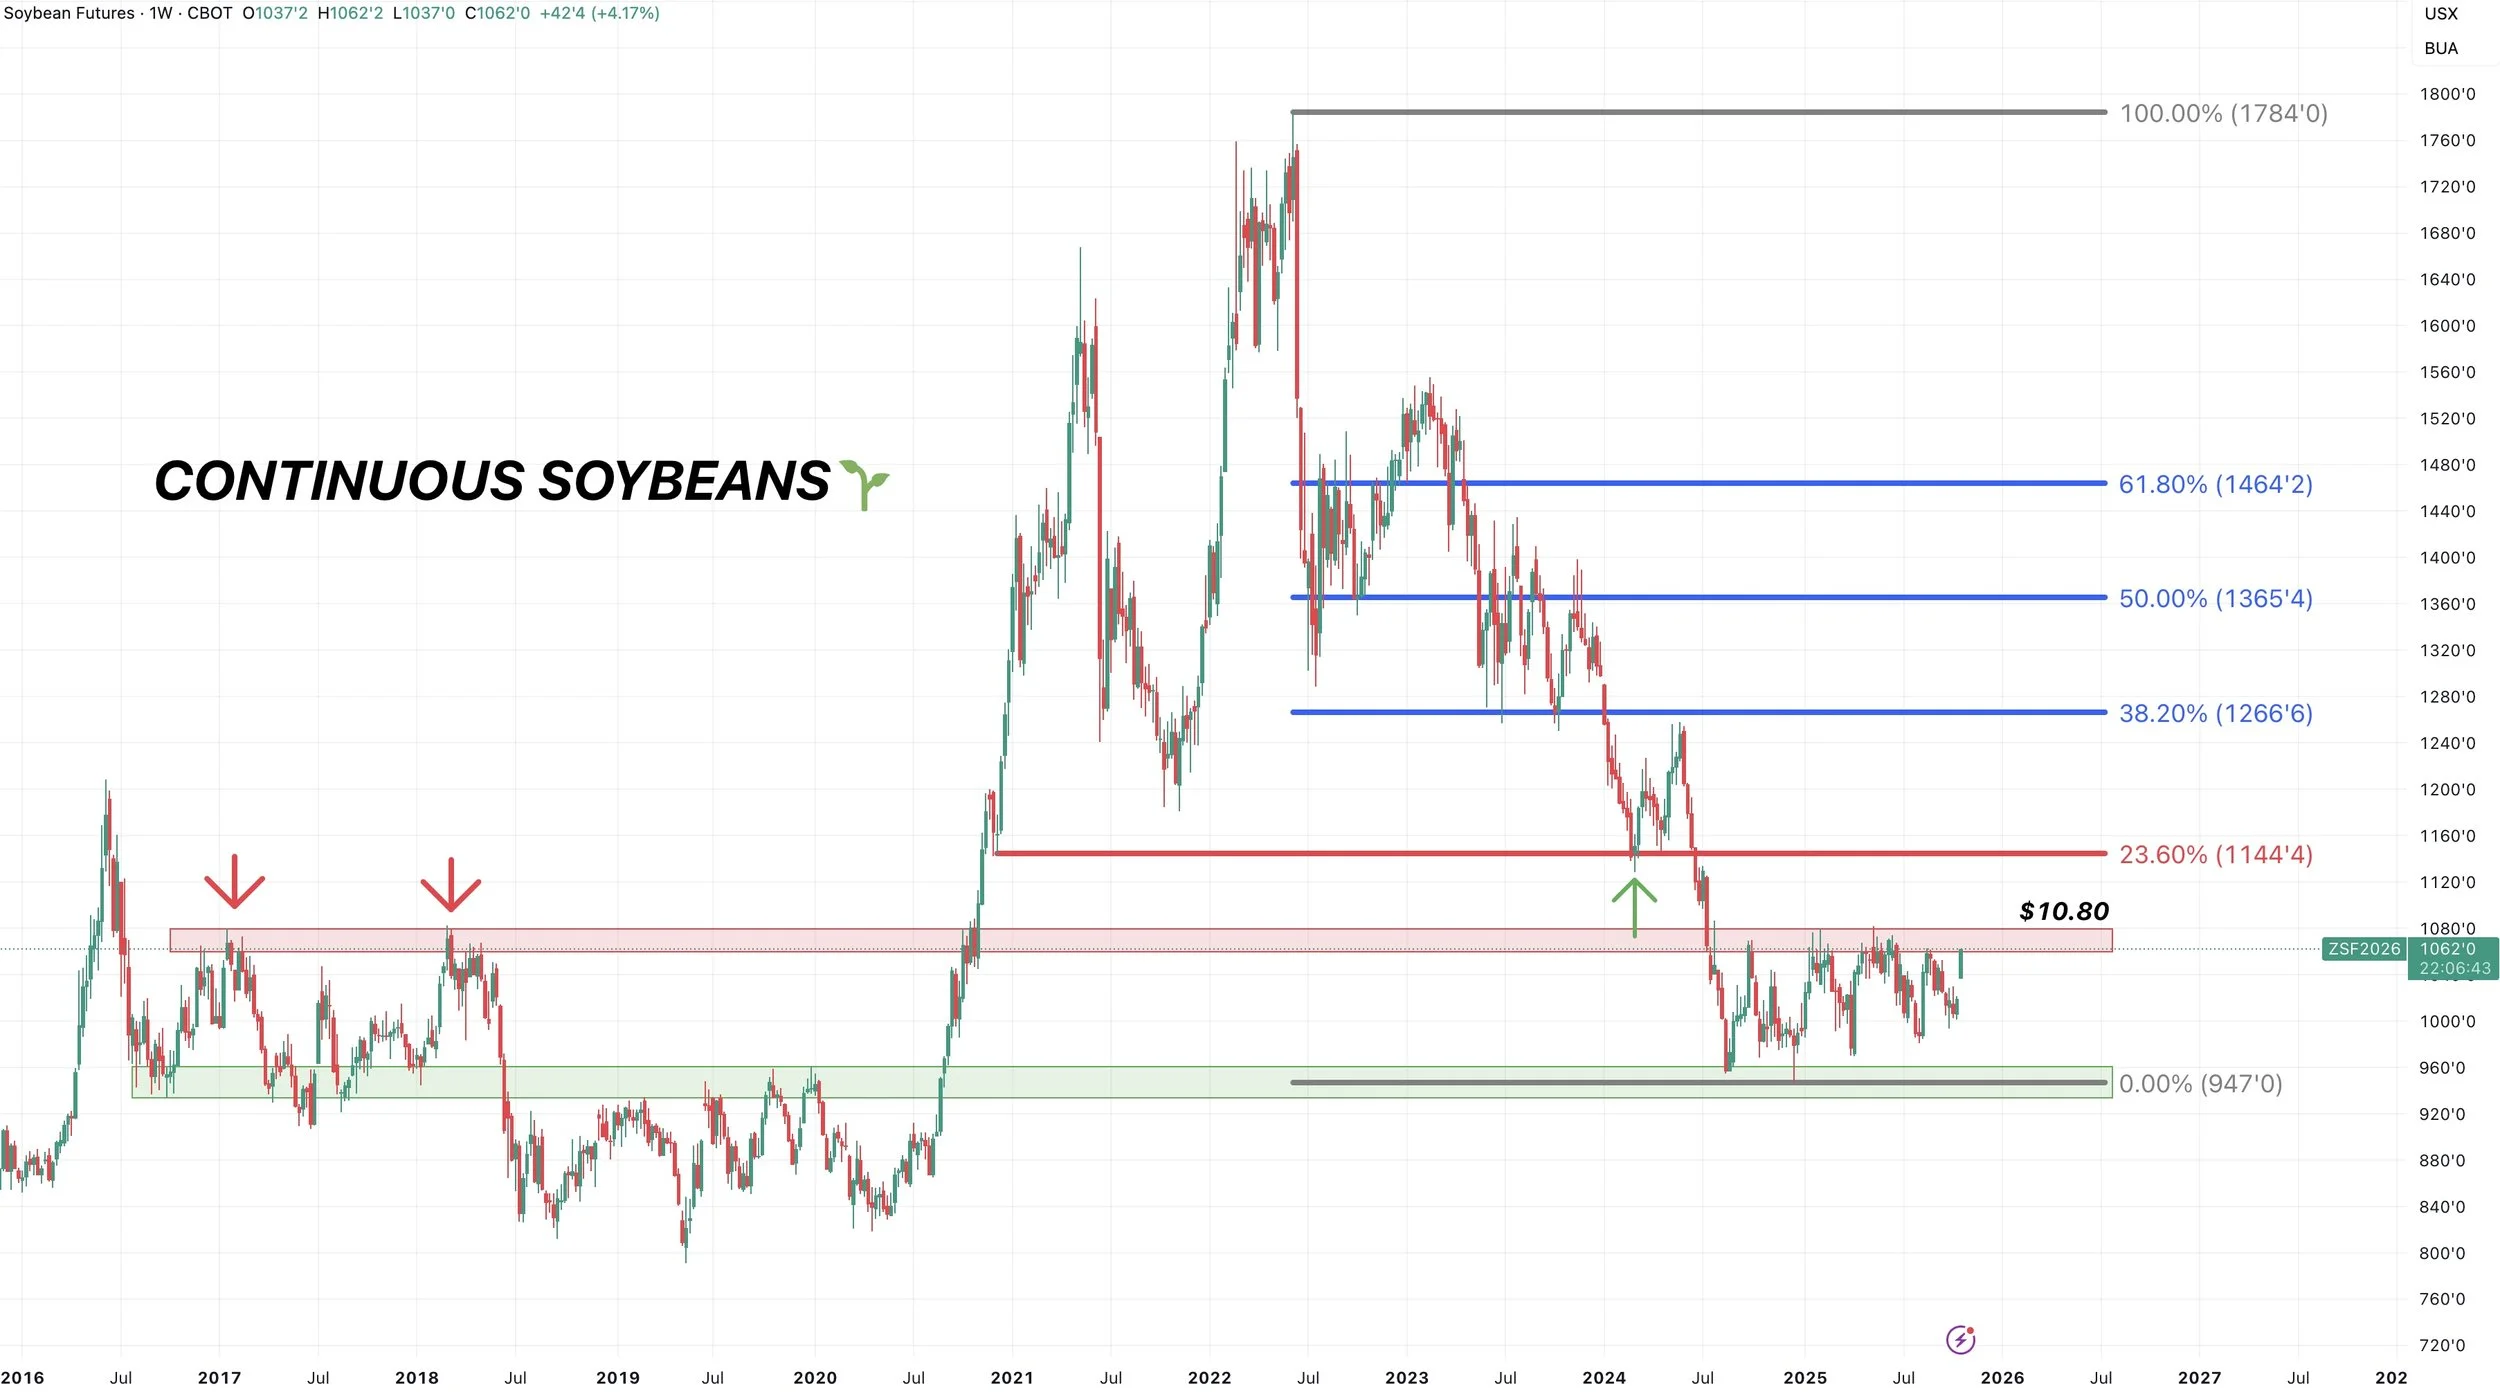
Here is an even bigger picture view.
You can see just how critical of level that $10.80 area is.
We've been trapped there a year. It was also key resistance back in 2017-2018.
This market has pretty much never traded between $10.80 and $11.40
Meaning there is a massive gap of air.
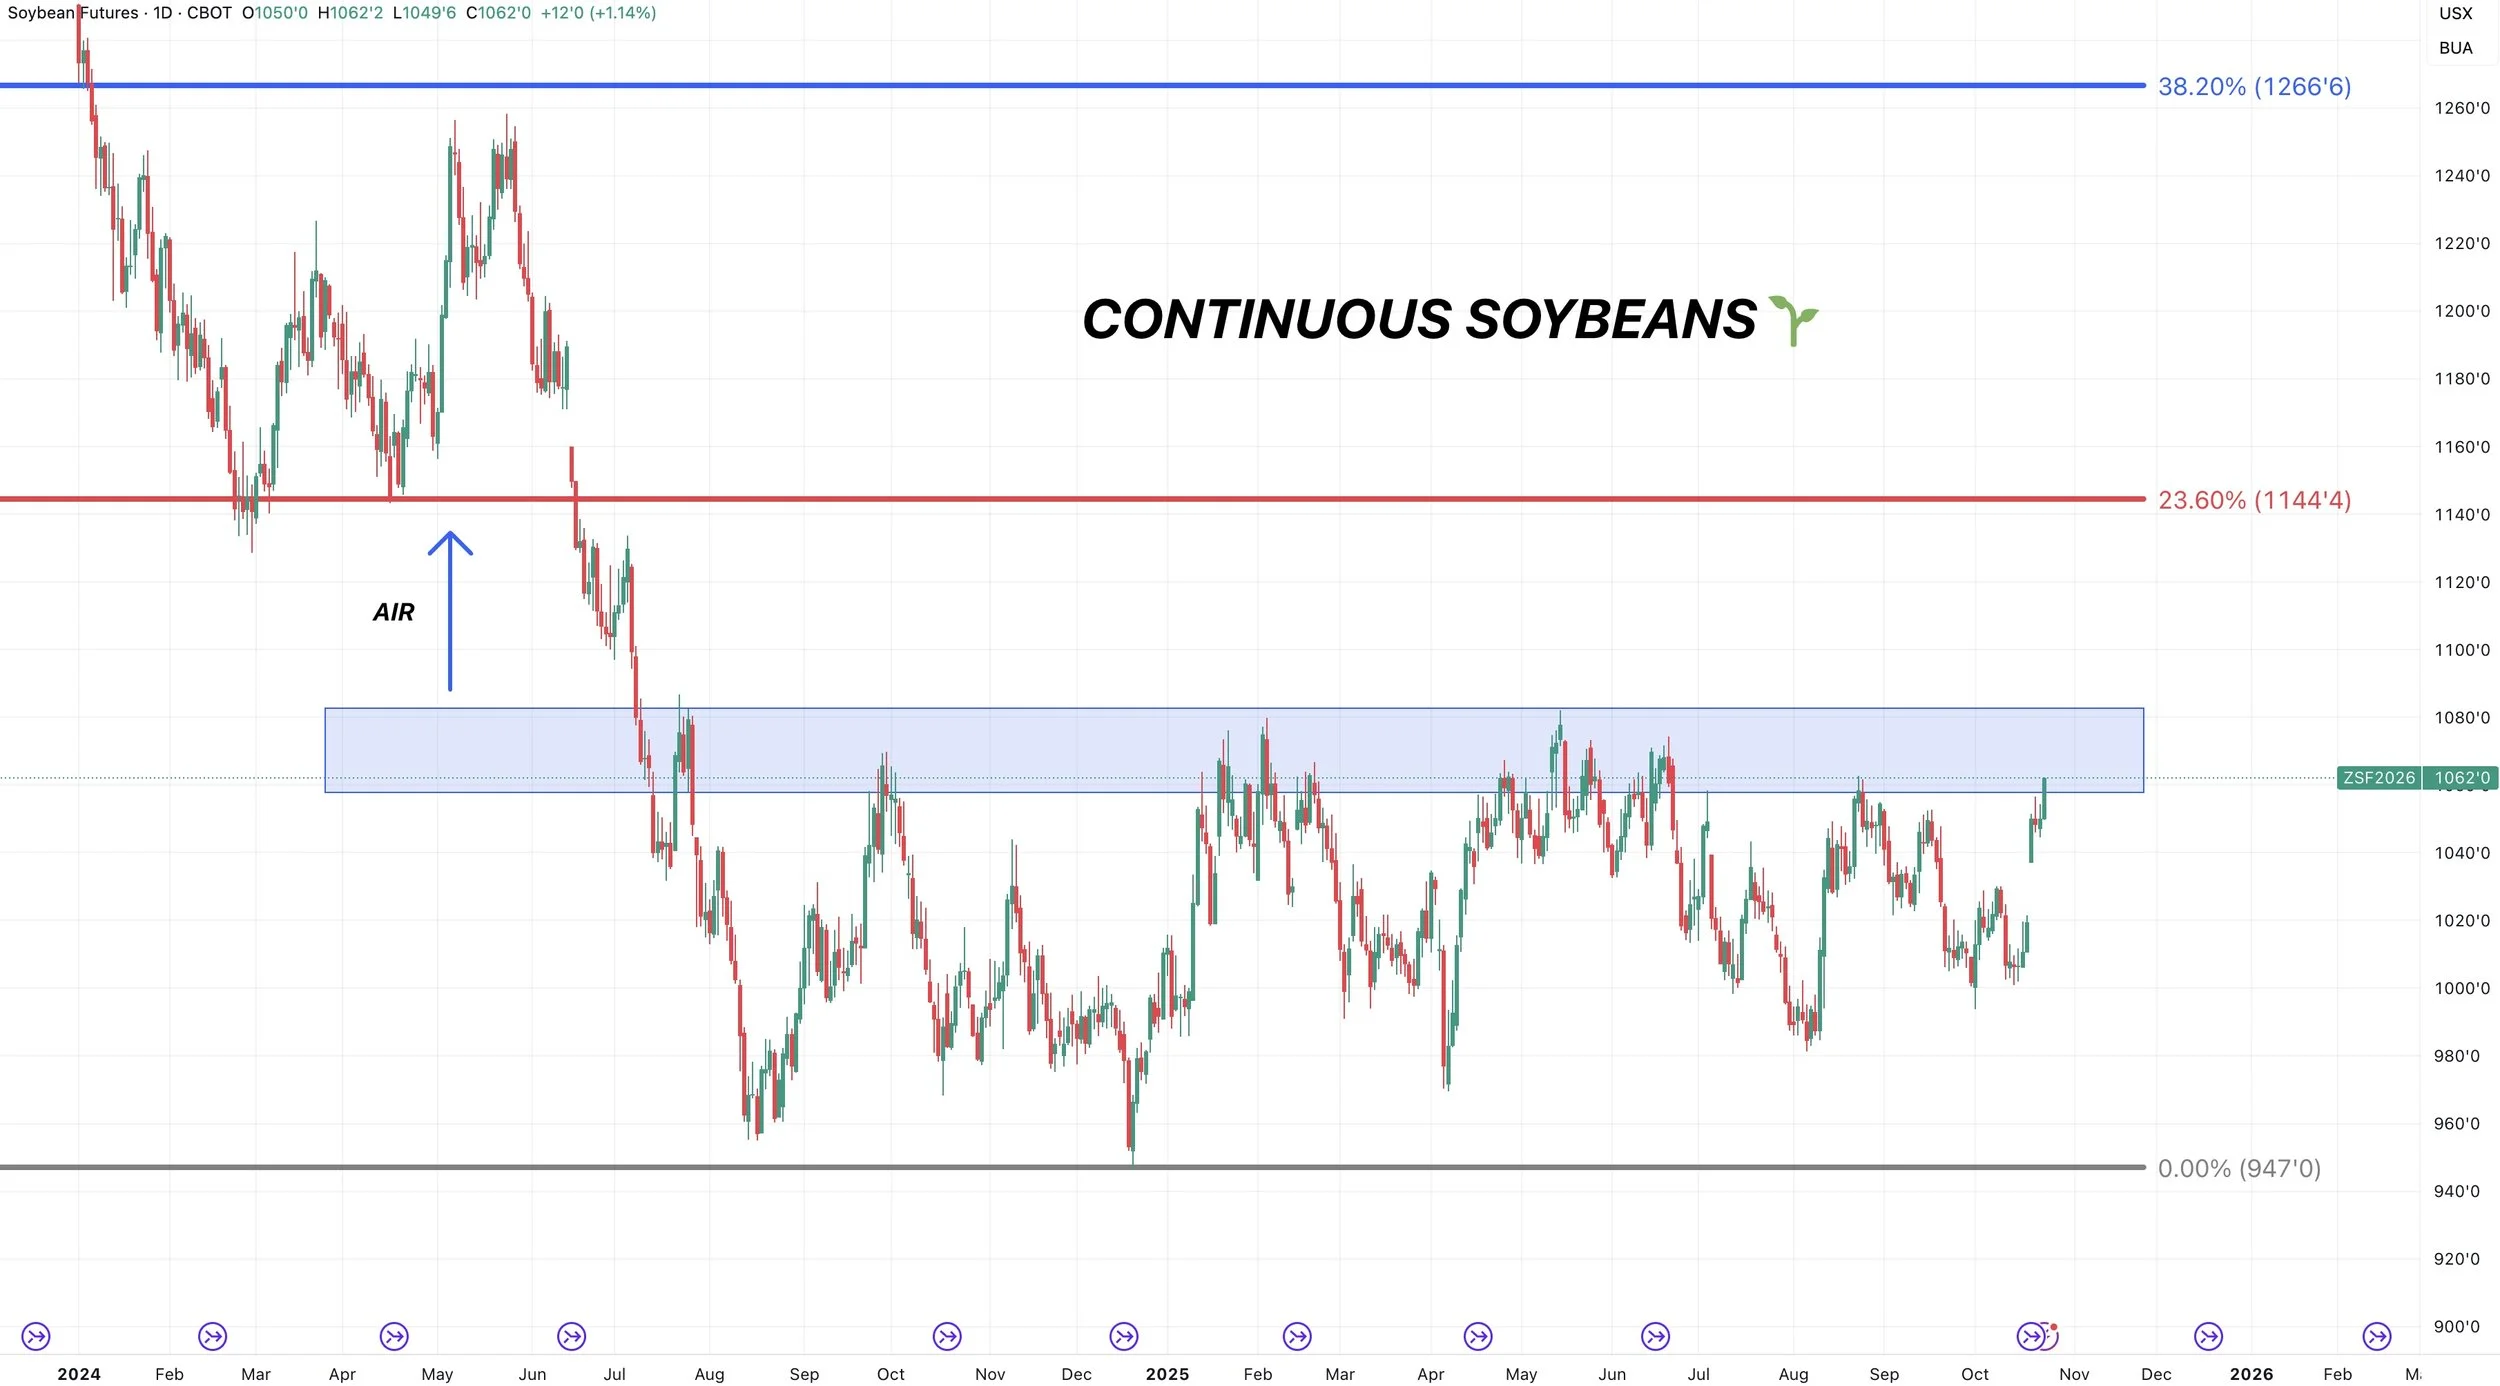
Lastly, here is a close up view.
This market has topped in this area 4 separate times over the past year.
It has been an absolute lid.
Which is why we will be looking to take risk off the table here soon.
But again.. if we ever clear $10.80 it opens the door so much higher to that $11.40 range.
Wheat
Fundamentals:
Like corn, wheat also found some strength due to that China headline about too much moisture.
China also grows a good amount of winter wheat, and their planting is wrapping up here soon. Too much rain are not great for that crop.
Outside of that, the wheat market still lacks a fundamental catalyst.
The charts on the other hand are providing some optimism here.
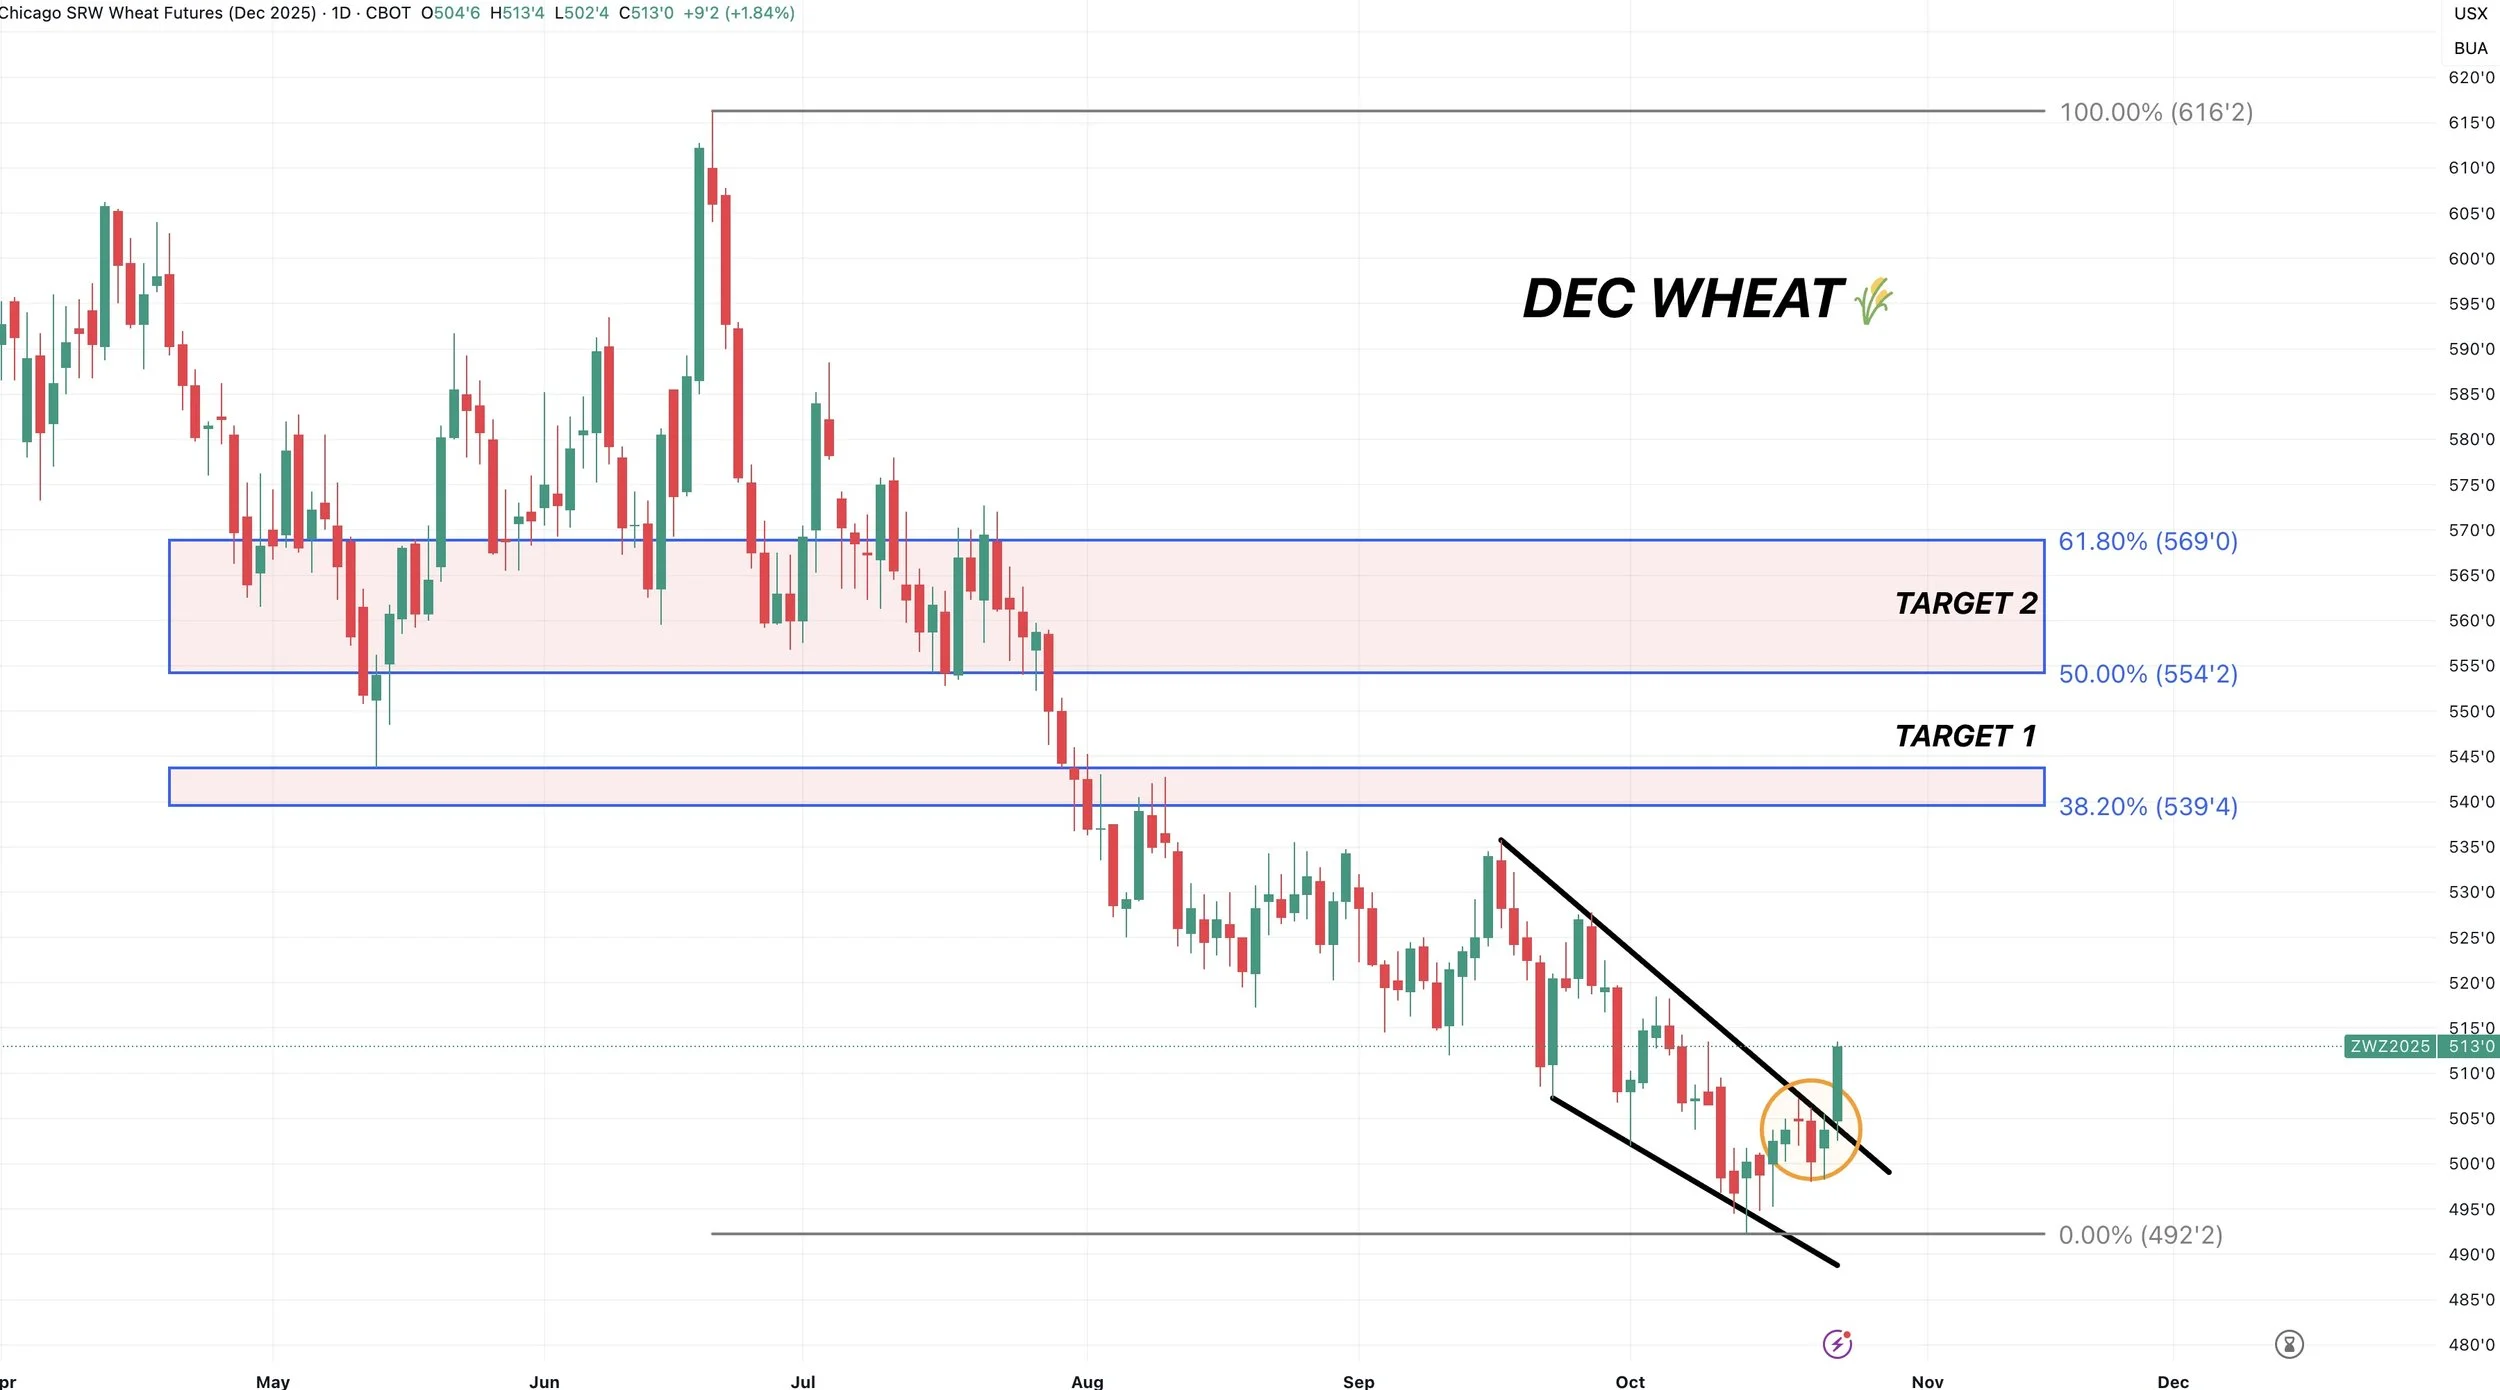
Dec Wheat Technicals:
Today was the best day for the wheat market in a month.
We now appear to breaking out of this brutal downtrend.
So the chart looks optimistically good here.
If this is truly the start of the turn around, I think we have at least another 25 to 40 cents of upside here.
Dec KC Wheat Technicals:
KC also looks like it is finally seeing a break out.
I see at least 30 cents of upside from here if this is actually the start of the move bulls have been waiting for.

Cattle
We already touched on the Trump news.
We've been very vocal about keeping protection up here at these levels and still like doing so.
Fundamentally nothing has changed in cattle.
But there are several things the government can do to add pressure to this market.
They could remove the Brazil tariffs.
They could re-open the Mexican border.
If your government is flat out telling you that they are trying to lower prices, you need to protect yourself at all-time highs after a historic run.
You do not want to caught with zero protection if this market starts to fade away. If this market tanks and you don’t already have protection, there isn’t much you can do. But you can do something right now.
I am not saying this bull run is over. It just makes sense to protect yourself when your President is telling you lower prices are coming.
Take eggs for example. They wanted lower prices. They got them.
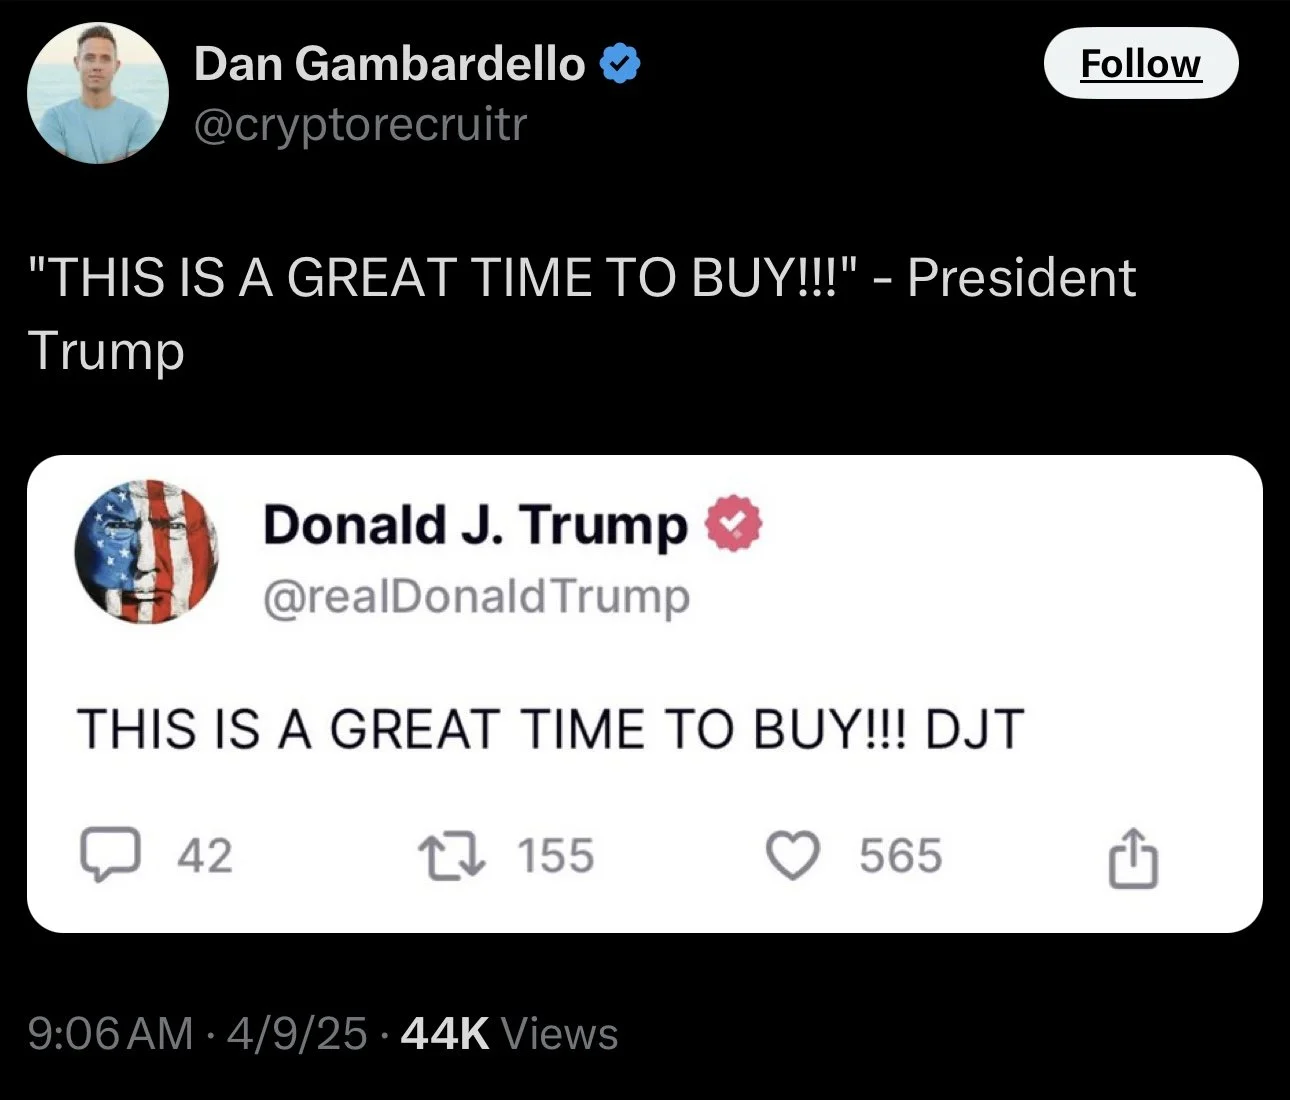
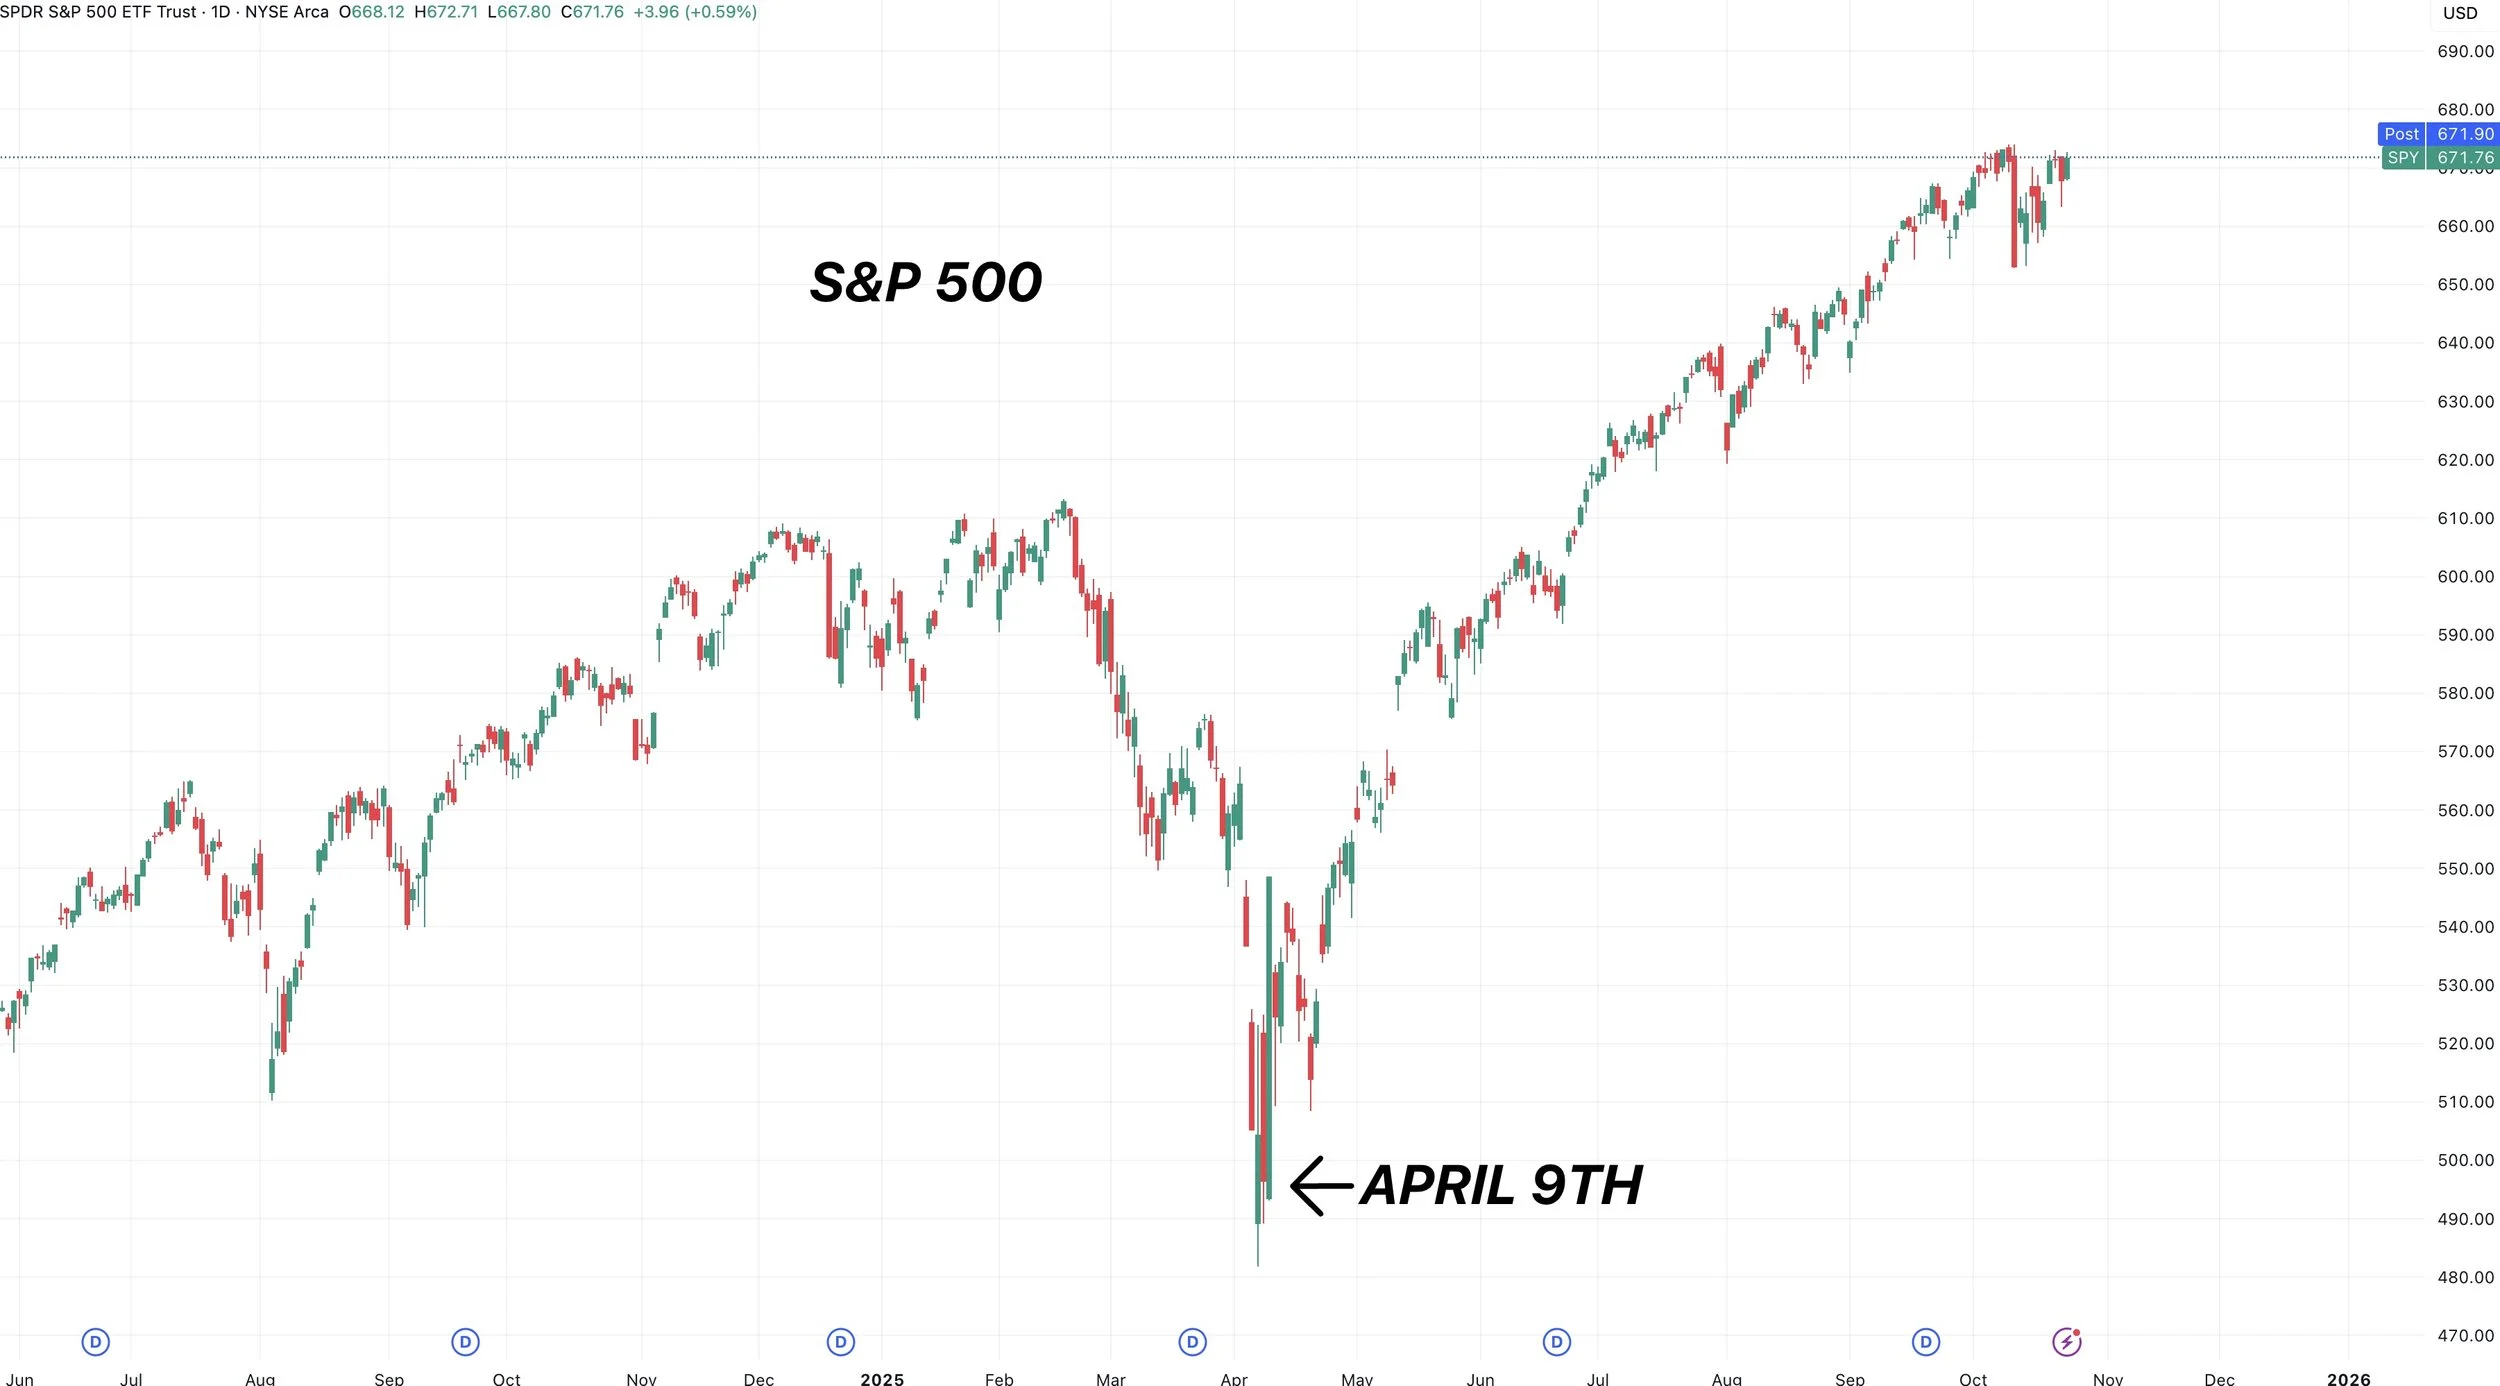
Trump told everyone to buy the stock market on April 9th.
He then paused tariffs, and stocks have exploded higher since he said that.
Whether it is right or wrong, the government can control markets. We can’t control if they are trying to lower beef prices.
The only thing you can control is your risk in this market.
Nov Feeder Chart:
Nov feeders are now in this golden zone box.
Which is 50-61.8% of the recent rally.
This is a pretty big must hold spot.
The 50-day MA also sits right in this box.
Which we are quickly approaching.
If that level gives it, you have to imagine it sparks a leg lower.
The 50-day has acted as a complete floor. If it breaks, I'm sure the algos are going to sell it further.
This is a big spot for bulls to hold.
If we are going to bounce, it needs to be here.

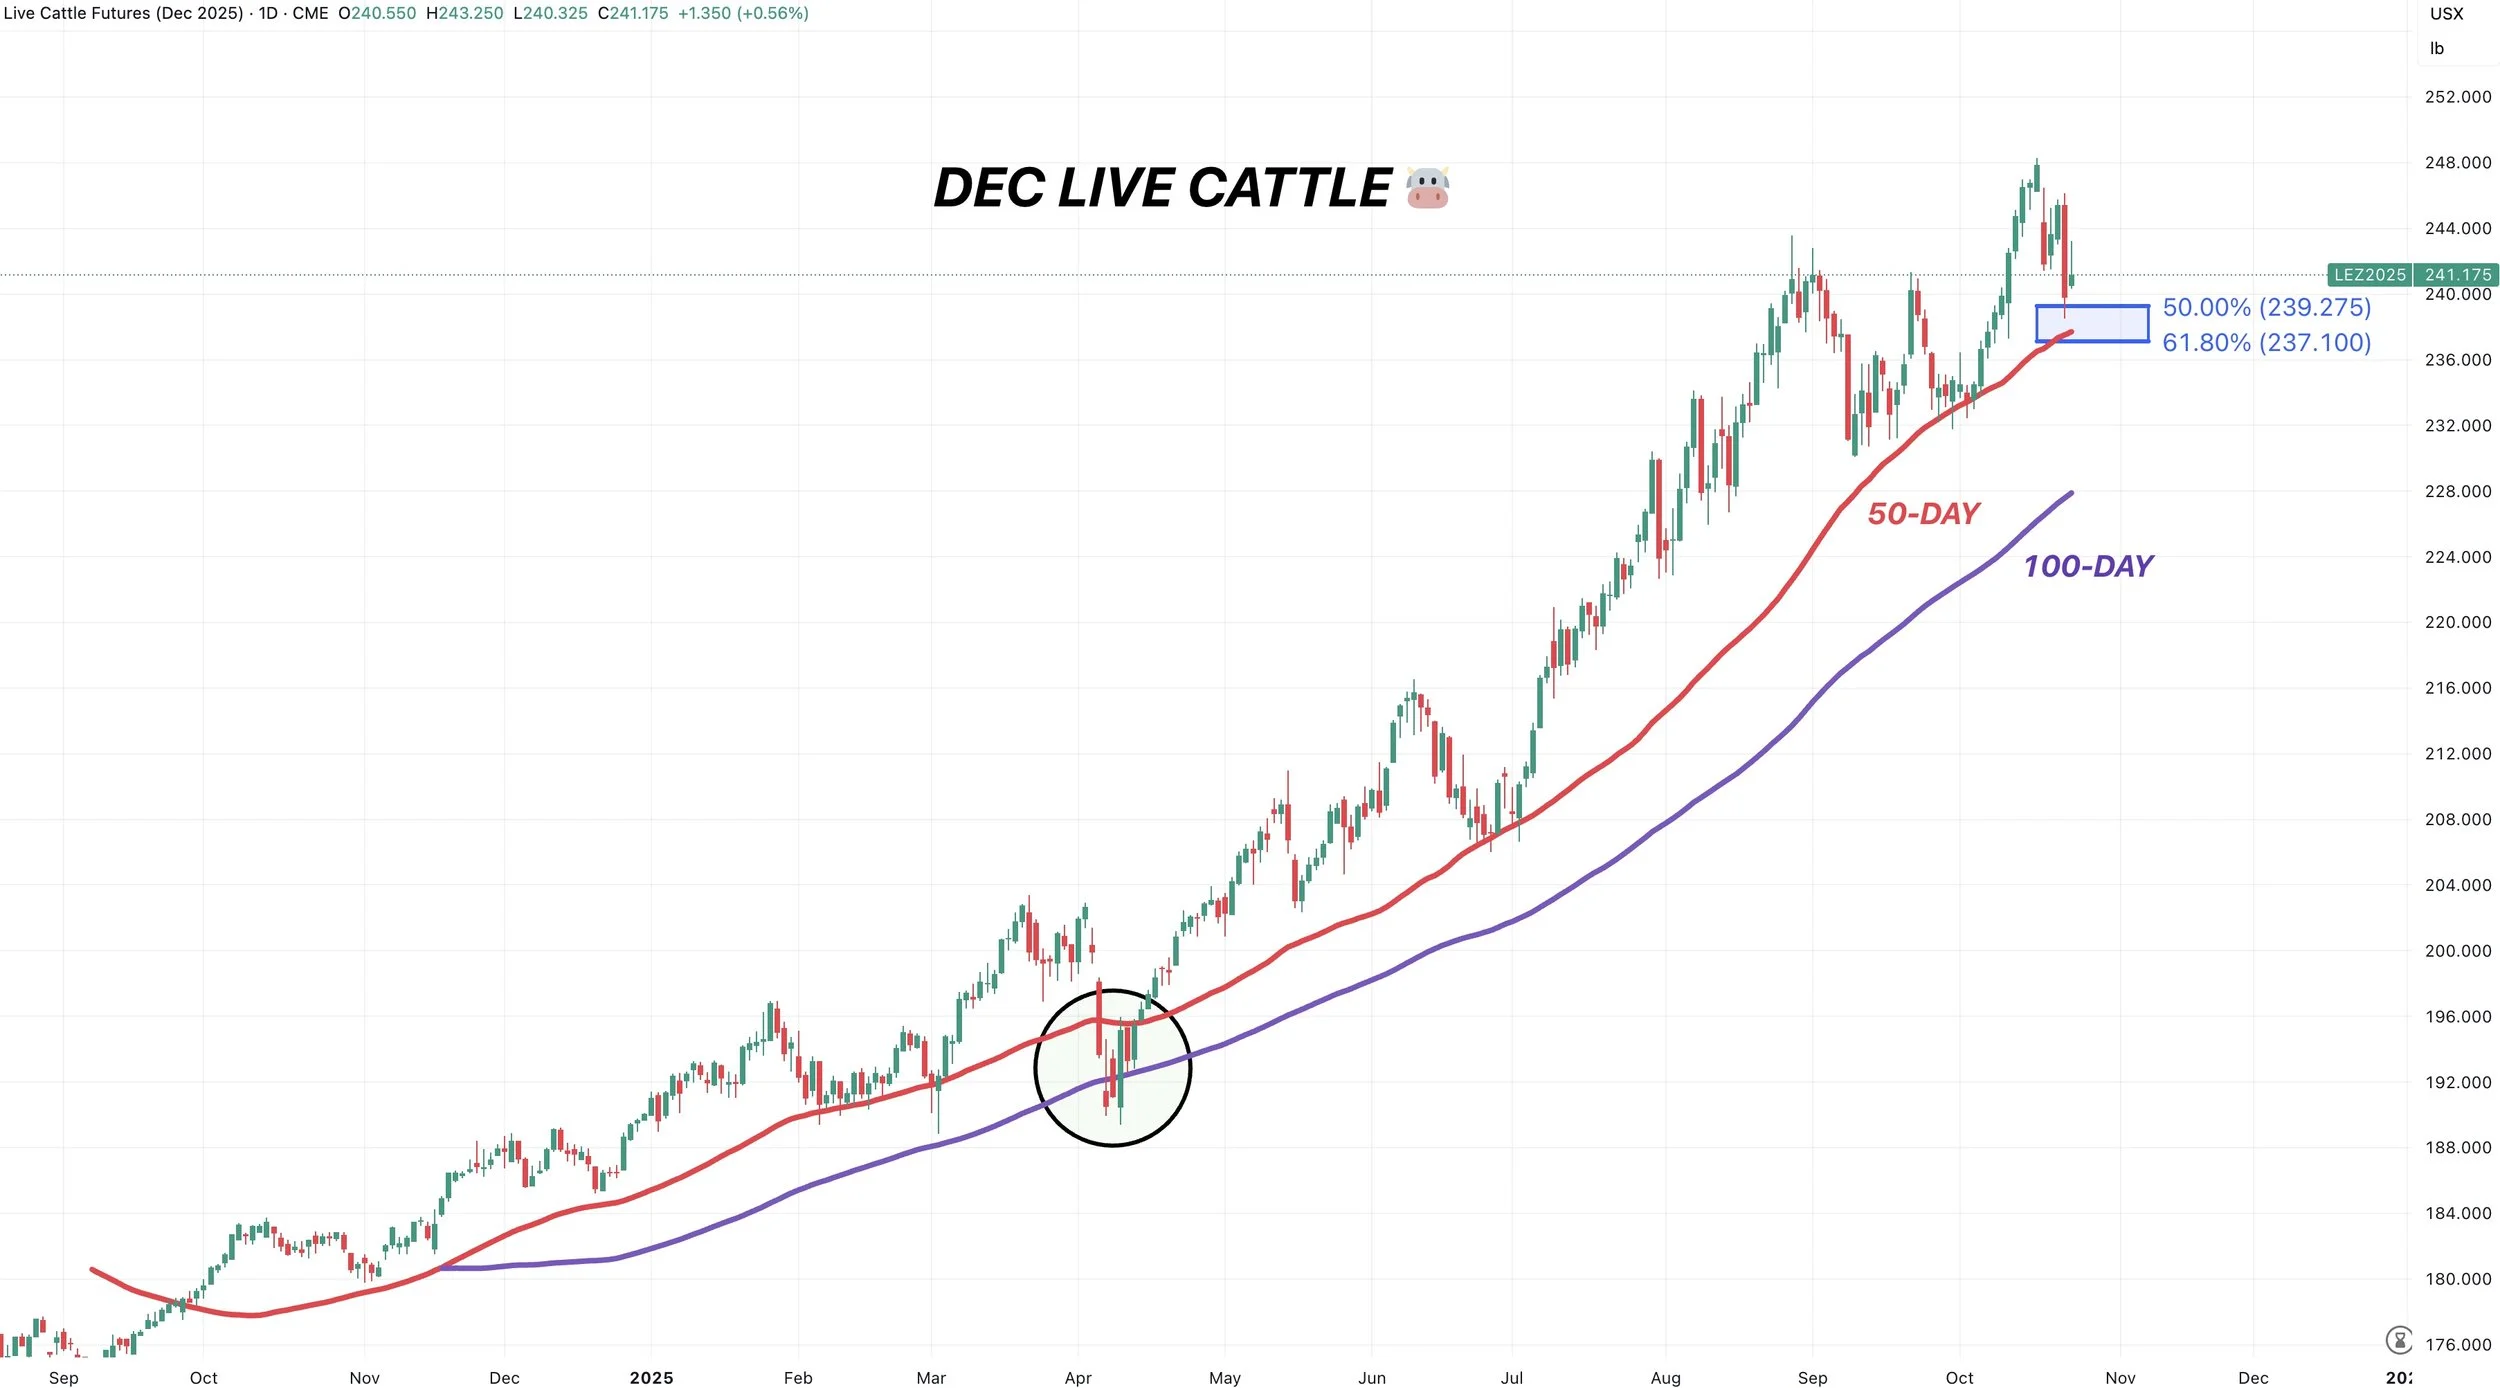
Dec Live Cattle:
Live cattle is holding up better on the sell off.
That is probably because feeders led the rally higher. So they have a larger move to correct.
Like feeders, live cattle is also approaching a must hold spot.
The golden zone and that 50-day MA.
Absolute must hold.

Here is how utterly massive of support the 50-day has been.
It's marked pretty much every bottom.
The one time we broke below was April. It then sparked a sell off down to the 100-day MA.
So if the 50-day fails to hold, one could argue we fall down to the 100-day.
I am not saying cattle is going to fall apart. I am simply stating how crucial of a level we are approaching.
If this market is going to bounce, it has to be soon, or we could very well be in for some larger downside.
Past Sell or Protection Signals
Oct 13th: 🐮
Cattle sell signal & hedge alert.
Aug 22nd: 🌱
Soybean sell signal & hedge alert.
July 31st: 🐮
Cattle sell signal & hedge alert.
July 10th: 🐮
Cattle sell signal & hedge alert.
CLICK HERE TO VIEW
June 5th: 🐮
Cattle sell signal & hedge alert.
June 2nd: 🌾
MPLS wheat sell signal.
April 10th: 🌽
Old crop corn sell signal.
March 19th: 🐮
Cattle hedge & sell signal.
Feb 18th: 🌽 🌾
Old crop KC wheat & old crop corn signal.
Jan 23rd: 🌽 🌱
Corn & beans old crop sell signal.
CLICK HERE TO VIEW
Jan 15th: 🌽 🌱
Corn & beans hedge alert/sell signal.
Jan 2nd: 🐮
Cattle hedge alert at new all-time highs & target.
Dec 11th: 🌽
Corn sell signal at $4.51 200-day MA
CLICK HERE TO VIEW
Oct 2nd: 🌾
Wheat sell signal at $6.12 target
Sep 30th: 🌽
Corn protection signal at $4.23-26
Sep 27th: 🌱
Soybean sell & protection signal at $10.65
Sep 13th: 🌾
Wheat sell signal at $5.98
May 22nd: 🌾
Wheat sell signal when wheat traded +$7.00
Want to Talk?
Our phones are open 24/7 for you guys if you ever need anything or want to discuss your operation.
Hedge Account
Interested in a hedge account? Use the link below to set up an account or shoot Jeremey a call at (605)295-3100.