
CHINA DISAPPOINTS. NOW WHAT?
MARKET UPDATE
You can scroll to read the usual update as well. As the written version is the exact same as the video.
Timestamps for video:
Overview & China: 0:00min
Corn: 2:30min
Beans: 8:25min
Wheat: 12:20min
Cattle: 16:30min
Want to talk?
Office: (806)484-1214
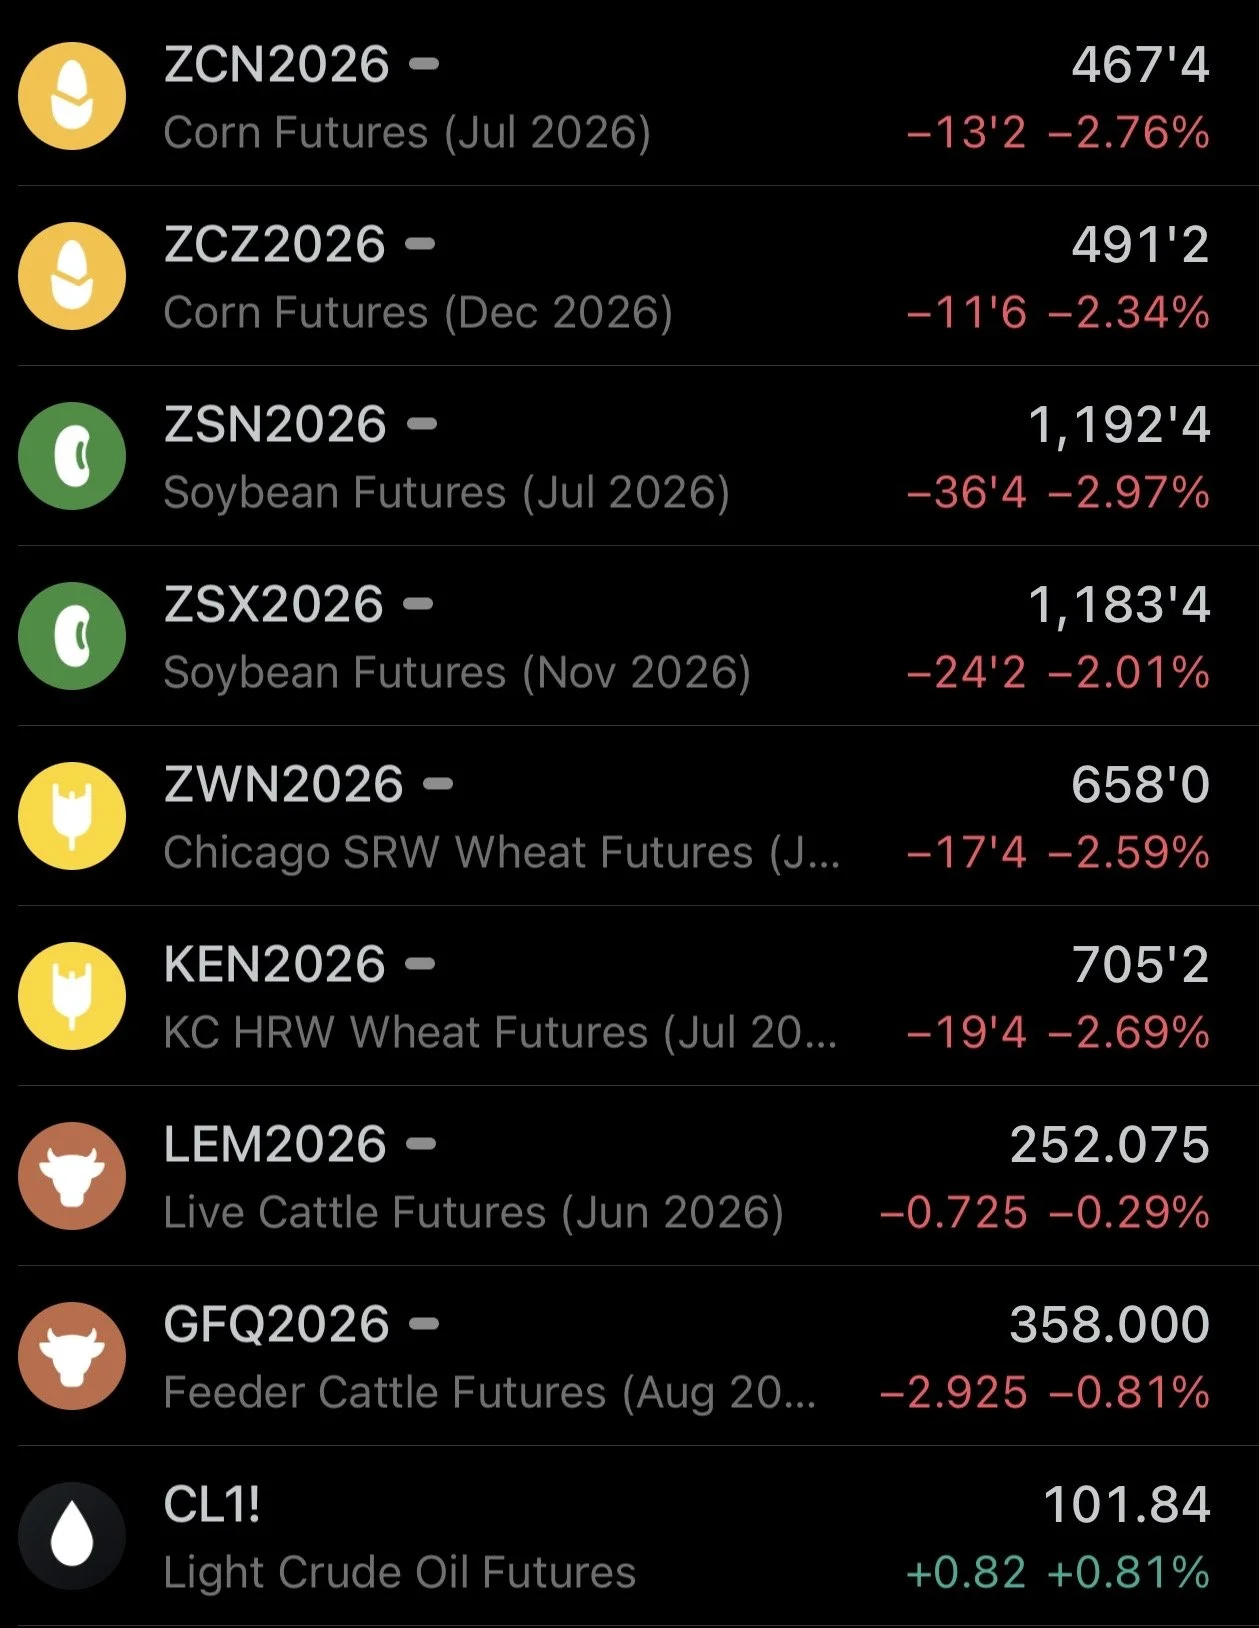
Futures Prices Close
Overview
Absolute blood bath in the grains, with everything down double digits.
Today's weakness was of course all about the China meeting, as a result soybeans led the way lower which was a fear I had and partial reason behind that sell signal in beans on Tuesday.
Click Here for Tuesday's Bean Signal
Clearly, the meeting didn’t provide what the market wanted.
So what exactly happened in this meeting?
There were several headlines from the meeting. It was reported that ags were discussed, but lacked details.
There was only one singular headline that pertained to the grains.
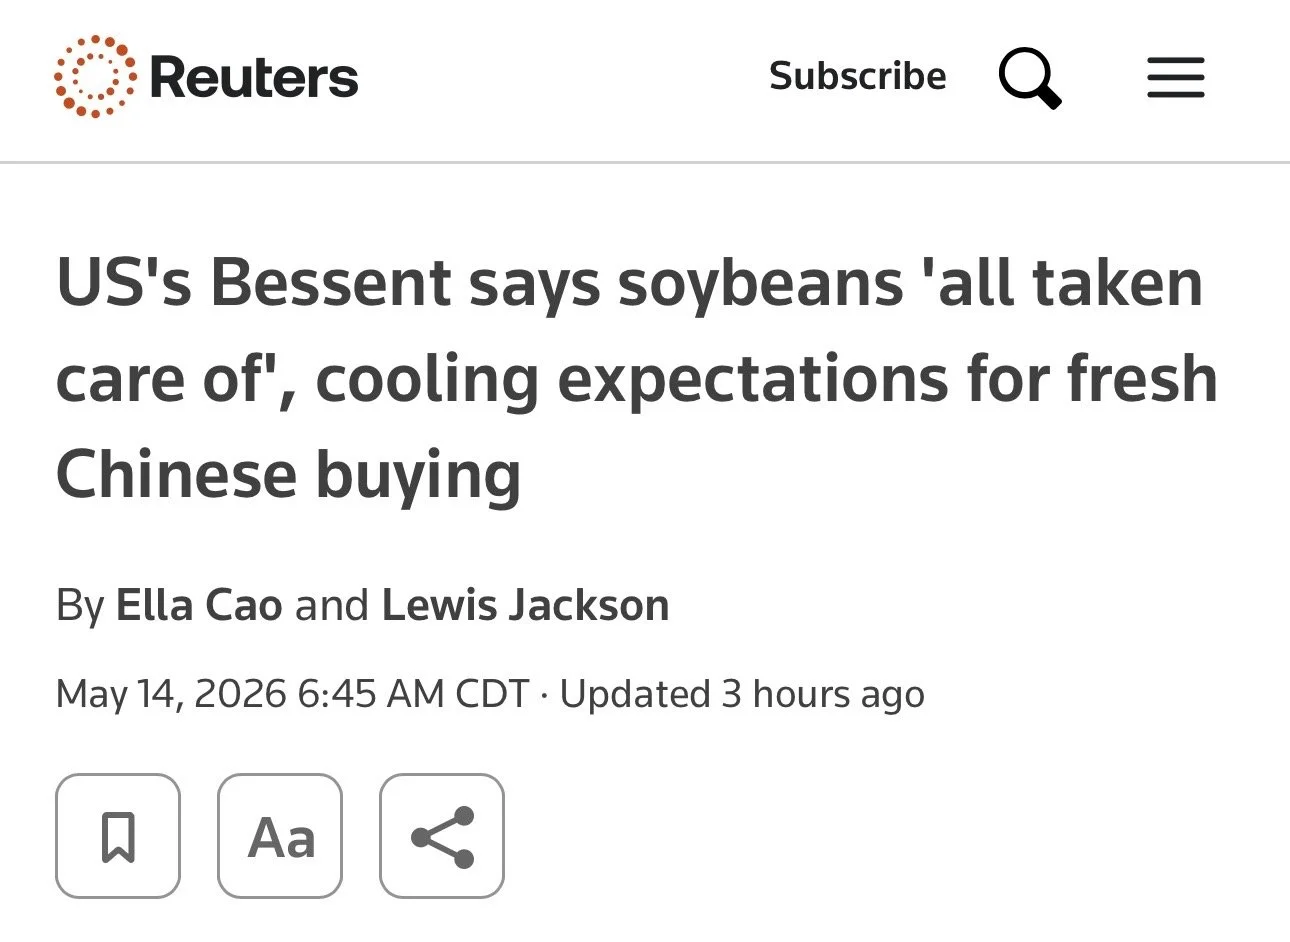
Bessent simply said:
"Soybeans are all taken care of."
That's it. No further details. No trade agreements or anything. Nothing about corn or any other ags.
As a result, the market tanked after running higher going into the meeting.
About as classic of a buy the rumor sell the fact event as you can get.
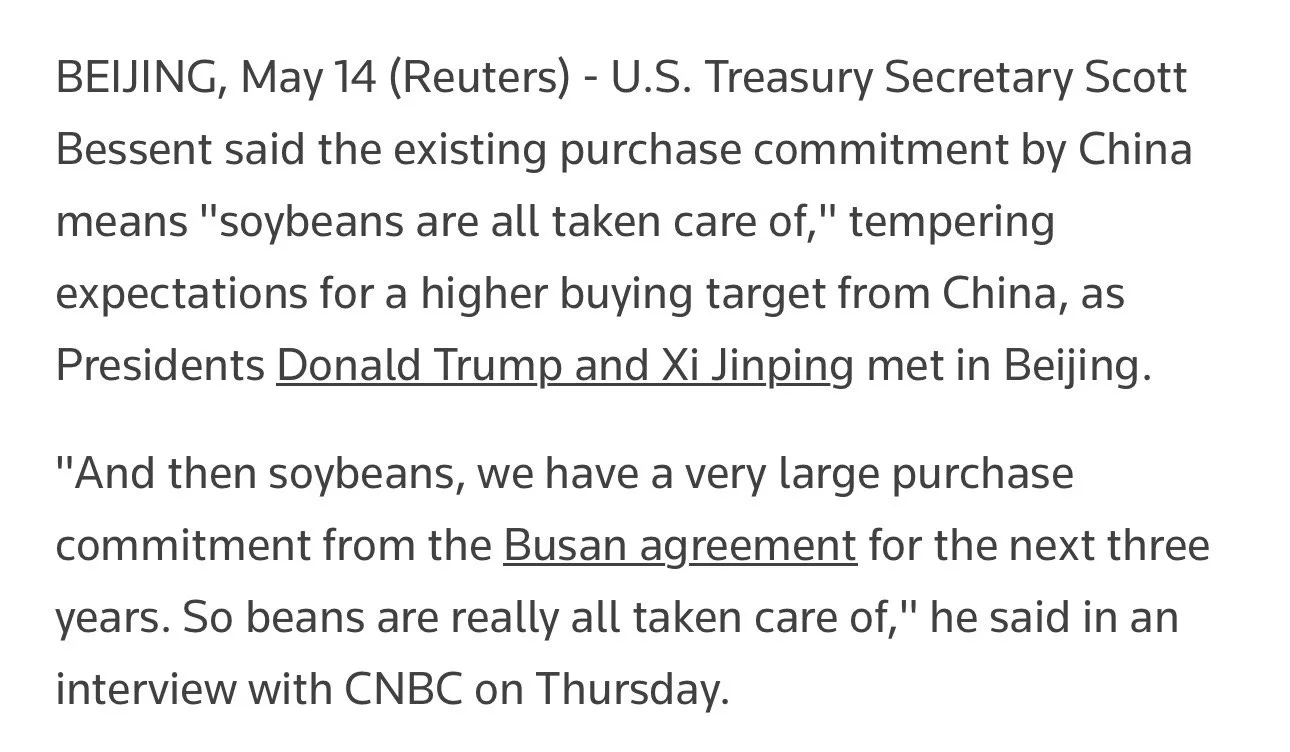
He said that:
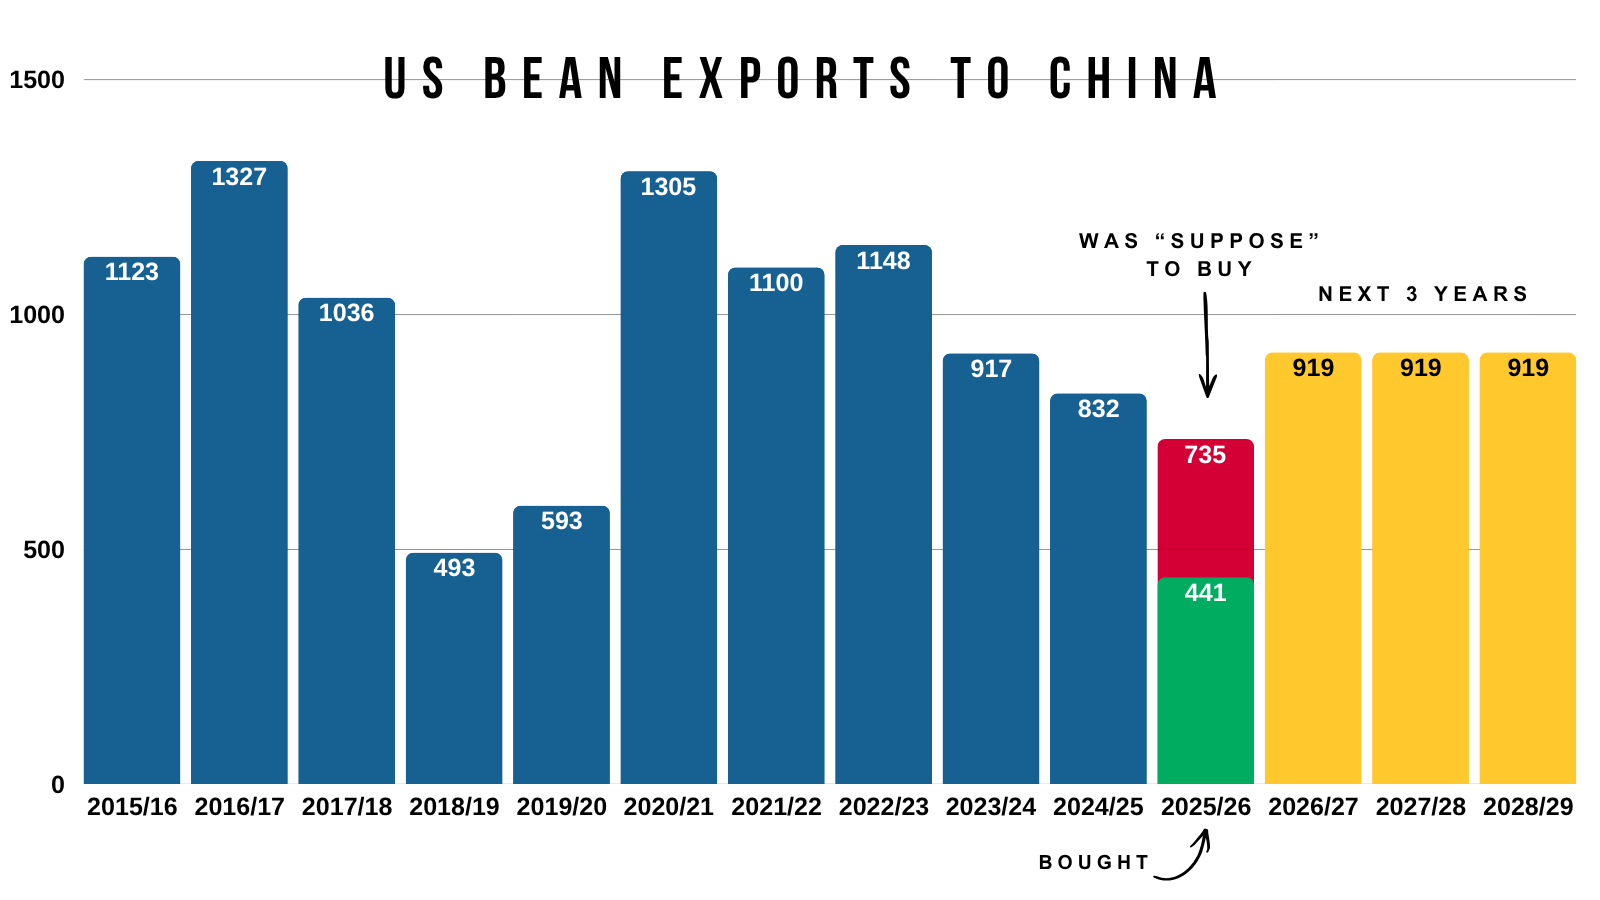
"and then soybeans, we have a very large purchase commitment from the Busan agreeement for the next 3 years. So beans are really all taken care of."
So basically he just said what we've already known for months.
That agreement where China buys 25 MMT of soybeans every year over the course of the next 3 years is still in place.
But there was nothing about any additional purchases beyond that, and nothing about that extra 8 MMT of old crop they were supposedly going to buy a while ago.
If you remember, back last fall China agreed to buy 12 MMT of old crop beans. Which they did end up fulfilling.
However, Trump then said they agreed to up it to 20 MMT, for an extra 8 MMT. But that never ended up coming to fruition and doesn’t appear like it will.
Trump has now agreed to meet with China again in the US in September. Which is a ways away.
There is always the possibility that we get some agreement later and China agrees to buy more ag products.
Or maybe China did agree, and it just hasn't been announced.
Either one of these wouldn’t surprise me at all, but again, it's impossible to know.
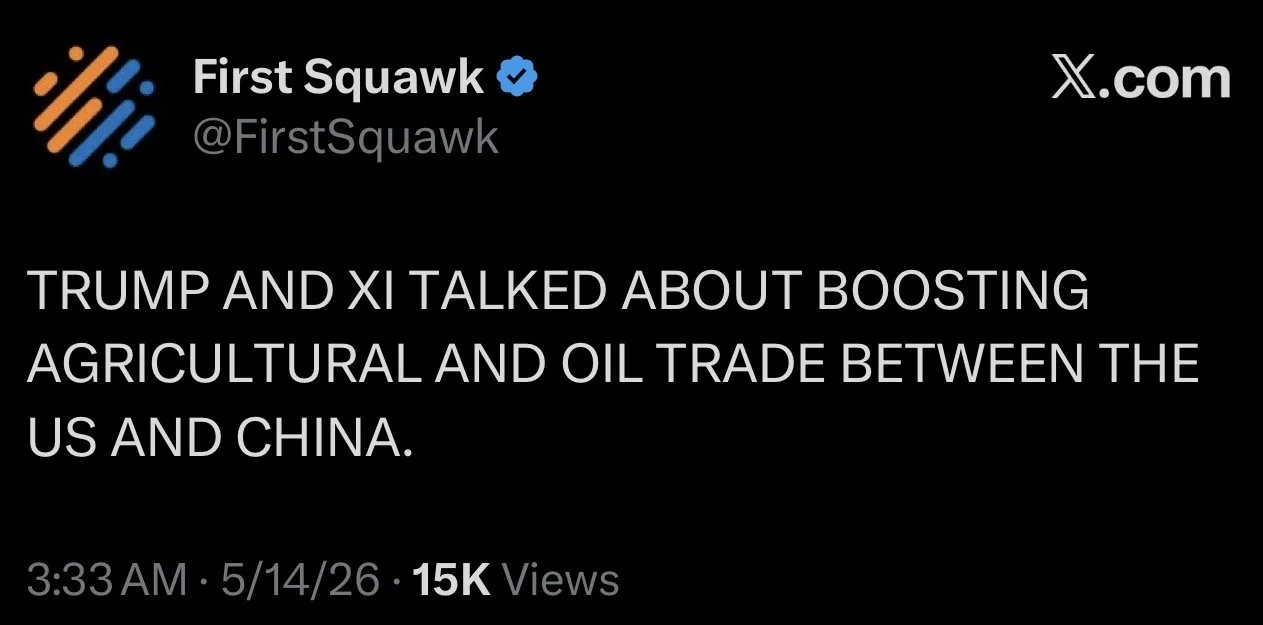
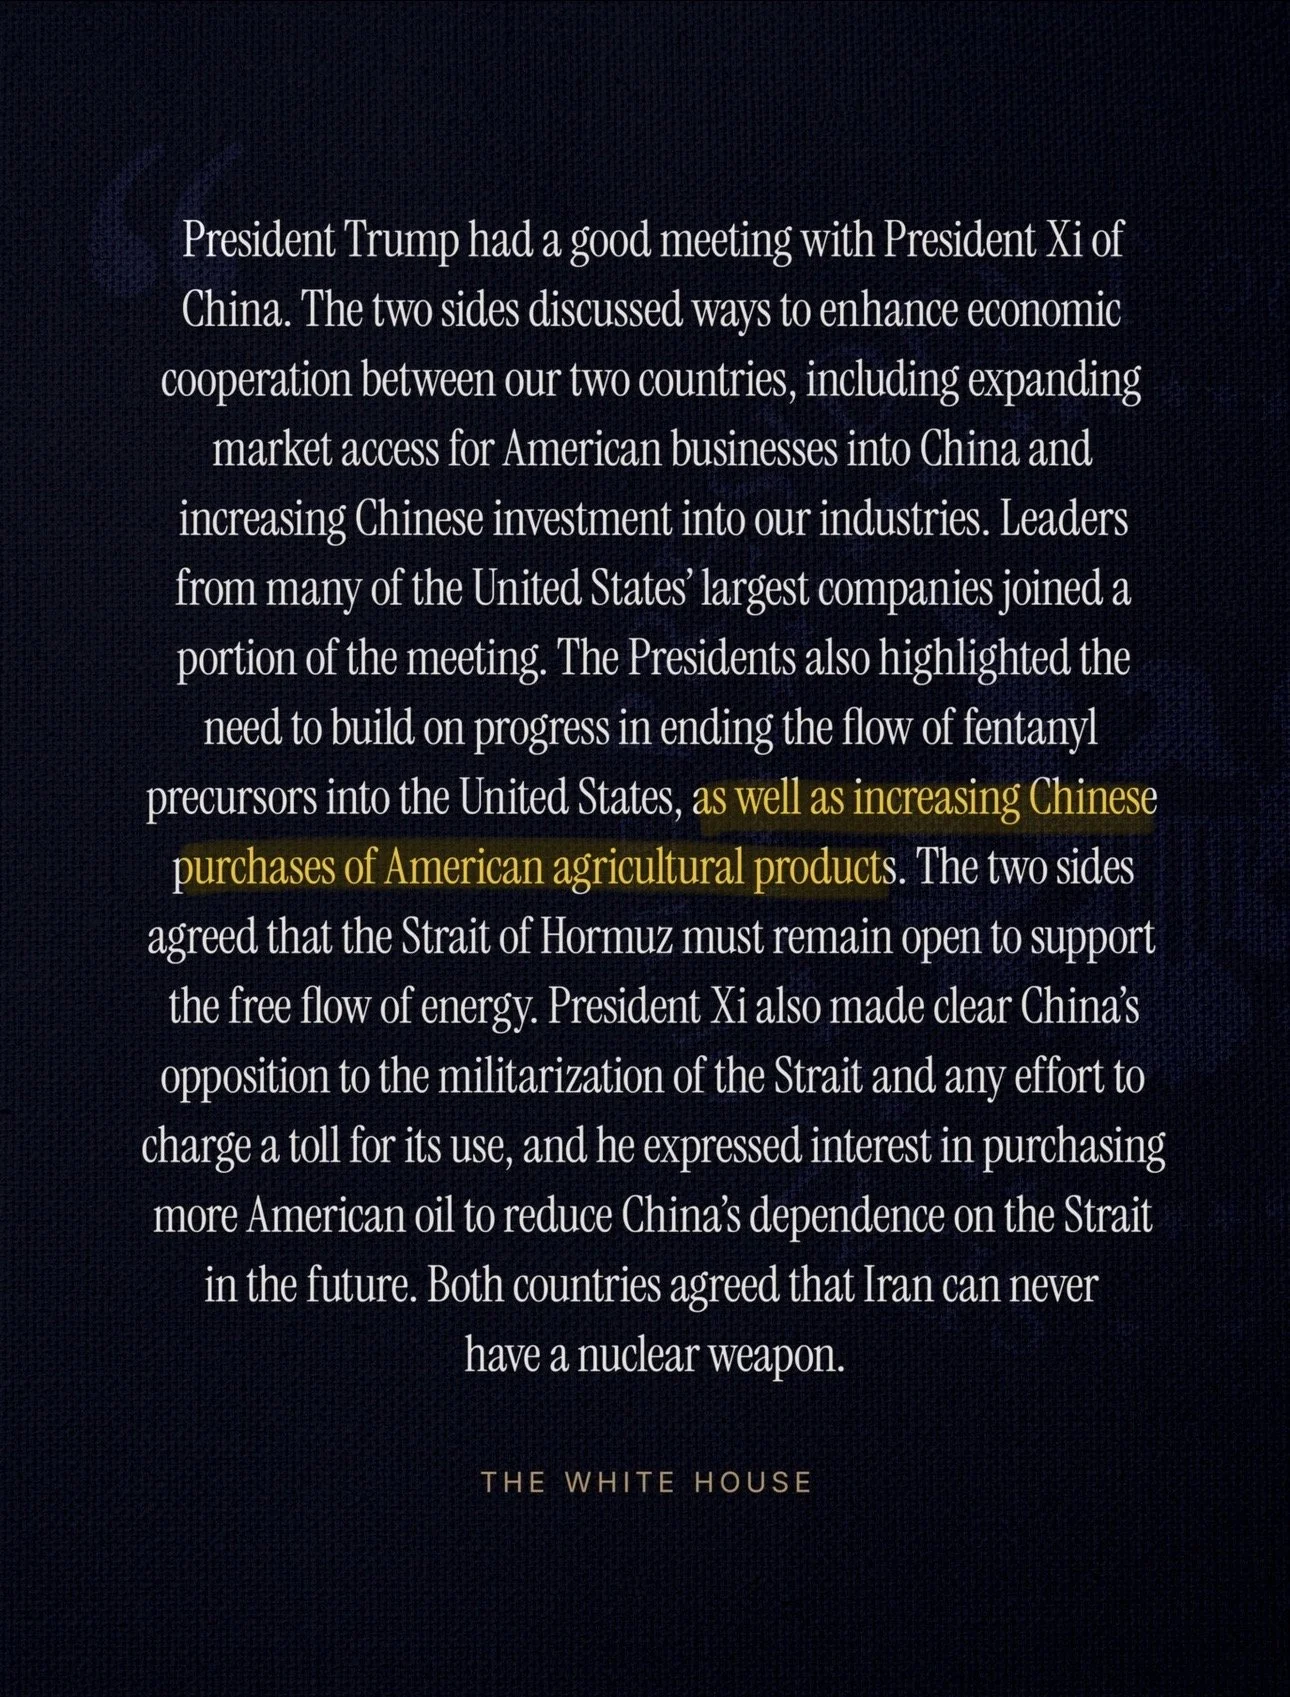
The White House's post sharing how the meeting went, did specifically included that Trump and China talked about:
"Increasing Chinese purchases of American ag products".
So I'd say it's too early to claim that China can’t and won’t be buying any more ag products.
Maybe.. China is breaking the market to buy it?
But for now, they did not agree to buy anything more than the market has already known for the last several months.
So the meeting was a disappointment on the ags side, as a result we sold off today.
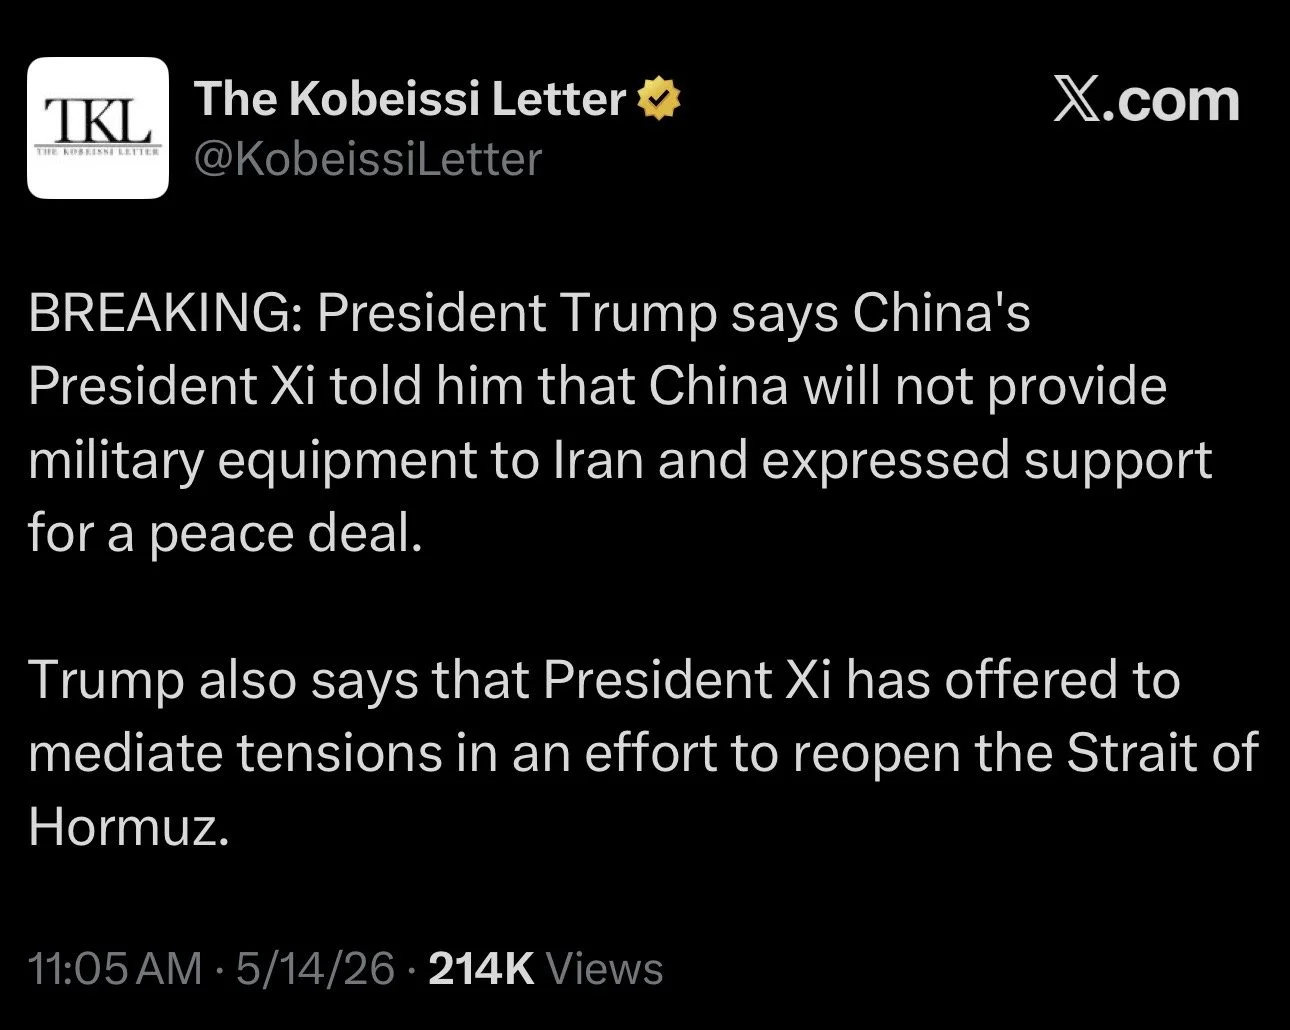
Trump did say that China's President offered to help make a deal with Iran.
As it's clear China wants the war to be over.
Today's Main Takeaways
Corn
Not great action in corn as we wiped out the last 4 days of gains.
Despite there really being no "corn deal" priced into this China meeting like there was for soybeans. As it feels like it was simply a risk off attitude across the grains complex.
The USDA report this week confirmed that the old crop story isn’t bullish.
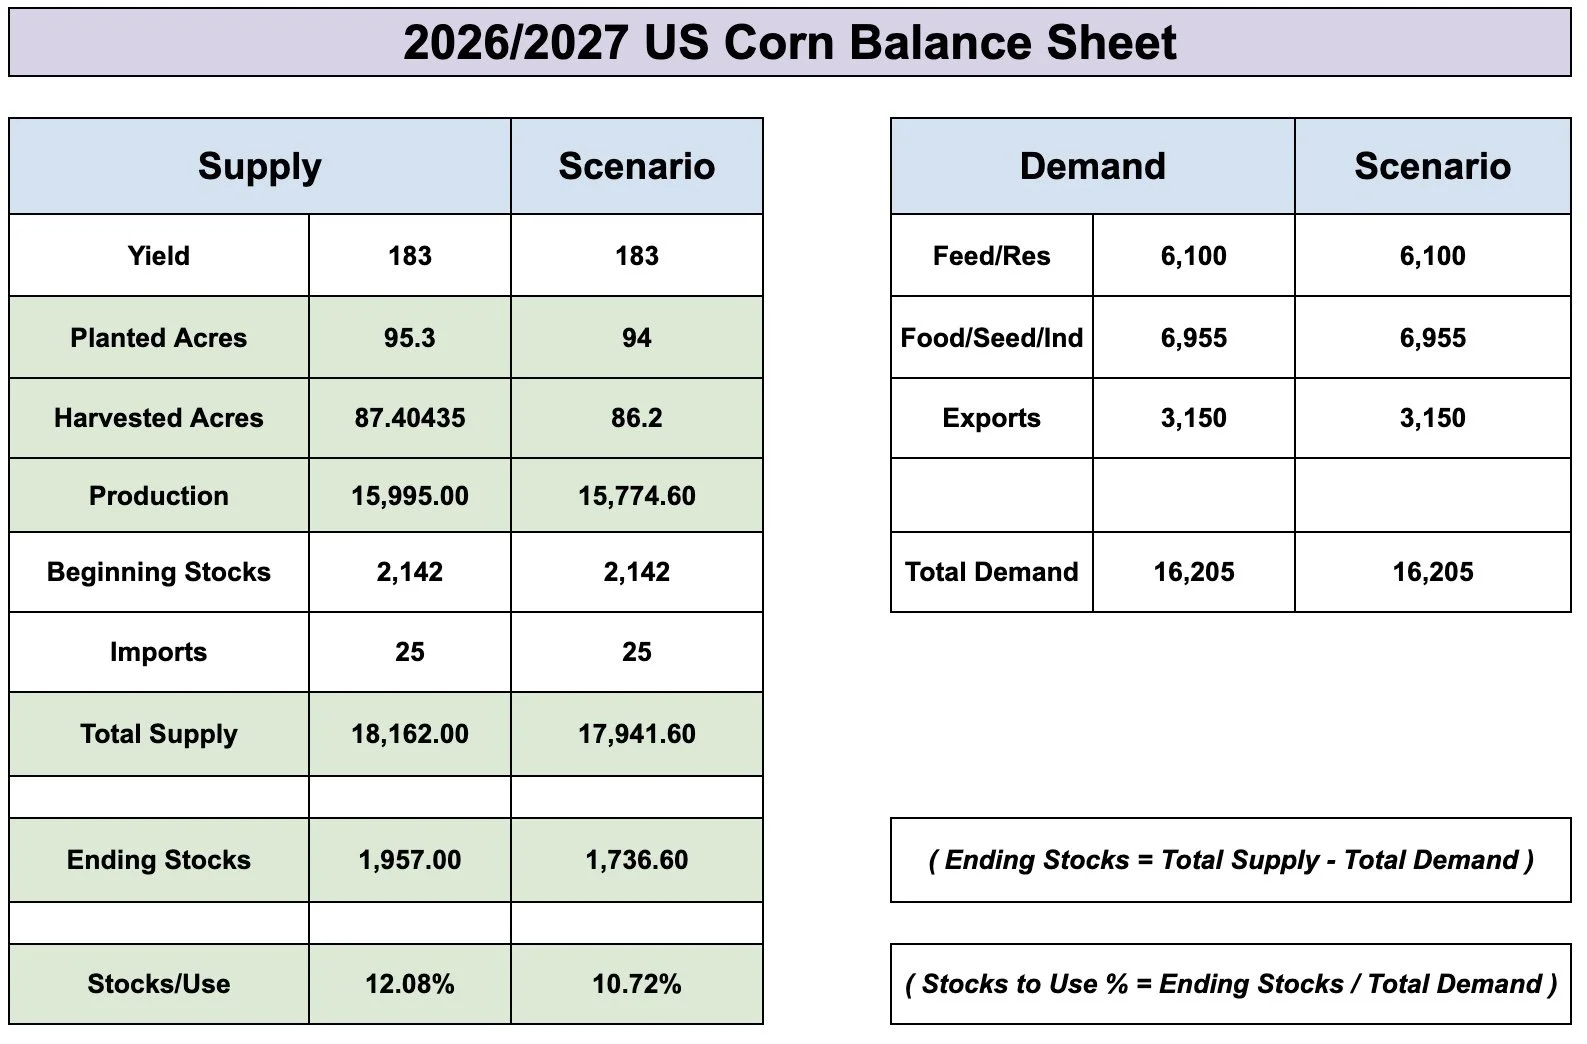
It also said we have an ample amount of supply here in the US for new crop for now. With a near 2 billion bushel carryout.
But that number also uses a 183 yield and 95.3 million acres. Both of which could change down the road.
As even just a 1 million drop in acres alone, makes that carryout a lot tighter than is currently expected. Even with a 183 yield.
So the story in new crop isn’t dead. Especially if you take a long term approach on this market, heading into next year and how the entire fertilizer situation is going to impact us.
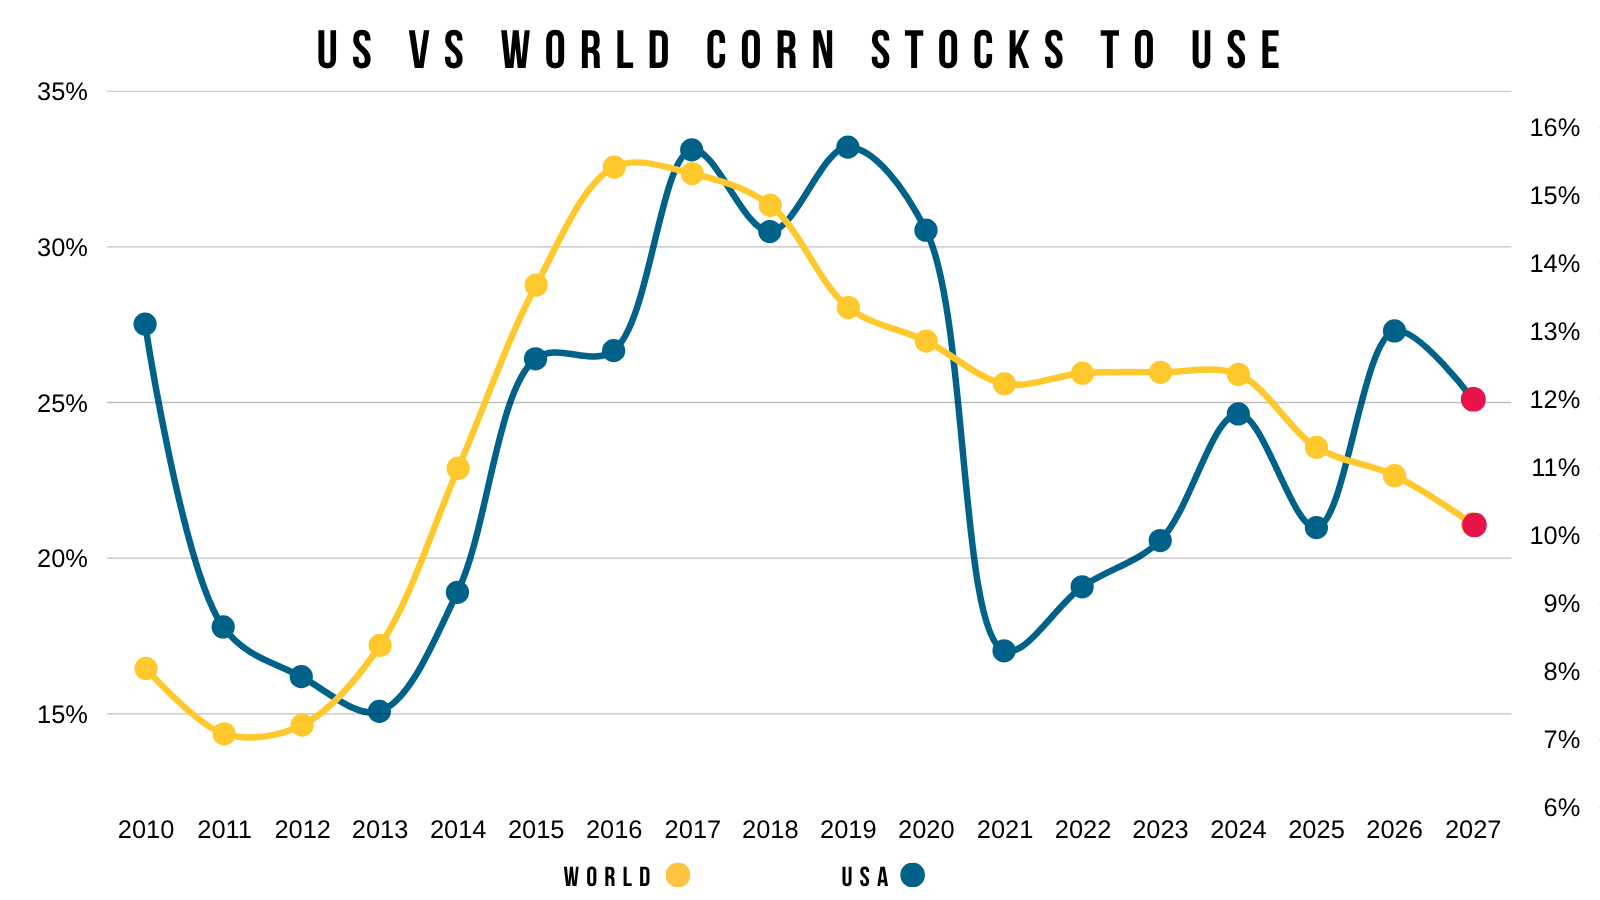
As I've talked about several times, the world situation is a lot different than the US situation.
The world is the tightest it's been on corn in 14 years.
Which does not matter to the market right now, but makes it all that more important for the US to grow a big crop.
As the world can’t afford a sub par US crop.
I saw an interesting report today.
It was reported that Citi Bank told their clients that ags are "skewed" to the upside over the next 6-12 months thanks to the Strait, inflation, and an El Niño.
They are projecting corn to reach $5 a bushel short term and $5.50 a bushel over the next 12 months.
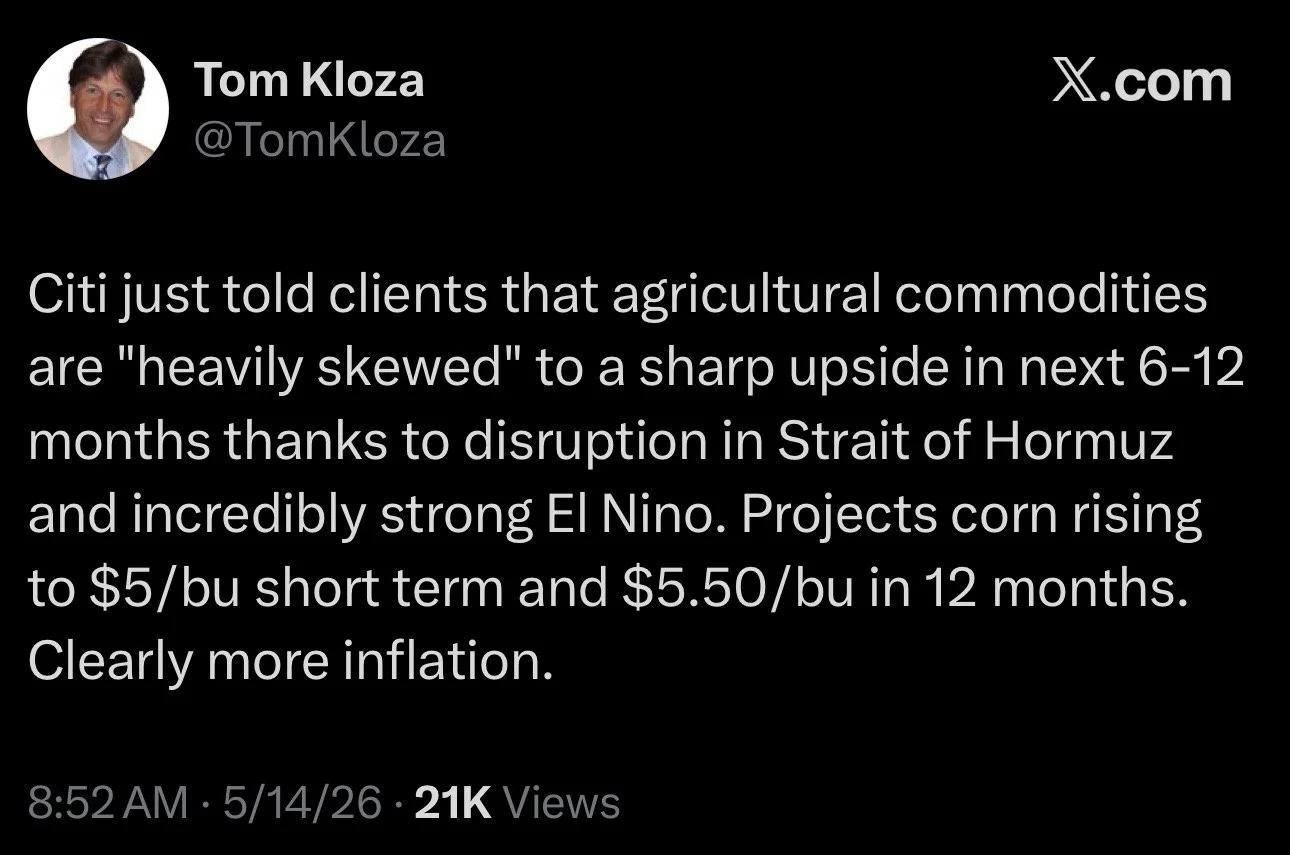
I don’t necessarily disagree with their argument.
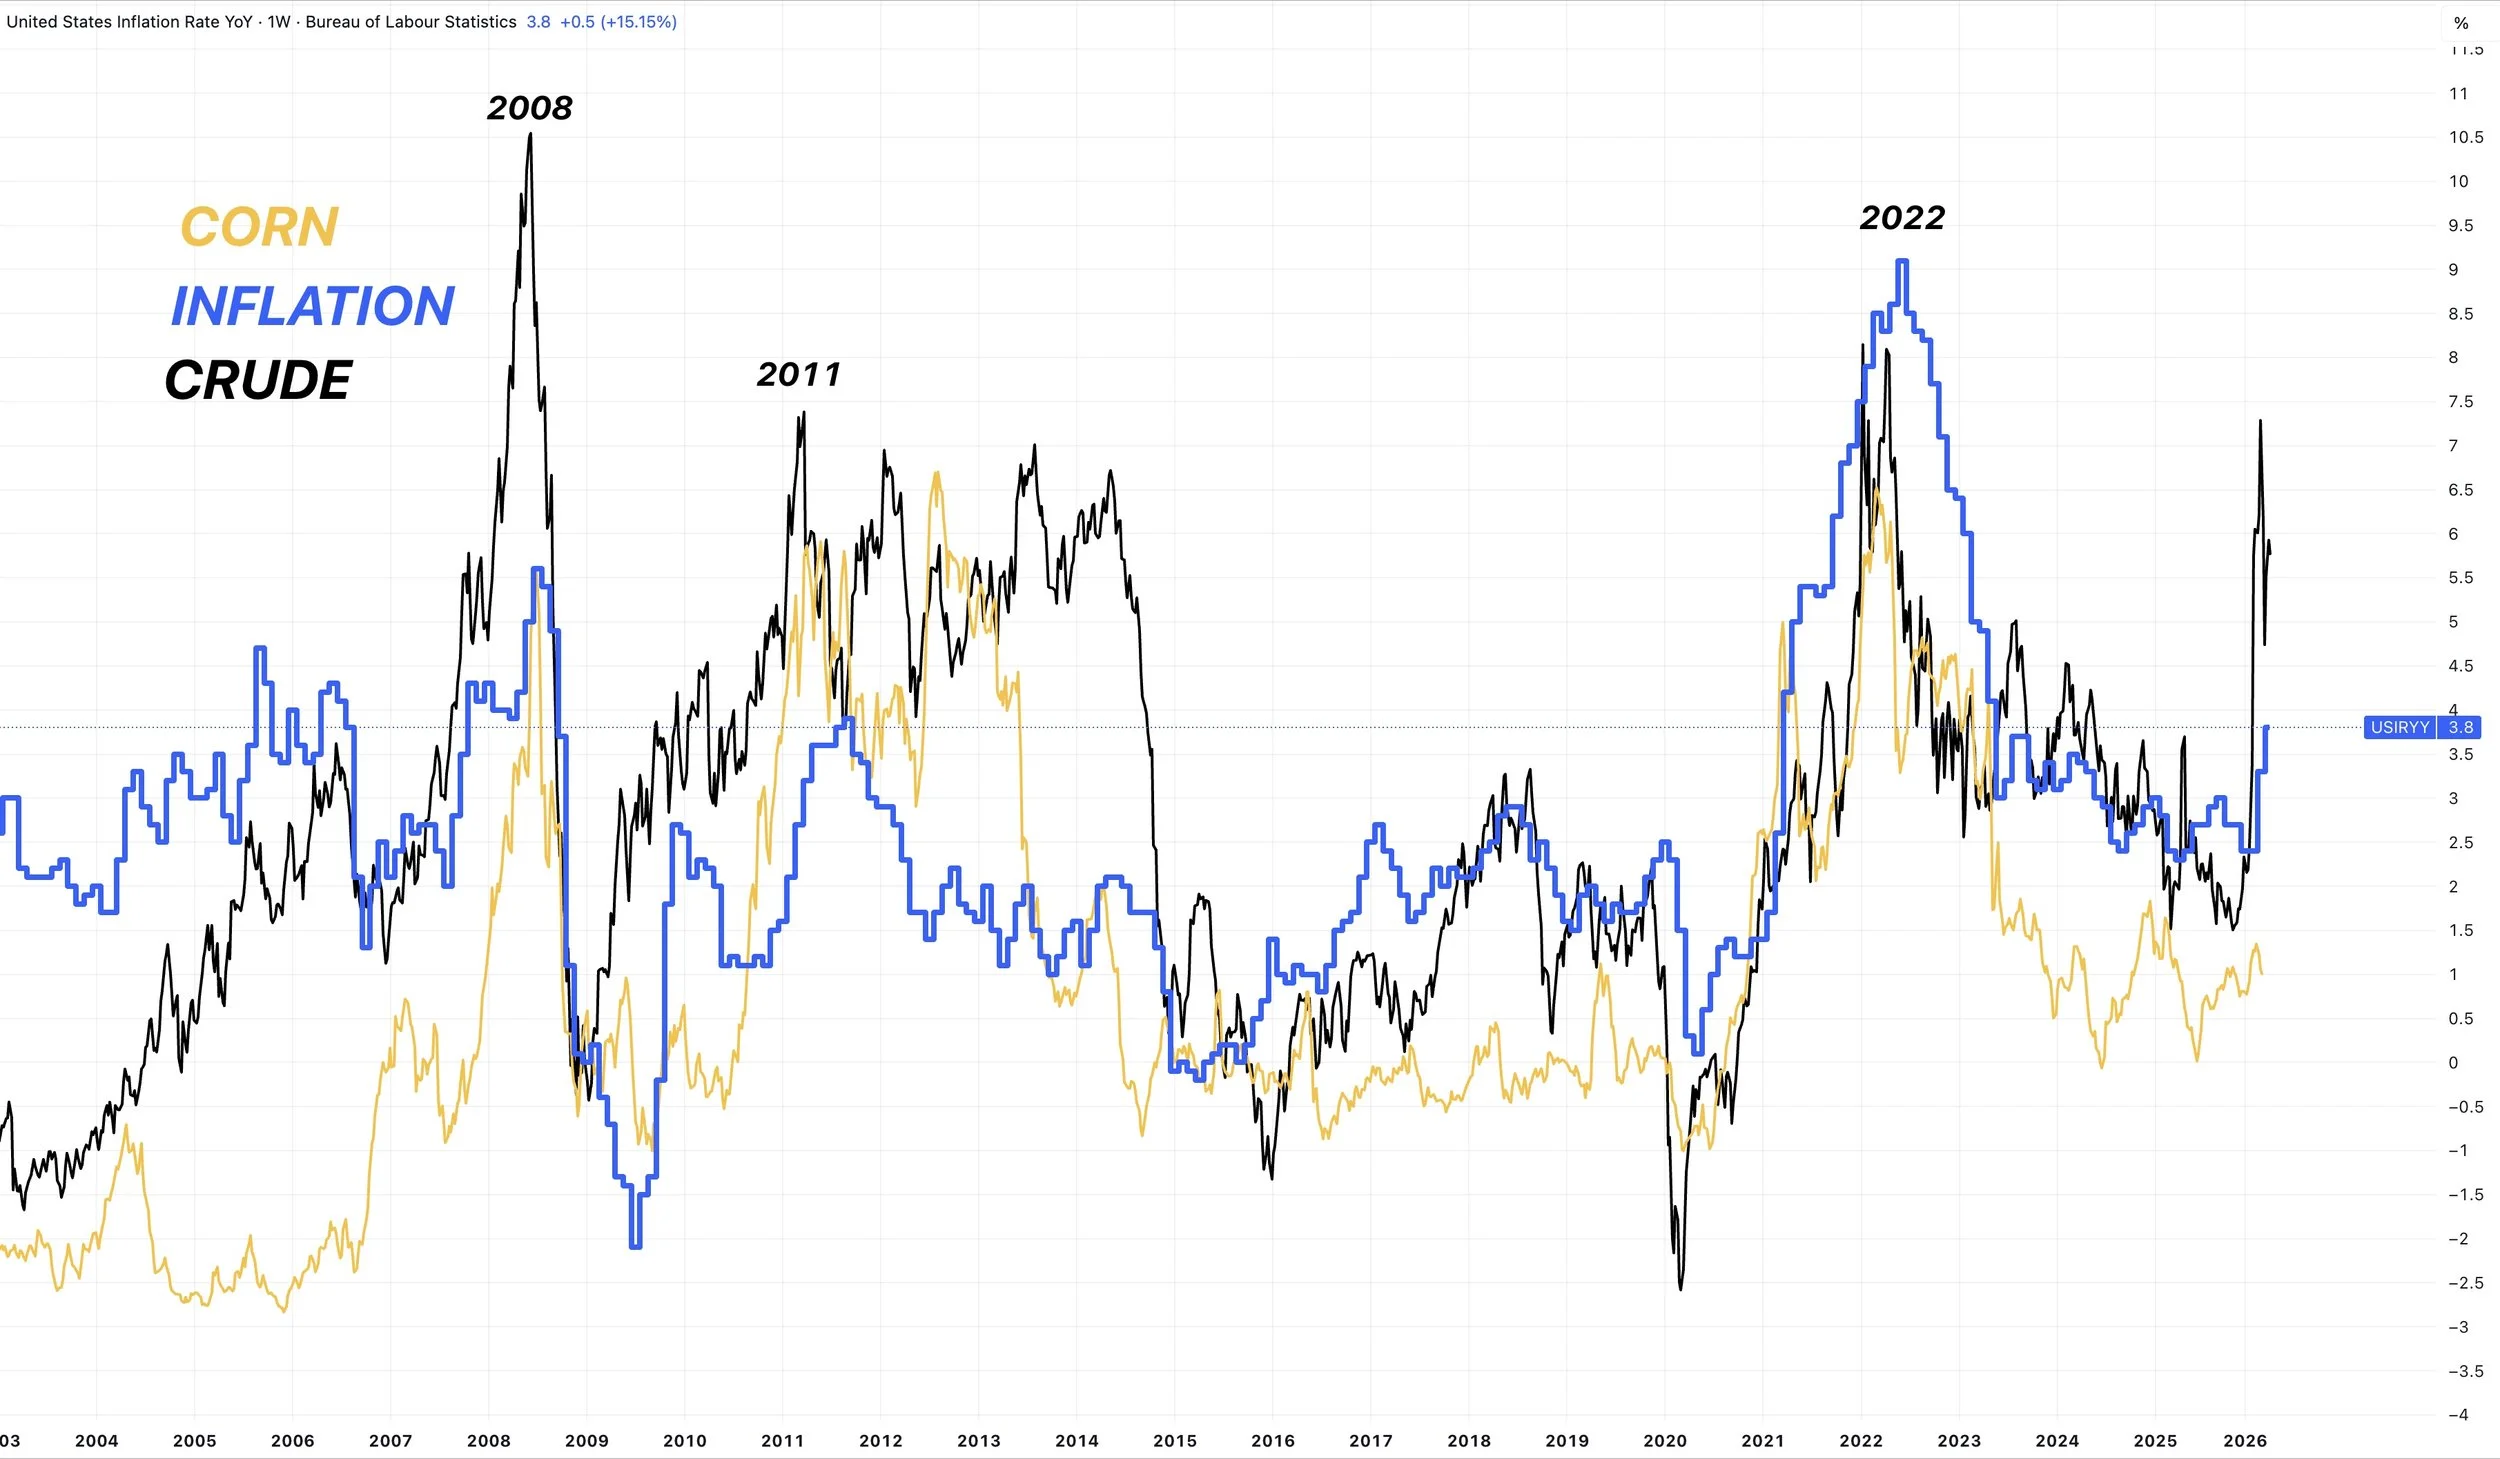
At the end of the day, inflation effects grains.
As we've talked about a thousand times. The one common theme across every bull market is a rise in inflation.
The story in this market was never about production concerns.
2 billion bushels of corn typically doesn’t result in $5.00 new crop.
The story has always been driven by the macros.
With crude oil still trading over $100 and inflation on the rise but not yet "soaring".
Something that definitely gives new crop potential over the next 6-12 months if it continues.
For now, there doesn’t seem to be any real weather risk in this corn market.
There are pockets that aren’t perfect. But generally, the weather is viewed as favorable for now for most of the I-states.
As there is plenty of rain in the forecast for the I-states through the end of May.
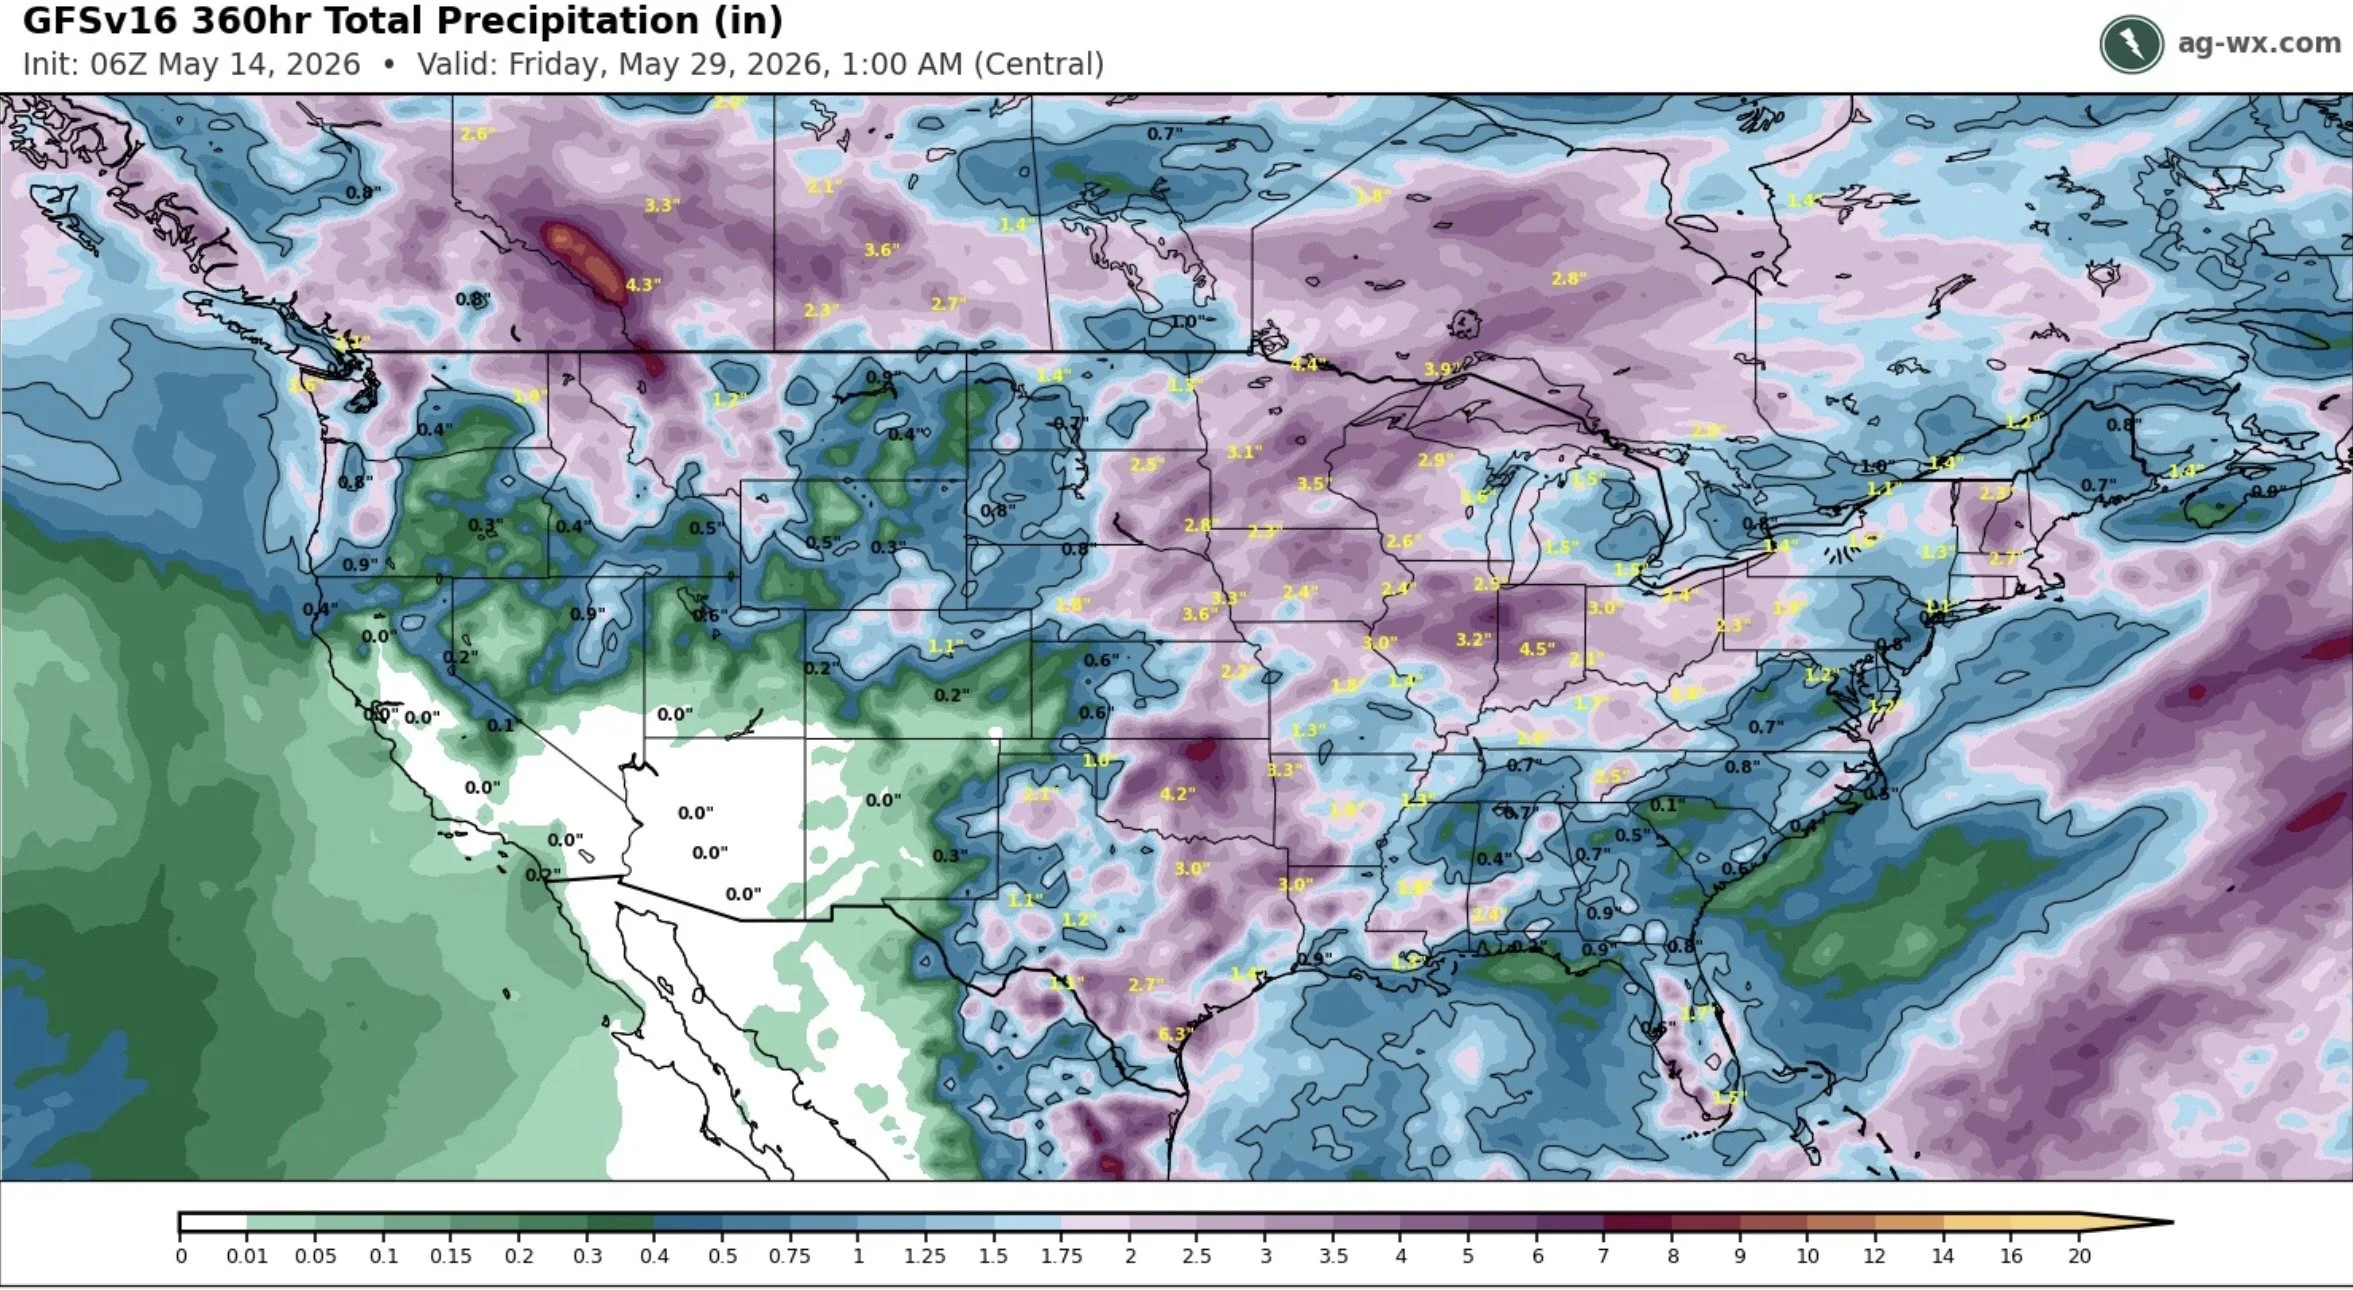
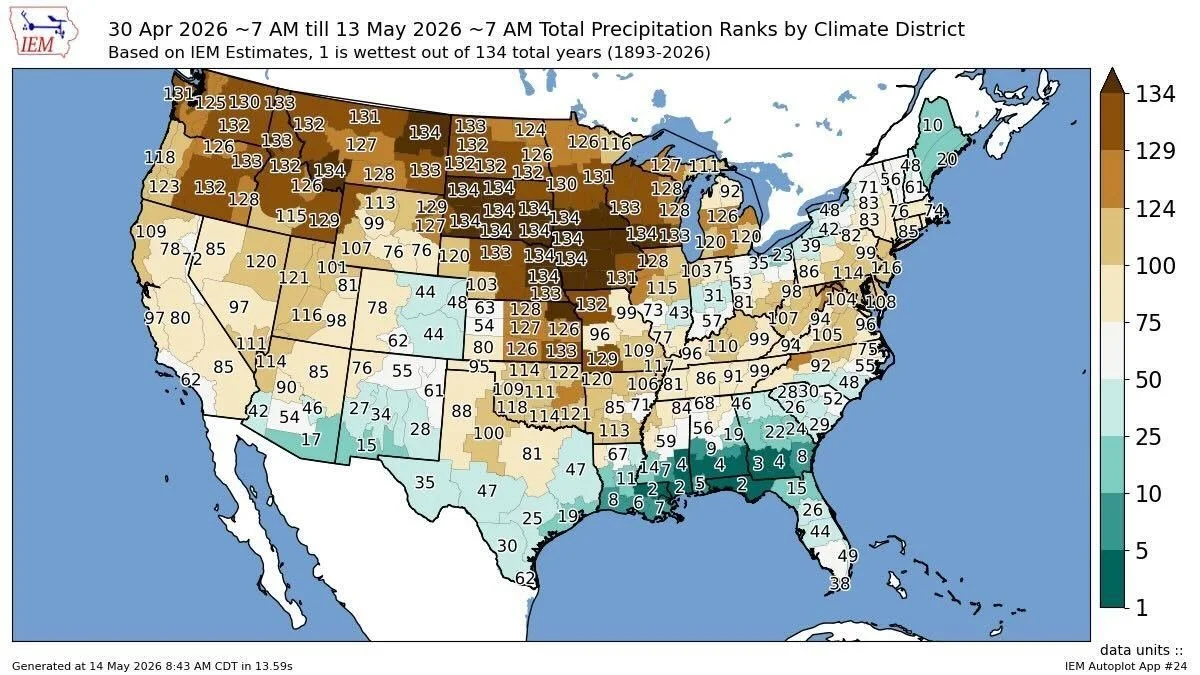
However, if you look at Iowa specifically there are some concerns starting to pop up.
They did just have their driest start to May they've ever seen. Although April was one of the wettest.
It's still too early, but you do have to wonder if that drought out west has a chance to spread.
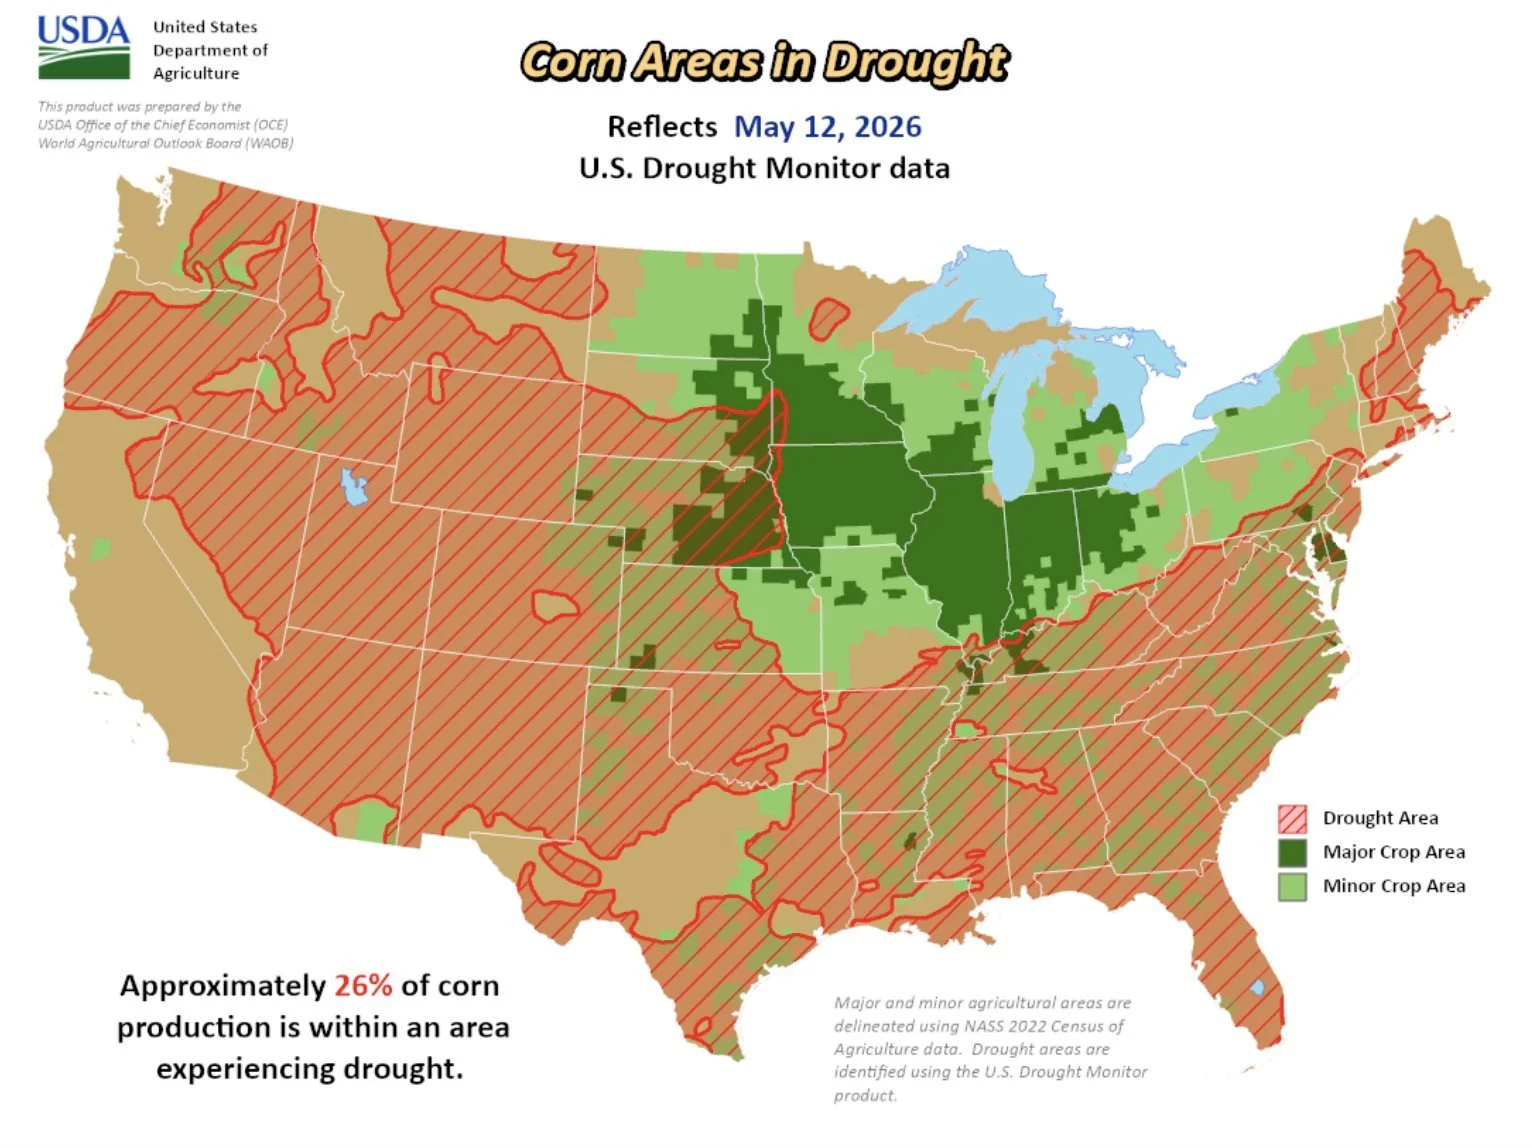
Here is the US drought overlayed on top of corn production areas.
Again, most of the corn areas are not in drought right now aside from Nebraska.
Drought is effecting basically the entire United States outside of the I-states.
So overall, no concerns today.
Right now the short term forecasts don’t look too threatening over the next week or two, with ample rain.
But that doesn’t mean it can’t change in June and July.
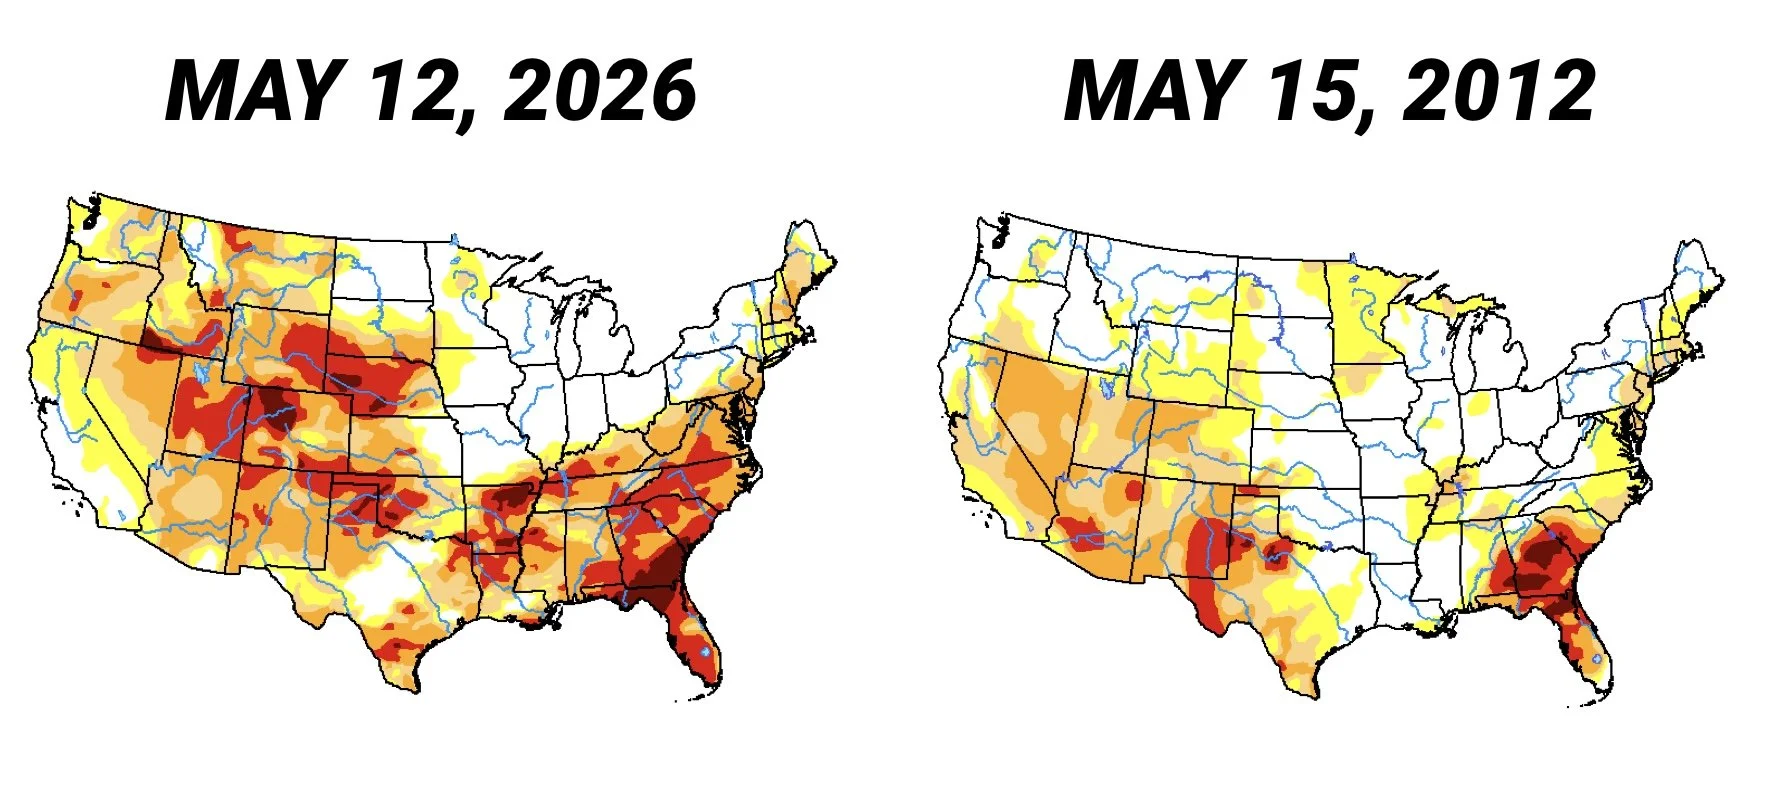
Here is the current drought monitor if you compare it to 2012 for this same date.
Yes, I know 2012 is always that hand-picked year, and 2012 will always remain a year of it's own no matter how many times it gets comparisons.
This is NOT me calling for drought. I'm just simply pointing out that you can always have an issue later on no matter what it looks like in May.
But you could theoretically say this every year.
As I've been talking about heavily for the last few weeks, this is the time of year where we need to be putting our marketing hats on or having some protection.
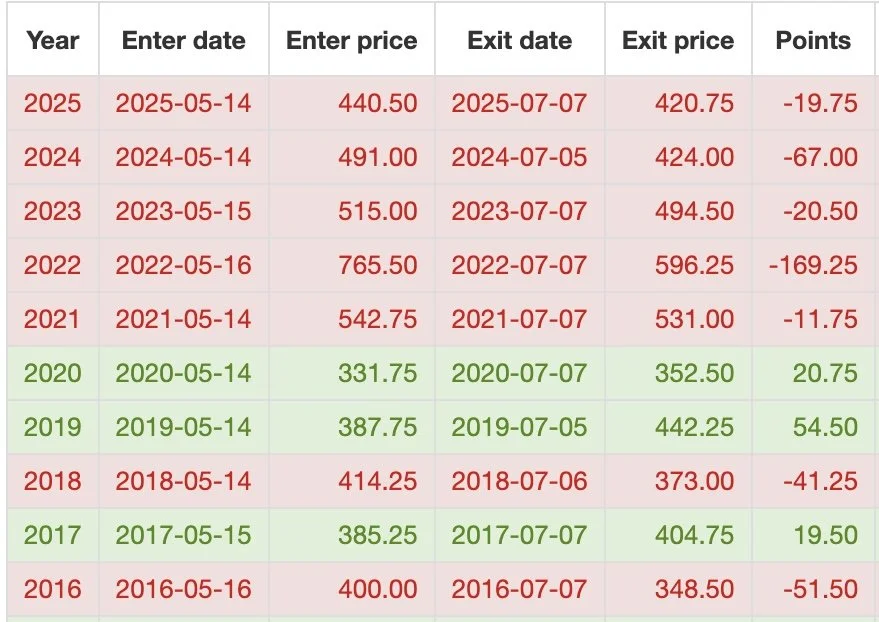
As historically, we fall out of bed within the next 30-45 days if there isn’t an issue with the crop by June or July.
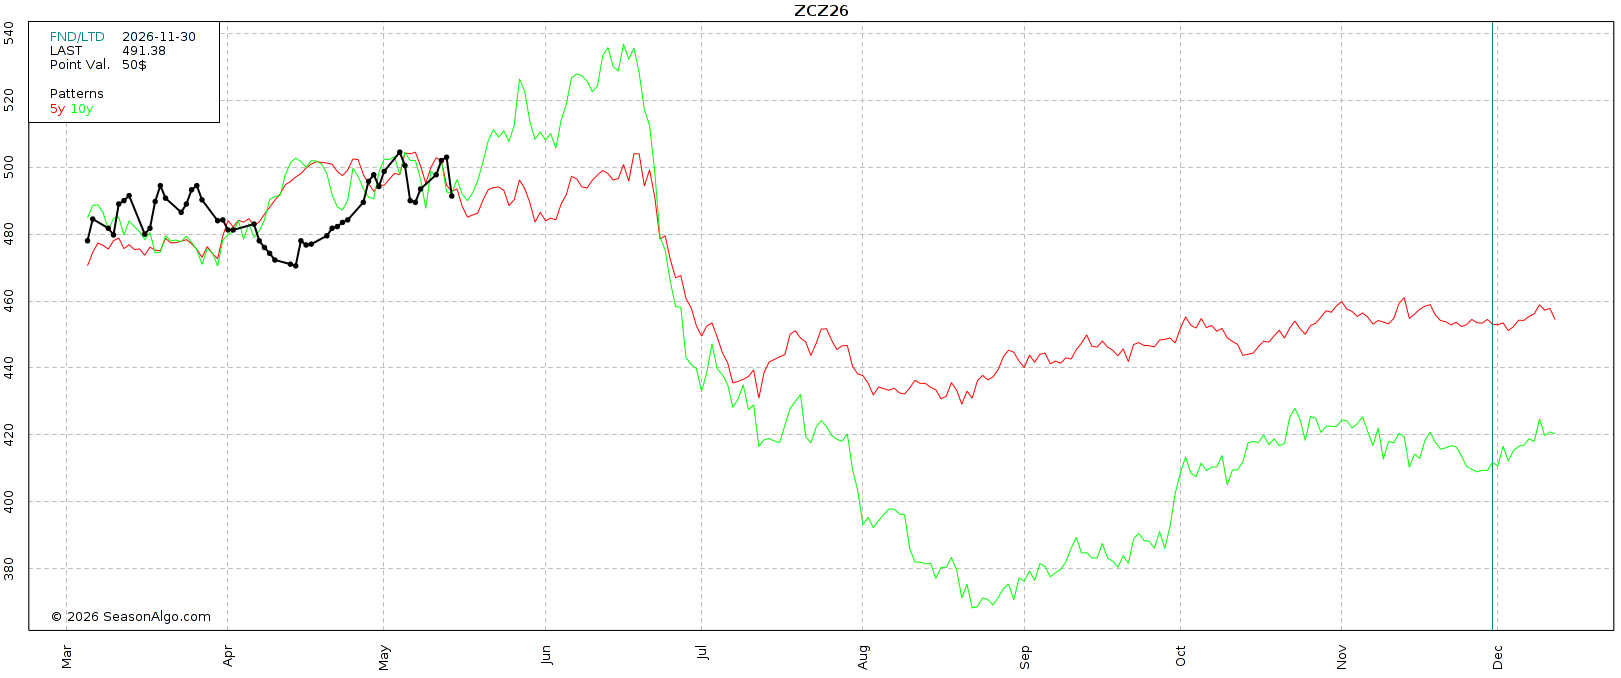
More often than not, we are lower from today by that 4th of July weekend.
Lower the last 5 years in a row.
Lower 7 of the last 10 years.
Doesn’t mean we can’t go higher first. Just means we are typically lower by then.
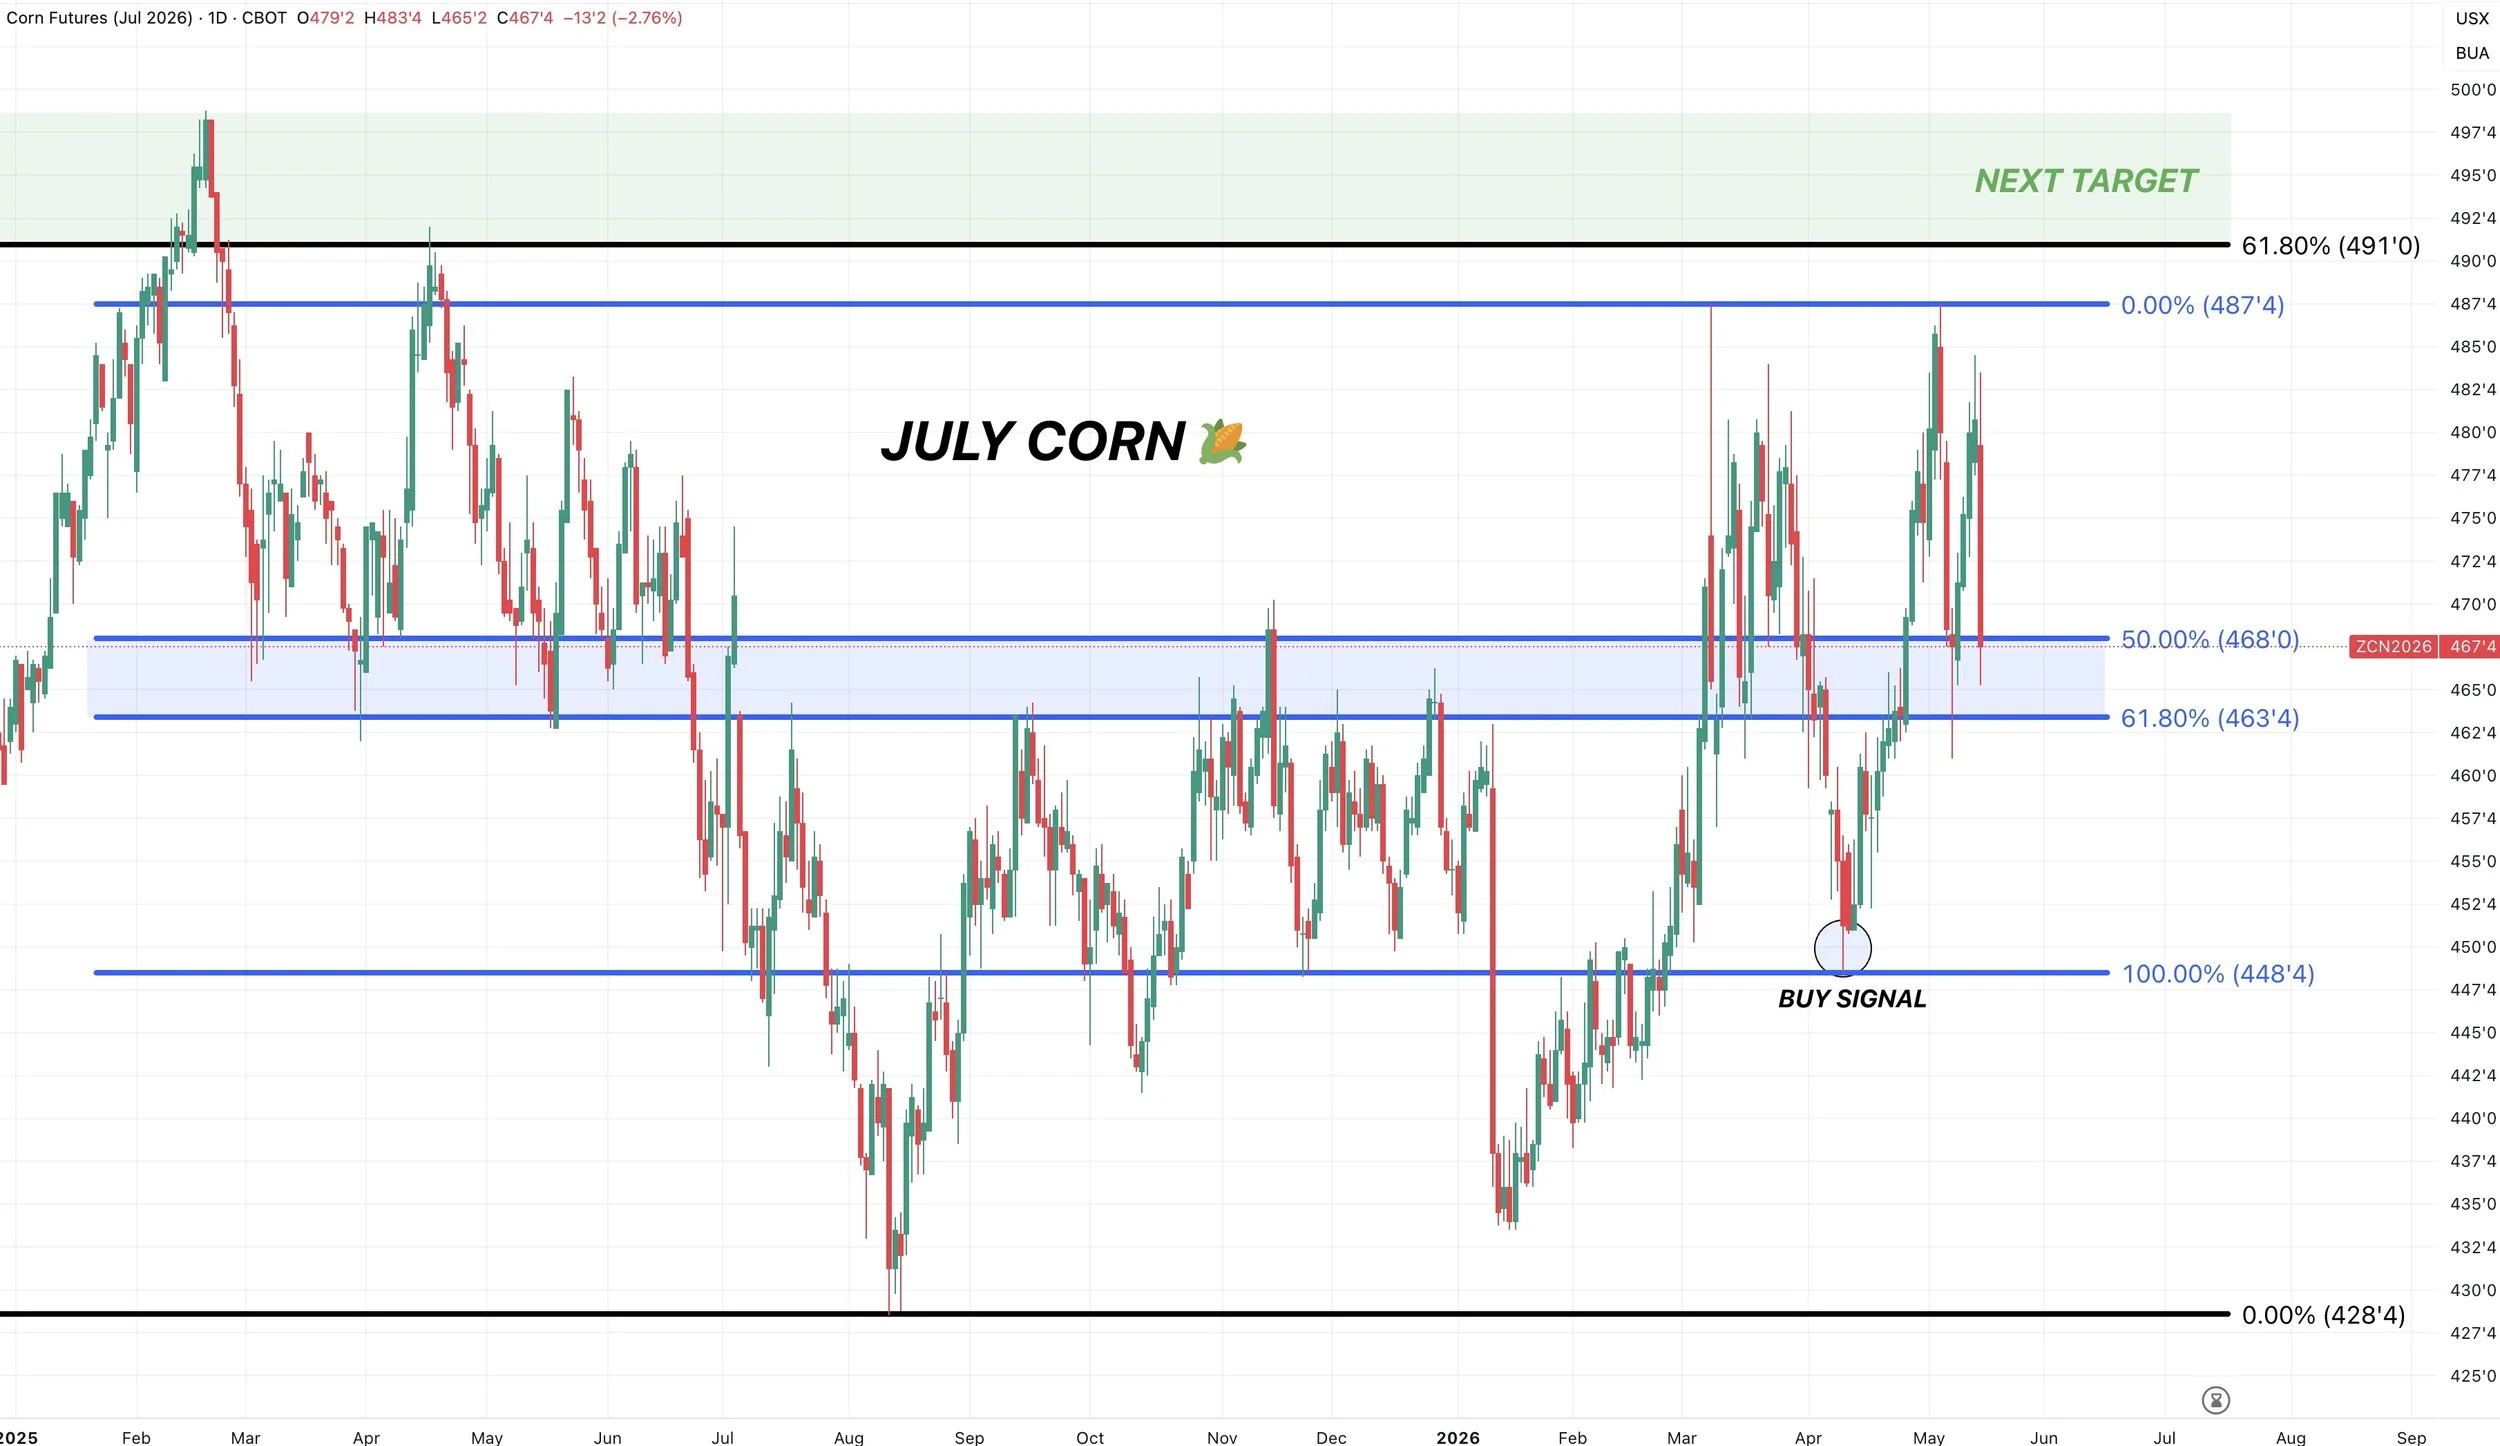
July Corn Chart:
Obviously not a great today.
However, we are now right back support.
We previously bottomed after giving back 61.8% of the entire rally.
That same area was key resistance several times back in the fall.
This level is once again going to be that must hold level that decides our fate.
Where the market decides if we are falling apart or not.
If we break below this level, we likely revisit those April lows.
I still want to de-risk if we crawl into the $4.90 to $5.00 range.
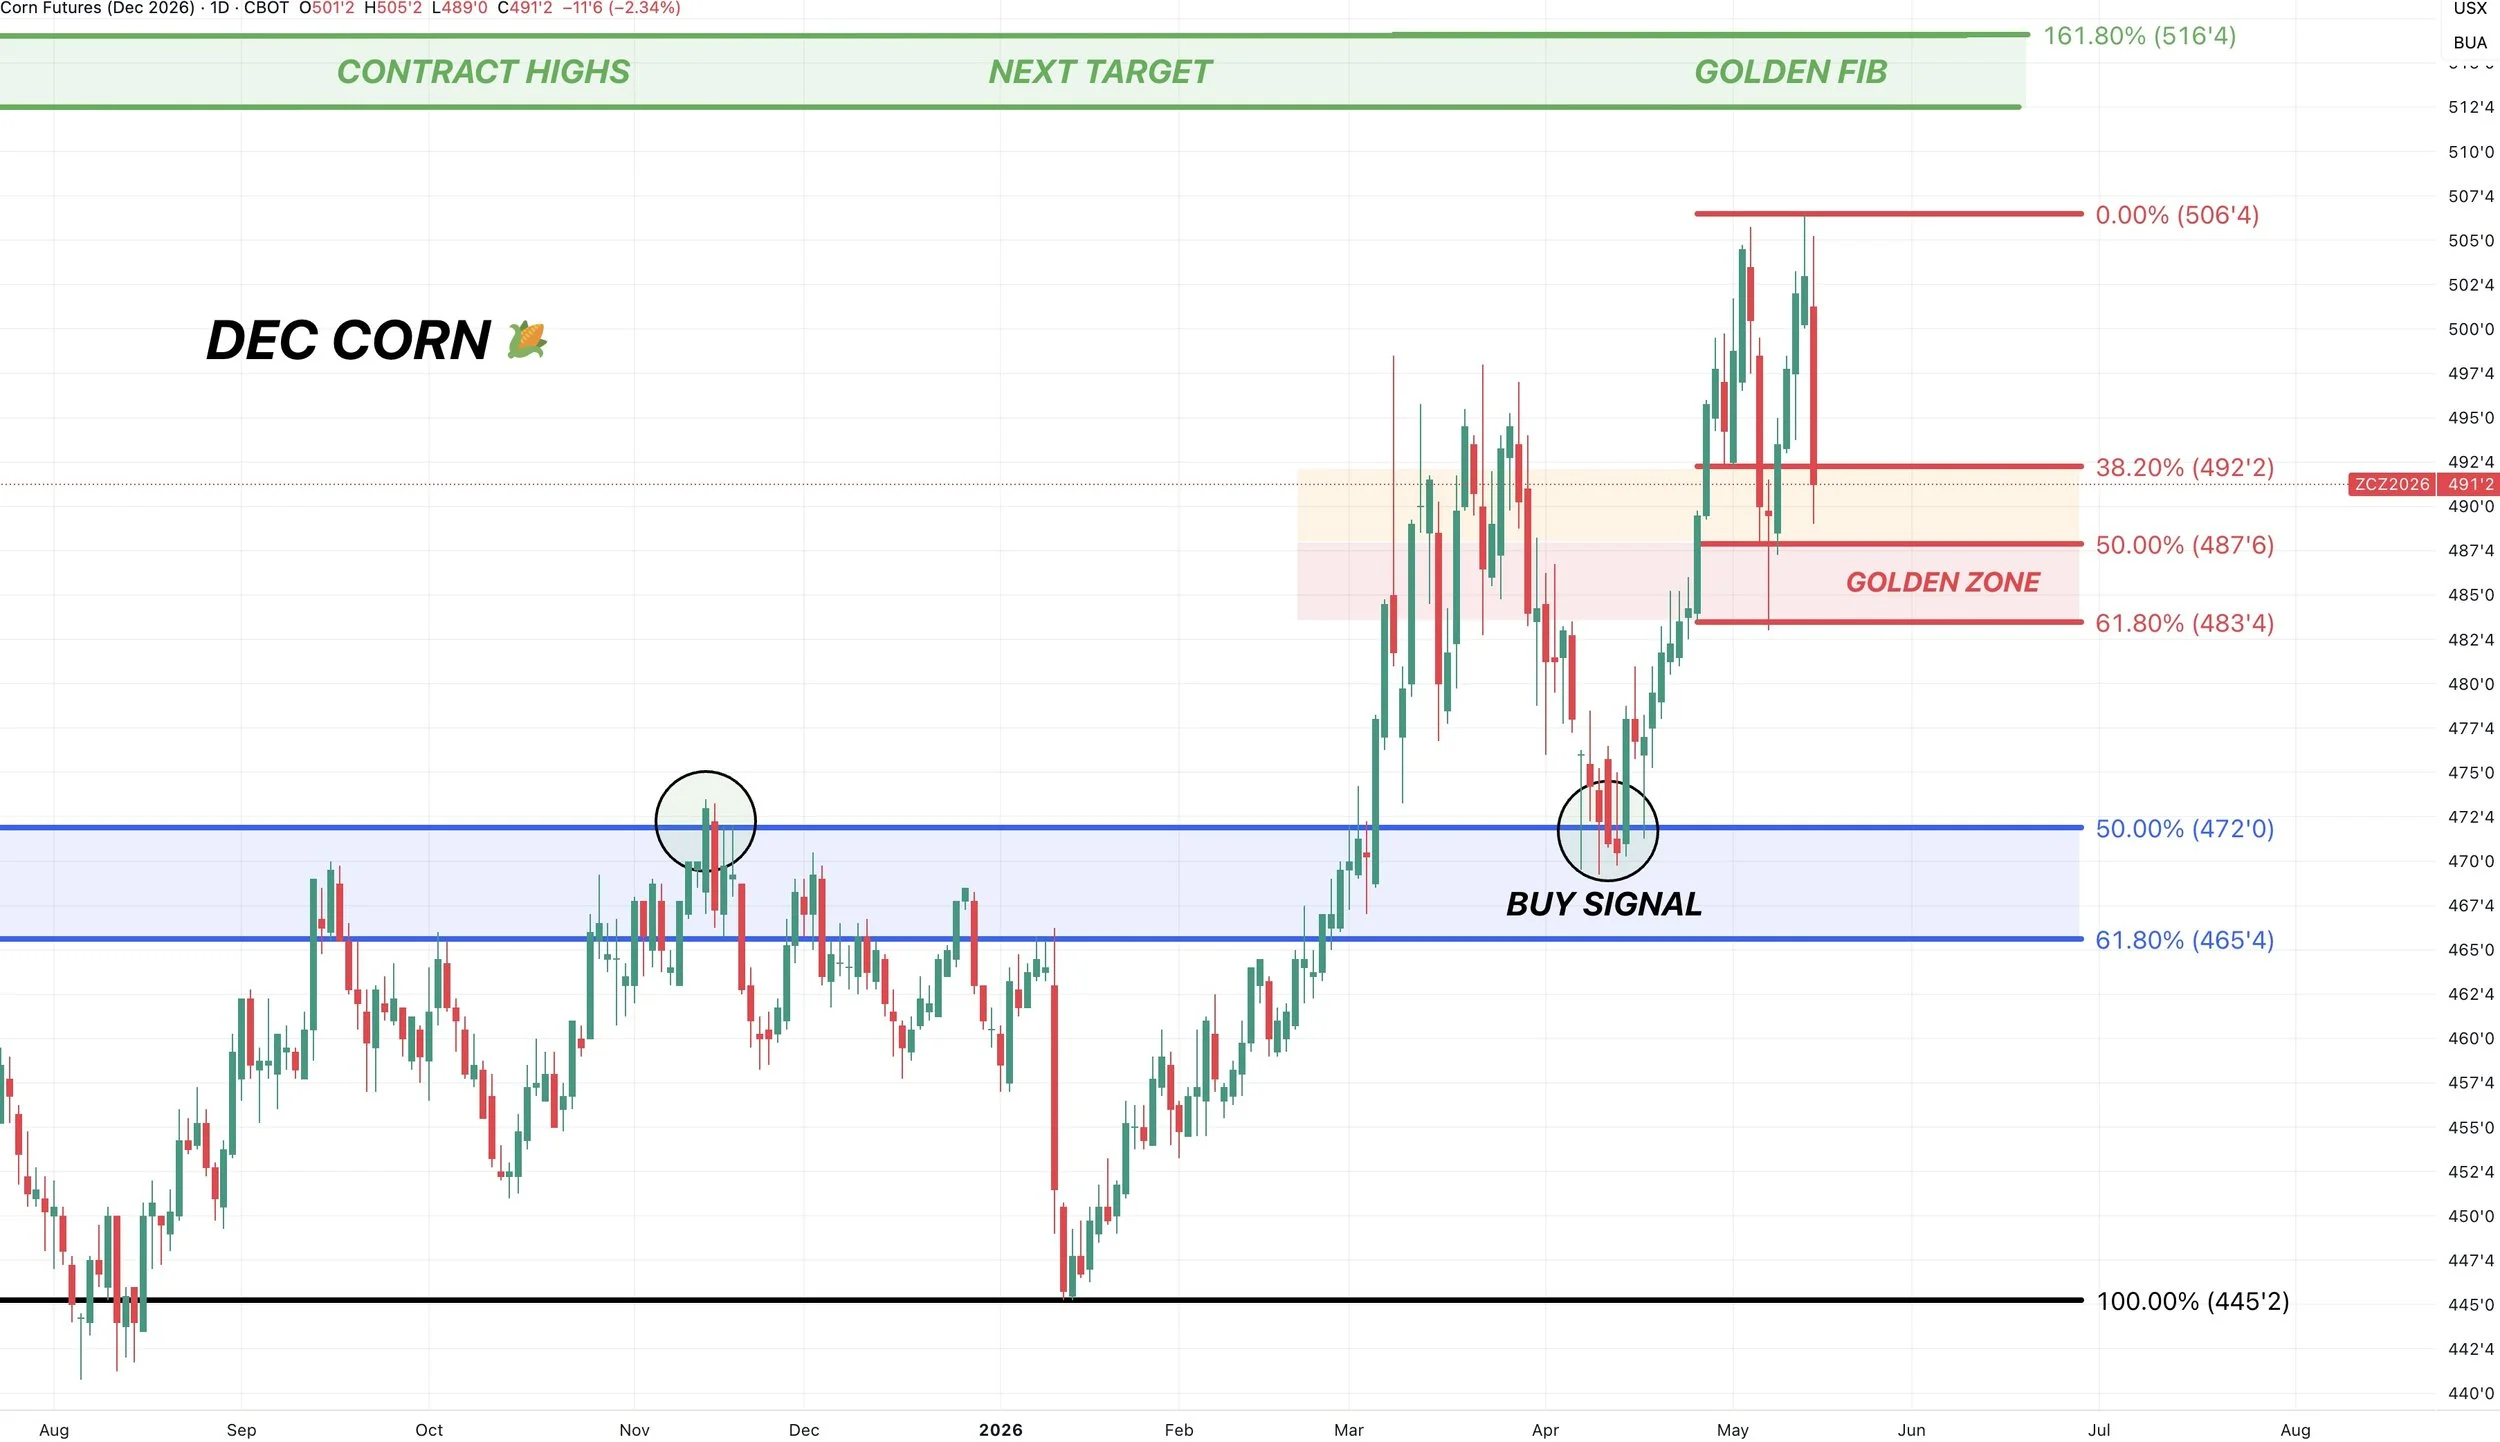
Dec Corn Chart:
We're still in a clear up trend for now.
As I've talked about a lot recently, in strong markets we do not have to come down to the golden.
Often times the correction is less steep and in the 38.2% to 50% range rather than the 50% to 61.8% range like we are currently seeing in July corn.
The 38.2% and 50% level lines up with prior resistance in Dec as well.
So finding some life here would make sense.
However, $4.83 and the 61.8% level is ultimately the level to hold.
The trend remains higher unless we break below that level.
To the upside, still looking to reward a move towards $5.10 to $5.15 for a variety of reasons we've discussed previously.
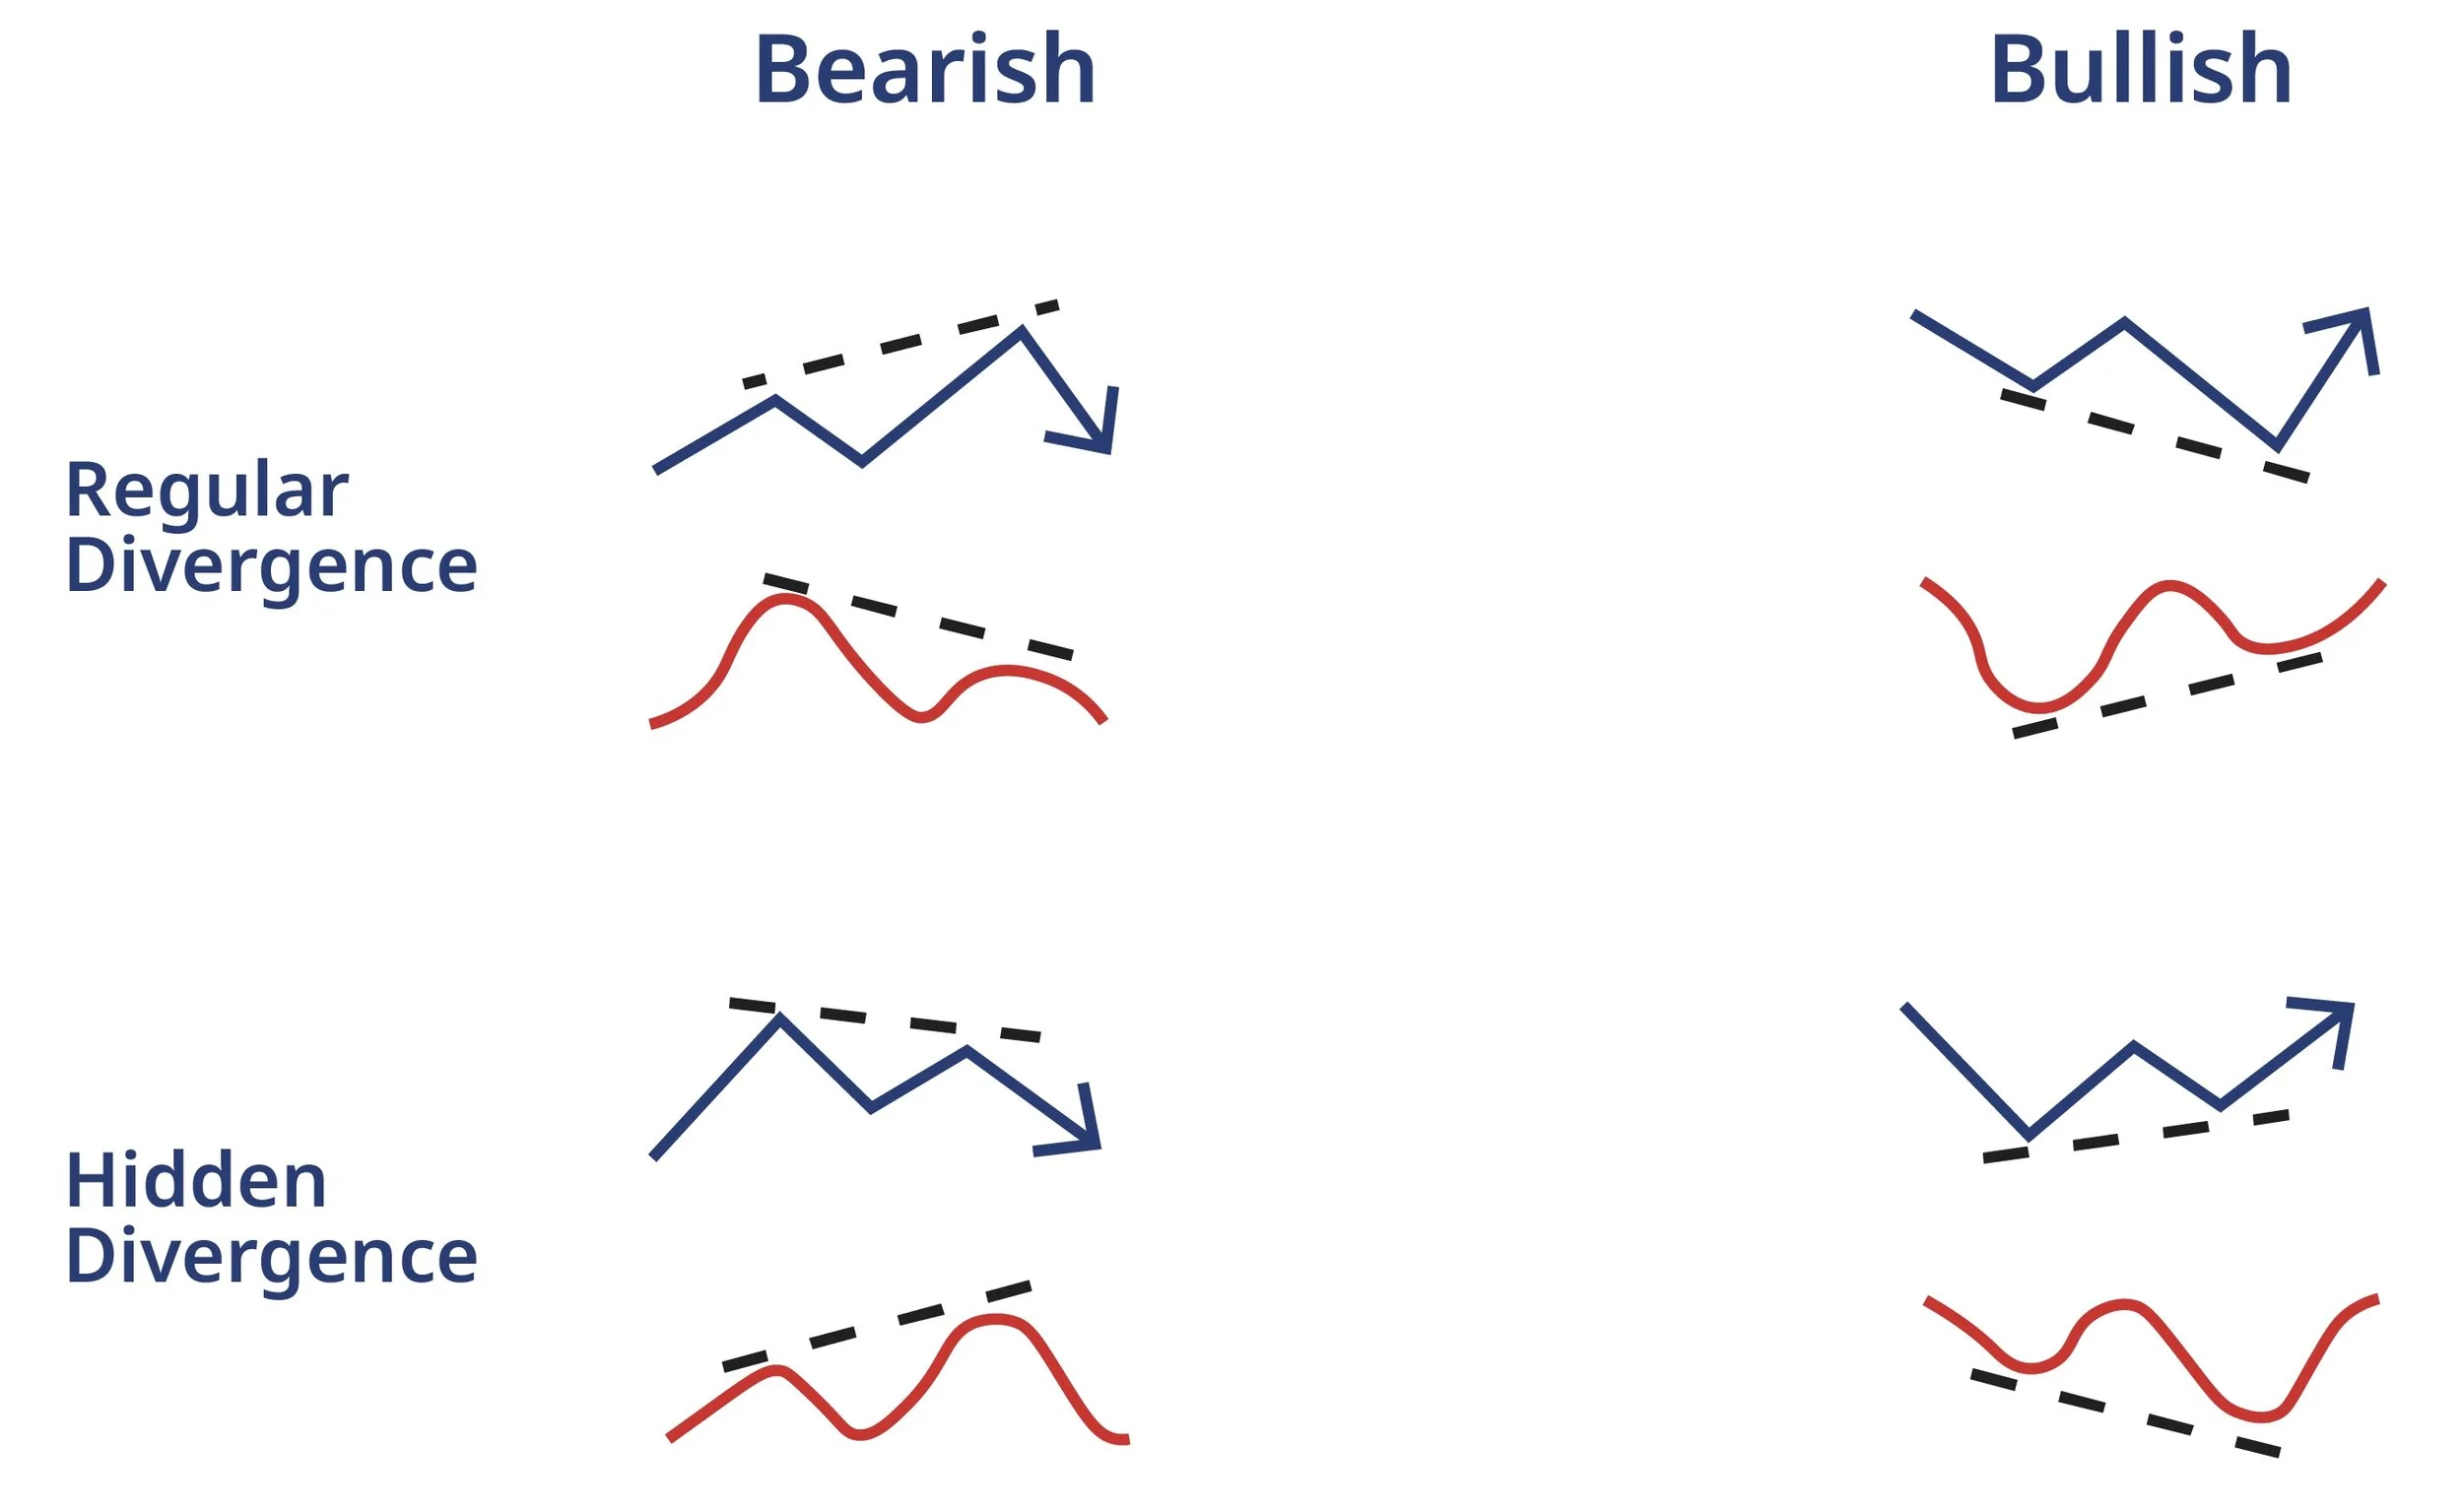
We are showing some possible hidden bullish divergence on the RSI.
The RSI made a new low.
Prices did not.
Normal bearish divergence marked the high back in March.
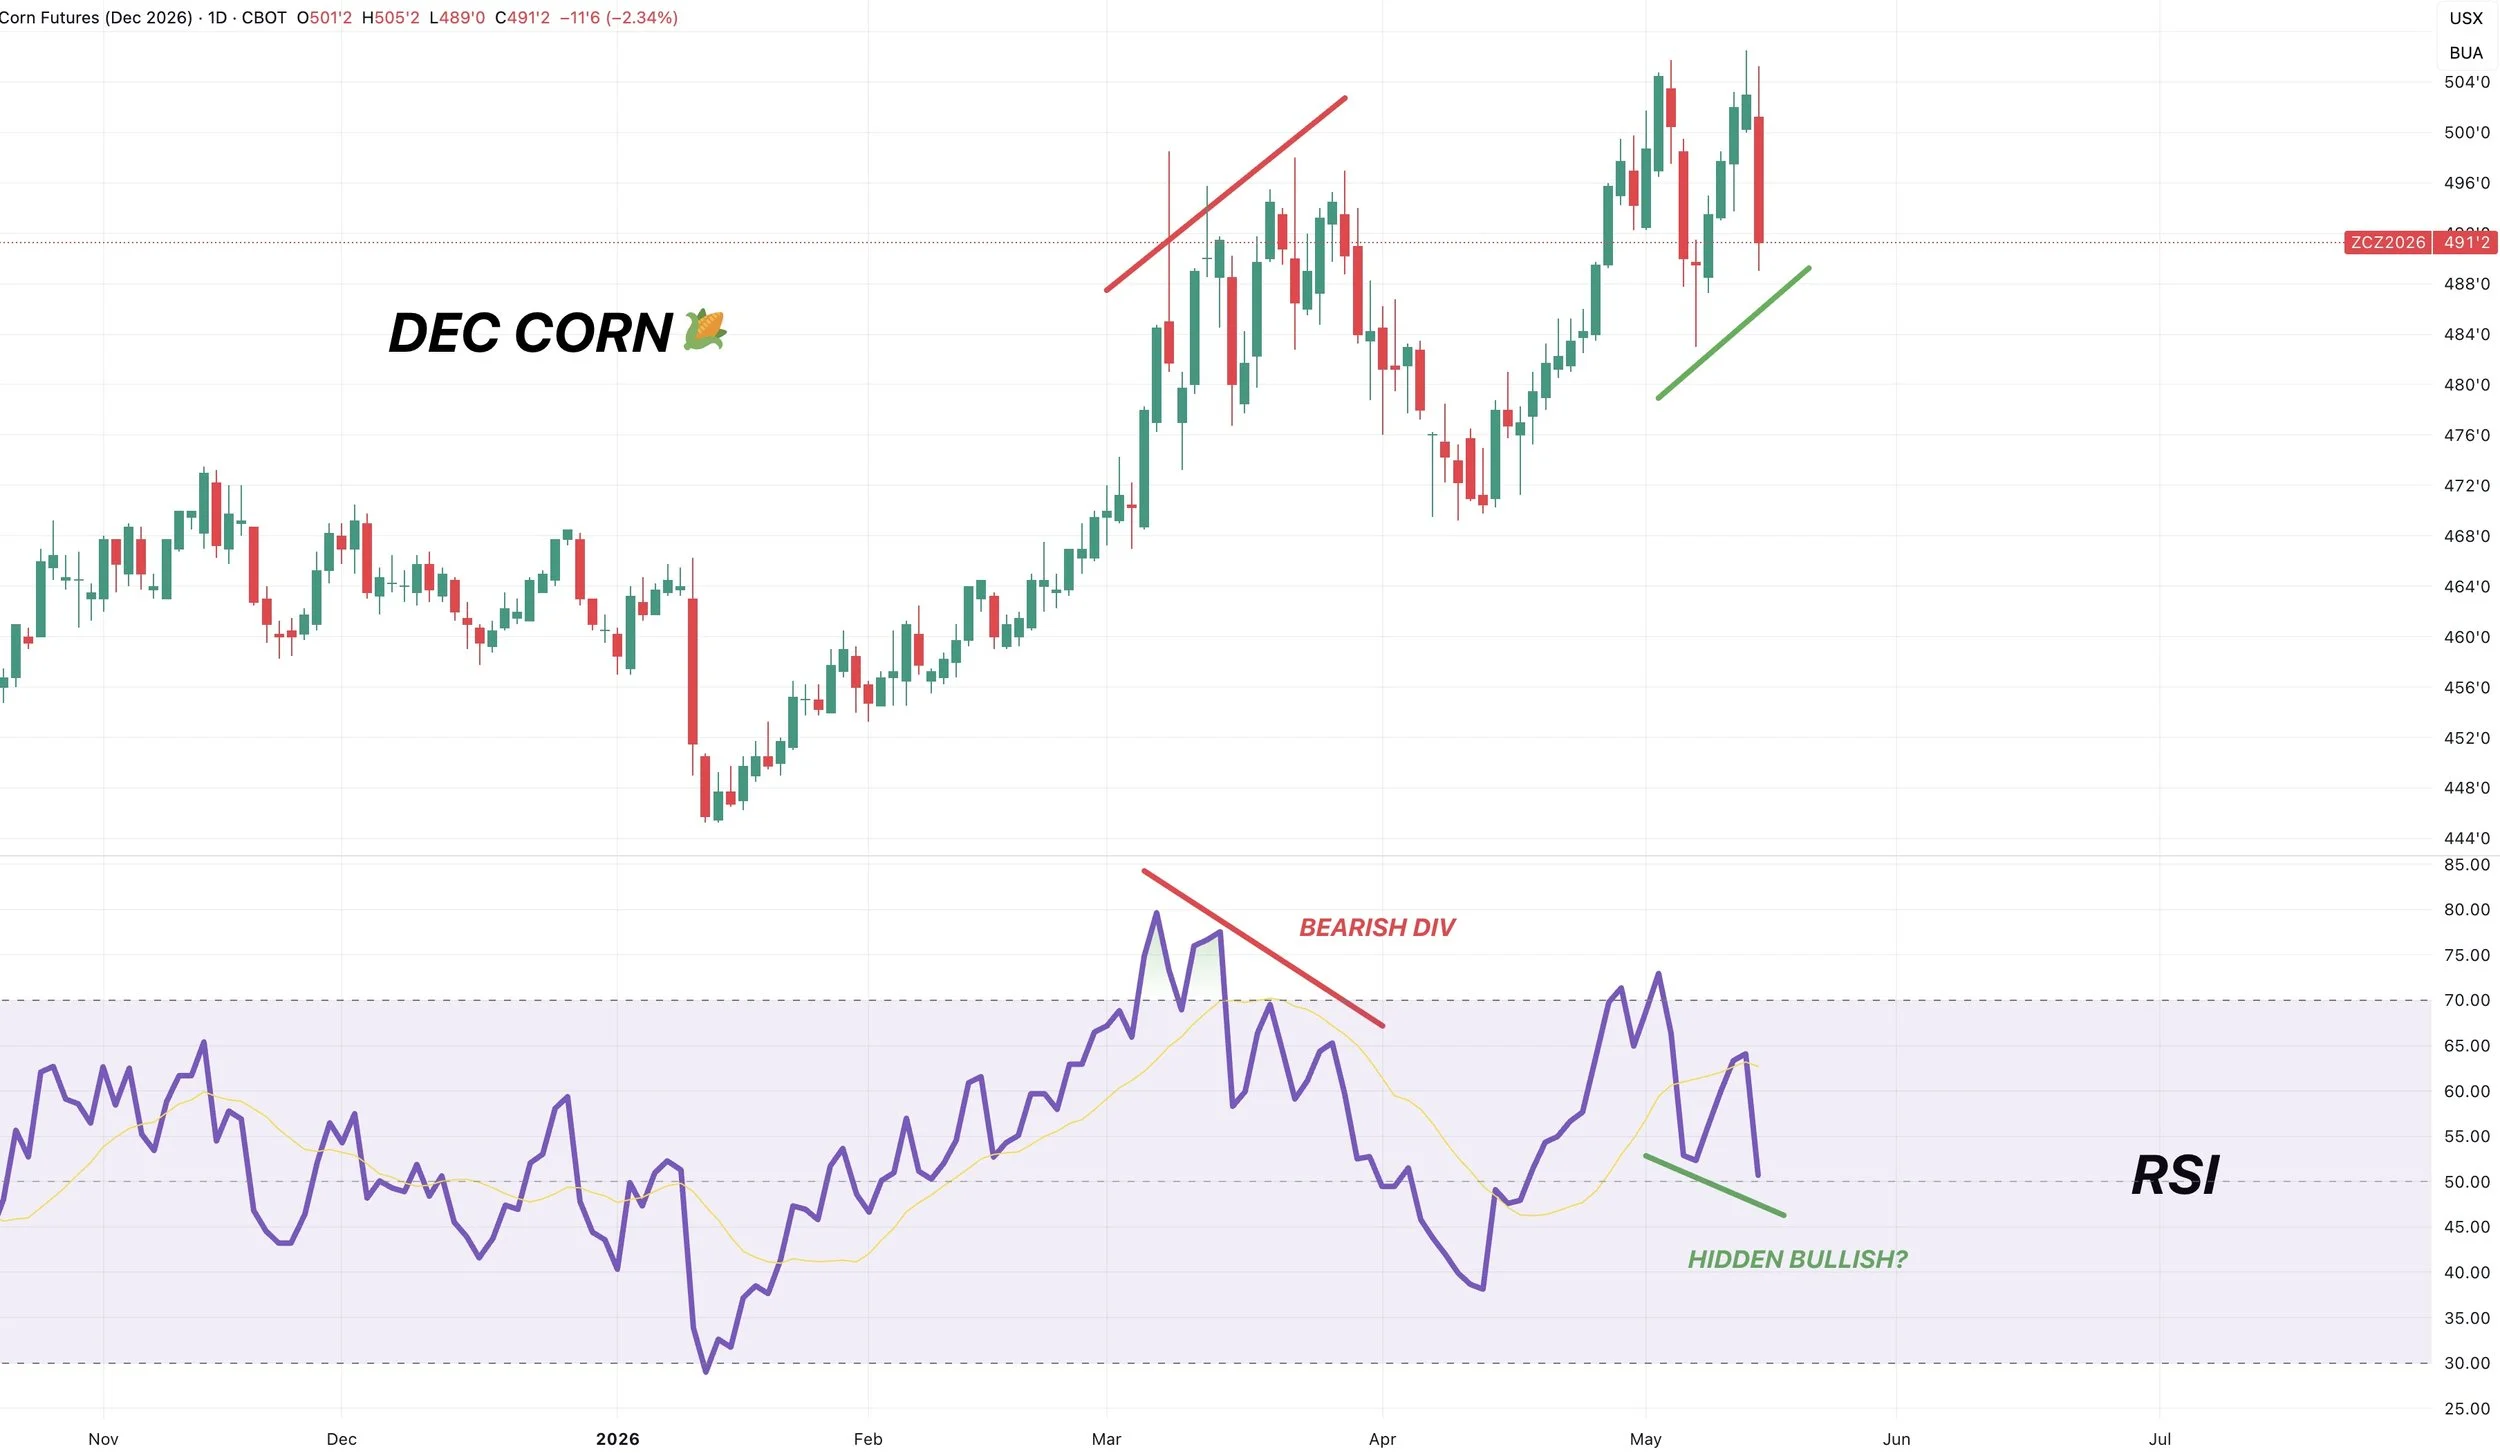
Here is an RSI divergence cheat sheet if you are wondering what they all look like.
Soybeans
The China meeting was a disappointment no doubt.
Who knows if we'll see some other sort of announcement or if that's all we are going to be getting.
Like in corn, we don’t have any concerns surrounding this crop or production.
However, the USDA did just give us a balance sheet that doesn’t offer a lot of wiggle room in the event that we don’t raise yet another record yield.
Simply dropping yield by 2 bpa cuts your carryout in half. Although I ultimately think acres may be too high at the end of the day.
Regardless, there is not a lot of room for error on this balance sheet.
So that offers some potential for new crop. Which is where the story has been for a while now in comparison to old crop.
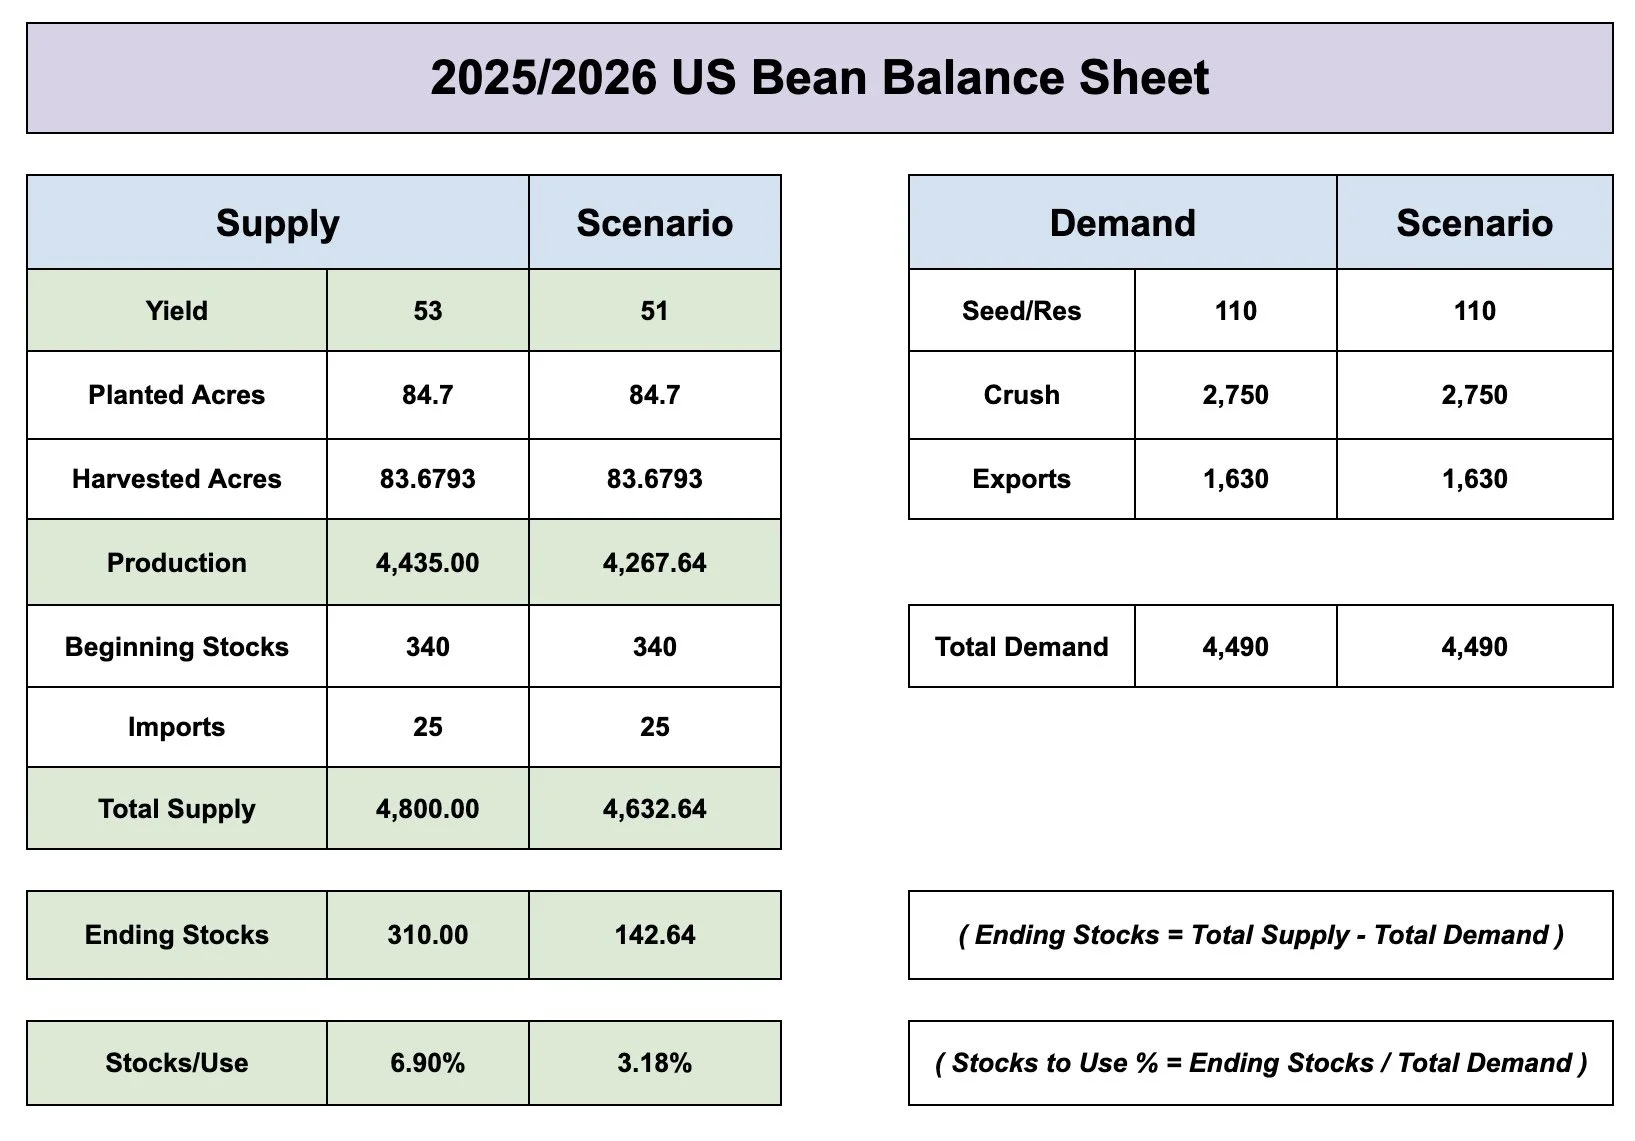
The reason the balance sheet is tighter than last year despite having a lot more acres is because of demand. Both exports as well as crush.
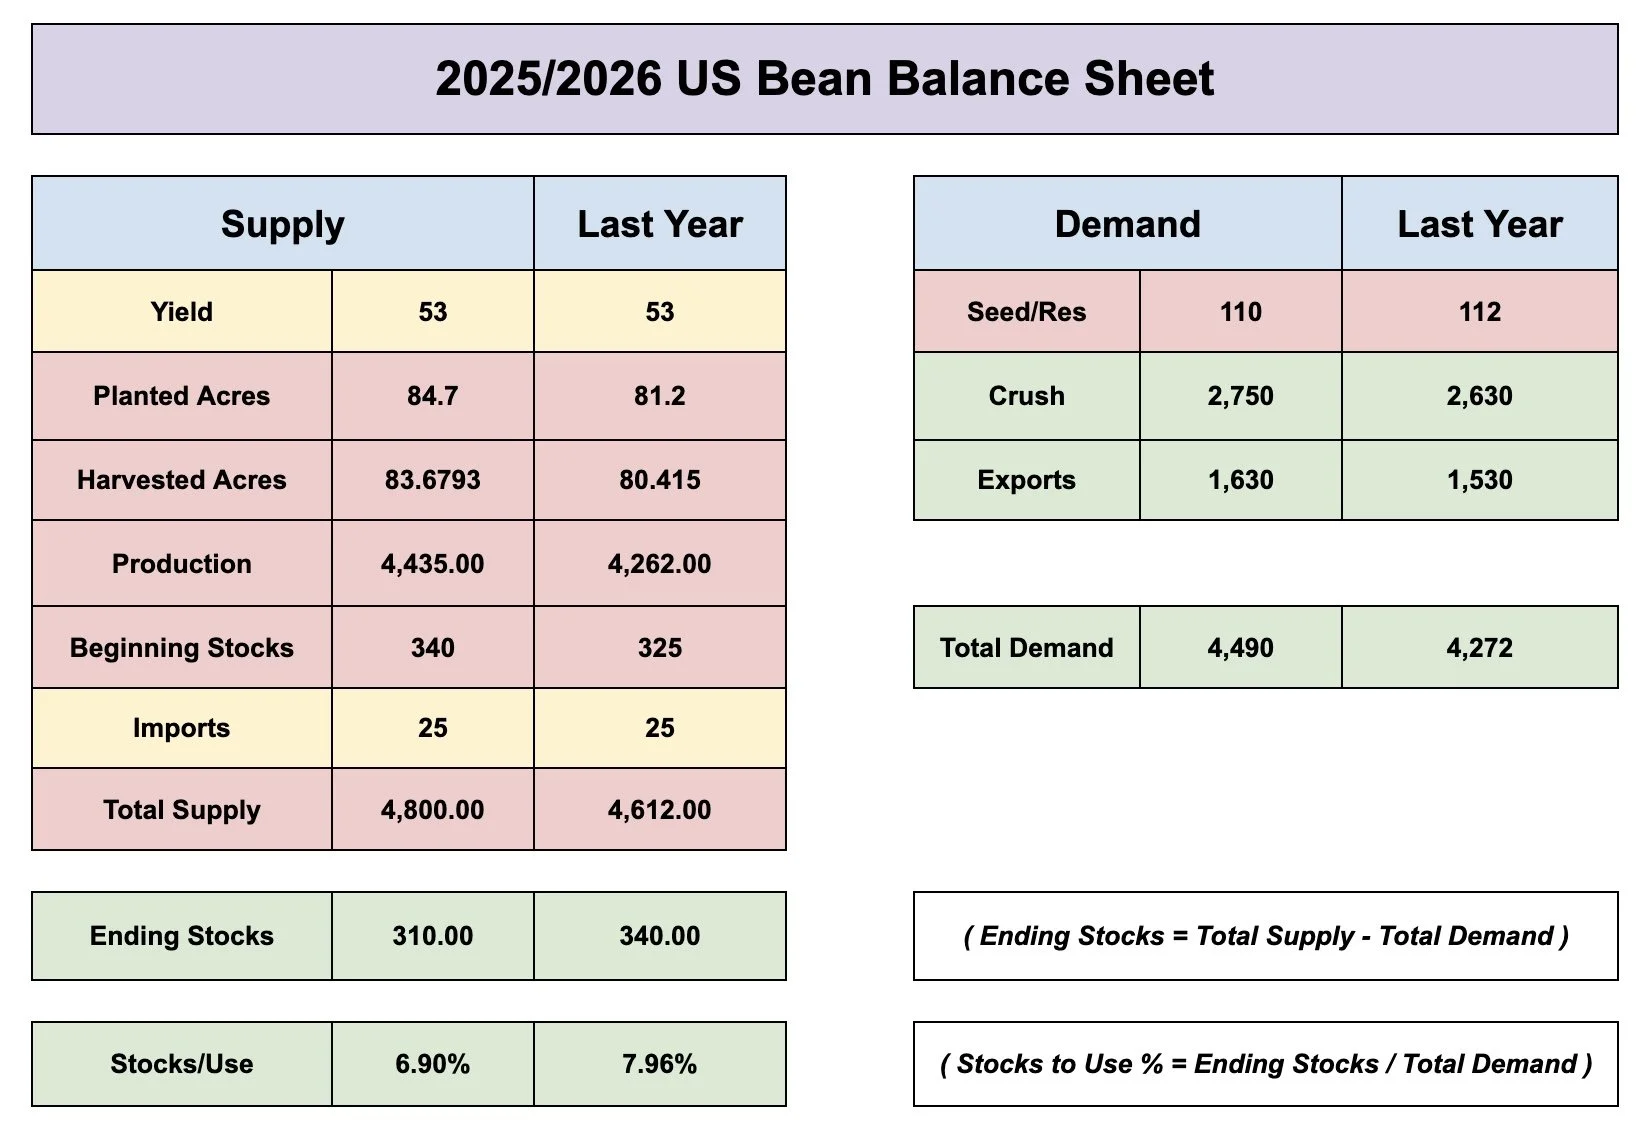
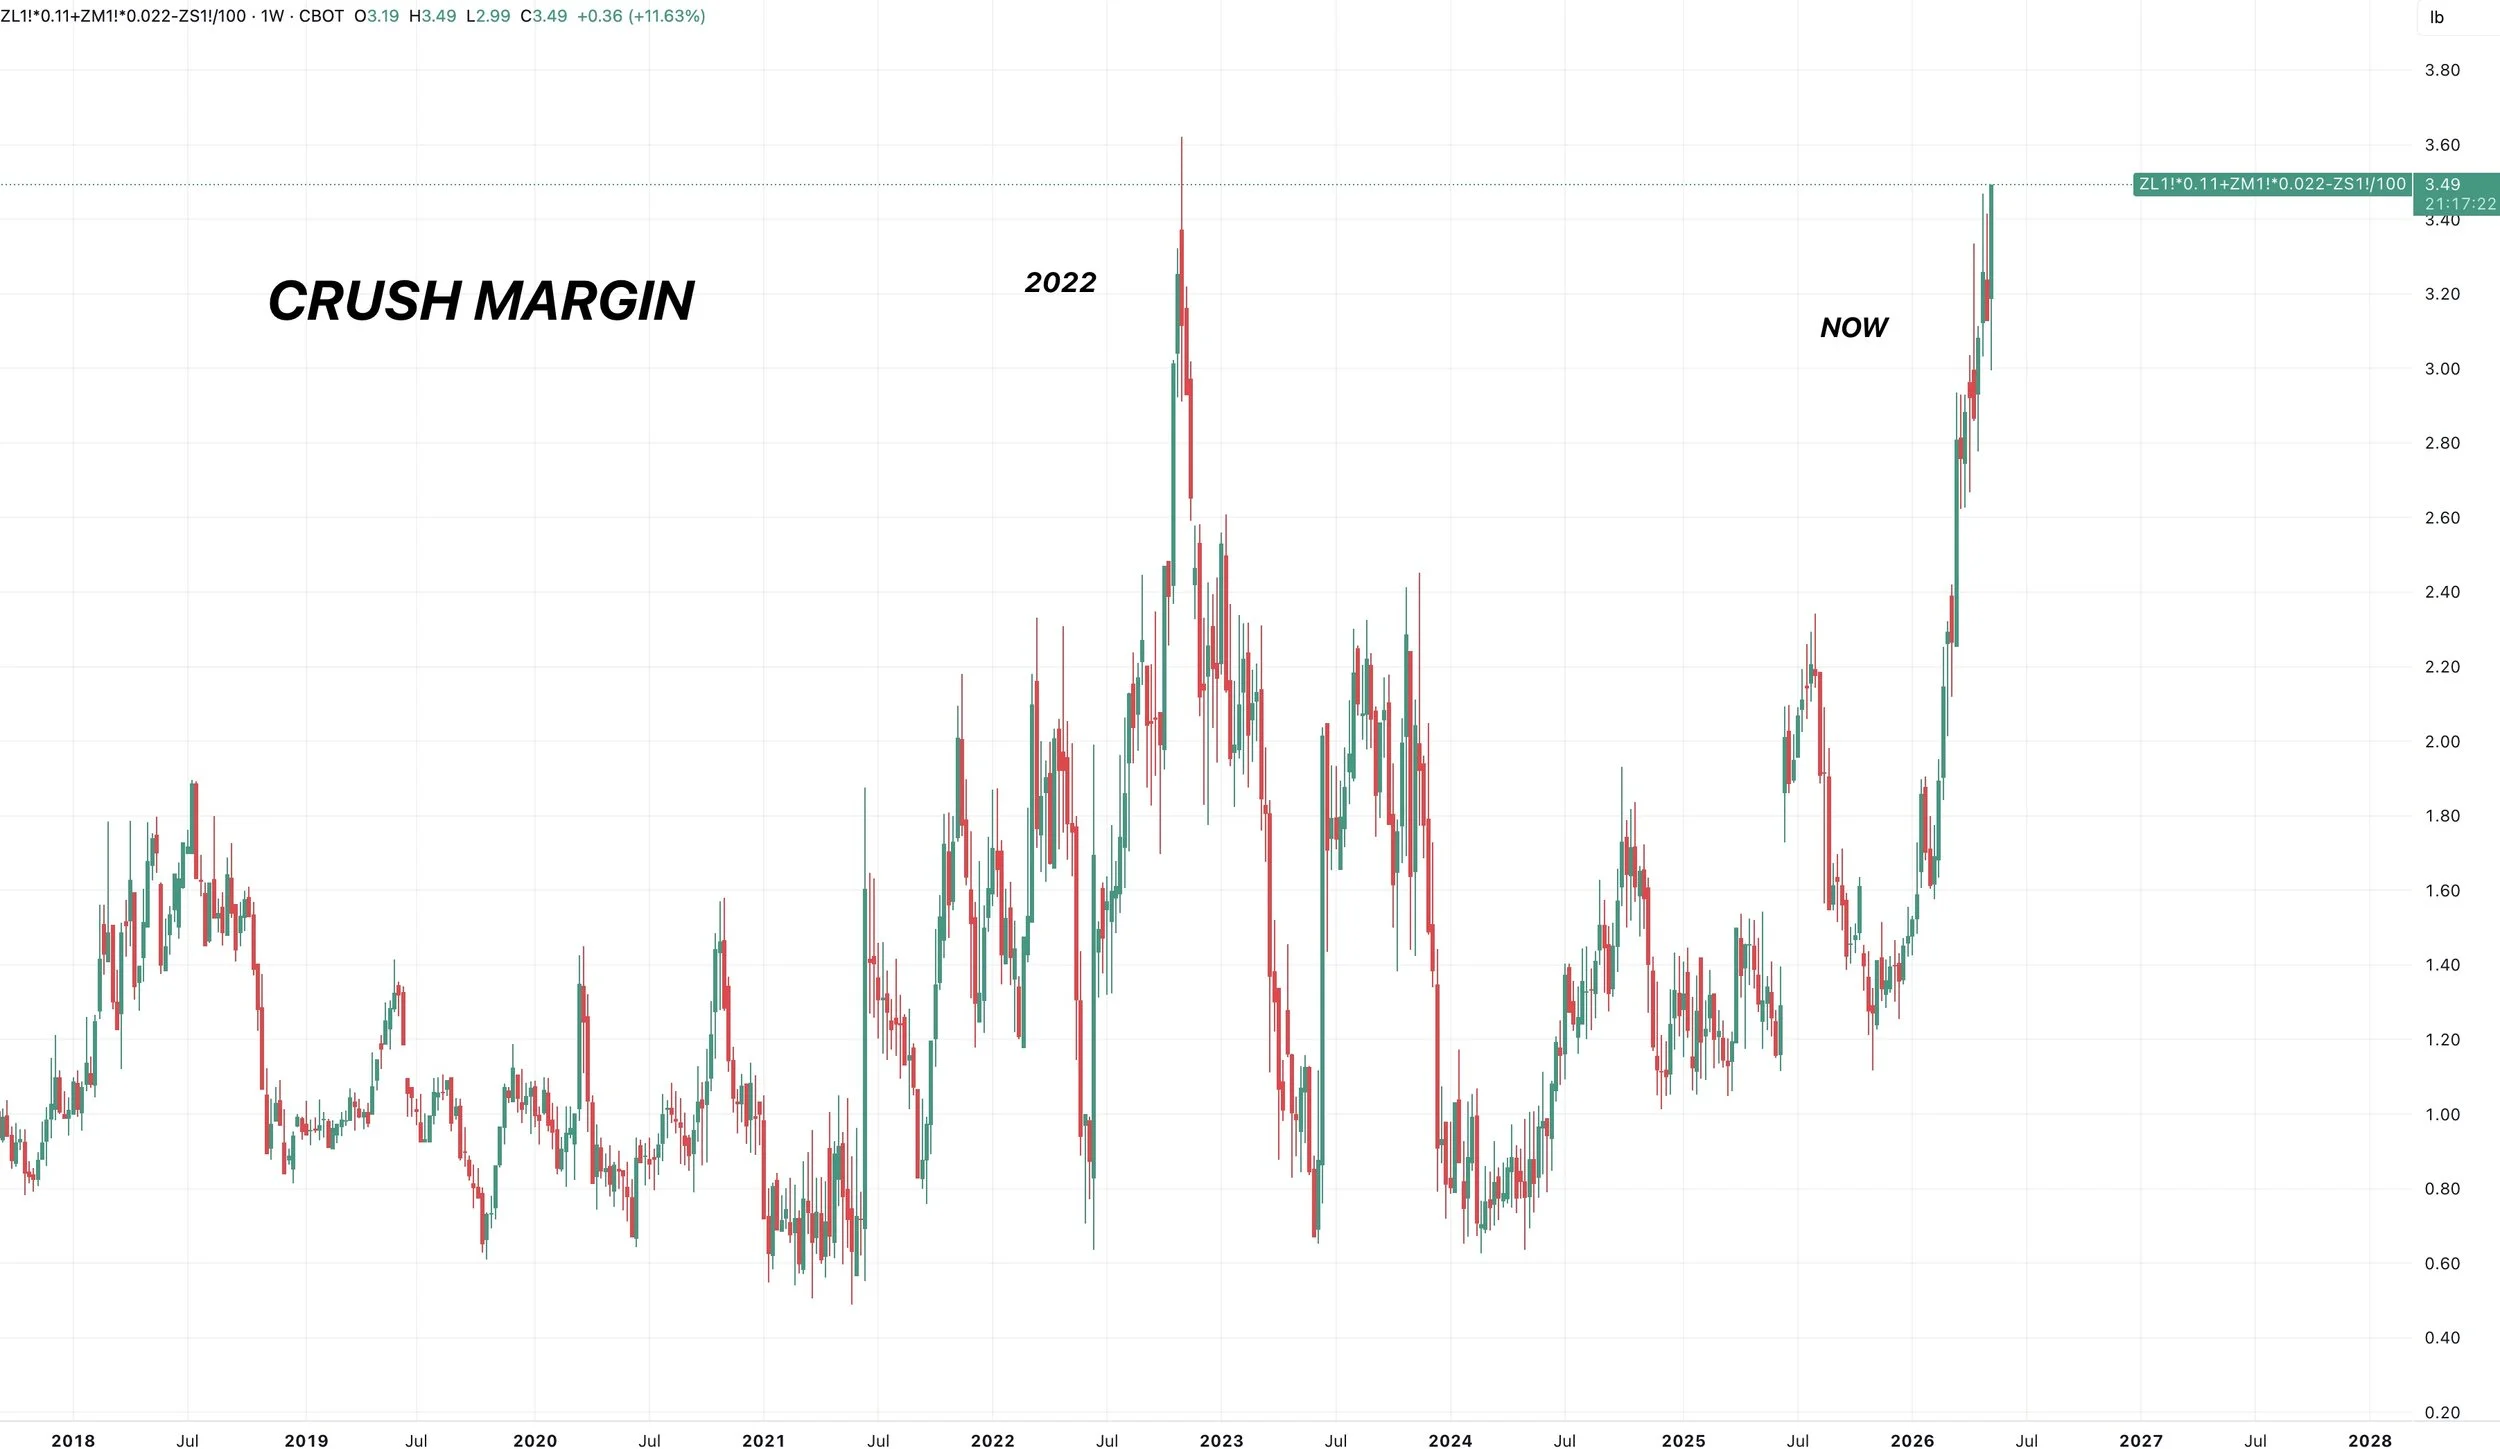
I mean look at crush margins.
They're at an all-time high.
Posting a new high for the move today.
That's not bearish for soybean demand.
This doesn’t mean soybeans have to "go to the moon" and can’t go lower from here, but it should keep some nice support beneath this market moving forward.
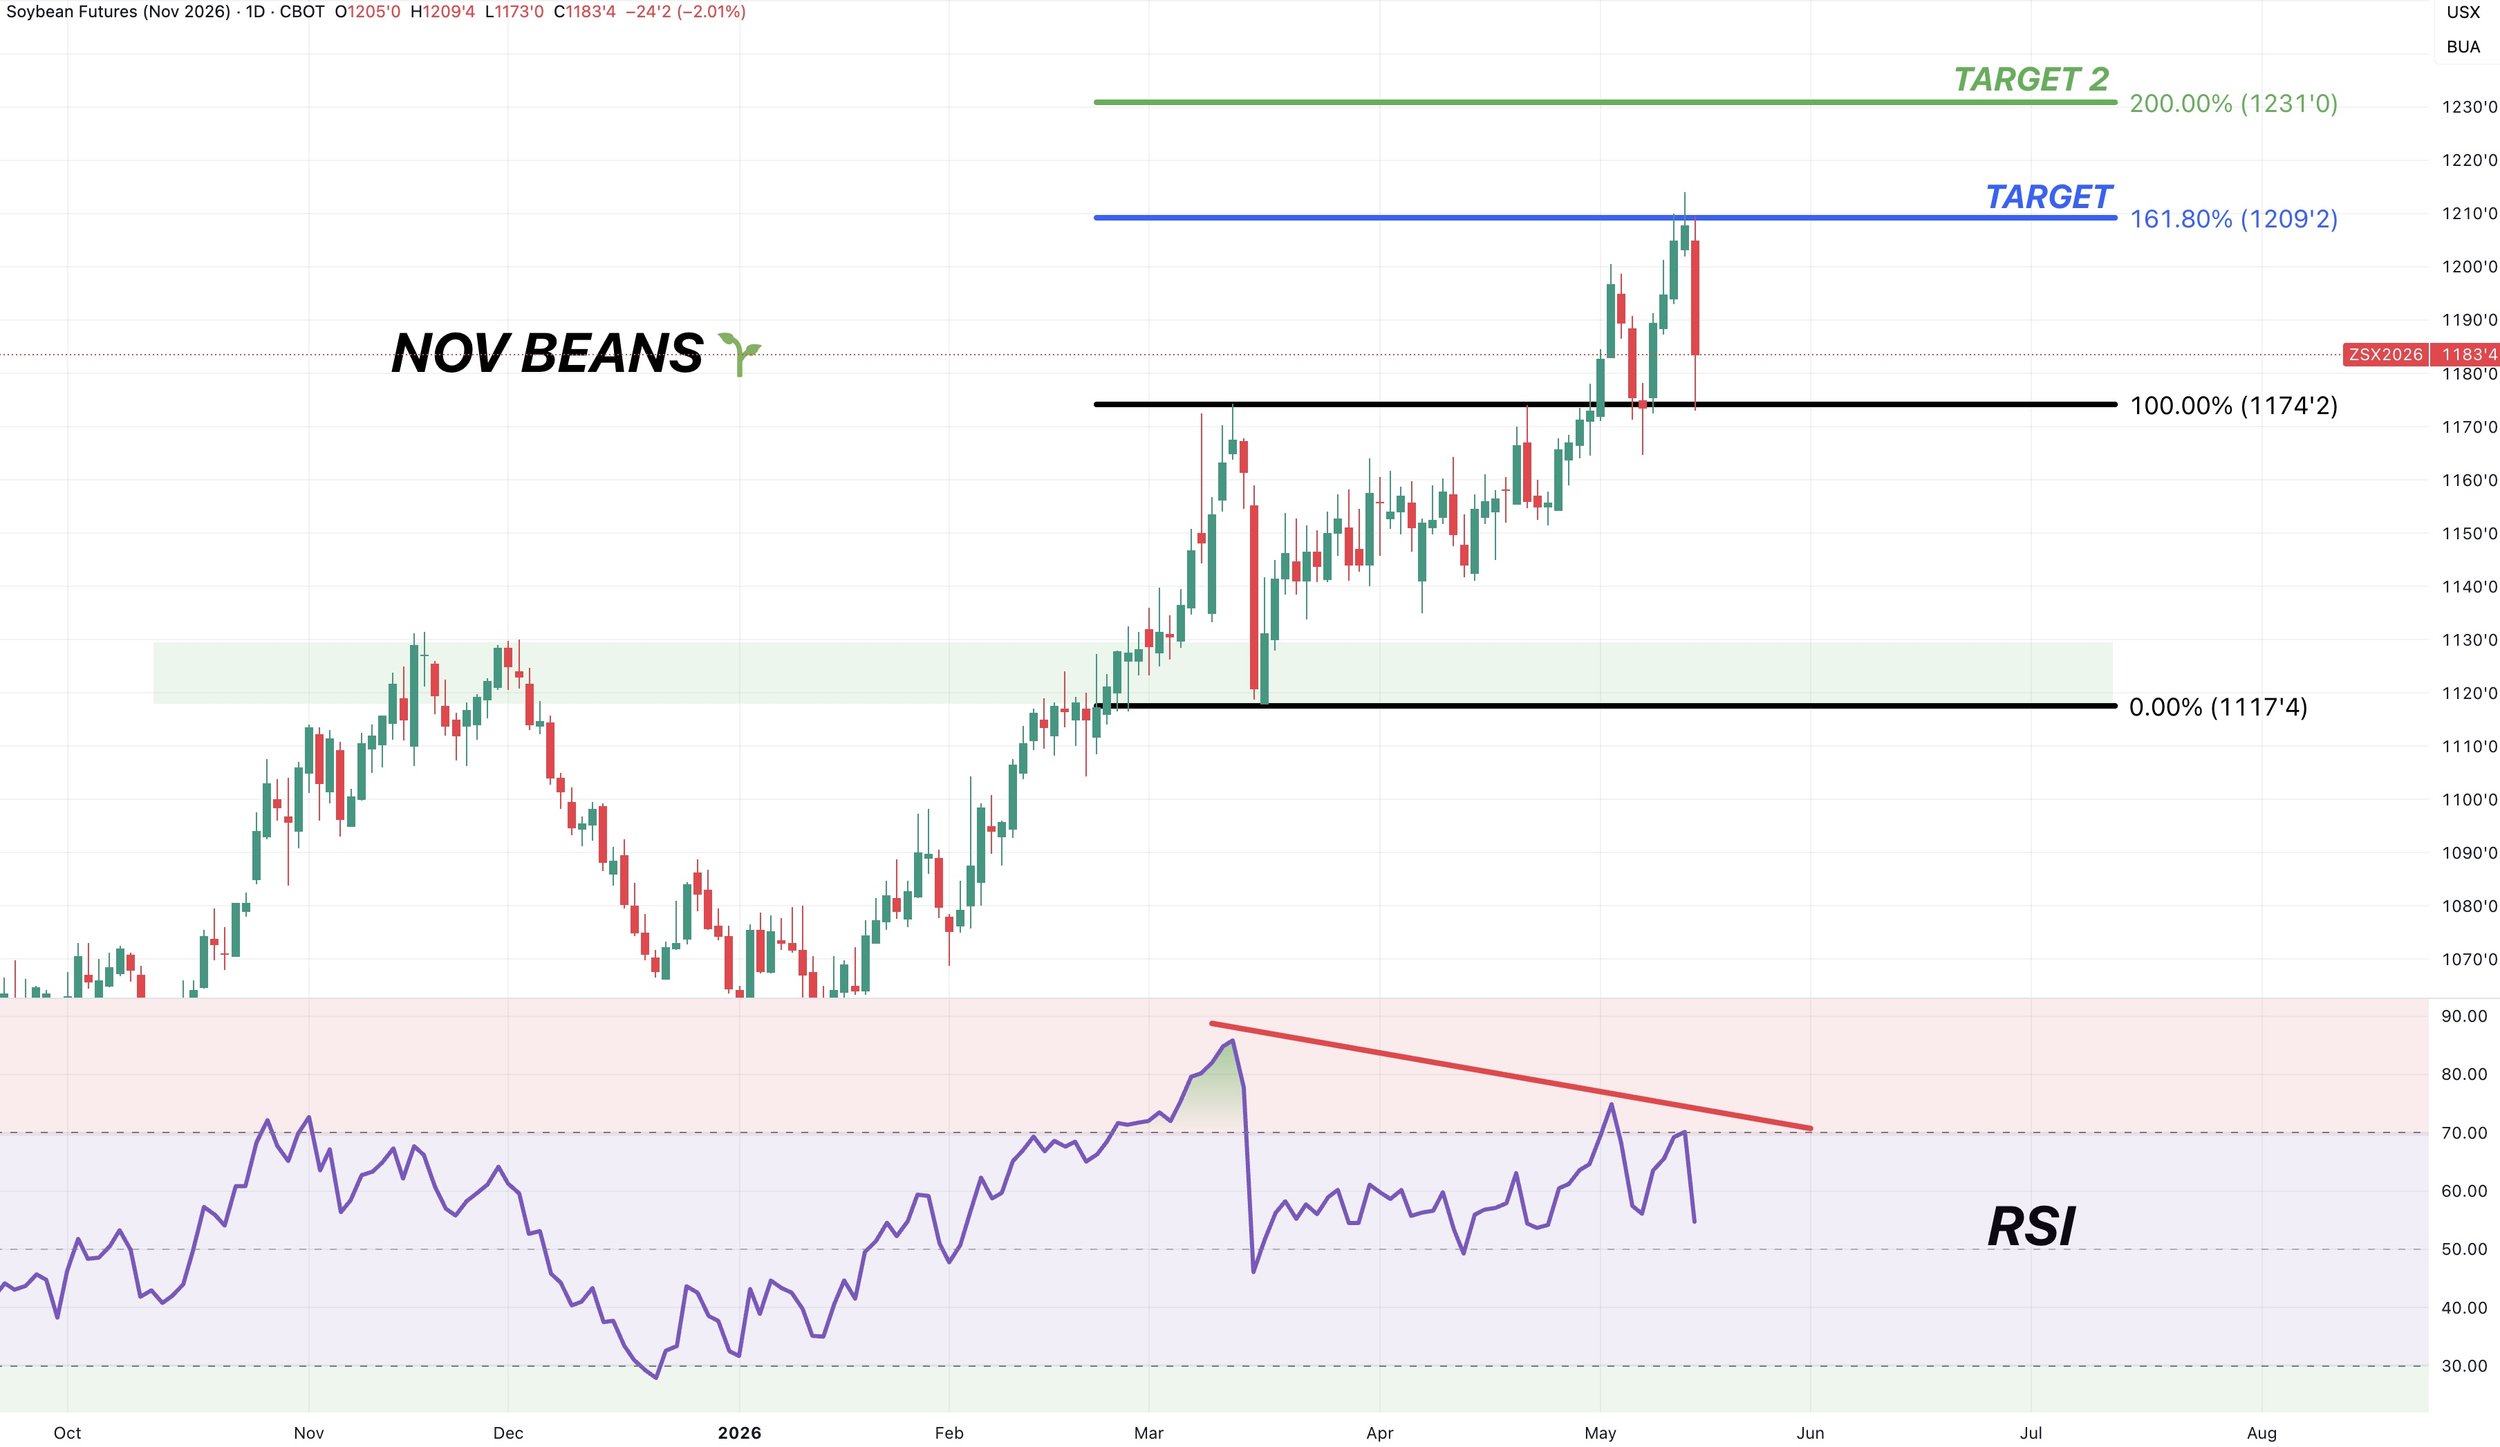
Nov Beans Chart:
The China meeting was the surprise, but there were some signs on the charts and reasonings behind Tuesday's sell signal and hedge alert.
For starters we hit the golden fib.
Which equaled 161.8% of the March lows up to the March highs. A common continuation target.
At the same time, we were showing some bearish divergence on the RSI. As prices were pushing higher posting new highs, meanwhile the RSI was not.
It was simply a sign momentum could start to slow.
Of course a surprise announcement could’ve pushed us higher. But sometimes it feels like the charts can tell us a story before we know the news.
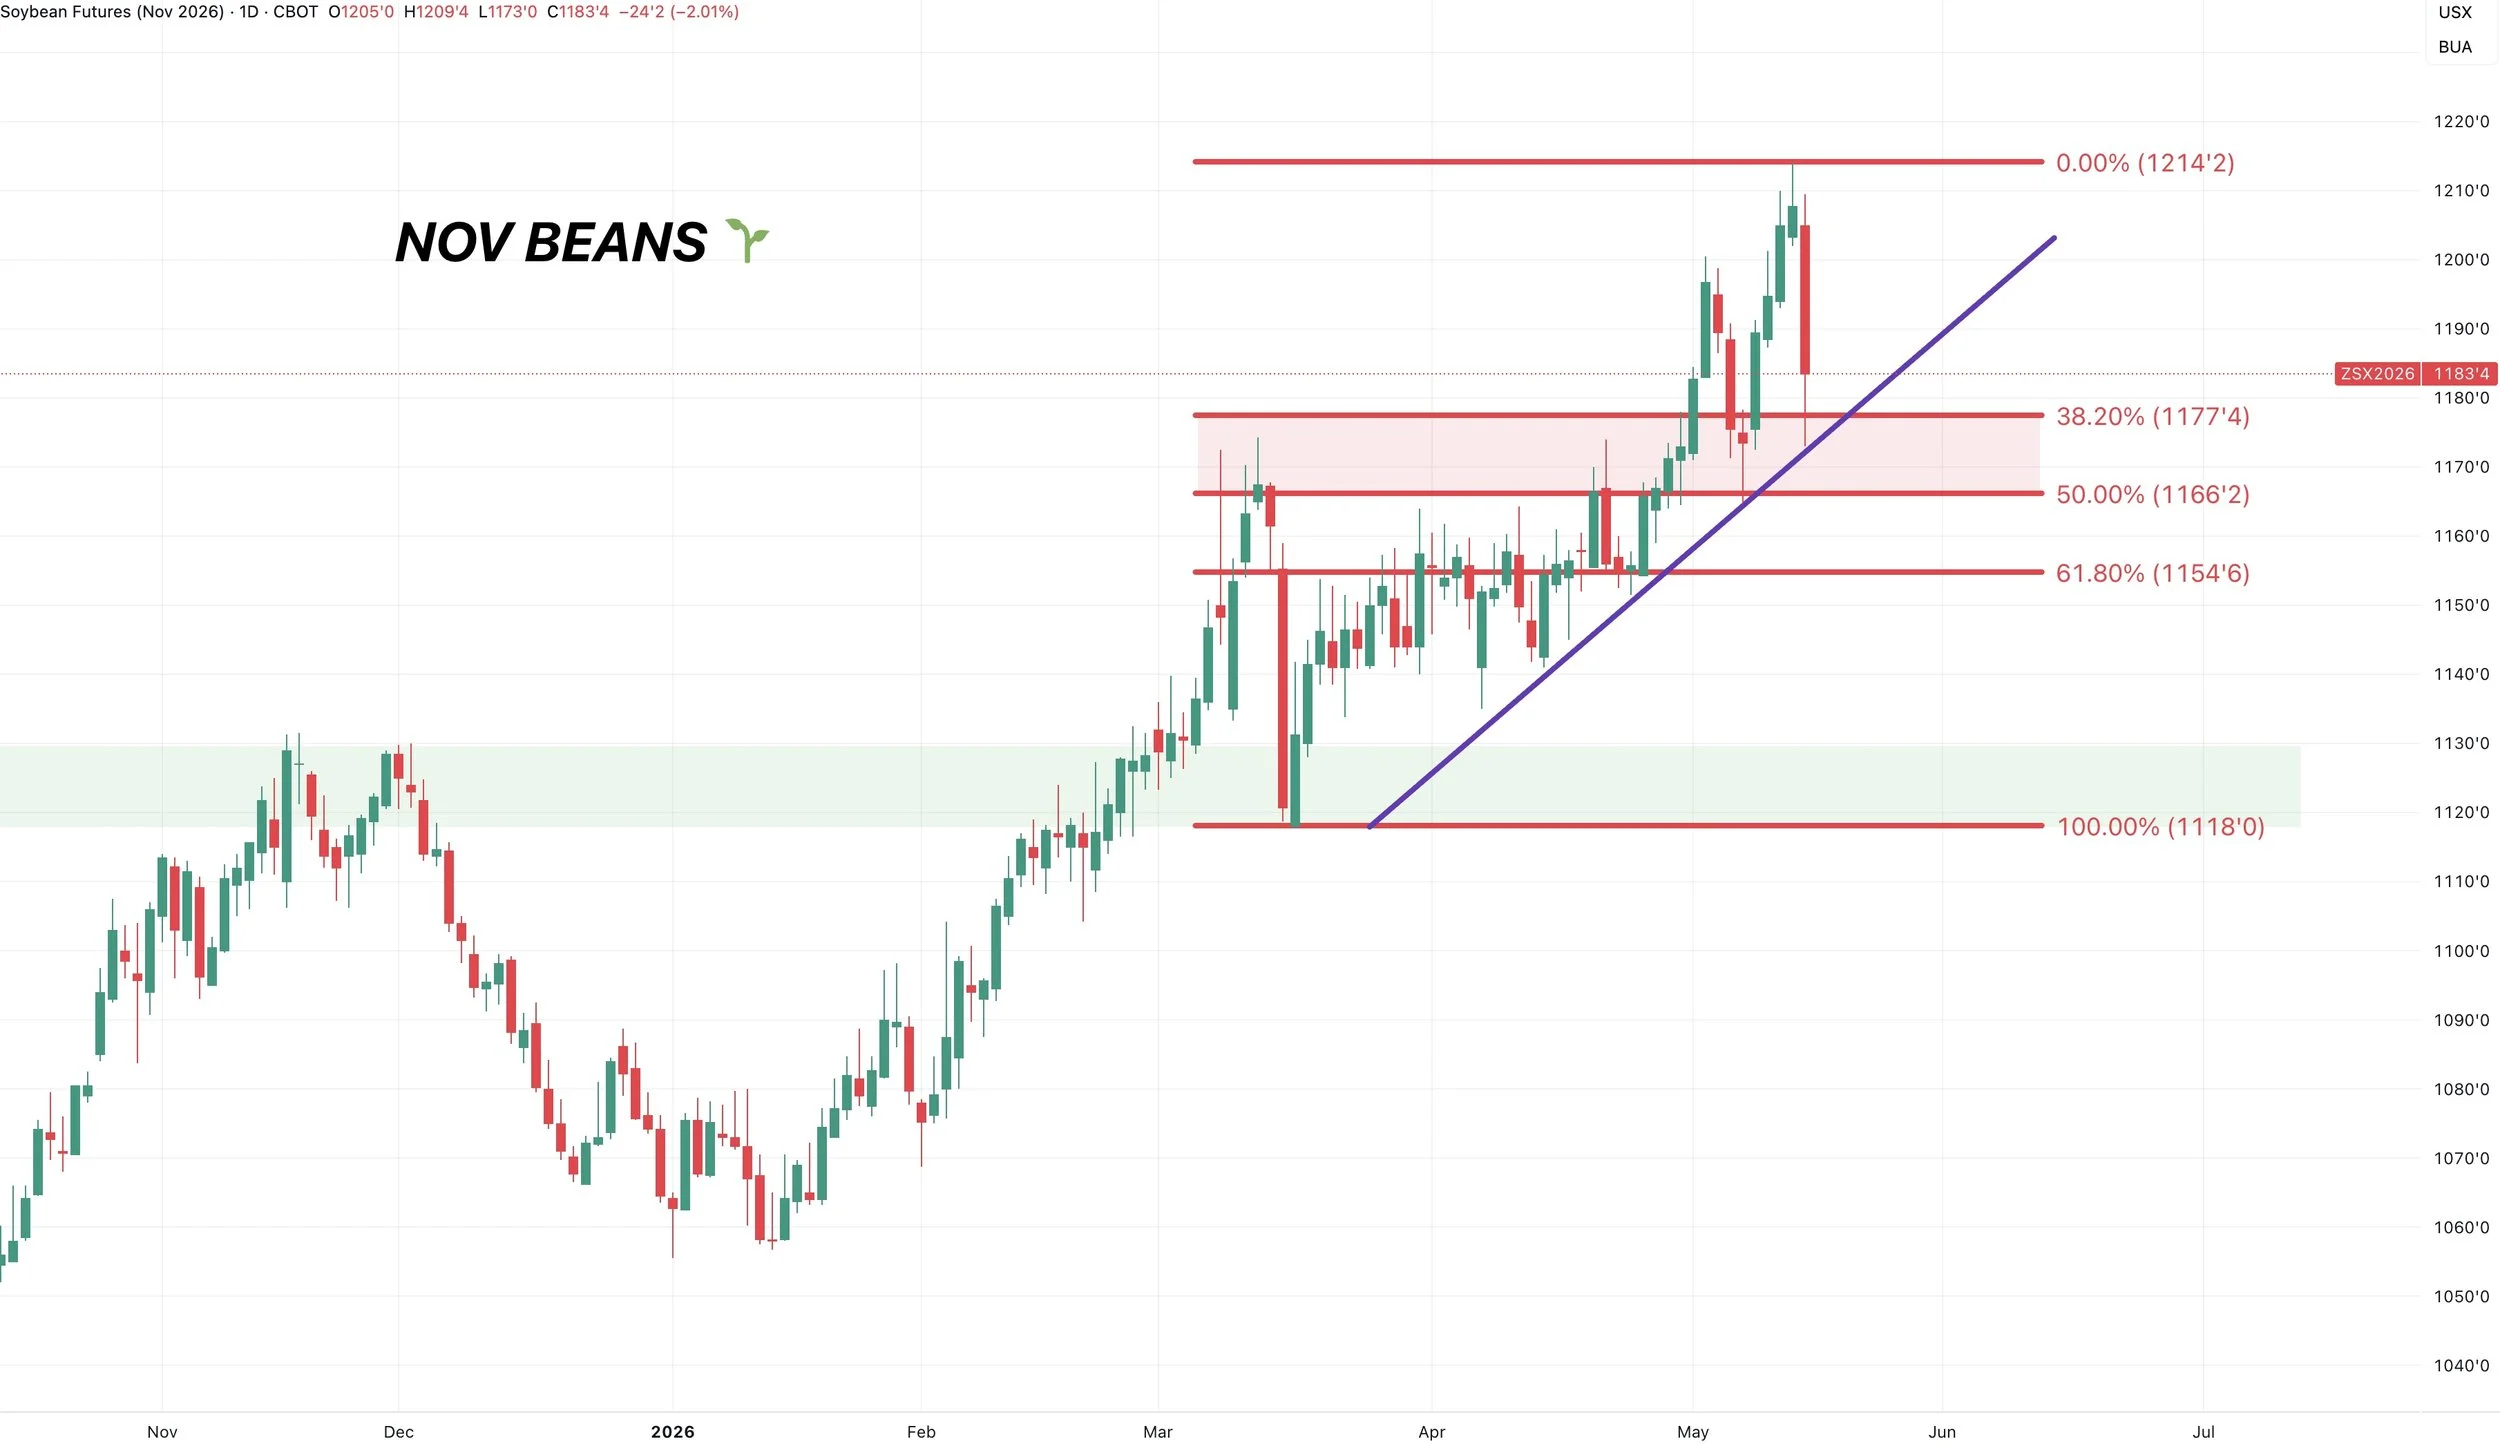
Now what?
It was actually decent action in new crop beans despite being down 20 cents. As we closed around a dime off the lows and held support.
We did not cause any serious damage on the charts.
The big picture trend in this market remains higher unless we break below $11.55. That gives back 61.8% of the entire rally. If you break below that, it tells us this is no longer a normal pullback.
Today we held trendline support.
We are also attempting to turn that old resistance into new support.
Normally, we look at the golden zone. Which I'll show in July beans here in a second.
However, in a strong market, the 38.2% to 50% levels can be more common.
Those retracement levels also line up with that prior resistance.
So if we are going to find some life, this is an area I'd expect us to do so.
A decent sell-off today, but the chart is far from broken.
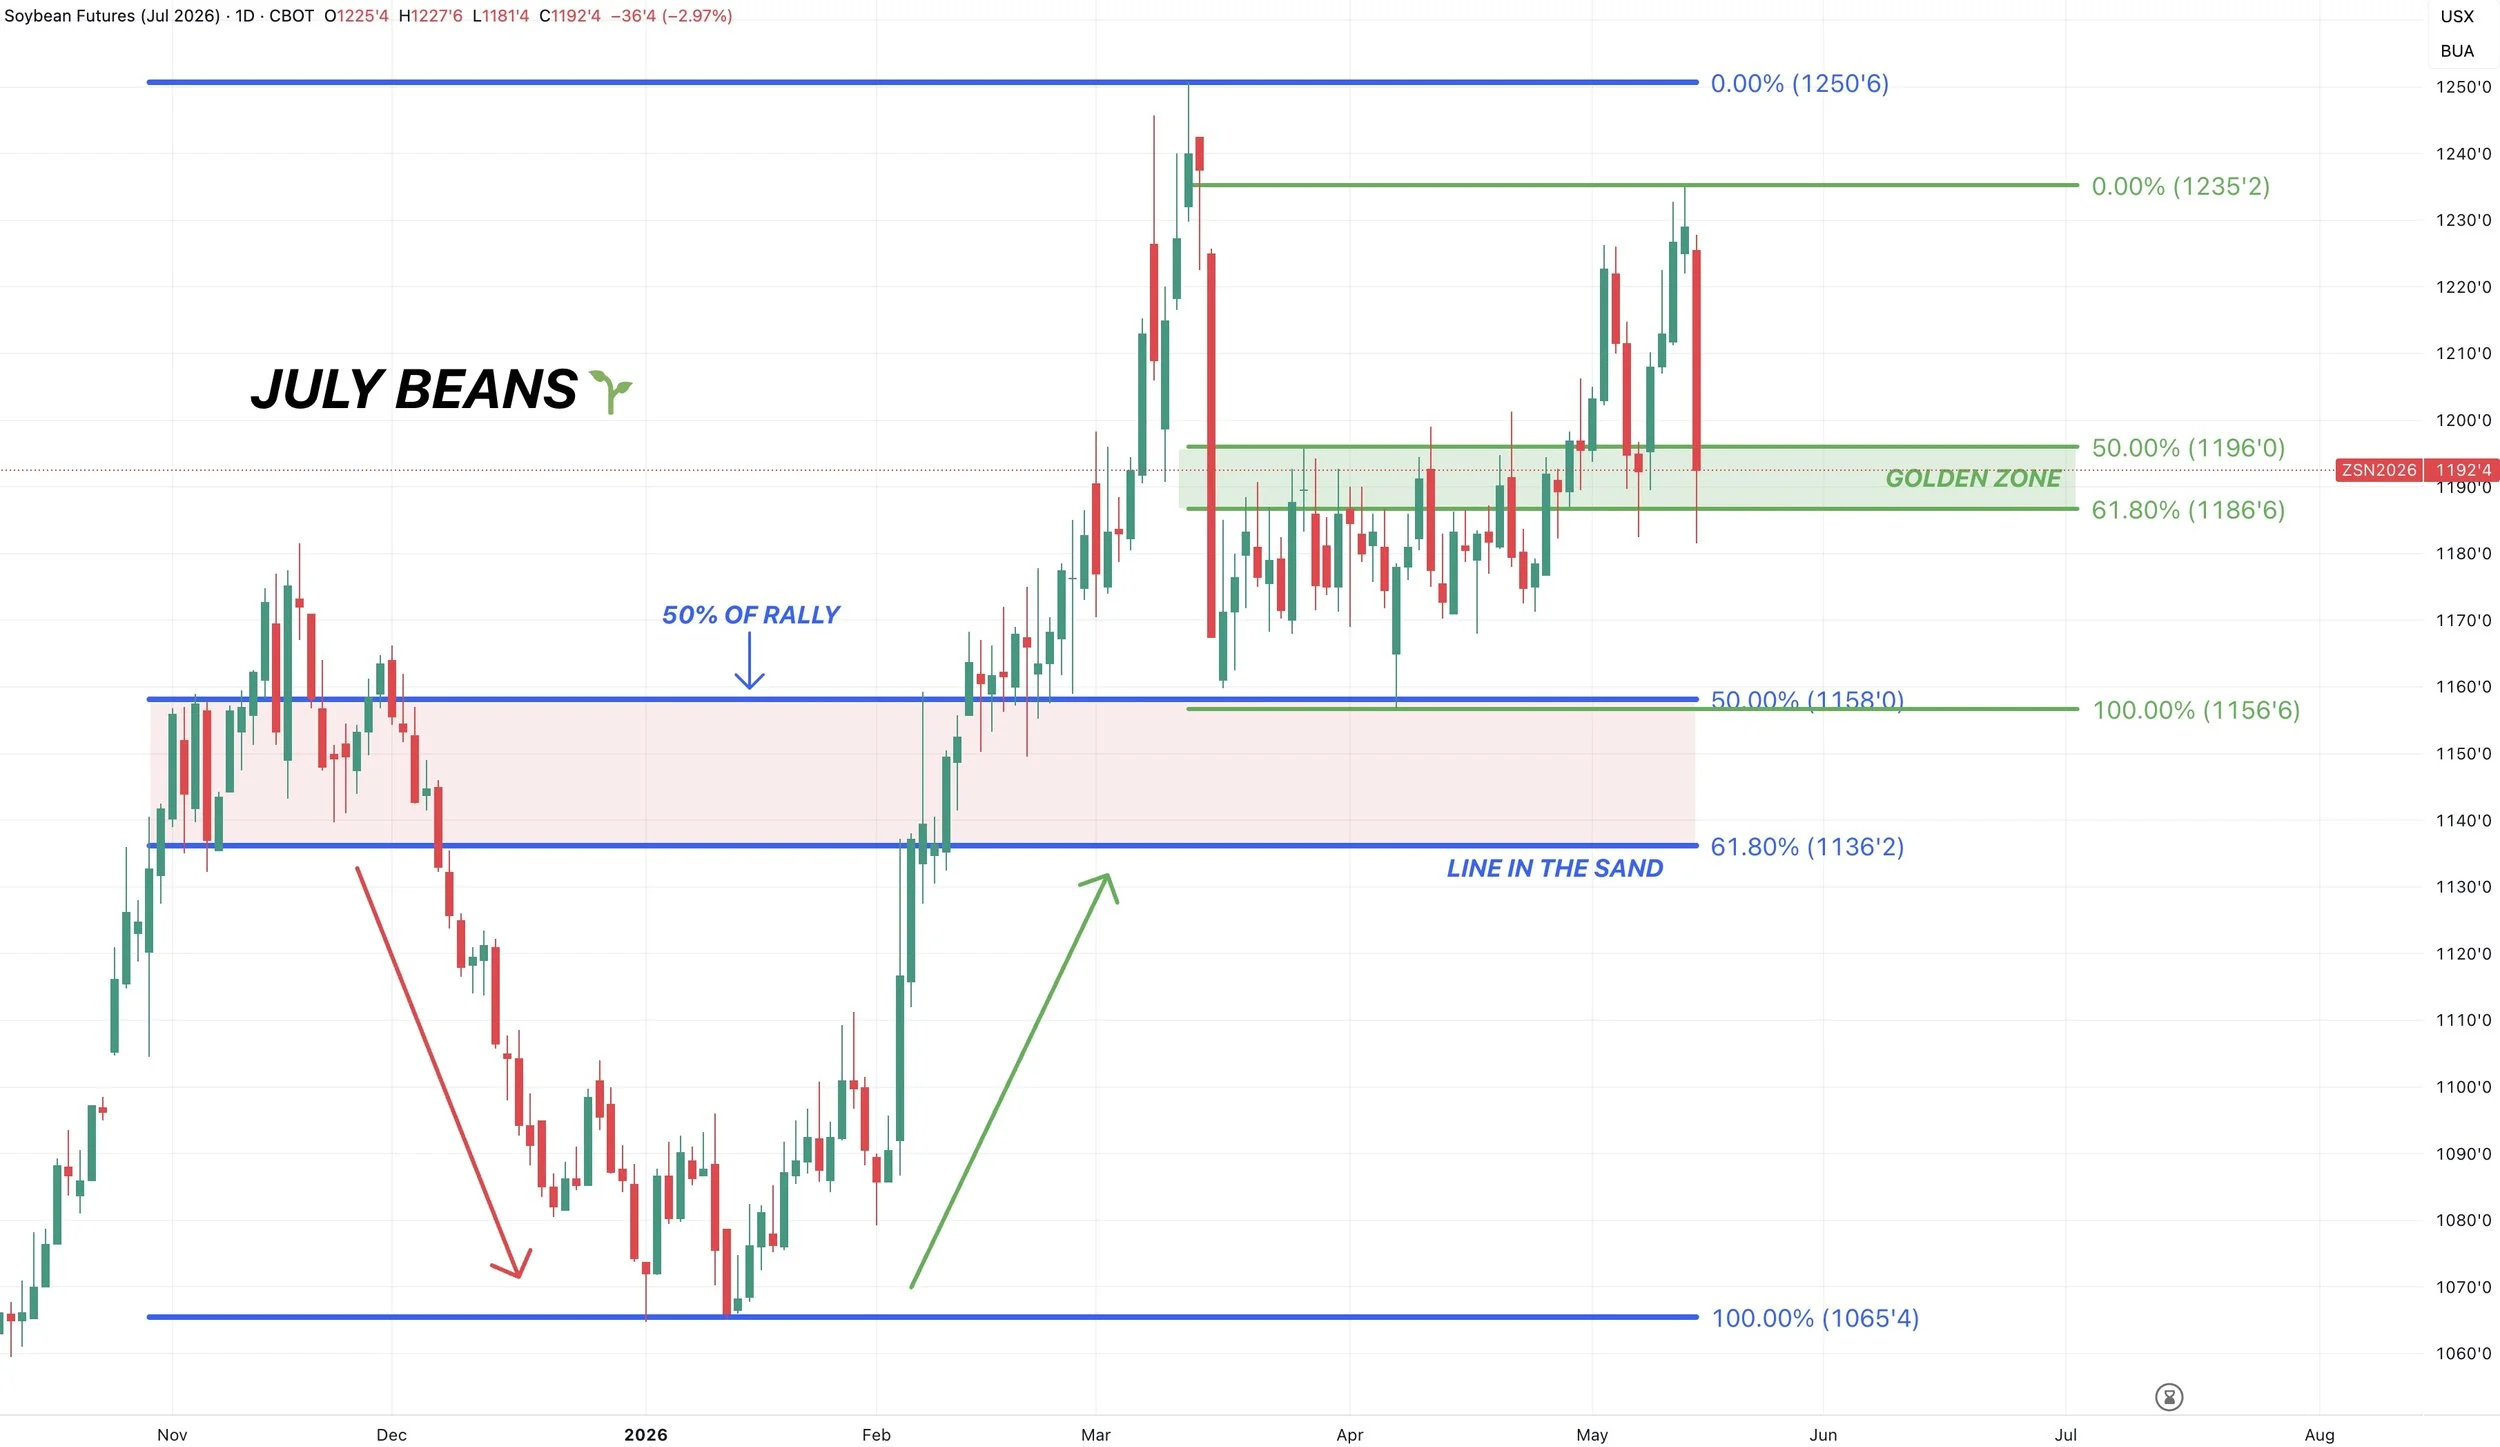
July Beans Chart:
Here is why that 38.2% to 50% level could offer support in Nov beans.
Because July beans are in the golden zone (50% to 61.8%).
The most common retracement levels and where the market often tells us if this is a normal pullback or if the market is truly starting to fall apart.
Today was a nasty sell off no doubt.
But we held that 61.8% level. Which is also old resistance from that old brutal range and where we just bottomed last week.
HOWEVER, if we break below today's lows it could very well open the door lower and we could head towards the red box. As breaking below here would not be a good sign and often indicate we are rolling over.
It's too early to say "it's over" when we are simply sitting at support.
But tomorrow’s price action will be very important.
Do the funds step back in here or are they actually starting to puke?
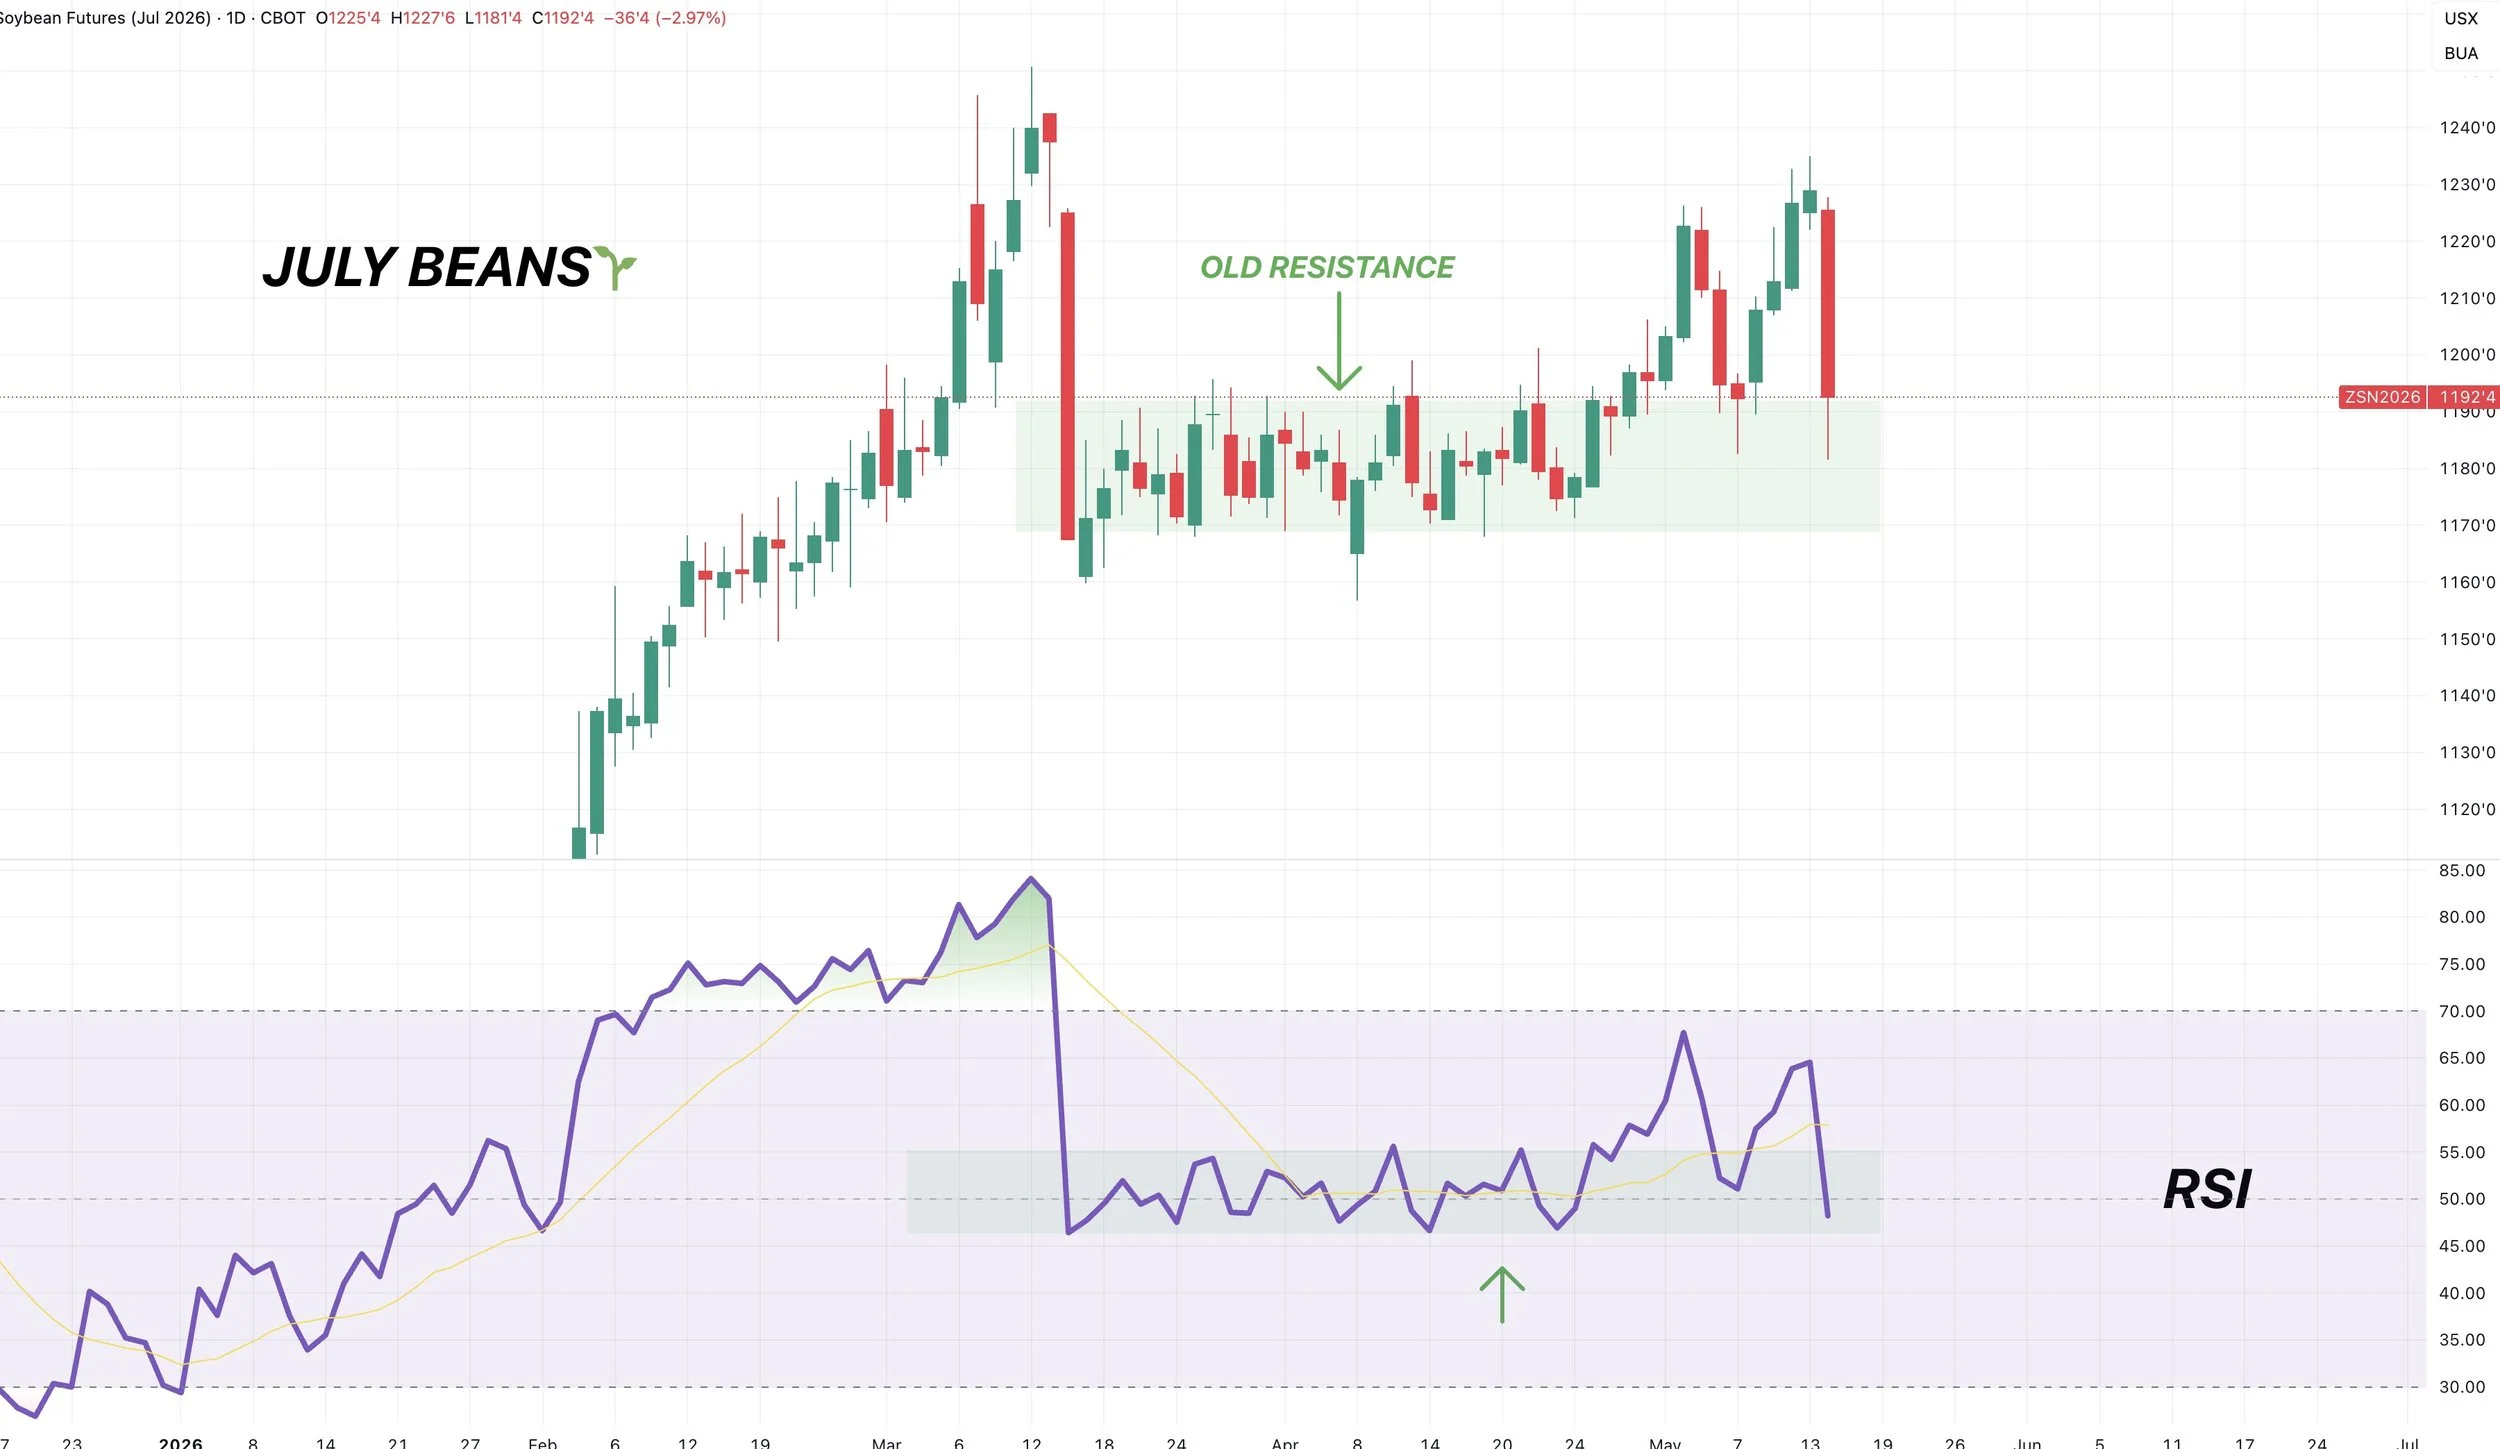
RSI at Support:
If we look at the RSI, it has some clear support that it is still holding as well.
However, we need a bounce soon to prevent it from making a leg lower.
RSI stands for "relative strength indicator".
So if the RSI breaks support, it could be a sign this market is losing strength.
Wheat
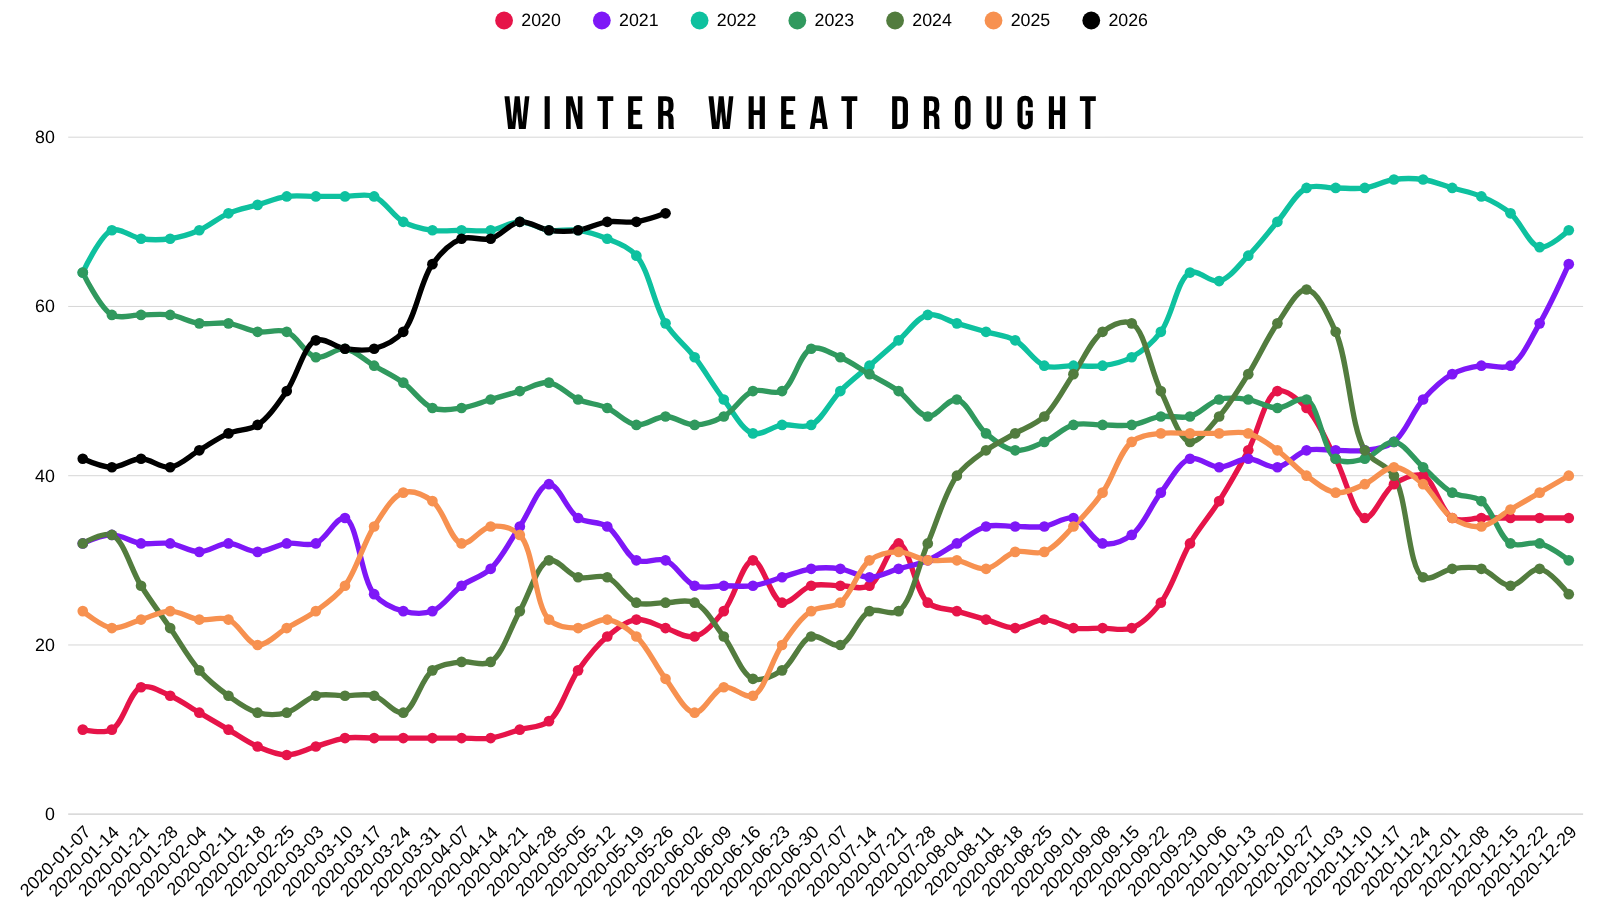
The drought udpate came in.
Winter wheat areas in drought are sitting at 71%.
That would be a record.
Surpassing the previous record set back in 2022.
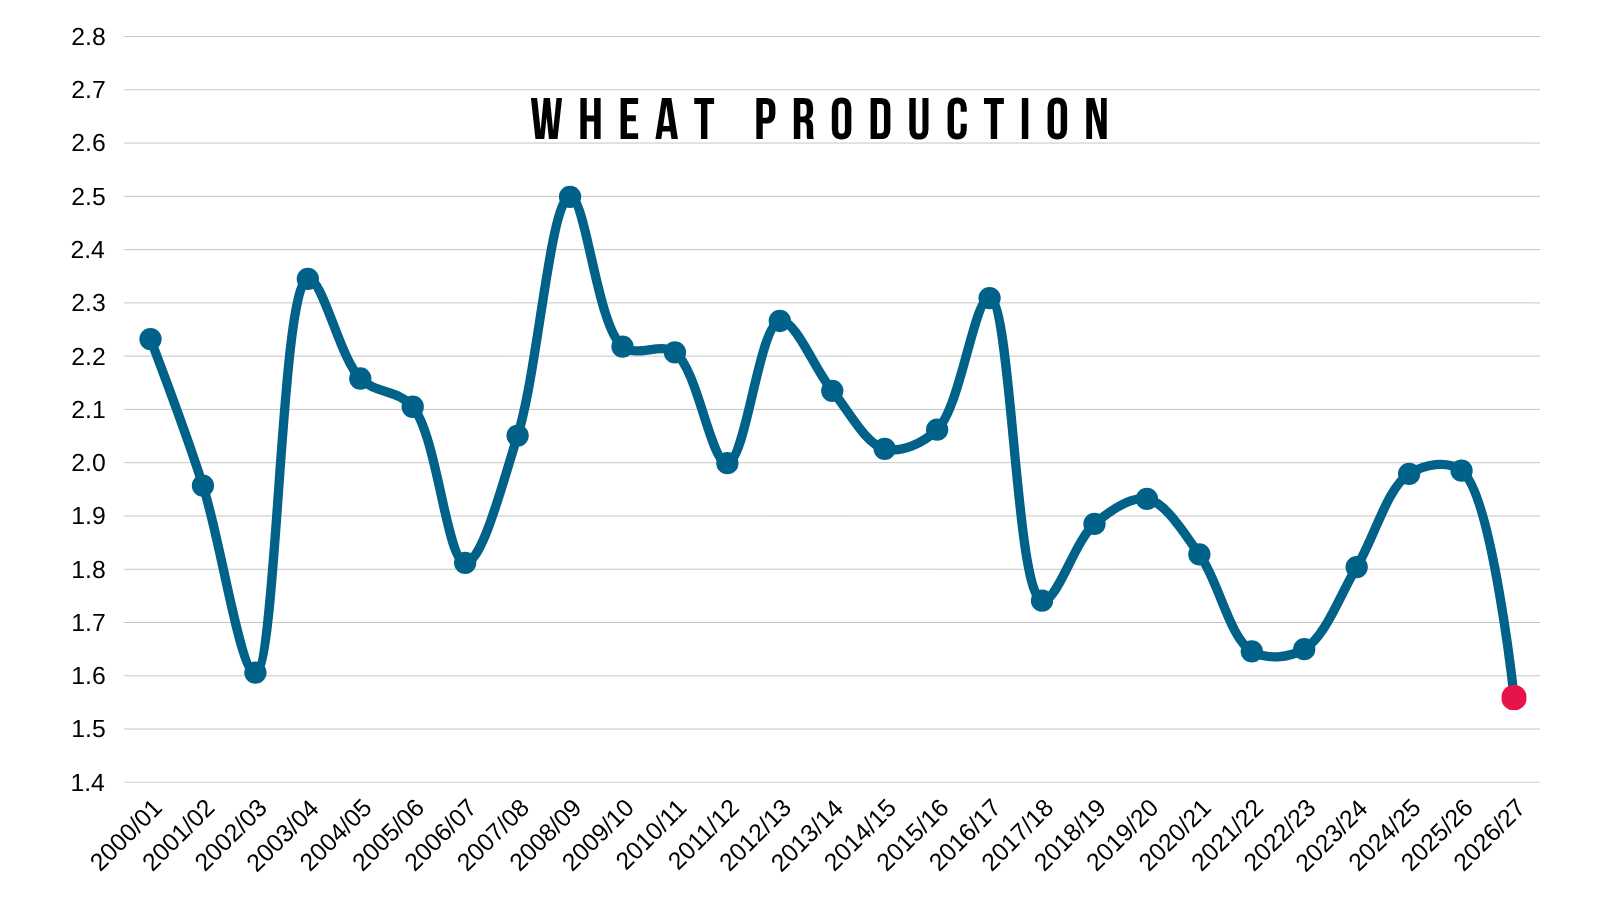
US wheat production is expected to come in at it's lowest levels ever.
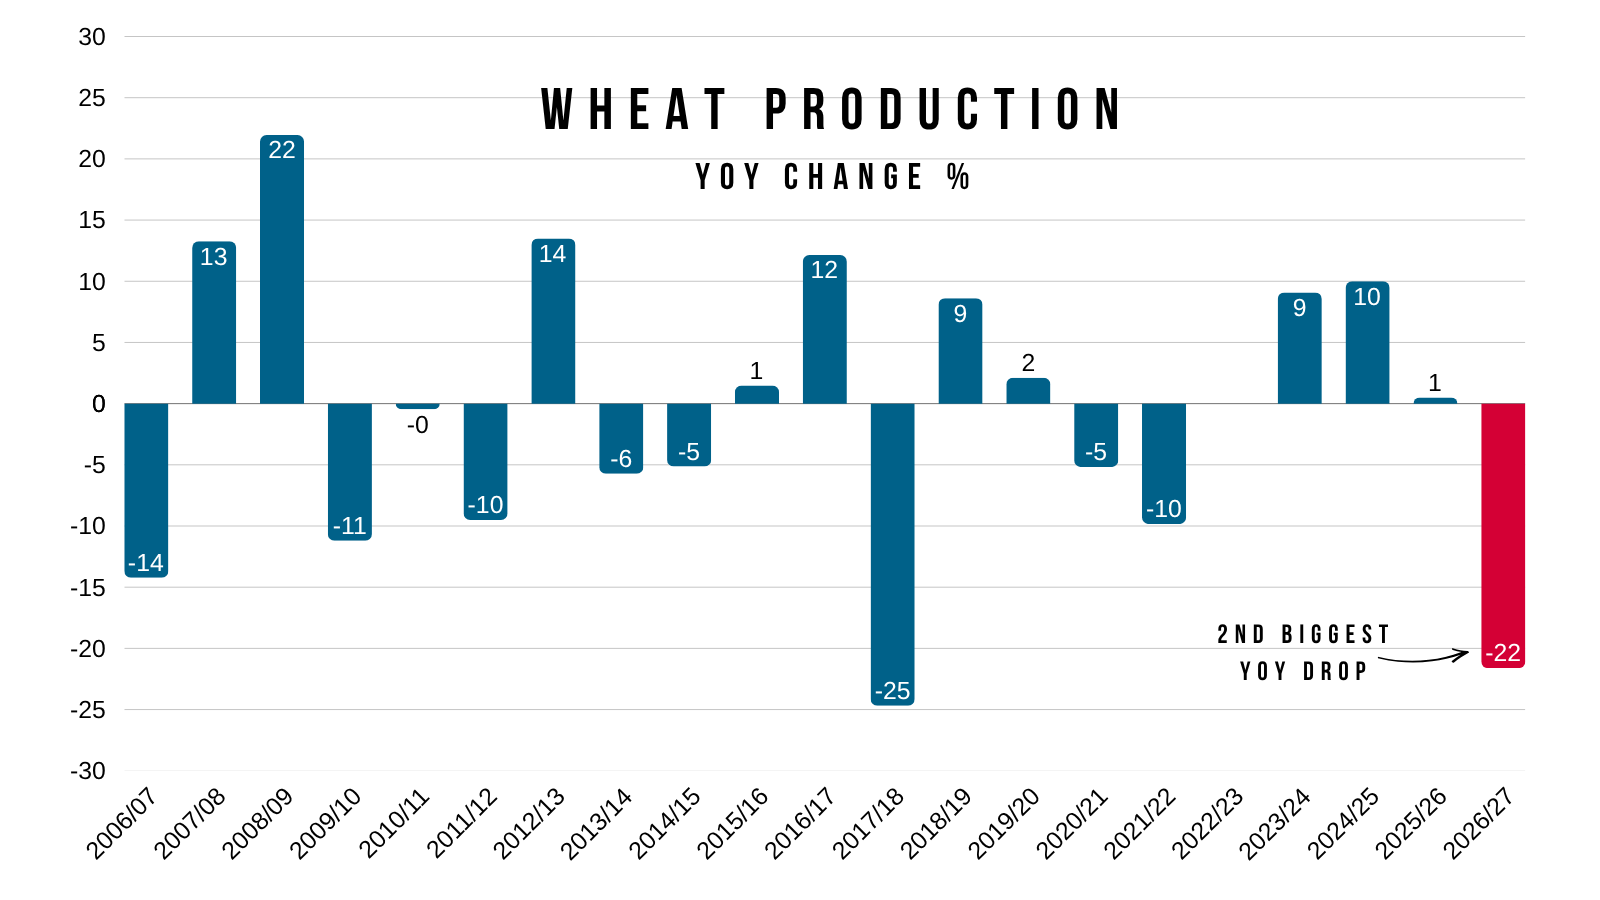
Production is expected to be down -22% vs last year.
If realized, that would be the 2nd largest year over year drop ever.
The only bigger drop we've seen came from 2017 to 2018.
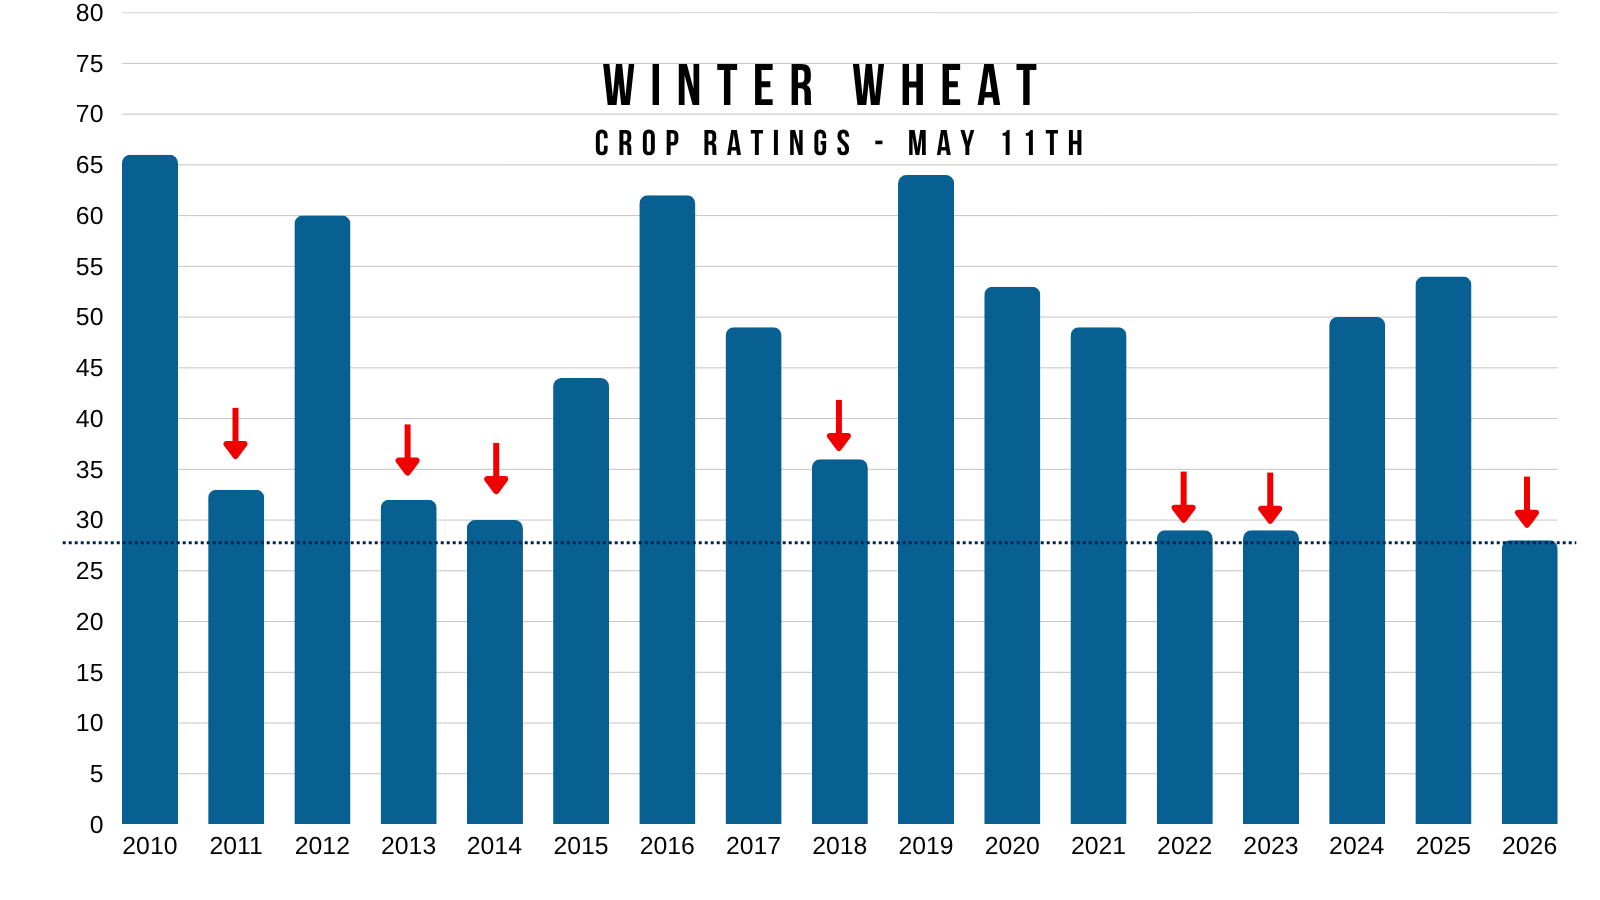
National crop ratings are their worst ever.
This is without even simply diving into just the HRW states where the concerns only grow.
Yes, you can argue that wheat is more of a global crop than corn for example.
So a disaster of a crop here in the US doesn’t make as large of an impact. That is a valid argument.
Short term, this market could've very well priced in this drought story completely. As the crop is about as bad as it can get.
Which is why we've said if you are someone who has to move wheat, it makes sense to reward this market or defend these levels.
However, long term it feels like the world story is being under played.
Sure, you can argue globally we aren’t short on wheat.
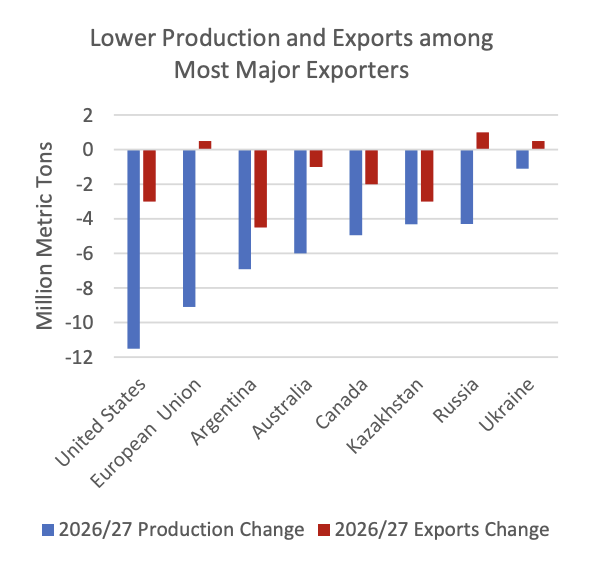
But in the recent USDA report, every single major exporter of wheat is expecting production to be less than last year.
You cannot forget that the fertilizer situation is global.
Long term (I'm talking over the next year plus) it could very well cause a lasting impact.
I think it could cause a greater impact than some realize. Which is why I think wheat has long term potential.
However, short term this is the time of the year to be selling your wheat or locking in some worst case scenarios.
We did just hit a major target on the charts we've been sharing for months, which I'll touch on in a second.
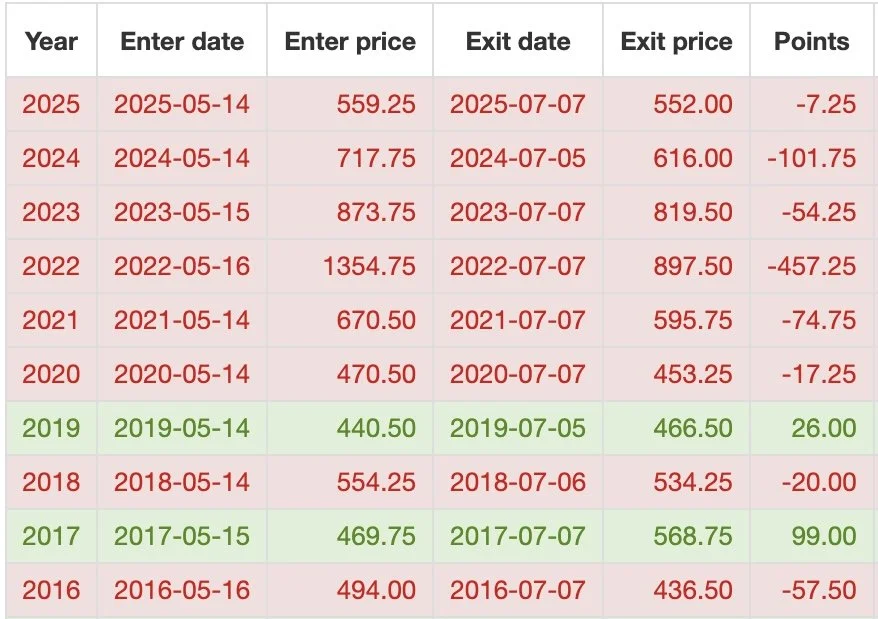
Seasonally, wheat starts to see weakness come June or July.
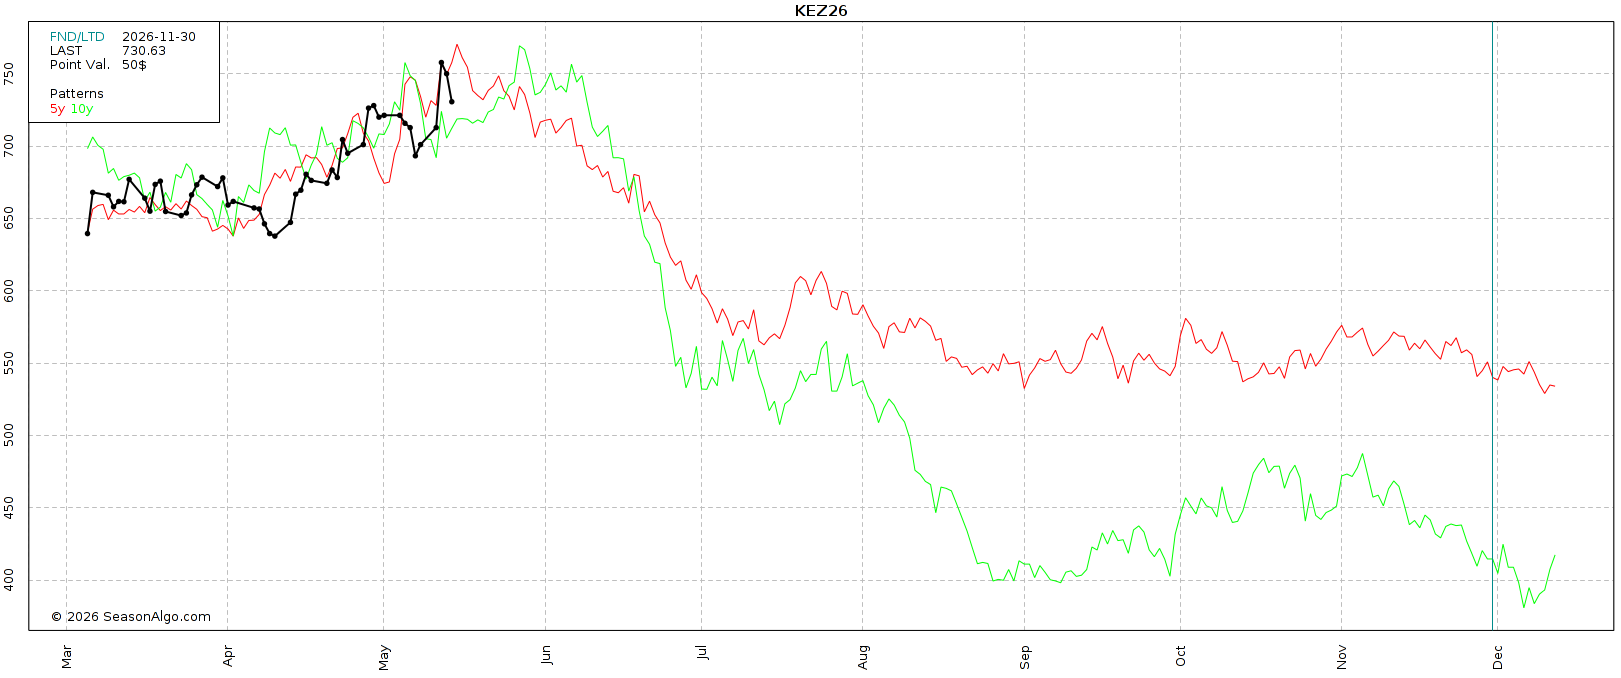
Just to give you a reference.
KC wheat has been lower from today by the 4th of July weekend the last 6 years in a row.
Lower the last 8 of 10 years.
So if you have to market wheat, we usually want to do it here soon.
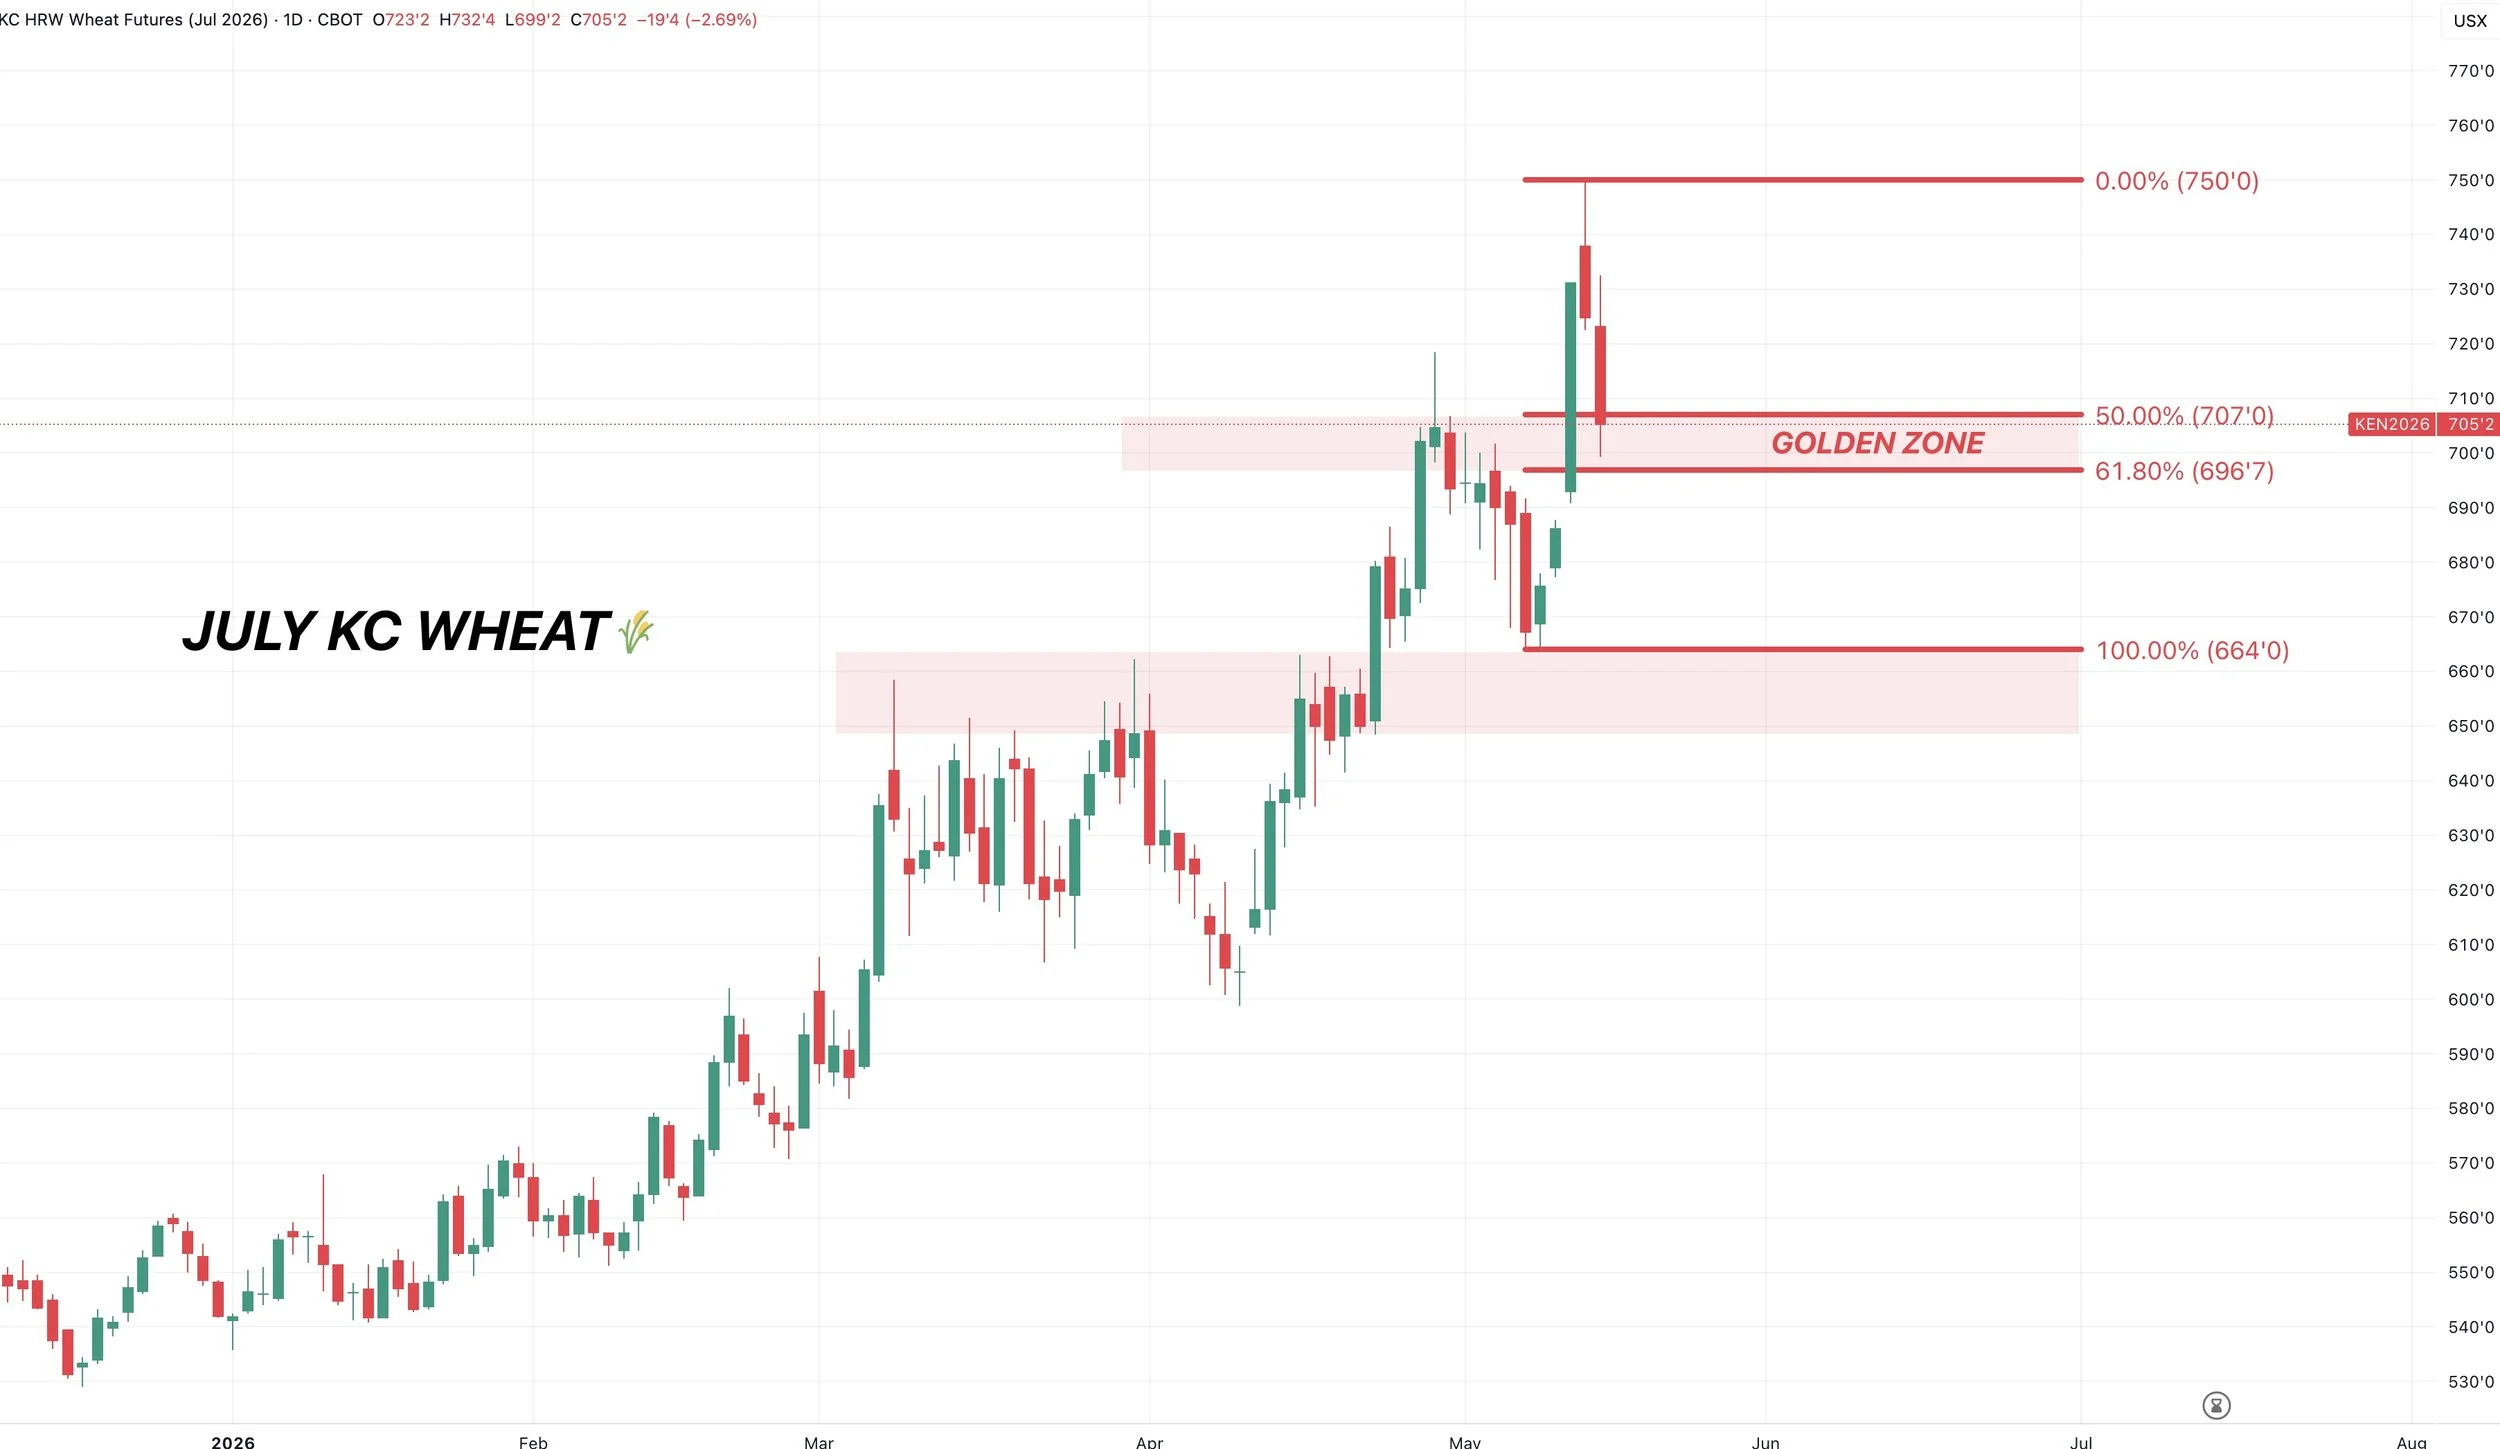
July KC Chart: $7.50 Target Hit
Our targets were:
1) $7.00
2) $7.50
We have been sharing these targets for a very long time. Yesterday we hit $7.50 before closing over 20 cents off the highs.
That target was hit in the overnight session, so we were not able to get out a signal before the market had already given back the gains.
This is why having targets can often times be a good thing, as markets can move fast.
Why was this the target?
It was the contract highs.
It was also the golden fib. Meaning it was 161.8% of the recent lows up to those April highs. Like that target in Nov beans, it is a common continuation target often in a strong market.
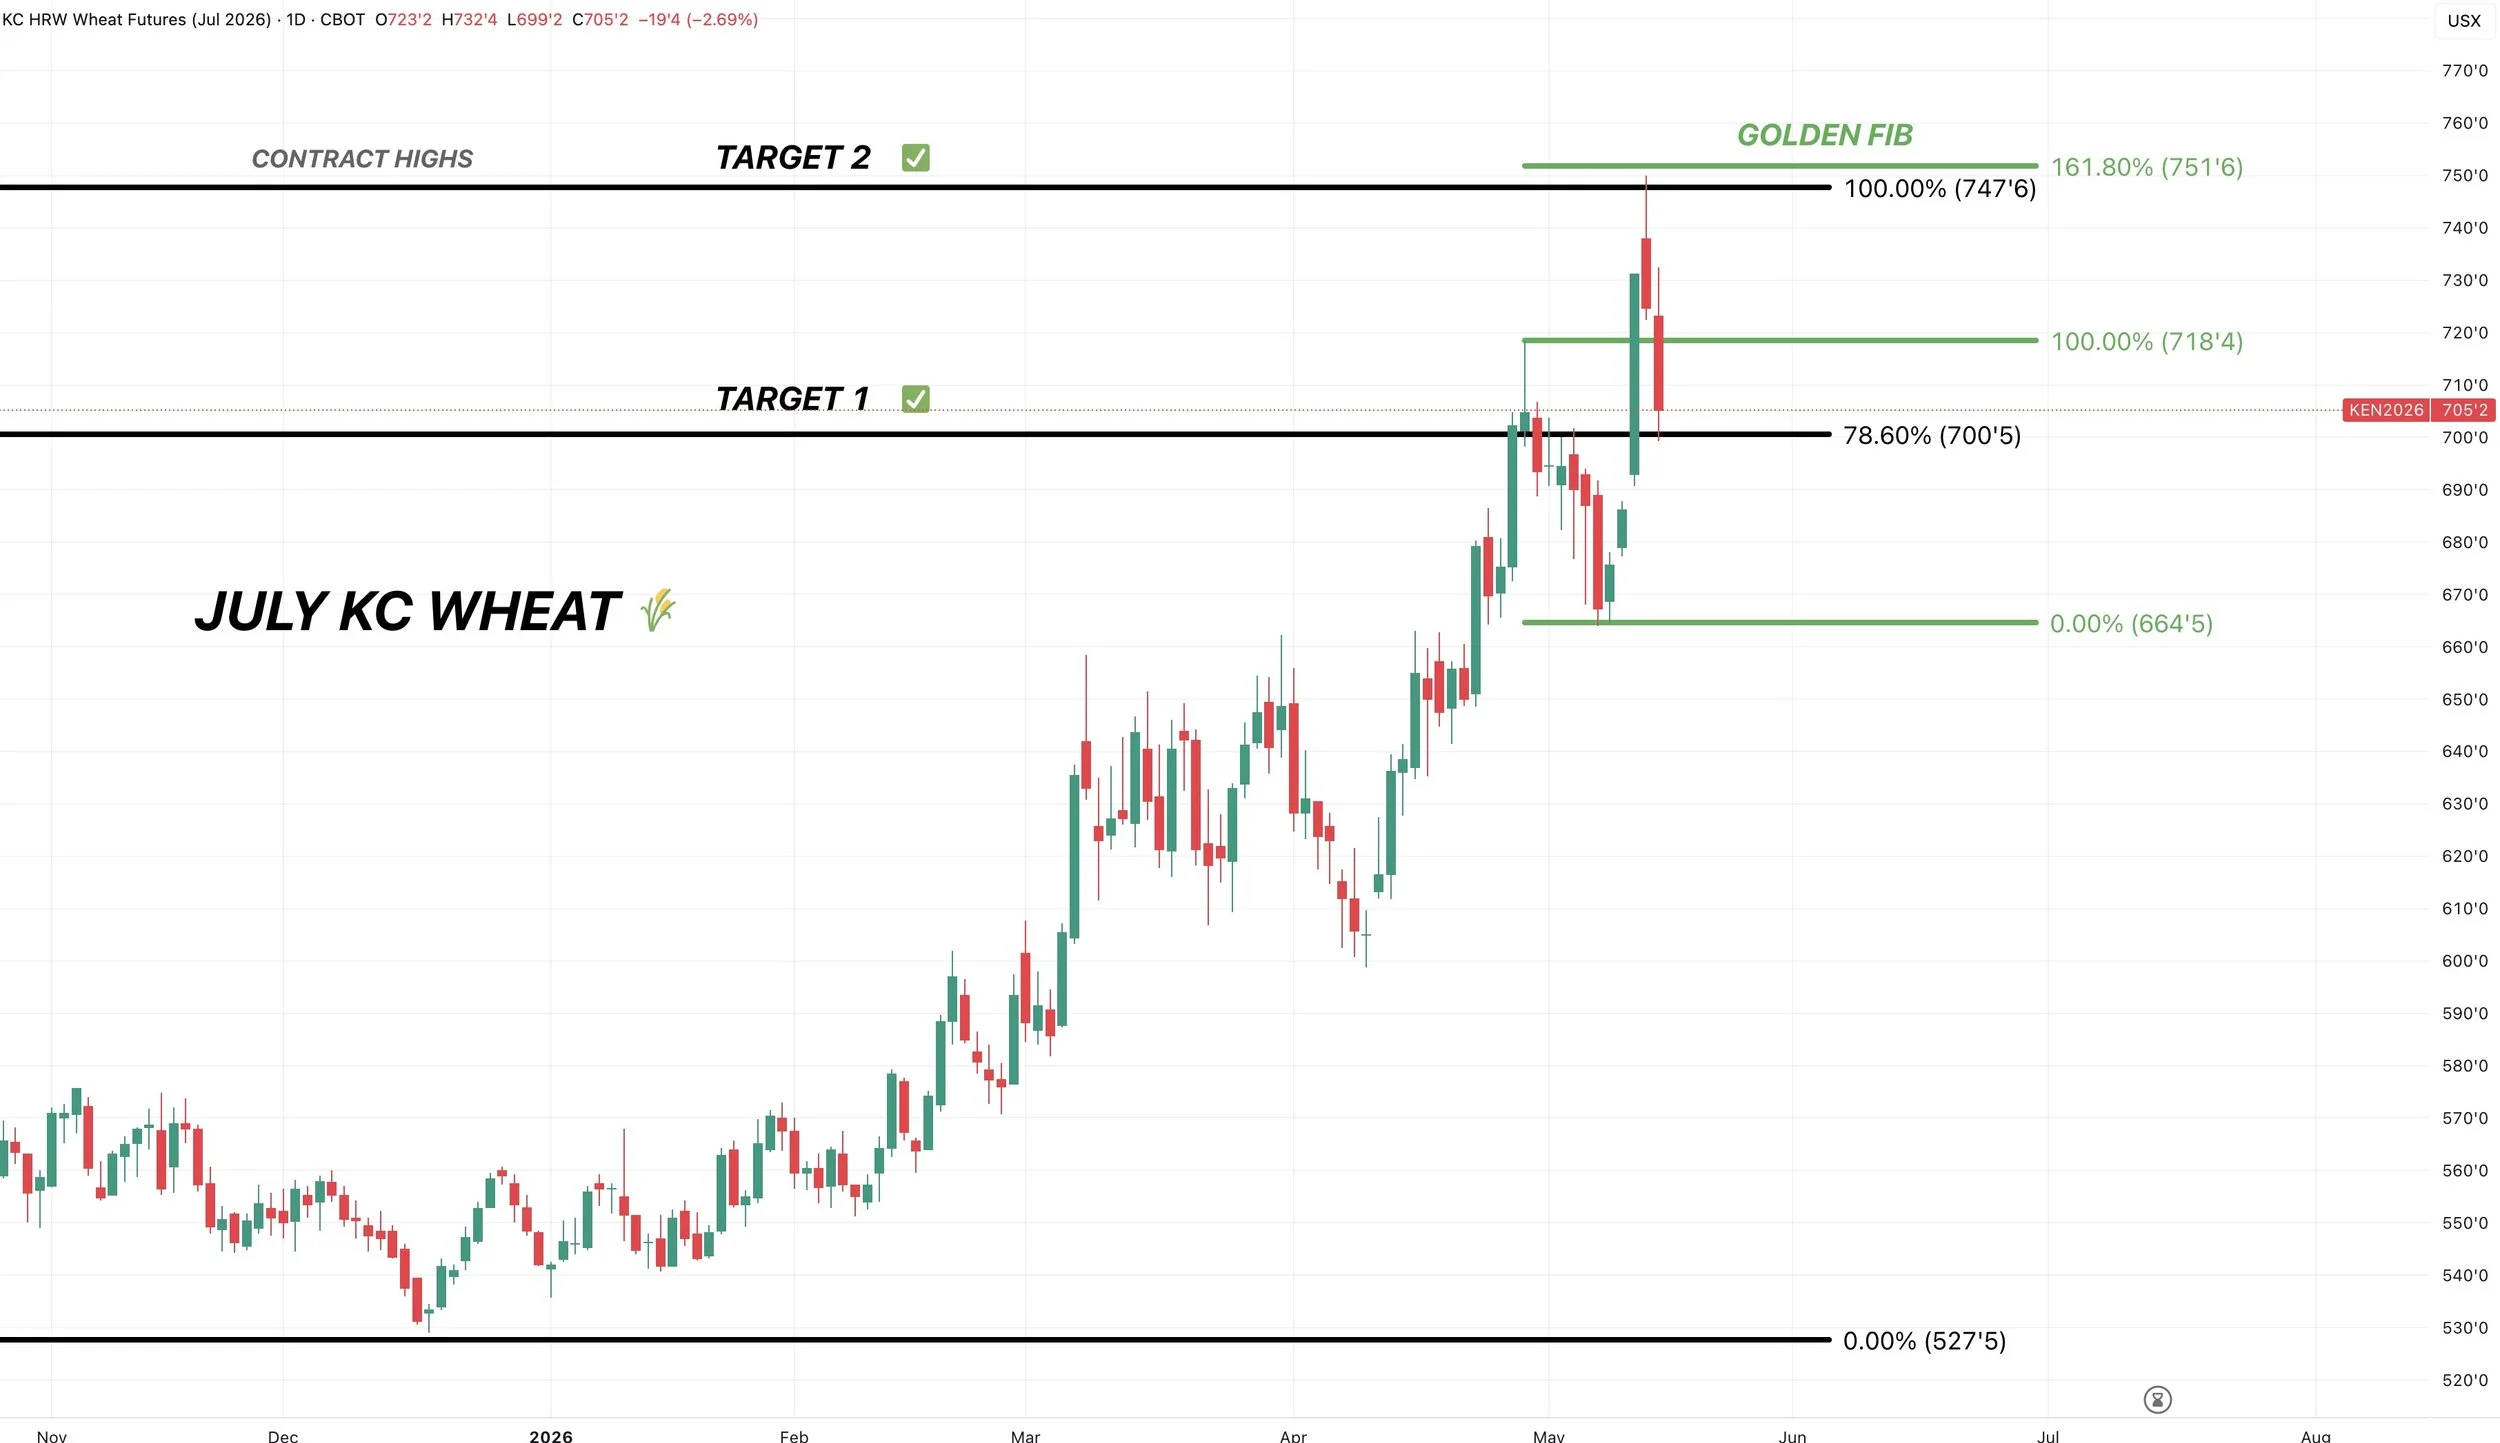
Now What?
We're still in a clear uptrend for now.
But sitting in a pretty critical spot here.
We're sitting in the golden zone from the recent rally.
As we've given back 50% to 61.8% of yesterday’s highs down to those lows from last week.
This is where a bottom would make sense.
This is where the market tells us whether this is just a pullback or something deeper.
This area is also old resistance.
If we are going to bounce, it needs to be here.
If we fail this level, it opens the door lower.
So the 61.8% level at $6.97 is the level we want to hold or we re-visit the March lows.
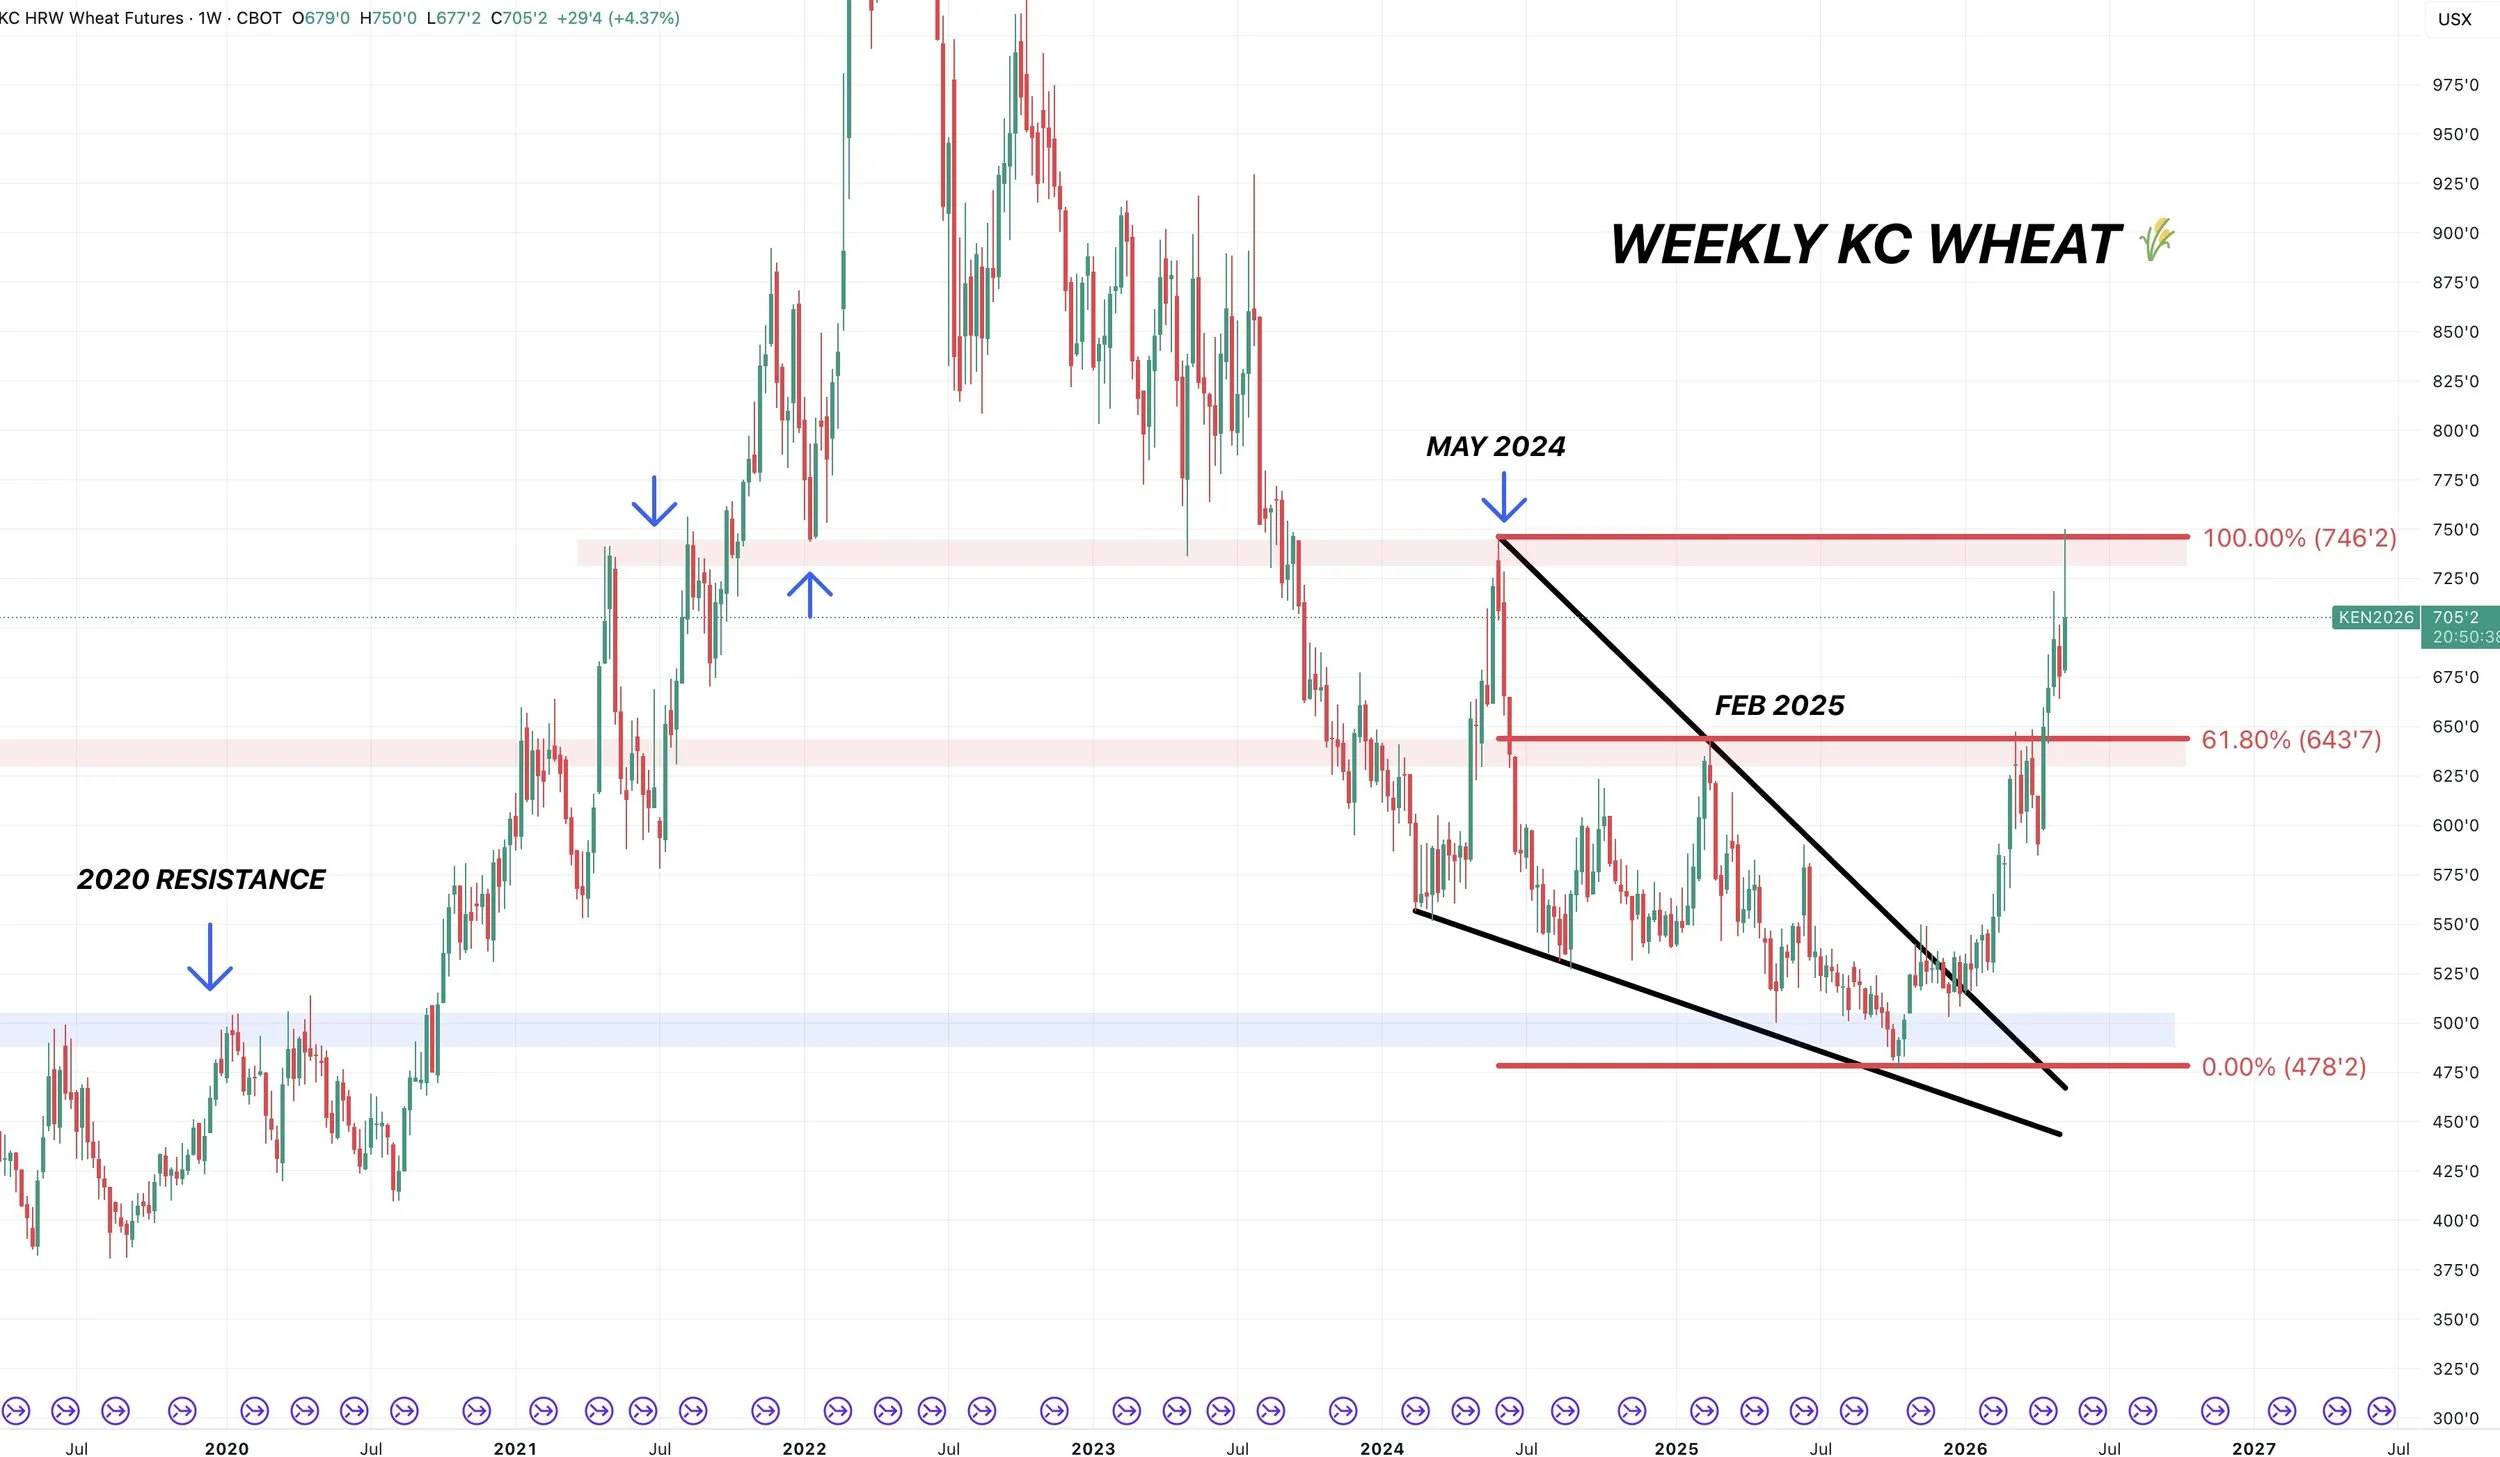
Big Picture Chart:
I've been showing this chart since wheat was trading in the $5.00's
The big picture weekly chart.
This was another reason why $7.50 was that next major target.
It's the highs from May 2024, as well as prior key support and resistance a few other times. Such as the lows from 2022 or the highs from 2021.
It is a major level.
It makes sense for us to fail here.
However, if you ever break above it, it opens the door much higher.
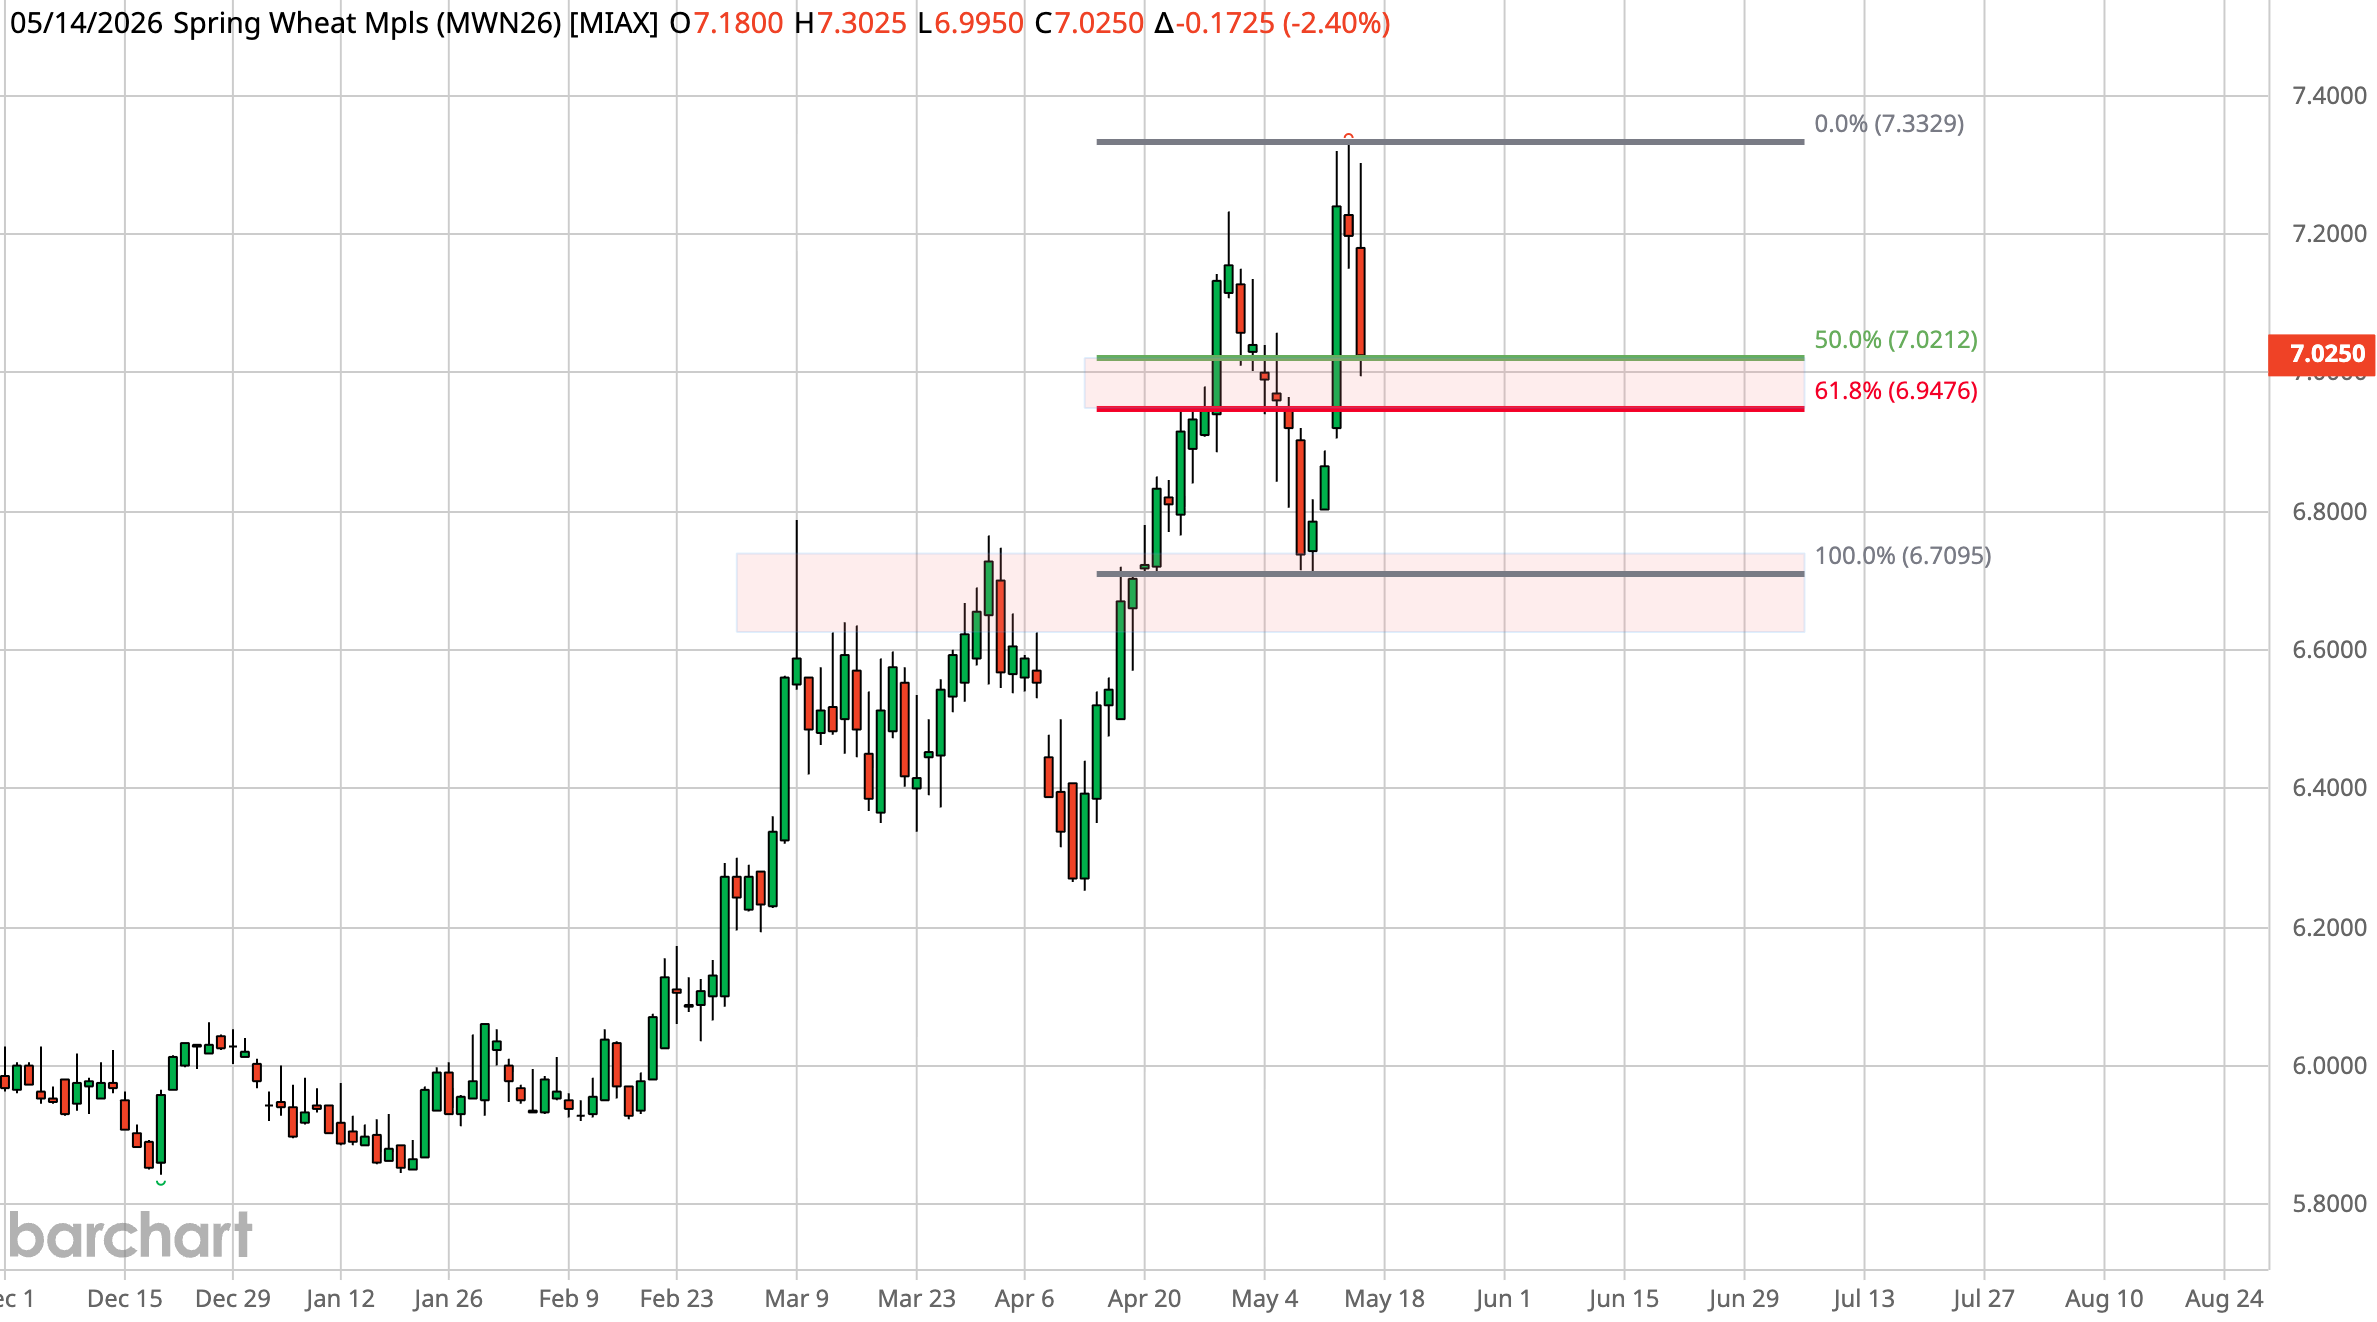
July MPLS Chart:
The chart is clearly not broken.
The level we want to hold is $6.94
That gives back 61.8% of the recent rally.
Sitting in the golden zone and where we'd expect a bounce.
But if we fail there, we likely re-vist the recent lows.
Cattle
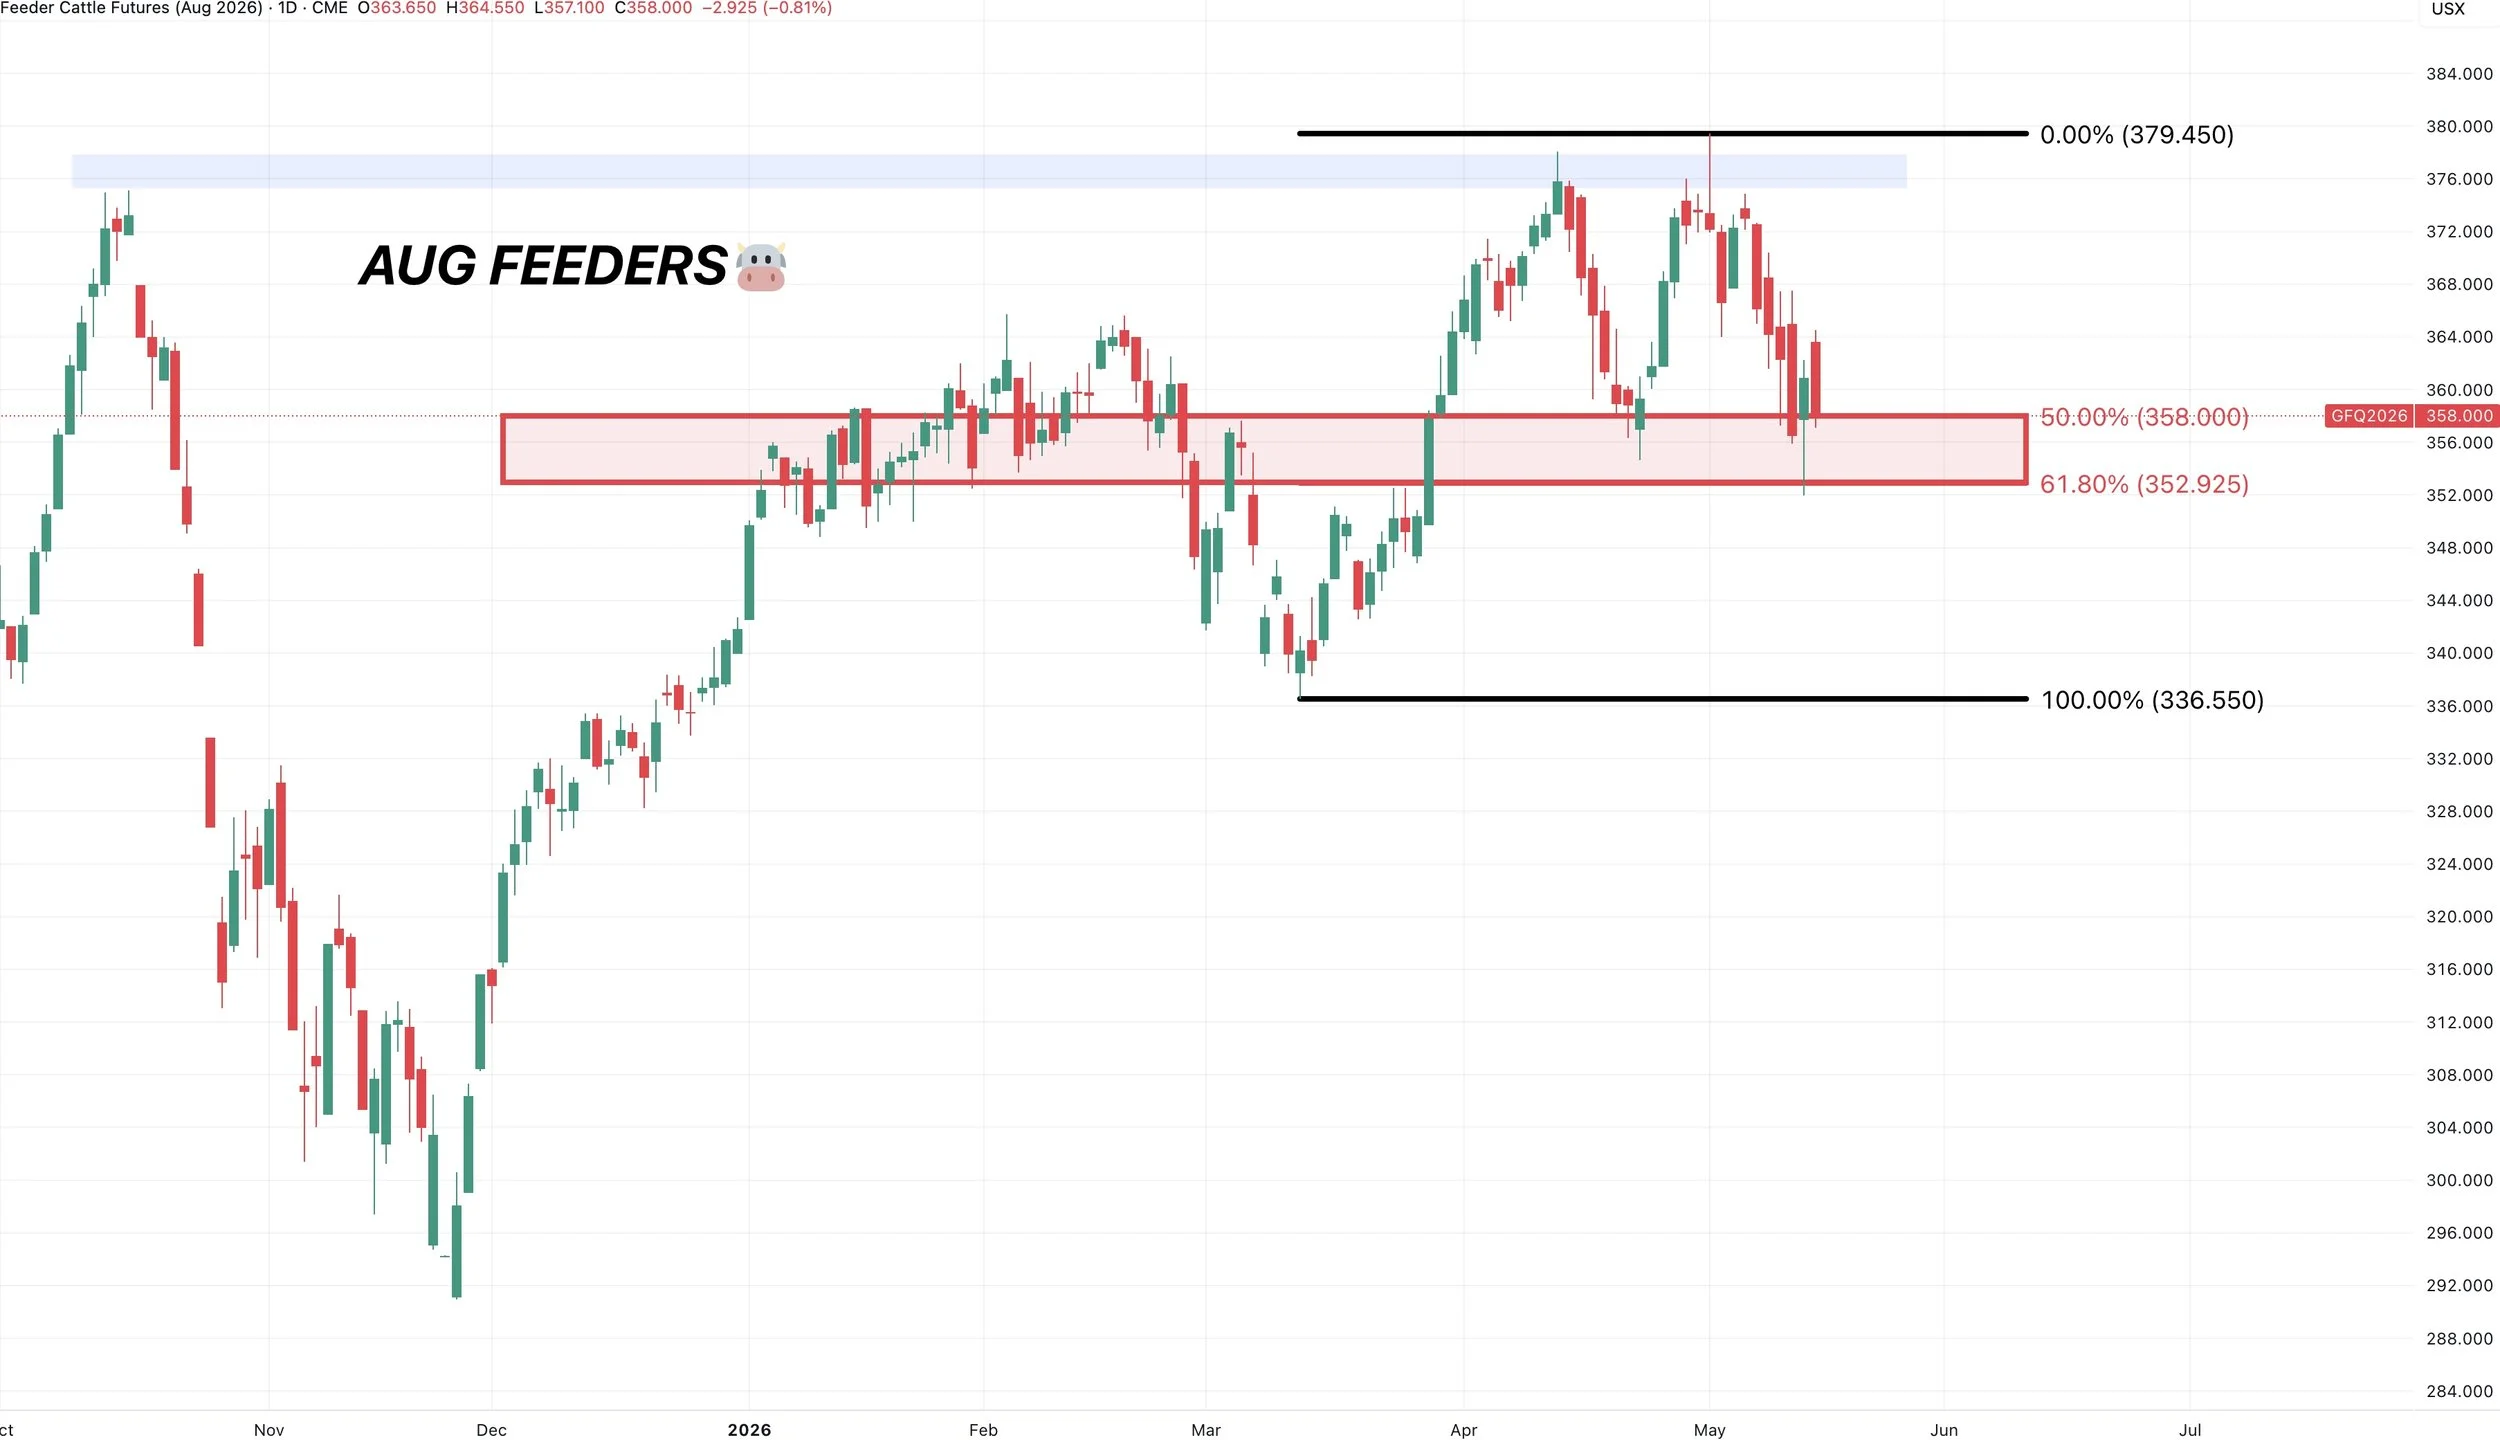
Aug Feeders Chart:
Not the best closes here.
We gapped open higher in cattle but then closed in the red.
We did hold that must hold level perfectly.
That is still going to be the level to hold.
The trend remains higher UNLESS you break below that level. If we break below this red box and the 353 level then it could be a warning sign we are in for a deeper correction.
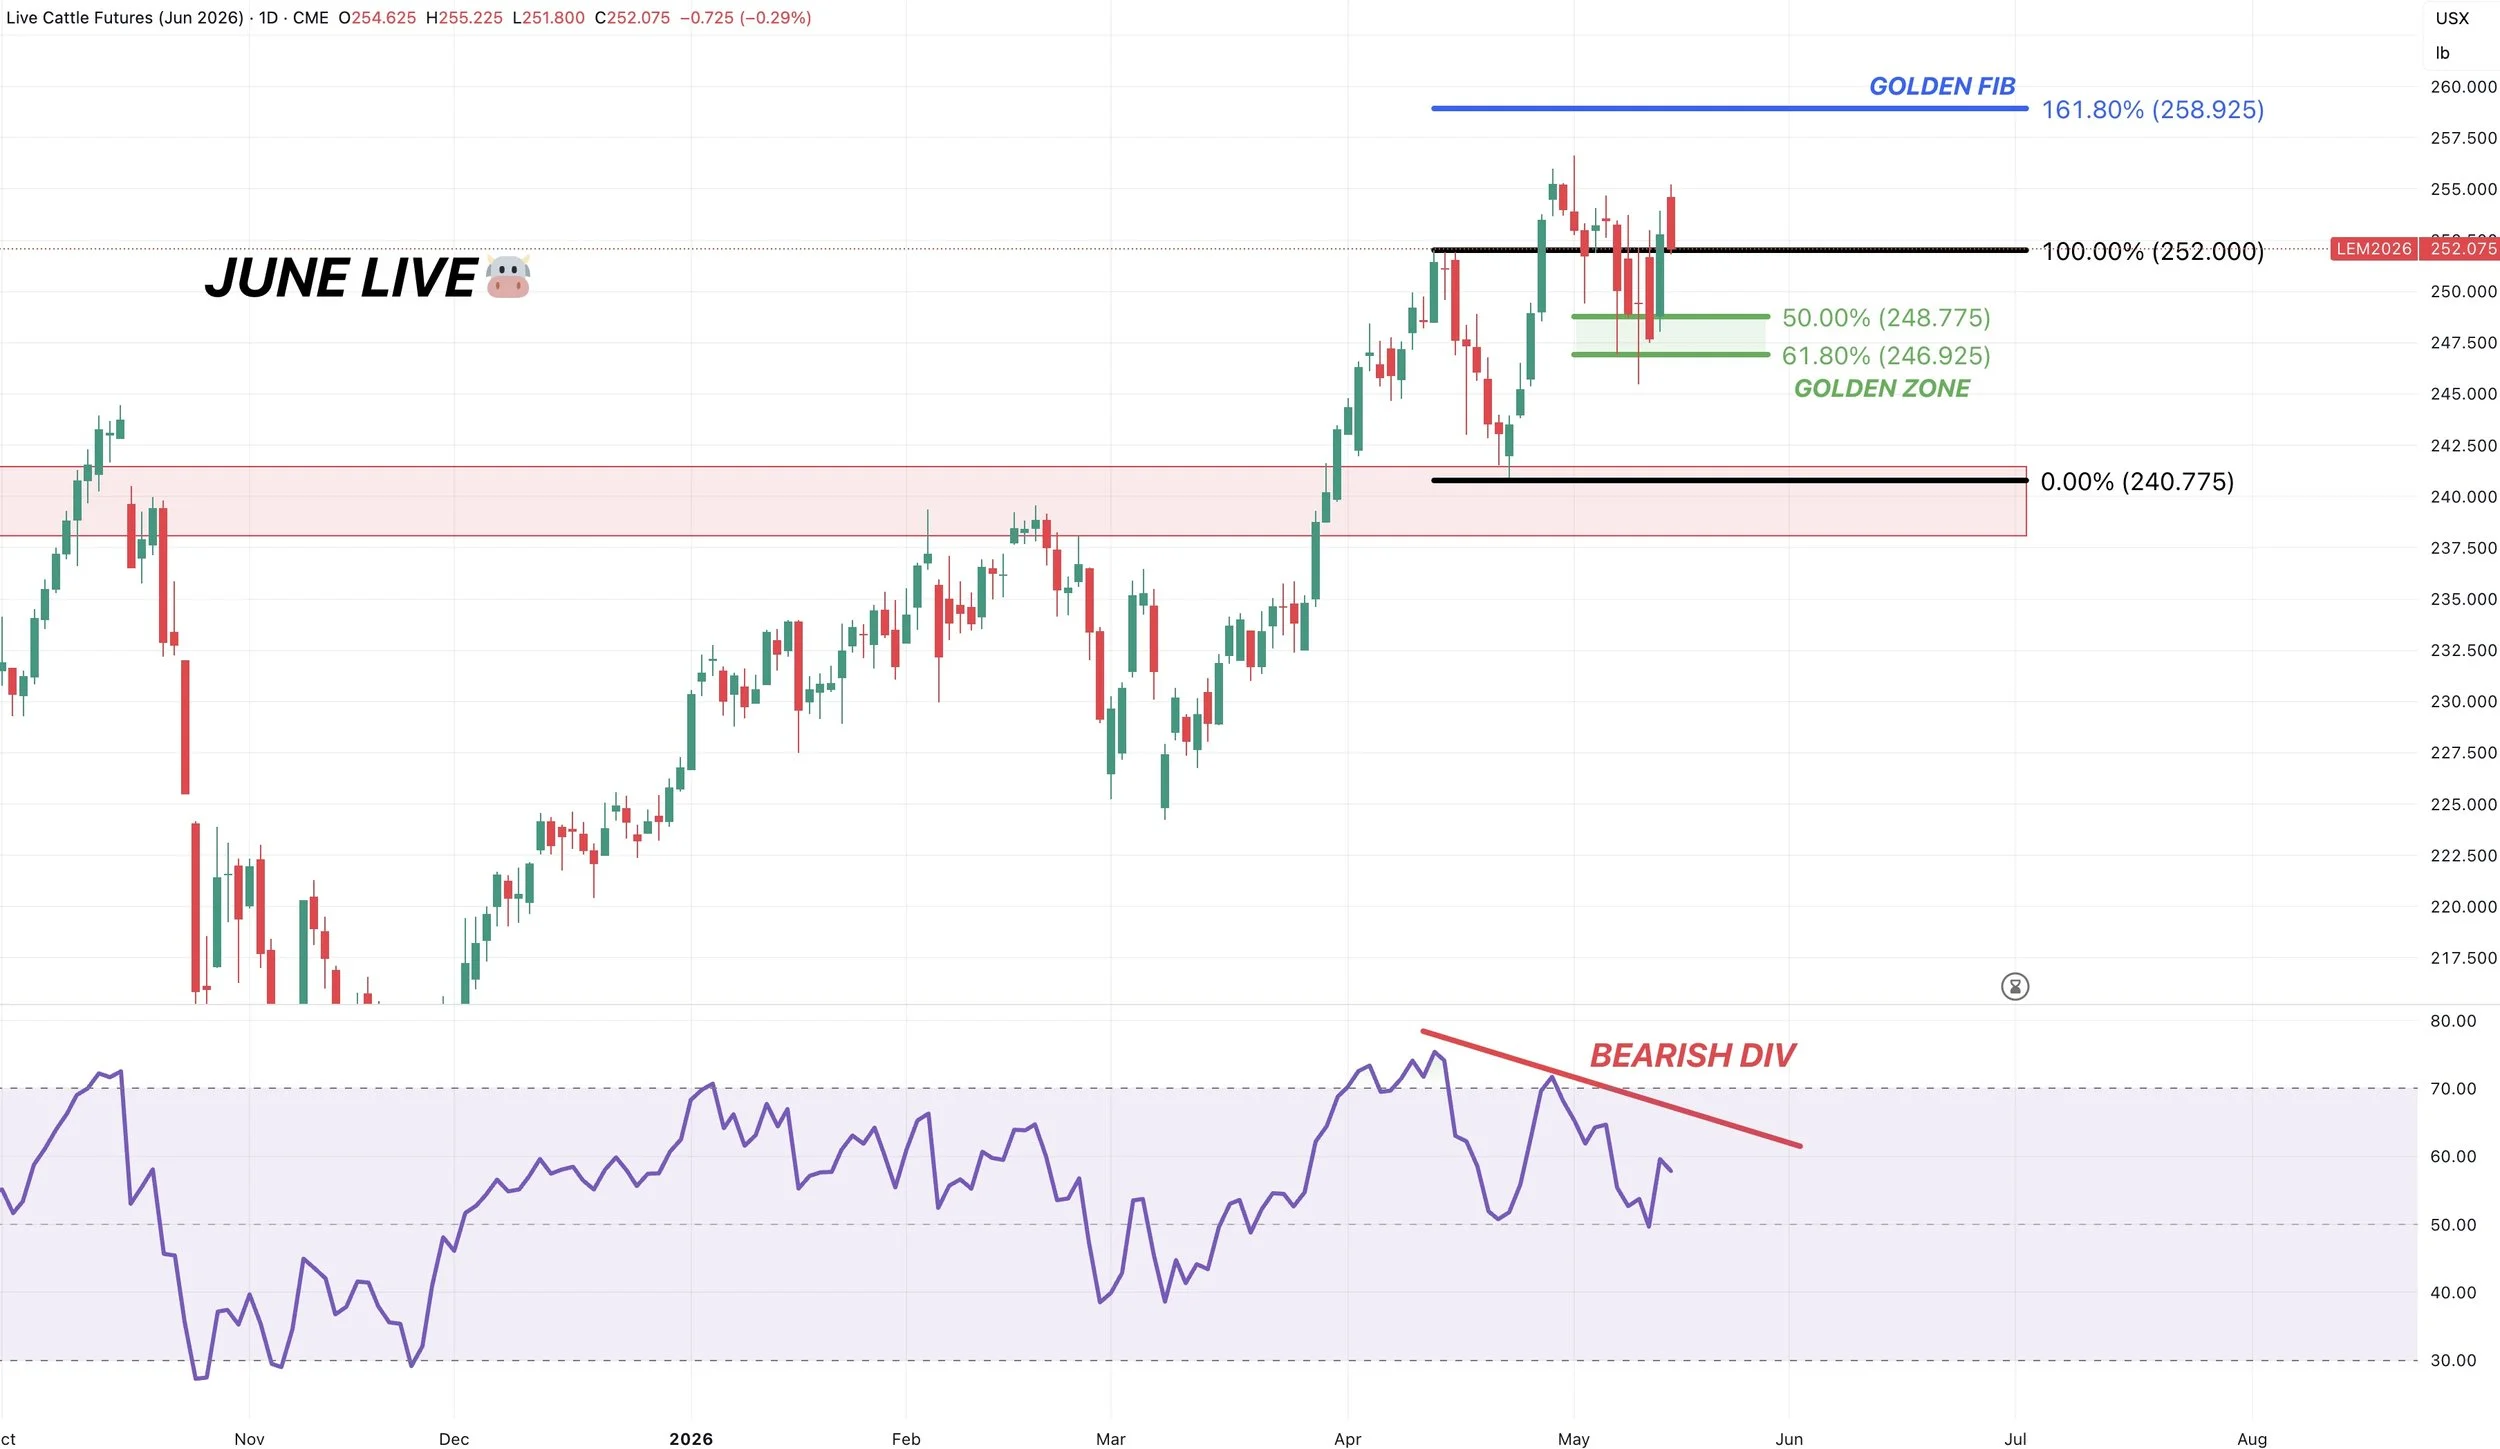
June Live Chart:
Live cattle continues to hold up far better than feeders.
However, just like feeders we did hold that must hold support.
The golden zone down to the recent lows.
That's the level to watch at 247.
I've still got a golden fib target of just under 259. Which is 161.8% of the April lows up to the April highs.
We are showing some major bearish divergence on the RSI, which can be a sign upside momentum is slowing.
So it probably makes sense to start looking at some downside protection here soon.
Want to Talk?
Our phones are open 24/7 for you guys if you ever need anything or want to discuss your operation.
Jeremey & Office: (806)484-1214
Sebastian: (605)280-1186
Email: sfrost@dailymarketminute.com
Hedge Account
Interested in a hedge account? Use the link below to set up an account or give us a call.
Recent Updates
May 13th - Audio Commentary
China Meeting Tonight
Click Here to View
May 12th - Market Update Video
USDA & Wheat Limit Up
Click Here to View
May 11th - Audio Commentary
All About Trump, China & USDA
Click Here to View
May 8th - Market Update Video
Grains Catch a Bid Where Needed
Click Here to View
May 7th - Audio Commentary
Grains Hold Critical Spots
Click Here to View
May 6th - Market Update Video
Grains Nearing Sink or Swim Levels
Recent Signals
May 13th, 2026: 🌱
Soybean sell signal & hedge alert.
CLICK HERE TO VIEW
April 28th, 2026: 🌾
KC wheat specific signal.
CLICK HERE TO VIEW
April 27th, 2026: 🌽
Corn catch up sell signal.
CLICK HERE TO VIEW
April 10th, 2026: 🌽
Corn buy signal.
CLICK HERE TO VIEW
March 19th, 2026: 🌱
New crop soybeans signal & hedge alert.
CLICK HERE TO VIEW
March 9th, 2026: 🌱
Soybeans signal & hedge alert. Sent via text.
CLICK HERE TO VIEW
March 6th, 2026: 🌽 🌾
Corn & wheat sell signal & hedge alert.
CLICK HERE TO VIEW
March 3rd, 2026: 🌽
Old crop & new crop corn sell signal & hedge alert.
CLICK HERE TO VIEW
Feb 26th, 2026: 🌱
Old crop & new crop beans sell signal & hedge alert.
CLICK HERE TO VIEW
Feb 19th, 2026: 🌾
KC wheat sell signal & hedge alert.
CLICK HERE TO VIEW
Feb 6th, 2026: 🌽 🌱
Old crop corn & soybean sell signal & hedge alert.
CLICK HERE TO VIEW
Feb 4th, 2026: 🌱
Soybean sell signal & hedge alert.
CLICK HERE TO VIEW
Nov 17th, 2025: 🌱
Soybean sell signal & hedge alert.