
ALL EYES ON USDA
MARKET UPDATE
You can scroll to read the usual update as well. As the written version is the exact same as the video.
Timestamps for video:
Overview: 0:00min
Corn: 2:00min
Beans: 7:15min
Wheat: 12:30min
Cattle: 13:30min
Want to talk about your situation?
(605)295-3100
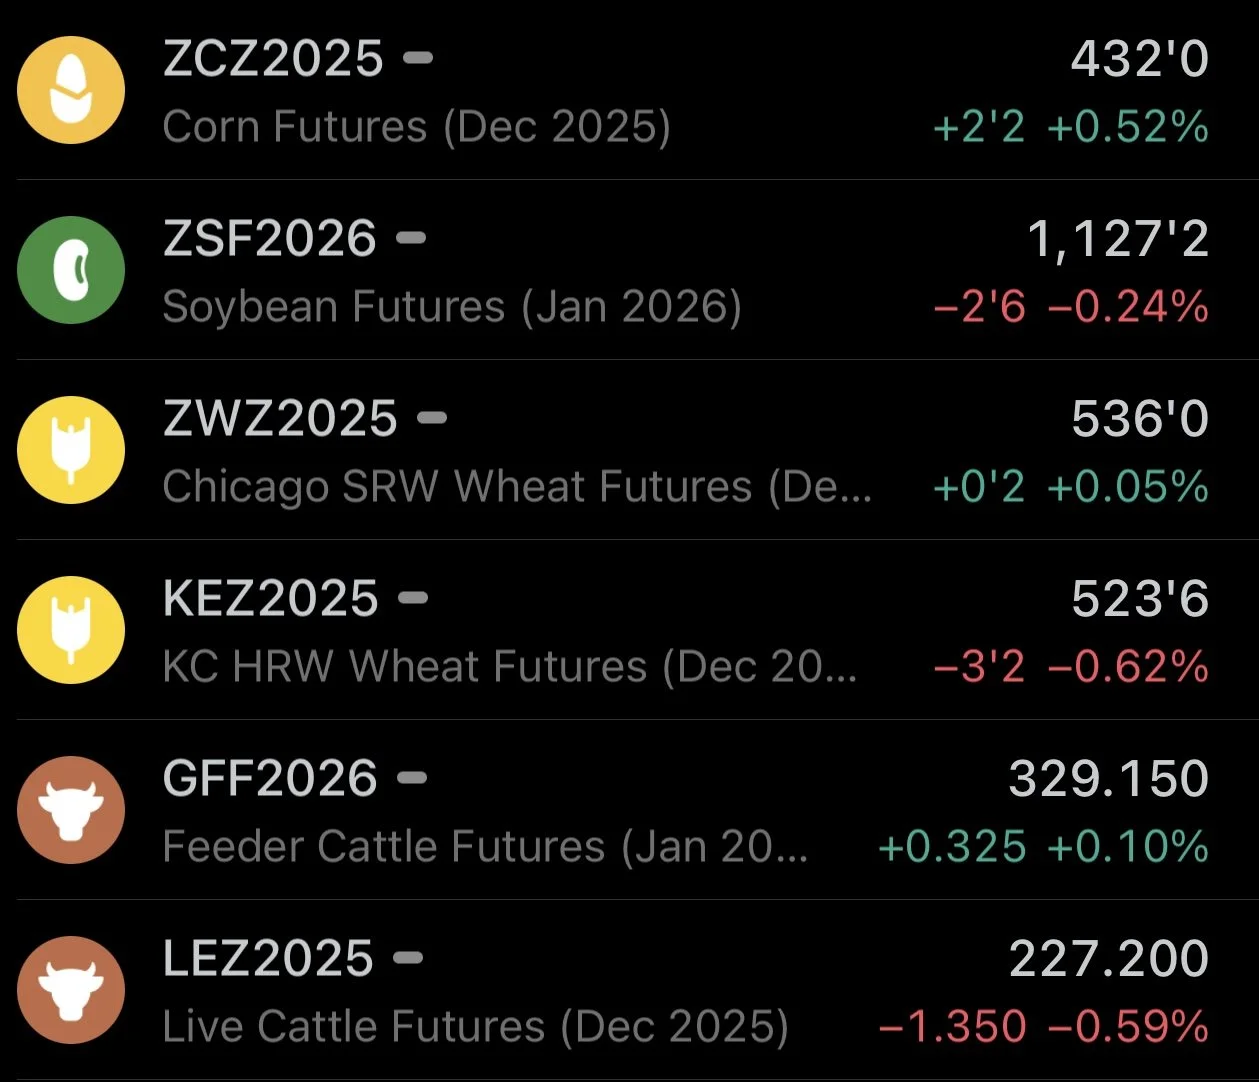
Futures Prices Close
Overview
Grains mixed on Tuesday following yesterday's nice bounce.
All eyes are on Friday's USDA report.
This report has the potential to shake up the markets massively. This is going to be one of the most unpredictable reports we have ever seen.
We have had limited data to go on for the last 2 months.
Our last USDA report was that quarterly stocks report in September. Since we never got the Oct WASDE, we never saw the implications from that report.
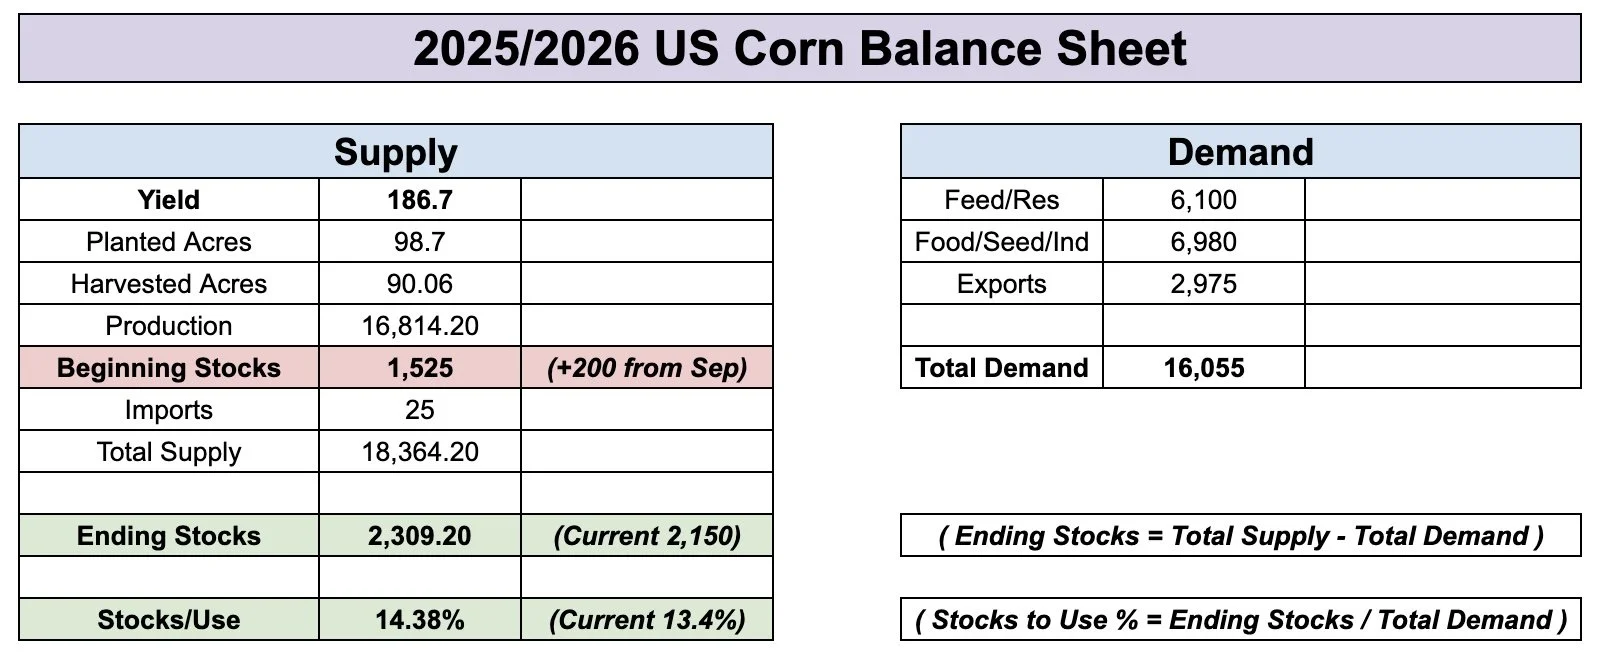
If you remember, the USDA dropped old crop feed demand by nearly -200 million. That extra 200 million bushels of supply was then automatically added to the new crop balance sheet in the form of beginning stocks.
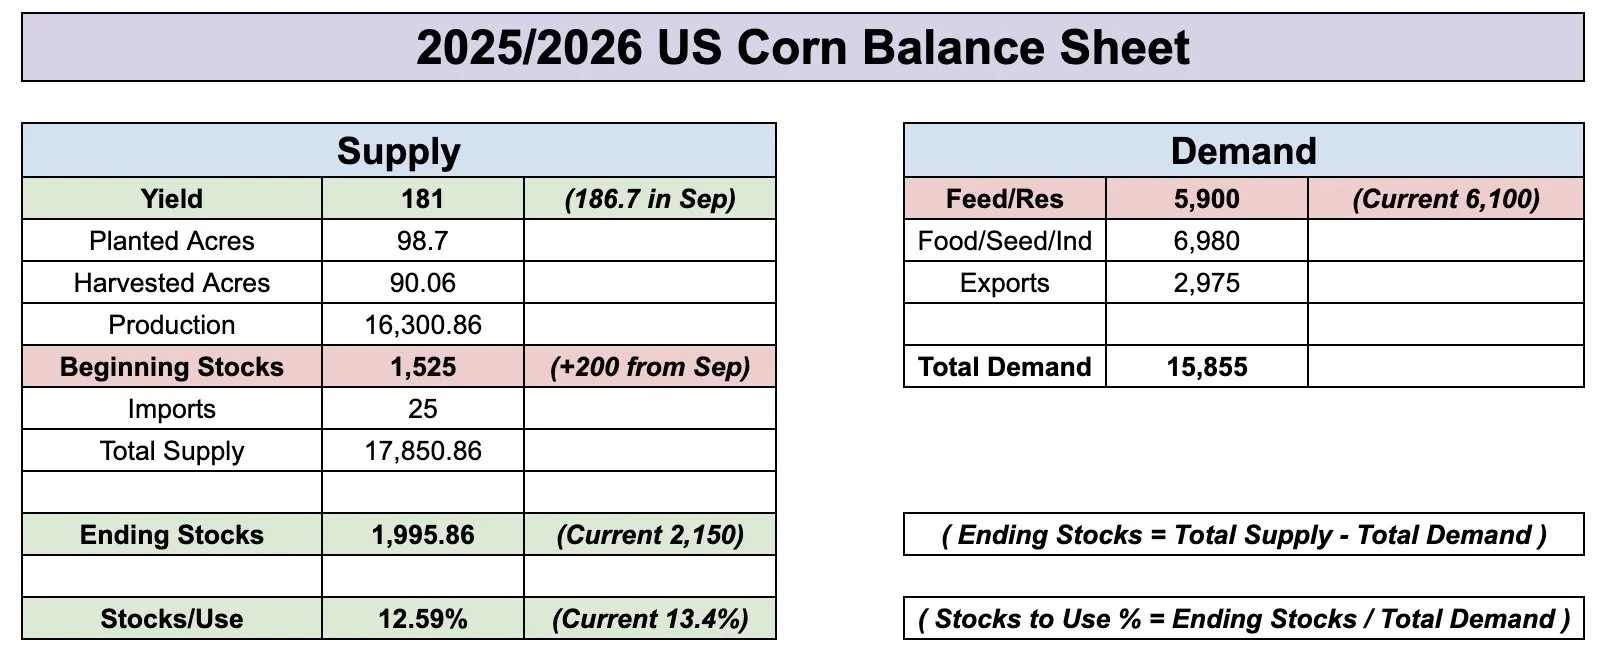
With a yield of 186.7 bpa, those beginning stocks rose carryout from 2.10 billion to 2.30 billion. Which would’ve been one of the highest since the 1980's.
Here is that balance sheet with the 186.7 yield and added +200 million beginning stocks from the September reports.
Let's dive into the estimates.
We have some absolutely massive trade ranges for this report.
I'm talking a +/- 4 bpa range on corn yield and a whopping +/- 500 million on corn carryout.
Soybeans carryout ranges from 187 to 494 million. That is a major difference. 187 means we are running out of beans. 494 means we are swimming in beans.


Today's Main Takeaways
Corn
Fundamentals:
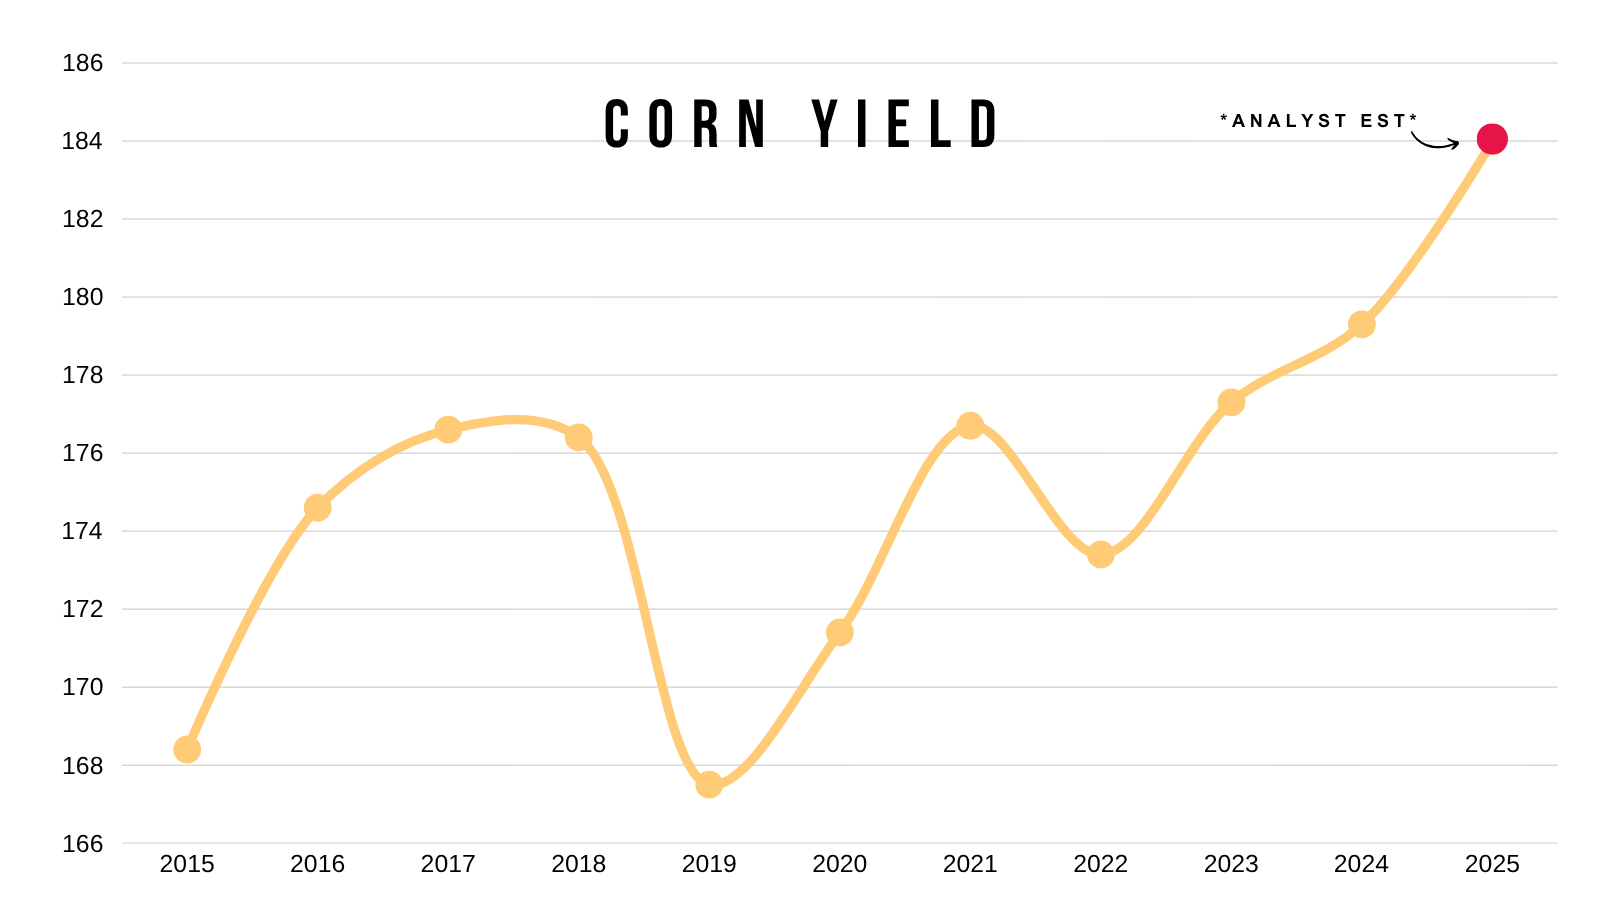
Yield should come in lower. By how much is the bigger question.
Here is a month by month change in corn yield from this year vs last year.
Last year, the USDA only dropped yield by -0.7 bpa before ultimately dropping it by nearly -4 bpa in January.

Here is a visual of the corn yield changes for the Oct (blue) and Nov report (green).
There isn’t really a correlation.
Sometimes they lower yield in October only to raise it in November, and vice versa.

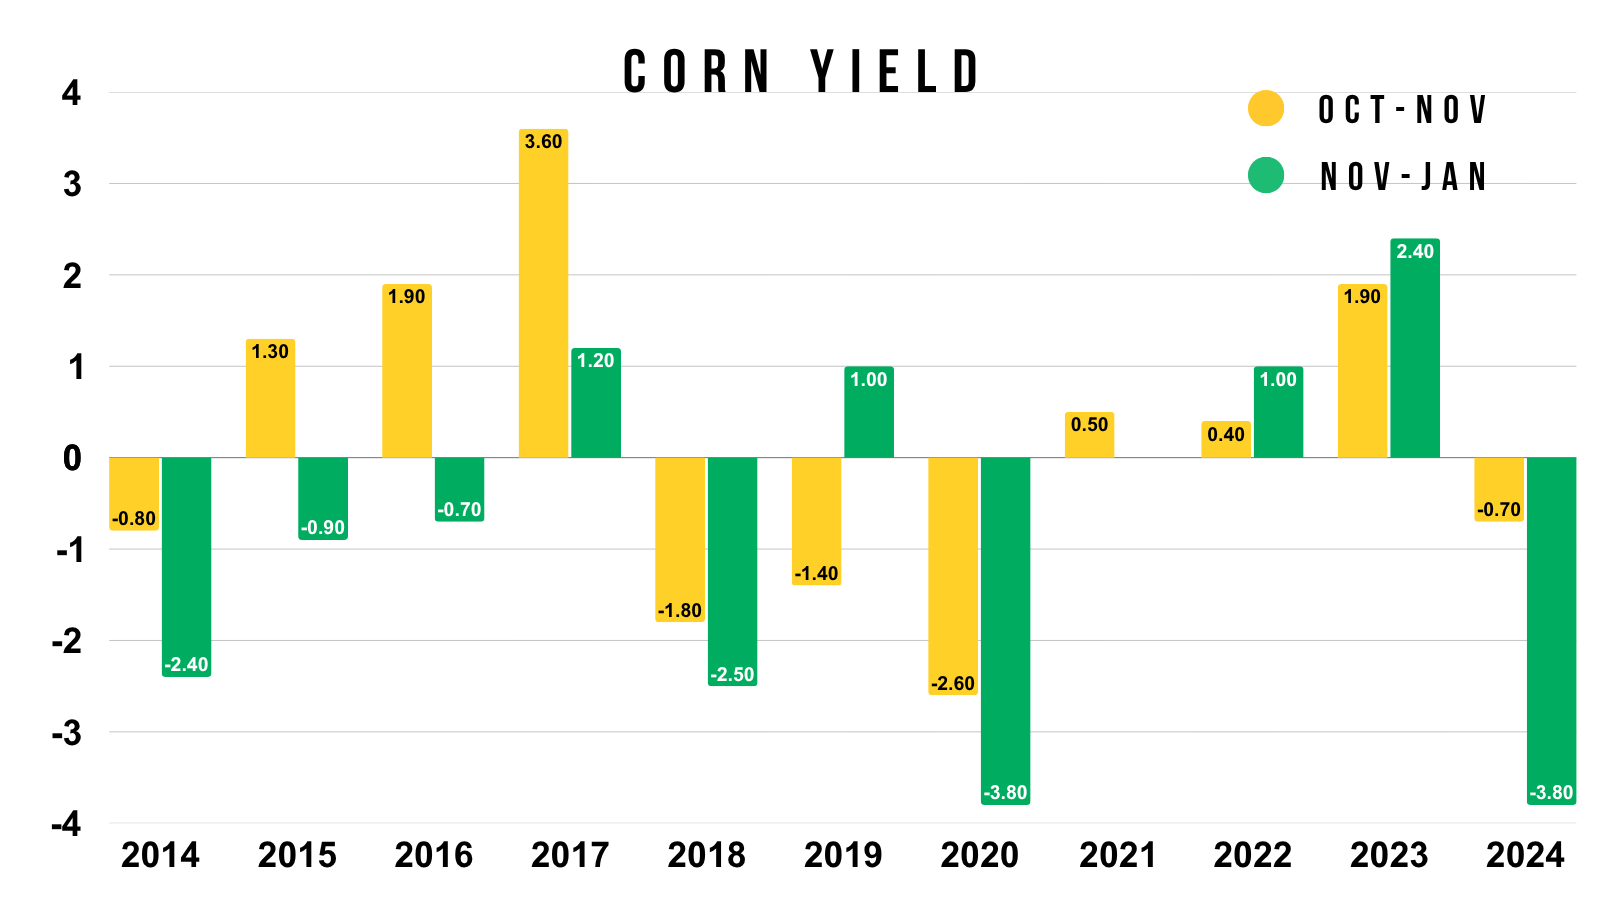
However, if we look at the yield changes for the Nov (yellow) and Jan (green) report, there is a correlation here.
For the last decade, nearly every time we saw them lower yield in November, it was then followed by an even larger cut in January. The only year it did not was 2019.
We should see a yield cut this week.
If history suggests anything, it suggests we will also see a cut in January. Which is typically larger than the one in November.
Now let's look crop conditions.
We did not get the last few weeks of data, as the last round was the end of September.
These do not determine yield.
However, corn crop conditions were roughly the same as they were last year.

So why would yield have to be +5 bpa higher than last year?
Now if the USDA lowers yield, they very well could offset it with a cut to demand.
It is called balancing the balance sheet.
We haven’t had export sales data in forever.
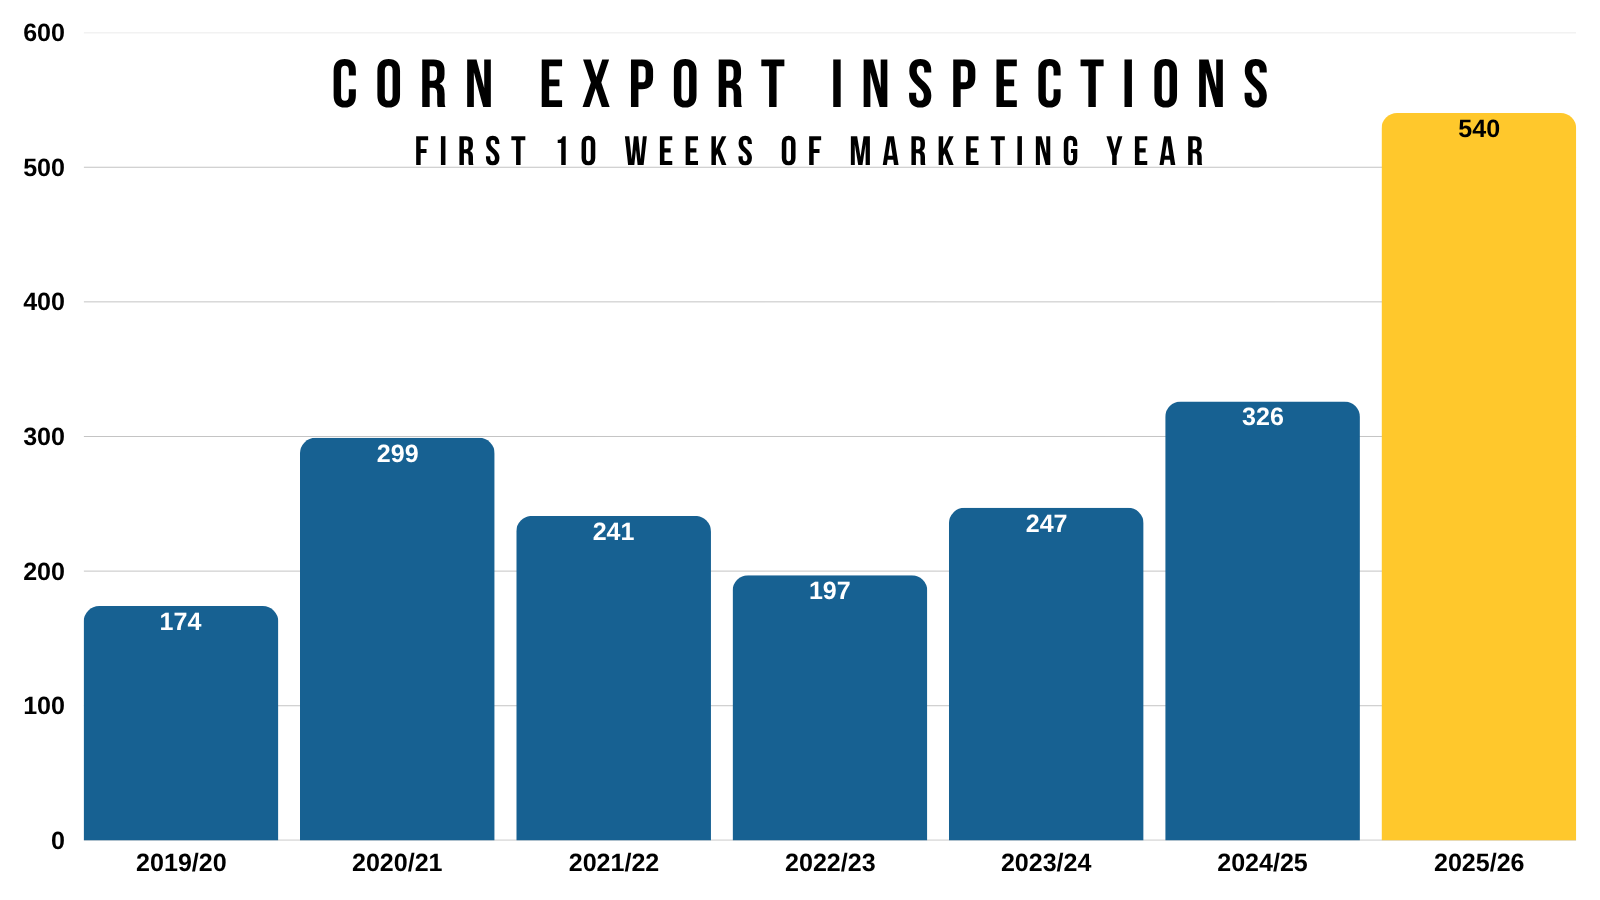
But export inspections are the best they've ever been.
They are up +65% vs last year.
So export demand clearly isn’t the concern.
The concern is feed and residual demand.
In the quarterly stocks report, the USDA dropped old crop feed demand by -184 million bu to 5,494.
The USDA is currently projecting new crop feed and residual to be 6,100.
That would be an +11% increase YOY.
2024/25: 5,494
2025/26: 6,100 (+11% increase)
The problem with this is that we've never that big of an increase before, and the USDA did just admit they were too optimistic on the old crop estimates.

There is a possible scenario where if the USDA drops feed demand by -200 million, we could still end up with a near 2 billion bu carryout even if yield came in at 181.
That is because we have record acres and supply regardless of yield.
So it might take a pretty large cut to yield to get carryout much lower than 2 billion.
Here is what that looks like:
Let's say that the USDA is going to drop feed demand by -200 million.
If yield is 180 or lower, then corn is still definitely undervalued here.
But to get a truly bullish scenario with a stocks-to-use ratio below 10%.
We would need to see a yield of 176, if exports remained the same.
That would be very bullish even if feed demand is overestimated.

Here is an update of that March-25 vs March-26 corn pattern I've been showing for a while if we line up the harvest lows.
We are still tracking a pretty similar path.
I could still very well see a scenario where we continue sideways for a little while longer before getting our real opportunity later in the year and into next year.

Technicals:
Dec Corn
Corn has been basically sideays for the last two weeks. Trapped in about a 10 cent range.
Really only watching two things.
If we break above the green box, we are probably ready for the next leg higher. That is 50% of the Feb highs and key support from spring (now resistance).
The 200-day MA also sits right there, so breaking above could spark more upside.
If we get a pullback, I am looking for a bounce in the red box.
That gives back 50-61.8% of the recent rally. Which is the most common place for a correction to end.
The last big pullback we saw in September ultimately gave back 50-61.8% of the rally off contract lows before bouncing there (orange box).

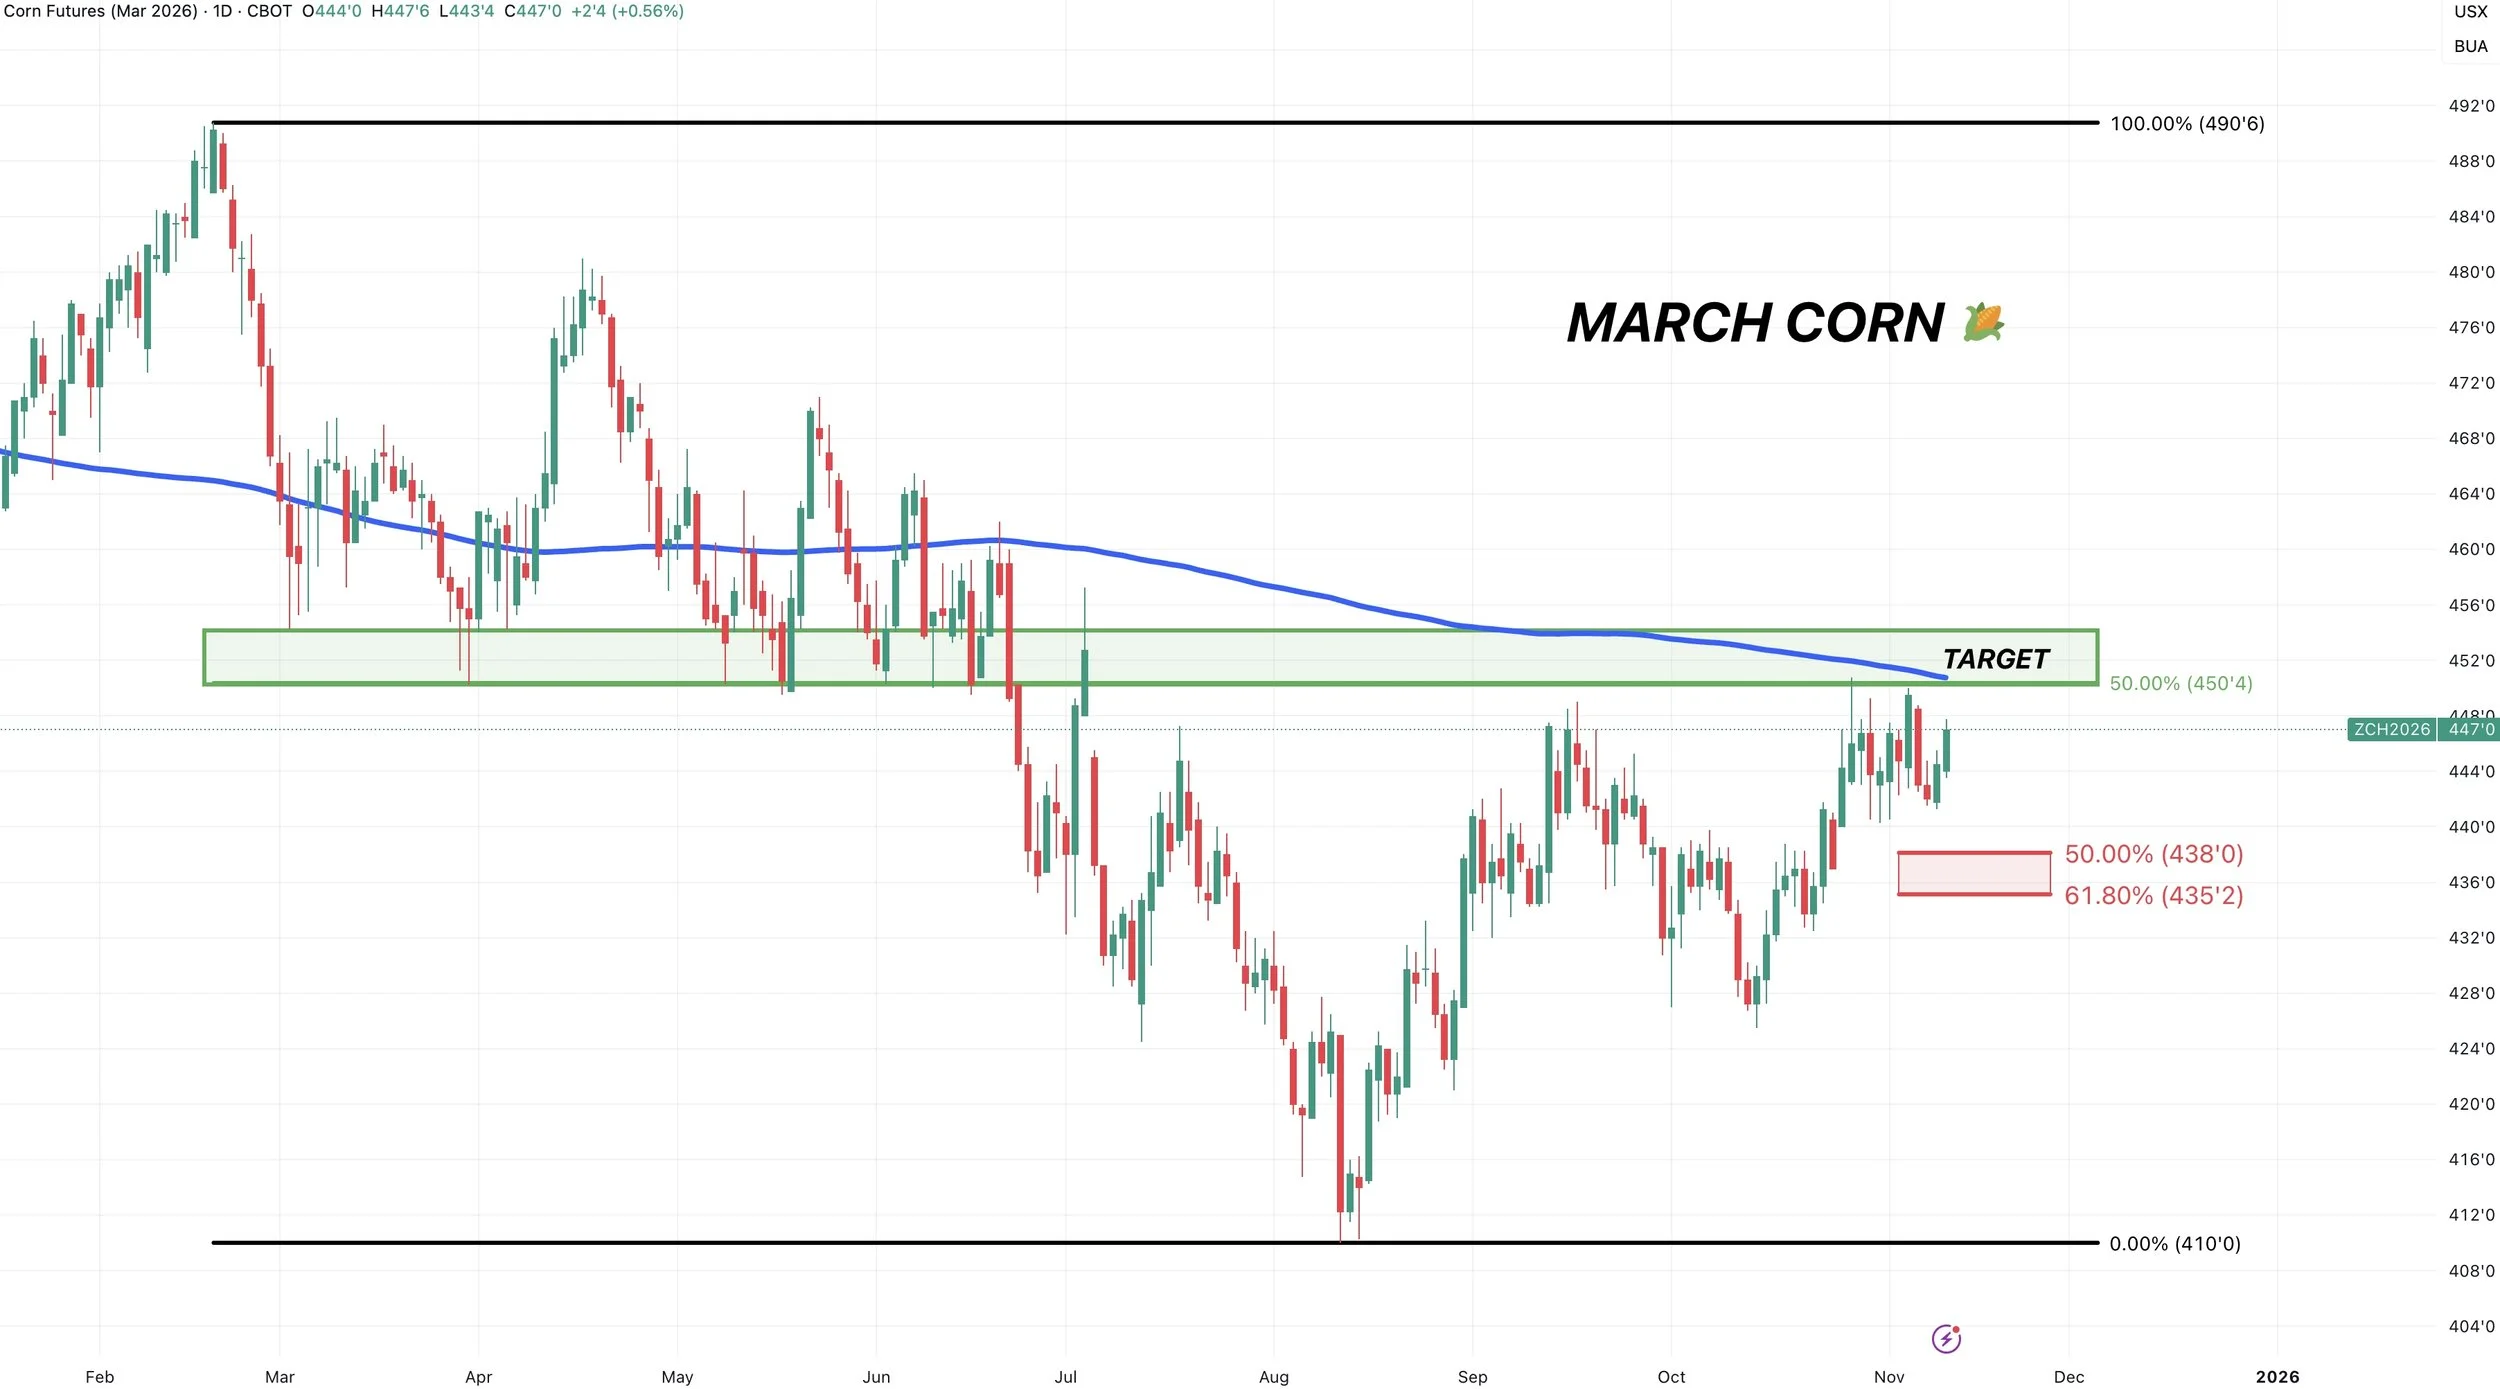
March Corn
Essentially the same set up in March corn.
Break above the green box and we could see further upside.
In the meantime, we want to hold the red box.
Soybeans
Fundamentals:
Like I mentioned, we have an extremely wide range of estimates for this report.
With a low of 187 million vs a high of 494 million for carryout.
With the average guess being 300 million (unchanged from Sep).
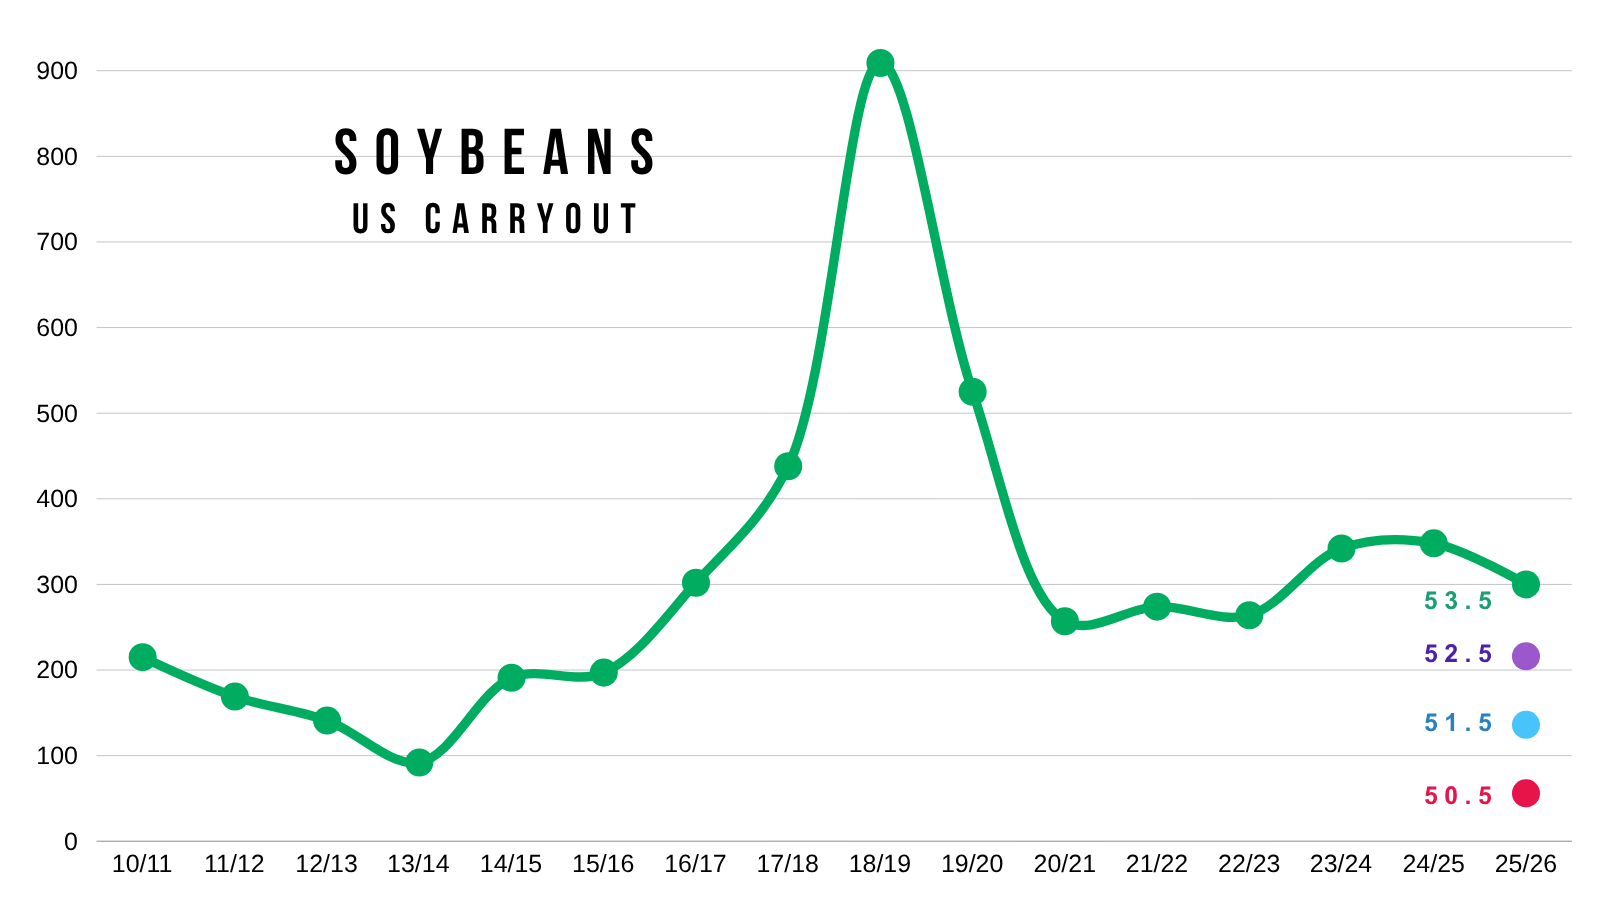
Here is a soybean carryout visual with the high and low estimates to give you a clear picture on just how wide of a range they have for the report.
The high estimate would be the 2nd highest carryout ever.
The low estimate would be the lowest in over a decade.

That is because nobody has any idea what the USDA will do with soybean demand.
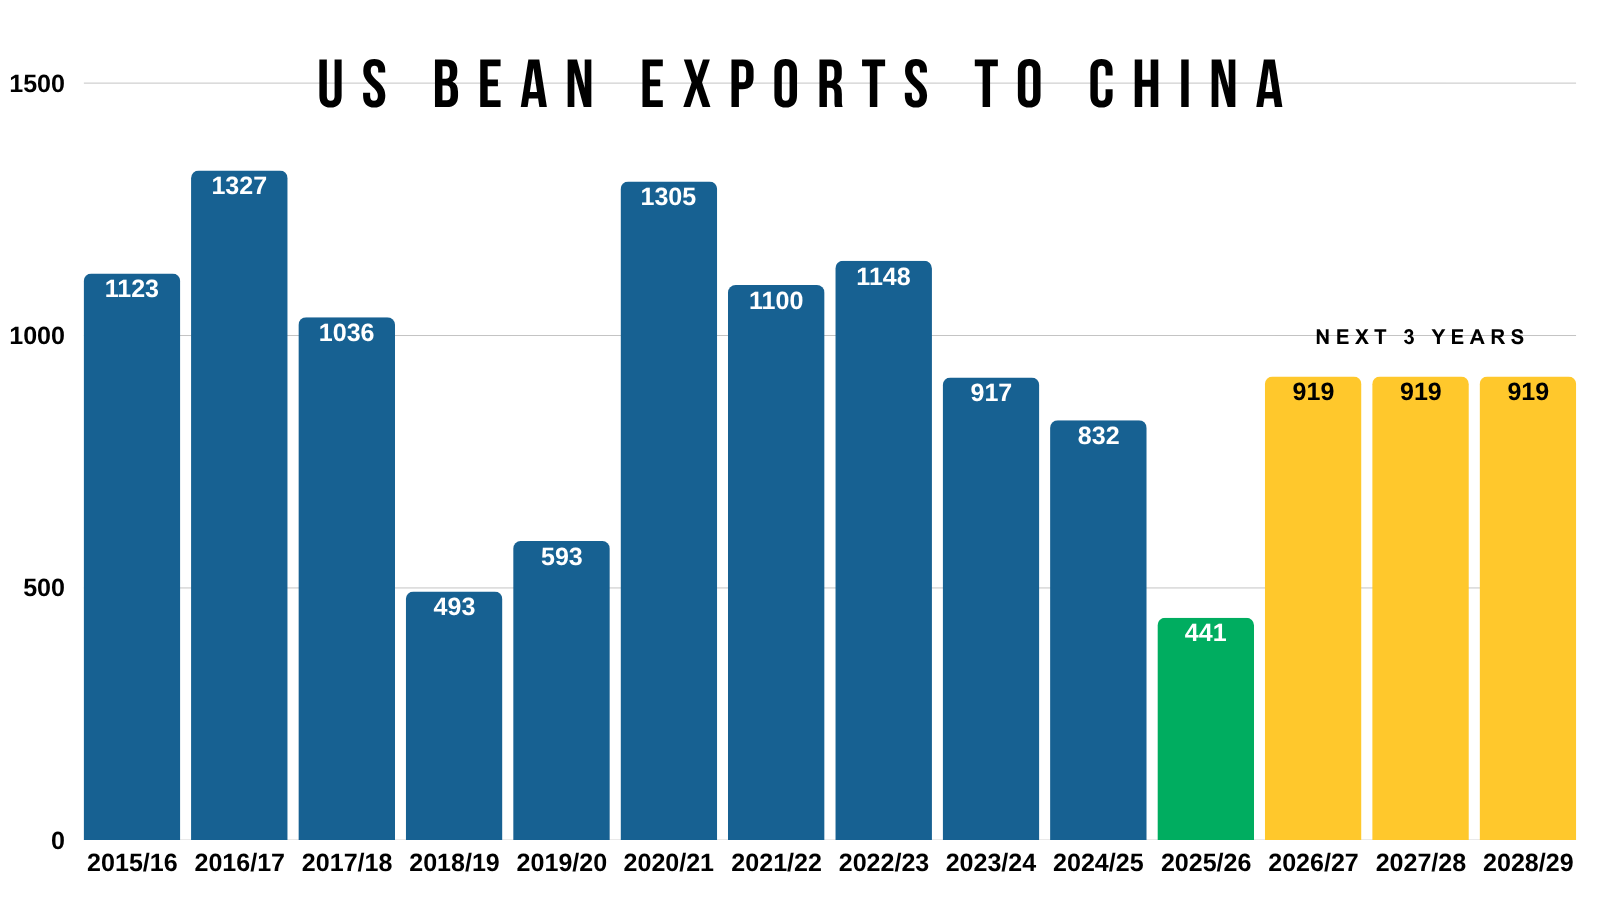
China committed to buying soybeans.
We have still yet to see any export inspections show up to China.
As soybean export inspections are down -42% vs last year, and the worst in 17 years up to this point.
Some of nervous that China isn’t going to be able to buy that 12 MMT of soybeans by the end of the year.
But do people really expect us to just ship soybeans to China 10 days after they agreed to buy them?
There isn’t a reason to doubt to them buying this soon after the agreement.

However, demand outside of China has been solid.
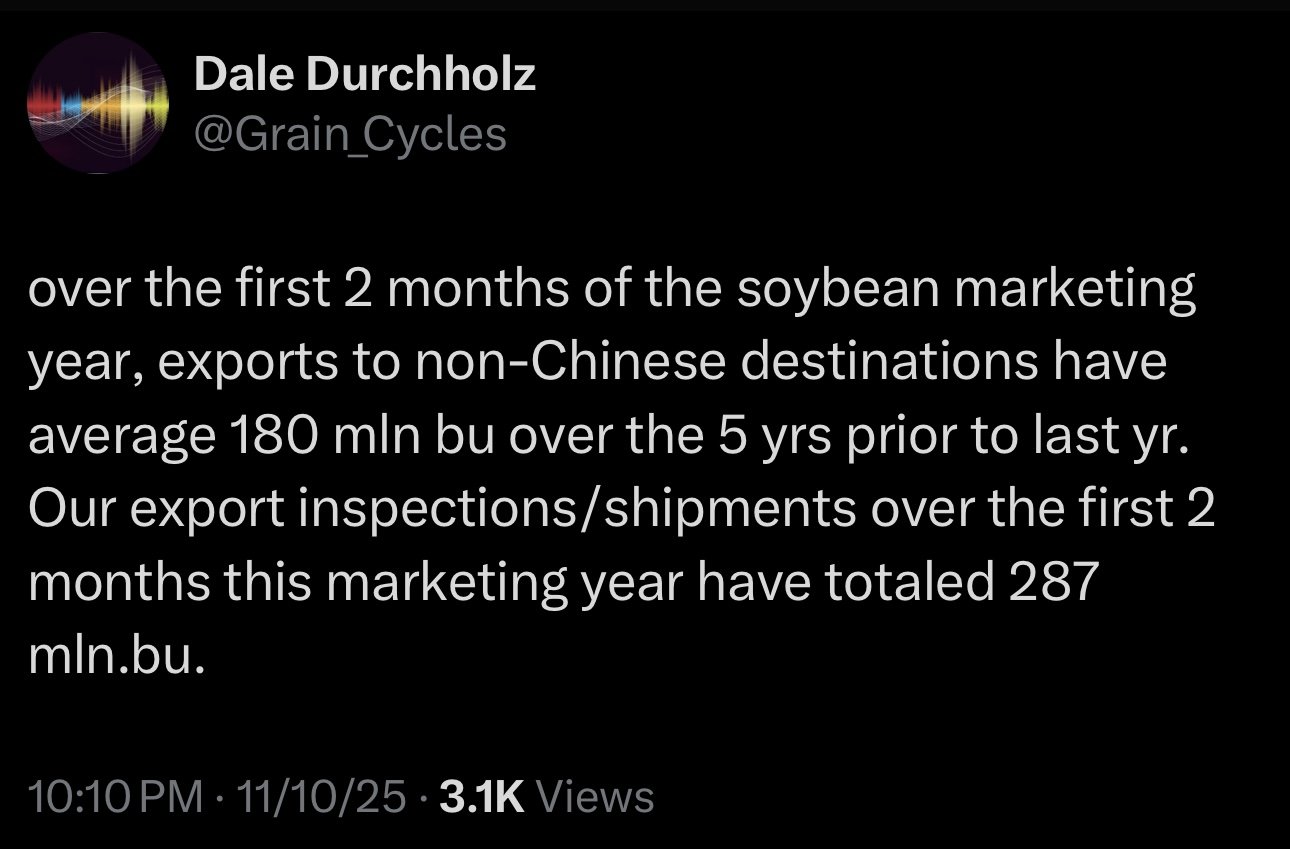
Here is a great tweet from Dale Durcholz:
"Over the first 2 months of the soybean marketing year, exports to non-China destinations have averaged 180 million bu over the 5 years prior to last year.
Our export inspections over the first 2 months this marketing year have totaled 287 million bu."
That would be a +60% increase YOY.
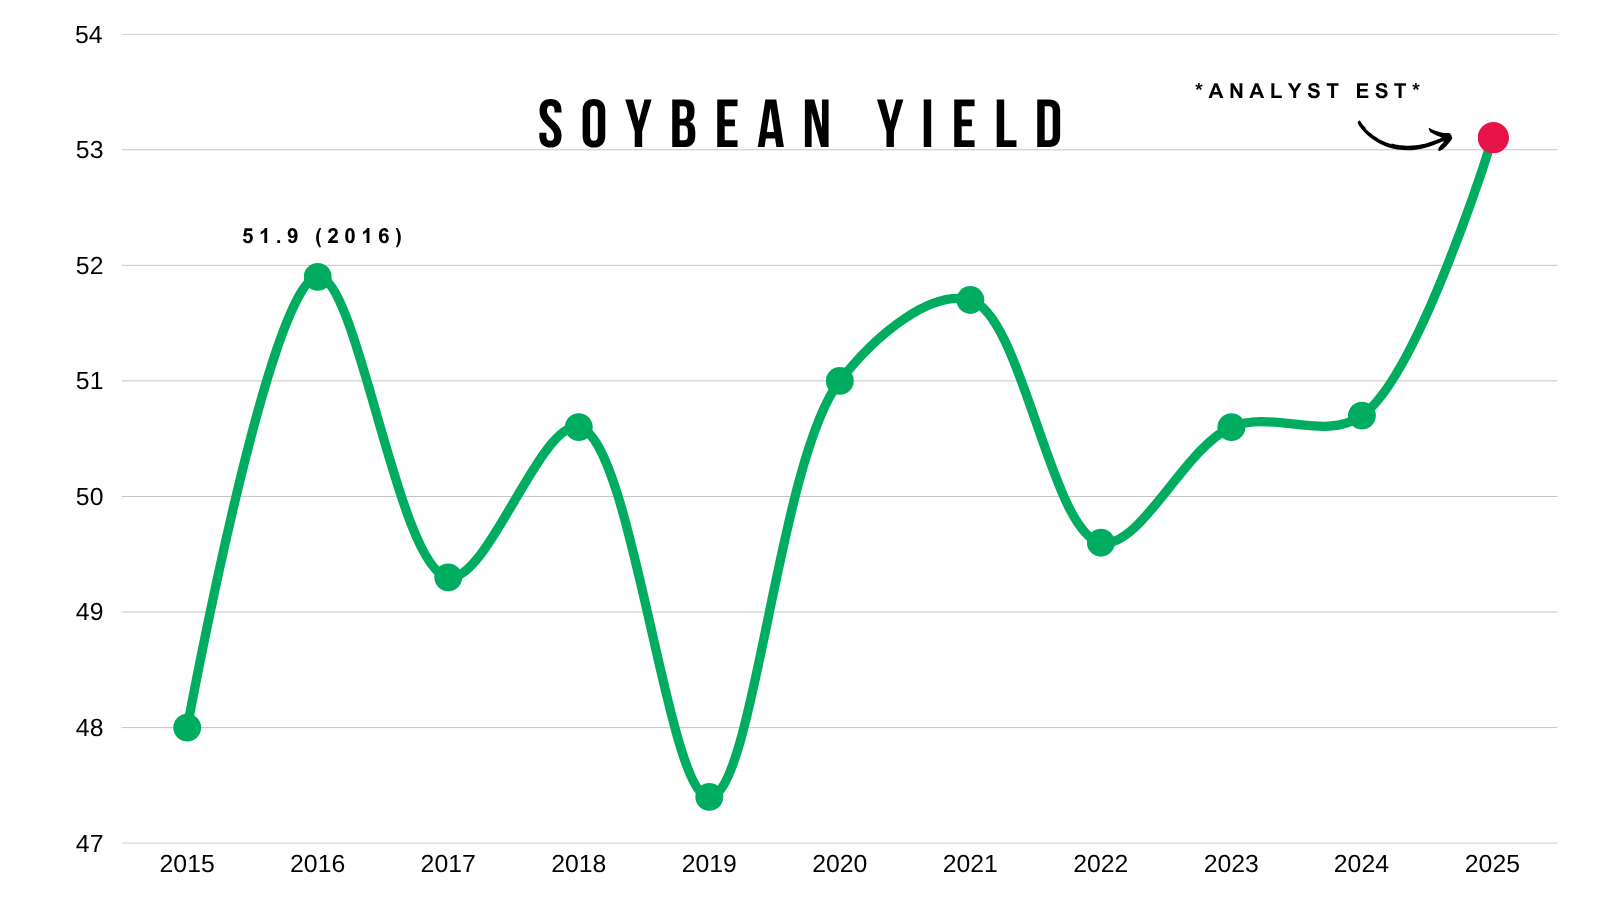
Looking at crop conditions.
Soybean crop conditions were actually worse than last year based on the last set of data we received.

Does this really scream yield is some far and away record we've never seen?
China isn’t buying some crazy amount of soybeans, and yes there are certainly concerns that they won’t live up to the promise.
But they basically agreed to just buy the normal amount of soybeans they do.
So I don’t think that is too hard of a task to accomplish.
The biggest difference over the last few years is crush demand.
Crush demand is +200-300 million bu more than it was the last time China was buying this same amount of soybeans.
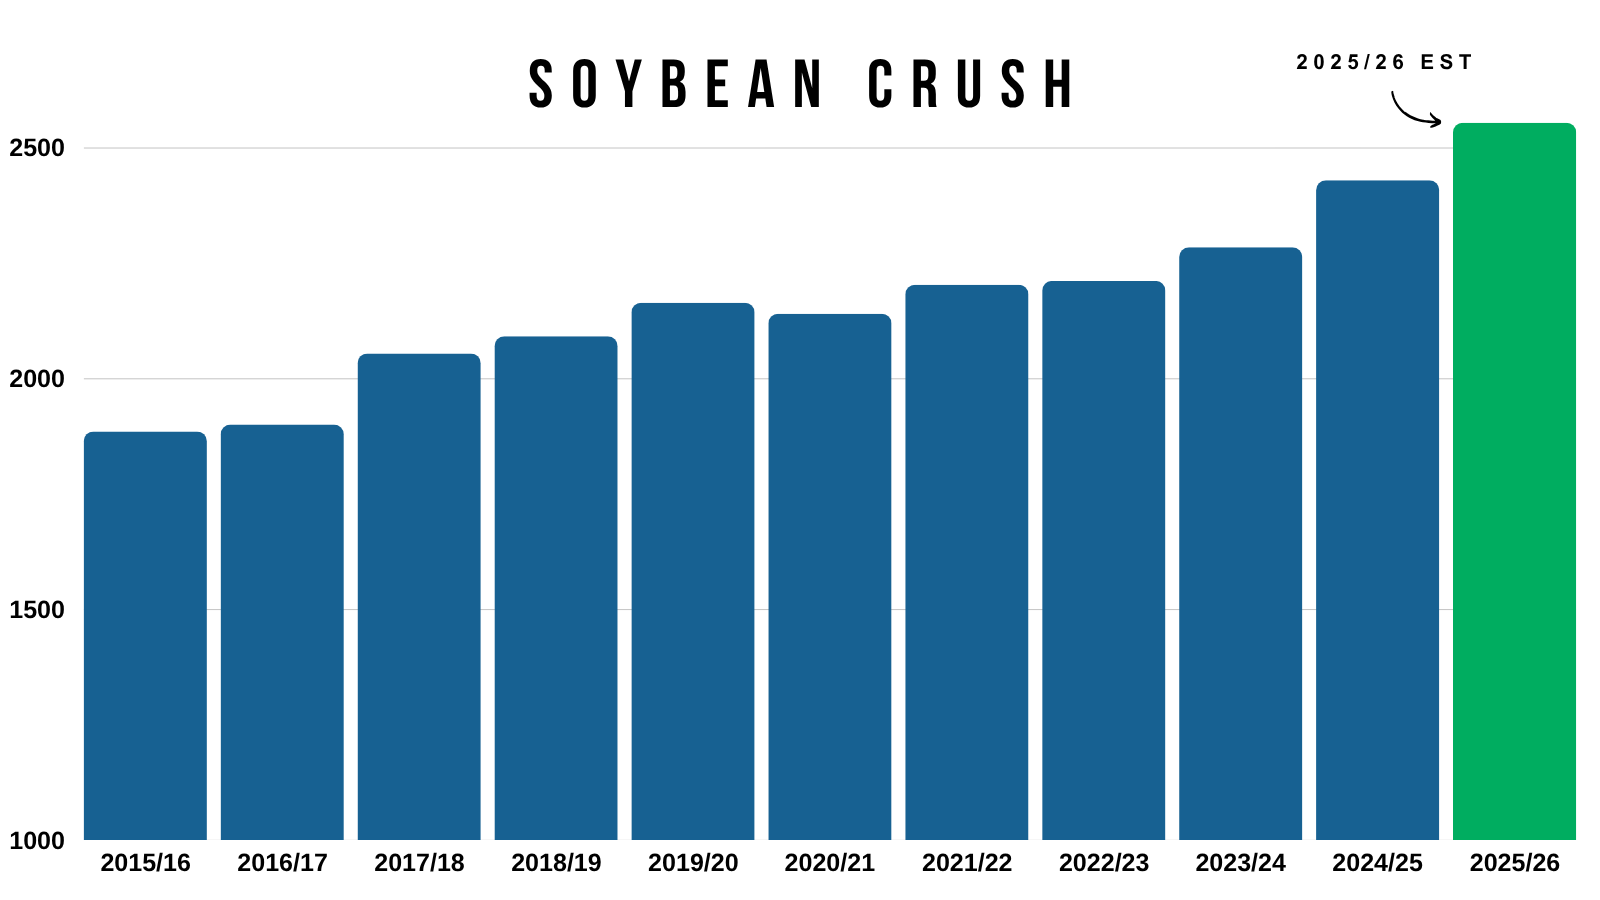
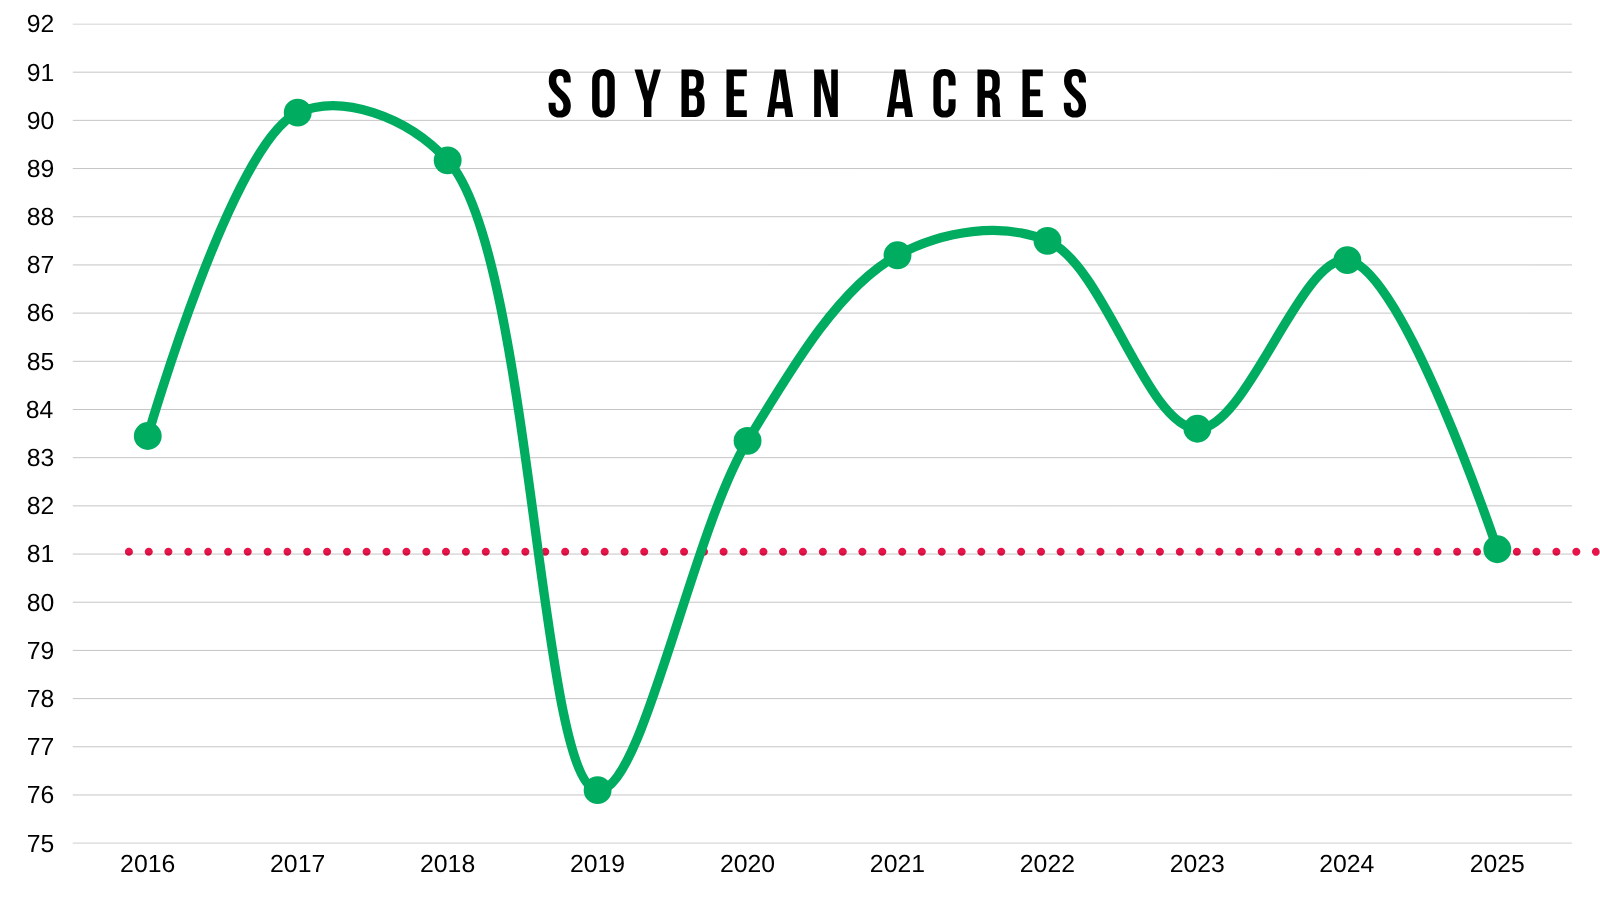
Not to mention we have the 2nd lowest acres in the last decade which shrinks the room for error on the balance sheet even further.
Any cut to soybean yield is going to have to be met with a cut to demand to prevent the balance sheet from becoming tight.
However, typically, to justify rationing demand lower, prices should go higher. To incentivize that loss in demand.
Because if you do not touch the demand numbers at all, here is how soybean carryout changes as you drop yield.
The balance sheet gets awfully tight fast like I've talked about for months.
However, USDA is going to more than likely going to be dropping export demand to some extent.
The upside in this market is certainly there as I've been stating all year long.
However, to see over $12 soybeans it will probably take some weather scares in Brazil's crop.
Currently, they aren’t seeing any major issues yet but it's something we have to start watching closely.
Technicals:
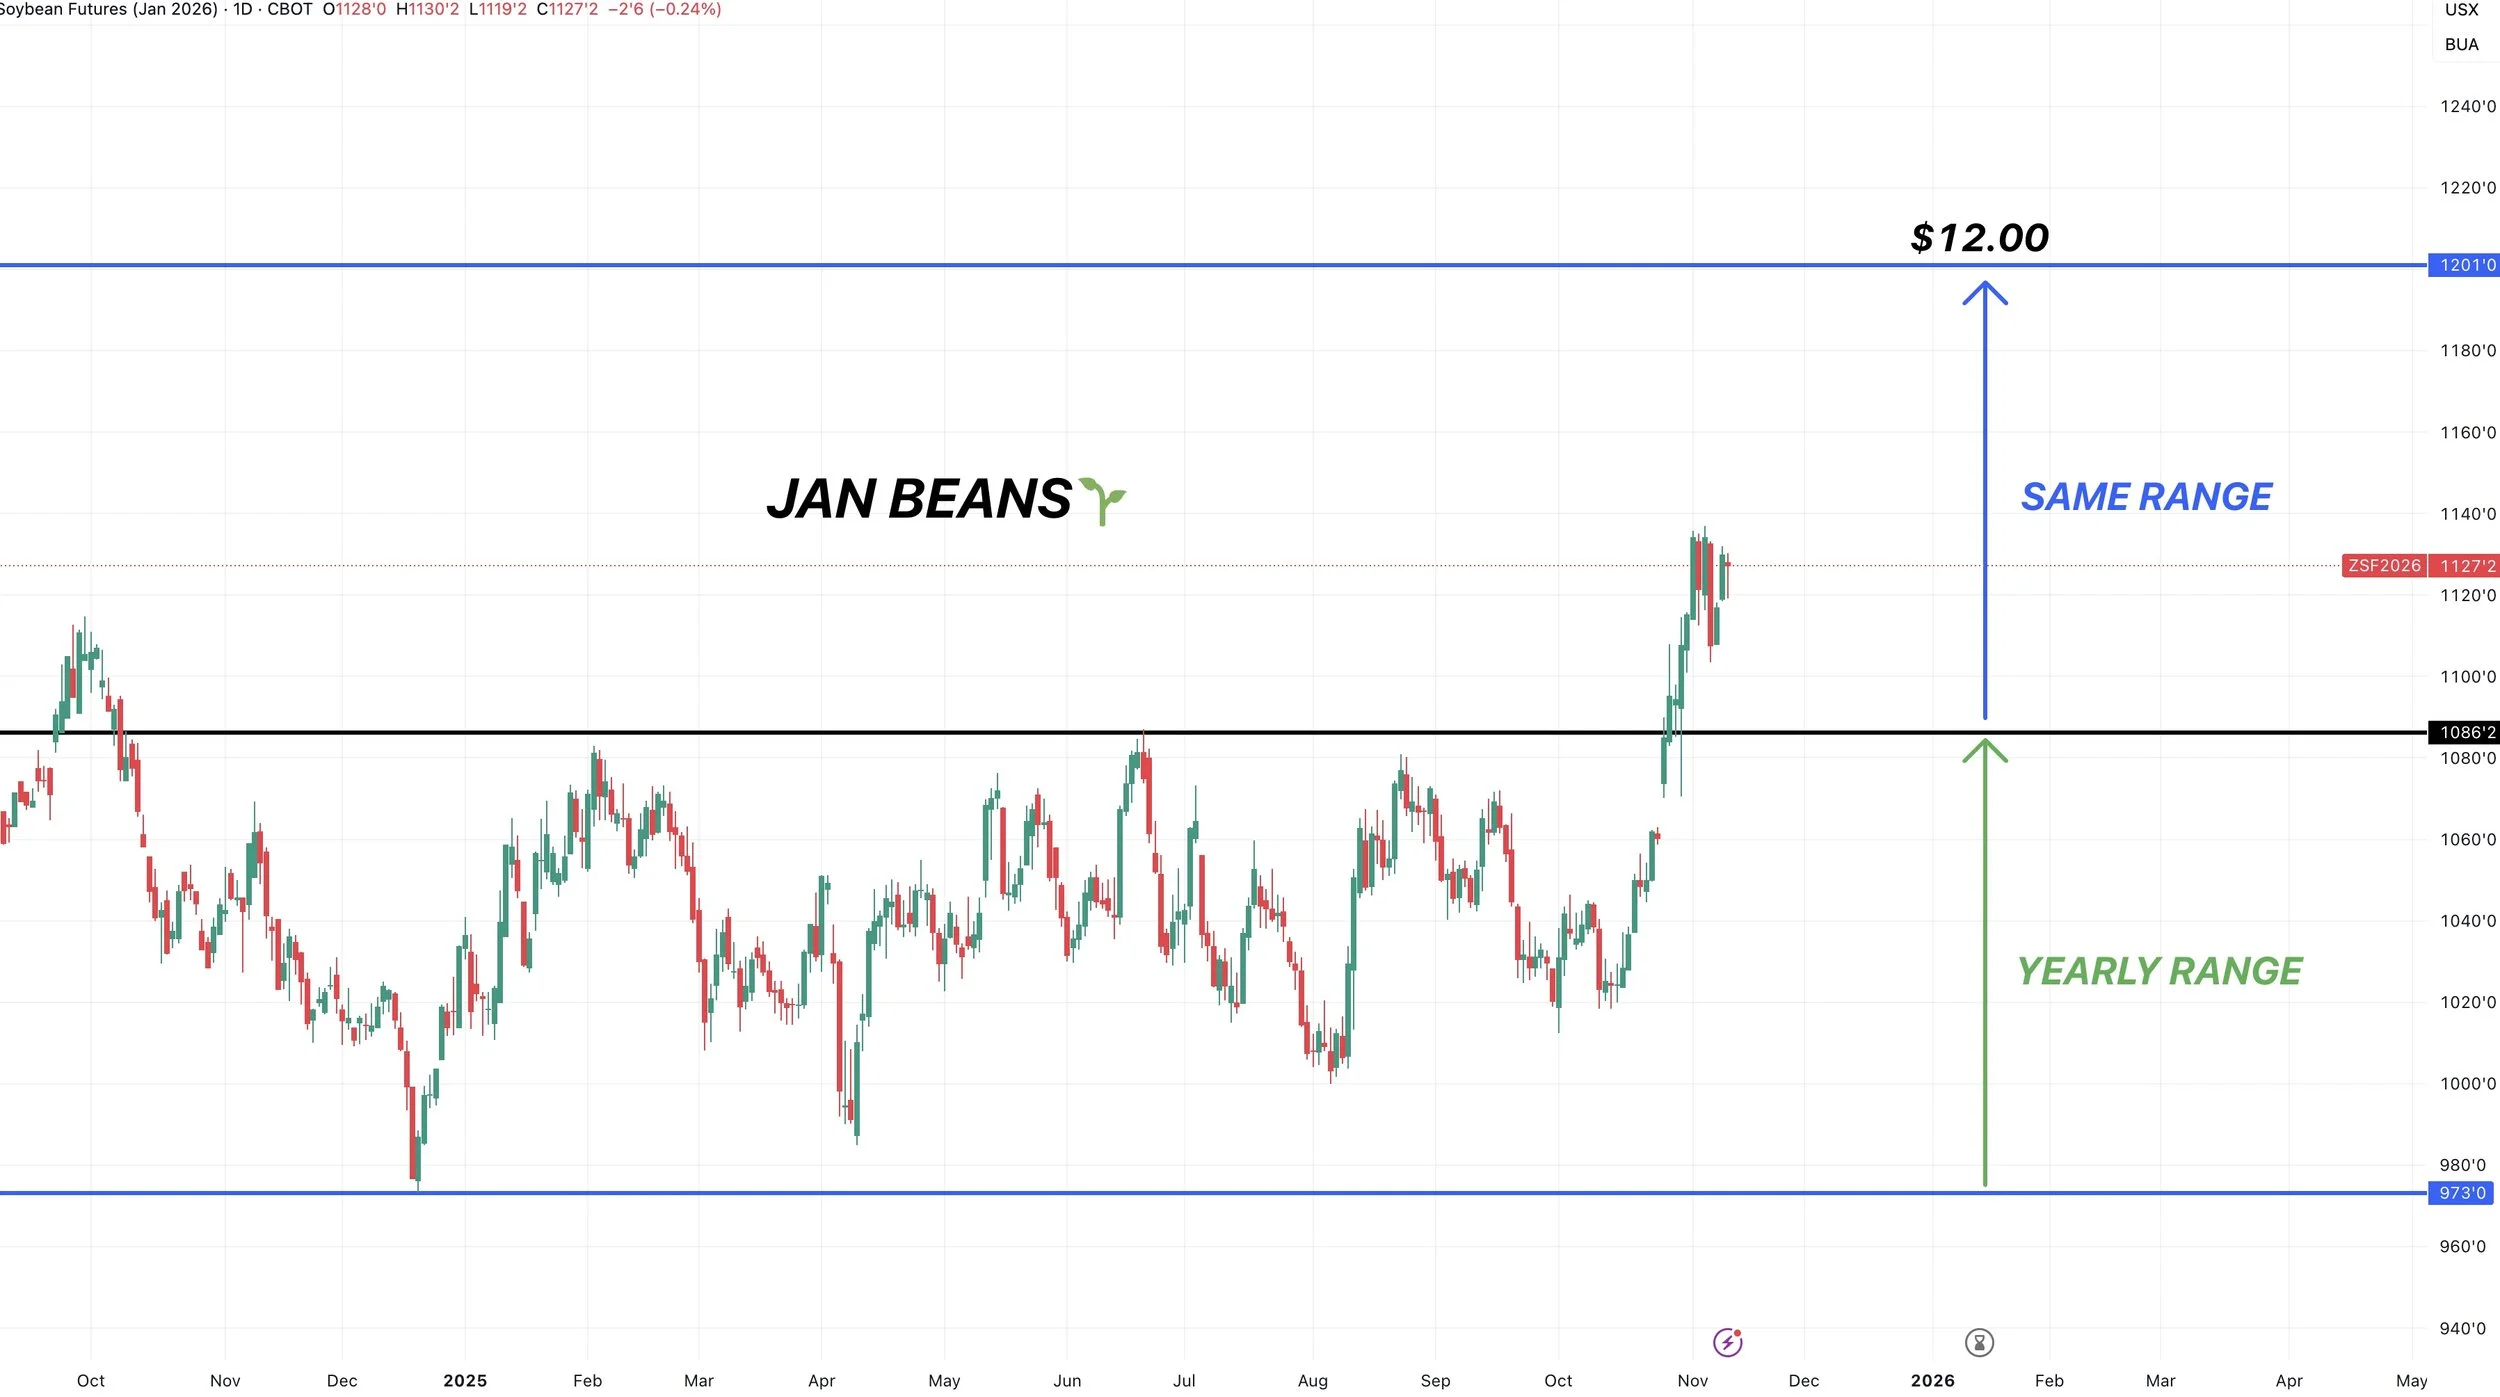
Jan Beans
Our next target to take risk off the table is $11.55.
We've only had 2 sell signals for soybeans in the last 8 months, both occurred at that previous yearly resistance.
Why is $11.55 the next target?
It gives back 61.8% of the contract highs.
We are above the 50% level. Next level is 61.8%.

$12.00 Soybeans?
I am not saying soybeans "have" to go to $12.00
These next charts simply point out a few reasons why we "could".
As they make a pretty compelling arguement that could justify a move towards to $12.00.
Soybeans were trapped in a $1.14 range for over a year.
Trading between $9.73 and $10.87
We've broken out of that range.
If you take the $1.14 range then add that on top of the point of breakout from the range ($10.87)
It gives you right about $12.00
($1.14 + $10.87 = $12.01)
Here is the monthly chart.
Soybeans hate trading in the $11.00's.
As of a matter of fact, every single time we've traded in the $10's and then rallied into the $11's, we have never stopped in the $11's.
Every time we have rallied to $12 or higher.

Here is the weekly chart.
We cleary broke out of a +1 year range with room to run.
Our resistance the entire year was also resistance in 2015, 2017, and 2018.
In the last decade, we've broken above this resistance twice before now.
The first time was 2016. We then rallied straight to $12.00 before stopping.
Then in 2020 where we continued a lot higher.

Wheat
Fundamentals:
I don’t have anything to update on wheat today.
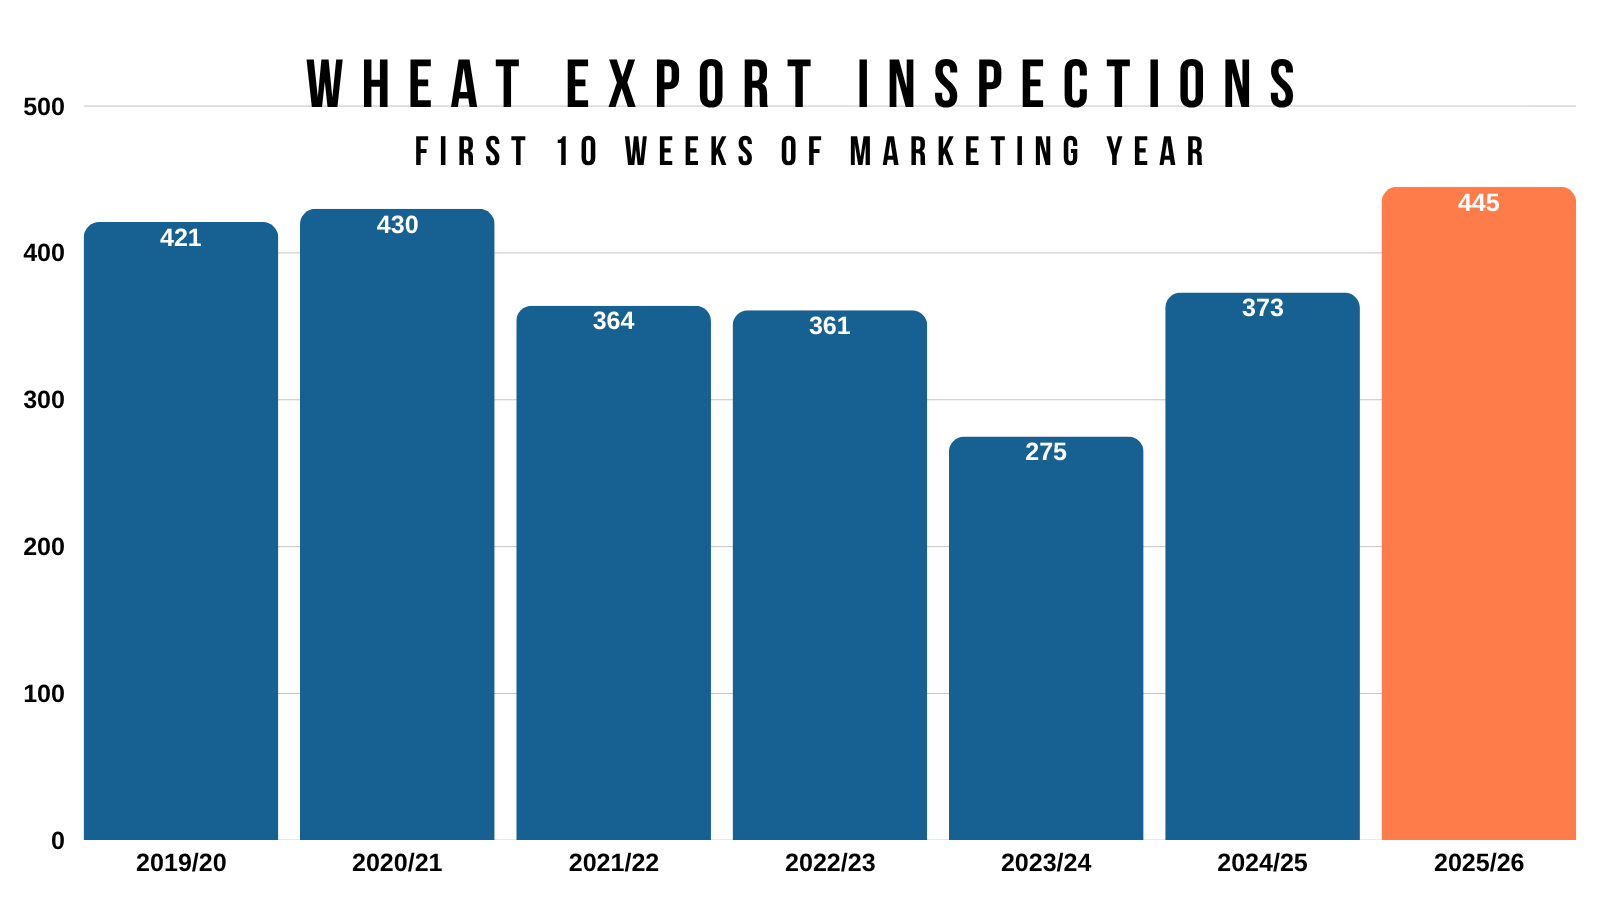
Export demand continues to impress.
Export inspections are some of the best ever.
They are up +19% vs last year.
Technicals:
Dec Wheat
We tapped that target box last week.
I still like taking some risk off the table in this green box.
As it claws back 50-61.8% of the June highs. Which is a common spot for a rally to end.
If we break above the 61.8% level then odds favor higher. But until then, it is a spot we want to reward if we get there again.
To the downside, we need to hold the orange box. That gives back 50-61.8% of the entire rally. The most common spot for a bounce to happen.

Dec KC Wheat
Unlike Chicago, we did not quiet reach the golden zone target box.
That is still the area we want to start to de-risk if we get up there.

Cattle
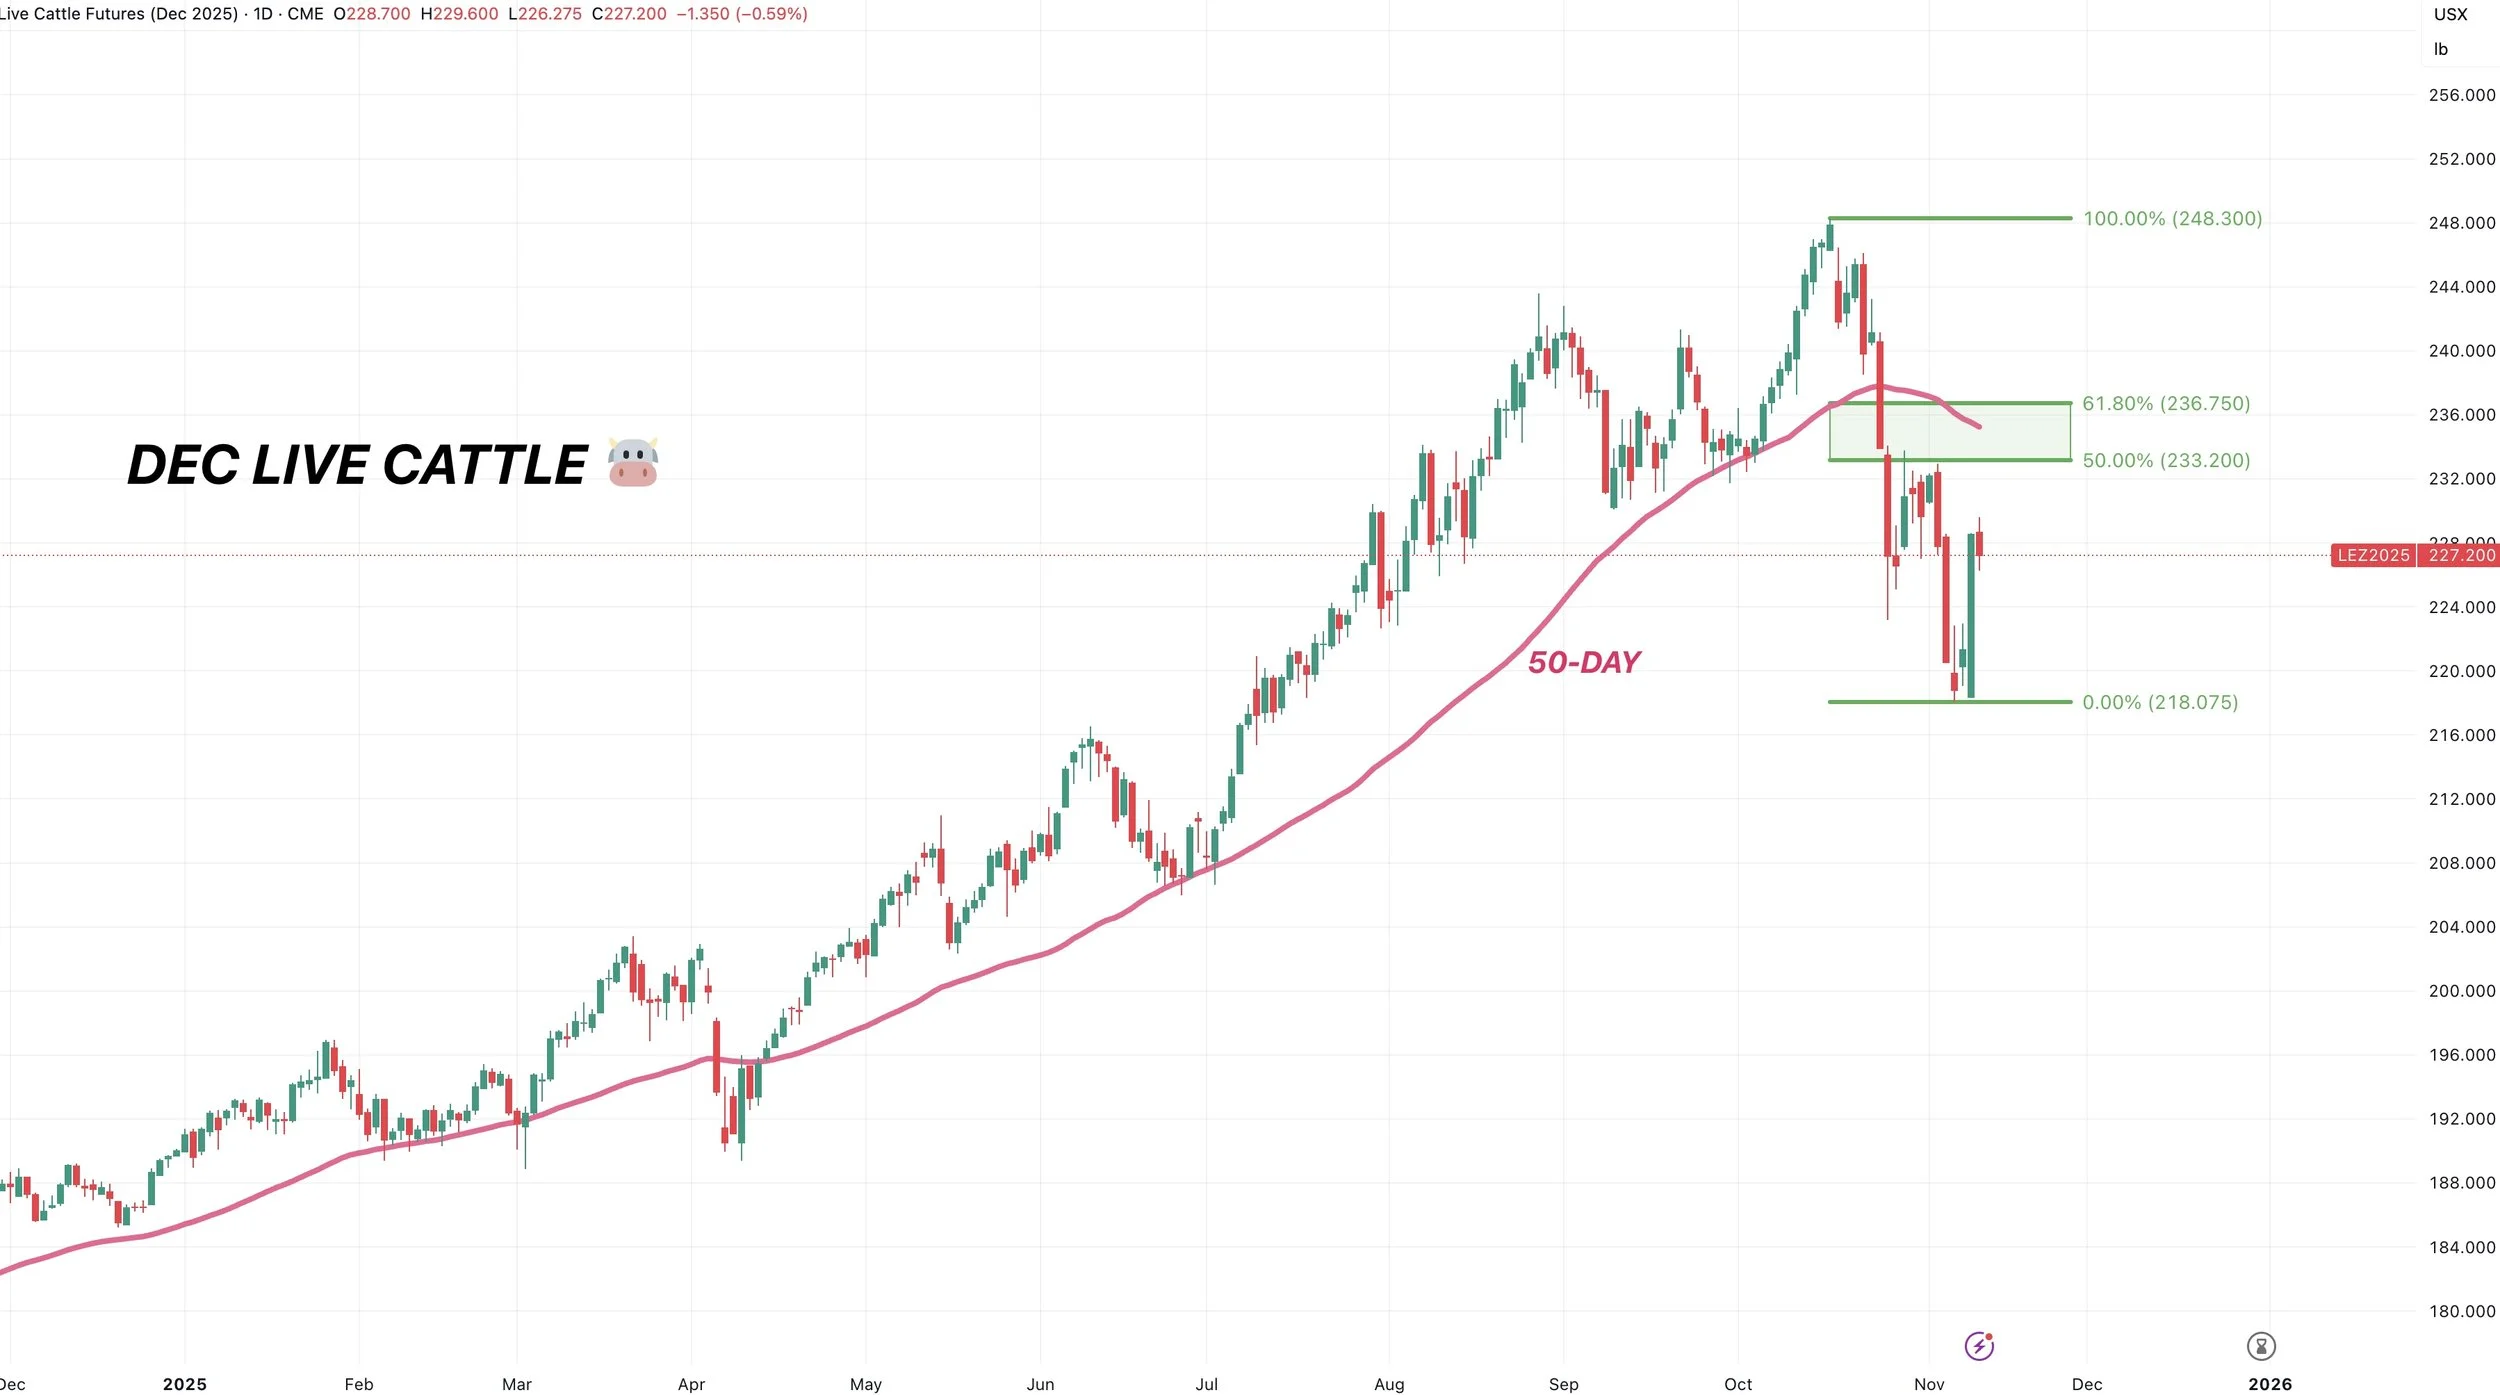
Dec Live Cattle
If we get some legs to this bounce, we want to look to reward this rally in this green box.
It gives back 50-61.8% of the sell off. Which is the most common spot for a relief bounce to fail. It is the golden zone.
Not only that, but we also have the 50-day MA that sits right in that box as well.
If you remember, the 50-day MA was once massive support the entire year long. So if we get up there, it could offer resistance.
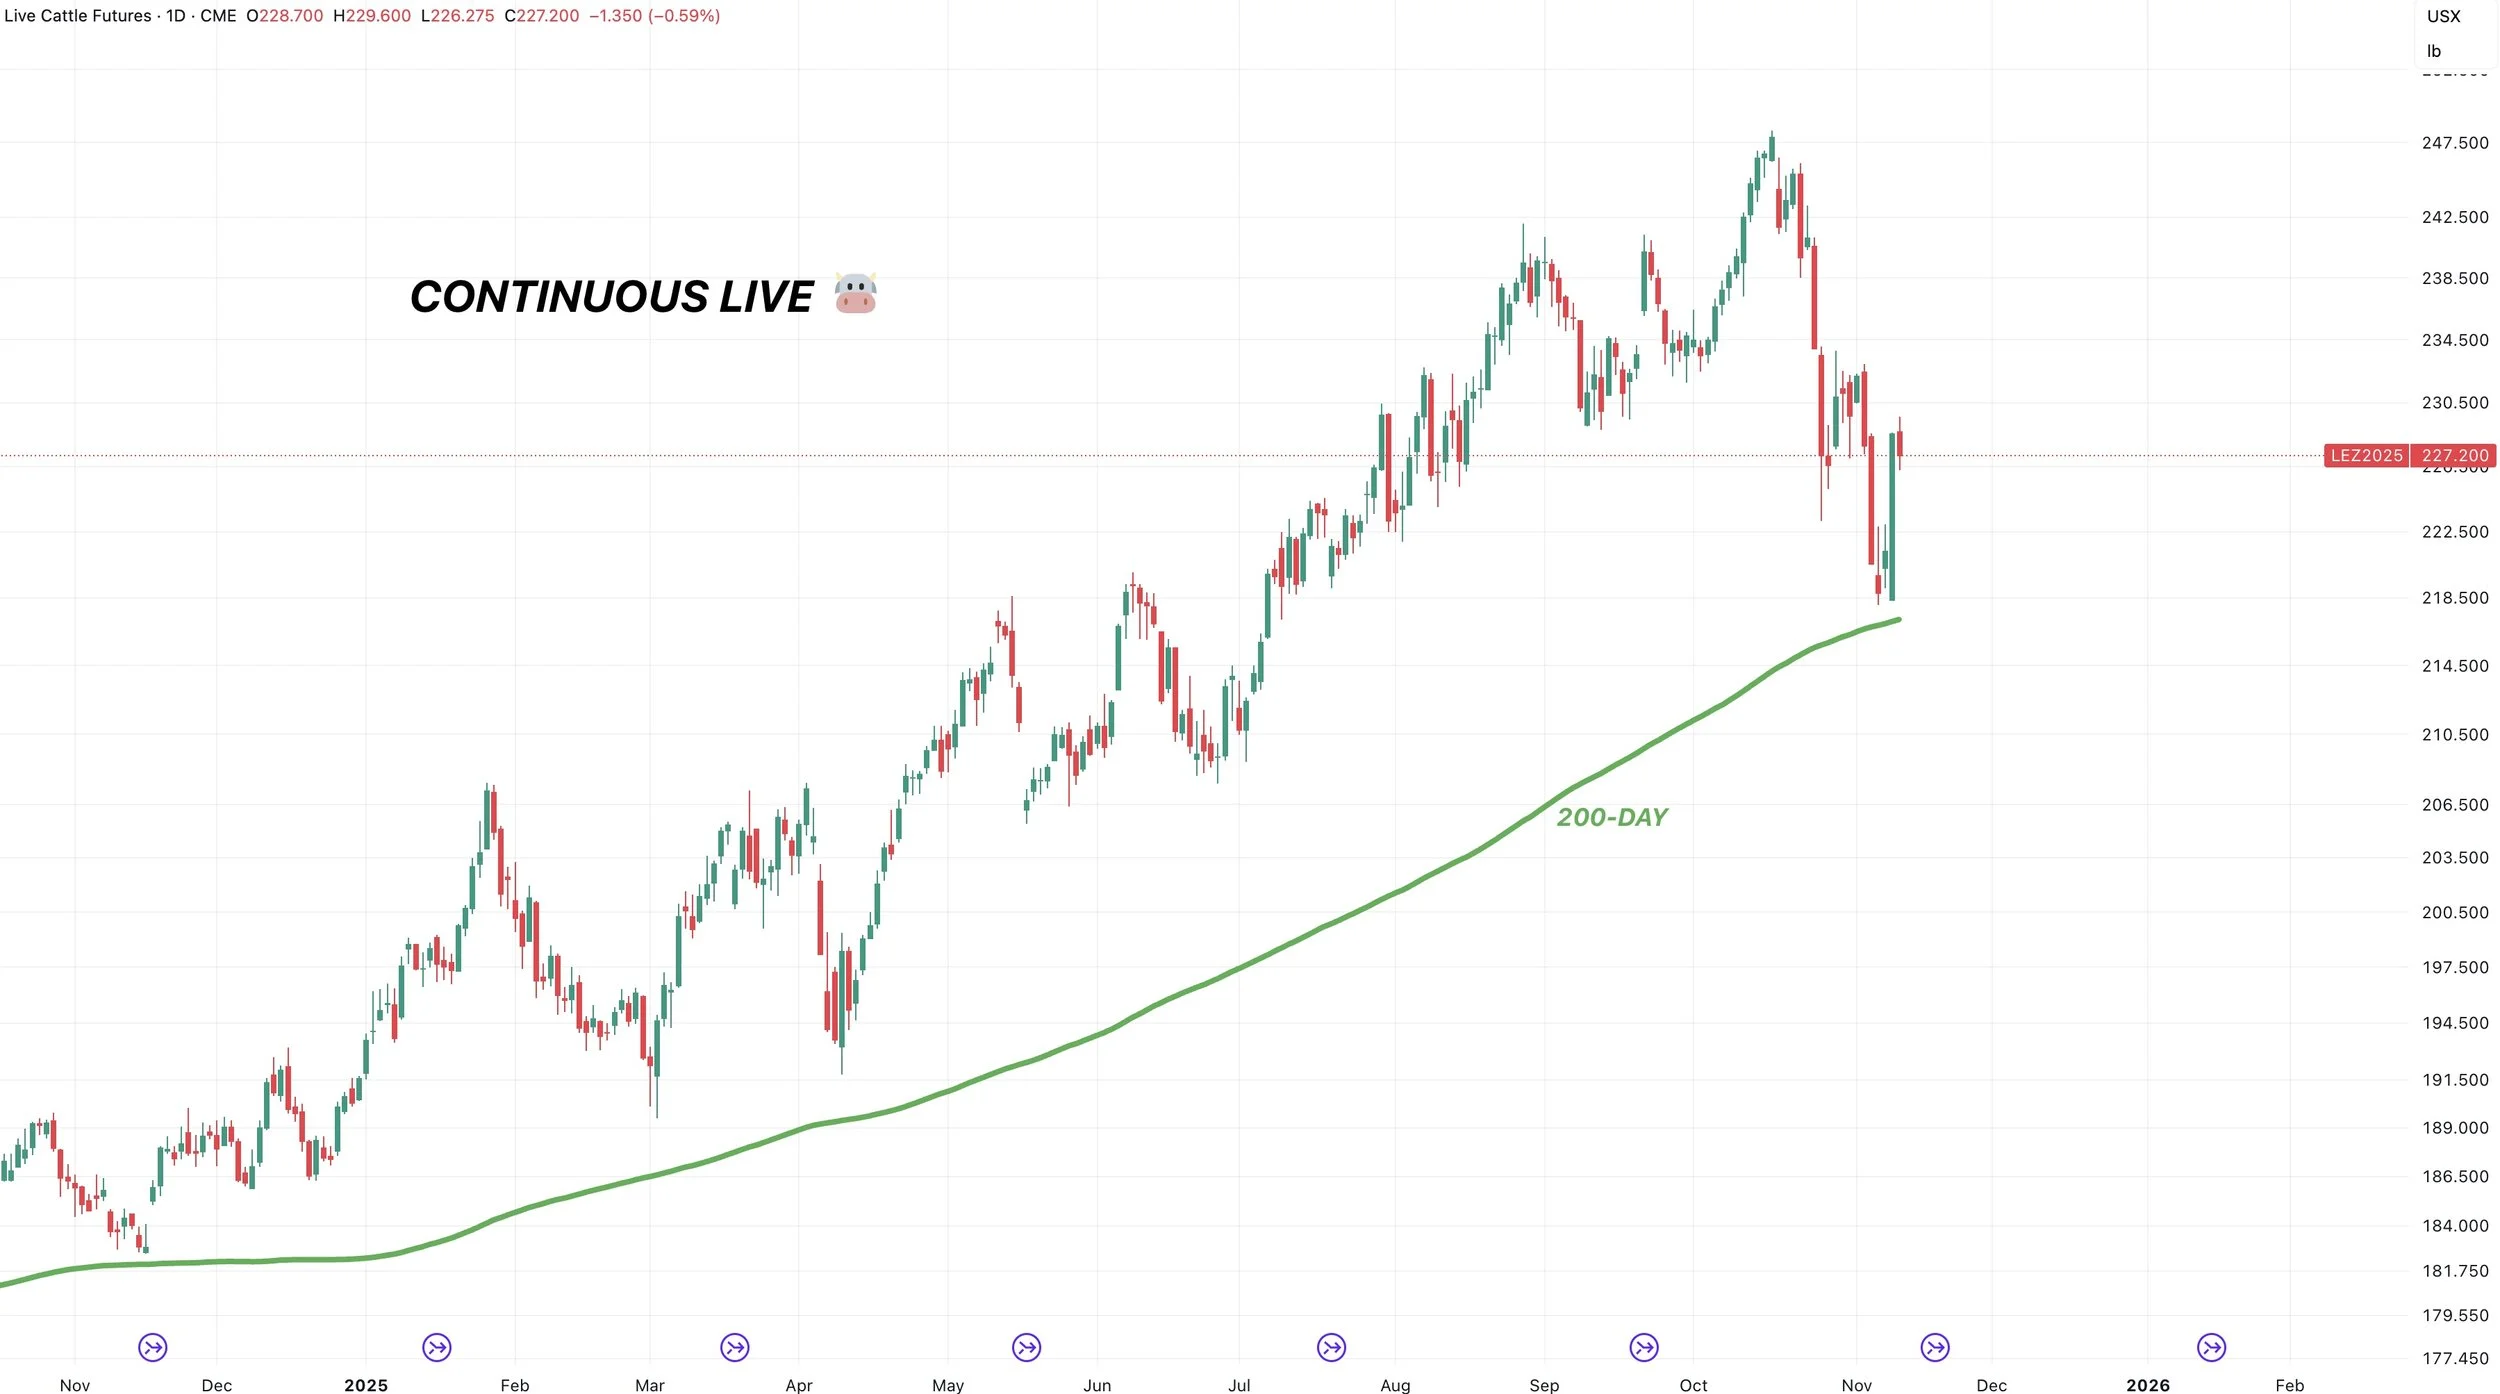
Continous Live
We found support right at that 200-day MA which was our downside objective.
We need to hold that to prevent sparking further downside.
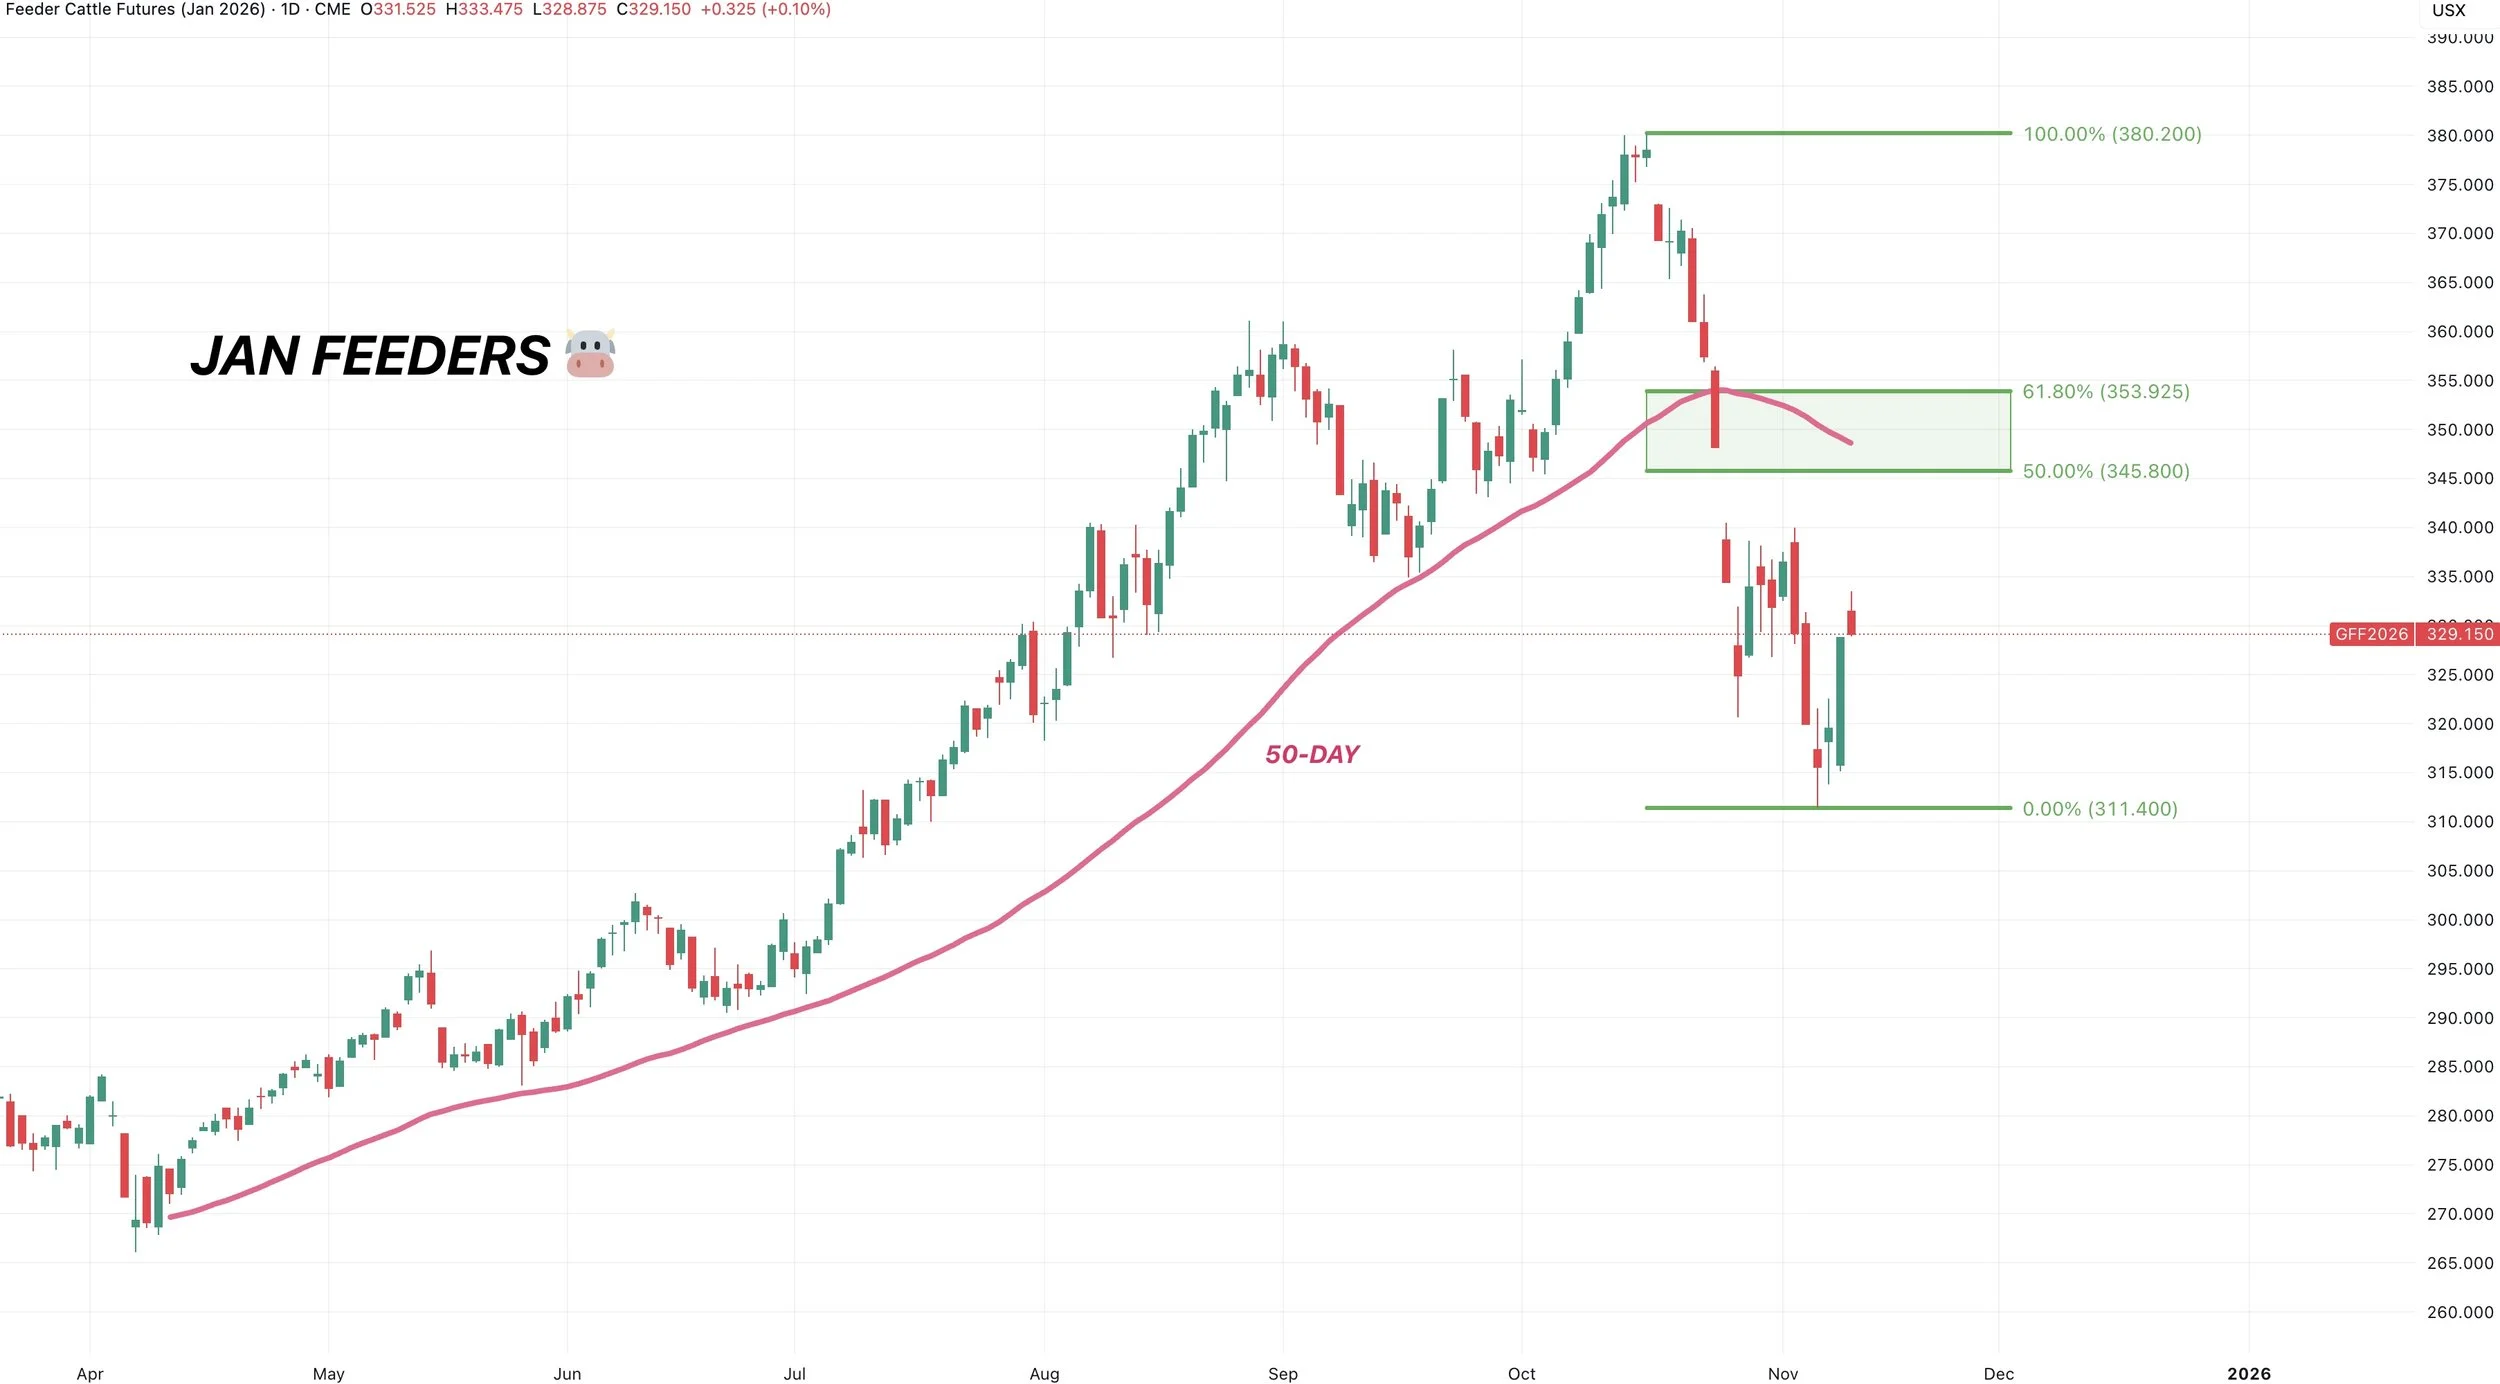
Jan Feeder
If we get a bigger bounce, we want to reward the rally in this green box.
That reclaims 50-61.8% of the sell off.
It is also the 50-day MA which was once support.
We also have that large gap that sits there.
Continuous Feeder
Like continuous live, we found support right around that 200-day MA.
If that breaks, it could open the door a lot lower.

Past Sell or Protection Signals
Oct 28th: 🌽
Corn sell signal & hedge alert.
Oct 27th: 🌱
Soybean sell signal & hedge alert.
Oct 13th: 🐮
Cattle sell signal & hedge alert.
Aug 22nd: 🌱
Soybean sell signal & hedge alert.
July 31st: 🐮
Cattle sell signal & hedge alert.
July 10th: 🐮
Cattle sell signal & hedge alert.
CLICK HERE TO VIEW
June 5th: 🐮
Cattle sell signal & hedge alert.
June 2nd: 🌾
MPLS wheat sell signal.
April 10th: 🌽
Old crop corn sell signal.
March 19th: 🐮
Cattle hedge & sell signal.
Feb 18th: 🌽 🌾
Old crop KC wheat & old crop corn signal.
Jan 23rd: 🌽 🌱
Corn & beans old crop sell signal.
CLICK HERE TO VIEW
Jan 15th: 🌽 🌱
Corn & beans hedge alert/sell signal.
Jan 2nd: 🐮
Cattle hedge alert at new all-time highs & target.
Dec 11th: 🌽
Corn sell signal at $4.51 200-day MA
CLICK HERE TO VIEW
Oct 2nd: 🌾
Wheat sell signal at $6.12 target
Sep 30th: 🌽
Corn protection signal at $4.23-26
Sep 27th: 🌱
Soybean sell & protection signal at $10.65
Sep 13th: 🌾
Wheat sell signal at $5.98
May 22nd: 🌾
Wheat sell signal when wheat traded +$7.00
Want to Talk?
Our phones are open 24/7 for you guys if you ever need anything or want to discuss your operation.
Hedge Account
Interested in a hedge account? Use the link below to set up an account or shoot Jeremey a call at (605)295-3100.