
USDA SNOOZE
MARKET UPDATE
You can scroll to read the usual update as well. As the written version is the exact same as the video.
Timestamps for video:
Overview: 0:00min
Corn: 2:50min
Beans: 9:15min
Wheat: 11:30min
Cattle: 14:30min
Want to talk?
Office: (806)484-1214
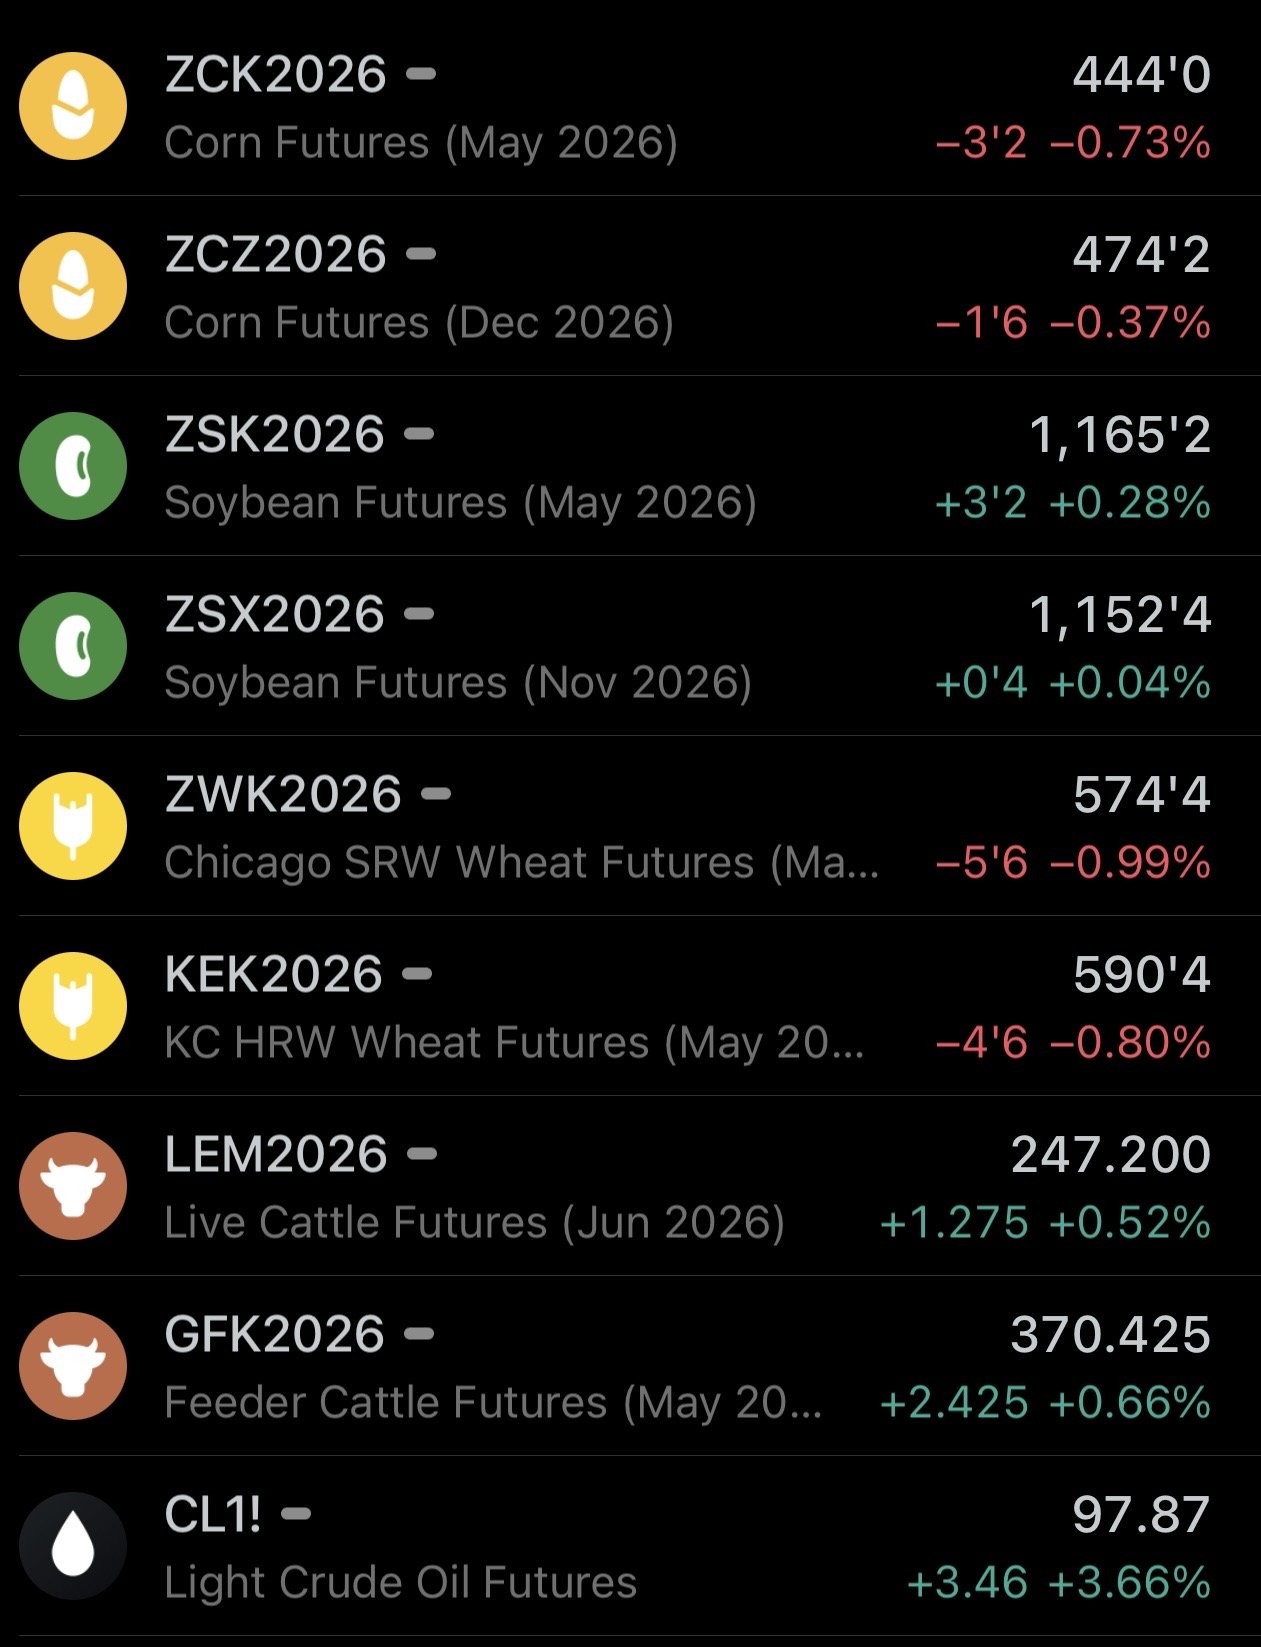
Futures Prices Close
Overview
Grains mostly lower, failing to follow crude higher once again.
Seems like we follow crude on the way down lately, but not on the way up.
Crude did fade -$5 off it's early highs.
Today we had a USDA report.
The report didn’t offer any major changes, but let's jump right in.
USDA Report Recap
Immediate reaction to the report was a snooze.
This report was only an old crop report. We won't get the official new crop balance sheets until May. So that will be a bigger report.
This report is usually not a market mover, and this one was not.
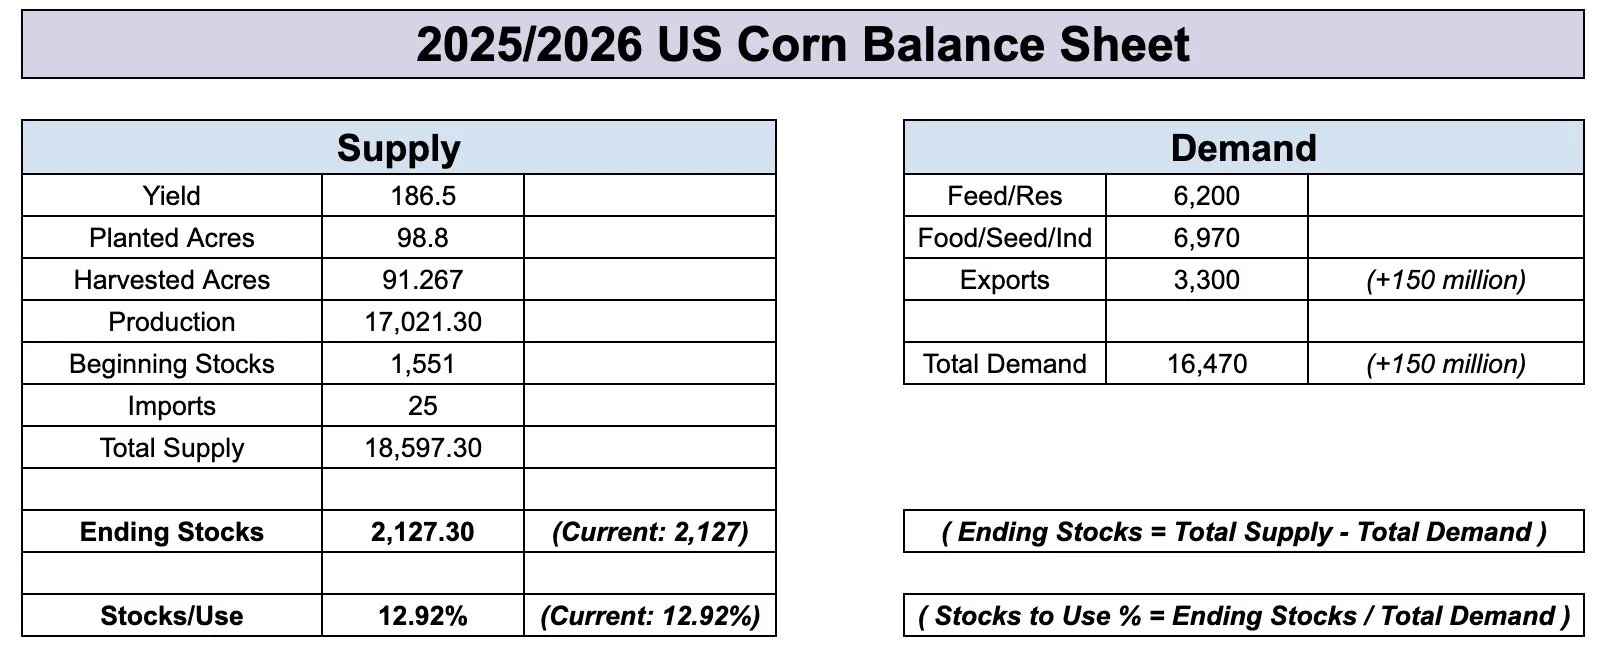
They left the old crop corn balance sheet completely unchanged. Which was expected.
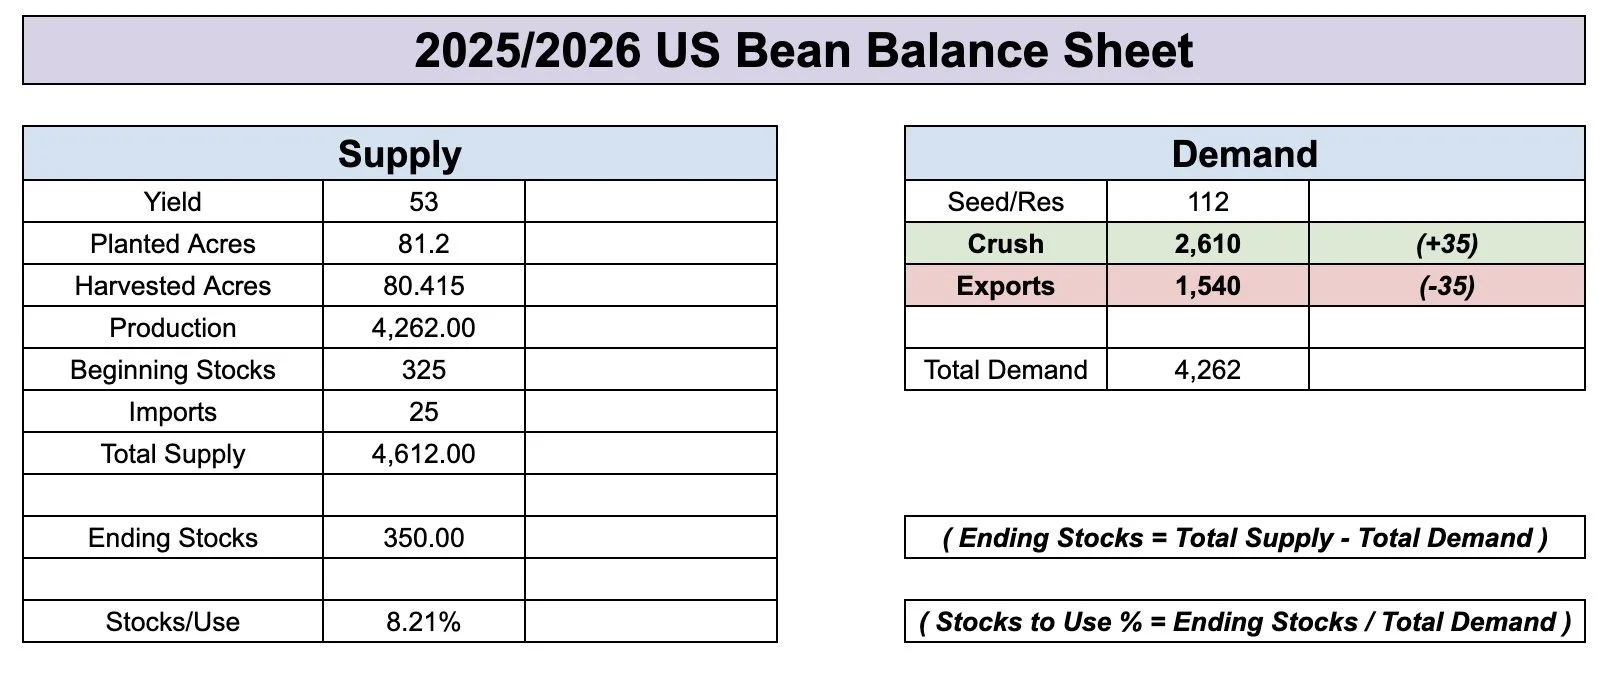
For soybeans, they made some slight adjustments to demand but nothing crazy.
They dropped export demand by -35 million bushels, which wasn’t a surprise.
But they also bumped crush demand by +35 million bushels.
As a result, it was a complete wash. Leaving the old crop soybean balance carryout completely unchanged.
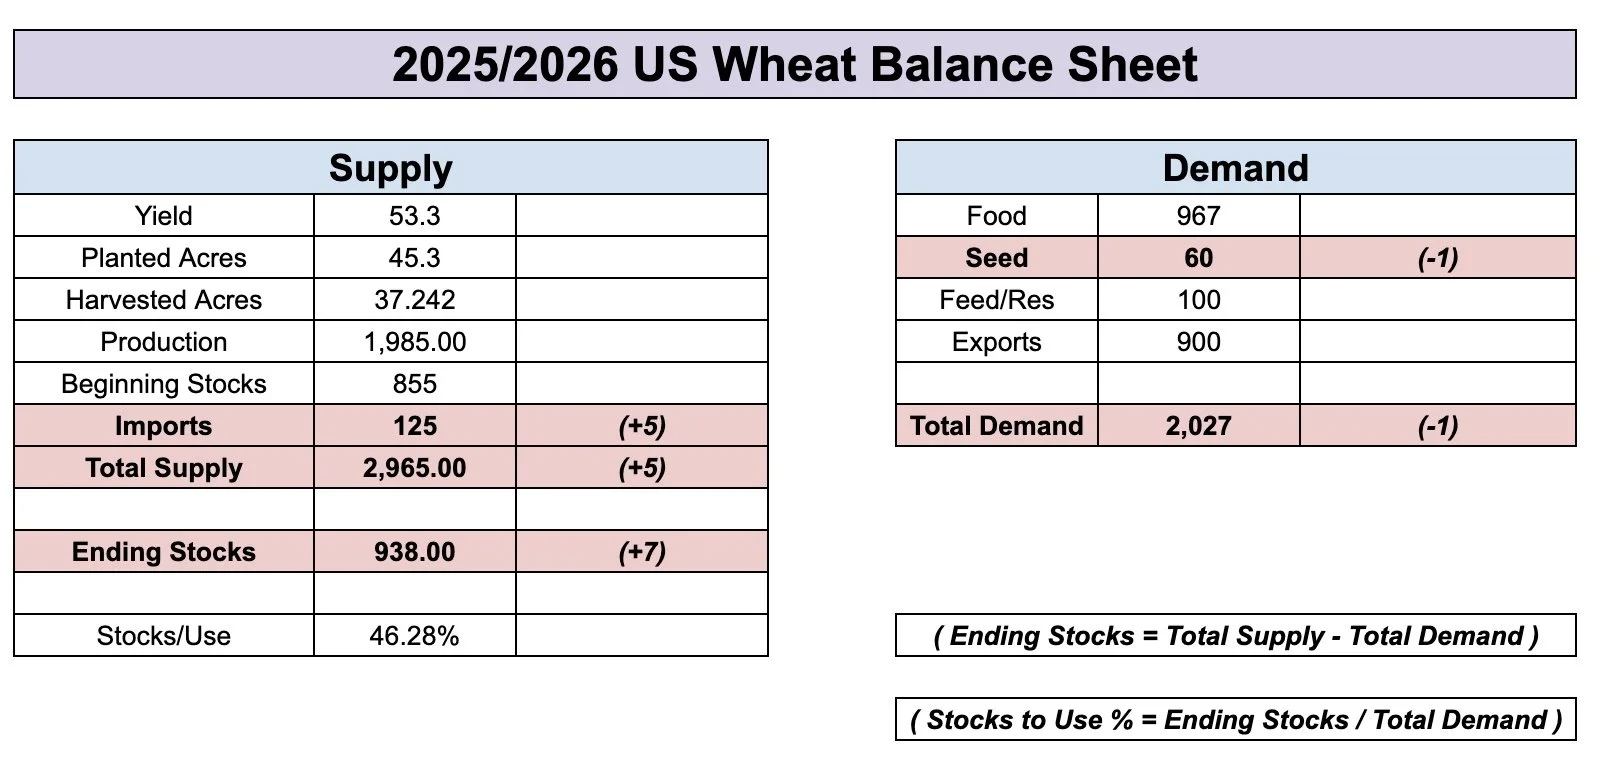
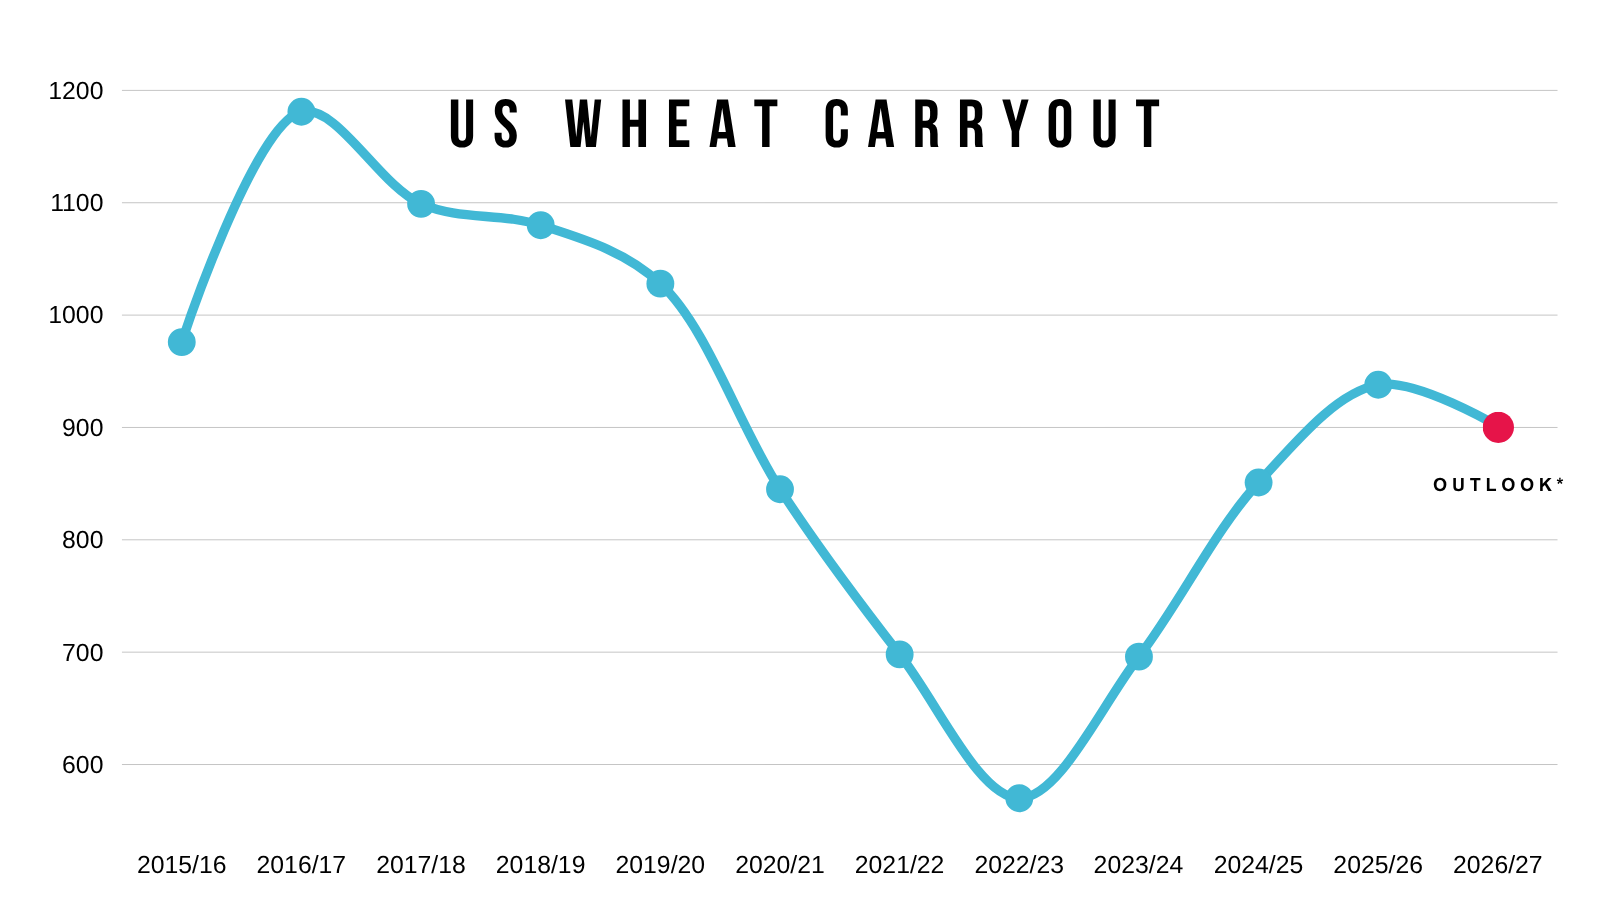
For the wheat US balance sheet, the trade was expecting carryout to fall slightly, but instead it actually jumped slightly.
USDA Today: 938 million bu
Trade Estimate: 923 million bu
USDA March: 931 million bu
They bumped production by 5 million via imports.
Some small changes that resulted in a slight 7 million bump to carryout.
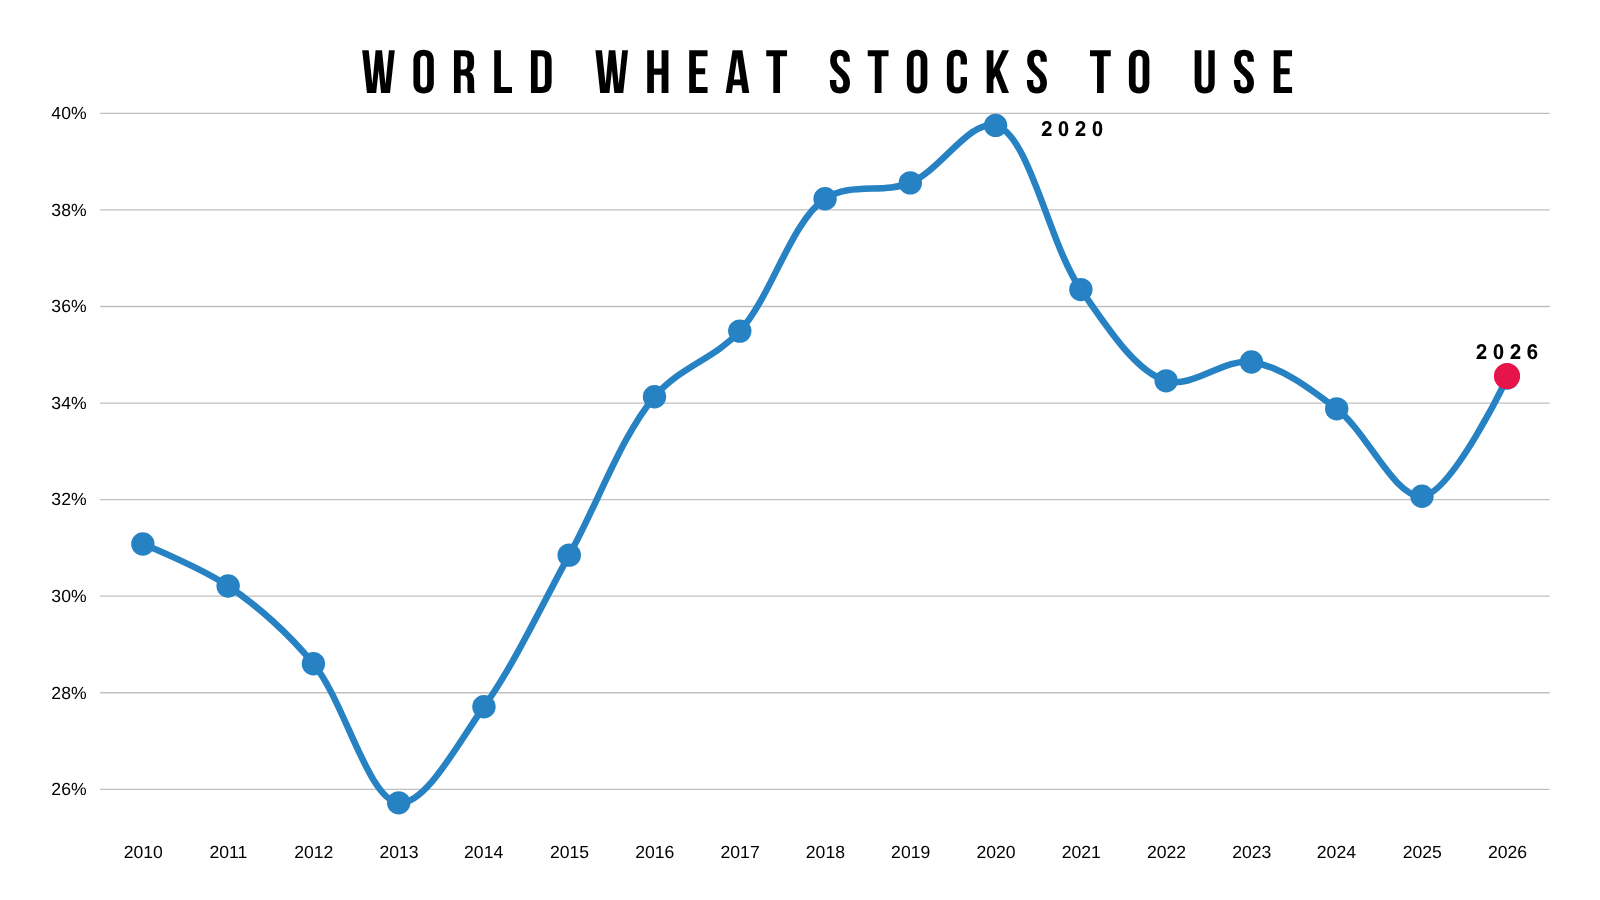
The biggest surprise came through the world numbers.
Specifically for wheat. Which was why the wheat market saw some pressure today.
USDA Today: 283.12 MMT
Trade Estimate: 277.07 MMT
USDA March: 276.96
The reason for wheat surprising high was because India had larger supplies in their own government report due to less domestic use.
That number isn’t super relevant though, as India doesn’t export any wheat to begin with.
Corn also surprised slightly high, meanwhile soybeans came in just below the estimates.

They opted to leave all of the South America crops completely unchanged.
So nothing noteworthy there.
The CONAB will have their estimates out on April 14th.

War Rollercoaster Continues
The war headlines continue to flip back and forth.
Headlines are still all over the place, and hard to keep track of.
We had the US and Iran agree to a 2-week ceasefire on Tuesday night.
But now that ceasefire has doubts.
The US agreed on a ceasefire if Iran opened the strait.
Which they did. The strait was open, but there were still hardly any ships moving through it. Only a handful of ships moved through from what I've seen.
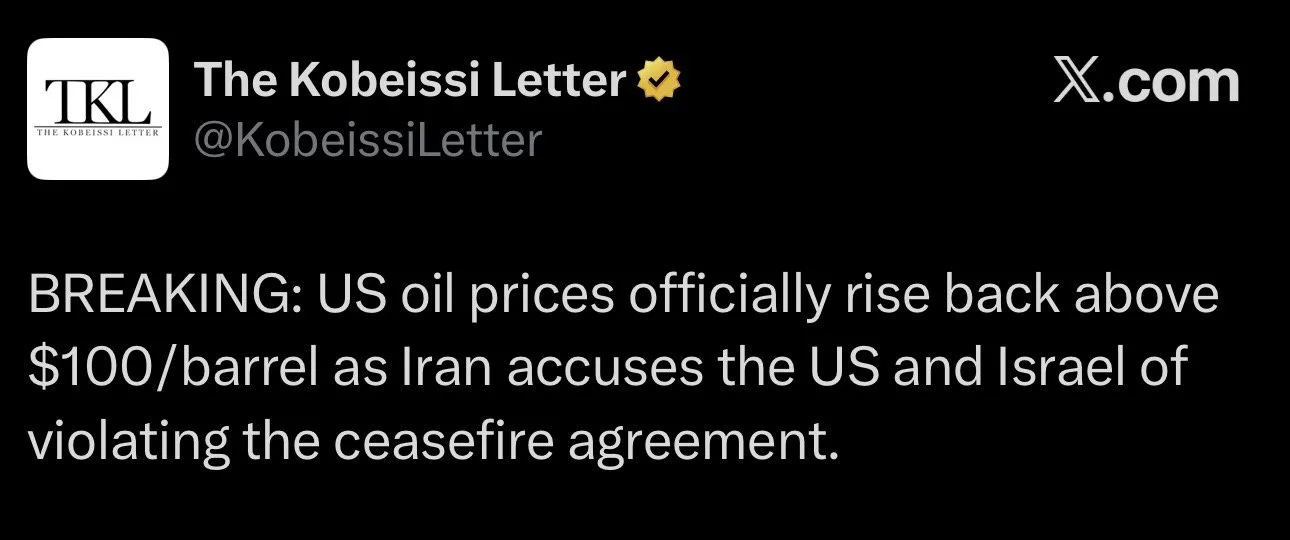
Then we have Iran accusing the US and Israel of violating the ceasefire agreements just a day or two after it was made.
Ceasefires are fragile, so who knows if it'll last, and who knows if it'll lead to an actual peace deal.
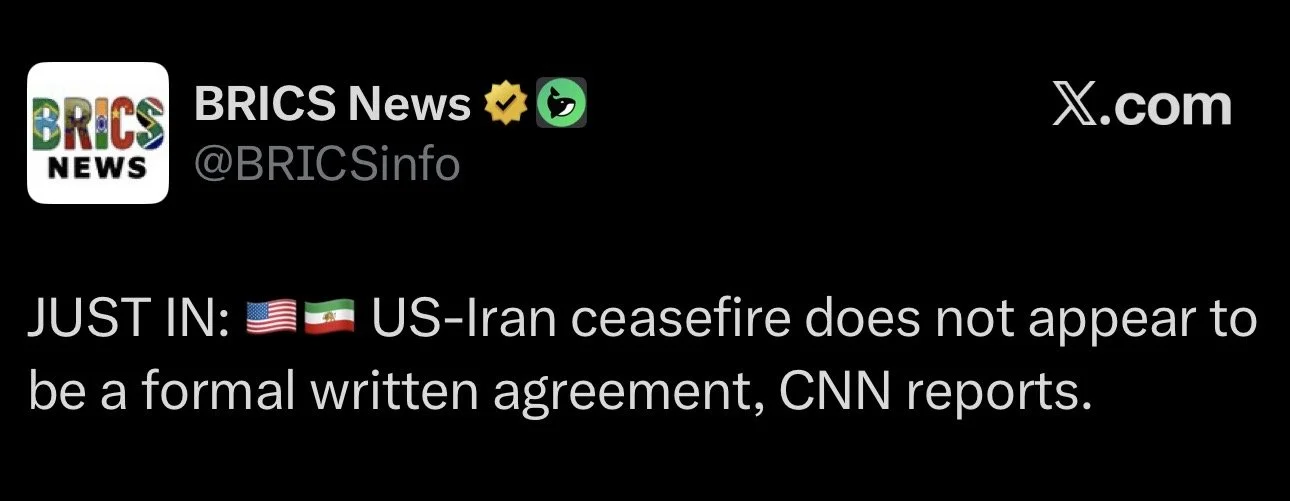
I mean the ceasefire was never actually anything put in hand writing either. Just a verbal agreement from the sounds of it.
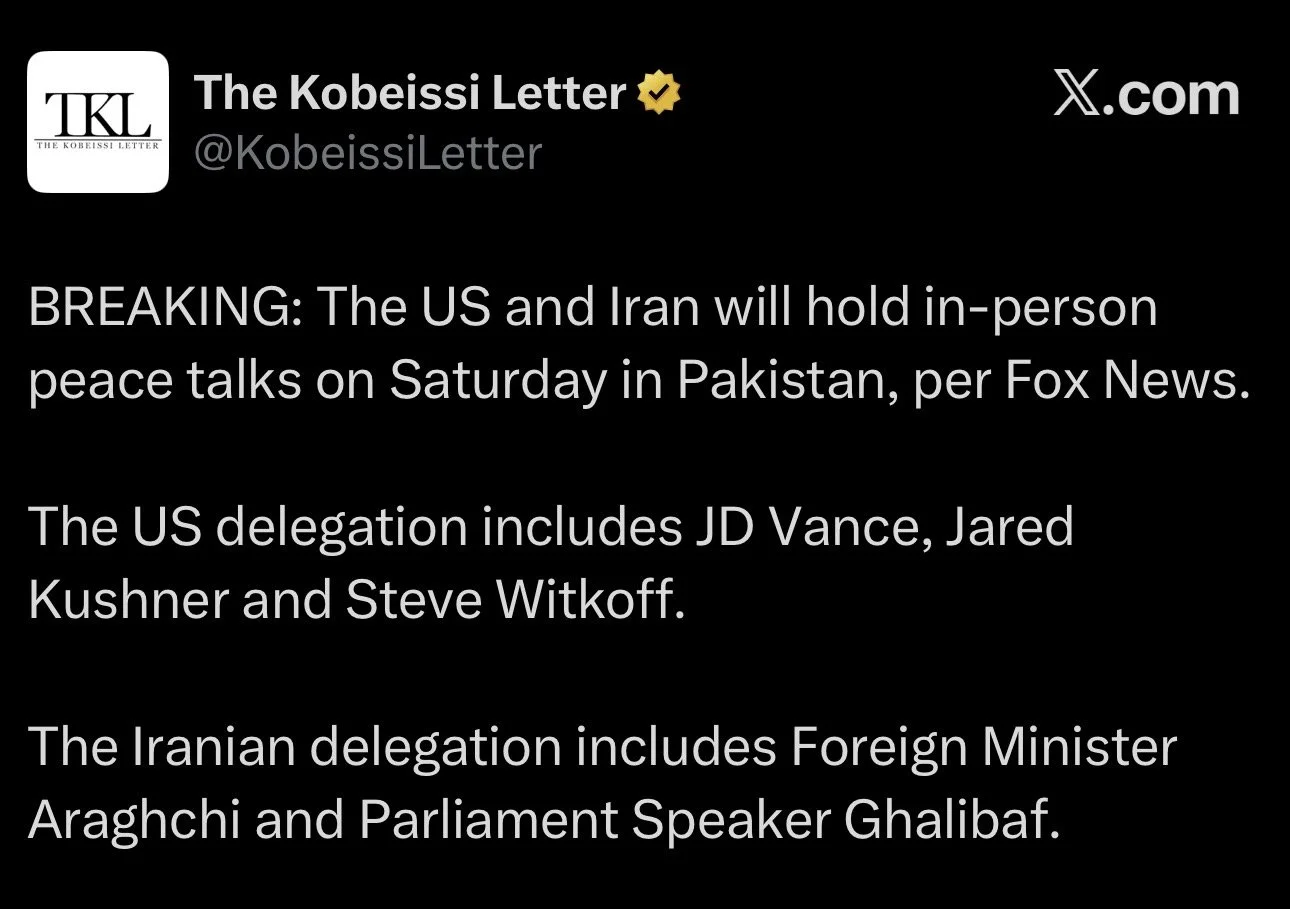
The US and Iran are scheduled to have peace talks this Saturday. So we will just have to wait and see if that makes things de-escalate or not.
Today's Main Takeaways
Corn
Super El Niño?
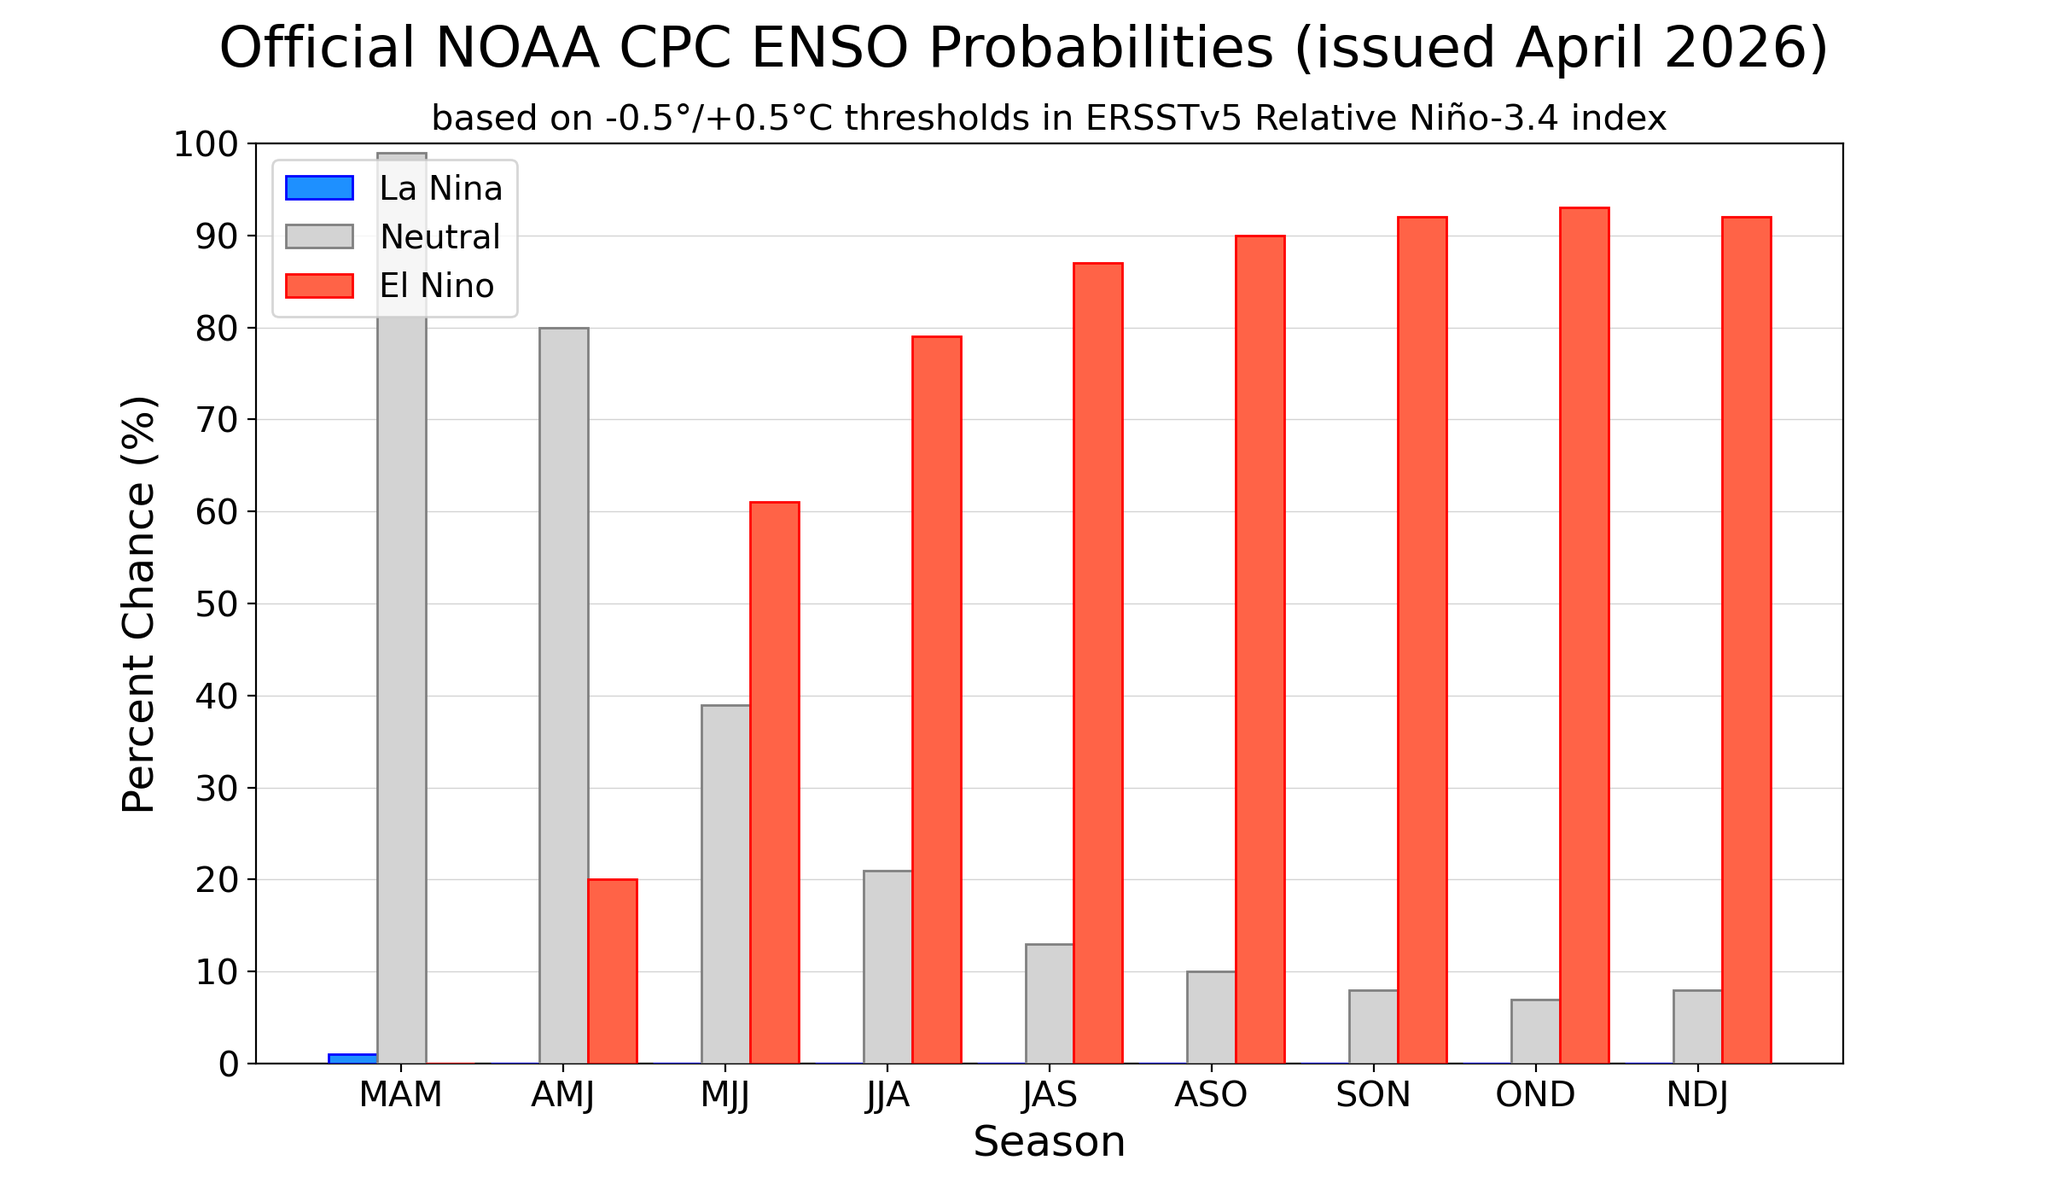
I've been hearing a lot of talk about the possibility for a "super El Niño" this year.

According to the NOAA there is a 63% chance for El Niño from May to July.
With a nearly 80% chance by August.
What does El Niño do?
I am far from a weather expert, and you always have to take these long range forecasts with a grain of salt.
But an El Niño happens when the ocean surface temps in the central and eastern Pacific get warmer than normal. It shifts global weather patterns and can result in some areas being super dry, while other areas can be way too wet.
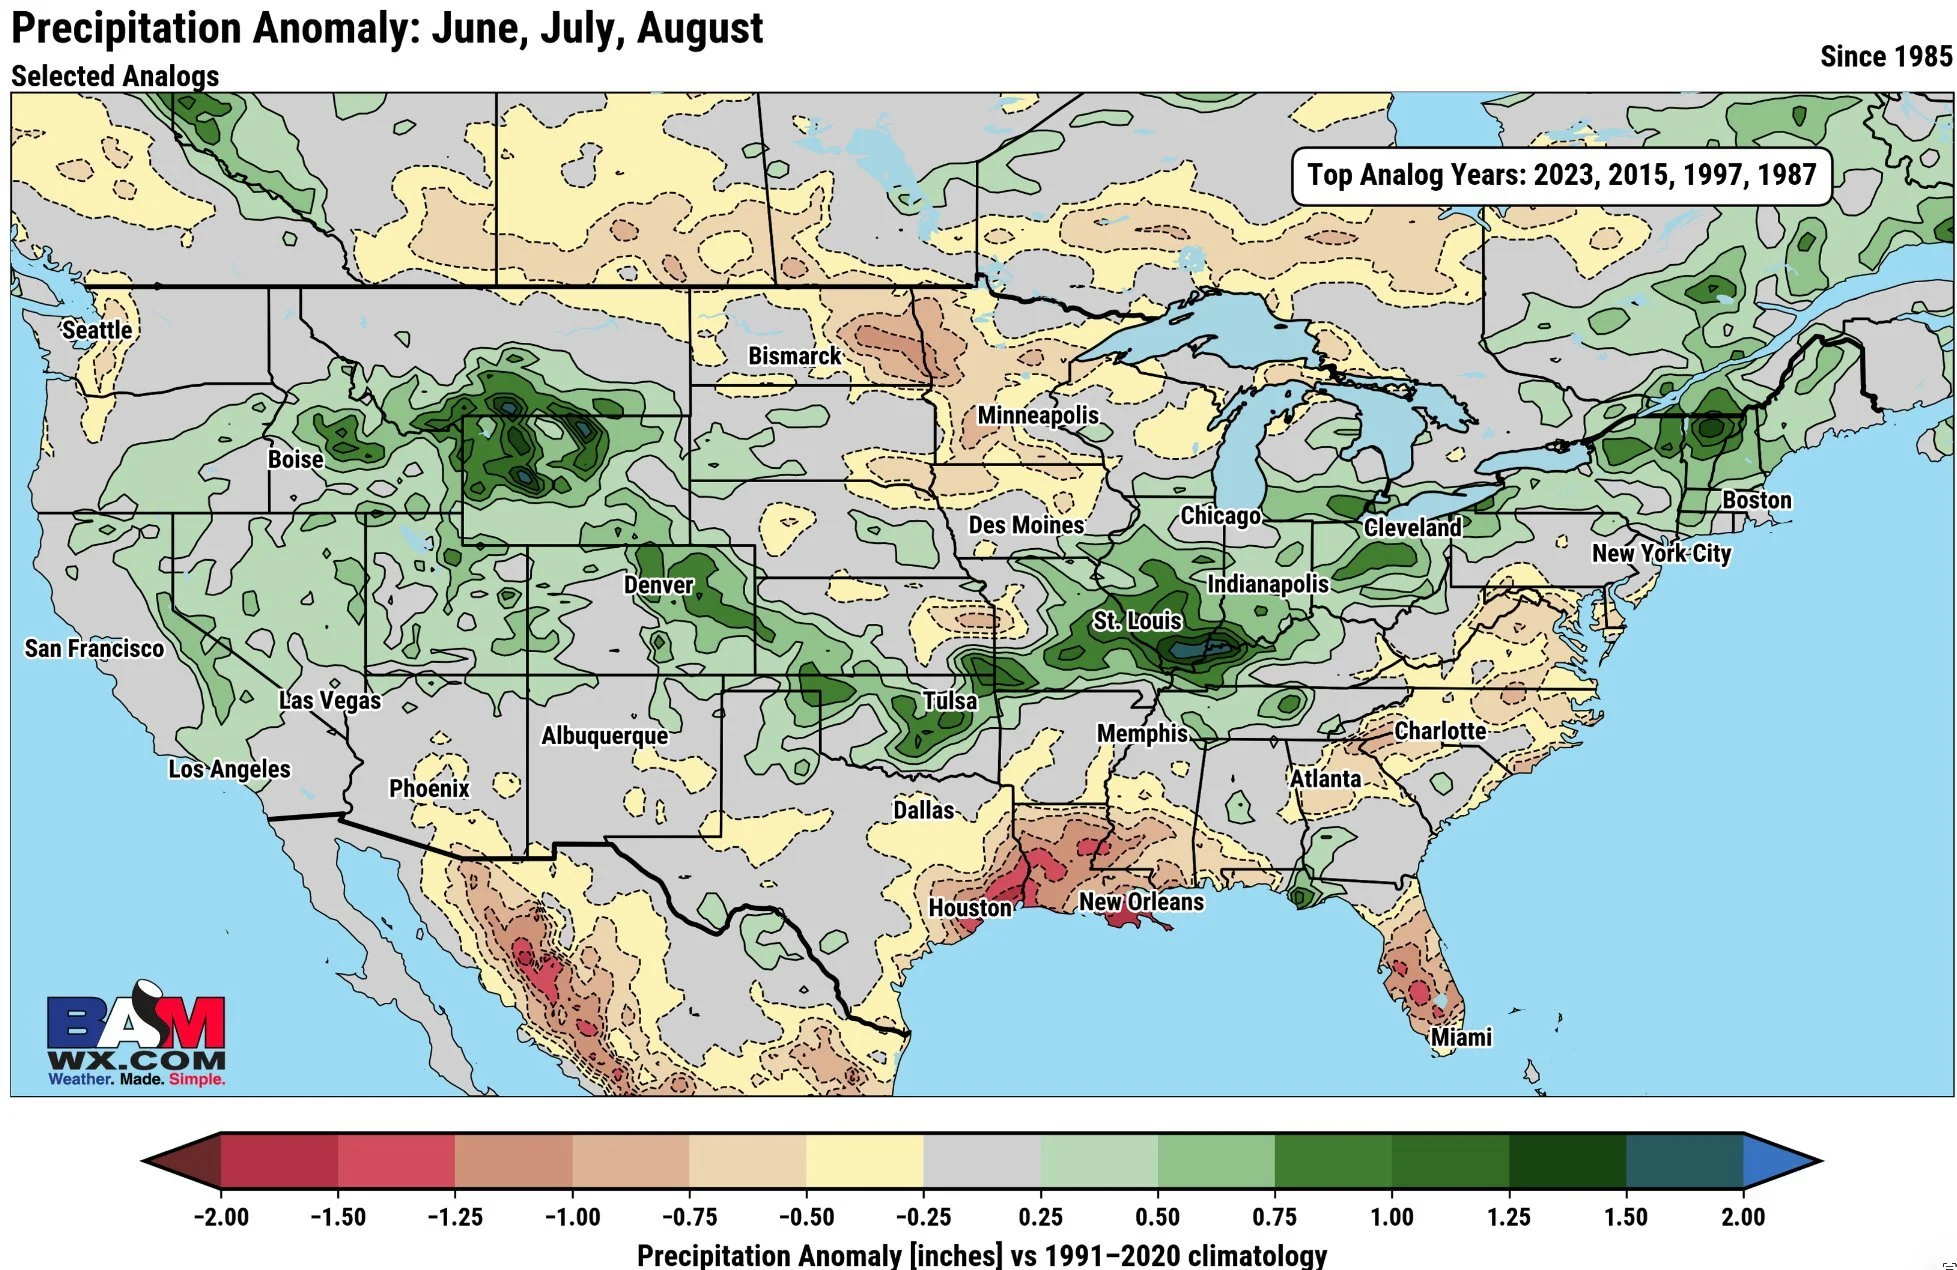
Here is a map from BAM Weather that show cases the past El Niño years, and how precipitation fell from June to August.
Based on these analog years it would suggest some decent moisture in most of the I-states.
When was the last "super El Nino"?
Back in 2015.
That is the year I hear most weather guru's comparing this year to.
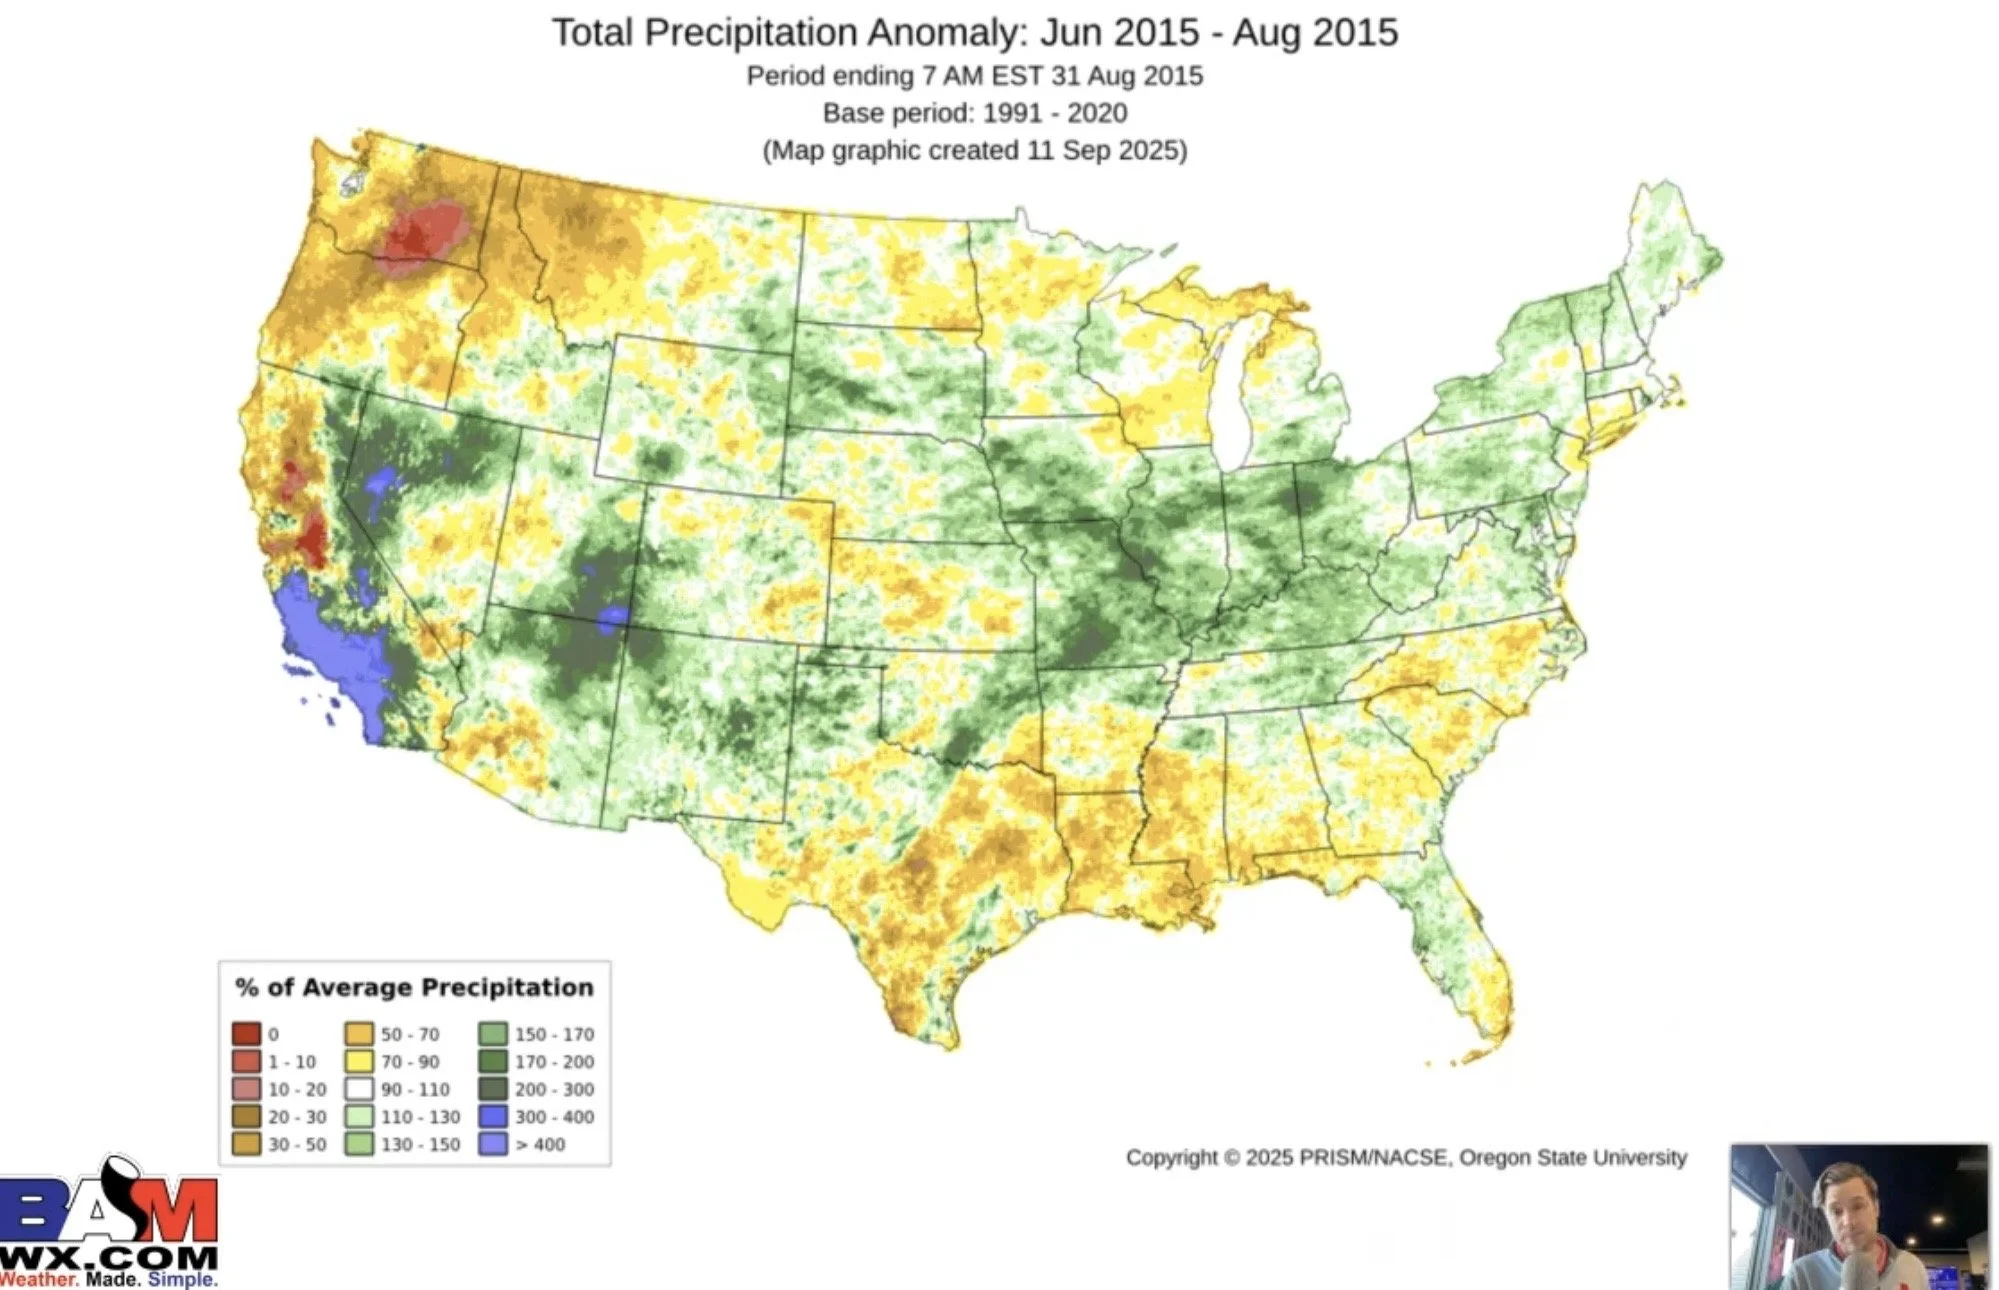
Here was what the precip looked like from June to August in 2015.
It was very wet across the I-states.
A weather scare doesn’t always have to come in the form of drought.
Sometimes, too much rain can be just as bad or even worse than it being too dry.
If it's dry, a rain or two can go a long ways and ruin a drought scare.
If it just simply stays too wet and the rains don’t turn off, you can run into several other issues.
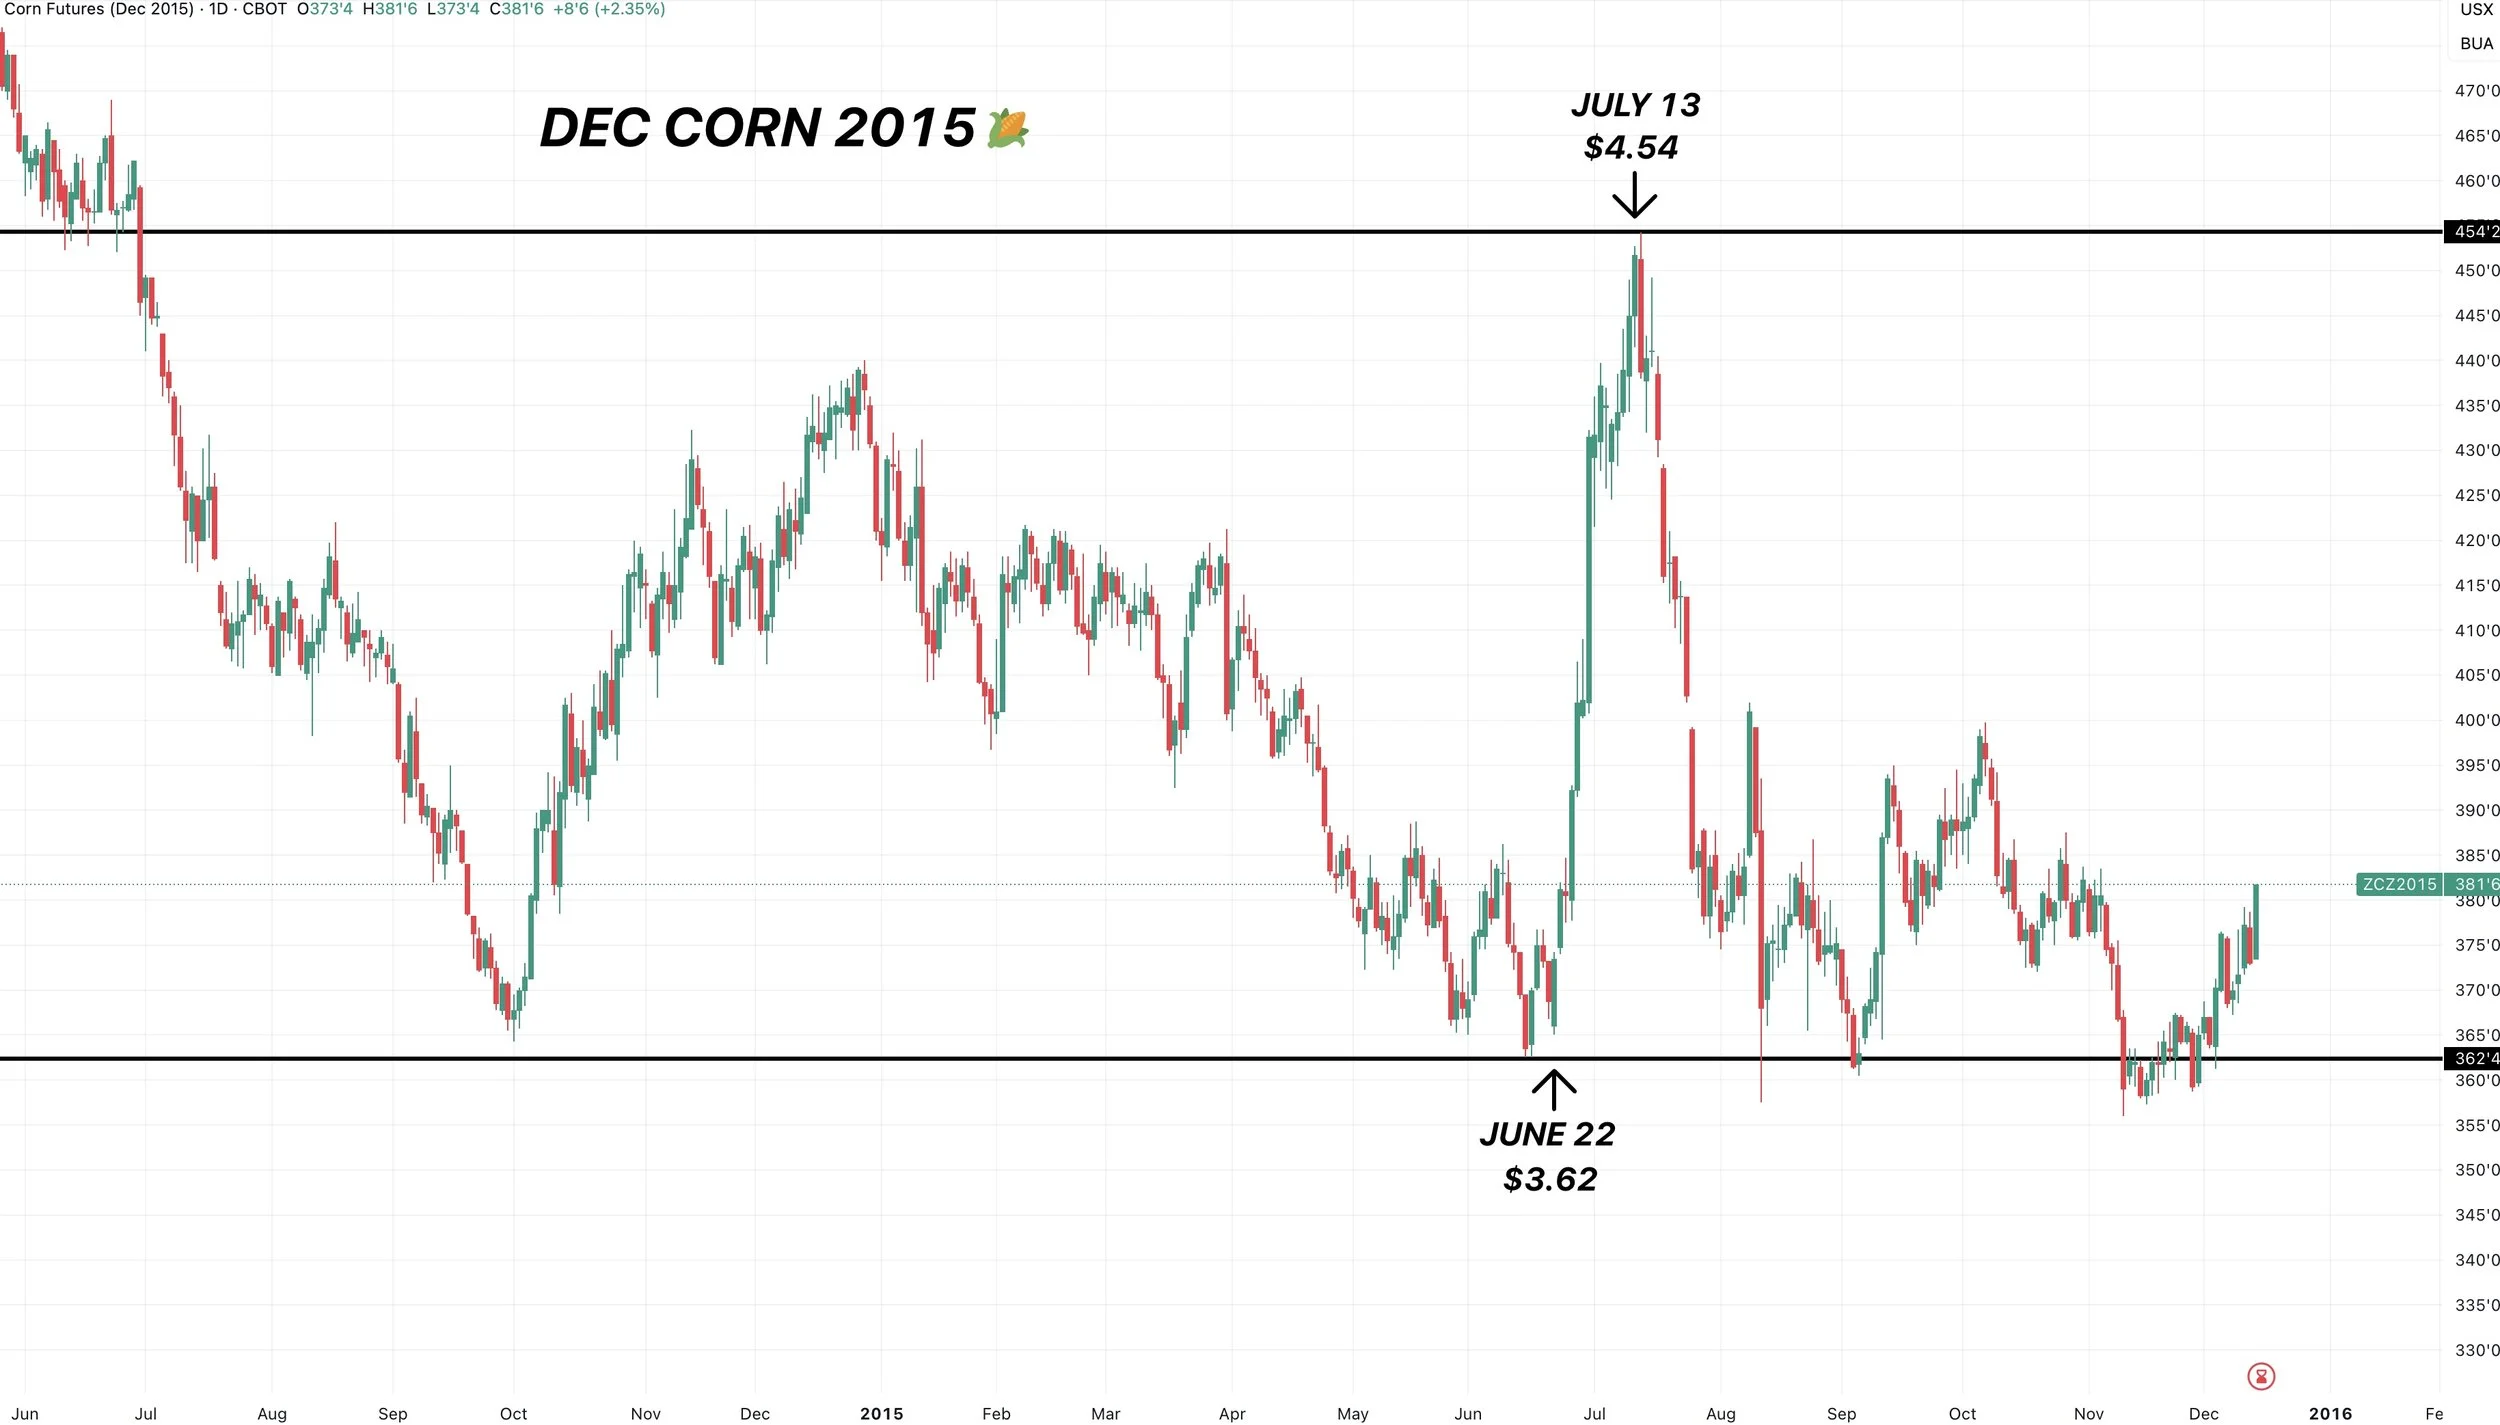
Here is what happened to corn during 2015.
We were in a downtrend the entire year.
Then out of nowhere we saw a massive rally in July, which was short-lived. It lasted less than a month.
But this was due to several areas in the corn belt getting triple the amount of normal rain.
But again, you have to take any sort of long-term forecast with a grain of salt.
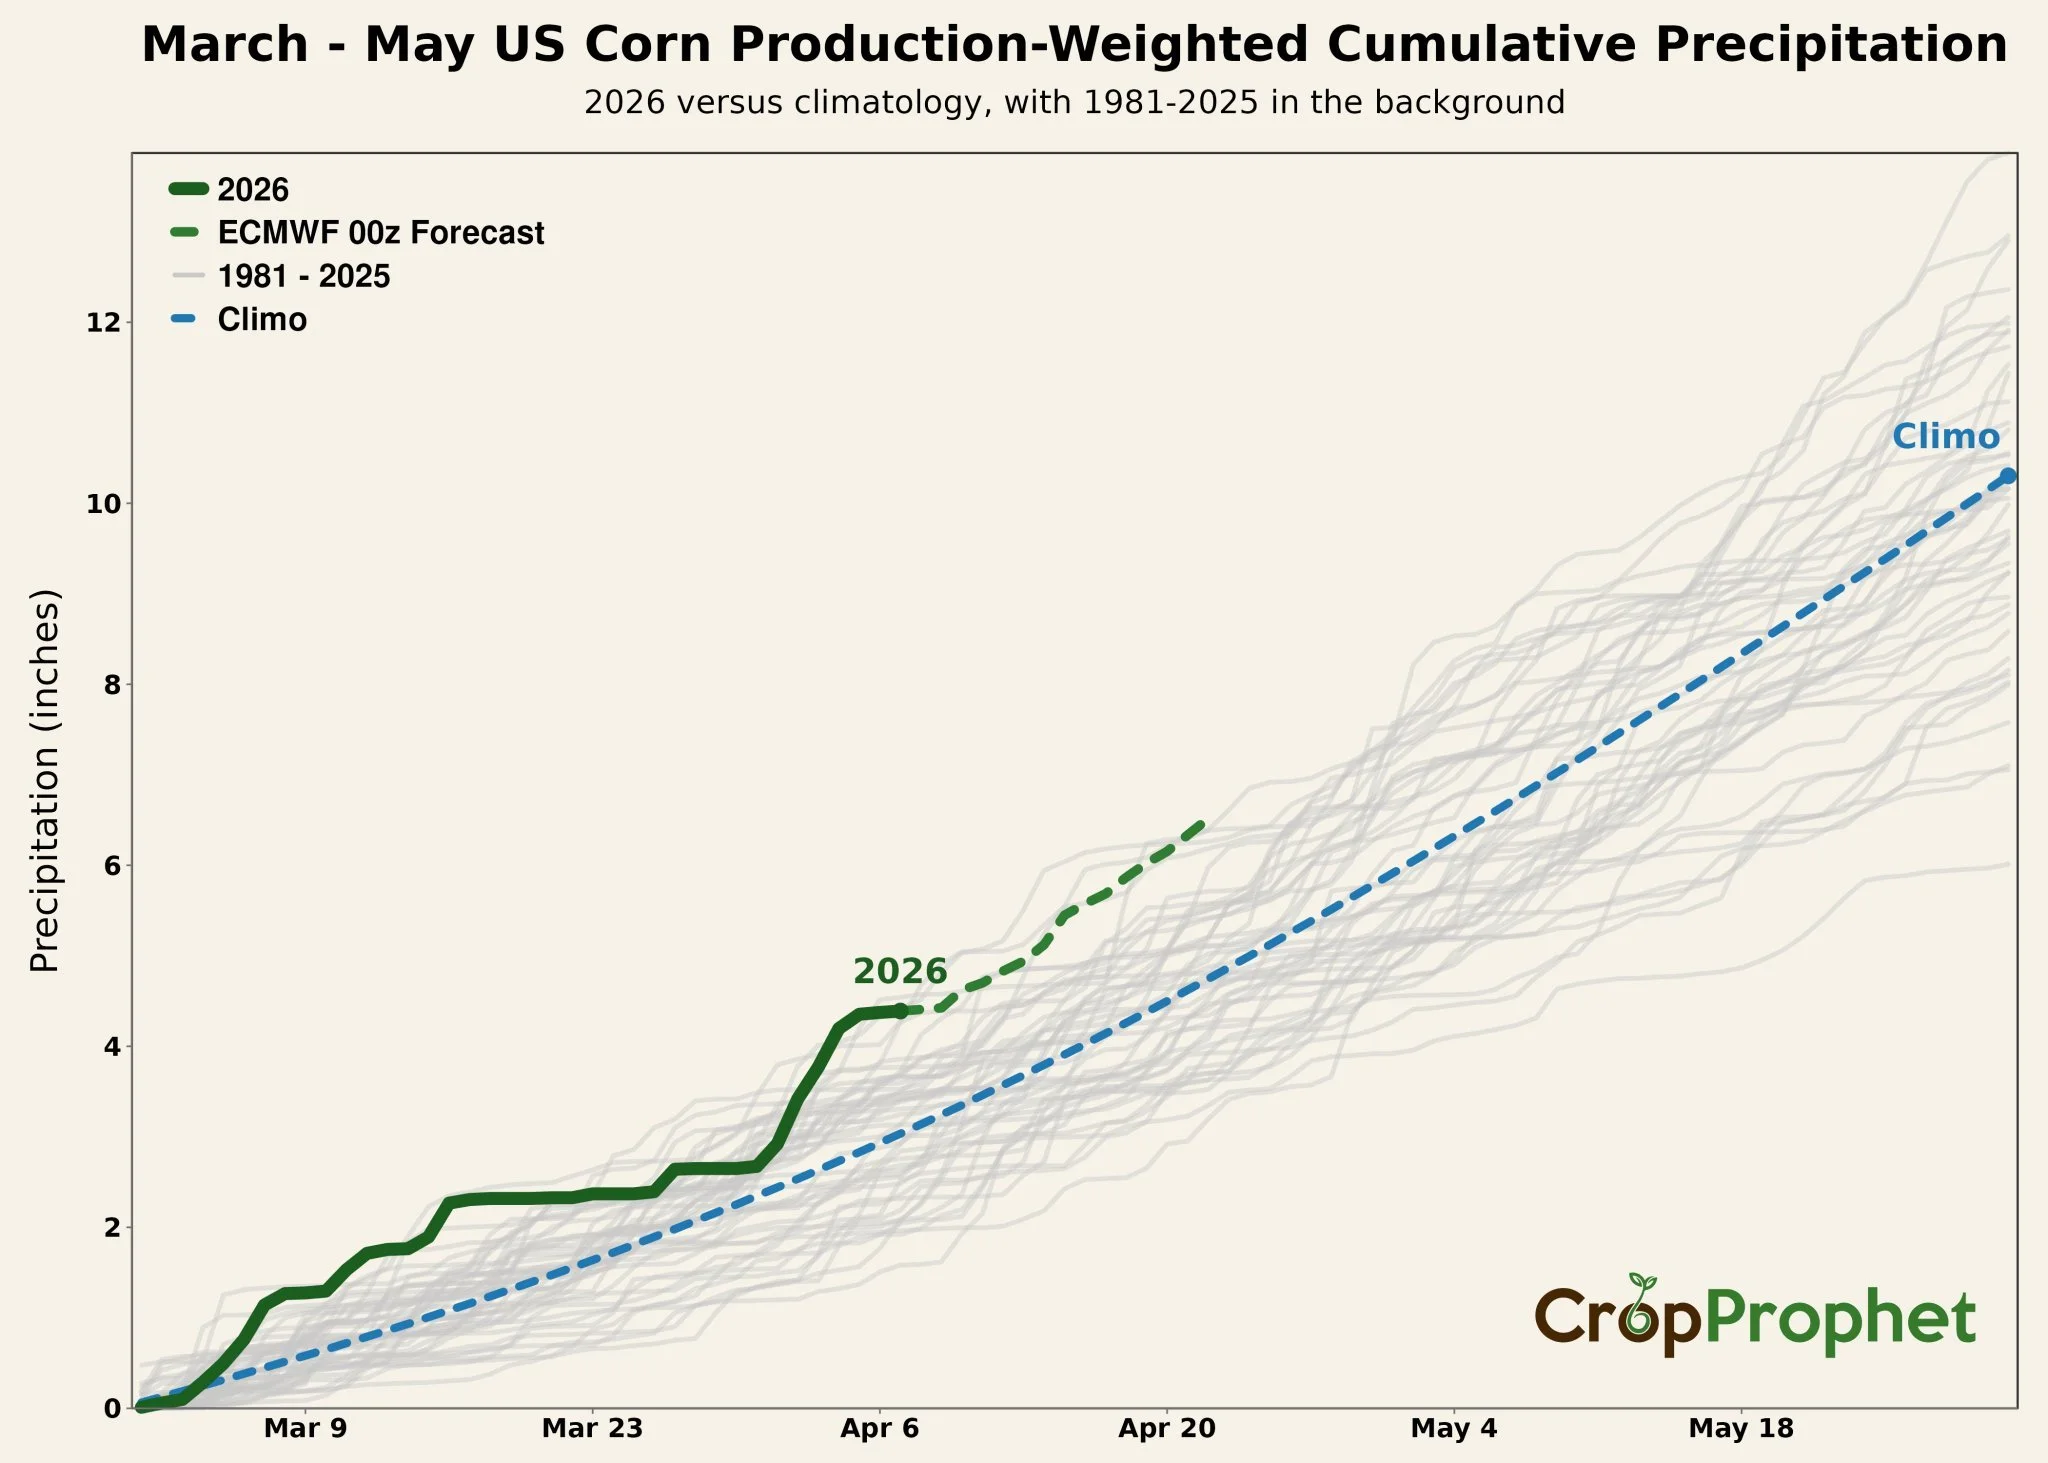
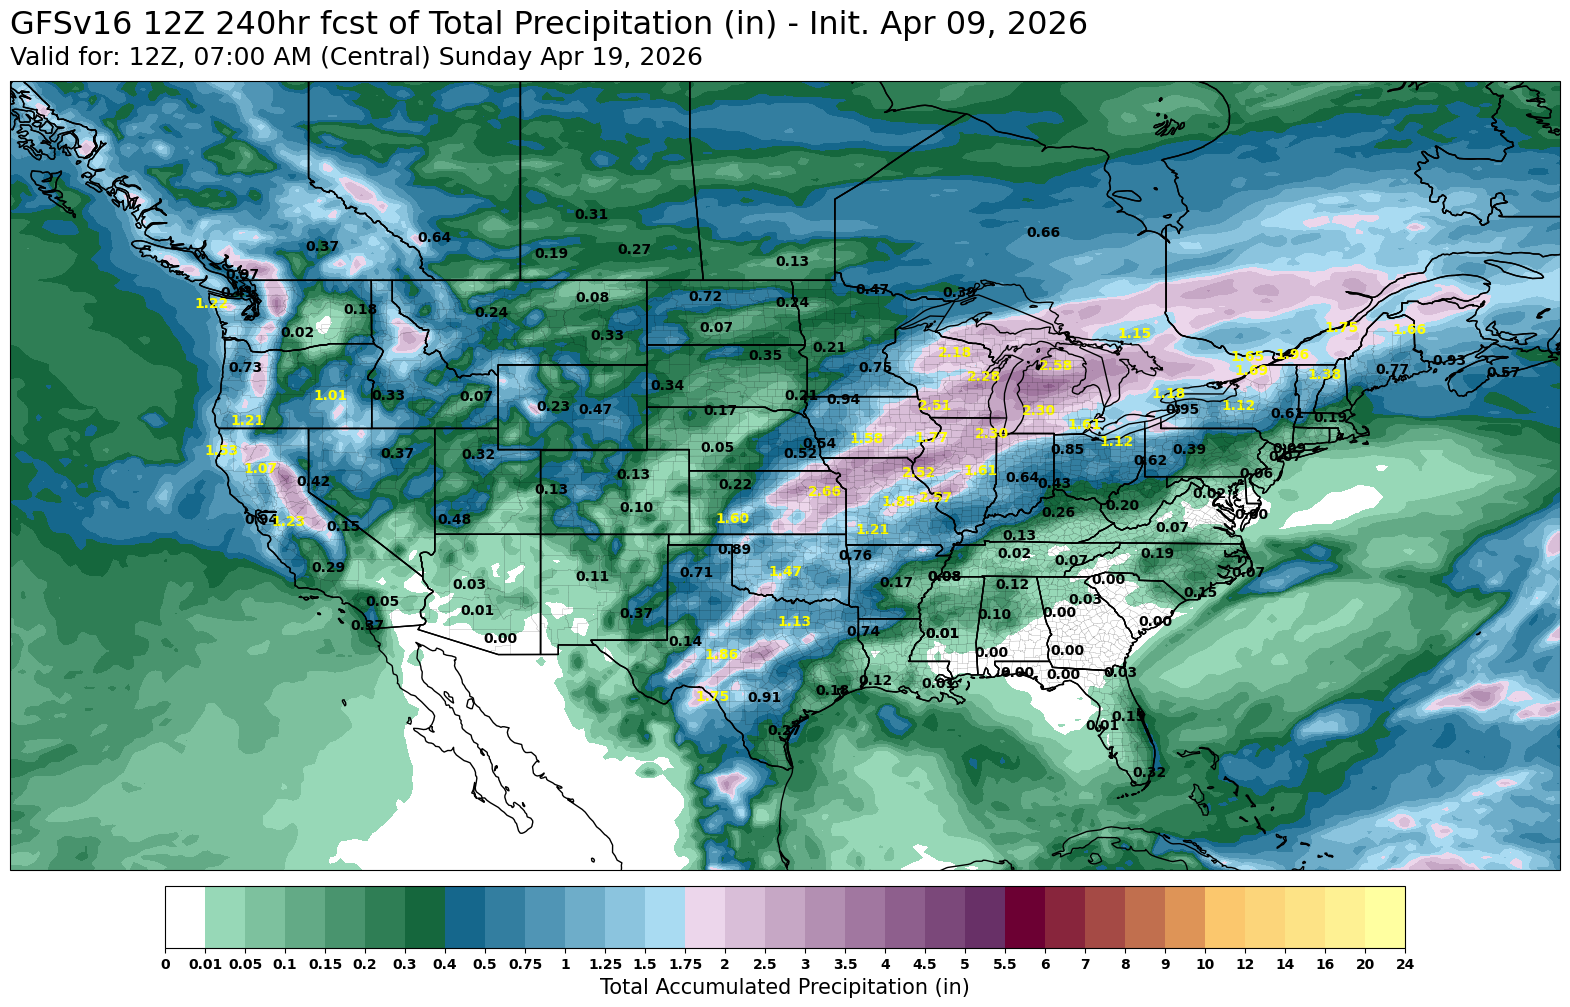
Here is a chart from Crop Prophet that shows corn precipitation for March to May.
Currently, we are actually seeing one of the wettest years we've ever seen for this time frame.
But it's not even mid-April yet, so still too early to call for a planting delay story.
It's also still too early to say we can’t have a drought story either, but right now they sure are trying to minimize that possibility.
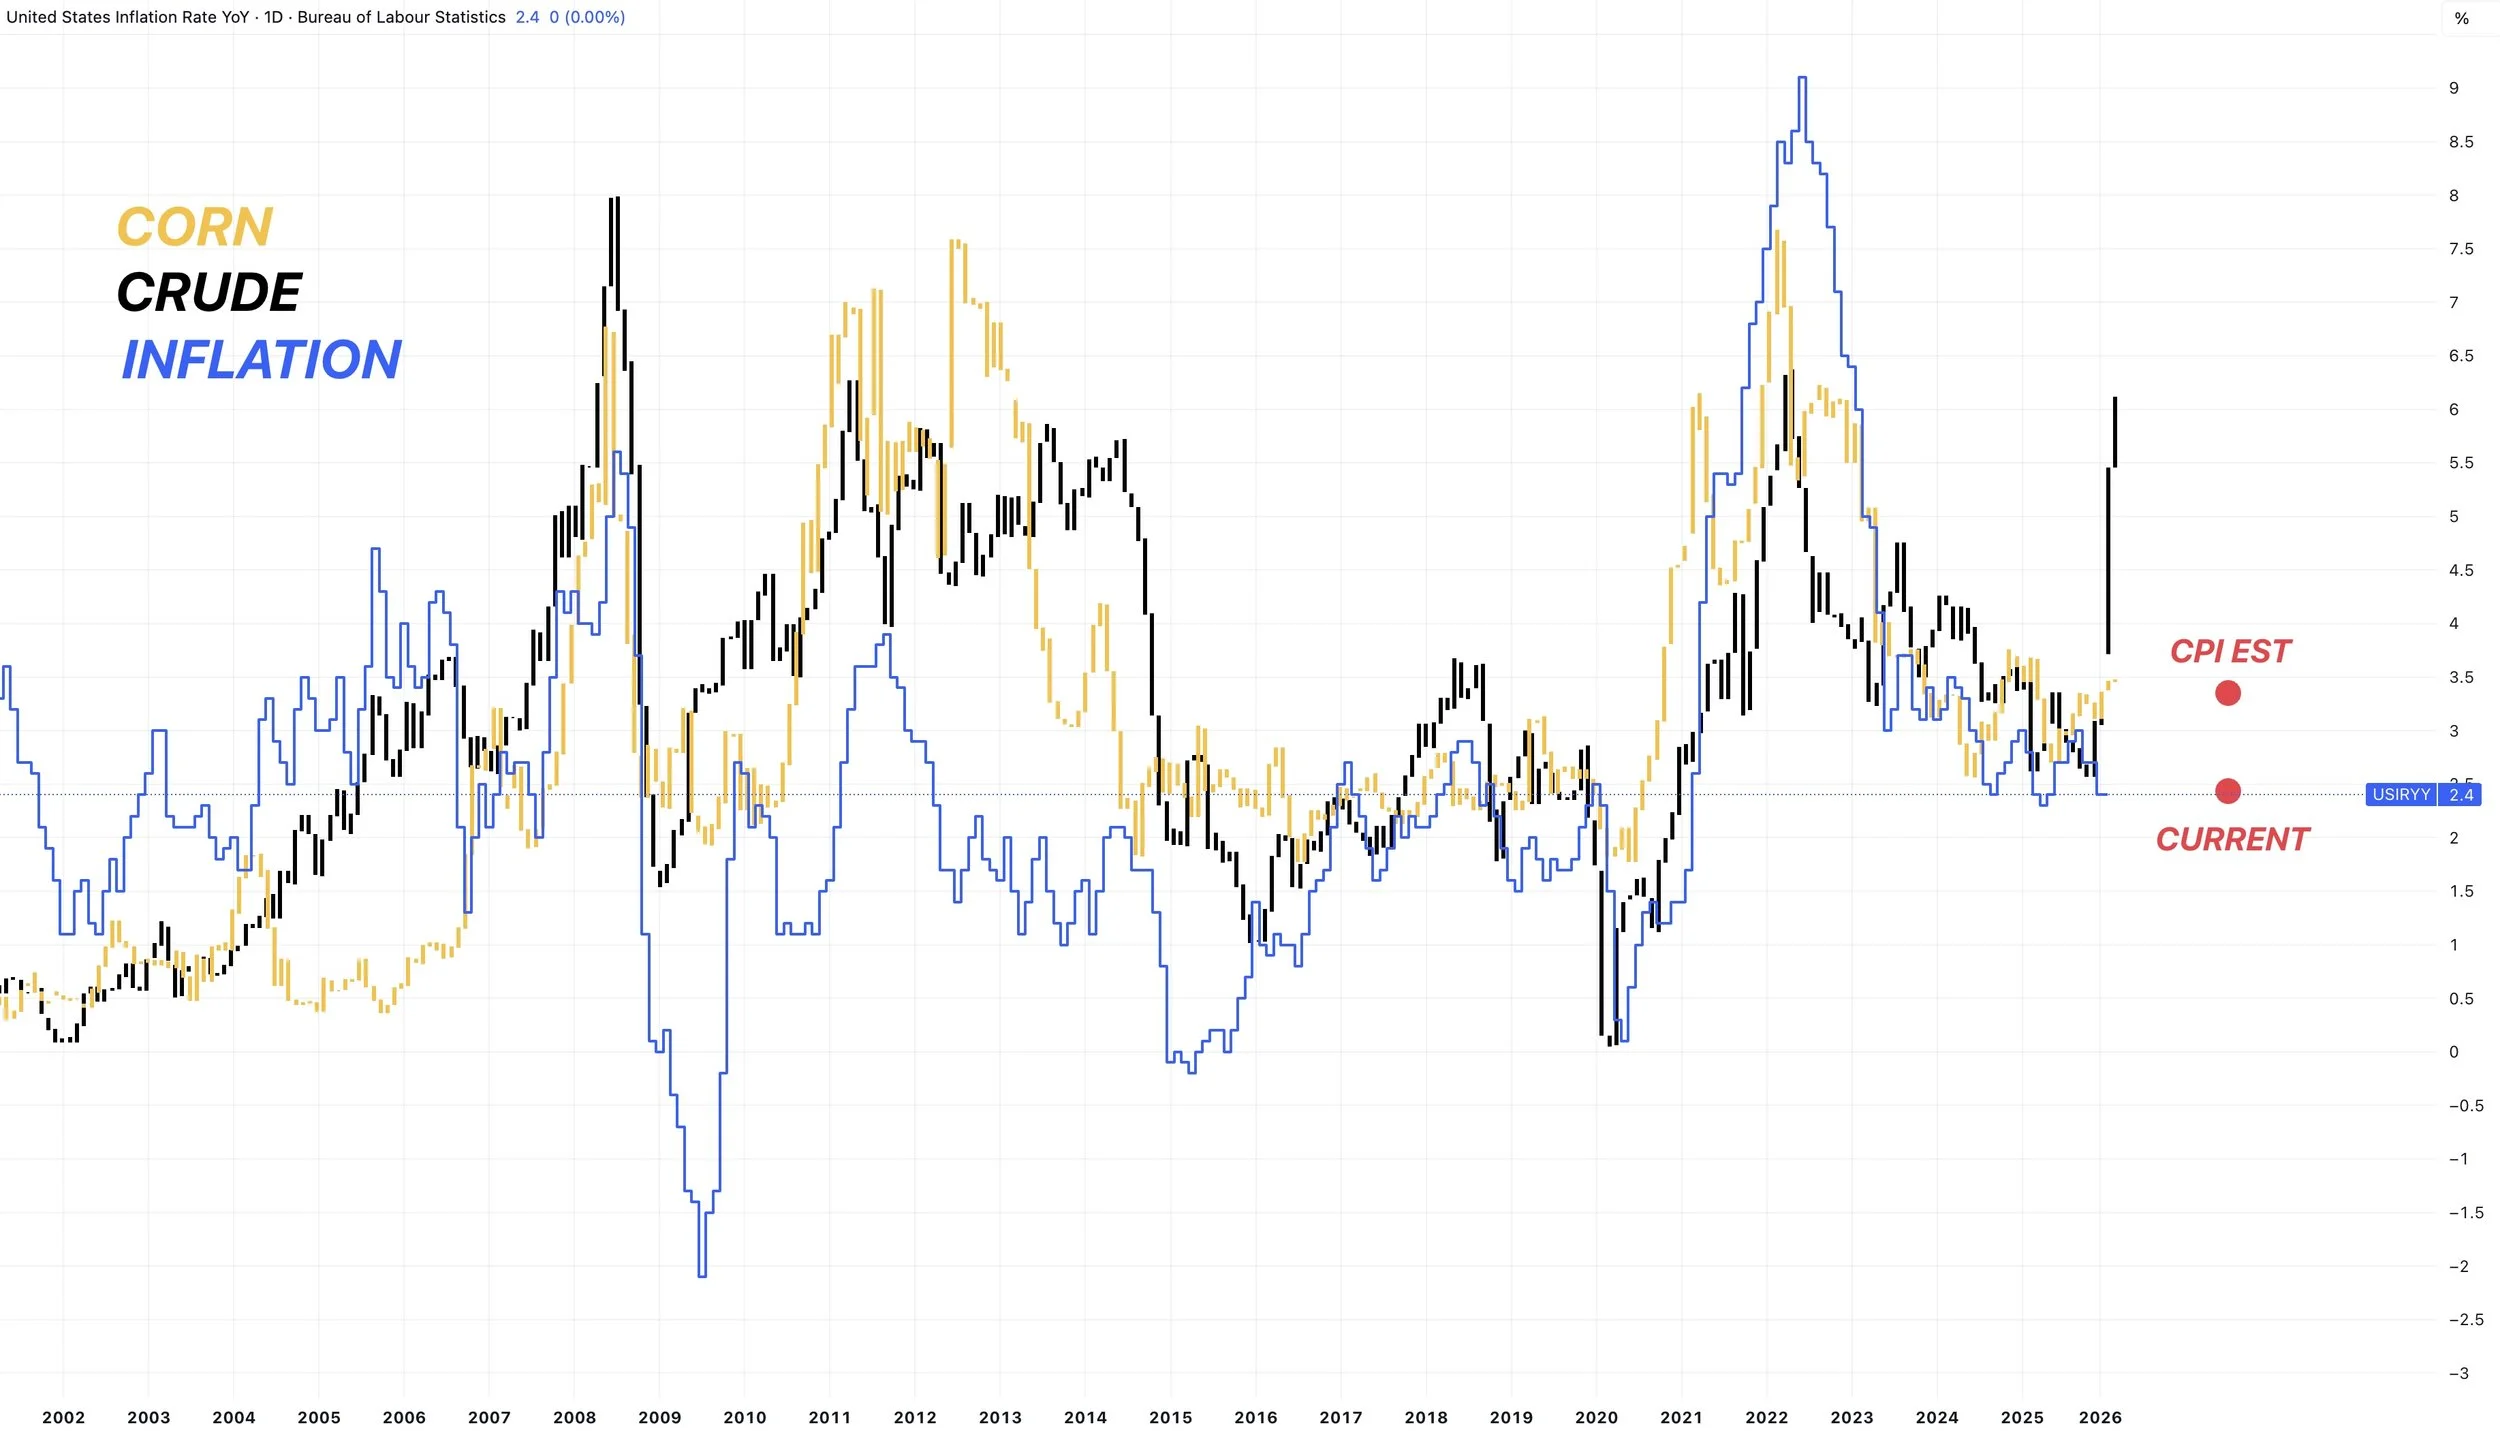
Corn vs Crude vs Inflation
I've shown this chart countles times.
Crude vs corn vs inflation.
IF crude stays up here for several months, corn will follow higher.
High crude will lead to high inflation.
High inflation will rise the cost of everything, and eventually grains would become an inflation play.
We have a CPI inflation report out tomorrow, where they are expecting inflation to jump to 3.3% up from the current 2.4%.
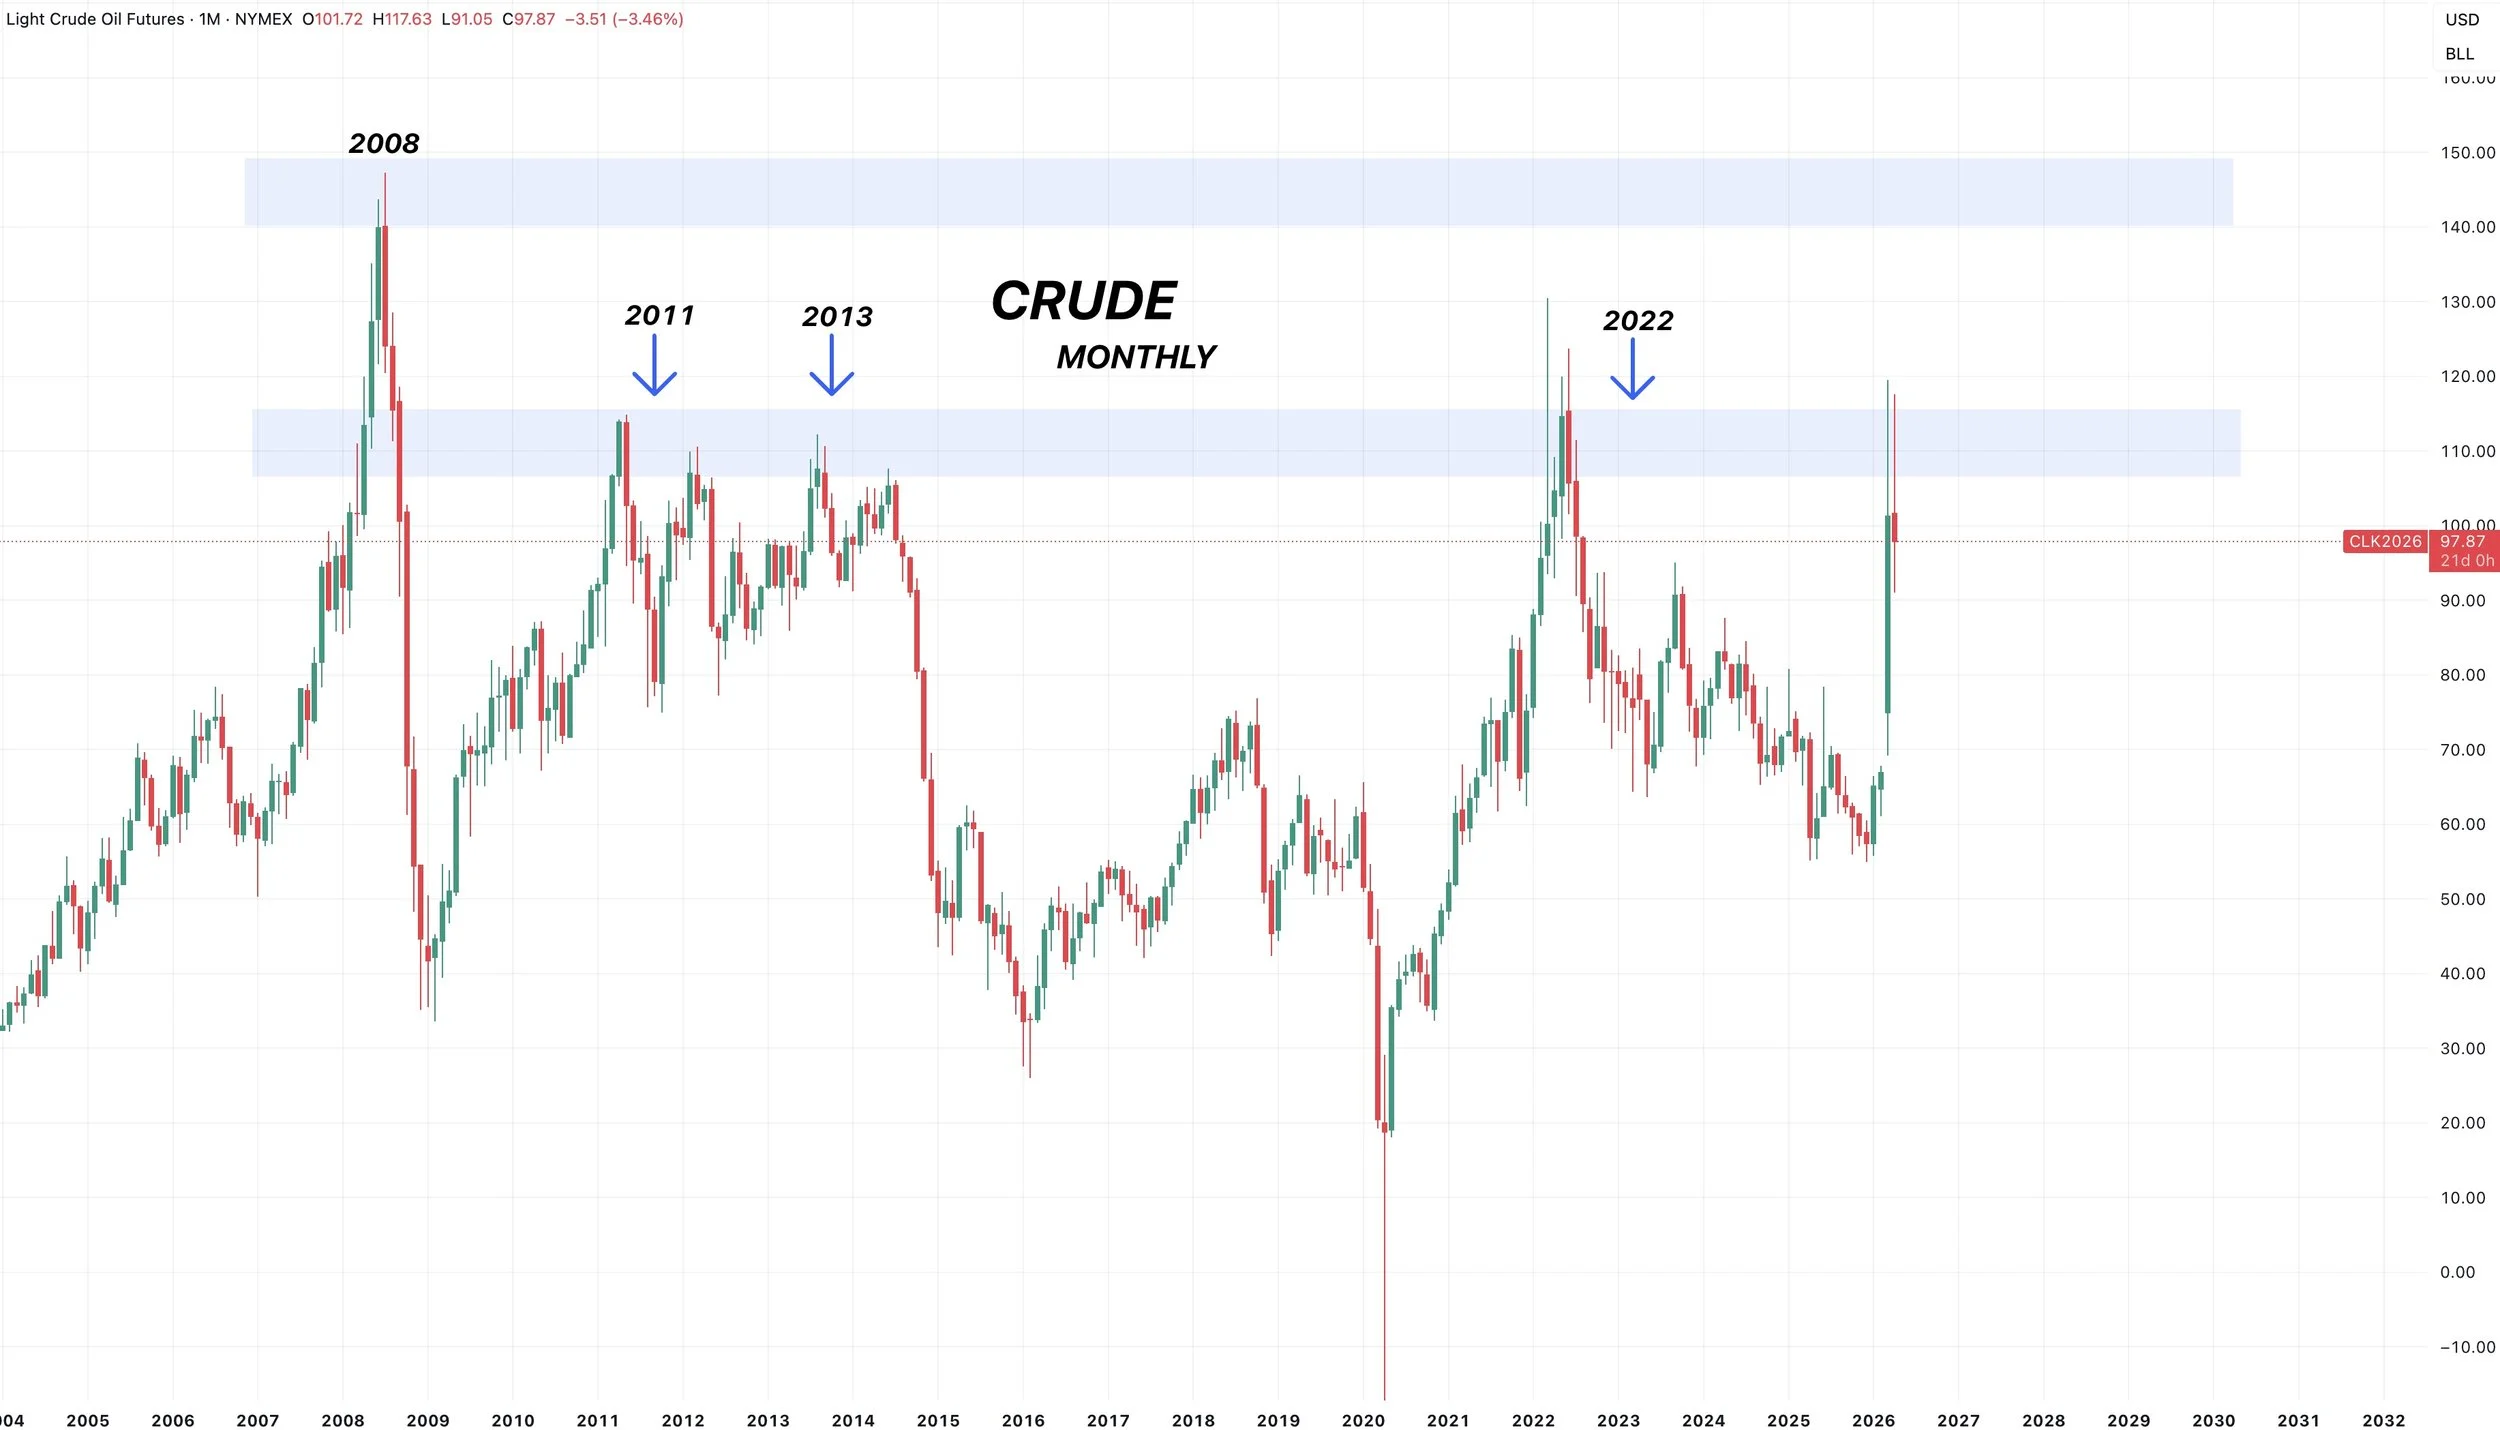
It's honestly impossible to know how long this war will drag out and how it's going to impact the economy, inflation, crude, and the grains moving forward.
But what we do know is that crude is sitting right at some multi-decade resistance levels. Where it failed time and time again.
Doesn’t mean it's impossible to stay up at these levels, but this is historically where we've topped out.
Pure Fundamentals
Now if the war ends, the strait opens back up, and crude falls.
You have to be cautious.
Yes, corn can rally and be an inflation play even if the balance sheet is bearish.
But with no inflation play, the balance sheet is not super friendly.
As I've talked about many times, a 183 yield and 95 million acres still prints a 2 billion bu carryout based on what we know today.
That is if both of those factors are true.
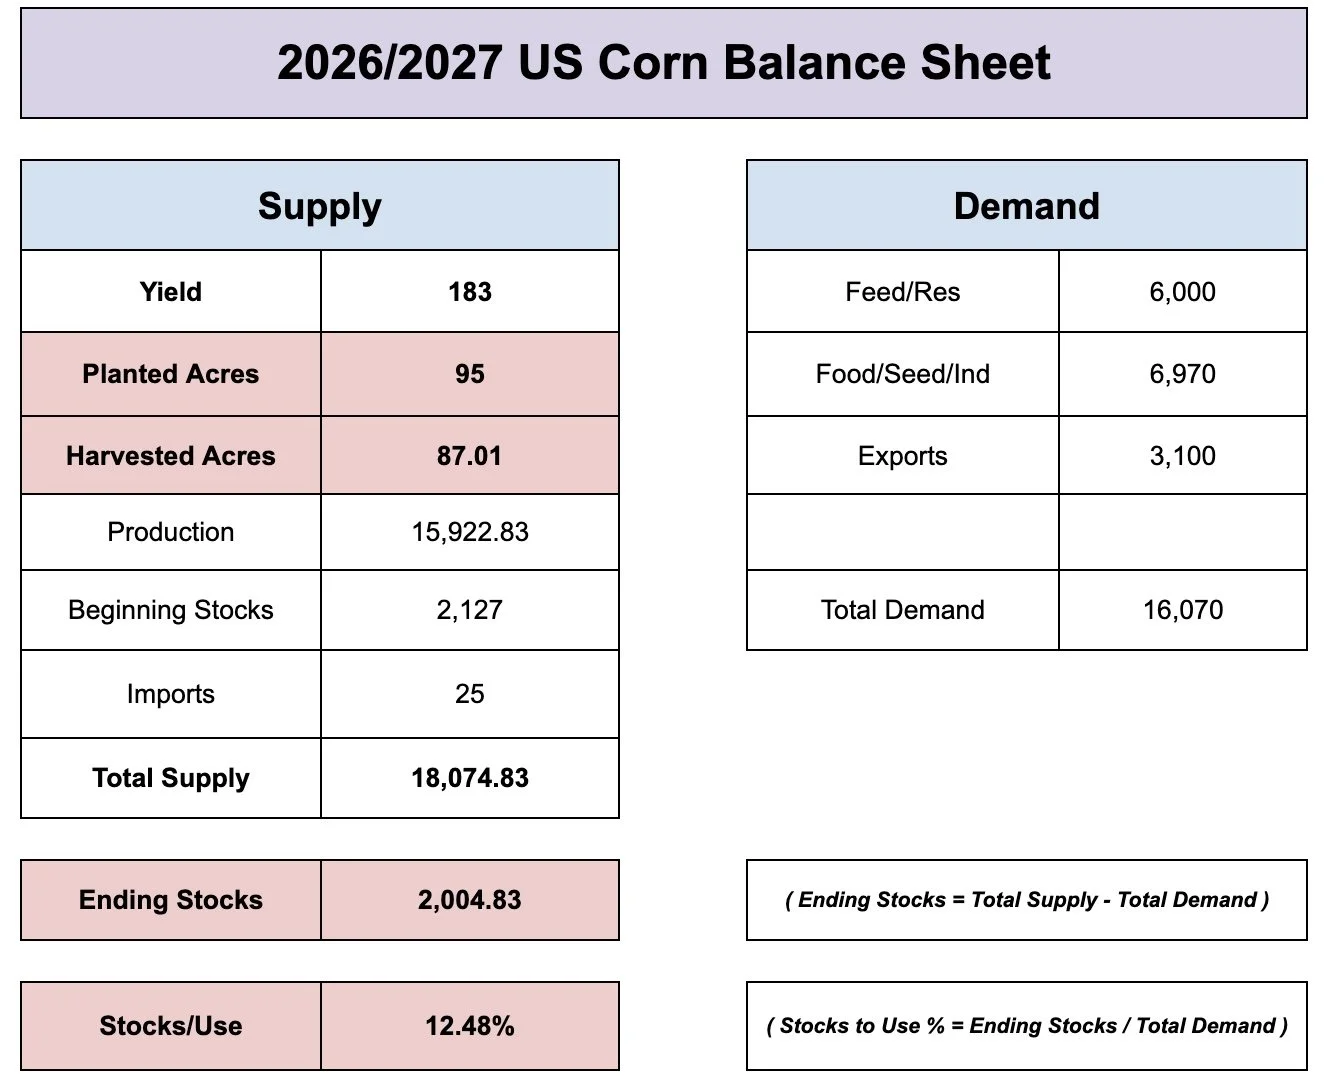
Which would still be a pretty significant carryout.
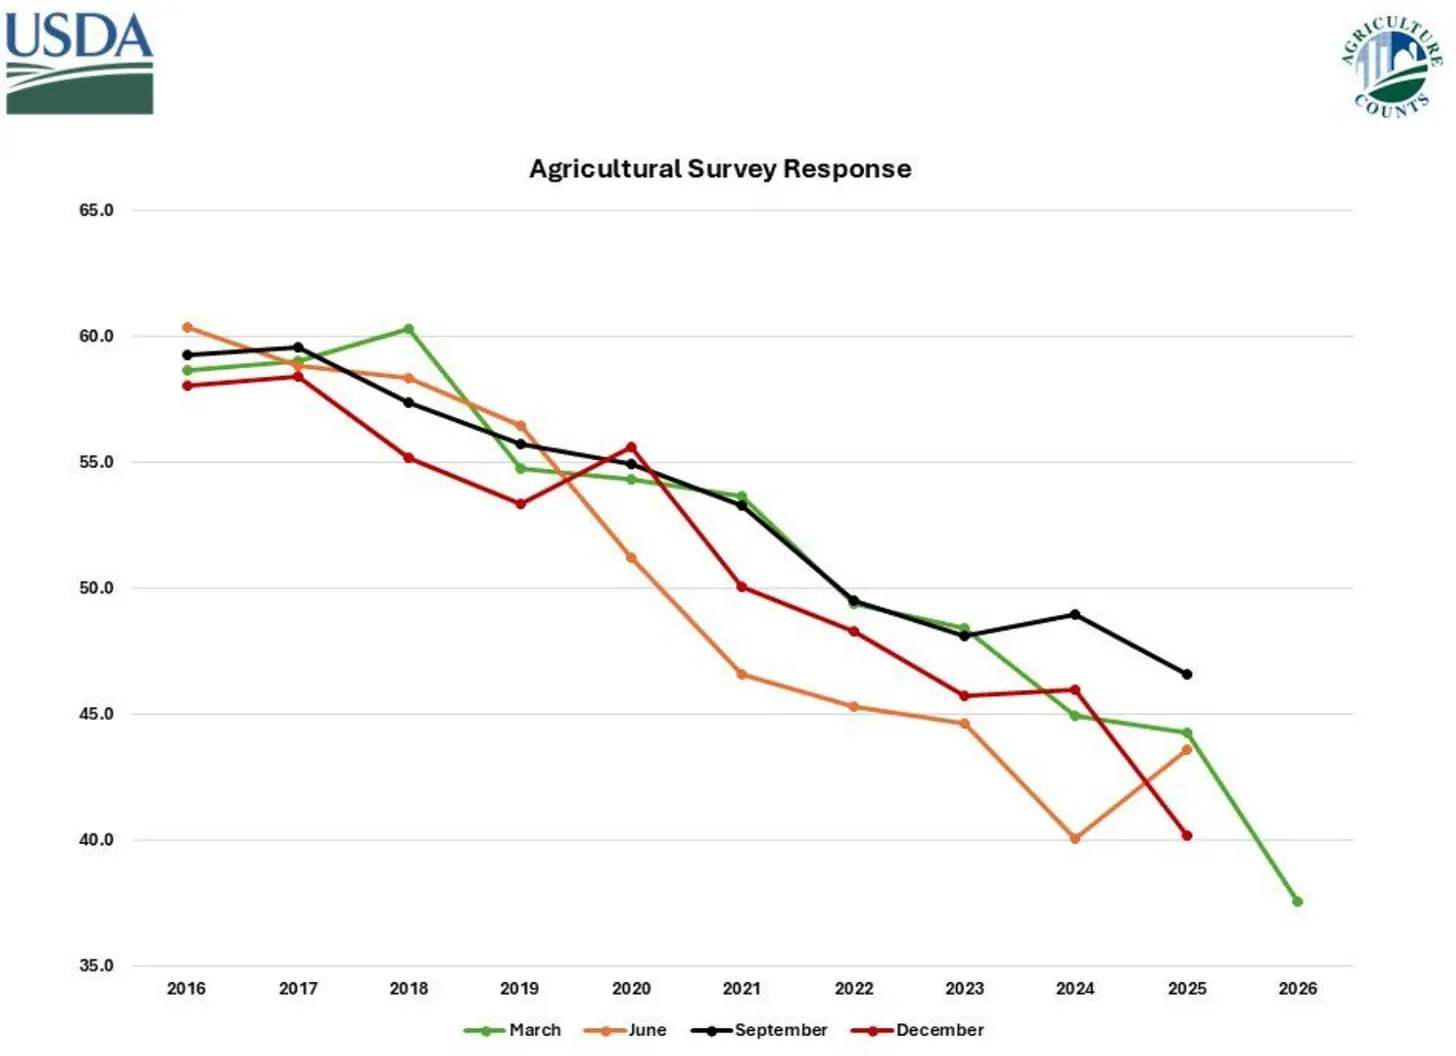
But at the same time, you have to question if 95 million acres is even a reality.
I mean this March report did have the lowest response rate they've ever had.
The response rates have continues to get smaller and smaller every year.
The funds are still long plenty of corn.
The risk here has to be the war headlines.
With no war premium, will they jump ship?
Because if the war ends, and we have 95 million acres and no weather story, they probably don't have a reason to be this long.
On the flip side, you would like to think they'll at least somewhat defend that position going into growing season.
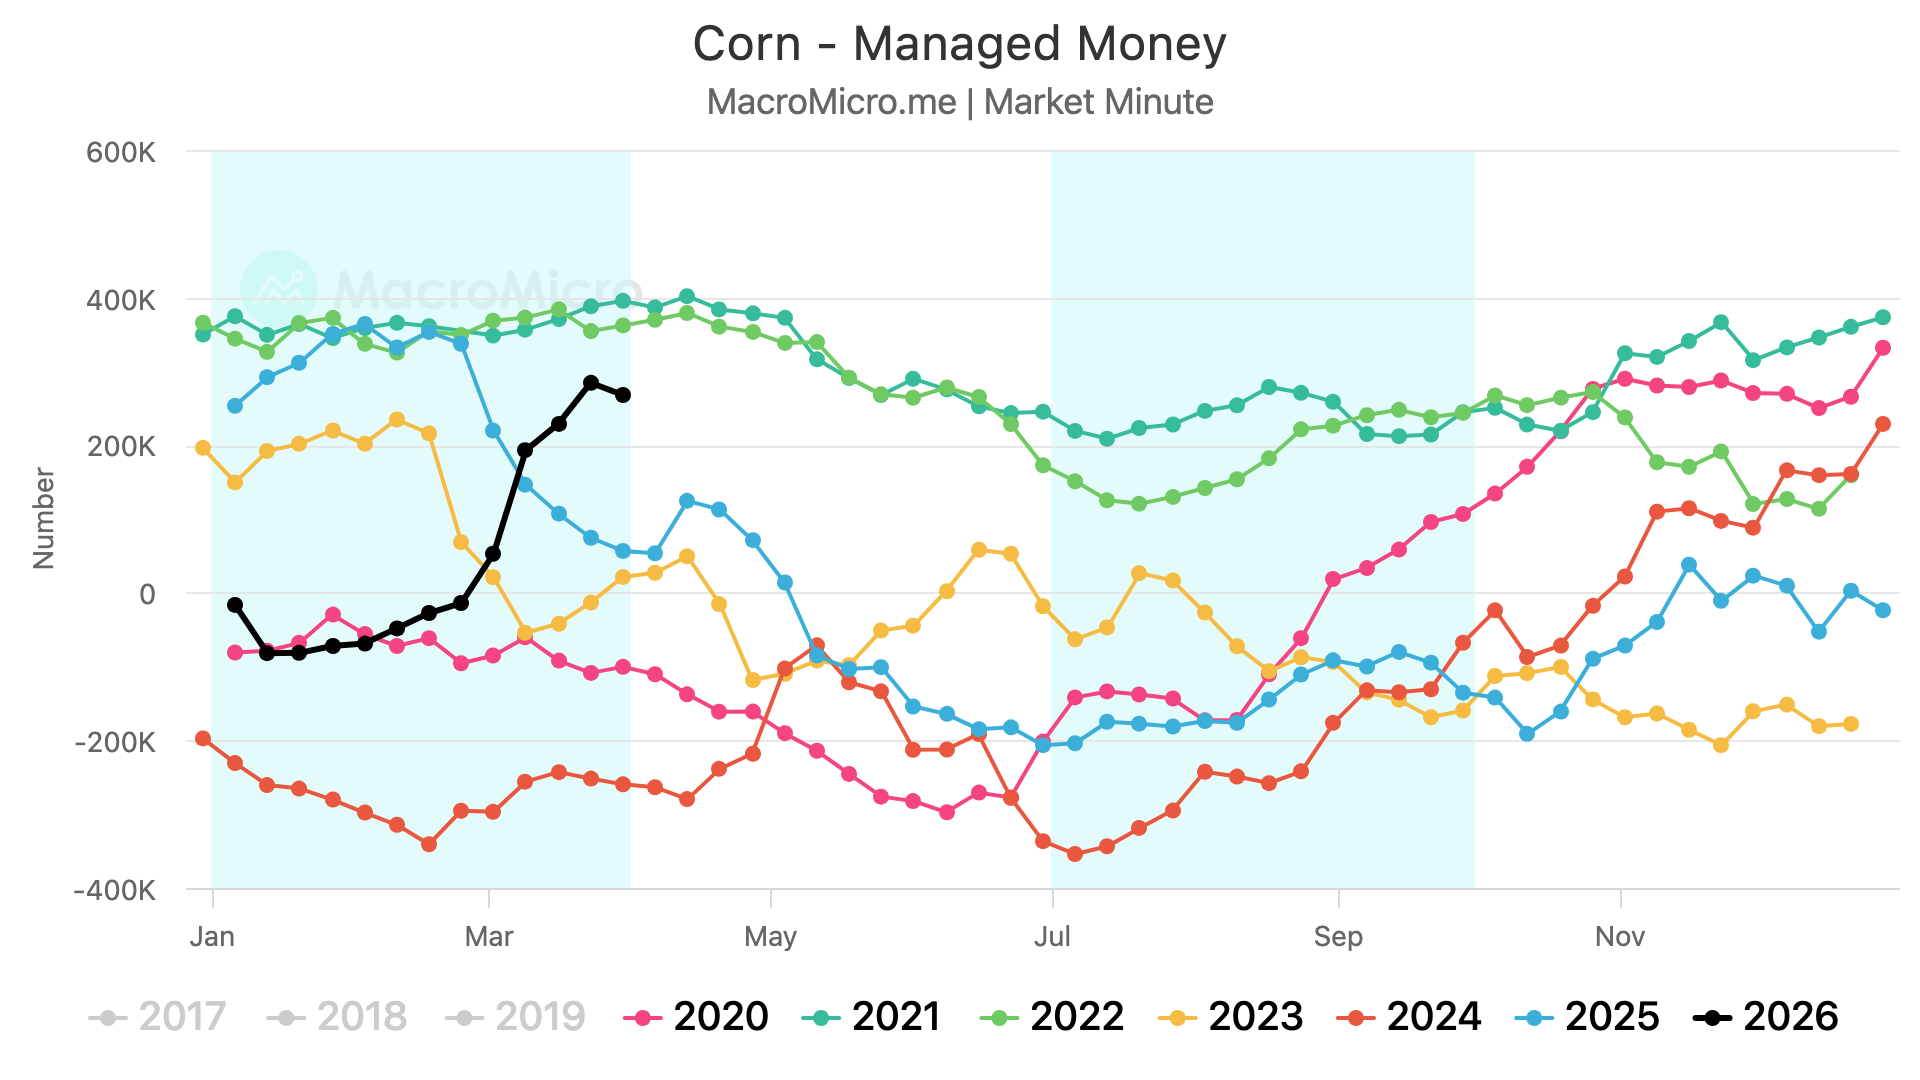
Then once we get into June and July, if the crop looks good, they hit the sell button.
Which is why we almost always fall off a cliff heading into the end of summer.
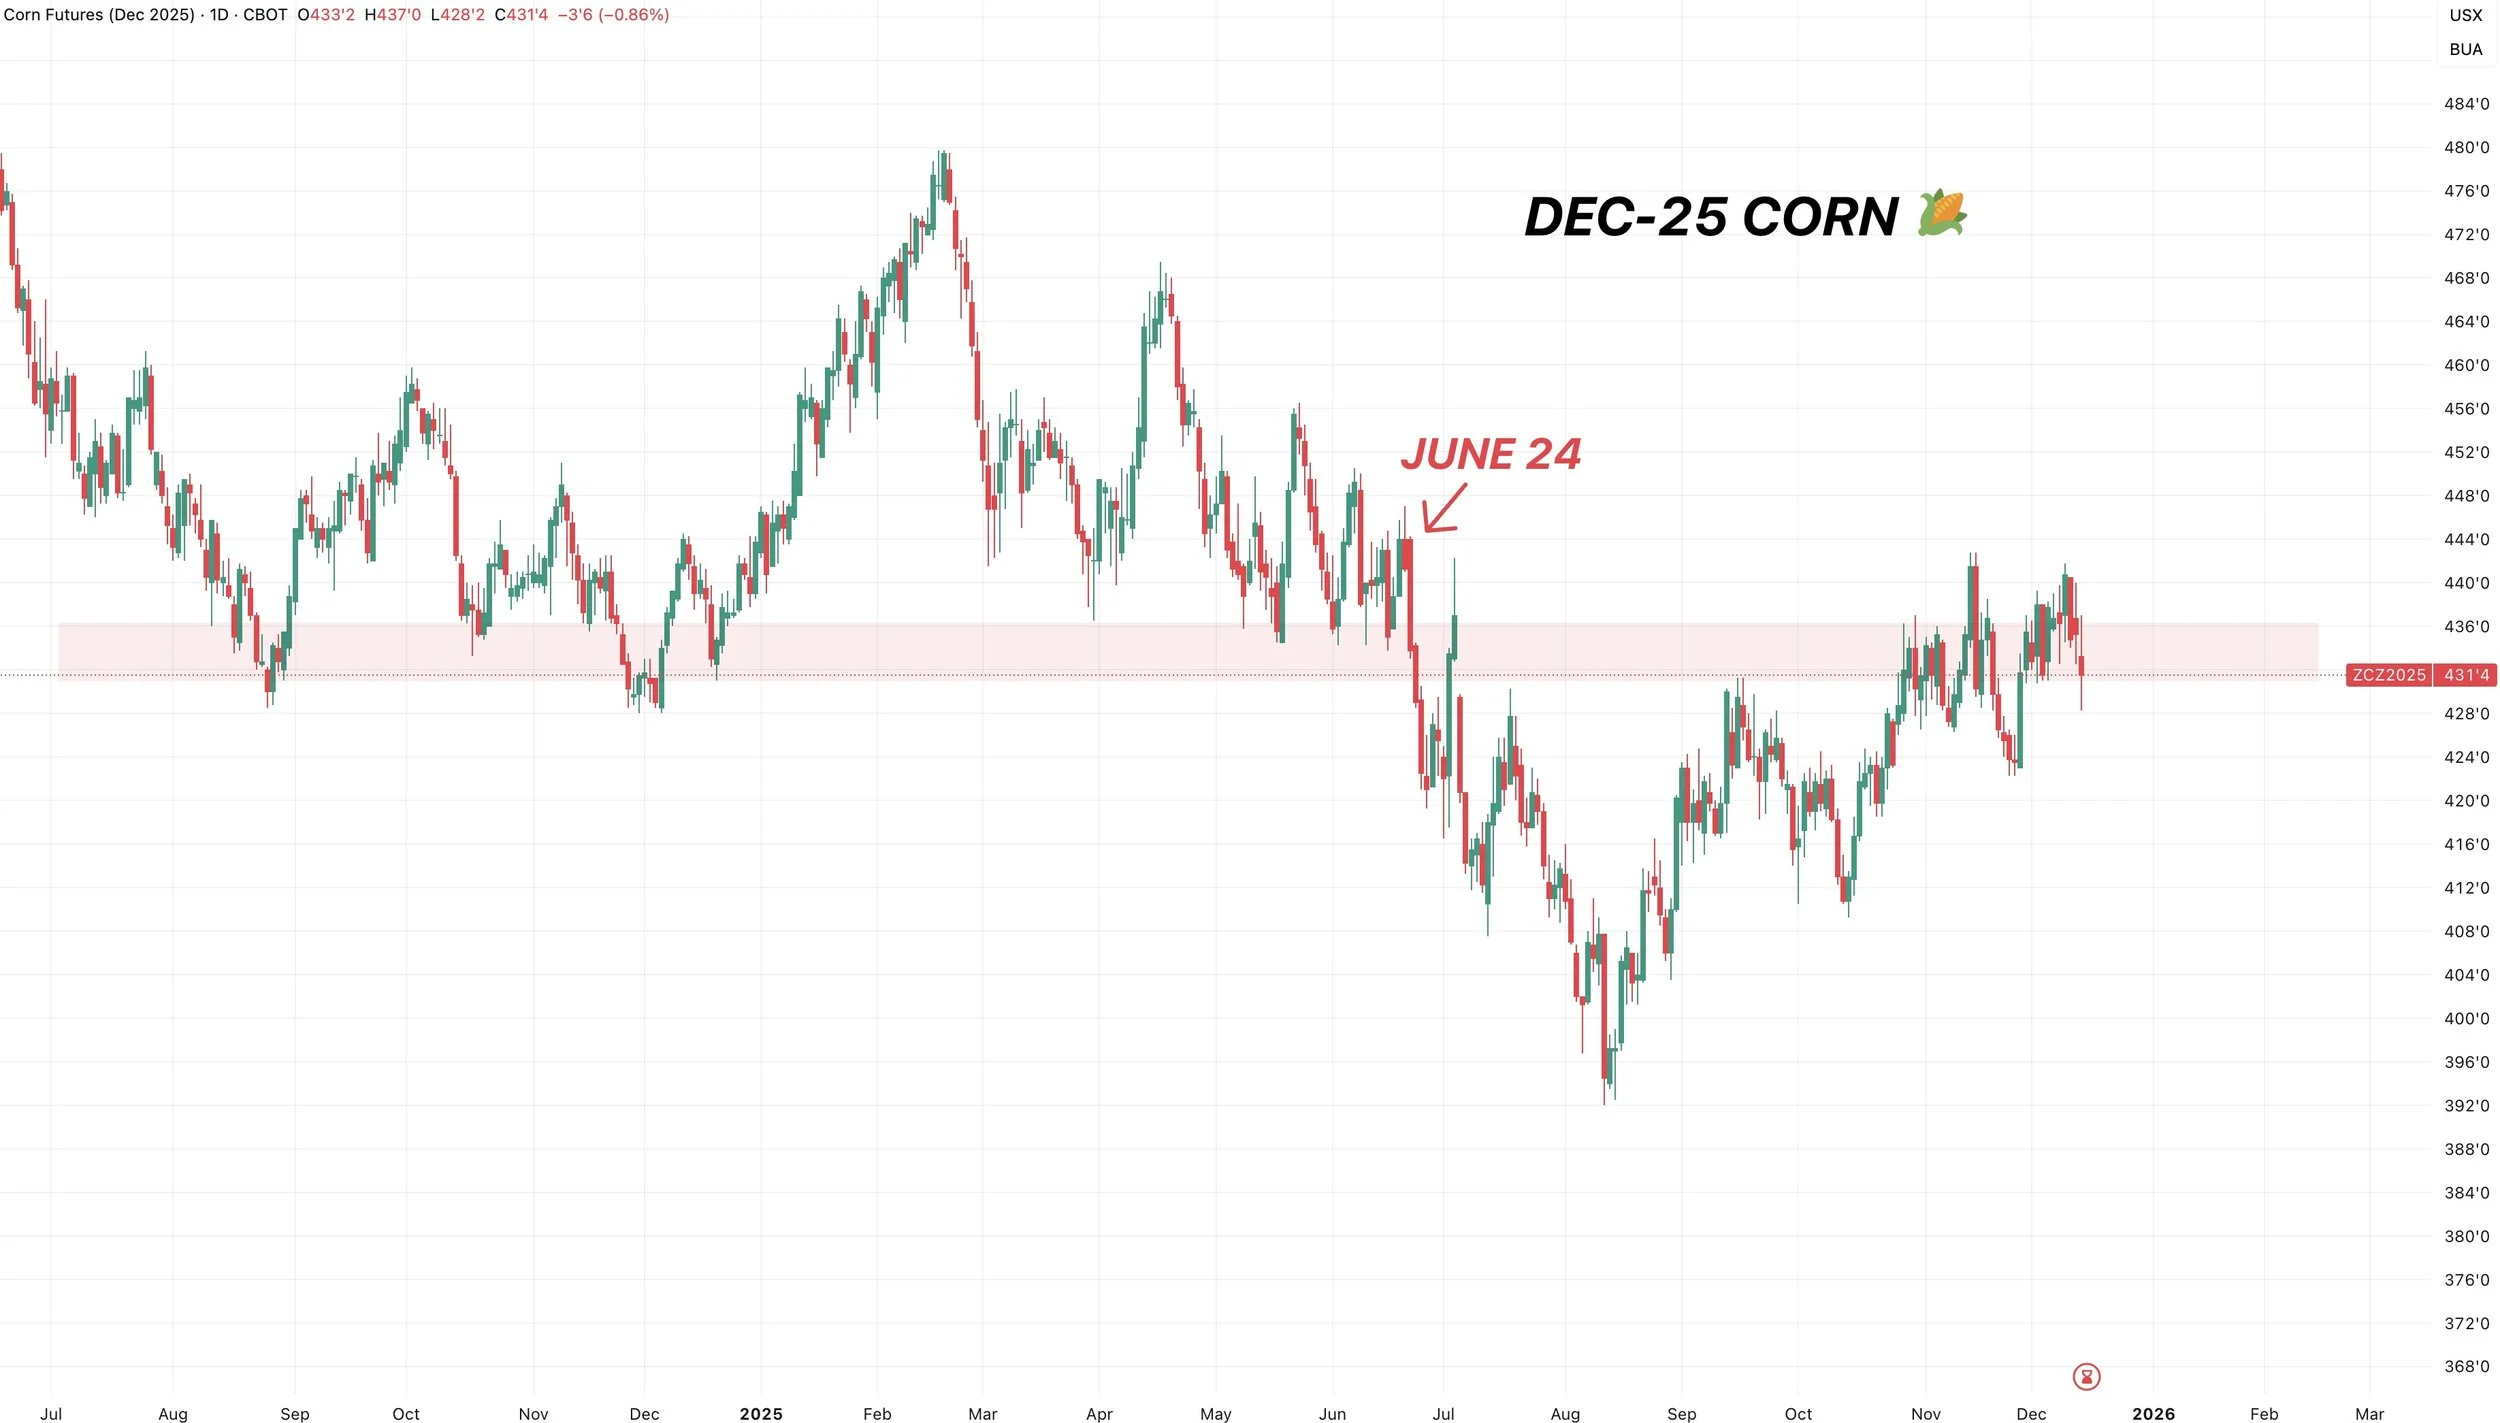
Even years where we top out early and are already well off the highs, we still have tended to find a way to collapse come August.
Take last year for example.
We were well off the highs in May and June, but we didn’t completely fall apart until July.
So, disregarding the war headlines, the market should hold on to weather premium and prevent us from totally collapsing for the next few months.
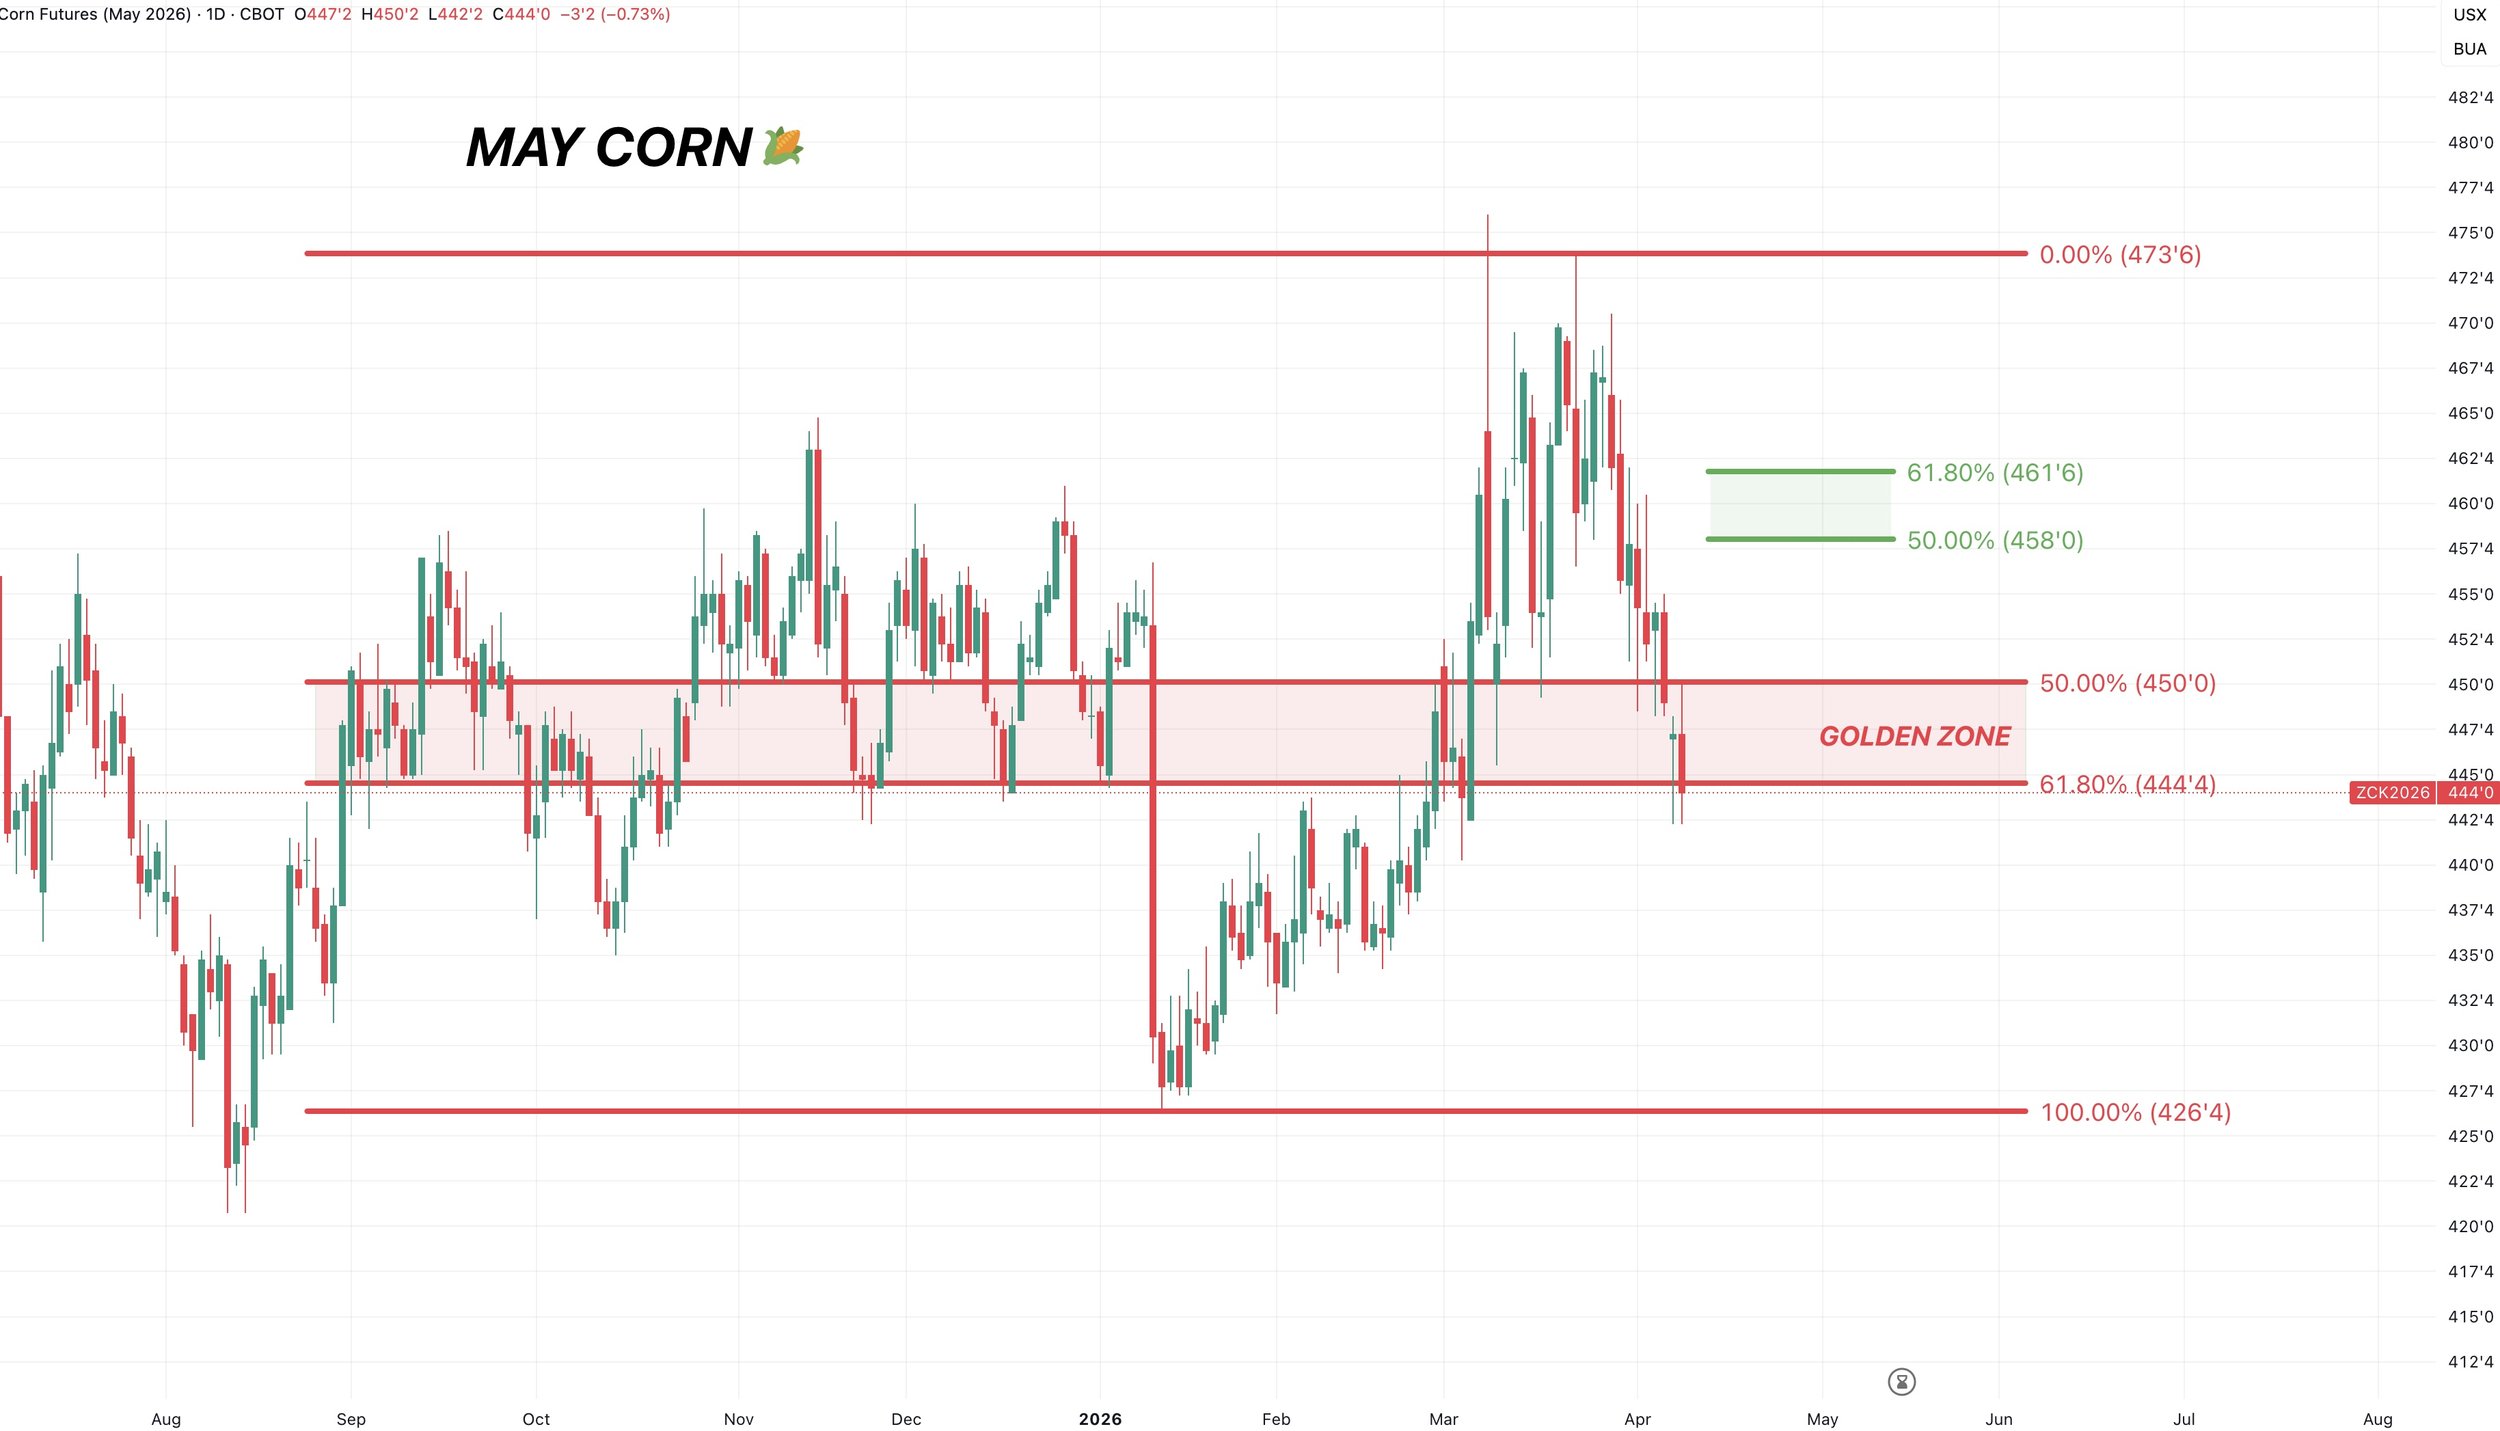
May Corn Chart:
Technically we closed below the 61.8% level, but we still held yesterday's lows and that support from fall.
Need to bounce pretty much right now.
As always this is where the market tells us if this is a normal correction or something bigger.
I personally think we will at least get a relief bounce out of here.
But if we break below this level it will not look too hot, and suggest this might be something bigger.
A usual relief bounce will take us back up towards the $4.58 to $4.62 area.
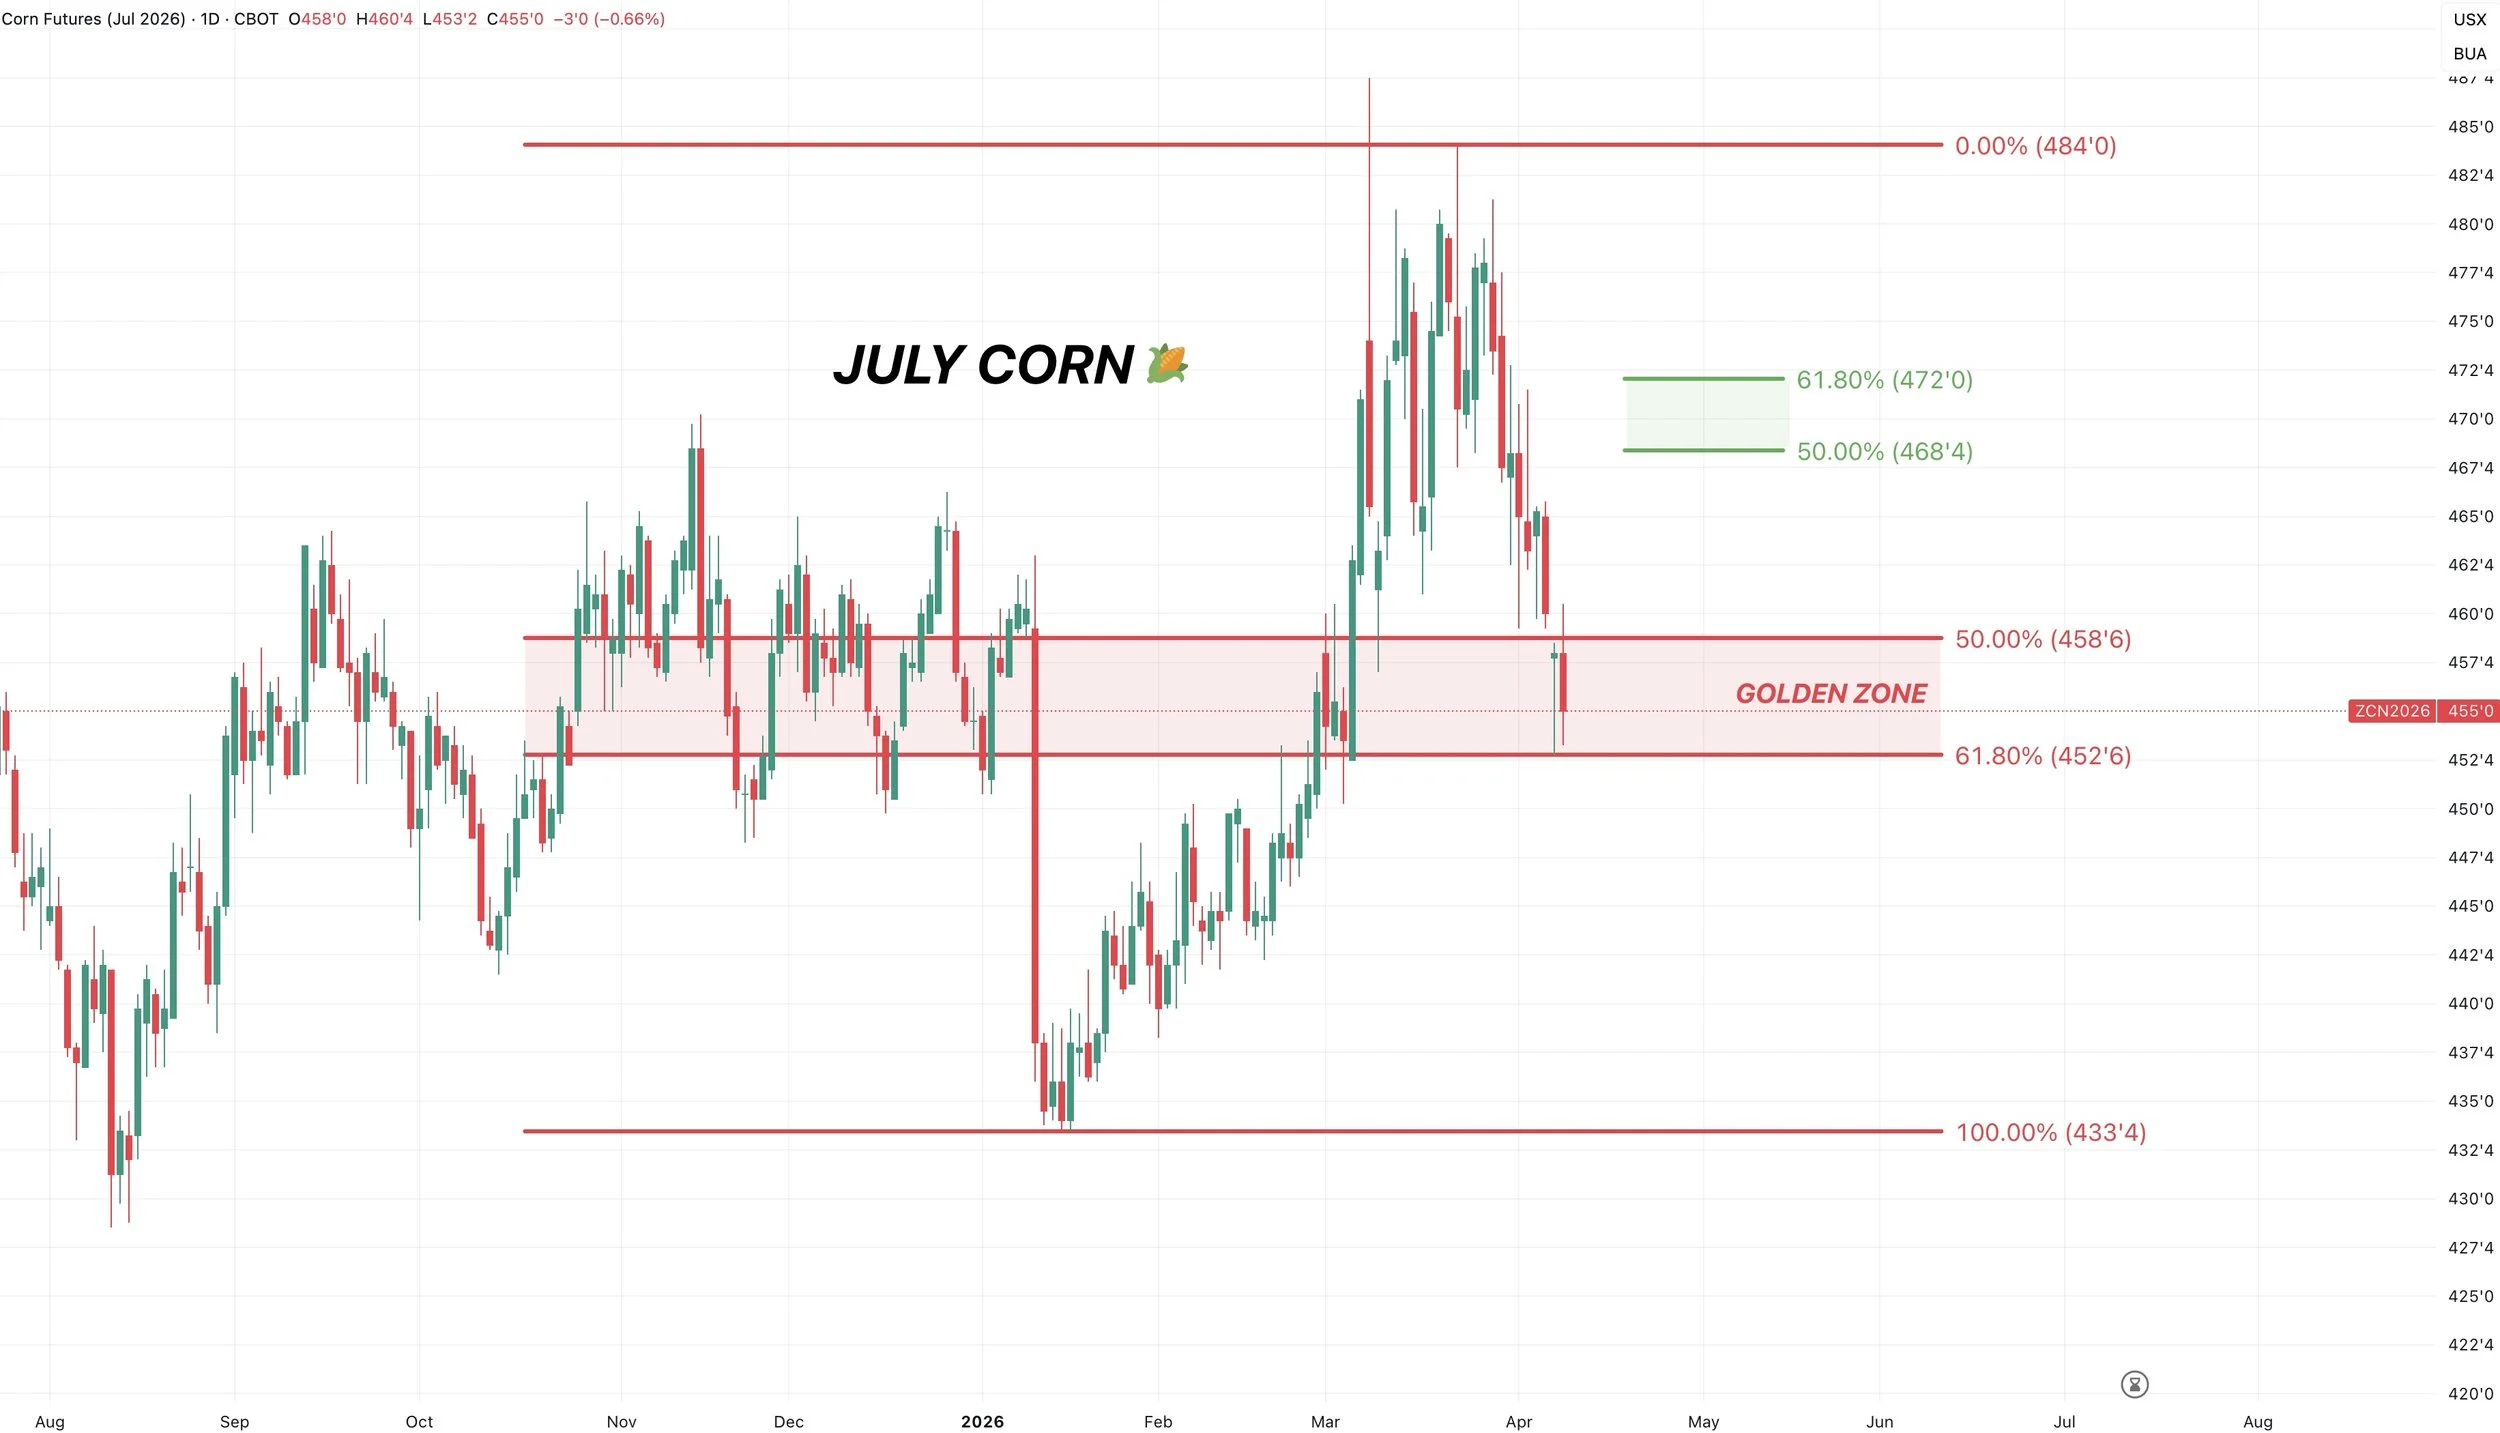
July Corn Chart:
Pretty similar to May.
Overall we need to hold yesterday’s lows or it opens the door lower.
Looking for a relief bounce towards $4.68 to $4.72 if it comes.
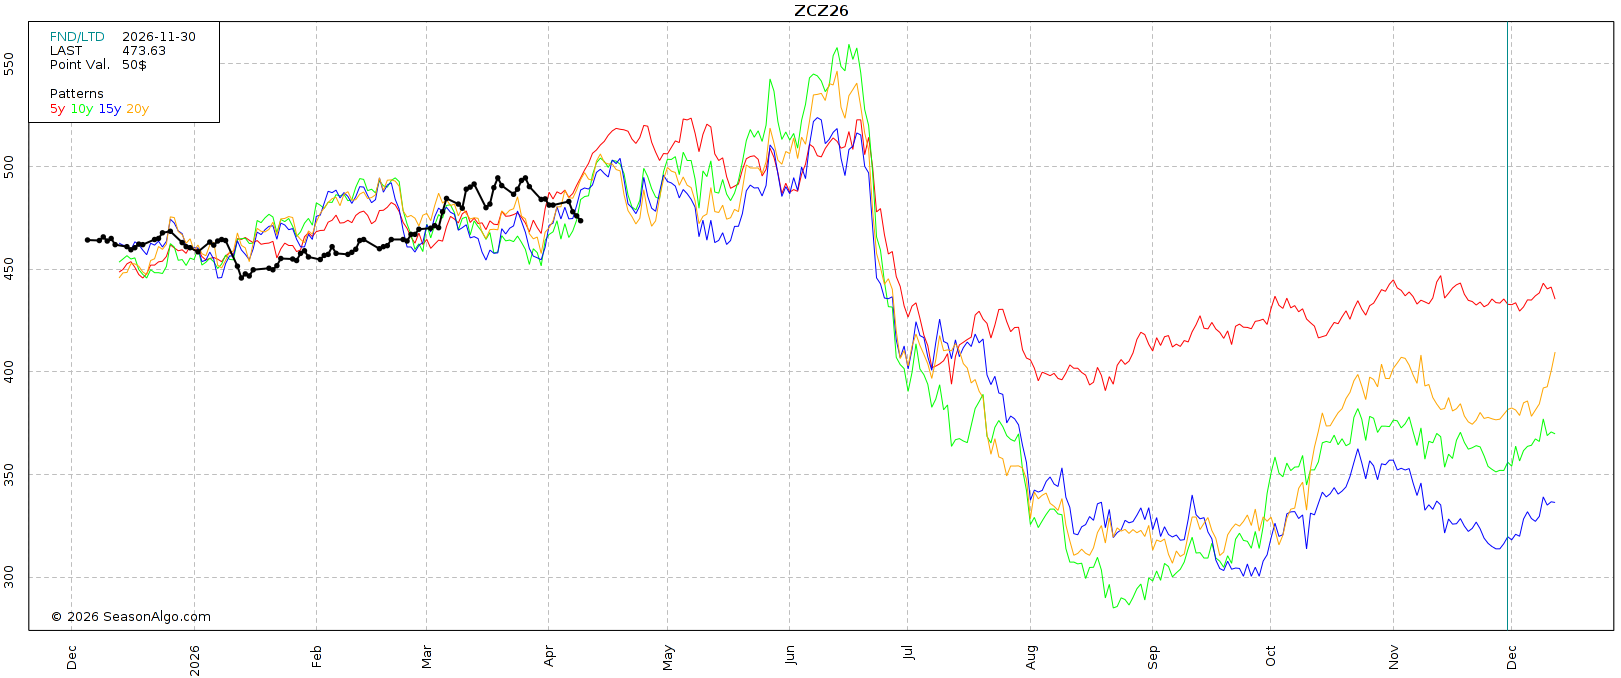
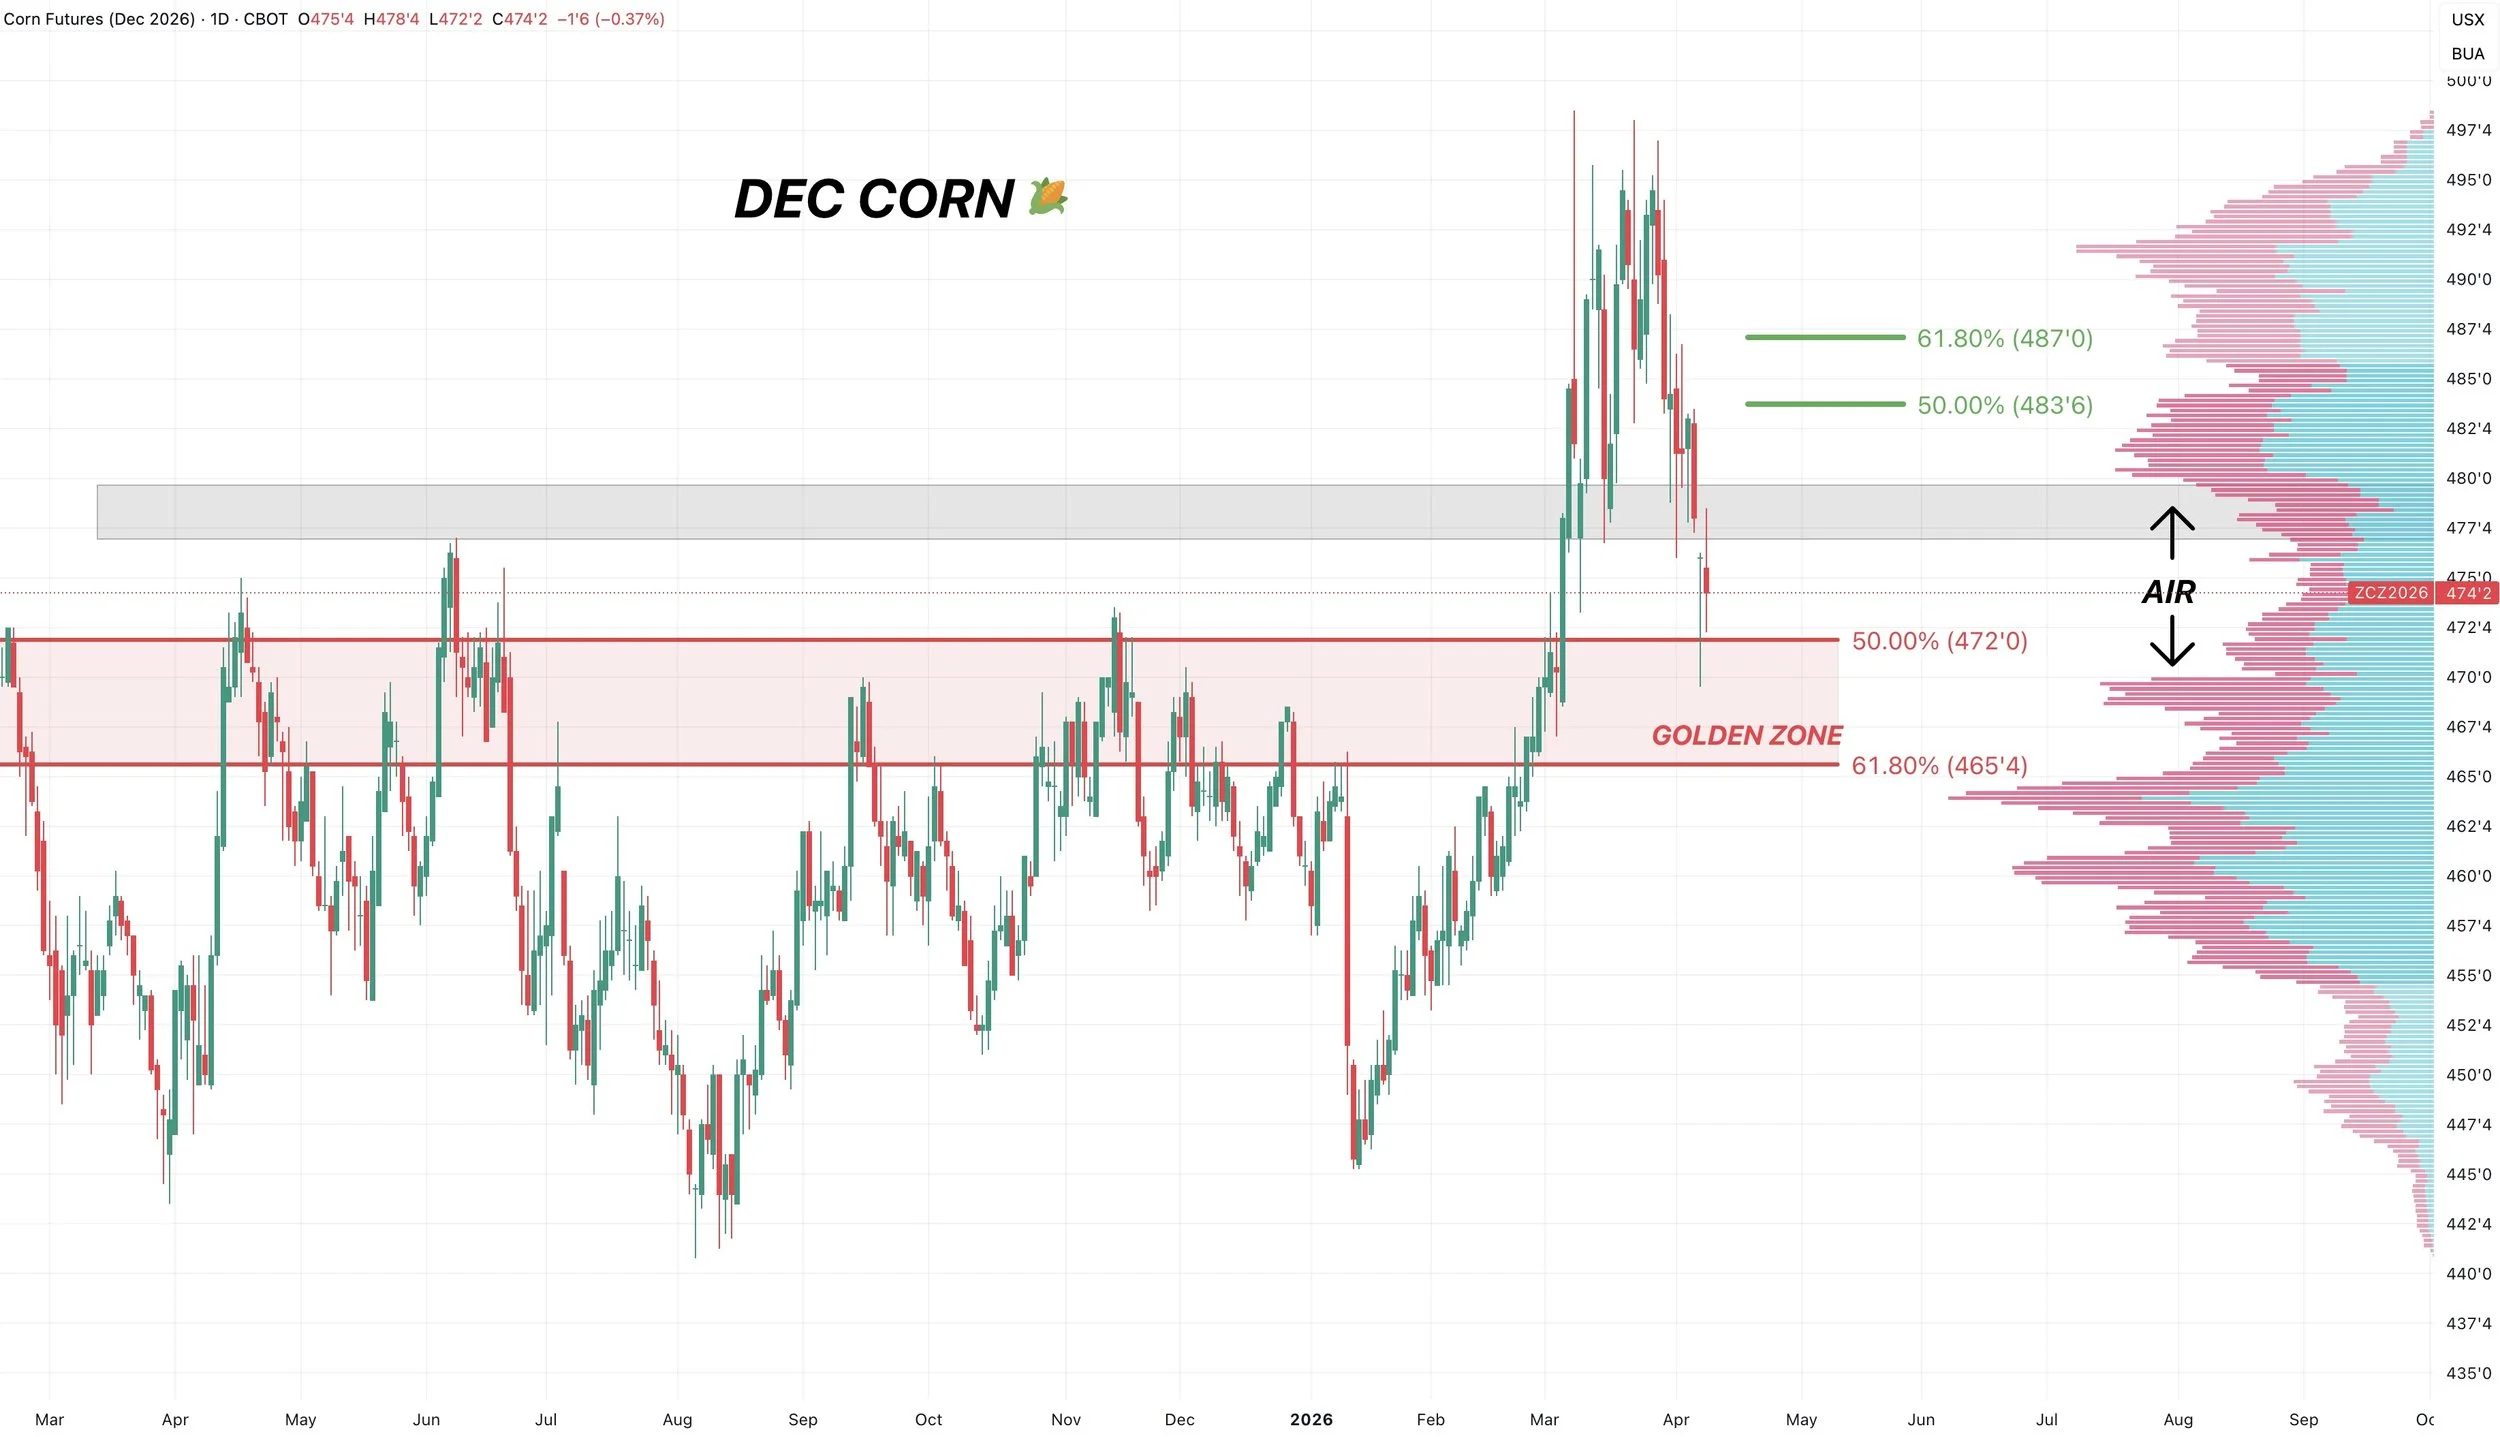
Dec Corn Chart:
We broke below key volume and went right to the next area of high volume.
We tagged the golden zone.
Finding a bottom in this zone makes sense.
It's the golden zone, it's an area of high volume, and it's old resistance.
If this is the true bottom, a bounce would normally take us towards $4.84 to $4.87
Soybeans
Not a lot on soybeans today.
I'd argue that this war has the least impact on soybeans directly, meaning that this rally we've seen in soybeans the last several months wasn’t driven by war. Like it was in corn and wheat.
Soybeans were already trading at 2-year highs well before the war started due to the China buying.
Soybeans are in a different situation.
Of course, long term, if crude and inflation run, soybeans will also follow.
But at the same time, China wants this war over with.
China was one of the ones that was trying to broker a peace deal between the US and Iran.
The reason that the original meeting was canceled and why soybeans had that limit down day, was because Trump and China were waiting for the war to be over.
If you want that business from China, the war ending might help that.
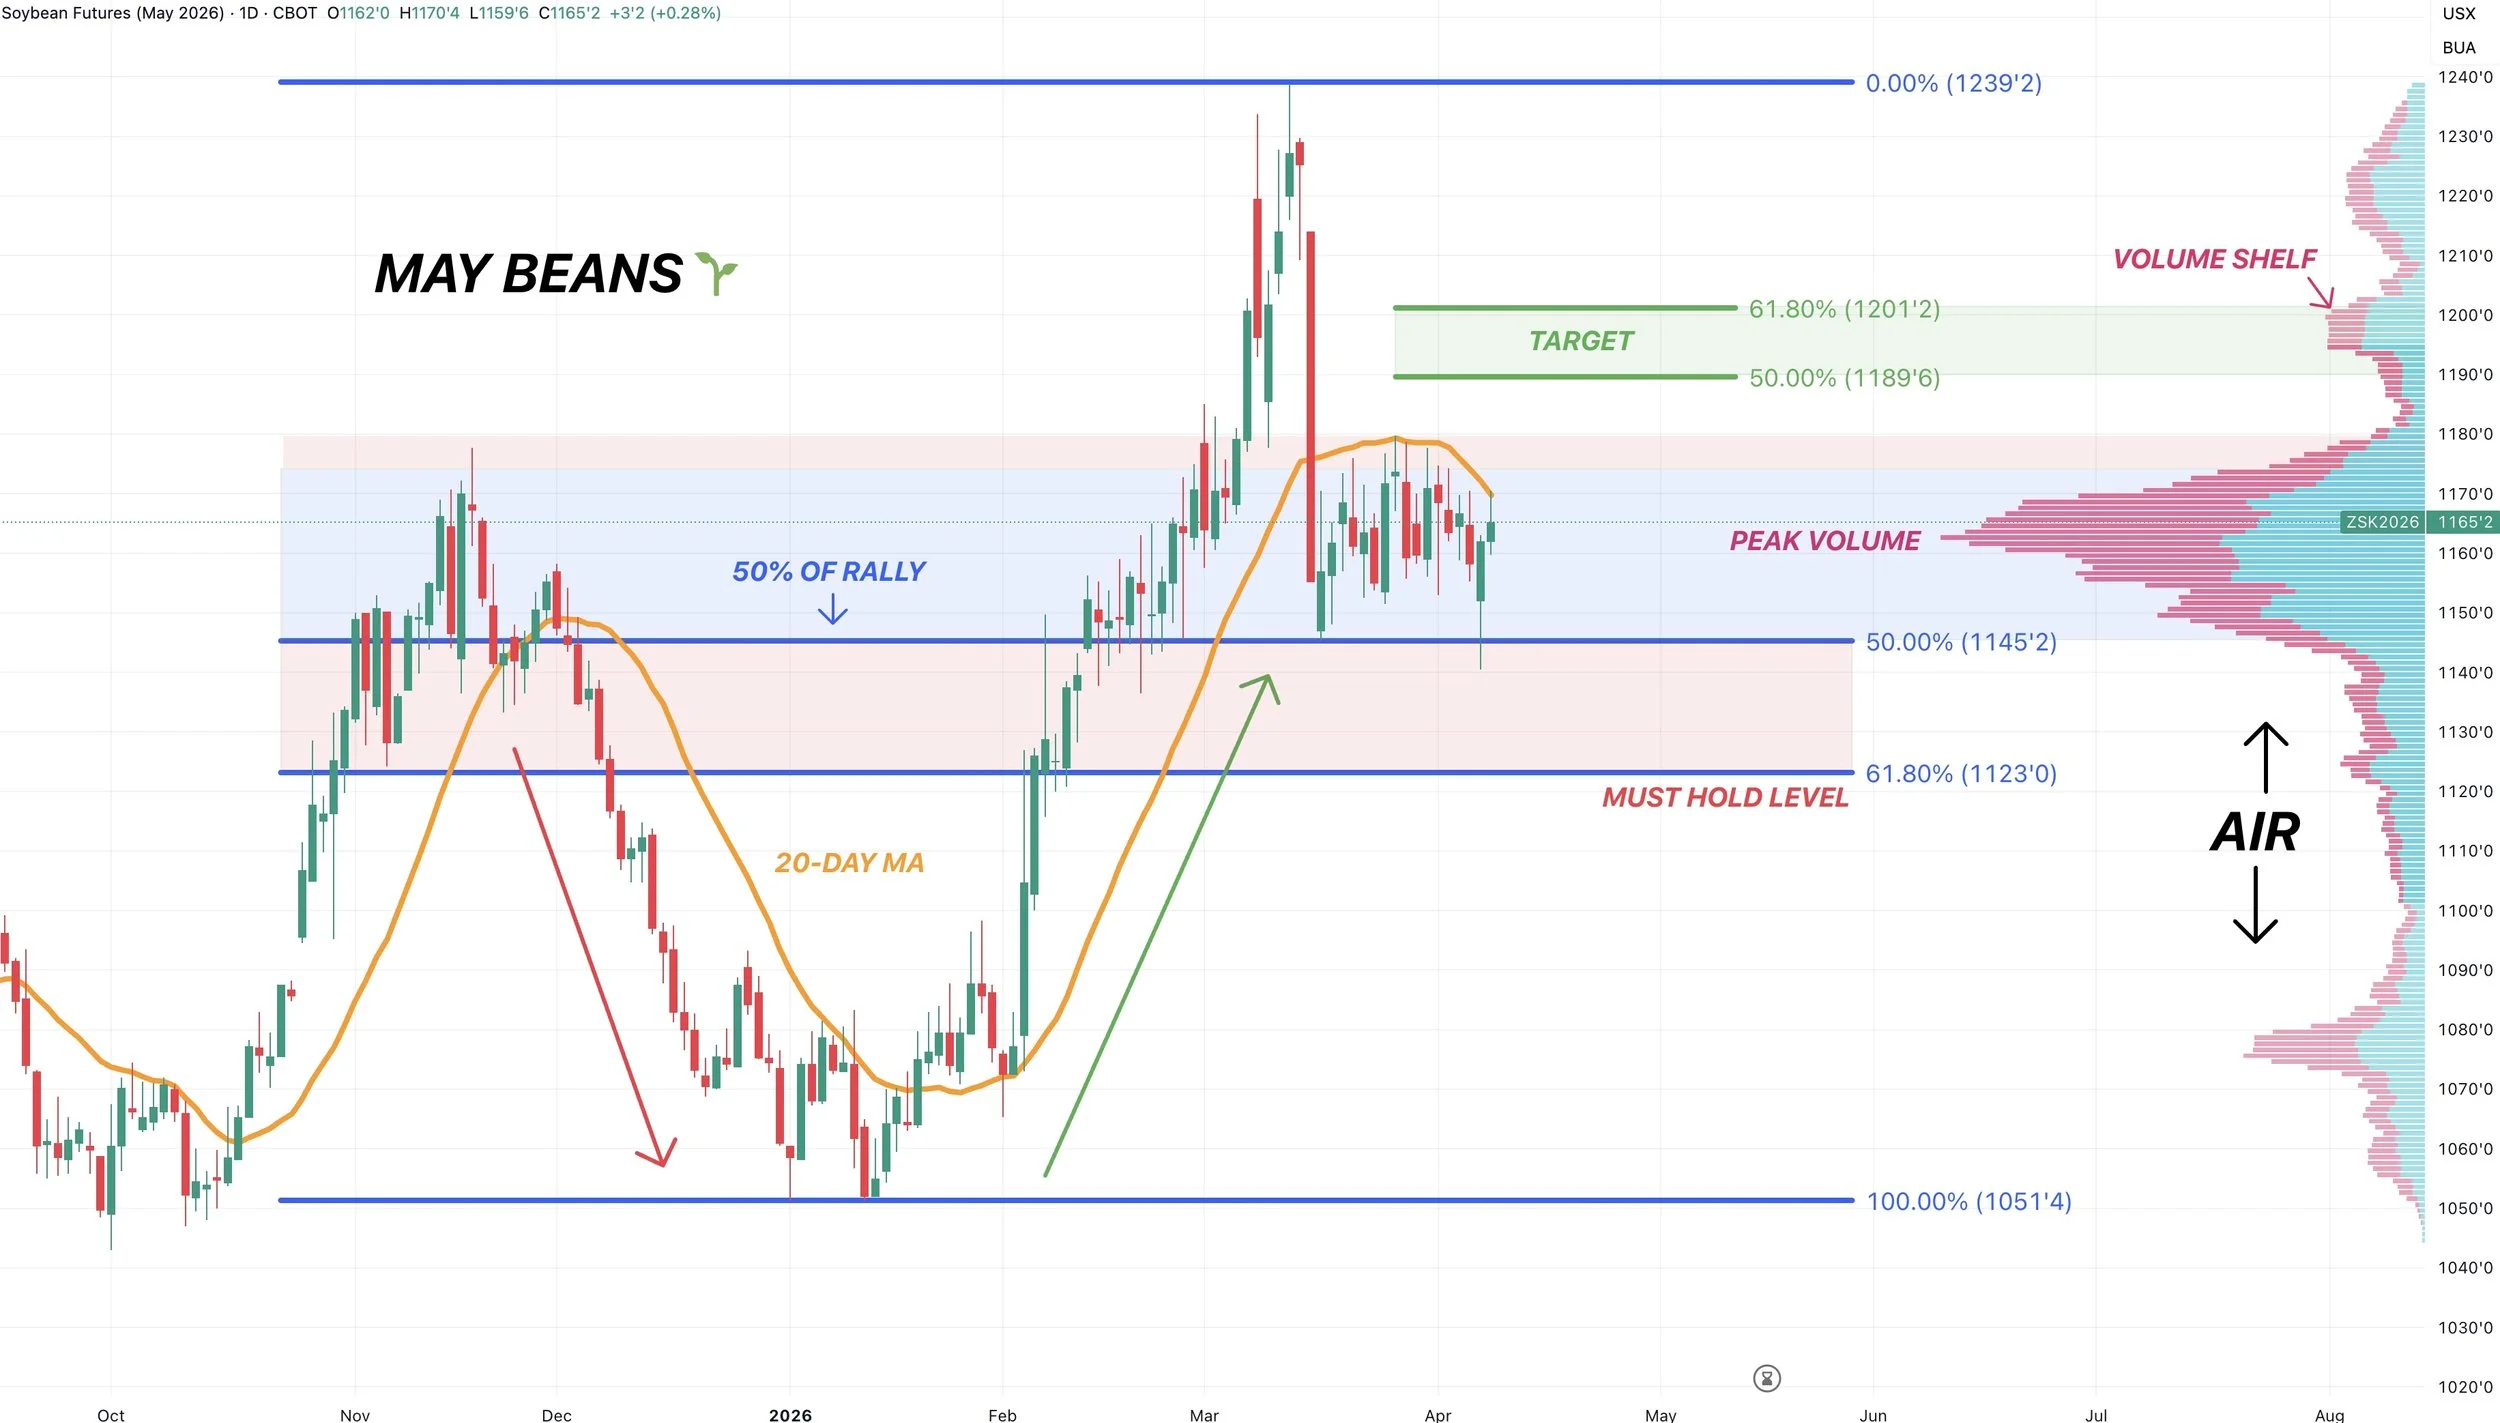
May Beans Chart:
Overall still waiting for confirmation here.
We continue to hold support and this area of high volume. Chilling right at those highs from last November.
Yesterday could’ve easily been a false breakdown and bear trap.
$11.45 is still the area we have to hold, or it will likely trigger a leg lower.
To the upside, we continue to reject the 20-day MA.
Today we failed right at it. That is our lid for now. But it's also going to be our indicator.
If we break above it, it should cause some algo buying and give us some confirmation we are potentially heading higher.
In the event we go higher, I am still looking to reward a move towards $11.90 to $12.00
The golden zone is where most relief bounces fail.
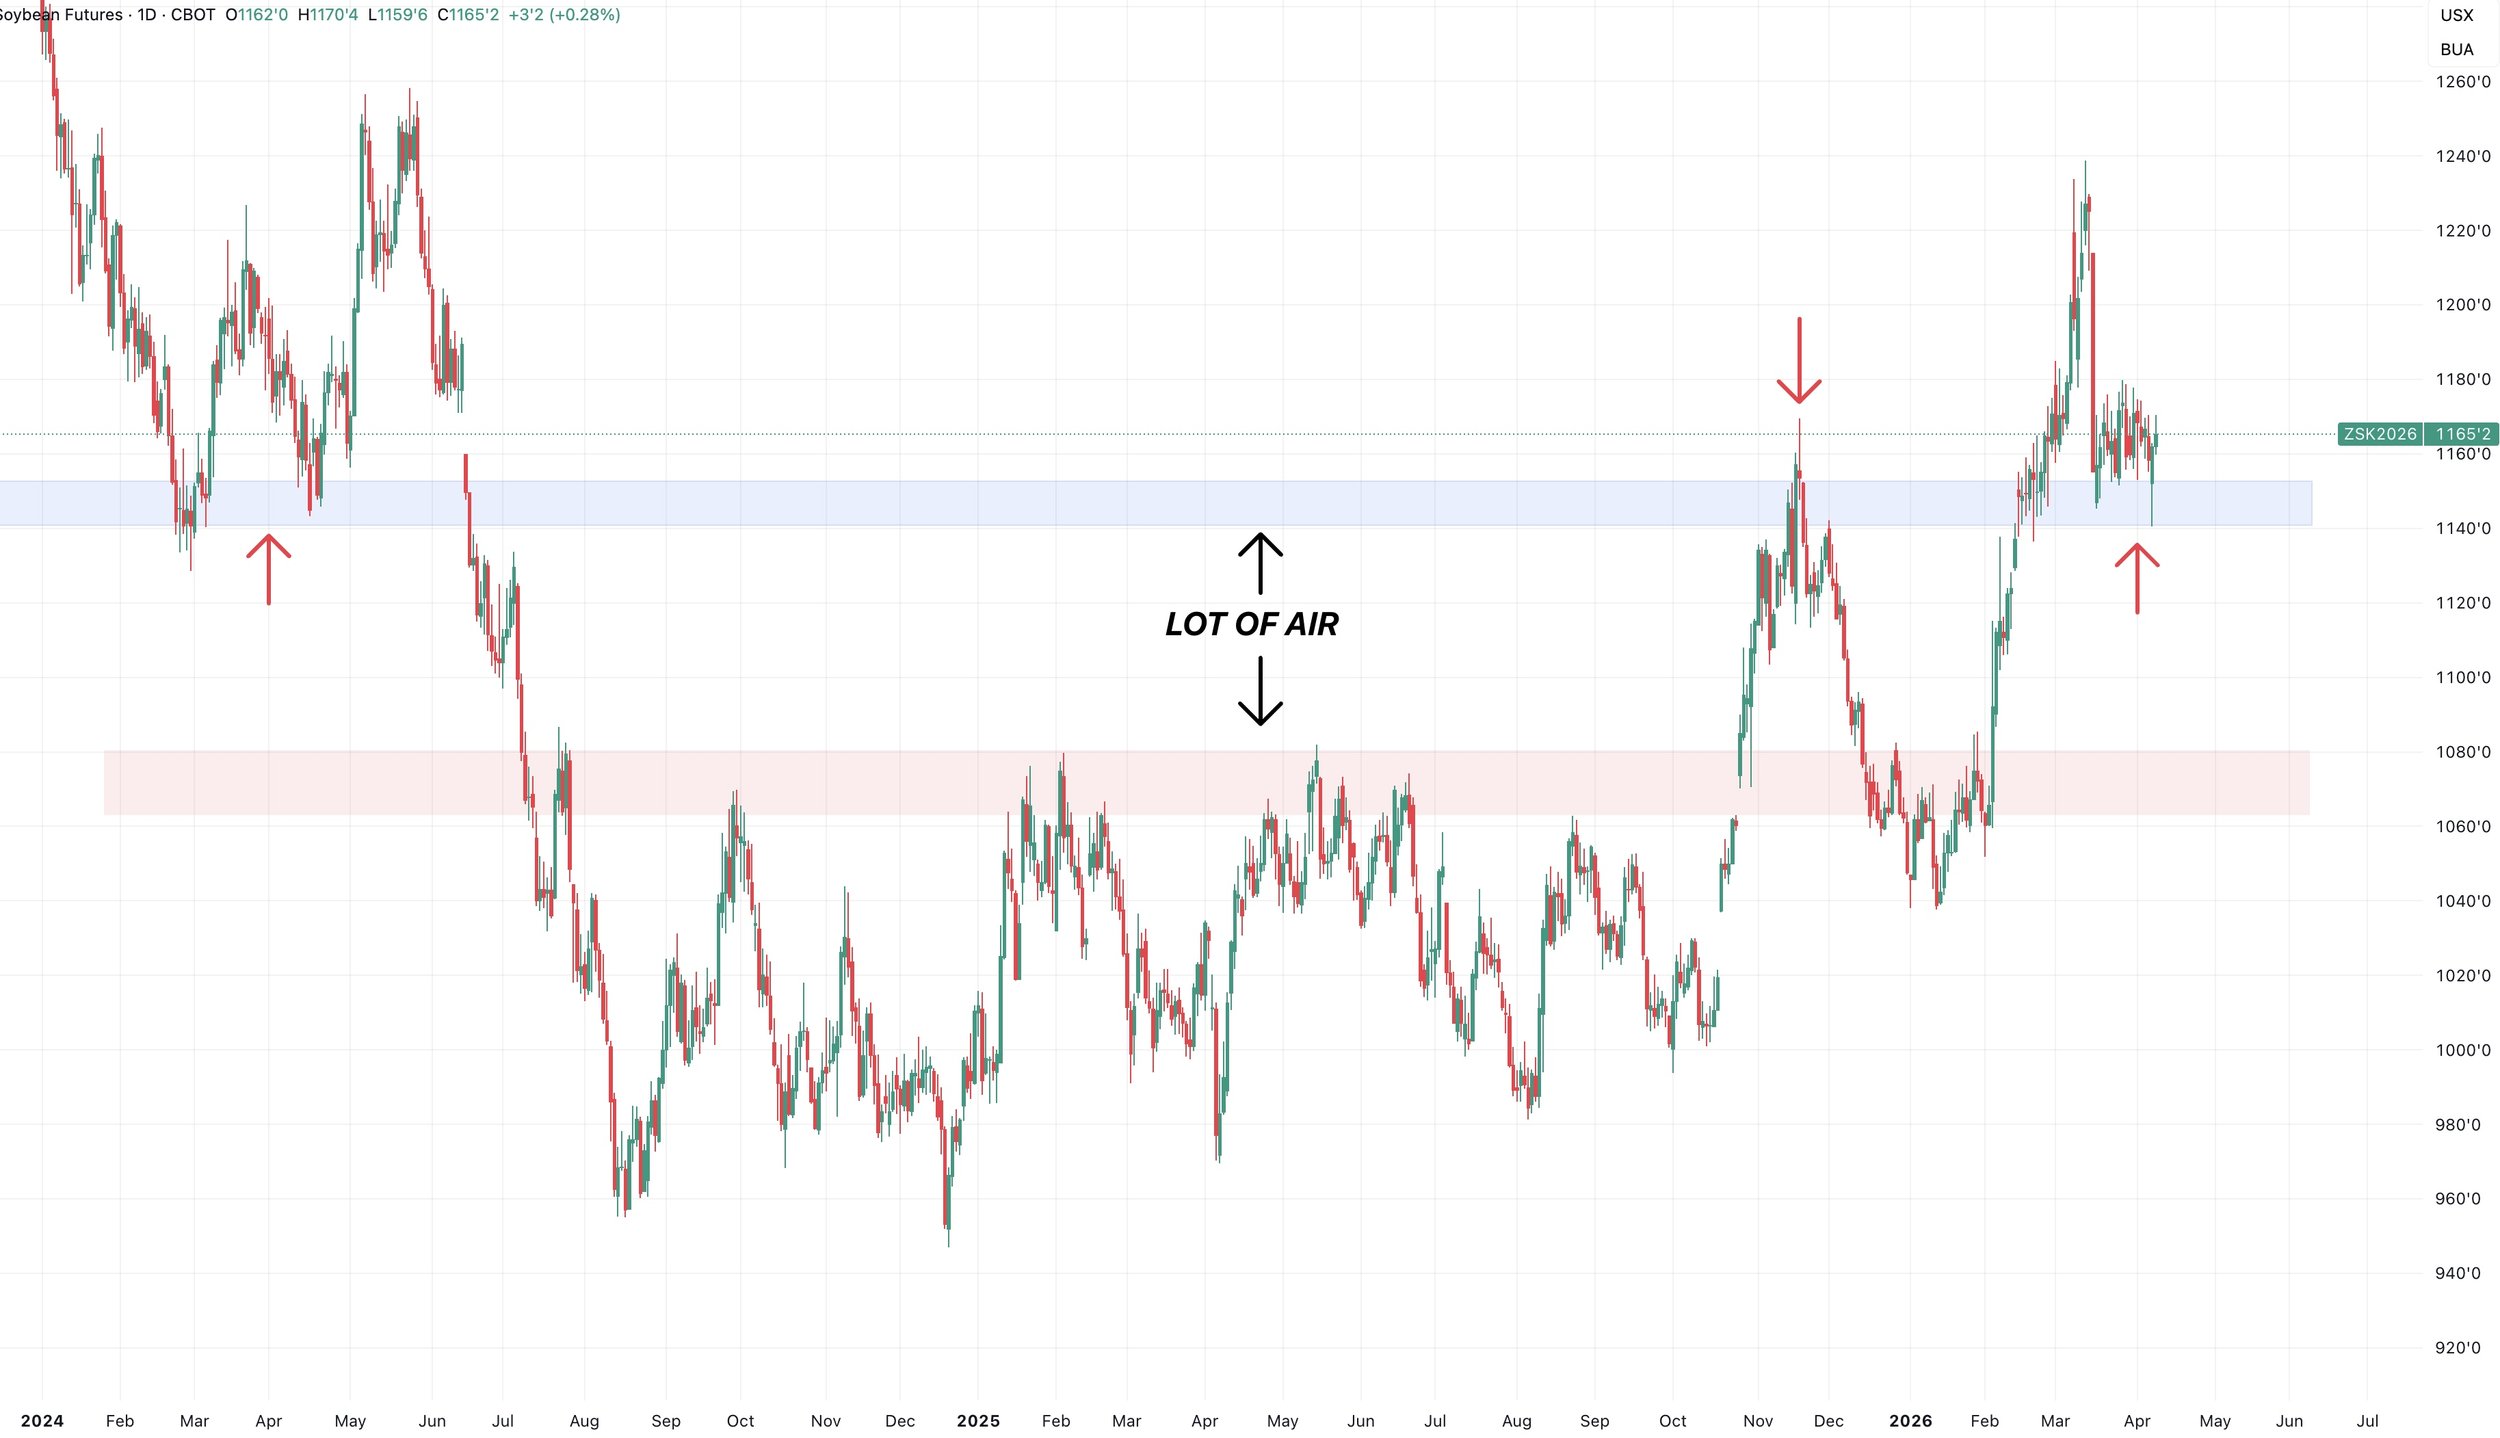
Big Picture Chart:
Here is front month beans.
Right now we are finding life right at those highs from back in November.
This same level was key support back in 2024.
It's a pretty key support and resistance level.
If we start to break below this level, there is some air lower.
Key spot we'd like to hold.
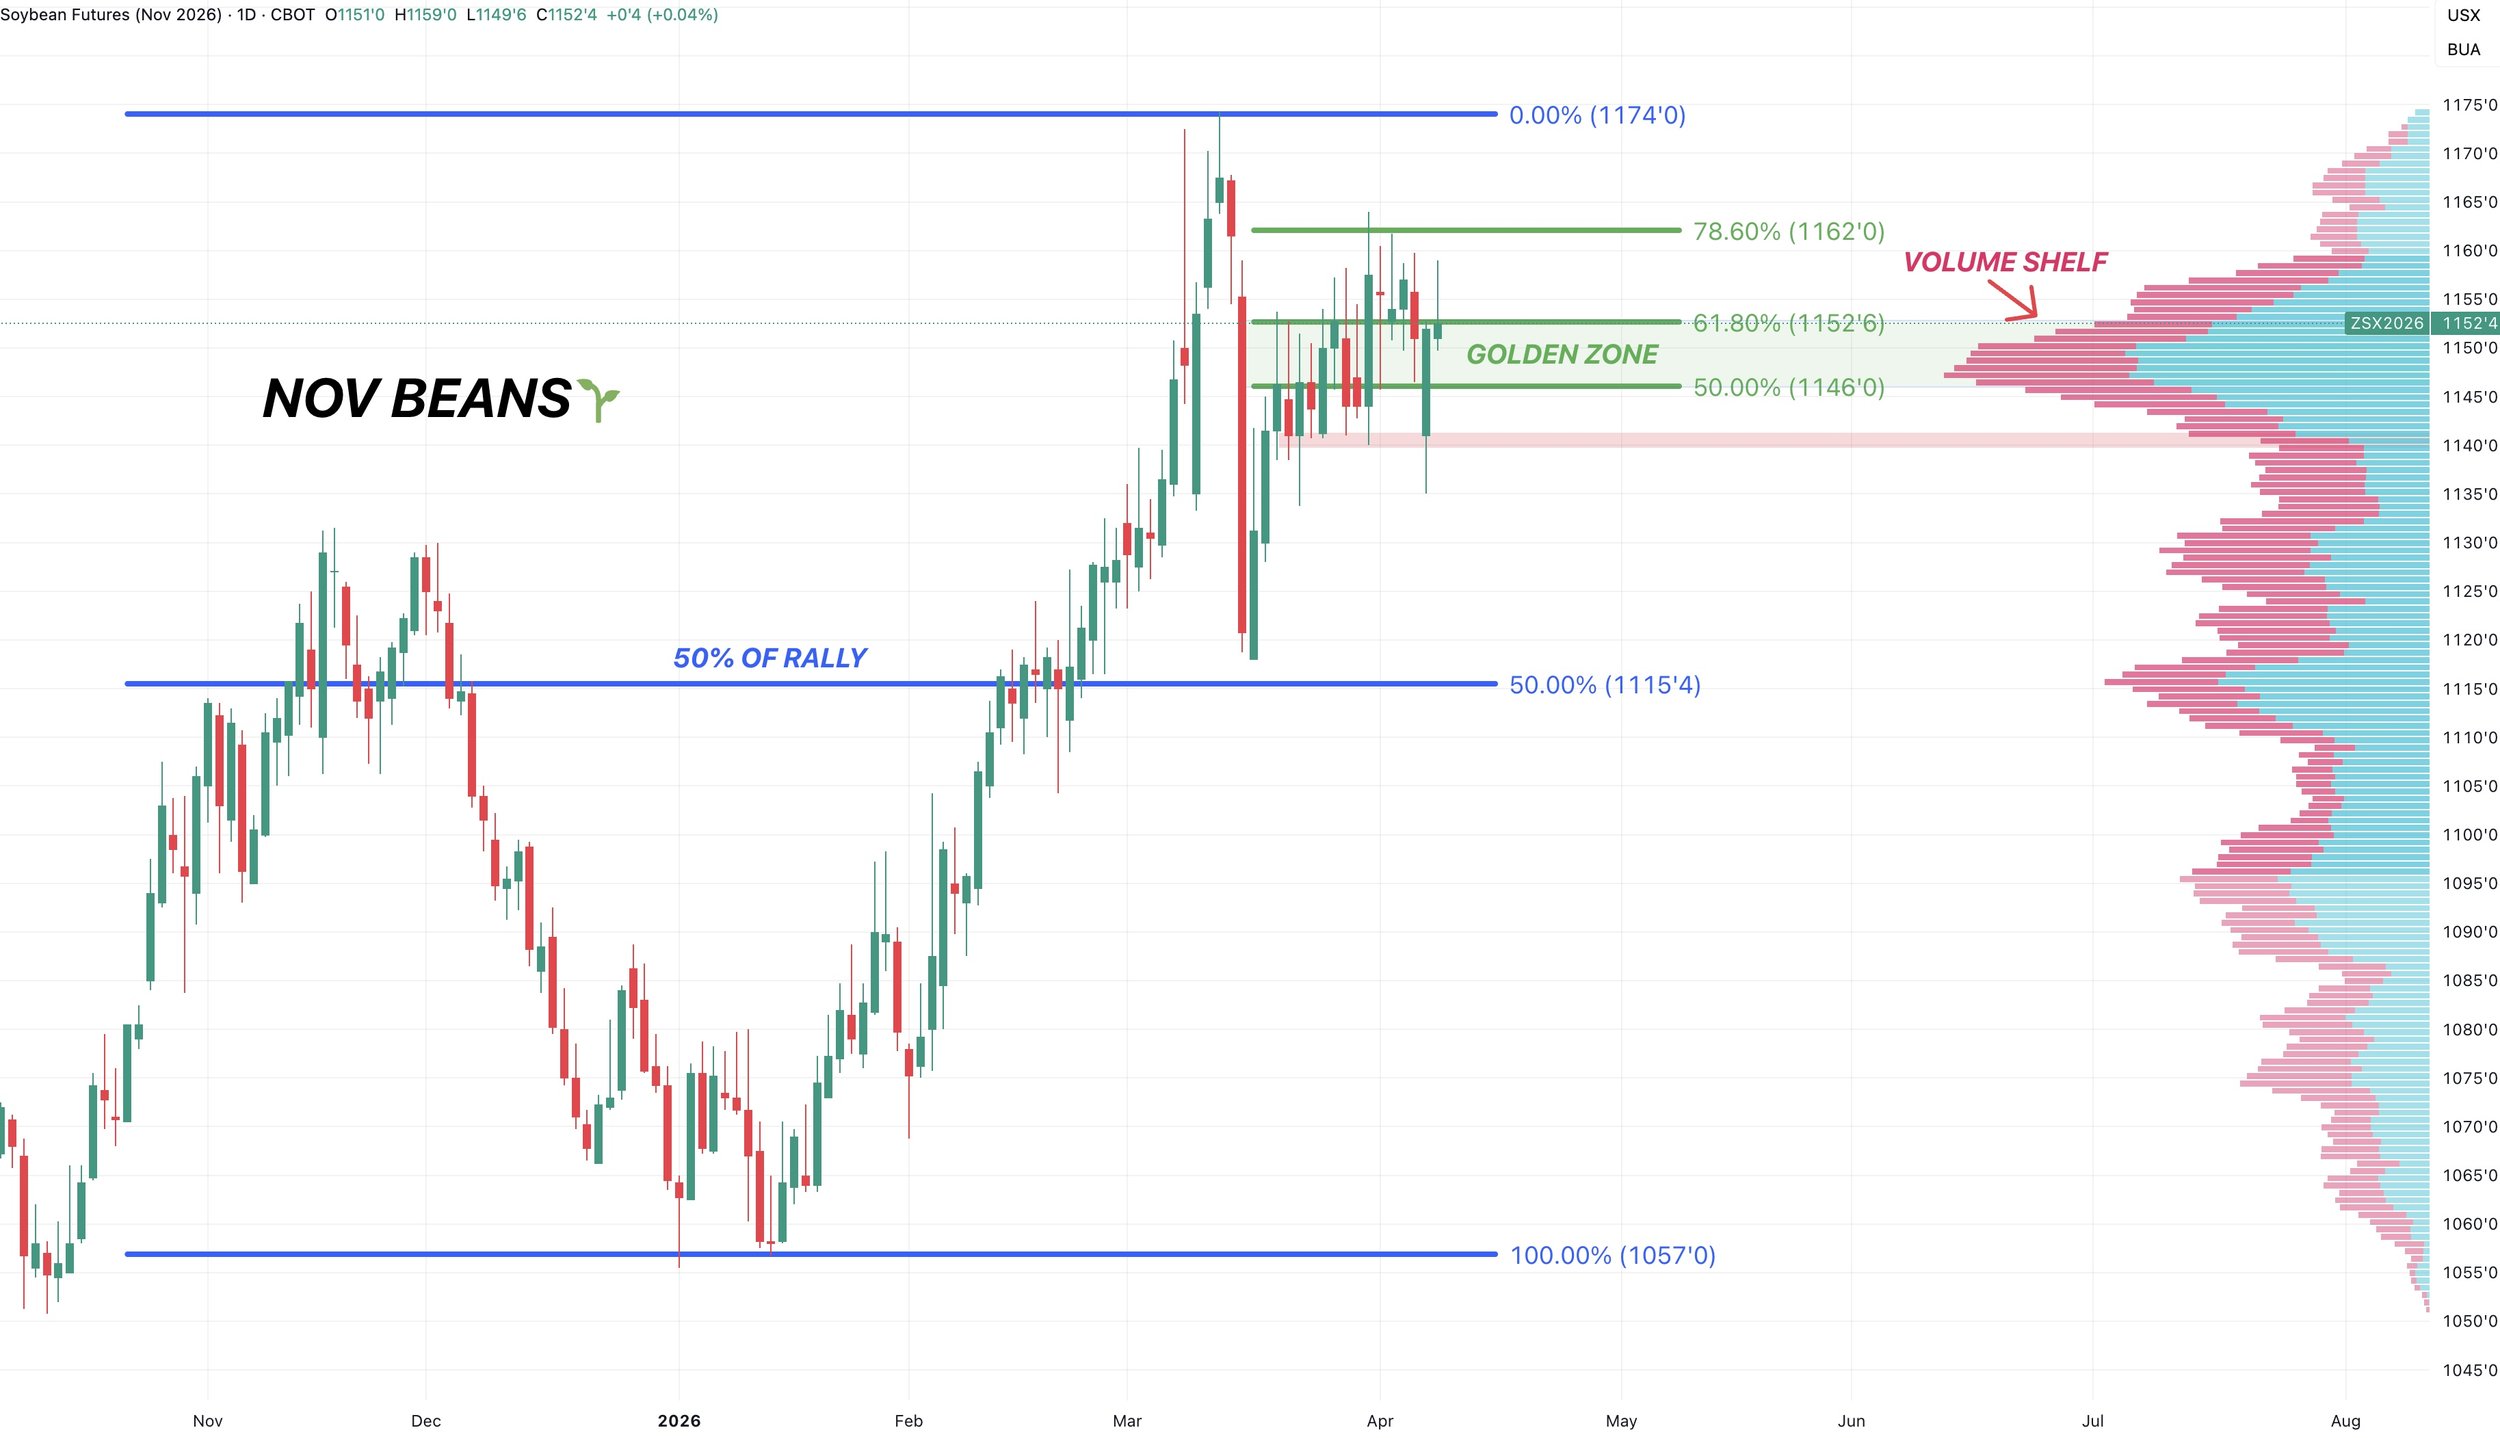
Nov Beans Chart:
If you haven’t rewarded this rally yet, we did so at this level. As it's still some key resistance.
Overall still completely sideways up in this key retracement level and area of high volume.
Watching May beans more closely. As if they get that bounce, Nov could go post new highs.
Wheat
Wheat had a bearish report today which didn’t help things.
At the same time, this market has started to remove some of that weather premium it's built in.
You could still argue that these rains might be a little too far east, but when the market sees rain in the forecasts, it's going to remove some premium.
Really going to come down to what actually falls or doesn’t fall.
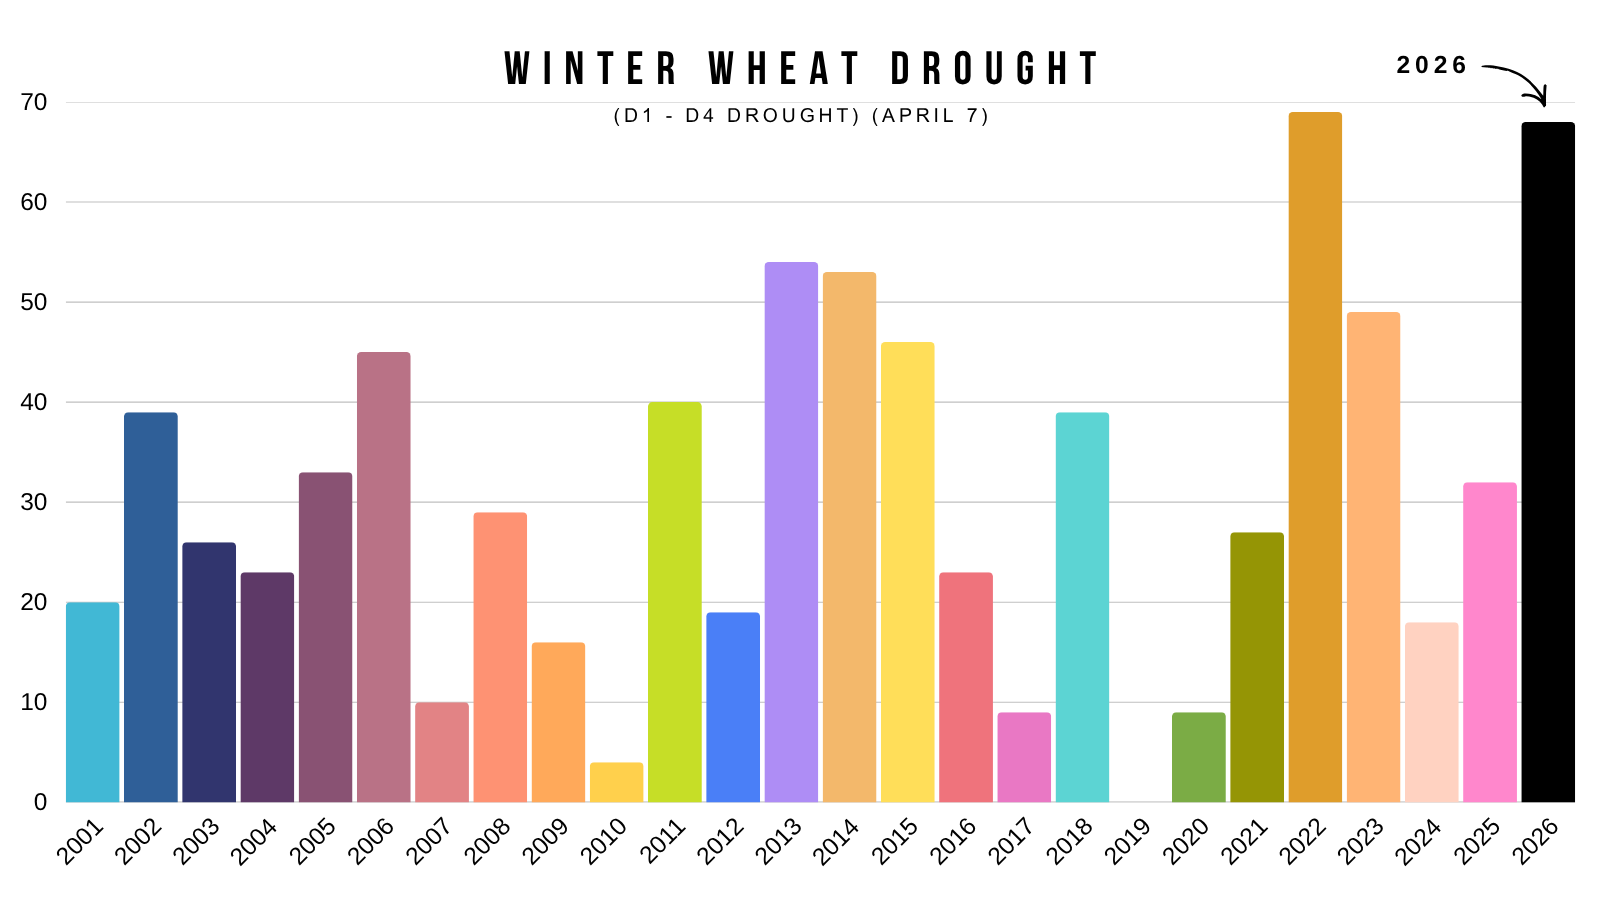
Areas in drought continue to ramp up.
Now sitting at 68% up from 65% last week.
This is the 2nd most drought we've ever seen. Only behind 2022.
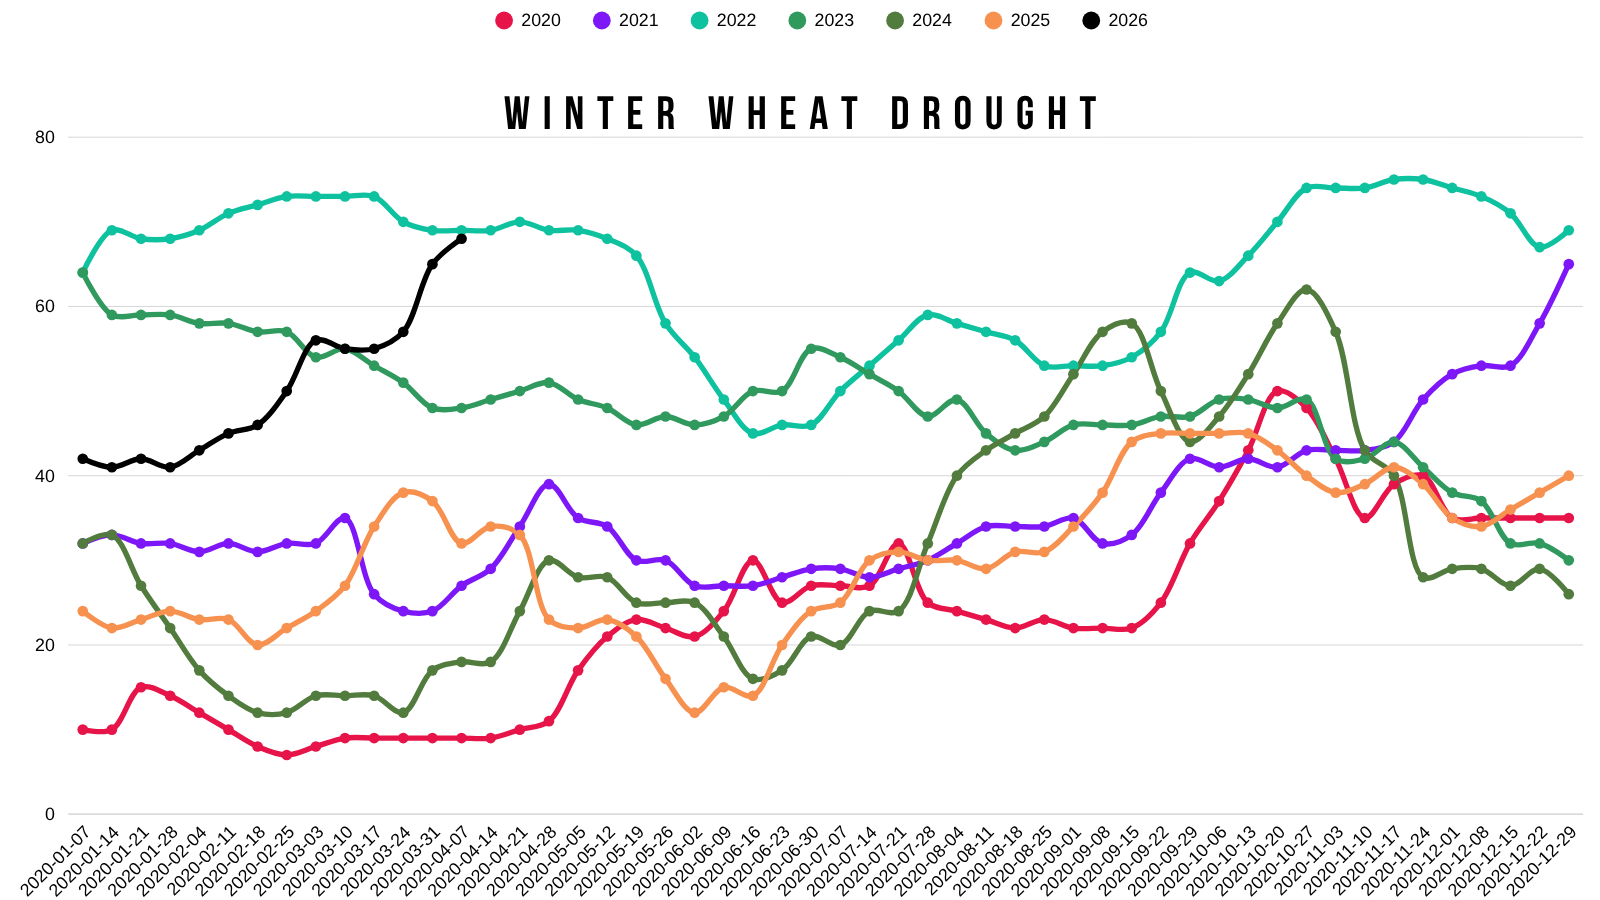
Here is a year by year breakdown of areas in drought for today's date.
Again, the 2nd highest ever only behind 2022.
Pure Fundamentals
No. The wheat balance sheets are not friendly.
I mean the old crop carryout is the highest in several years, altough on the Feb Outlook they are expecting new crop to come down compared to last year.
The world situation had been on a steady decline since 2020, but this was the first year where it's seen a sizeable jump.
But clearly, this isn’t a direct correlation to prices.
As last year the world stocks to use was the lowest in 5 years, yet prices were also at 5 year lows.
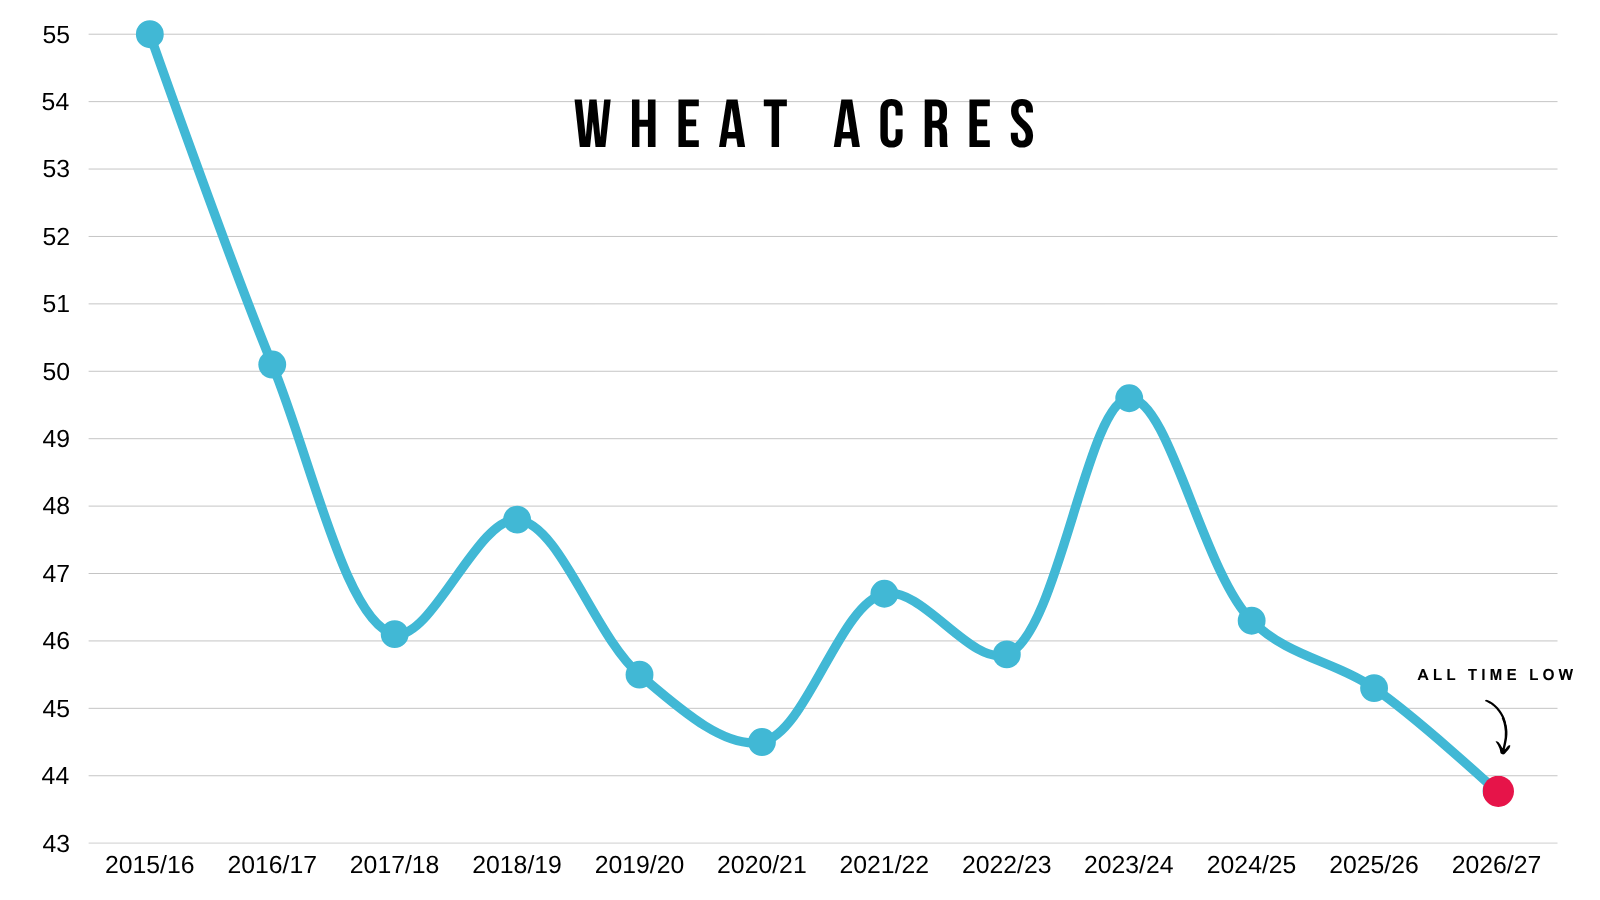
At the same time.. acres are projected to be at an all-time low.
Then we of course have the whole fertilizer situation.
This could impact wheat the most simply given the fact that someone around the world is always growing wheat.
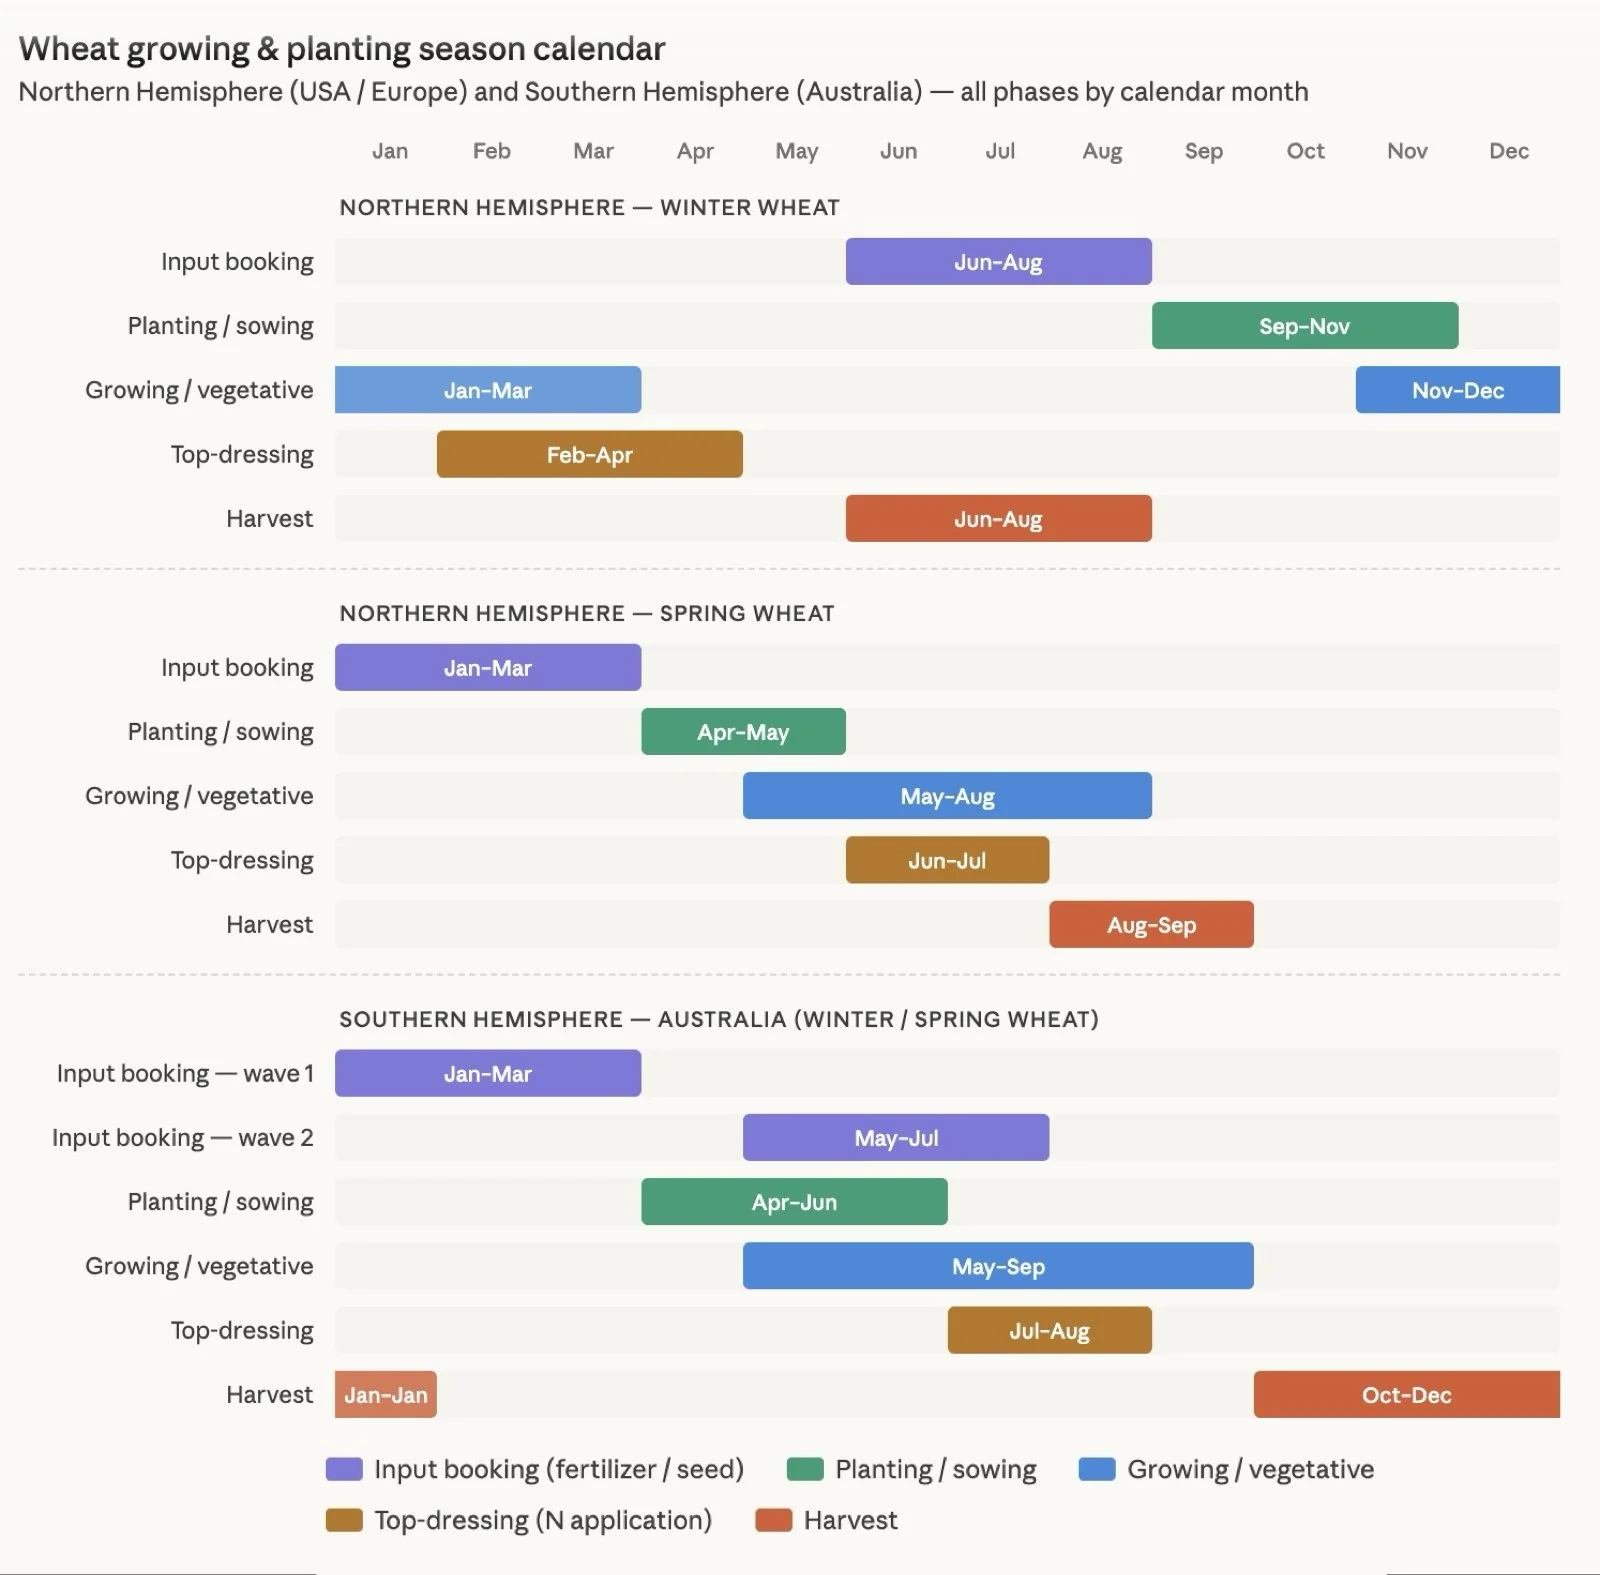
Here is a growing season chart for the northern and southern hemispheres. This chart also shows that rough input booking timeframe.
North America has a large part of their needs covered, but if the strait stays closed it could be an issue for others. Even if the strait closes, I am sure it will take some time for fertilizer prices to cool back down regardless.
Wheat doesn’t have to go higher from here.
But long-term, there is definitely a case to be made that there is a possible story brewing down the line.
You could also ask, how will this impact next year's crop if costs stay high?
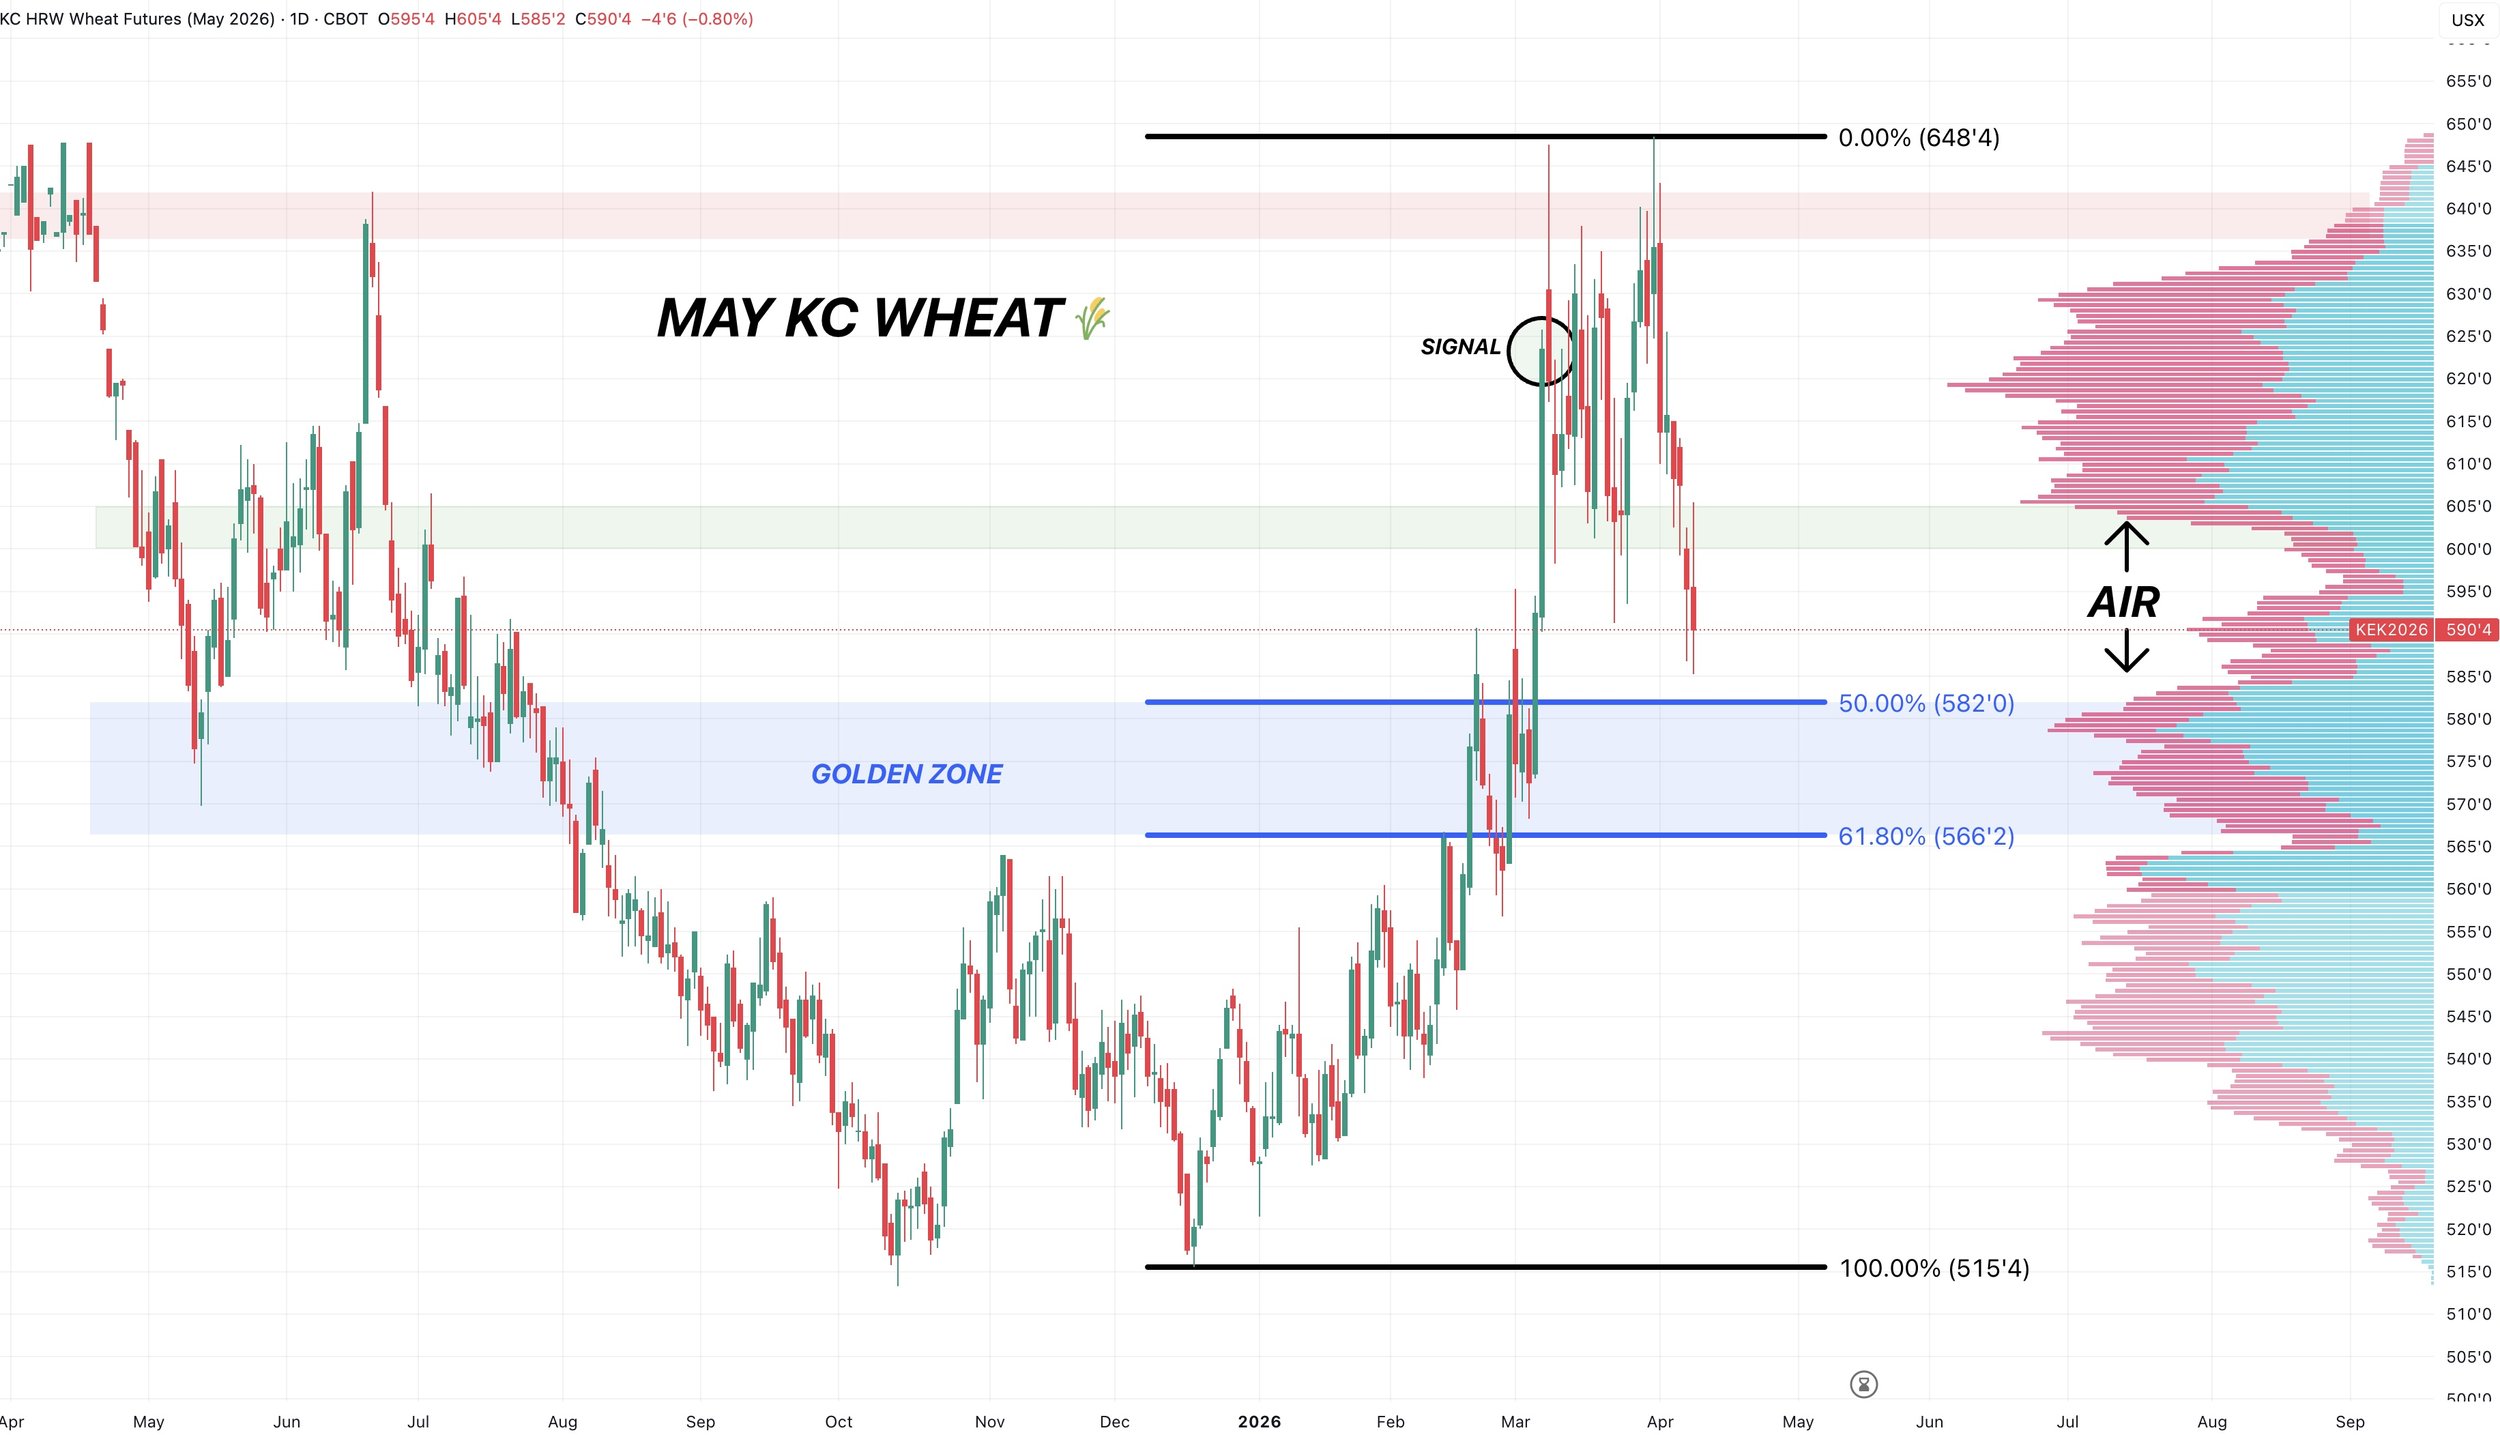
May KC Chart:
We already took some chips off the table with our sell signal back in early March.
We broke some support here. Now below that area of high volume.
We could bounce anytime, but finding some life around that 50% to 61.8% level and next area of high volume would make sense.
Line in the sand to stay bullish is $5.65
Staying patient for now.
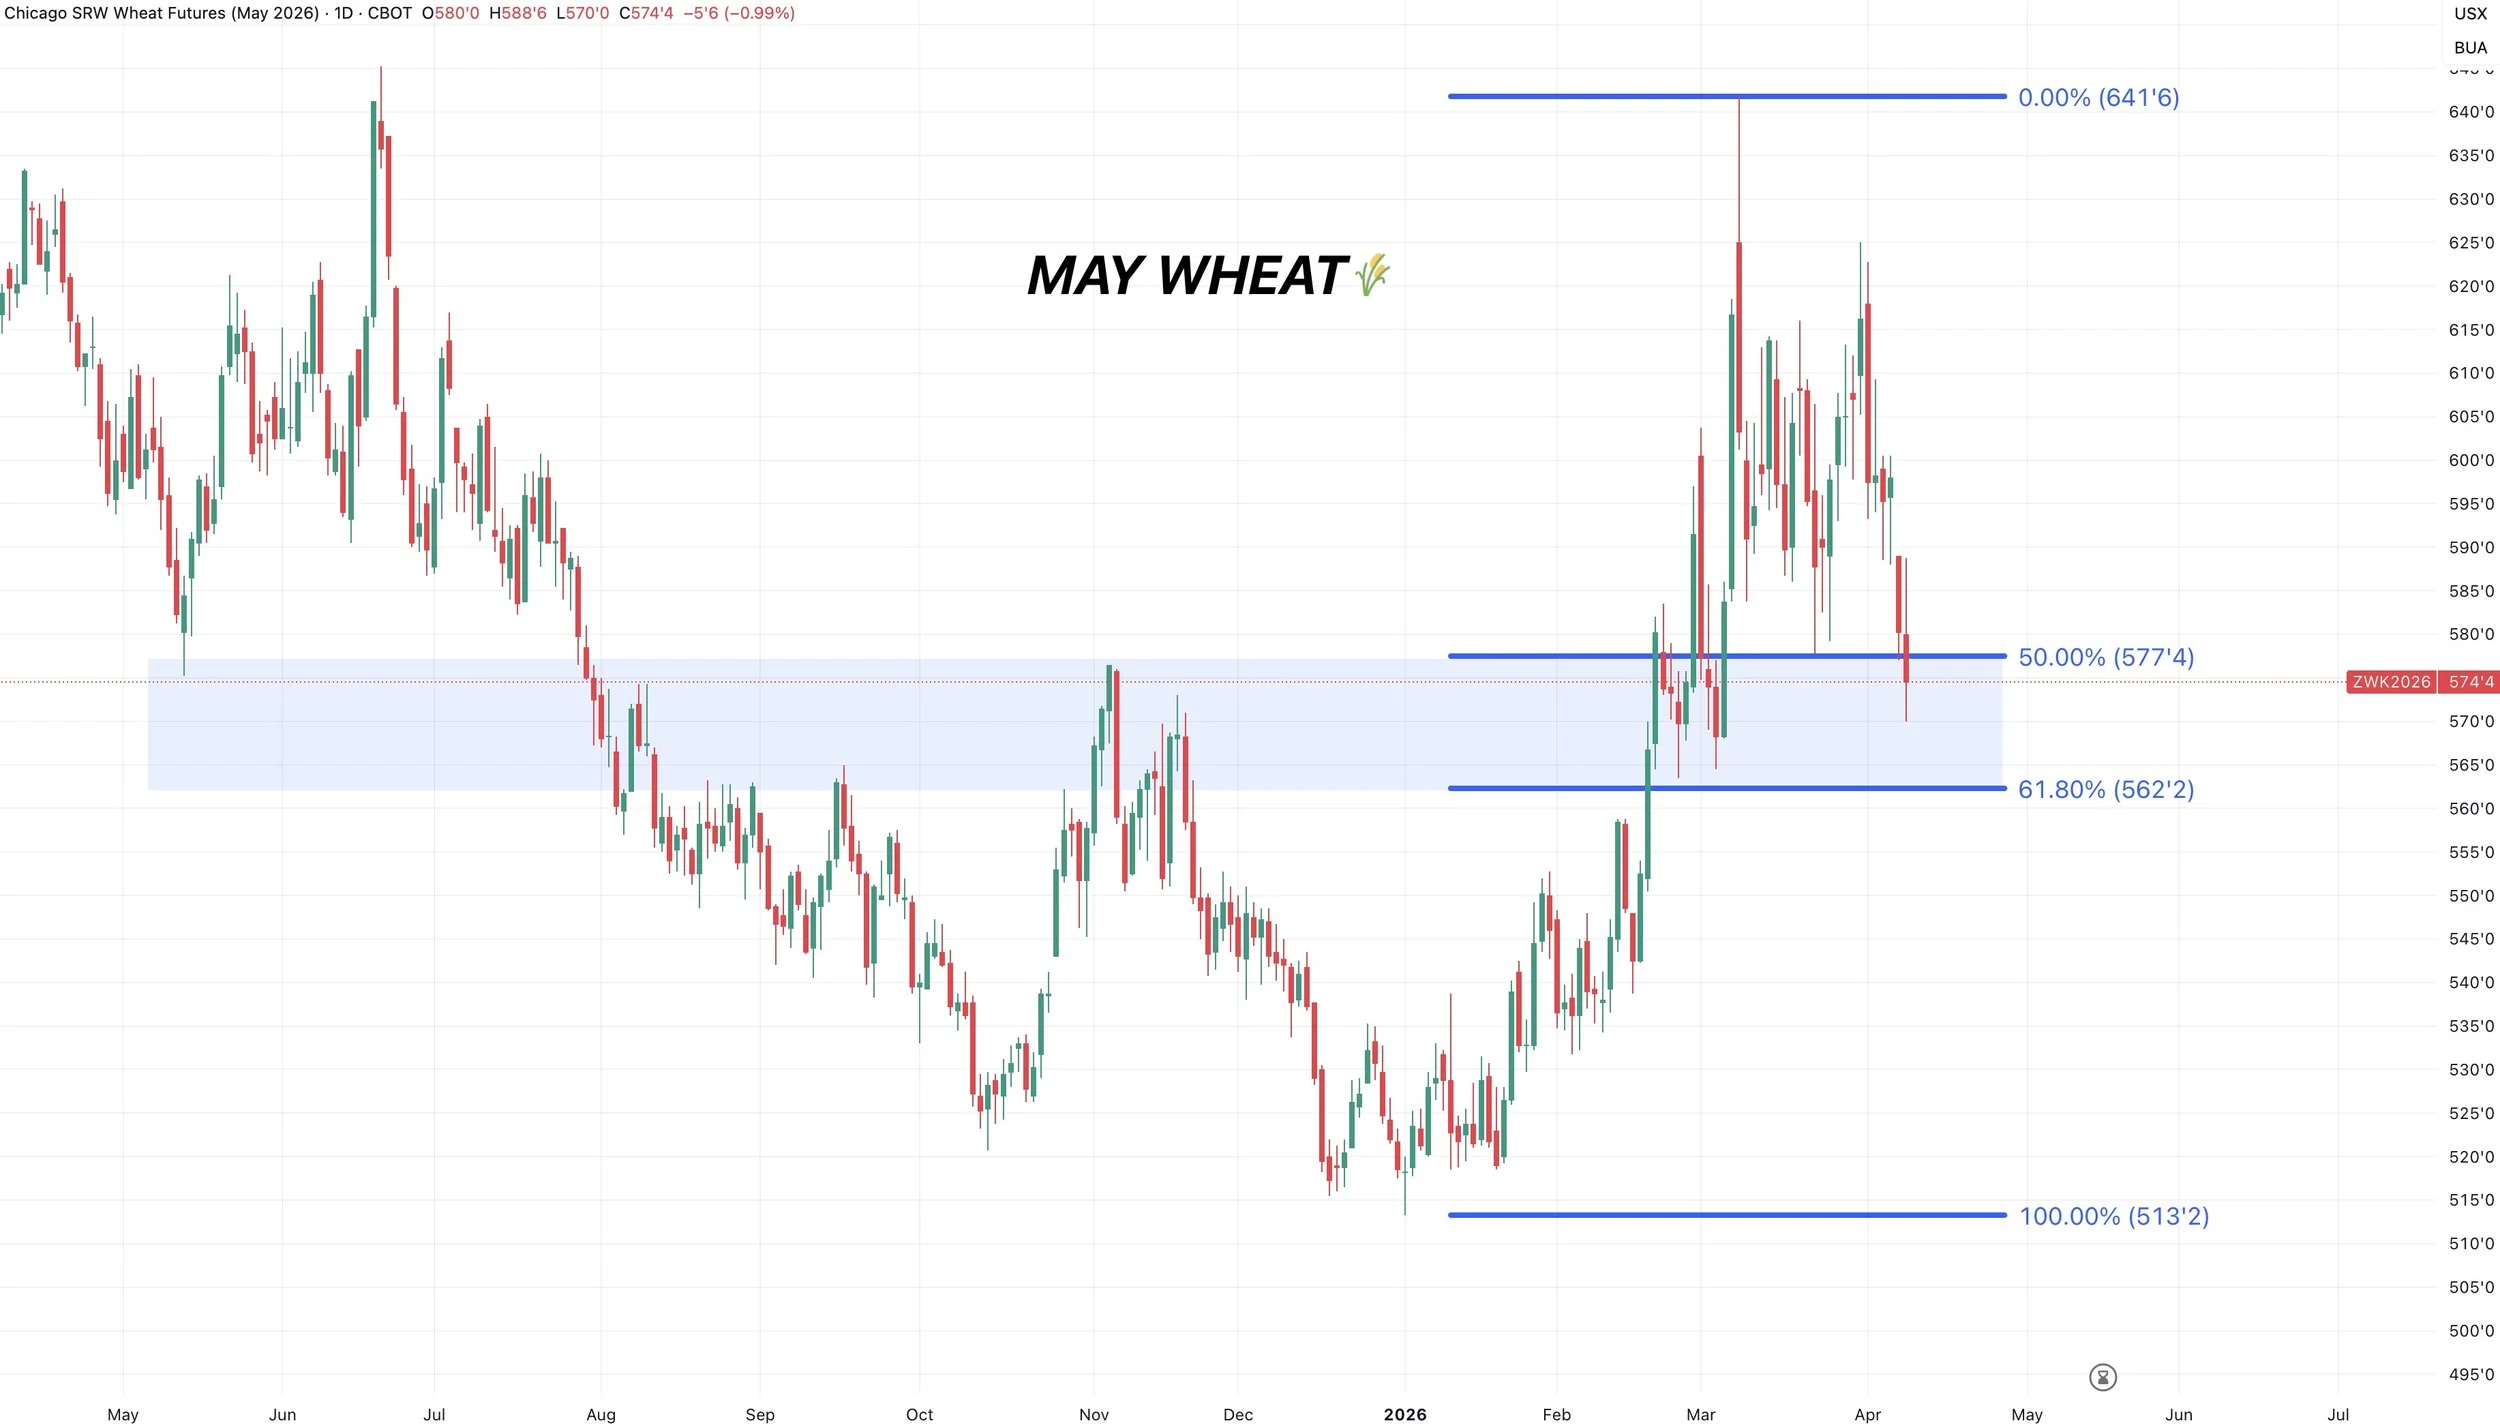
May Chicago Chart:
Sitting in that golden zone, as it has gave back more of the rally than KC has.
Finding a bottom in this general area makes sense.
This is also that old level of resistance.
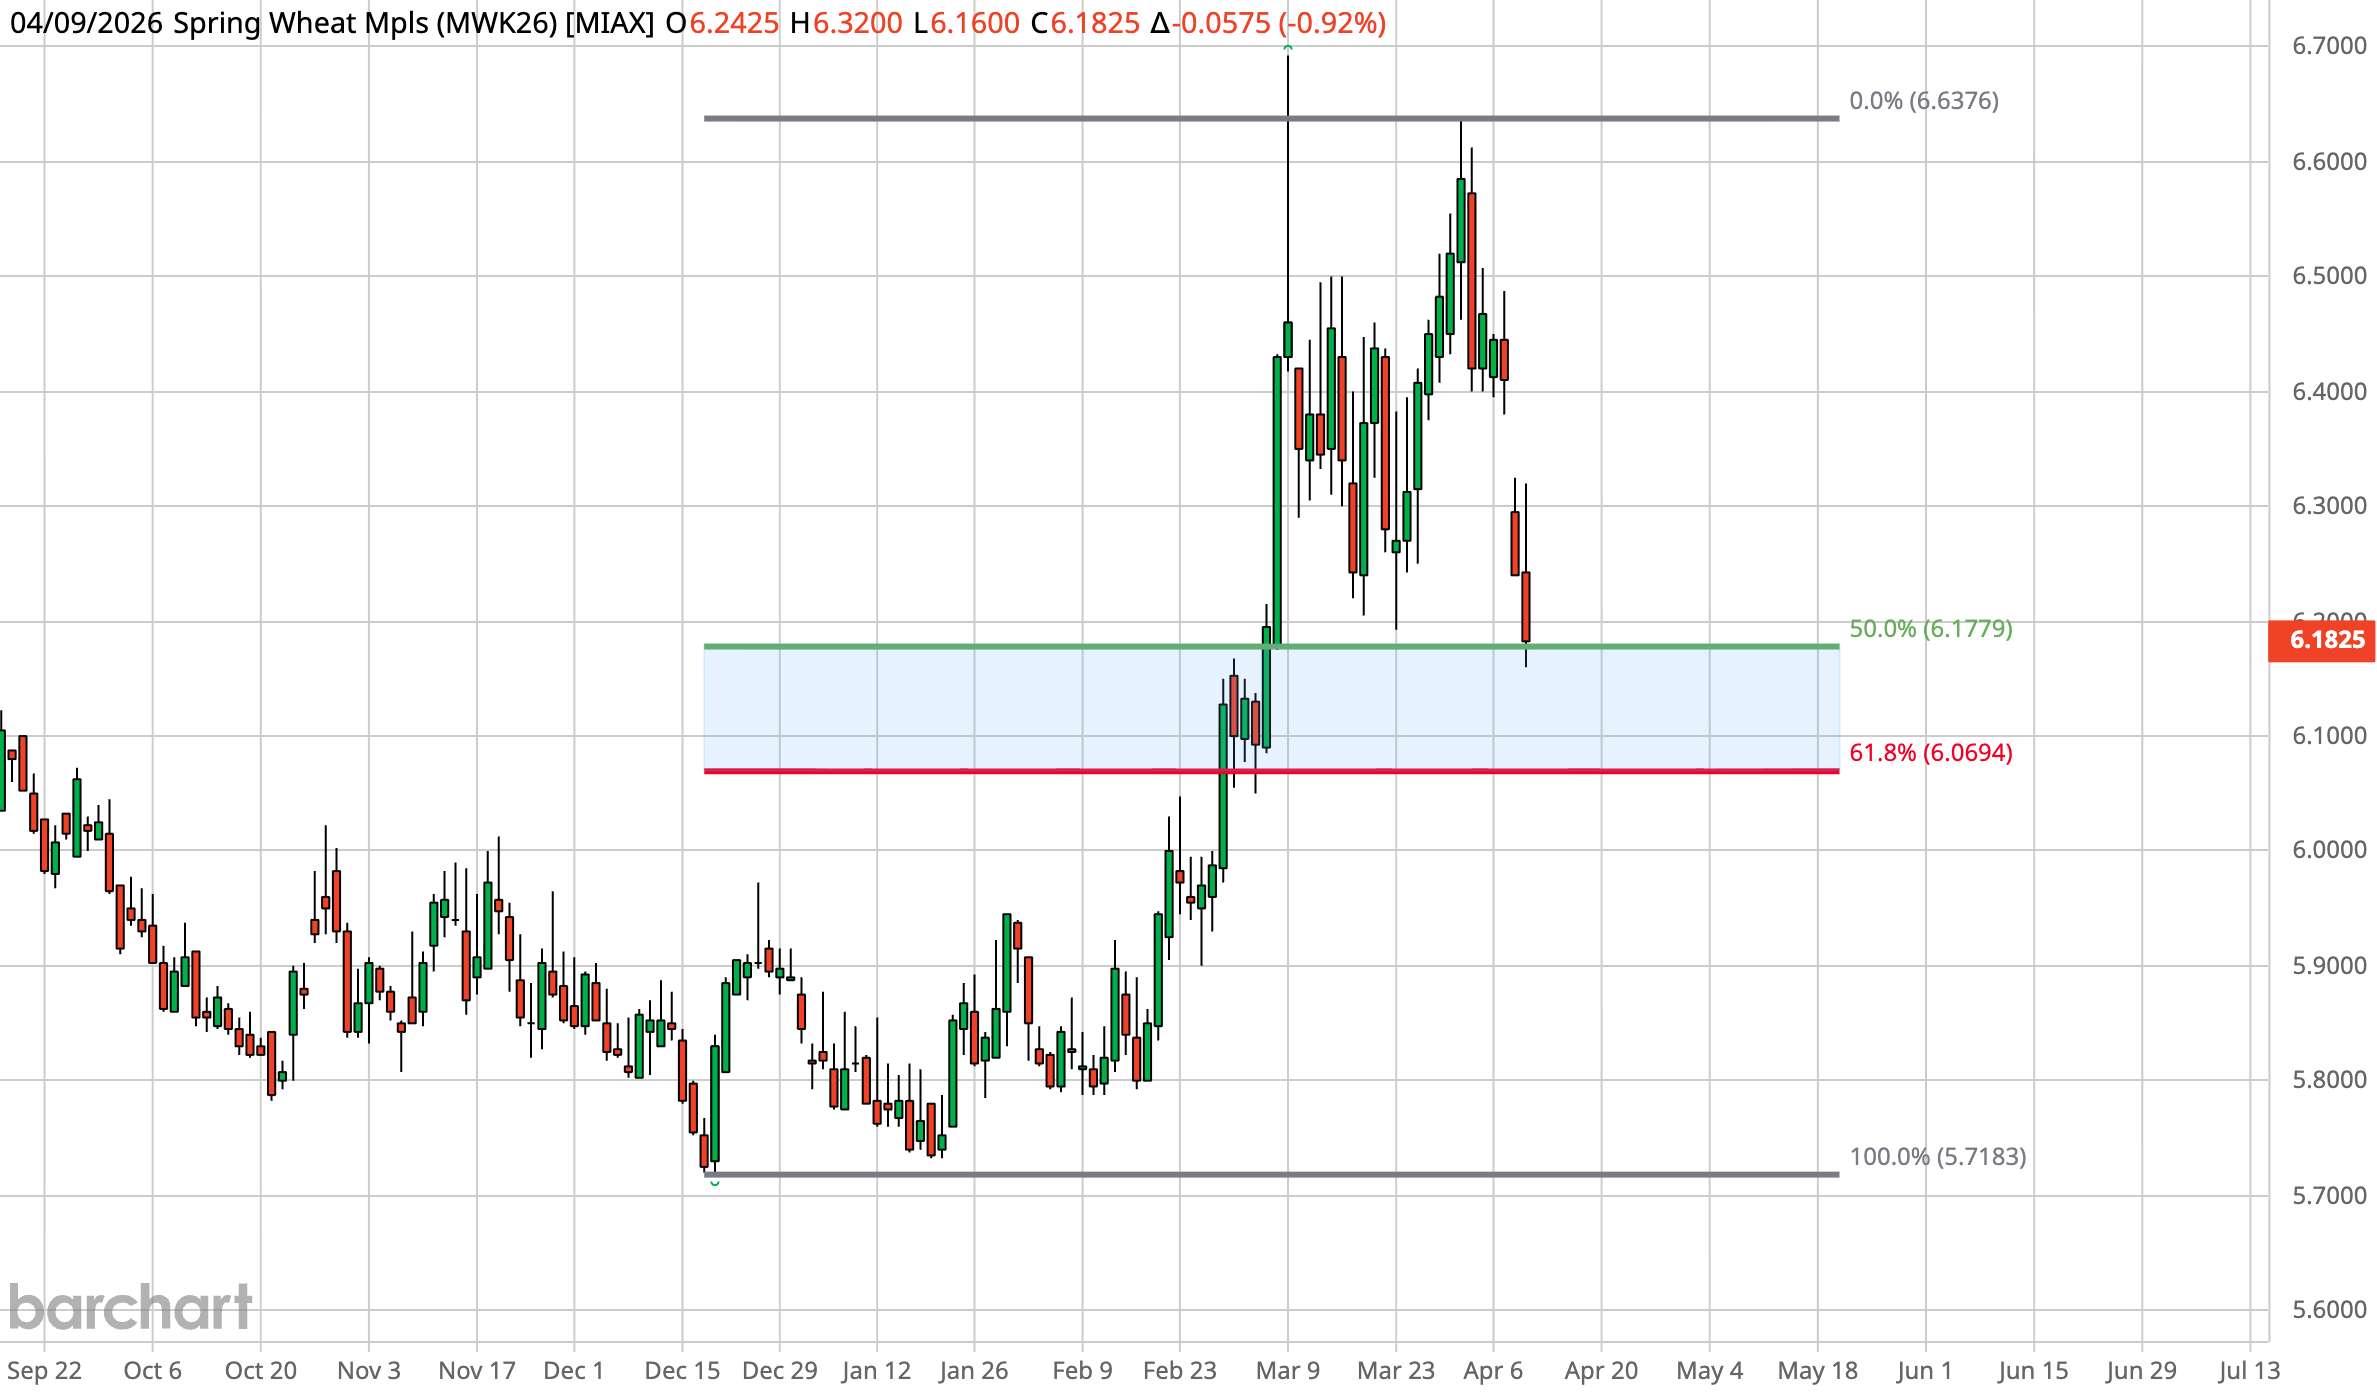
May MPLS:
I apologize for the poor chart here, my software doesn’t have MPLS.
But like Chicago, we are sitting in the golden zone.
So finding some life here soon would make sense.
This is where the market typically decides if we are simply correcting or full on falling apart.
Cattle
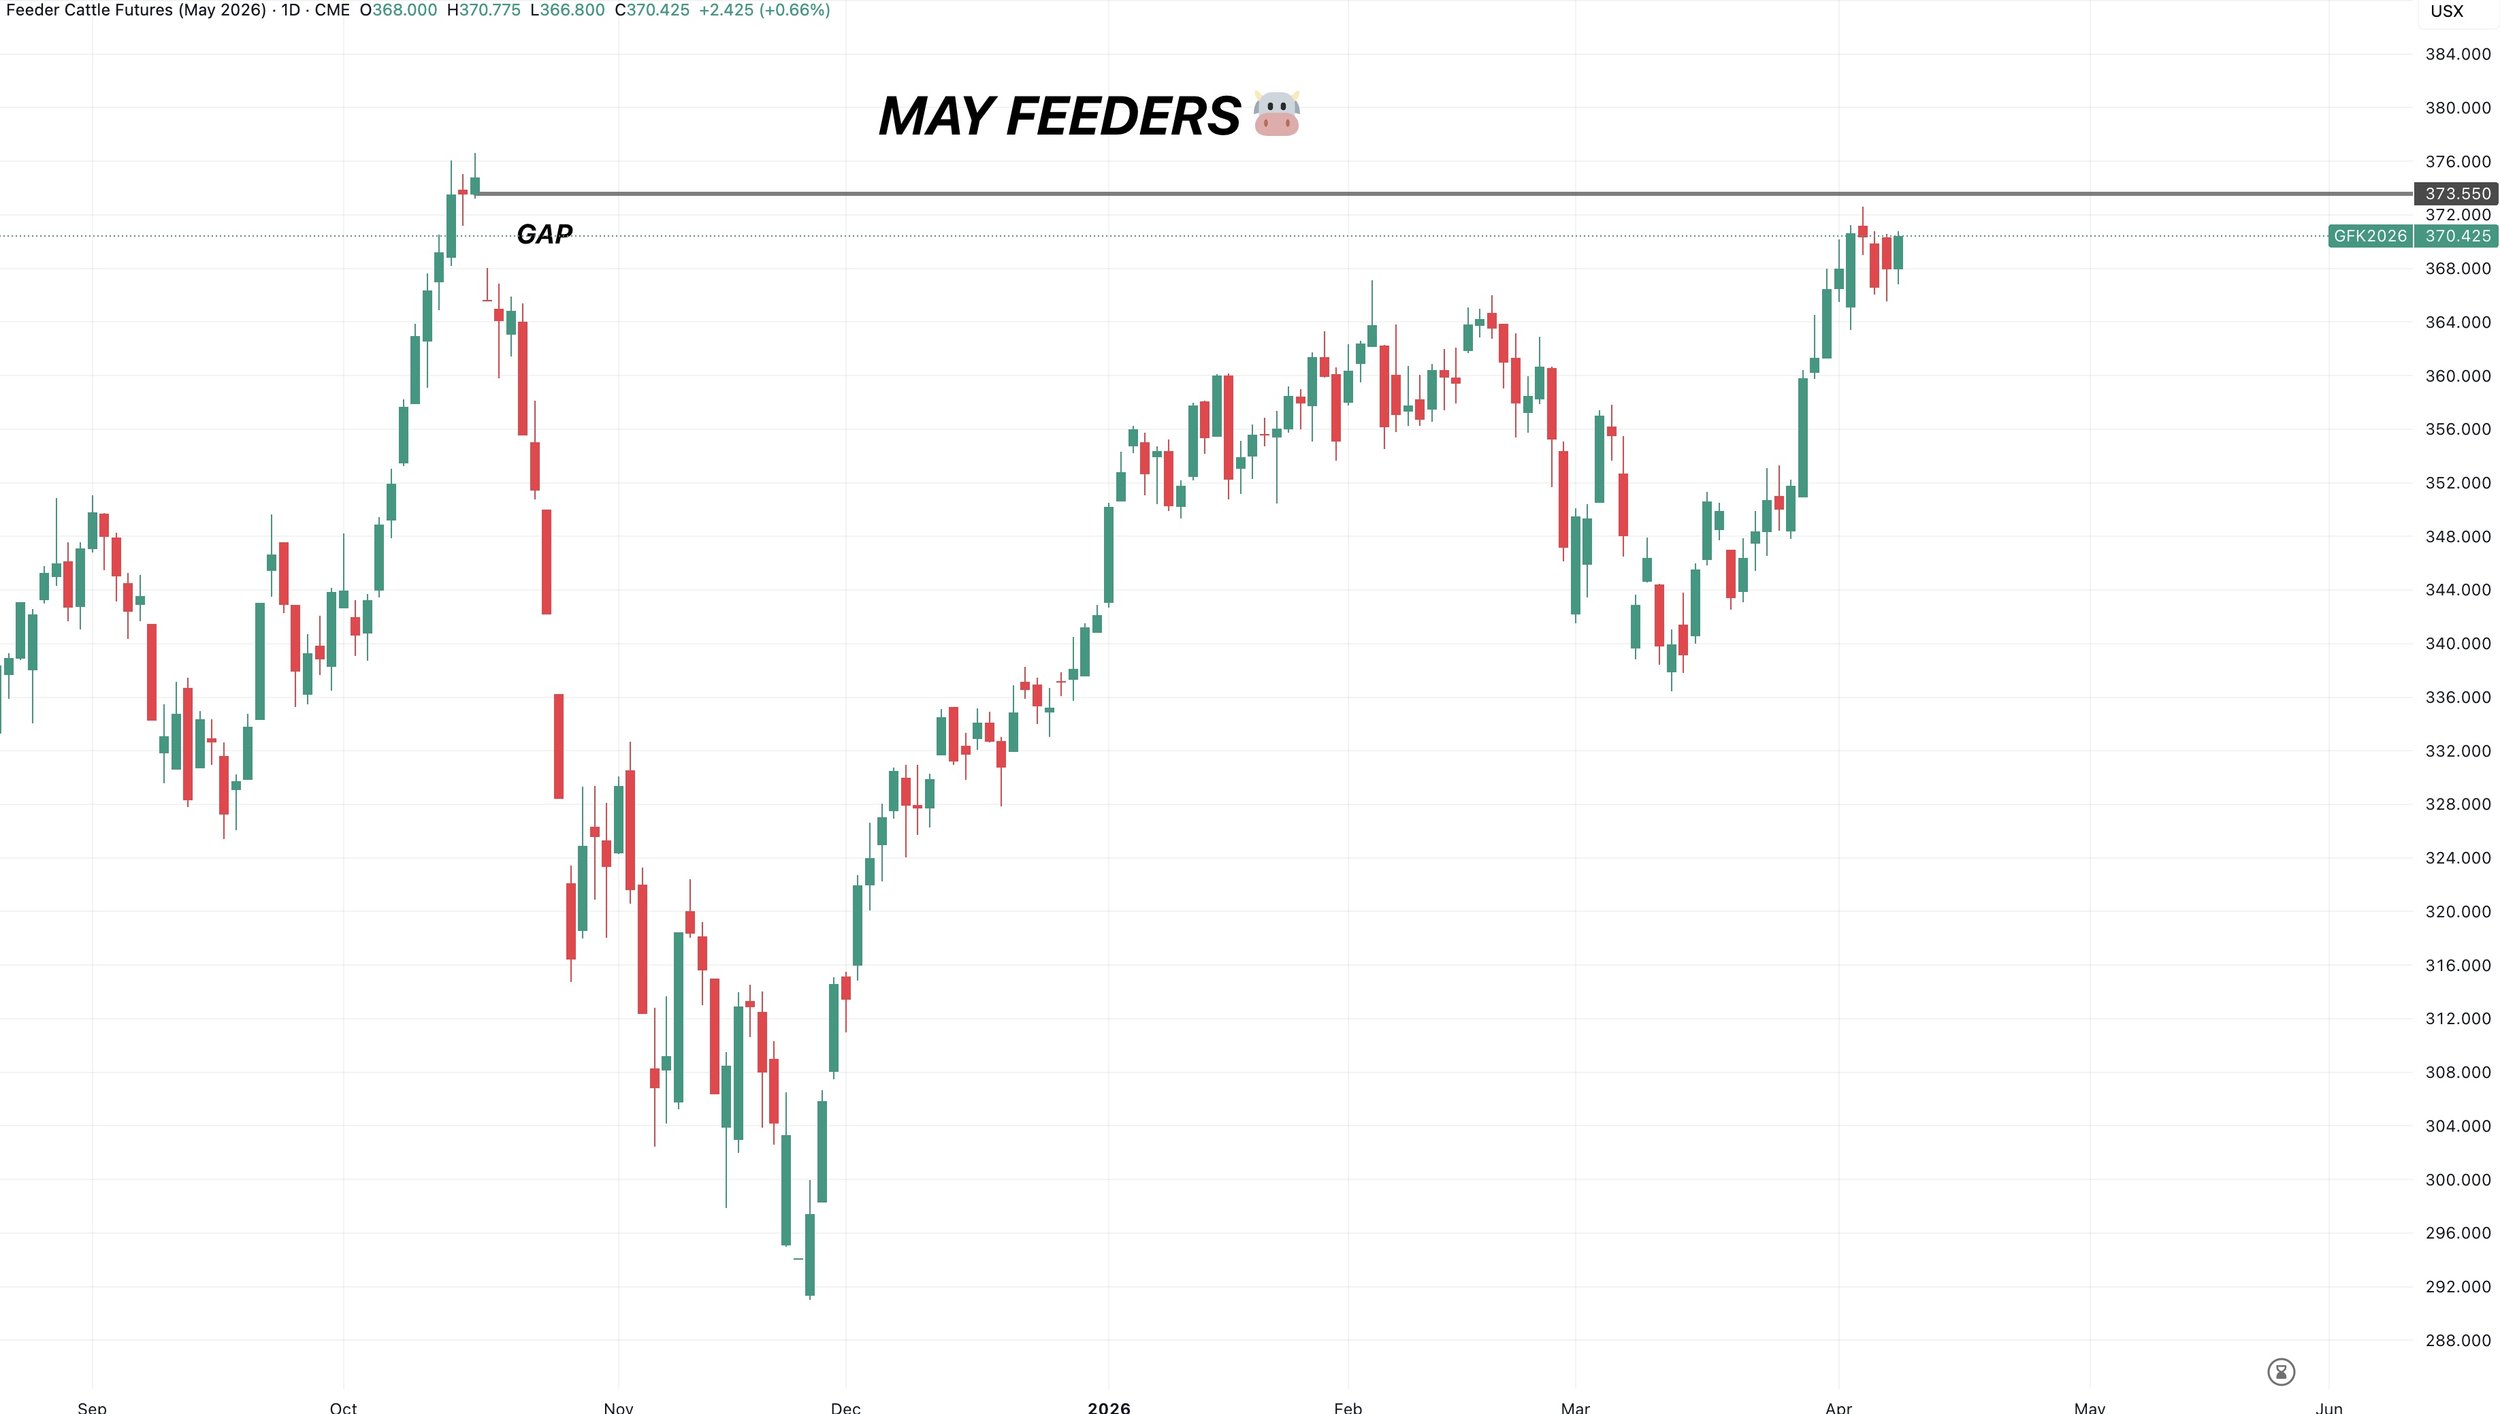
May Feeders Chart:
Not a whole lot on cattle today.
Looks like we are simply consolidating after the run up.
Fundamentally, you'd think this market could keep pushing higher.
But feeders continuing to fail the gap has to be a possible warning sign.
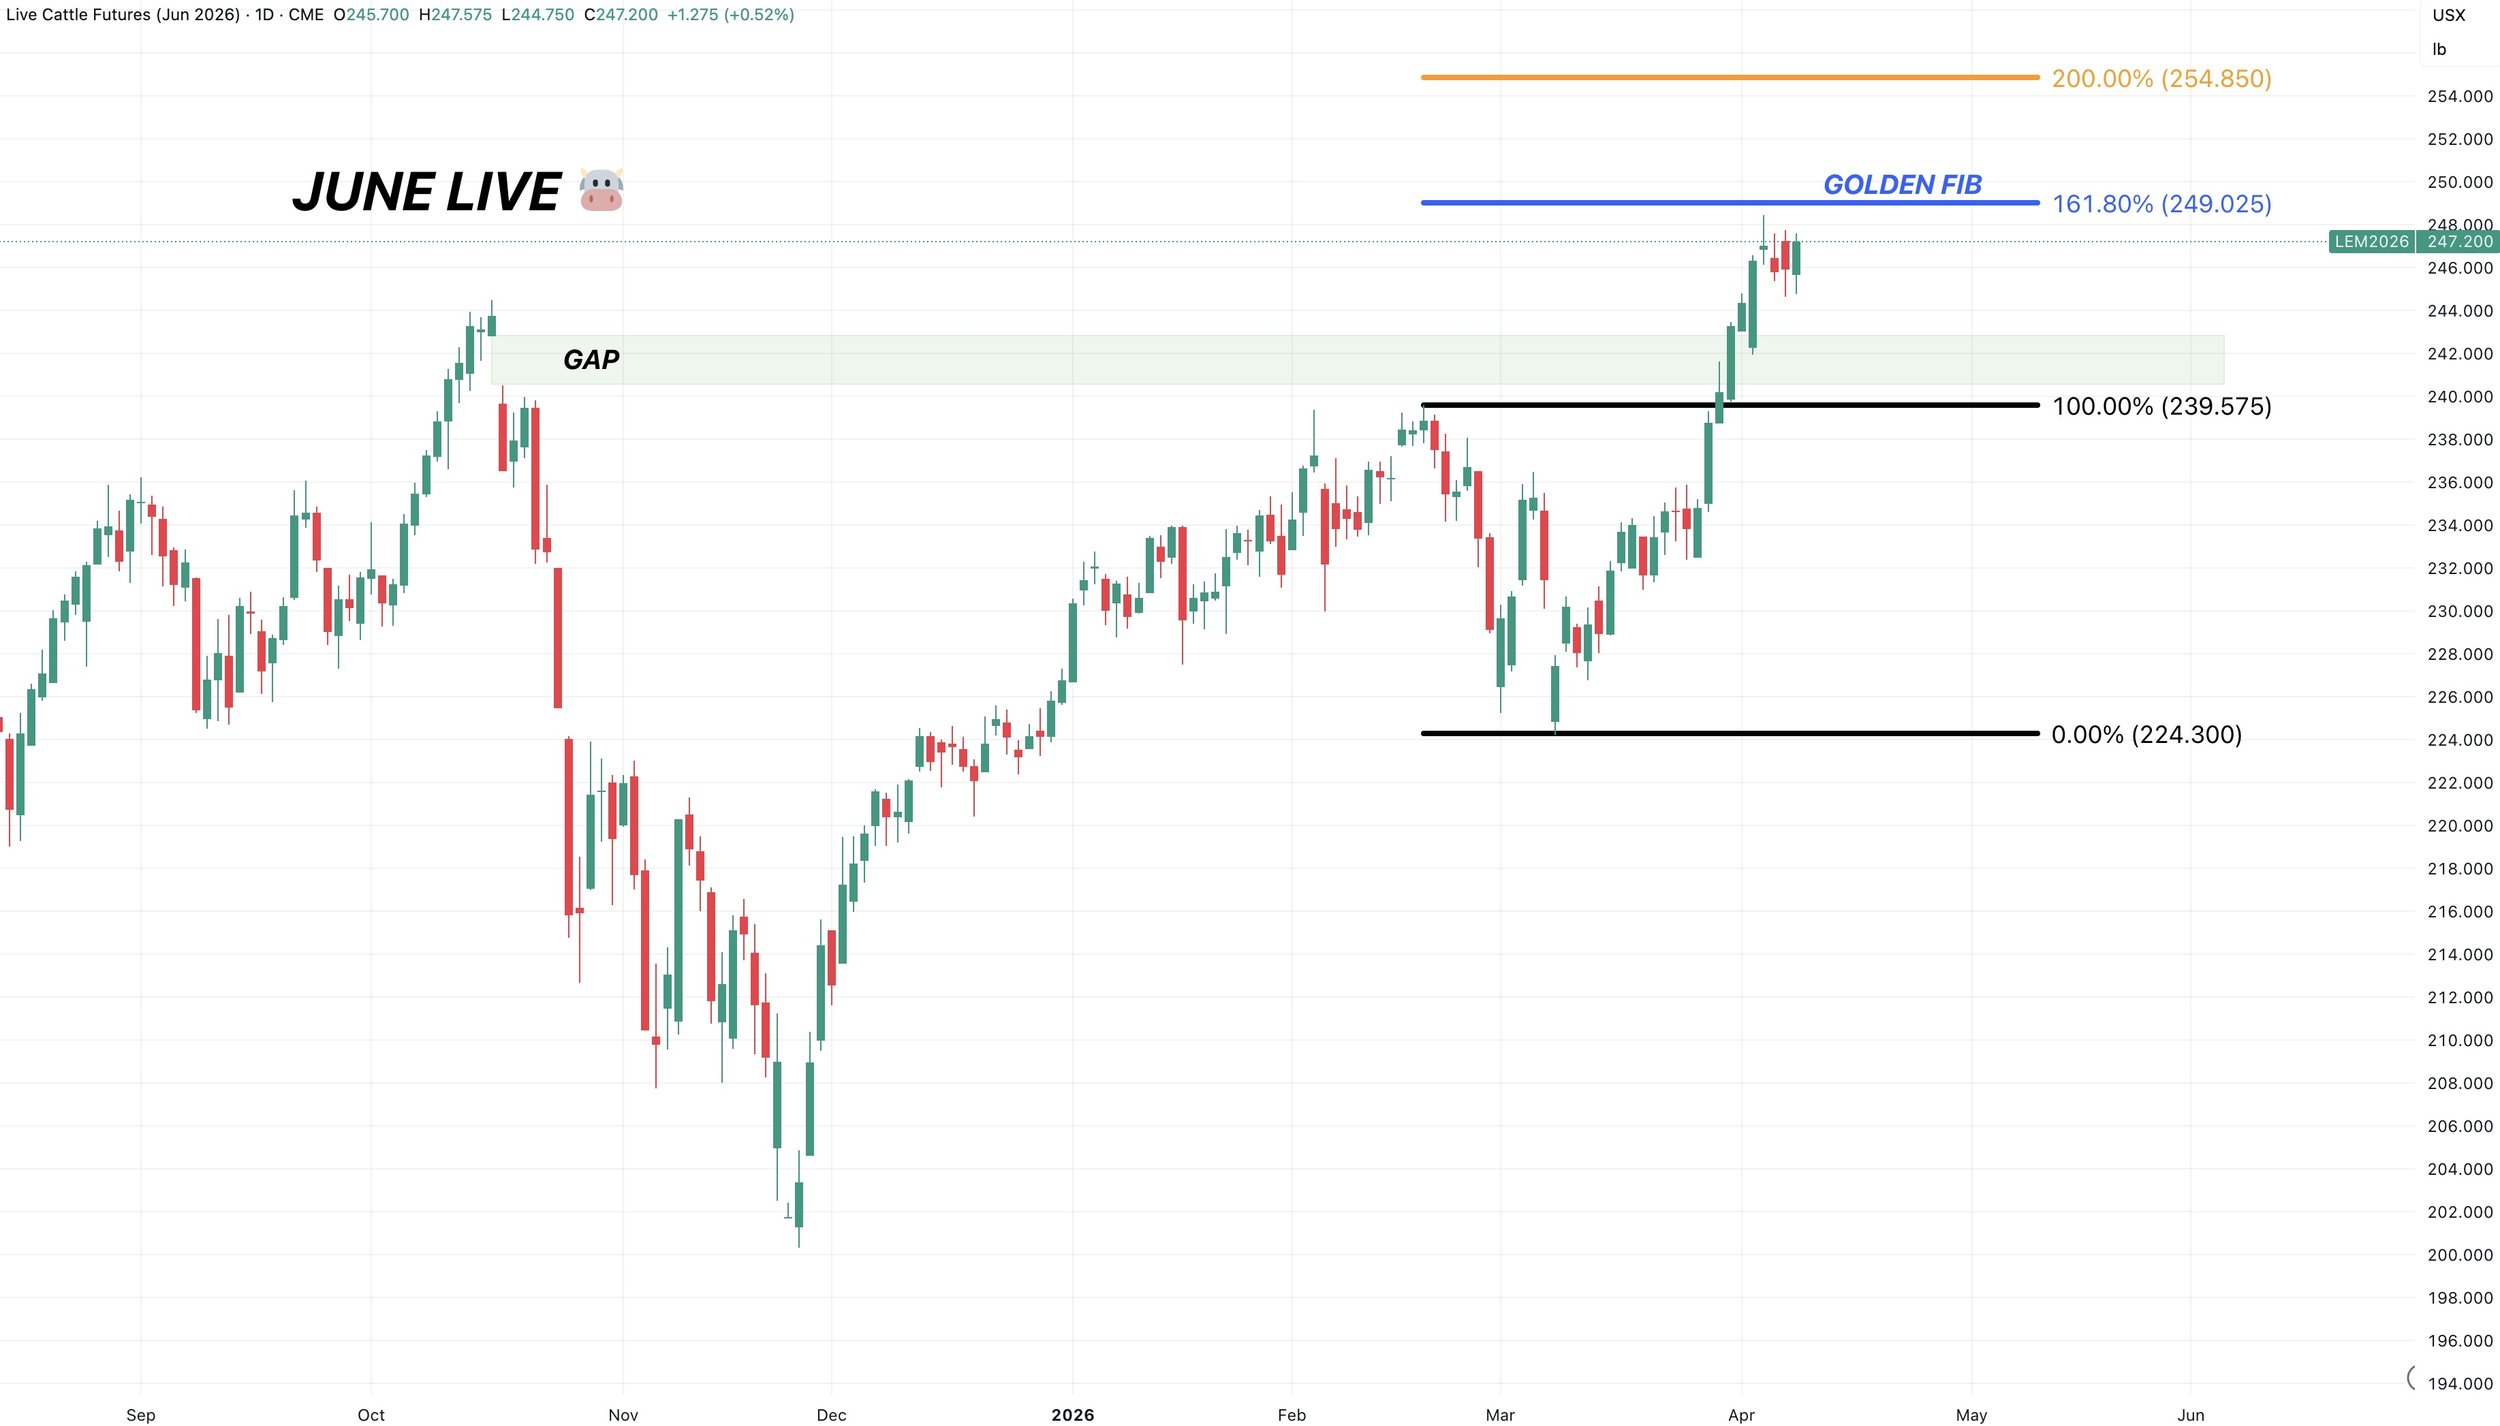
June Live Chart:
Right up near the golden fib extension.
I like at least having a floor at these levels if you do not.
Want to Talk?
Our phones are open 24/7 for you guys if you ever need anything or want to discuss your operation.
Jeremey, Lauren & Office: (806)484-1214
Sebastian: (605)280-1186
Email: sfrost@dailymarketminute.com
Hedge Account
Interested in a hedge account? Use the link below to set up an account or give us a call.
Recent Signals
March 19th, 2026: 🌱
New crop soybeans signal & hedge alert.
CLICK HERE TO VIEW
March 9th, 2026: 🌱
Soybeans signal & hedge alert. Sent via text.
March 6th, 2026: 🌽 🌾
Corn & wheat sell signal & hedge alert.
March 3rd, 2026: 🌽
Old crop & new crop corn sell signal & hedge alert.
Feb 26th, 2026: 🌱
Old crop & new crop beans sell signal & hedge alert.
Feb 19th, 2026: 🌾
KC wheat sell signal & hedge alert.
Feb 6th, 2026: 🌽 🌱
Old crop corn & soybean sell signal & hedge alert.
Feb 4th, 2026: 🌱
Soybean sell signal & hedge alert.
Nov 17th, 2025: 🌱
Soybean sell signal & hedge alert.