
WHEAT RATINGS PAINT FULL PICTURE?
MARKET UPDATE
*No video today. Only the written version, as I am out of the office this week. I apologize for the inconvenience. Usual video updates will continue next week.
Futures Prices Close
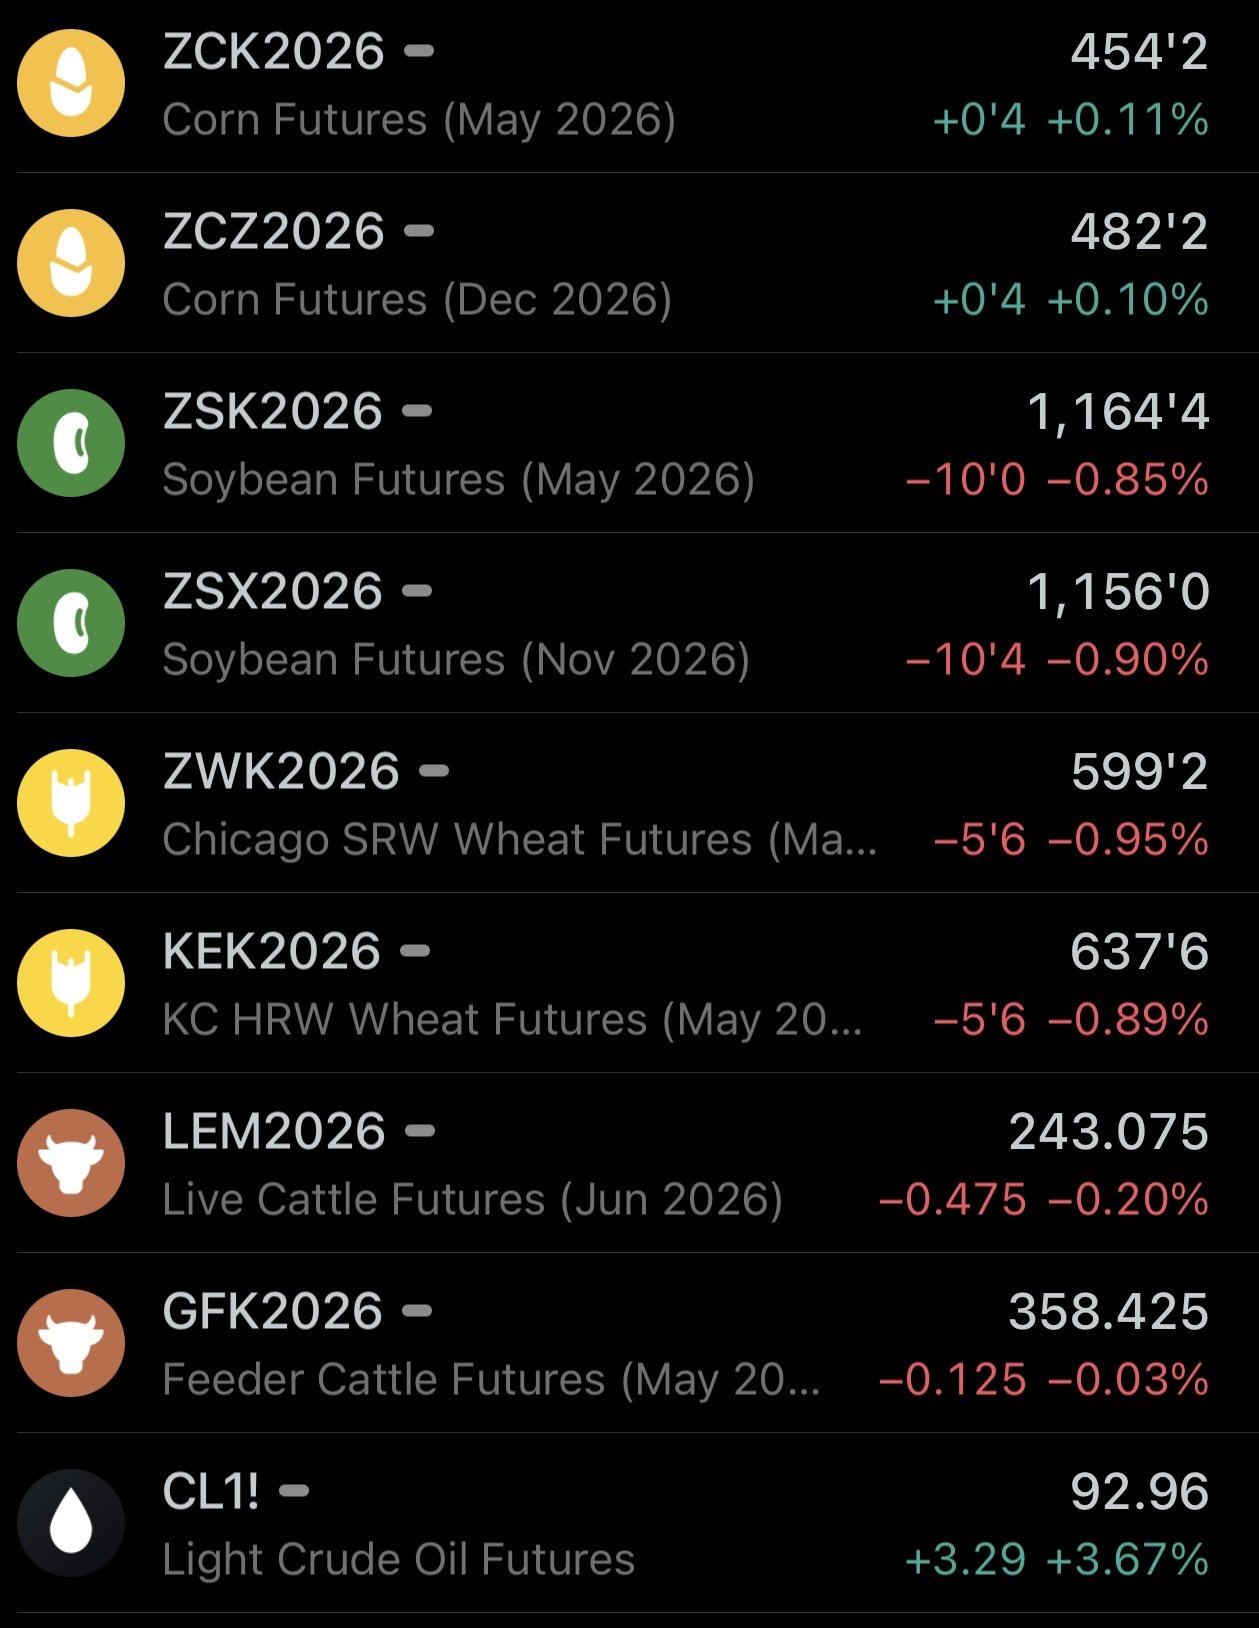
Overview
Grains were mostly lower as wheat takes a breather despite crop ratings continuing to tumble. We’ll dive into those ratings later in today’s update.
Corn continues to bounce off those key support levels we had been mentioning the last few weeks. Putting together a nice little rally following our buy signal from April 10th.
Cattle was under pressure once again, sparked by news surrounding the border.
Meanwhile, soybeans faded well off their overnight highs. As both old crop and new crop closed 20 cents off their highs.
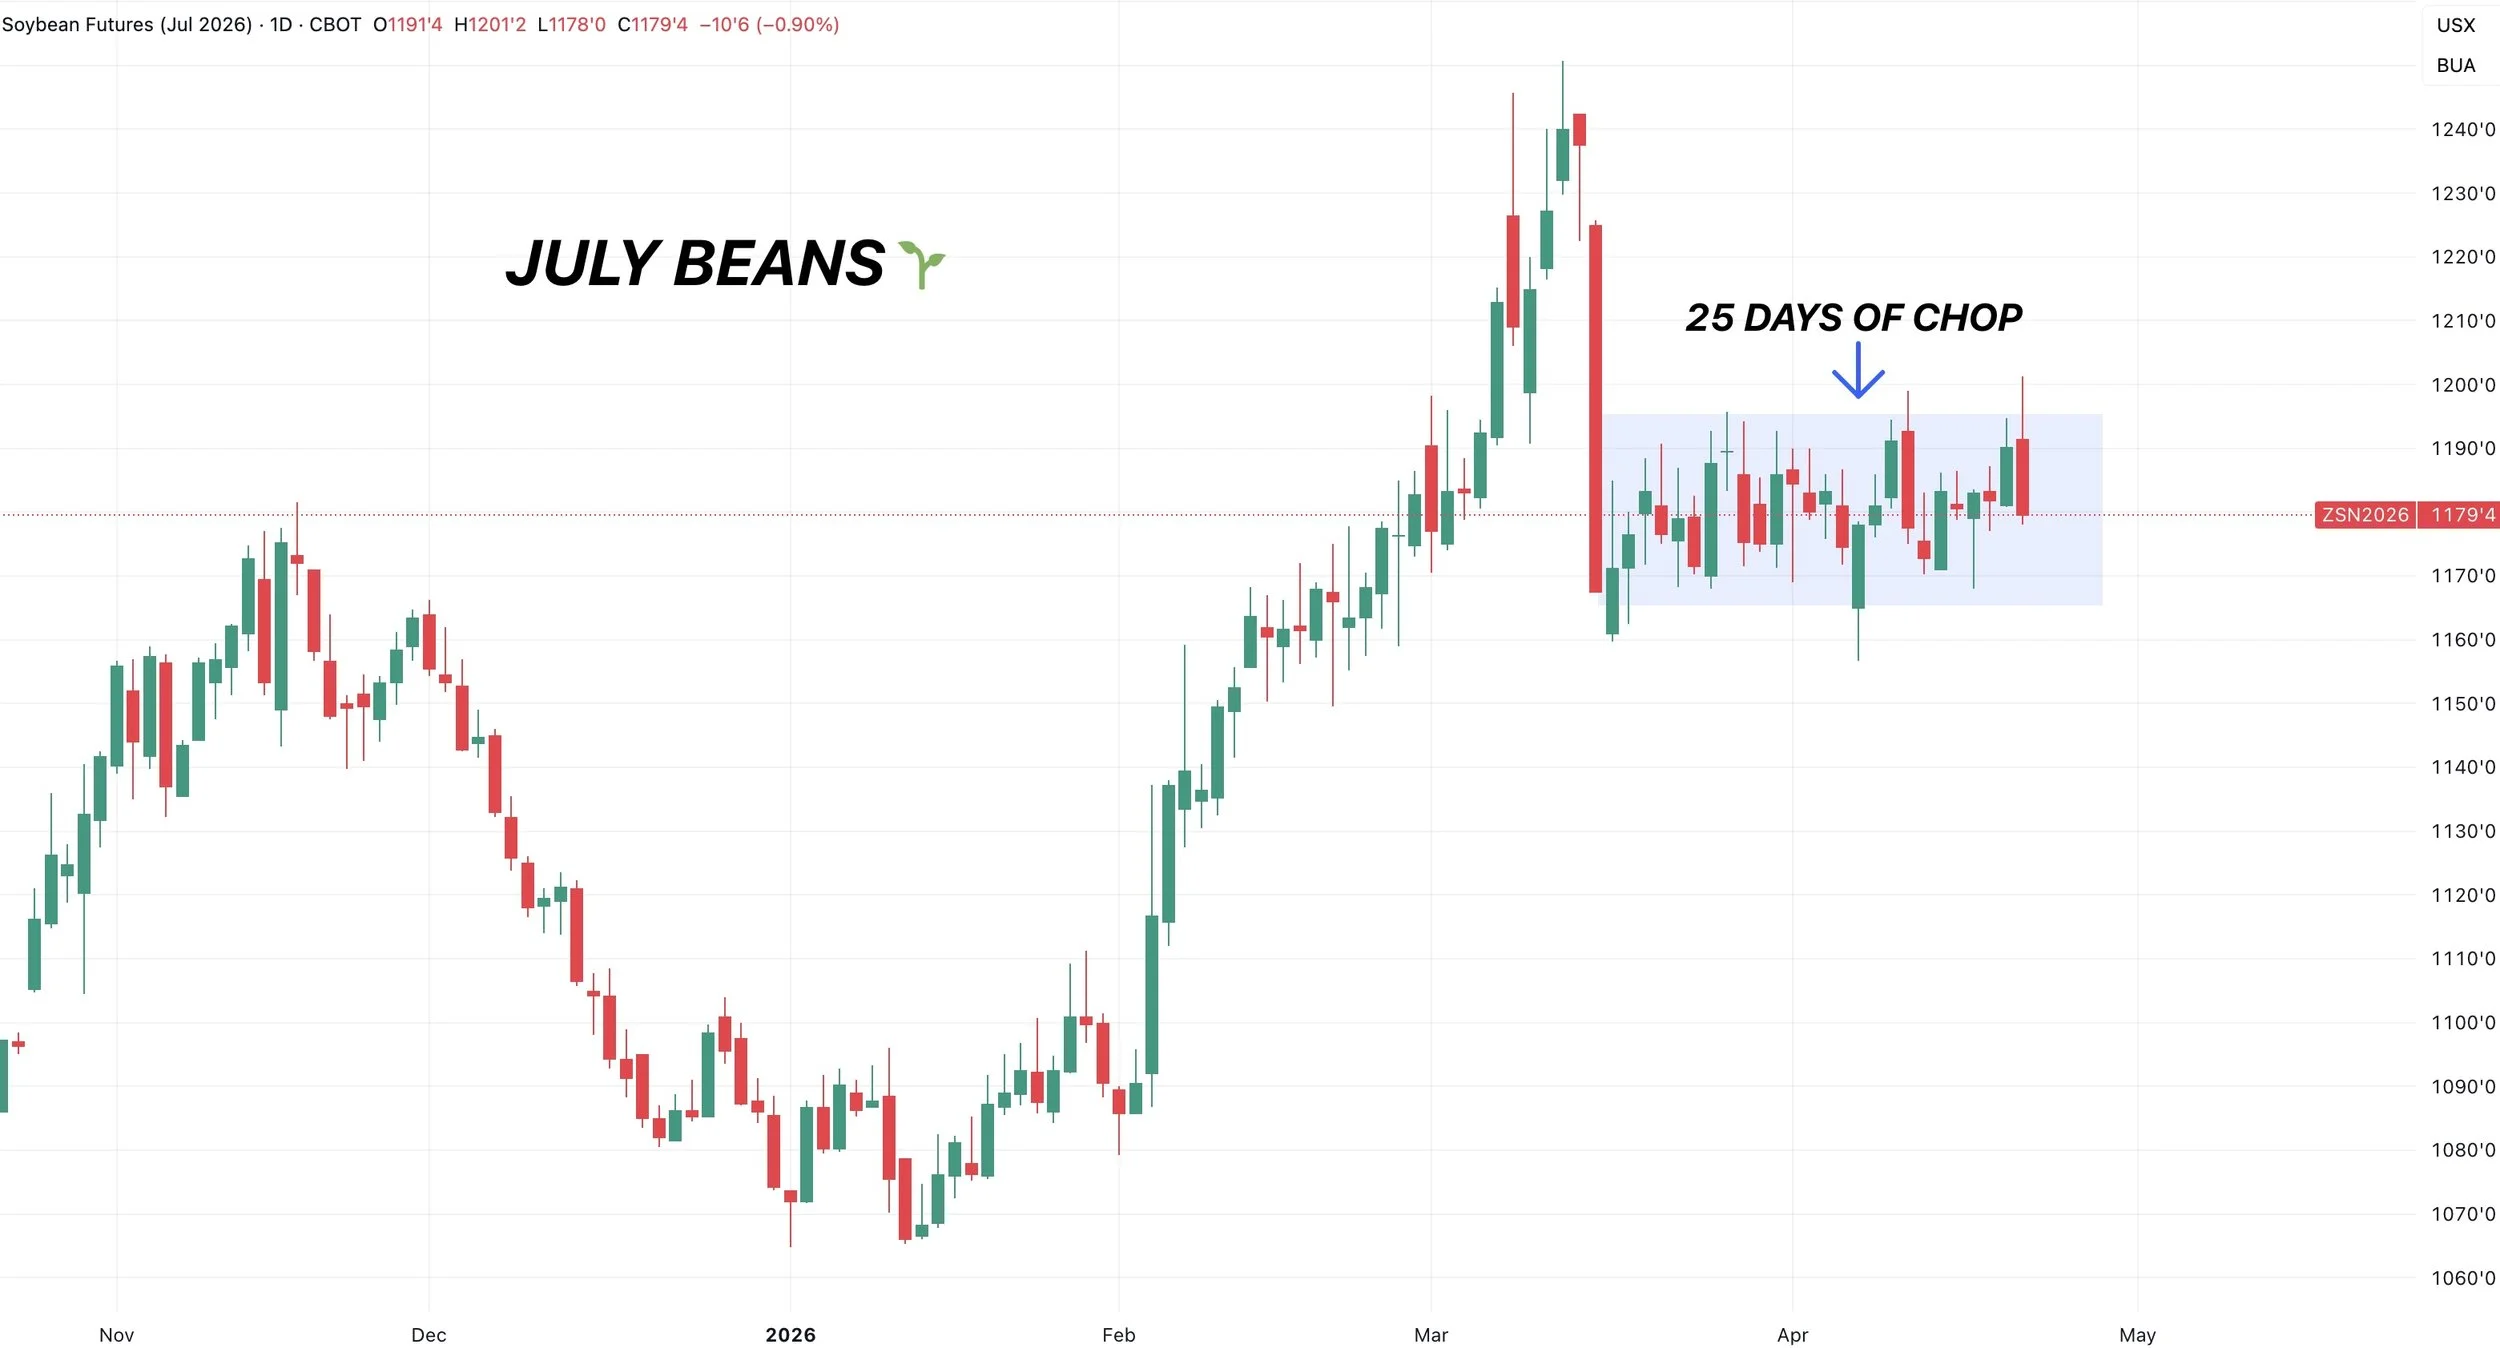
Old crop soybeans continue to be trapped in a brutal sideways range. As we've closed between in a 20 cent range for 25 trading days in a row now.
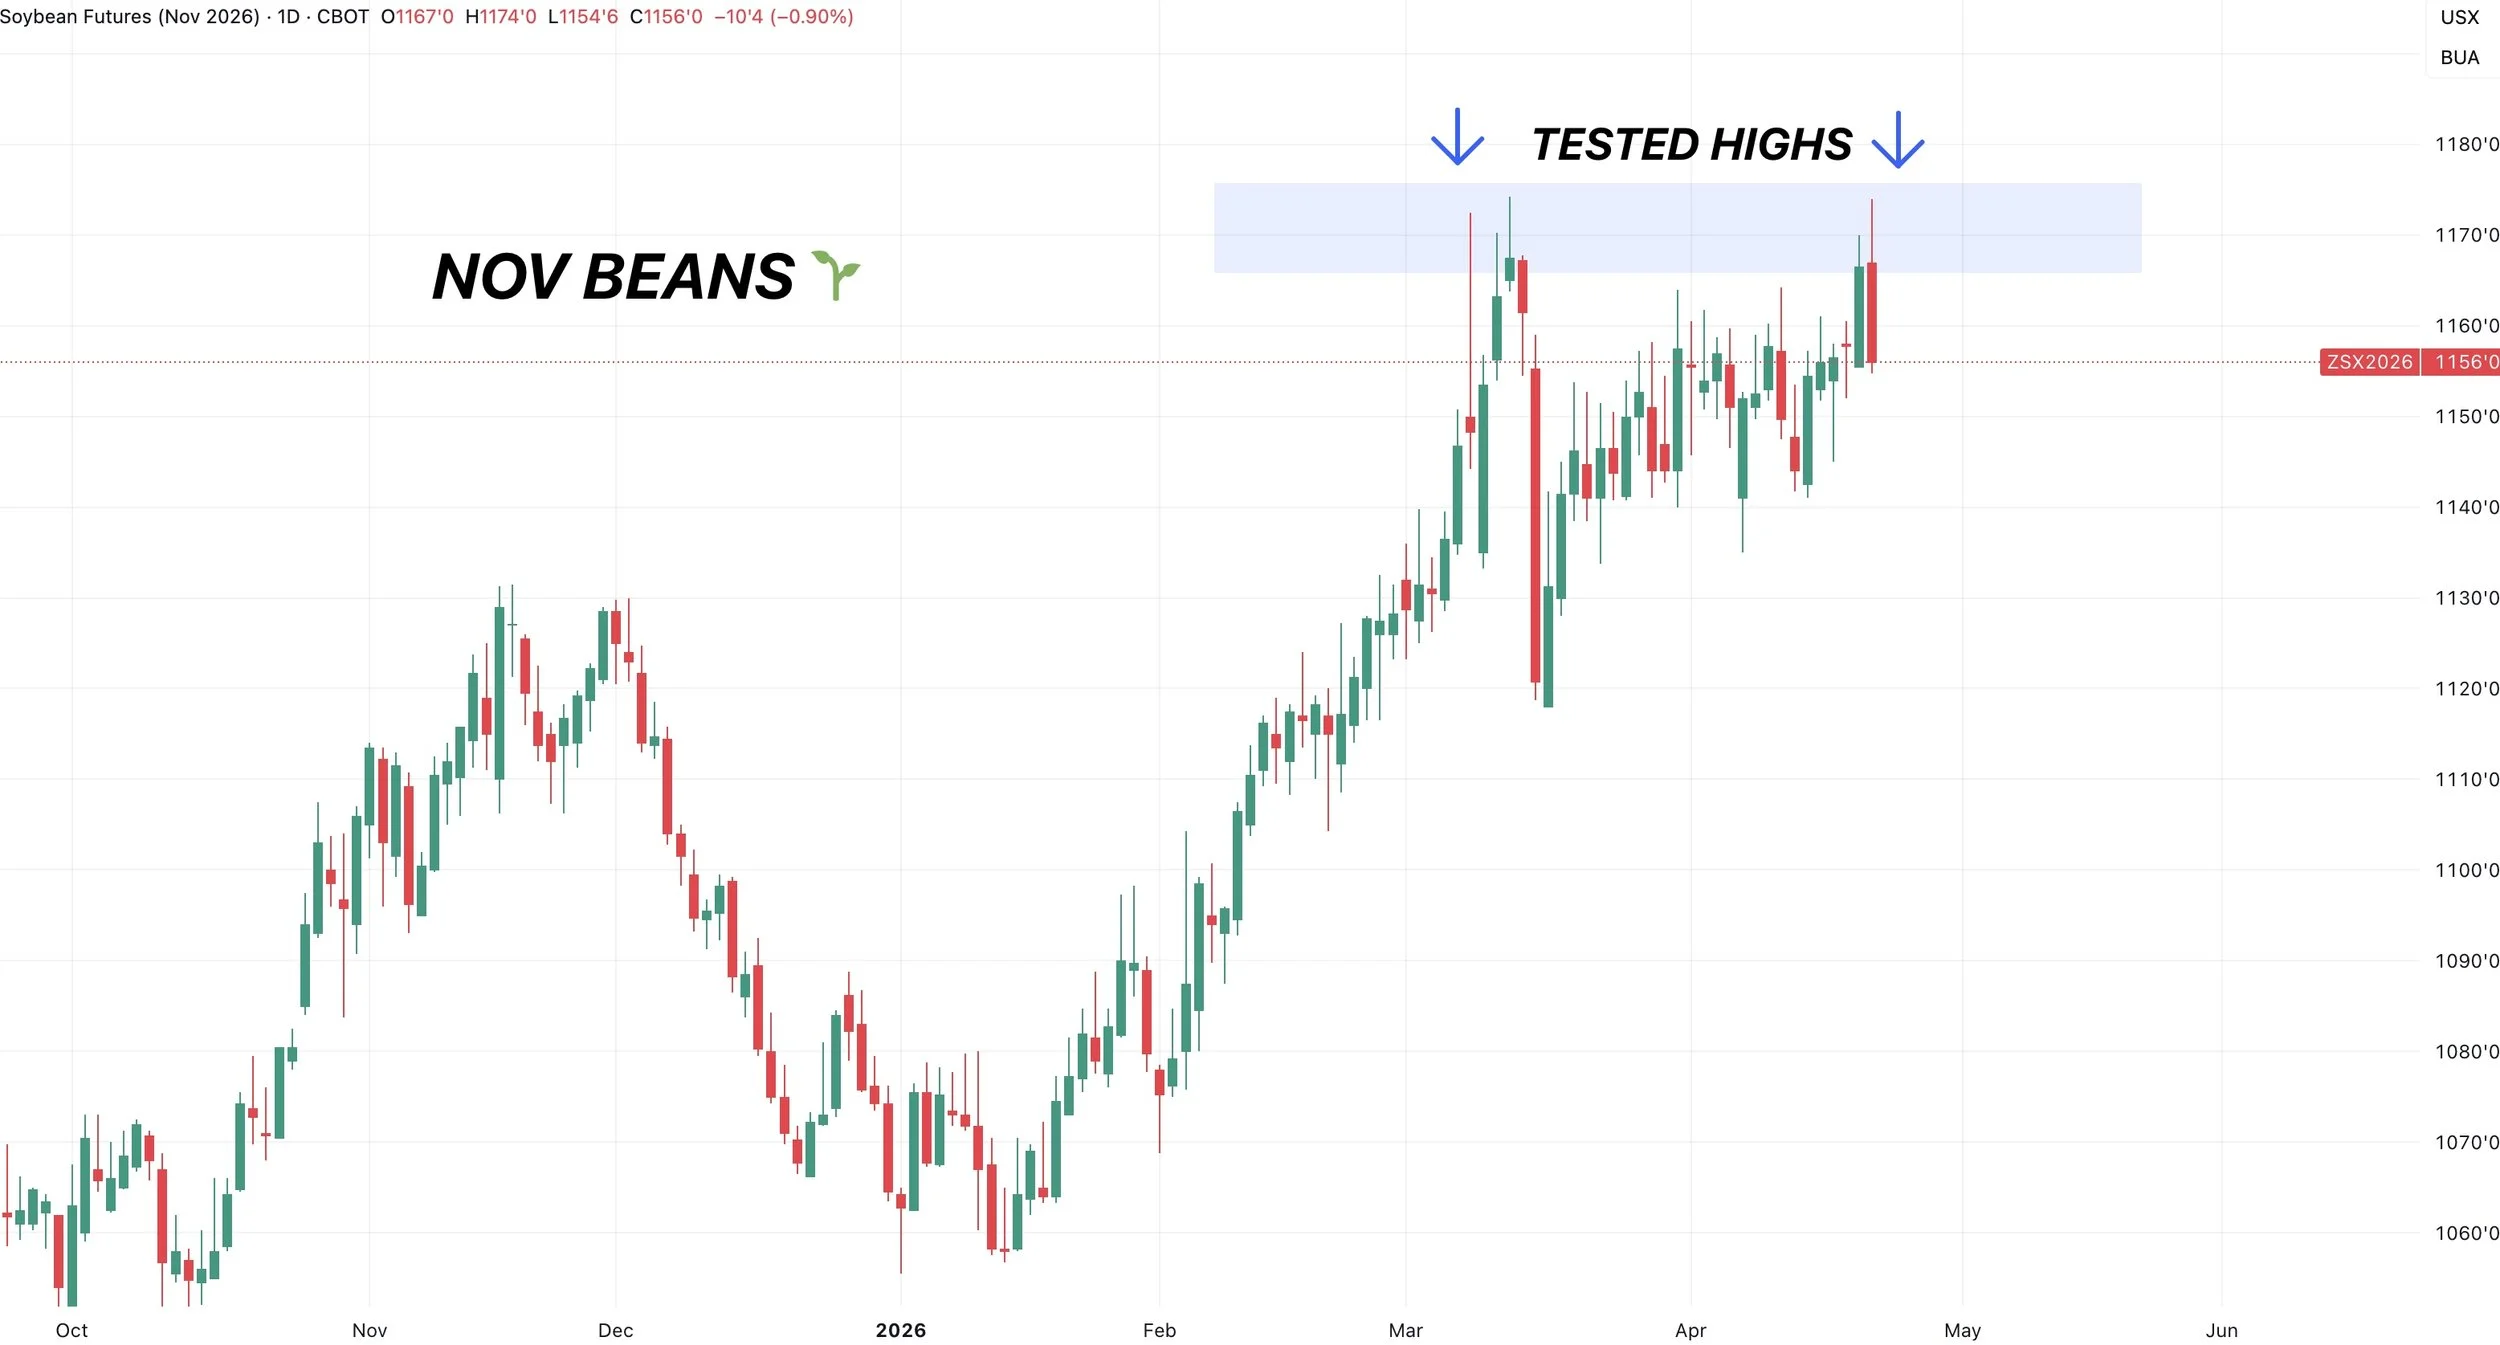
On the other hand, today new crop soybeans tested those contract highs from March before ultimately rejecting.
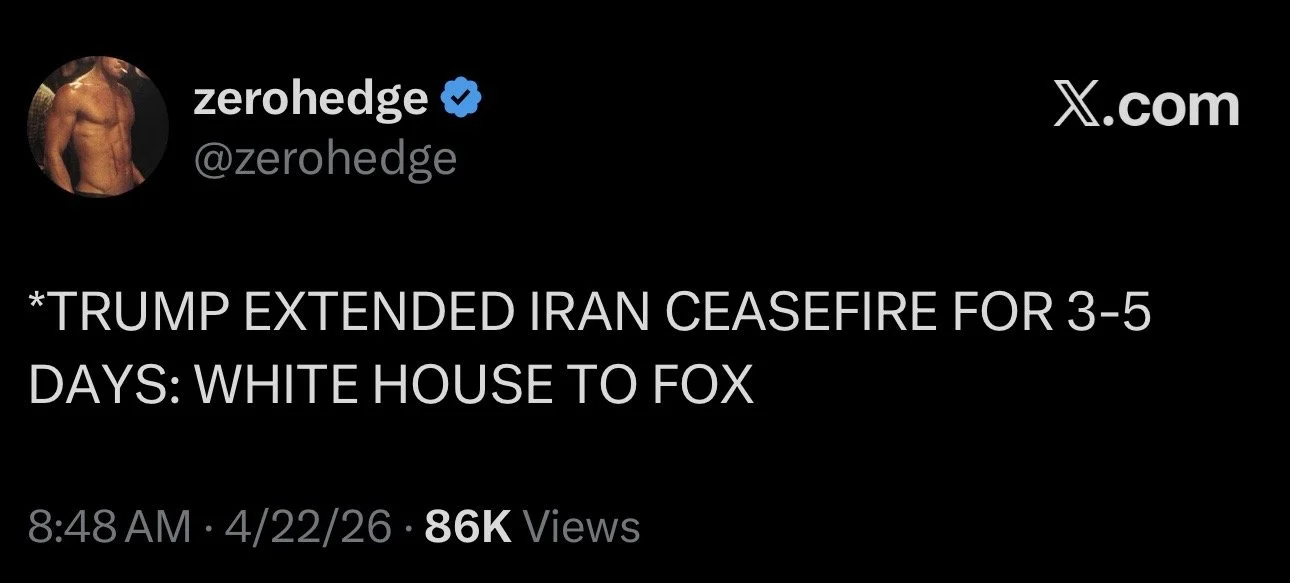
War Roller Coaster
As always they are back and forth every single day, and the market has become more and more numb to the daily headlines that are constantly changing.
The latest update is that Trump extended the ceasefire with Iran for 3-5 days.
Trump said that talks with Iran could happen as soon as Friday.
China Might Buy Other Grains?
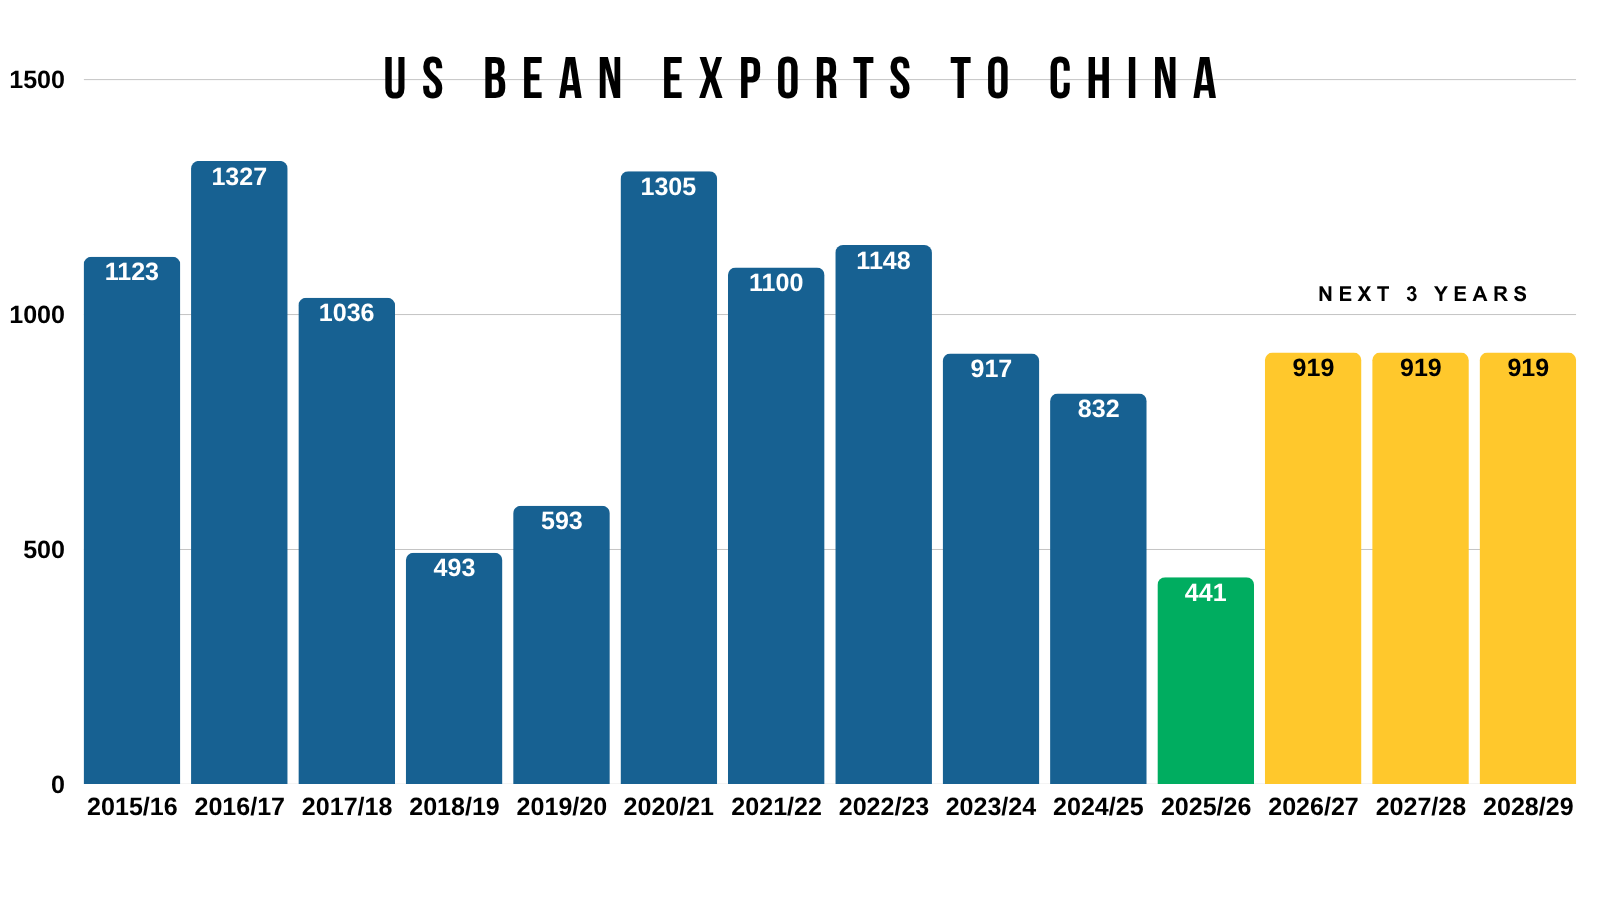
That meeting with China is still on for May 14th.
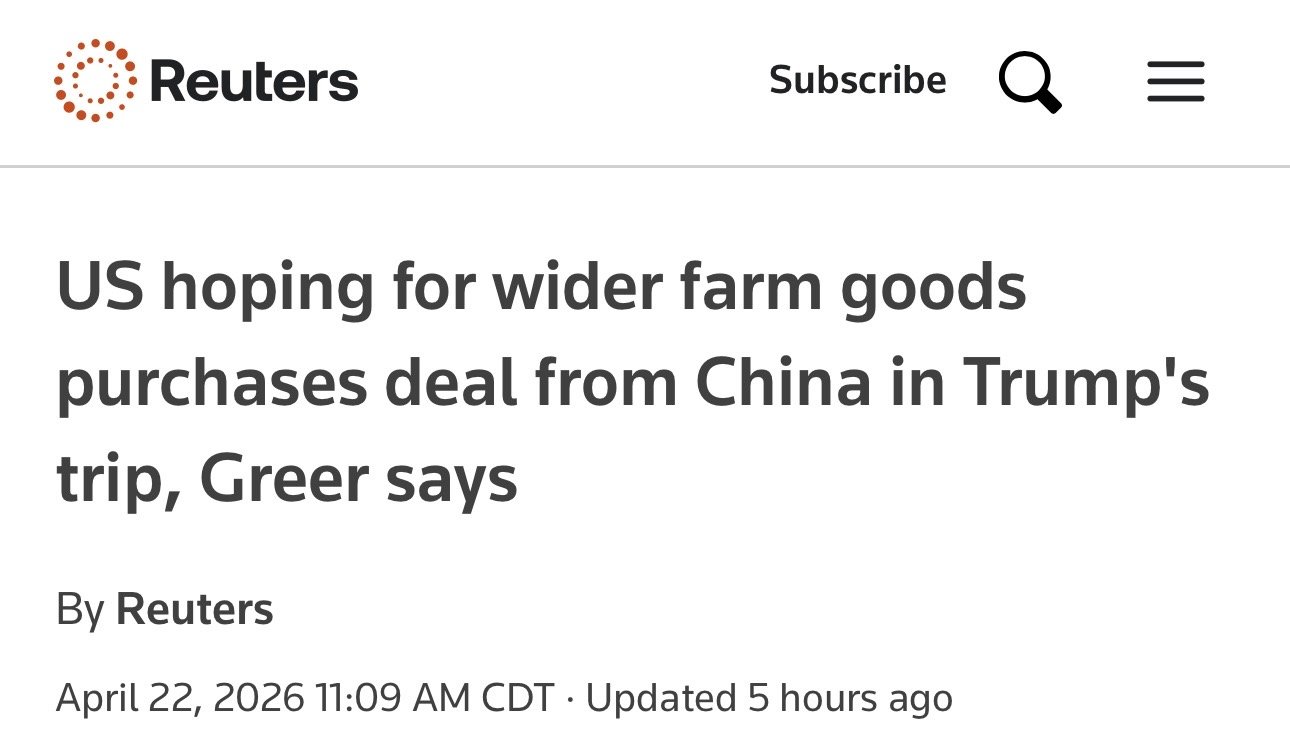
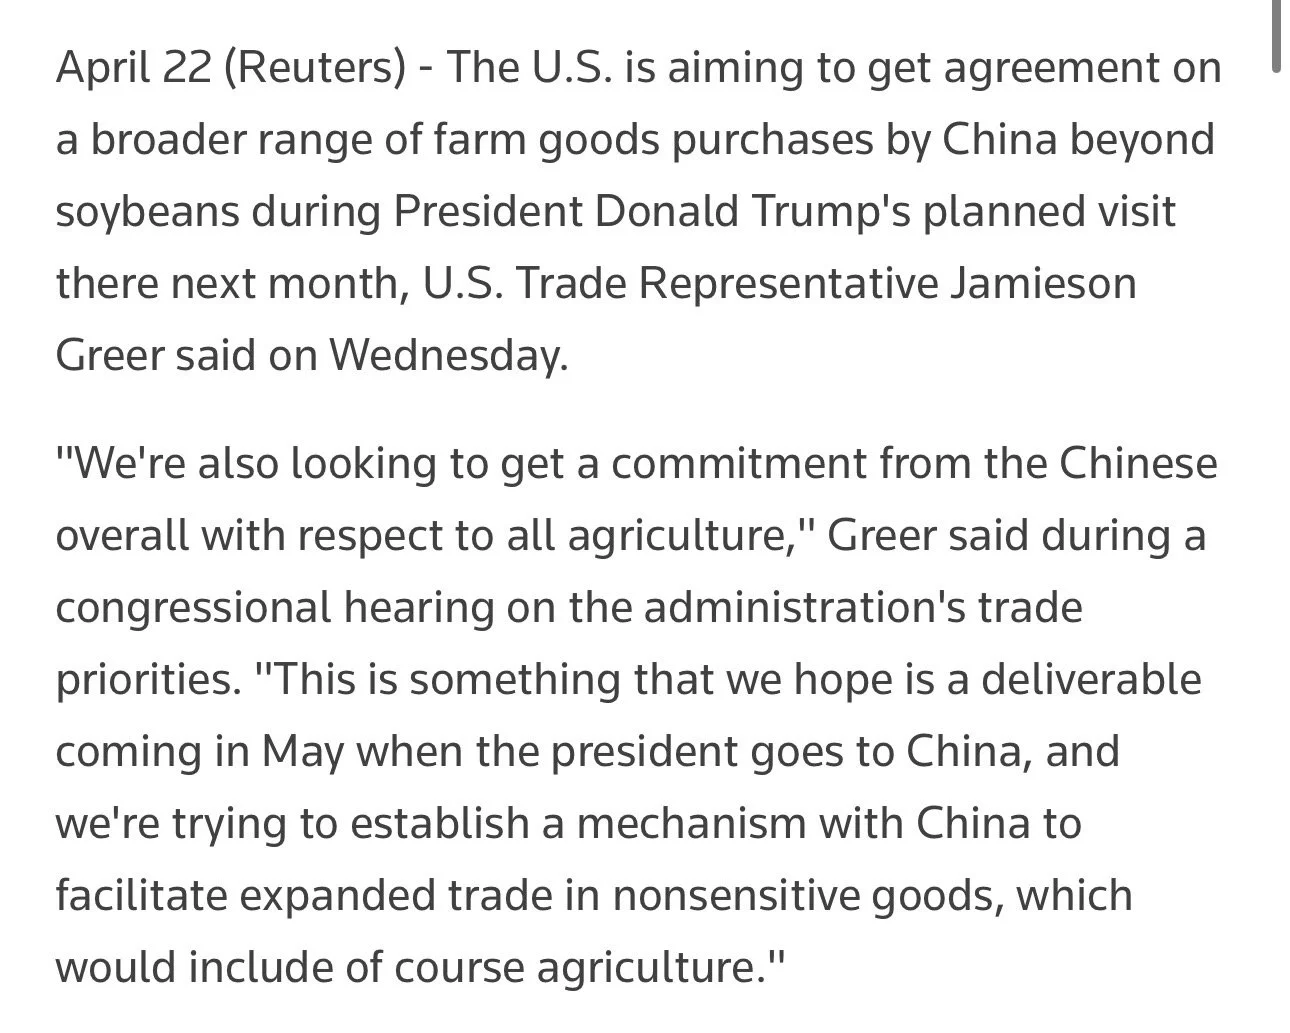
Today US trade rep Greer that they are also trying to get China to commit to "all agriculture" and get an agreement on a broader range of farm purchases "beyond soybeans".
This could’ve been part of the reason for the weakness in beans today. If they buy other products, does that mean less beans?
On the flip side, what if this includes corn or wheat?
Overall, if the meeting results in additional purchases of soybeans or any other grains it's going to be viewed as a friendly item.
We will have to wait and see if China starts to buy any soybeans ahead of the meeting like they sometimes tend to do.
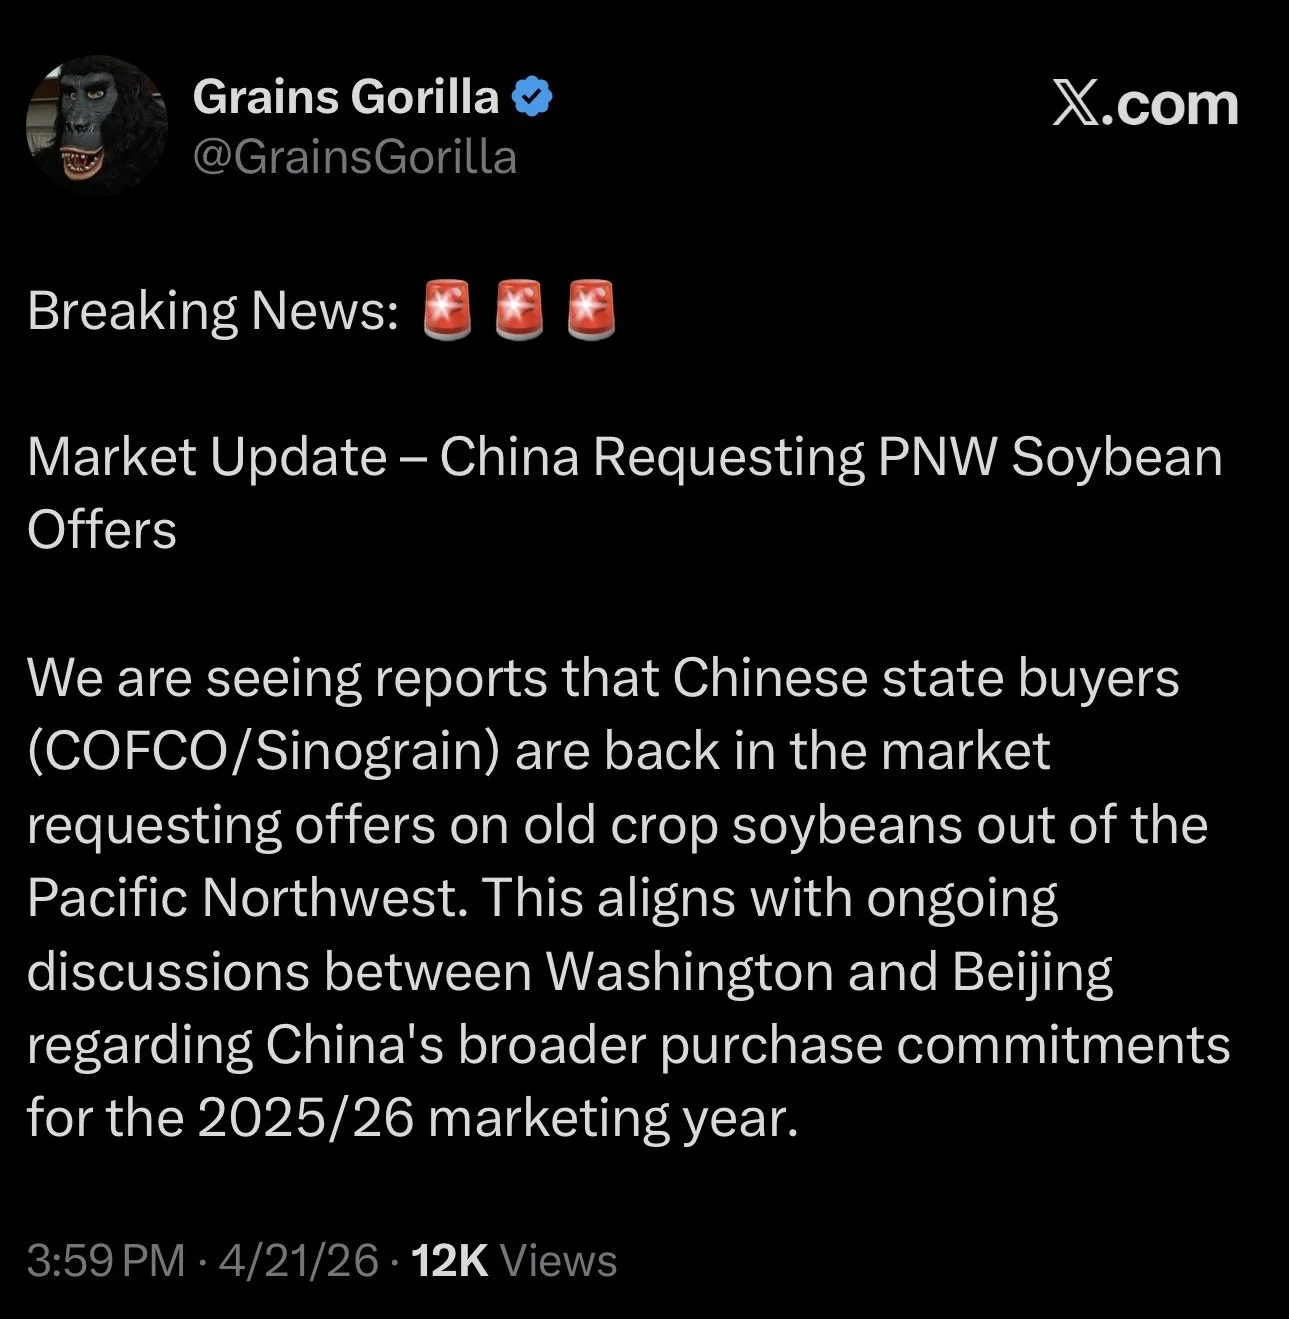
There was actually some rumors that China was back in the market and requesting offers on old crop soybeans.
However, from what I could find these are simply rumors and I haven’t seen any actual confirmation.
Today's Main Takeaways
Corn
Planting Progress:
Overall planting is slightly ahead of average. Largely to it being dry down south.
However, Iowa is the one that stood out in the crop progress report.
It is still way too early to call for a planting delay story, but Iowa is sitting at just 2% planted vs 8% on average as they continue to get hit with rain.

Fundamentals:
There isn’t much we haven’t already gone over fundamentally before.
Now, from the outside, the corn fundamentals don’t scream bullish.
Yes, I do think corn acres are overstated.
However, that isn’t going to show up until June if that's the case anyway.
If we actually grow a trendline yield and plant what the USDA says we will, it does still give you a 2 billion bushel carryout and a large stocks to use ratio when you plug it into the balance sheets.
It can obviously change in a hurry, but that is just something we have to be aware of.
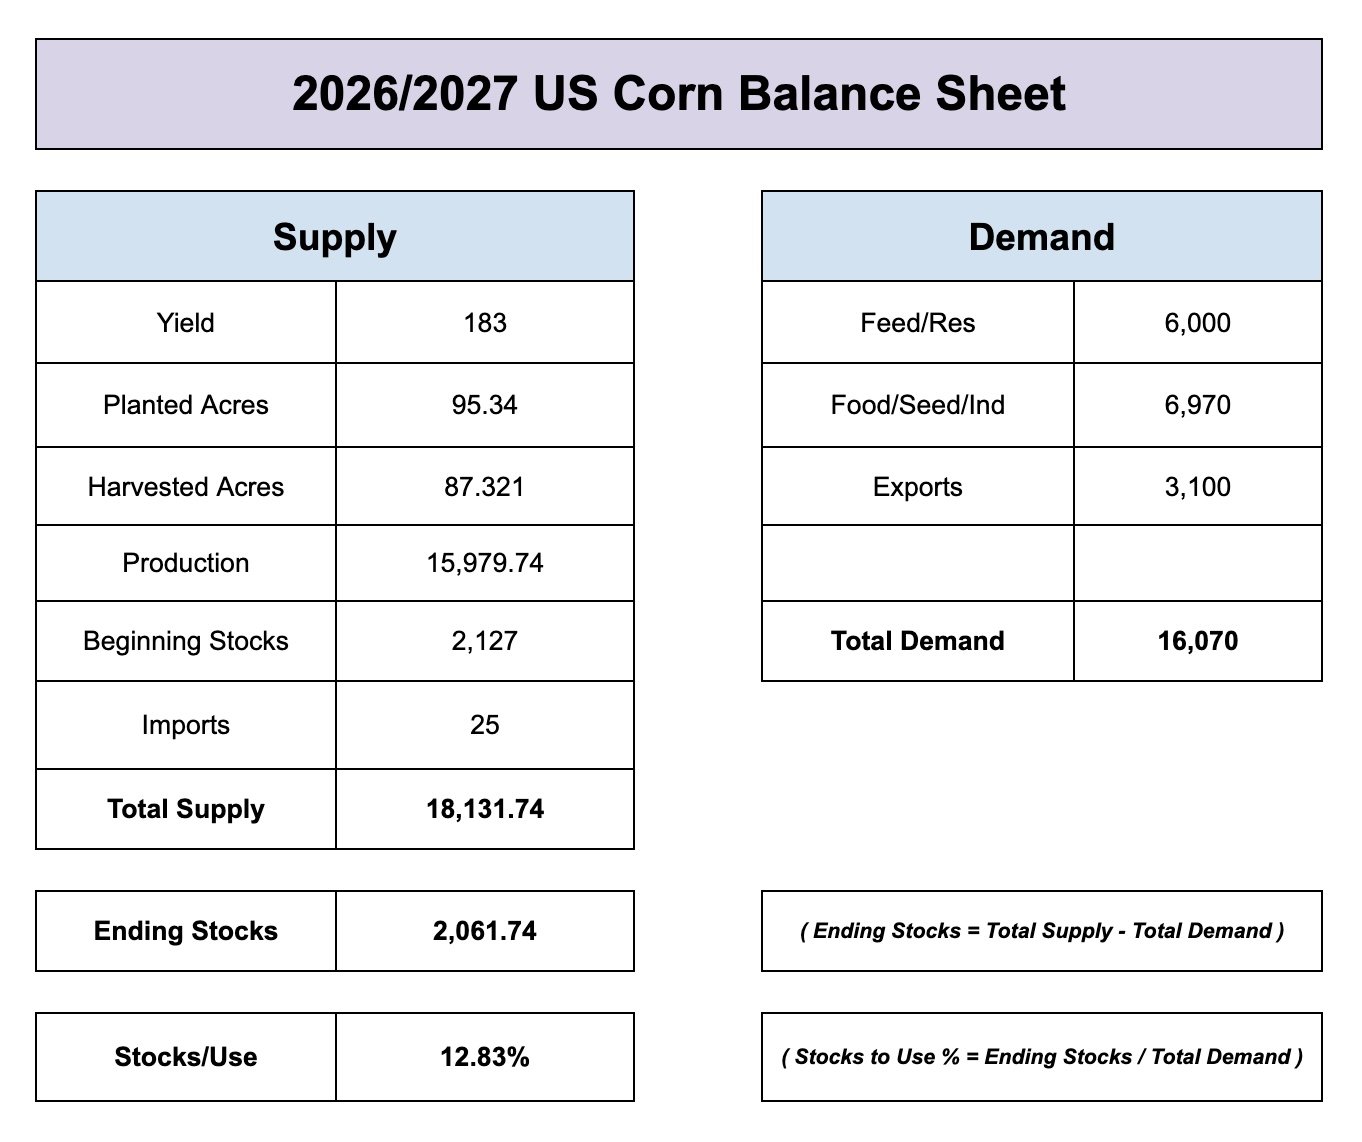
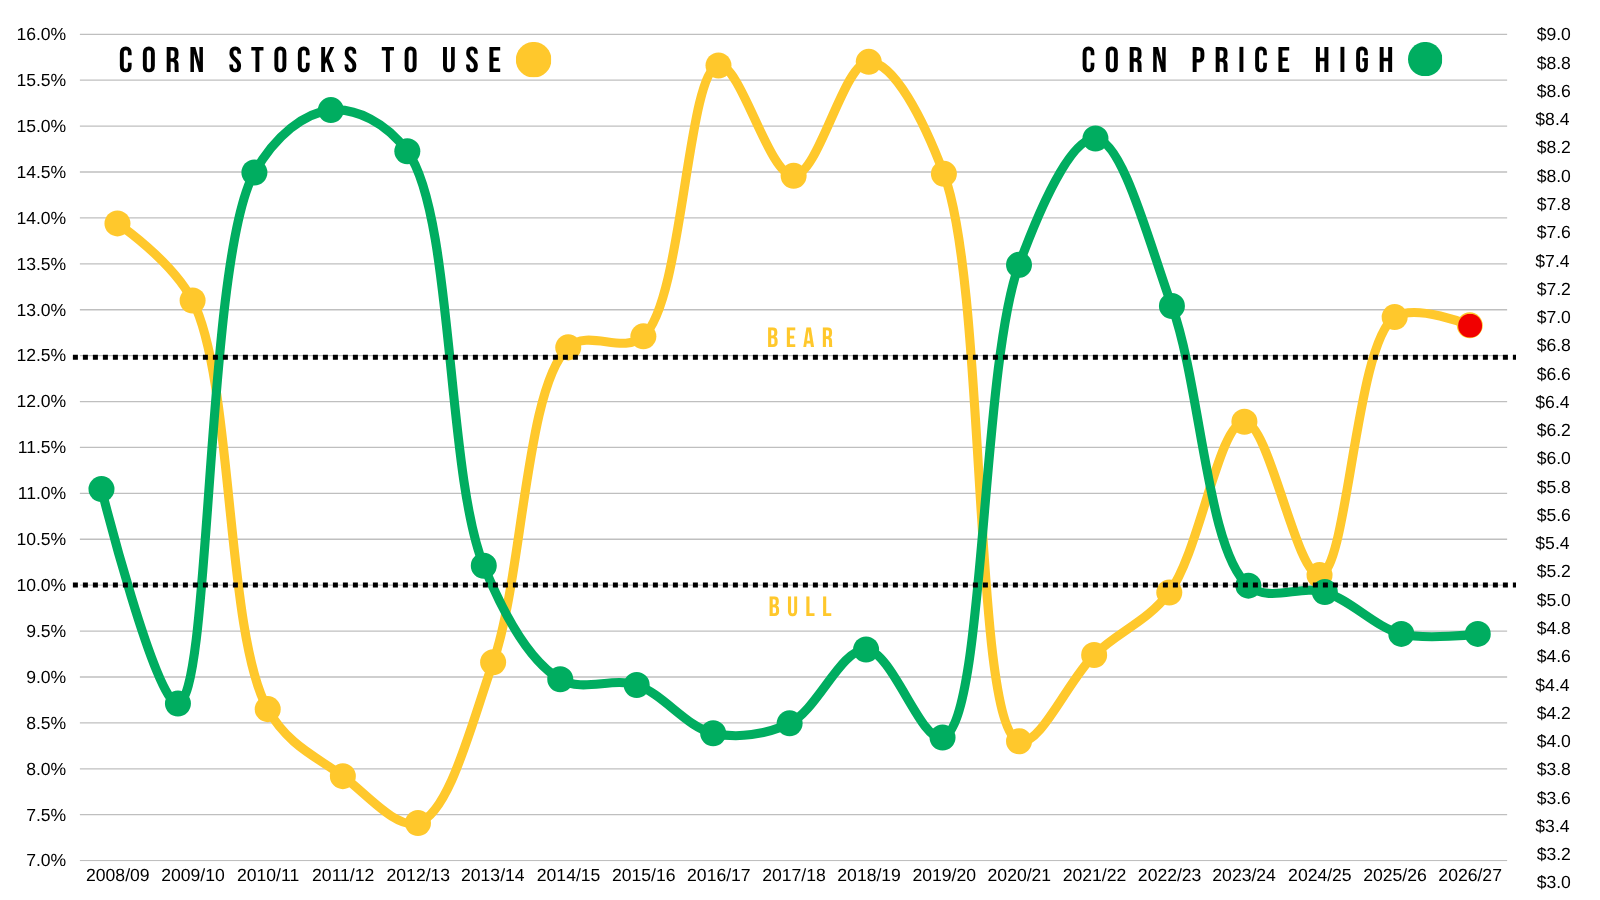
I've shown this chart countless times.
For reference, here is corn's highest price of the year vs our stocks to use.
Neither the old crop or new crop balance sheet says we need to go tremendously higher today based on the current outlook.
So it probably makes sense to look to protect this rally soon in some sort of fashion especially if you feel like you are behind.
Of course, there is still a potential story for new crop more so than old crop.
The crop isn’t even in the ground yet and things can change fast. We have an entire weather season ahead of us that will hopefully provide some opportunities.
We have the war, the potential "Super El Niño", the meeting with China, and possible impacts from inflation that can all play a role.
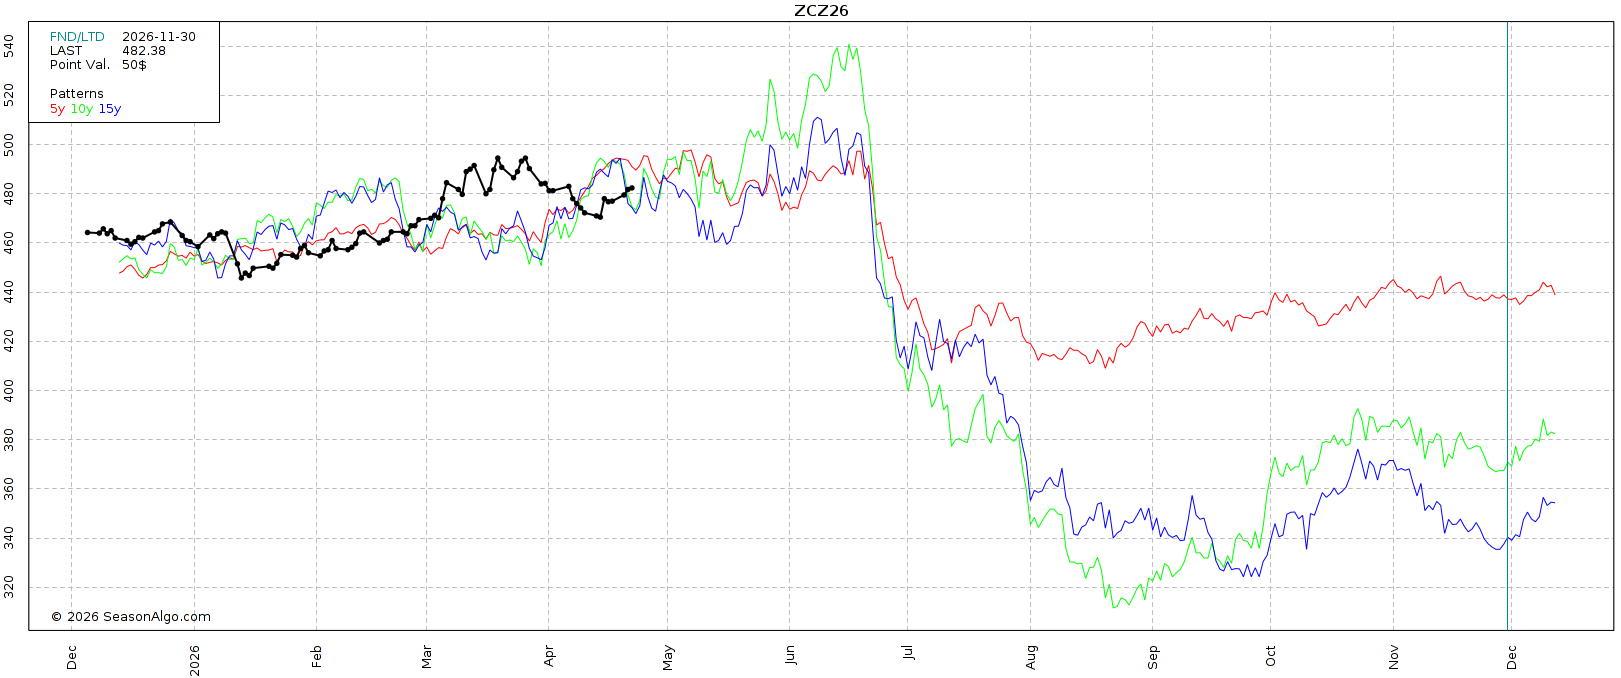
Seasonals:
The seasonals do lean friendly from here.
Most of the time, we keep some weather premium over the next few months.
So you'd like to think we at least have some underlying support via weather premium preventing us from falling out of bed.
We then almost inevitably collapse in late June or July unless we have some issues with the crop.
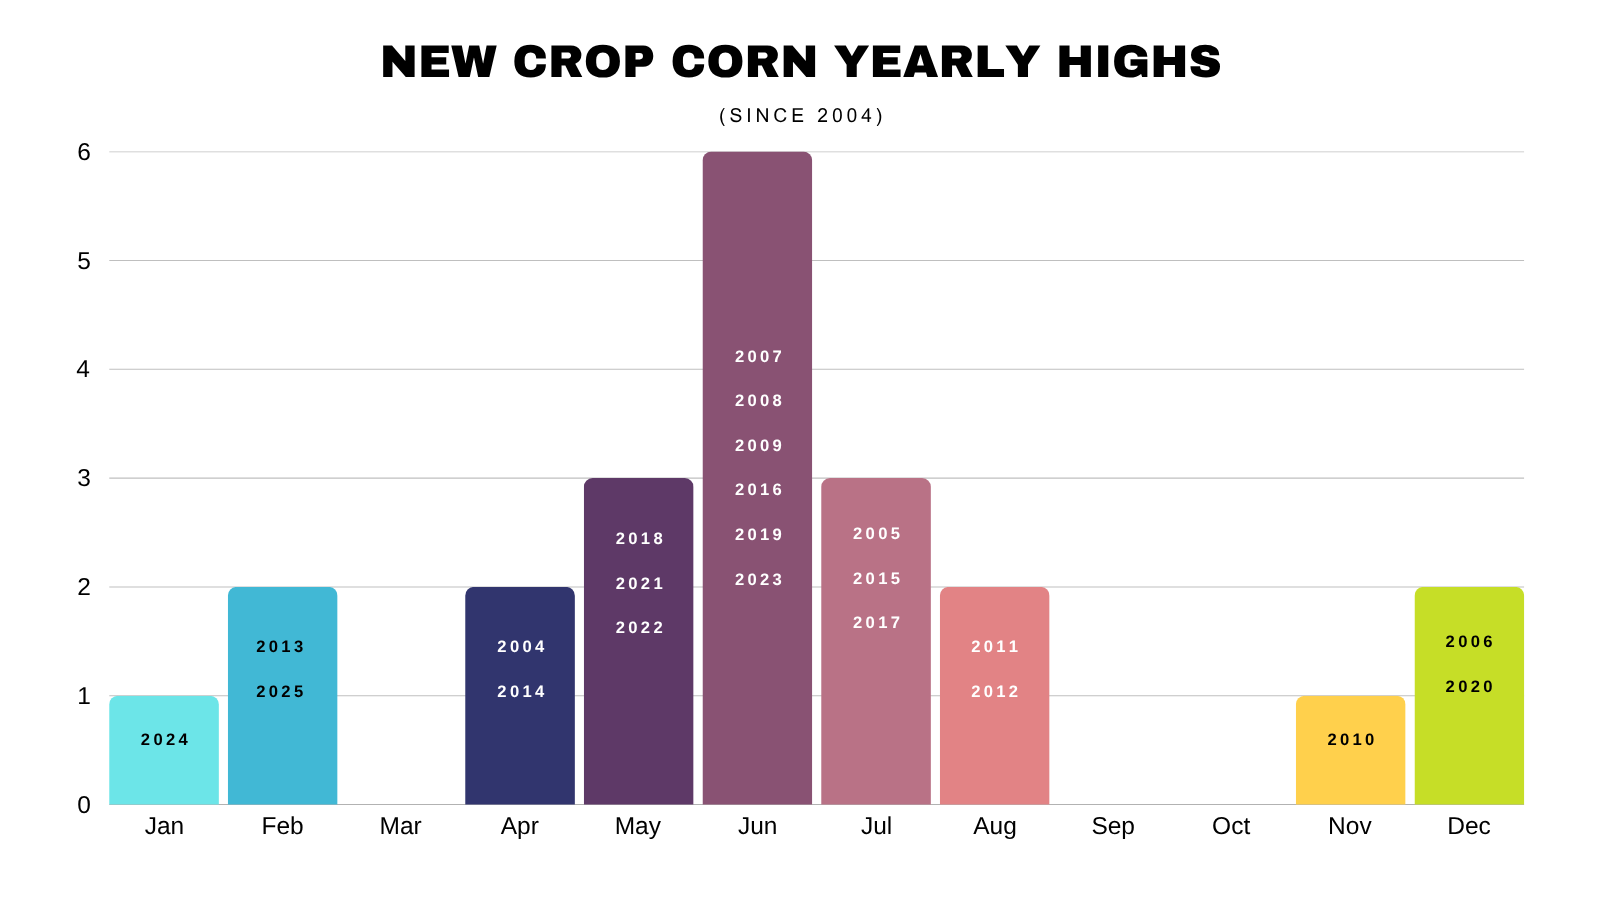
Highs in March?
The current high for Dec corn was on March 9th.
New crop has never posted it's highs for the year in March.
The data favors the high isn’t in.
However.. the last few years have been anything but normal.
Last year we topped in February which was just the 2nd time it's ever happened. The only other year was 2013 when we were essentially just in a downfall the entire year from 2012's record prices.
In 2024 we topped in January, which was the first time it's ever happened.
So you can’t say it can’t happen. We've never had a war in the middle east in March either.
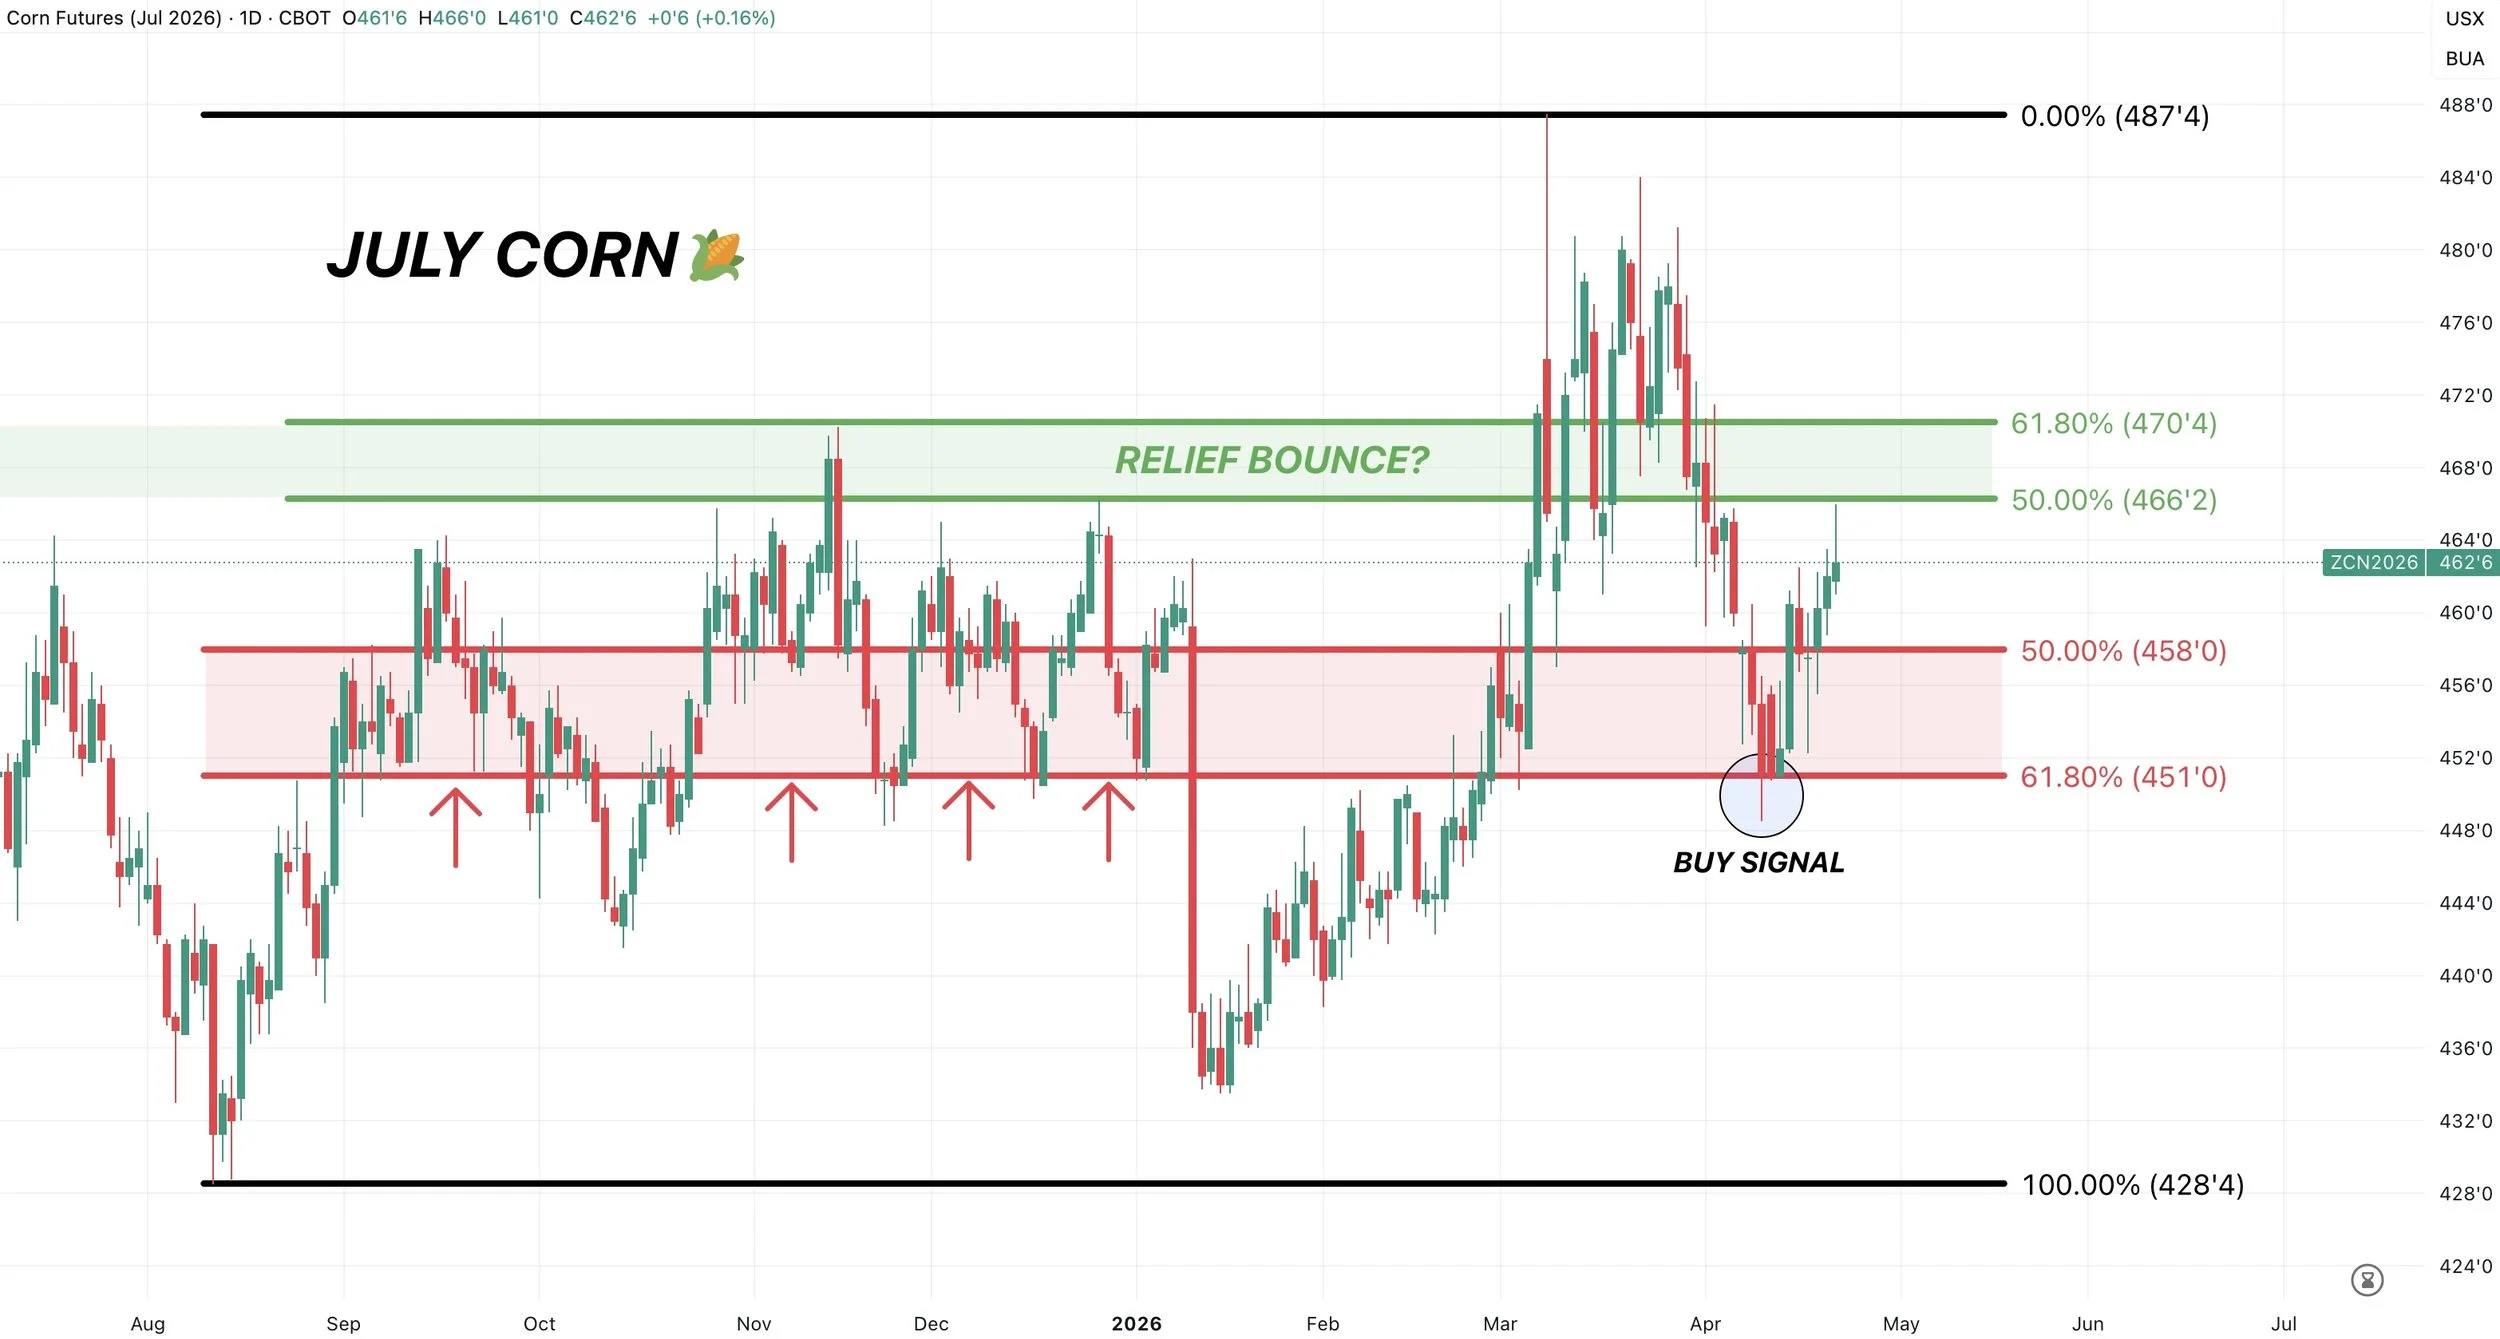
July Corn Chart:
We will be switching to the July contract from now on as that is now the lead contract.
On April 10th we alerted a buy signal for corn.
As we gave back 61.8% of the highs all the way down to contract lows. That same level was key support from fall.
Now what?
We are now approaching that target zone.
So we will be looking to lock in some profit or take some risk off the table in our marketing here soon.
$4.65 to $4.70 claws back 50% to 61.8% of the entire sell off.
That same area is resistance from fall.
We tagged the box today.
This area is where we find out if this is simply just a relief bounce or the start of a bigger rally. As this is where the market often makes that decision.
So I like rewarding the move soon.
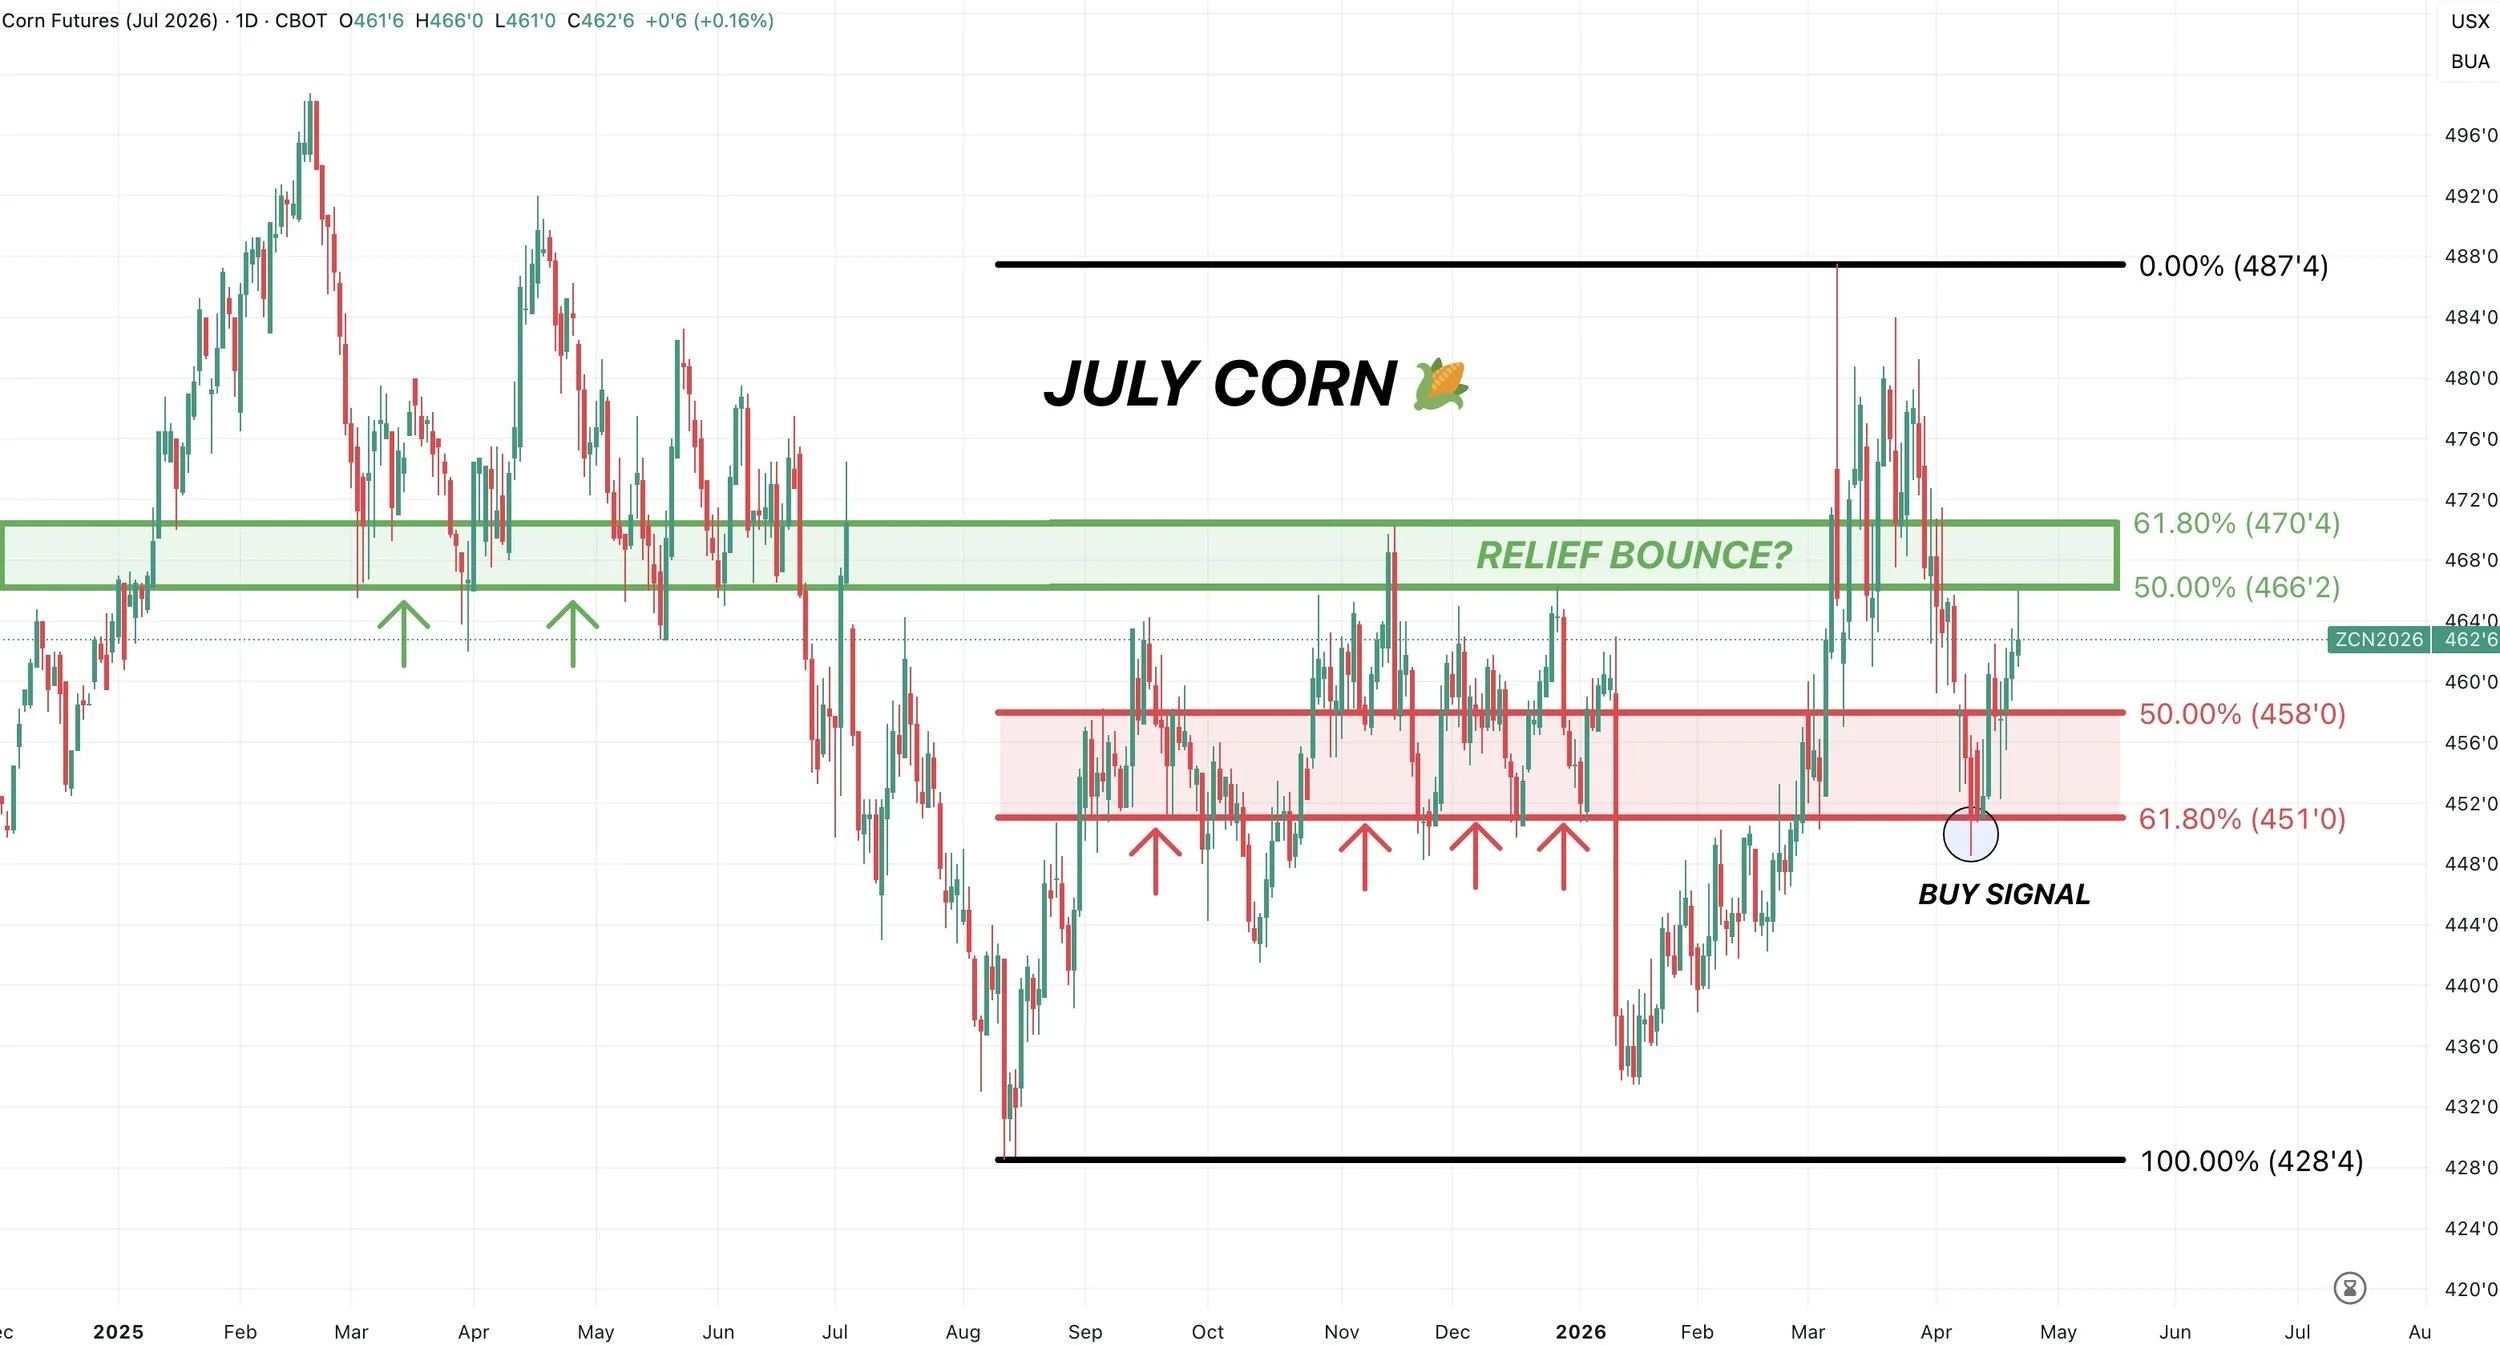
If you zoom out even further.. this same target box was not only resistance last fall.. it was also key support from early last year.
Making it that much more important of a level.
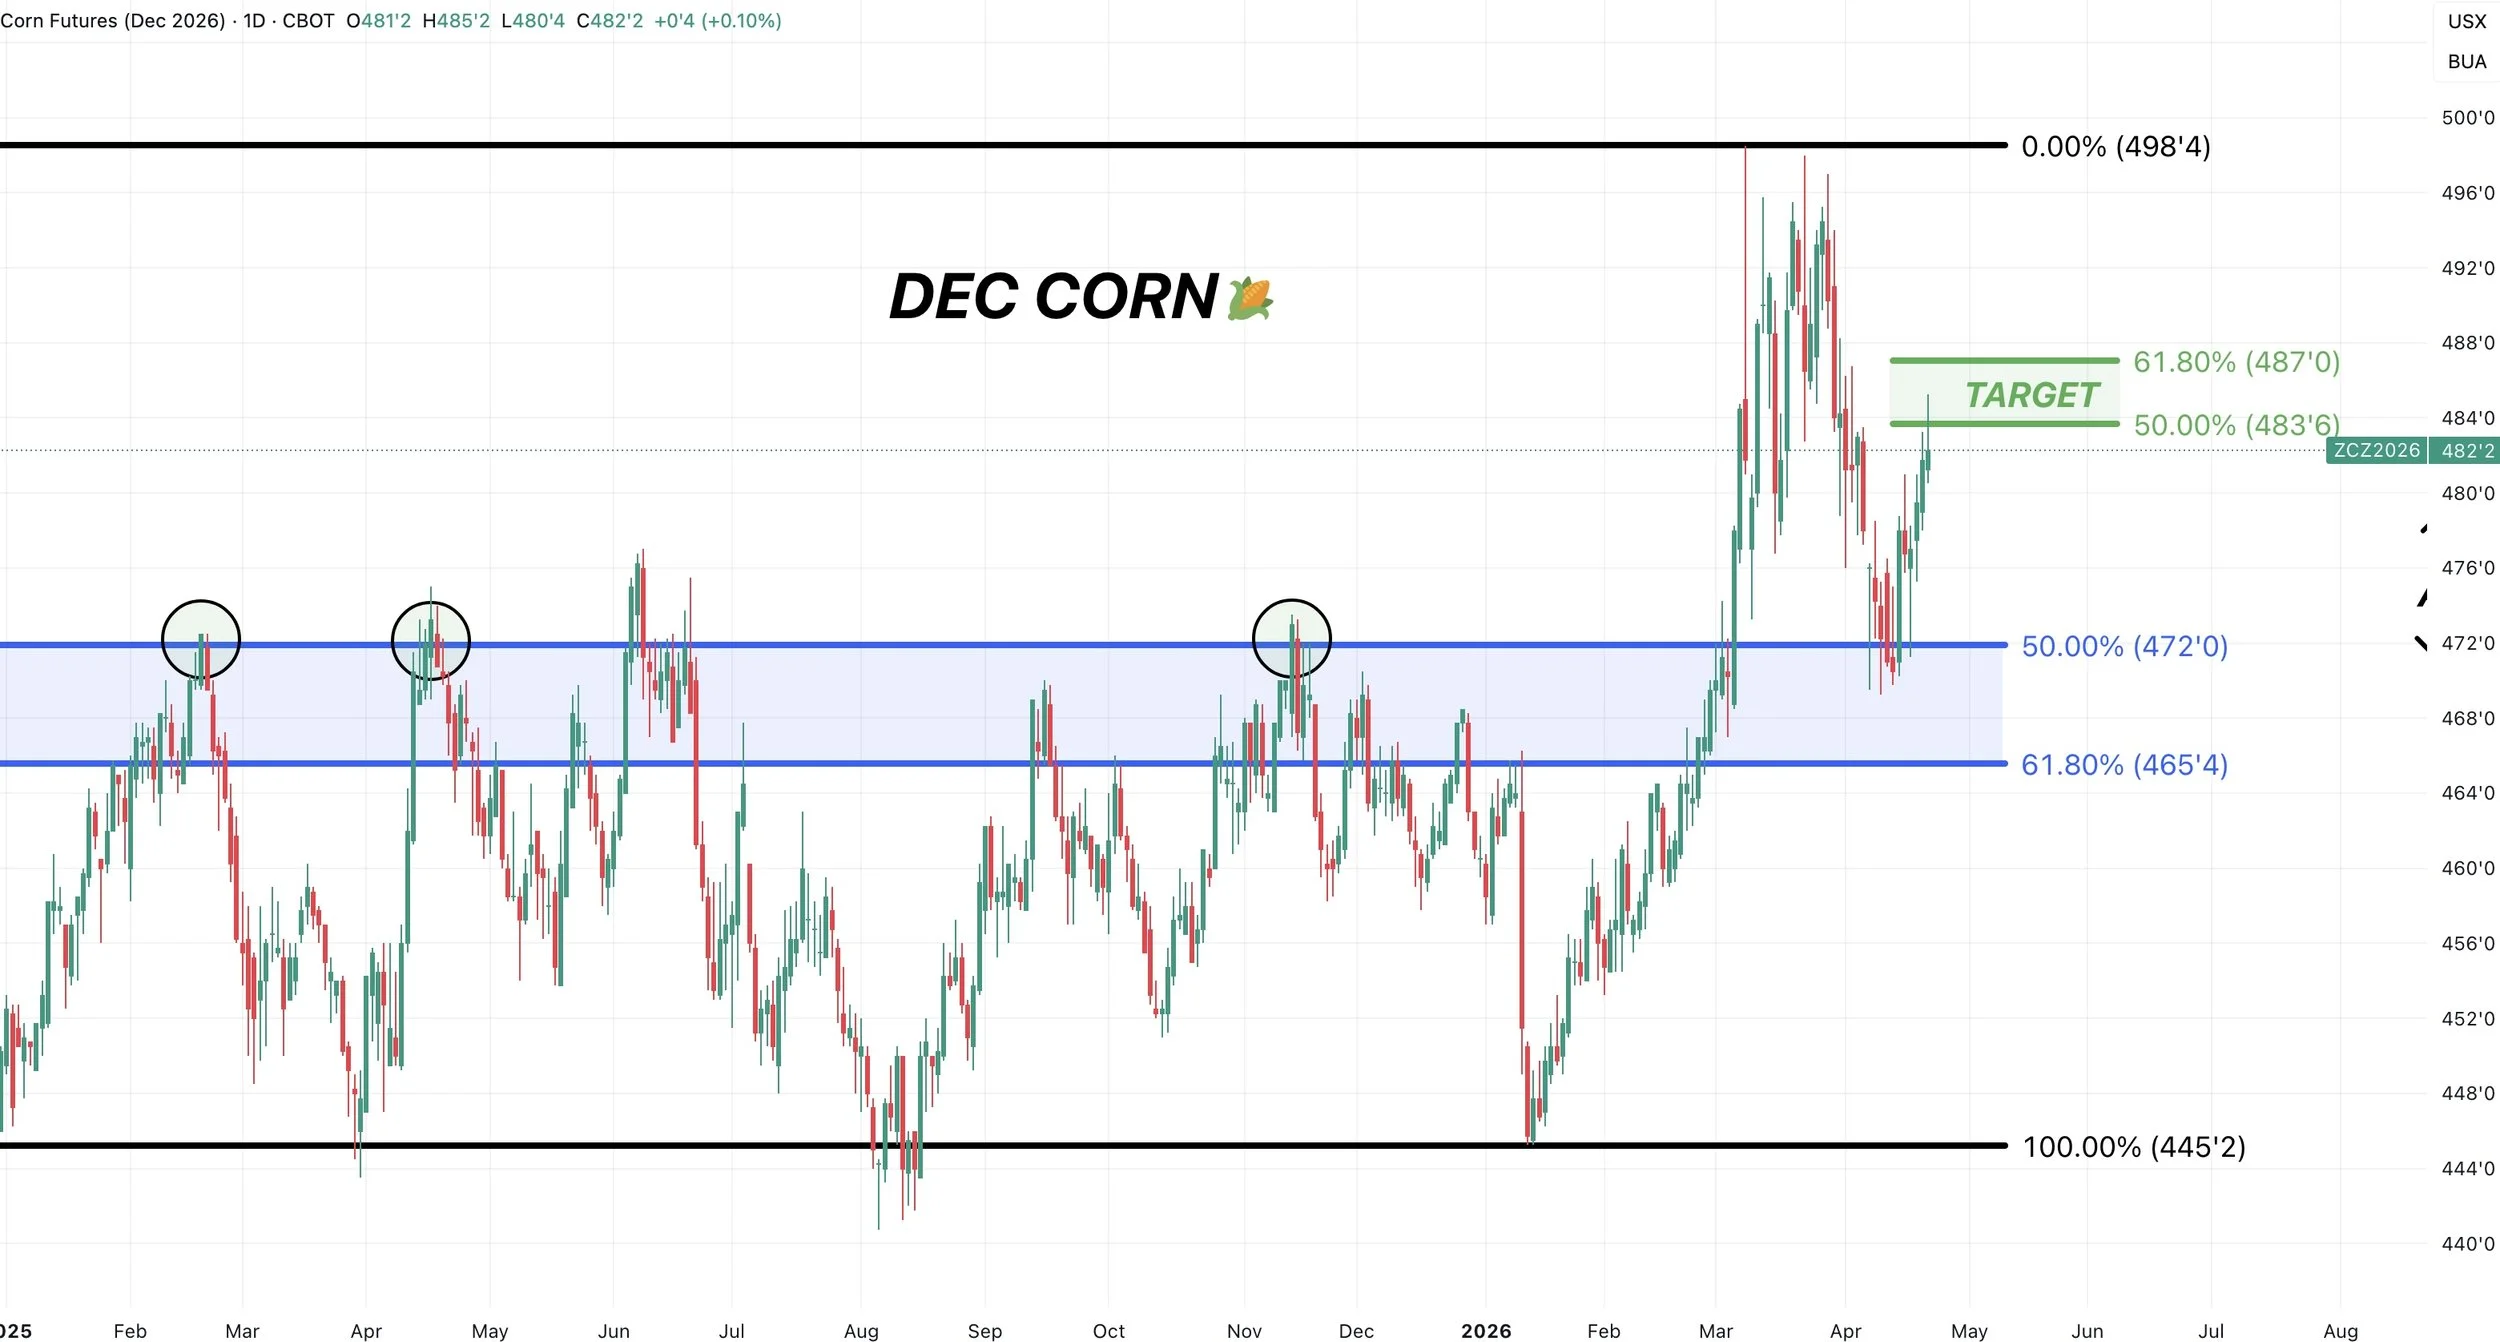
Dec Corn Chart:
Dec corn bounced after giving back 50% of the entire rally.
That same level was resistance last year. Where this market failed to break through on several attempts.
Sometimes it really is as simple as old resistance becoming new support.
Now to the upside, we tagged that target box today.
As a typical relief bounce brings us to $4.84 to $4.87 (50% to 61.8% of the sell off).
If we break above this box, it would suggest this is no longer viewed as a relief bounce and we can go challenge the highs.
If this is just a relief bounce, this is where we would expect us to struggle.
Soybeans
Planting Progress:
Soybeans are already 12% planted.
Which is one of the fastest starts ever.
However, I'd say a big part of this is just due to many growers opting to plant soybeans first the last few years and the agronomics behind it, so I don’t put much into it yet.

Fundamentals:
The biggest item is going to be the China meeting and what happens. After that it comes down to weather as we enter planting and growing season.
Fundamentally, some could argue that the soybean situation isn’t out of this world friendly either.
We have a big crop out of Brazil.
So world supply isn’t an issue.
If corn acres are too high, like I think they are, soybean acres might be a tad low when it's all said and done.
Most think that China is done buying old crop.
On the other side of things, you do have that continued optimism of China buying that new crop that they agreed to buy.
So the story is going to likely be in new crop.
Exports are still a concern.
The USDA might be overstating exports, but you can’t discount our domestic demand.
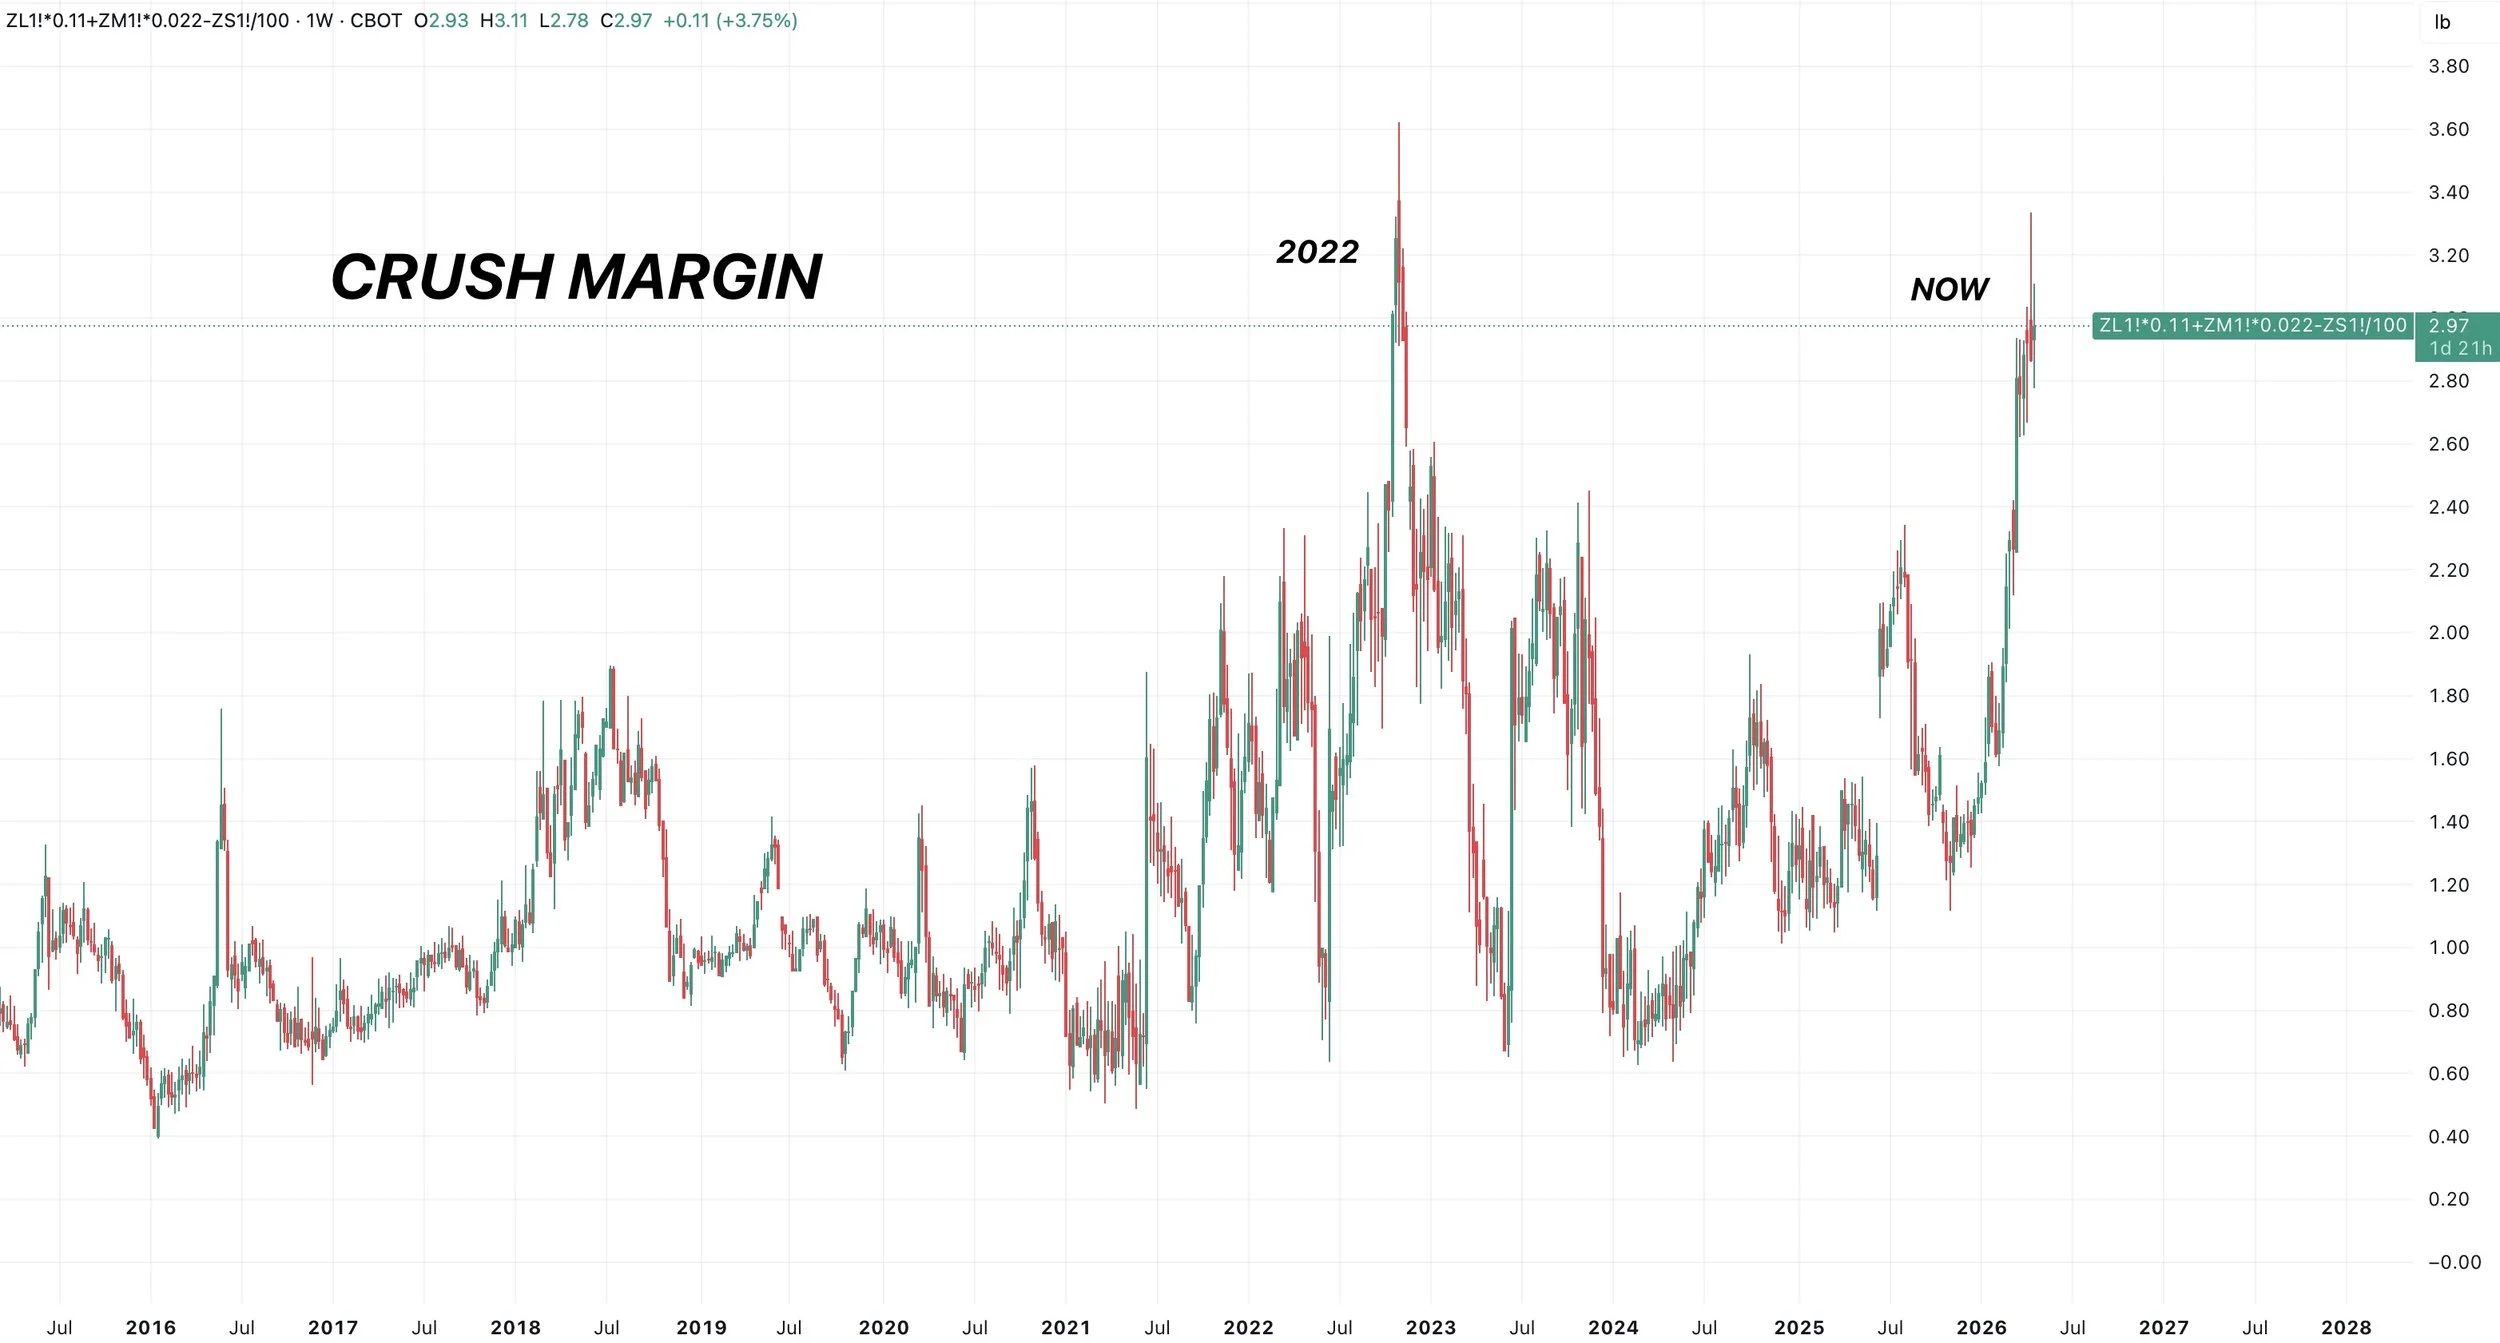
Crush margins are still sitting at $3.
That's the 2nd largest margin ever.
This is not bearish for soybeans.
It tells us that processors can continue to buy as many soybeans as possible, as that is a pretty nice incentive to do so.
This should at least provide some underlying support in this market.
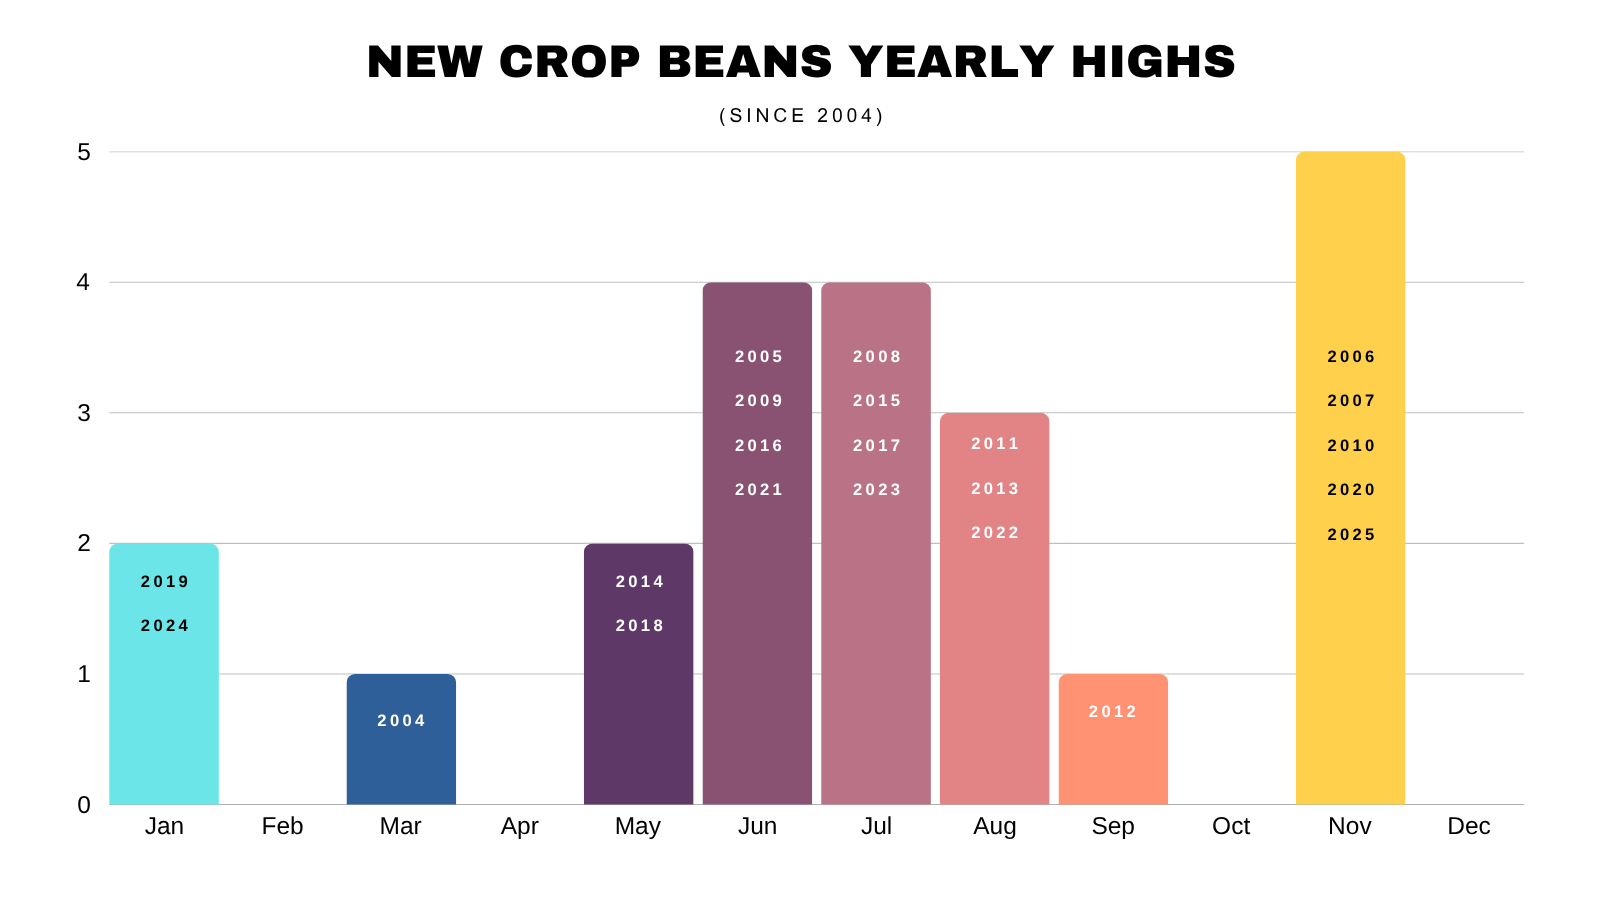
April Highs?
Fun fact, new crop soybeans have never posted their highest price of the year during April.
We've only posted them in March once, over 20 years ago.
Of course that doesn’t mean it can’t happen, but that's the seasonal data.
Catching Up in New Crop:
We like catching up in your new crop marketing.
Nov beans are right at those highs from March.
We issued a sell signal a few weeks ago around these levels after the initial move higher.
If you haven’t done anything at these levels, it makes sense to defend this rally, especially if these levels make you money.
There are a few generic situations you might be in.
1) If you do not have storage and only do cash marketing, we like being around 40% sold.
2) If you have storage and only do cash marketing, we like using an HTA and being 30% sold.
3) If you have a hedge account and have zero cash contracts, we like having some options strategies.
Such as selling $13 calls on 25% of your production, or having 25% protected with a put spread and a sold call.
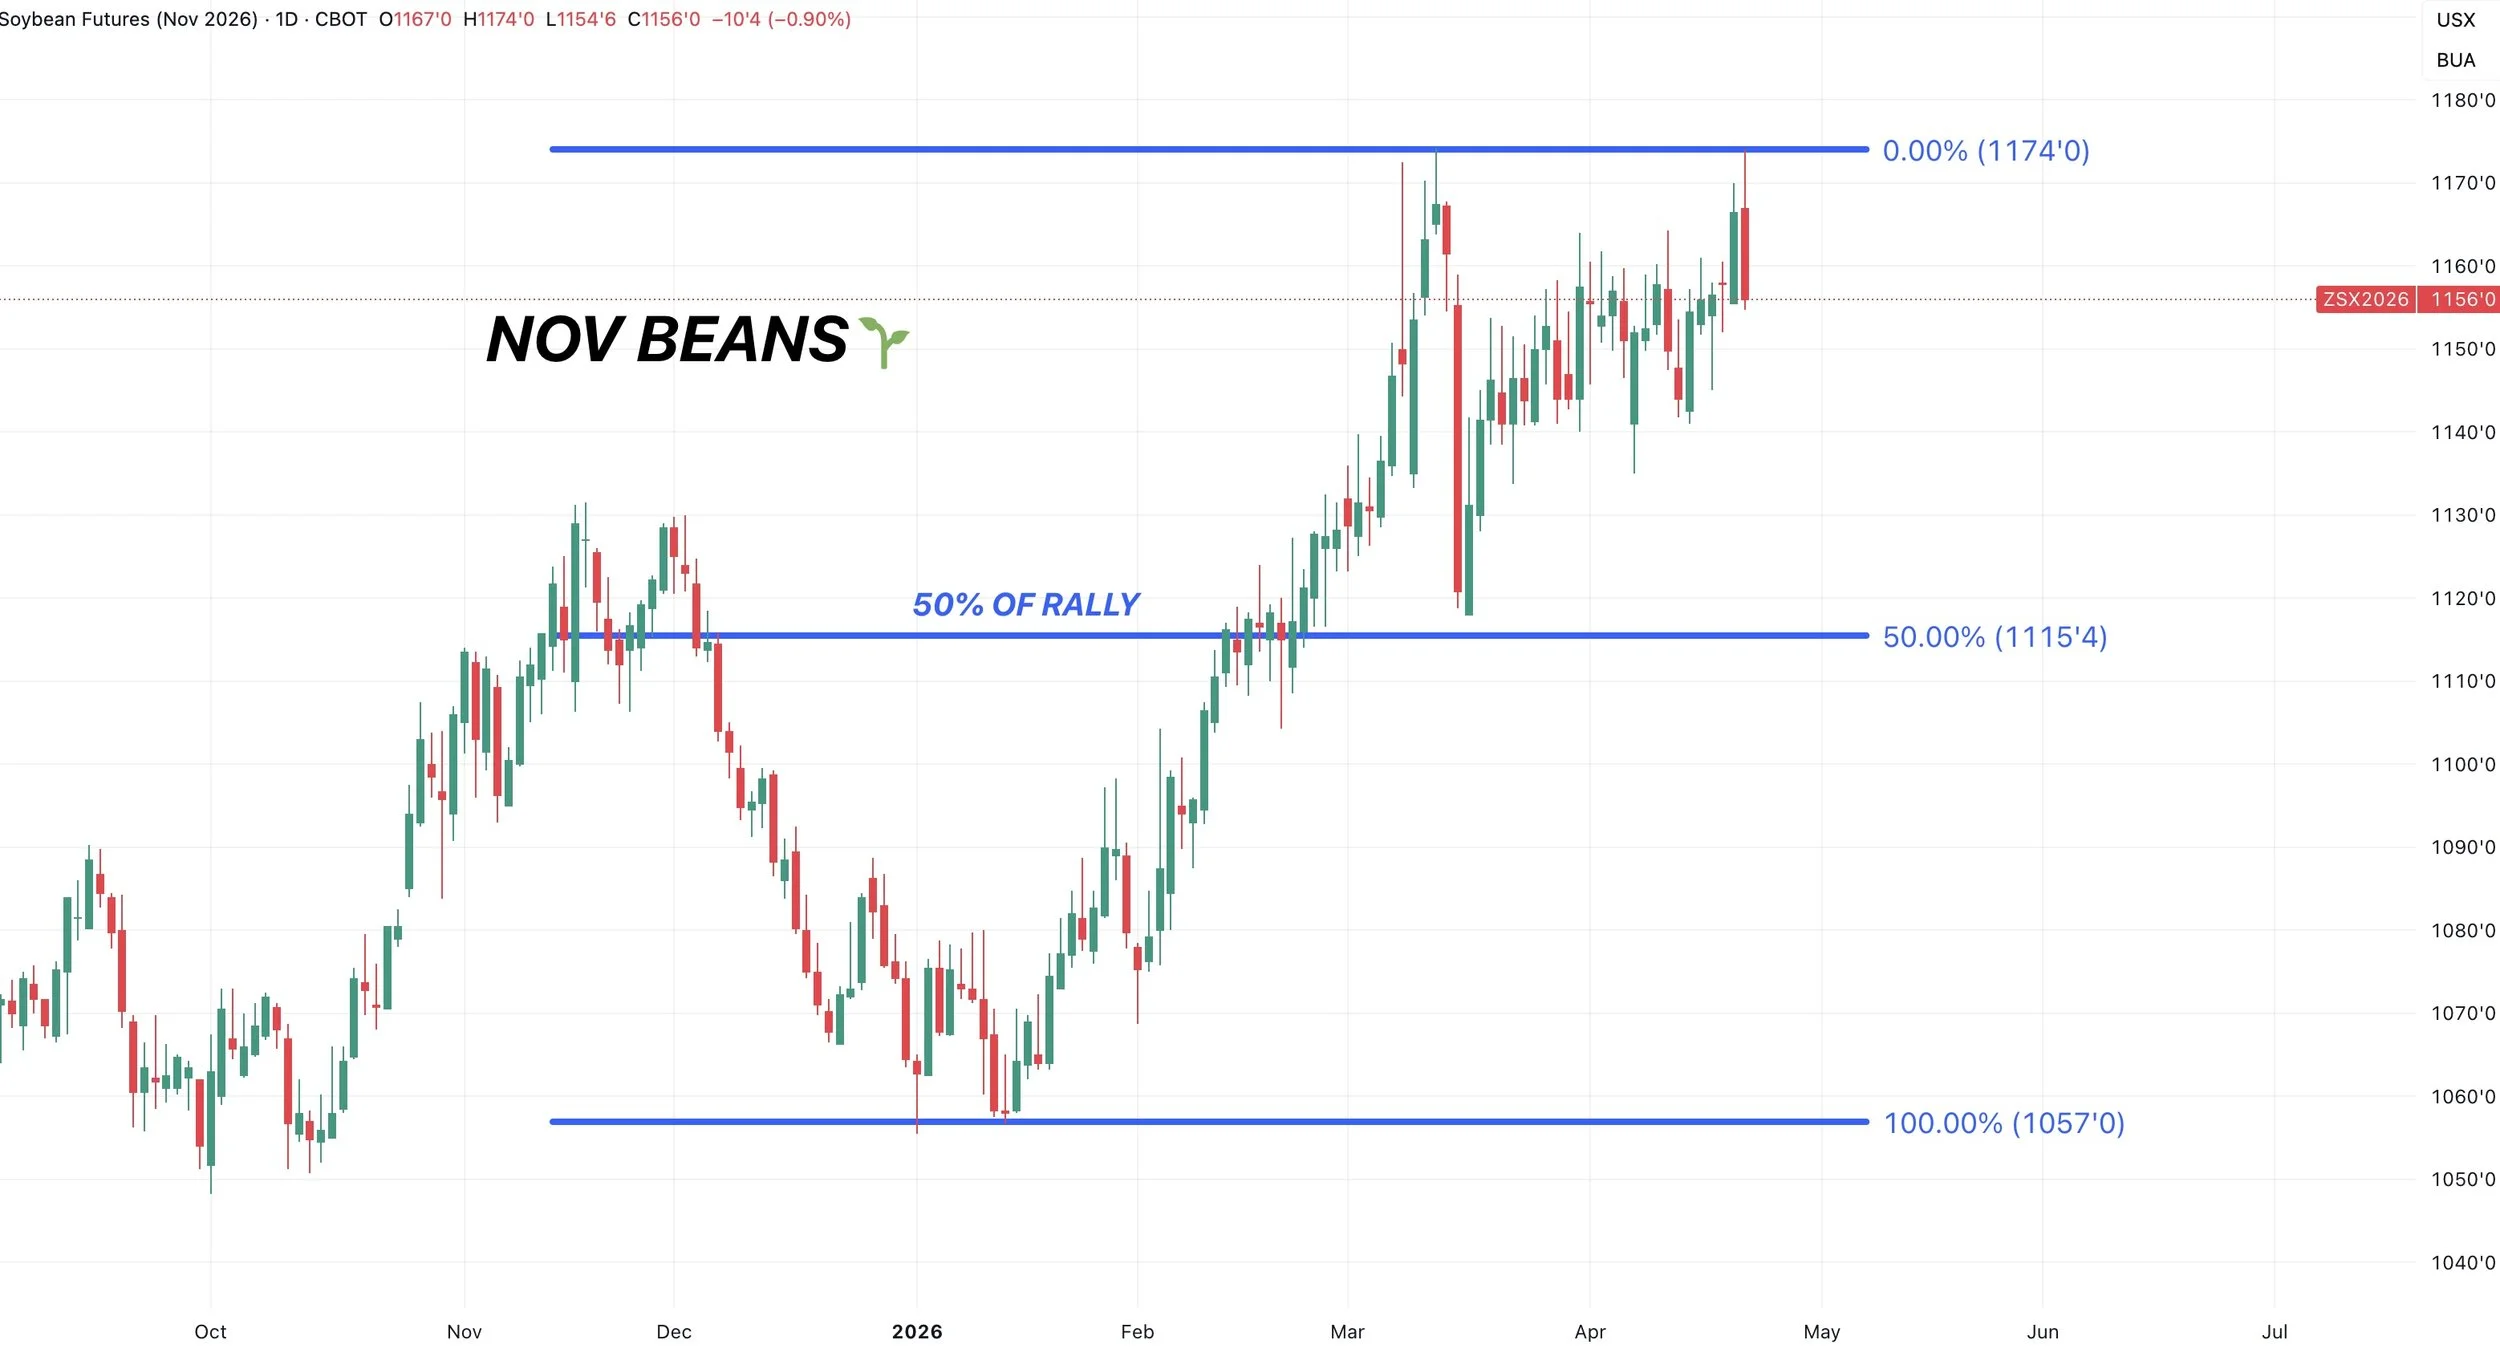
Nov Beans Chart:
We rejected right off those highs from March.
That is resistance for now, but if we break above it should open the door higher.
The caution here would be a potential double top.
Again, it makes sense to protect the highest prices we've seen in 2 years if you haven’t done so yet.
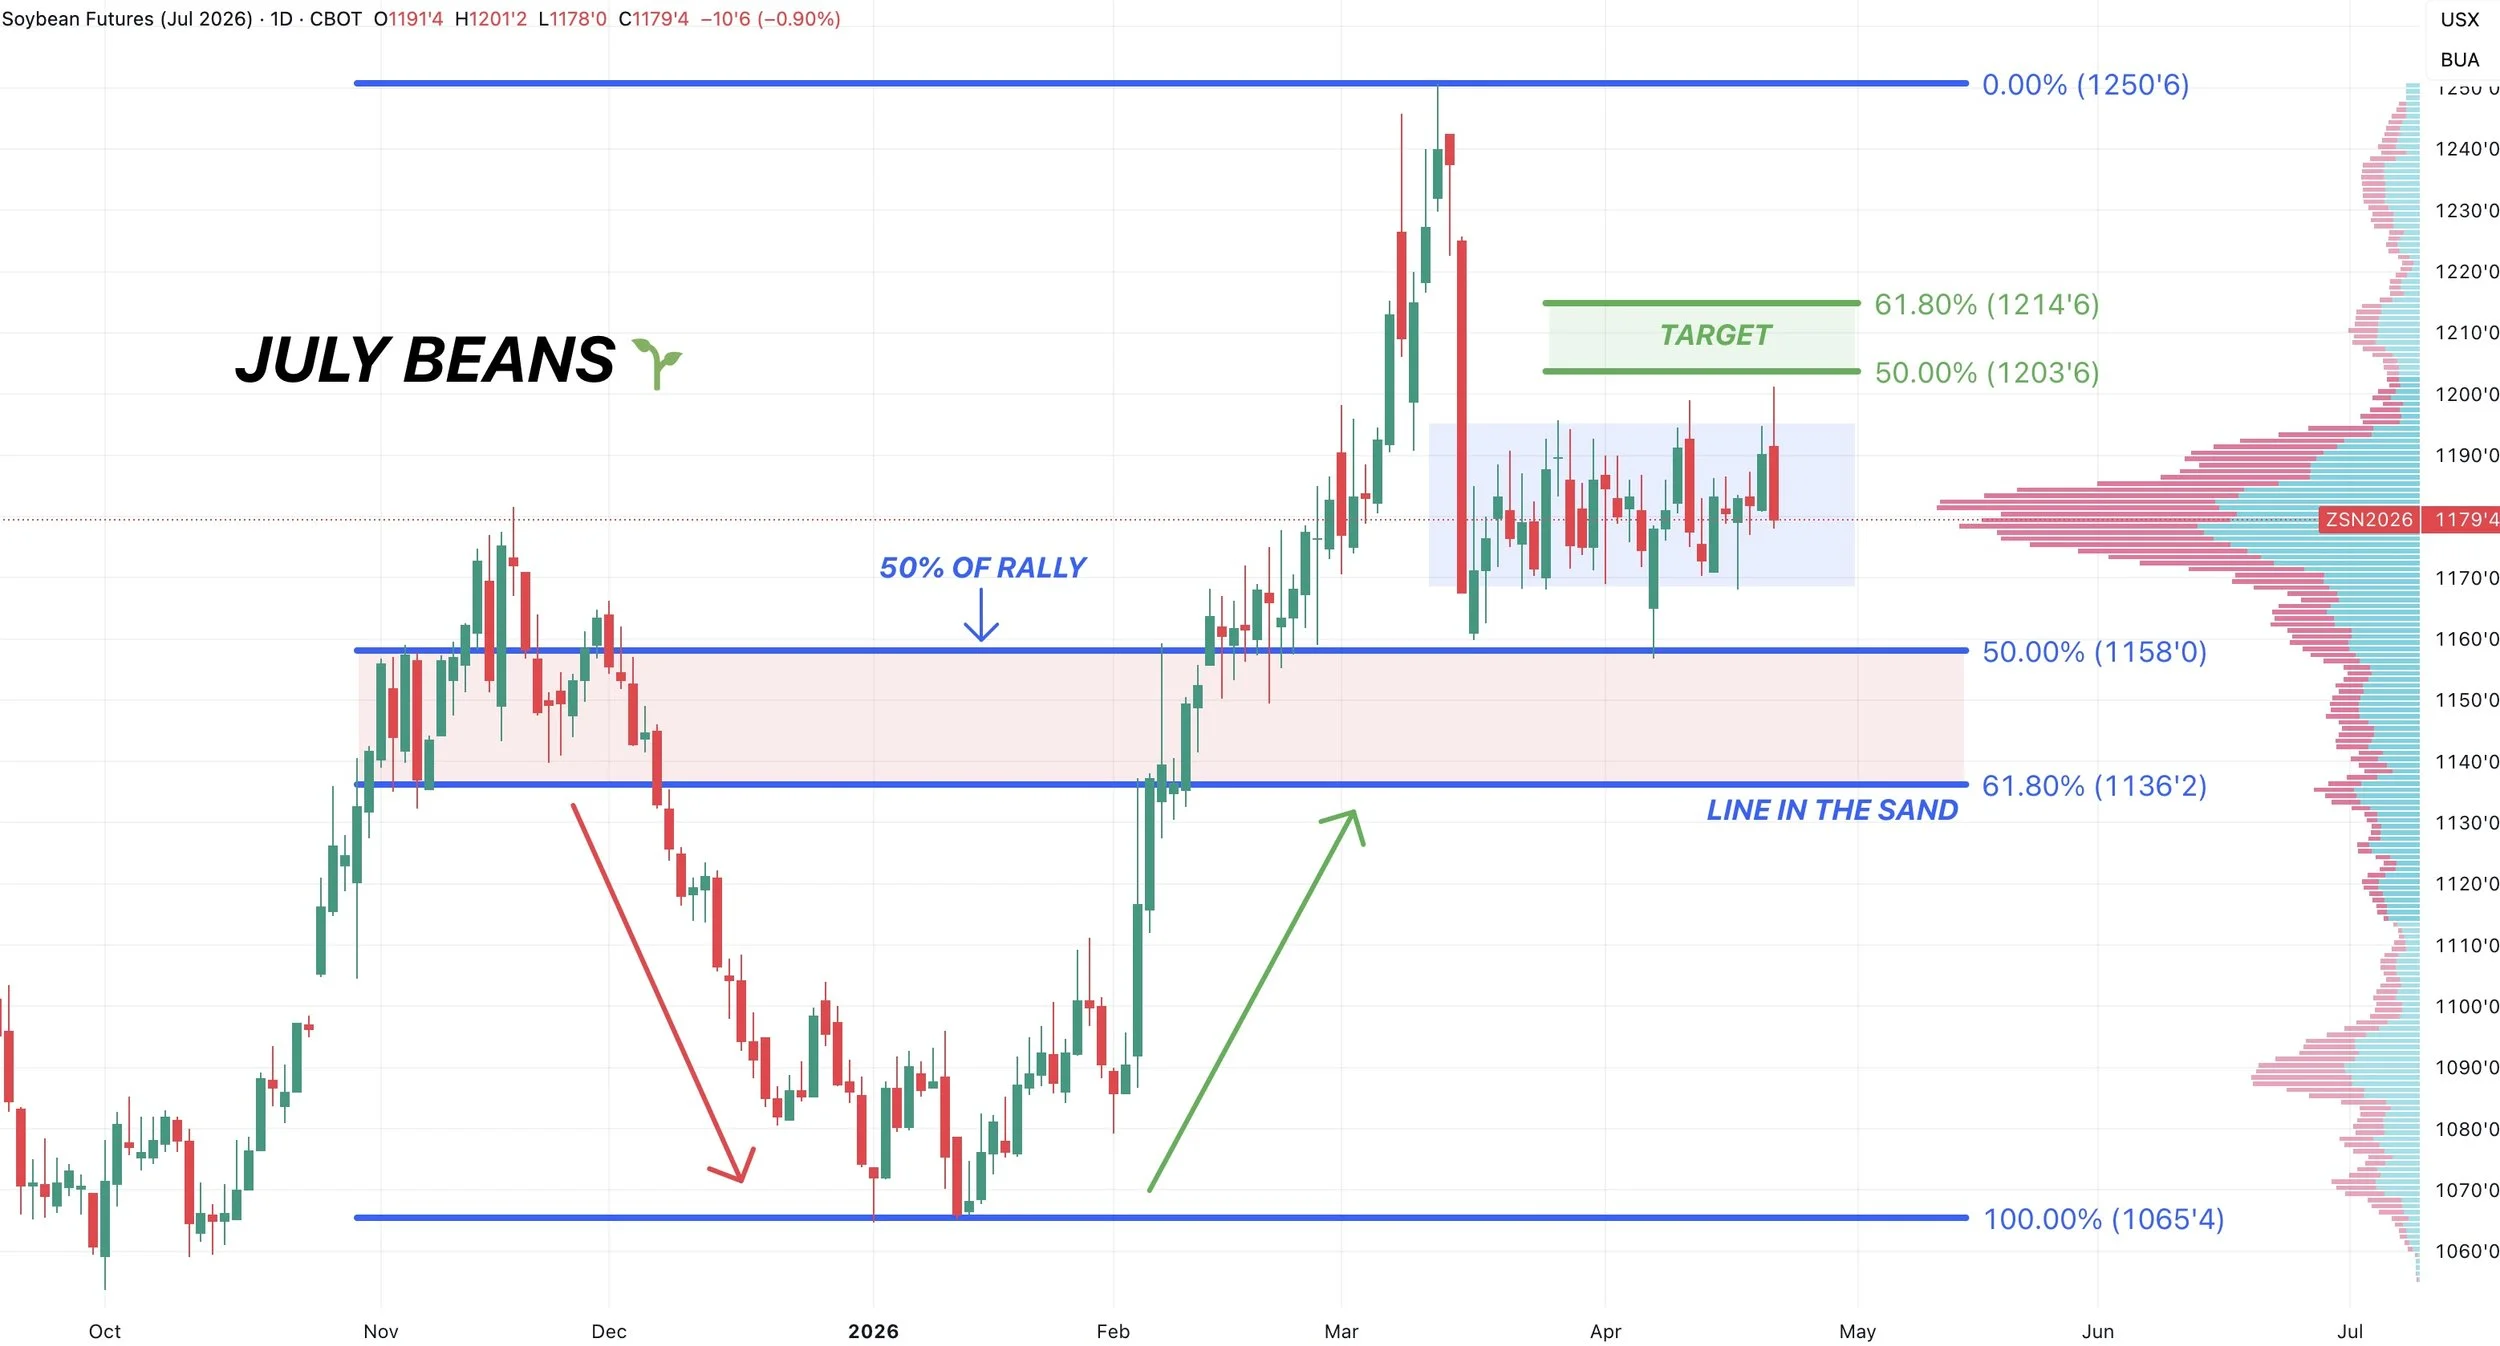
July Beans Chart:
We haven’t seen this long of sideways chop in a very long time.
We are still completely sideways in no mans land waiting for confirmation one way or the other.
If we get the break out, we want to reward a move towards $12.05 to $12.15 as that claws back 50% to 61.8% of the sell off.
Wheat
Wheat Ratings Paint Full Picture?
Wheat ratings continue to fall.
They dropped again this week. Now sitting at just 30% G/E vs 34% last week.
That number would be one of the lowest in decades.
But does it really paint the full picture?
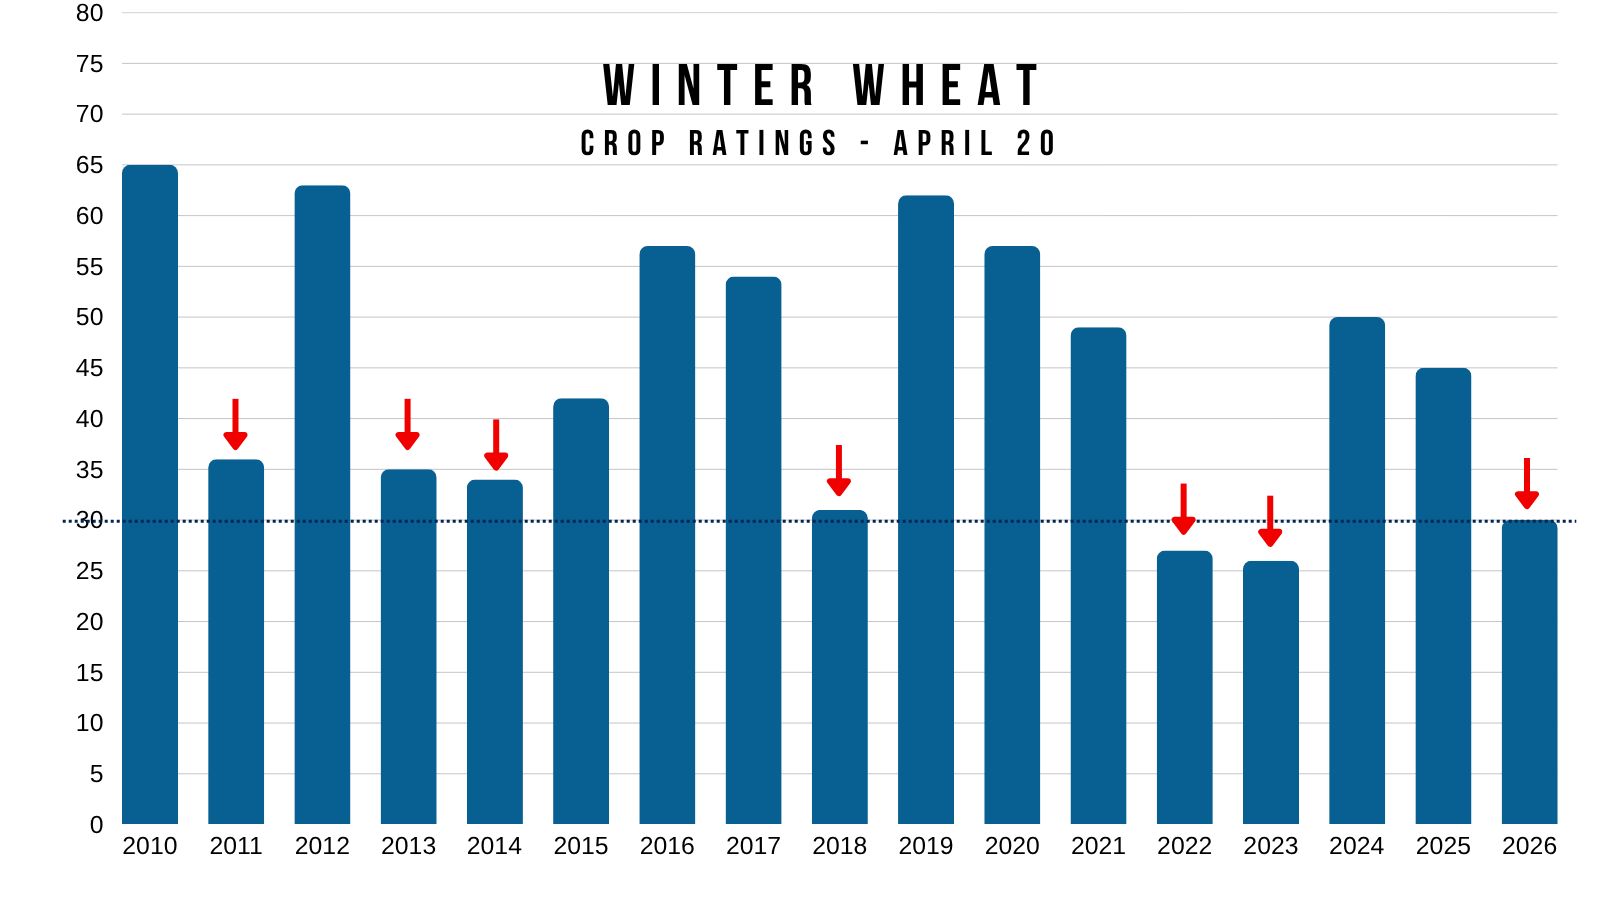
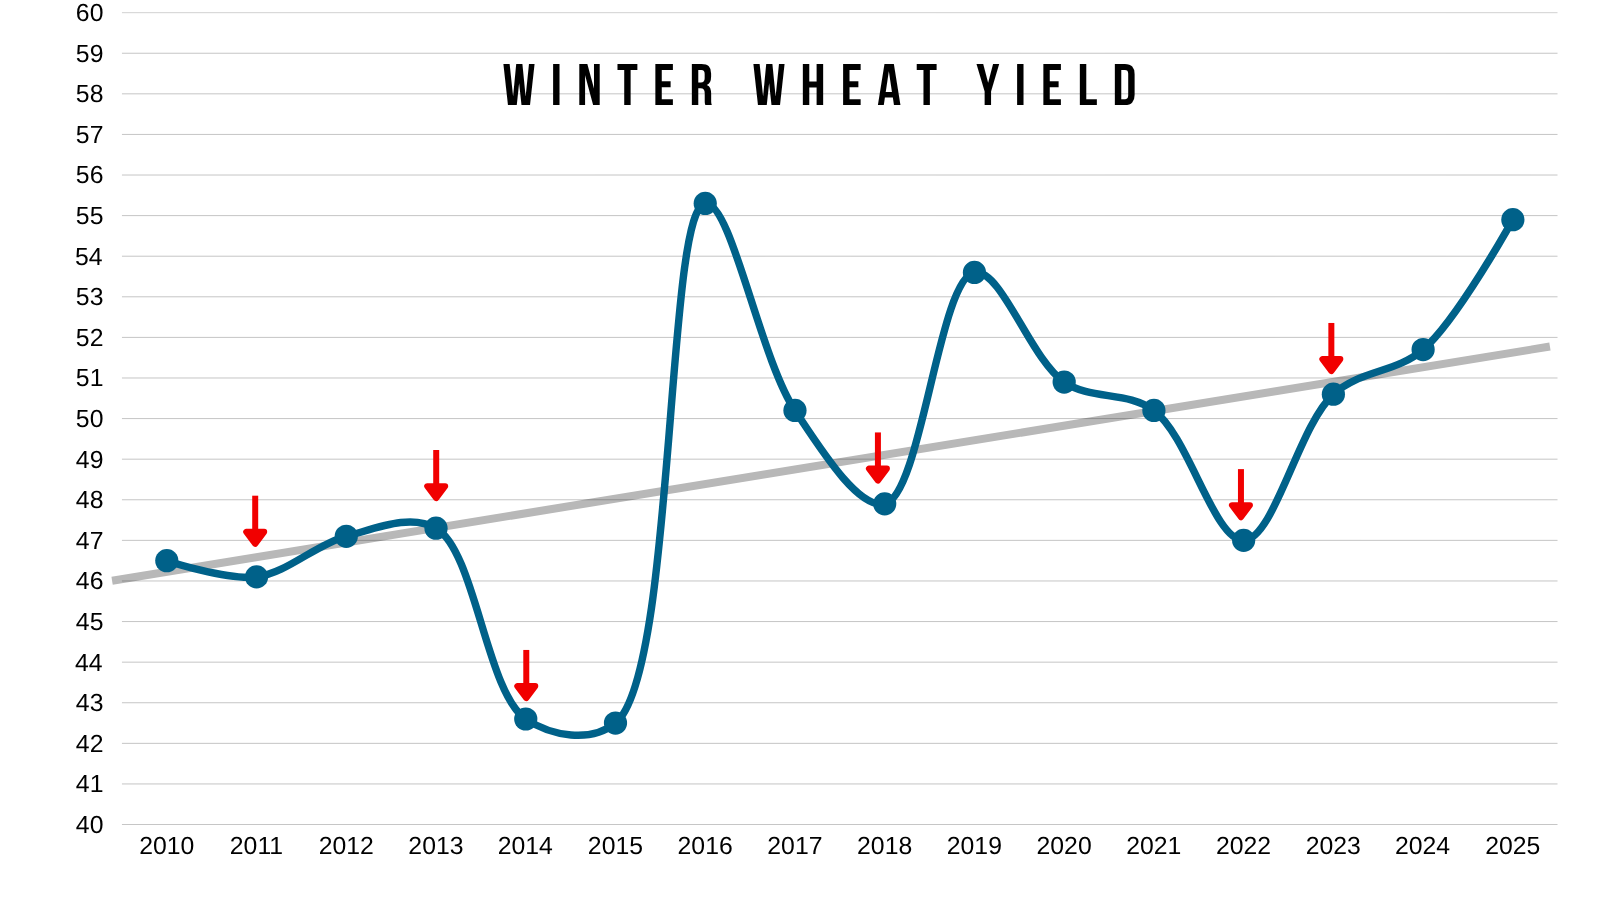
Well for starters, a national crop rating that low alone would suggest some poor yields.
Here is how yield deviated from trend amongst those years where crop conditions where around 35% or lower in mid-April.
Many of them did result in poor yields.
For example look at 2014, 2018, and 2022.
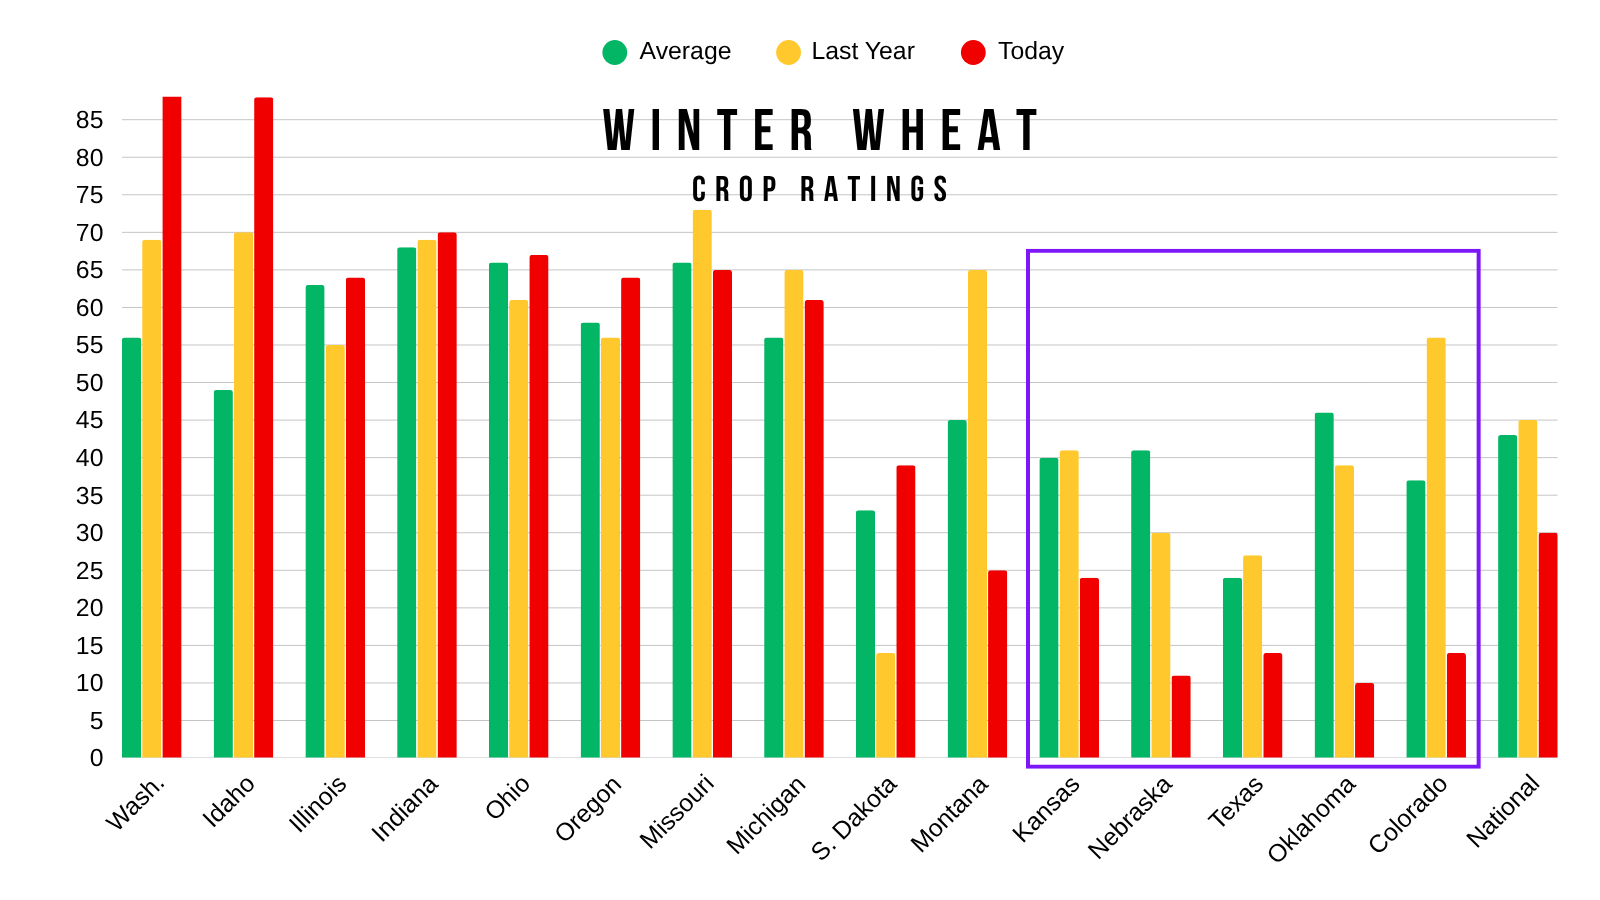
But the data goes deeper than that. As I've talked about before, the data is somewhat flawed when simply looking at the national ratings.
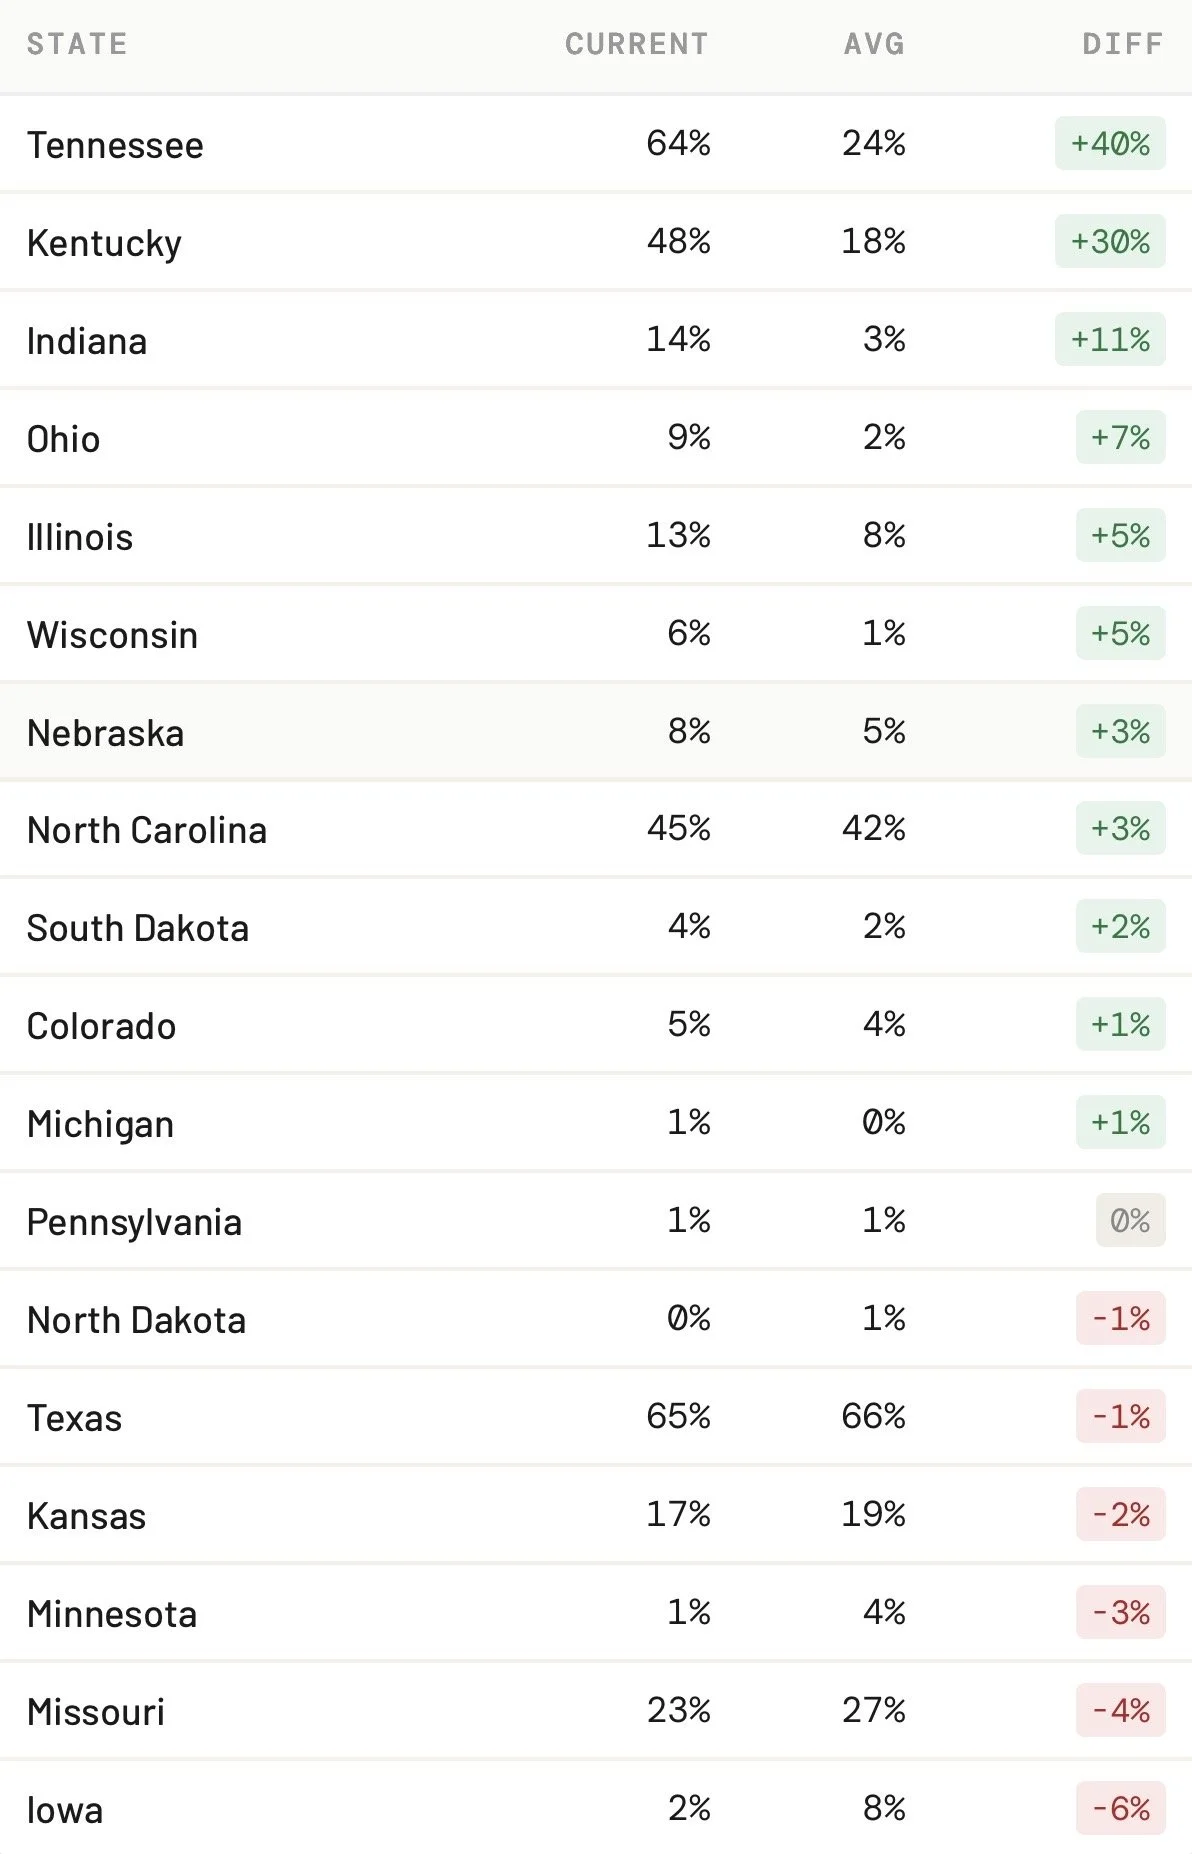
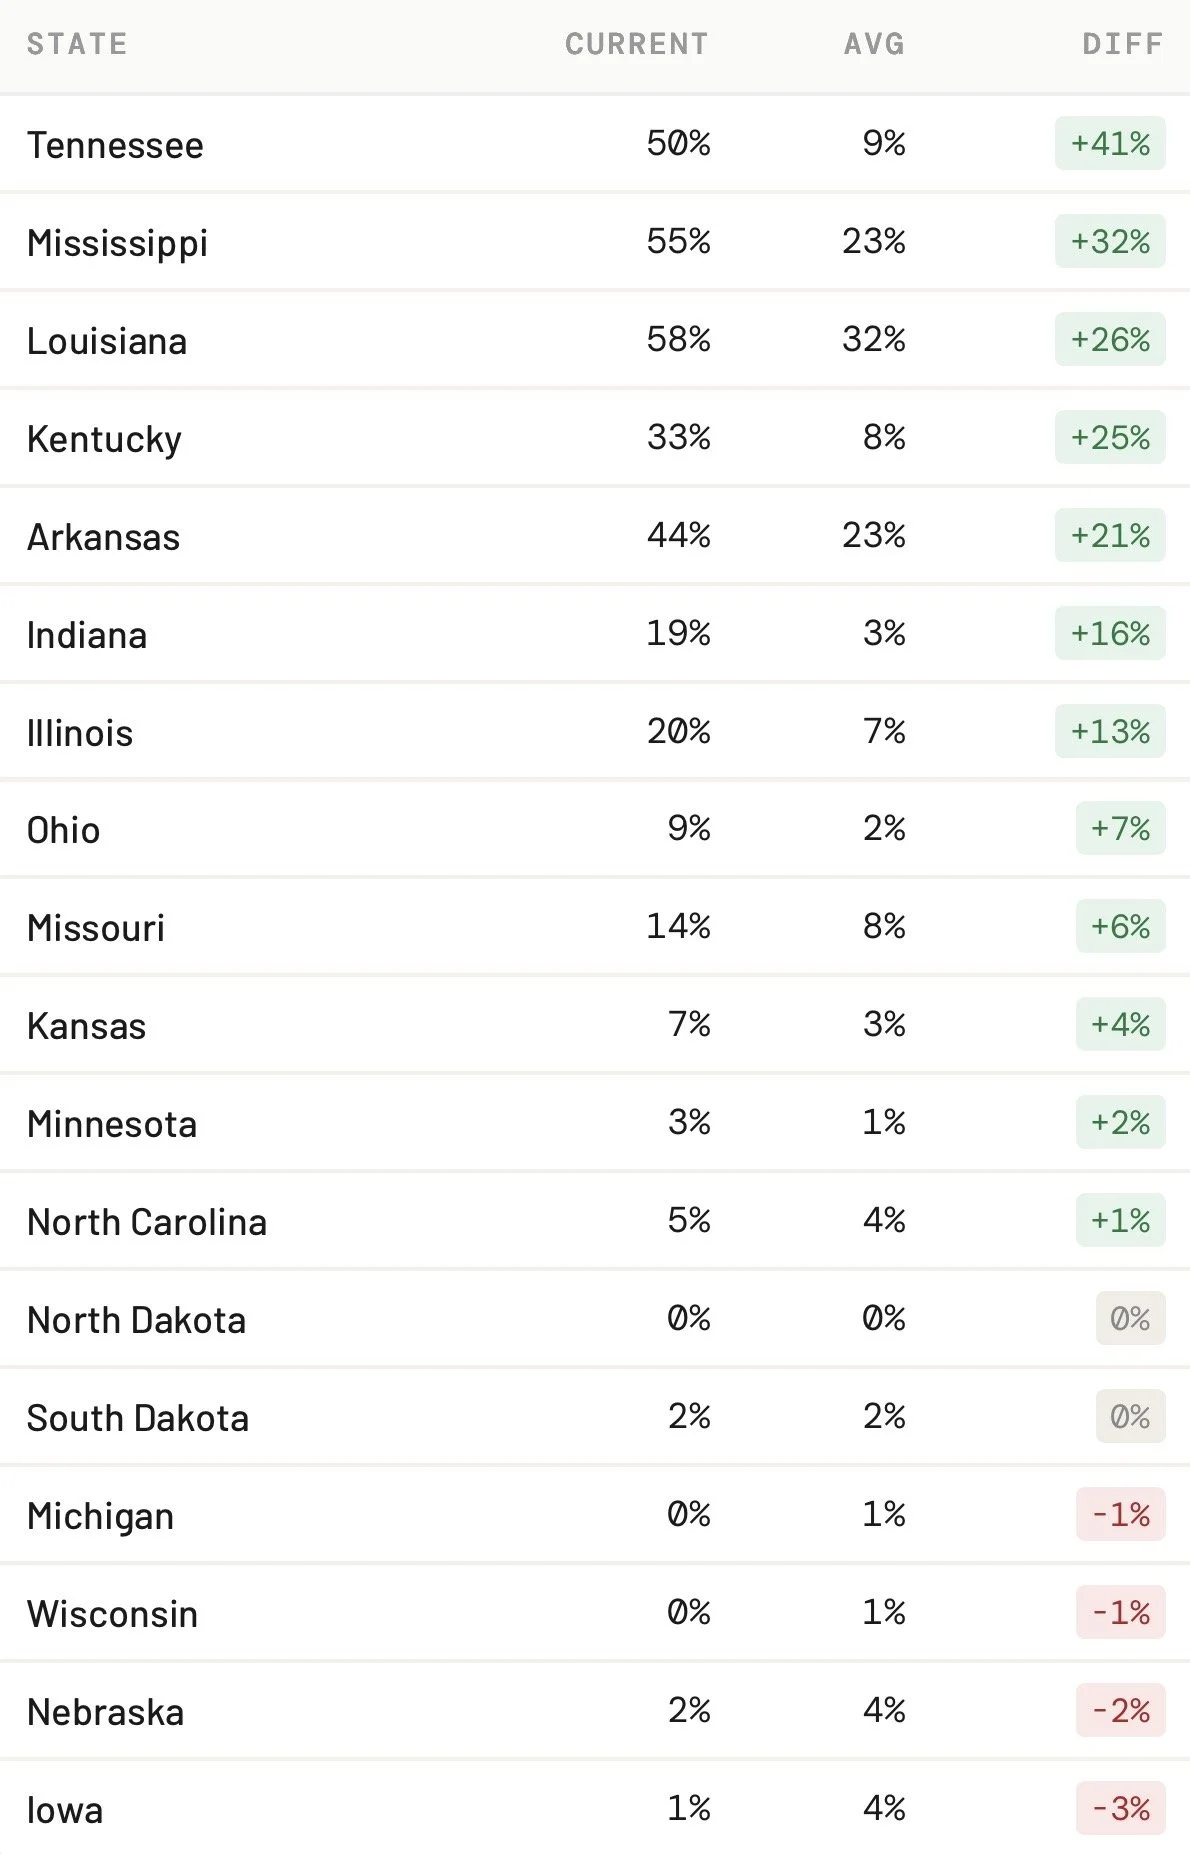
For reference, here is a break down of all winter wheat states and how they stack up vs last year as well as their average rating.
If you notice, states like Washington have phenomenal ratings.
But Washington and most of those states with great ratings grow SRW, not HRW wheat.
The plains and areas that grow HRW are clearly sitting well below average.
So the data is flawed due to the SRW areas propping up the ratings when trying to examine how the HRW crop is holding up.
The ones in the highlighted box are the top five HRW growers.
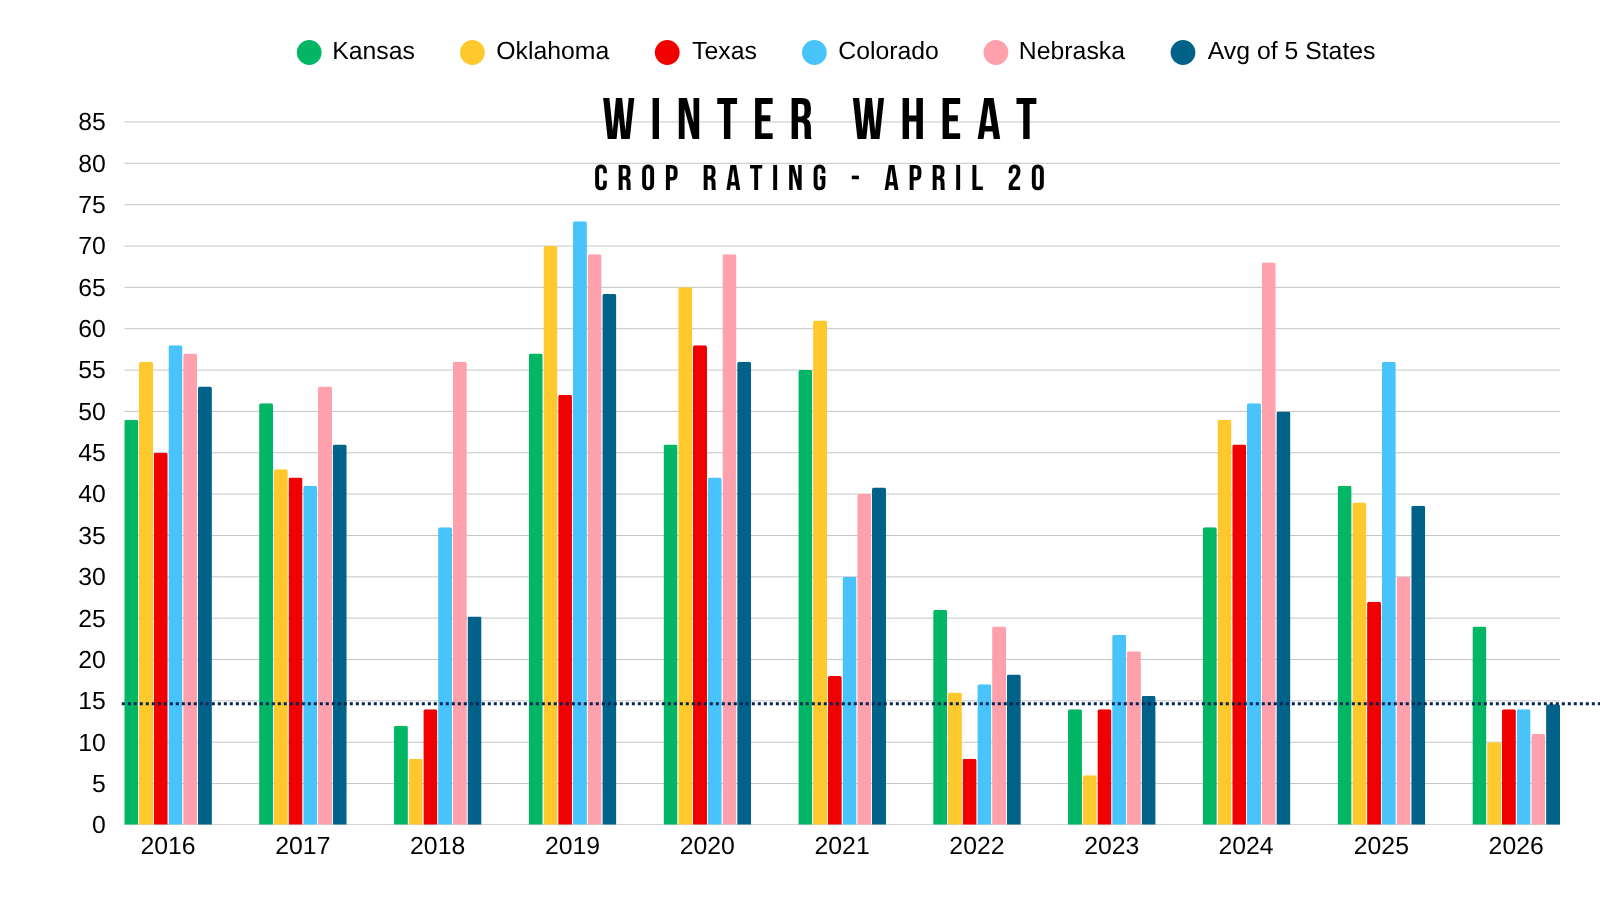
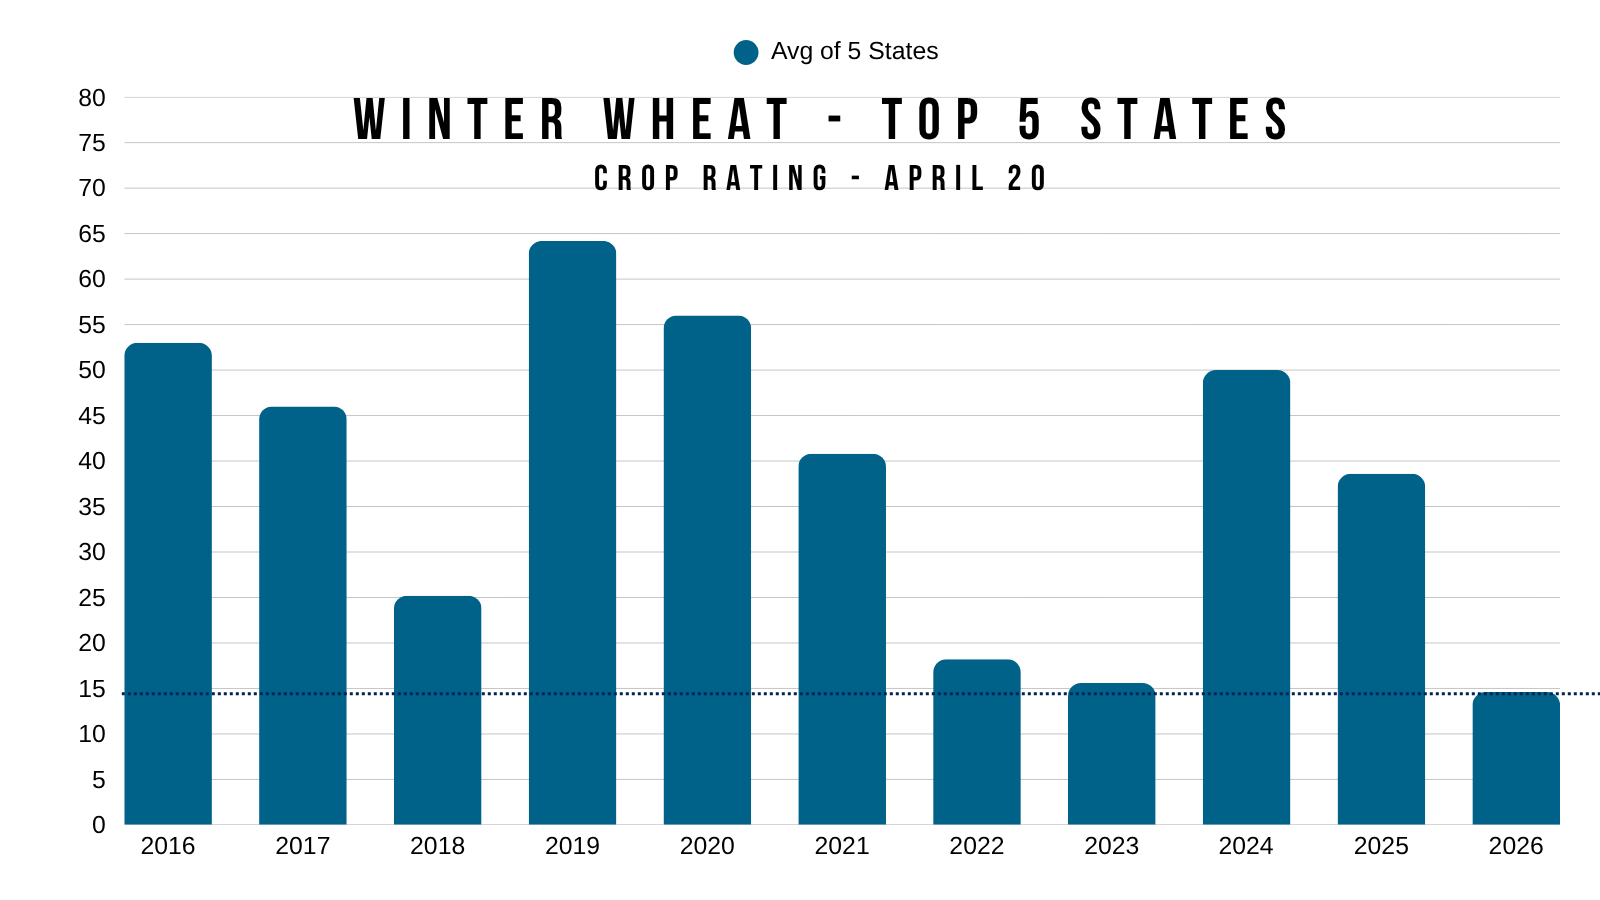
Here is another way to look at it.
This is an updated chart that I showed the other week.
This one compares the top five HRW growers ratings over the last decade. As well as their cumulative average for each year.
Most of them are sitting at their lowest ratings of the last decade.
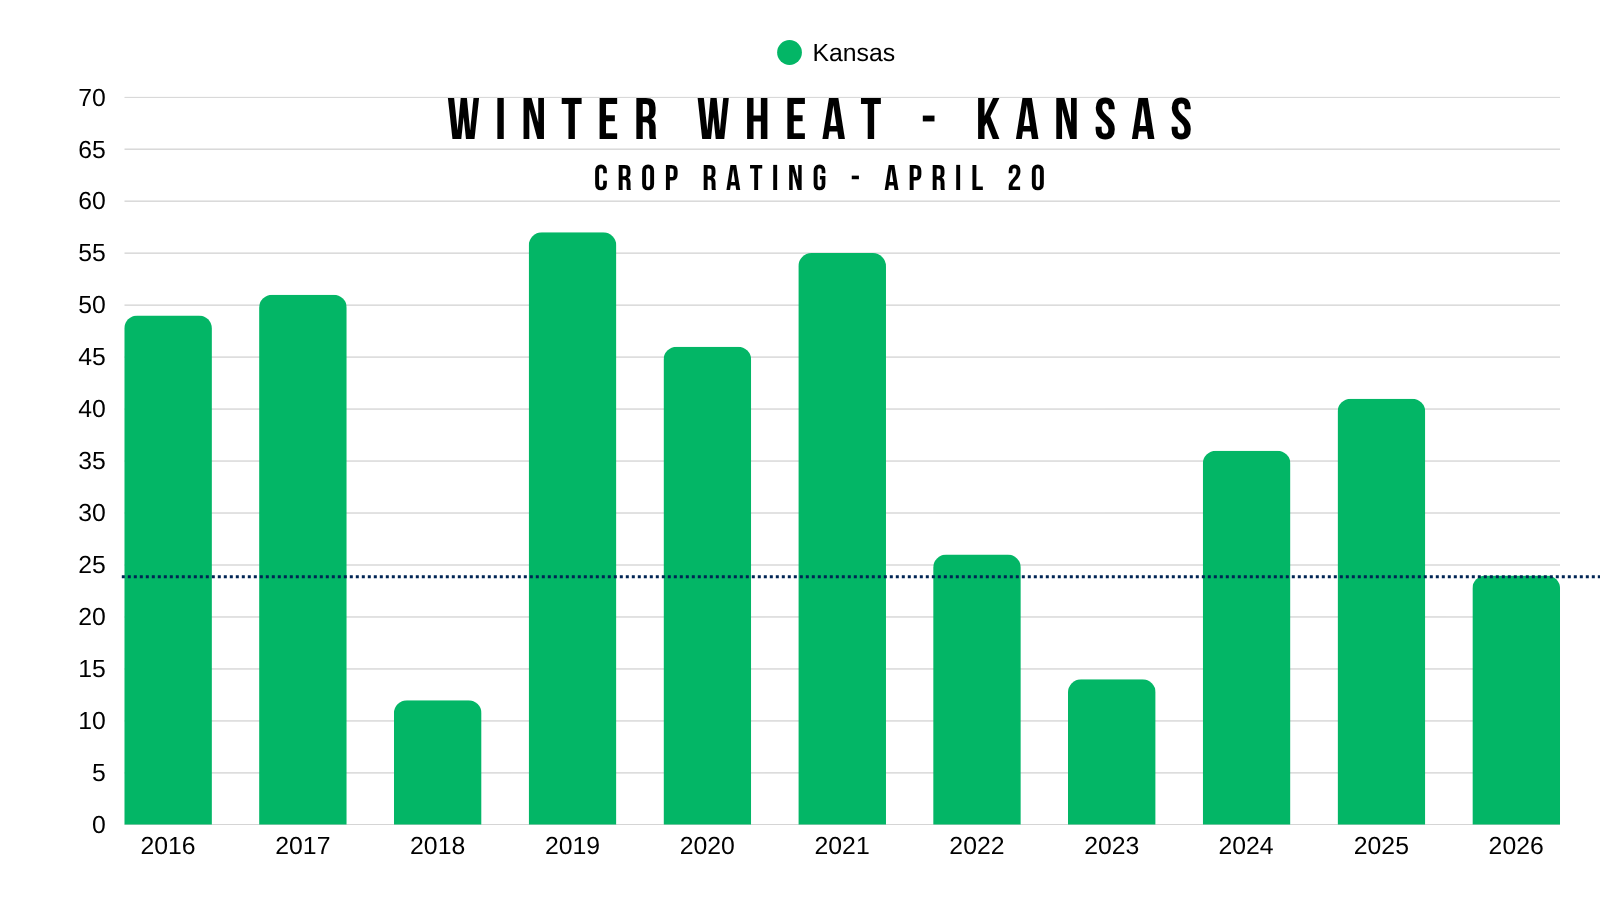
Here is a quick state by state breakdown.
First for Kansas who accounts for around 40% of the total crop.
They sit at 24% G/E.
That is the 3rd worst of the last decade.
Only trailing 2018 and 2023.
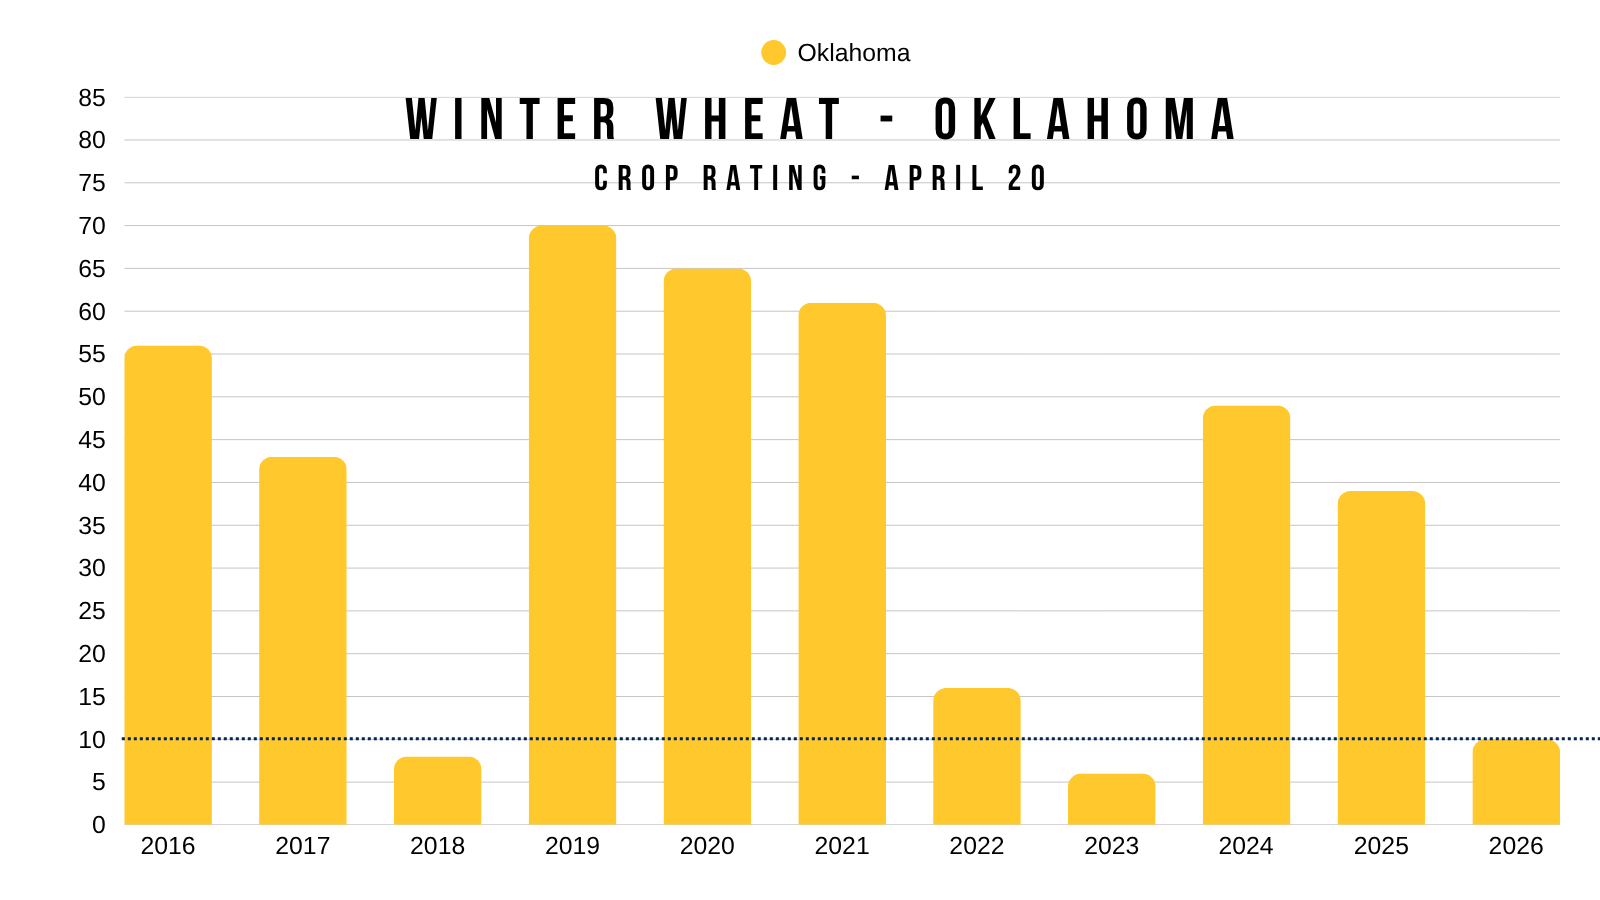
Next Oklahoma.
10% G/E.
Also the 3rd worst of the last decade only behind 2018 and 2023.
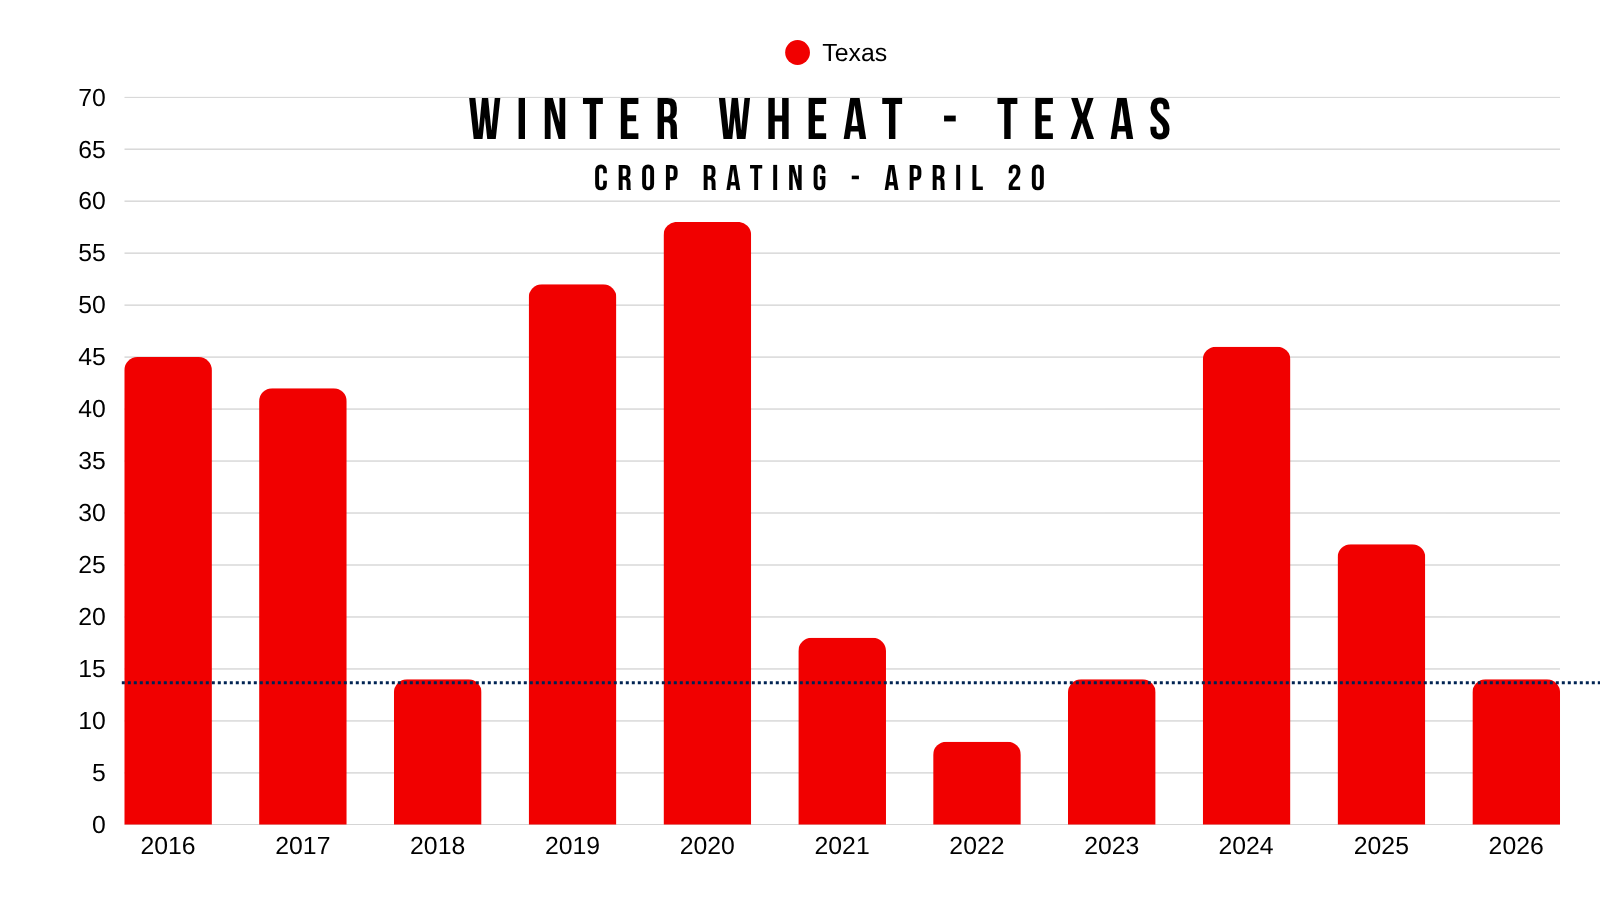
Next Texas.
14% G/E.
Tied for their 2nd worst of the last decade.
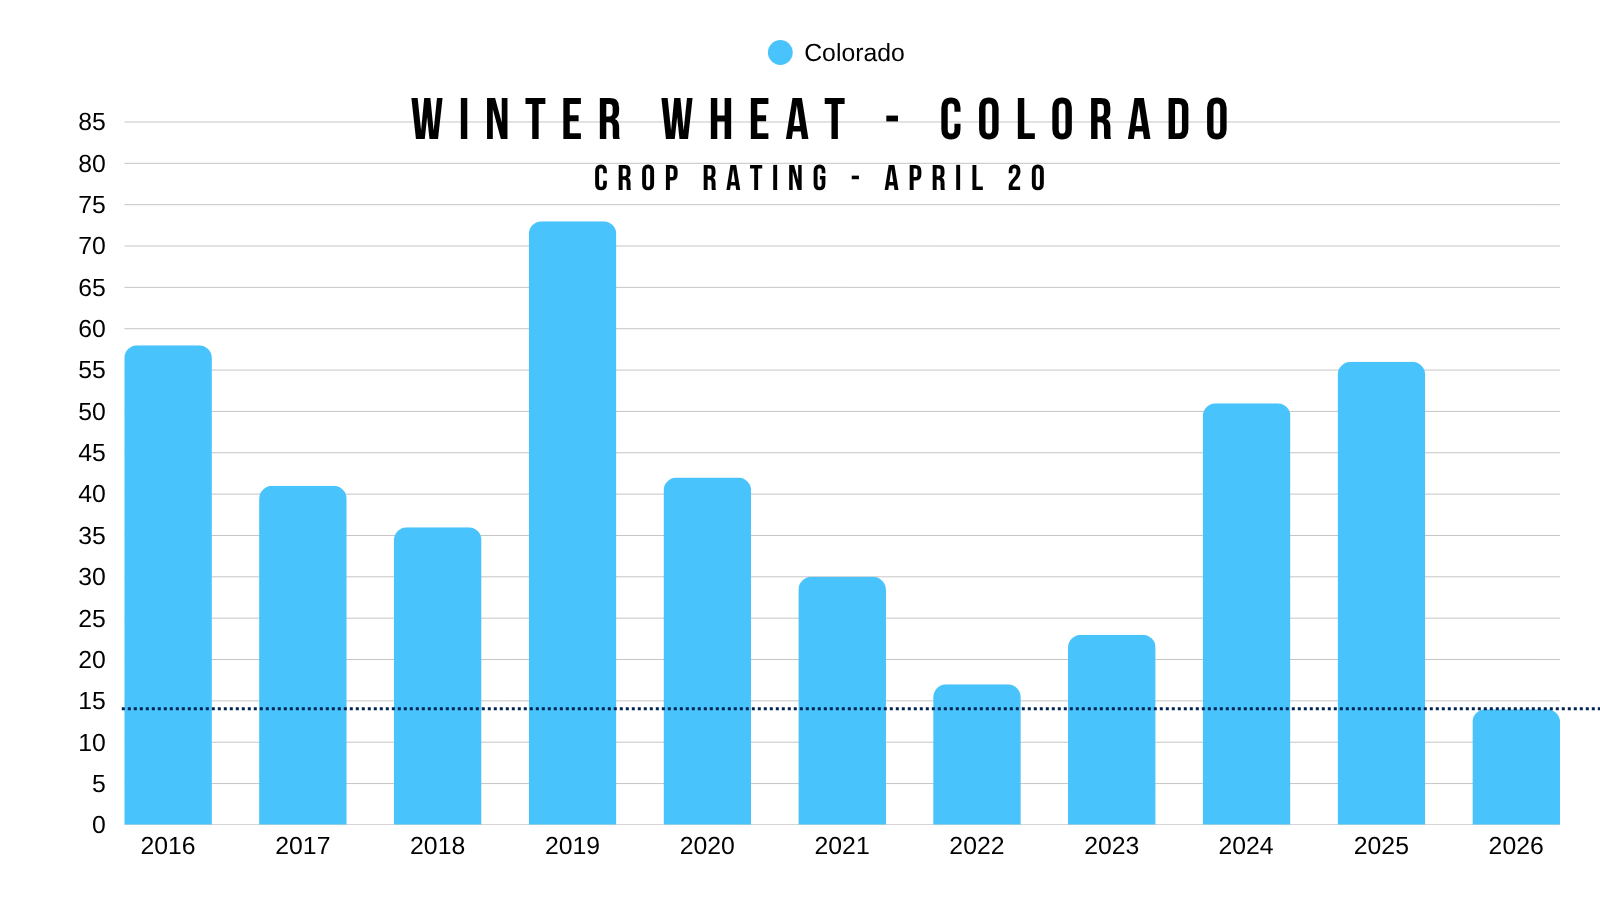
Next Colorado.
14% G/E.
Would be their worst of the last decade.
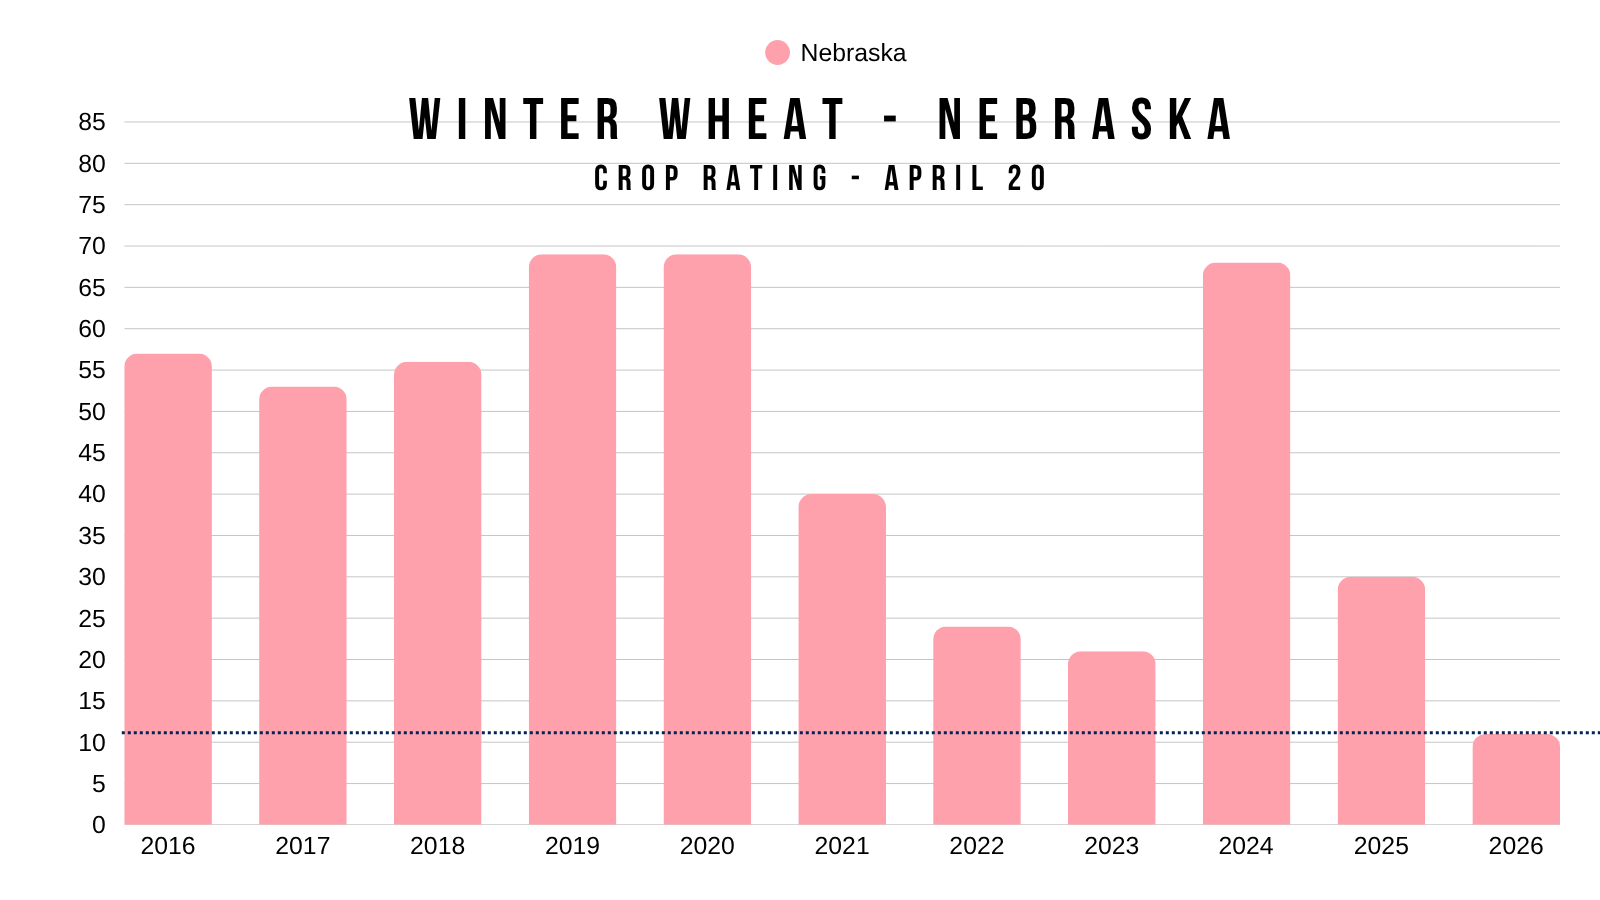
Next Nebraska.
11% G/E.
Would also be their worst of the last decade.
Lastly, what if you take the average rating of these top 5 states?
It would be the worst in at least the last decade.
Sitting at 14.5% G/E.
So it's seems like there is absolutely some problems with this winter wheat crop.
Something to note is that these ratings were done before the potential freeze event. So there is the possibility that they drop even further.
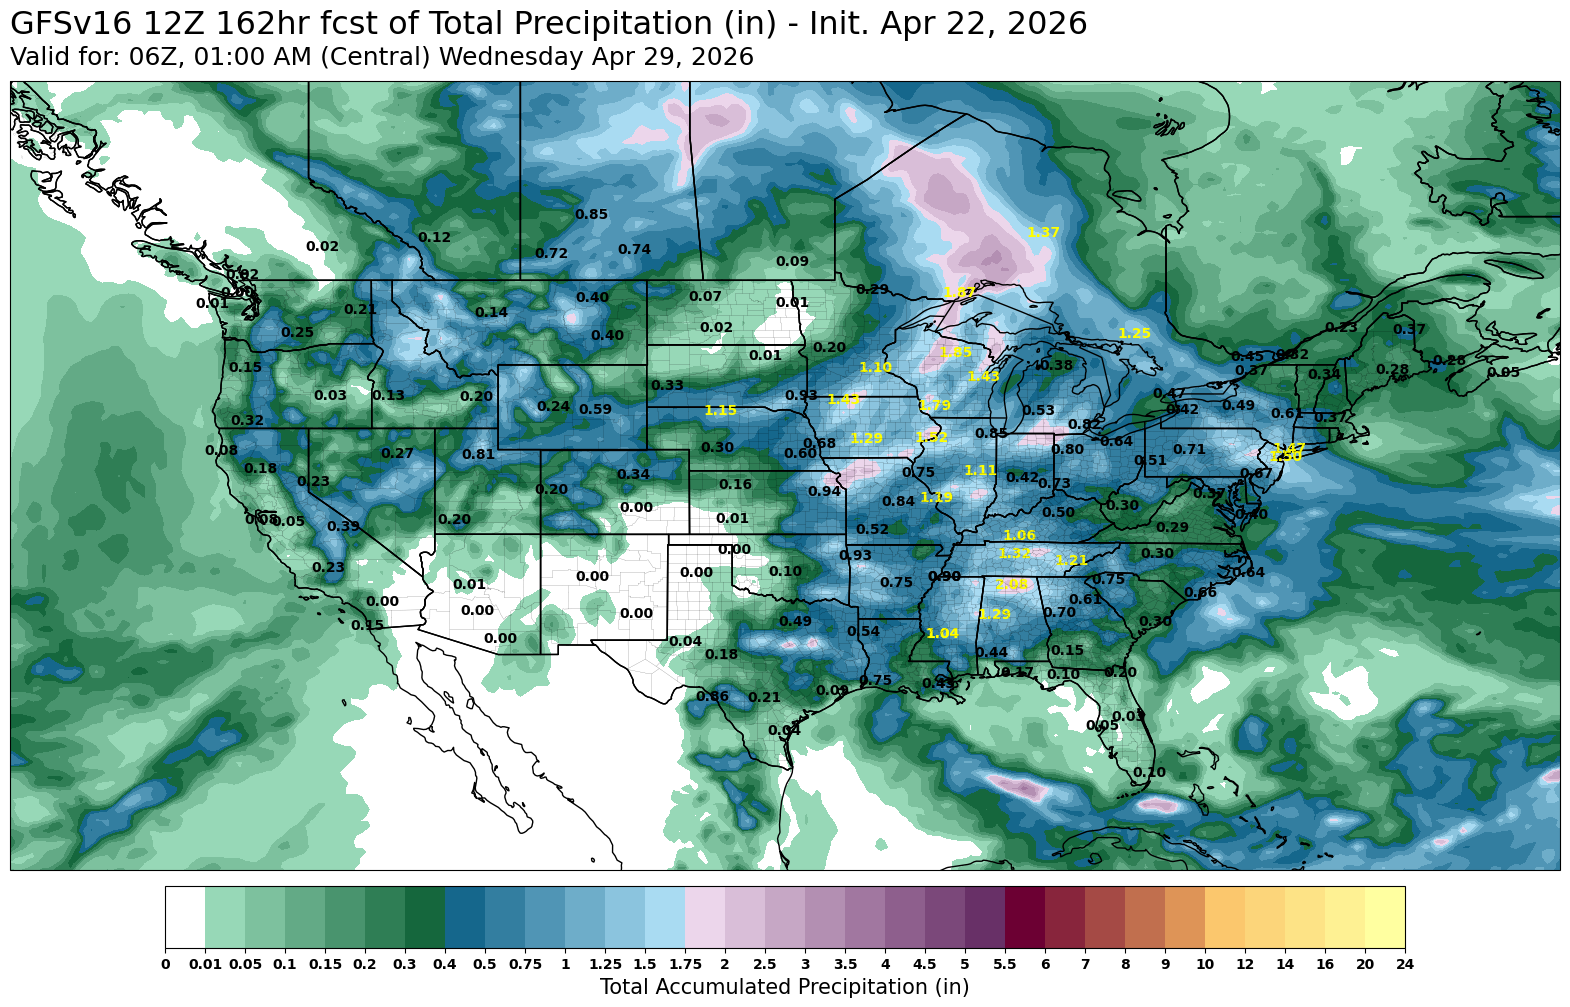
Looking at the forecasts, the next 7 days doesn’t look like it's going to offer a whole ton of relief for that key region that has continued to miss out.
It seems like they continue to throw rain into the long term forecasts only for it to miss out and remain too far east.
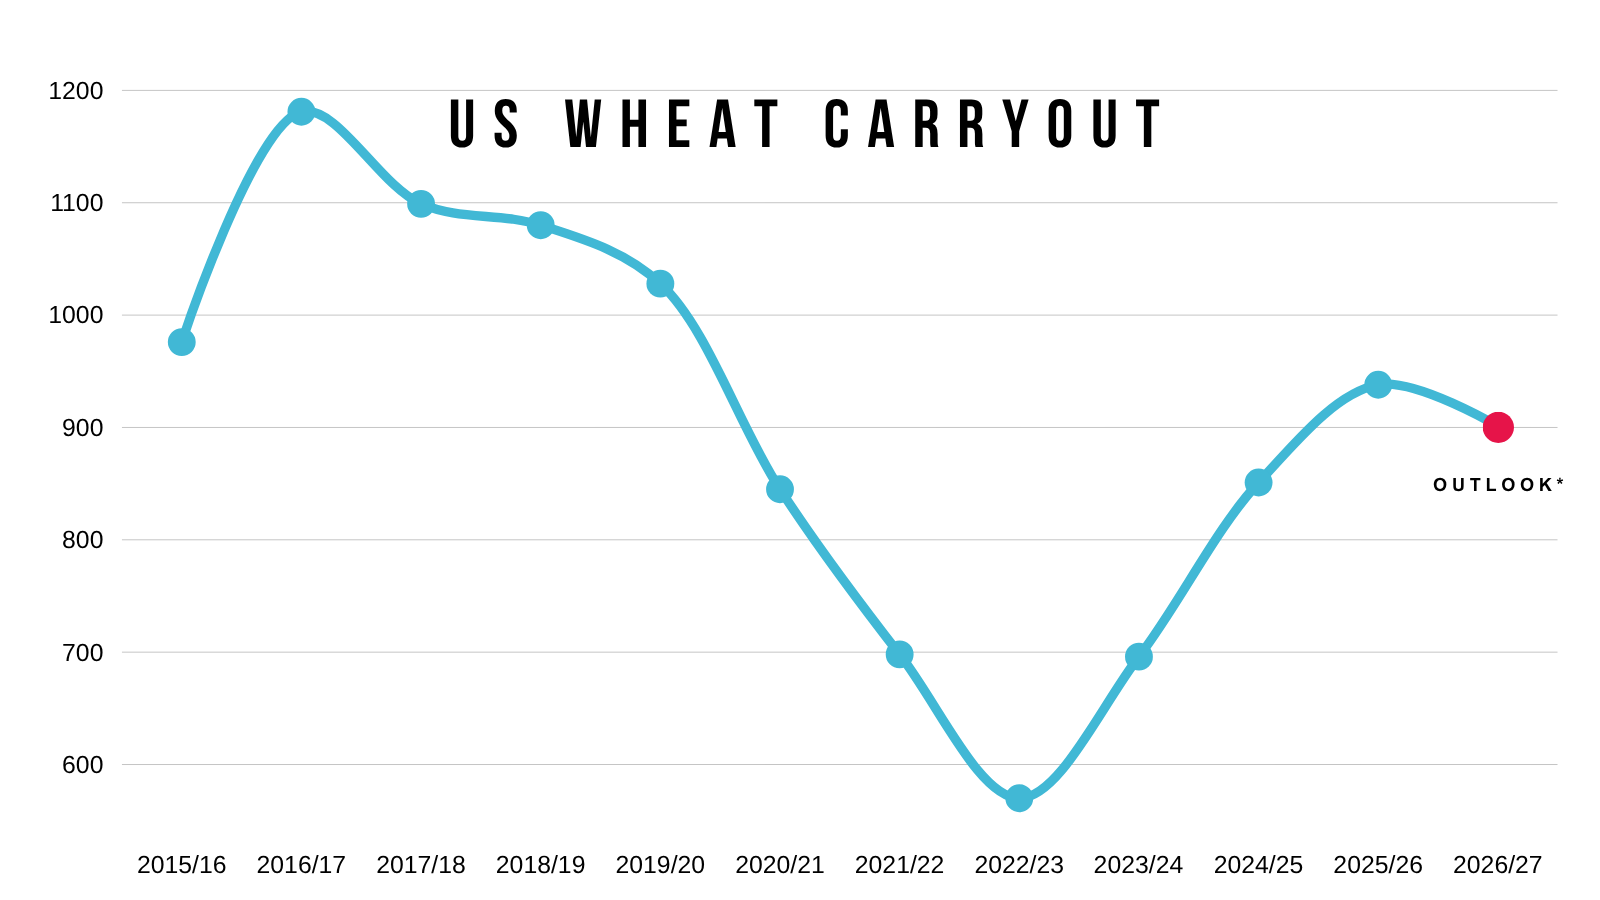
Now no, currently the US balance sheet isn’t considered wildly friendly.
The US balance sheet is projected to get a little tighter vs last year but is still one of the looser ones over the last few years.
But when you have ratings this low.
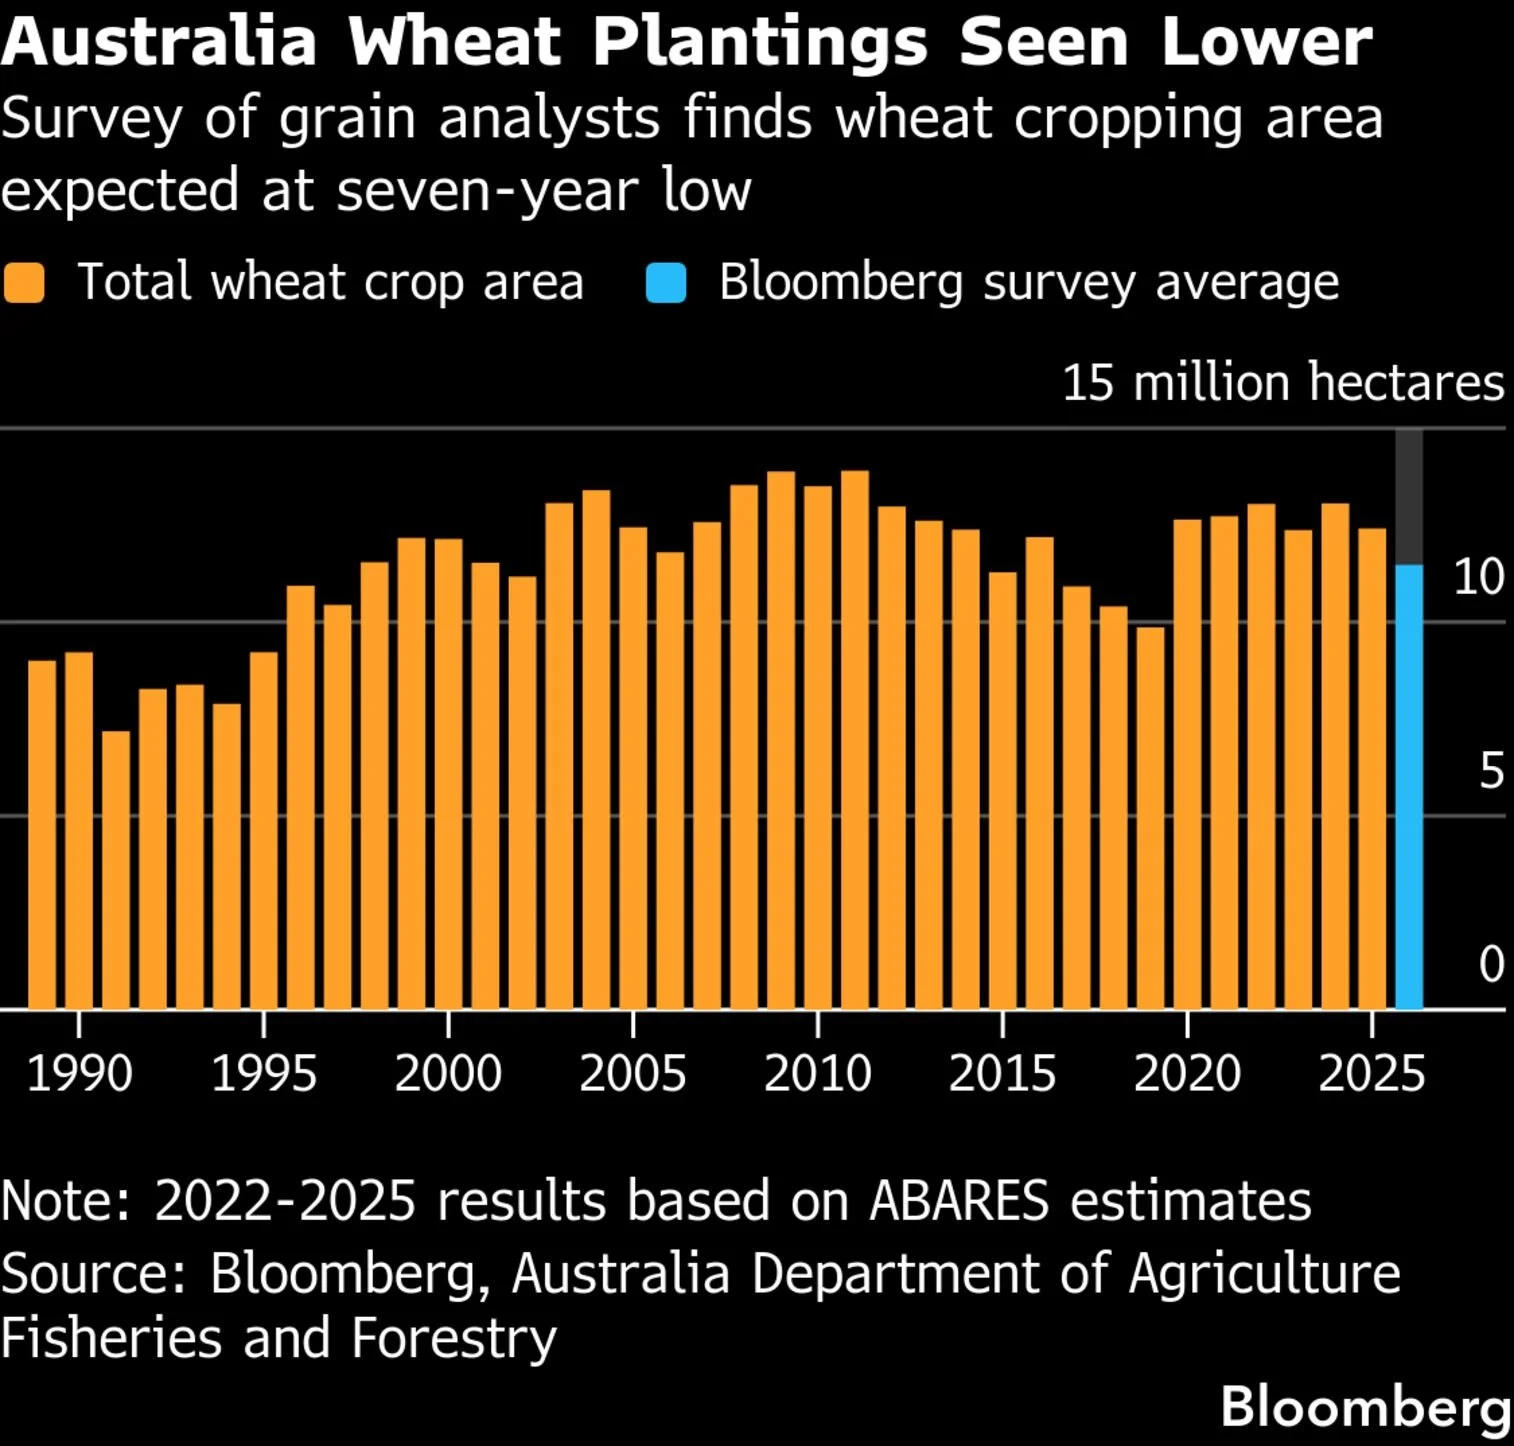
Along with the whole fertilizer situation that could impact growers across the world, such as Australia.
With analysts already calling for 7-year lows in Australia wheat plantings.
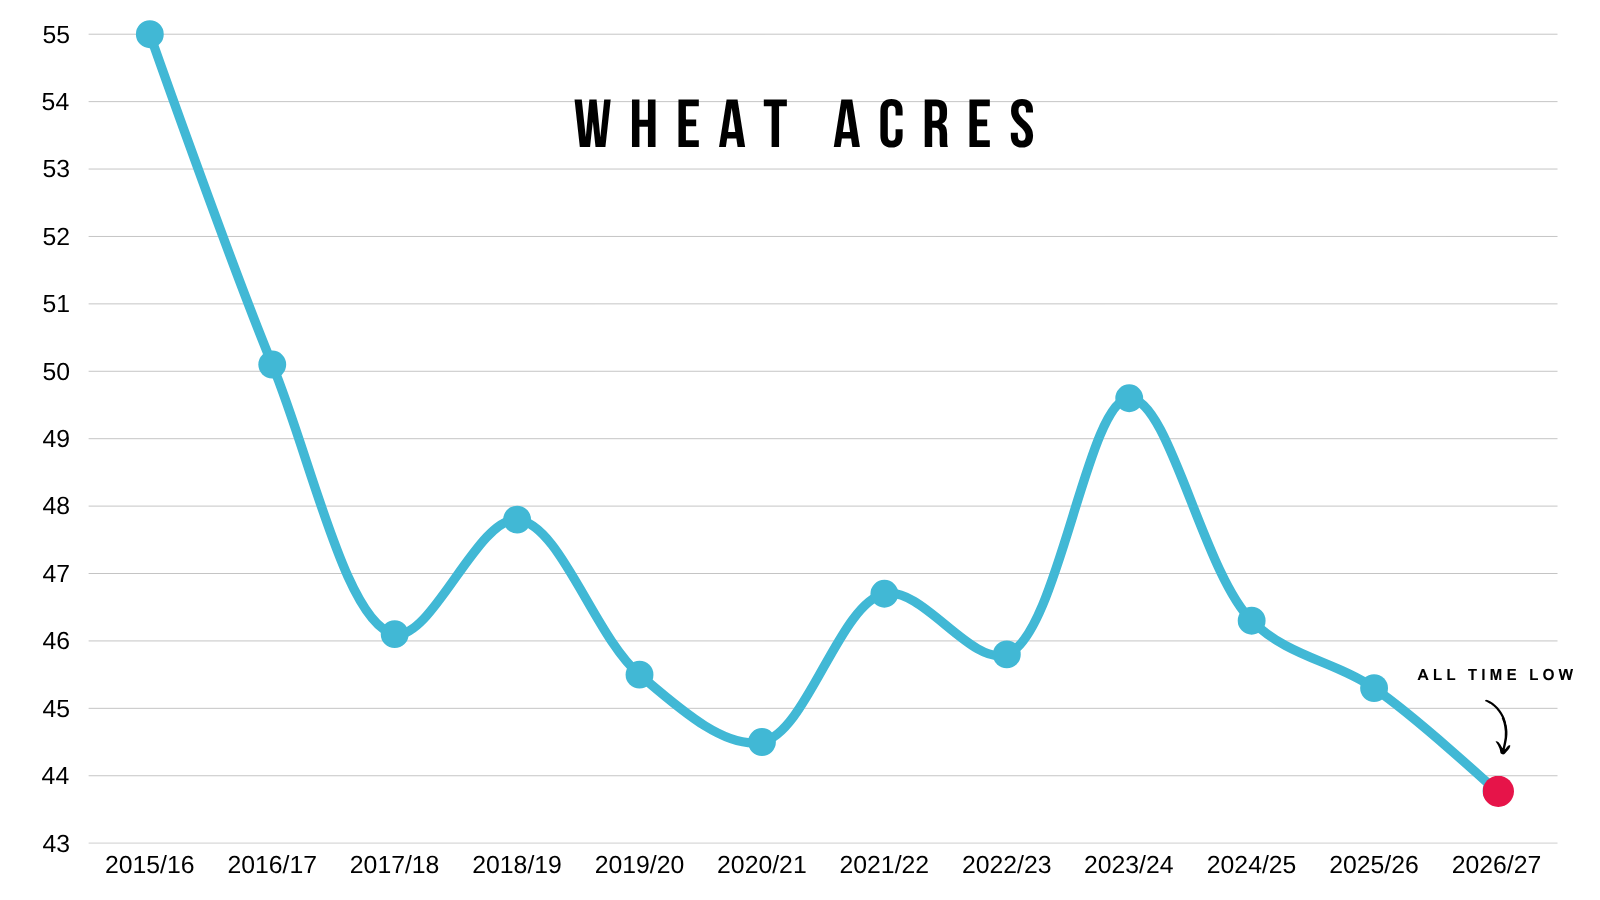
Not to mention US wheat acres are projected to at an all-time low.
Given all of this, I'd argue that yes, there is still definitely a possibility for this wheat market to have a compelling story.
Especially when you are looking long term.
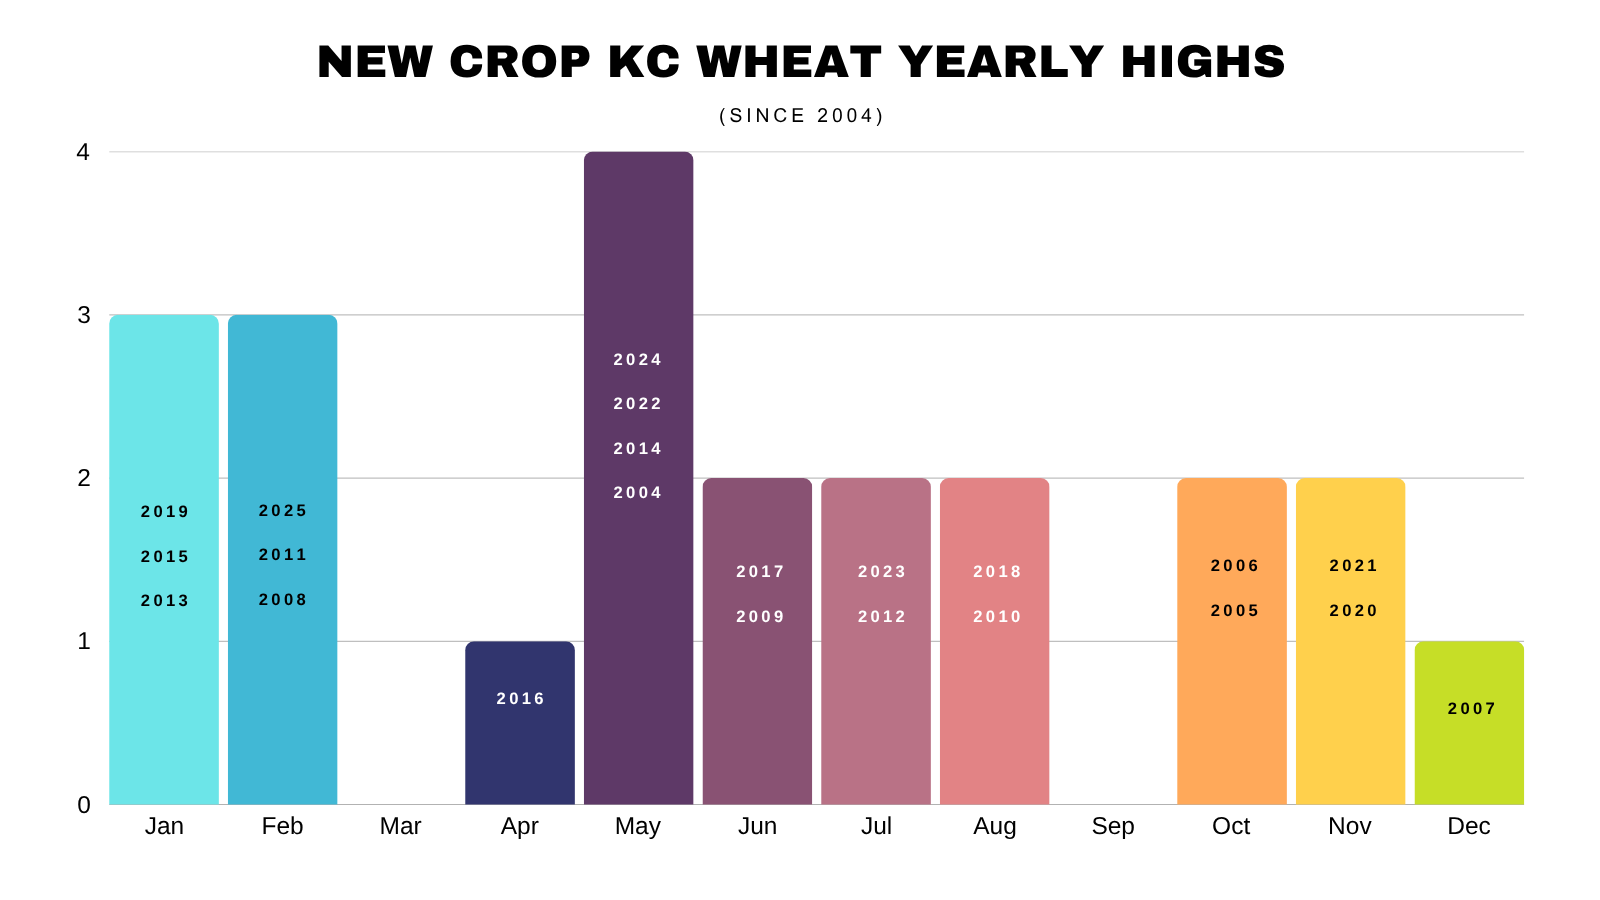
Seasonal Highs?
Wheat doesn’t have as clear window of opportunity as corn and soybeans do.
However, for new crop KC wheat, March and April are two of the months where we've posted our highest price of the year the least.
It's never happened in March.
It's happened in April only once, back in 2014.
May is the leader, although the data is pretty spread out and can happen at any point in the year historically.
July KC Chart:
Still battling resistance.
Testing this level for the 3rd time now.
It's clearly a big level to break through. If we do, it should open the door higher.
The current rally has so far stalled right at the 61.8% level from contract lows to contract highs.
If you haven’t already rewarded this market, it makes sense to do so sitting at our highest levels in over a year.
If you have, the next target is right around $7.00
That is the next retracement level and 78.6% of the contract highs.
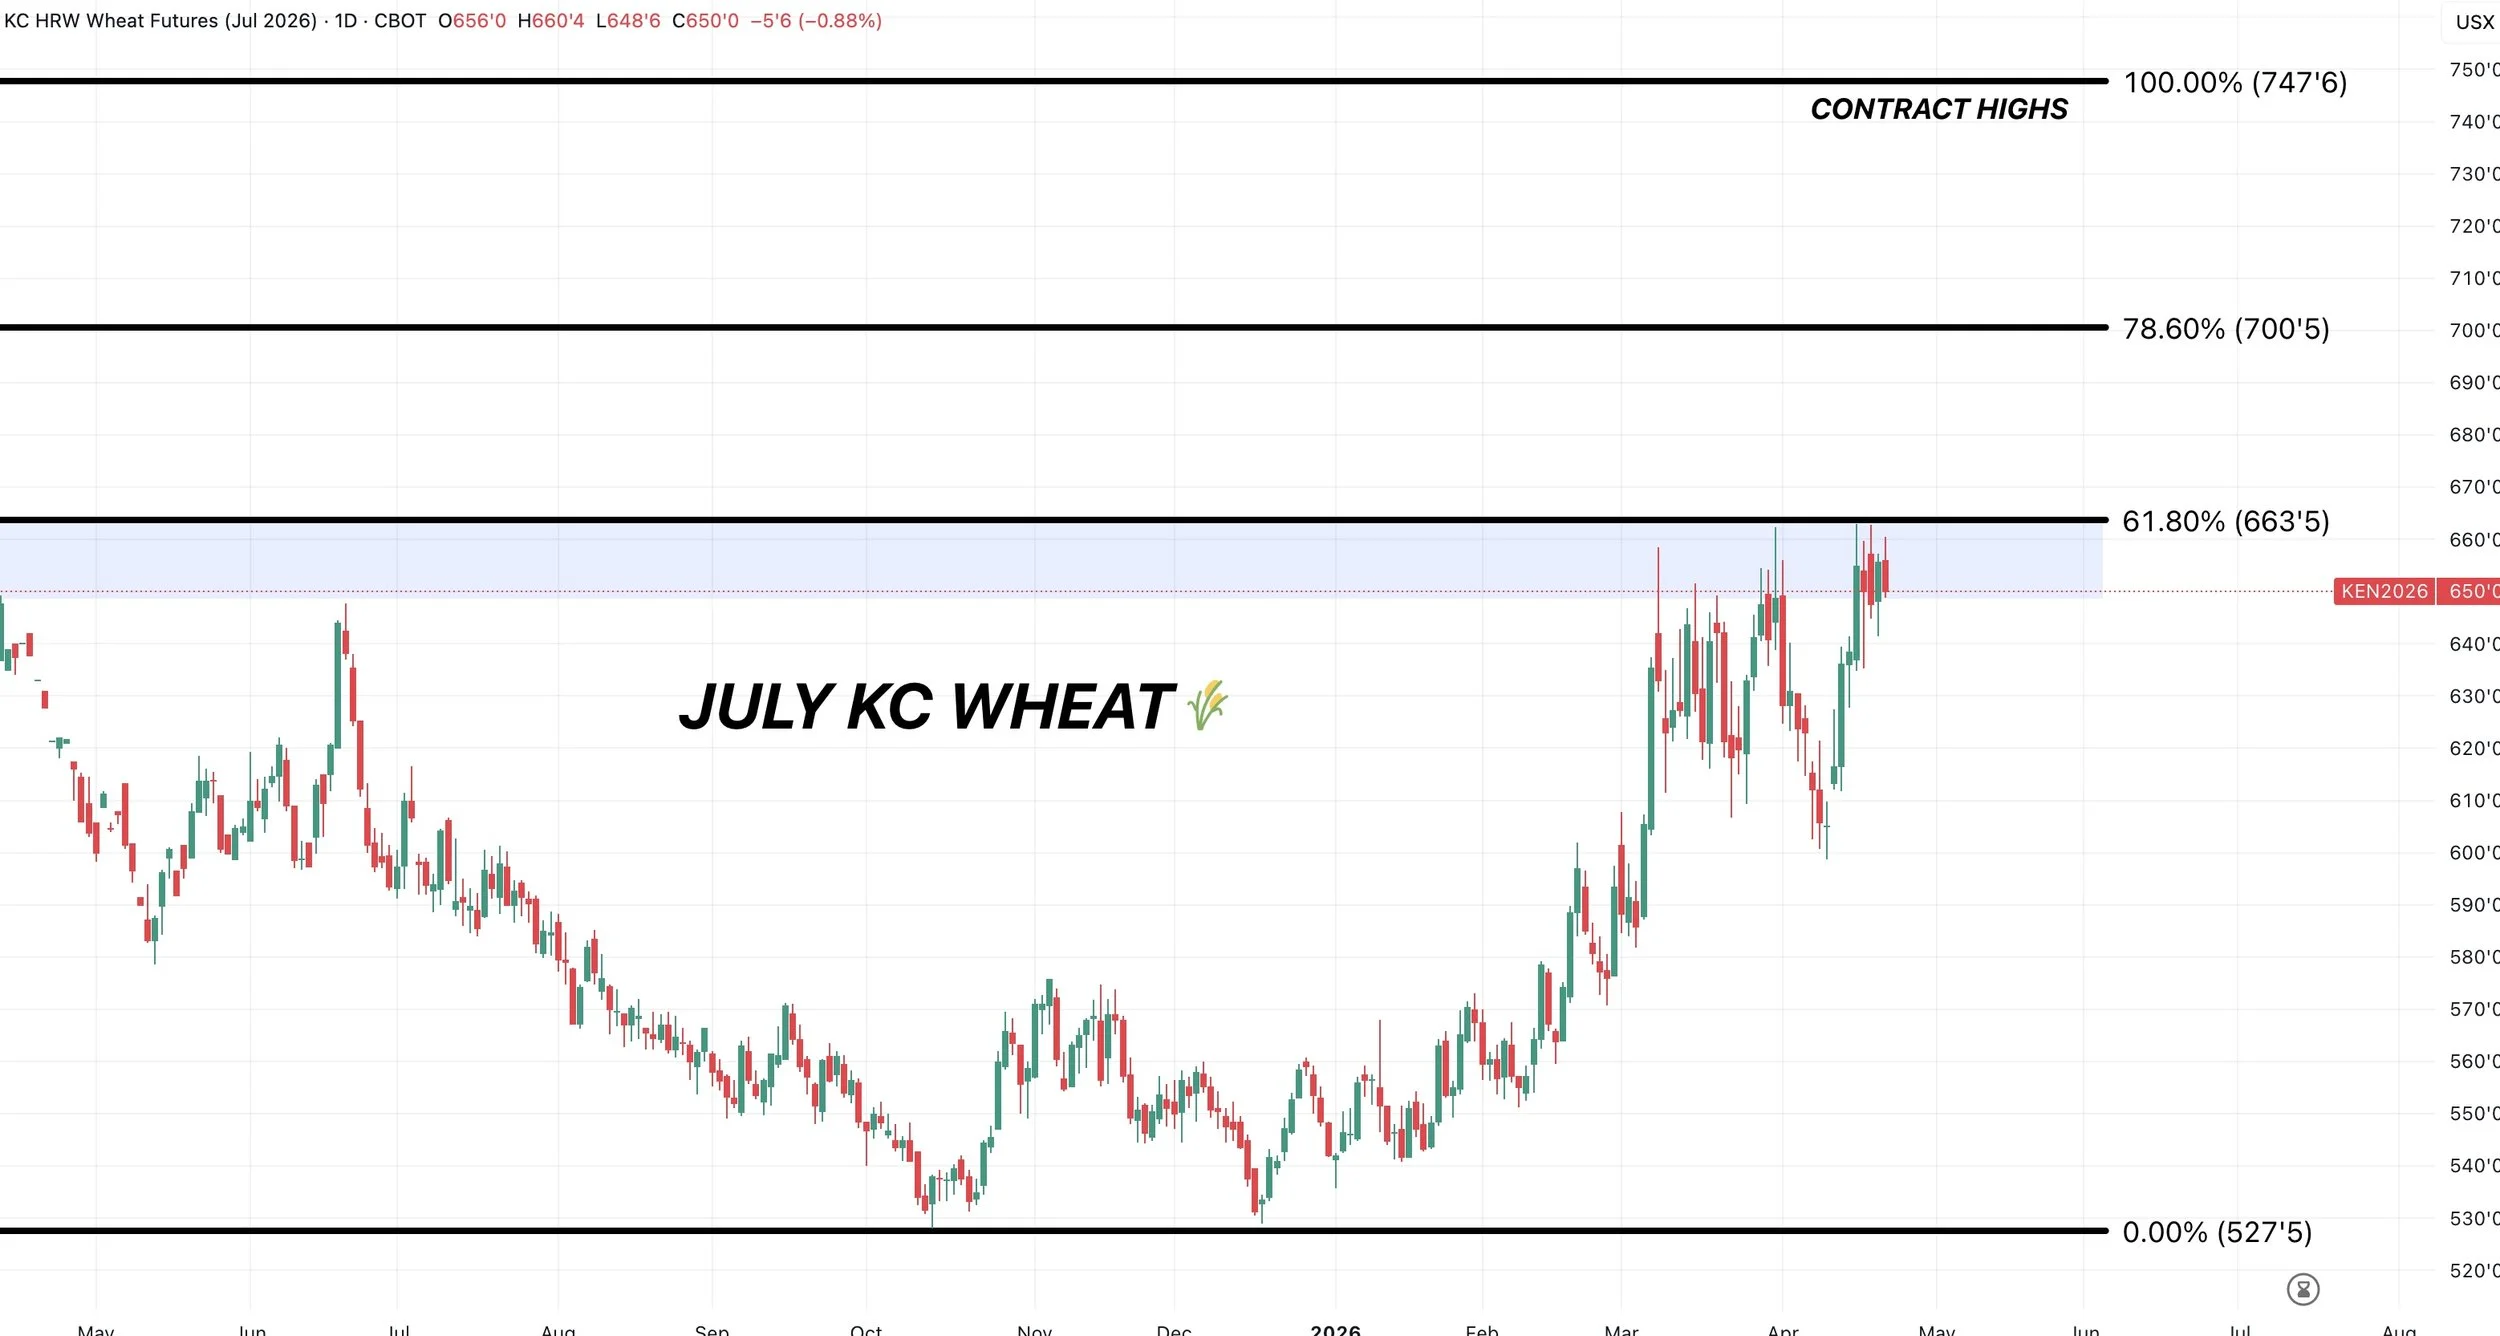
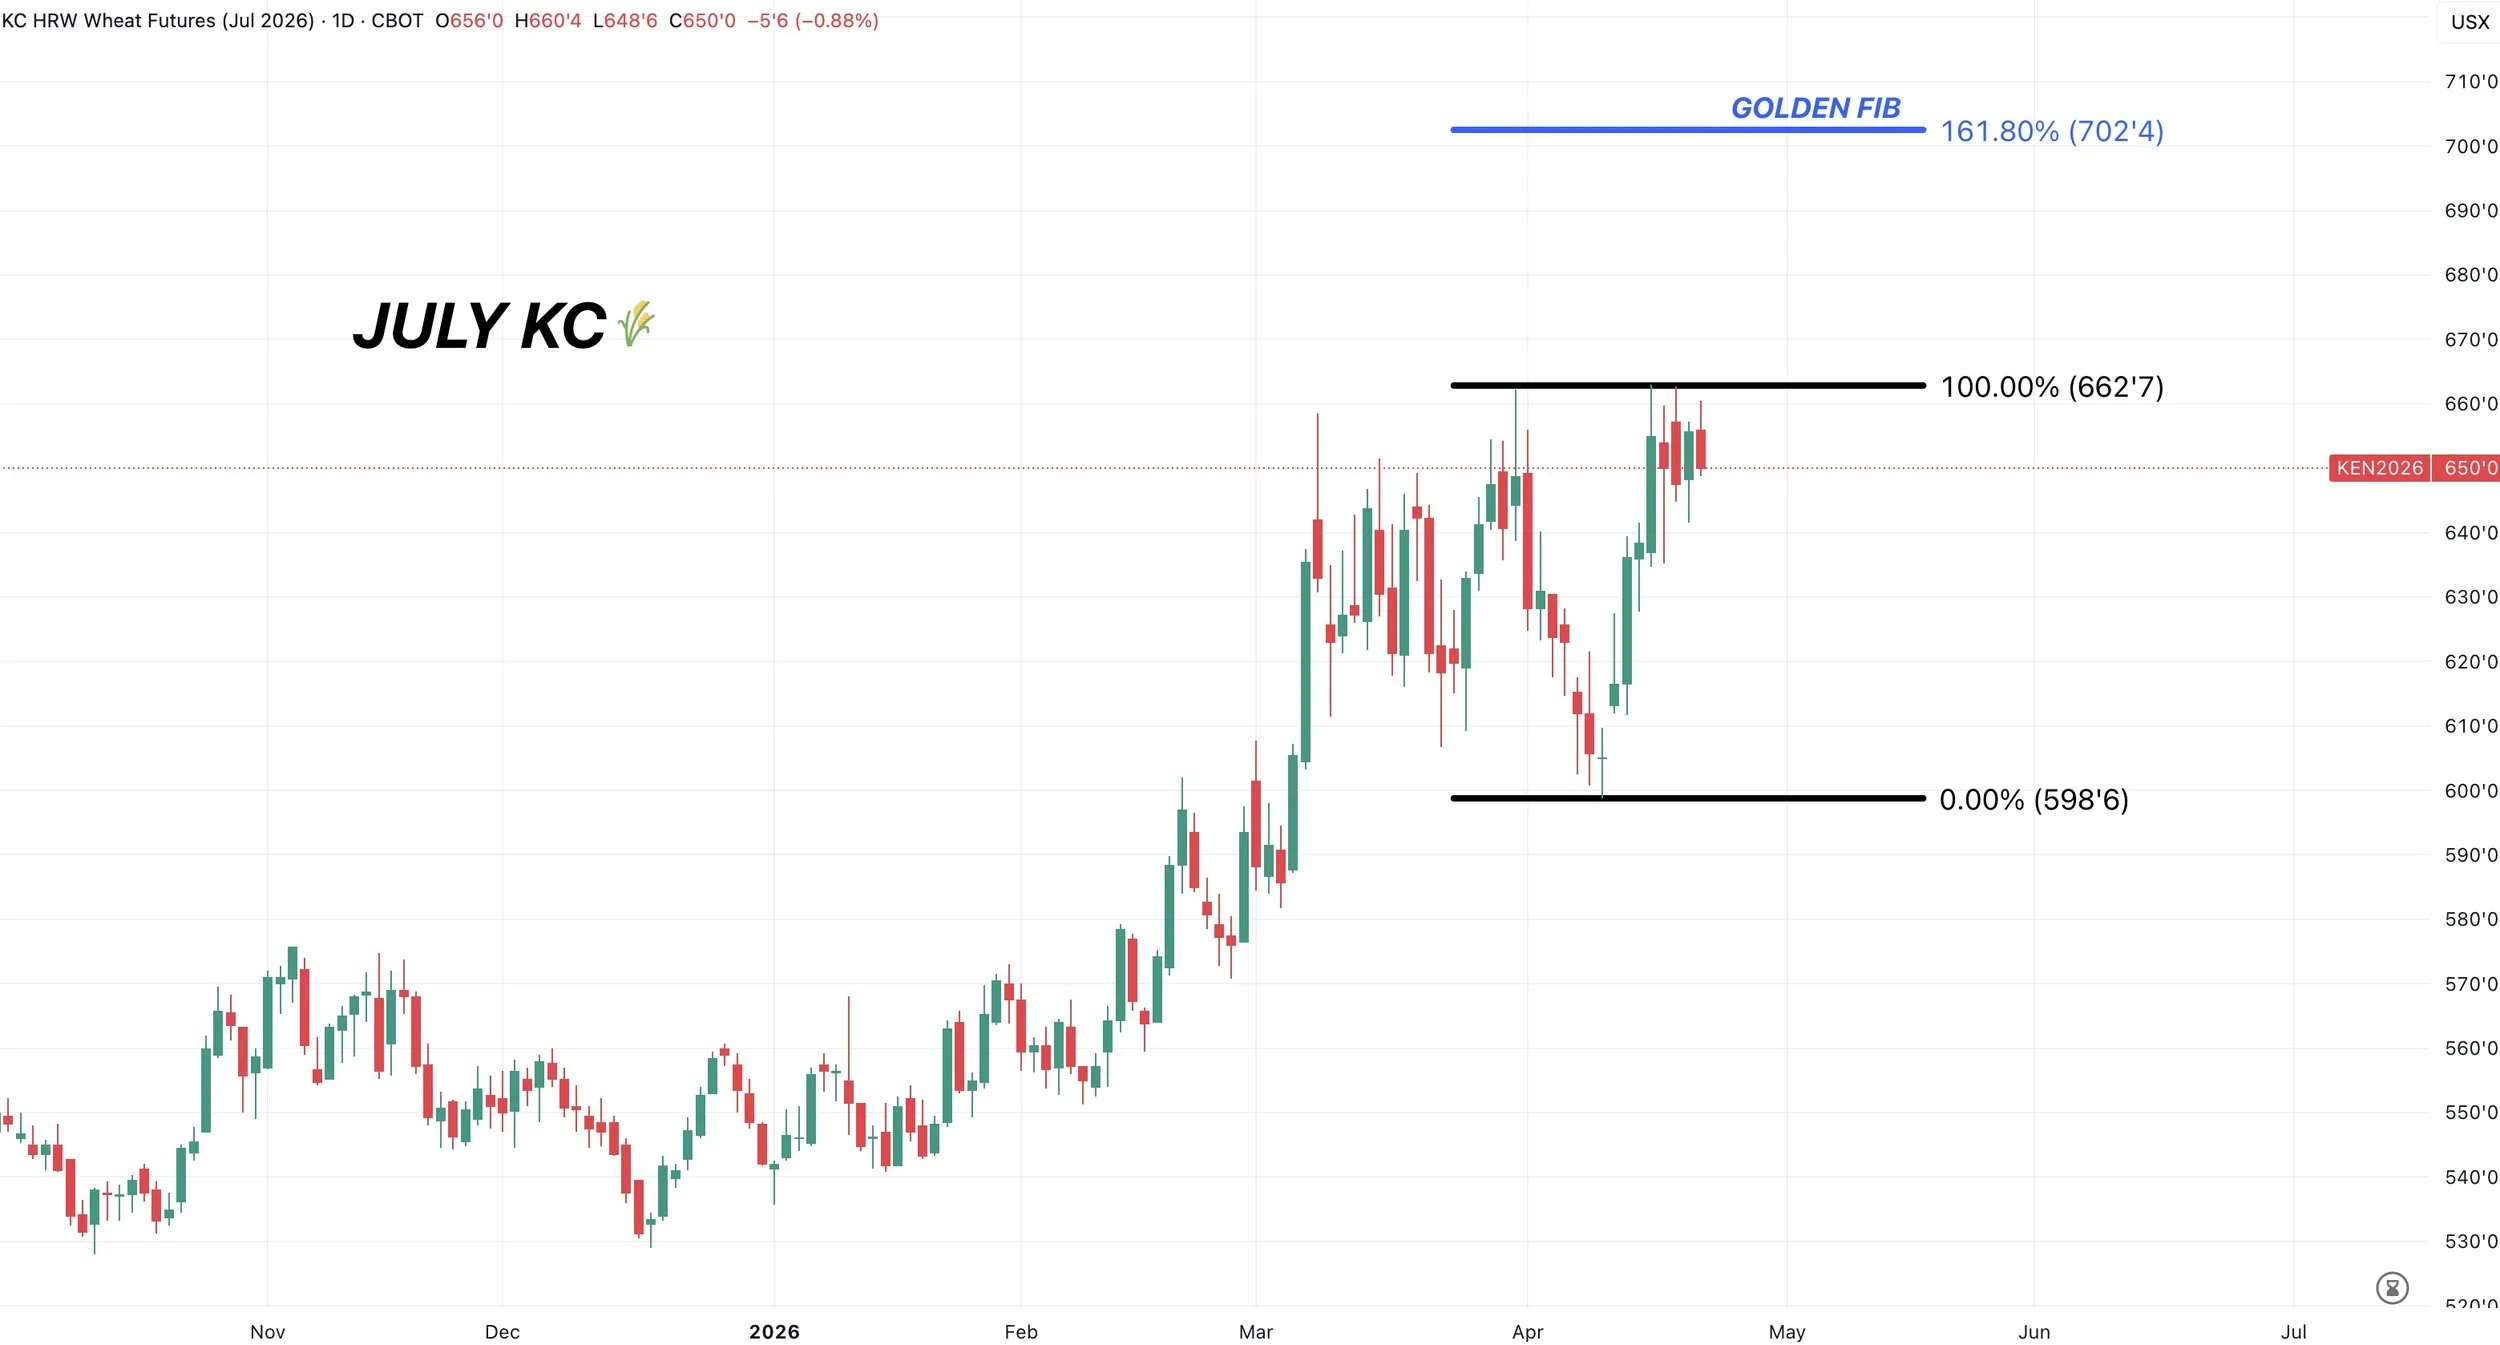
If you do a simple fib extension from the recent lows up to the prior highs, 161.8% of that move also comes in around $7.00
Which is a common area for a continuation rally to pause.
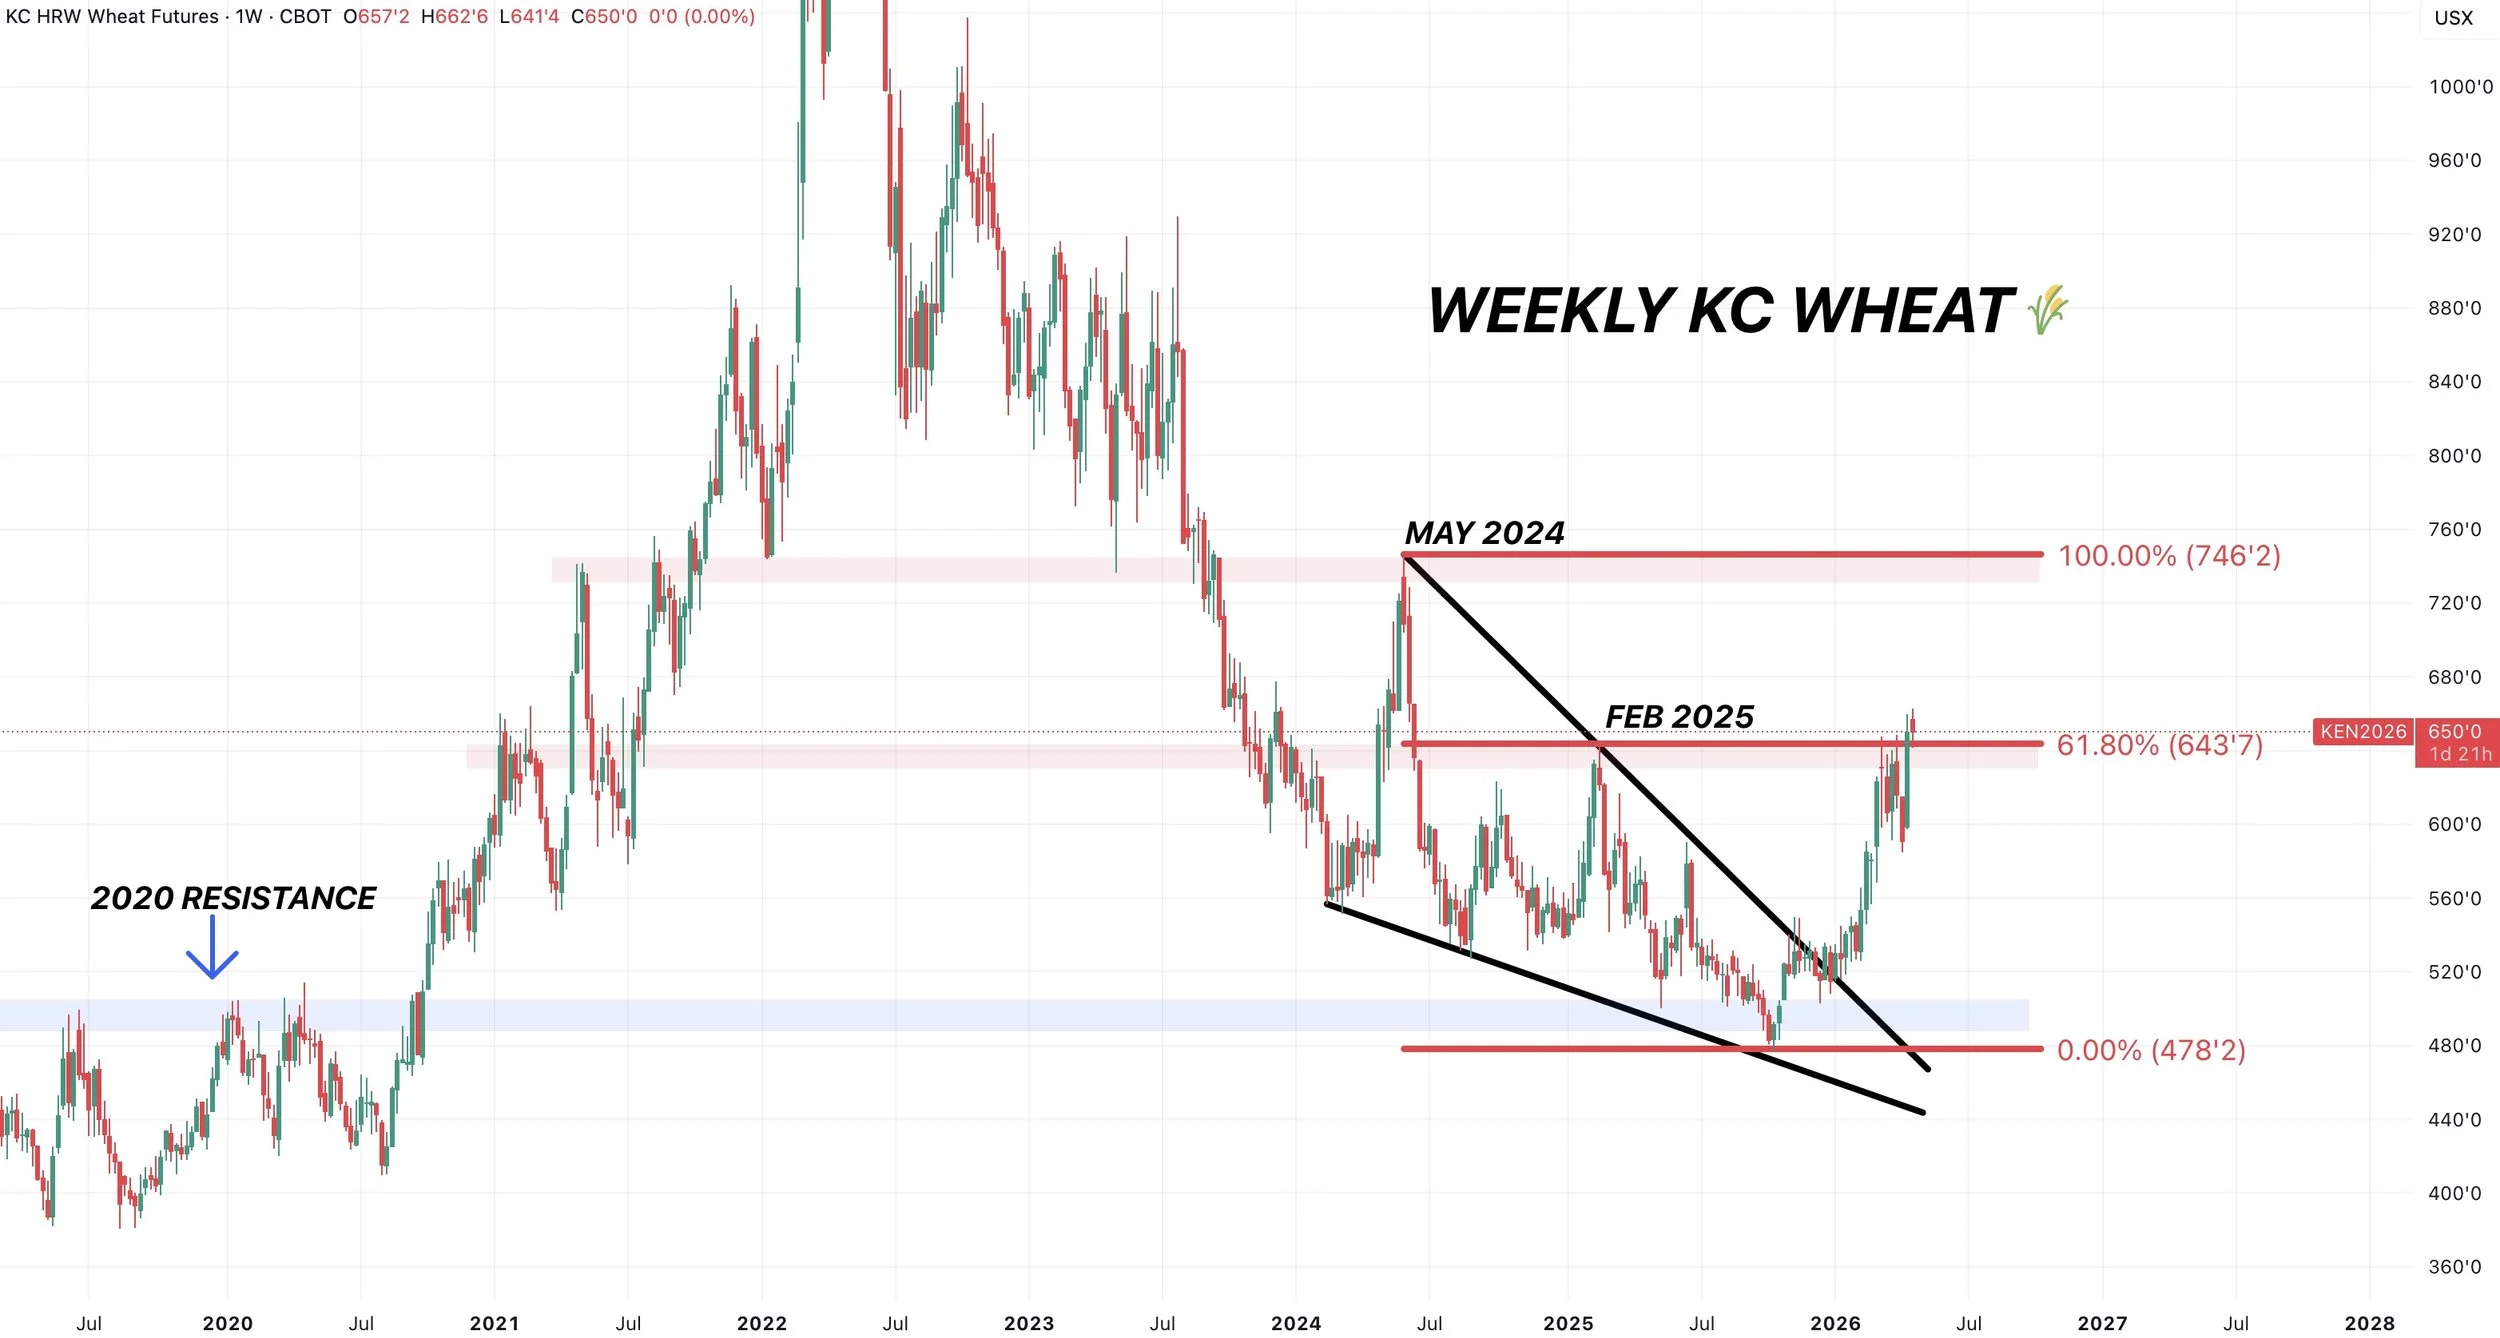
Big Picture Chart: First Higher High Since 2022
Here is the chart that shows the front-month contract.
Since volume rolled to the July now, we have a potential breakout.
This rally originally stalled at those highs from February of 2025. This was also 61.8% of the highs from May 2024.
This is our first higher high we've posted since 2022 on this chart.
Objectively, it looks good and could potentially suggest we have some room to run.
But the only reason to be hesitant would be that the breakout came on a contract switch rather than pure price action.
Cattle
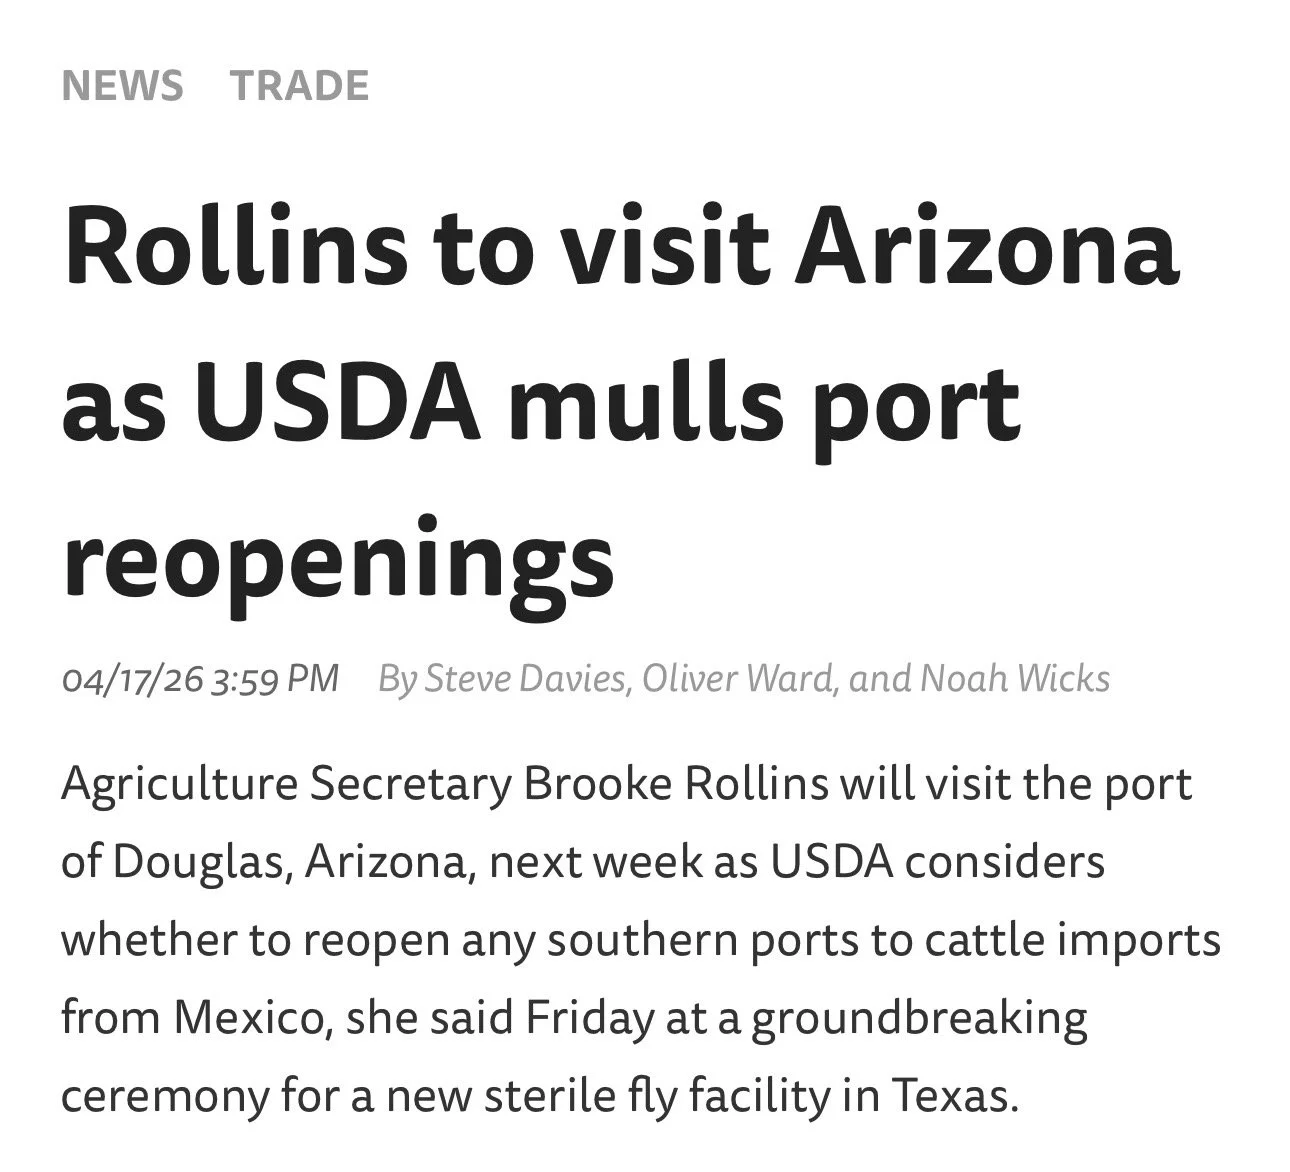
Cattle has seen a sizeable pullback the last few days off the back of some border news.
Last Friday Brooke Rollins visited a ceremony for a new sterile fly facility in Texas.
She said that she will be visiting Arizona as the USDA tries to decide if they are going to reopen the border.
So a big reason for the recent weakness is the fear that the border is going to be reopened.
The cutout is struggling with select above choice.
The DOJ is investigating meat packers again which might have the funds a little nervous up at all-time highs.
Cash traded $2 lower in KS this week.
Looking at the charts, where could we expect to find some support?
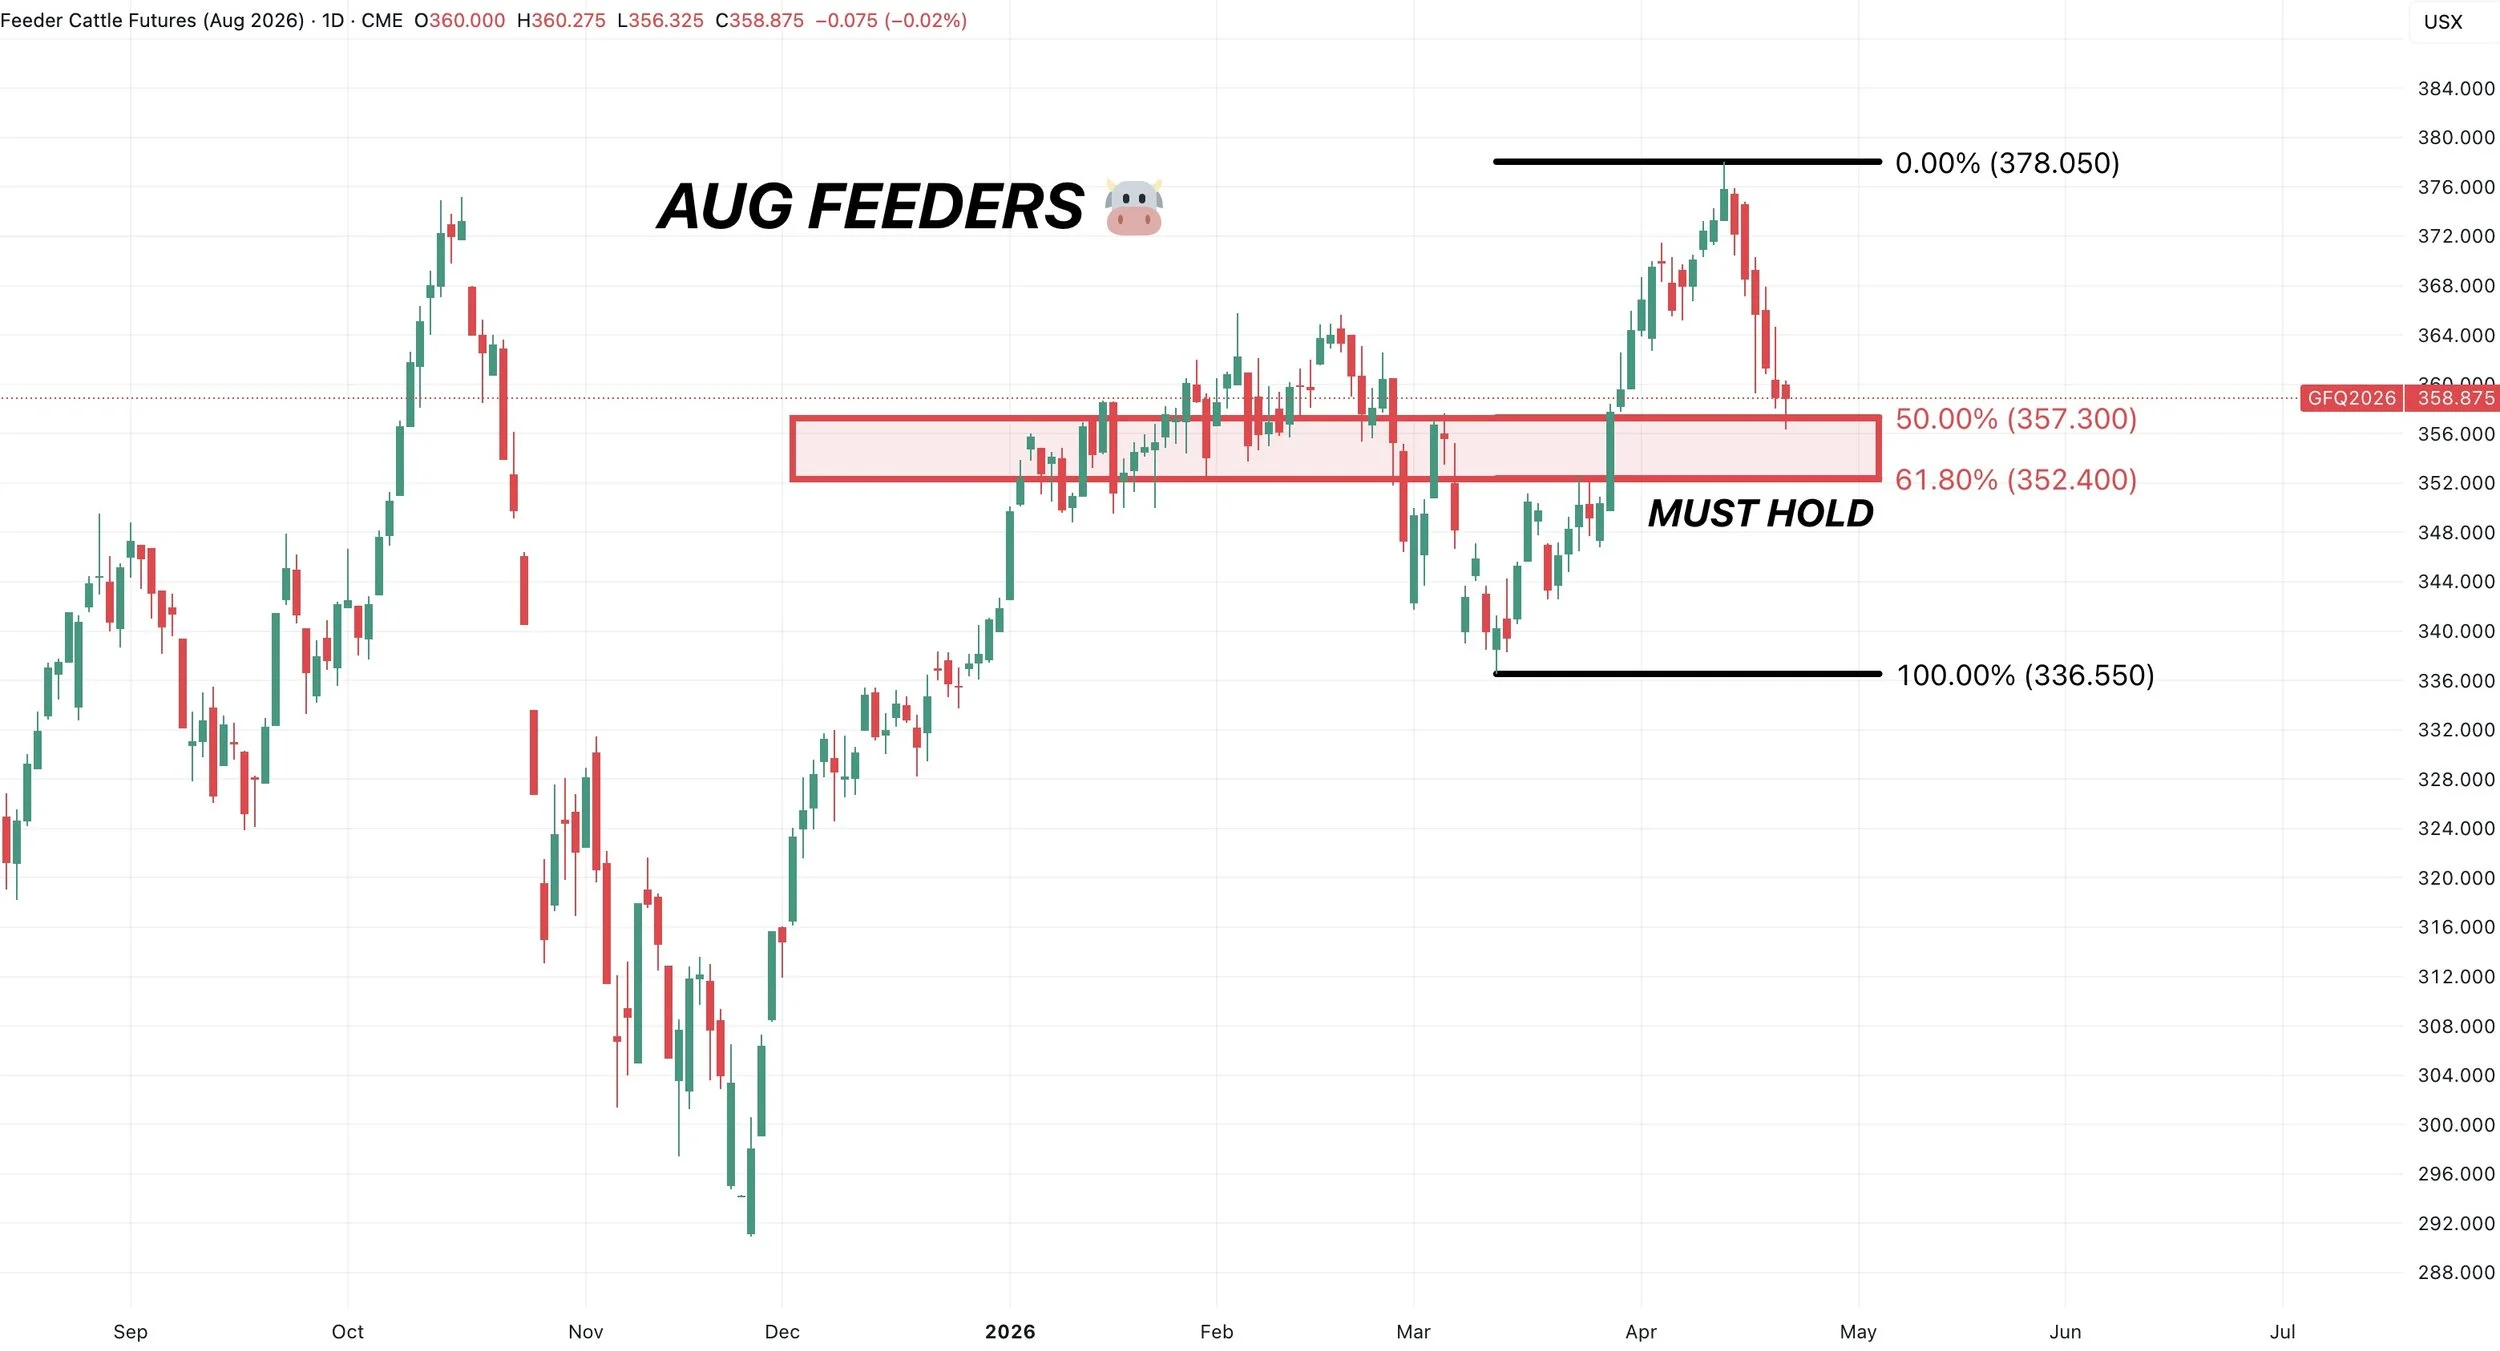
Aug Feeders Chart:
So far we've given back half of the entire recent run.
If this is simply just a normal correction, finding some life between here and 352.400 would be the area we'd expect us to do so.
That is the most common level for a standard correction to end.
If we break below, it would tell us that this is more than just a normal pullback and part of something larger.
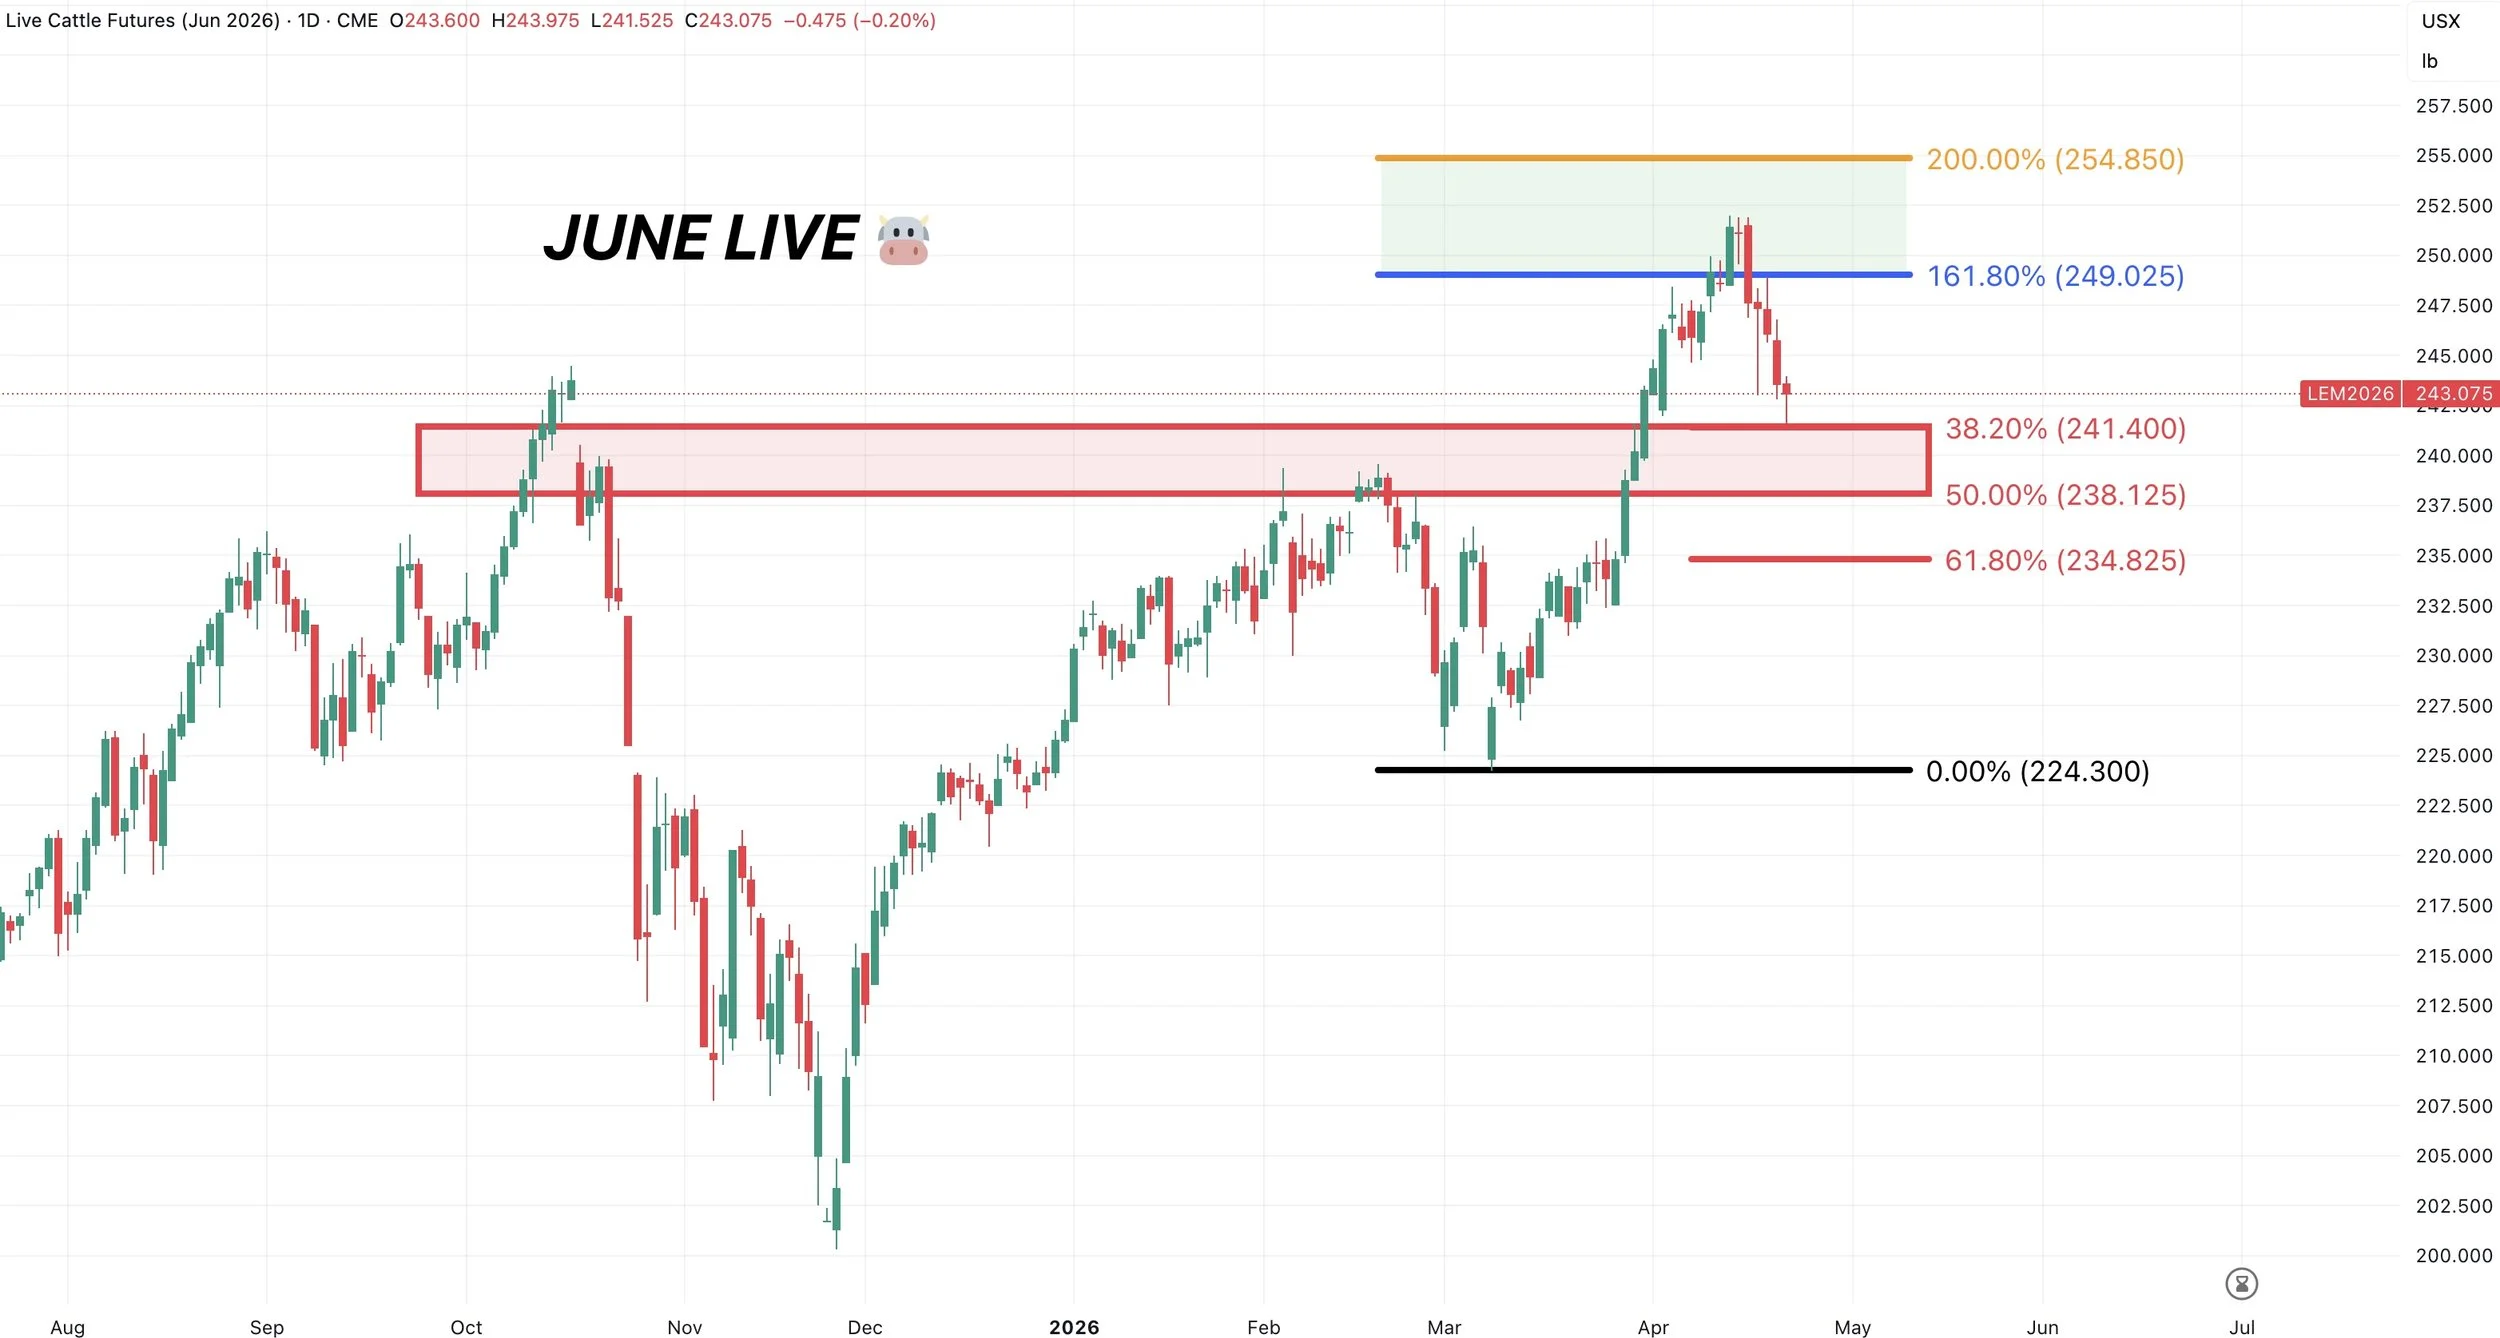
June Live Chart:
We failed right in that fib extension target zone we had been talking about for a while.
The 161.8% and 200% extension from the recent lows up to those Feb highs.
It would make sense to find some lows between here and 238. Which gives back 38.2% to 50% of the recent rally.
This same level is our old resistance which can often turn into new support.
The 50% to 61.8% levels are the two most common levels, but in a strong market the pullback doesn’t have to be as deep.
For example feeders have already given back 50% of the rally. Meanwhile, live cattle has only given back 38.2% of the rally.
Want to Talk?
Our phones are open 24/7 for you guys if you ever need anything or want to discuss your operation.
Jeremey & Office: (806)484-1214
Sebastian: (605)280-1186
Email: sfrost@dailymarketminute.com
Hedge Account
Interested in a hedge account? Use the link below to set up an account or give us a call.
Recent Signals
April 10th, 2026: 🌽
Corn buy signal.
CLICK HERE TO VIEW
March 19th, 2026: 🌱
New crop soybeans signal & hedge alert.
CLICK HERE TO VIEW
March 9th, 2026: 🌱
Soybeans signal & hedge alert. Sent via text.
March 6th, 2026: 🌽 🌾
Corn & wheat sell signal & hedge alert.
March 3rd, 2026: 🌽
Old crop & new crop corn sell signal & hedge alert.
Feb 26th, 2026: 🌱
Old crop & new crop beans sell signal & hedge alert.
Feb 19th, 2026: 🌾
KC wheat sell signal & hedge alert.
Feb 6th, 2026: 🌽 🌱
Old crop corn & soybean sell signal & hedge alert.
Feb 4th, 2026: 🌱
Soybean sell signal & hedge alert.
Nov 17th, 2025: 🌱
Soybean sell signal & hedge alert.