
MARKET FINALLY REALIZE THERE IS A DROUGHT?
AUDIO COMMENTARY
Massive day for KC wheat
No real new news in the war
Can cattle hold support?
Has the market finally realized there is a drought in HRW areas?
HRW could lose 25% or production?
Wheat exports 15% better vs last year
The world market could be lighter in wheat due to the fertilizer situation
The situation in wheat is unlike it has been in the last several years
Is demand starting to falter?
Funds don’t tend to stay long wheat very long
What should you do in wheat?
Don’t lose that carry
The situation makes you nervous in new crop beans. Makes sense to catch up to normal levels
Jeremey & Lauren Q&A below audio*
Chart breakdowns below audio*
Listen to today’s audio below
Q&A WITH JEREMEY & LAUREN
Here is a Q&A where Jeremey and Lauren from Texas Hedge go over a bunch of questions they’ve received from different producers.
If you have questions or want to talk feel free to reach out anytime.
Office: (806)484-1214
CHART BREAKDOWNS
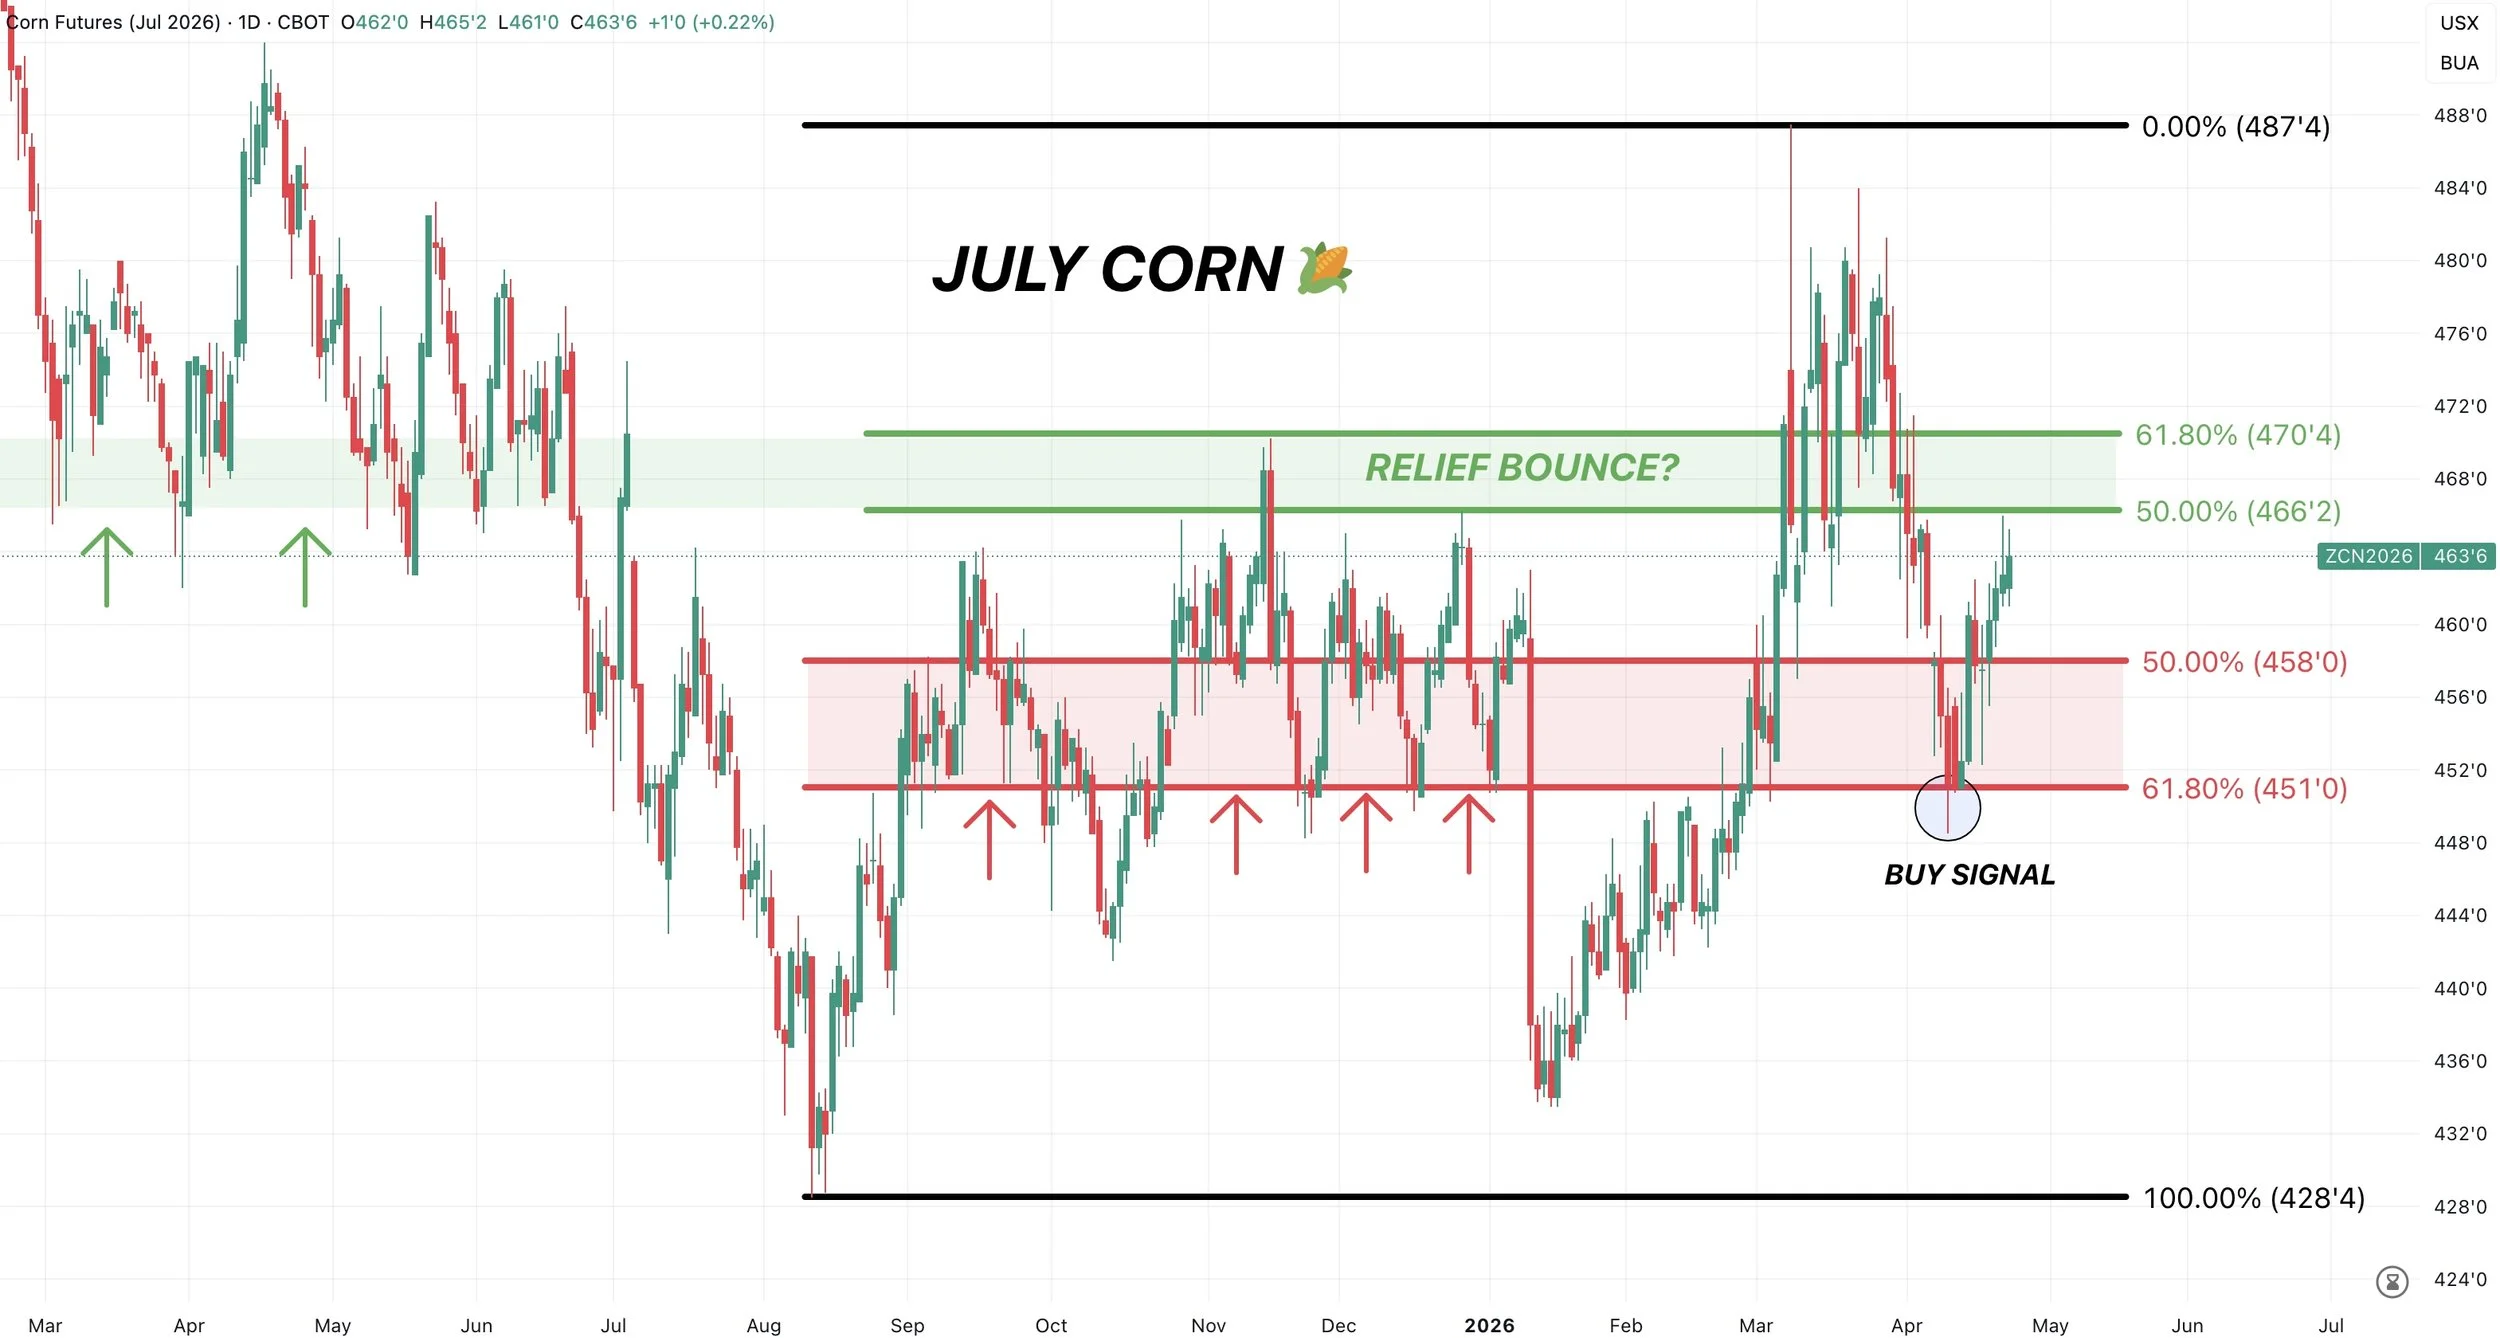
July Corn 🌽
Nearing that target box.
$4.65 to $4.70 is where a typical relief bounce can often fail, aka the golden zone.
This same level was resistance back in fall as well as support last spring.
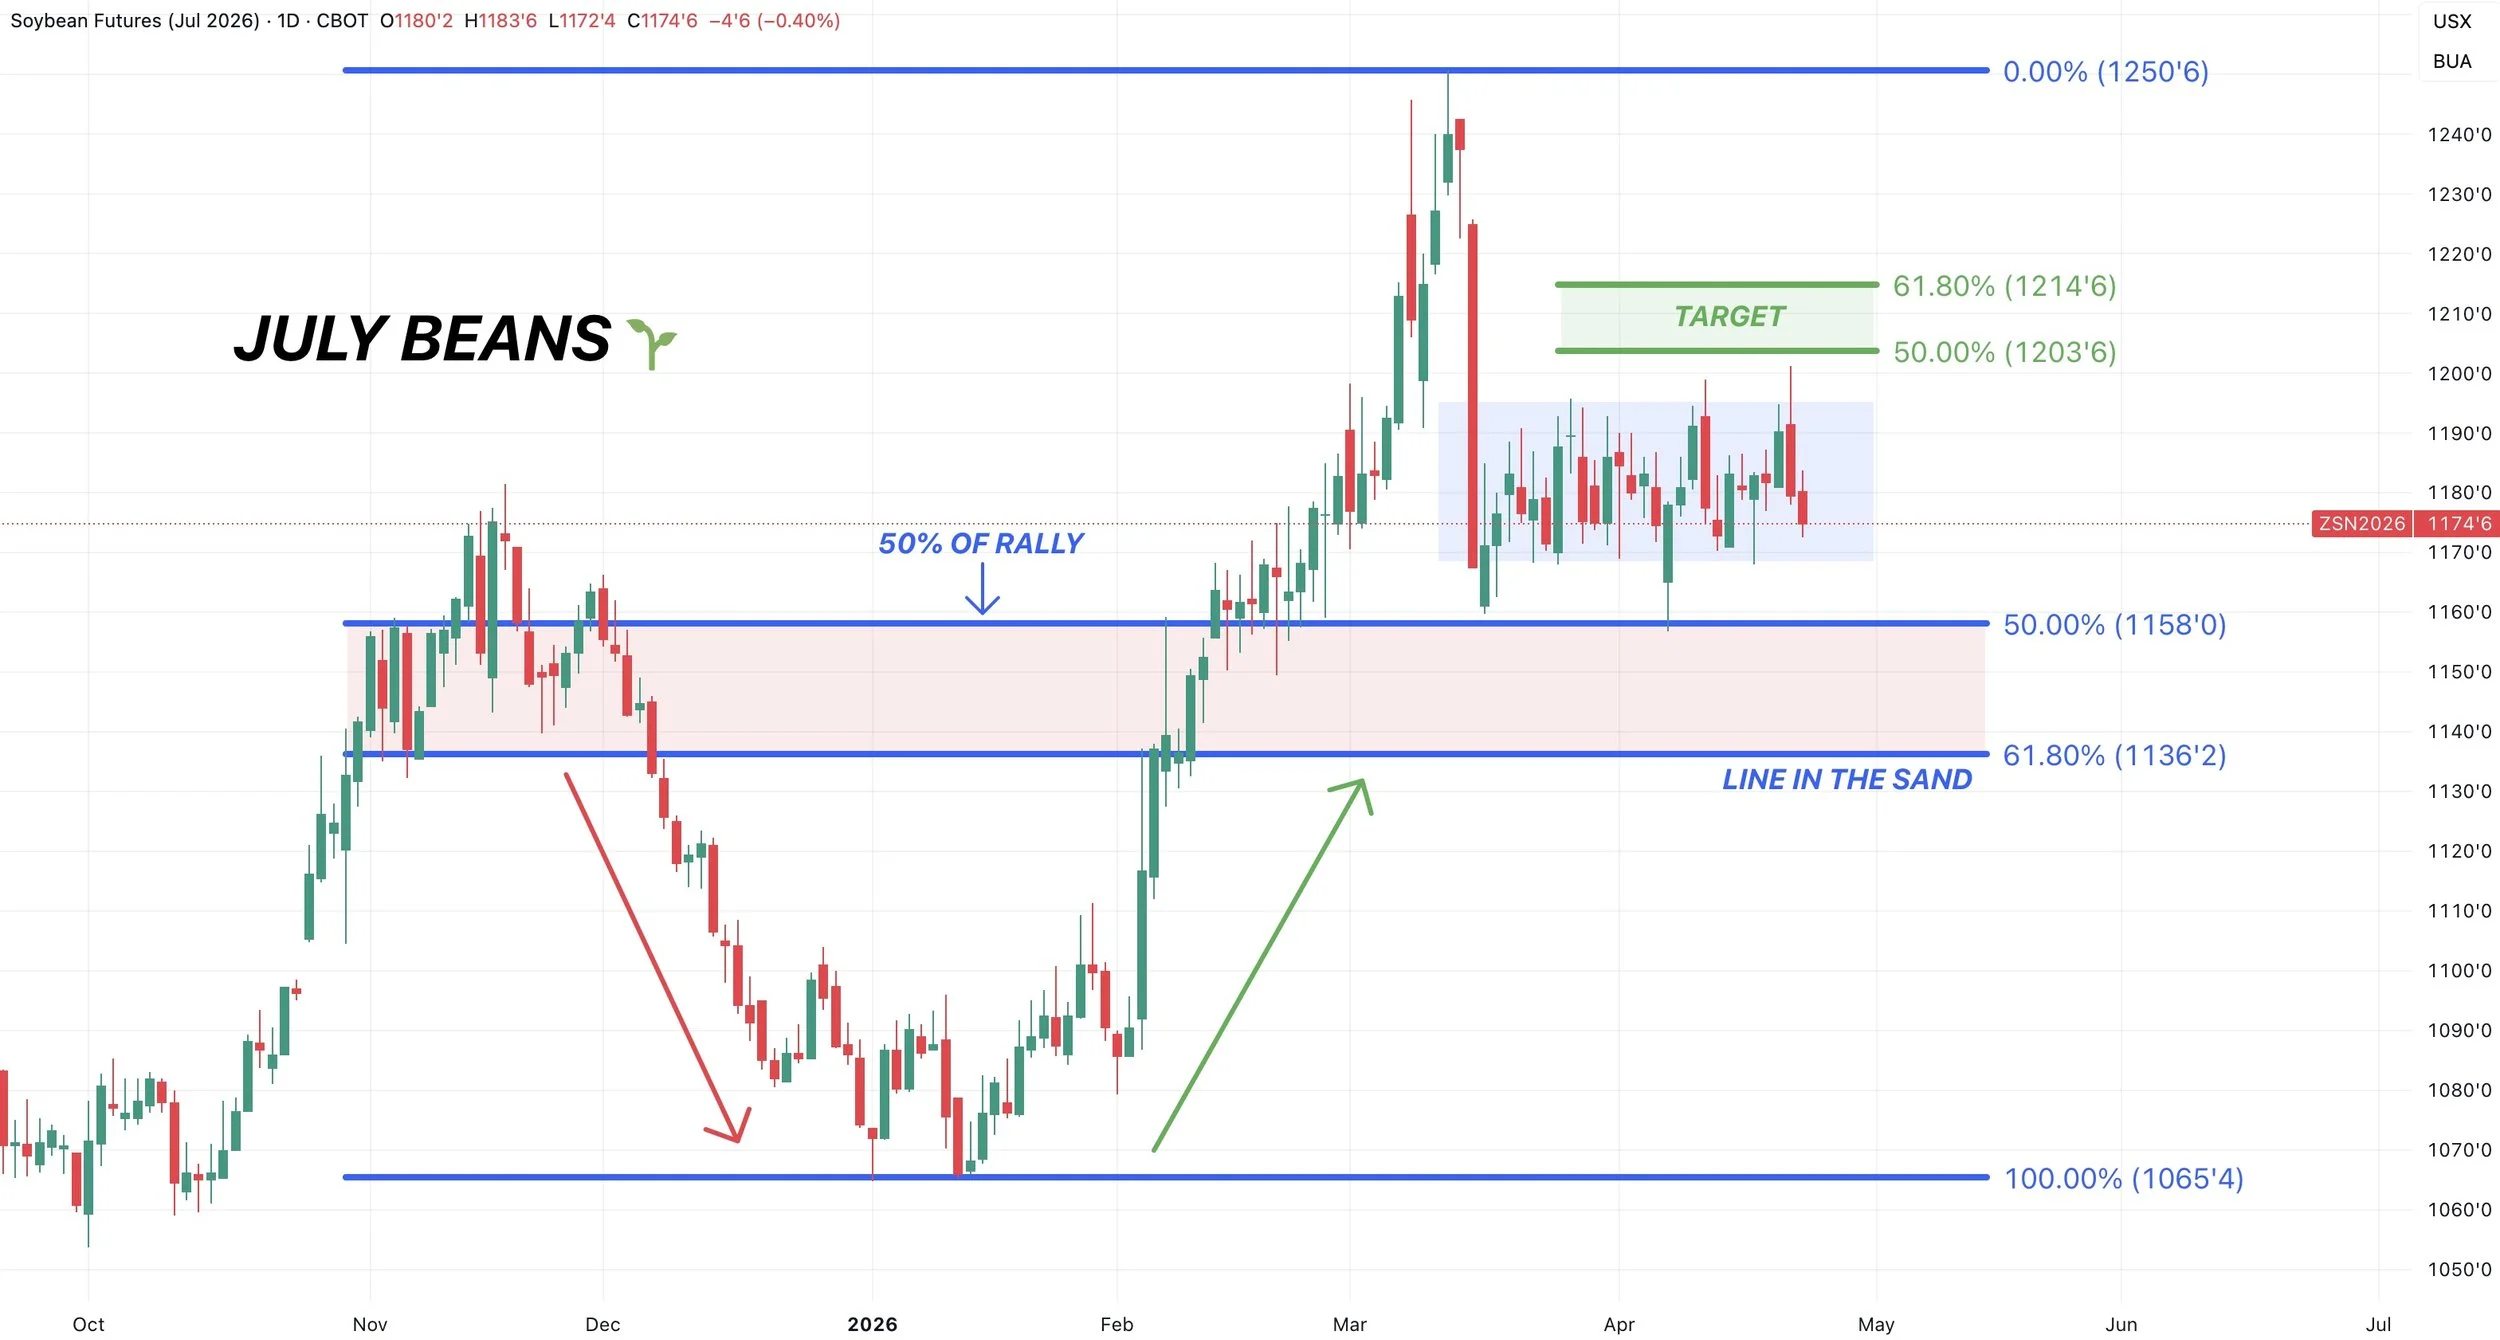
July Beans 🌱
Still completely sideways. Waiting for a break out in either direction.
A typical relief bounce will fail at $12.04 to $12.14 which is the area we want to reward if it comes.
Would like to see us continue to hold the local support at $11.70
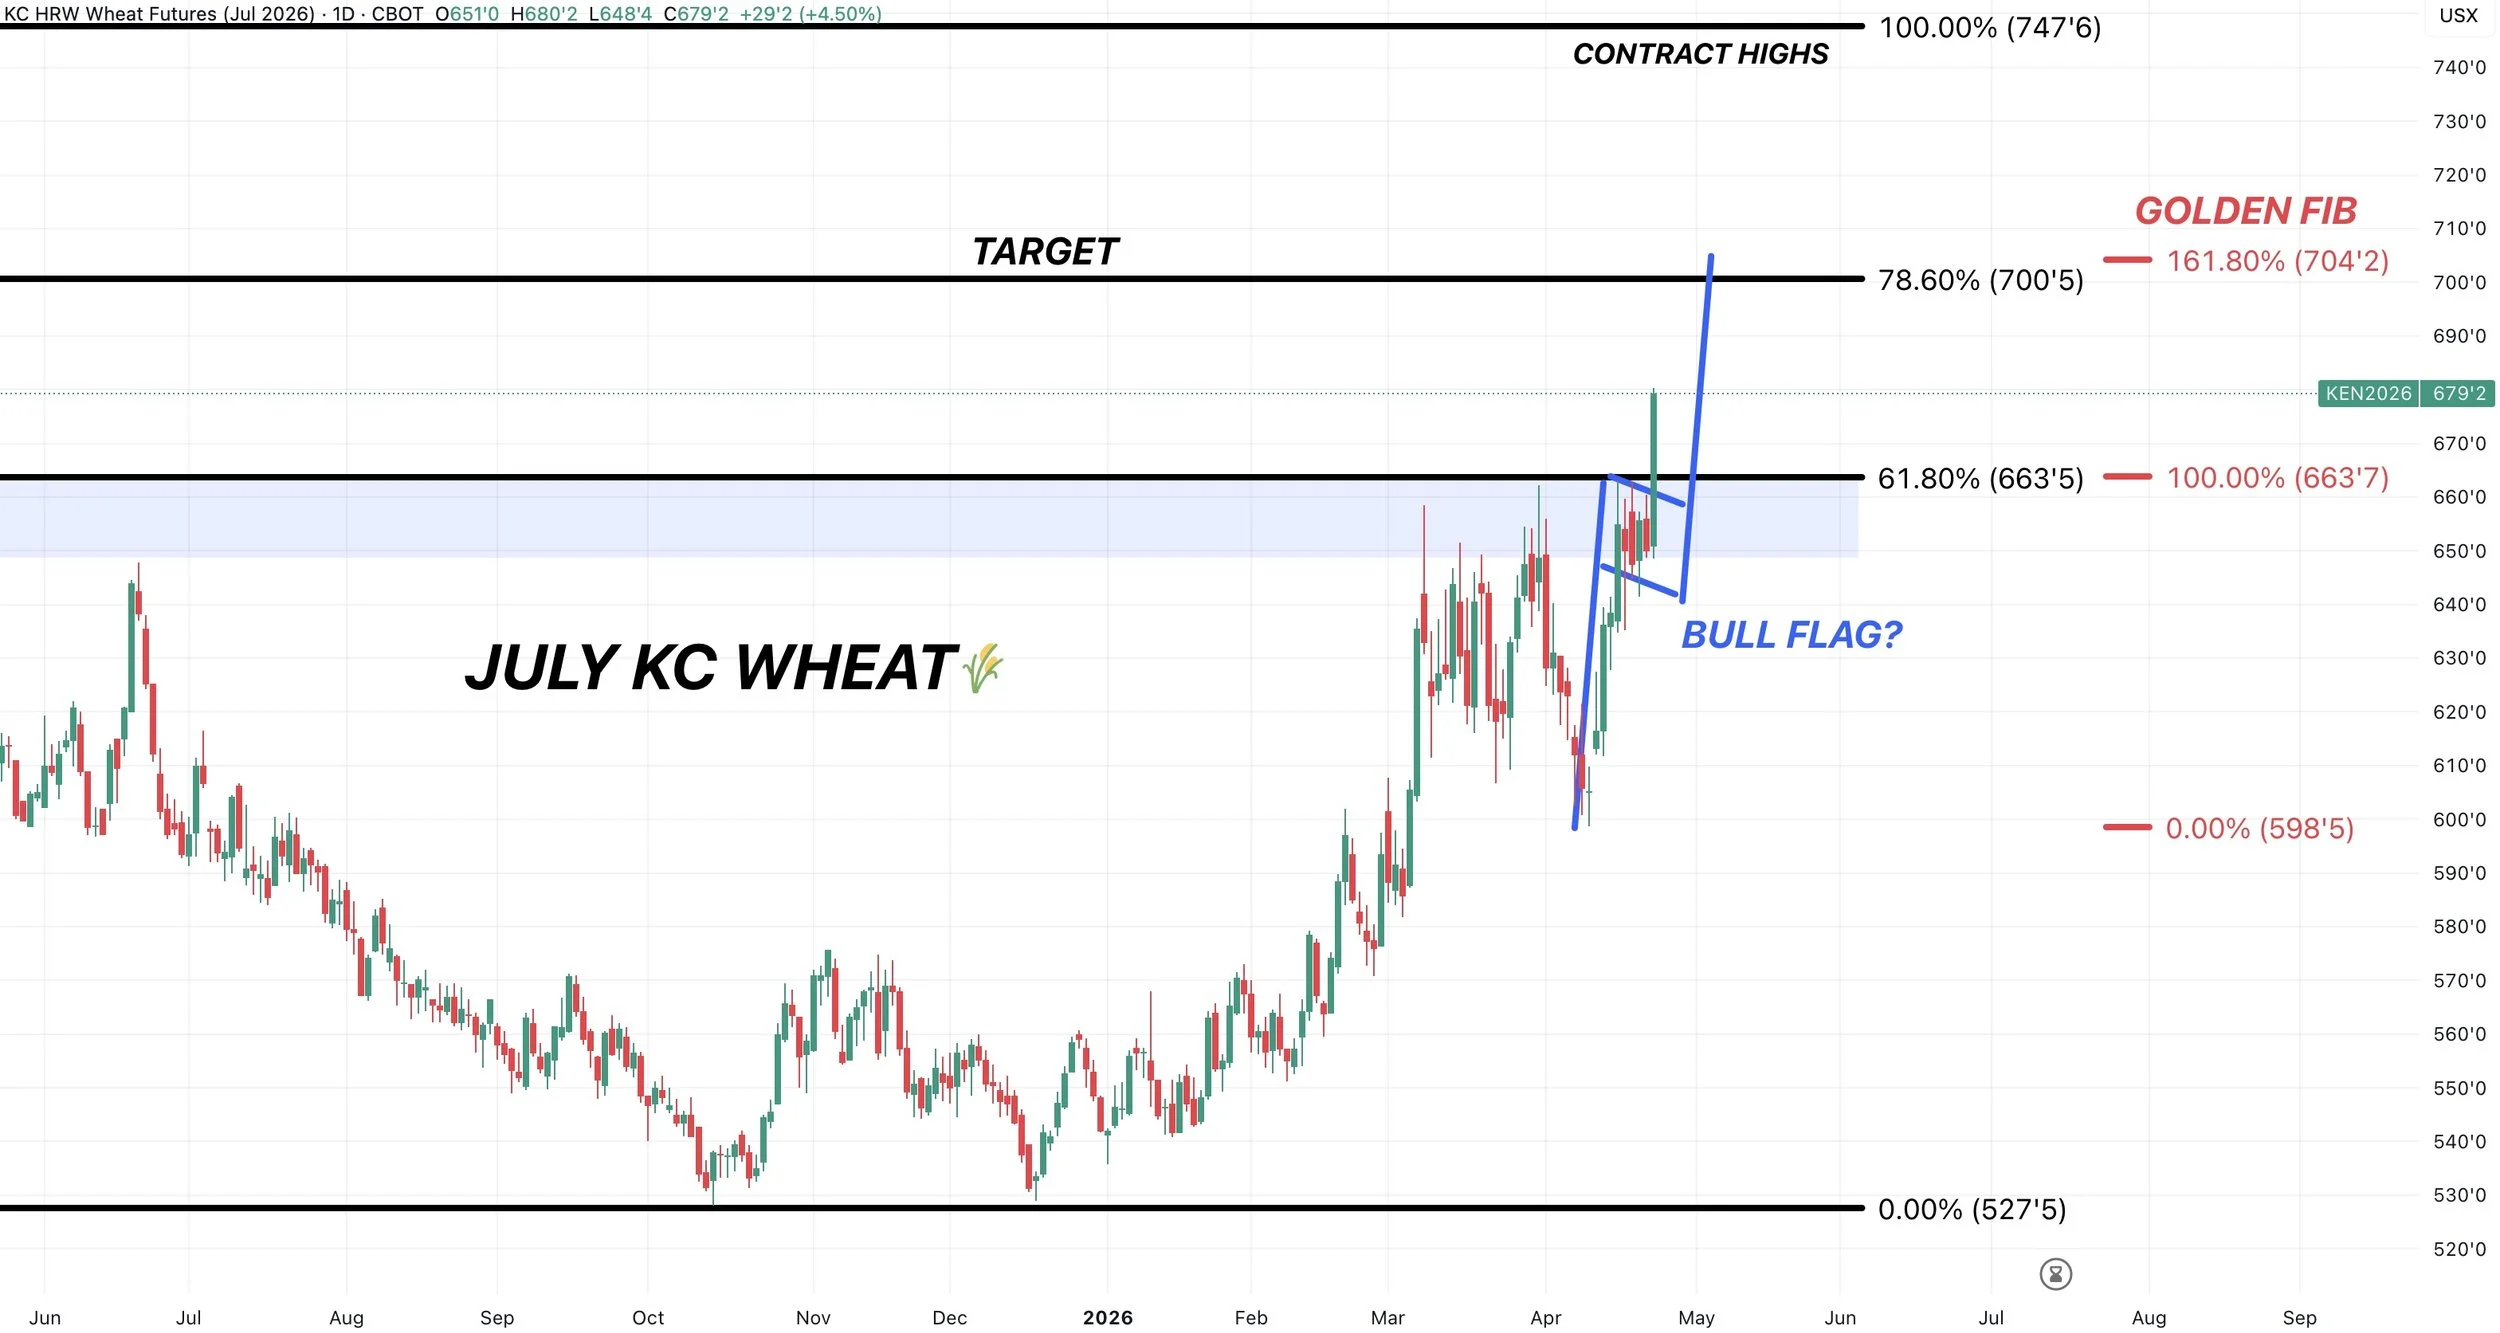
July KC Wheat 🌾
Next target is still $7.00 for a few reasons.
That is the rough implied move from this bull flag pattern we broke out of it.
It’s the golden fib extension from the recent sell off. Meaning $7.00 equals 161.8% of the recent lows up to those March highs. That is a common level for a continuation rally to stall.
We originally failed at the 61.8%. retracement from contract lows up to contract highs. We now broke out. The next retracement is the 78.6%. level at $7.00
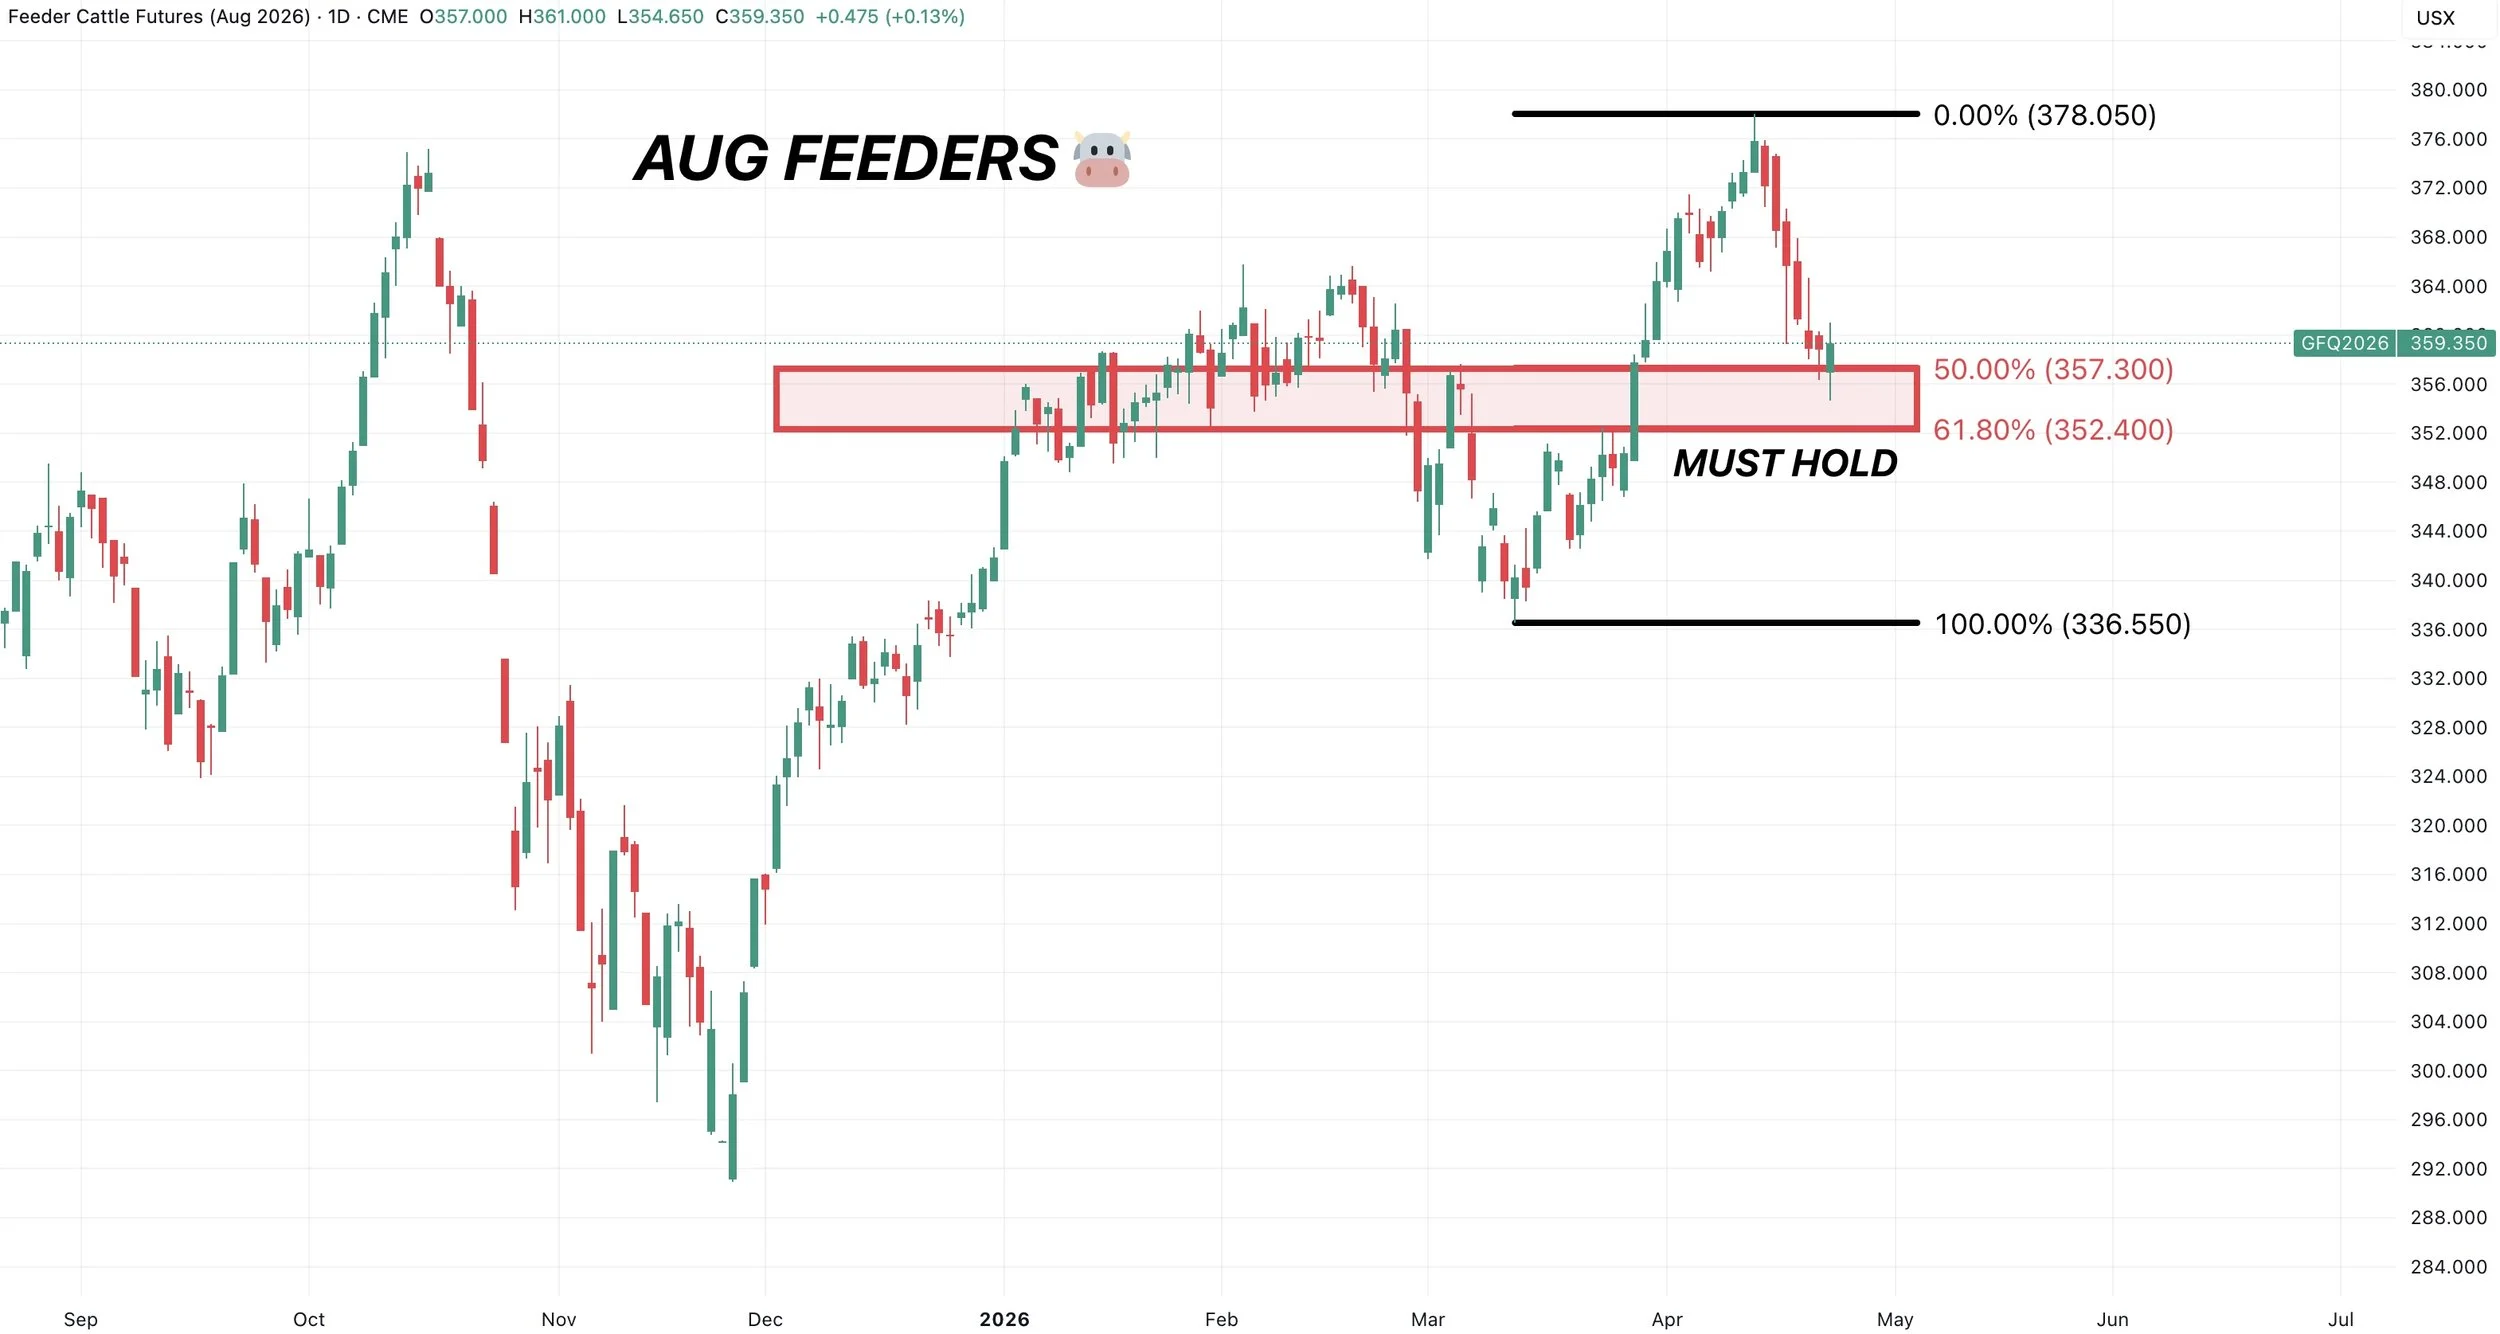
Aug Feeders 🐮
If we are going to bounce, this red box is where we’d expect it to happen.
This is where most standard sized corrections end.
It’s a must hold level, as if we break below it likely tells us this is more than just your normal correction.
This is where the market usually decides if we are in a correction or falling apart.
Want to Talk?
Our phones are open 24/7 for you guys if you ever need anything or want to discuss your operation.
Jeremey & Office: (806)484-1214
Sebastian: (605)280-1186
Email: sfrost@dailymarketminute.com
Hedge Account
Interested in a hedge account? Use the link below to set up an account or give us a call.
Recent Signals
April 10th, 2026: 🌽
Corn buy signal.
March 19th, 2026: 🌱
New crop soybeans signal & hedge alert.
March 9th, 2026: 🌱
Soybeans signal & hedge alert. Sent via text.
March 6th, 2026: 🌽 🌾
Corn & wheat sell signal & hedge alert.
March 3rd, 2026: 🌽
Old crop & new crop corn sell signal & hedge alert.
Feb 26th, 2026: 🌱
Old crop & new crop beans sell signal & hedge alert.
Feb 19th, 2026: 🌾
KC wheat sell signal & hedge alert.
Feb 6th, 2026: 🌽 🌱
Old crop corn & soybean sell signal & hedge alert.
Feb 4th, 2026: 🌱
Soybean sell signal & hedge alert.
Nov 17th, 2025: 🌱
Soybean sell signal & hedge alert.