
GRAINS SOAR WHILE CATTLE BLEEDS
AUDIO COMMENTARY
Feeder limit down again
Trump gets what Trump wants
How to protect profit on cattle puts
Don’t be complacent in marketing
Trump says US and China will make deal
Bessent says China will be “substantial” amount of soybeans
If we get a deal is it built into the market?
There is definitely upside potential in grains
Could the trade deal be a buy the rumor sell the fact event?
More details on our soybean sell signal
Most of you are suppose to reward this rally in some sort of matter
Who should try to hit home runs vs singles
We do not want to chase if we were forced to puke sell
What to do if you do not have a hedge account
Looking for $4.35-40 in corn (chart below)*
What if China buys & yield isn’t there?
No taking risk off the table in wheat
We are still harvesting a huge corn crop
No crop insurance floor is a risk
Beans break out of year range? (chart below)*
Listen to today’s audio below
Want to talk? (605)295-3100
CHARTS
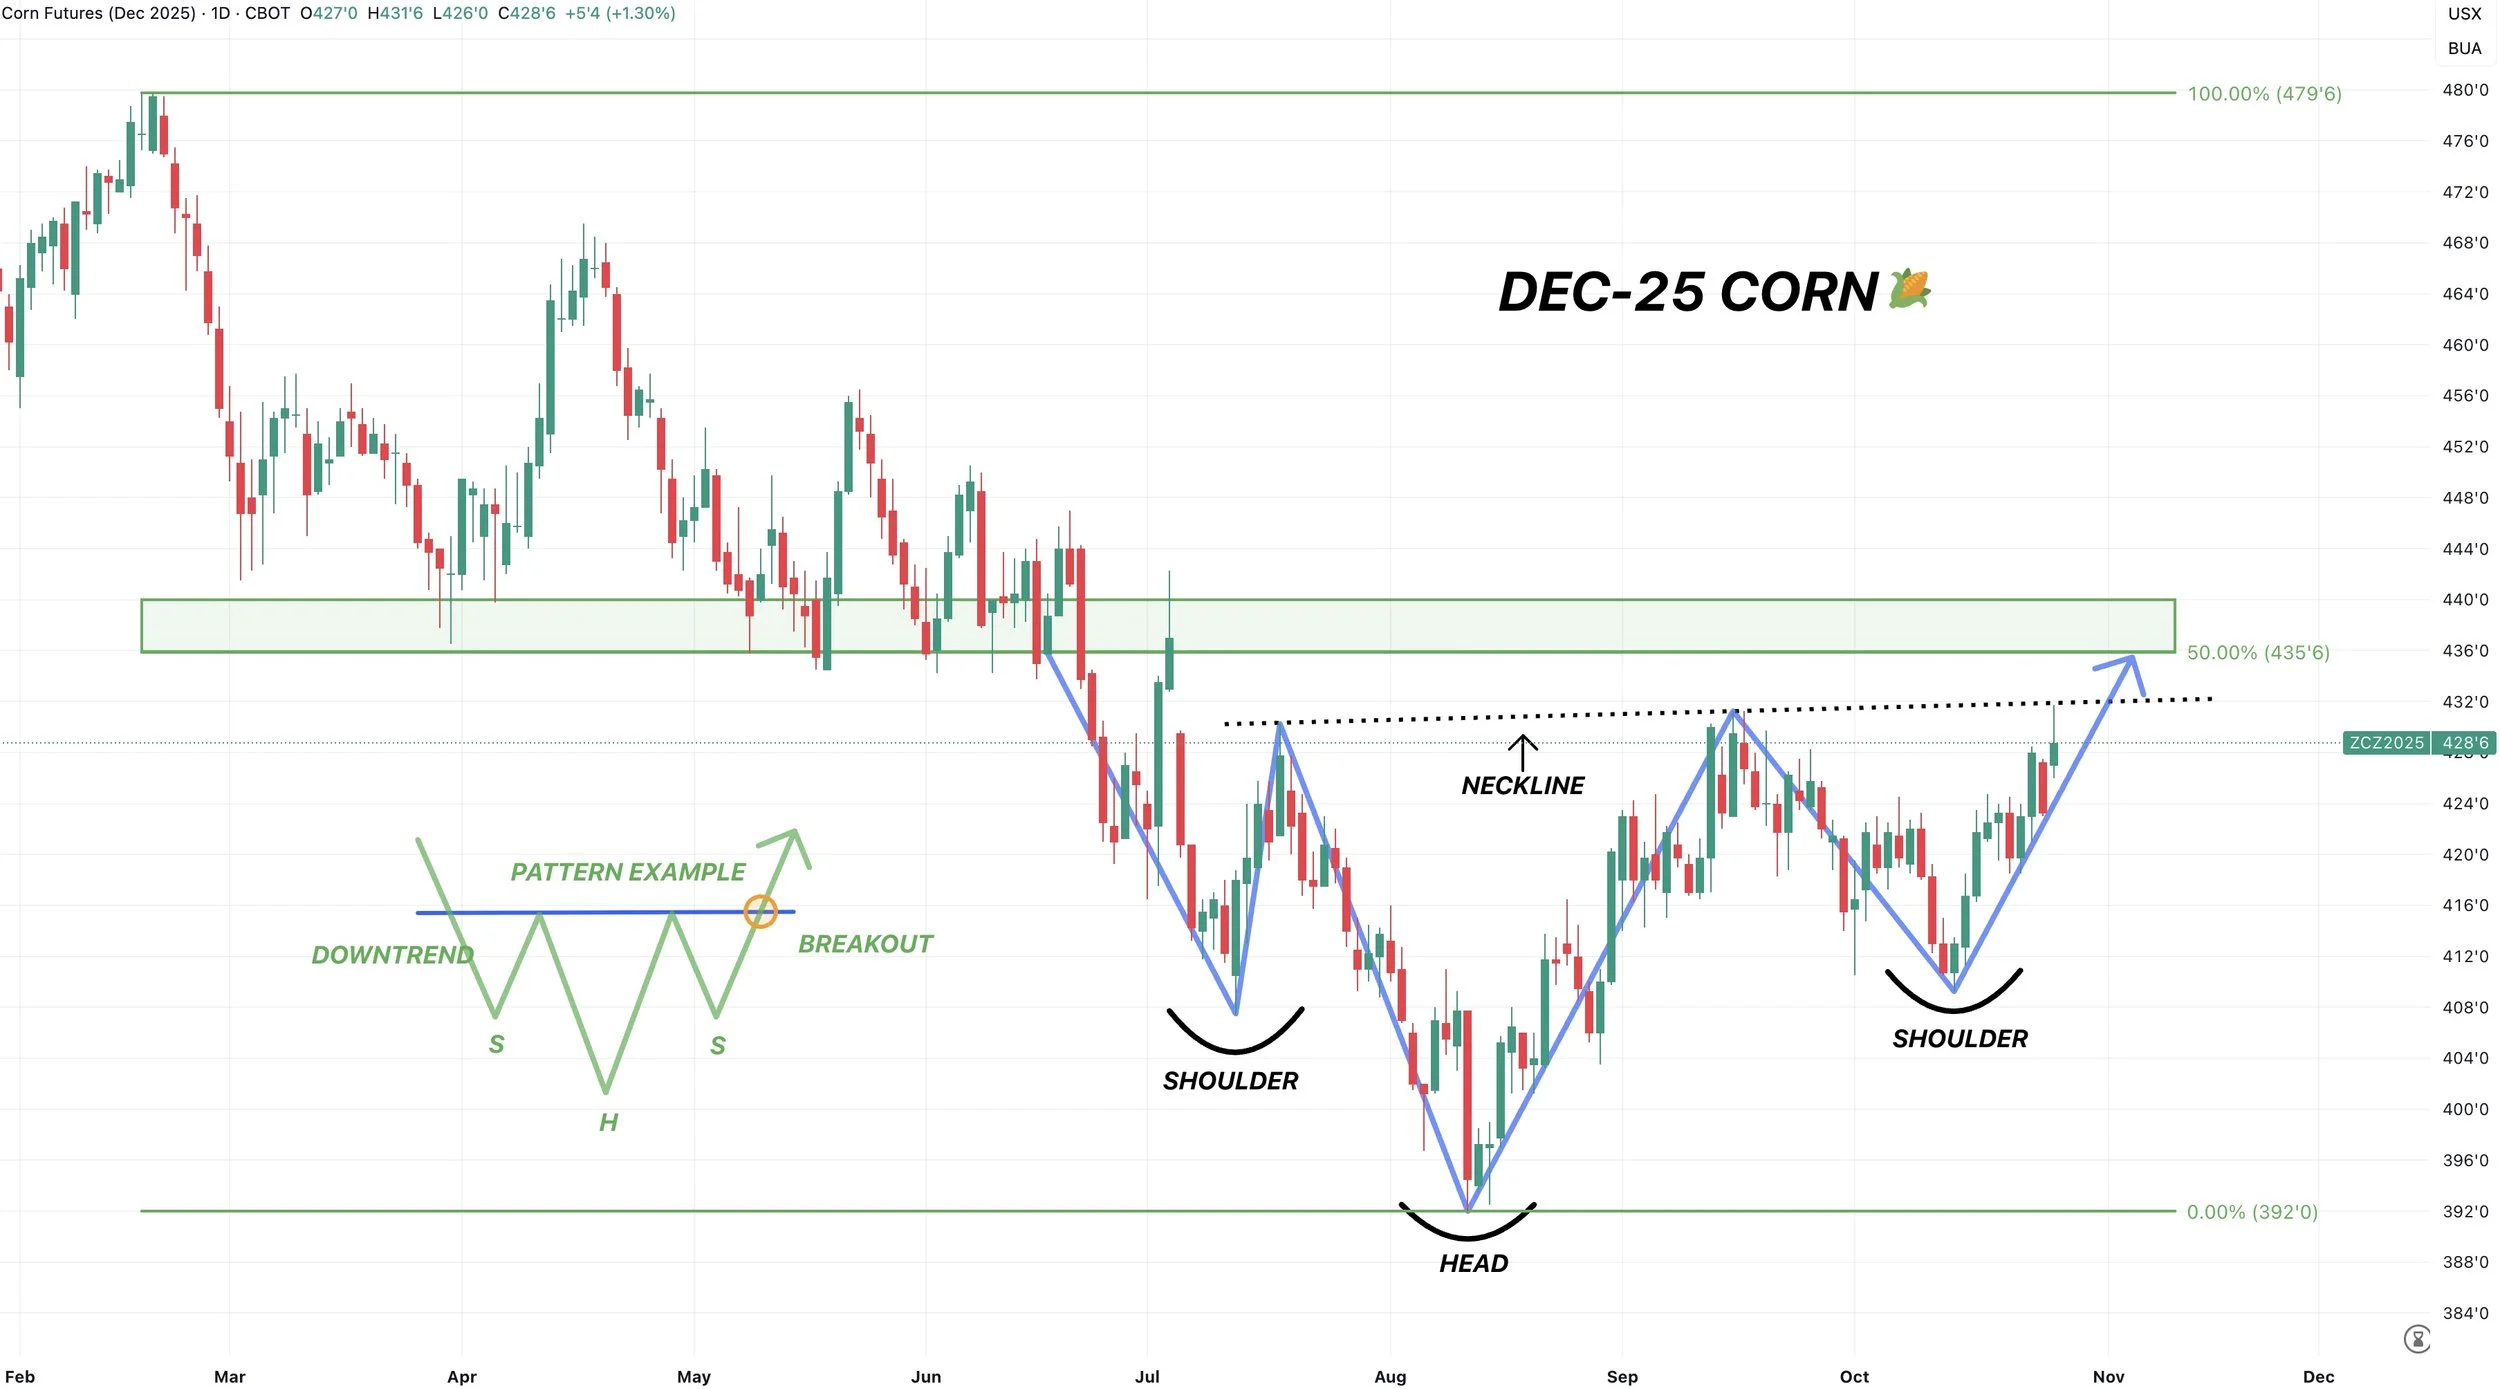
Dec Corn 🌽
Still eyeing $4.35 to $4.40 to start to de-risk.
That gives back 50% of the Feb highs.
It is also old key support from spring.

Still have the potential inverse head & shoulders pattern in place.
We tagged the neckline today.
Usually, a break above the neckline indicates more upside.
Jan Beans 🌱
Today we traded at our highest levels we’ve seen all year long.
We like de-risking here as this is where soybeans have failed all year long.
Very very close to breaking out this brutal range we’ve been trapped in for over a year.
If you break out of a range of that magnitude, more often than not it leads to more upside.
I will have my next upside target out once I’m confident this is truly a breakout of the range.

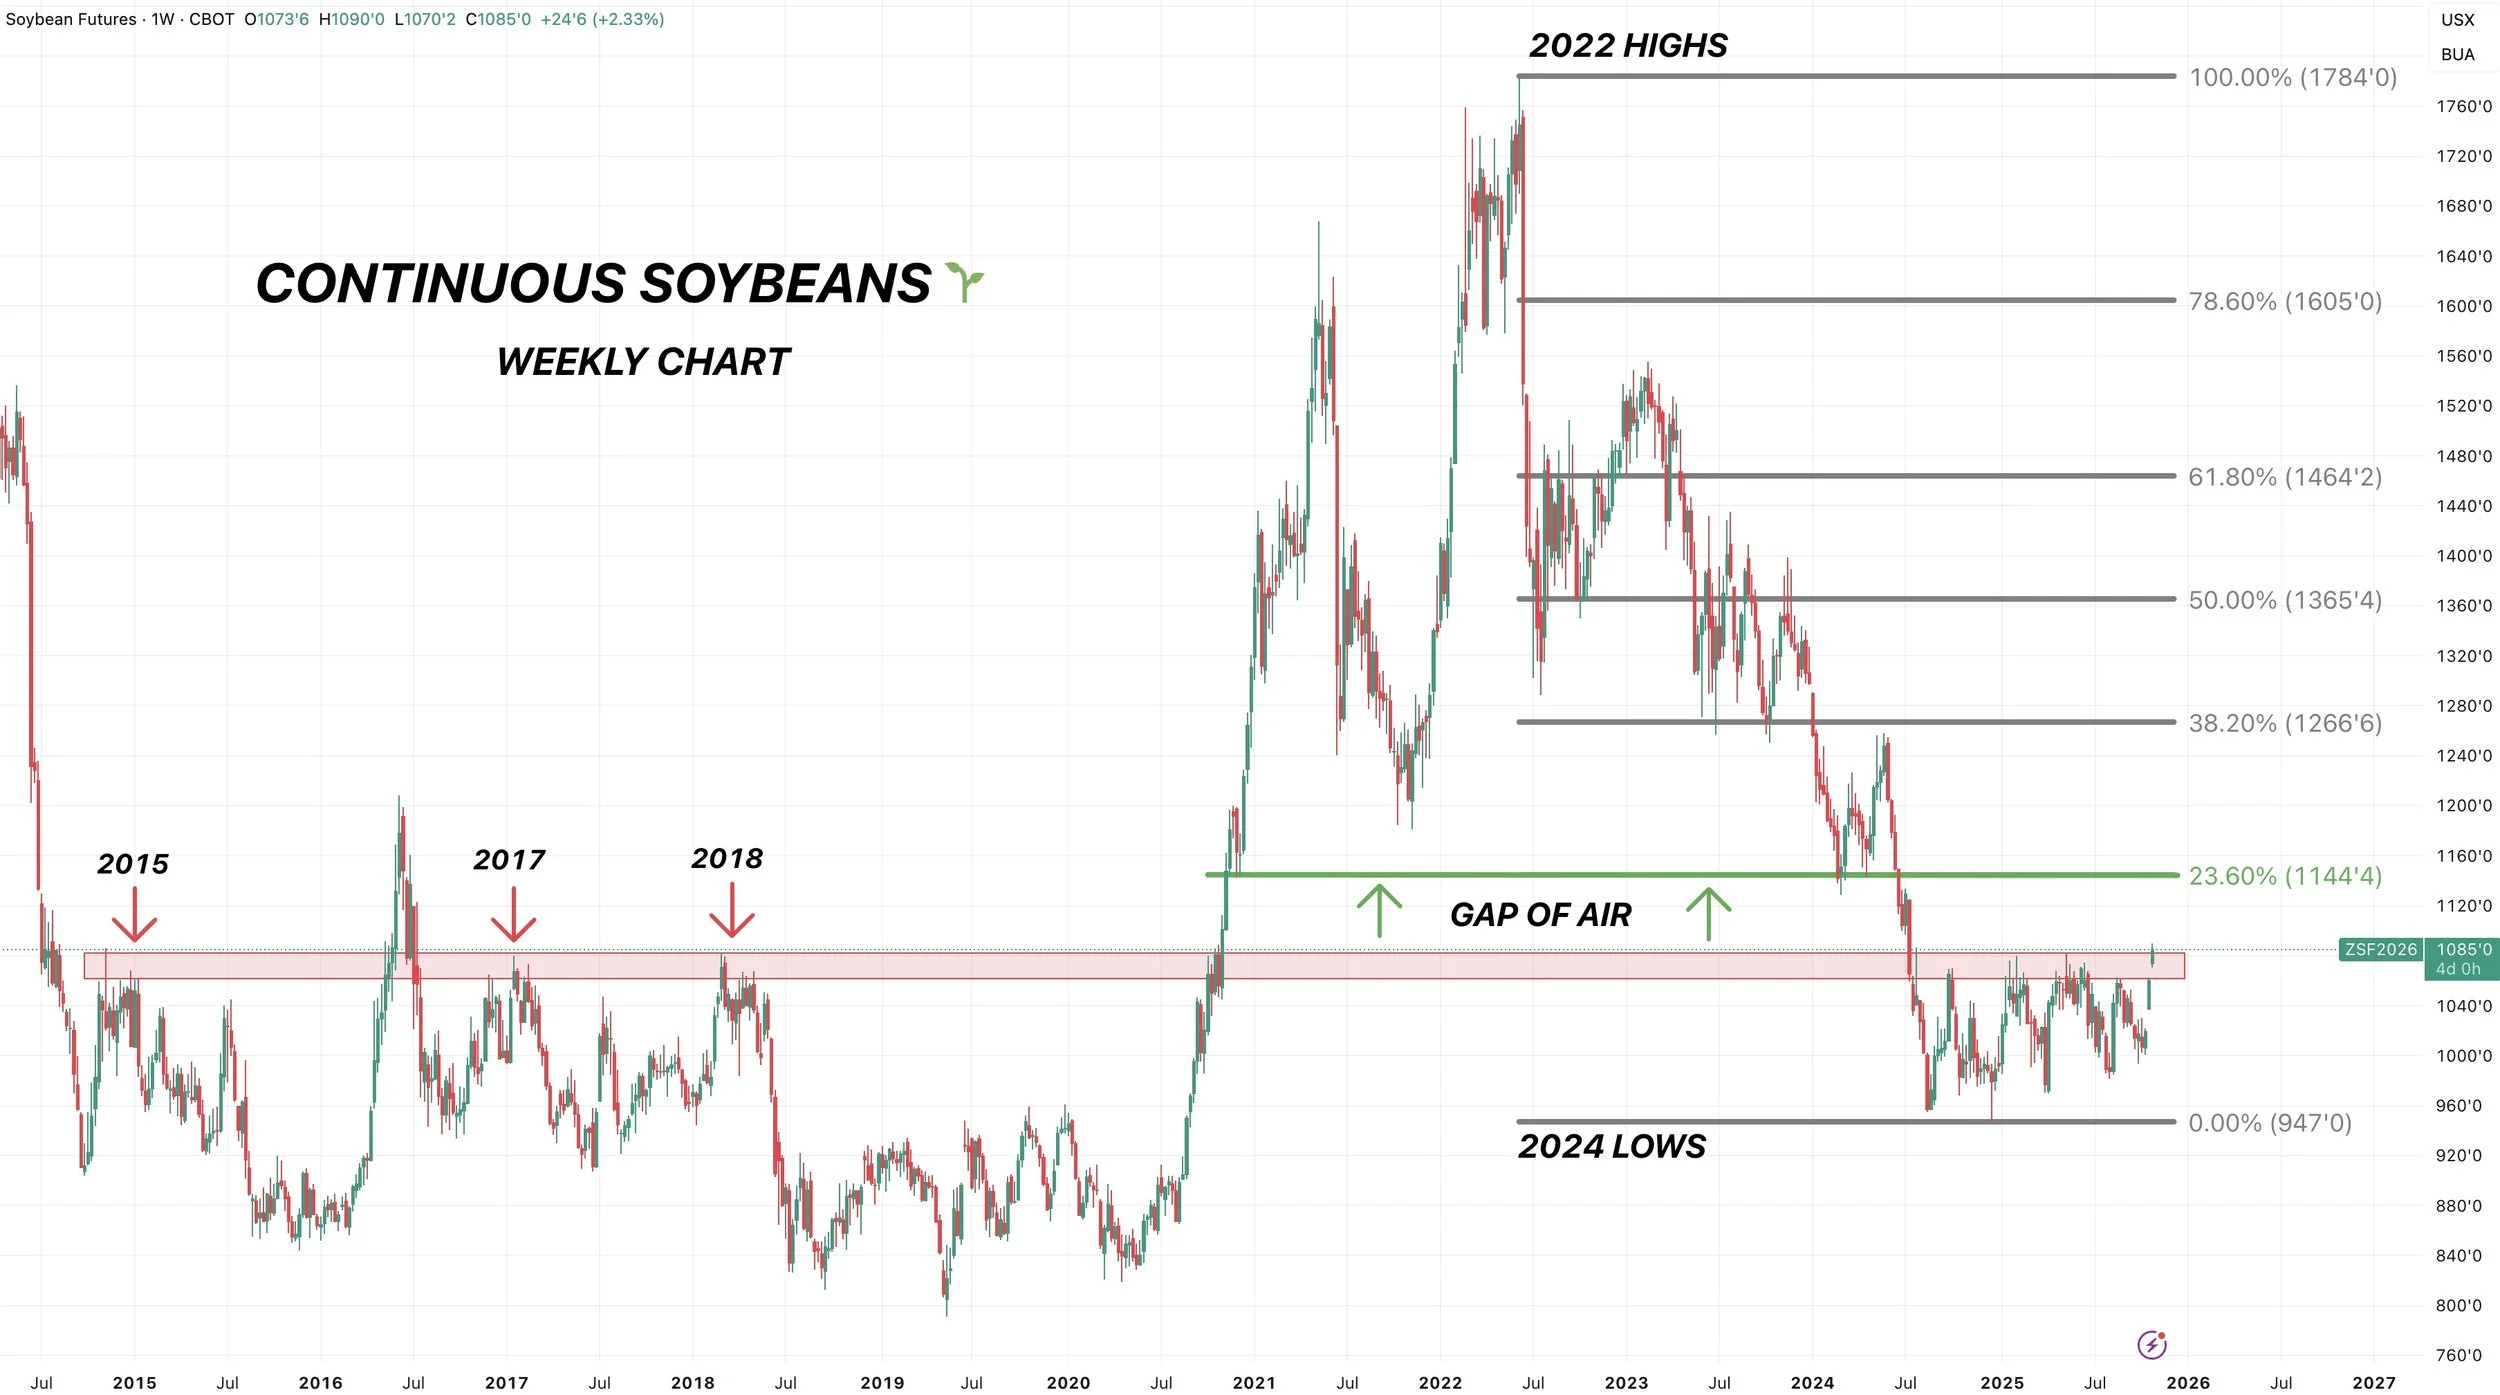
Continuous Soybeans 🌱
Now this chart is more interesting.
We might have just broken out of the range we’ve been trapped in for the last 475 days.
If this is the breakout, we have a clear gap of air towards $11.40
$11.44 gives back 23.6% of the 2022 highs. 23.6% is the first fib level.
The market has also simply just not traded between here and $11.40. As when we sold off, it was hard and fast. So it left a gap of air and not much resistance above these levels.

Here is a weekly continuous chart to give you an even bigger picture view.
This level we are was also resistance from 2016-2018.
If we break above (which we are on the verge of possibly doing) we have the gap of air towards $11.40
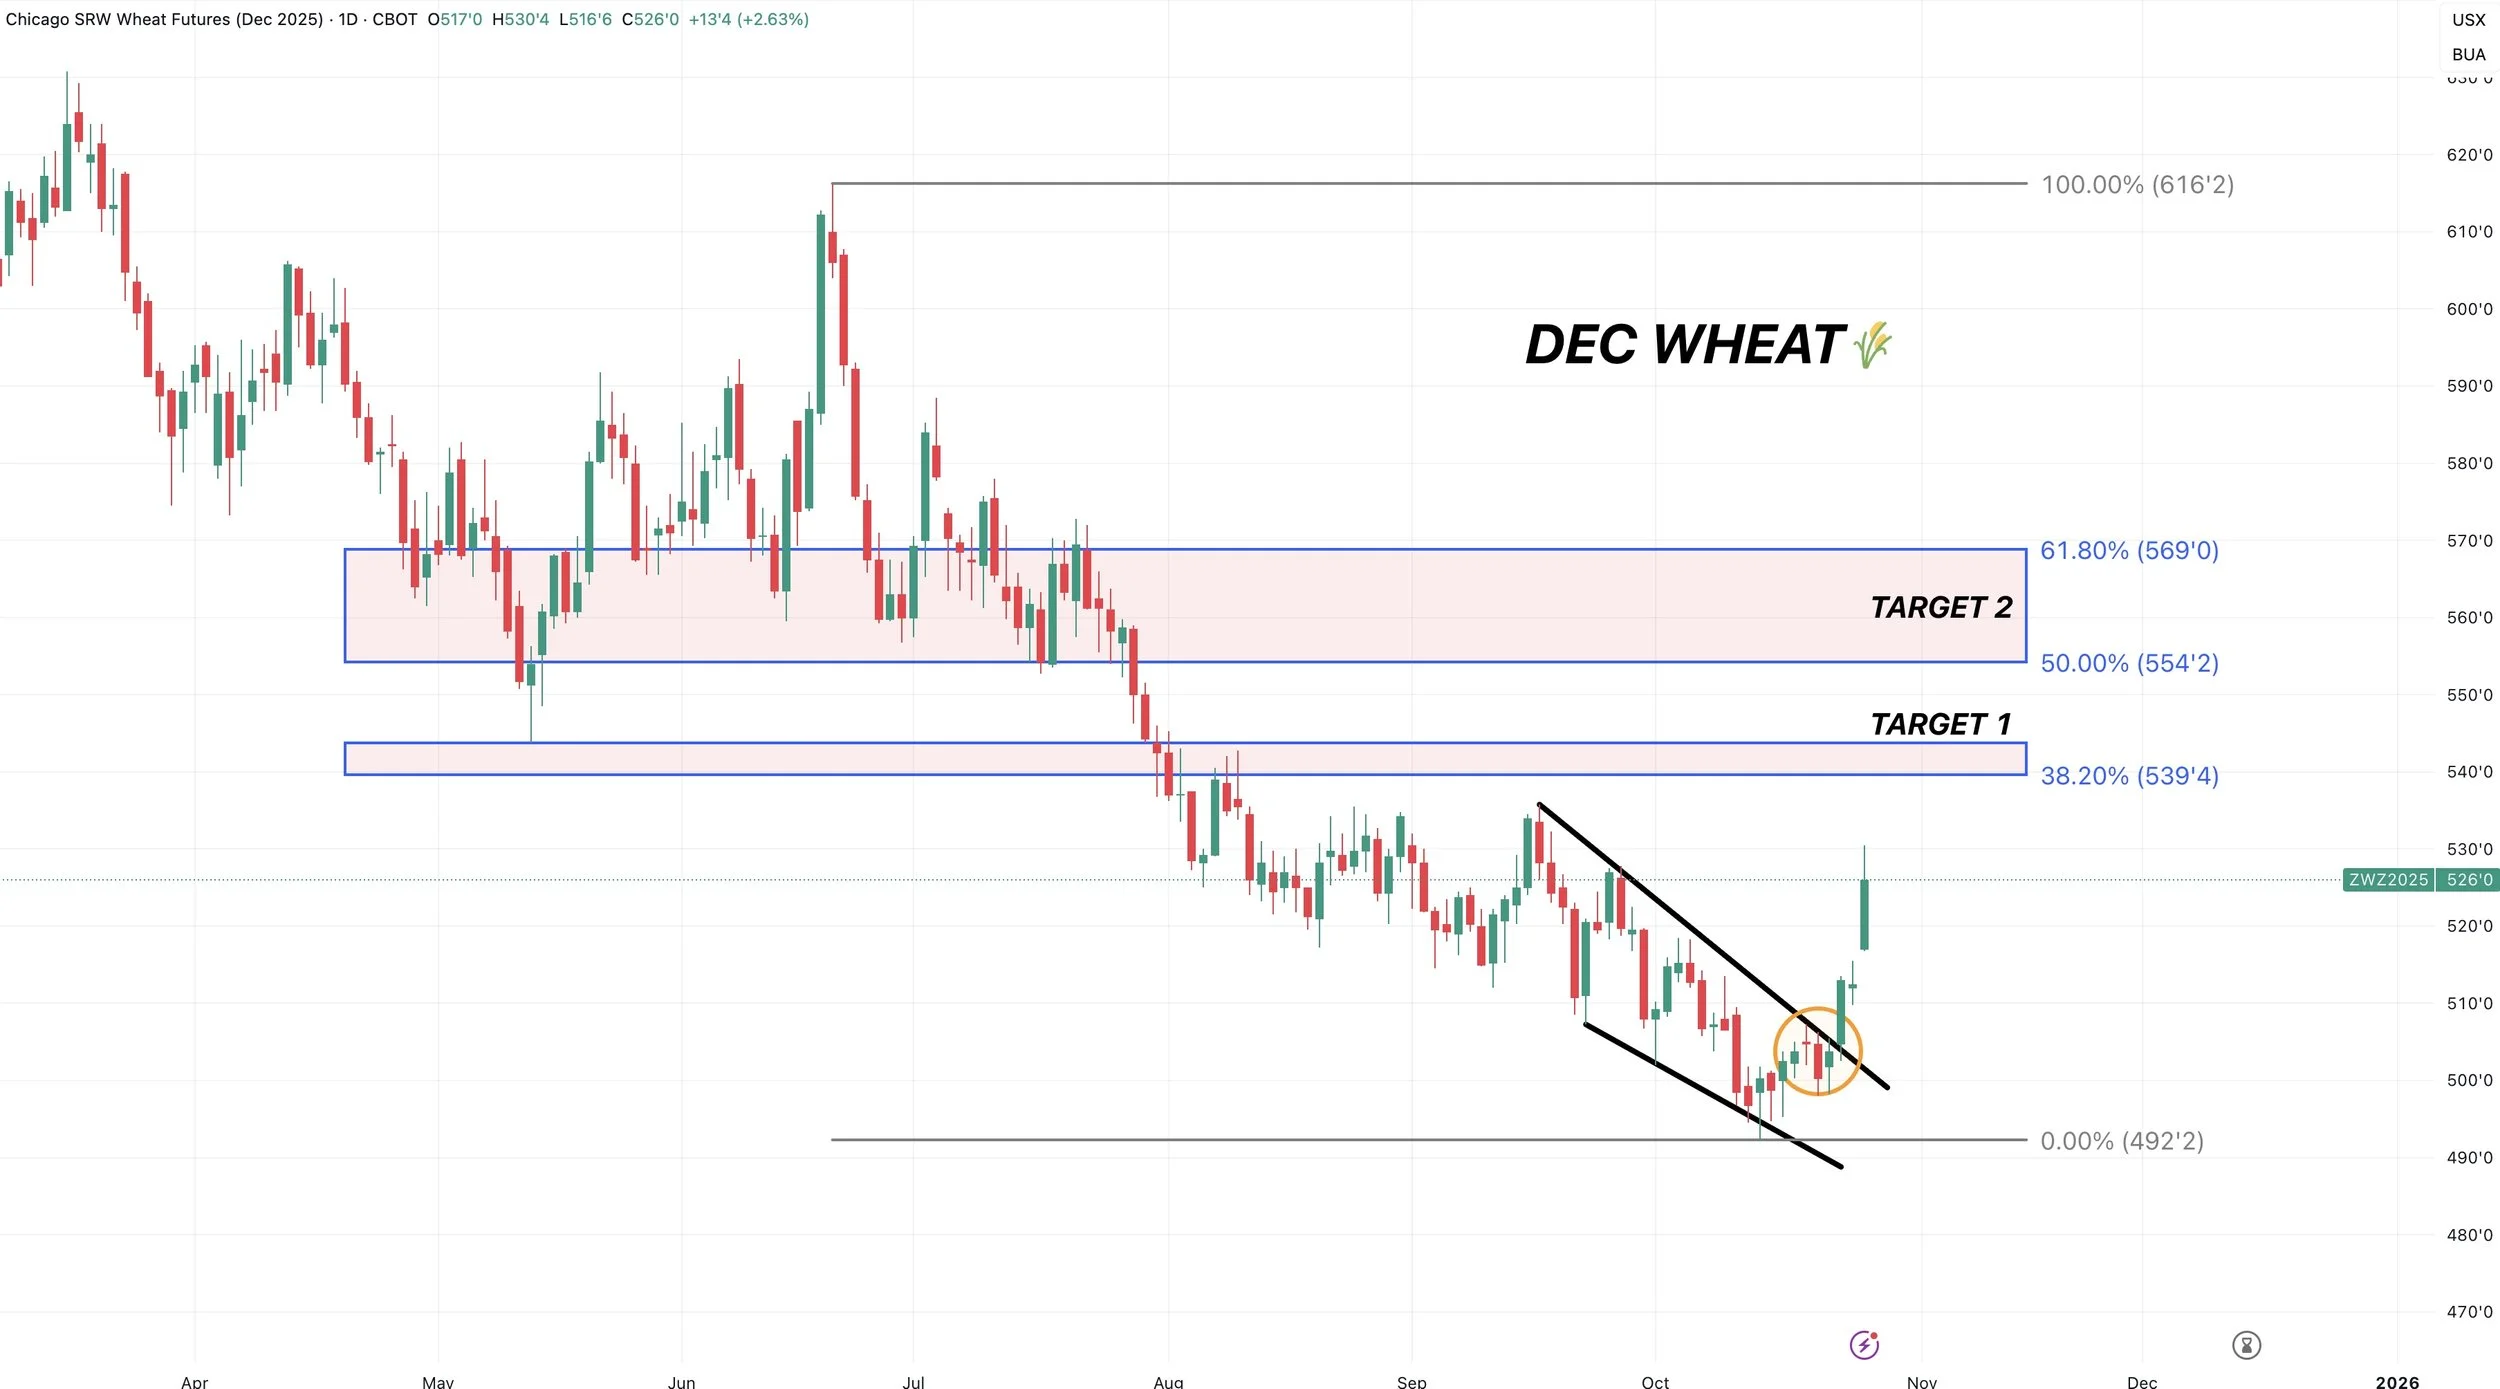
Dec Wheat 🌾
Finally got the break out we’ve been waiting for.
Still think we have room to run.
Dec Live Cattle 🐮
Not a good look here.
We talked about for weeks that if we broke below the 50-day MA it could very easily spark more downside. That was the must hold level and we failed to hold it.
We are now right below the 100-day MA. We need back above fast or the algos could sell this thing further.

Past Sell or Protection Signals
Oct 27th: 🌱
Soybean sell signal & hedge alert.
Oct 13th: 🐮
Cattle sell signal & hedge alert.
Aug 22nd: 🌱
Soybean sell signal & hedge alert.
July 31st: 🐮
Cattle sell signal & hedge alert.
July 10th: 🐮
Cattle sell signal & hedge alert.
CLICK HERE TO VIEW
June 5th: 🐮
Cattle sell signal & hedge alert.
June 2nd: 🌾
MPLS wheat sell signal.
April 10th: 🌽
Old crop corn sell signal.
March 19th: 🐮
Cattle hedge & sell signal.
Feb 18th: 🌽 🌾
Old crop KC wheat & old crop corn signal.
Jan 23rd: 🌽 🌱
Corn & beans old crop sell signal.
CLICK HERE TO VIEW
Jan 15th: 🌽 🌱
Corn & beans hedge alert/sell signal.
Jan 2nd: 🐮
Cattle hedge alert at new all-time highs & target.
Dec 11th: 🌽
Corn sell signal at $4.51 200-day MA
CLICK HERE TO VIEW
Oct 2nd: 🌾
Wheat sell signal at $6.12 target
Sep 30th: 🌽
Corn protection signal at $4.23-26
Sep 27th: 🌱
Soybean sell & protection signal at $10.65
Sep 13th: 🌾
Wheat sell signal at $5.98
May 22nd: 🌾
Wheat sell signal when wheat traded +$7.00
Want to Talk?
Our phones are open 24/7 for you guys if you ever need anything or want to discuss your operation.
Hedge Account
Interested in a hedge account? Use the link below to set up an account or shoot Jeremey a call at (605)295-3100.