
TRUMP ROLLERCOASTER. 2024 VS 2025 CORN
MARKET UPDATE
*No video today, only the written version. I apologize for the inconvenience. Normal video verson will be included on Thursday.
Futures Prices Close
Overview
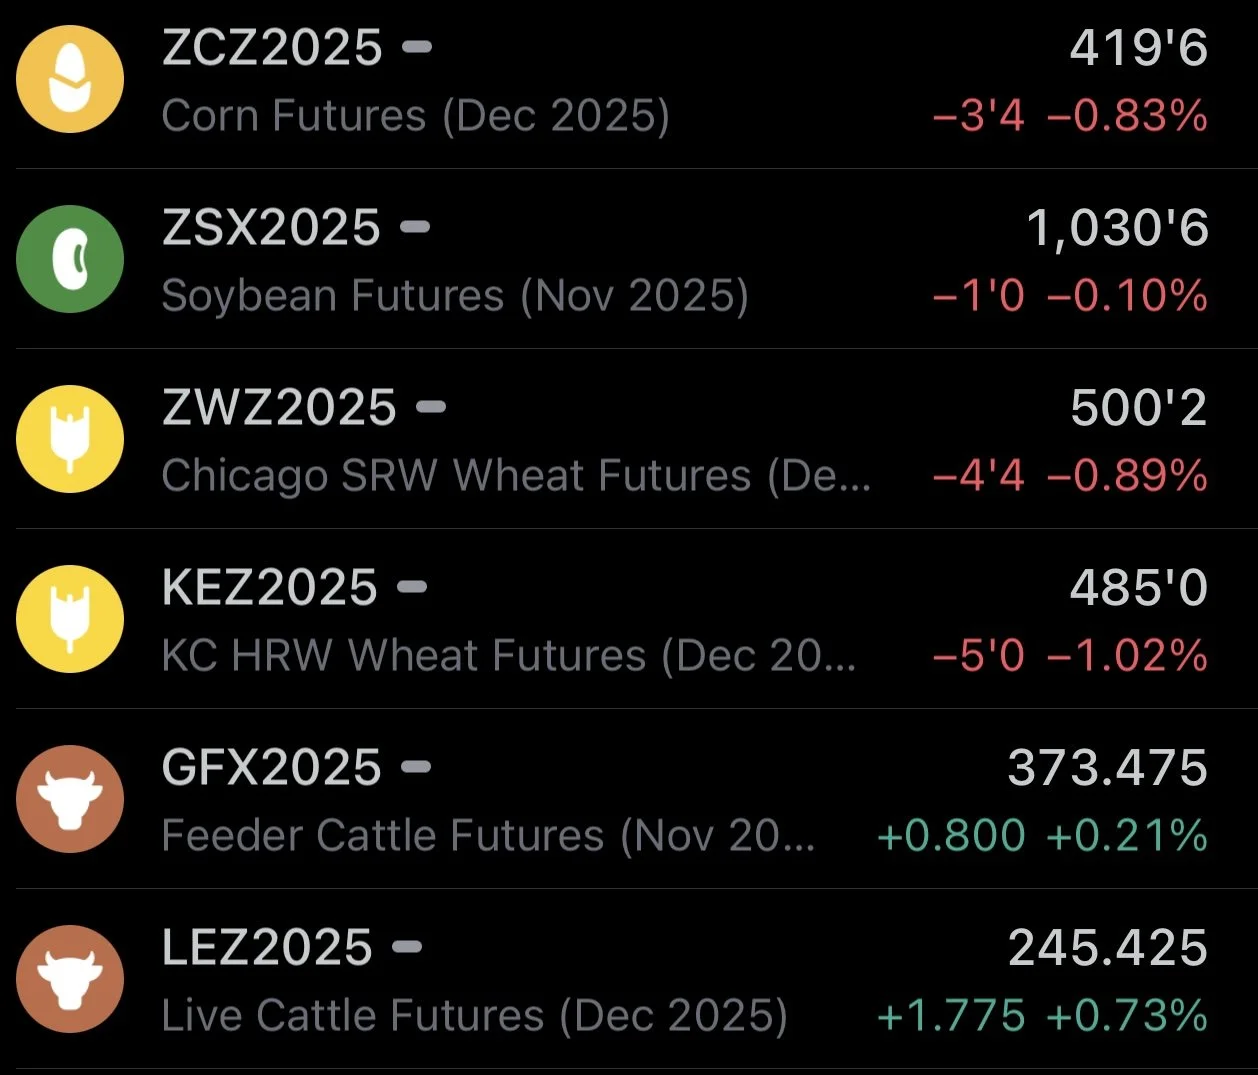
Grains lower across the board as corn posts it's first day lower in 6 days with soybeans down slightly after rallying +30 cents since last week. The wheat market continues to be the anchor.
Meanwhile, the cattle market sees some stabilization and has seen a small recovery following Friday's blood bath and Trump's comments about how he wants to lower beef prices.
There isn’t a ton of fresh news for the market to digust.
However, the Trump and China rollercoaster continues.
The recent rally in soybeans has largely been driven by trade deal optimism. The hopefulness that Trump is going to meet with China and a deal is going to be made.
Because that is exactly what Trump has made it sound like.
Today is a perfect example of the rollercoaster. One minute everything is completely fine and he says a deal will made, the next he says something that is the complete opposite.
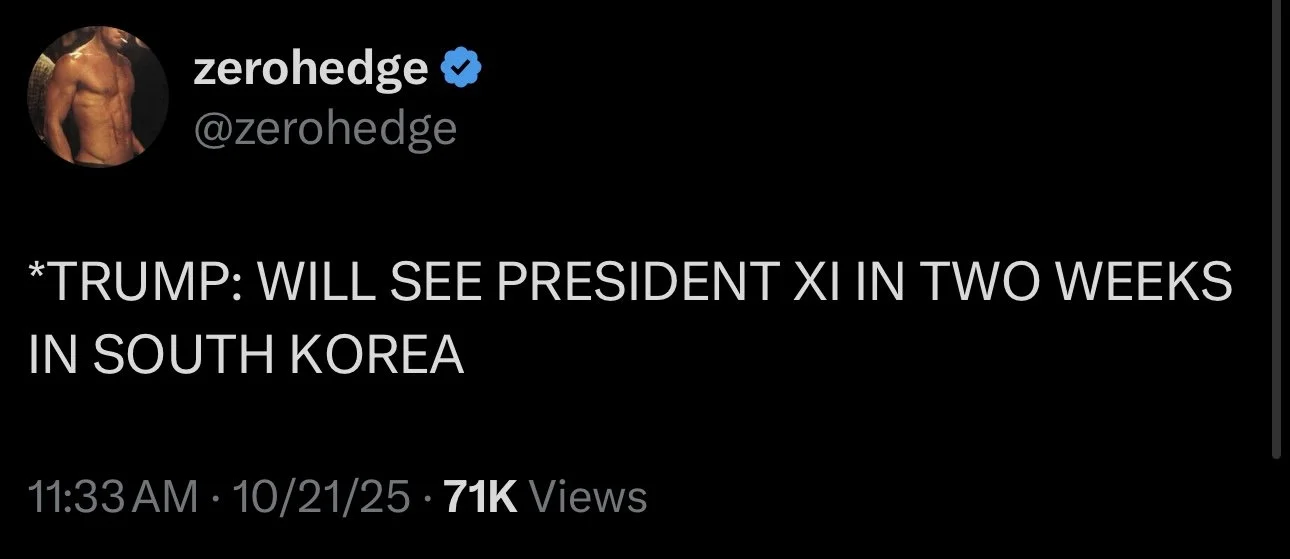
Here are the comments he made today and a timeline of when he said them.
11:33am: We will see President Xi in 2 weeks in South Korea. We will discuss a lot of things. We are going to do well in negotiation.
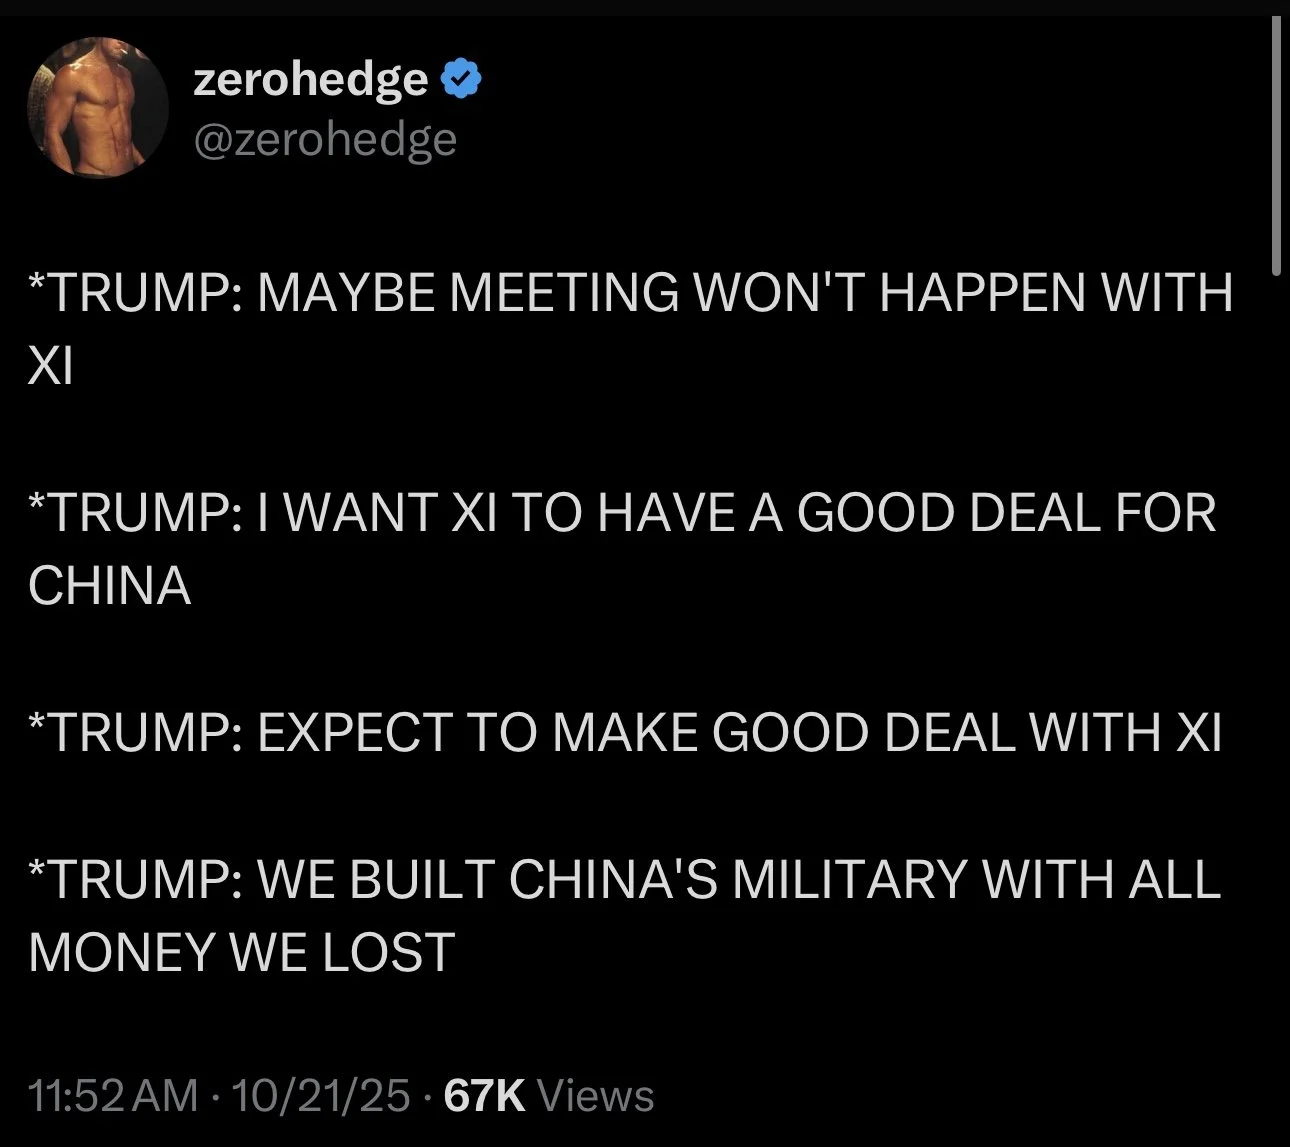
11:52am: Maybe the Xi meeting won’t happen.
In literally 20 minutes, he went from saying we are going to meet with China and get some negoation, to saying the meeting might not happen.
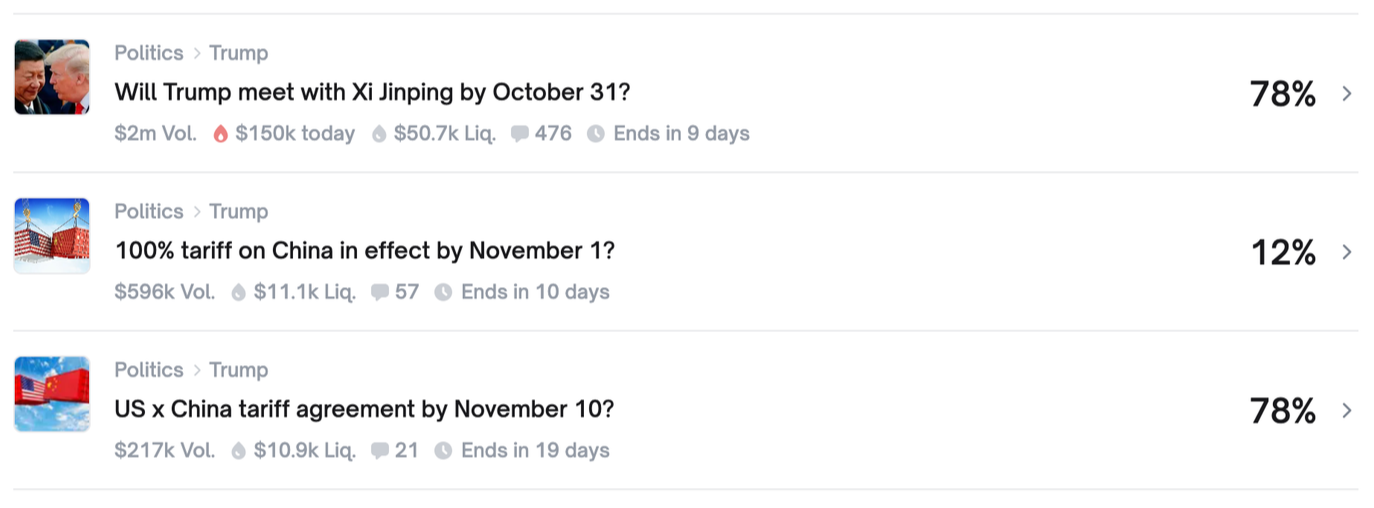
What are the betting odds telling us is expected to happen between Trump & China?
The current odds suggest:
78% Chance: Trump meets China by Oct 31st.
78% Chance: US and China come to a tariff agreement by Nov 10th.
12% Chance: 100% tariffs on China actually go into effect on Nov 10th.
So money is betting that they will visit and come to an agreement.
Here is the current odds for the goverment shutdown.
Right now it is expected to last until Nov 10th (40 days).
We are currently 20 days in.
Keep in mind, the November USDA report is also scheduled for Nov 10th.

Today's Main Takeaways
Corn
Fundamentals:
Corn is lower for the first time in nearly a week.
Fundamentally nothing has really changed.
The USDA is shut down, which means you have to rely on other things to get a grasp on what is happening.
Aka basis and spreads - what have they been saying?
Basis has been firming.
Spreads have been getting narrower.
Here is the Dec-25 and March-26 spread.
In early Sep, the spread was -18 1/2 cents.
Today it is -14 cents and tightest since all the way back in April.
Half of this move has came in the last week alone.

Why is this happening and what does it mean?
If basis is strengthening and spreads are narrowing, it means that demand is outweighing supply at the current point in time vs where it was when it was wider.
The market and buyers need the bushels now.
For buyers to buy grain, the first thing they do is firm the basis to get someone to sell. If that doesn’t work, they firm up the spreads to take away that incentive for someone to store it, and instead help incentivize you to deliver now rather than later. If that doesn’t work, they go and buy the board.
Generally, the path is usually basis firms, then spreads firm, then the board goes higher.
The spreads are telling us that something is up. It is probably suggesting that this crop is not as big as advertised.
Here is the current Dec to March spread (black) vs the Dec to March spread last year (blue).
We have been following a very similar path.

Last year, the crop was not as big as advertised.
It took until January for that to be realized.
Oct 2024 USDA: 183.80
Final 2024 USDA: 179.30

Here is the March-25 vs March-26 corn chart.
In this example, I aligned the harvest lows by moving March-25 corn back by 2 weeks. As last year the market bottomed on Aug 27th, this year we bottomed on August 12th.
Last year, this market didn’t really take off until January, before ultimately topping in February.
Up to this point, the two years have been following a very similar price path.
We got that summer sell off.
We got that August harvest low.
We got that rally off of the harvest lows heading into September.
The rallies off the lows were almost the exact same size.
We are now seeing a correction off those highs like we did last year.
The two years are NOT going to follow each other exactly.
But there is a chance we continue along the same path.
Perhaps trend sideways for a while until getting the real opportunity heading into the end of the year and into next year.
(Mar-25 = Black) (Mar-26 = Orange)

Overall my thought process remains the same.
We have too much supply to get overly bullish. But record demand should keep a floor under this market.
We also priced in about as bearish of a scenario you could possibly imagine back in August with a crop that is getting smaller. There just isn’t a reason to get super bearish.
The action in the spreads is also pretty optimistic.
Corn Options Trading Strategy
For those of you that have a hedge account with us, here is an options strategy we sent out to some of you.
If you are being forced to sell corn, this could be a good strategy.
As this strategy is cheaper than paying interest or DP charges.
For those that do not have a hedge account and would like one with us, they are always a great tool to have.
Click Here to Open Hedge Account
The Strategy:
2 March 4.45 Calls vs 1 Short December 2026 5.00 Call
Total Cost: roughly 1.5 cents
Overview of this strategy:
As a hedger, what this trade does is re-owns 2x the bushels of old crop corn. Presently, March corn is 4.33, so the 4.45 calls are within 12 cents. These calls will cover you for 122 days.
They get you a month past the January USDA report, these March calls expire around the same time we made our highs last year (mid-February).
The Opportunity:
There is always the possibility that the USDA does not have a report until January. Which could open the doors to a big market shock.
If a trade deal with China includes corn and our yield is sub 180 or even as low as 175, the market could be off to the races.
In exchange of the 2x re-ownership, we are selling 5.00 December 2026 calls in hopes that we will have 5.00 plus new crop at some point.
Possible Exit Strategies:
1) The Market Goes Up:
The market takes off on a profitable trade. We will have made money on the long calls and potentially lost some money on the short calls. However, we have twice as many long calls vs short calls to compensate. March corn is at the lower end of it's range while Dec corn is more sideways. Which is why we think this spread could come together, benefiting the strategy.
2) March Calls Expire Worthless:
If this happens, we will have an opportunity to buy back the December calls at a level less than where we sold them. We will also have the option to roll them up and out if we want to continue to see how the market plays out.
Call or text us if you would like to discuss this strategy.
(605)295-3100
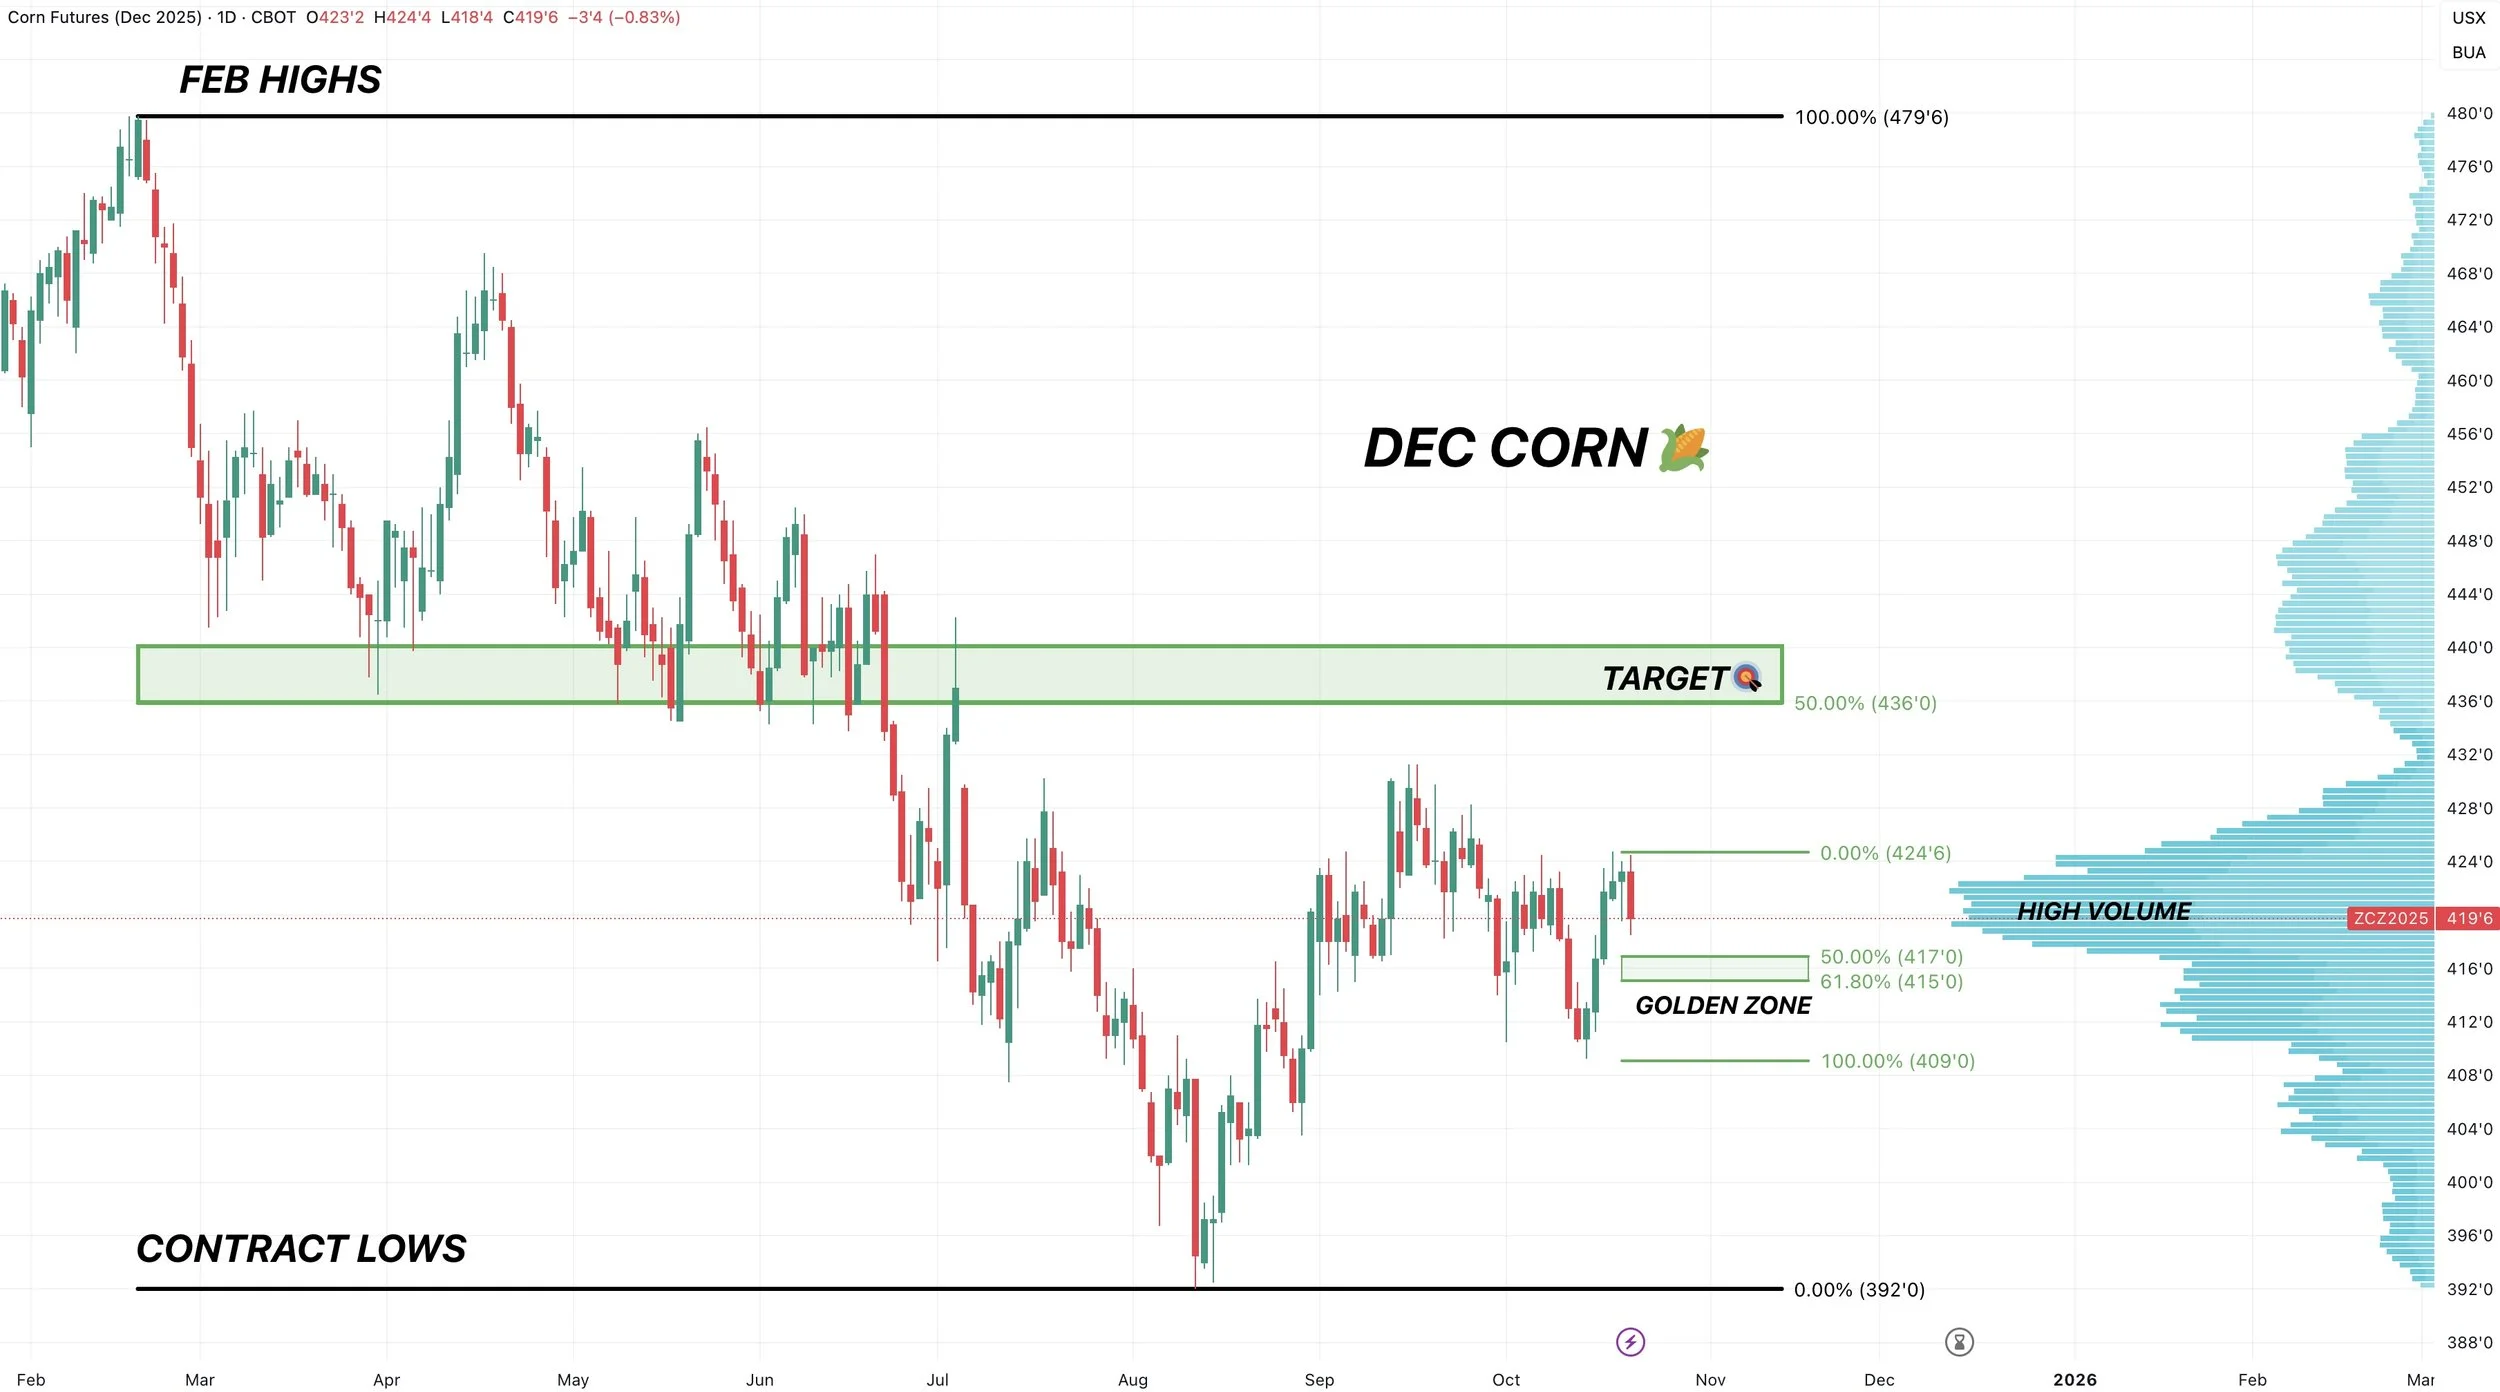
Technicals:
We have been talking about this $4.23 level for a while in Dec corn.
We rejected right at that level.
That is the level we need to break above to spark more upside.
As it reclaims 61.8% of this sell off from September. Which is the most common spot for a relief bounce to fail at.
If we bust above this level, more often than not it tells us we are in for some more upside. As it is no longer viewed as a relief bounce.
First upside target is still $4.35

Here is a chart that shows all the volume for corn (blue bars on the chart).
Currently, we are at an extremely high area of volume.
So this general area "should" offer some support.
Level in the sand we need to hold is $4.15, as that gives back 61.8% of this recent mini rally.
Personally I think we hold.
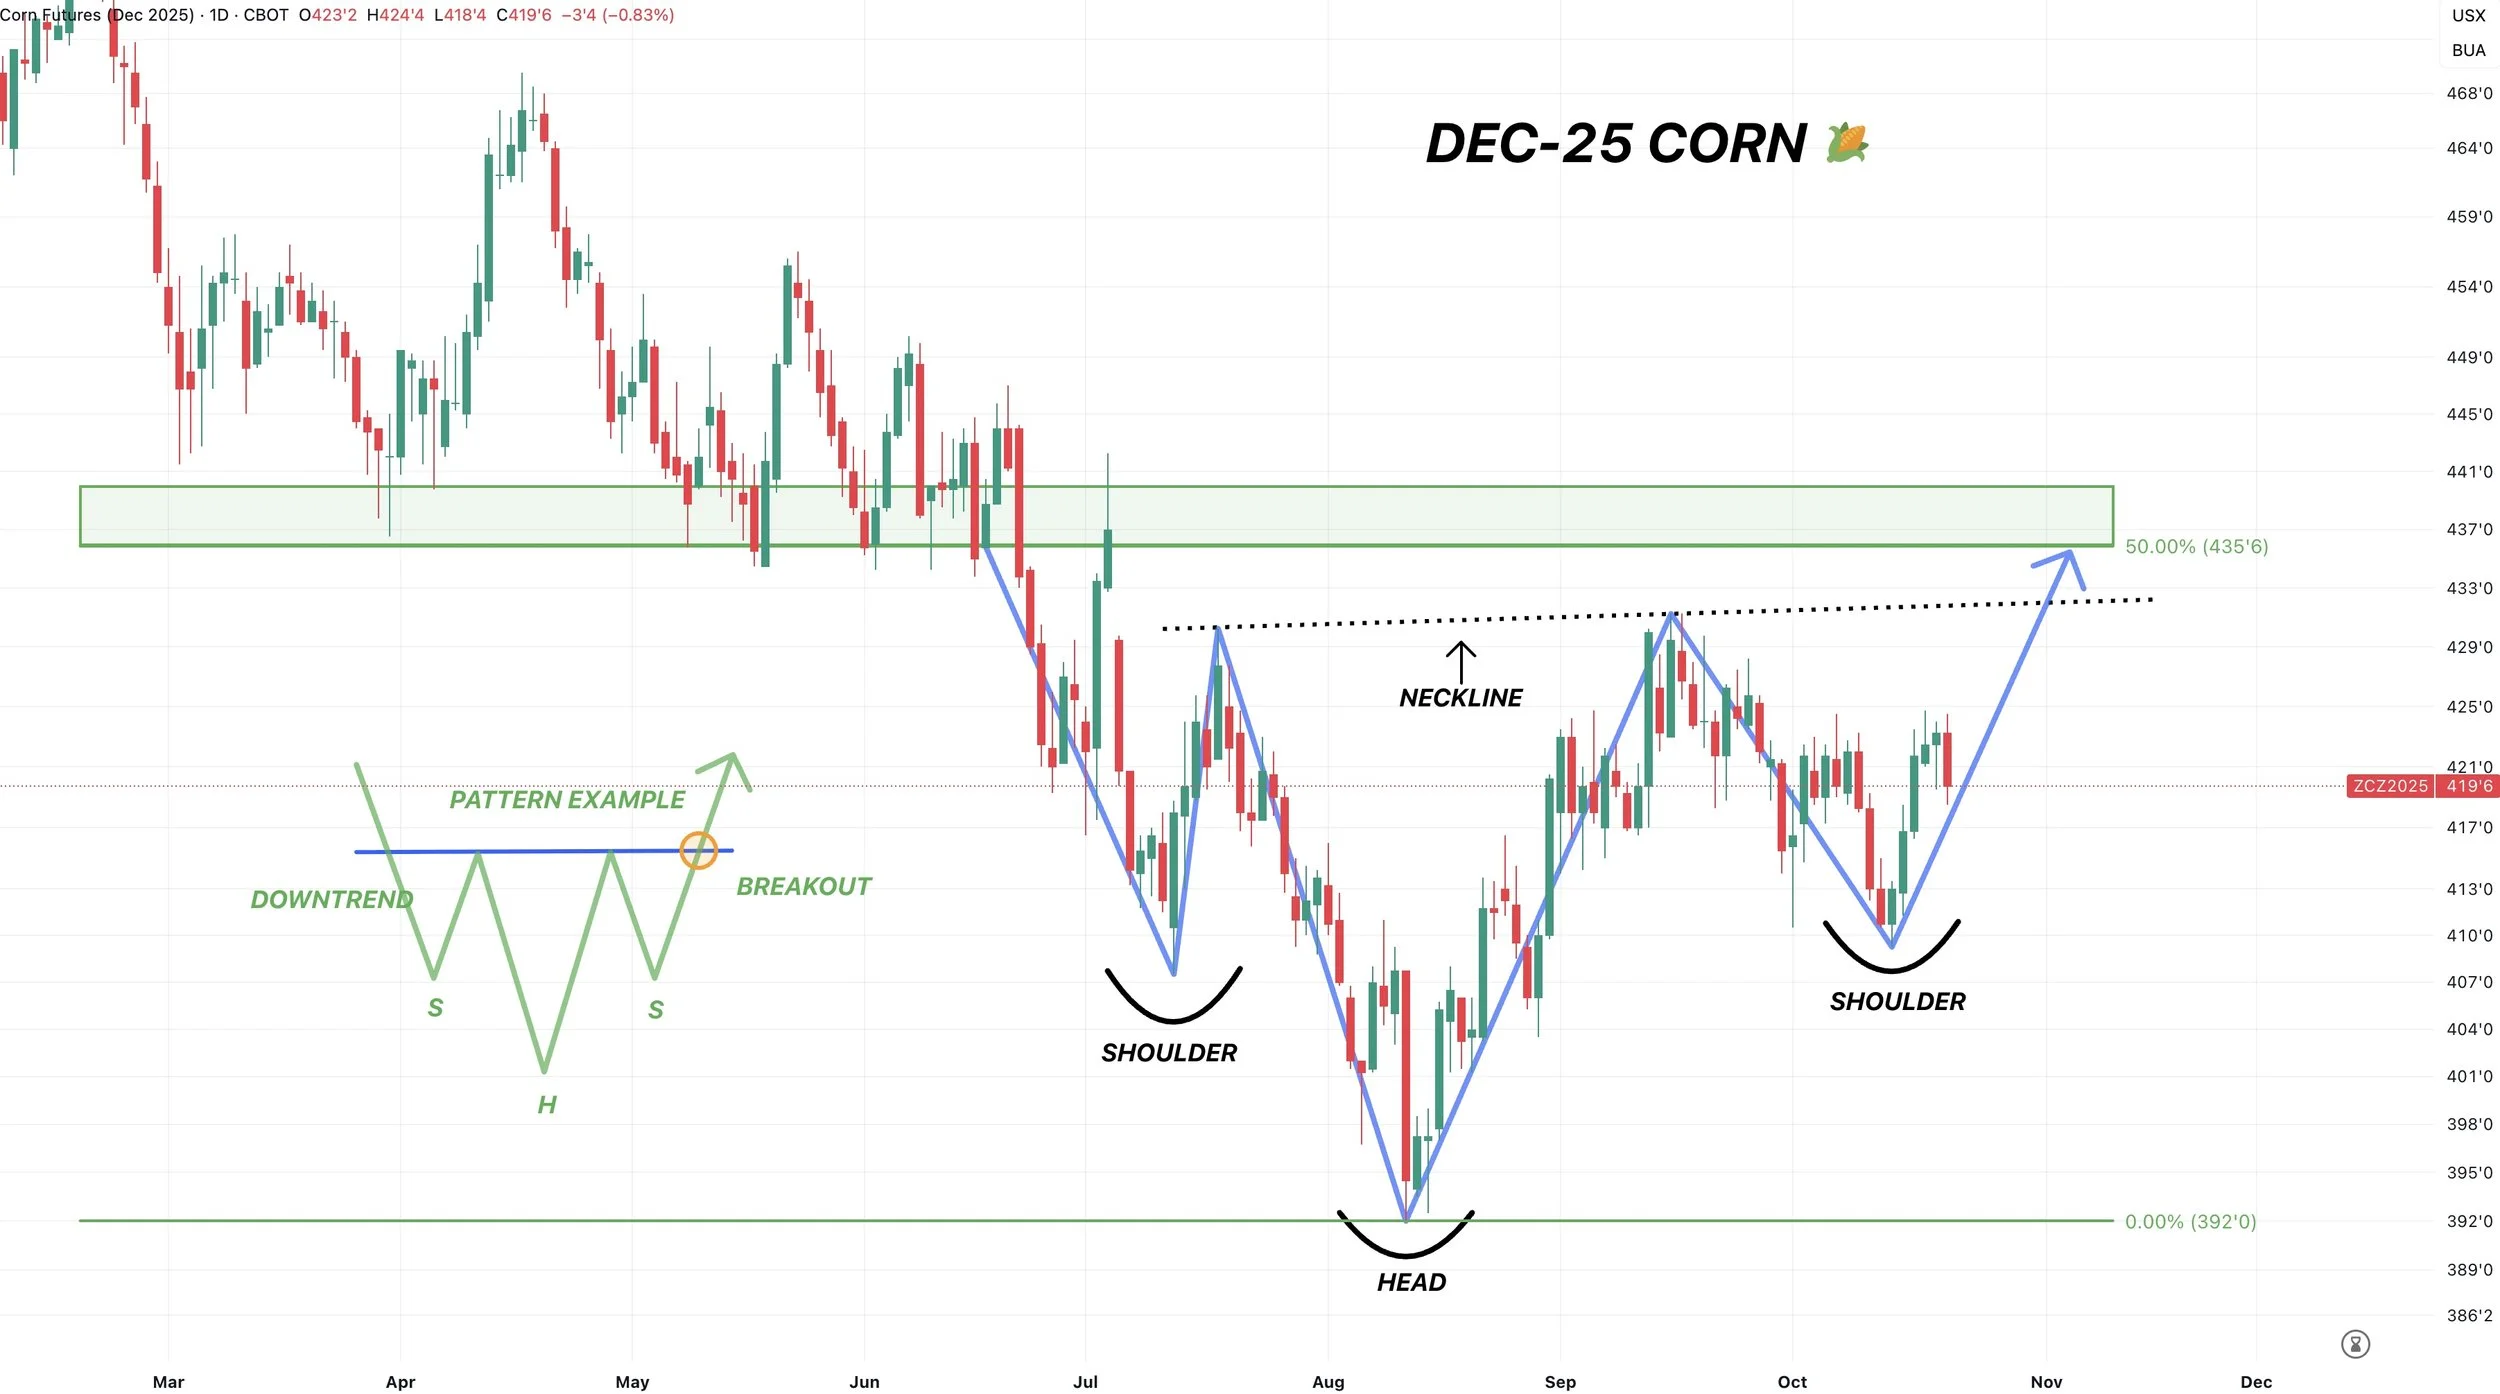
The potential inverse head & shoulders pattern still looks solid.
If we break above the neckline, then things become very interesting.
Soybeans
Fundamentals:
Soybeans recent rally has been driven by trade deal optimism.
The sell off a few weeks ago was driven by headlines saying Trump and China wouldn’t meet, now we are recovering due to the thought process that they will.
Yesterday Trump made yet another comment on soybeans.
As he said he wants China to buy soybeans. At least the same amount of soybeans they bought last year, and he said was confident a soybean deal would be made.

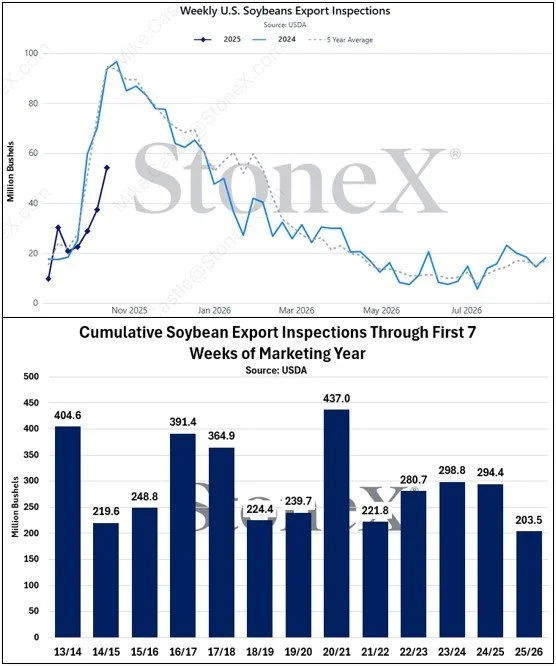
Soybean export inspections finally showed some seasonal strength. Coming in well above the expectations. However, they are still down -30% vs last year.
Export inspections up to this point are their worst in at least a decade.
Soybean exports are currently -3% behind the USDA's forecast.
Chart from StoneX
Unlike soybeans, corn & wheat export inspectations are some of the best on record.
Through the first 7 weeks of the marketing year, wheat is the highest in 14 years while corn is the highest of all-time.
Chart from StoneX

I don’t have a ton else on soybeans today as we've done deep dives on the fundamentals and balance sheet scenarios plenty of times.
How the Trump and China meeting goes will play a large part in the direction we go here.
If we get a trade deal, and Trump is somehow able to get China to buy our soybeans, this market has all the upside in the world.
According to Arlan Suderman of StoneX, even with Brazil, China is still going to need an extra 370 million bushels of soybeans from somewhere to meet their needs until Brazil's crop is available in February.
He stated that if we are able to secure that business they need, it would allow us to hit the USDA's export target for the year. Which is already lower than last year's.
If China buys more than that, it paints a really bullish scenario given that there is zero room for error on the supply side of the US balance sheet like we've went over many times before.
Technicals:
Soybeans posted new highs for the move yesterday and today.
We are currently rejecting the 61.8% retracement up to those August highs.
If we can bust above $10.36 it usually suggests more upside.
So that is a major spot we need to close above.
We are also battling some downtrend resistance.
I do not have an exact sell signal target yet, but it will be somewhere near the top of the range if we can get there.

Wheat
Fundamentals:
The biggest piece of news was Russia's IKAR once again raising their estimates for the Russian wheat crop.
They raised it to 88 MMT, which is +8% bigger than last year's 81 MMT and higher than the USDA's current estimates of 85 MMT.
Demand like we mentioned, is the strongest it's been in over a decade.
But the wheat market just can’t find that catalyst given that the world has plenty of supply.
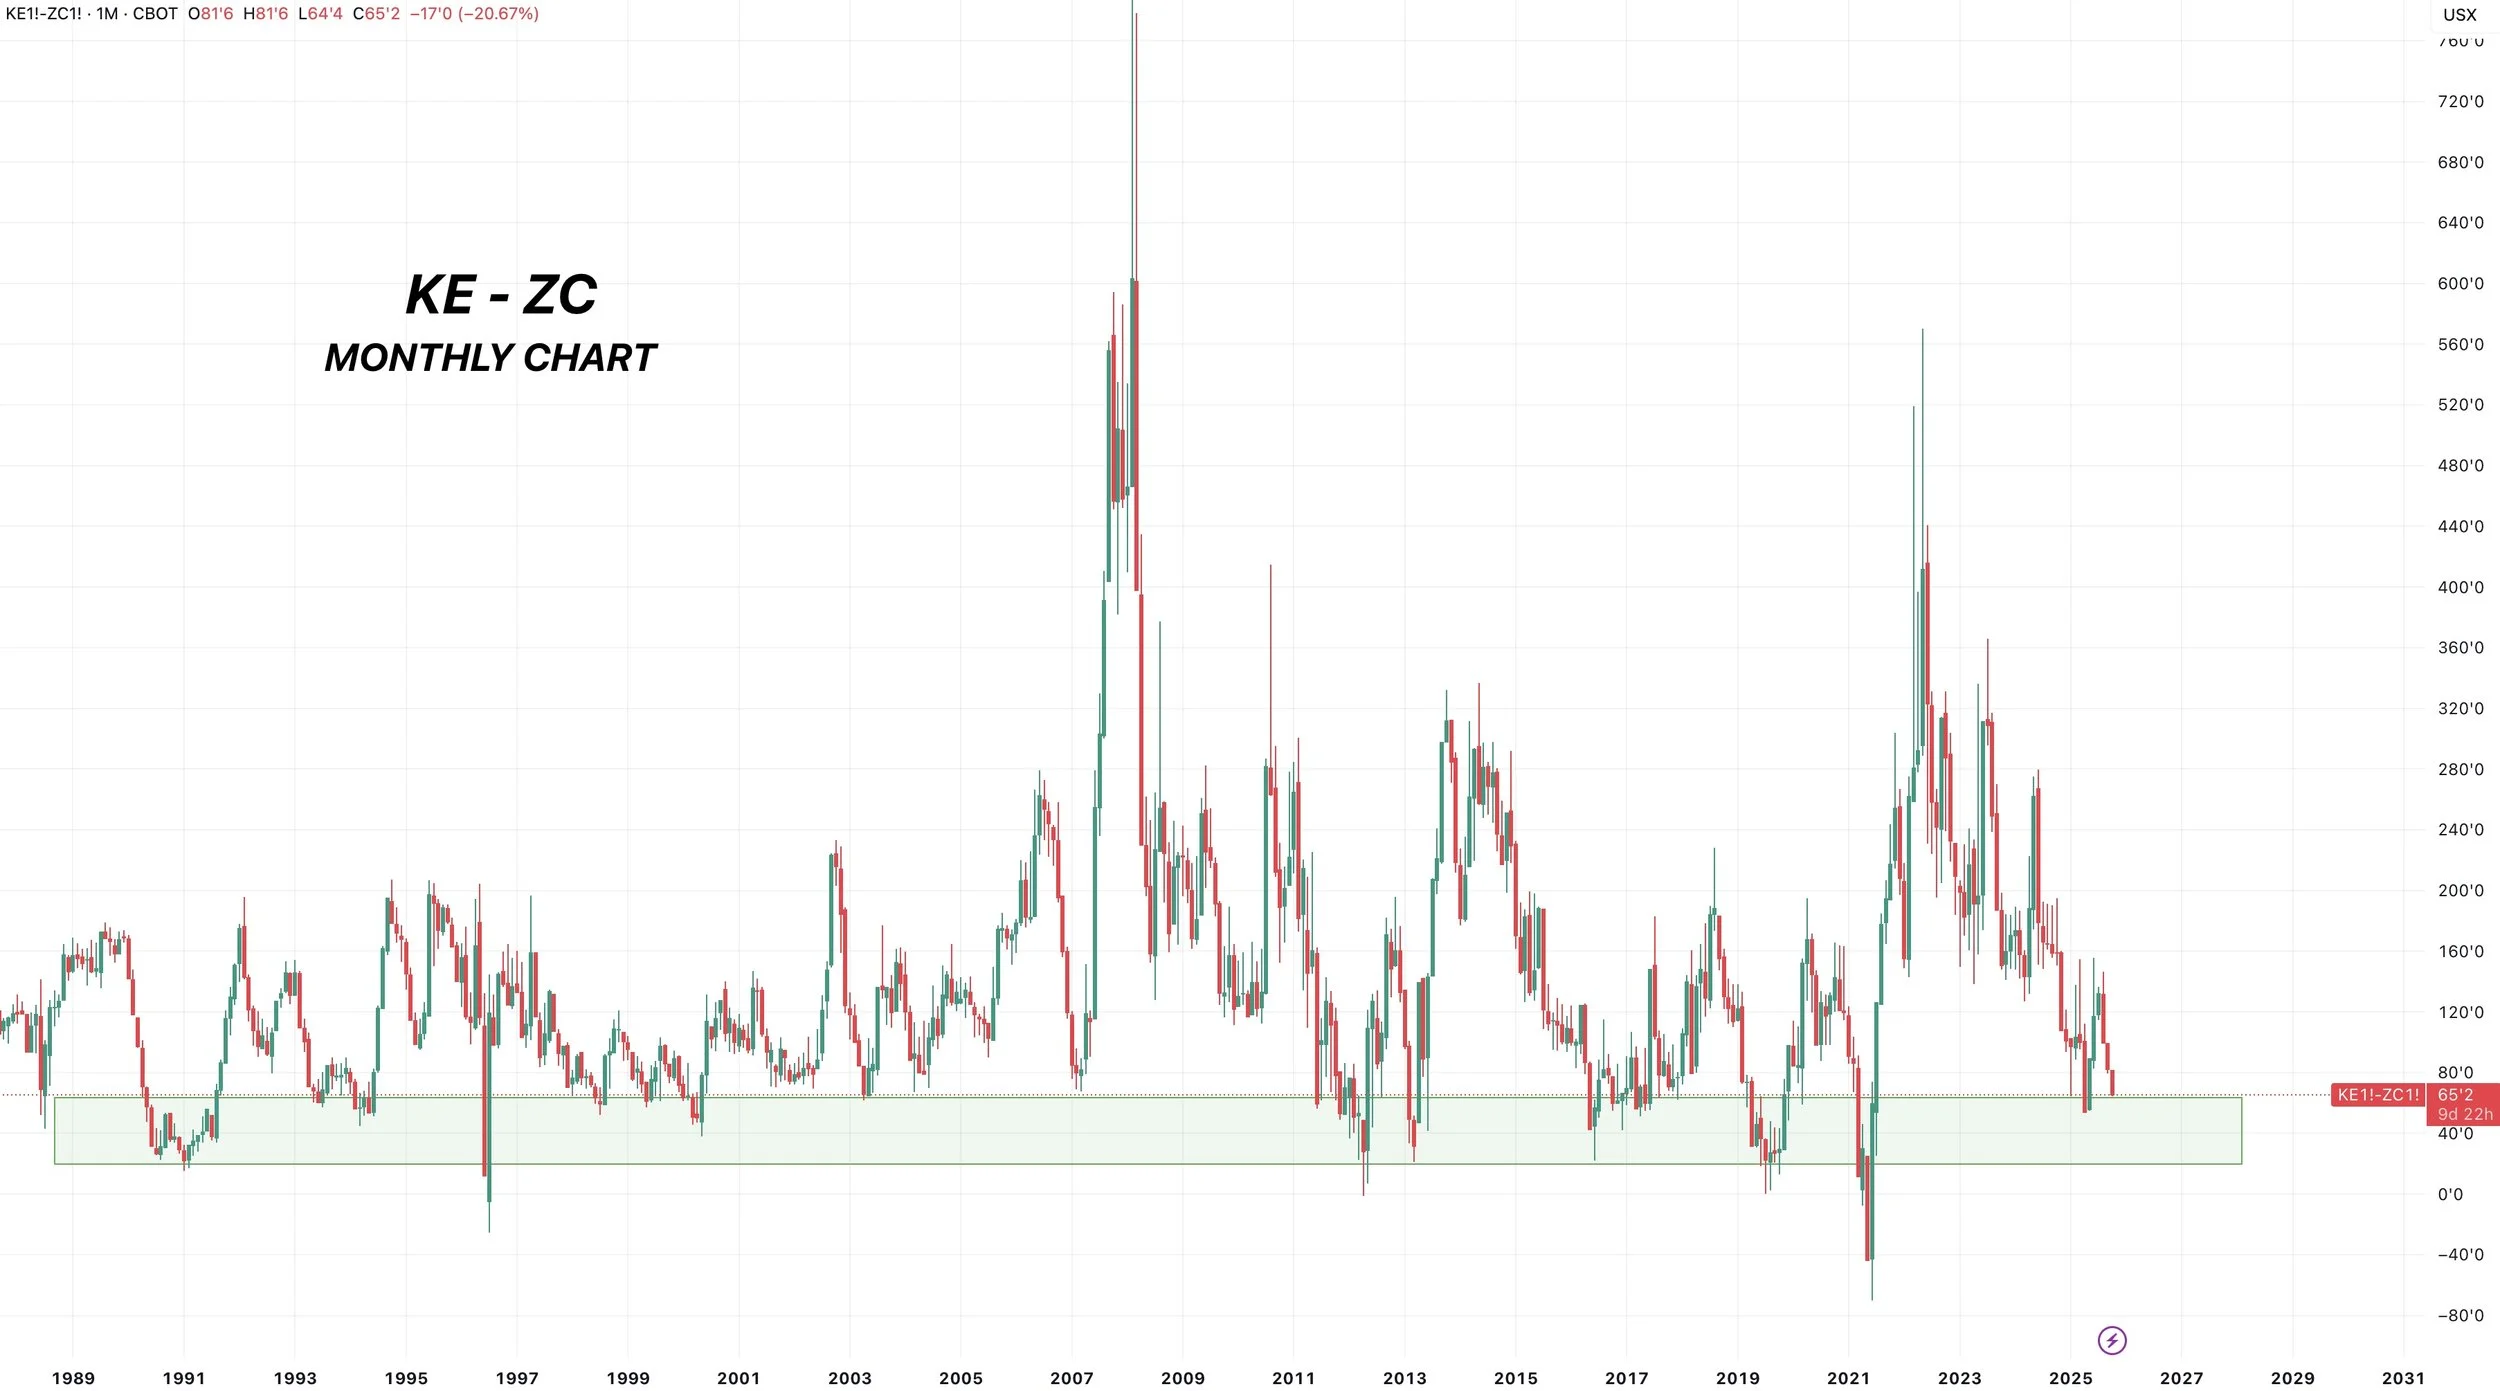
Here is a fun chart.
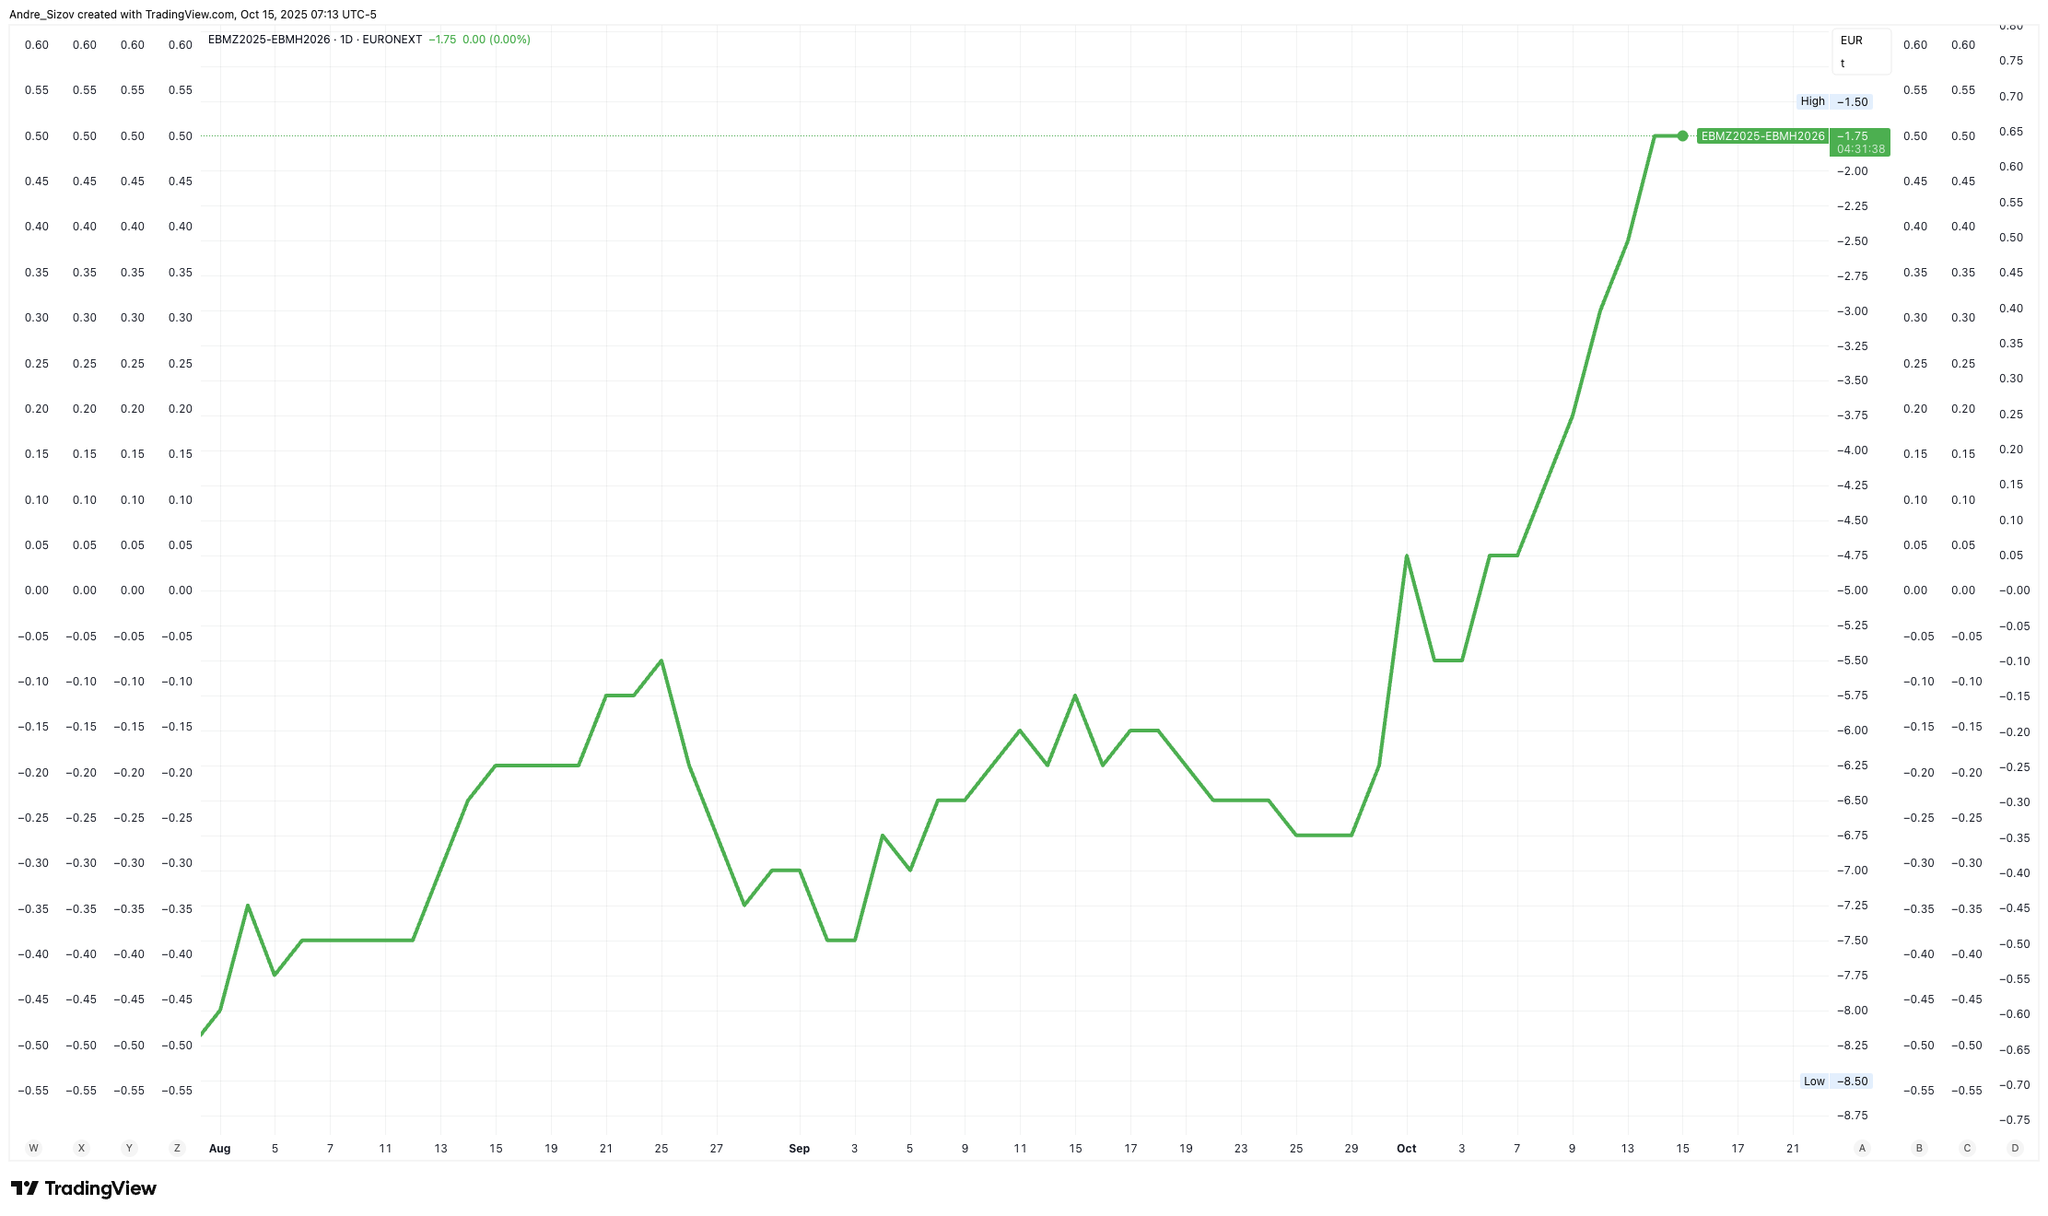
This is the KC wheat to corn spread.
It is at some historically low levels.
Either wheat is cheap, or corn is overpriced.
I really don’t think corn is overpriced at these levels.
We are seeing matif wheat spreads rally (European wheat).
This is indicating stronger short term demand or some supply tightness in Europe.
If matif wheat prices rally, this helps US remain that much more competitive on the export market.
Chart from Andrey Sizov
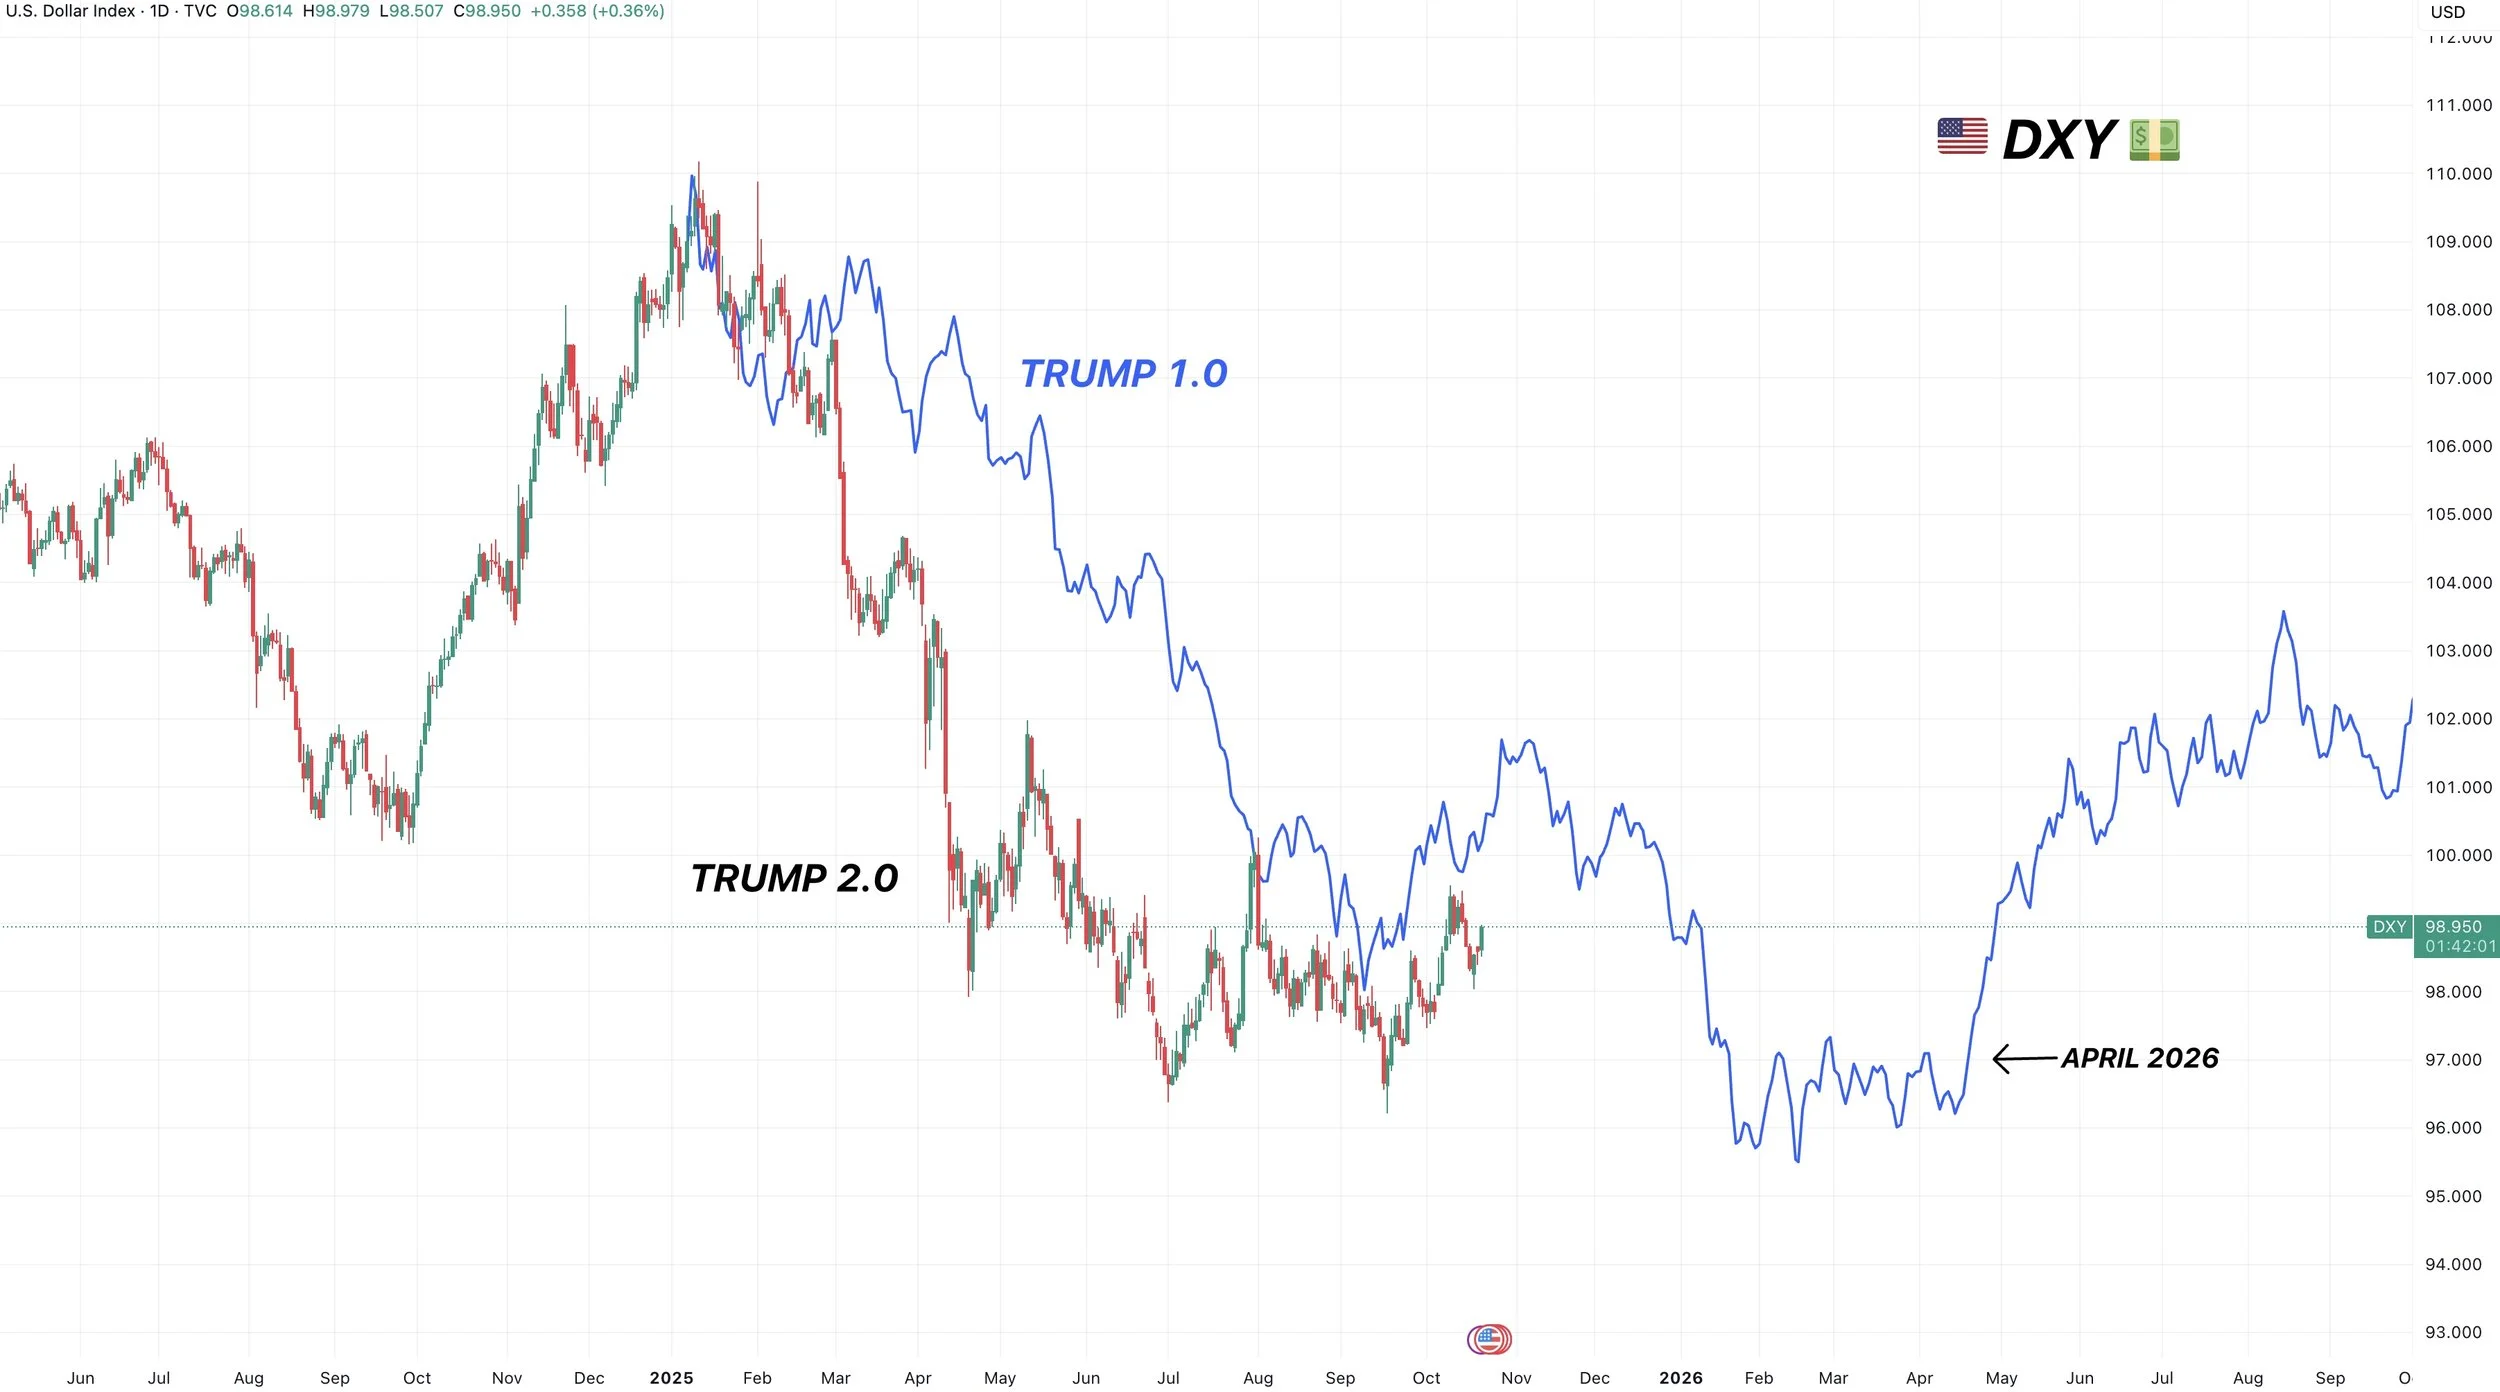
Here is the US Dollar Index with Trump's first full year in office (2017 in blue) vs the US Dollar Index today.
So far, they have been following an extremely similar path.
It isn’t going to make this market rally tomorrow and it doesn’t have to at all.
But if the dollar stays suppressed until sometime next year, that is only going to help increase our export demand even more.
Dec Wheat Technicals:
I have no idea when this market will turn around.
But when it decides to do so.. I think we realistically have at least +40 to +50 cents of upside.

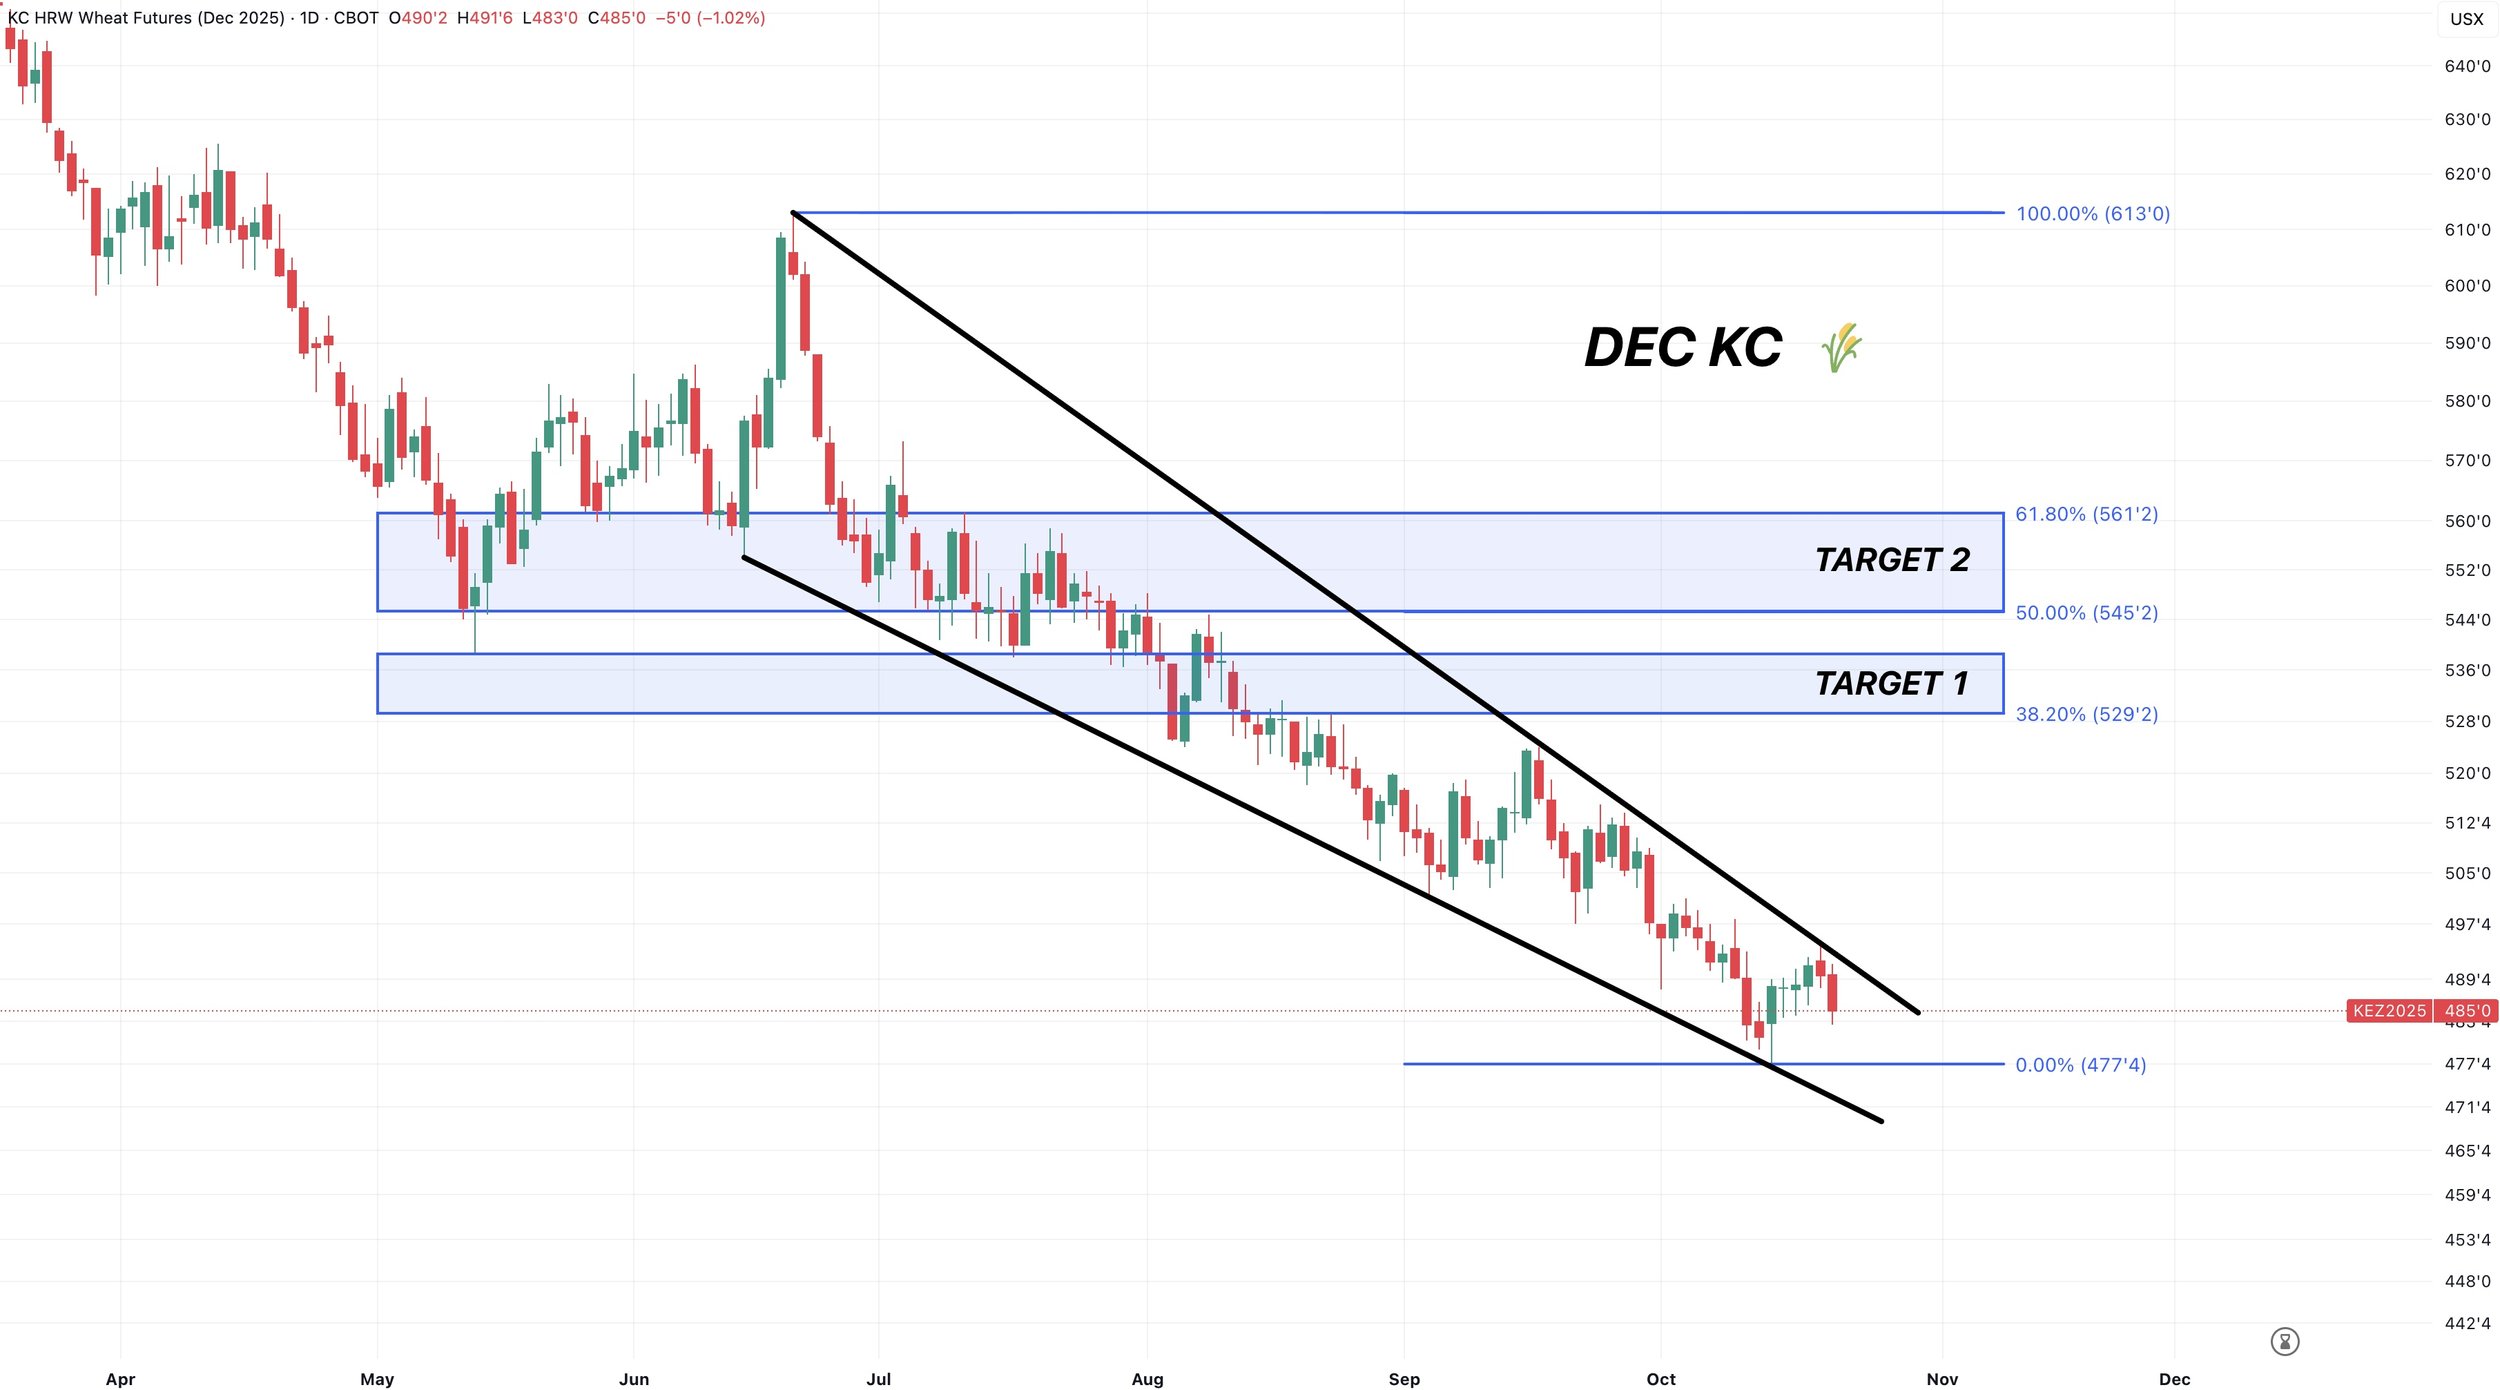
Dec KC Wheat Technicals:
KC rejected right at downtrend resistance.
Bulls waiting for a breakout.
If it comes, there is plenty of upside.
Cattle
Fundamentals:
As you already know, Trump said he wants to lower beef prices.
Trump said he will buy Argentine beef to help bring down prices for Americans.
In reality, buying Argentine beef doesn’t really make that big of difference.
He has not yet removed the tariffs on Brazil beef. If he did that, it would be a negative factor. As they are the largest exporter of beef in the world.
The market simply sold off on the headline that he wants to get beef prices lower.
Even if the bull market continues.. if your President is saying that they are working on lower prices, it is probably a good idea to keep some protection under this market.

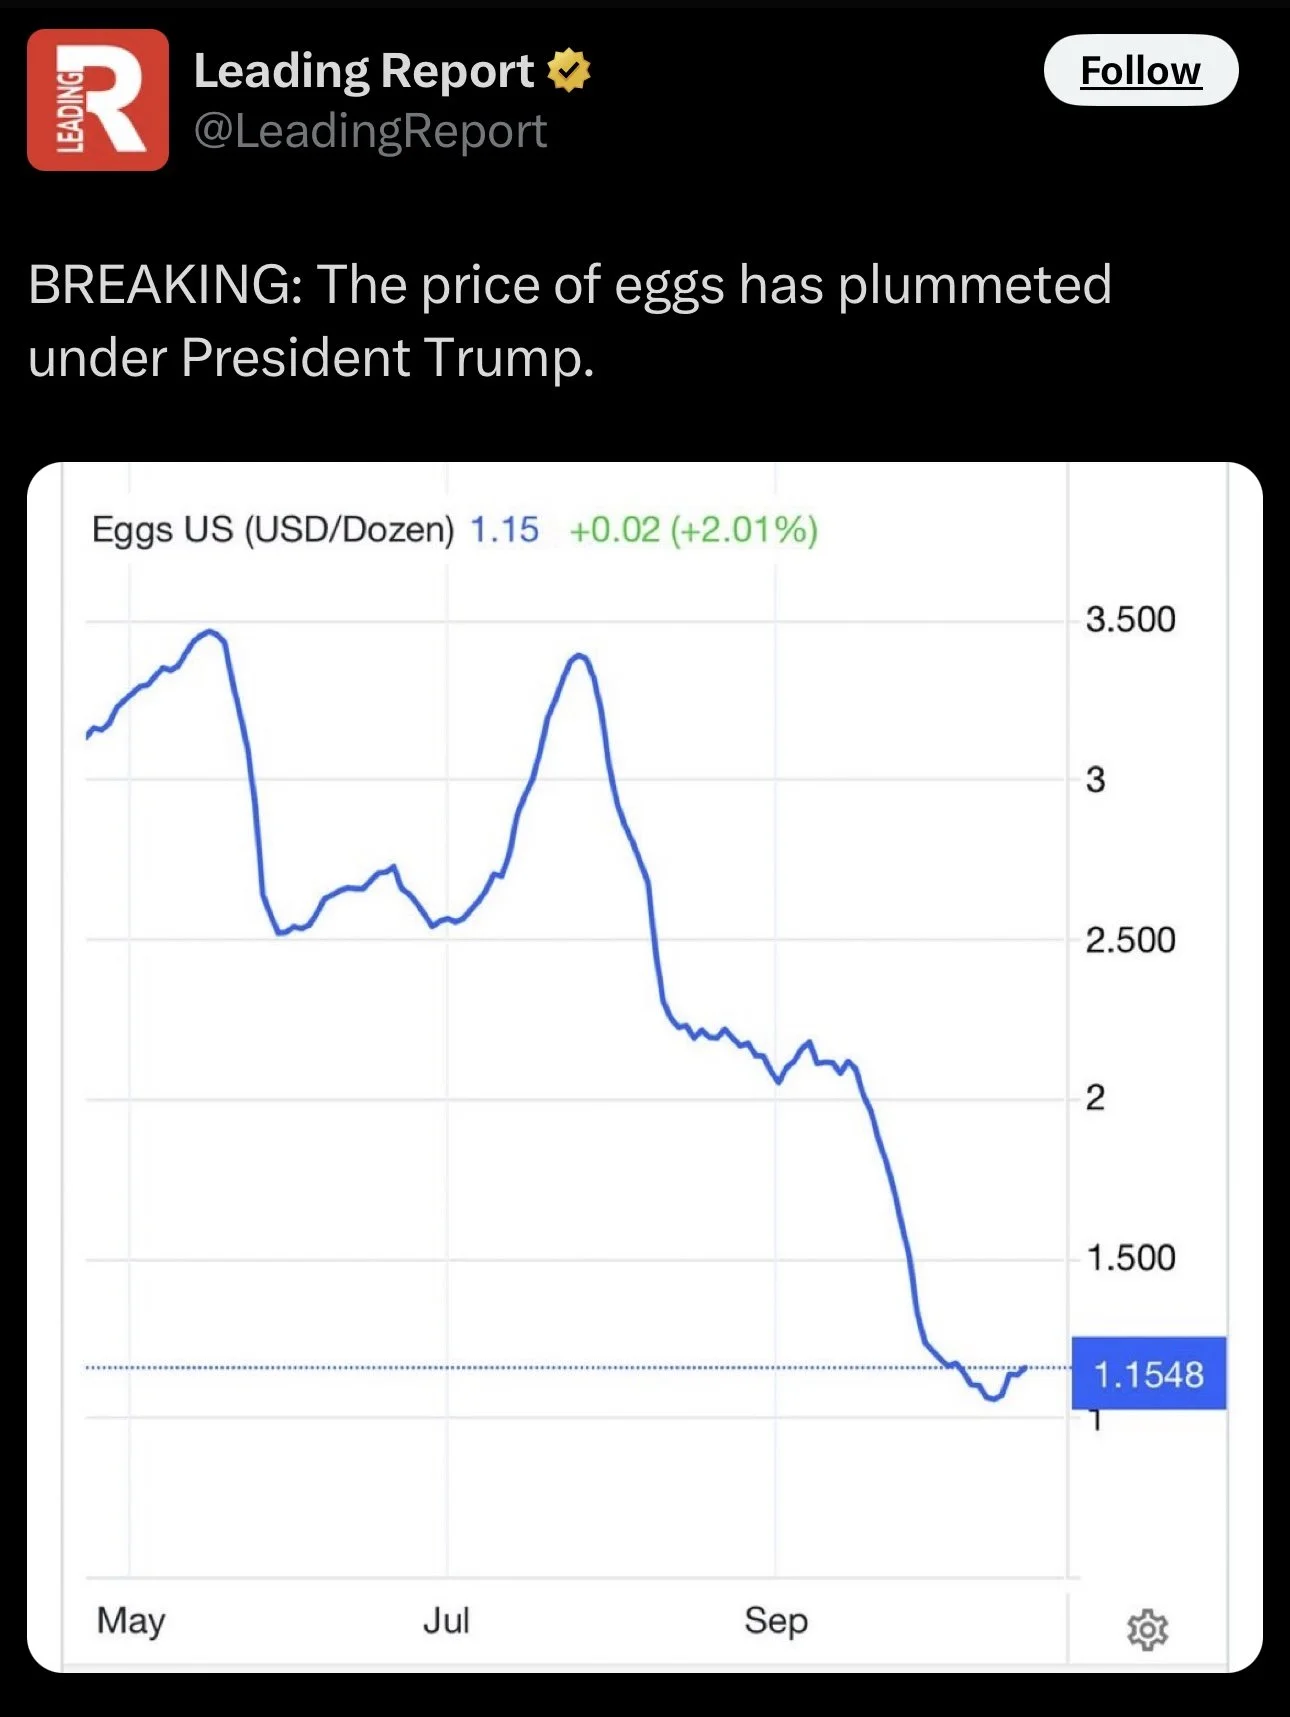
The government thought egg prices were too high.
So look at what they did to egg prices.
Cleary cattle and eggs aren’t the same market. But if the goverment is actively trying to lower the price of something, it makes sense to defend all-time highs.
Here are some thoughts from our partner Lauren over at Texas Hedge when asked about if Trump could really lower the price of beef.
She said:
"He could facilitate a trade deal with Argentina. He could lower Brazilian beef tariffs. He could re-open the Mexican border.. Almost half of this rally was manufactured (by the government) to begin with."
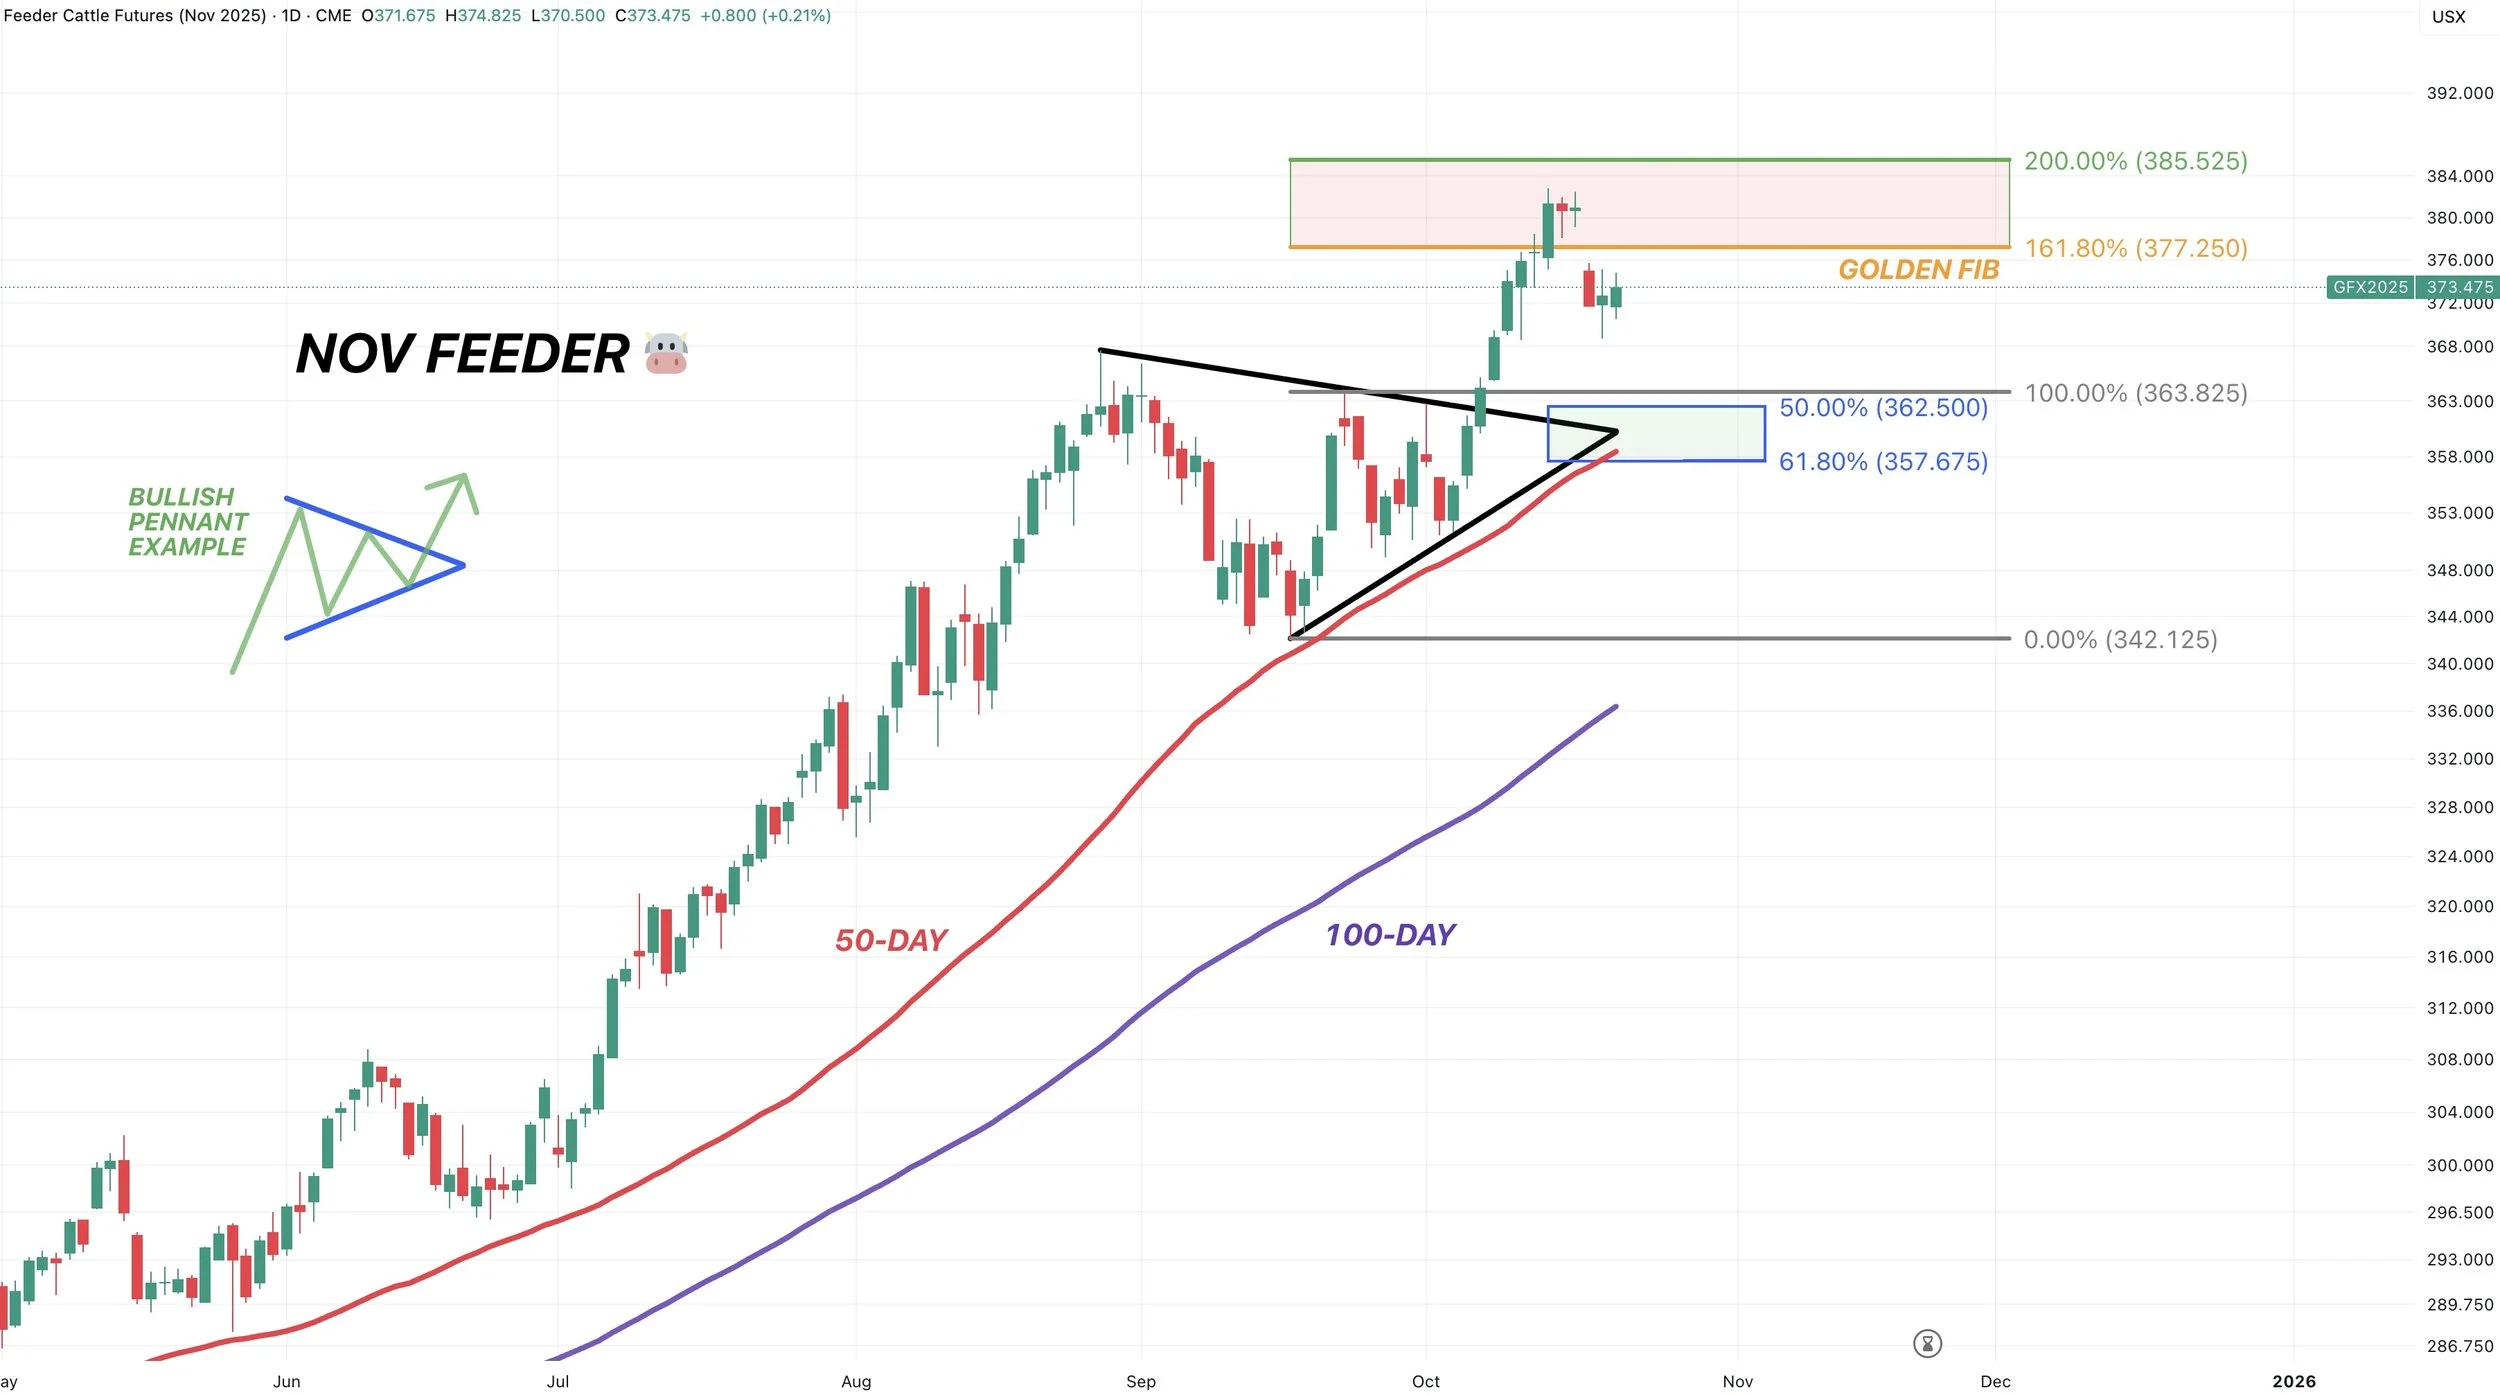
Nov Feeder Chart:
So far we have rejected that target box.
The 161.8% to 200% fib from the mid to late Sep rally (marked with grey lines).
Despite the sell off, the trend is still clearly higher.
The chart still leans higher until proven wrong.
The level bulls need to defend is that blue box.
That gives back 50-61.% of the recent rally from Sep.
That is also where the 50-day MA sits at. Which has acted as a massive floor the entire run.
If that level gives out, then you need to be concerned. As that would likely lead to a larger correction, something this market hasn’t seen in a long time.
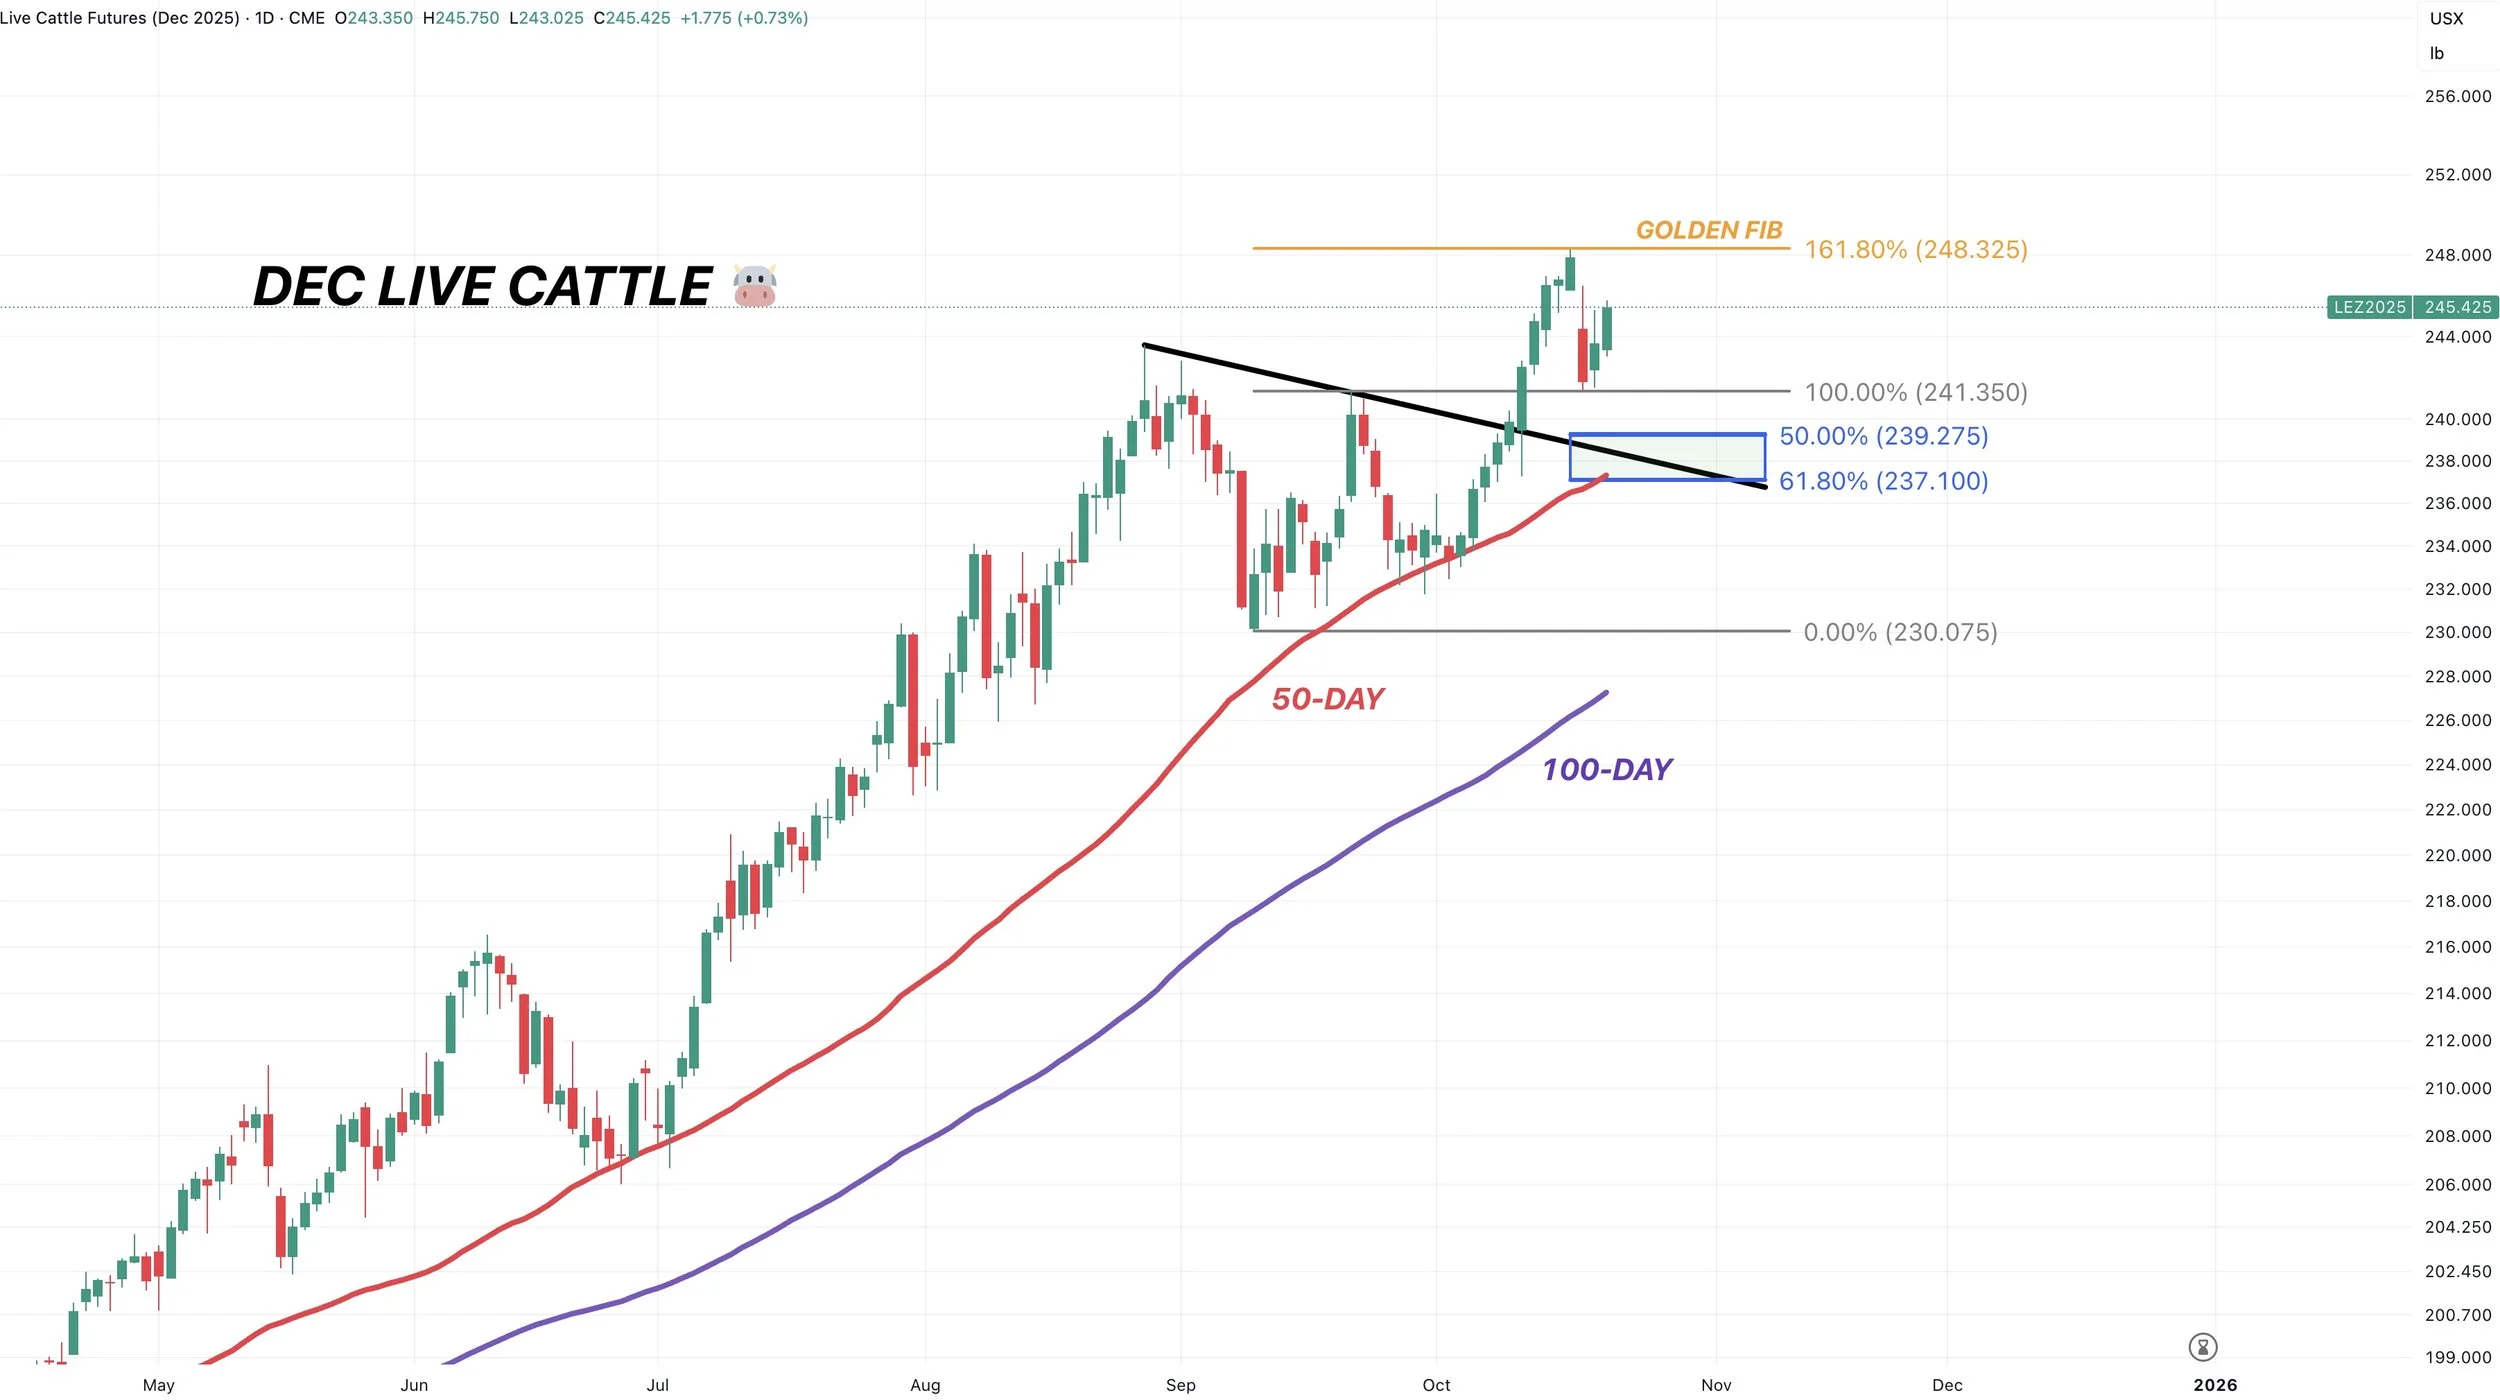
Dec Live Cattle:
Exact same story in live cattle.
We rejected the golden fib target.
Bulls need to hold the blue box and 50-day MA to prevent a larger correction. Until that happens, the trend remains higher. But when it gives out, that is our warning sign.
Here is a zoomed out chart of live cattle and the 50-day MA.
It has been a massive floor.
It only broke one time.
When it did, we visited the 100-day MA.

Past Sell or Protection Signals
Oct 13th: 🐮
Cattle sell signal & hedge alert.
Aug 22nd: 🌱
Soybean sell signal & hedge alert.
July 31st: 🐮
Cattle sell signal & hedge alert.
July 10th: 🐮
Cattle sell signal & hedge alert.
CLICK HERE TO VIEW
June 5th: 🐮
Cattle sell signal & hedge alert.
June 2nd: 🌾
MPLS wheat sell signal.
April 10th: 🌽
Old crop corn sell signal.
March 19th: 🐮
Cattle hedge & sell signal.
Feb 18th: 🌽 🌾
Old crop KC wheat & old crop corn signal.
Jan 23rd: 🌽 🌱
Corn & beans old crop sell signal.
CLICK HERE TO VIEW
Jan 15th: 🌽 🌱
Corn & beans hedge alert/sell signal.
Jan 2nd: 🐮
Cattle hedge alert at new all-time highs & target.
Dec 11th: 🌽
Corn sell signal at $4.51 200-day MA
CLICK HERE TO VIEW
Oct 2nd: 🌾
Wheat sell signal at $6.12 target
Sep 30th: 🌽
Corn protection signal at $4.23-26
Sep 27th: 🌱
Soybean sell & protection signal at $10.65
Sep 13th: 🌾
Wheat sell signal at $5.98
May 22nd: 🌾
Wheat sell signal when wheat traded +$7.00
Want to Talk?
Our phones are open 24/7 for you guys if you ever need anything or want to discuss your operation.
Hedge Account
Interested in a hedge account? Use the link below to set up an account or shoot Jeremey a call at (605)295-3100.