
GRAINS FREE FALL. OVERSOLD YET?
MARKET UPDATE
You can scroll to read the usual update as well. As the written version is the exact same as the video.
Timestamps for video:
Overview: 0:00min
Corn: 4:25min
Beans: 11:45min
Wheat: 13:45min
Cattle: 15:10min
Want to talk?
Office: (806)484-1214
Get full access to every update & signal
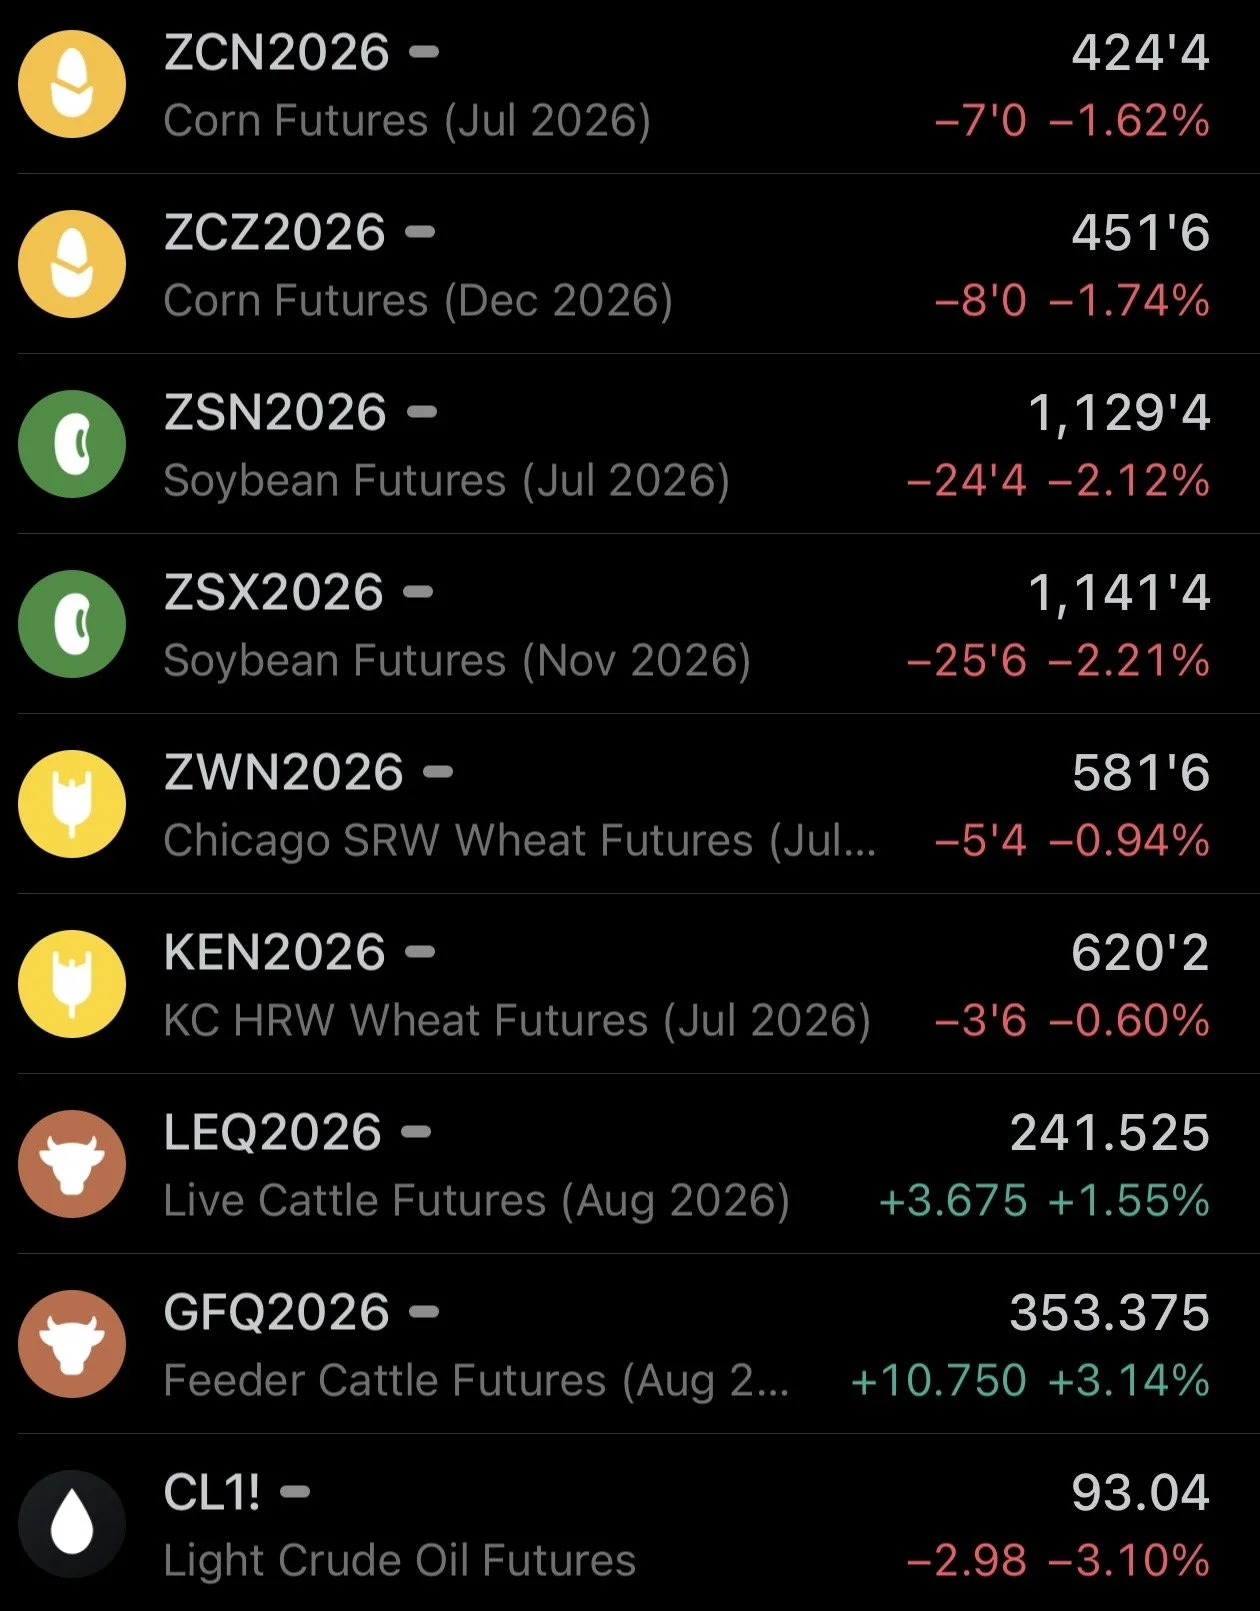
Futures Prices Close
Overview
The puke out and mass liquidation across the grains continue.
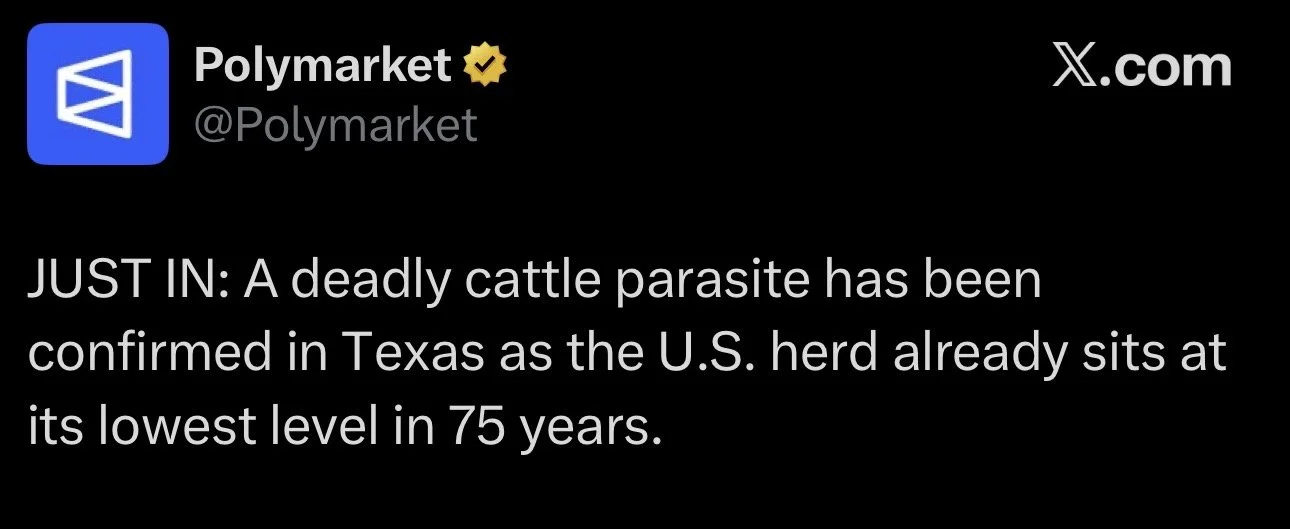
Feeders were actually limit up today, following the announcement of screwworm in the US last night. Appears like a possible sell the rumor buy the fact, or maybe the trade is worried about what could happen to supply vs the potential impact on demand.
Wheat has now been lower 12 days in a row. Featuring one single day higher over the last 16 days.
Corn has been lower the last 10 of 12 days. As July corn posted fresh contract lows today.
Soybeans take a big hit today, cracking below some support we'll touch on later.
Why is this flush out happening?
There are a few reasons. So let's get into them.
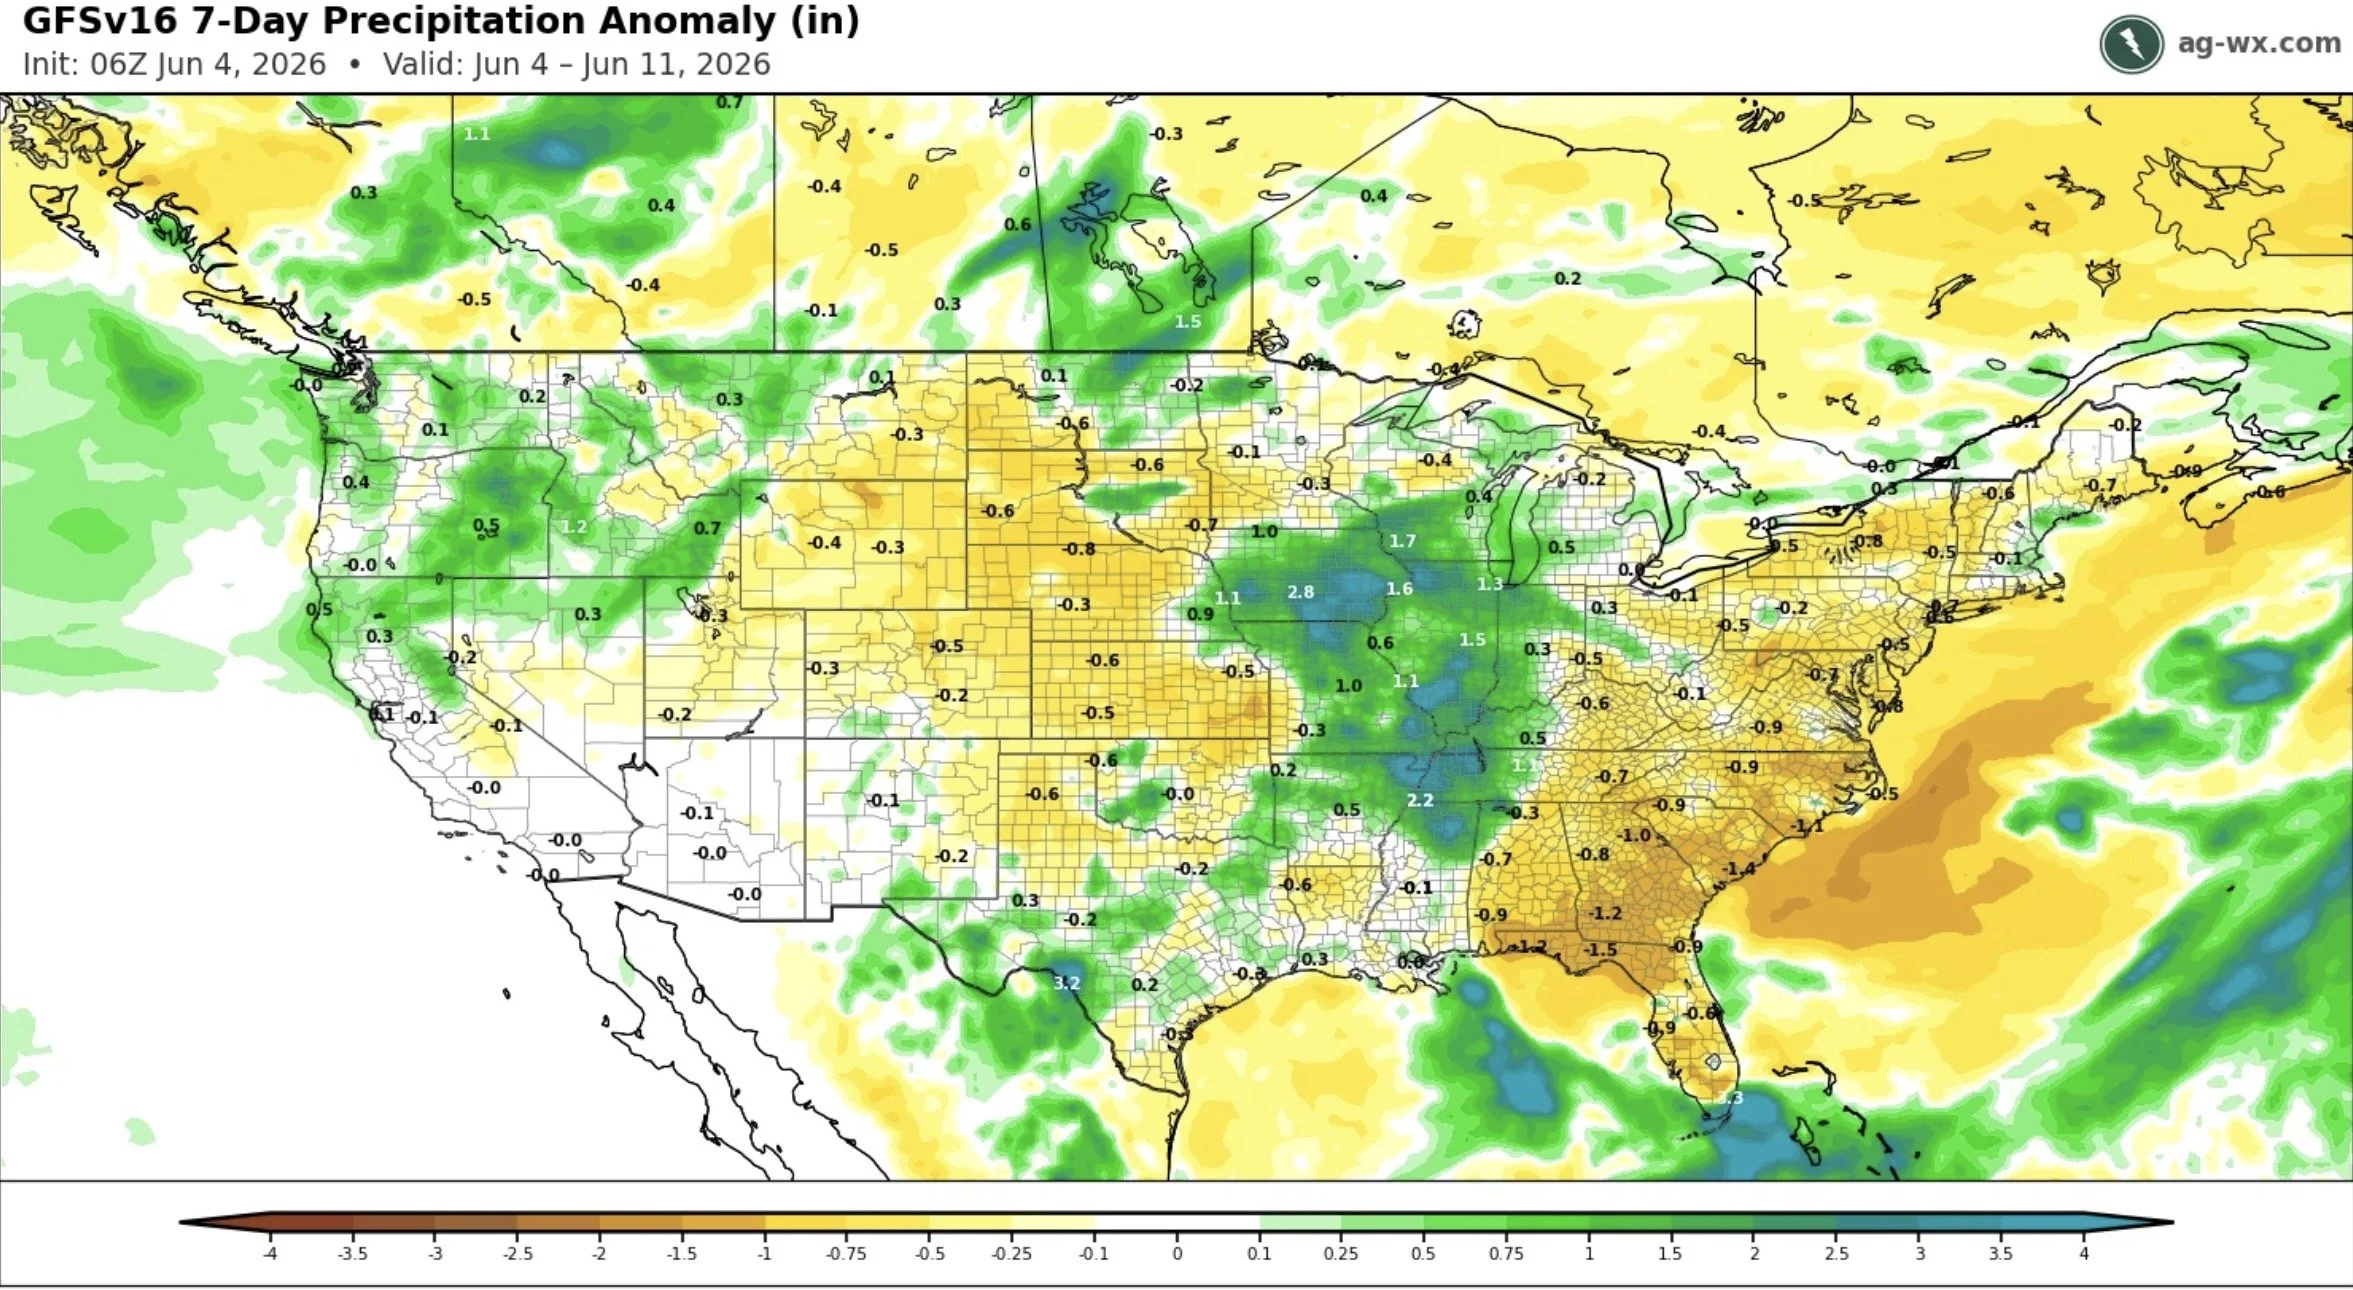
The first is obviously weather. It's simply providing no threats.
Rain in the heart of the corn belt is not bullish.
The forecasts are providing rain where needed. Then you have areas such as Ohio, who have been way too wet, looking like they are going to get a break.
Here is what the next week looks like until June 11th.
We all know weather can flip on a dime. A crop isn’t made in May, and it's only June 4th. You could always run into a dry spell in late June or July, but for now, zero concerns for at least the next week.
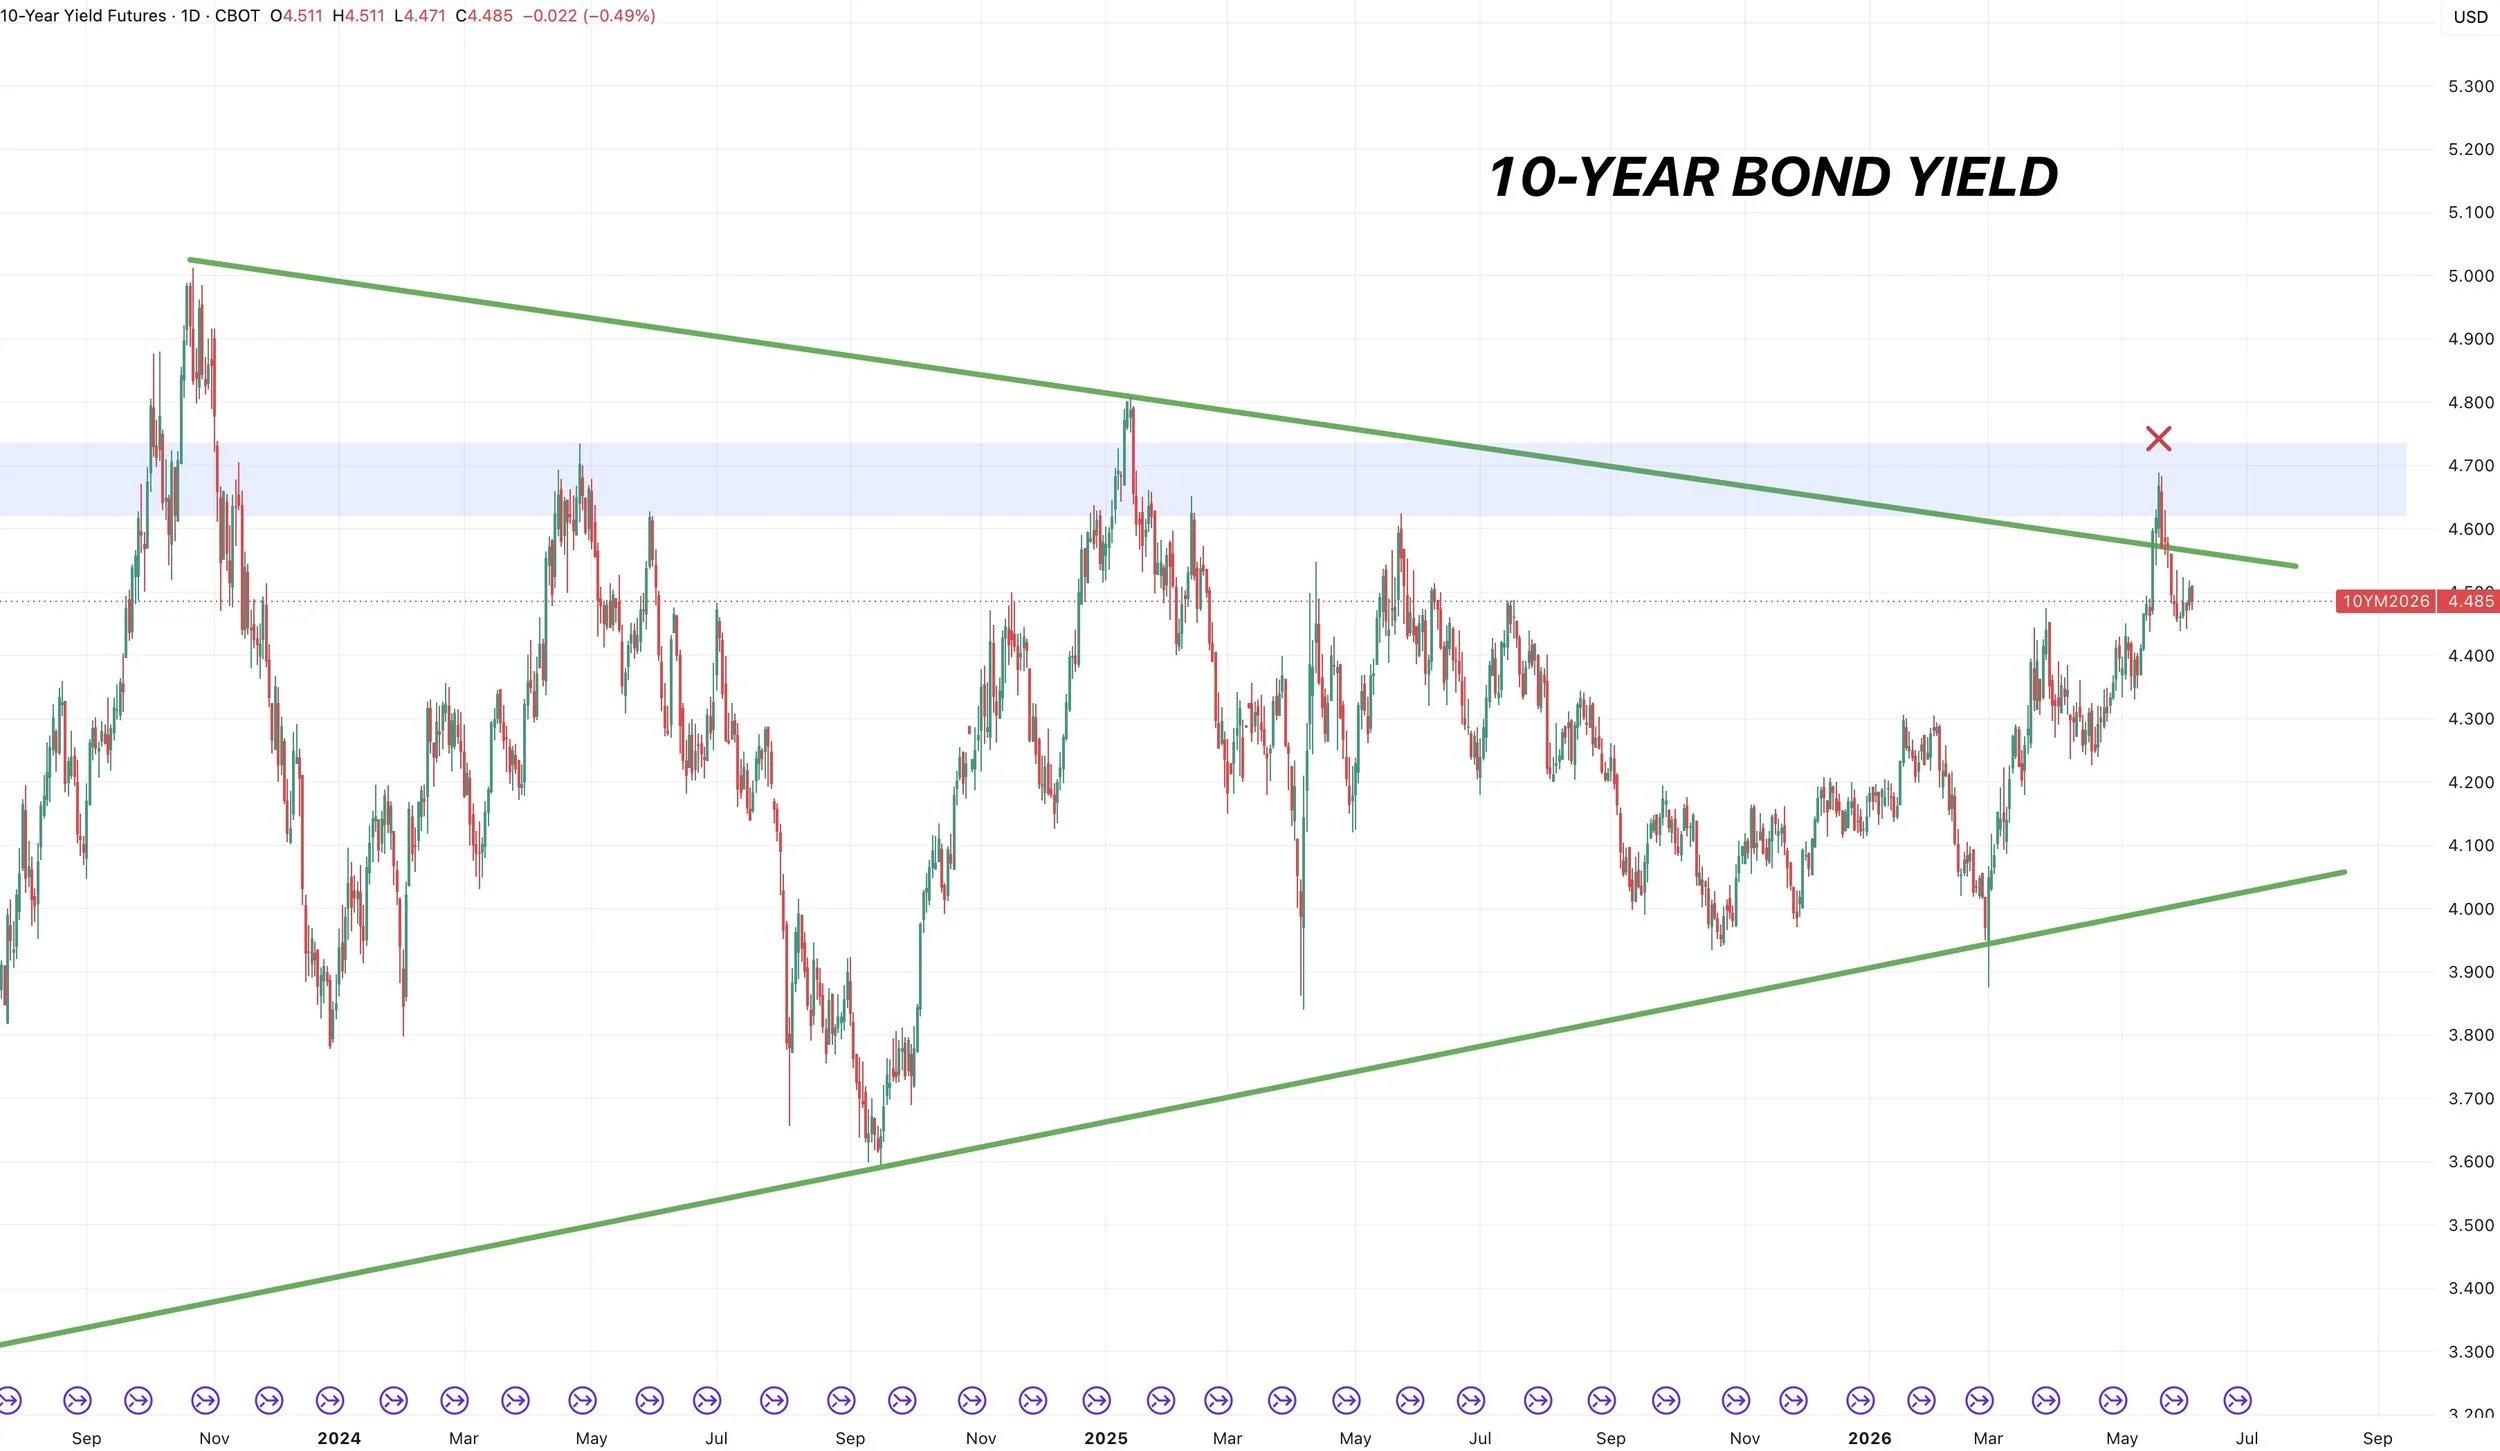
Remember this chart I showed a few weeks ago?
This is the US 10 Year Bond Yield.
It has a false breakout and rejection.
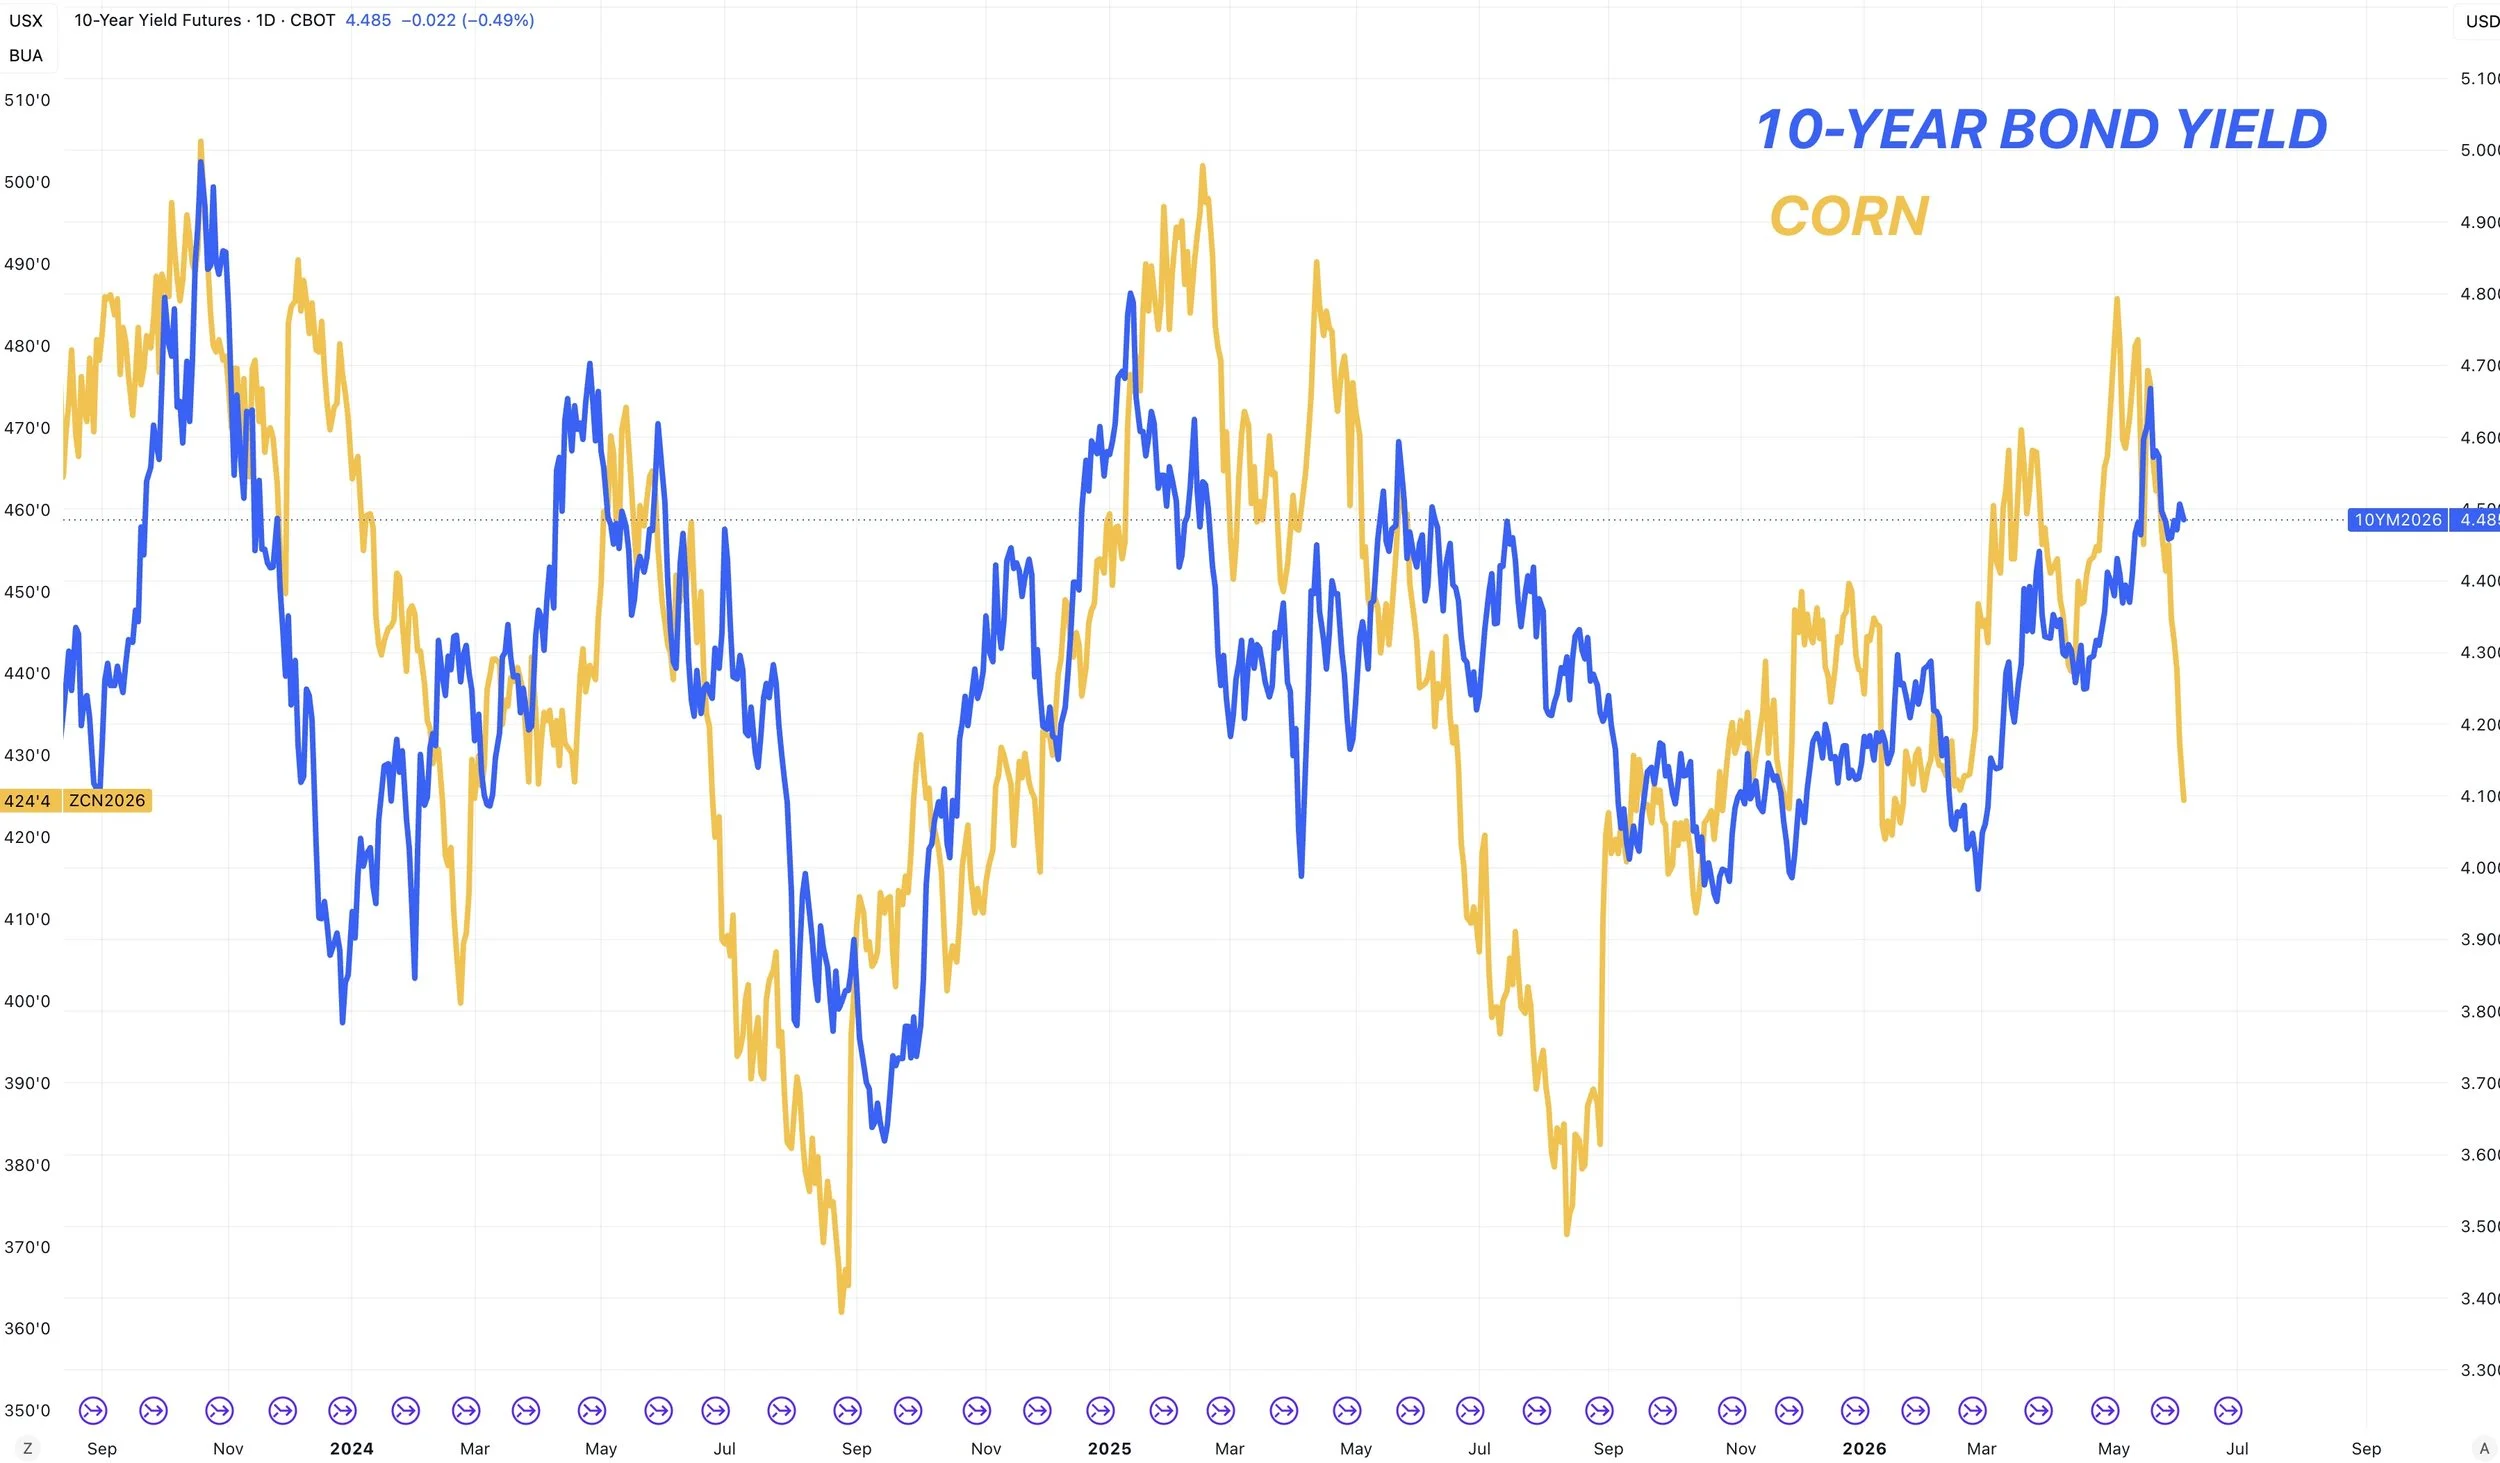
What does this have to do with corn?
Corn has followed the price action of this closely over the last two years. Here is a comparison.
It's not because corn cares bout bonds directly, but because money flow and inflation expectations can move them.
Corn and the bond yield topped the same exact day after that China announcement. They've both been lower since then.
Since bond yields backed off, the funds starting exiting grains and that inflation story for the time being.
At the same time, we obviously haven’t seen any business to China.
So the market quickly removed the premium from that announcement.
The funds were heavily long the entire ag complex.
So they've simply been puking out of that long position.
Somewhat creating a cascading effect.
Someone pukes, corn goes lower, others get margin called, so corn continues to fall.
Which is why moves like these can go lower than you'd like to think. Which is what we've seen happen.
Fundamentally, nothing has actually changed the last two weeks aside from the forecasts being favorable.
We had a bunch of "tourists" in the ag space due to the macros, crude etc. Essentially a bunch of people were in this market that normally aren’t, so they are getting forced out.

Long Term Argument (Next 1-2 Years)
Right now it feels like the sky is fallling.
Short term, I am going to sugar coat things. It doesn’t look great.
That doesn’t mean corn for example can’t receive a relief bounce and we are going zero. At all.
But this is seasonally the time of the year where we simply head lower until harvest. Although, I would like to think it's not going to be a straight line lower like it has been.
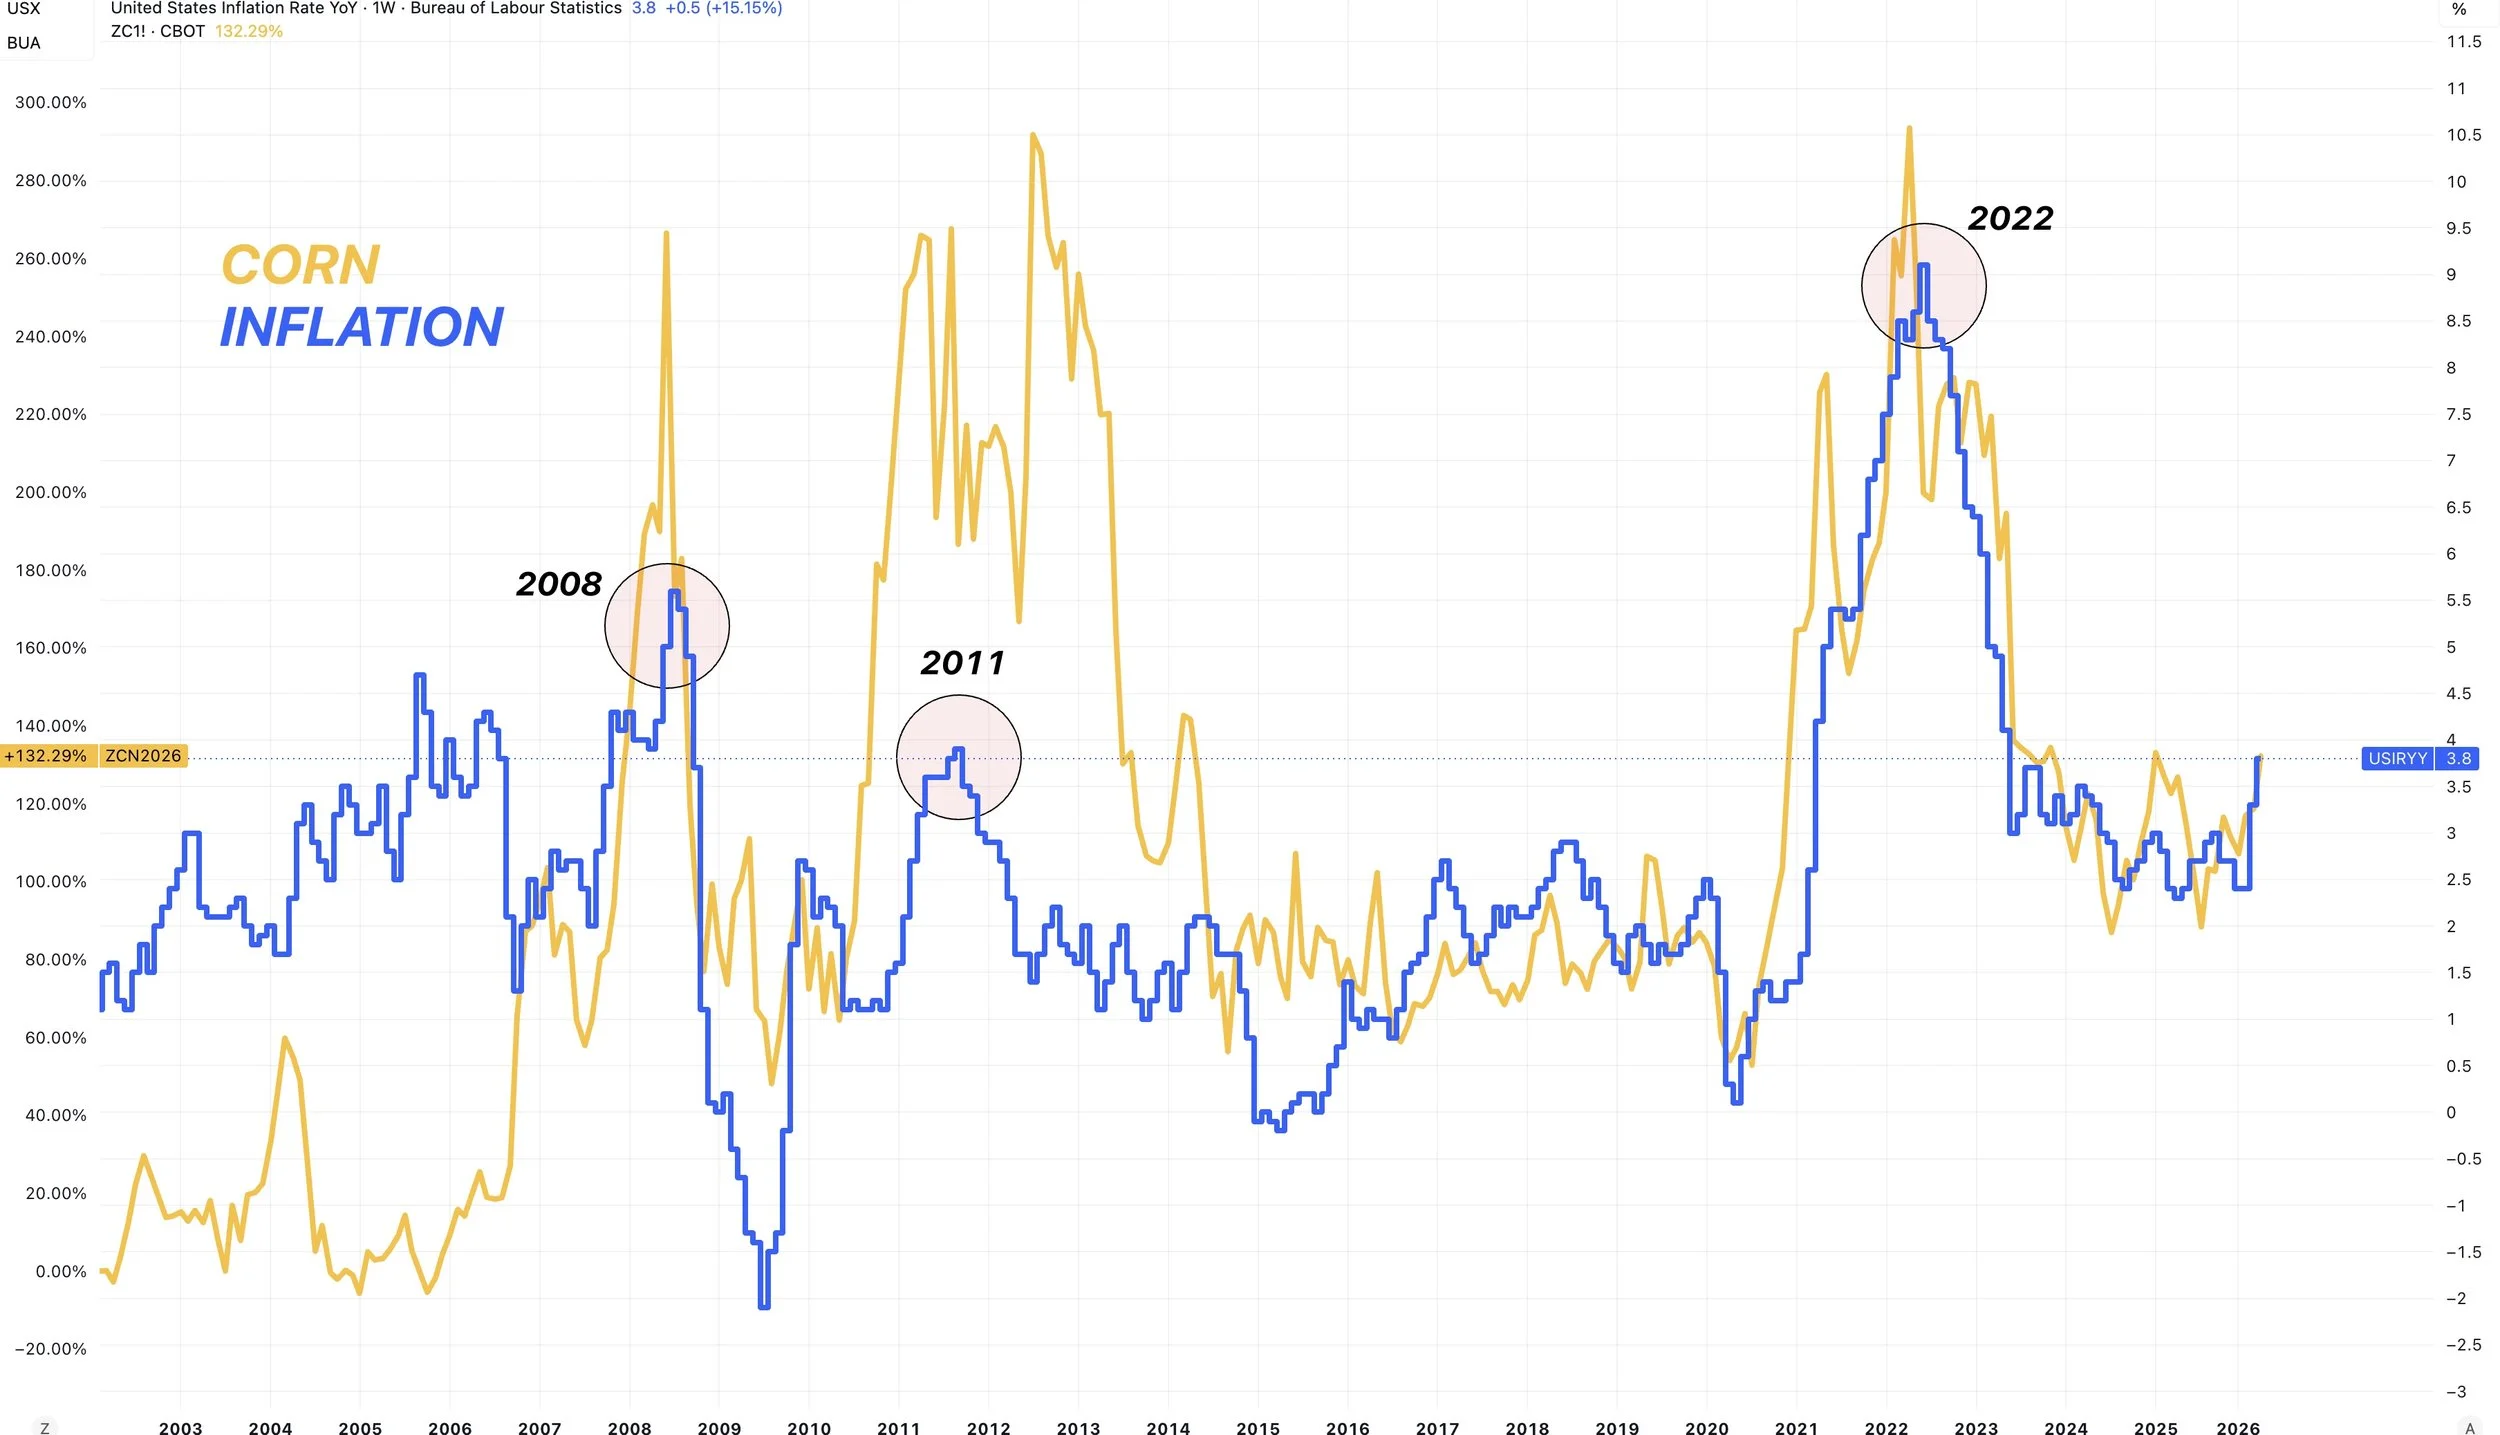
Let's look at inflation first.
As I've talked about countless times, you can’t ignore the similarities between inflation, corn, and the rest of the grains.
Right now, inflation is at 3.8%. That's not a crazy high number for now.
What happens if it goes higher?
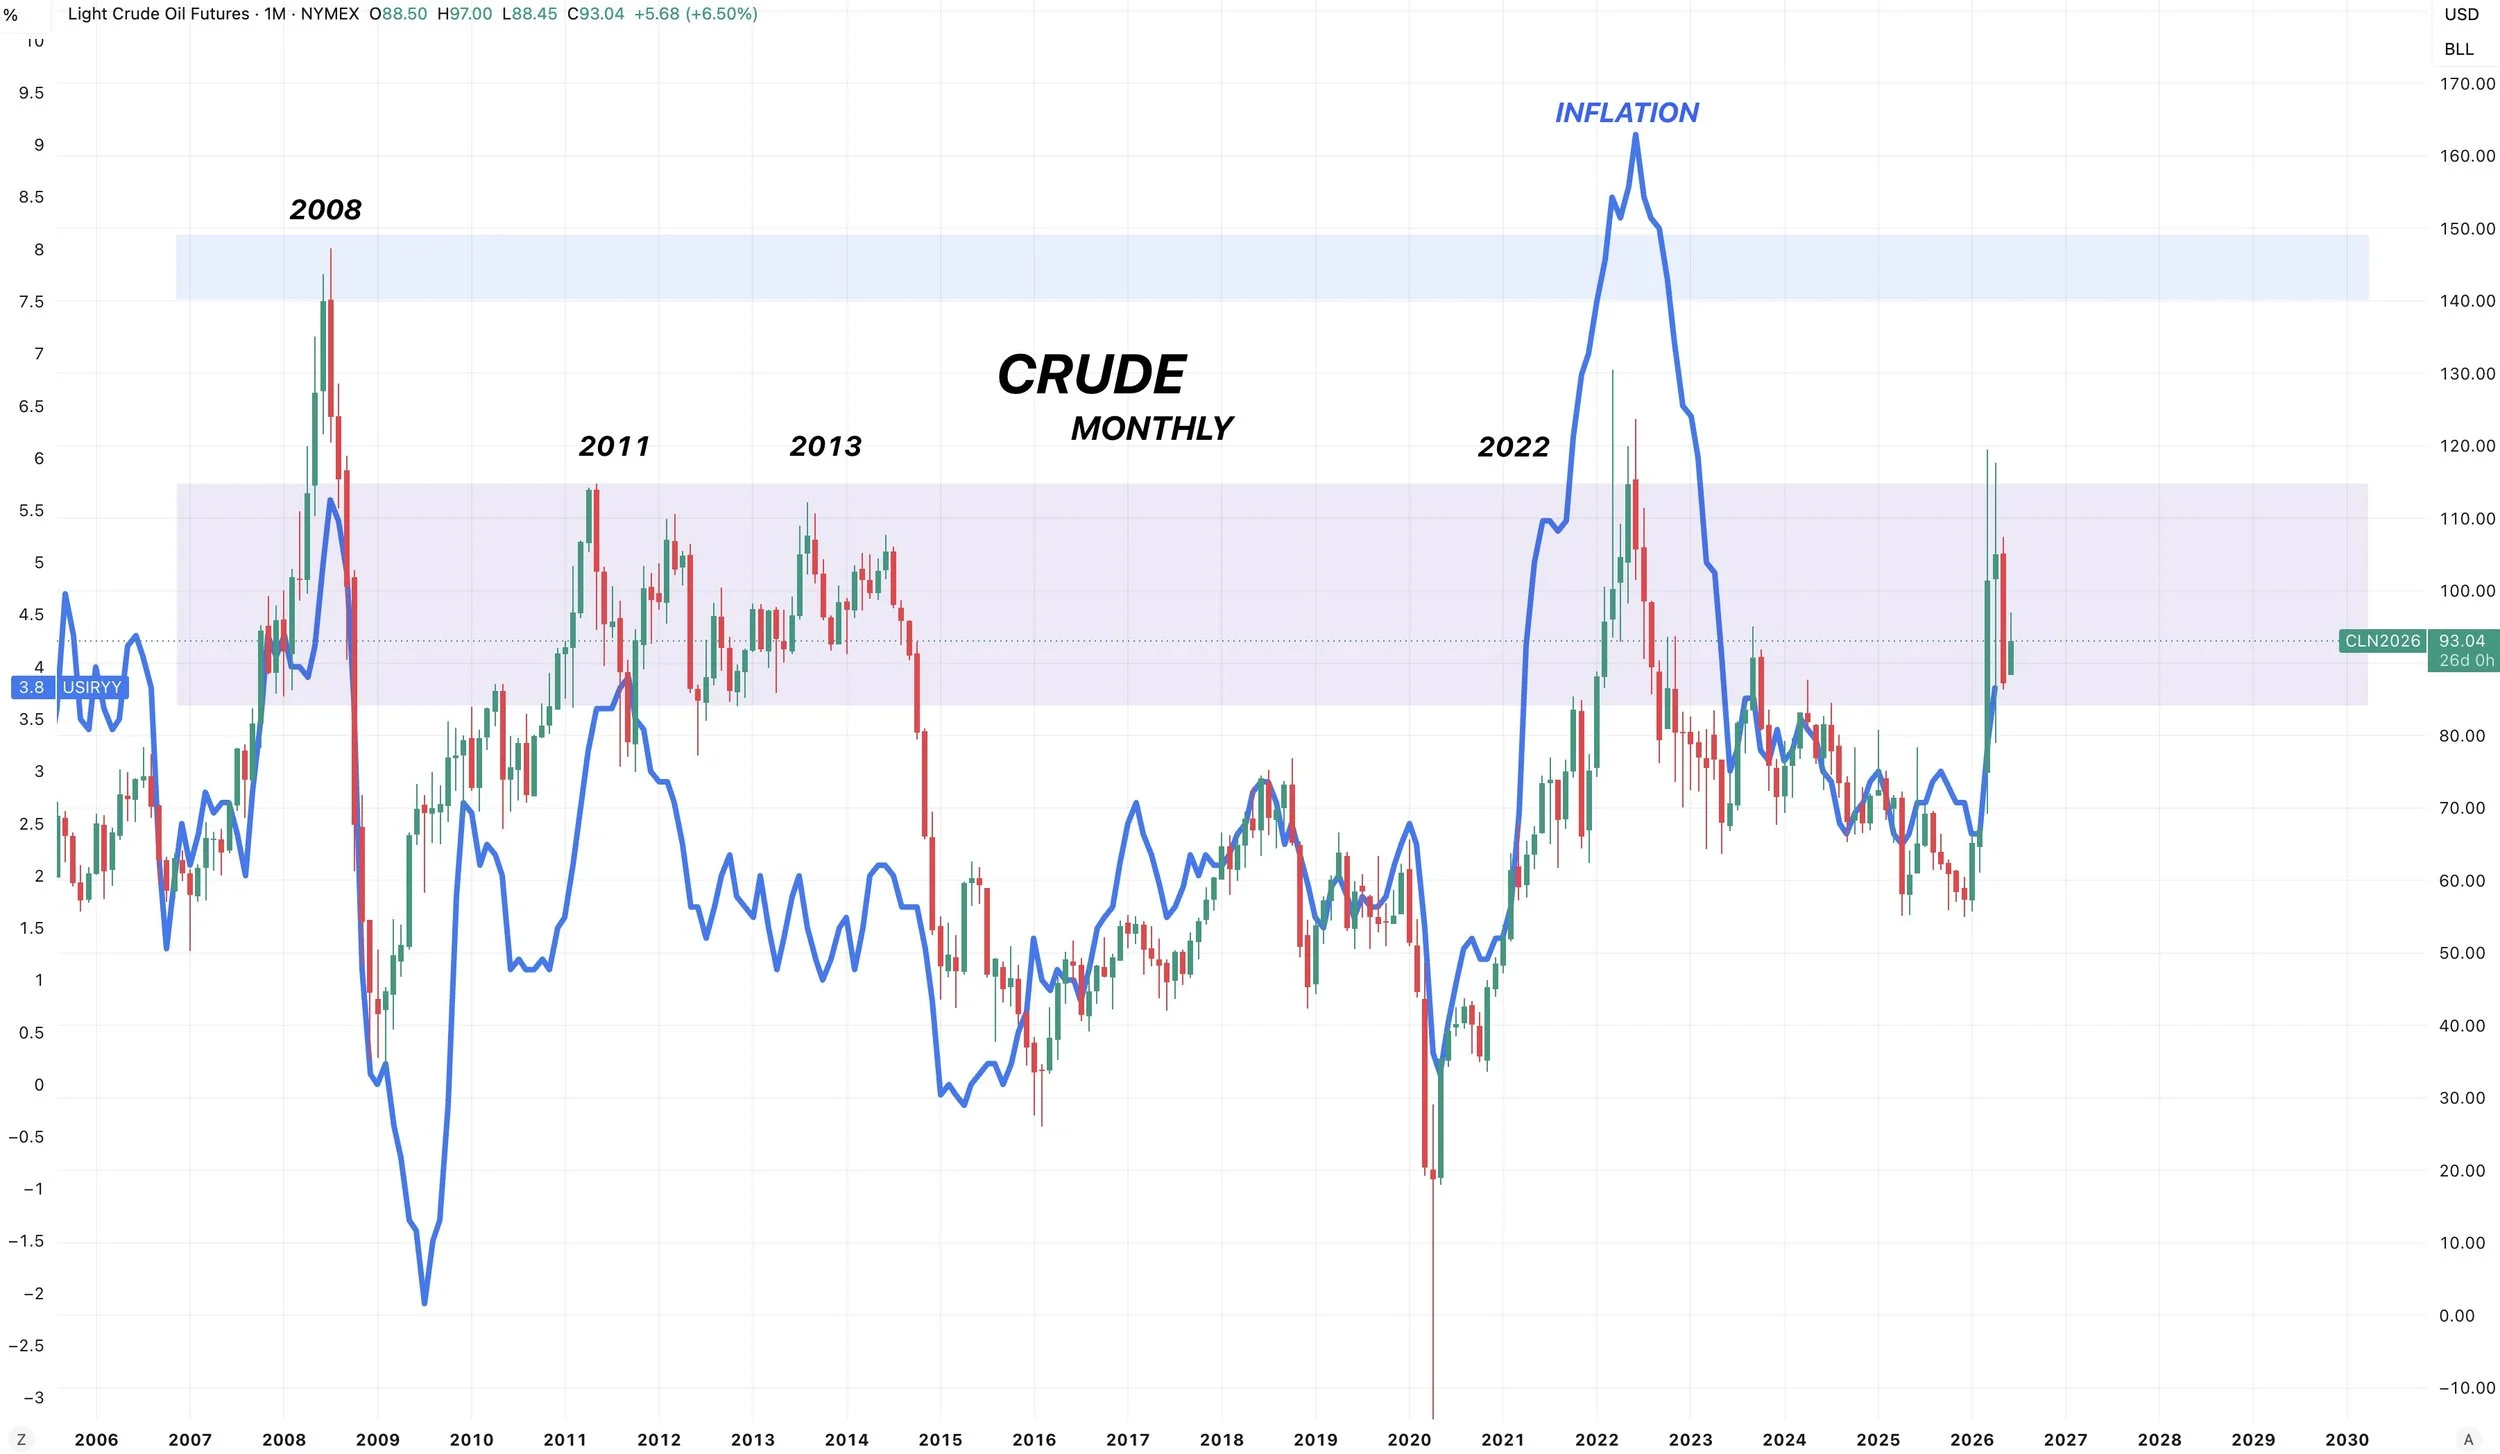
The thing is, do you think crude being above $90 for the last 3 months isn’t going to have an impact on inflation later on?
Grains have taken a big hit.
Funds are exiting.
Weather is favorable for now.
Seasonals suggest we can still head lower for another month or two.
But where are we going to be 6 months from now or a year from now?
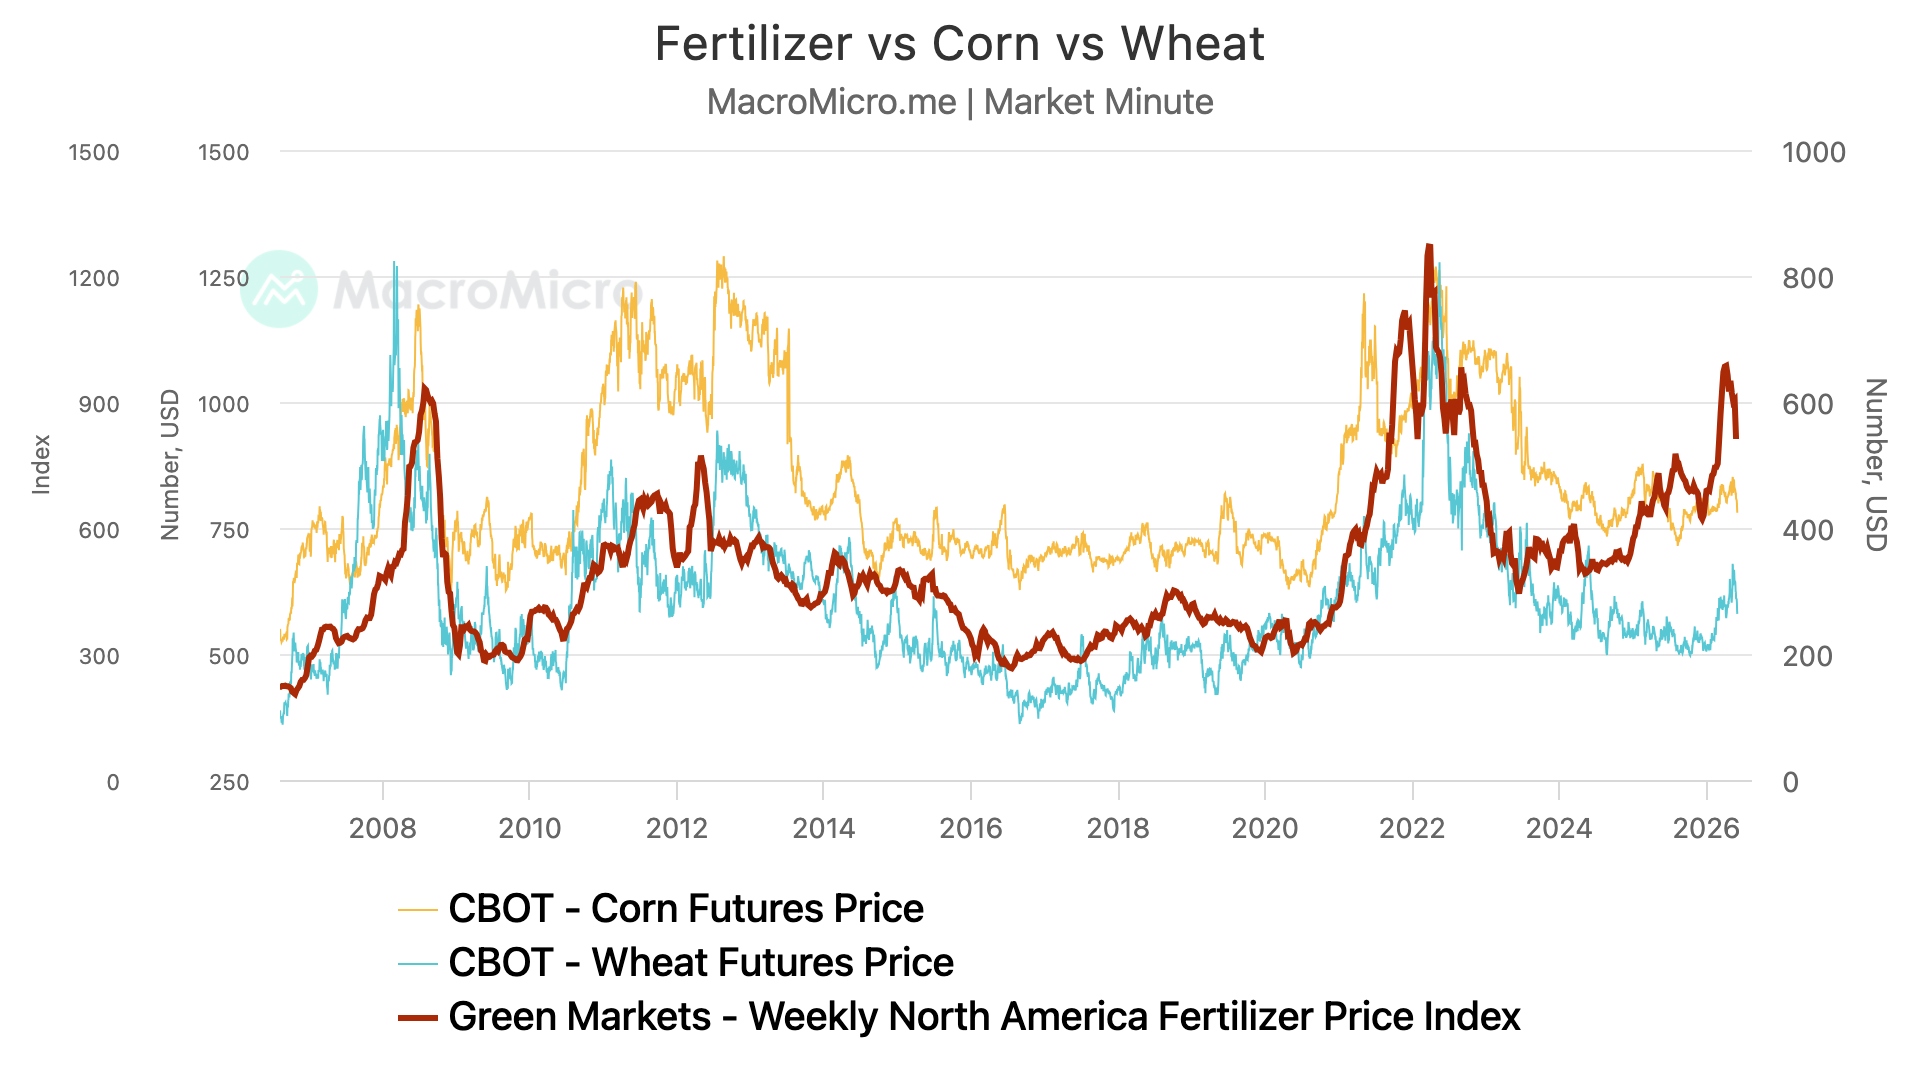
Here is a fertilizer index chart vs corn and wheat prices.
You can’t convince me that this isn’t going to have an impact on the 27 and 28 crop.
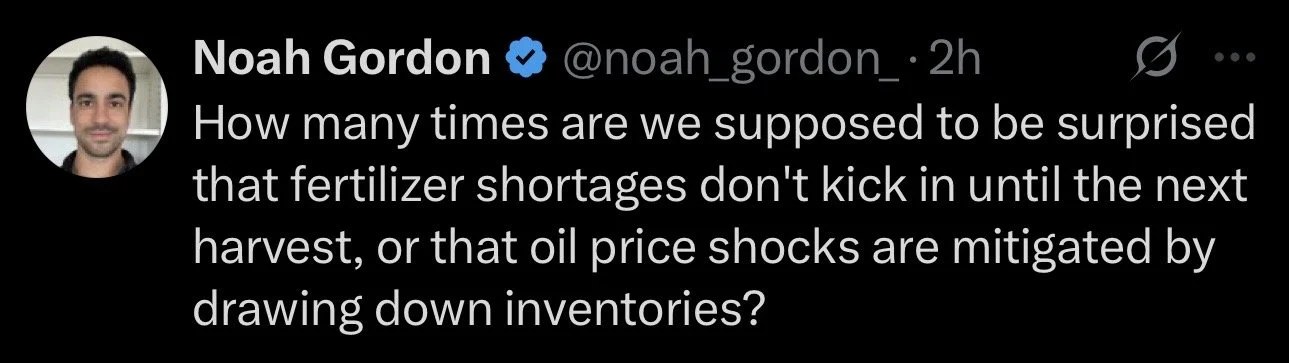
Here is a tweet I saw that pretty much sums it up.
We did just also see the Government draw record amounts of crude from inventories in an attempt to keep supply at ease.
Short term, there isn’t a real reason to get a massive rally.
Unless China randomly steps in here or weather switches up on us.
Although corn and wheat are extremely oversold, so I'd like to imagine we get some sort of relief bounce rather than continue to fall off a cliff. I will touch on the charts later.
Long term, there is absolutely a story for grains still over the next year or two.
They are just potential factors that don’t matter today.
I'll talk more about why new crop corn still has fundamental potential in the corn section.
Today's Main Takeaways
Corn
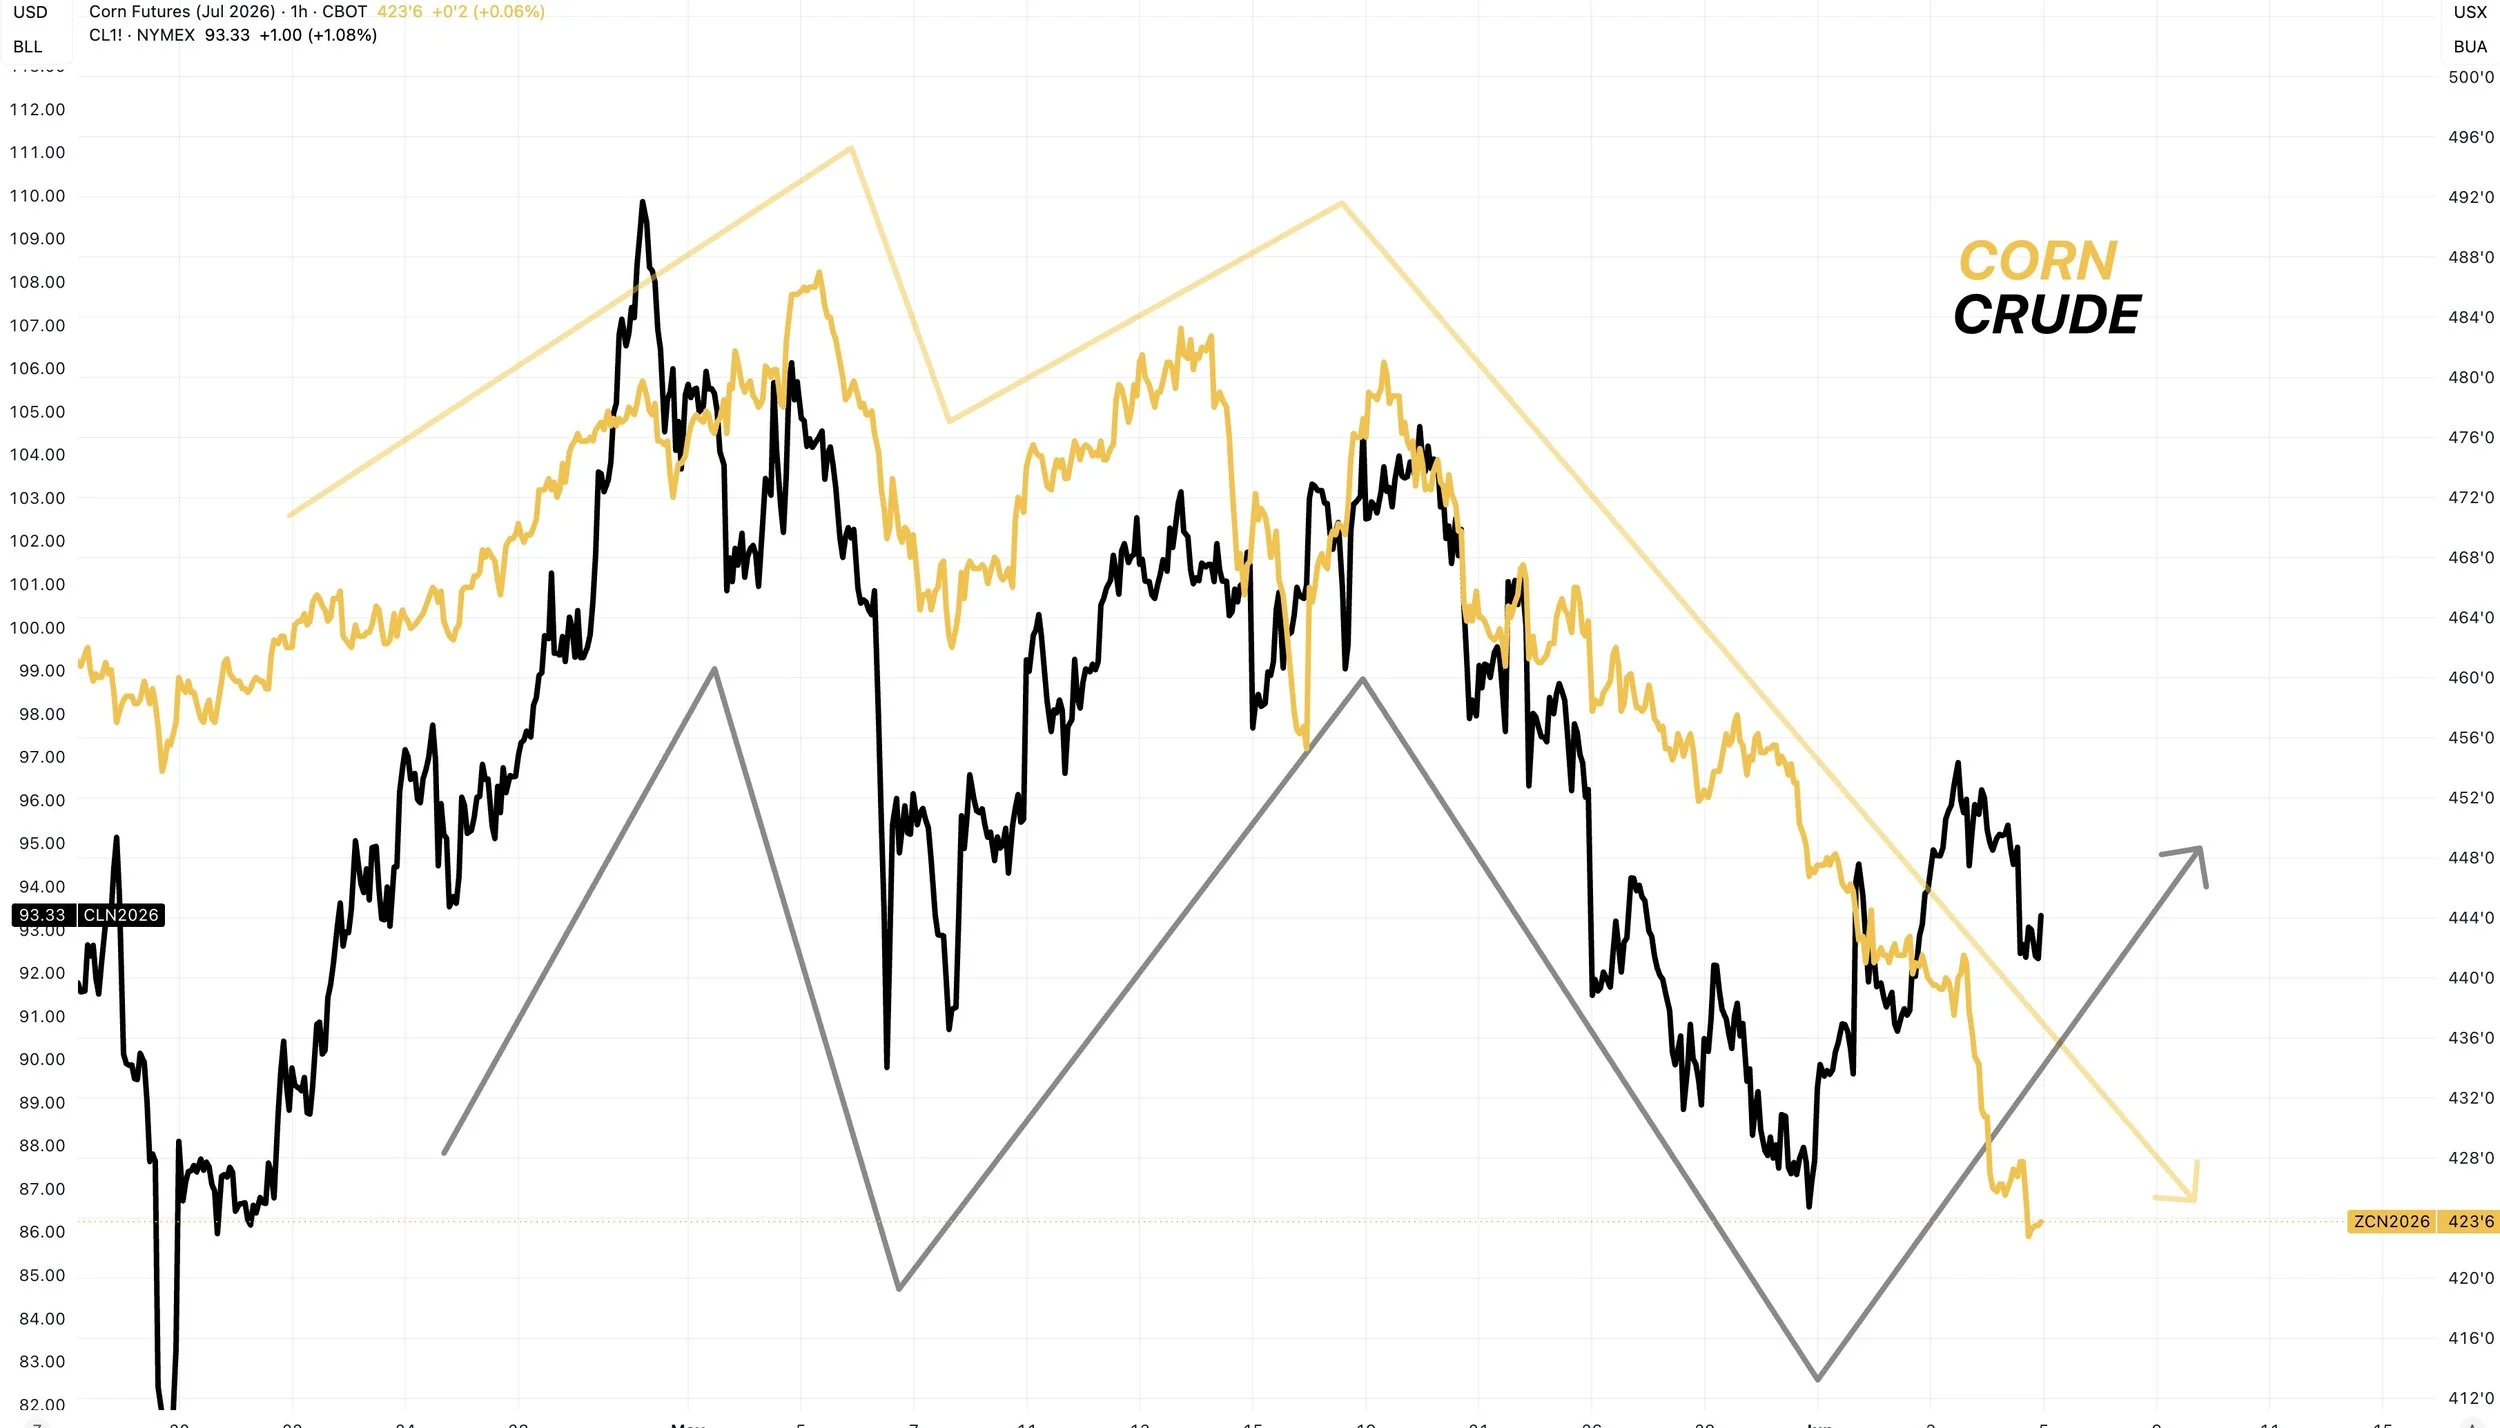
Corn vs Crude vs Wheat:
Here is a chart that compares corn and crude price action.
The correlation in corn and crude has died down the last few days.
We had been following each other to a tea for over a month. Then over the last few days, we completely diverged.
Crude bounced, corn continued lower.
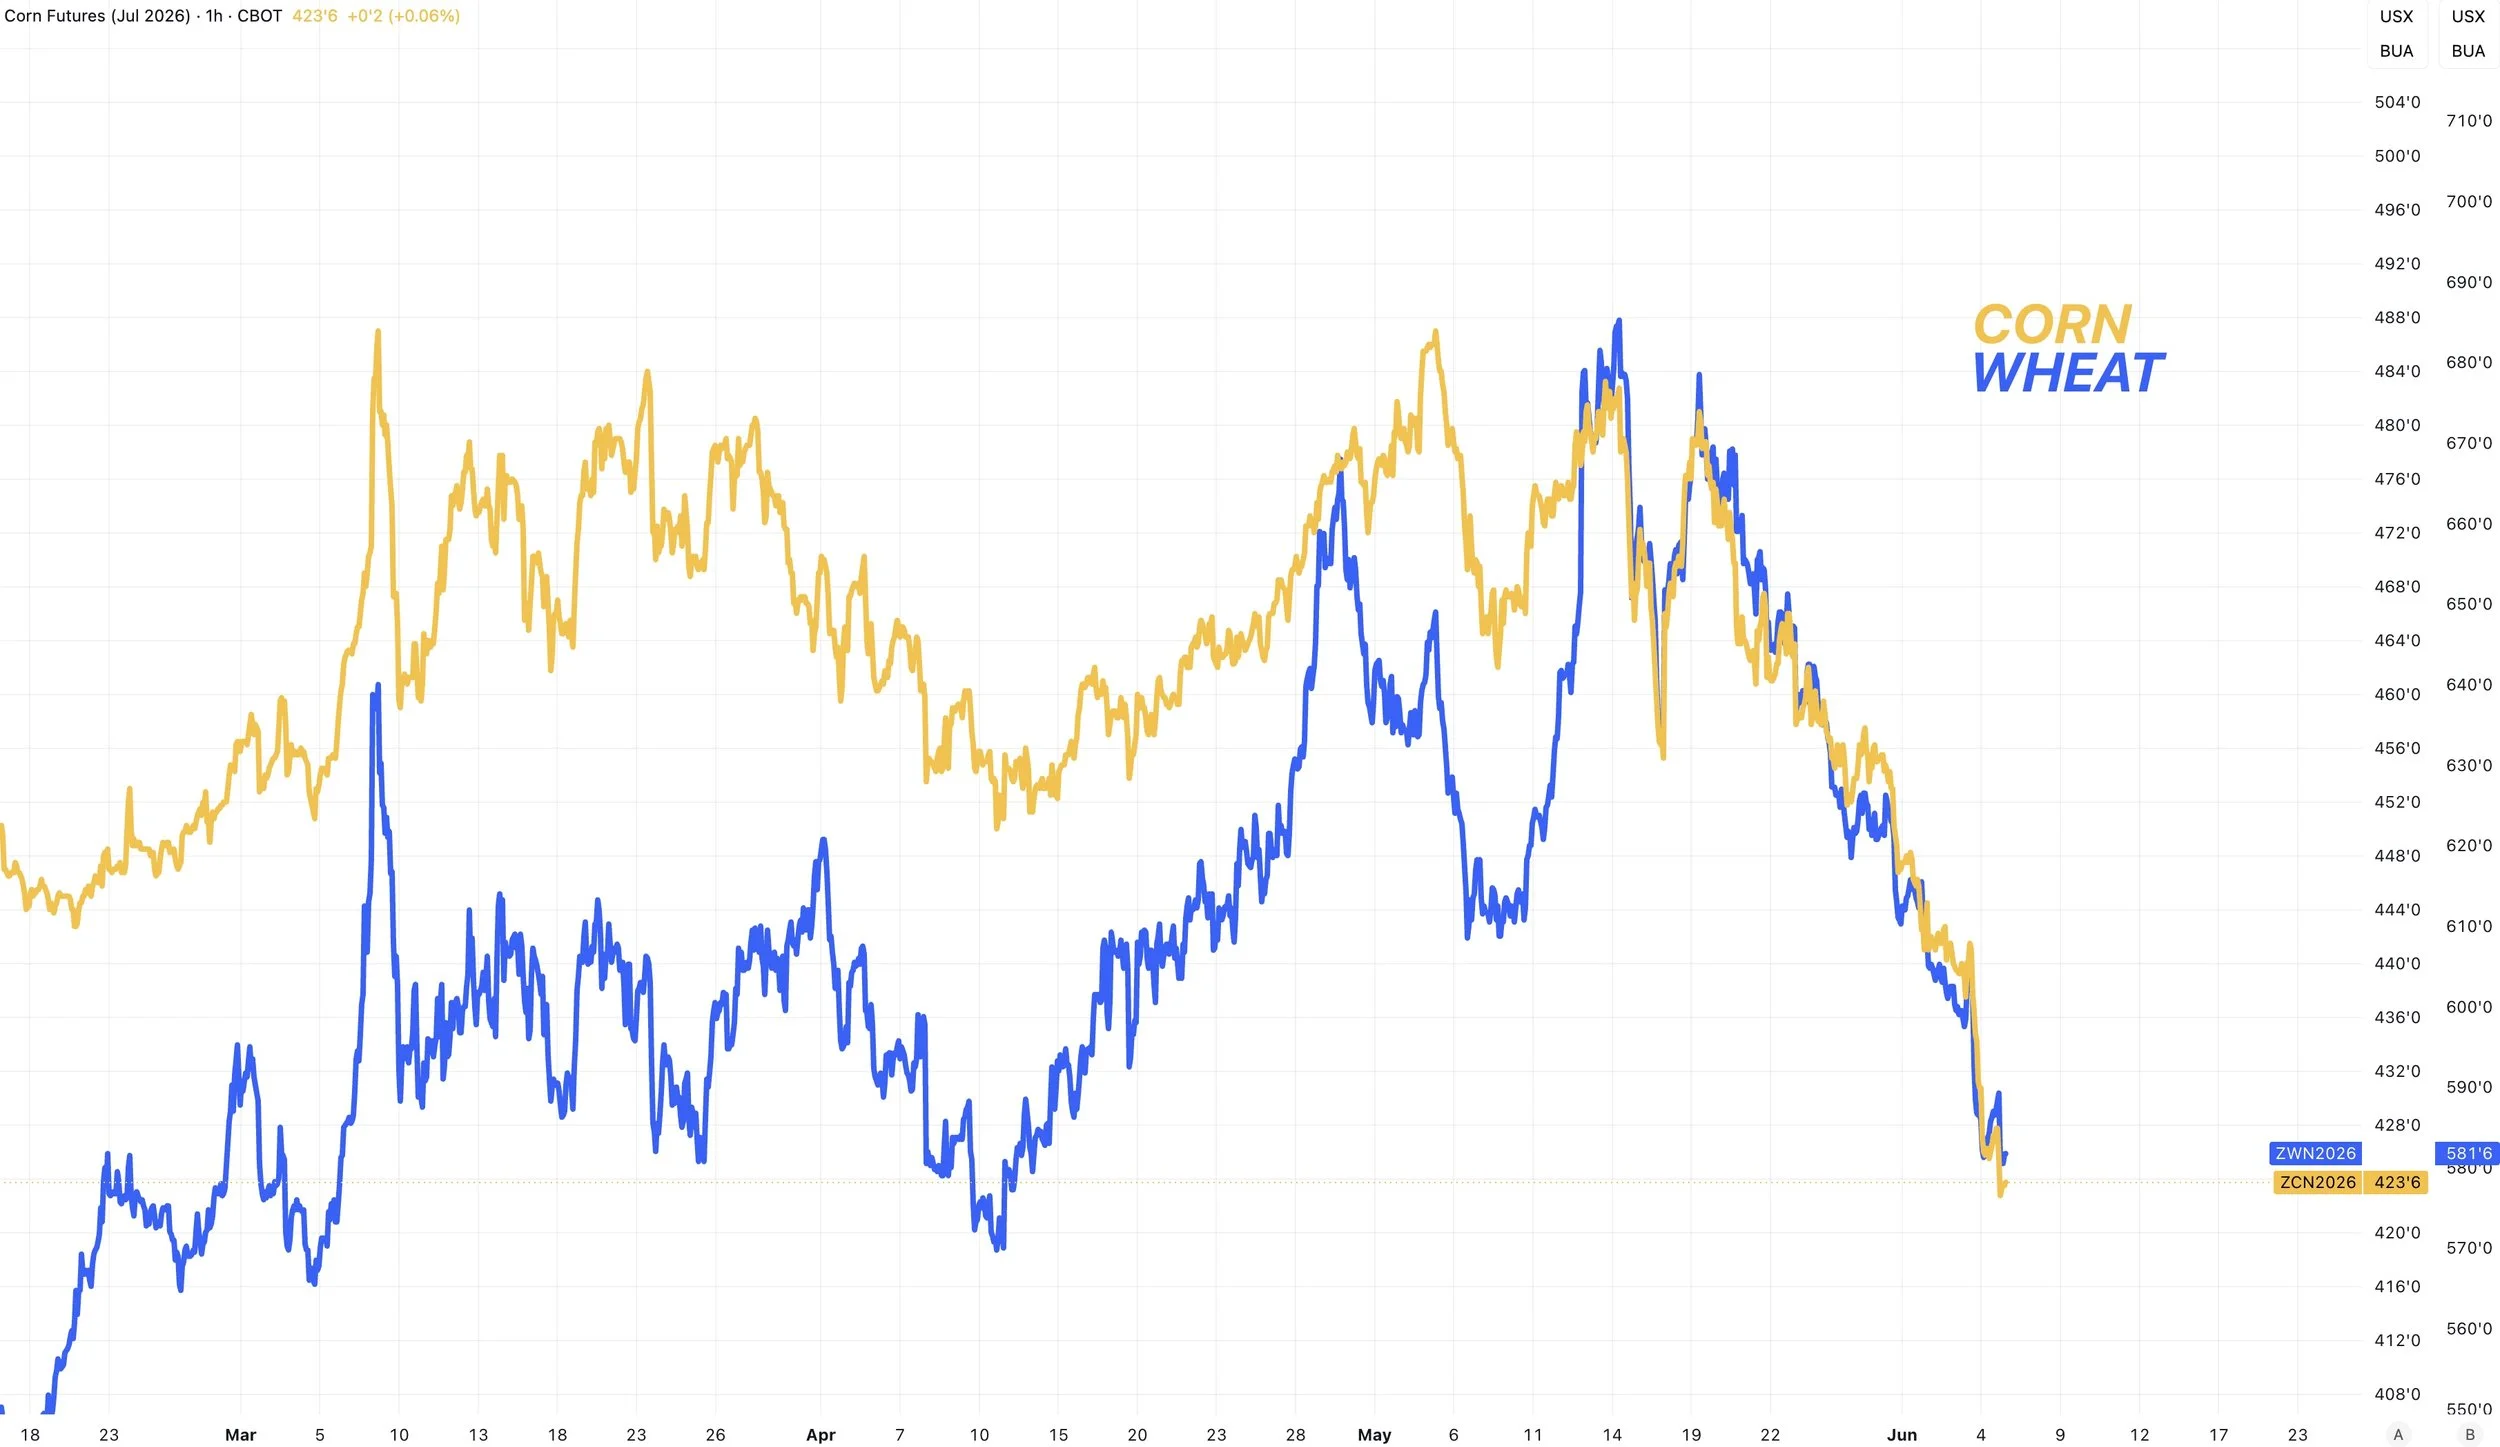
Here is a chart that compares corn and wheat price action.
Now these two have been following along identically for a long time now.
So you could argue, for corn to find footing, the wheat market might need to stop falling apart.
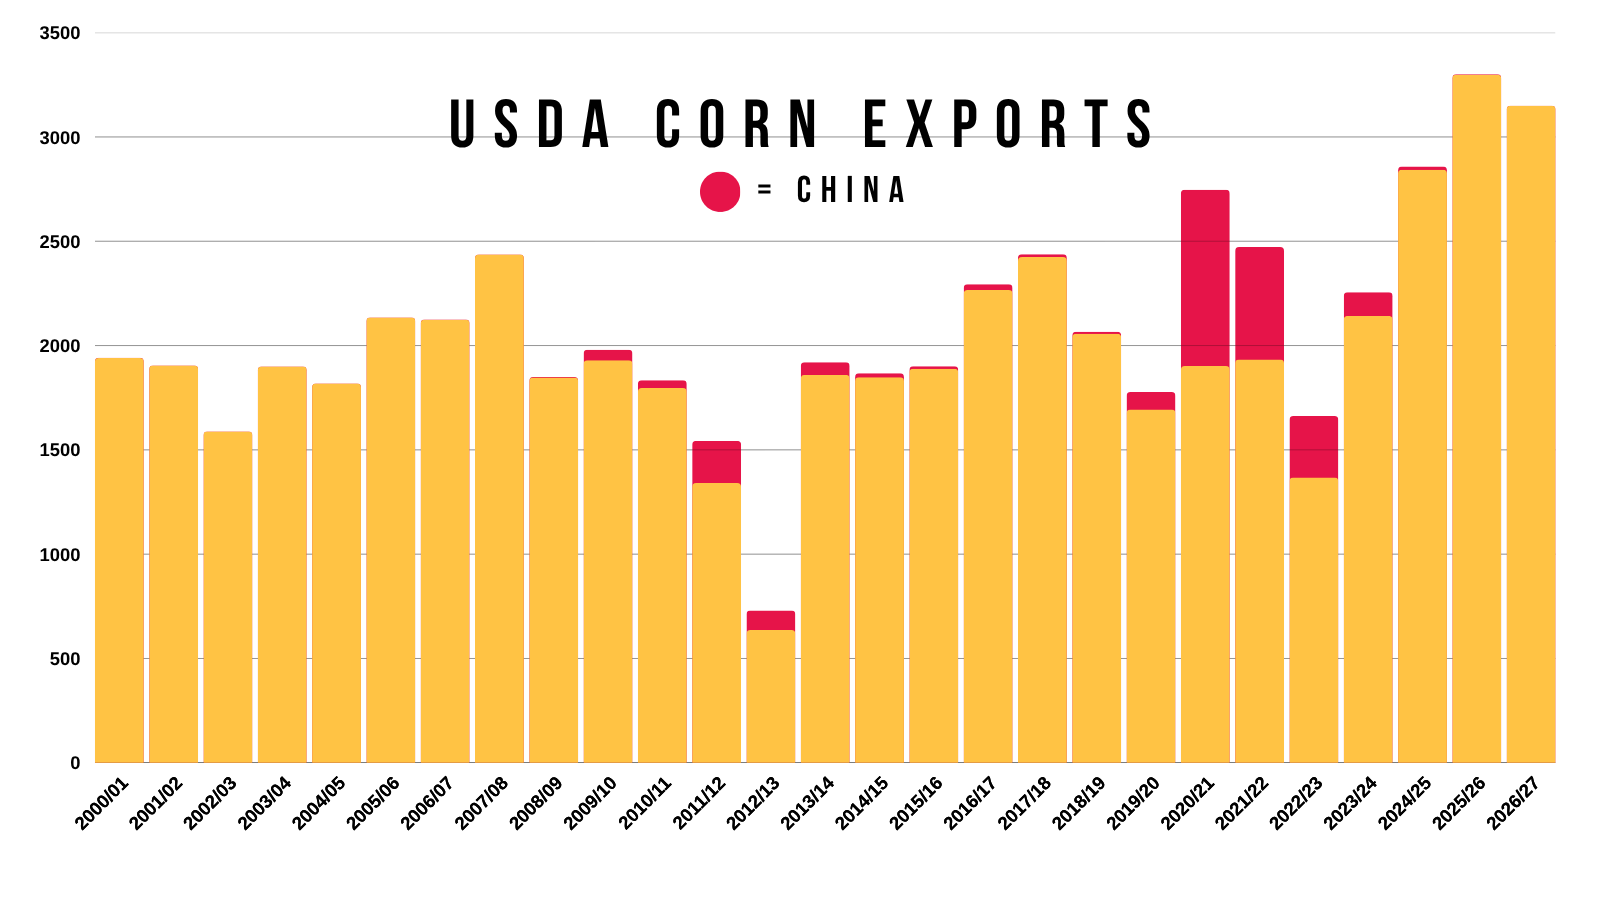
China Wild Card:
On top of the inflation and fertilizer story, China is another long term factor over the next +6 months that could be a great thing for corn.
I am very confident China will buy corn.
There is a reason they didn’t buy when it was announced, they thought they could get it cheaper.
China is not stupid. They know exactly what they are doing.
They will buy when they think prices have gotten cheap enough.
Corn does look a lot more attractive to them did it just two weeks ago.
I'd still argue they don’t start buying until around harvest time. When prices are typically their cheapest and when the US has the most amount of supply.
New Crop Potential:
The story has always been in new crop. There is no world where a +2 billion bushel old crop carryout is viewed as wildly bullish.
Here is the list of friendly possible factors for new crop:
Acres are "probably" too high
We don’t know yield at all
China should "eventually" buy
Inflation and fertilizer impact next year
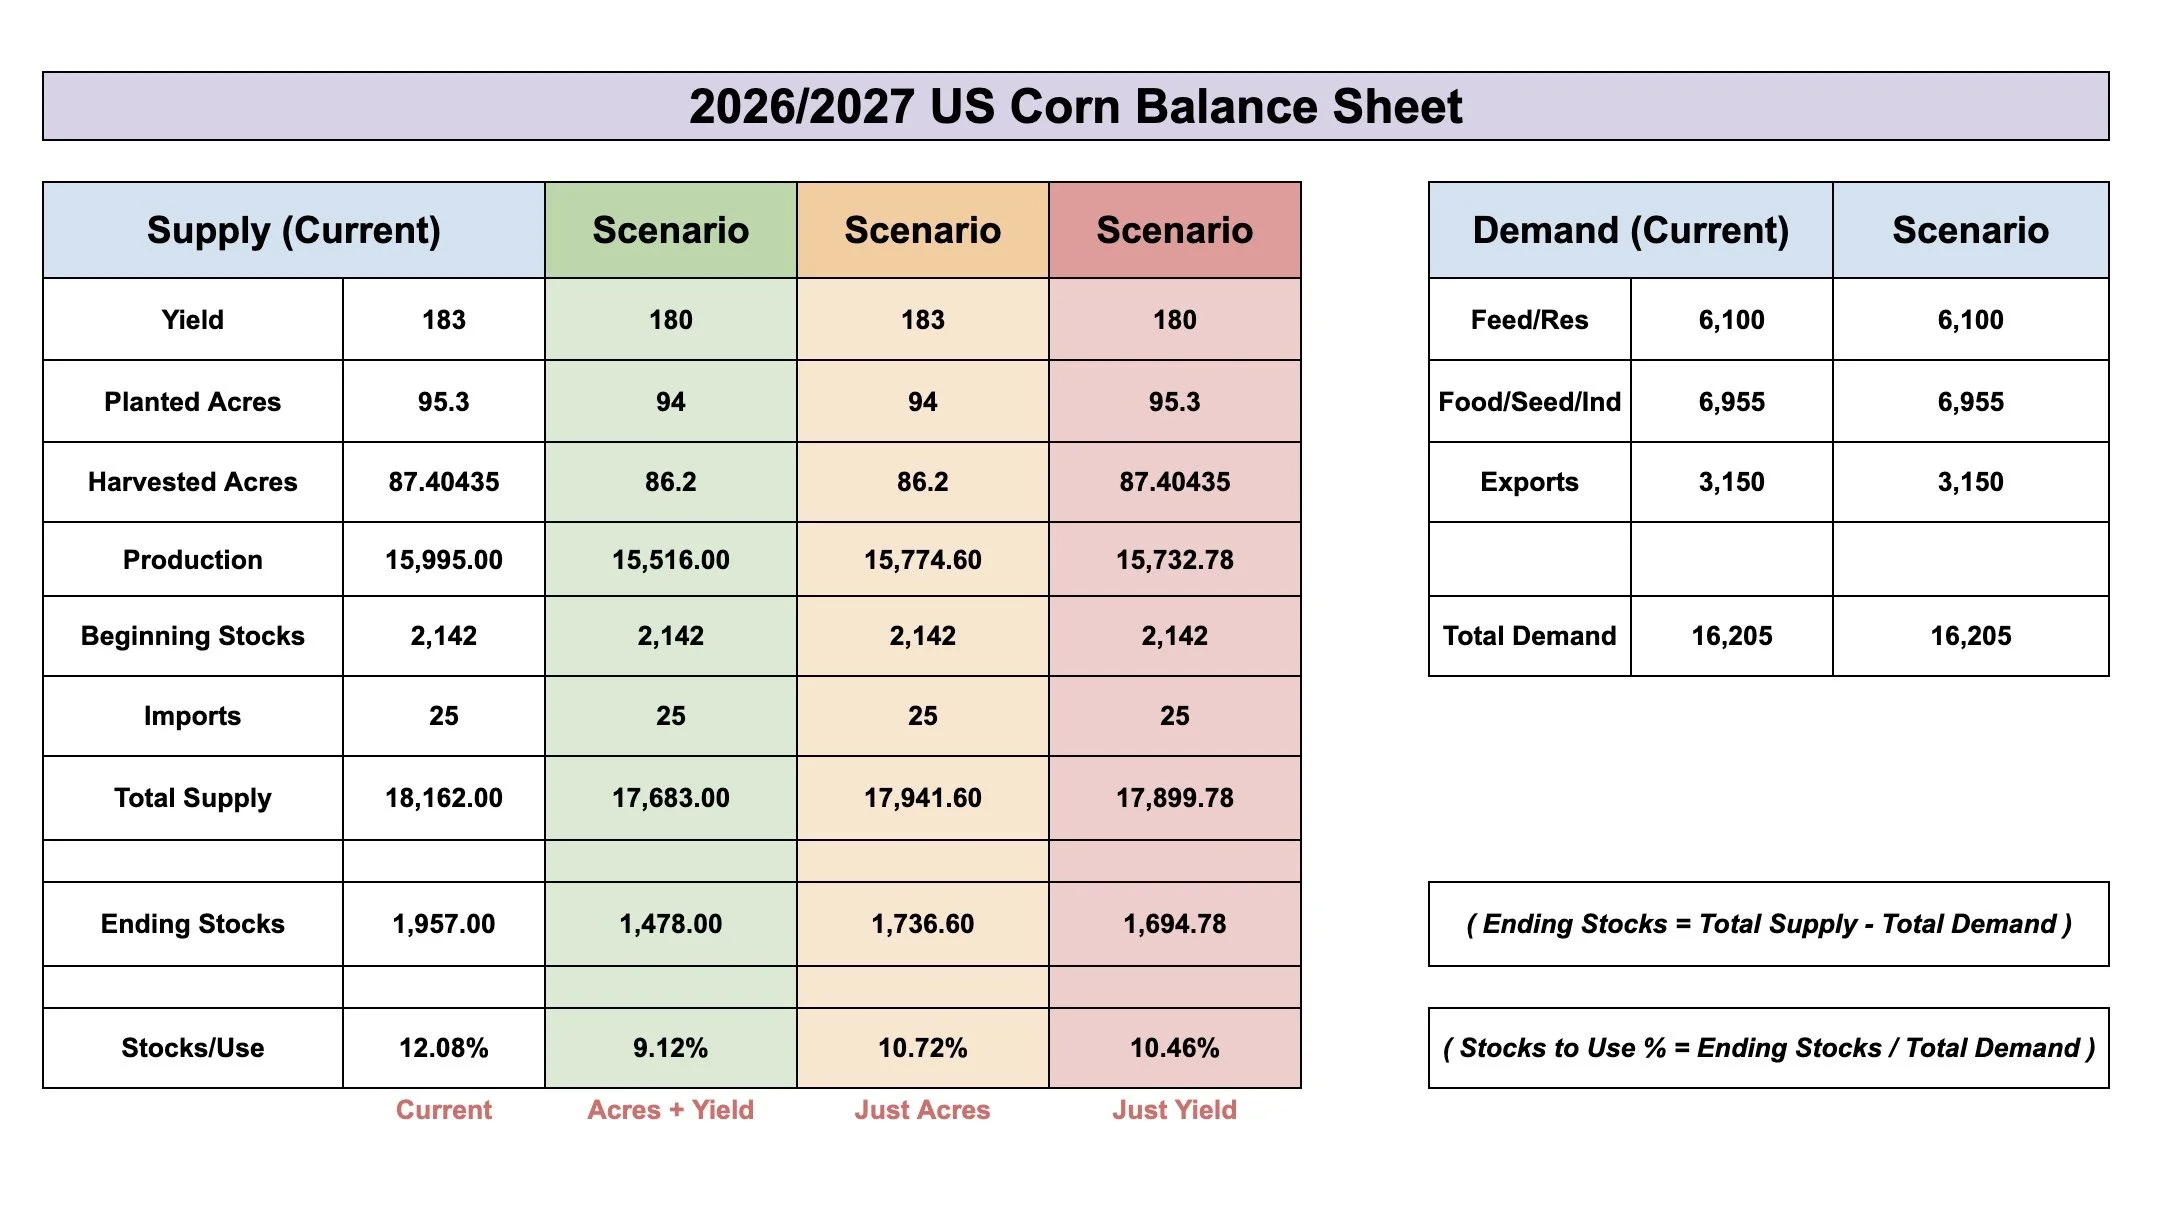
Let's just look at the new crop balance sheet.
I threw together a few scenarios here.
One of them is acres are too high.
One of them is yield is too high.
One of them, both of them both are too high.
So there are several ways this balance sheet could get tighter.
Then you also have the fact that the USDA is expecting demand to be worse than it was last year. I don’t know if that cut was justified. Demand has been great. The USDA simply did this so they could "balance the balance sheet" off the bat. Given that they lowered production this year.
Now what happens if you combine that with some China buying?
Well.. there is your potential recipe for a completely different story for new crop.
Again, none of these are factors that are likely going to impact us today. They are factors for later on.
Along with the fact that the USDA probably won’t touch yield until August.
Seasonal Data:
Bottom line, we could definitely still struggle for another month or so.
I'll dive into the charts next, but I would like to think we at least get a bounce.
I've went over a ton of seasonal data the last month or so.
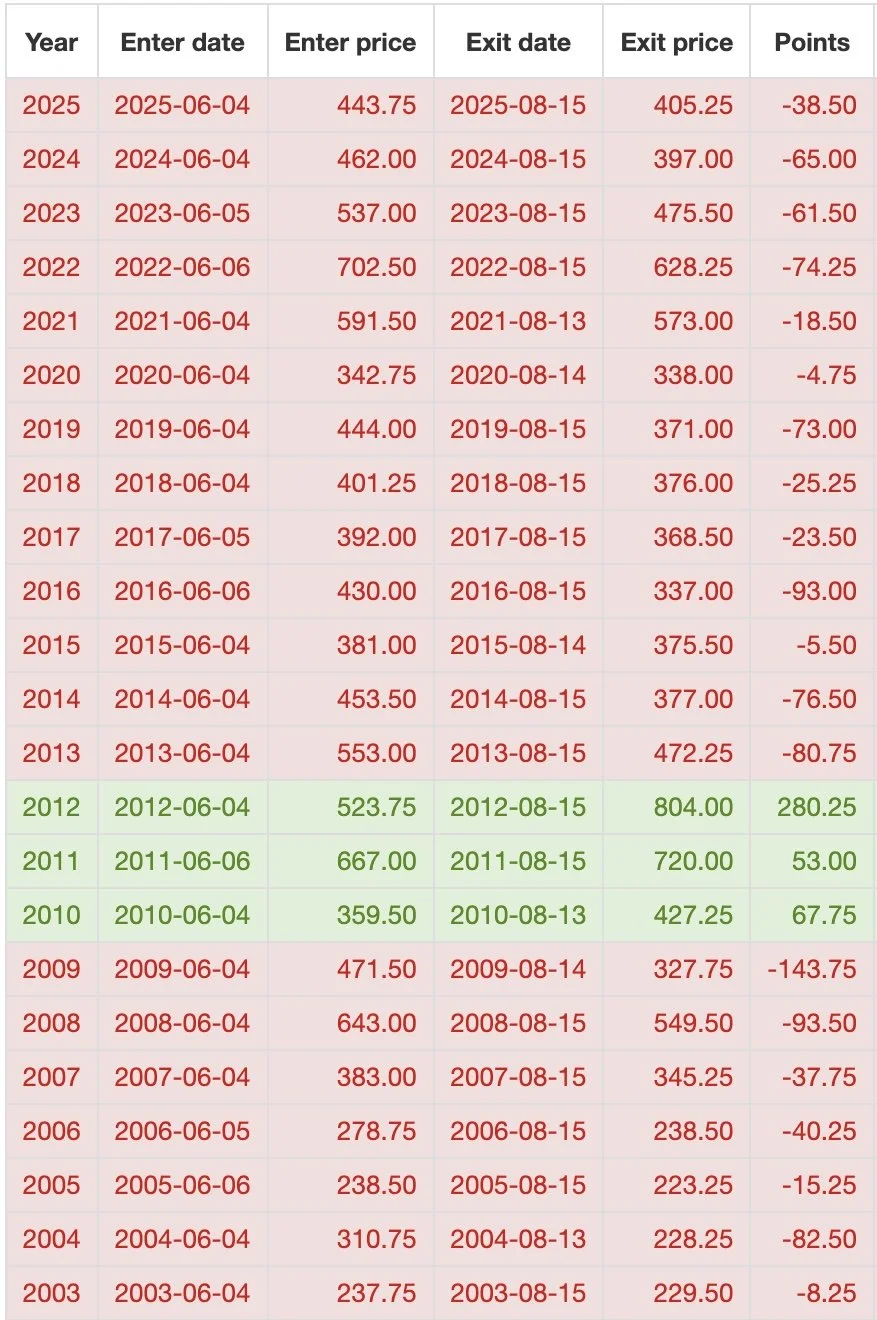
Here is the seasonal data from today by August 15th.
We have been red an astonishing 13 years in a row.
Lower the last 20 of 23 years.
This does not mean we cannot bounce before hand, but by August we are typically lower than we are today.
As that is some pretty strong seasonal tendencies.
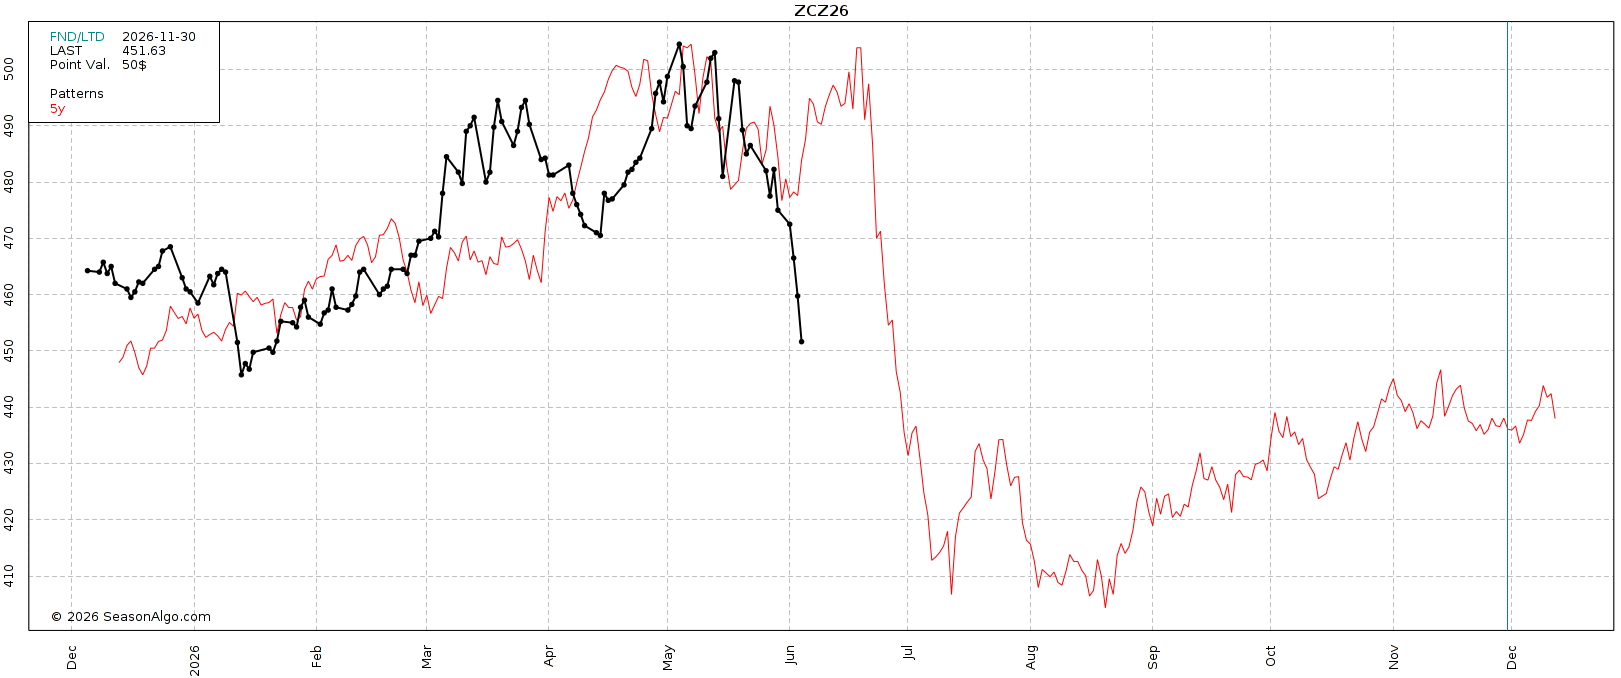
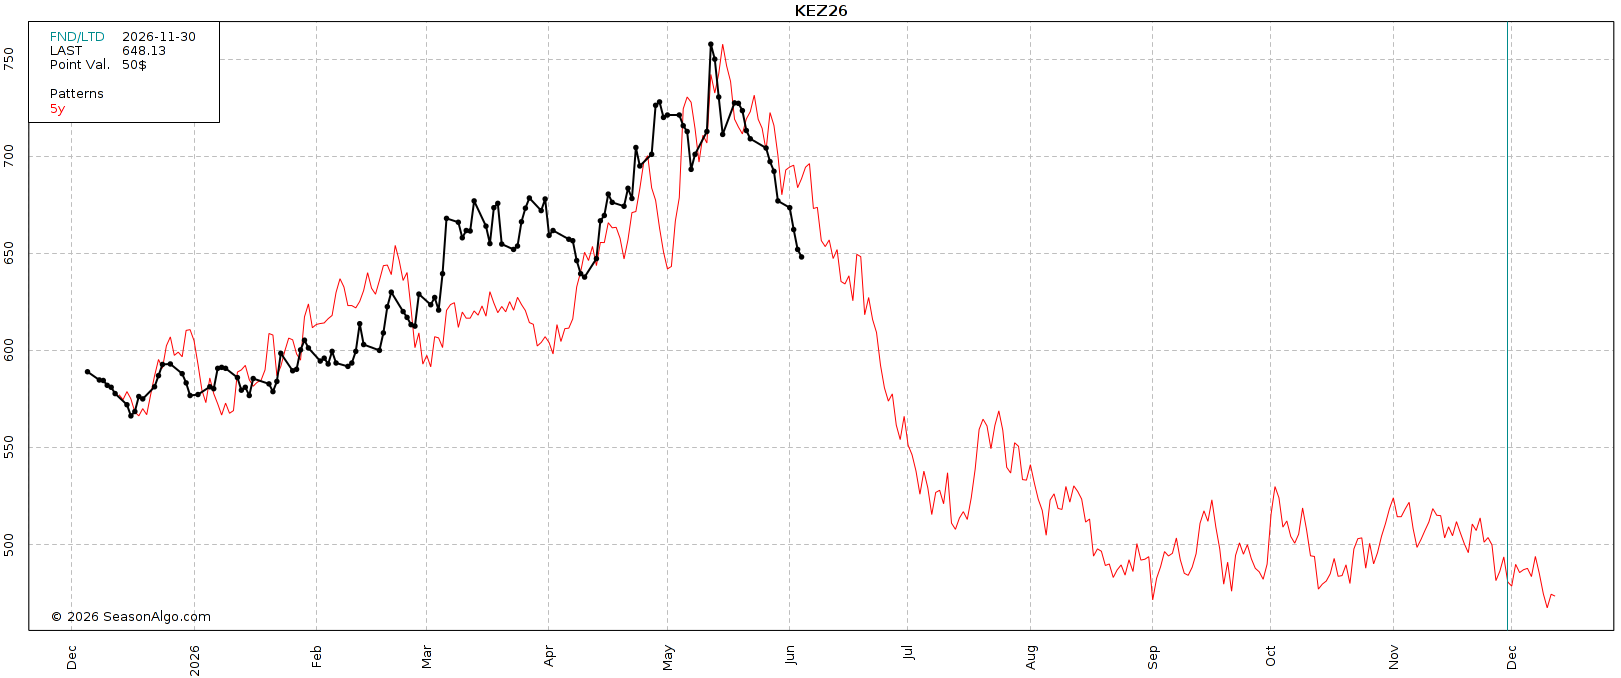
Here is that 5-year seasonal pattern.
You could argue might just be a few weeks ahead of schedule.
In this 5-year seasonal, we tend to carve out a true bottom and head higher in August.
But the market actually tends to stabilize in early July after the intial sell off.
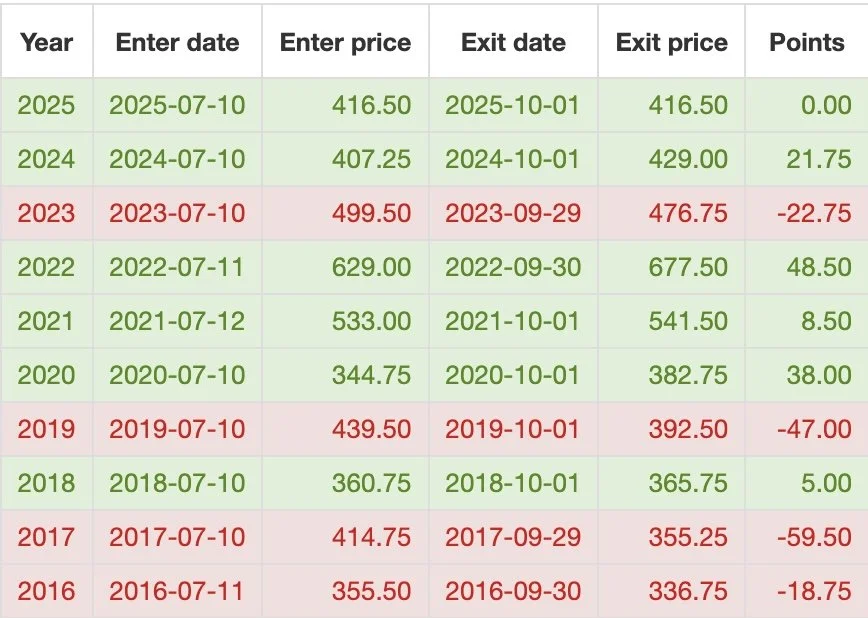
Here is another set of seasonal data.
This one is July 10th (that seasonal date for stabilization on the 5-year seasonal) by October 1st.
After the seasonal sell off, we've been higher by October the last 5 of 6 years.
So essentially, we just want to get through that seasonal pressure, which we've started.
I like the 5-year seasonal more than the longer term seasonals because this is the 3rd year in a row without a weather scare (so far anyways).
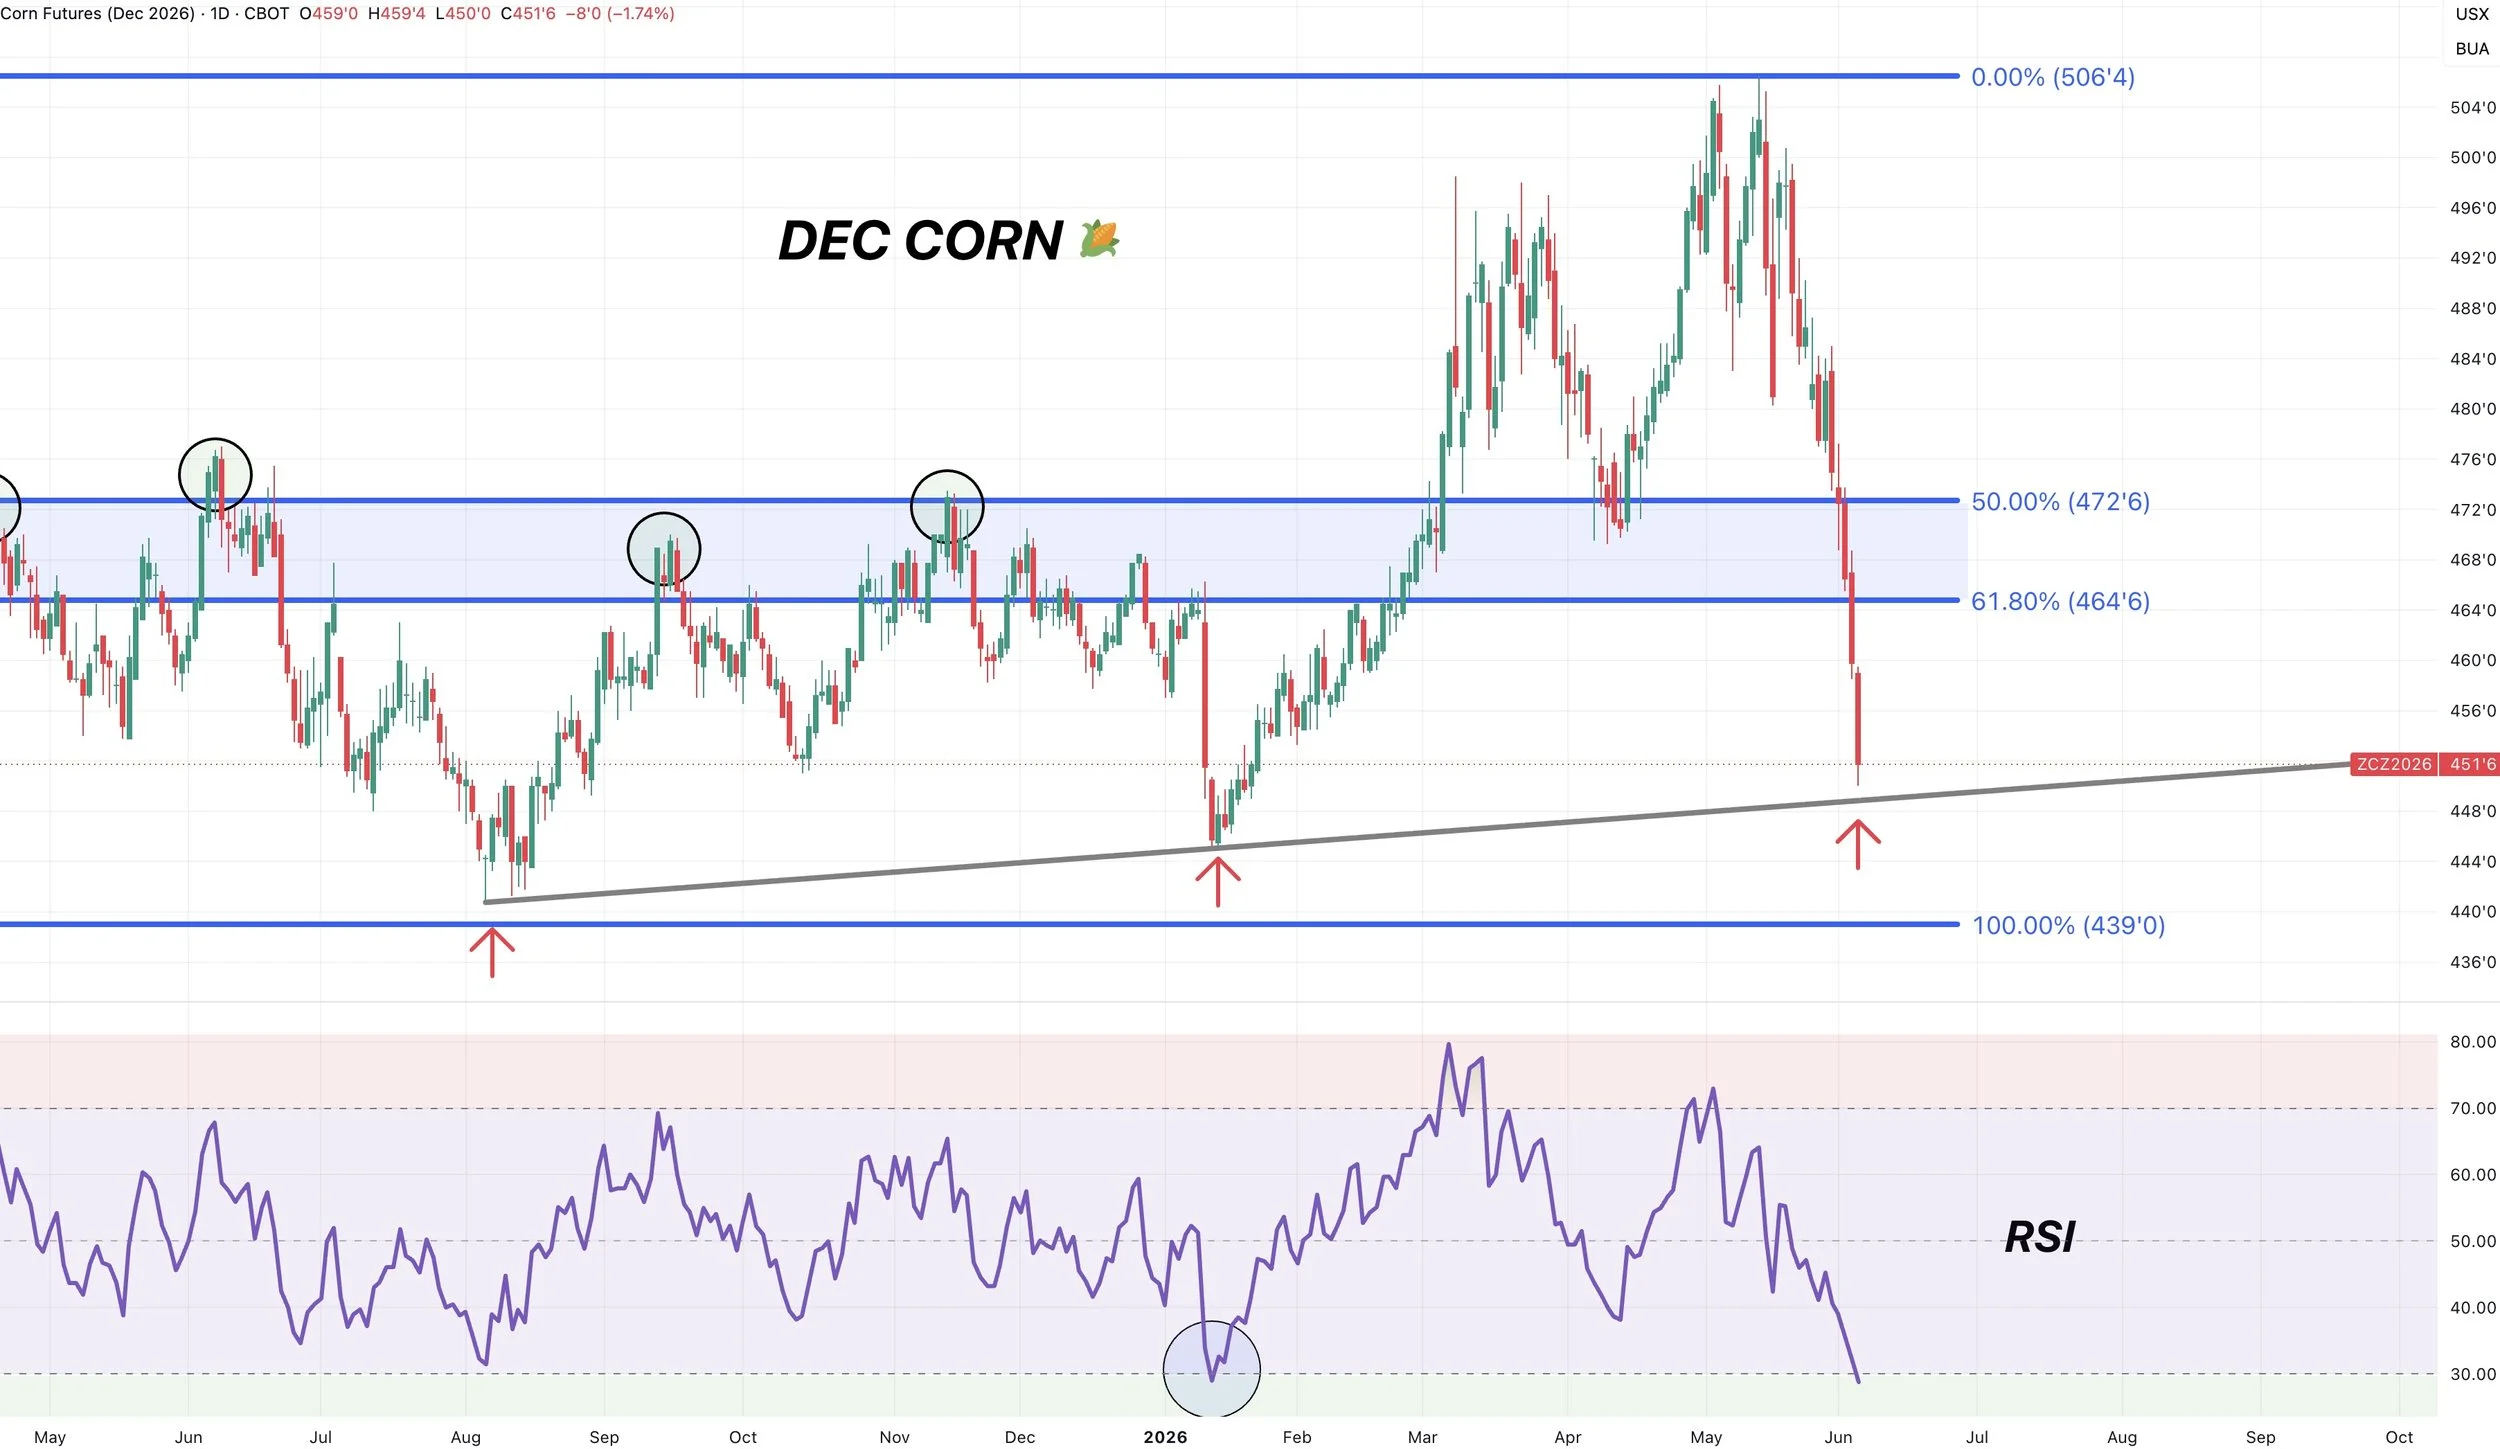
Dec Corn Chart:
Wanted to look at Dec first here today.
Not at contract lows like like July.
However, we lost major support.
We broke below the 61.8% retracement from the highs to contract lows. This tell us the overalll trend is likely lower from here.
One thing to note is that the RSI is the most oversold it has ever been.
Last time it was this oversold we bounced. So it would be reasonable to think we bounce here soon.
We also have some potential trendline support here as well.
Do we have to bounce here? No.
Would it make sense for us to bounce here? Yes.
Break this level and we could be looking at contract lows next.
For all of the charts today, I am not going over any upside targets. I will only go over upside targets once it feels like we've put in a short term bottom.
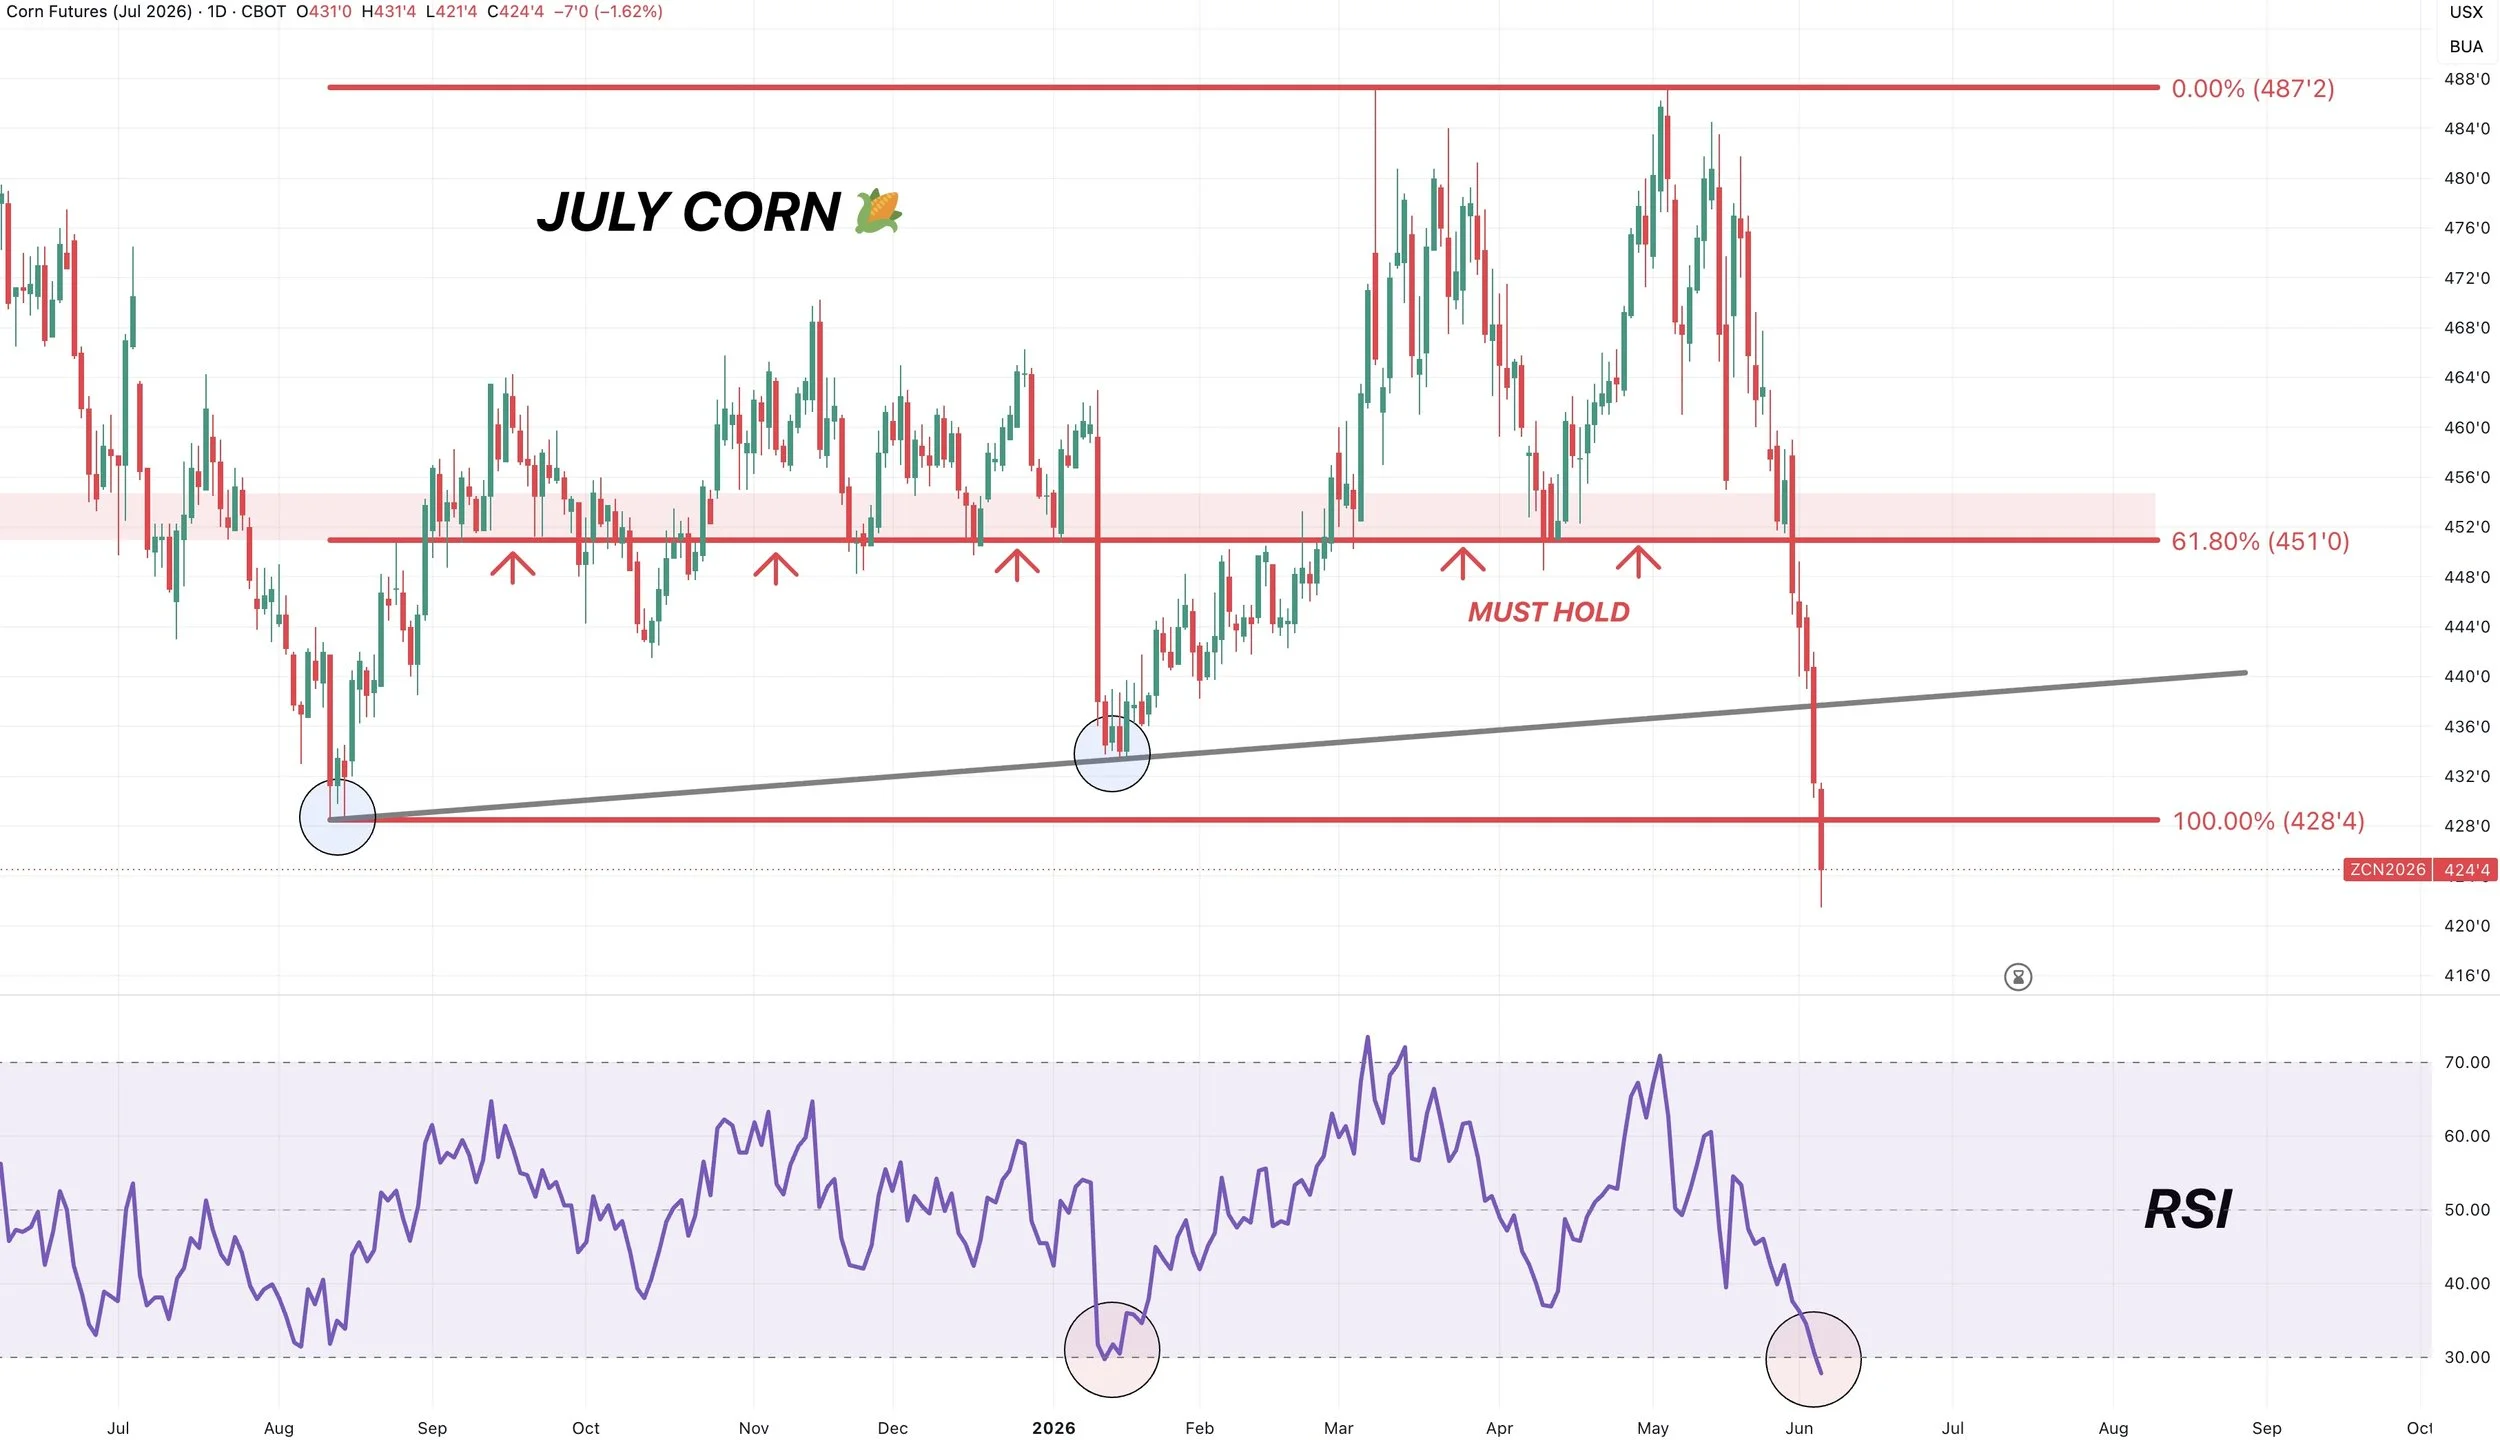
July Chart:
New contract lows in July corn.
The chart looks about as ugly as it can get.
We broke through every single level of support.
As the flood gates opened when we lost that must hold $4.50 level.
Since we made new contract lows, there is no support beneath us.
However, like Dec, we are getting very oversold.
The last time we were this oversold was those January lows.
I don't like selling at contract lows. If you have to sell something, I'd want to do it on a bounce.
But the bounce clearly has to be treated as nothing more than relief bounce, unless we get a game changer.
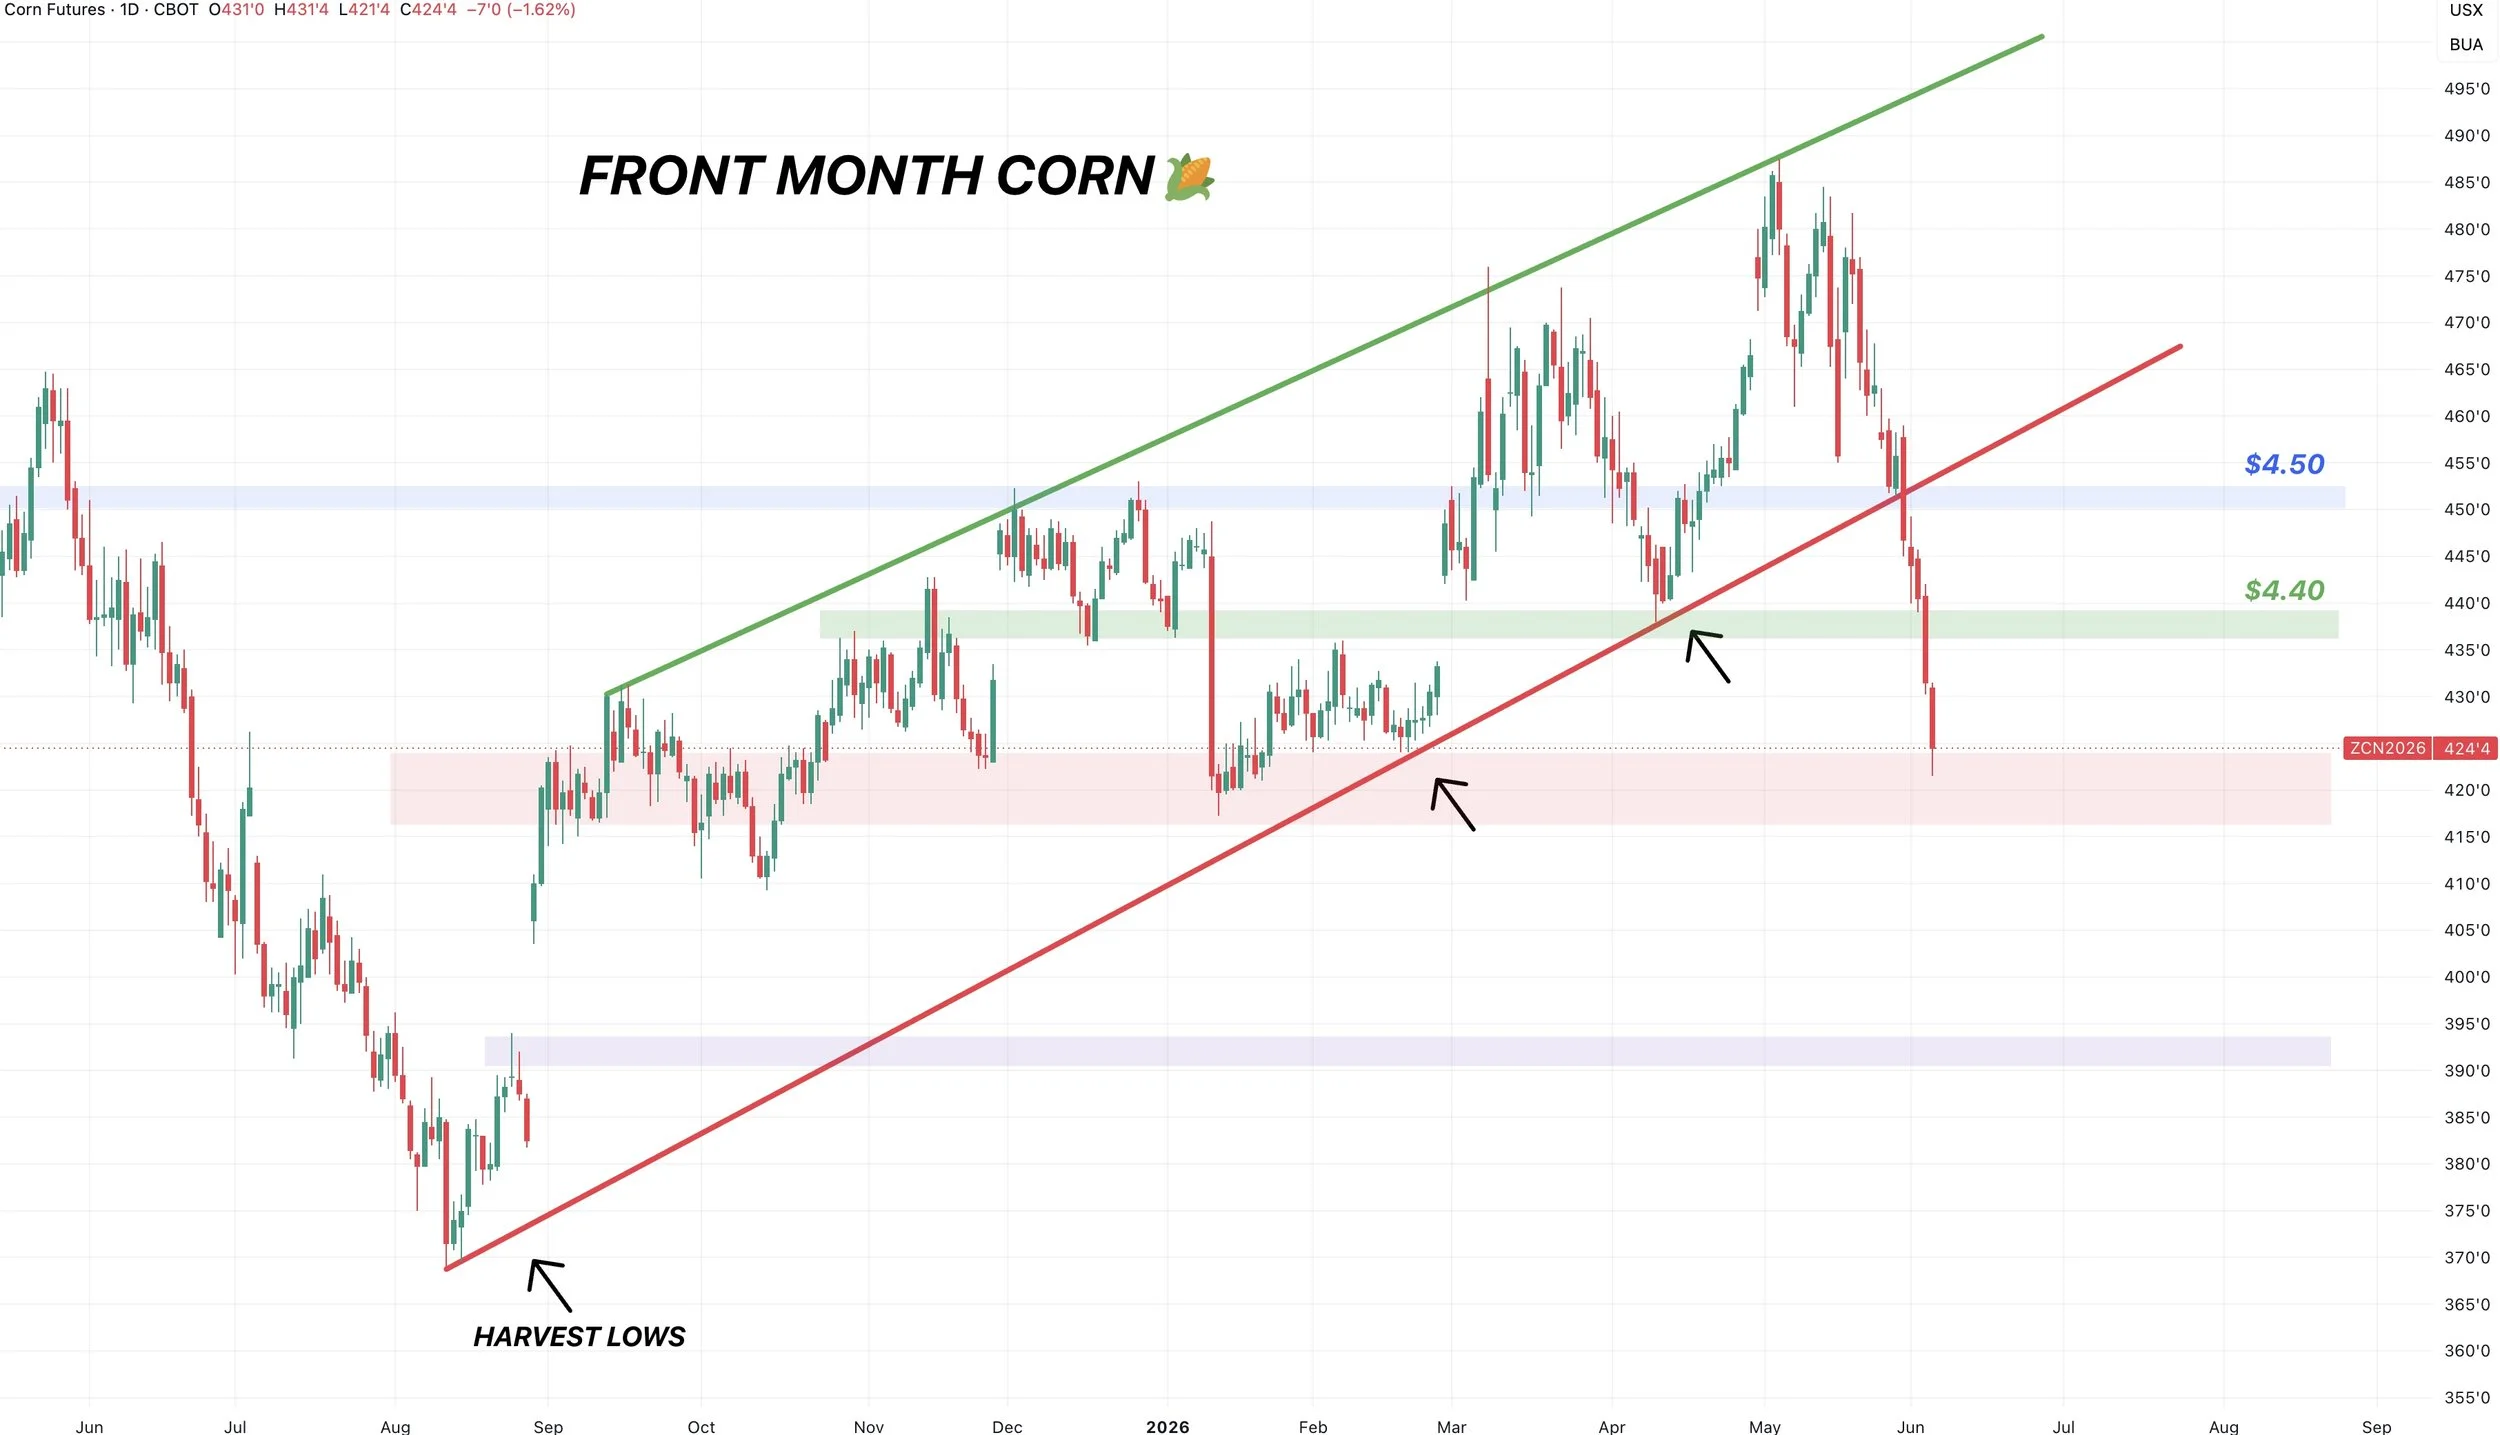
Front Month Corn Chart:
When you are at contract lows or contract highs, often times you have to use the front month chart to find potential targets or areas of support.
This is how we identified that $7.50 target in KC wheat.
If we look at corn here, we continue to break support.
We broke that uptrend we had held since the harvest lows.
This tells us that the overall structure in corn is lower.
Again, that does not mean we cannot get a bounce, but the overall trend is lower from here.
We are getting pretty close to one of our last levels of support right now.
So getting a bounce here soon, would make sense.
As it doesn’t make sense for us to drop further into that $4.00 area and then bounce. As there is no support there.
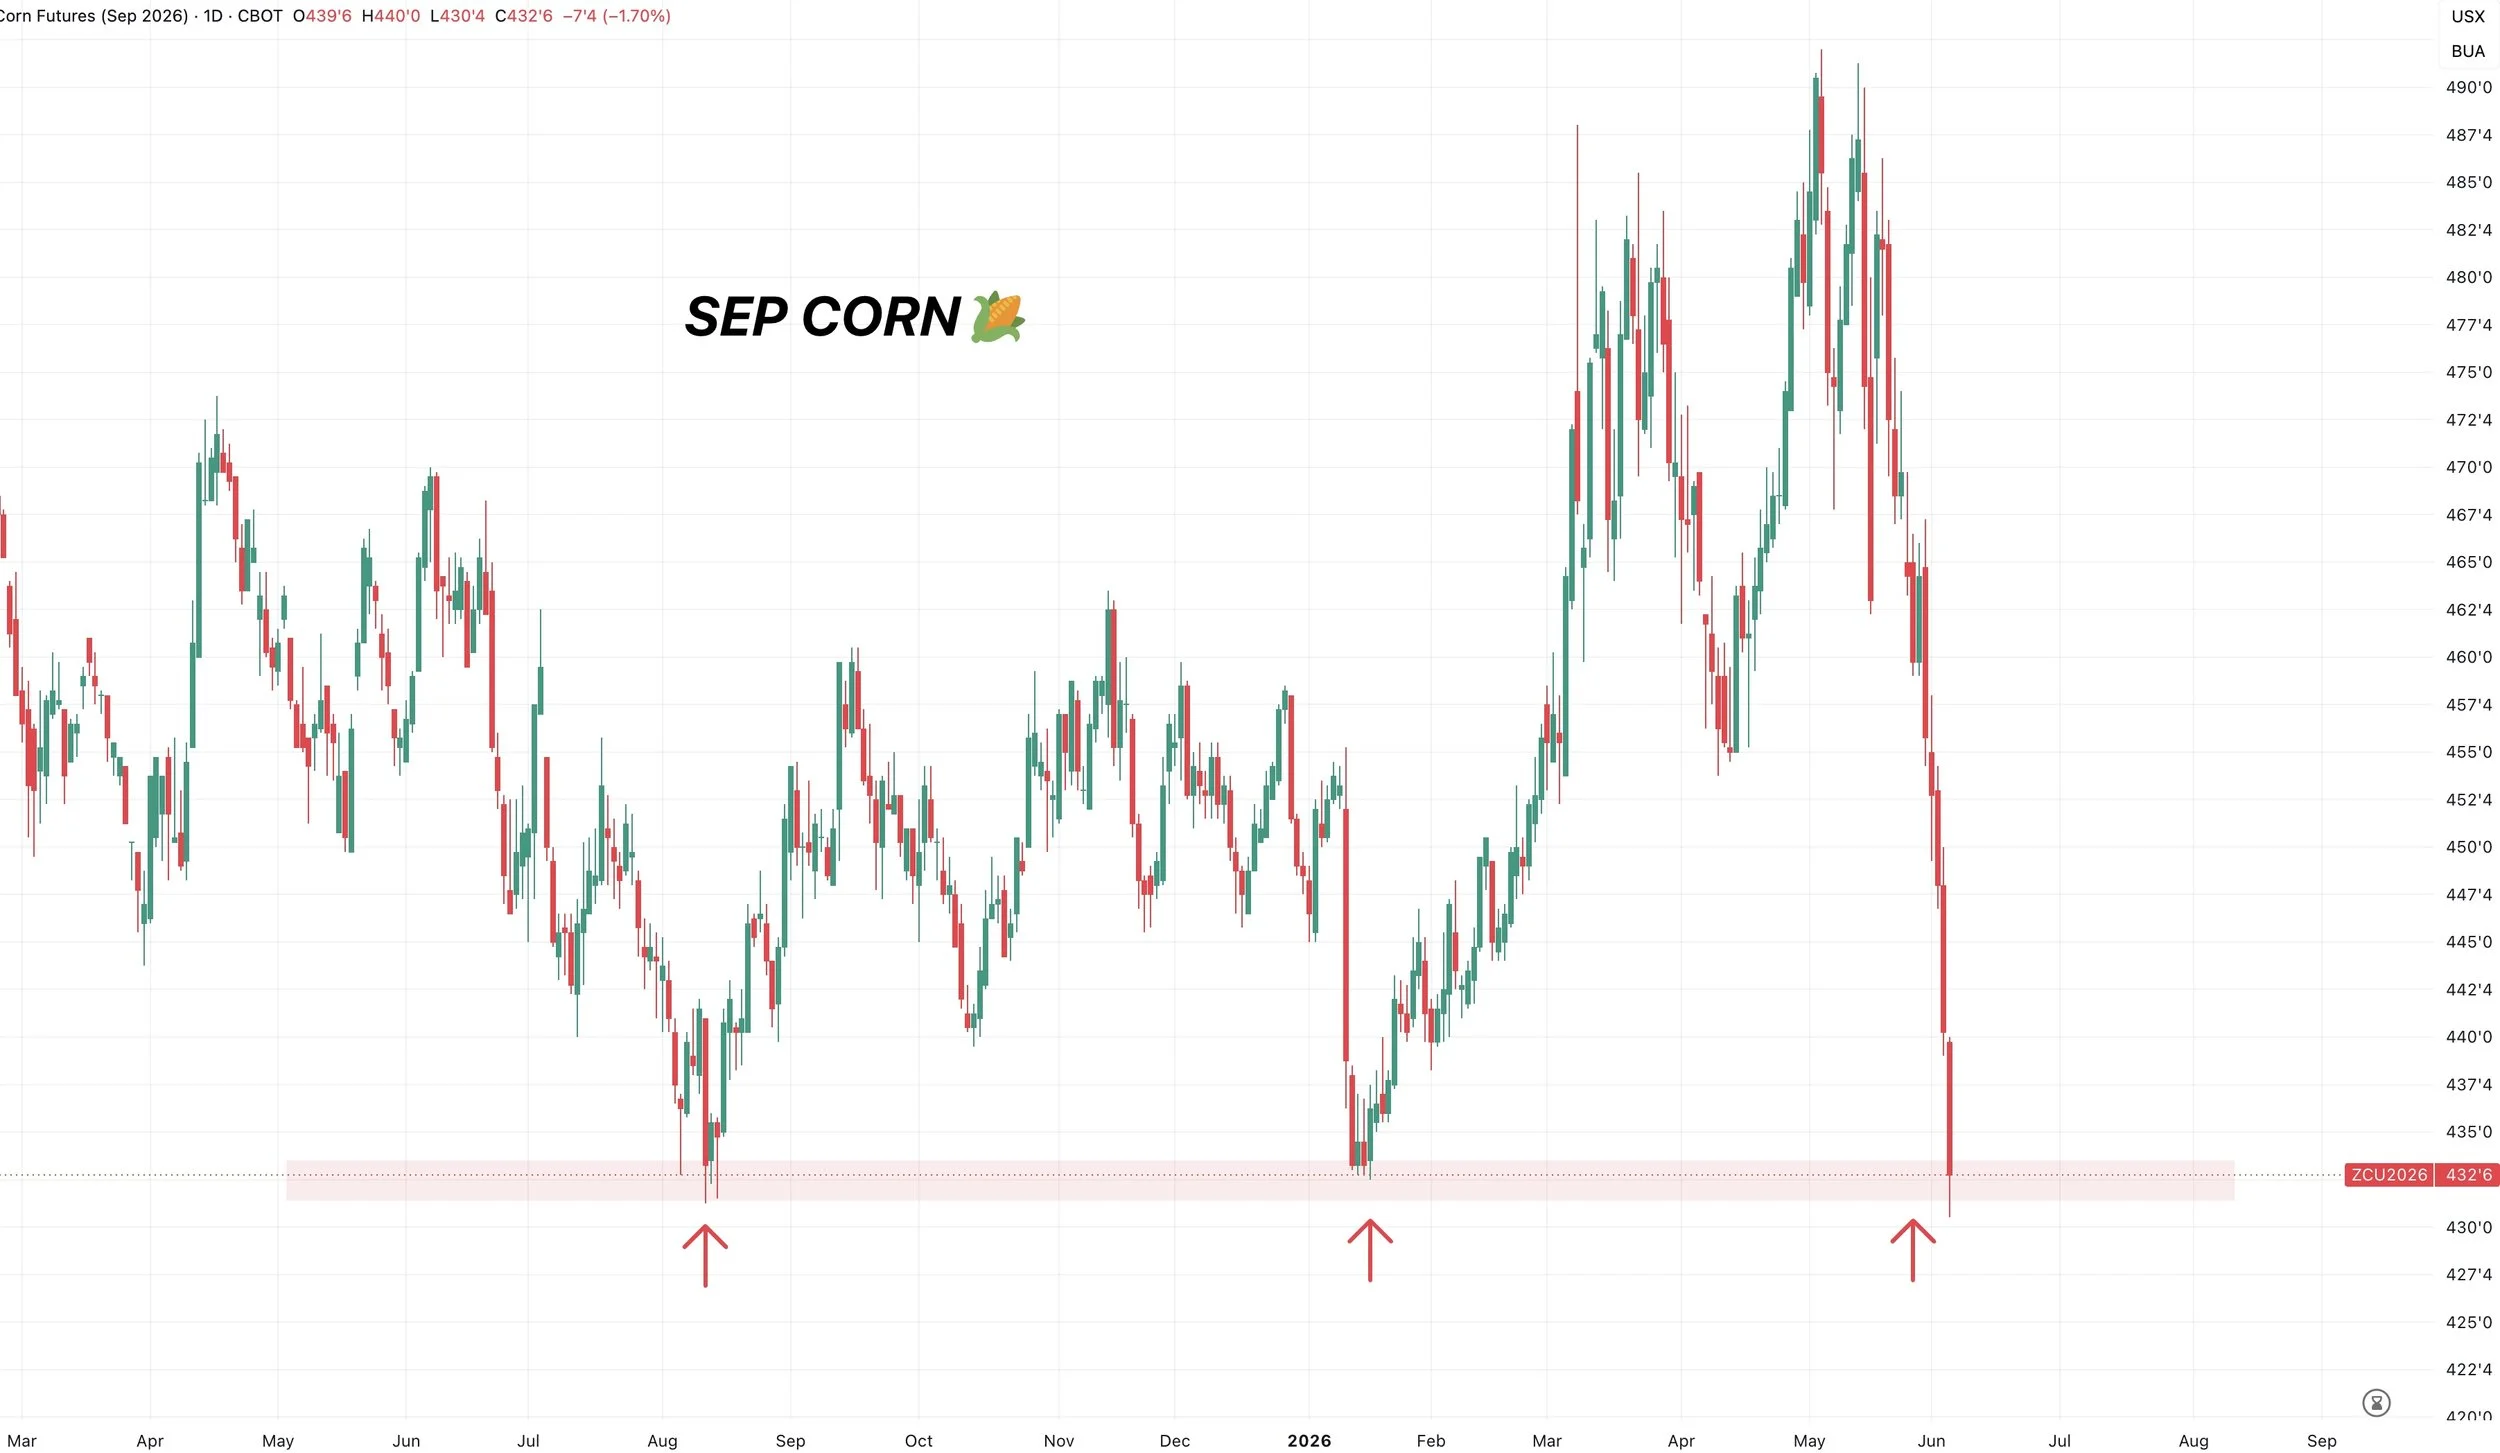
Sep Corn:
If we look at Sep corn here.
It's sitting at it's last line of support as well.
It's bottomed here twice before.
Lose this level and it wouldn’t be good.
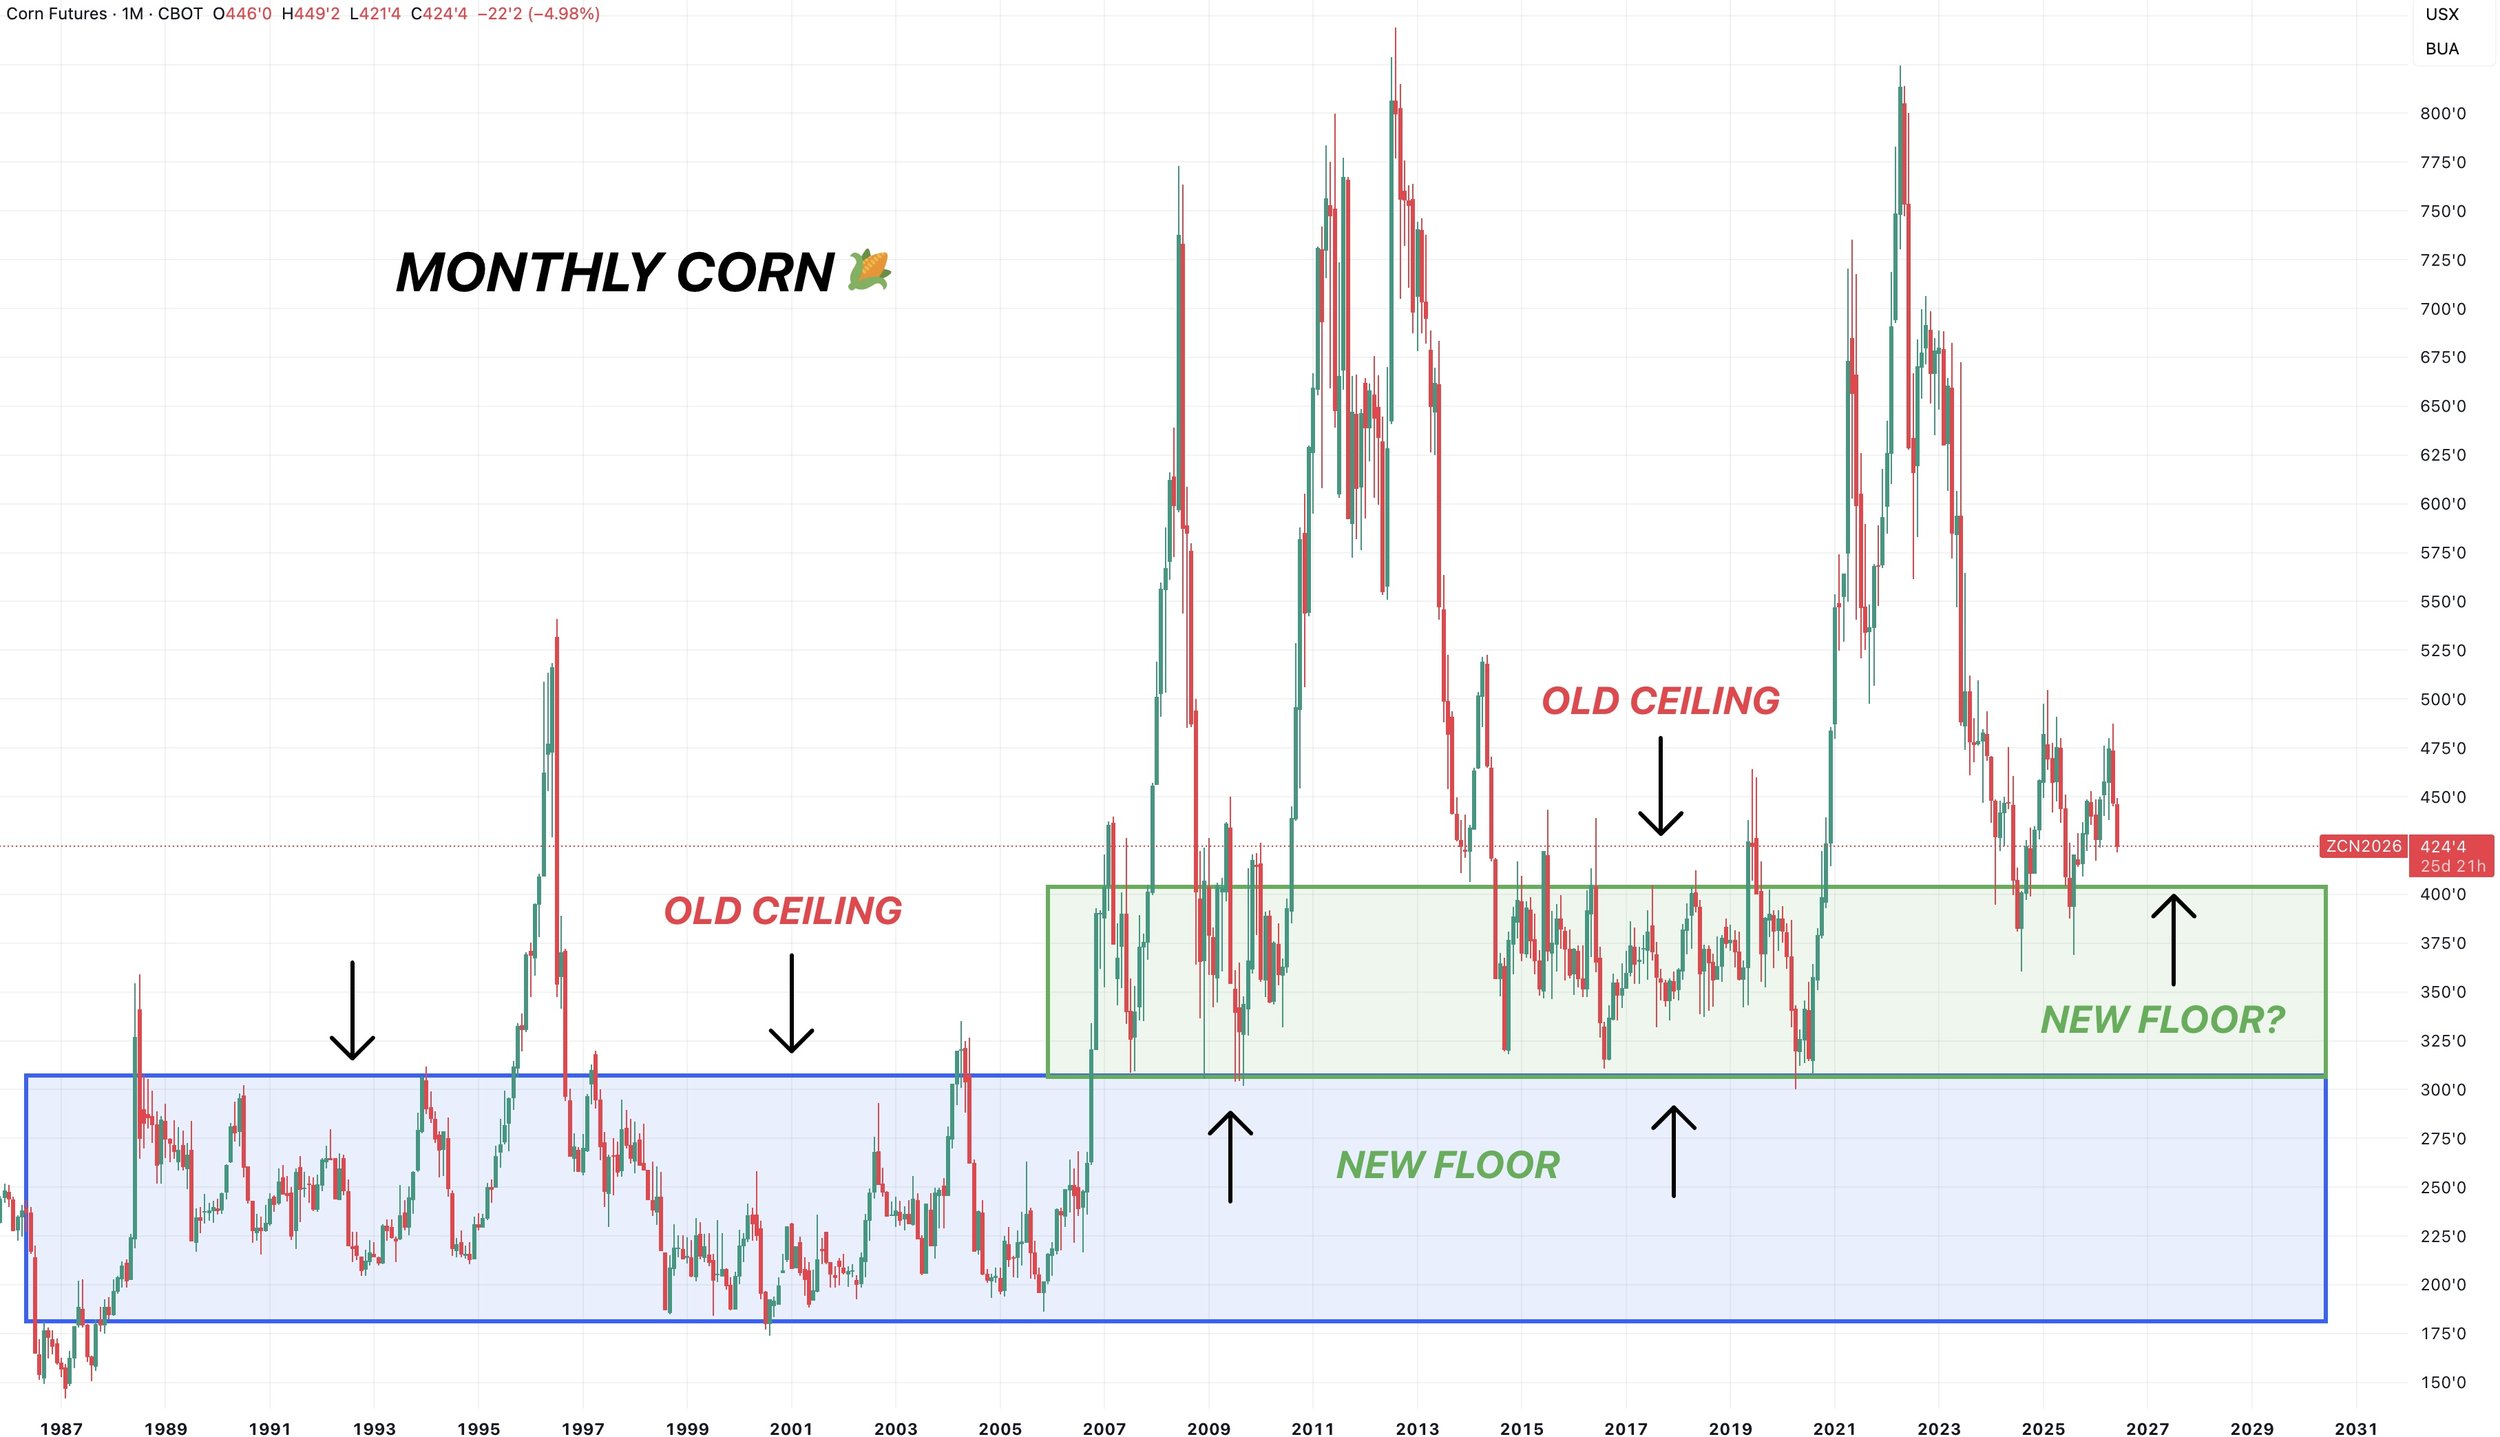
Monthly Corn Chart:
I showed this chart the other day.
I think our floor is around $4.00.
Could we venture below it for a short time? Sure. But if it happens, I do not think it lasts long.
Why I think that is the floor:
The ceiling in the 1990's and early 2000's was $3.00
In the 2010's, $3.00 became the new floor.
From 2015-2020, the ceiling was $4.00
So I expect that to roughly be the new floor on the front month.
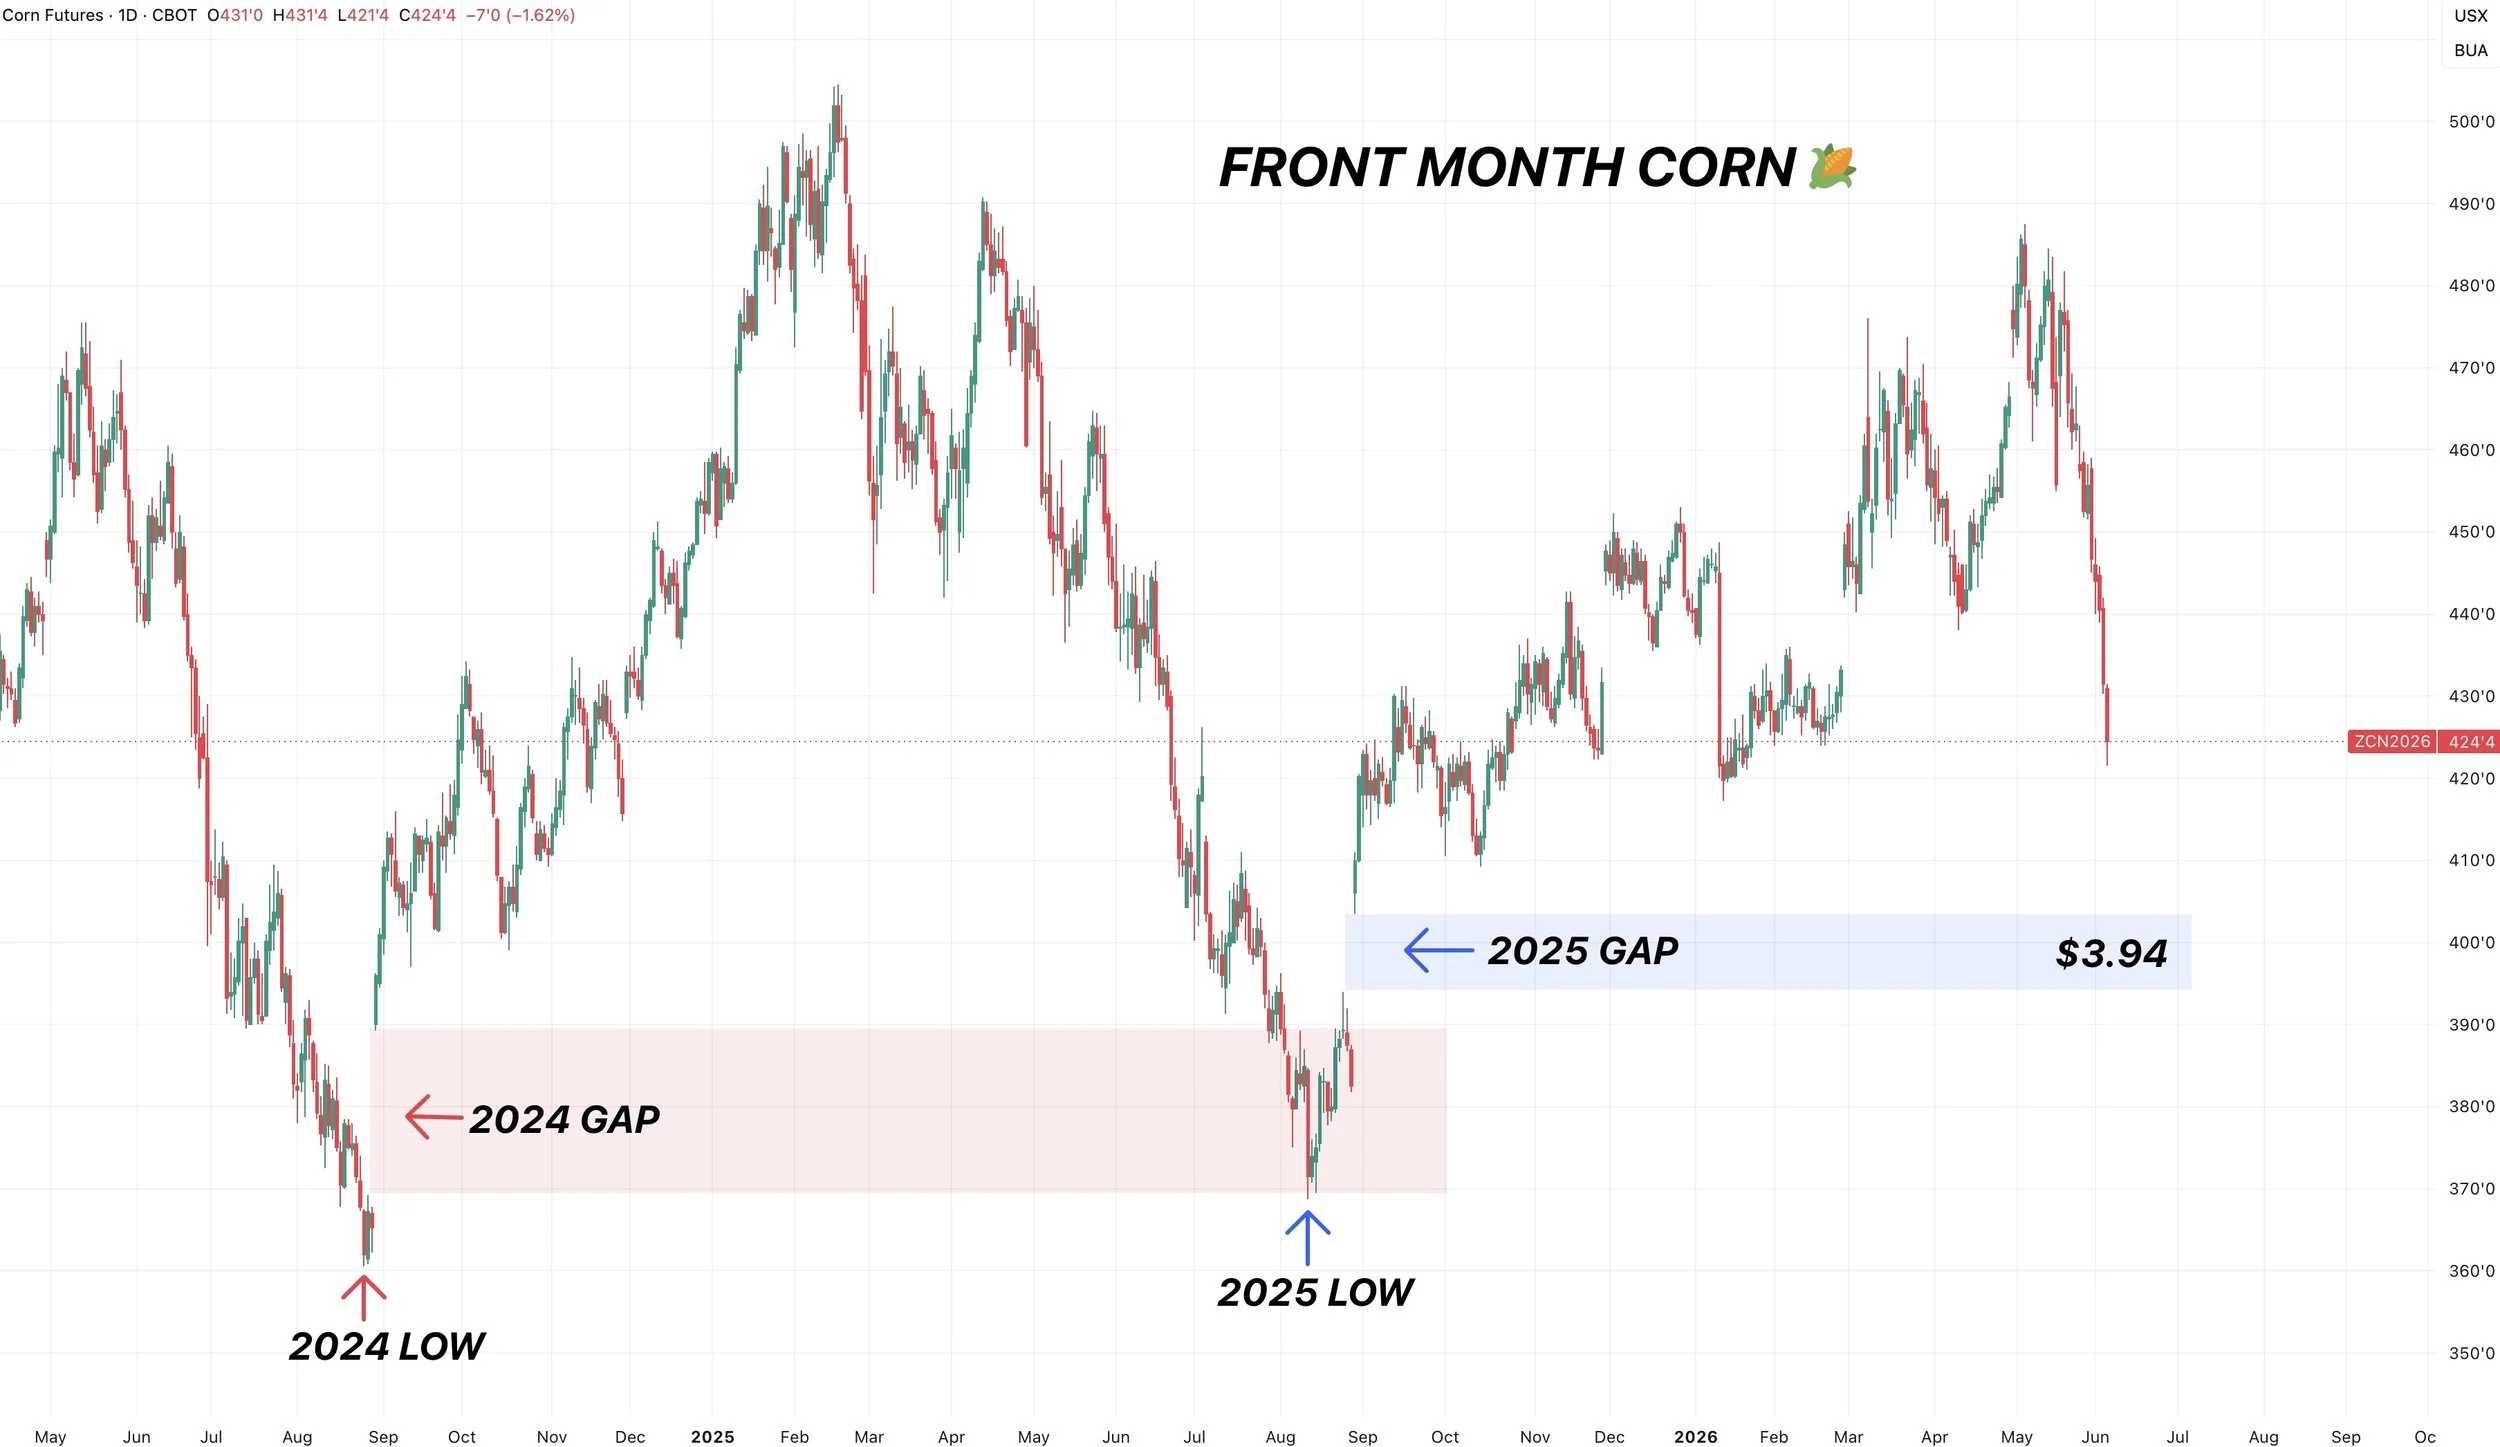
Where could the harvest low be?
Here is the front month chart again.
This chart shows rolls gap.
I found something interesting.
In 2024, we left a roll gap after the harvest lows.
In 2025, our harvest lows perfectly filled that roll gap. To the exact penny.
Last year we also left a roll gap after harvest, that roll gap comes in $3.94
Our lows last year were $3.68
I do not think we get as low as last year.
The new crop situation is far friendlier than the old crop situation.
Soybeans
Soybeans joined the puke party today.
Why?
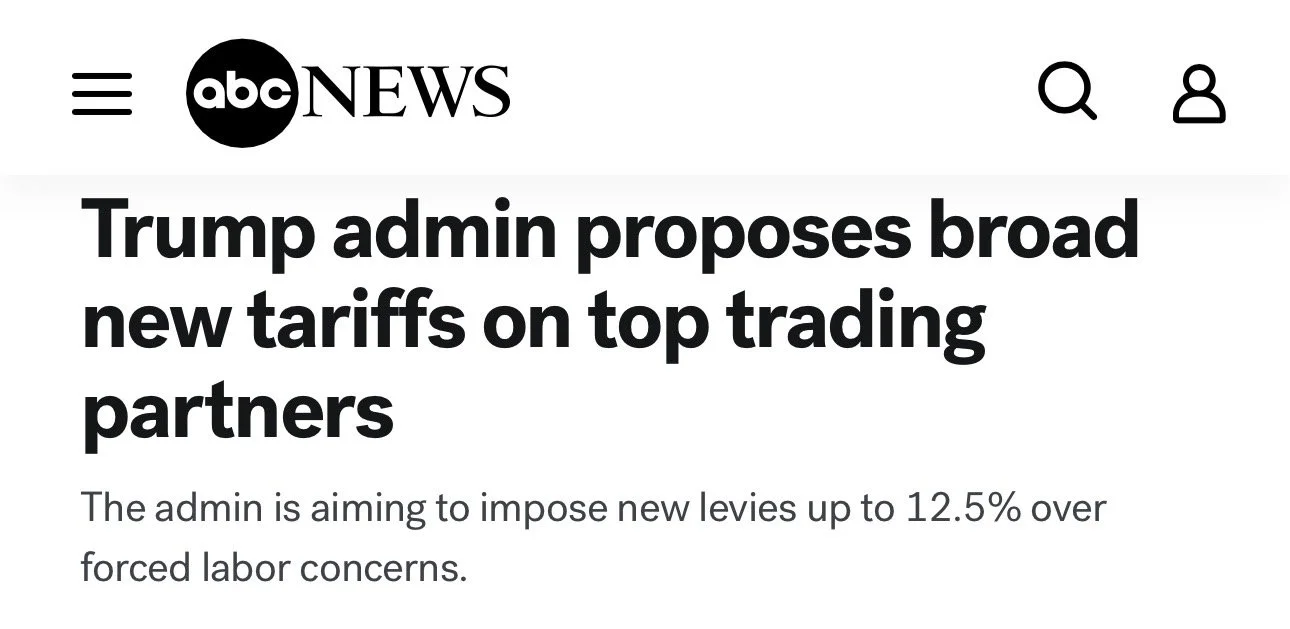
It was partially part of another Trump headline.
They proposed new tariffs on our top trading partners, including China.
Throw on beneficial weather and a risk-off taste of commodities from the funds.
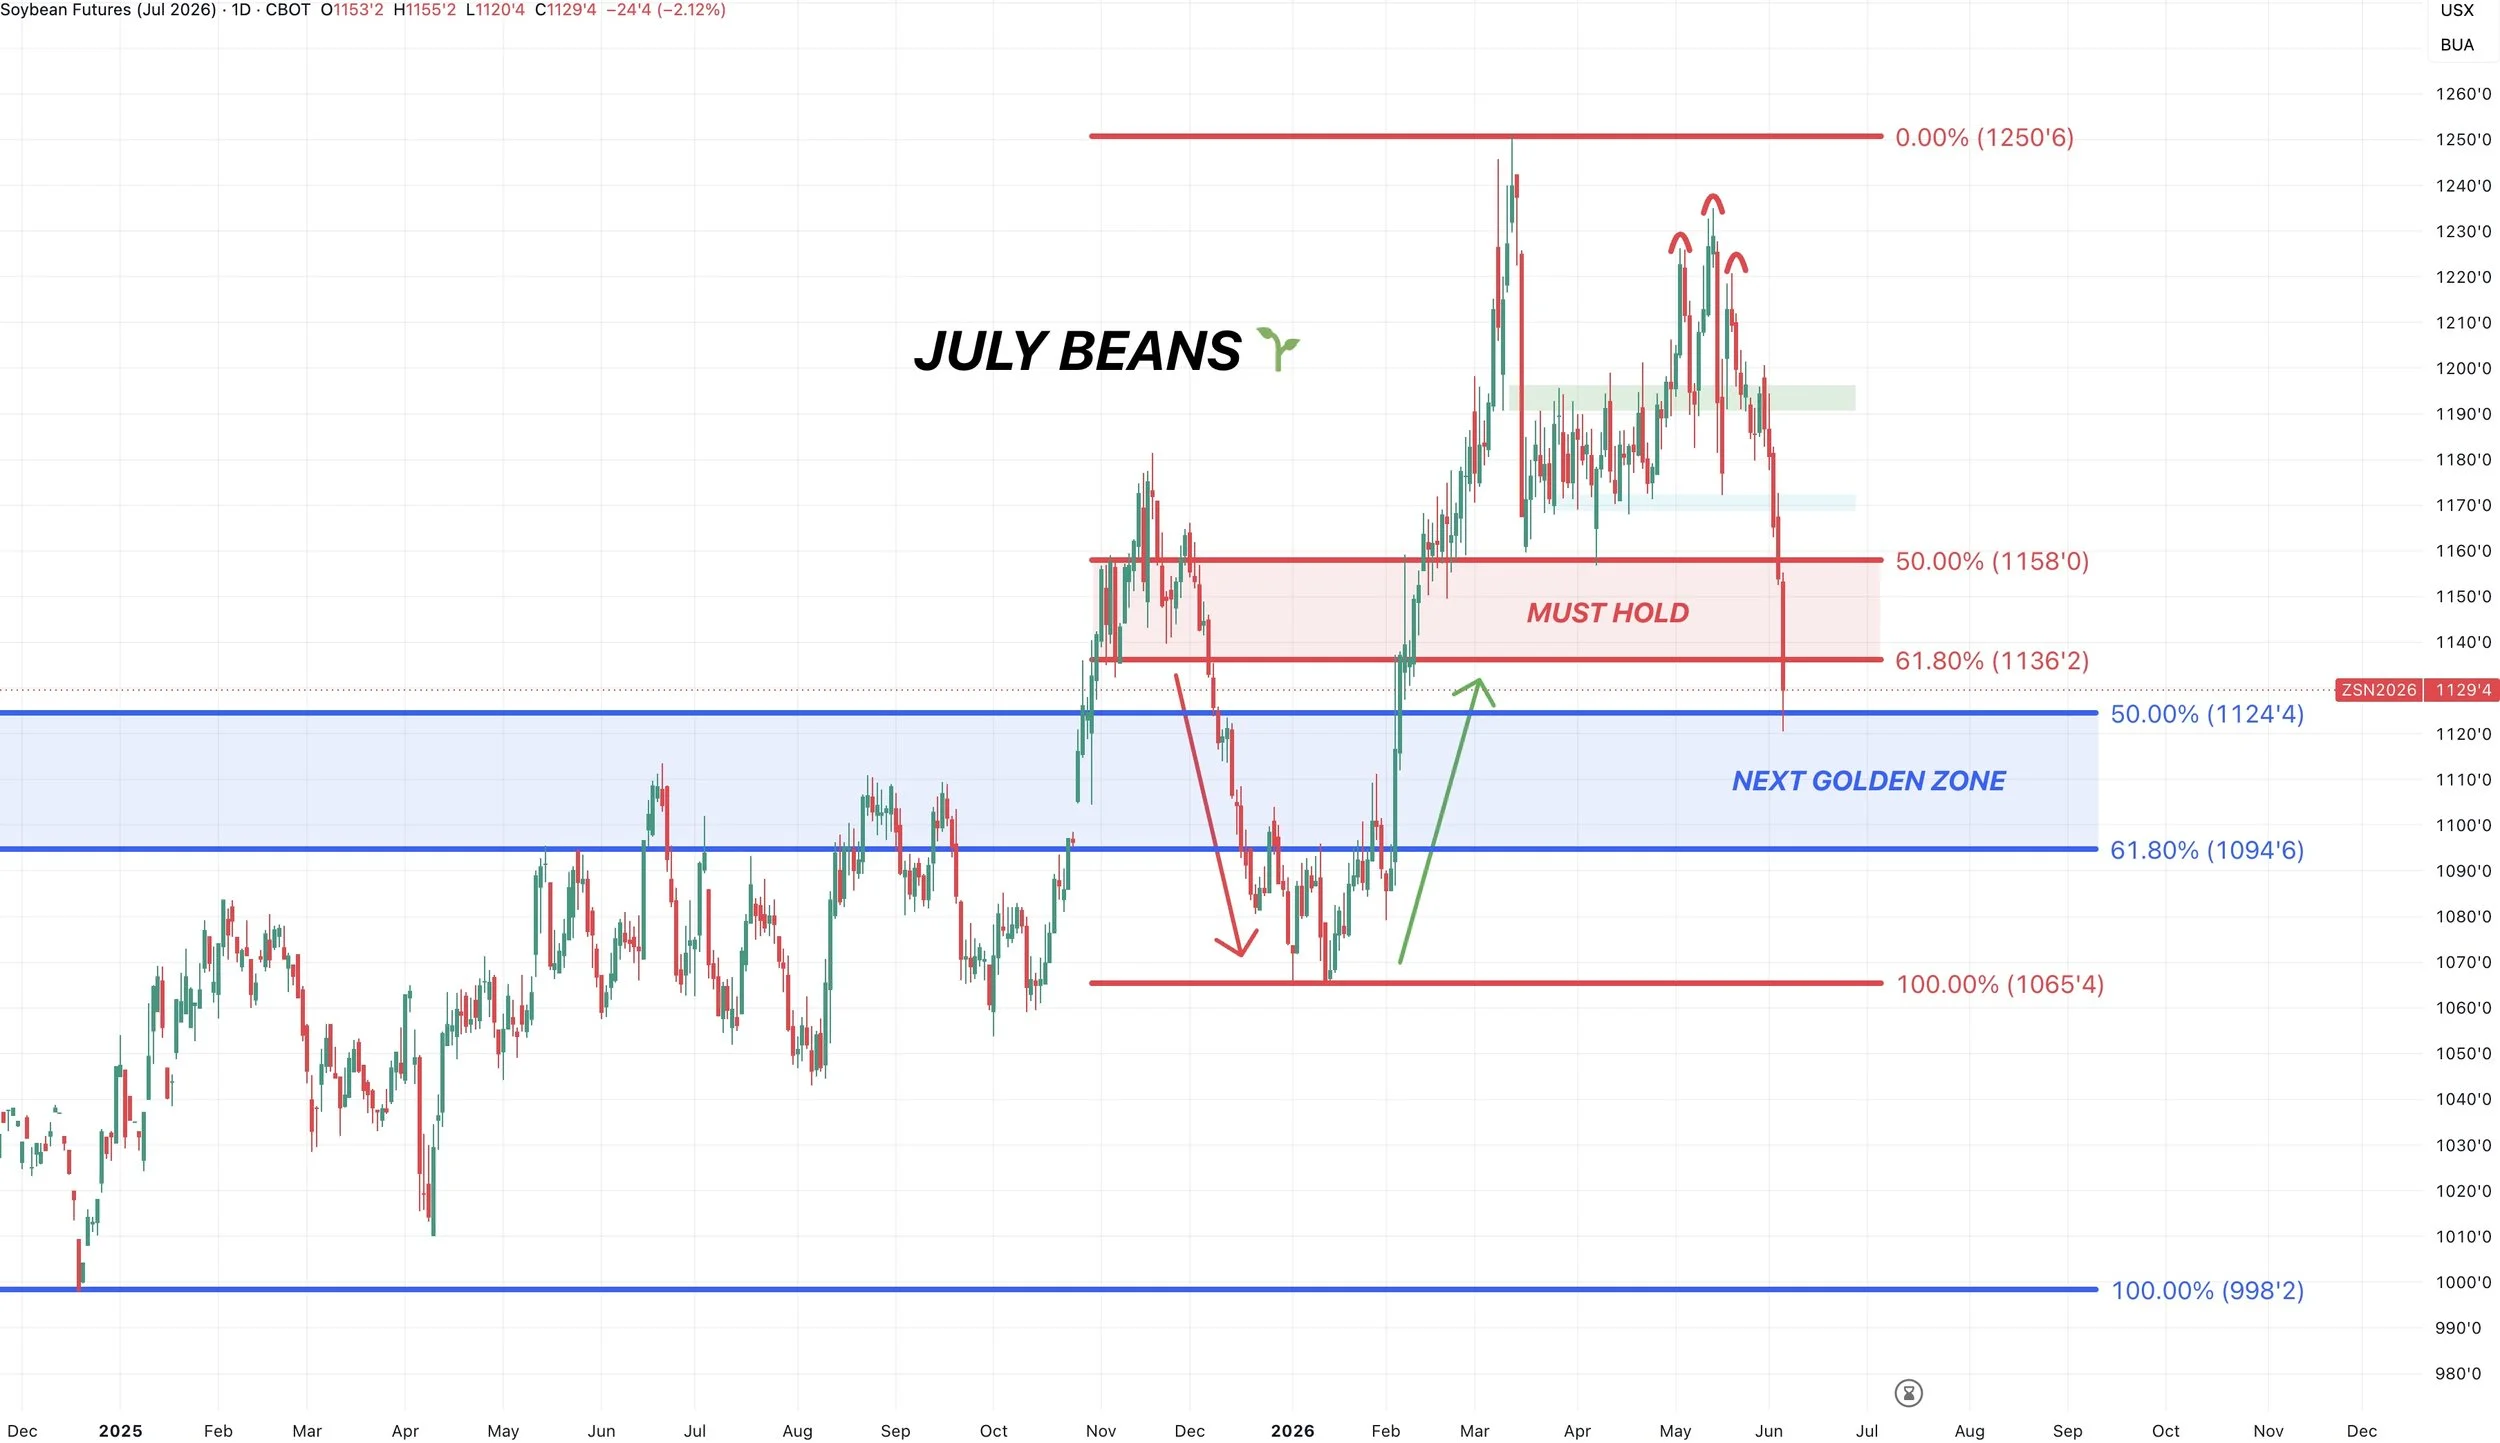
July Beans Chart:
We broke some major support.
We fell out of that old range, which opened the door lower. As there simply was no support or volume below that range. So it accelerated the downside.
We then failed to hold the 61.8% retracement down to the January lows.
Which tells us the overall trend in soybeans is now lower, and opens the door lower.
Unless today was a bear trap. But we'd need back above $11.36 tomorrow.
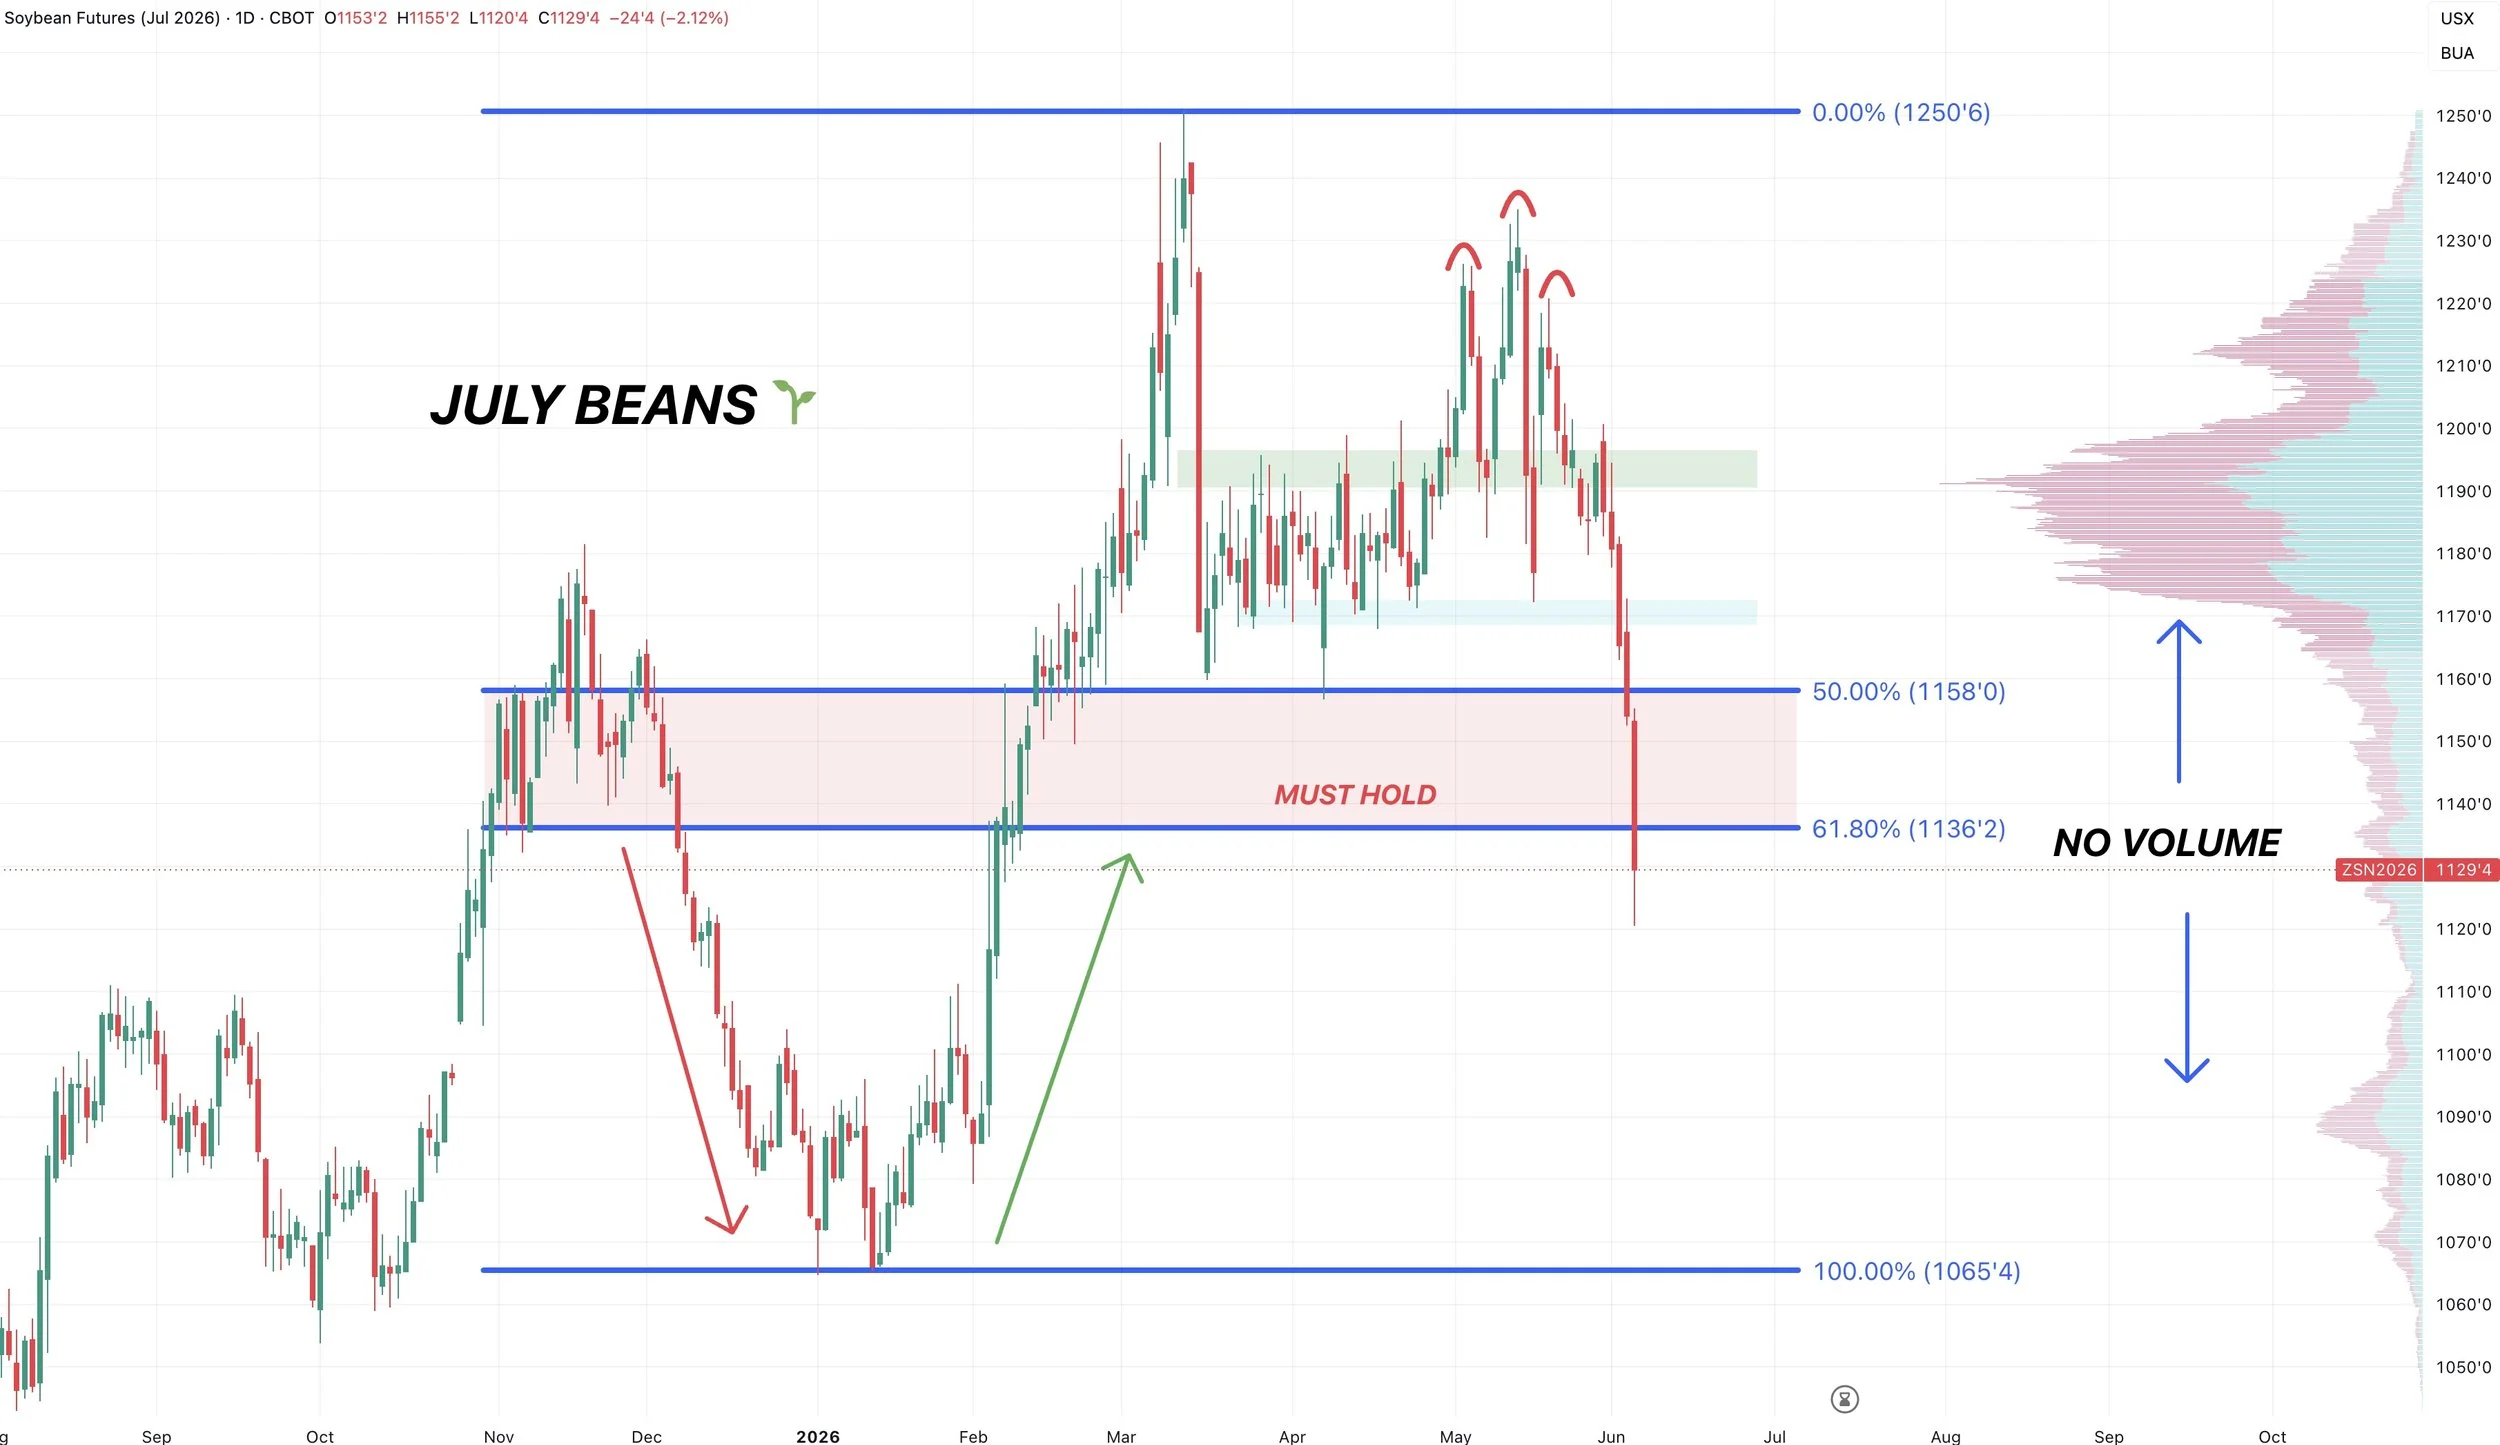
The next big support is the golden zone from the highs all the way down to contract lows.
That same level lines up with resistance from last year.
That's where I'd like to see us bounce.
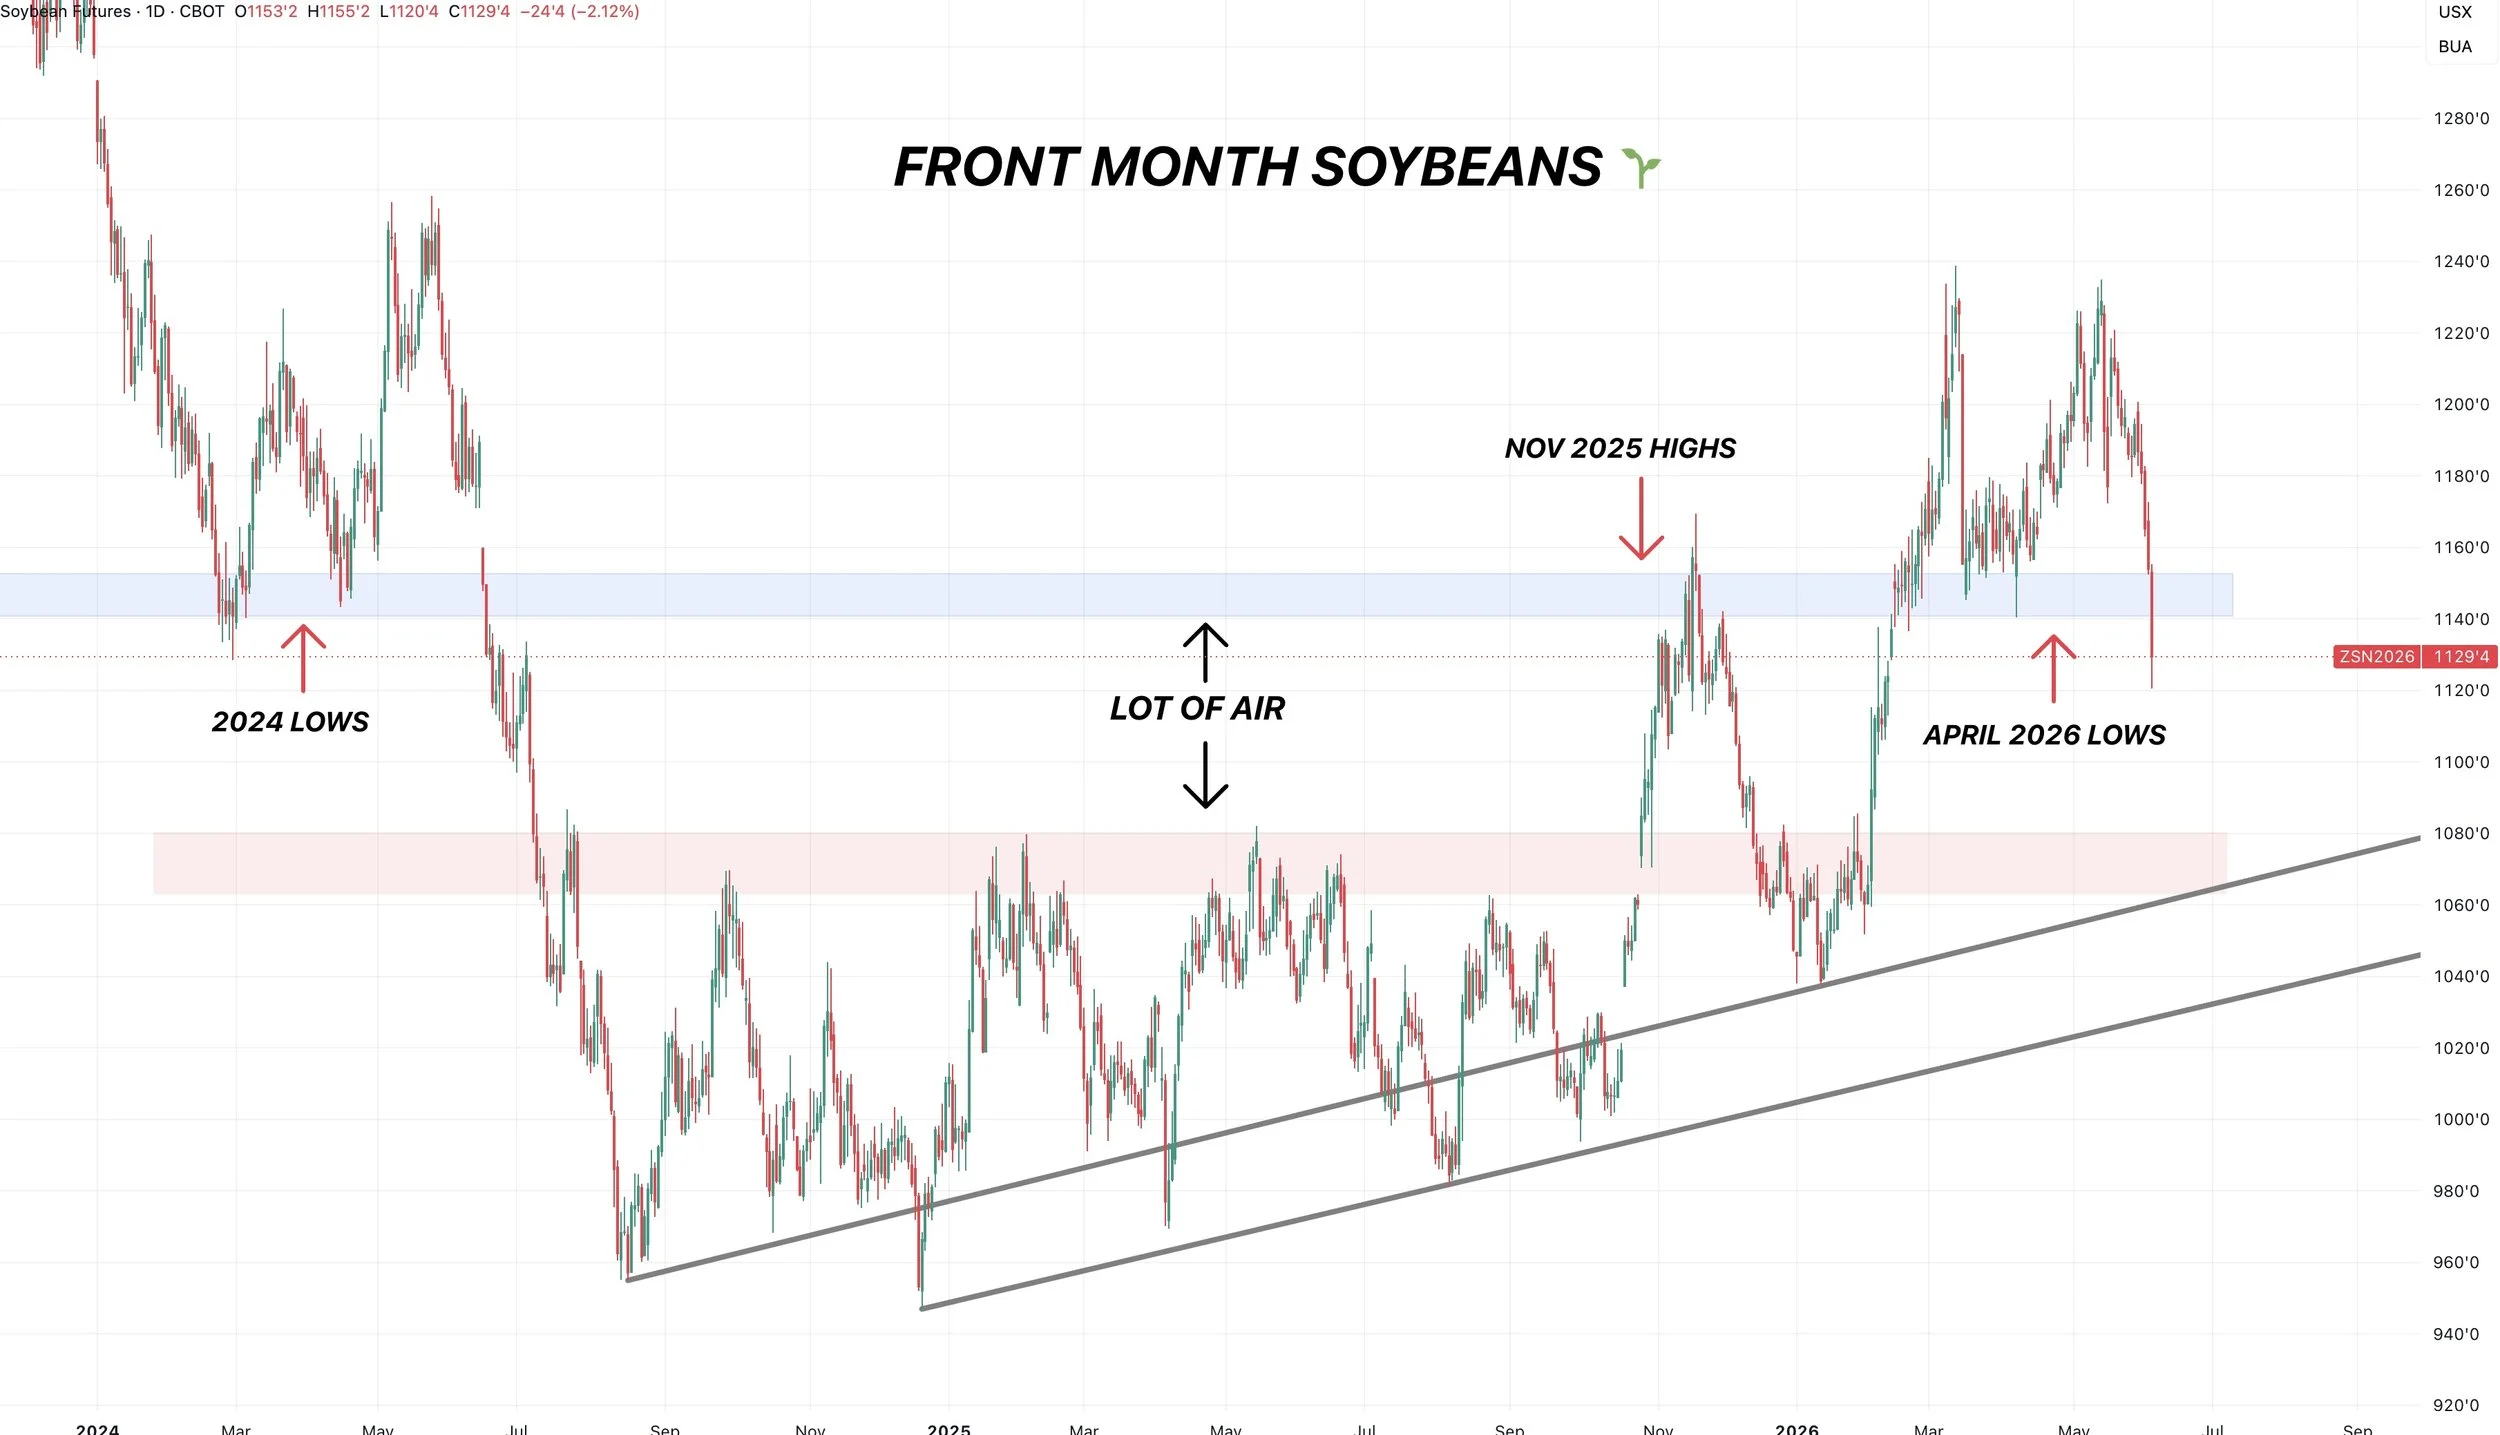
Front Month Beans Chart:
That $11.40 level was pretty crucial.
If you look on this chart, breaking that level does offer a lot of risk.
As there is plenty of air to the downside now that the $11.40 level failed.
$11.40 was the 2024 lows. It was the November 2025 highs. It was where we bounced in April this year.
Each time we traded between $10.80 and $11.40 we did slice right through.
So we either need to bounce back above asap and leave a bear trap, or there is room lower.
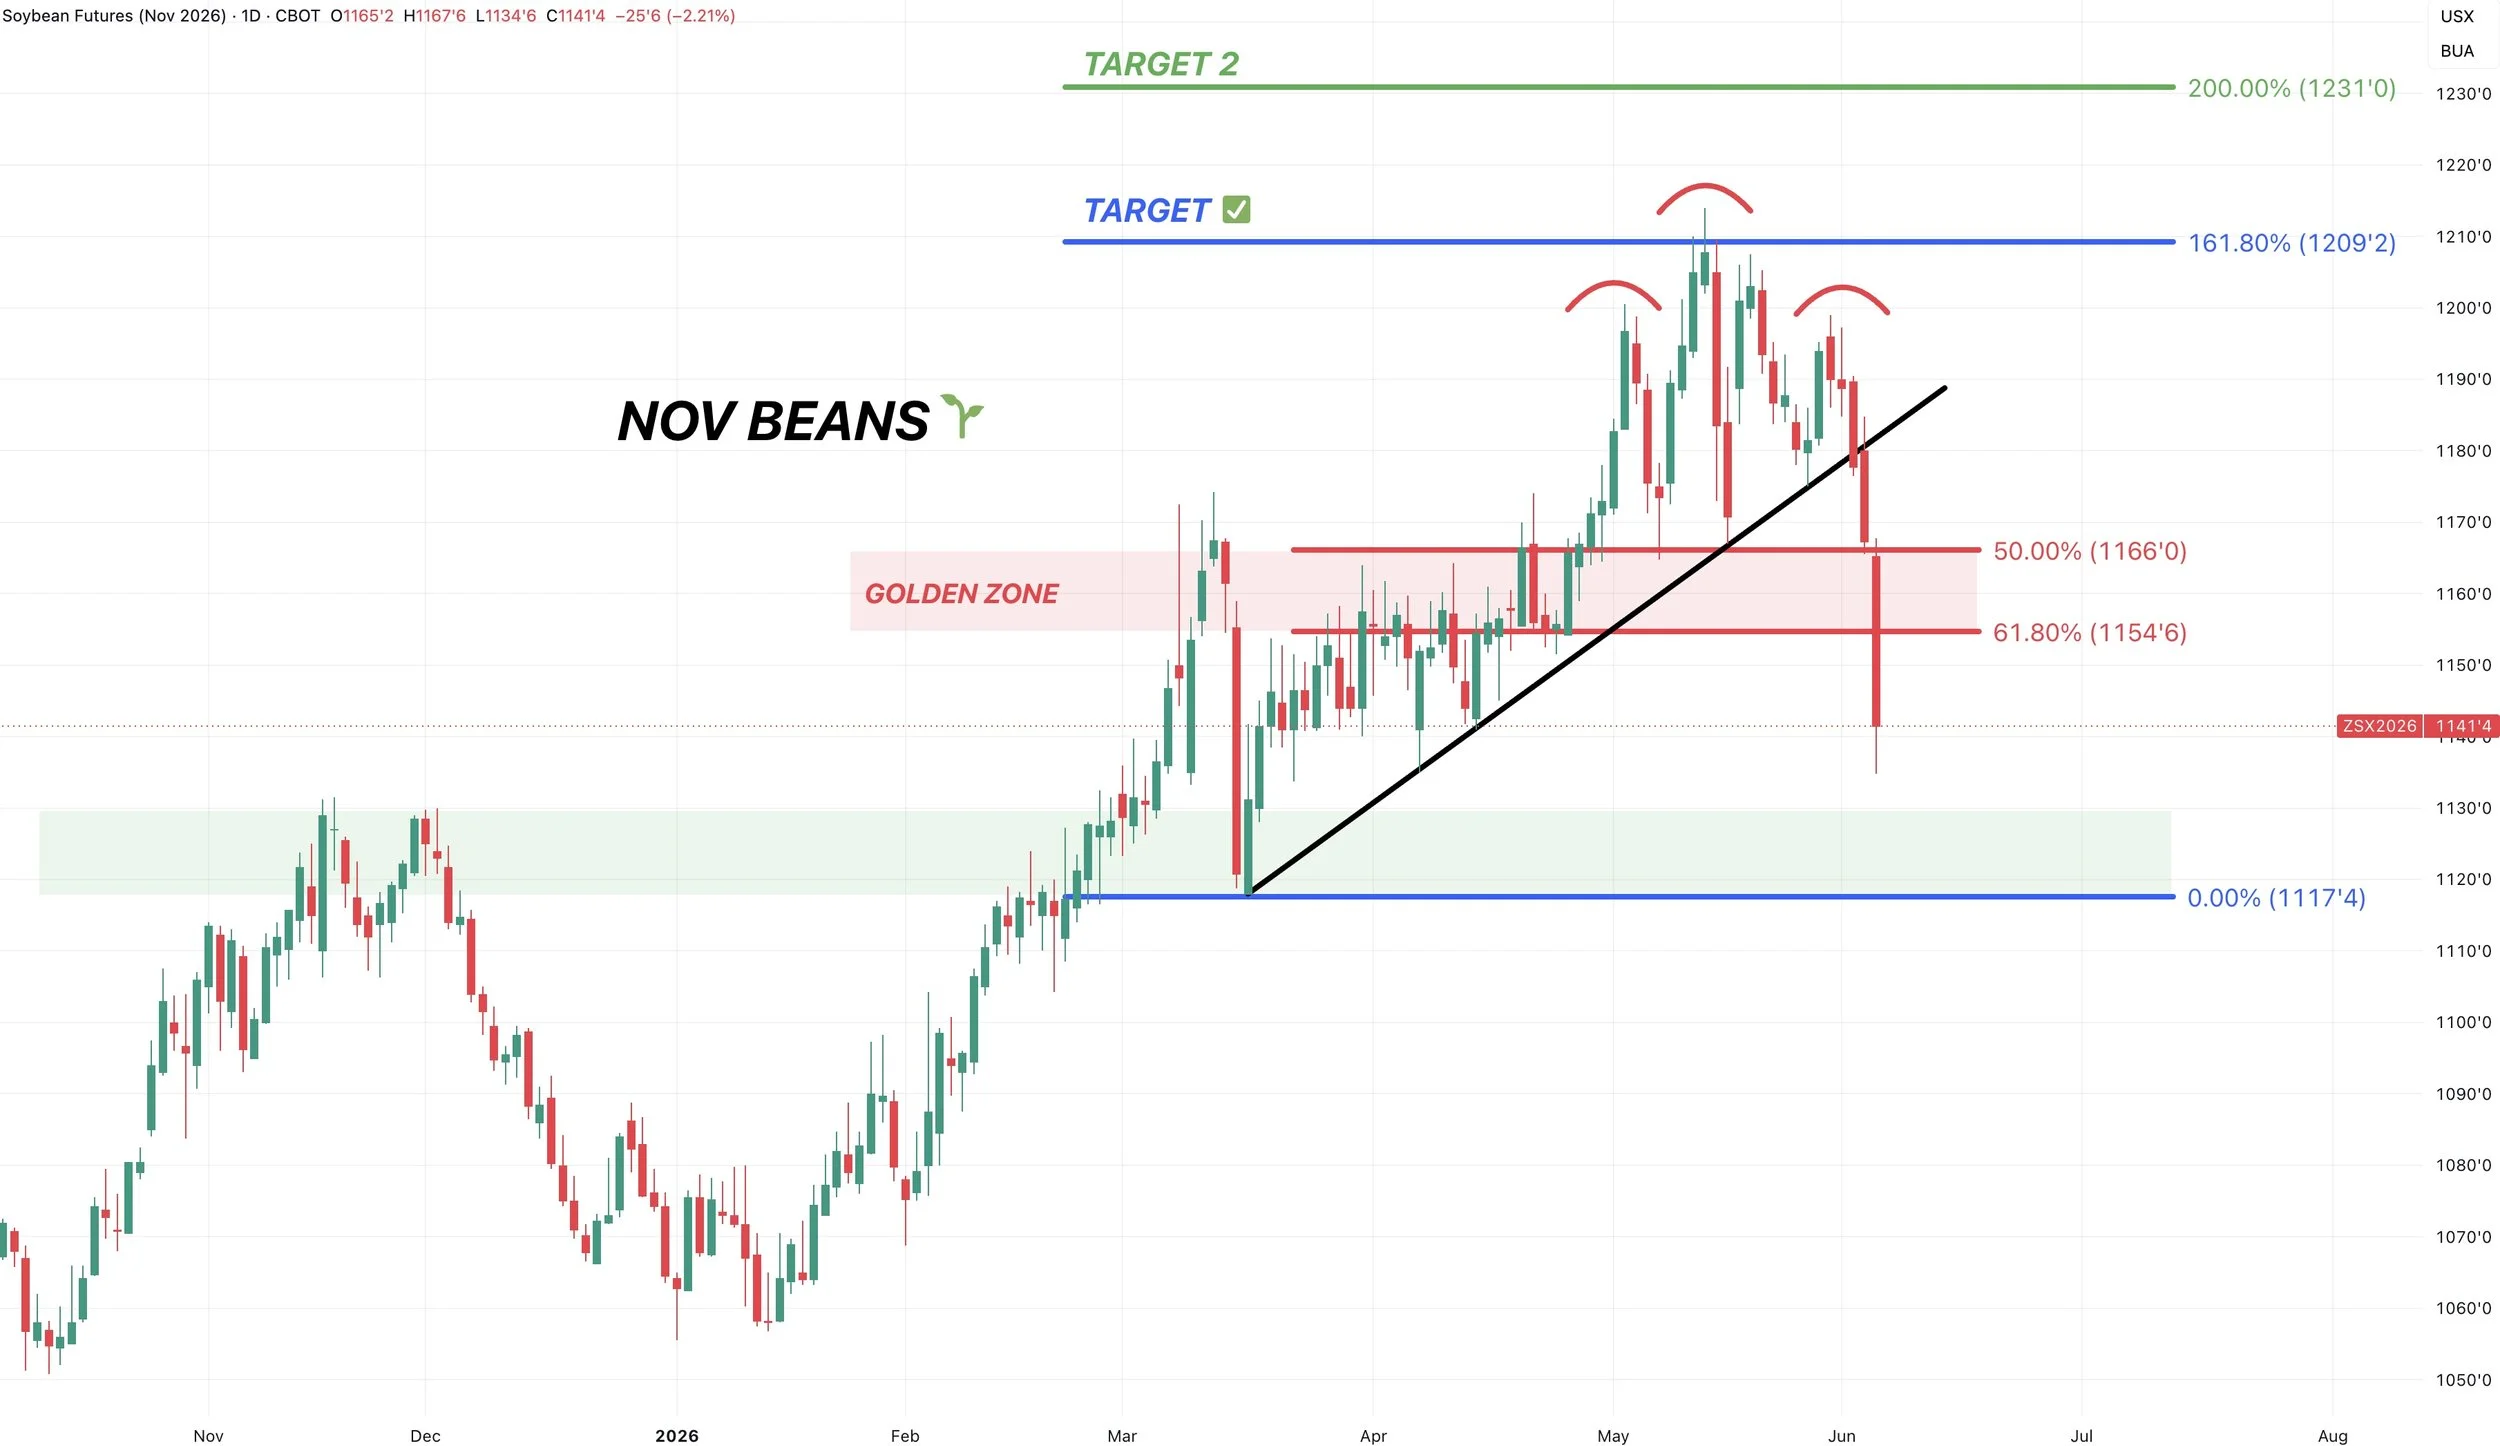
Nov Beans Chart:
Nov beans finally broke their uptrend, which sparked further downside.
We actually now failed some key support on this chart as well.
We broke below the 61.8% retracement from the highs down to the March lows.
This tell us that this is no longer a standard correction, it could be something larger.
Next support comes in at those March lows, which is also the highs from last November.
Wheat
Nothing to really update on wheat today.
Short term, this is the time of year wheat tends struggles as we head into harvest.
We priced in the drought, globally there are no major weather threats for now.
The fertilizer argument I made in corn goes hand in hand with wheat.
I still think wheat has potential when taking a long term approach over the next year or so.
If we look at the seasonal pattern, we are currently following it exactly so far.
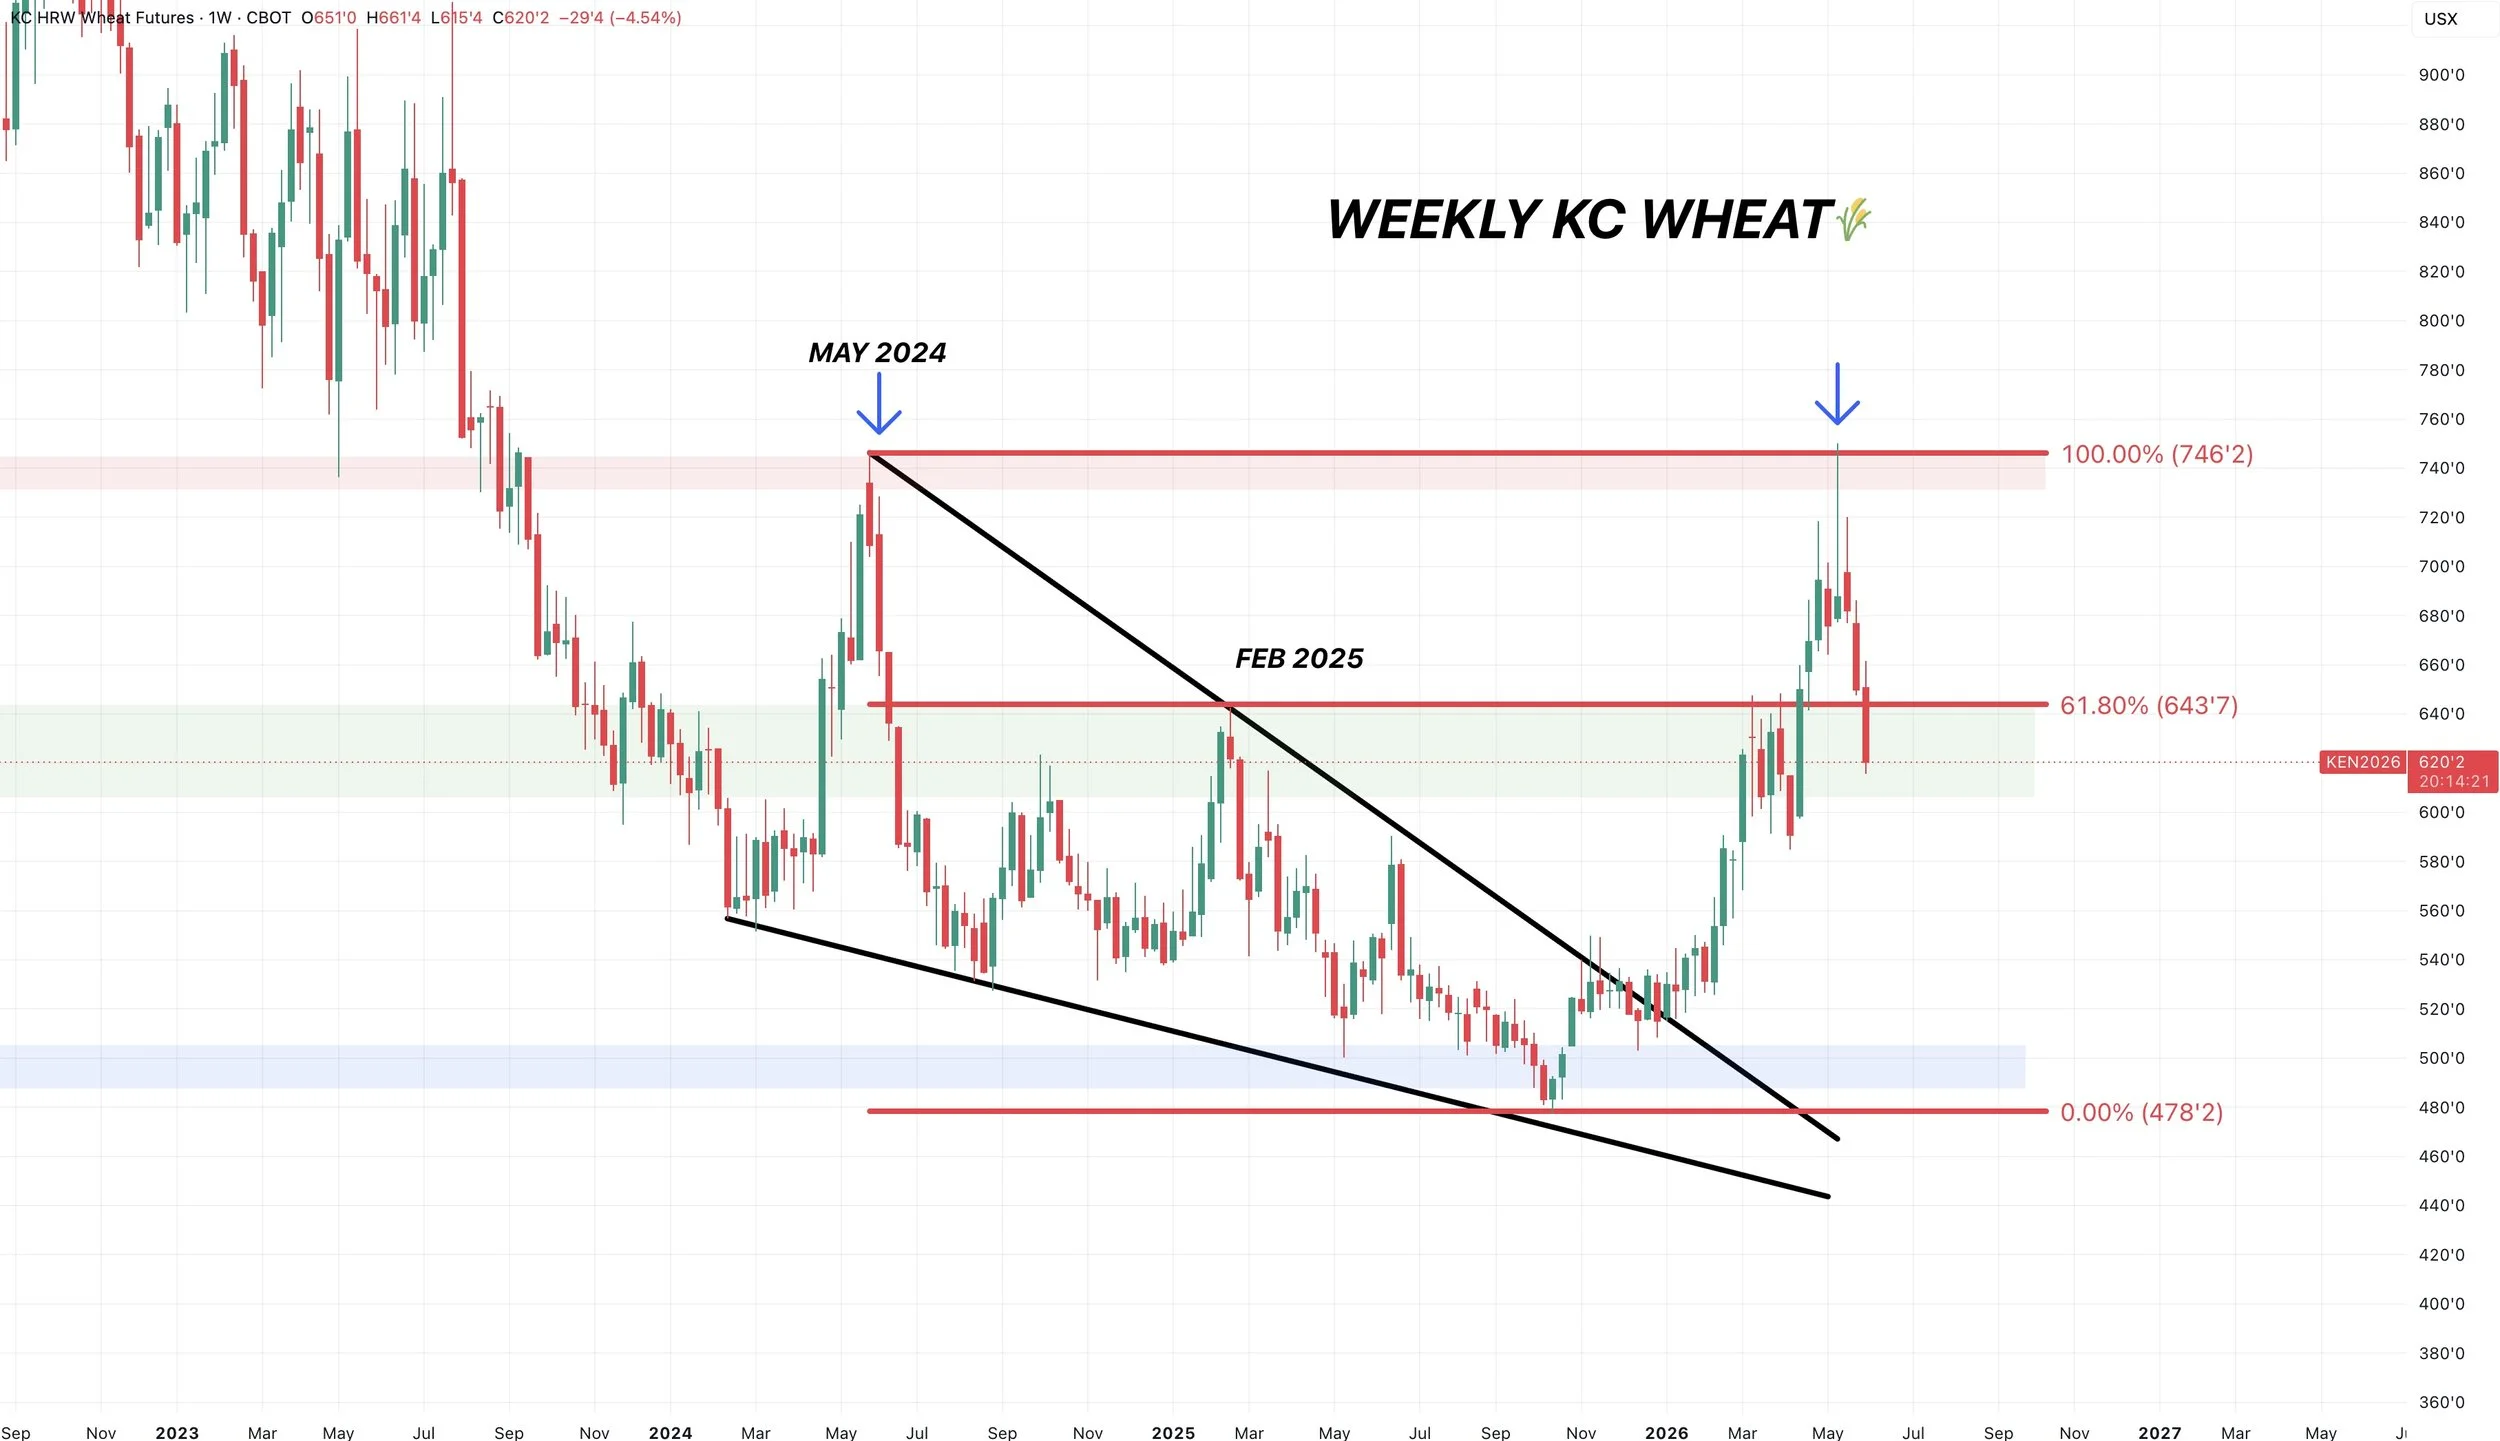
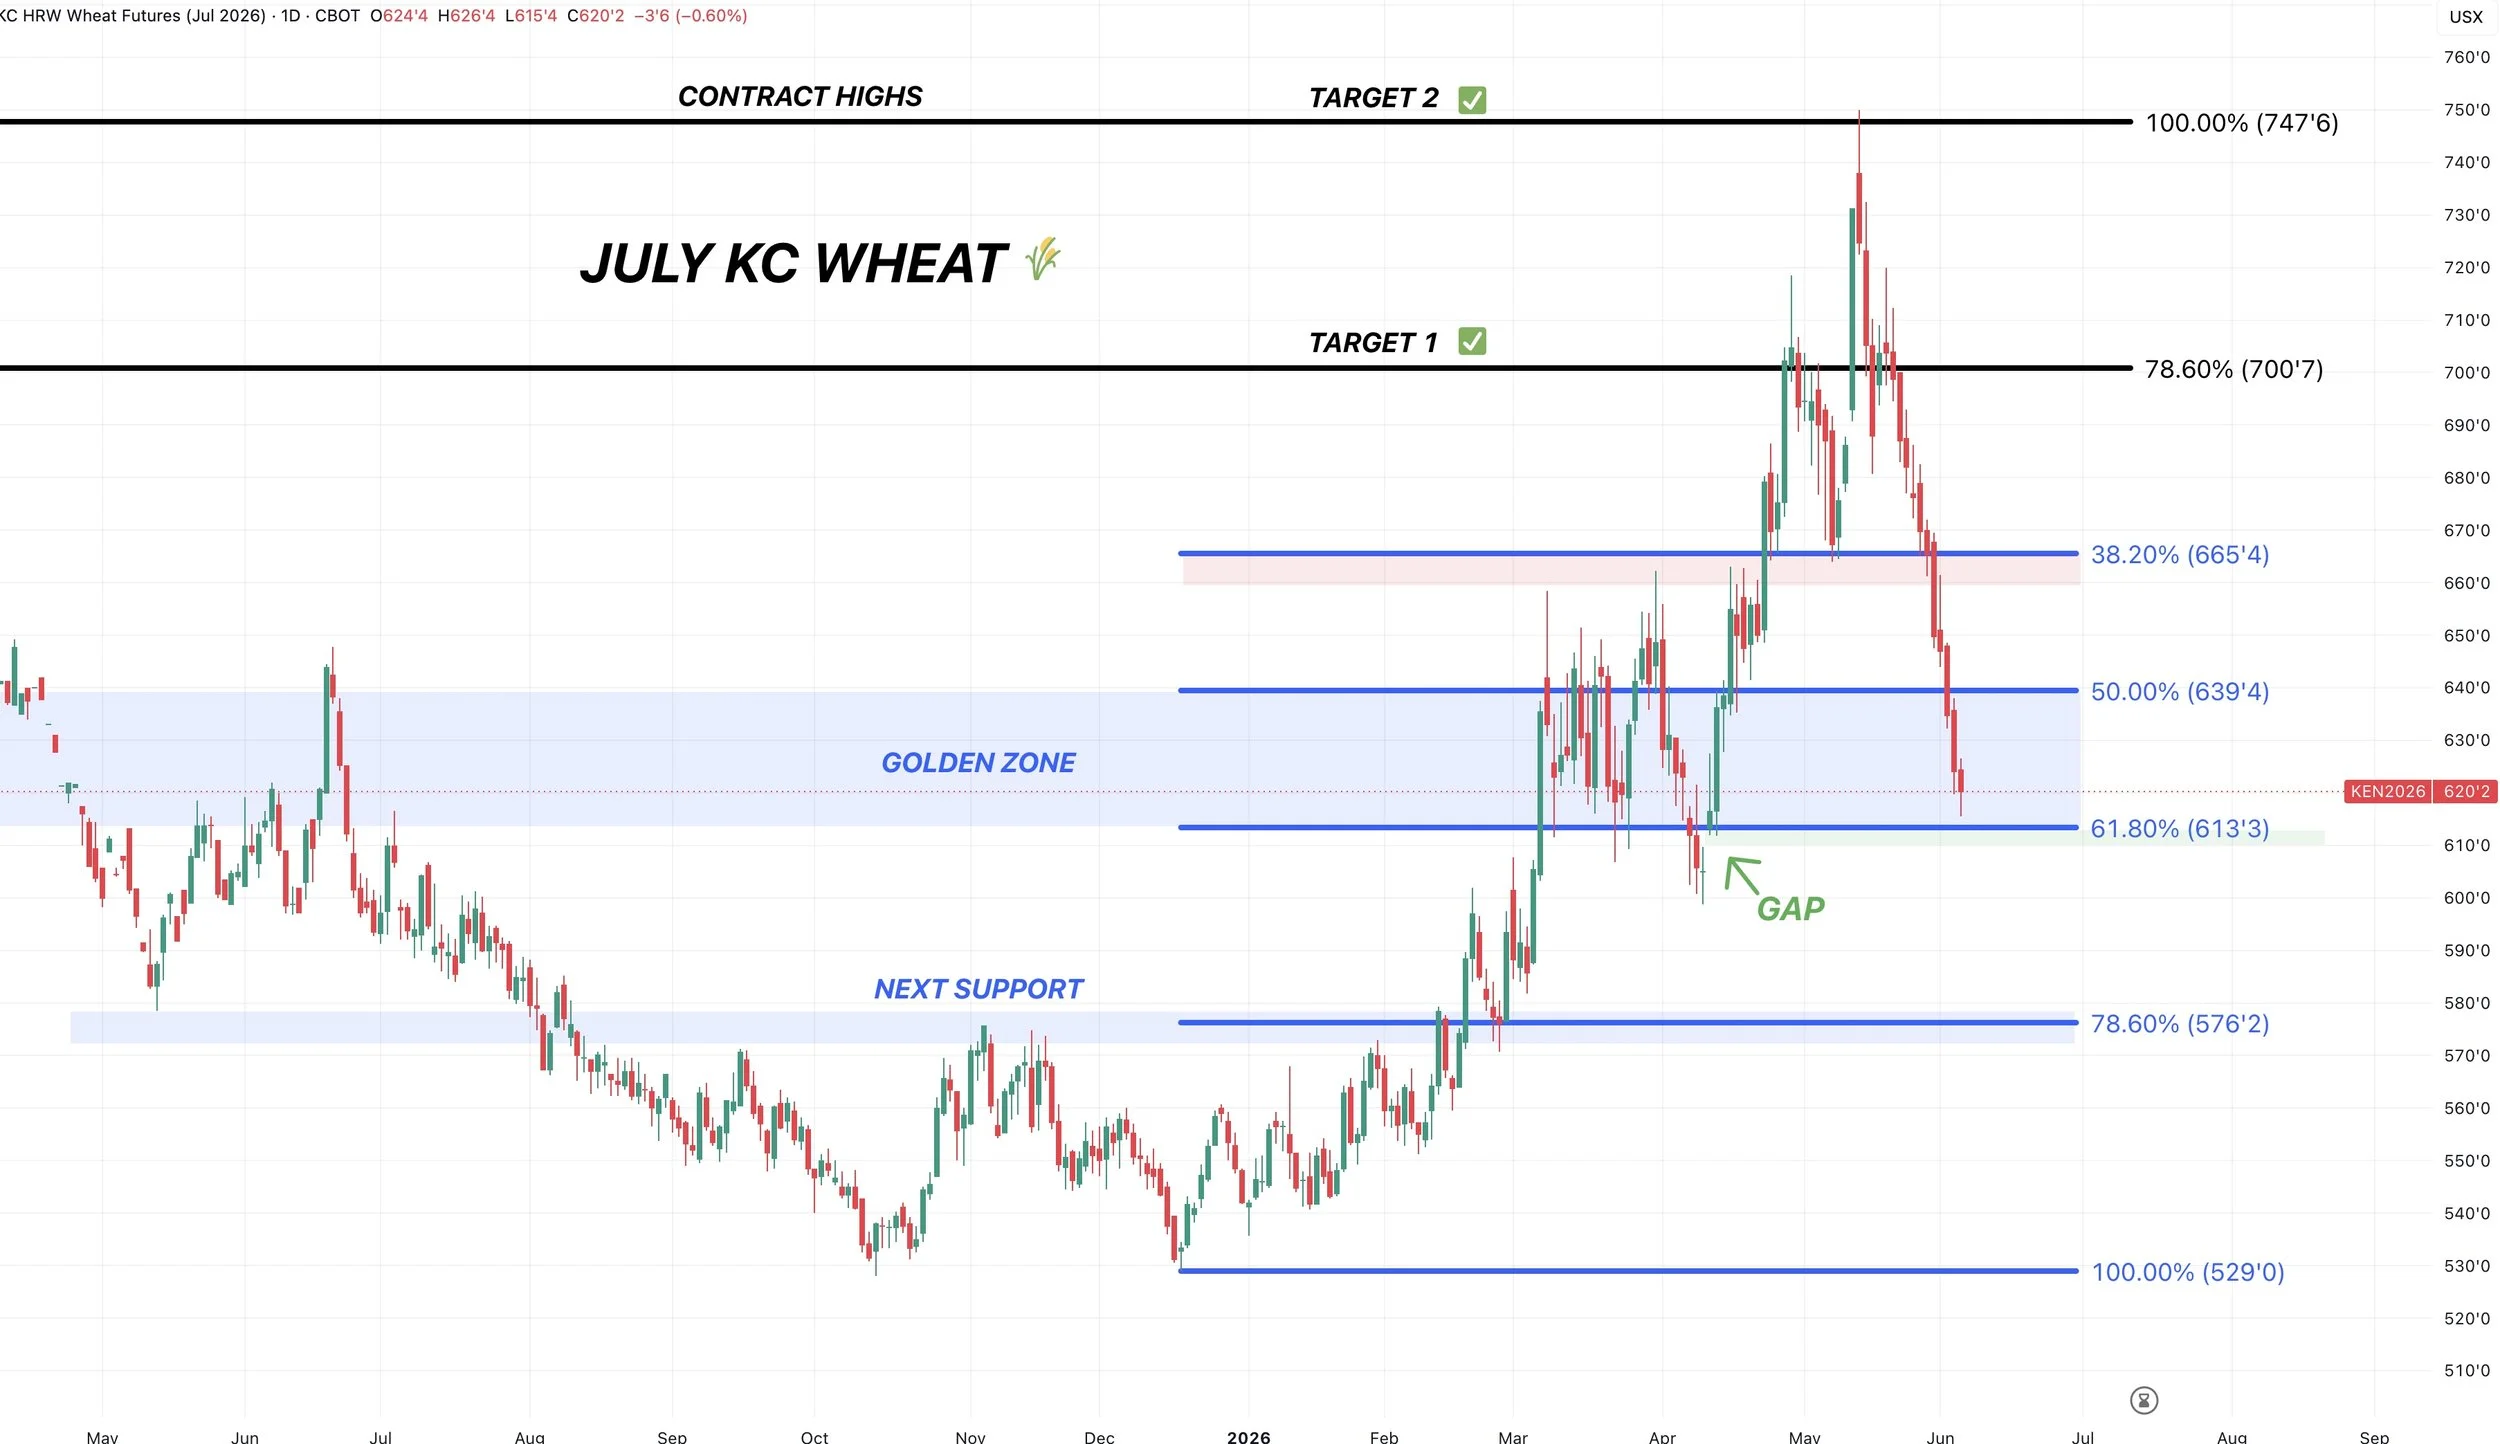
July KC Chart:
We are sitting right at the 61.8% retracement from contract highs to contract lows. (Most common level).
There is also an open gap that sits right there as well.
If wheat is going to get a bounce, this would be the level we'd expect it to happen.
If we cannot bounce here, we simply open the door lower into that old range.
Which could result in us dropping down into that $5.75 range next.
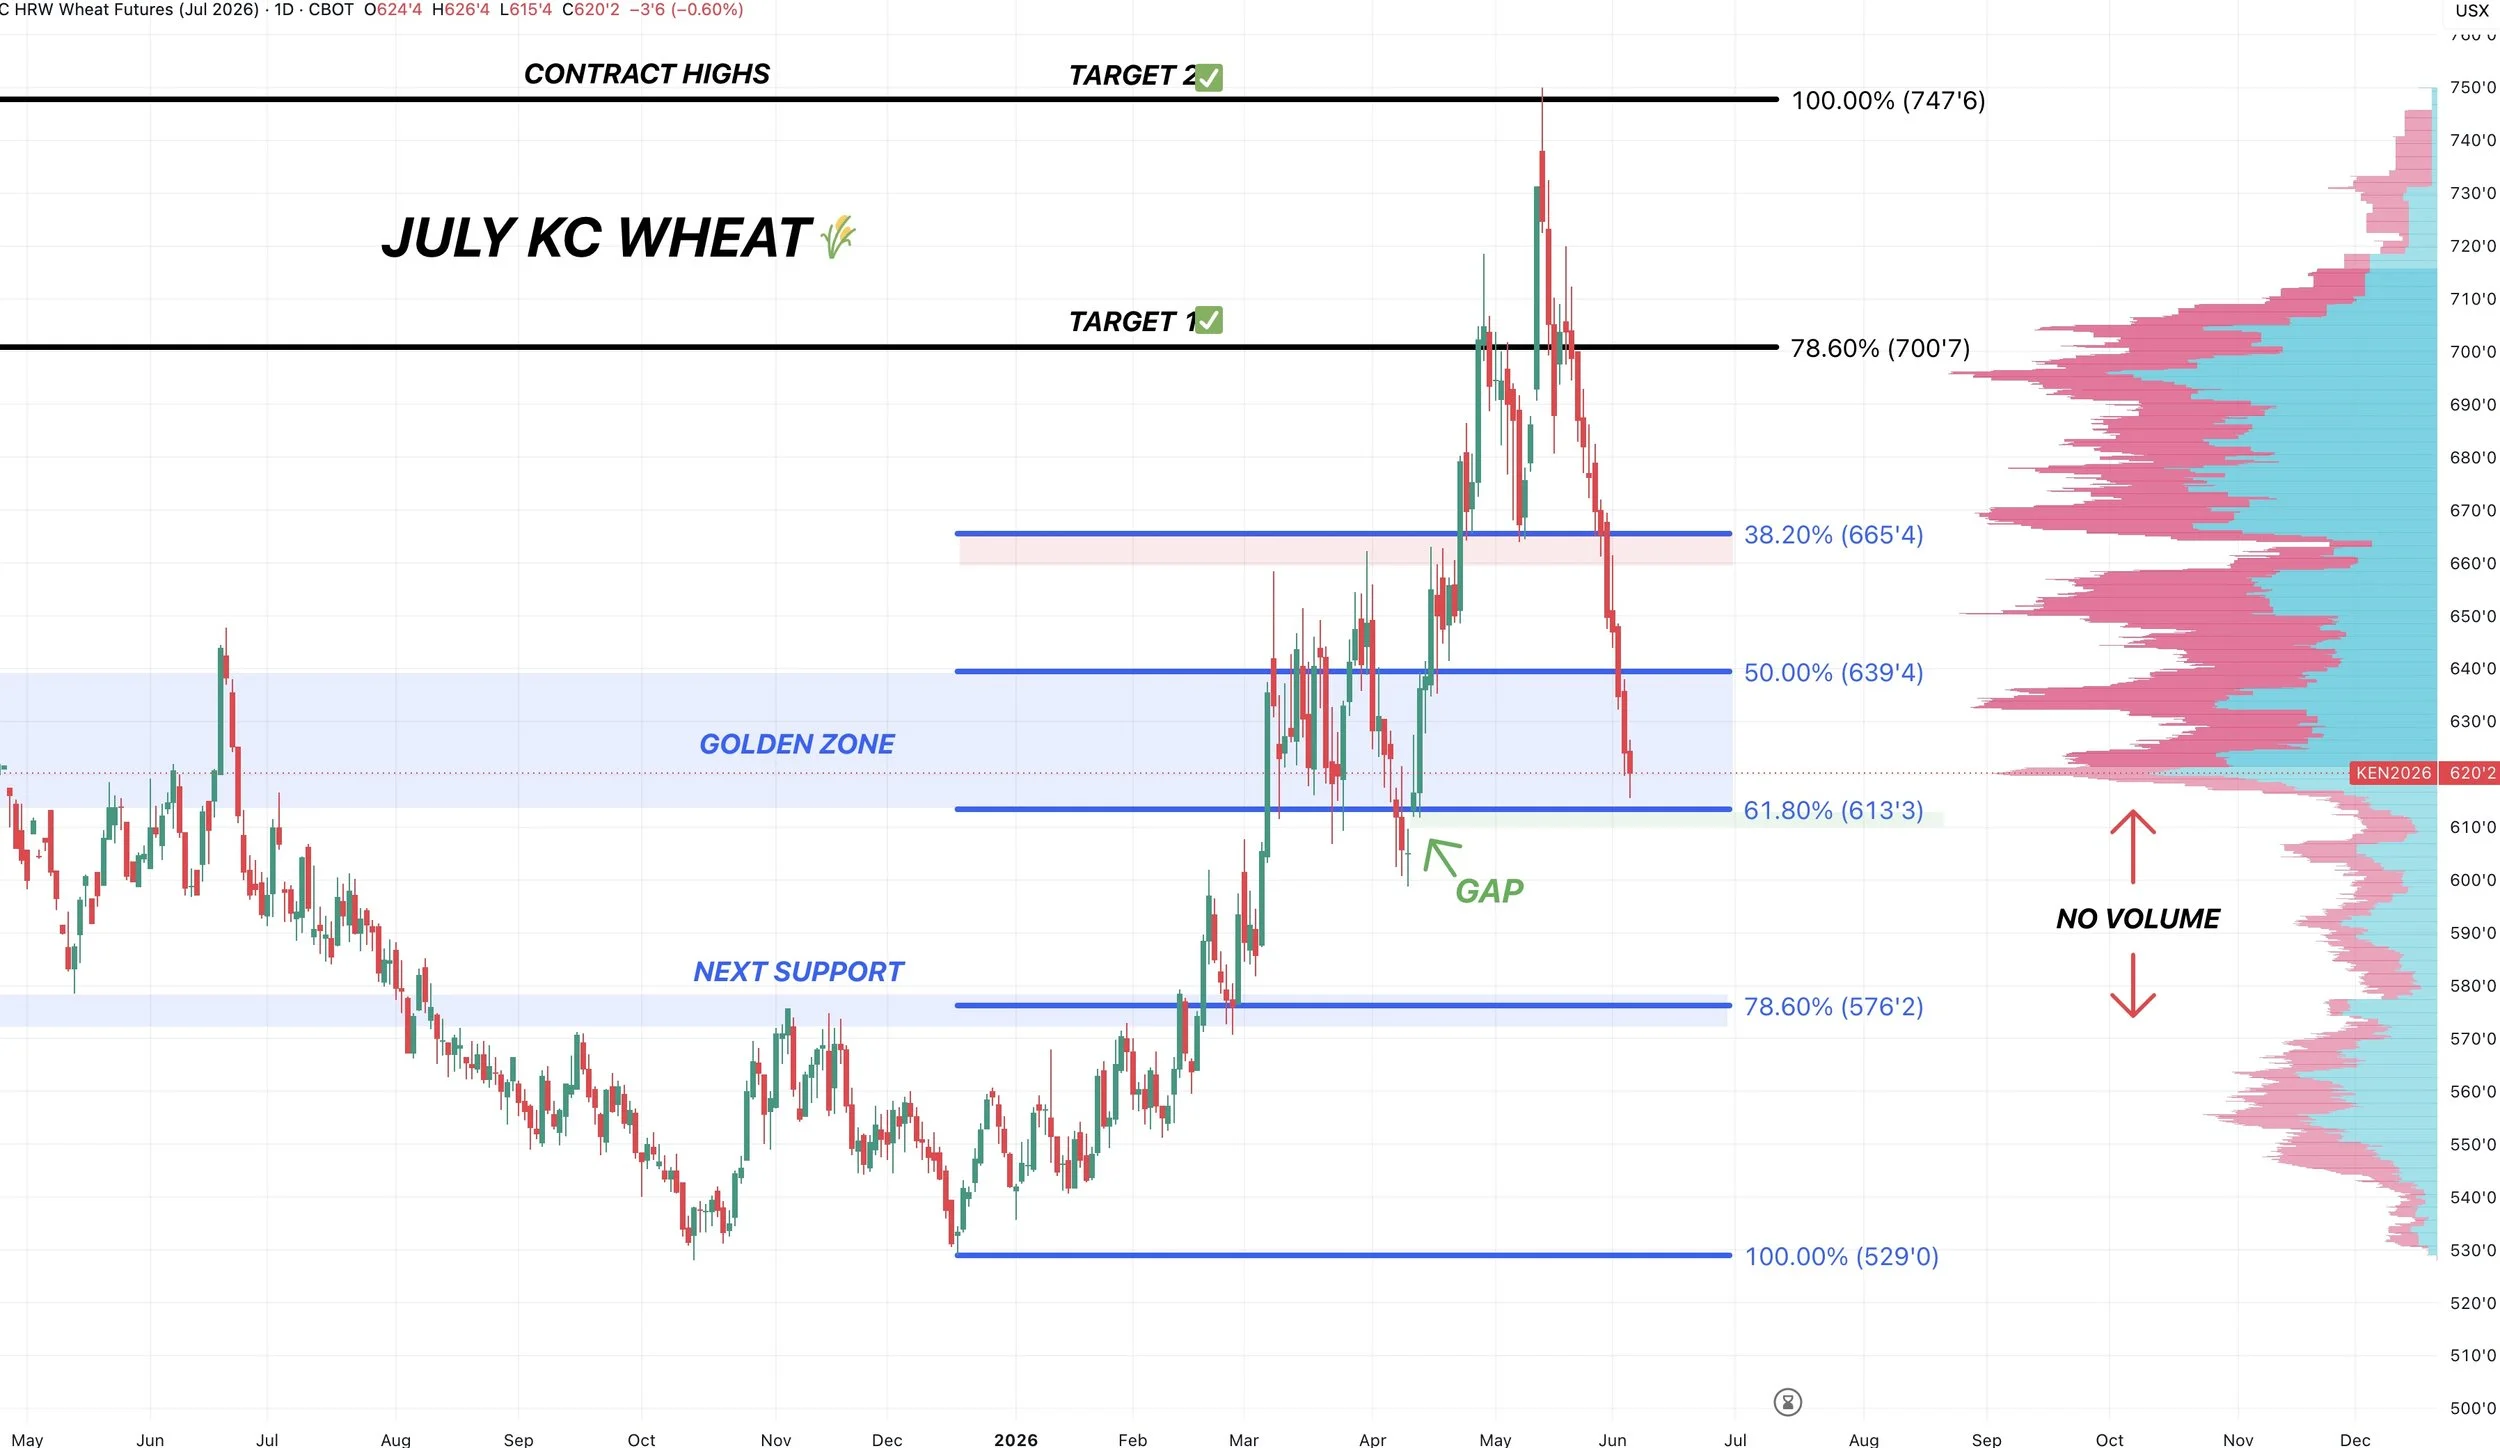
Here is the volume profile.
There is no volume beneath this level until you get into that $5.75 range.
So bulls want to hold this level to prevent another trip lower.
As when support breaks, it can open flood gates. Which is what we just saw in corn when it broke $4.50
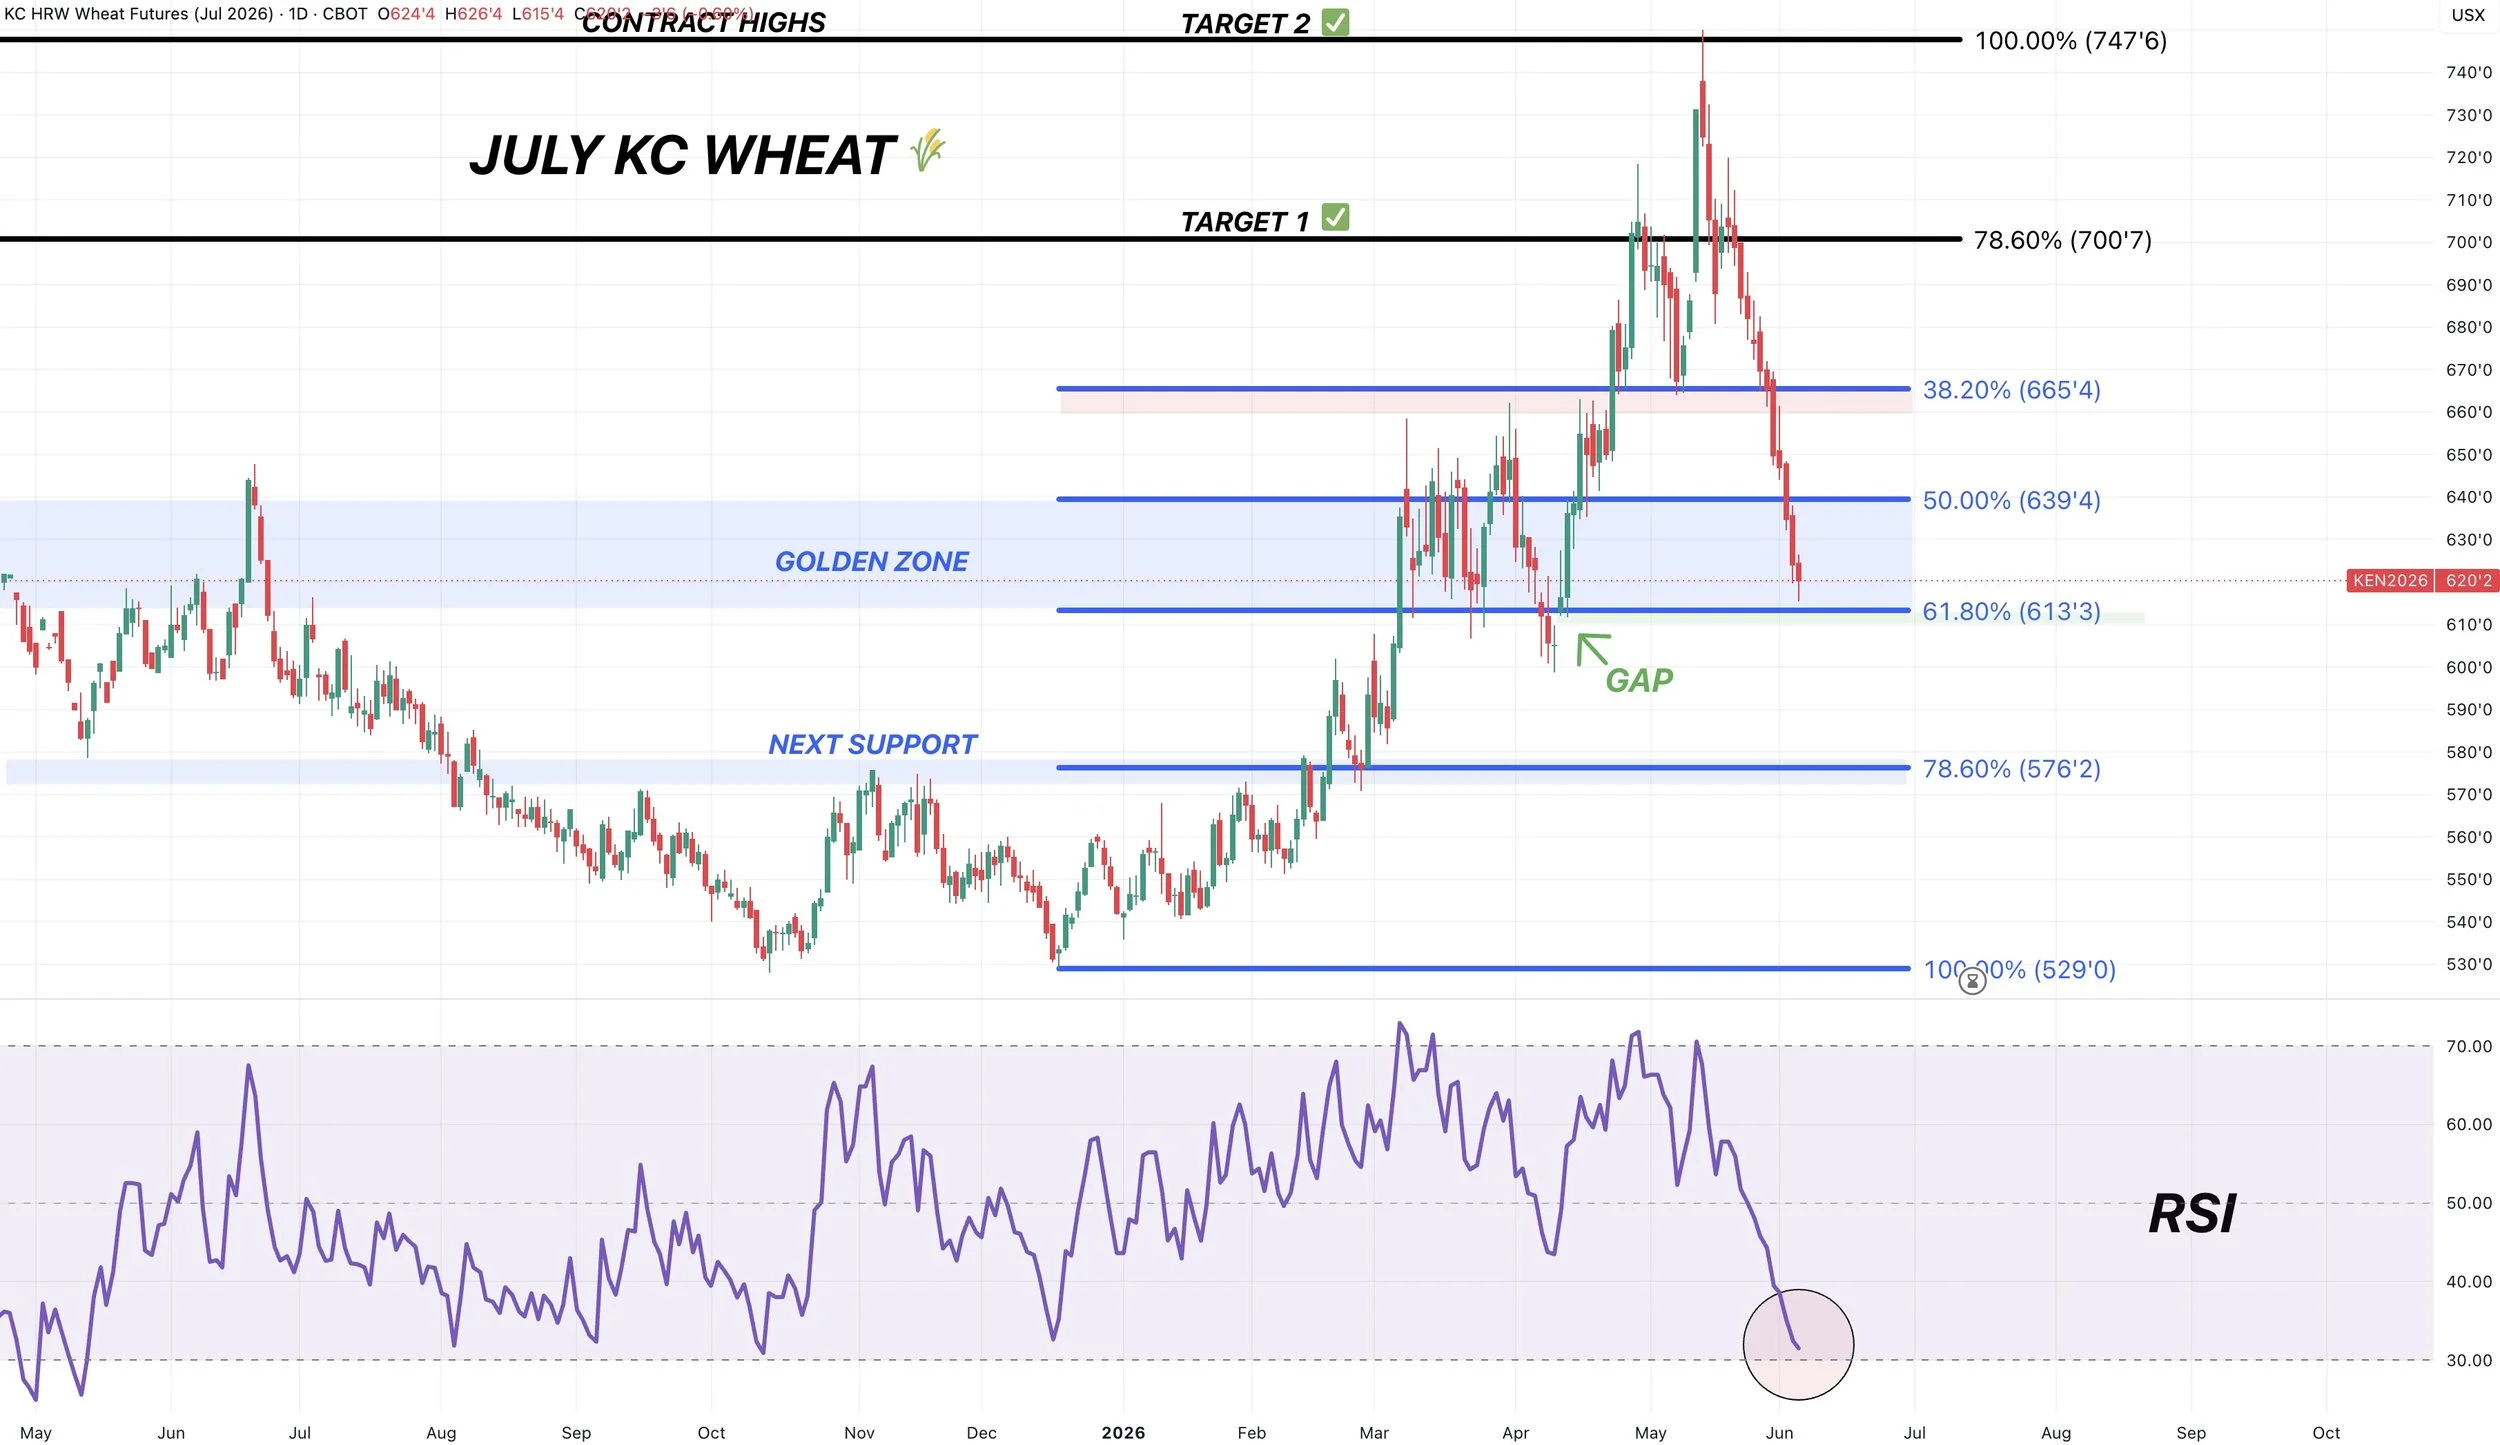
We are getting extremely oversold.
So you'd like to think we get a bounce soon.
And it would make sense for it to happen at this level of support.
Cattle
It was officially announced that screwworm was in the US.
Yet cattle traded limit up?
How does that happen?
If you had told anyone cattle would be limit up on this news, you wouldn’t have believed them.
Maybe it was partially a sell the rumor by the fact?
One argument is that screwworm could cause more deaths. Thus, we would see lower supply. Which would be a bullish factor long term.
On the other side of the argument, you could say it might hurt demand. As consumers seeing these headlines might lead to less beef consumption.
Along with putting restrictions on how you transport cattle. So it's hard to say which argument the market is going to run away with.
It might just be how the news is going to be perceived by the audience and how the media tells the story.
Screwworm isn’t going to be increasing supply, the risk is if the media freaks everyone out.
Basically, it's all about how the people react to it. As you can make arguments for screwworm being bearish or bullish, although the timetable of the impacts from both arguments is different.
People think that their food is bad so they don’t eat beef, that hurts demand.
It leads to deaths, which lowers supply.
Screwworm enters the US, they realize it's not a major problem. They open the border.
There are so many different ways the situation could play out.
It was just one case, so we will have to see how it unfolds.
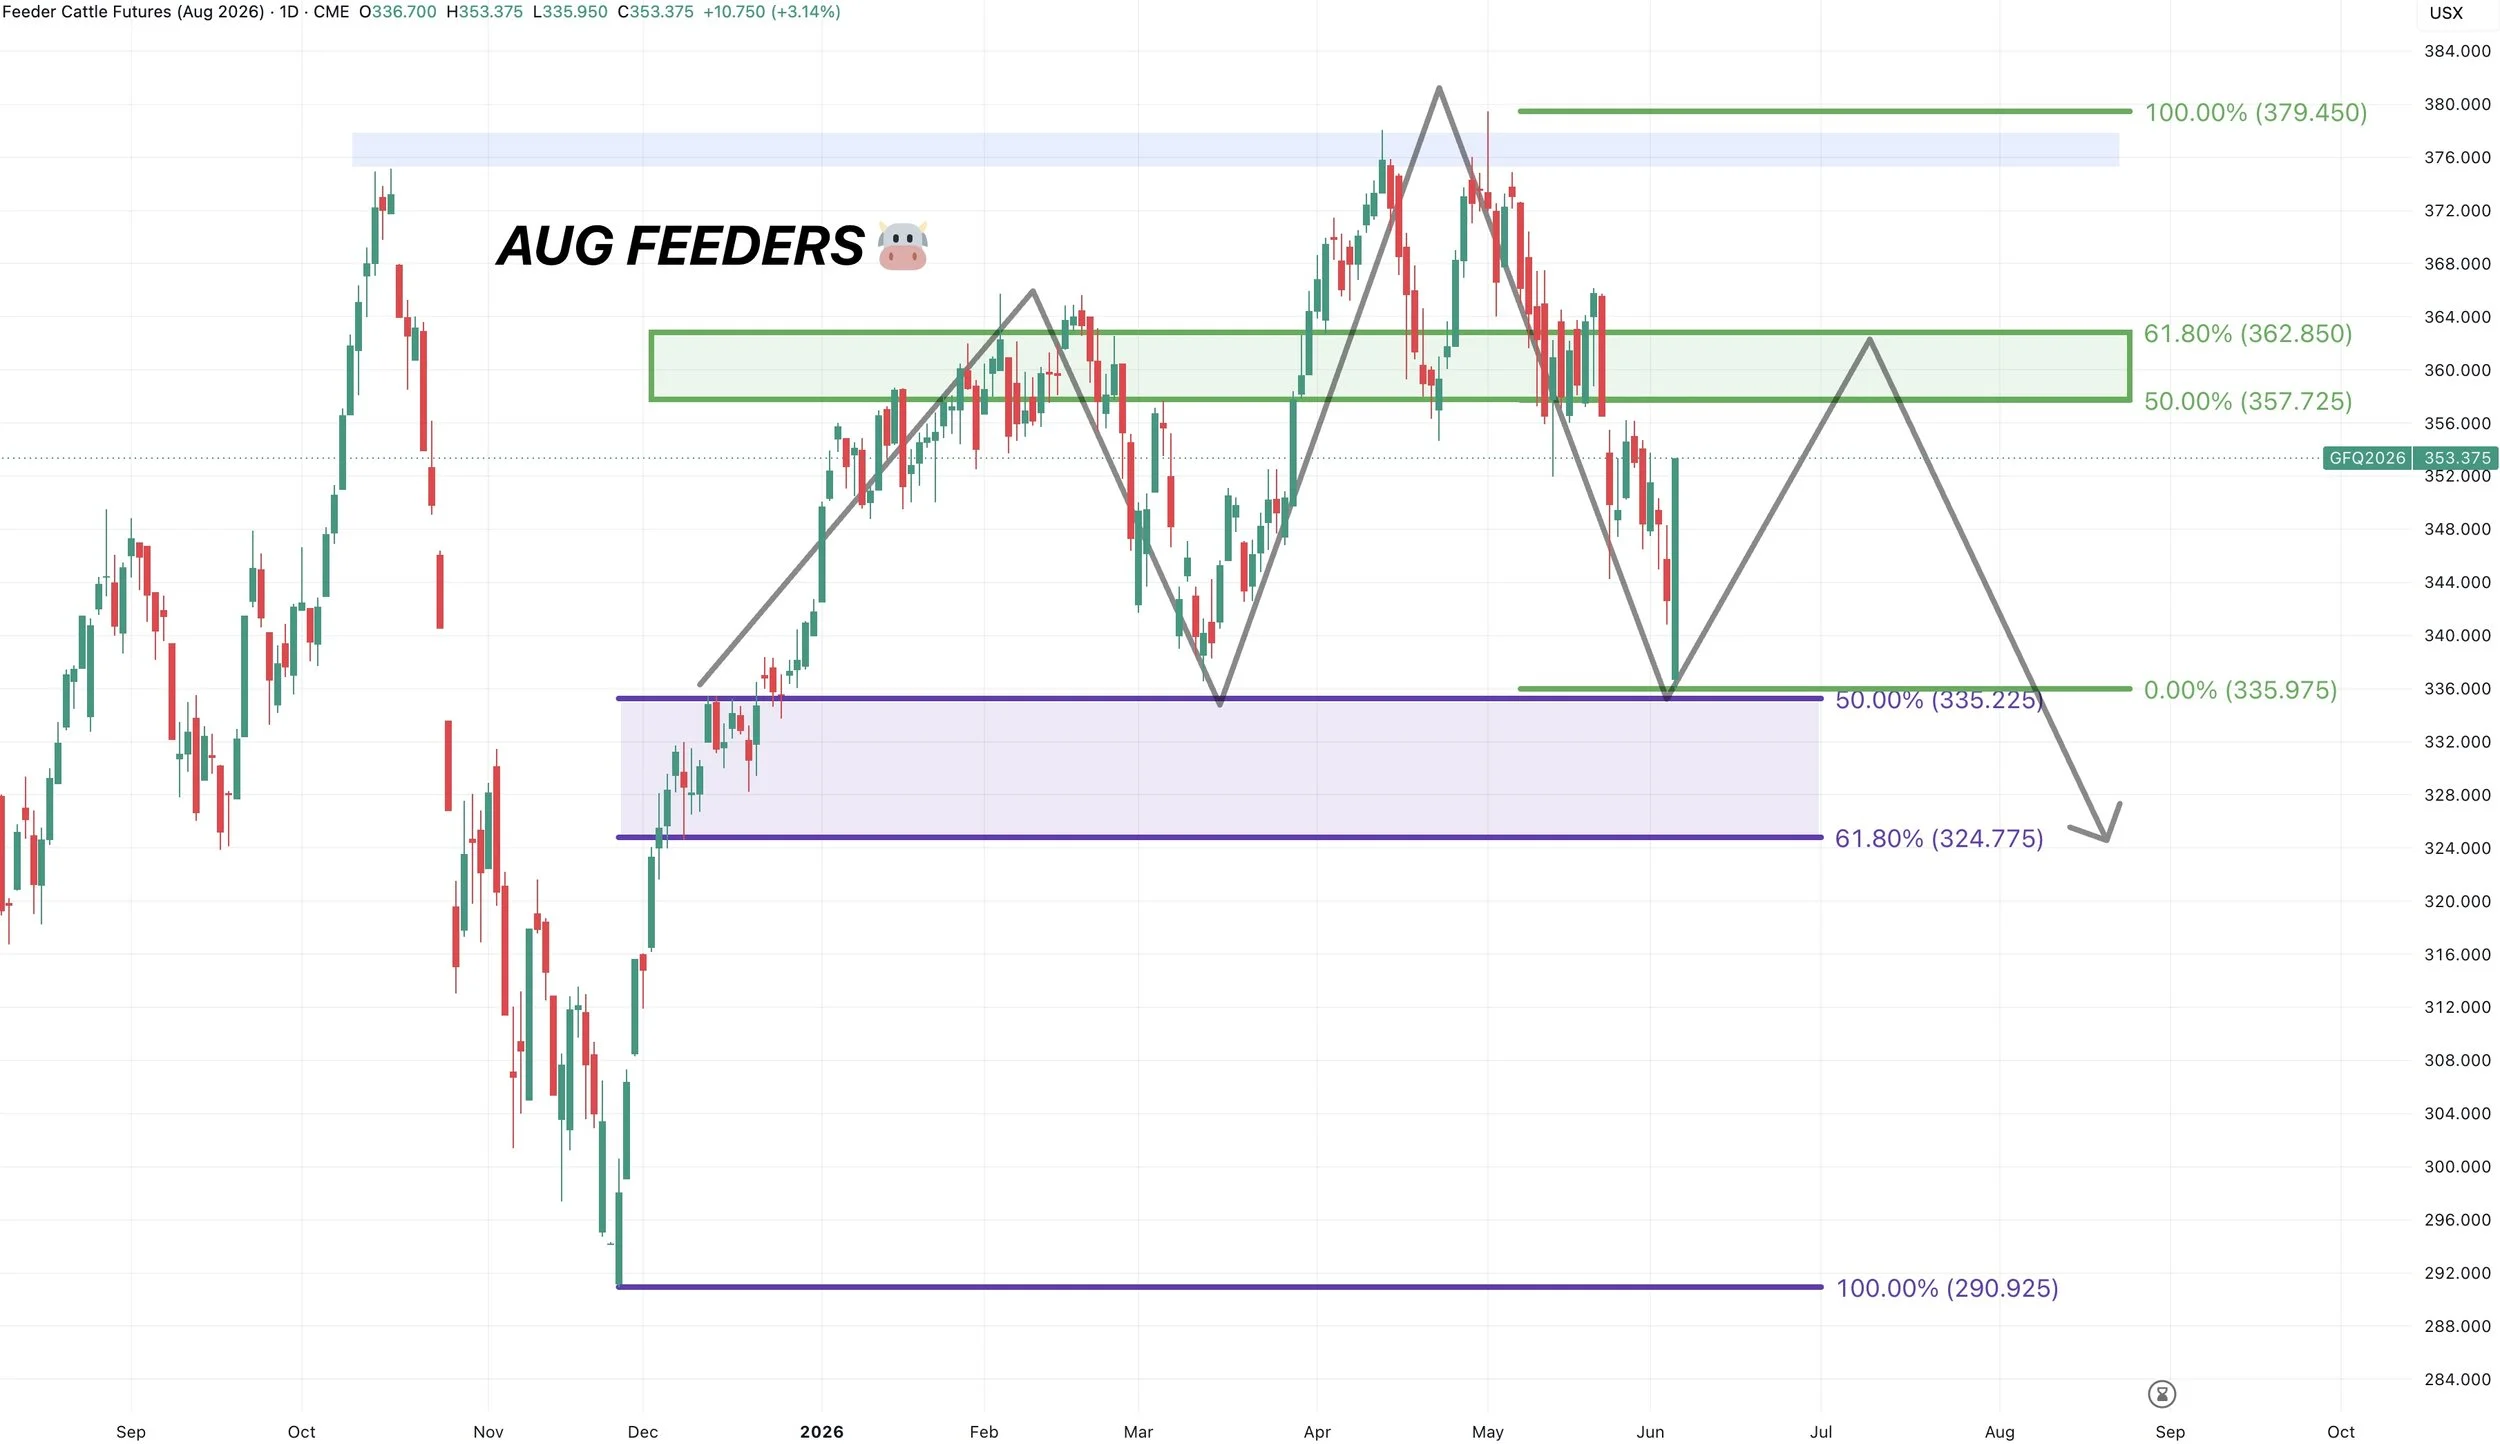
Aug Feeders Chart:
We broke back above the yearly open on the headlines.
We tested that 50% retracment of the entire rally perfectly.
Here is something I'm watching now.
We could possibly be setting up for a text book head and shoulders pattern.
That right shoulder would also line up with the golden zone retracements. Meaning we would claw back 50% to 61.8% of the sell off. The most common level for a bounce.
I'd look to protect if we get up there.
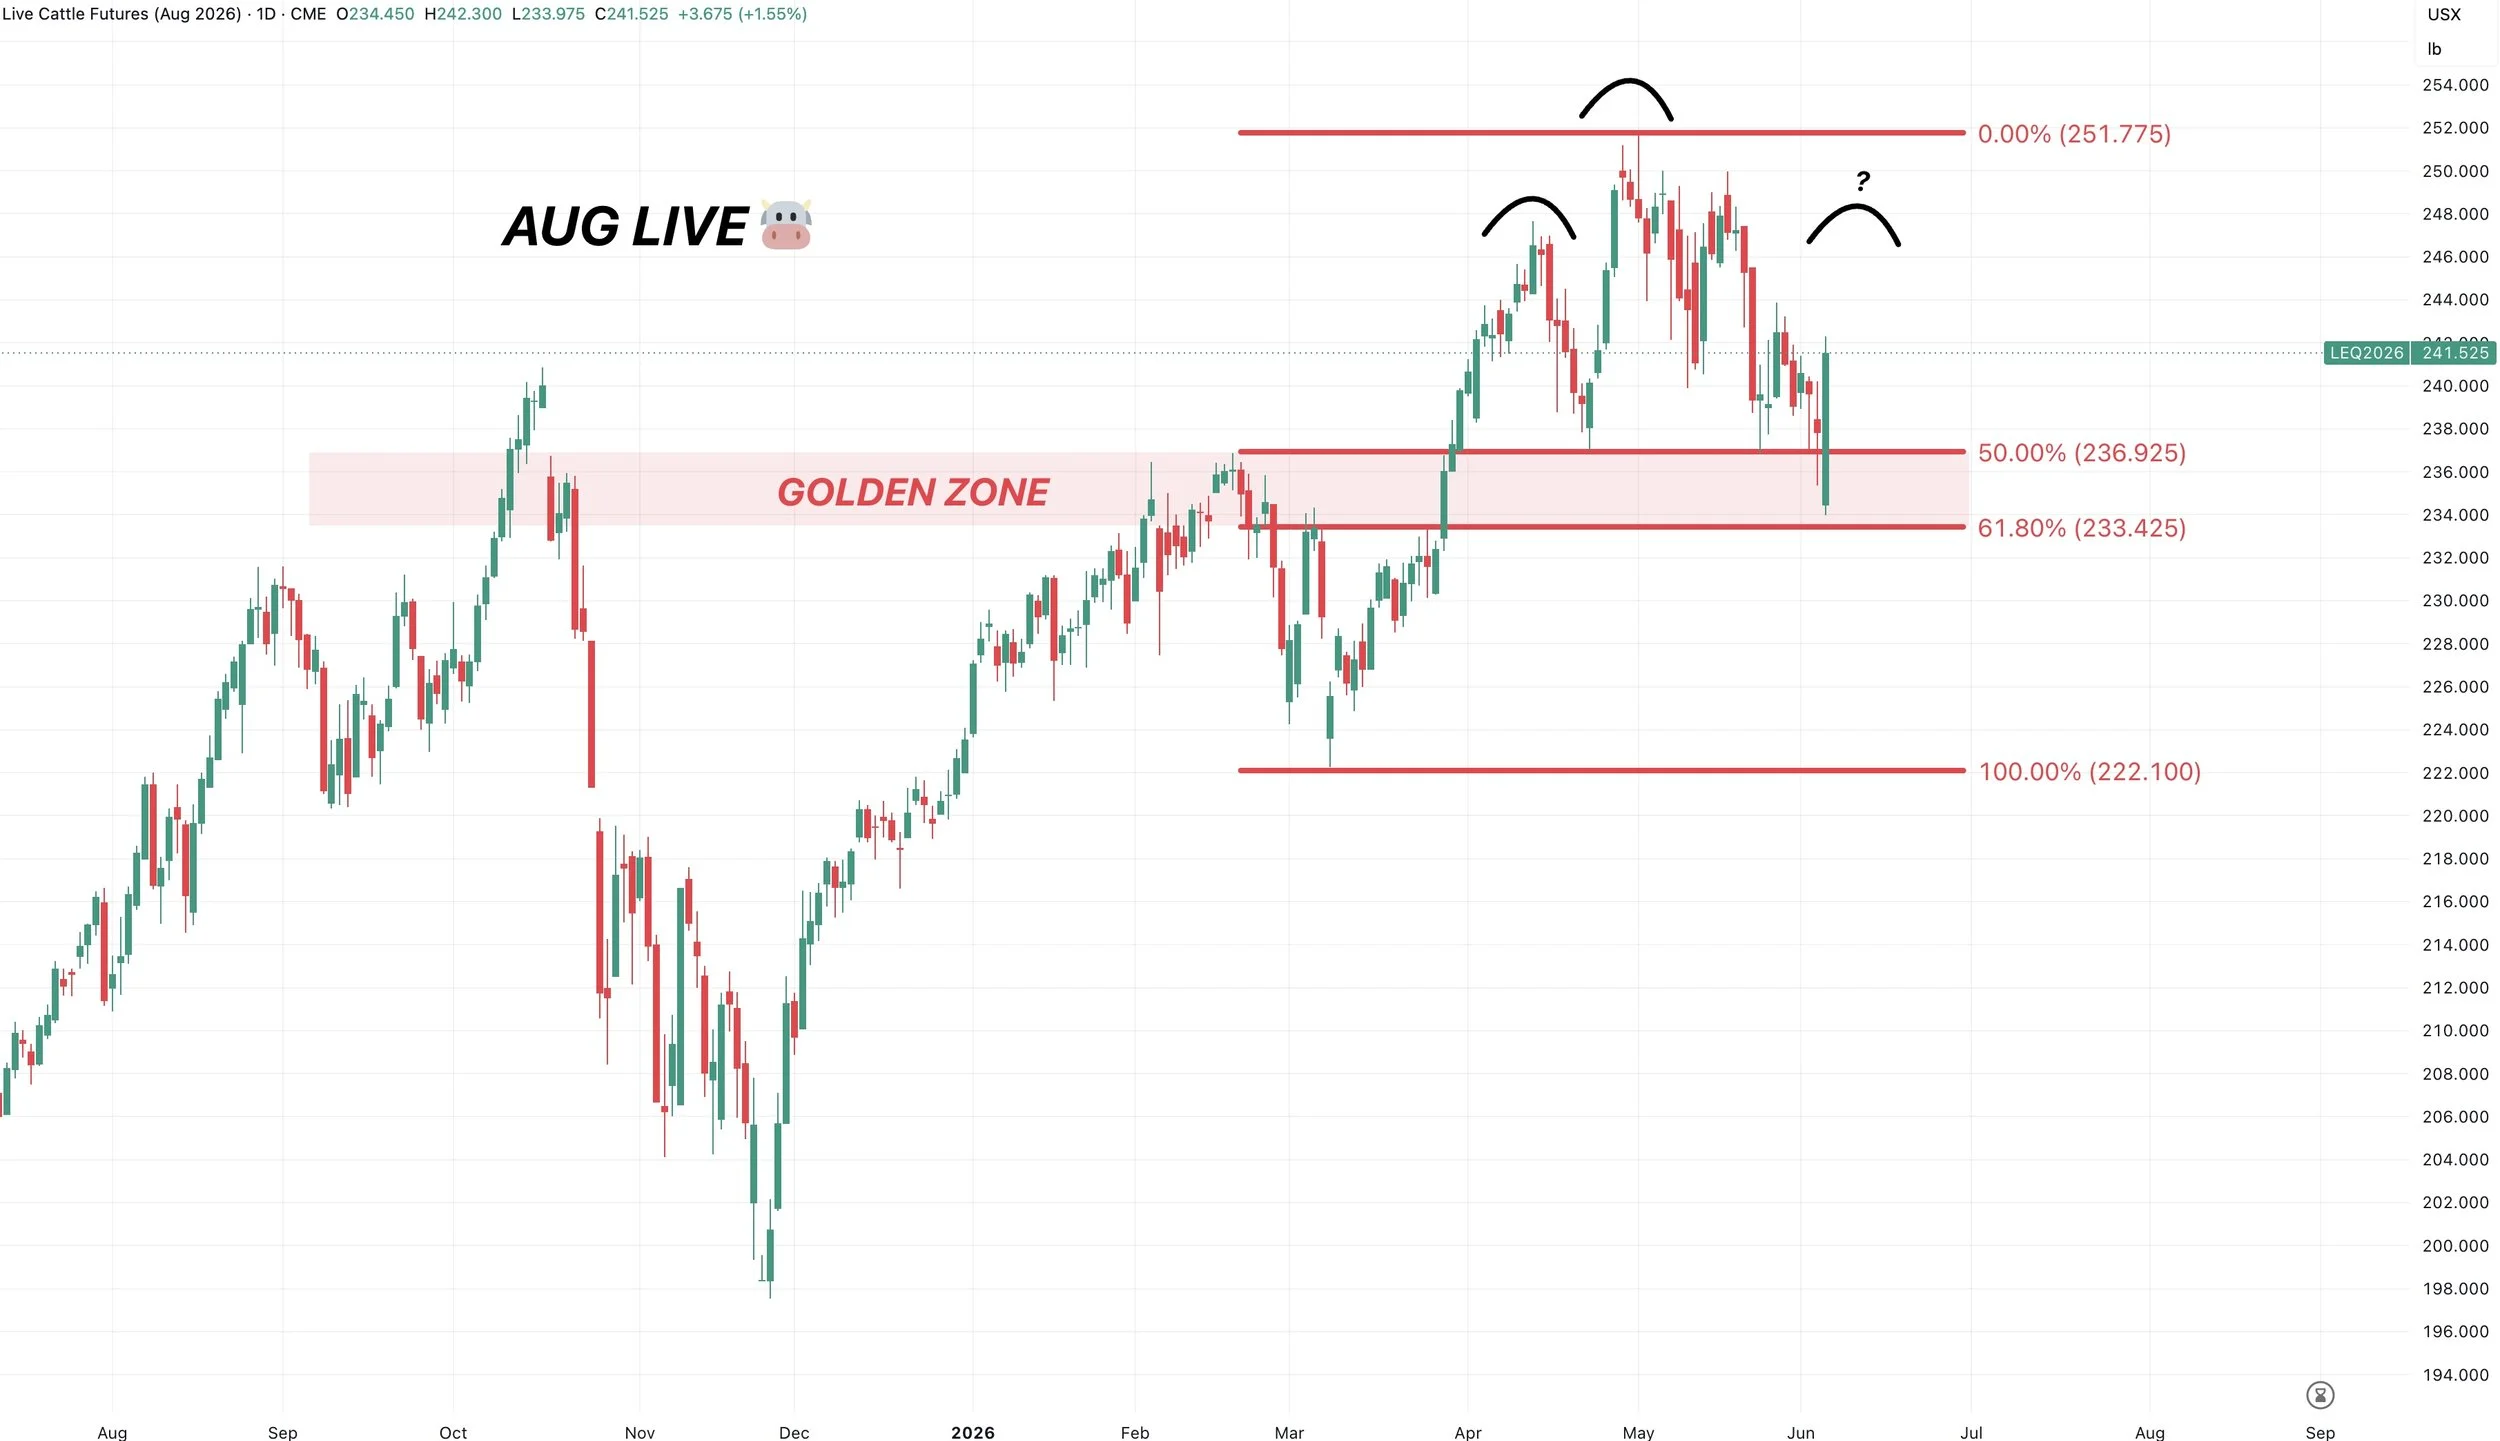
August Live Chart:
Live cattle held that golden zone perfectly.
The trend remains higher unless we break below that level.
But am also being cautious of a possible head and shoulders set up.
Want to Talk?
Our phones are open 24/7 for you guys if you ever need anything or want to discuss your operation.
Jeremey & Office: (806)484-1214
Sebastian: (605)280-1186
Email: sfrost@dailymarketminute.com
Hedge Account
Interested in a hedge account? Use the link below to set up an account or give us a call.
Recent Signals
May 27th, 2026: 🌽
Corn conditional buy signal.
CLICK HERE TO VIEW
May 13th, 2026: 🌱
Soybean sell signal & hedge alert.
CLICK HERE TO VIEW
April 28th, 2026: 🌾
KC wheat specific signal.
CLICK HERE TO VIEW
April 27th, 2026: 🌽
Corn catch up sell signal.
CLICK HERE TO VIEW
April 10th, 2026: 🌽
Corn buy signal.
CLICK HERE TO VIEW
March 19th, 2026: 🌱
New crop soybeans signal & hedge alert.
CLICK HERE TO VIEW
March 9th, 2026: 🌱
Soybeans signal & hedge alert. Sent via text.
CLICK HERE TO VIEW
March 6th, 2026: 🌽 🌾
Corn & wheat sell signal & hedge alert.
CLICK HERE TO VIEW
March 3rd, 2026: 🌽
Old crop & new crop corn sell signal & hedge alert.
CLICK HERE TO VIEW
Feb 26th, 2026: 🌱
Old crop & new crop beans sell signal & hedge alert.
CLICK HERE TO VIEW
Feb 19th, 2026: 🌾
KC wheat sell signal & hedge alert.
CLICK HERE TO VIEW
Feb 6th, 2026: 🌽 🌱
Old crop corn & soybean sell signal & hedge alert.
CLICK HERE TO VIEW
Feb 4th, 2026: 🌱
Soybean sell signal & hedge alert.
CLICK HERE TO VIEW
Nov 17th, 2025: 🌱
Soybean sell signal & hedge alert.