
MAKE OR BREAK FOR CORN
MARKET UPDATE
You can scroll to read the usual update as well. As the written version is the exact same as the video.
Timestamps for video:
Overview: 0:00min
Corn: 1:05min
Beans: 7:30min
Wheat: 10:20min
Cattle: 12:45min
Want to talk?
Office: (806)484-1214
Your free trial has ended
You no longer receive every daily update or signal. Here is extended access to this weekends Memorial Day sale if you’d like to keep full acess
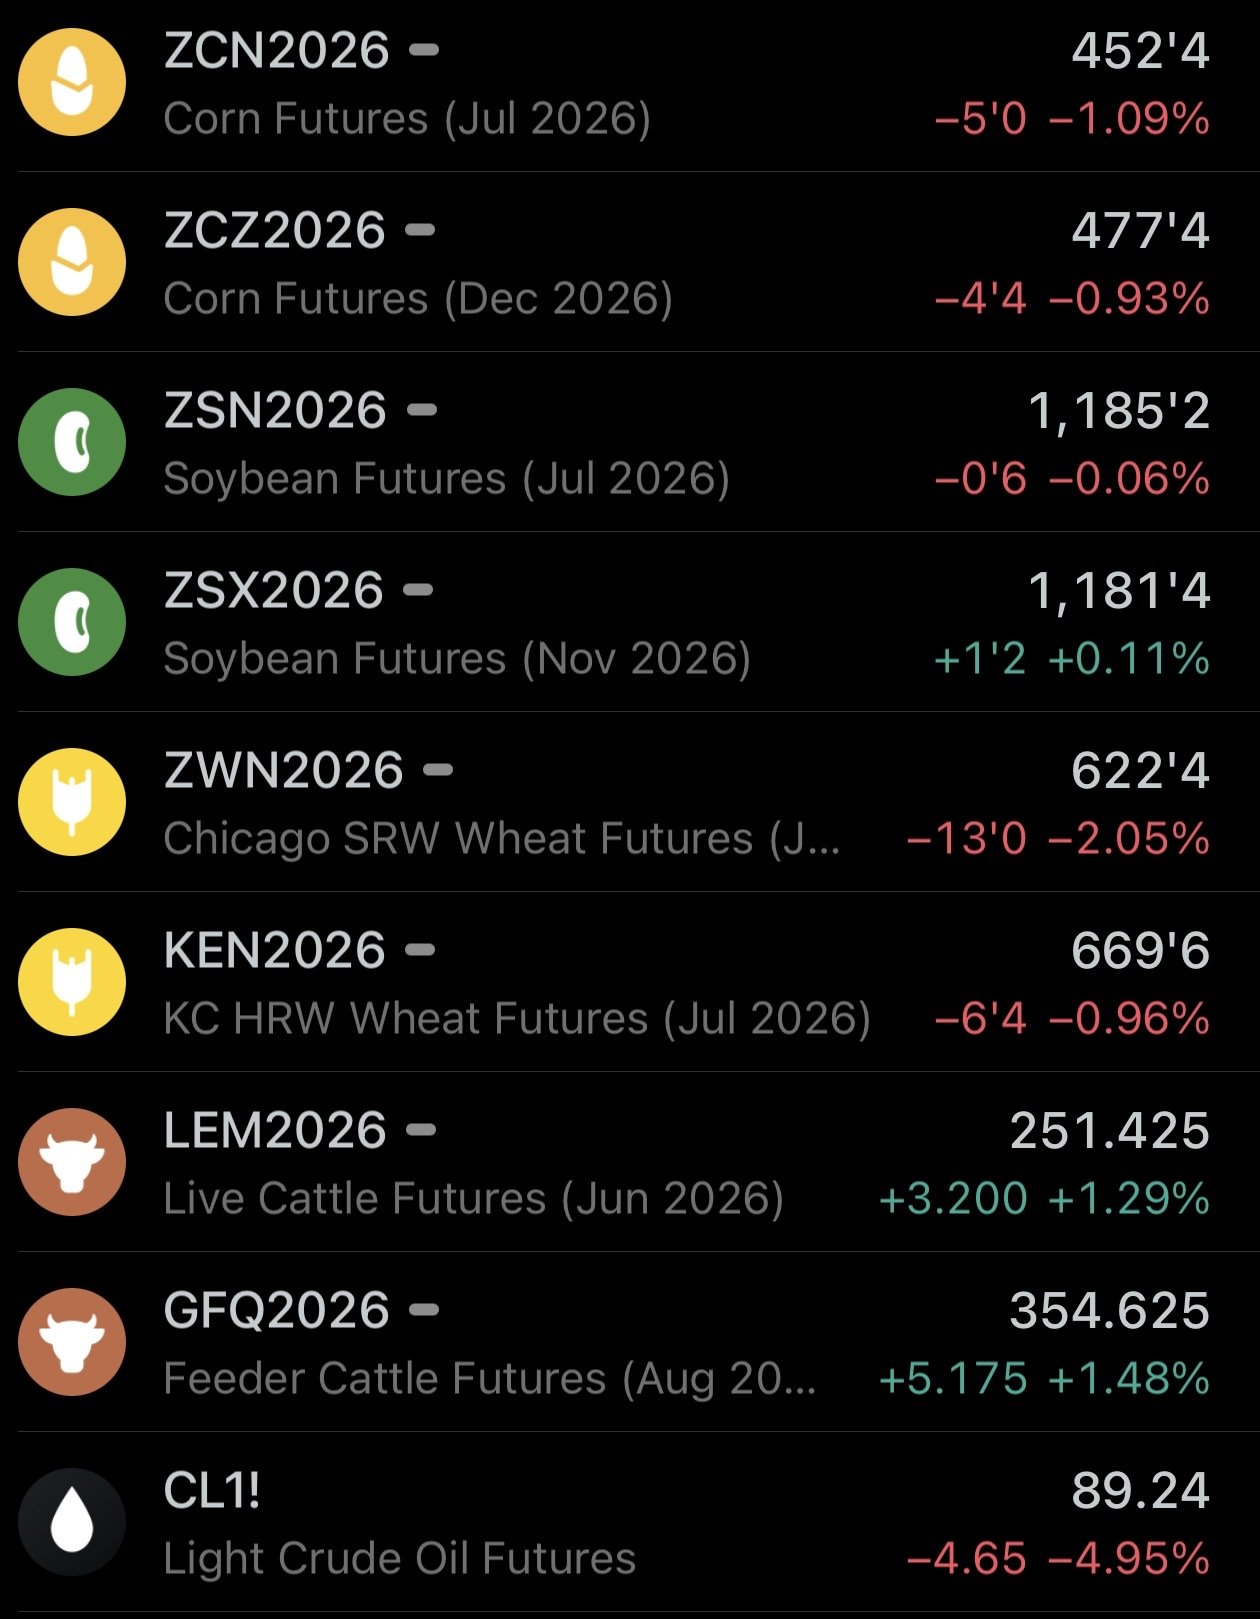
Futures Prices Close
Overview
Grains mostly lower as we continue to follow the crude oil market lower, meanwhile the cattle market catches a bid after last week's sell off.
This sell off has been almost entirely fueled by crude oil in my opinion.
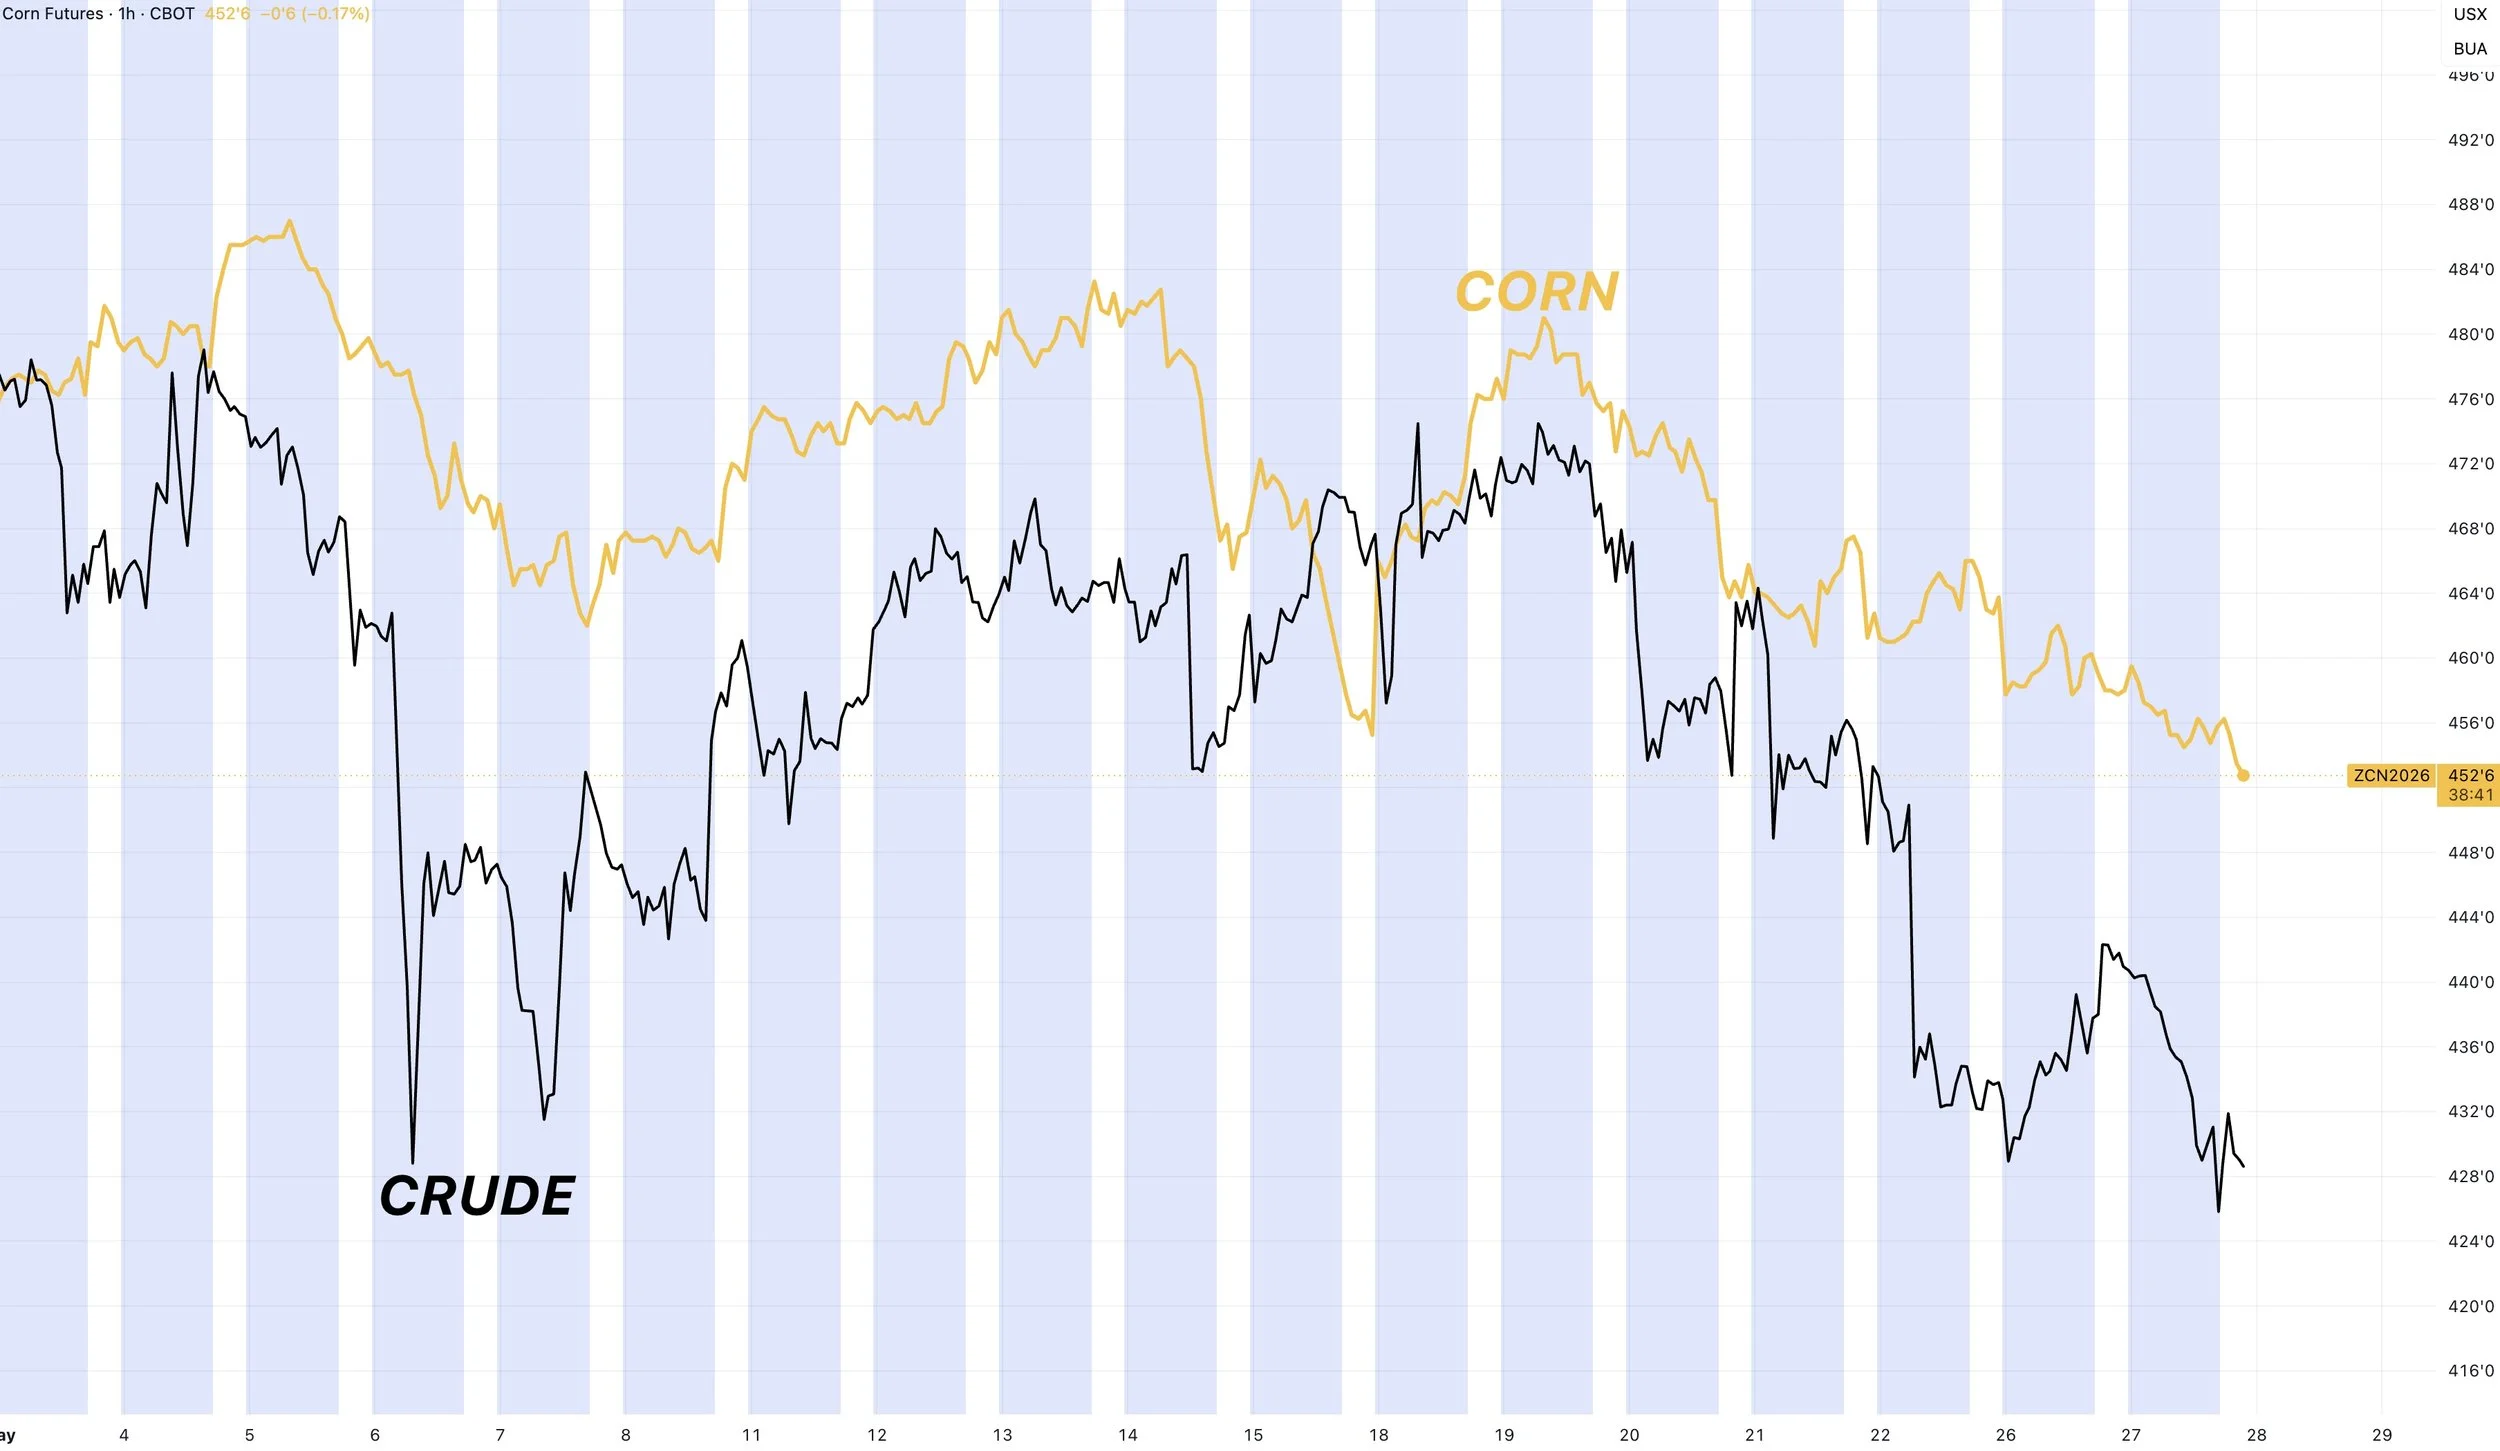
Just to give you an example, here is crude oil vs corn since the start of May.
They've been closely tied together all month long.
They've followed each other on every rally and sell off.
The war headlines continue to be all across the board.
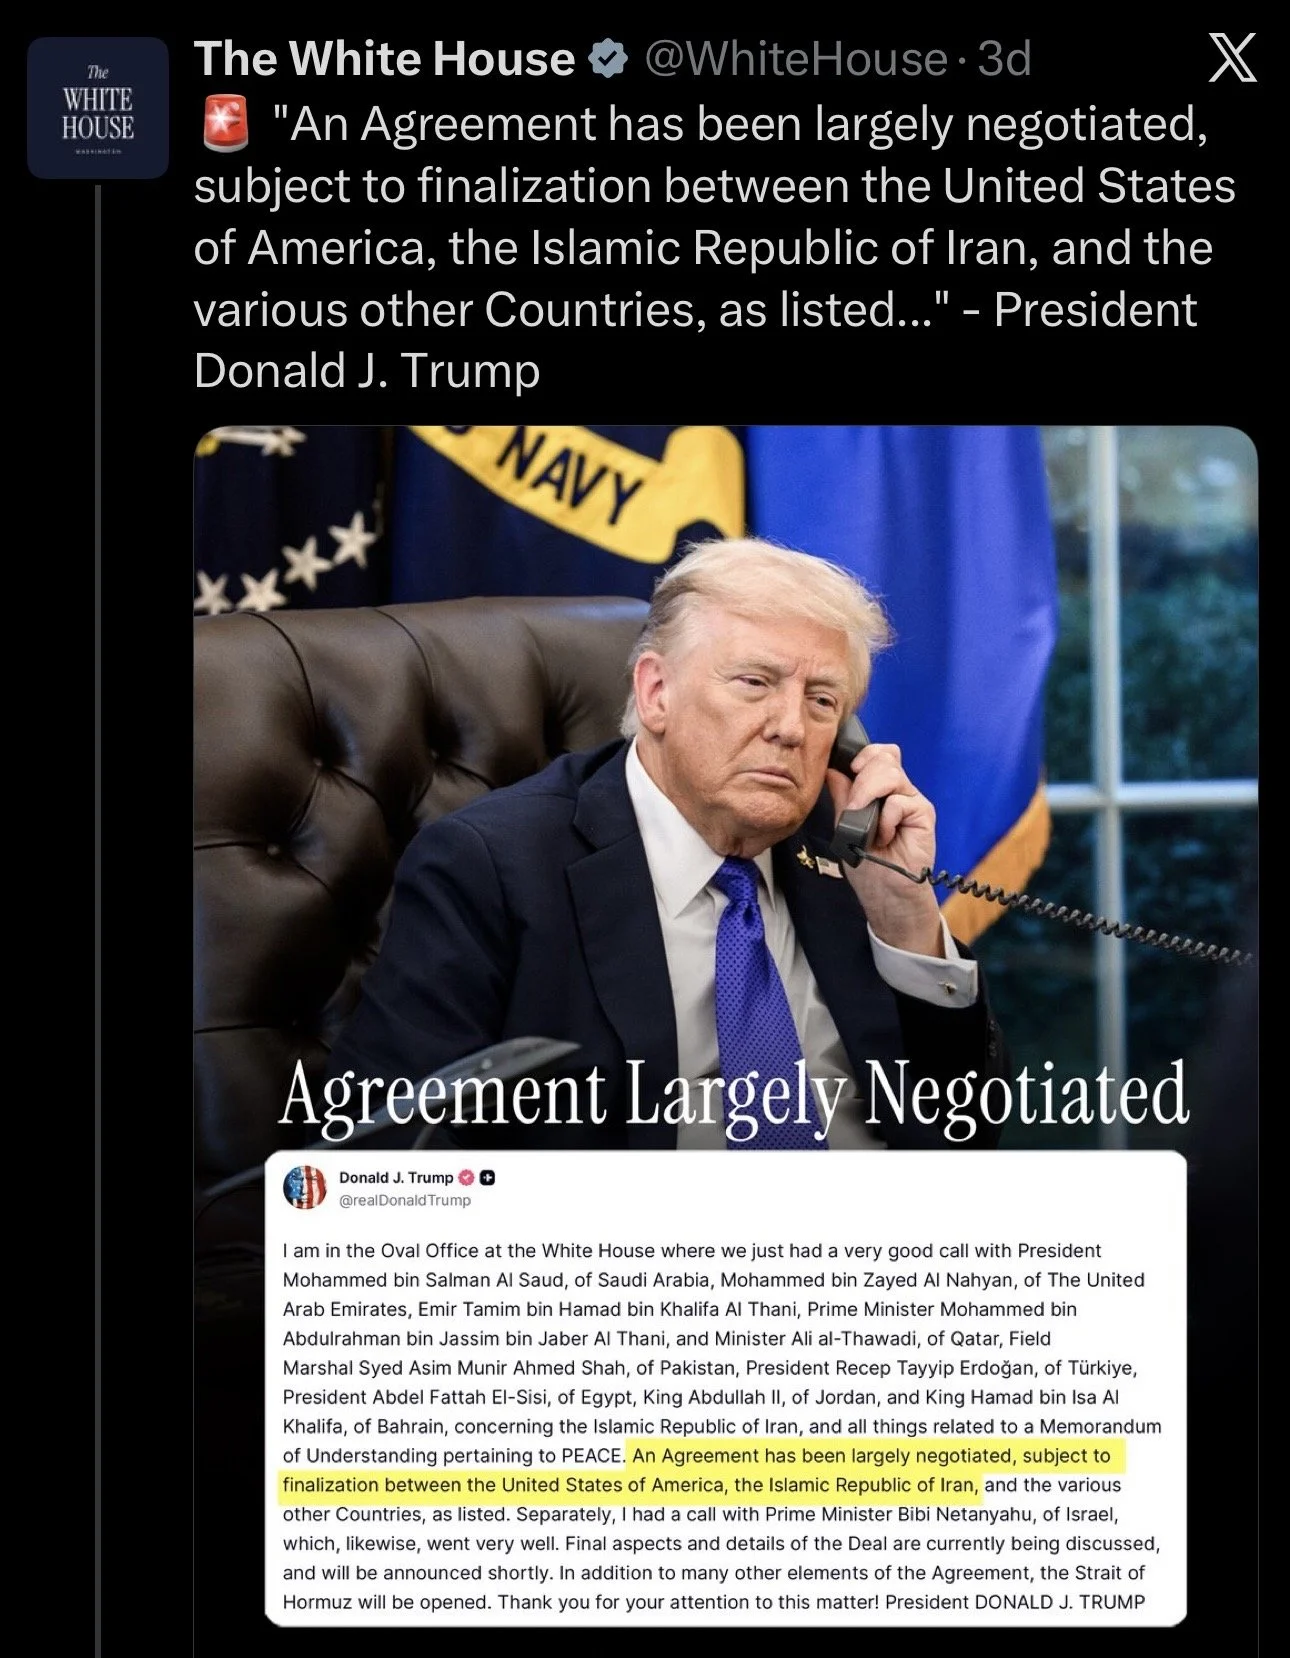
Over the weekend, Trump basically said a peace deal was imminent and that it was largely negotiated.
As a result we saw crude oil tank Monday, even though grains were closed on Monday.
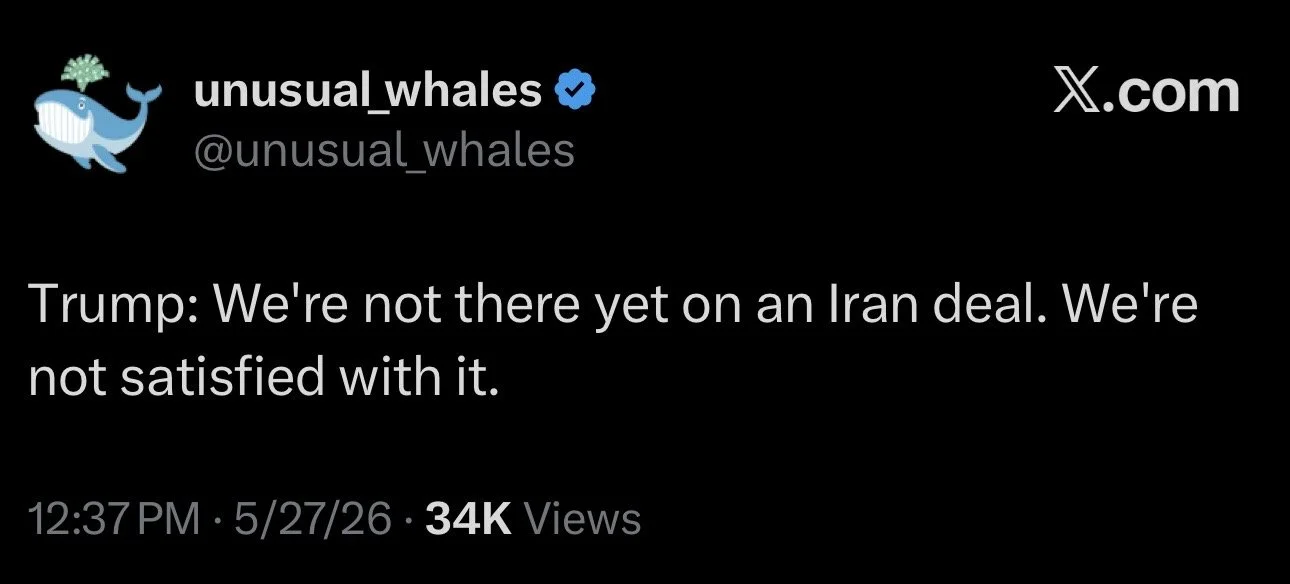
We still haven’t seen a deal.
Trump said the following comments today:
"We're not there yet on an Iran deal. We're not satisfied with it."
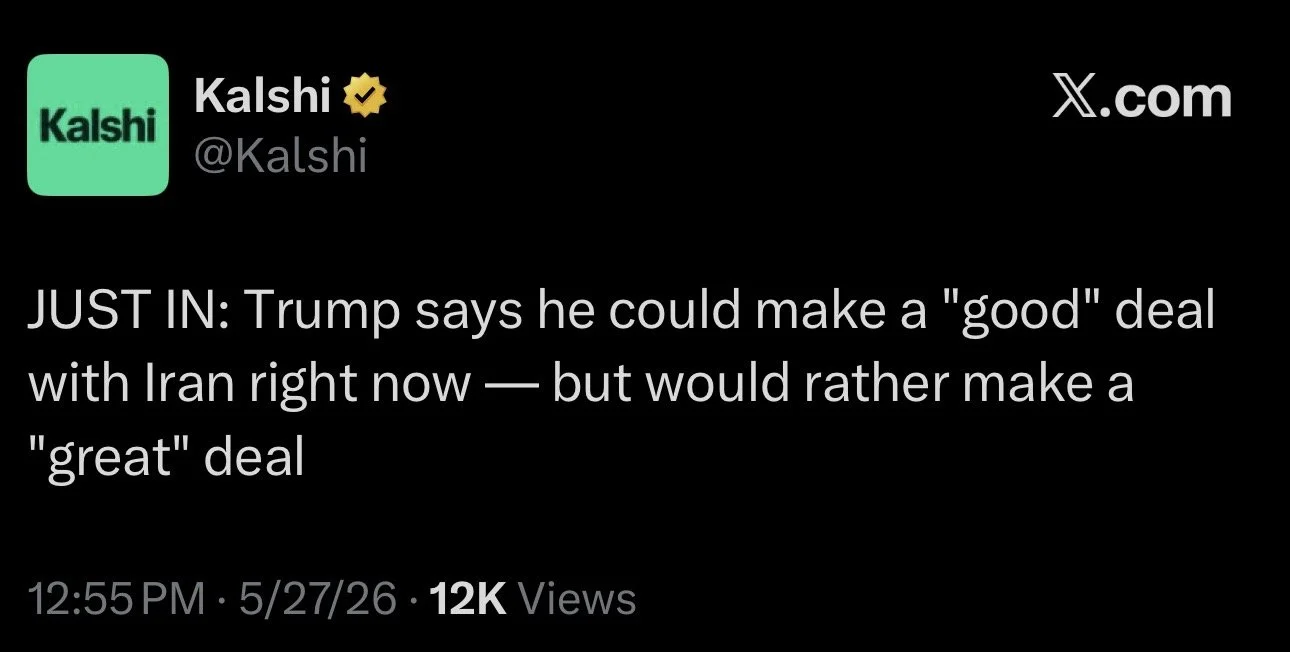
He also said we could make a "good" deal with Iran right now, but he would rather make a "great" deal.
For now the equity markets, grains, and crude have all been trading under the impression we'll get some sort of peace agreement.
Today's Main Takeaways
Corn
Last week we went over plenty of fundamentals, so I want to try keeping today's update more brief.
If you want a deeper dive, check out last week's videos.
Click Here for Friday's Video
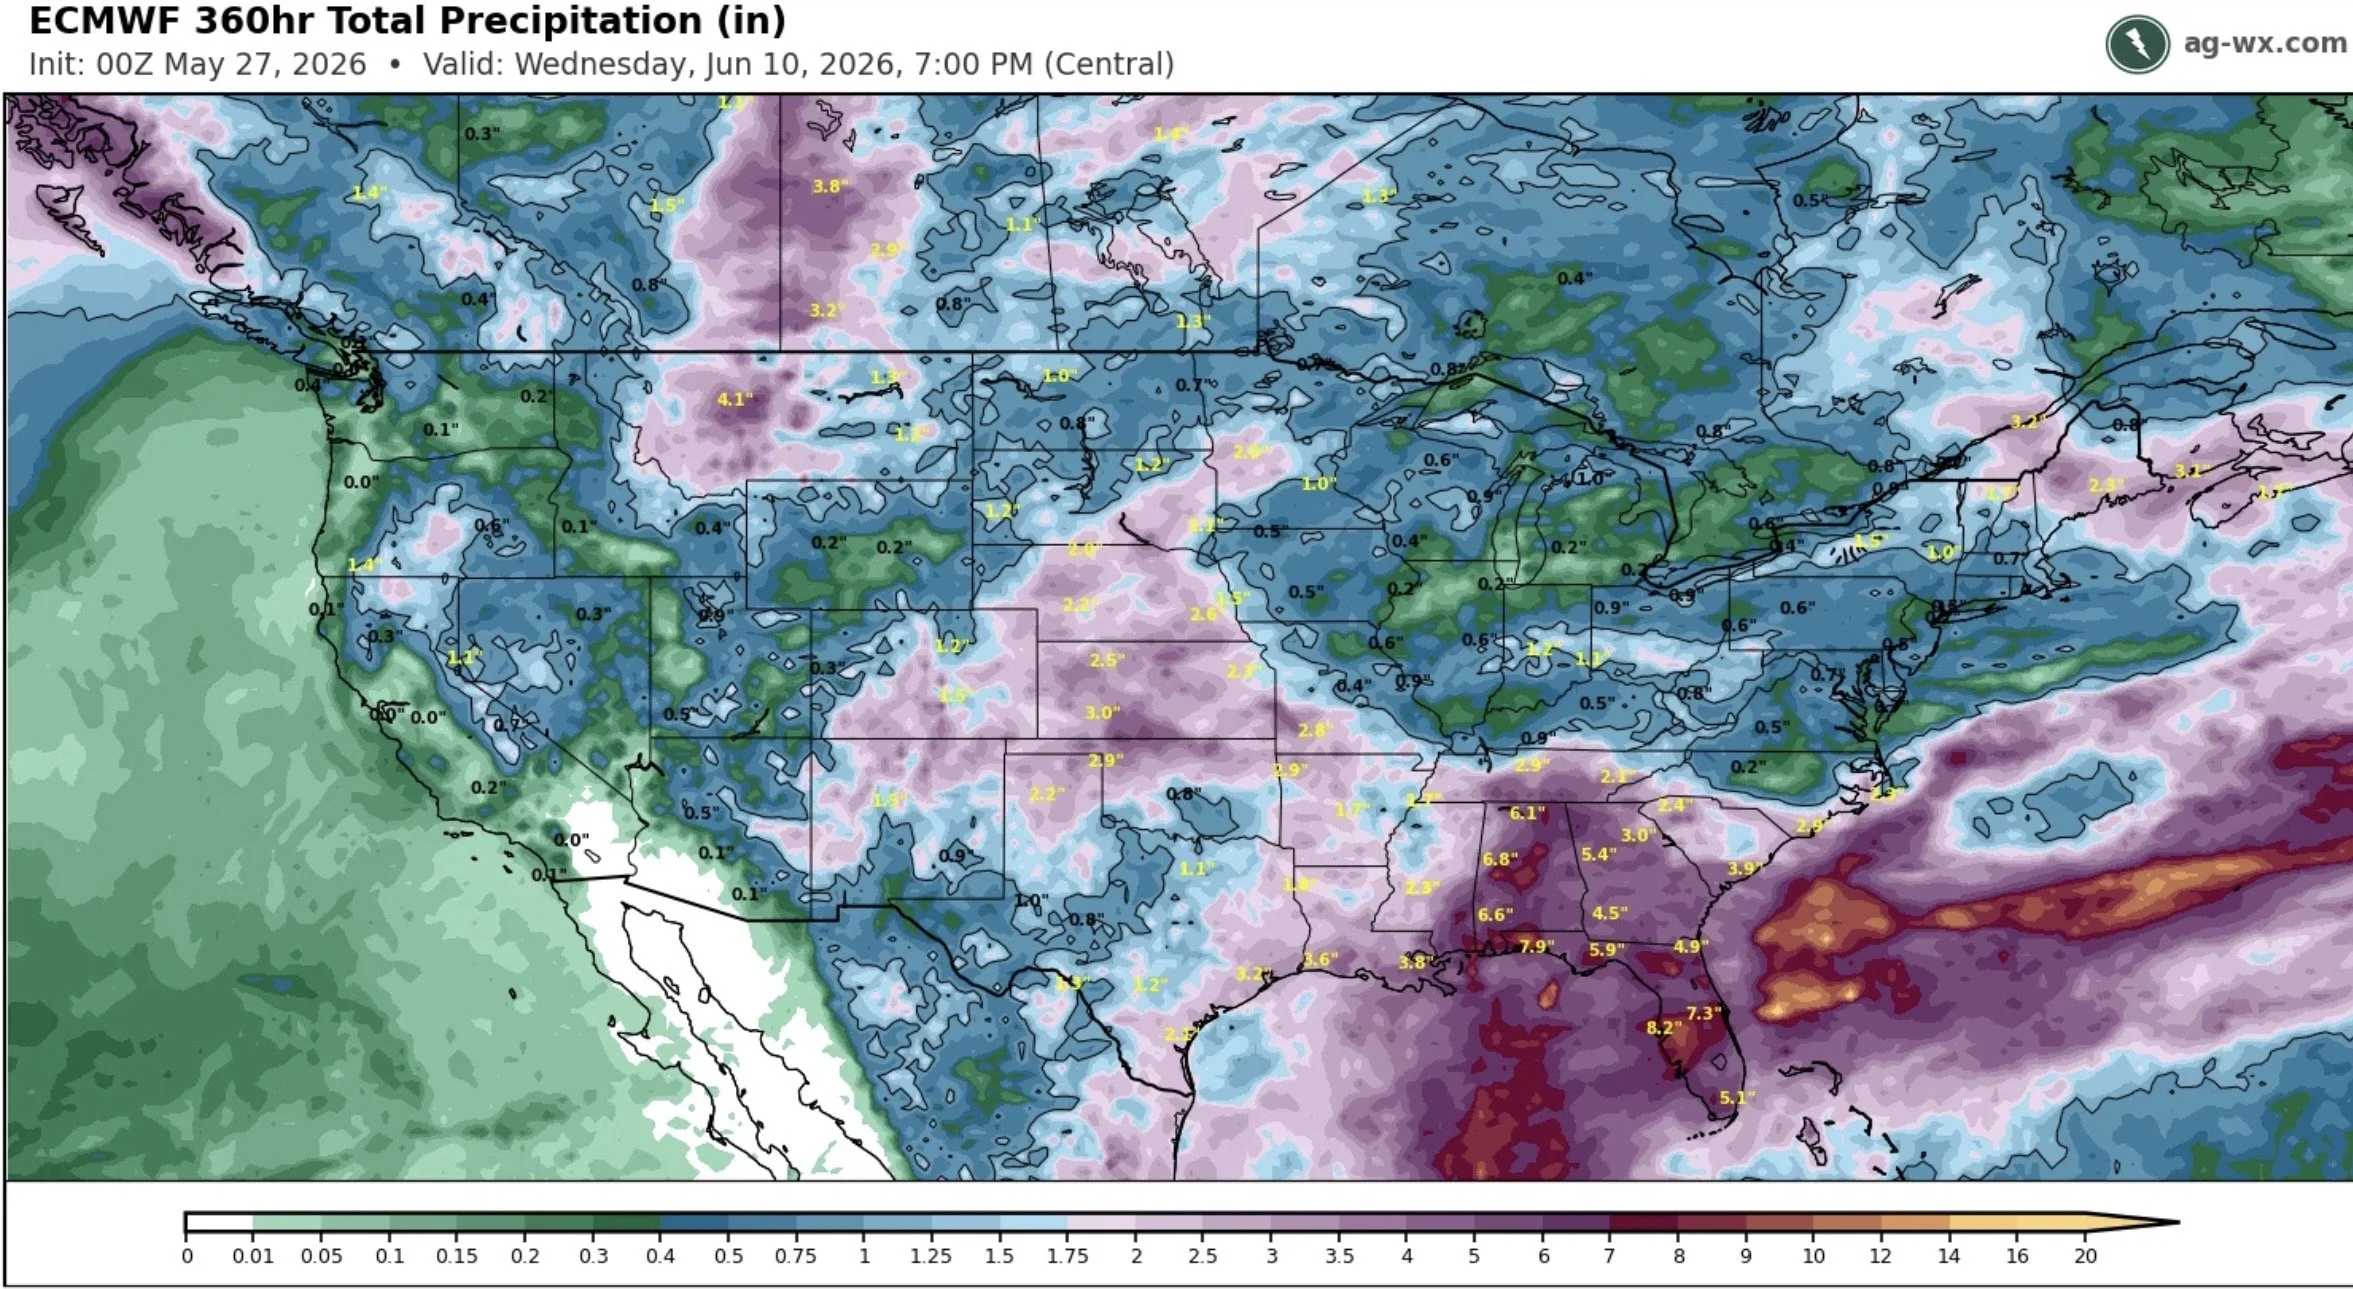
Weather is arguably one of the biggest factors that's going to impact prices over the next month or so.
The next week is going to be dry for the central corn belt.
The biggest question is, will that dryness stick around?
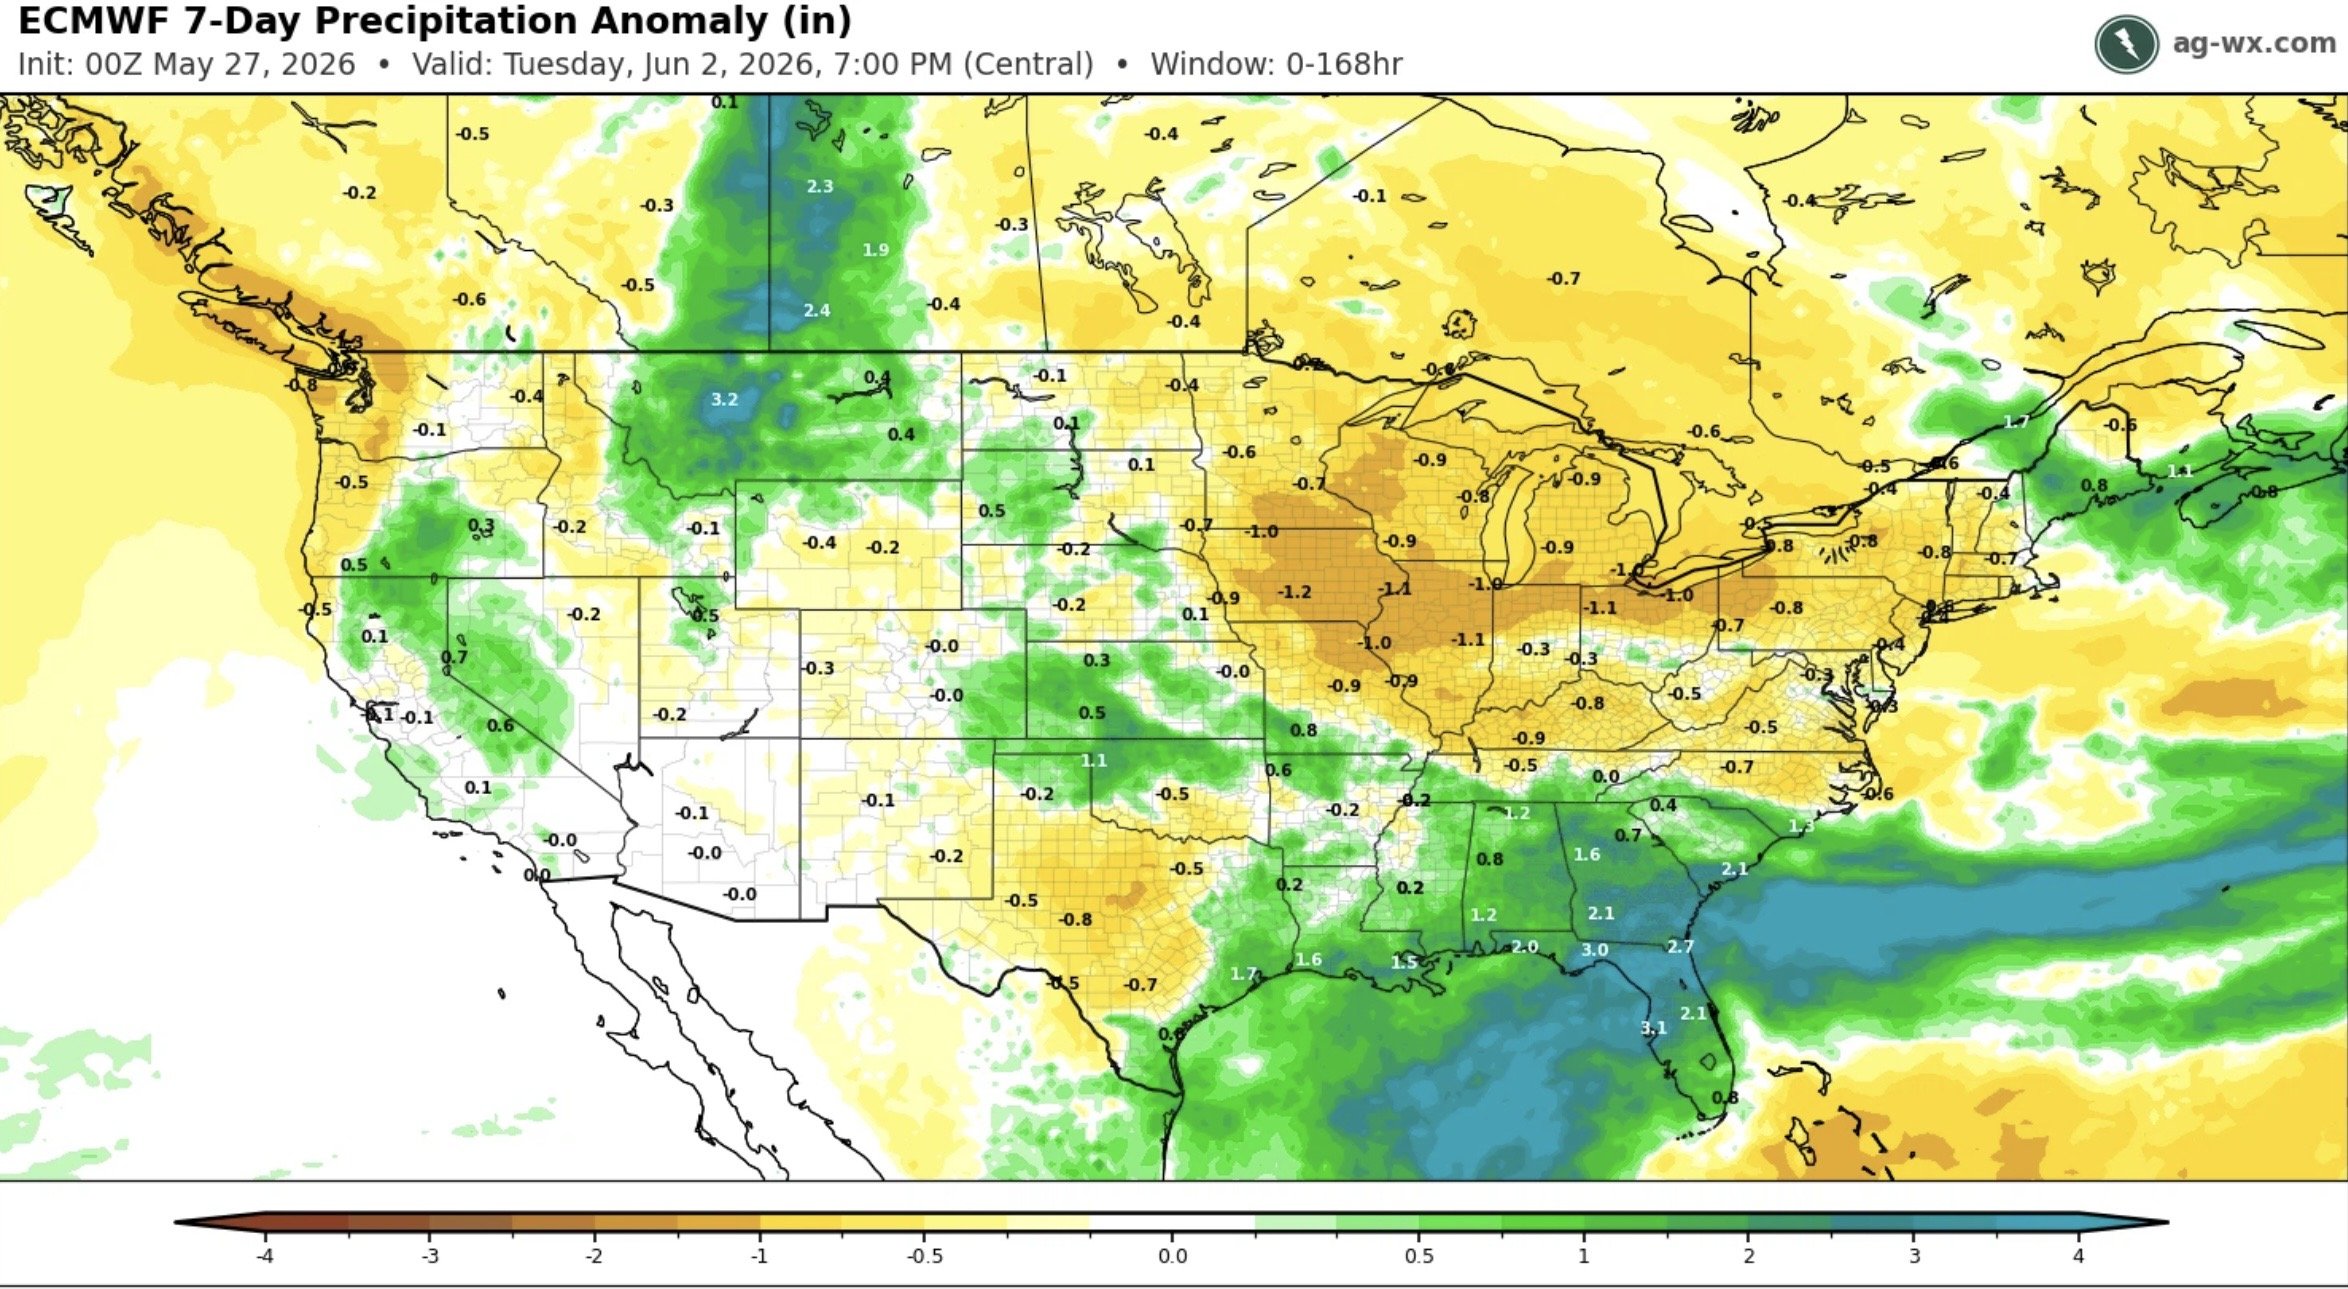
Here is the total precip forecast for the next 2 weeks until June 10th.
The central corn belt does look like it might be on the light side of things.
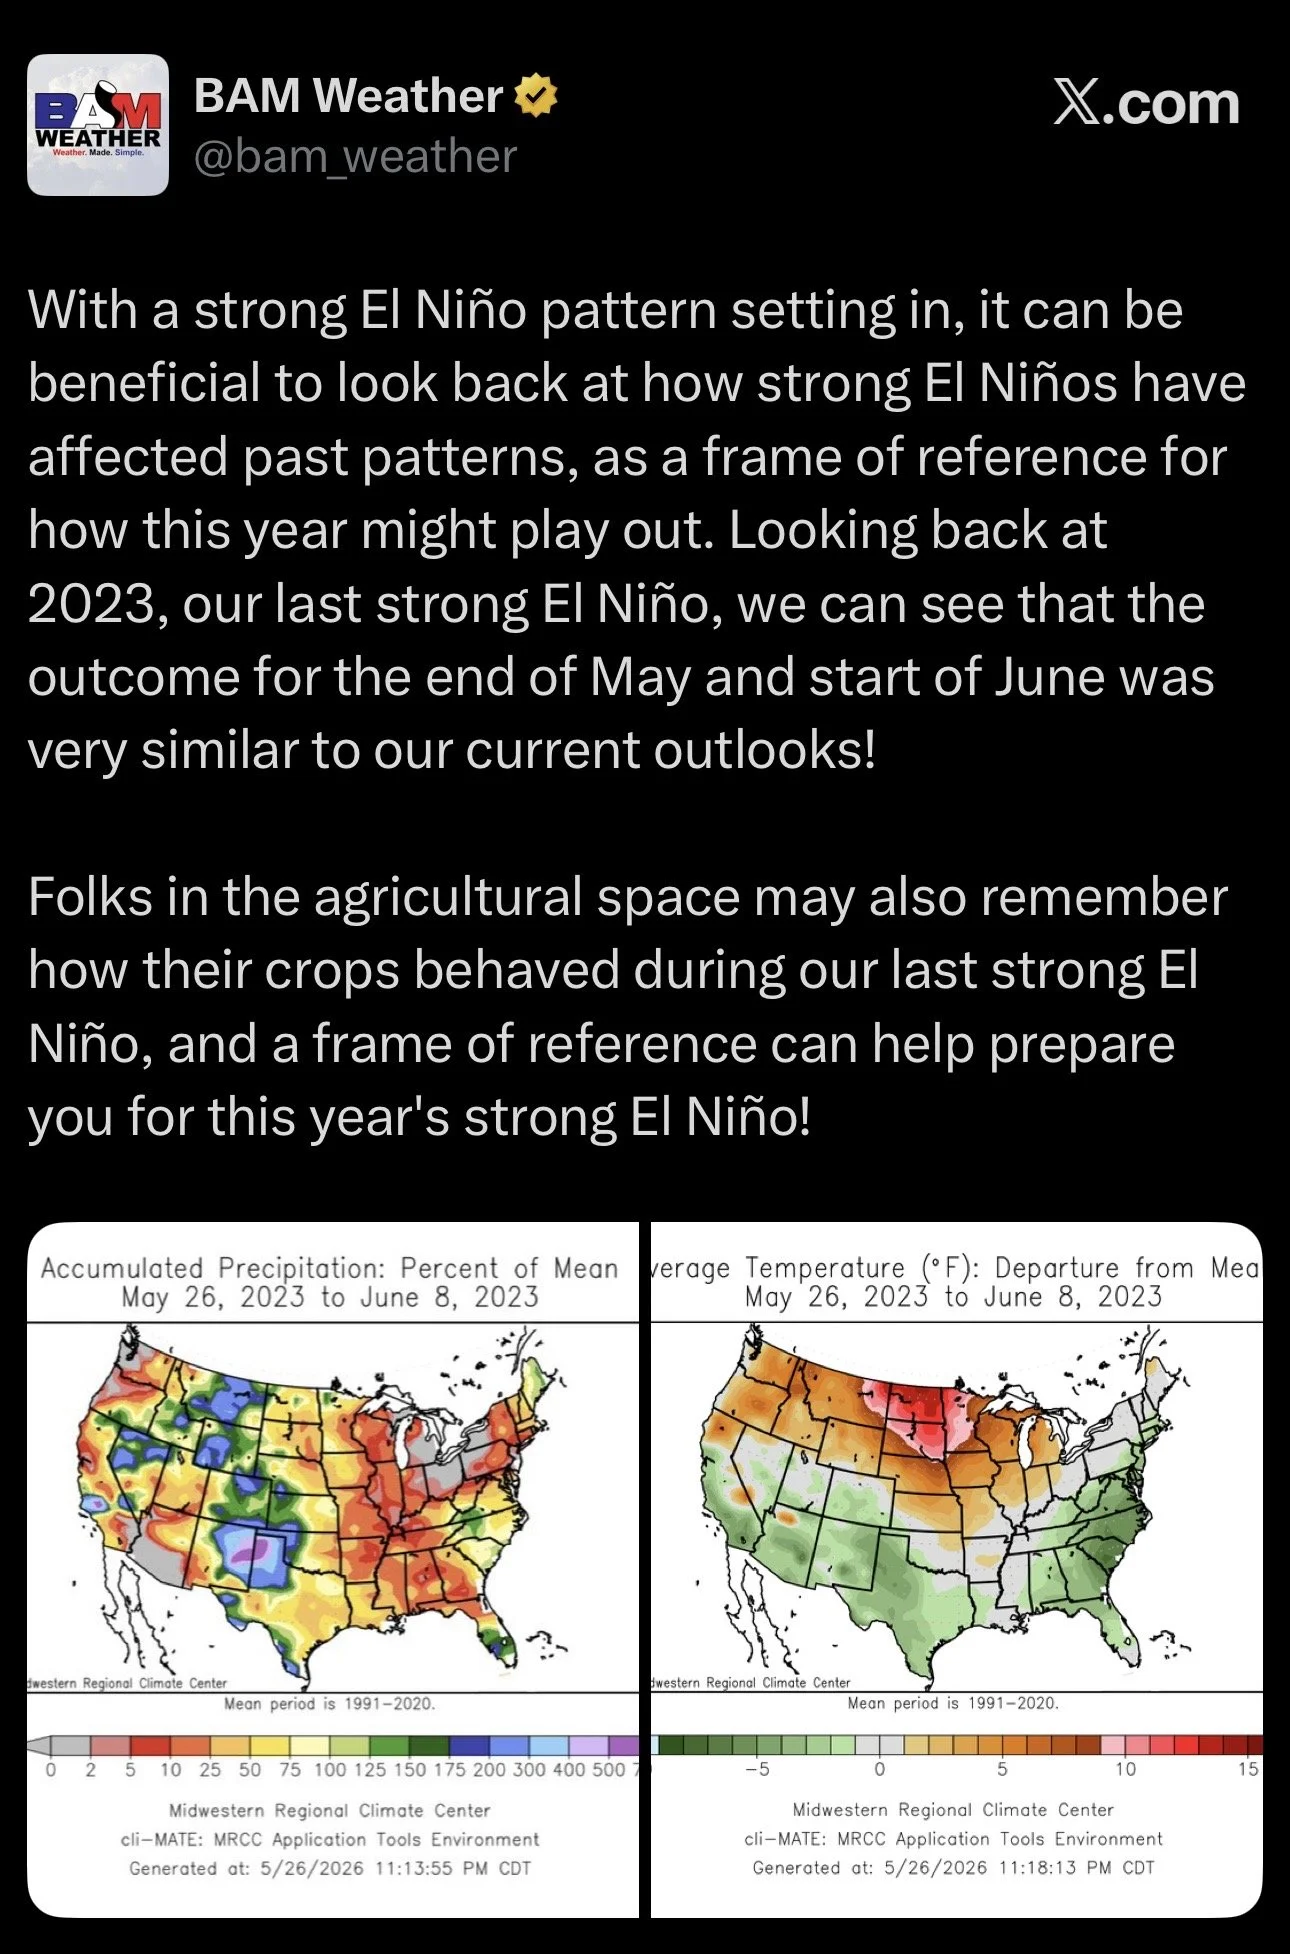
There has been some chatter that this El Niño set up is looking similar to that of 2023.
I'm not a weather guru, so I guess we'll just have to wait and find out.
Here is what Bam Weather had to say about it:
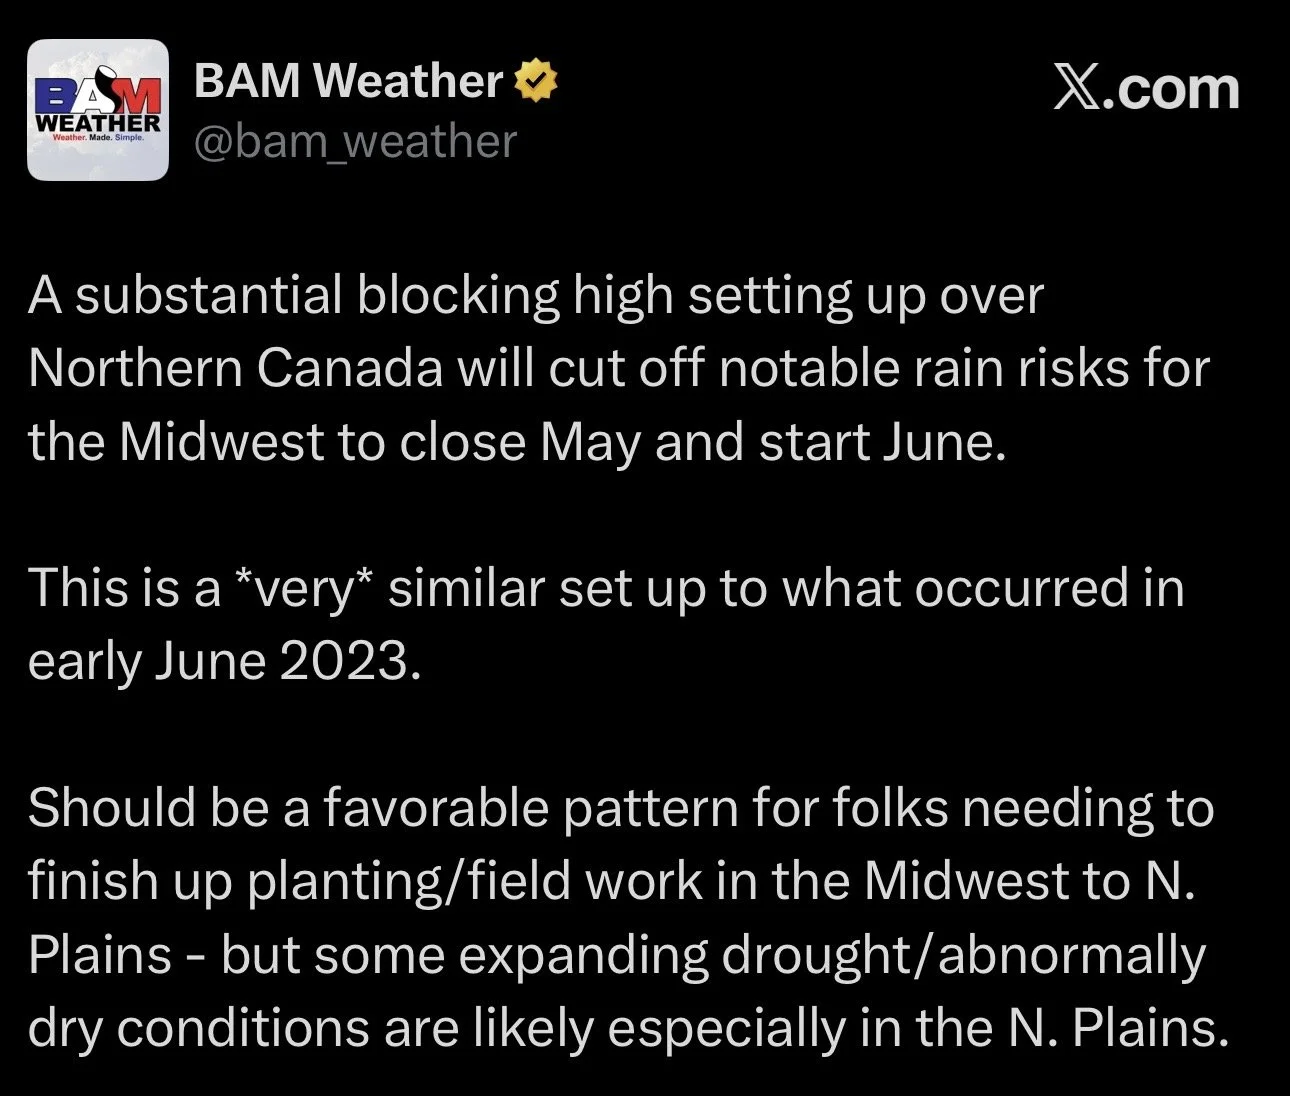
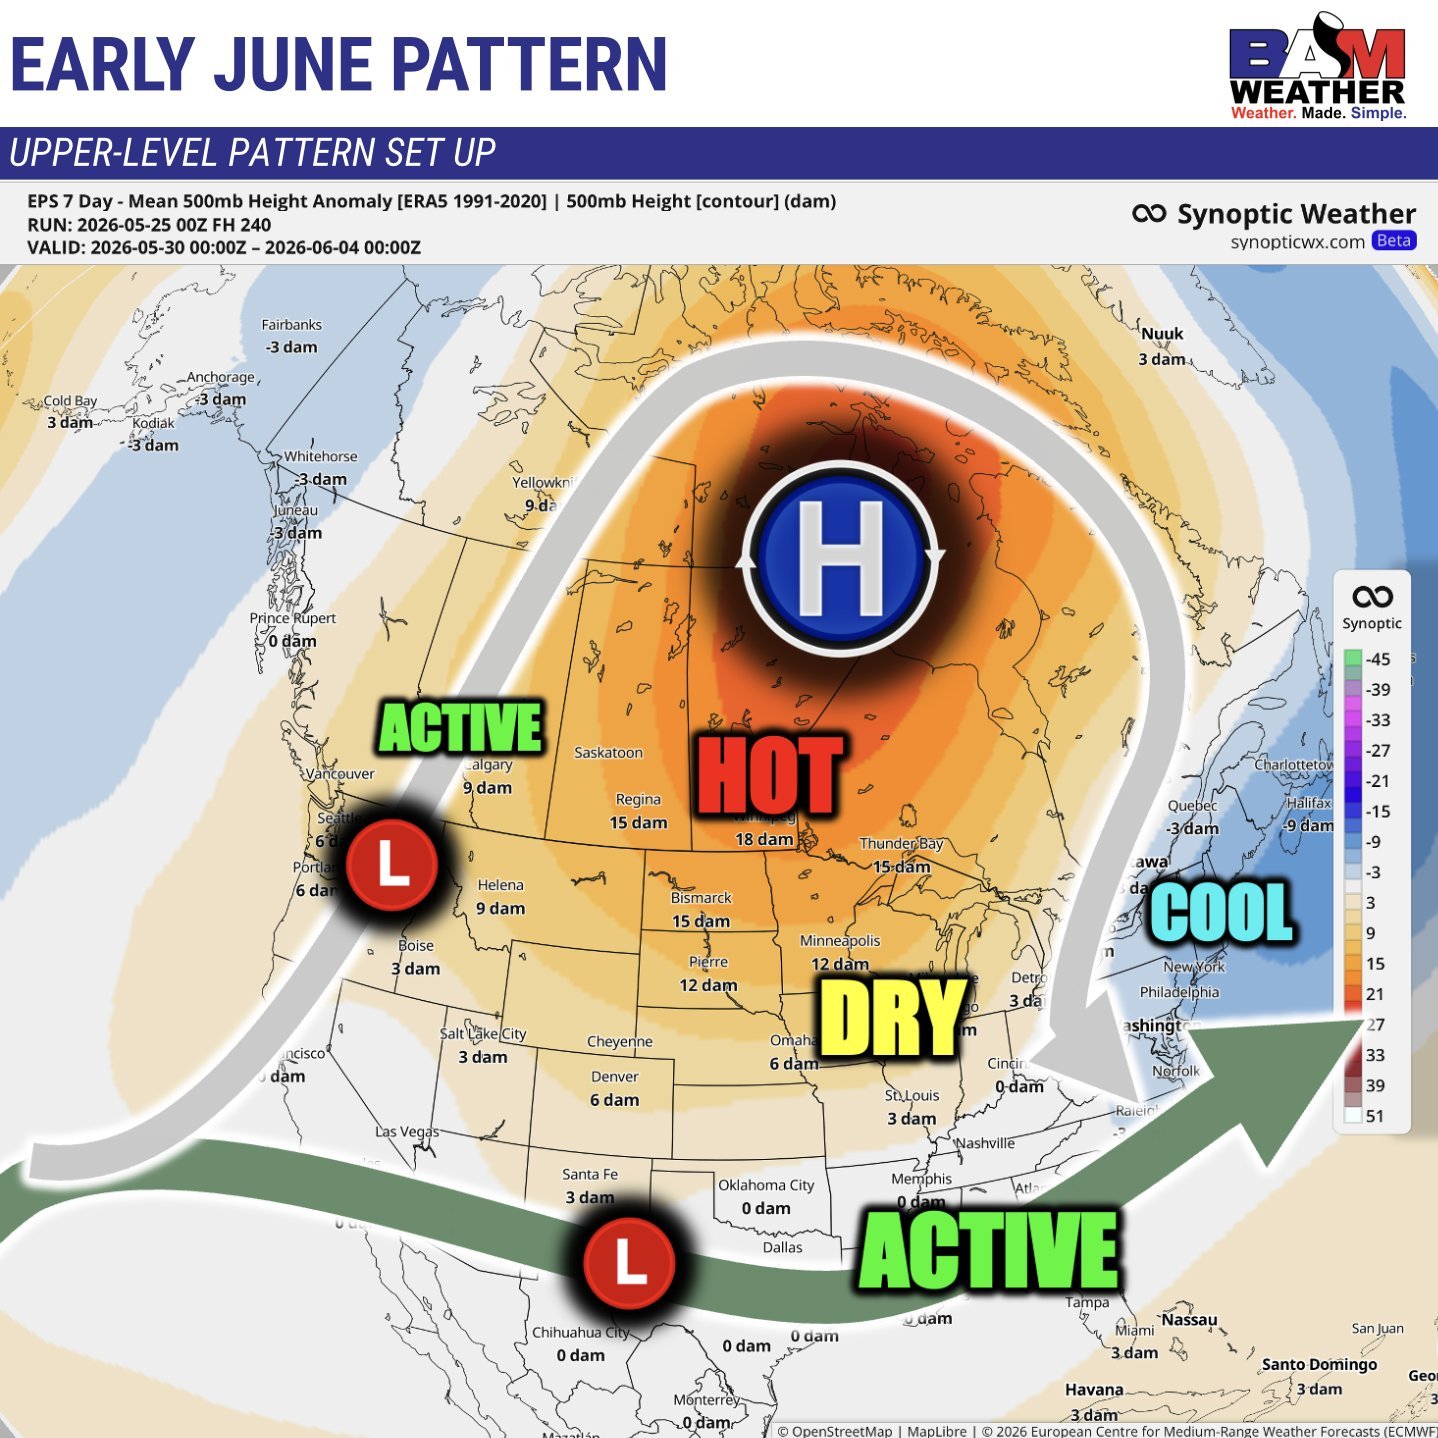
If the forecasts stay dry through June, then we might build some weather premium into this market.
If the forecasts flip wet, then there really isn’t a reason for us to go on a crazy rally short term and keep the funds as long as they are. As we would just lack a bullish catalyst.
However, I don’t think the funds are going to simply puke out of their entire position until they get a better grasp on what this crop actually looks like.
And they might want to stick around and see how acres look in that June report before completely hitting the exit door.
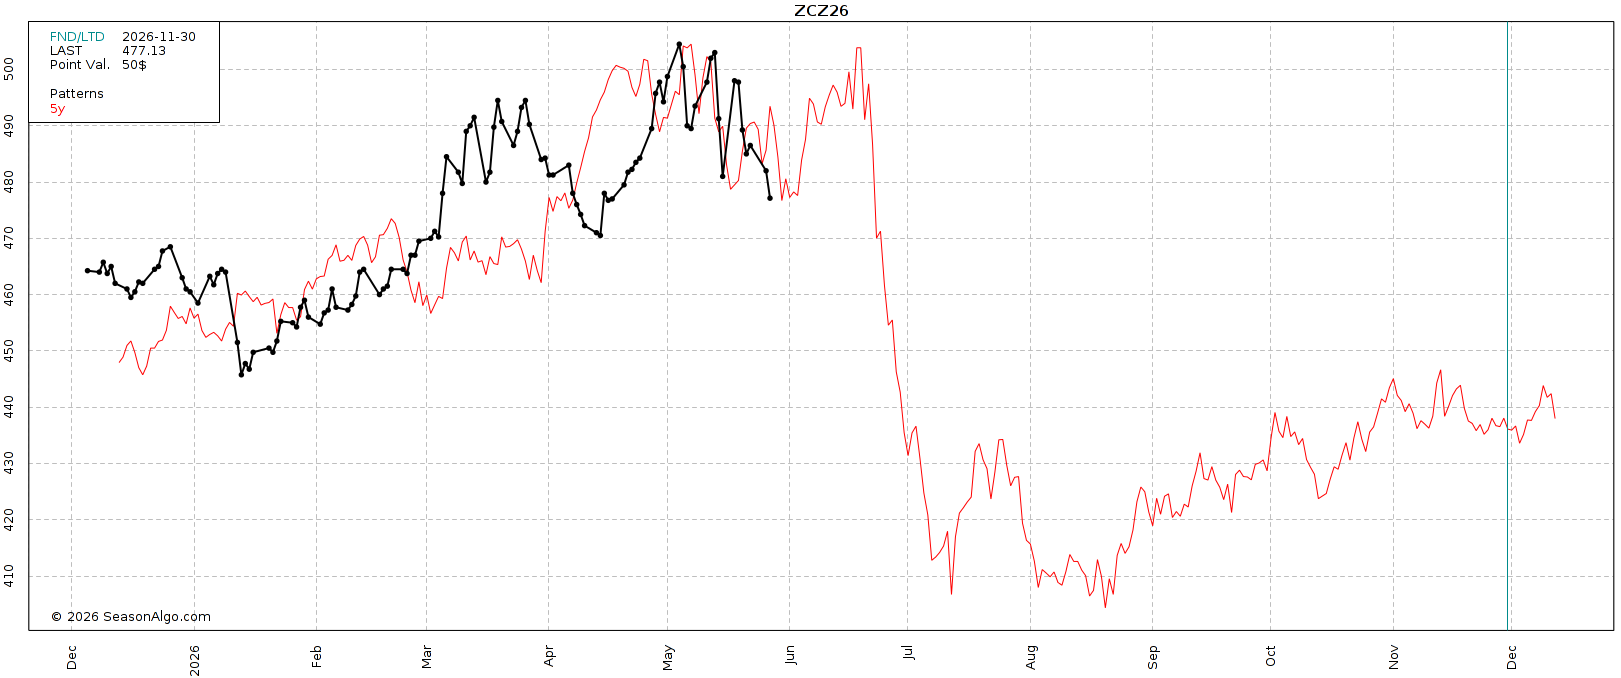
Historically, we fall out of bed right around that acre report at the end of June.
Long term, I think corn has plenty of potential.
I am very confident China will be buying corn.
The only issue is.. they might wait until harvest to do so.
Why buy now if you can get it on a discount later on if you wait?
But demand is already the best it's ever been by a wide margin. Without a single dime of China business.
What do you think happens when China starts to buy and demand is already a record?
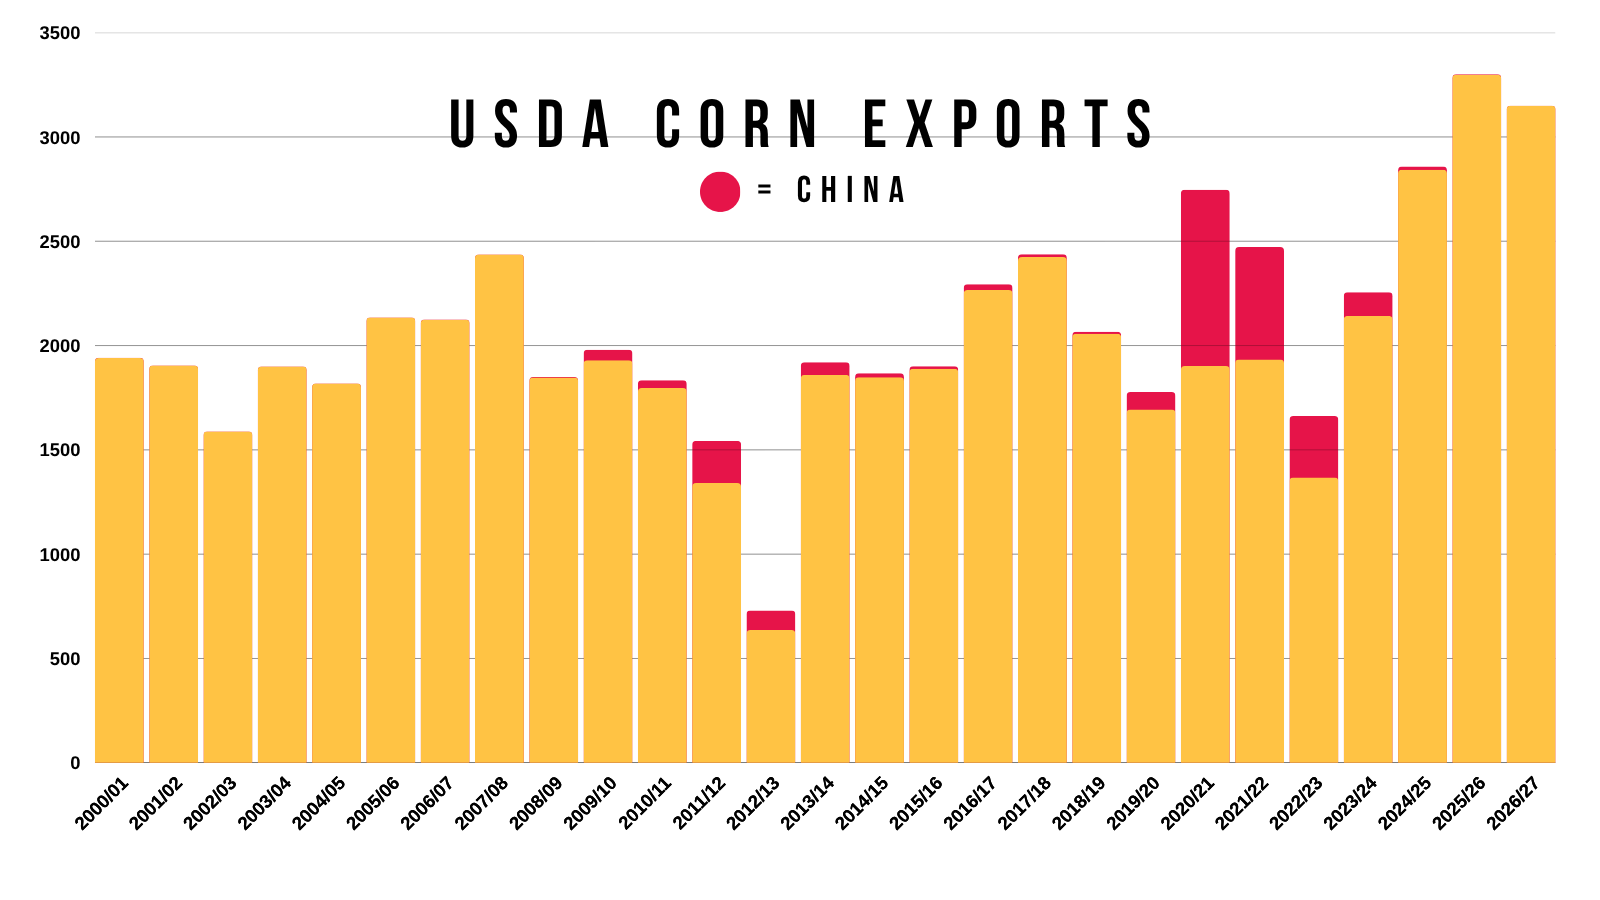
Even though the US isn’t short on supply right now, the world absolutely needs US corn.
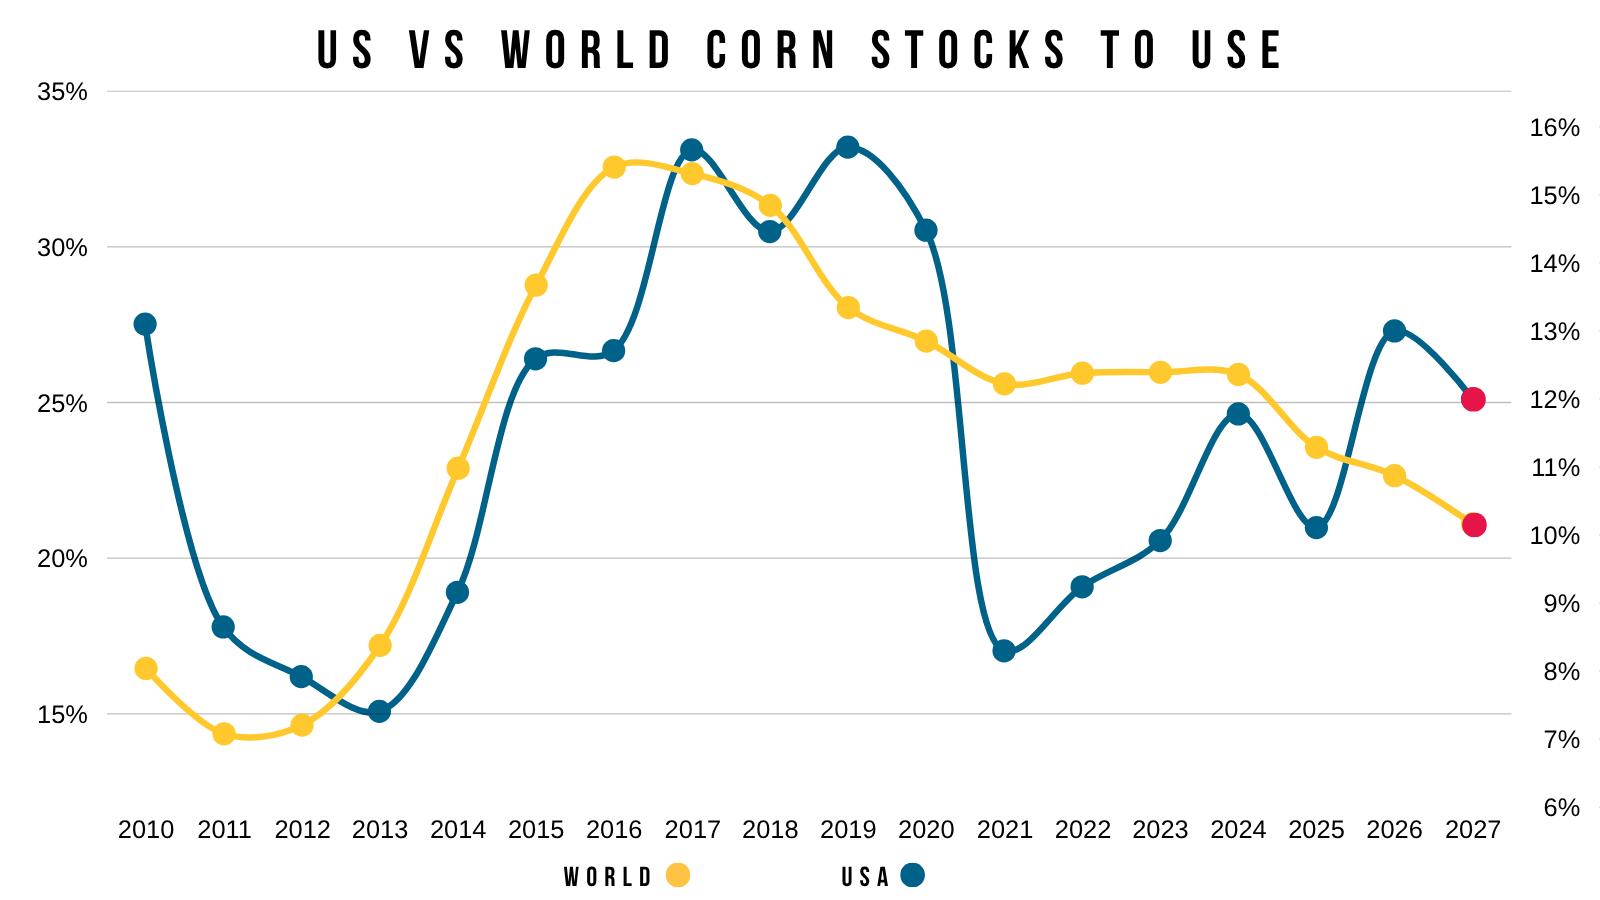
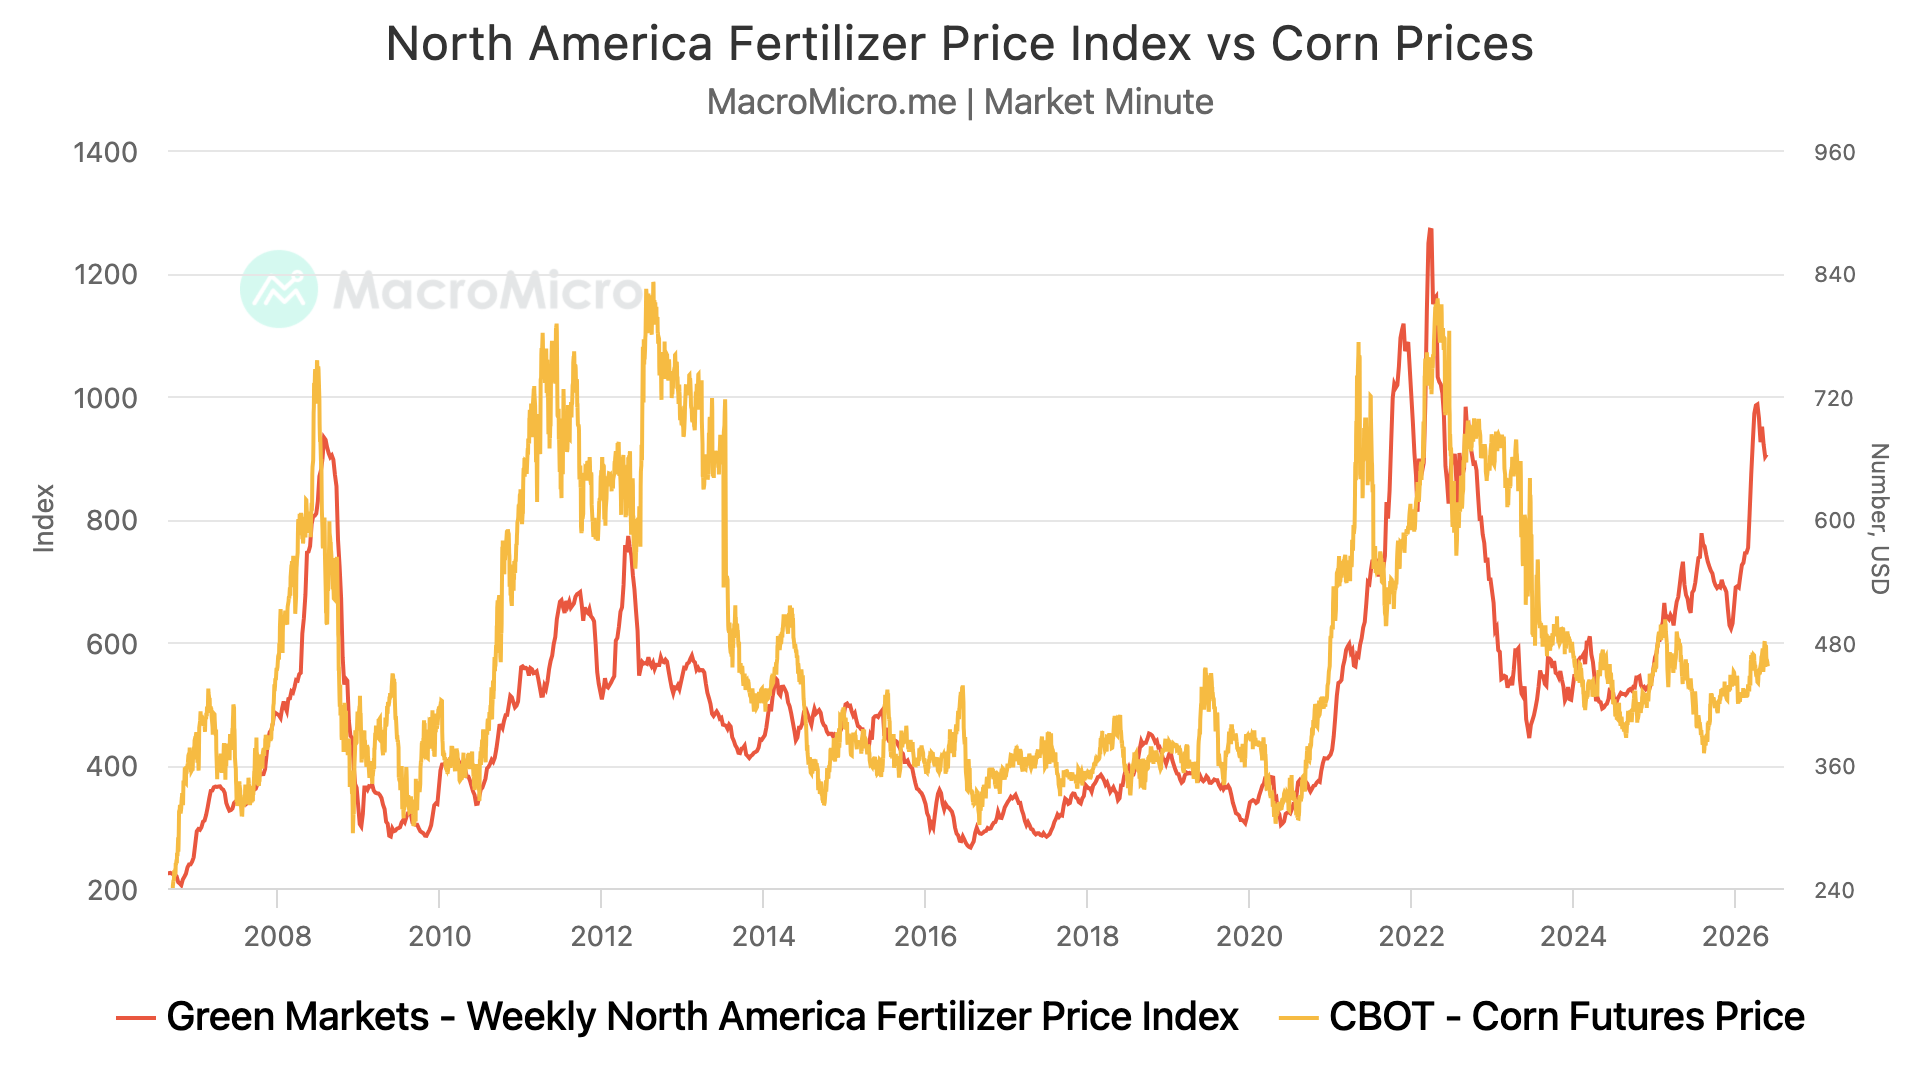
I still think acres end up coming down, and I still think inflation and the entire fertilizer situation could have a major impact on things down the road and looking at next year.
I don’t think we fall apart just yet, but short term, it might take an outside factor such as weather if we want to go screaming higher from here.
If weather cooperates, crude oil continues to tank, China waits until harvest to buy, you could easily argue the highs are in for a while if that happens.
But long term, I still see a story.
Here is the fertilizer price index vs corn. We've lagged behind by a mile.
July Corn Chart:
Today we did issue a re-ownership/buy signal for corn.
If you missed it: Click Here to View
Basically, if you made previous sales, we like to consider re-owning some of them here via calls. We also like buying back short calls, and picking up courage calls here.
If you decide to use futures, have a plan or a stop to manage your downside risk in the event we continue lower.
If you use corn for feed, this would also be an area to hedge.
This wasn’t us saying everyone should go out and buy corn. This was a disciplined shot at some major support.
If you have questions or want to talk about a strategy that would fit your specific operation, give us a call or a text.
Office: (806)484-1214
Why the alert?
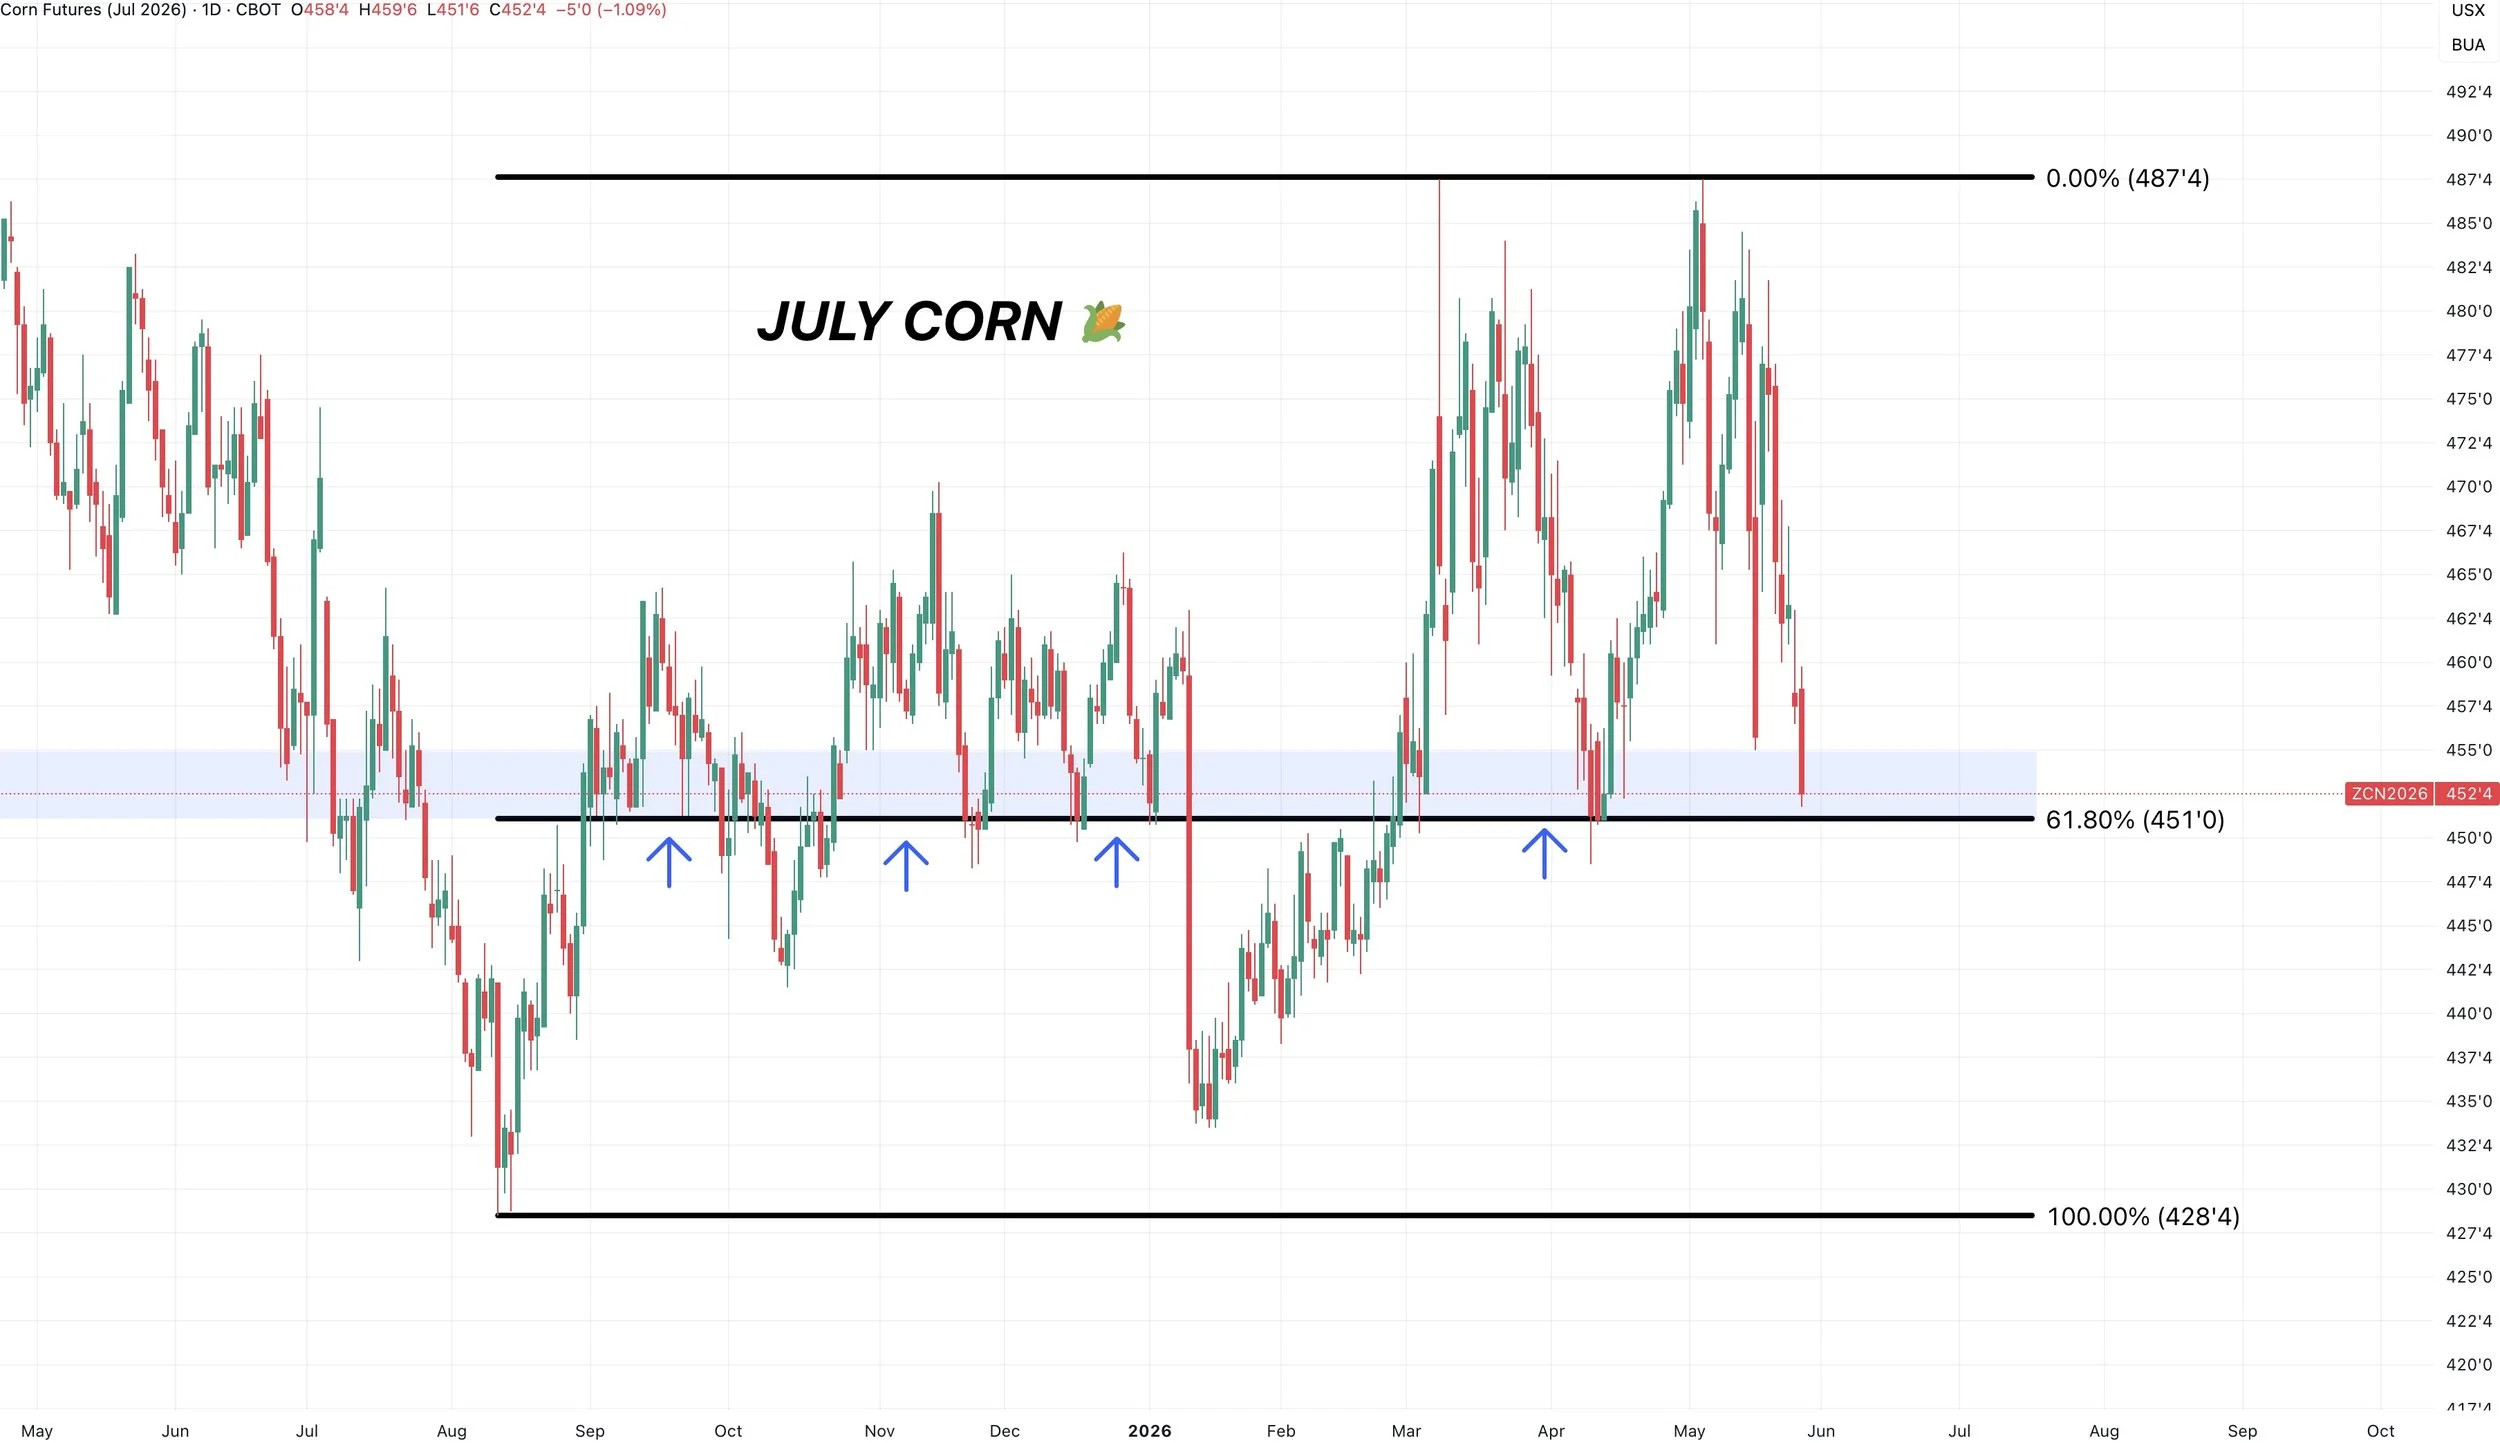
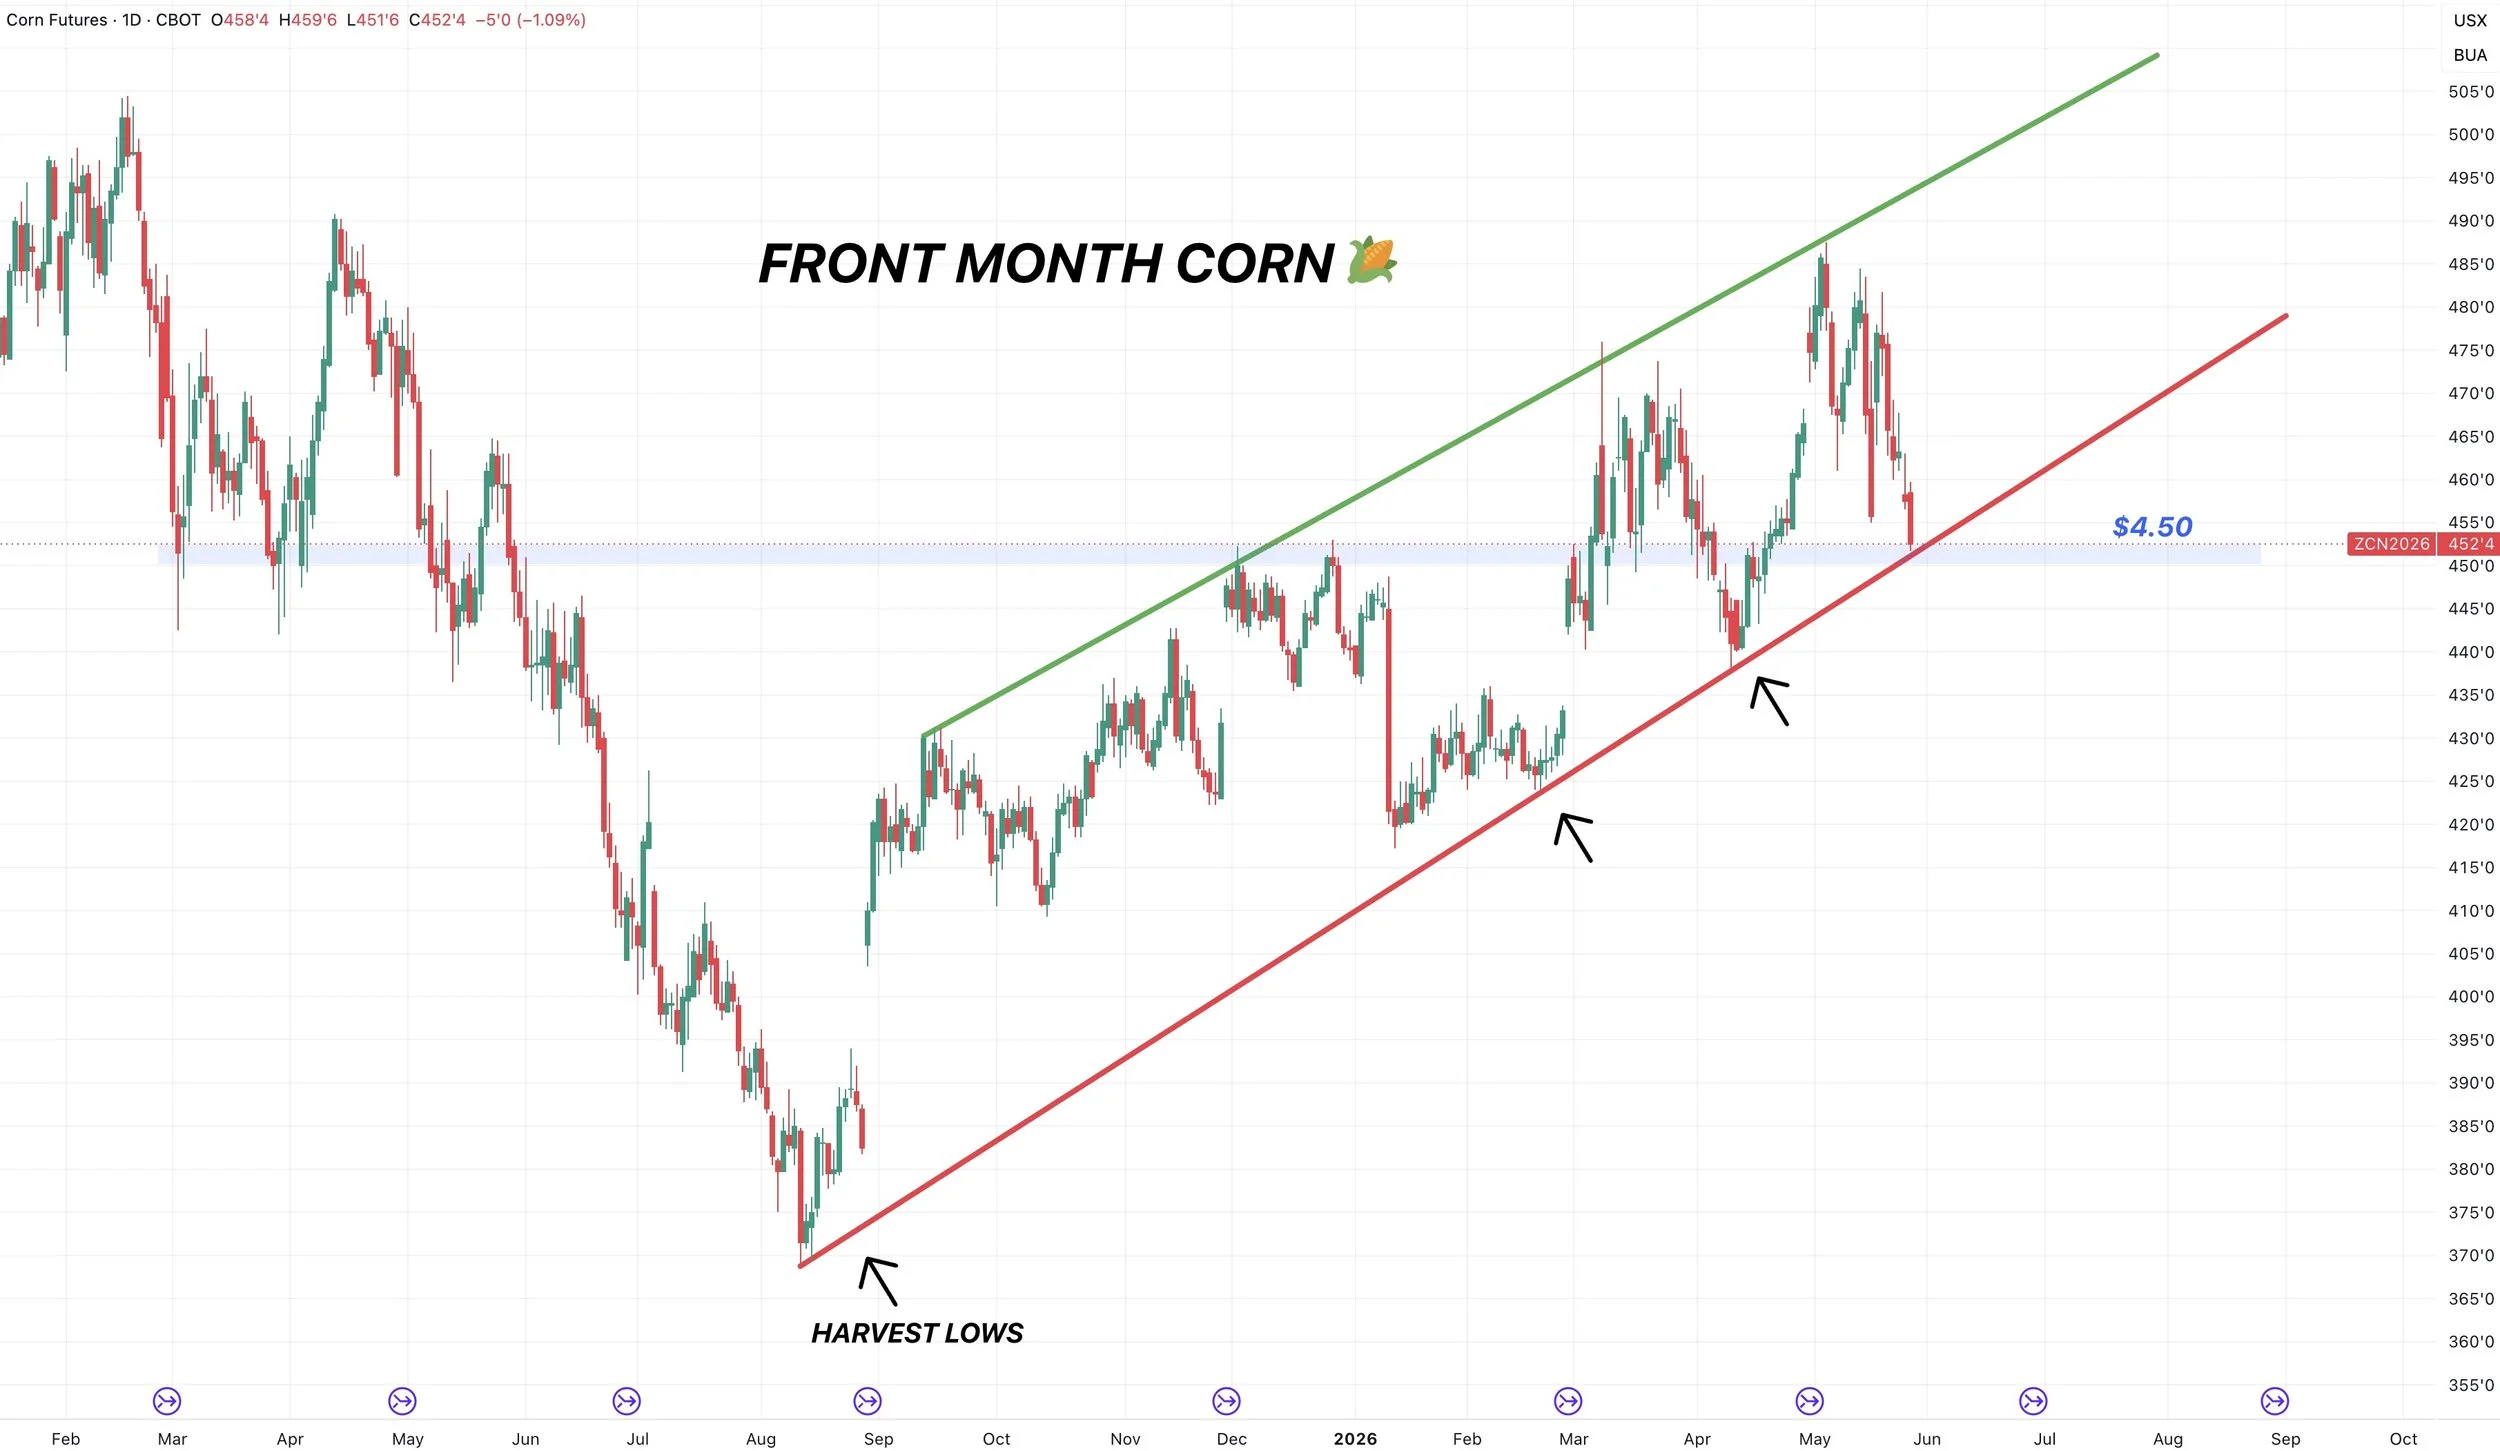
Corn is at a make or break level.
$4.50 is the level.
If we are going to bounce, it needs to be here.
If we break below this level, you could argue it's over, as it opens the door lower.
That is major key support. Not only is it 61.8% of the highs all the way down to contract lows, which is the most common retracement.
It's also key support from fall and is exactly where we bounced back in April.
An absolute must hold level.
So our thought process behind this signal is that we will know when we're wrong if we break below that $4.50 level. As this is basically our last level of support.
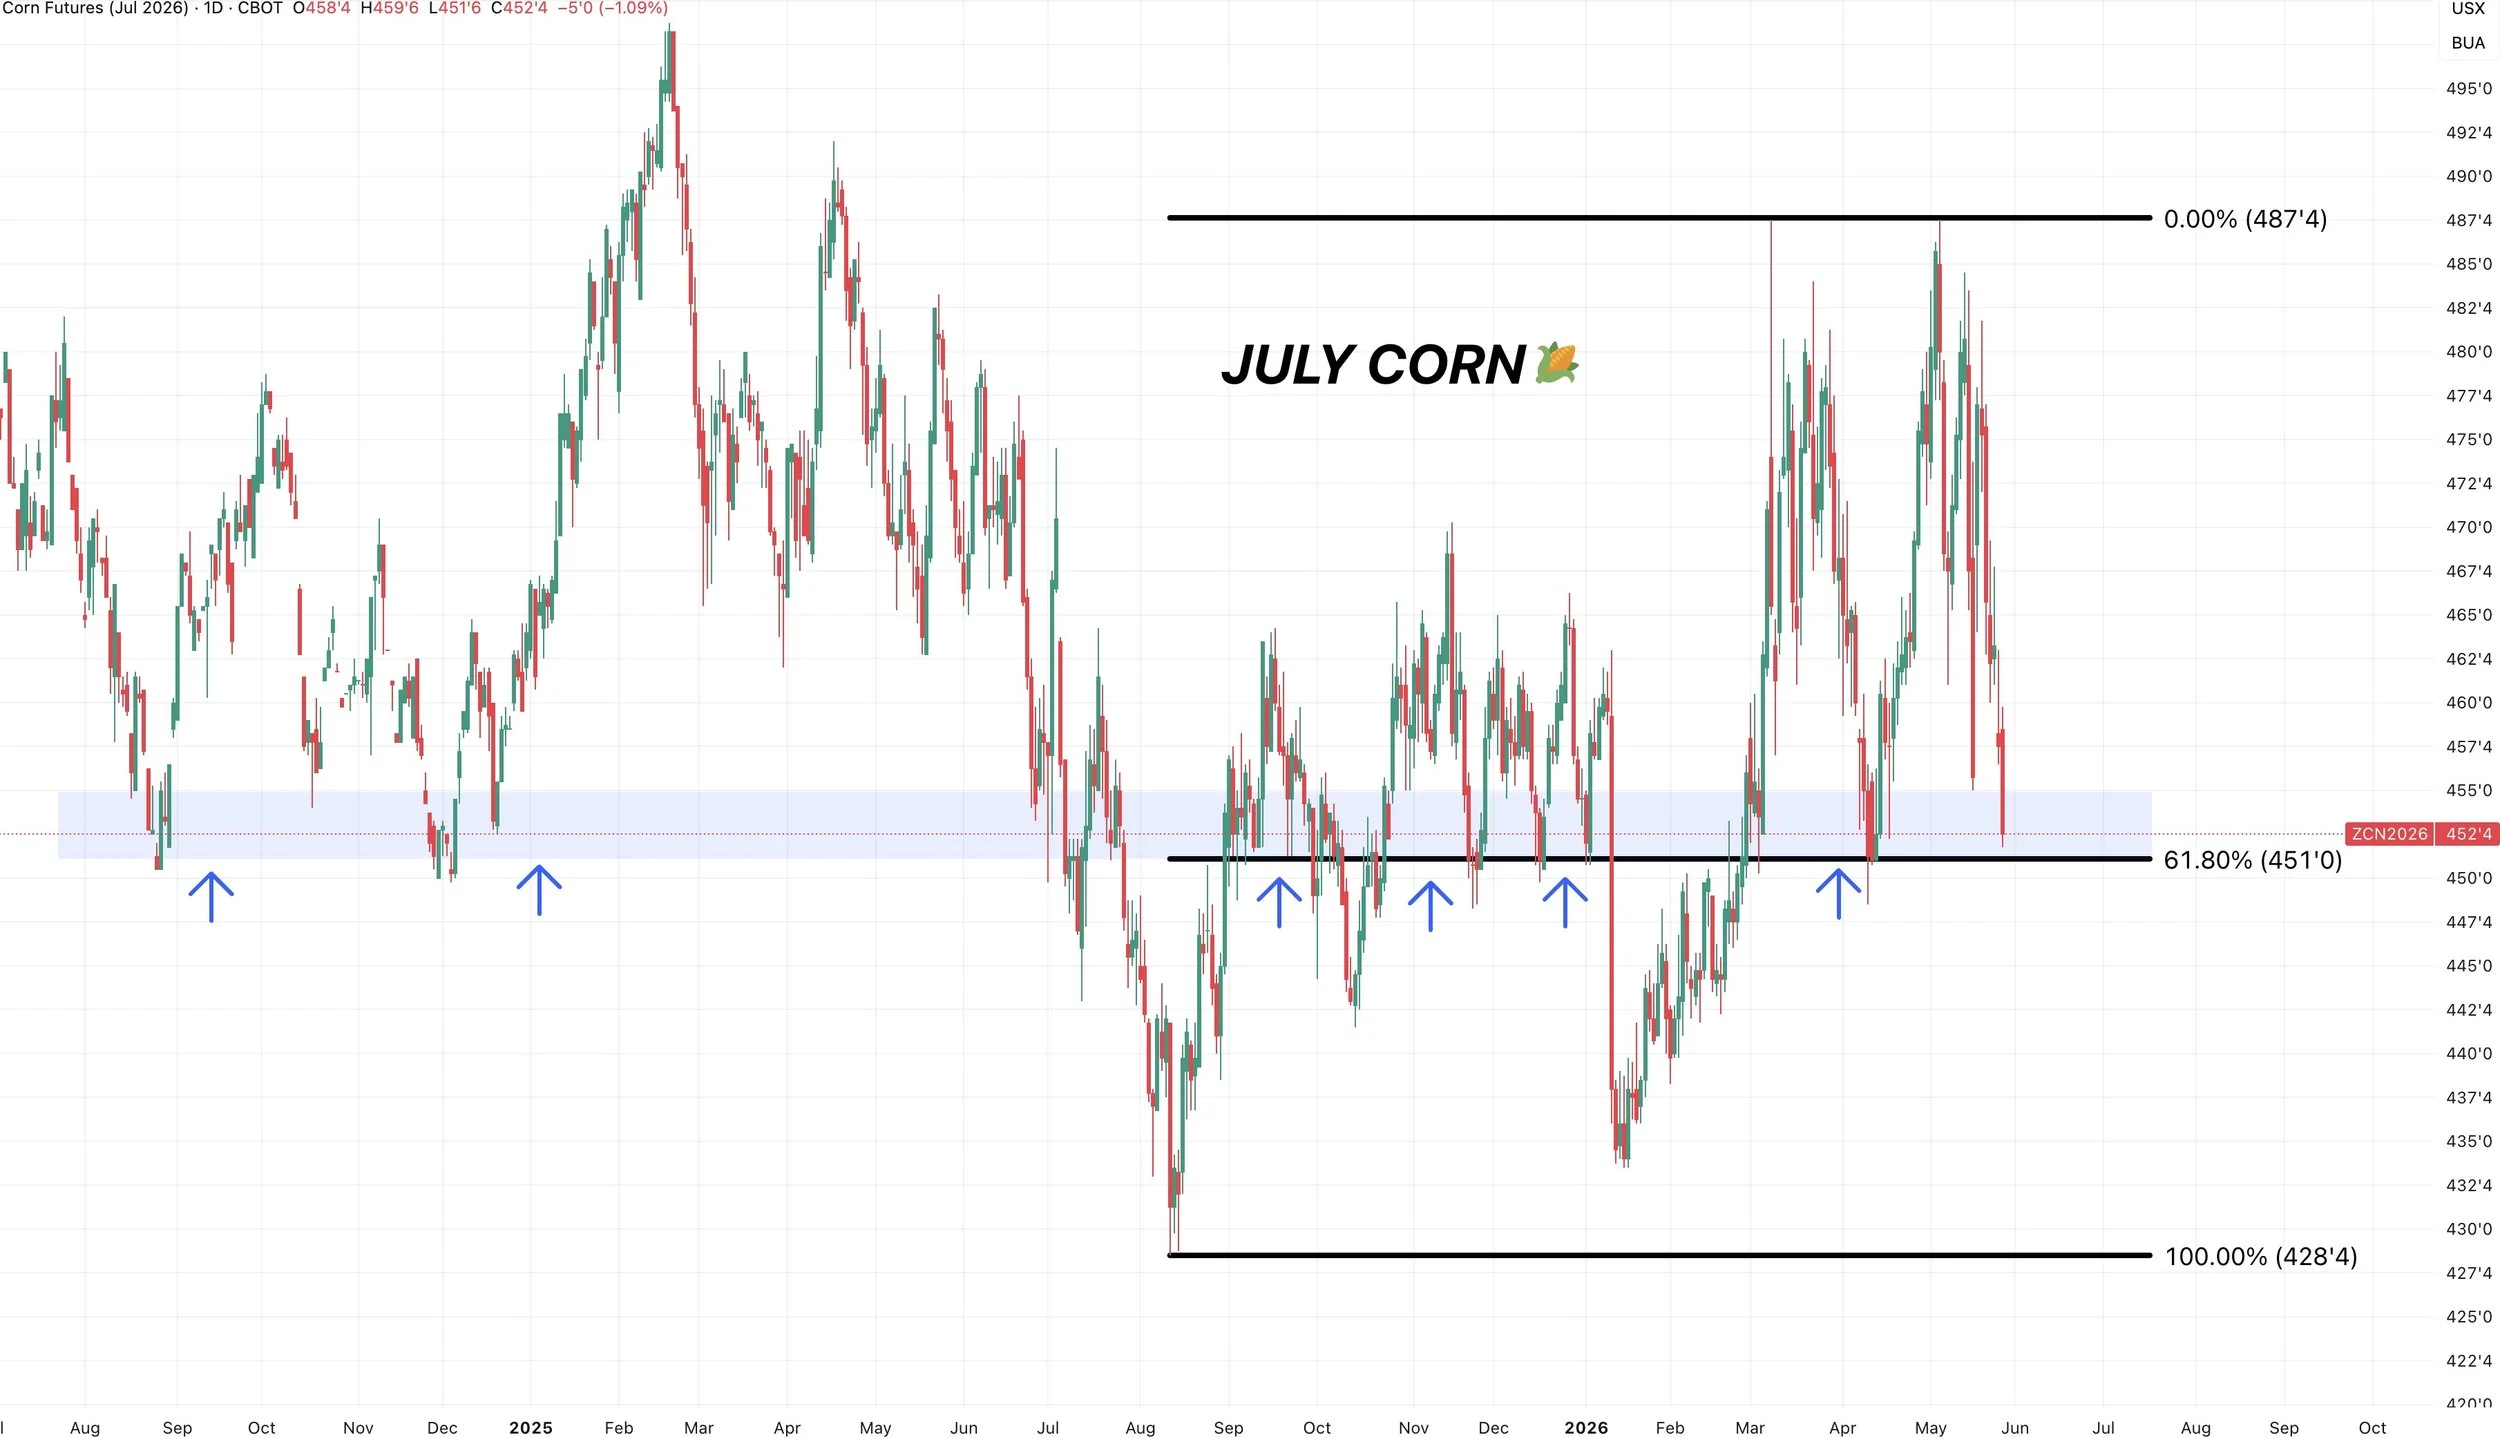
Here is a more zoomed out look to add even more perspective.
Must hold level.
Front Month Corn Chart:
Take a look at the front month chart.
We've been in a clear upward channel since those harvest lows back in August.
We're currently sitting right at the bottom of the channel.
So again, you once again know where you are wrong.
If we start to break below $4.50 and this below this channel, it could very well be a sign that we are setting up that for that usual seasonal sell off.
But if we are going to bounce at all, this would be where we would expect it to happen.
Dec Corn Chart:
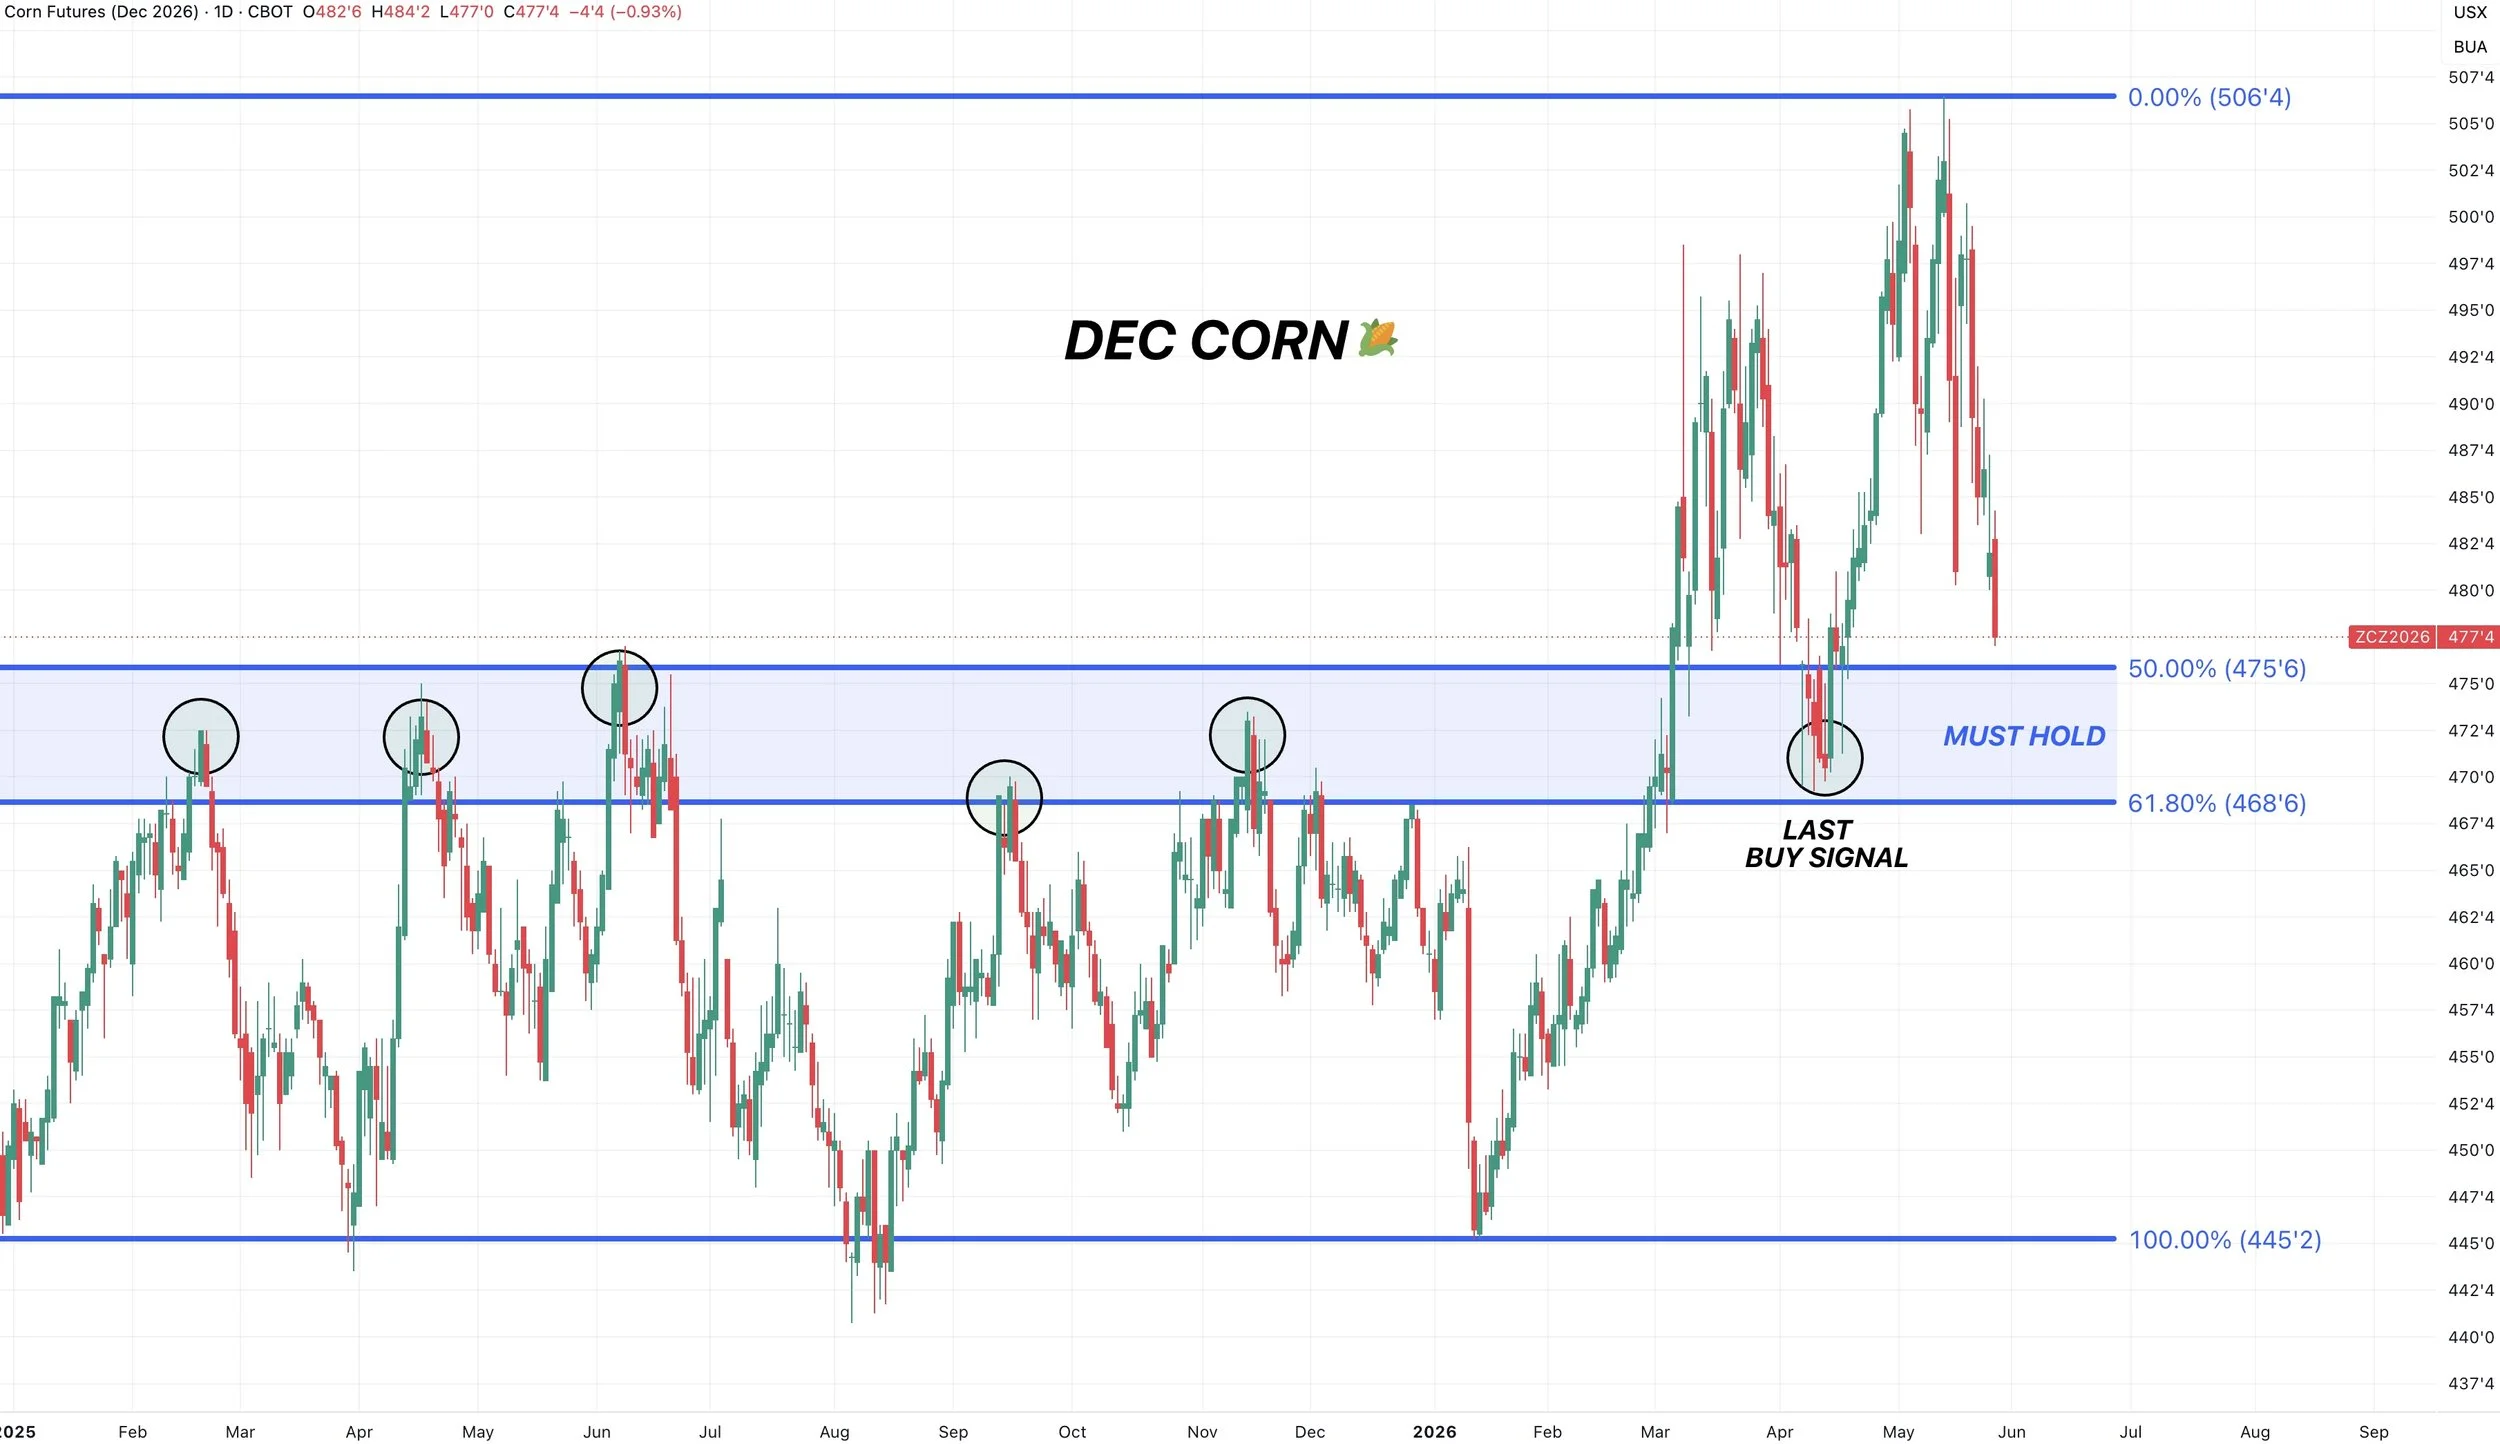
Today's signal was based on the technicals in July rather than Dec, as July is at a make or break spot where as Dec has a little more wiggle room.
We're very close to giving back 50% of the entire rally.
The must hold spot is those April lows. Which also gives back 61.8% of the entire rally.
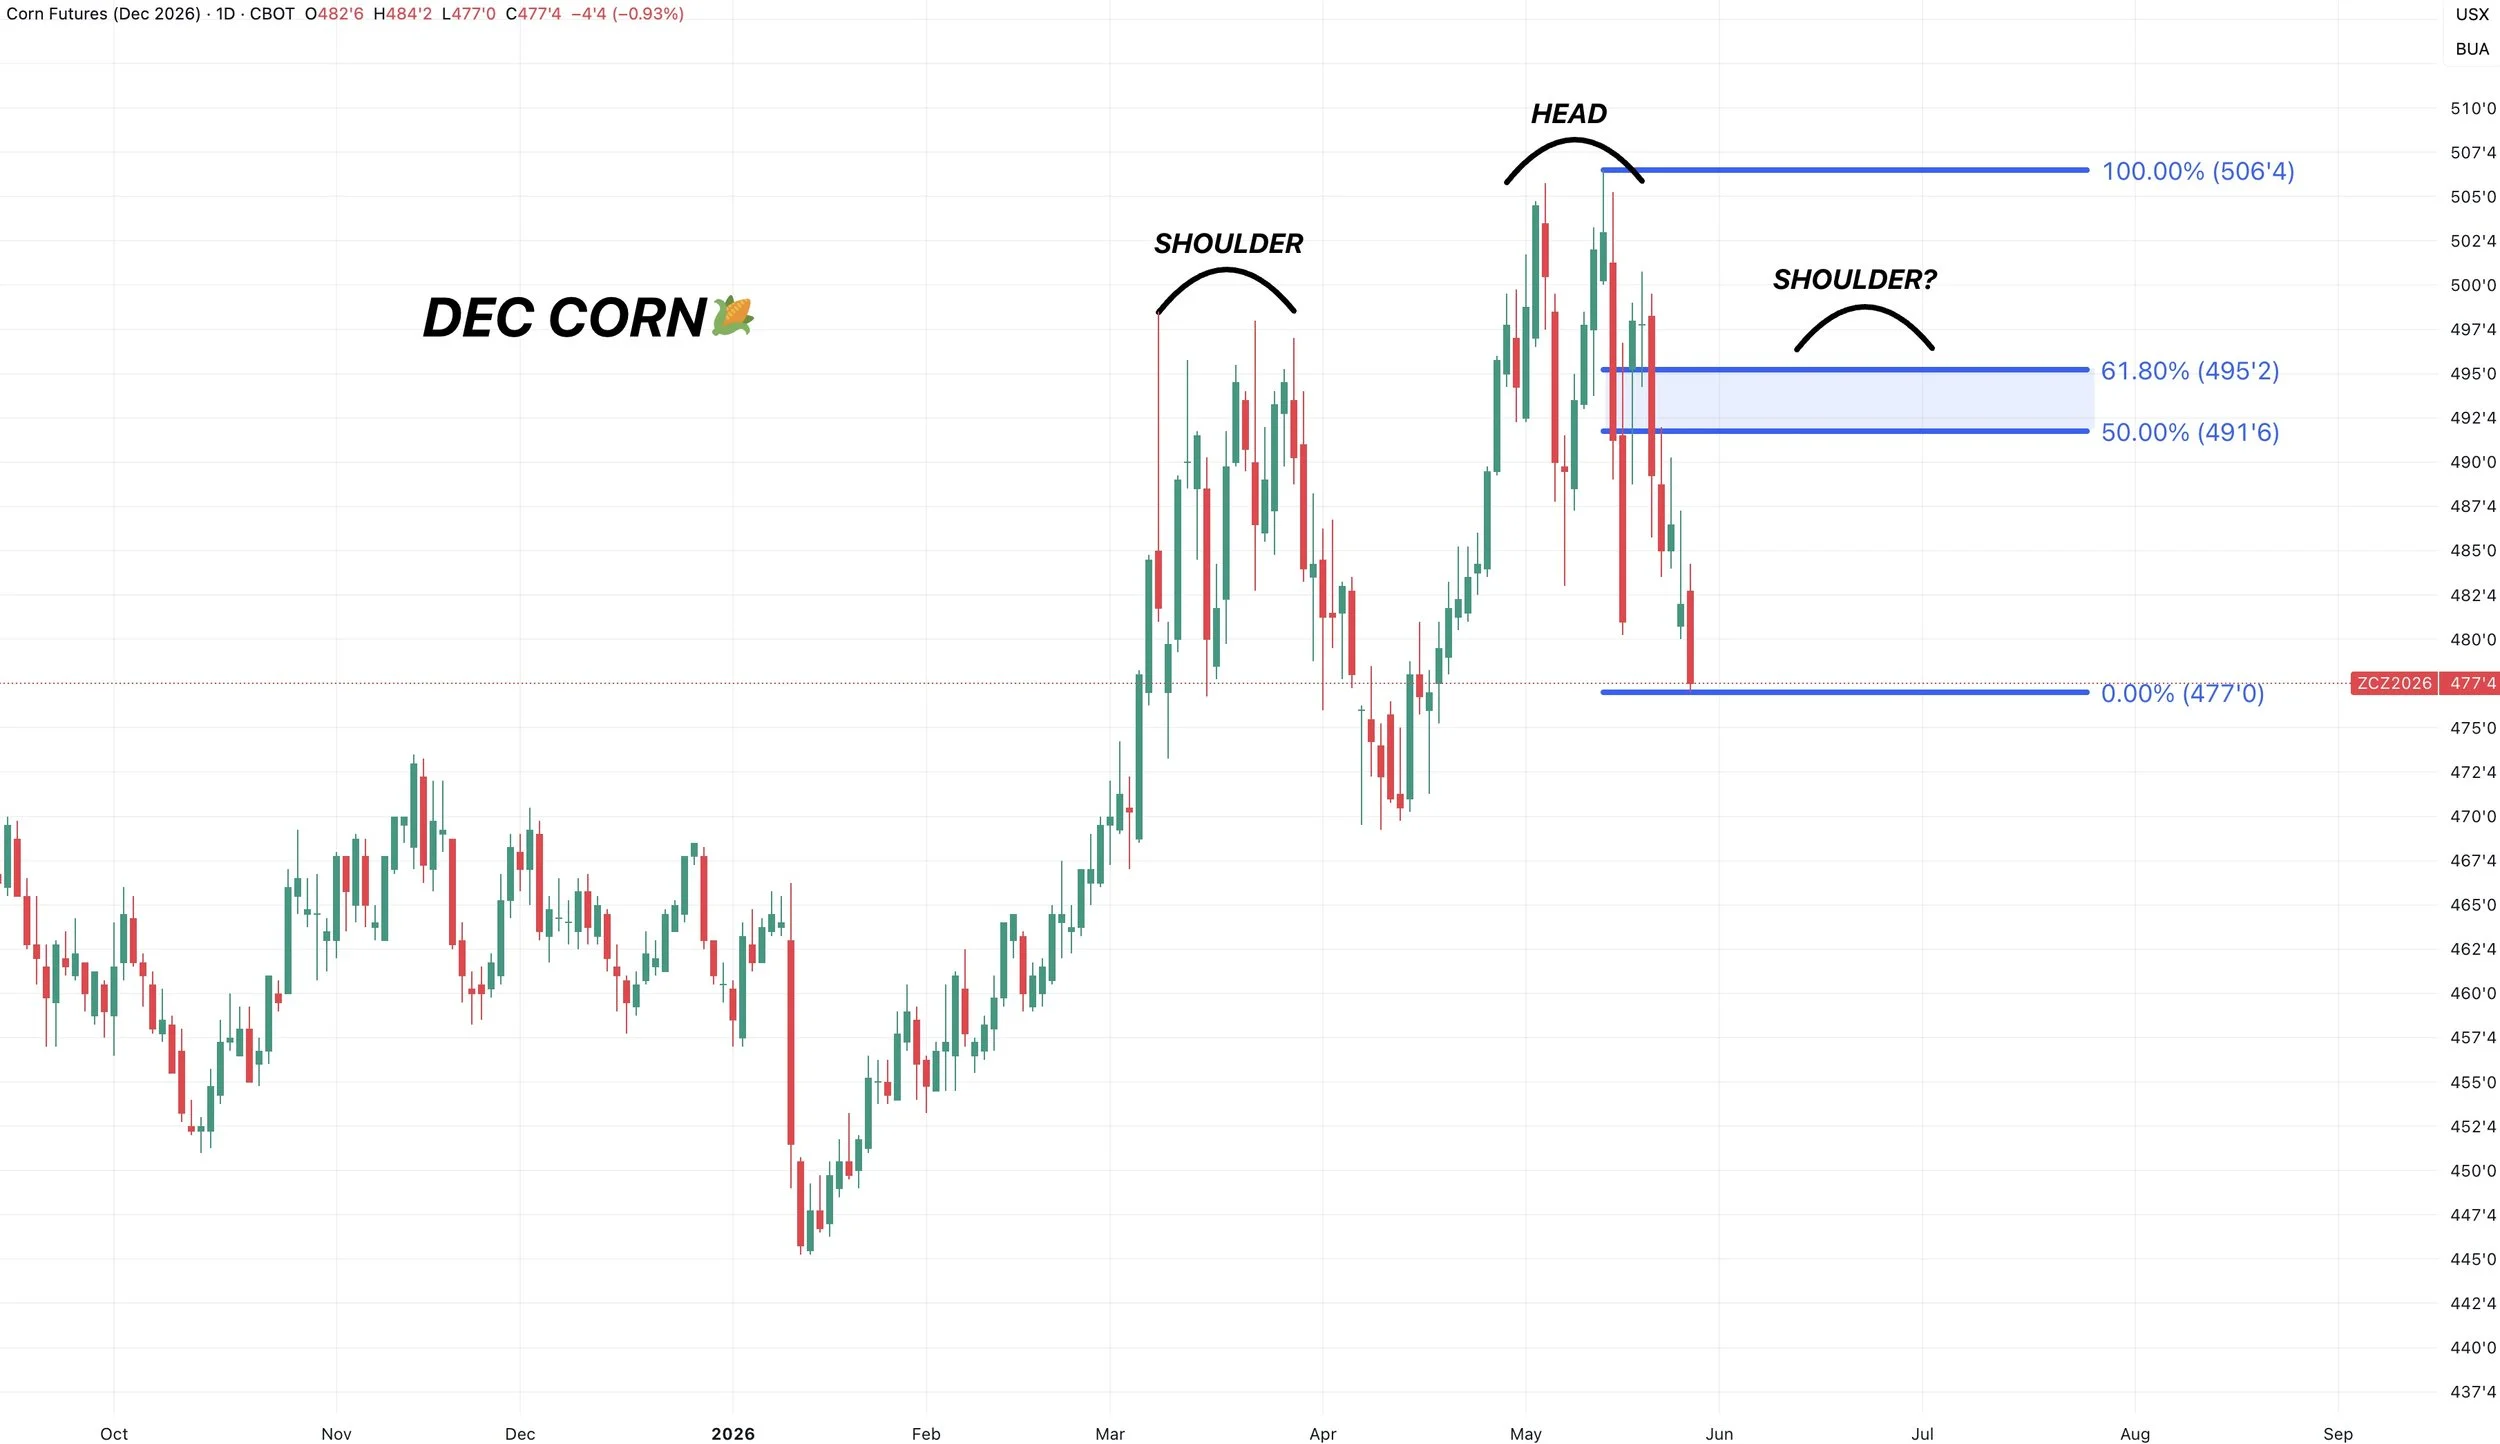
Here is a possible scenario I could see playing out.
I doesn’t have to play out this way, and we don’t have to bounce at all, but I could see us getting one last rally before forming a head and shoulders pattern.
We already have the left shoulder and the head. Just missing the right shoulder.
That shoulder would also line up with clawing back 50% to 61.8 % of the sell off.
Aka the golden zone where relief bounces often fail.
So if this ends up being the local bottom, and we bounce into that level, it'd be an area to reward.
Soybeans
I'd argue that corn and wheat has a more compelling story long term and looking towards next year due to the fertilizer situation.
Along with the idea that I believe soybean acres are going to ultimately end up higher than where the USDA currently has them at.
But that doesn’t mean I'm bearish on soybeans.
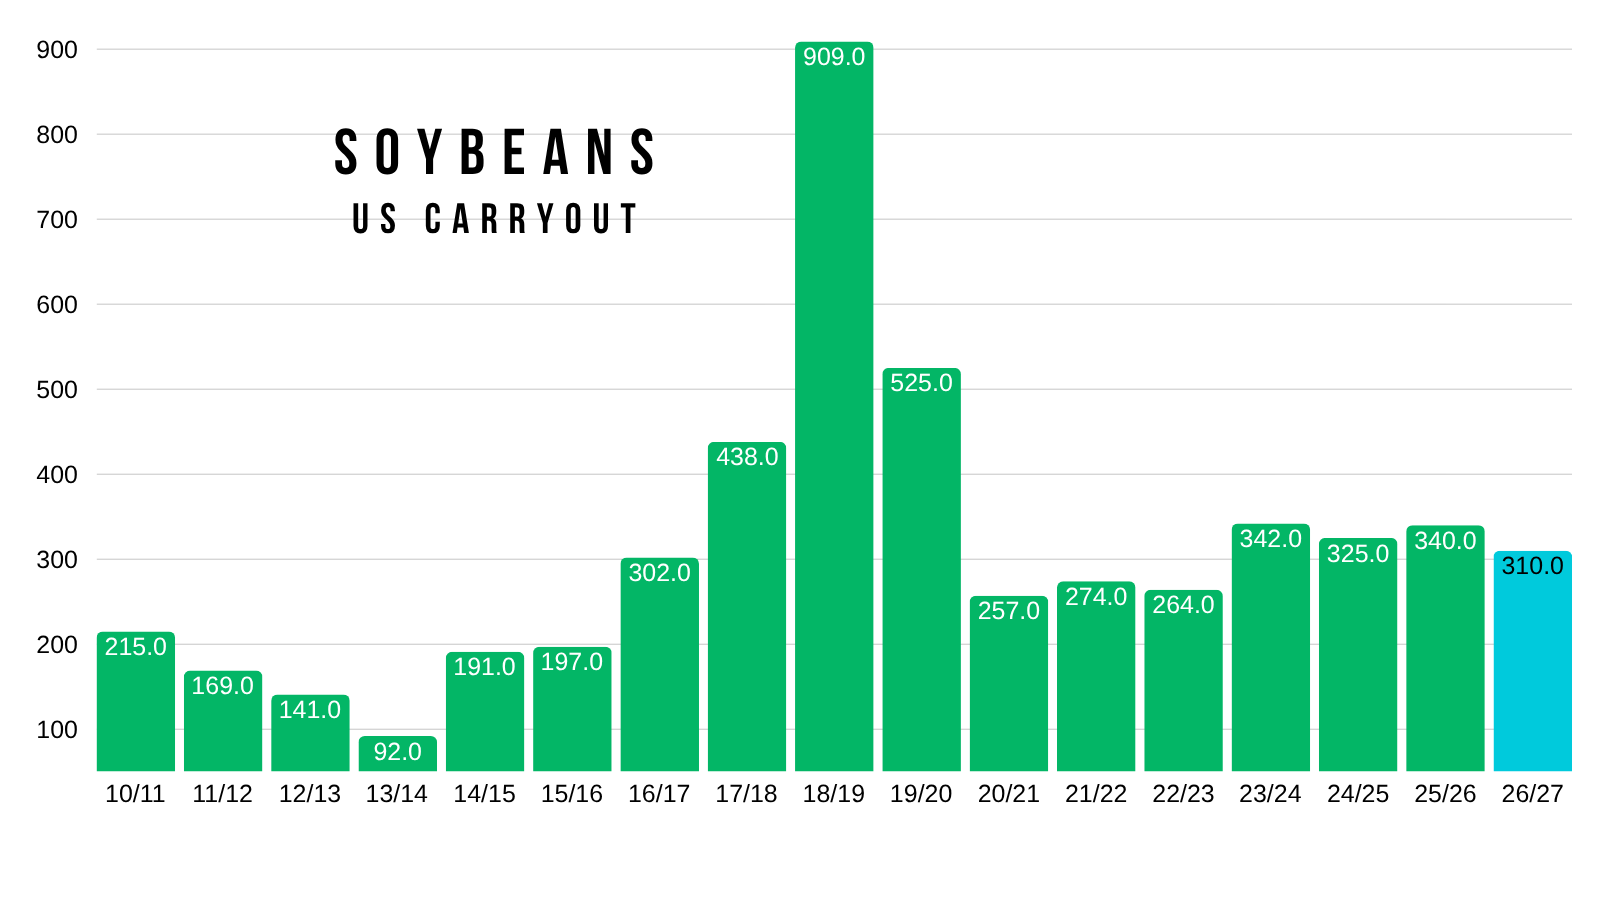
The US balance sheet for new crop still doesn’t have this massive amount of wiggle room.
Let's just say acres are 1 million too low, at the same time, we don’t raise a percent crop and get a 51 bpa yield rather than a 53.
Without touching demand, it still cuts into that carryout pretty heavily.
So the point is, there just isn’t massive room for error if yield is less than 53.
I am not saying it has to happen, but that's your possible path for a tighter situation in soybeans.
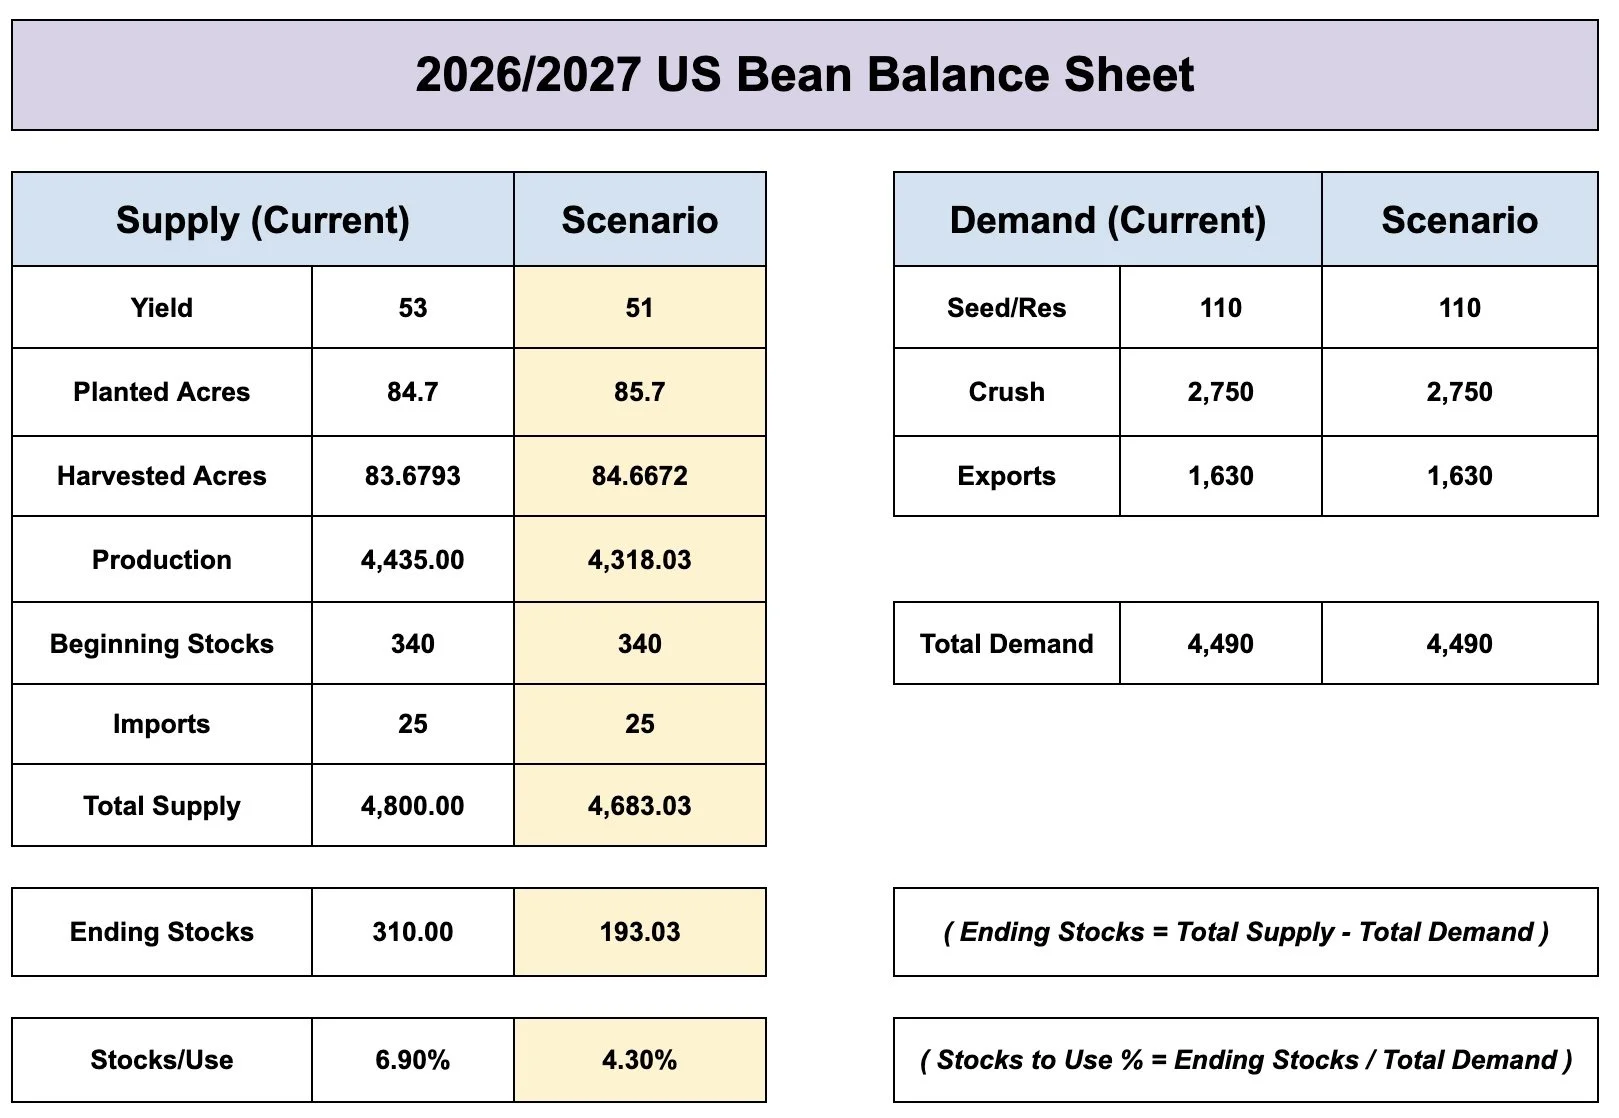
The USDA is already starting with a relatively tighter balance sheet for new crop to begin with.
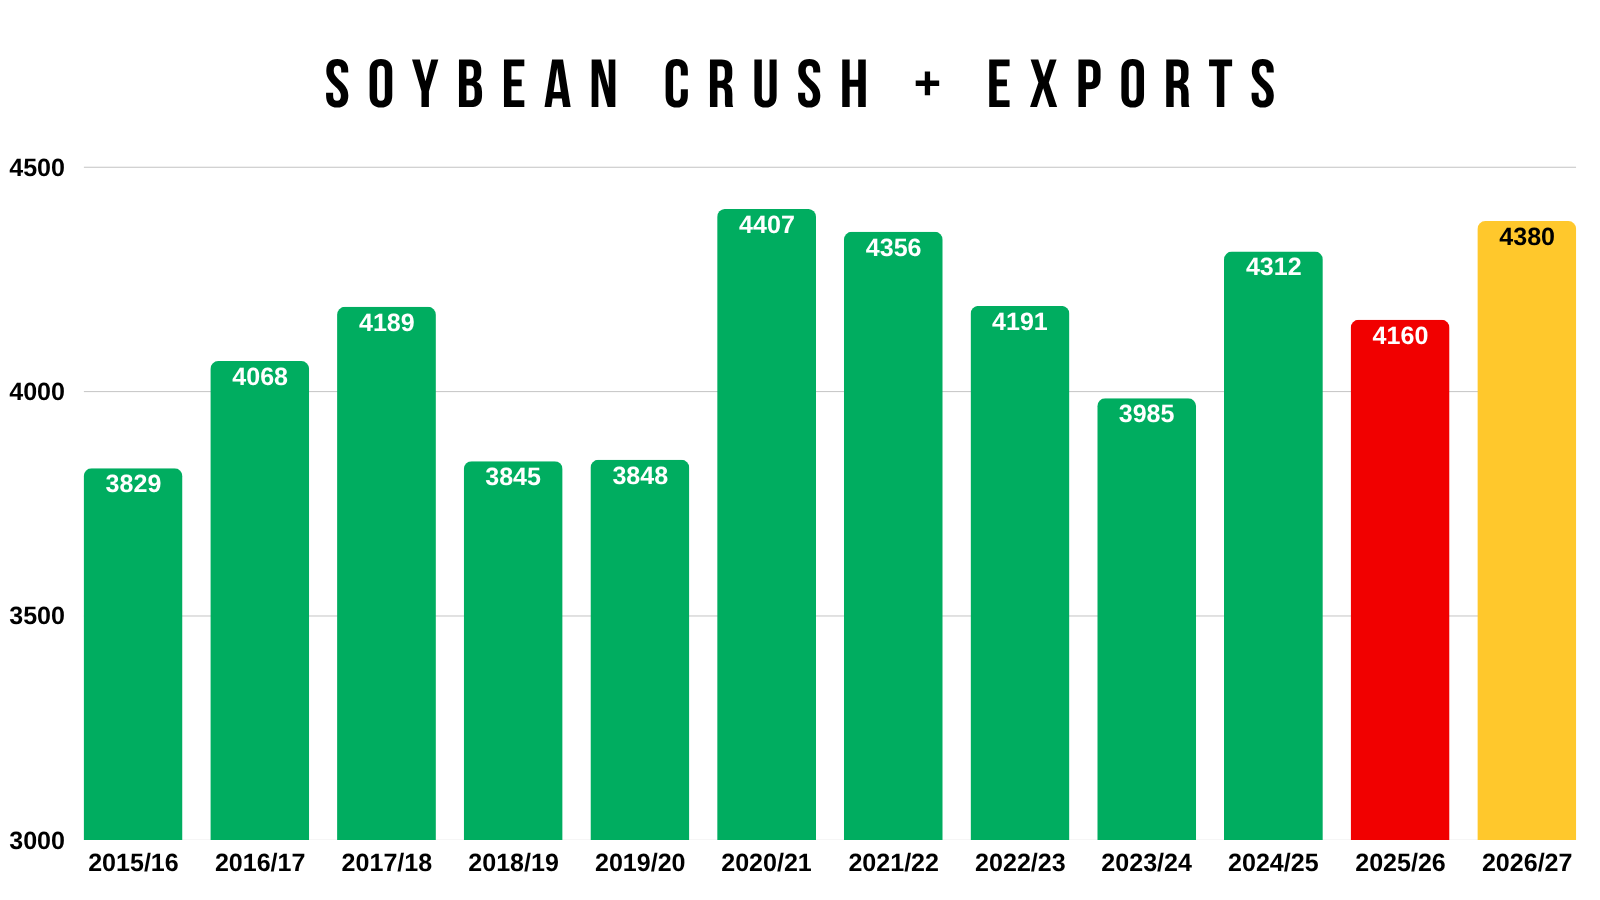
Bears argue that exports suck, which is true.
But the record crush demand is carrying soybean demand.
If you combine both our crush and our export demand, we're actually about on par with the record levels from 2021/22.
So I wouldn’t call overall demand for soybeans bearish.
July Beans Chart:
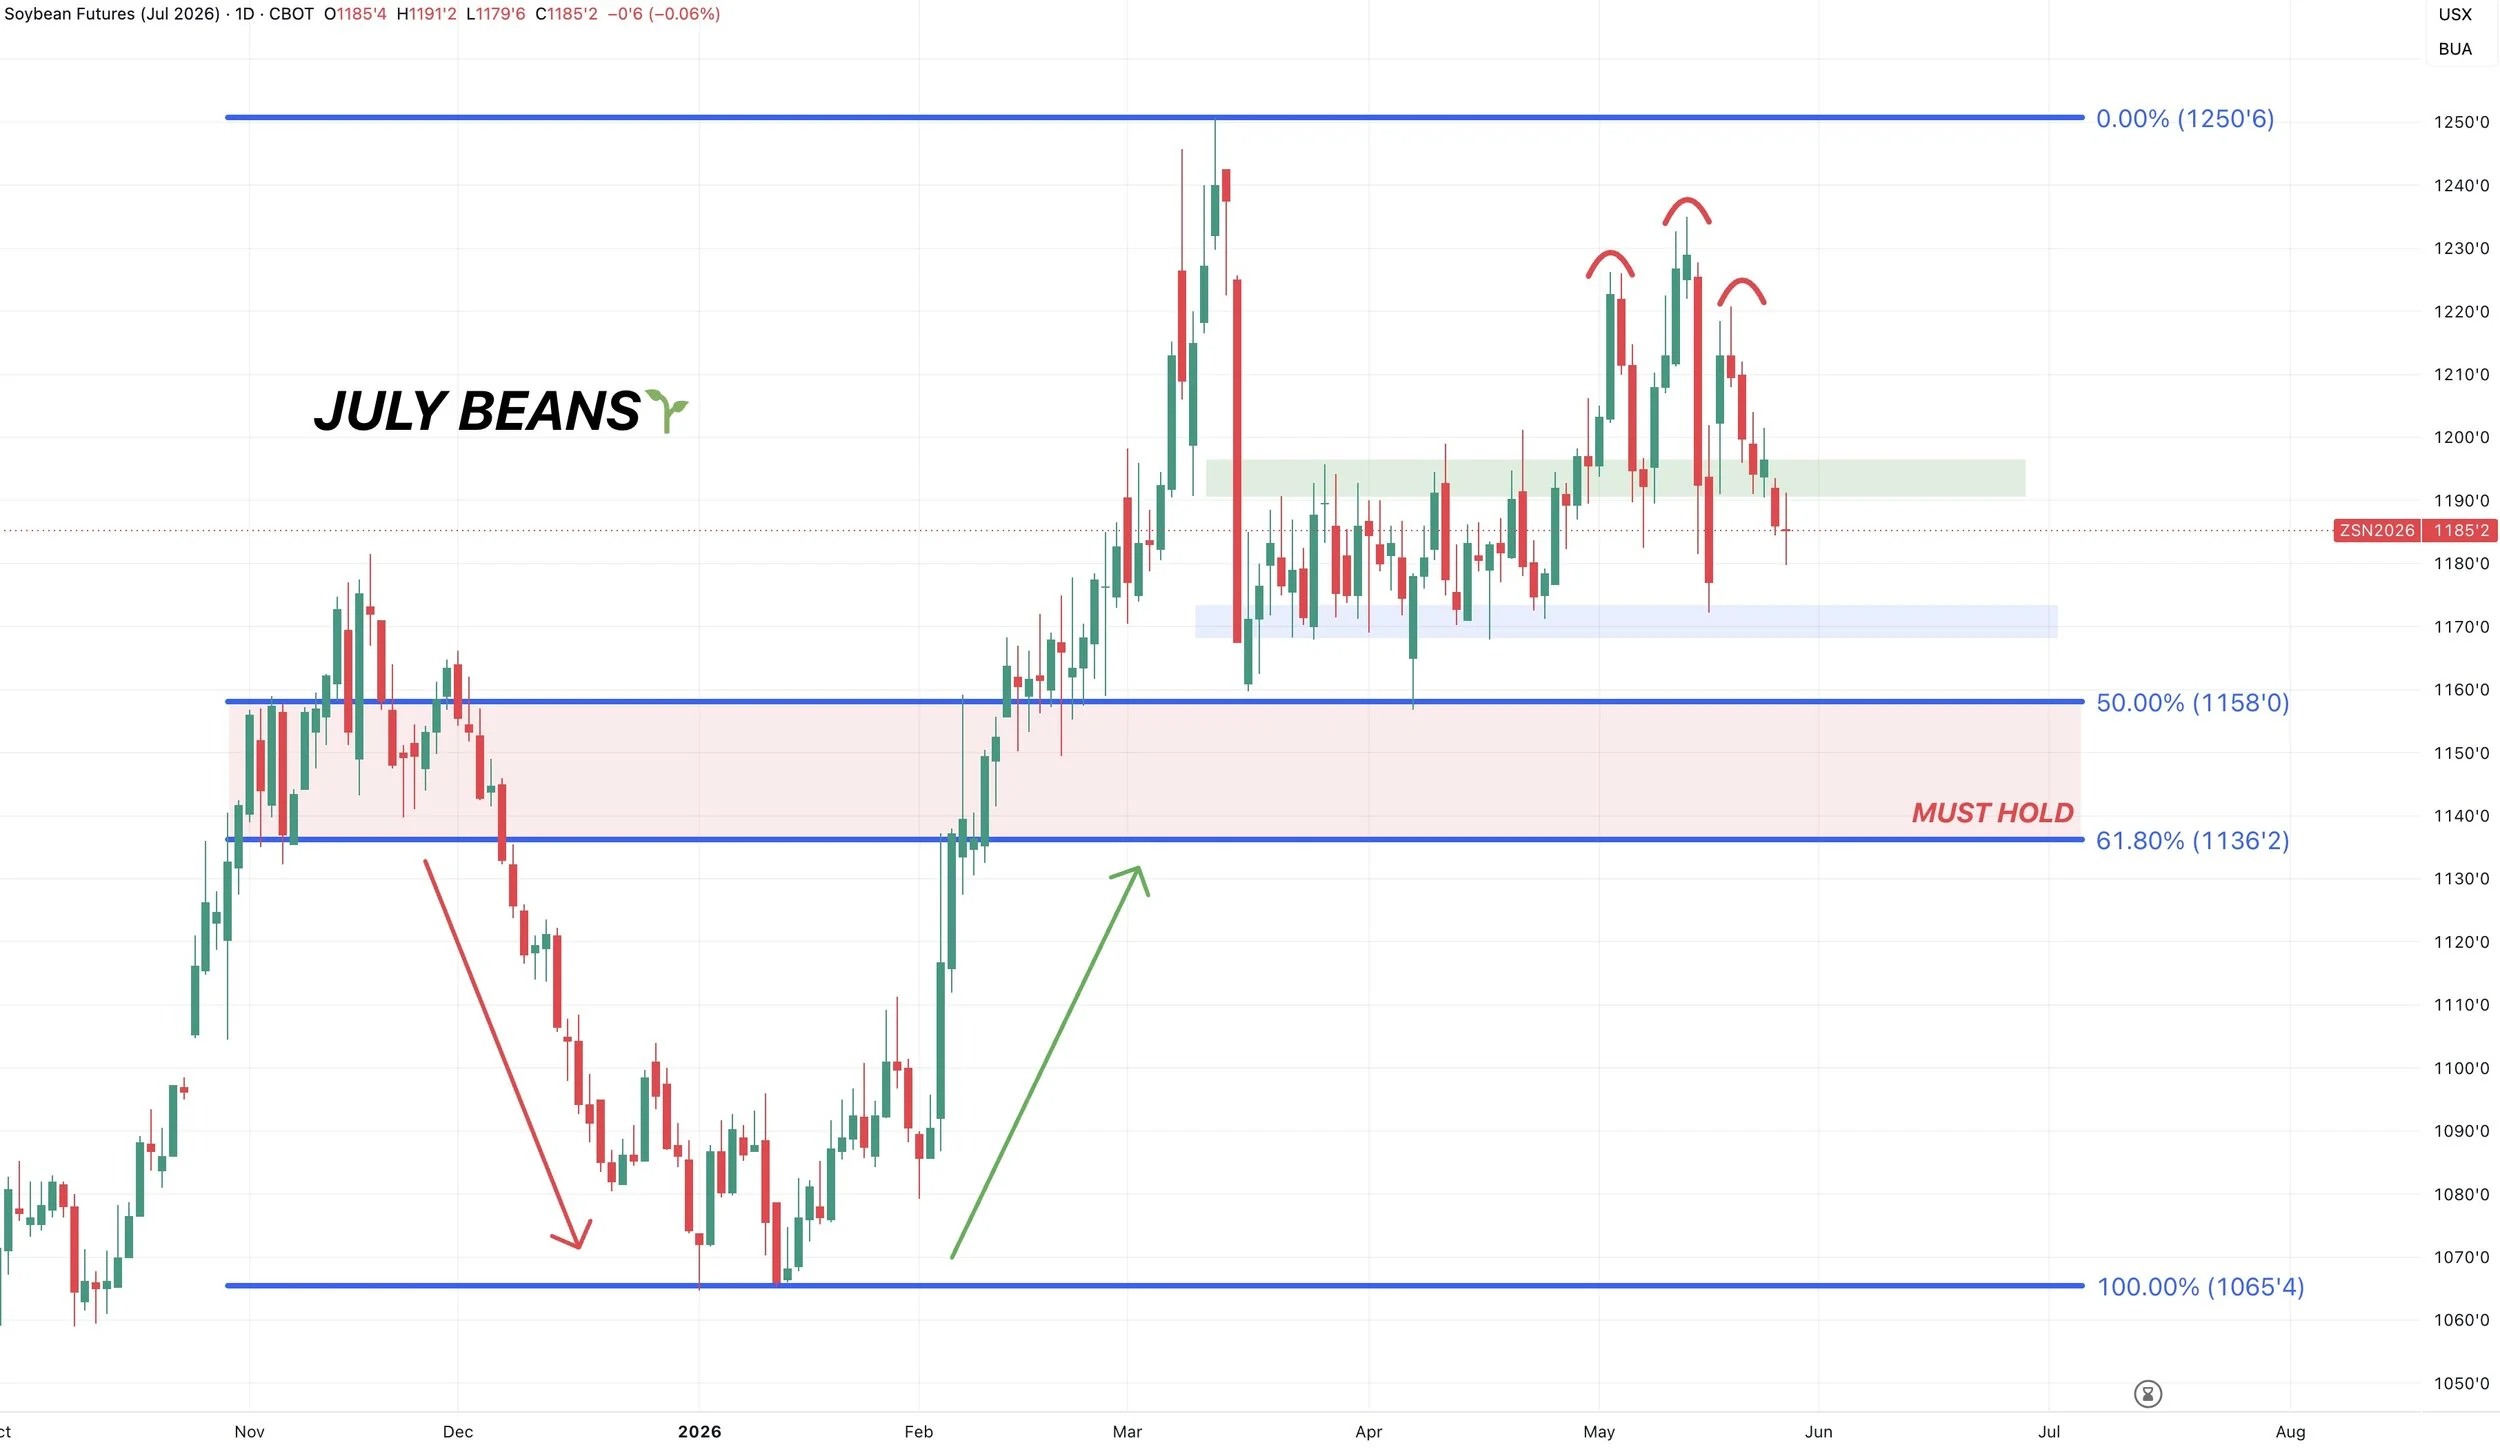
You can talk about fundamentals and balance sheets for days. At the end of the day, the only thing that matters is price action.
Right now, July beans are basically in no mans land.
We failed to turn that old resistance into new support, so we are back in the old range.
If we lose the bottom of the range and that $11.70 level then you'd have to start to get a little nervous, as we could drop down into the red box.
But for the long term trend to remain higher, we need to hold the red box. As there is plenty of air below there.
Front Month Beans Chart:
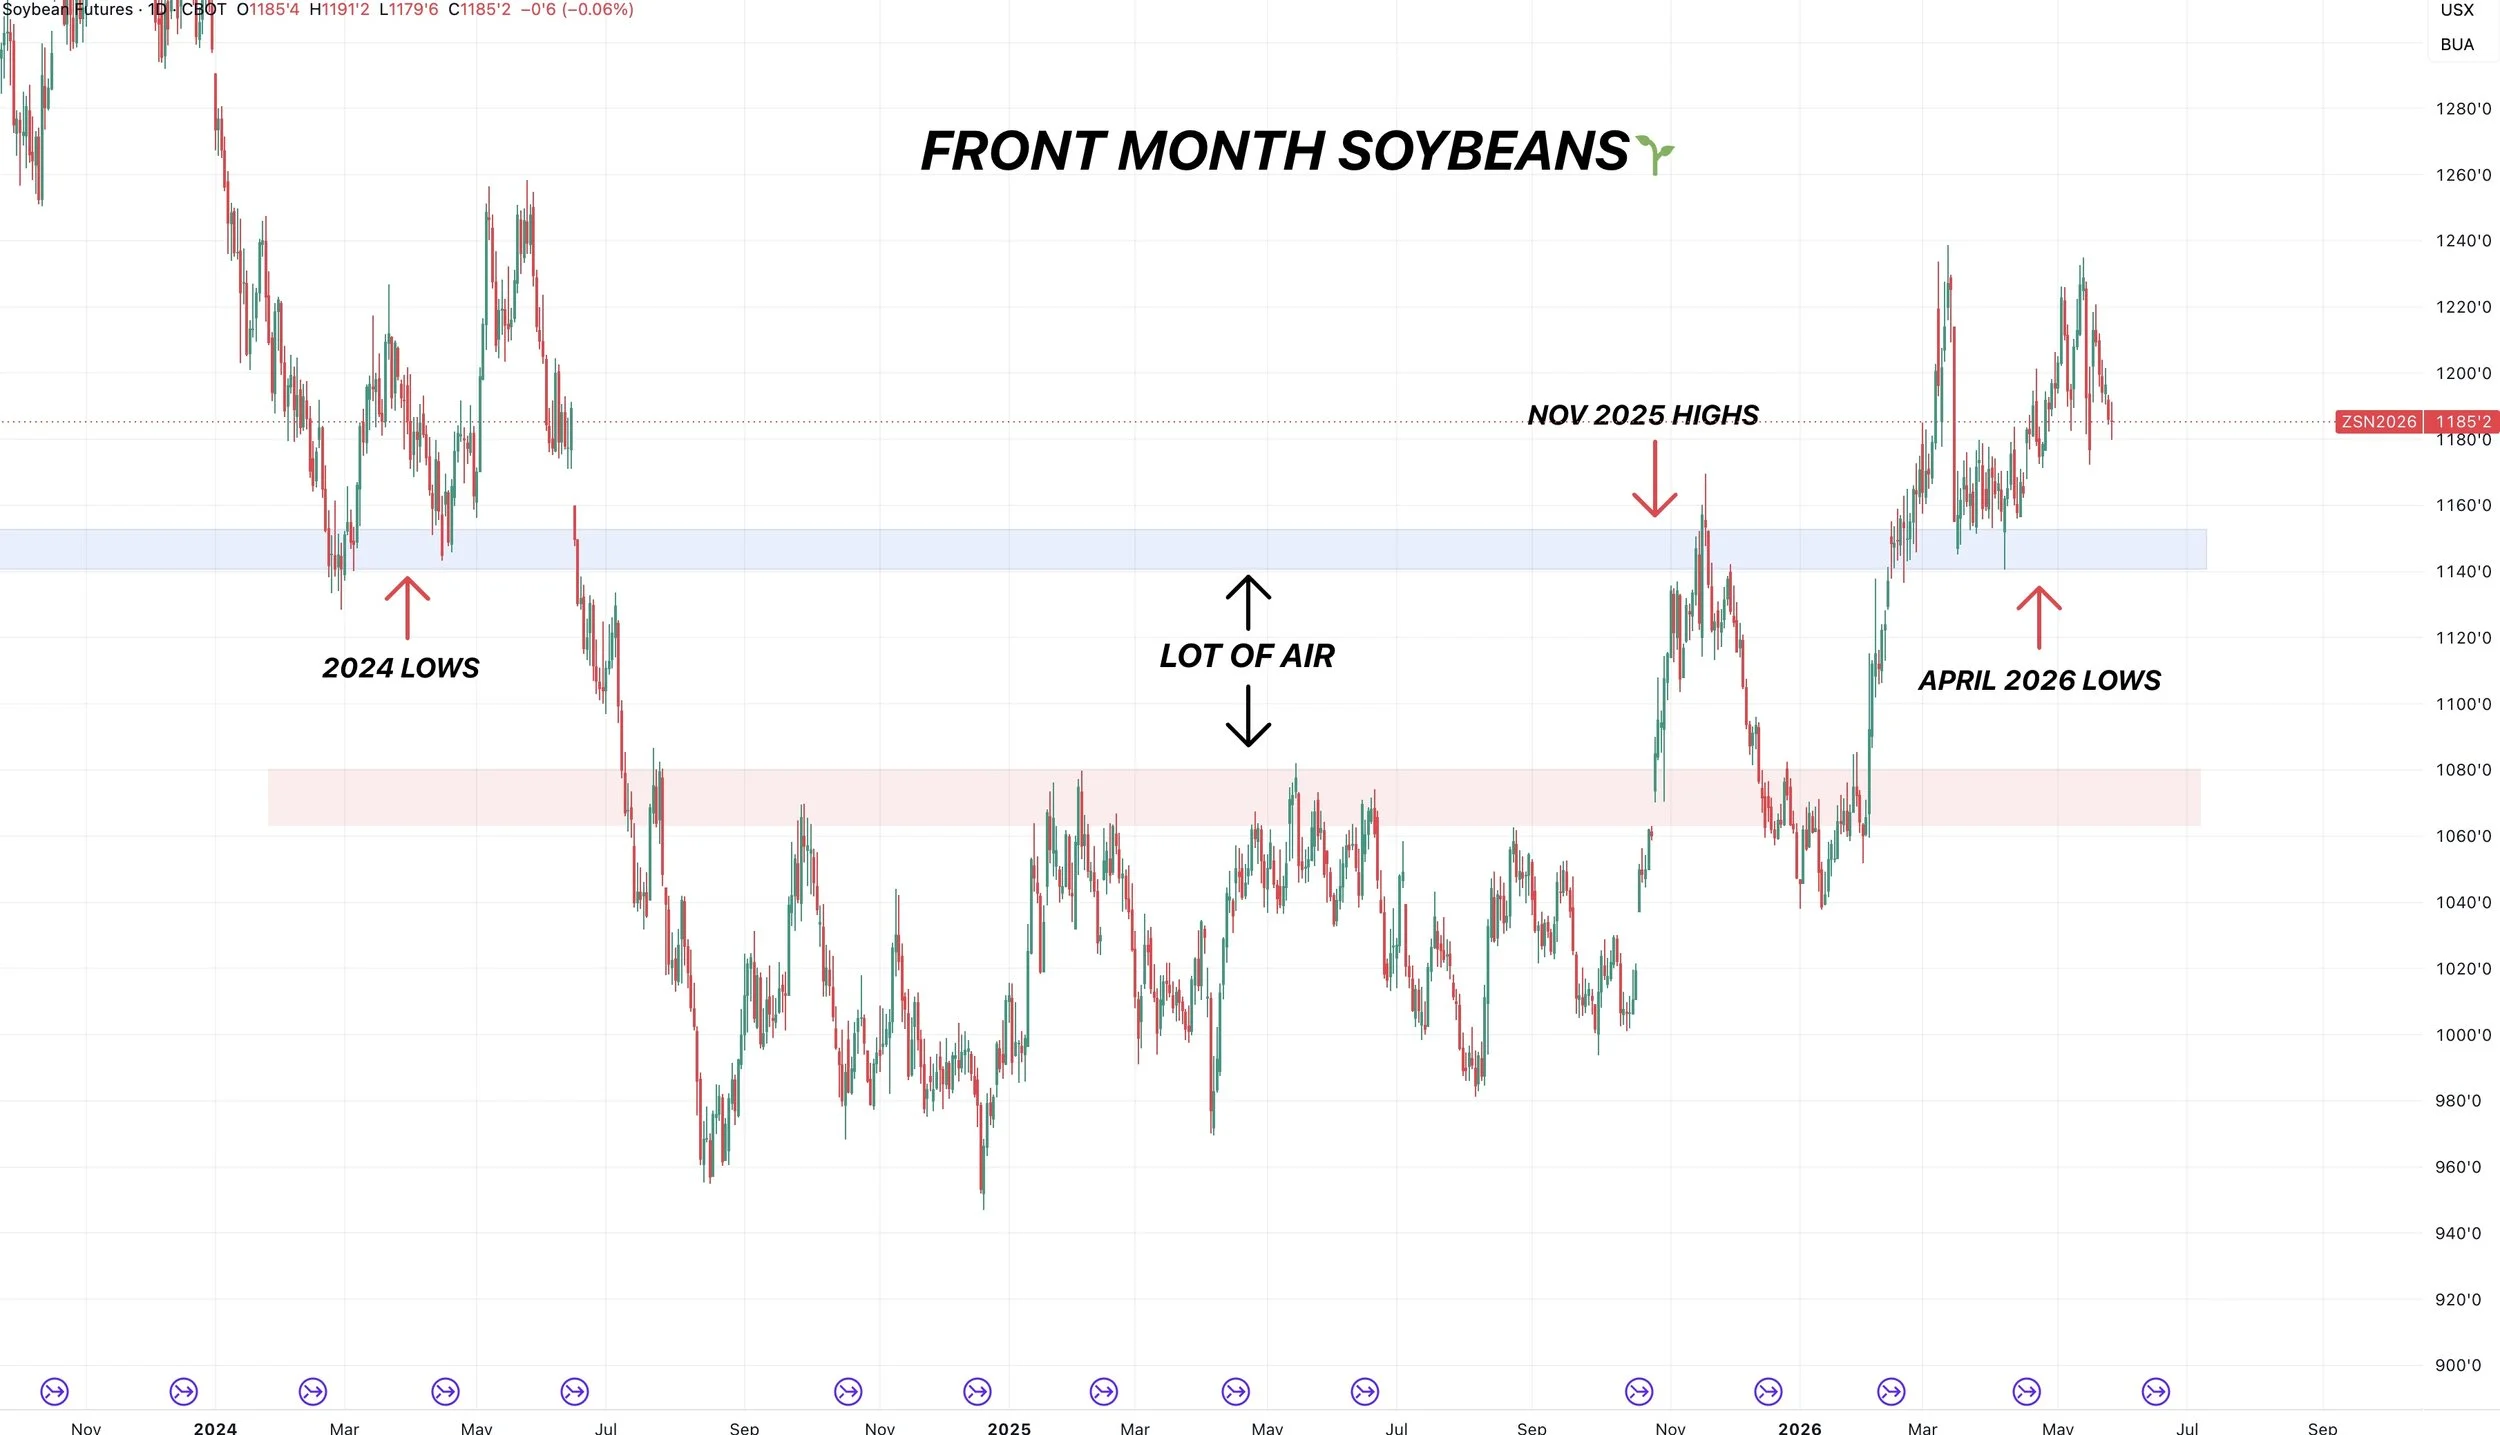
The front month chart tells the exact same story.
Soybeans need to stay above $11.40
As long as you can do that, the long term structure of the chart is not broken.
But if you start to break below that level, you have to watch out. As there is major room to go lower if it breaks.
Nov Beans Chart:
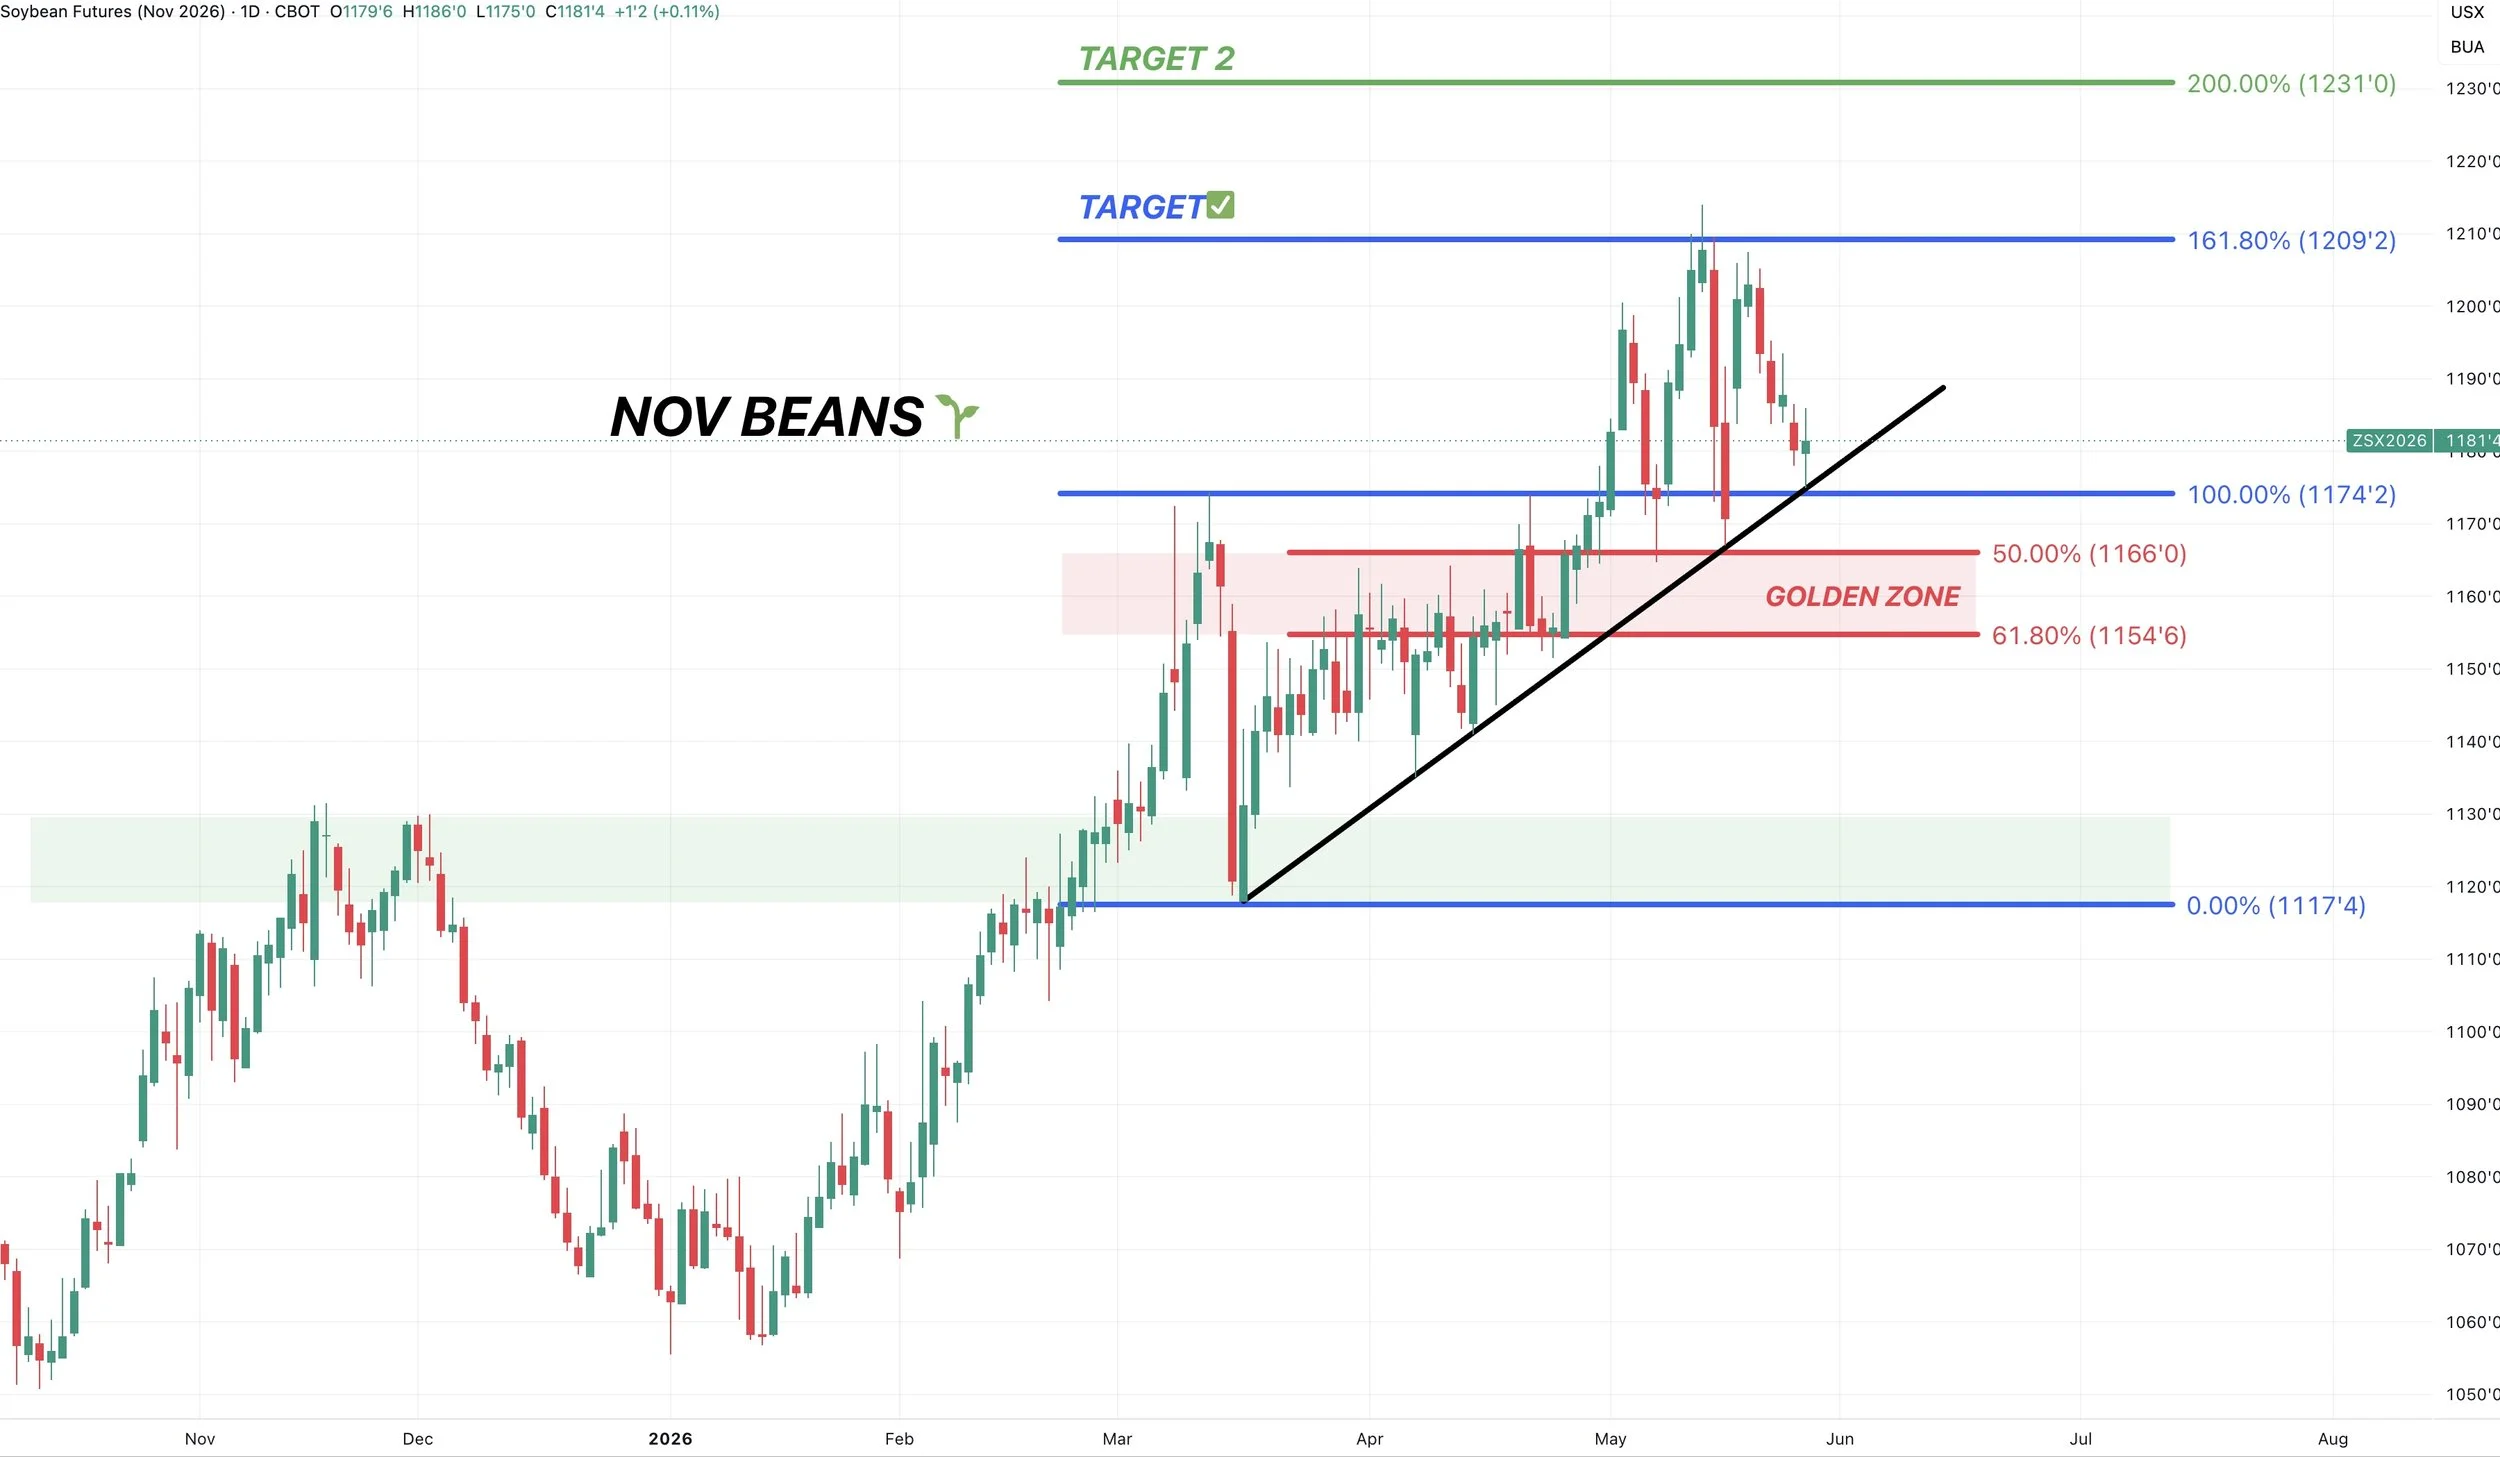
Our last target and sell signal was at $12.09
Nov beans are arguably still the strongest chart in the grains.
Currently, you are still holding some trendline support.
Overall the trend is higher unless you break below $11.55
That gives back 61.8% of the highs down to the lows from March.
If you break below that level, it's probably a warning sign that we've put in some local highs for the time being.
Wheat
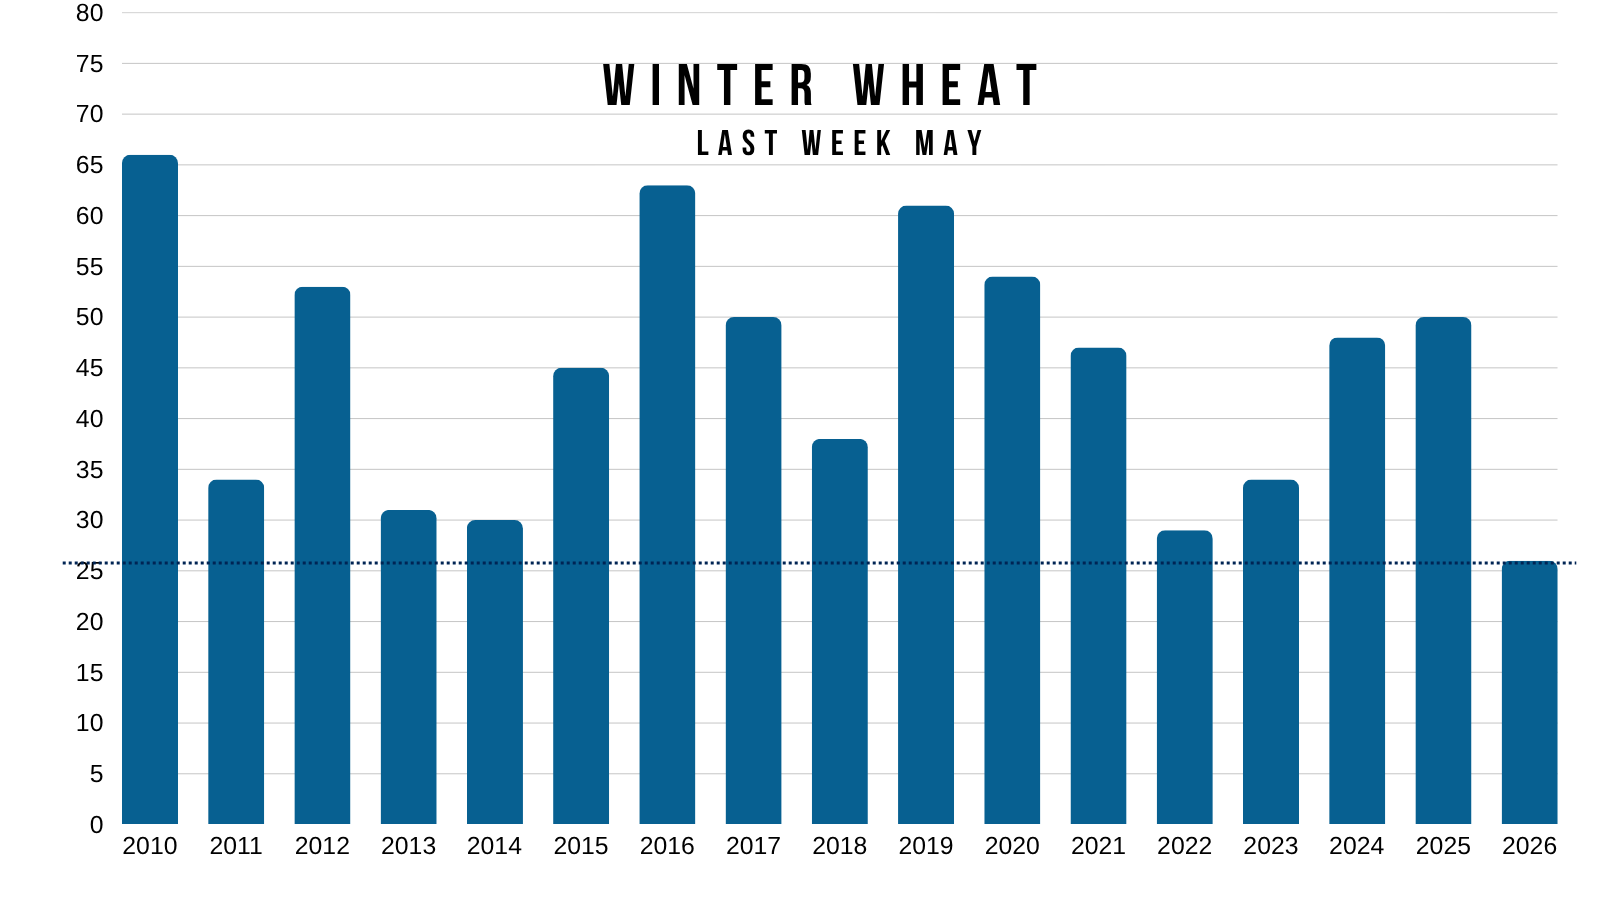
Everyone already knows how bad this winter wheat crop is.
Crop conditions dropped yet again.
Coming in at 26% rated G/E.
The absolute worst on record.
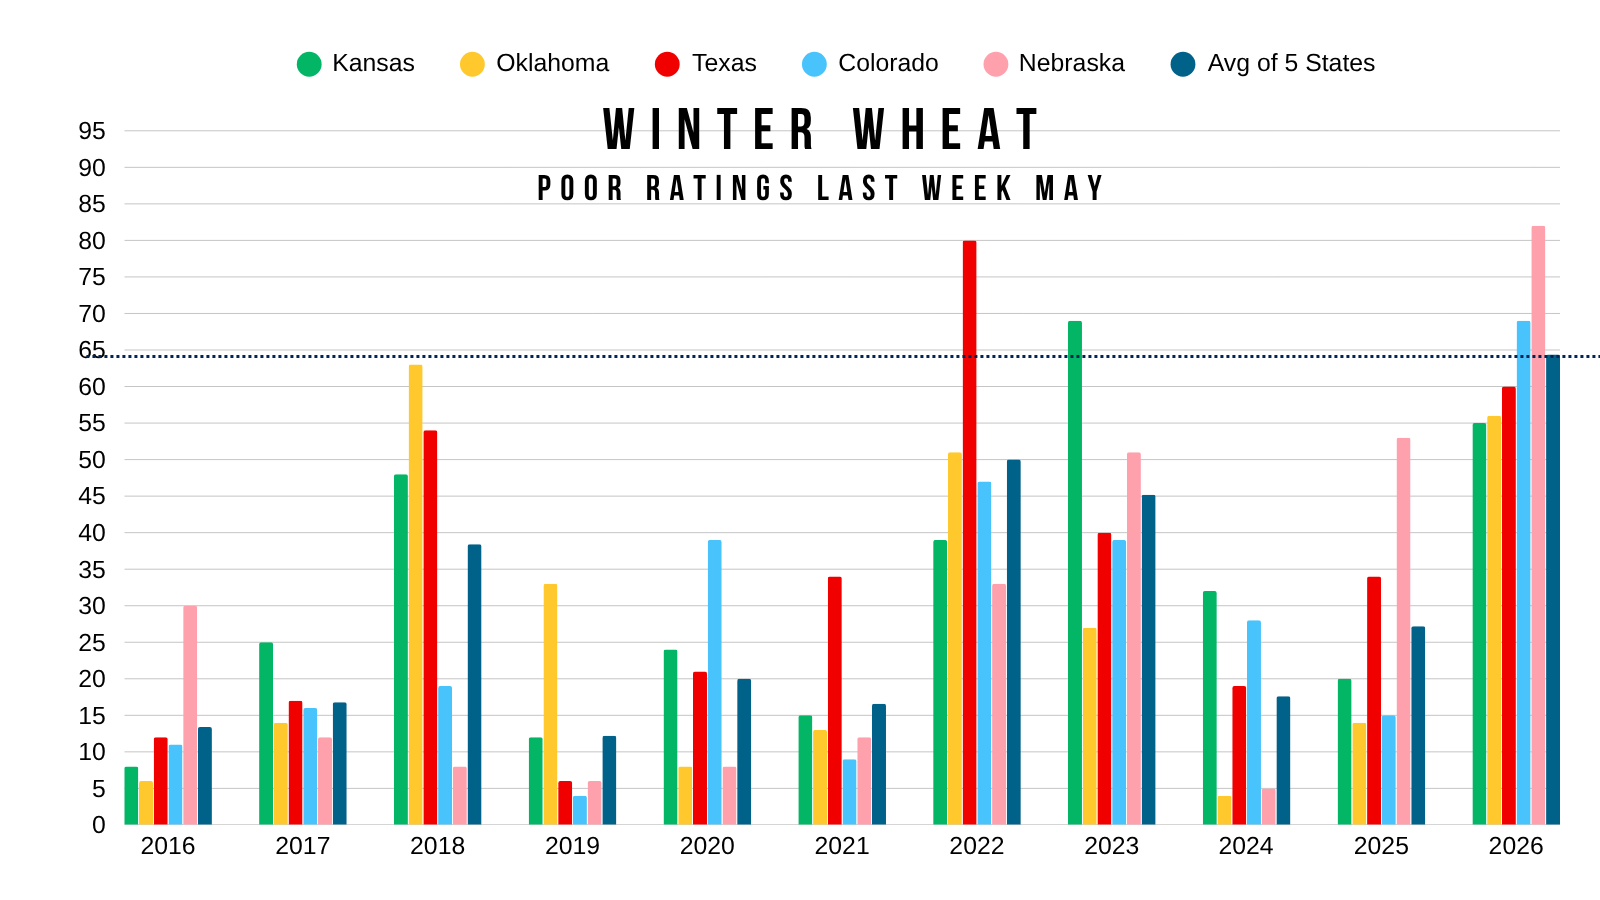
Here is the top 5 HRW states poor to very poor ratings.
By far the worst ever almost 65% poor to very poor. Shattering the next closest with 2022’s 50%.
But the issue is.. again everyone already knows this.
It's largely been priced in.
And seasonally, this is the time of year when wheat starts to see that pressure before carving out a bottom later in the summer.
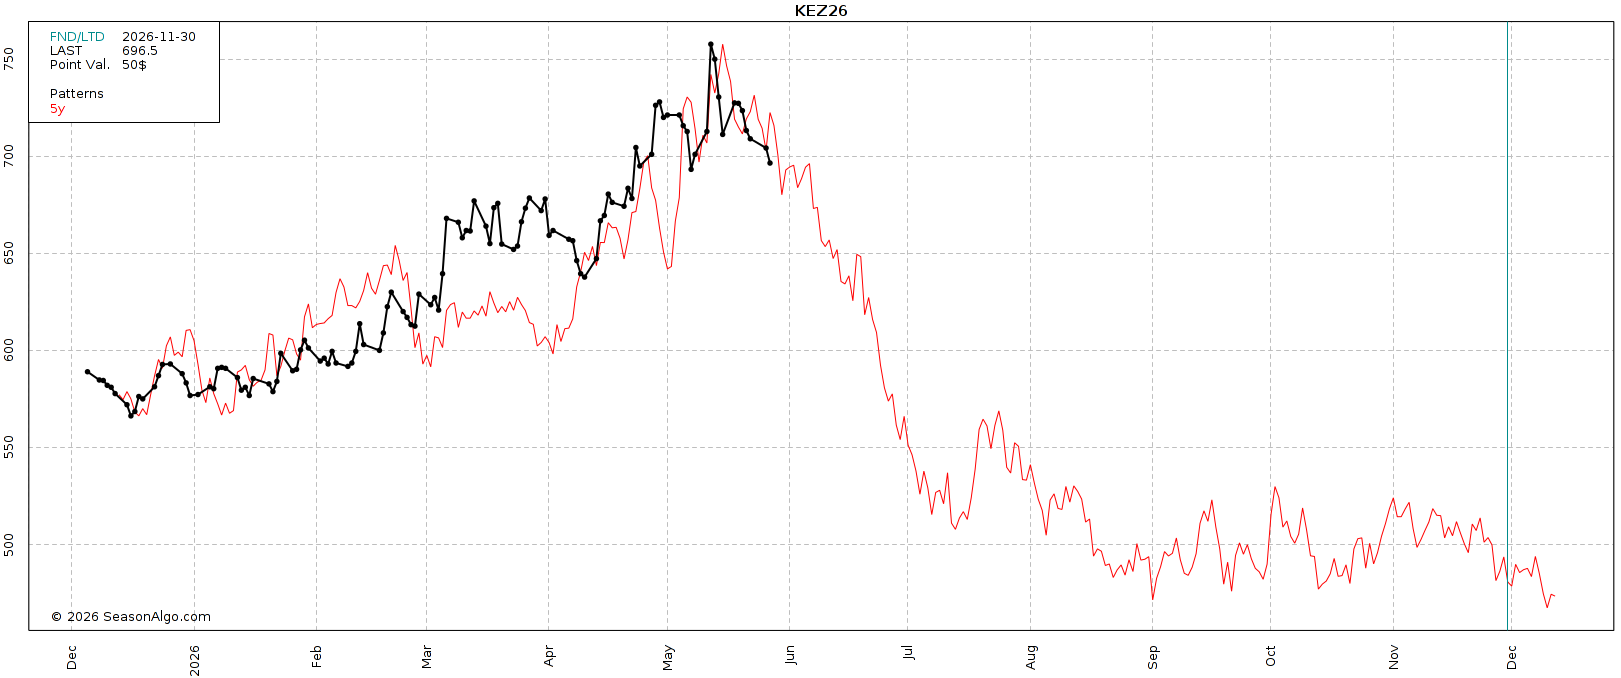
Short term, it looks like we've printed some local highs for the time being.
Long term, just like in corn I think we have a ton of potential.
We have the smallest US wheat crop on record. You got record low acres.
You have the fertilizer situation that's making an impact, we just don’t know how large of an impact it's going to make.
We do know that the USDA is already expecting EVERY major exporter of wheat to produce less wheat than they did last year.
Long term, I'd have to imagine this all leads to a pretty large impact.
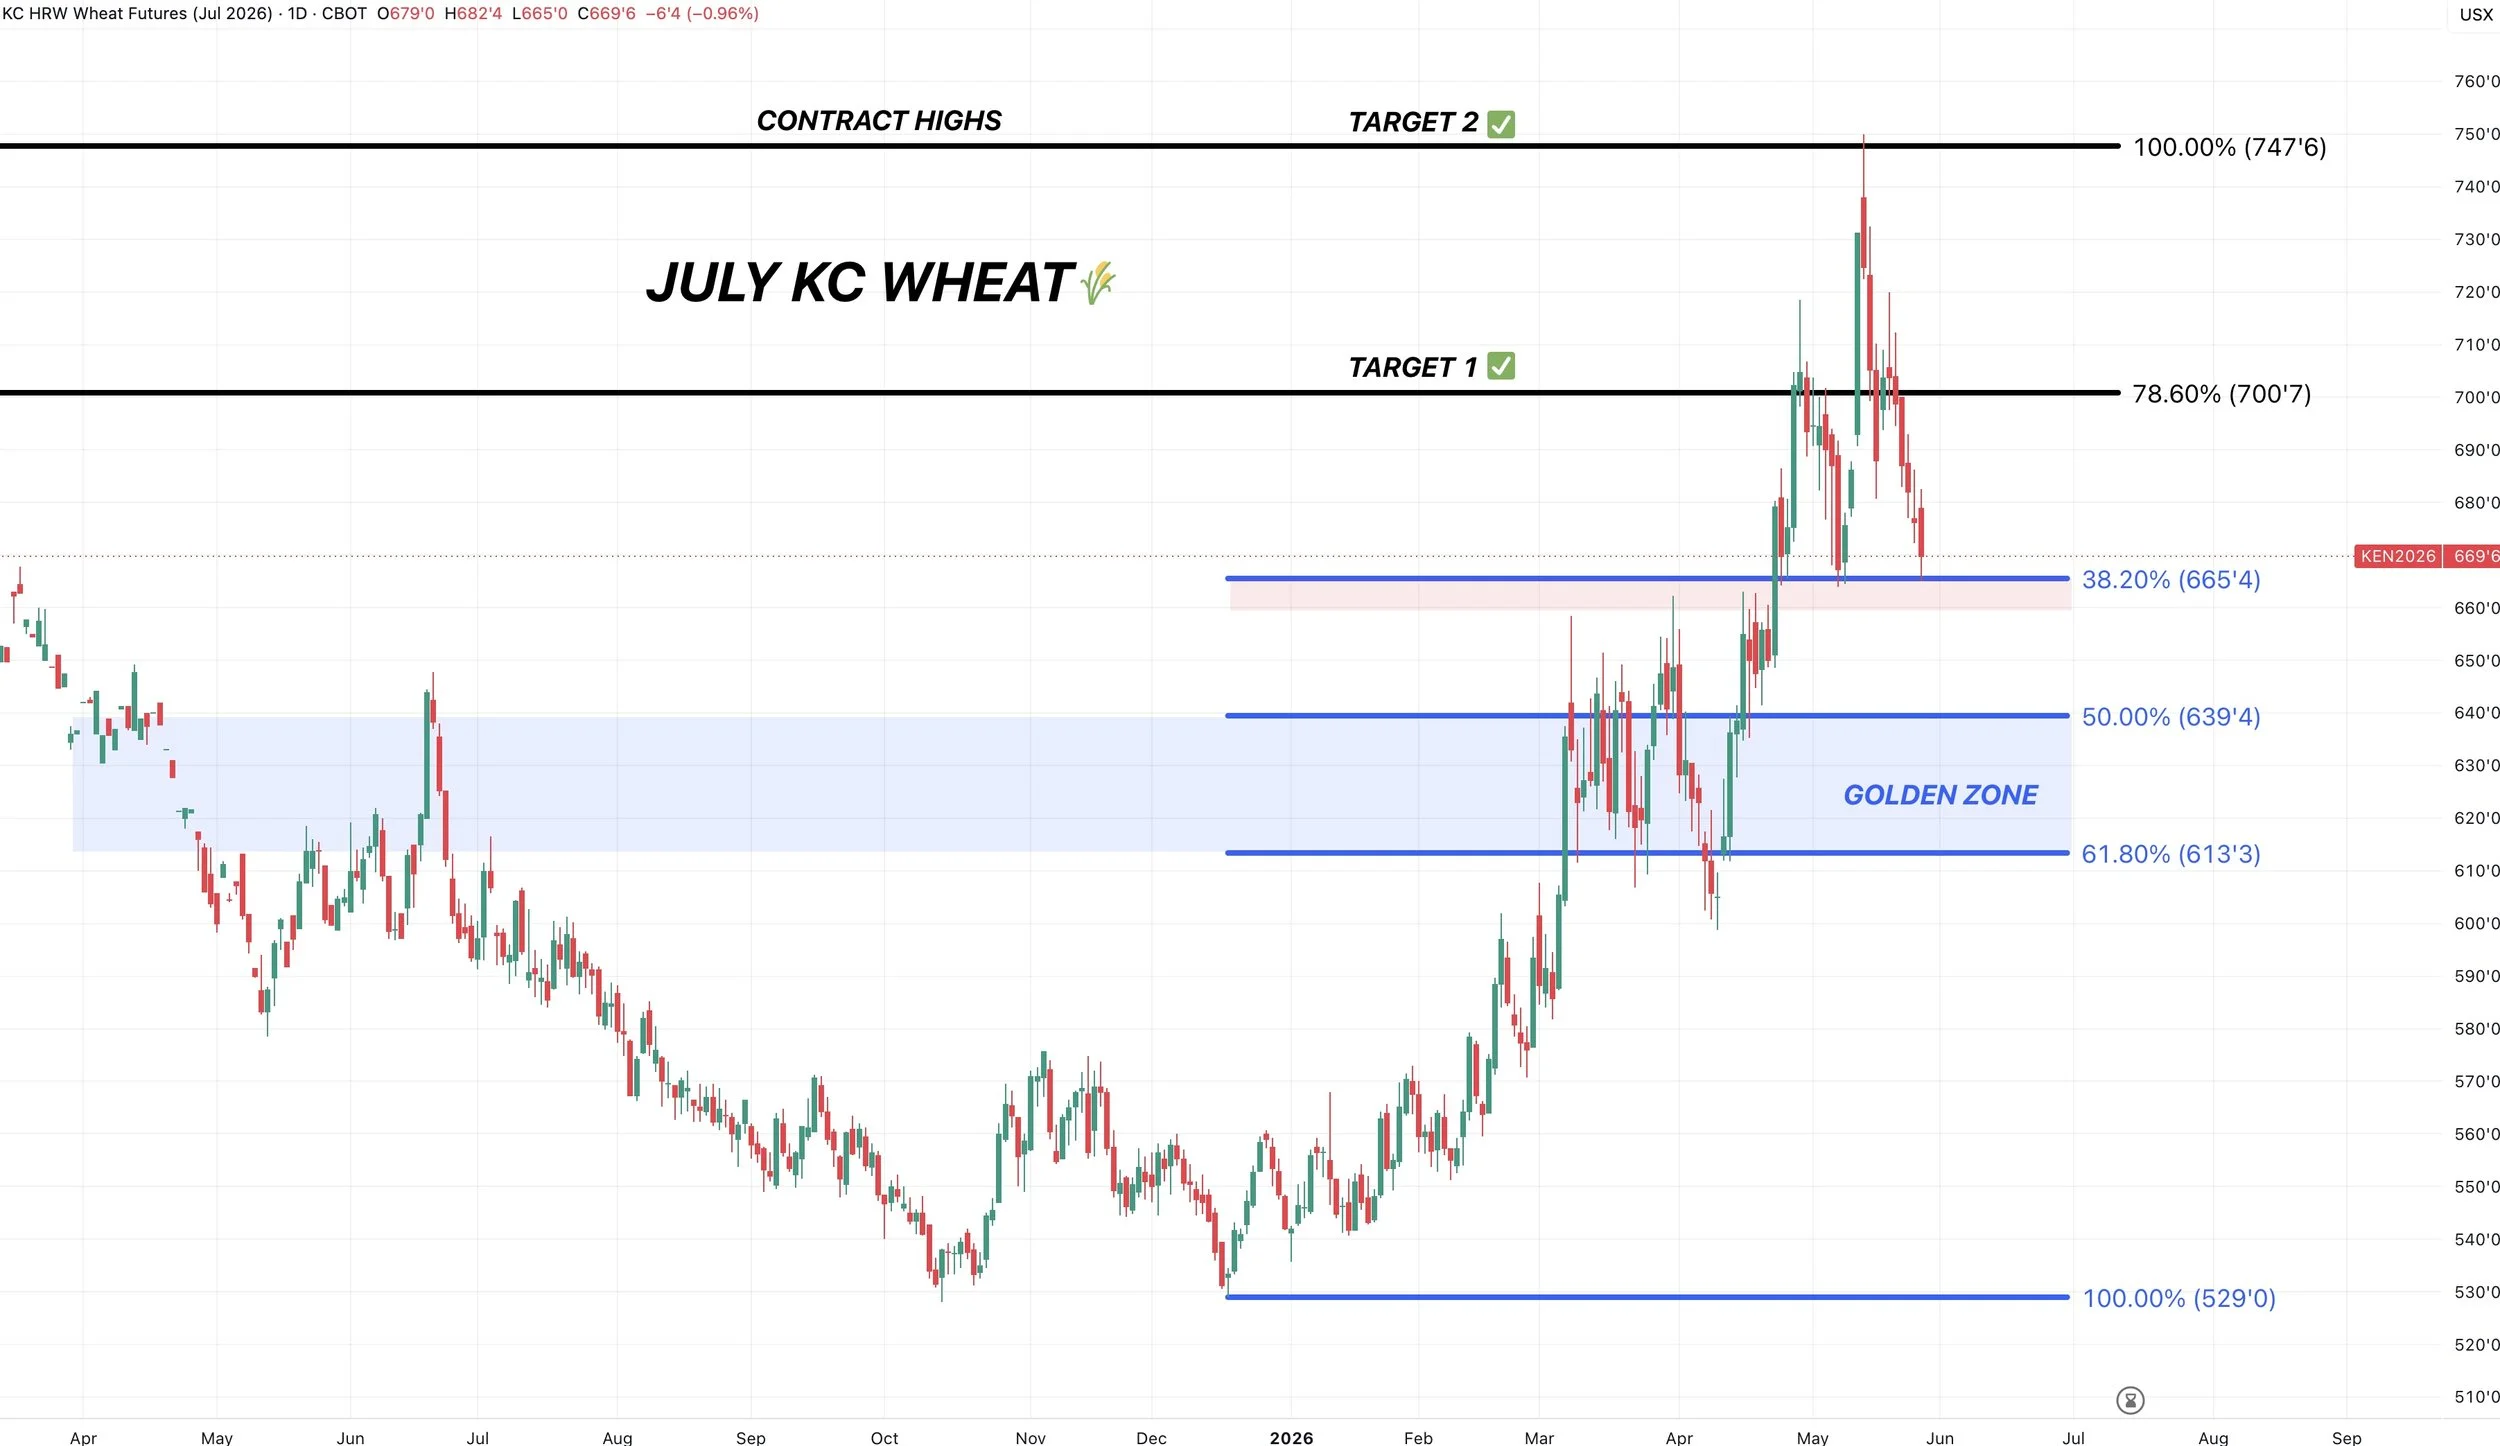
July KC Chart:
Getting close to some possible support.
We are right at those lows from May.
This also gives back 38.2% of the highs down to contract lows. The first retracement level.
It would make some sense to find some life in here. This same level was resistance from Feb and March.
If we fail to hold this level, we could drop into the golden zone. Which gives back 50% to 61.8% of the entire rally from contract lows.
If that happened, I do not think we break below that blue box. As that would be the must hold level to keep the big picture trend higher.
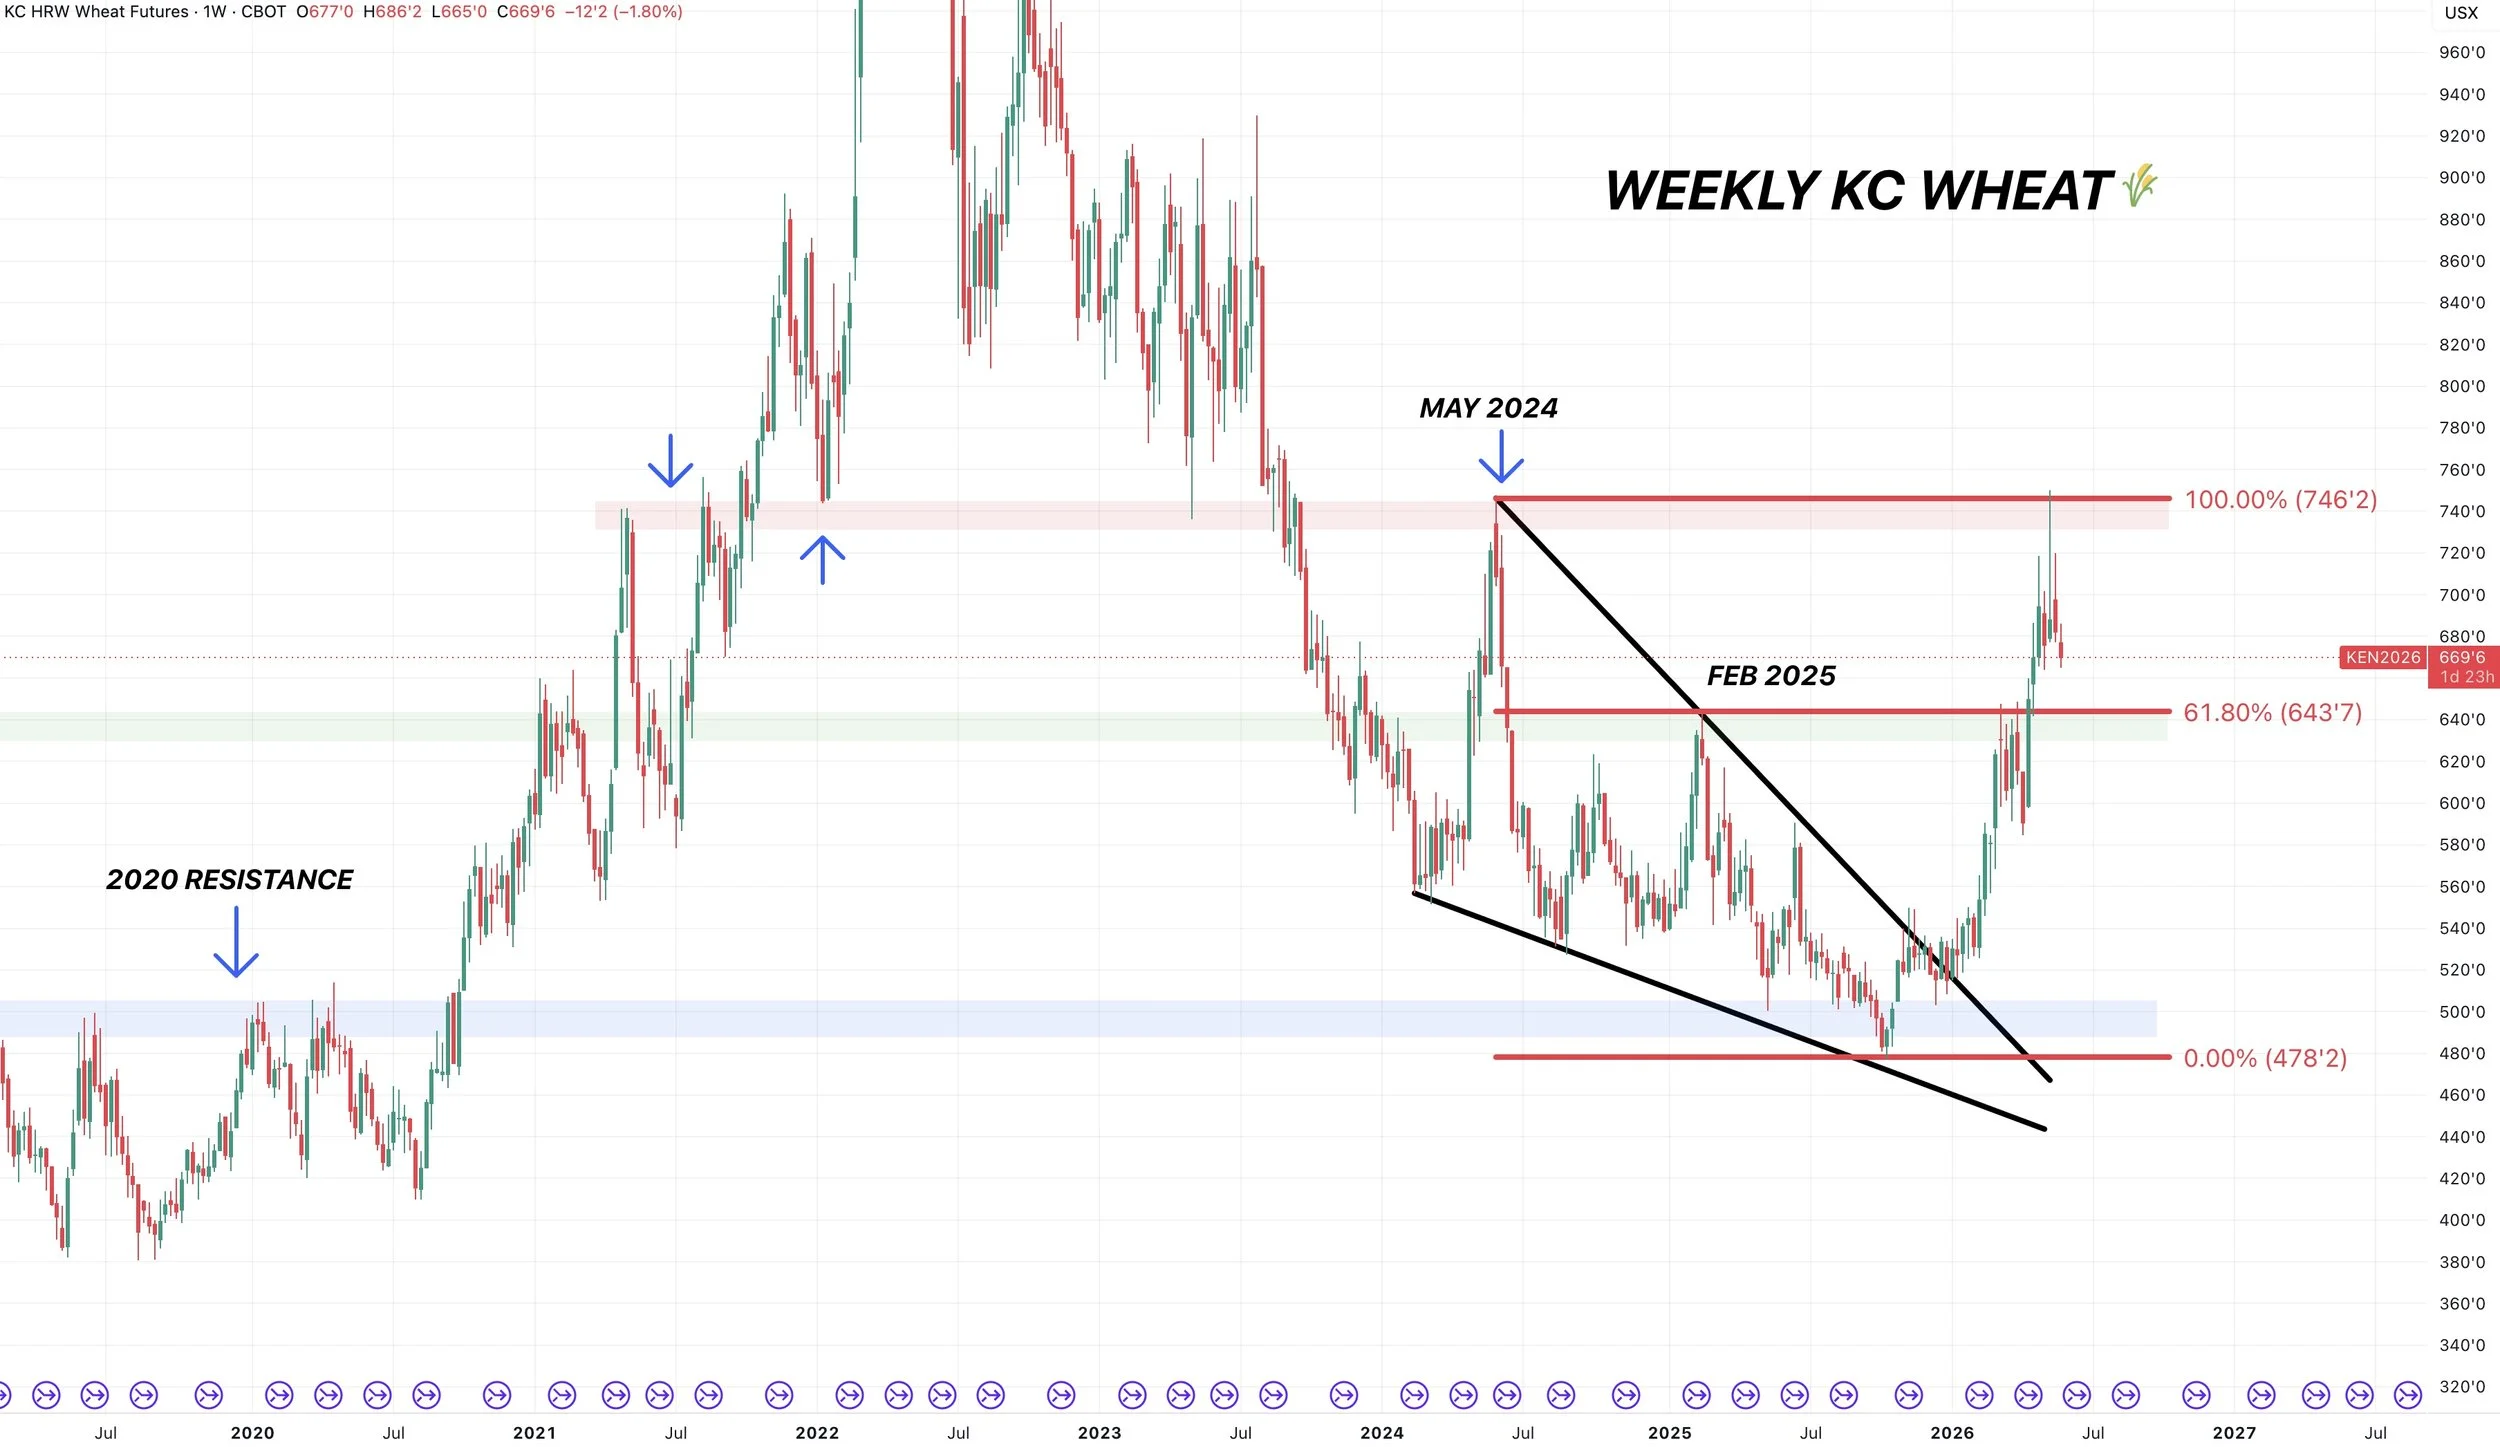
Front Month Chart:
If we zoom out here, you could easily argue that KC could drop into that $6.30 to $6.40 range, which would be over $1.00 off the highs, and the pull back would still be completely healthy.
It would be a simple re-test of old resistance.
The long term uptrend in wheat is very much still in tact.
I still think we printed some multi-year lows last year.
Cattle
Cattle got smoked last week, specifically feeders, as live cattle has actually managed to hold in there.
Friday's on feed report was bearish, but that was expected and appears like it was priced in like we mentioned last week. Hence why we sold off before hand and have since bounced.
Beef cutout is higher.
There are rumors that the Cargillin Ft Morgan strike finds a resolution before the end of the week, so that could be a positive headline.
So it's hard to say if this is simply just going to be a corrective bounce, or if we've found some meaningful lows.
Let's get into the charts.
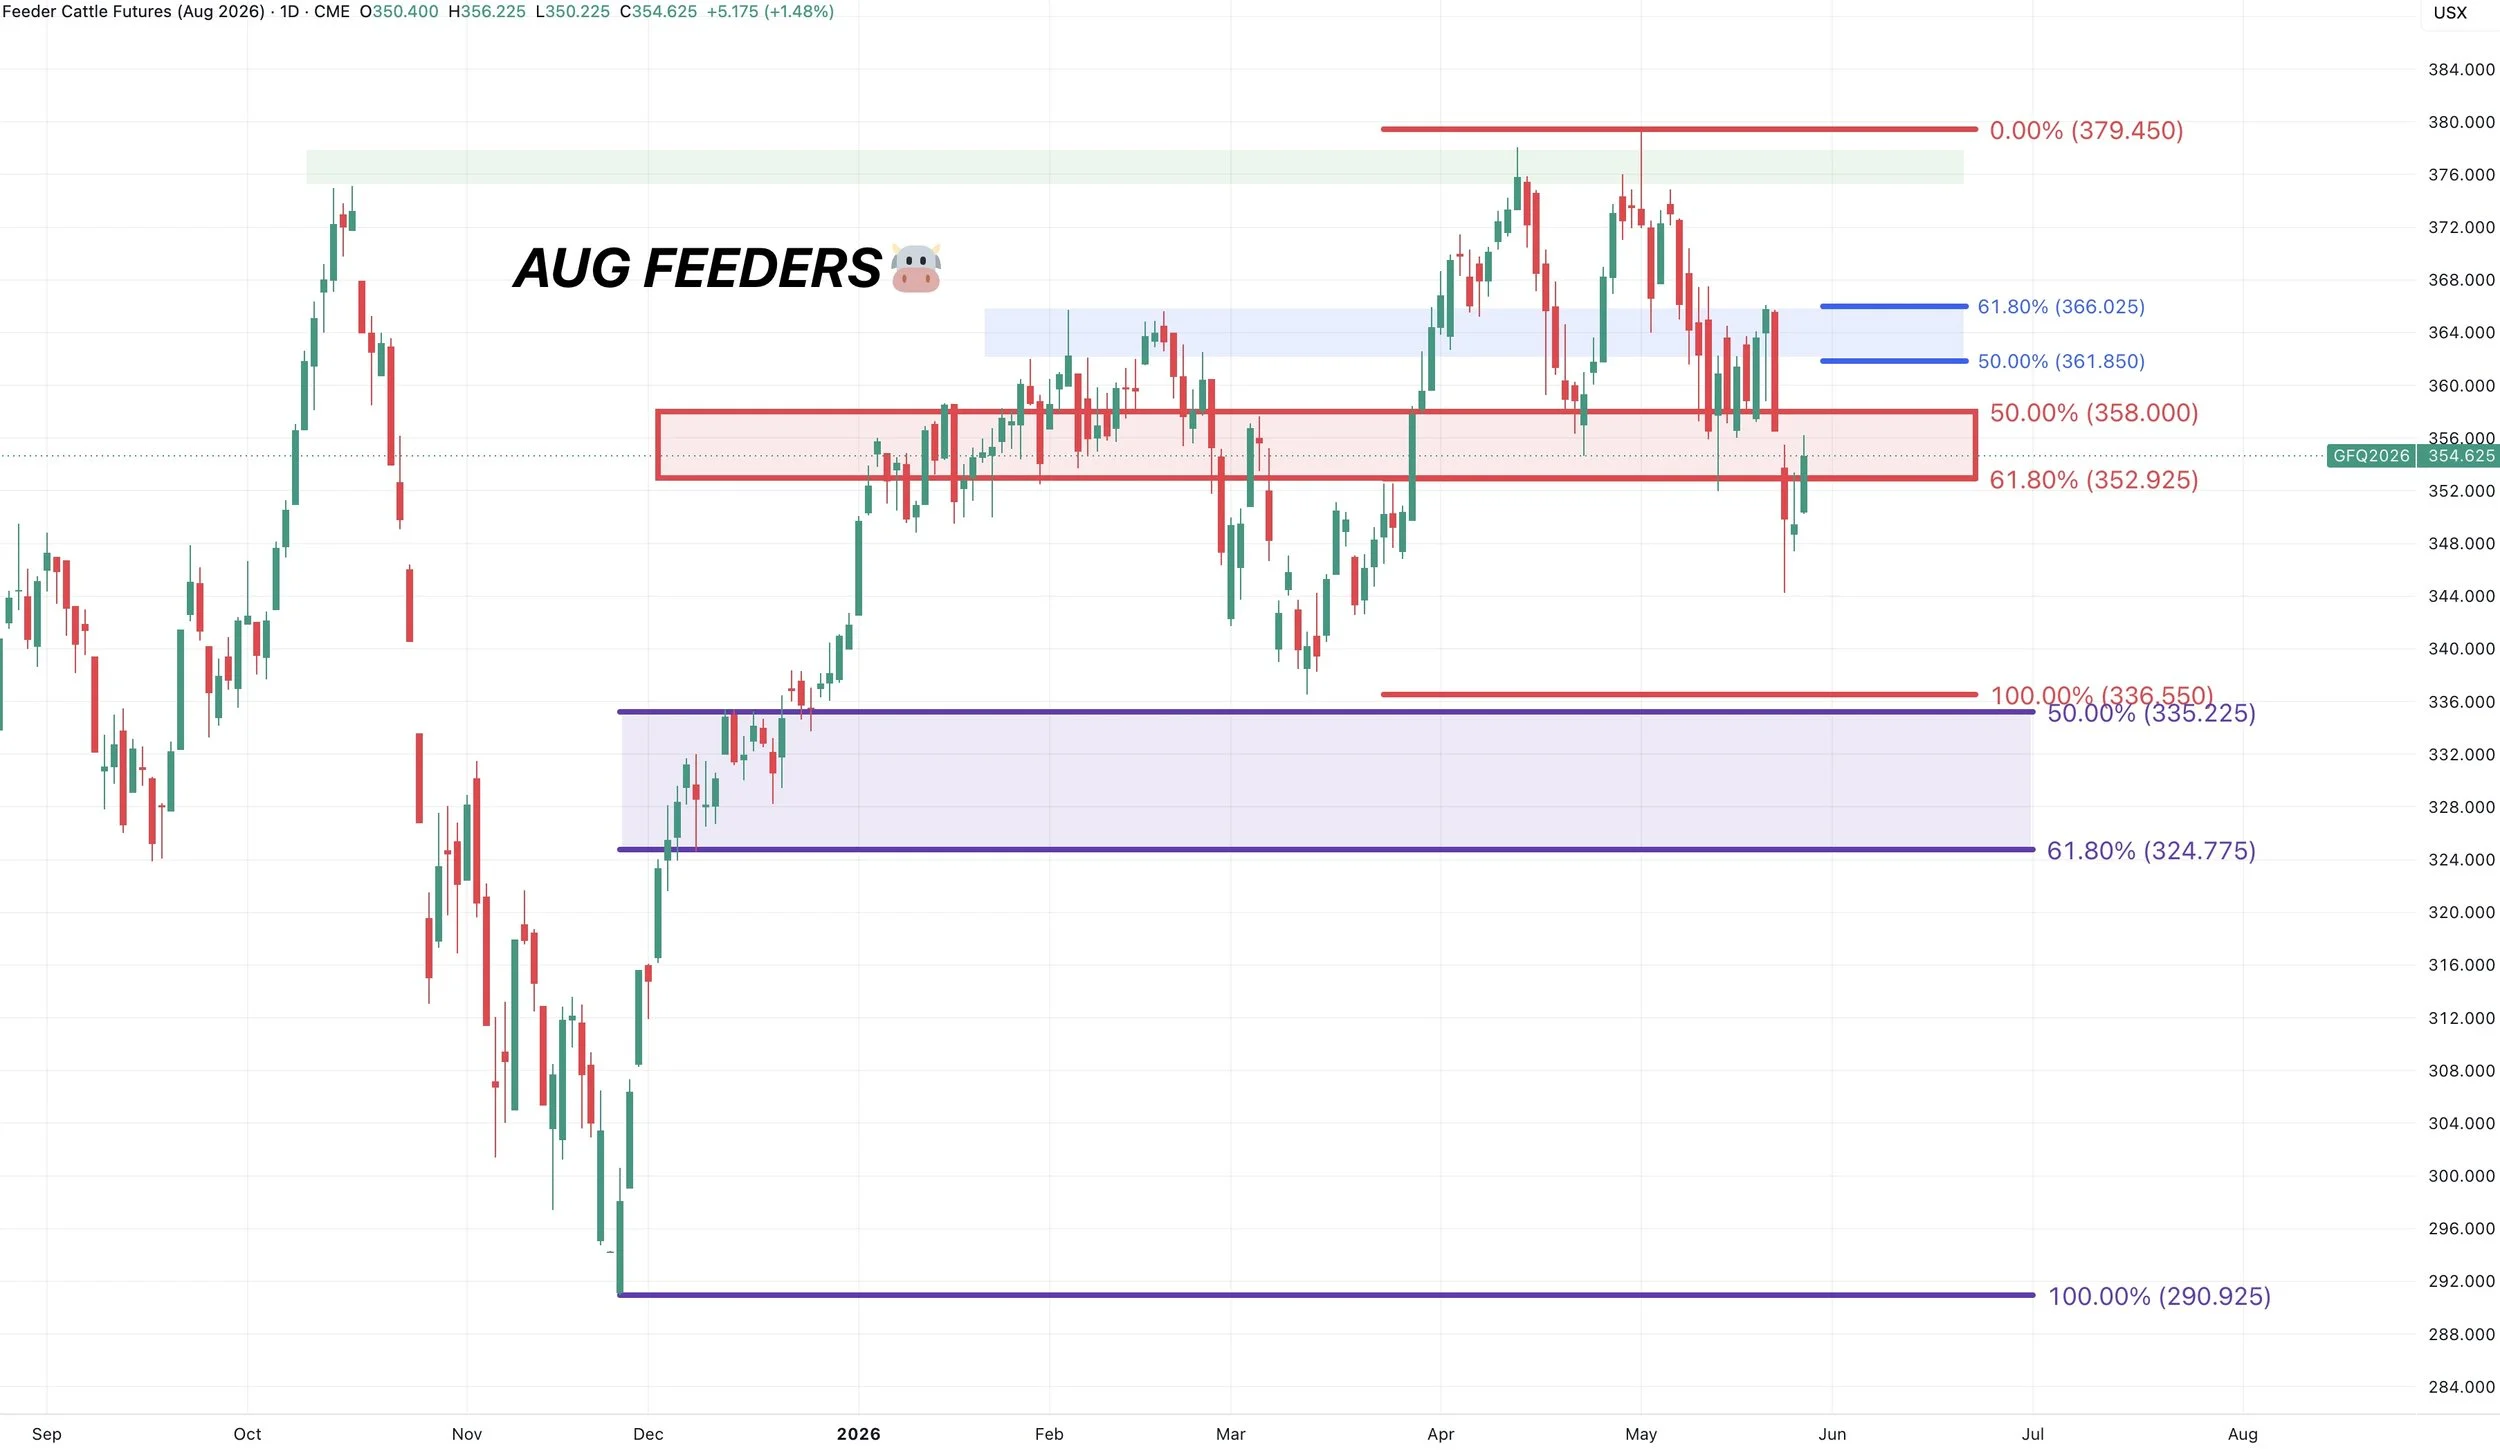
Aug Feeders Chart:
Feeders broke that key support we had talked about for a long time.
So some further downside wouldn’t be a surprise.
However, if we do manage to put together a larger bounce, we want to eye the 362 to 366 level.
That's going to be our key in deciding if this is just a relief bounce or an actual bottom.
If it's a relief bounce, we could fail there. If we break above, it's likely an actual bottom for a while.
If we break below the recent lows, we could ultimately head towards the purple box, which is the golden zone from the entire rally.
(Scroll to look at continuous chart)
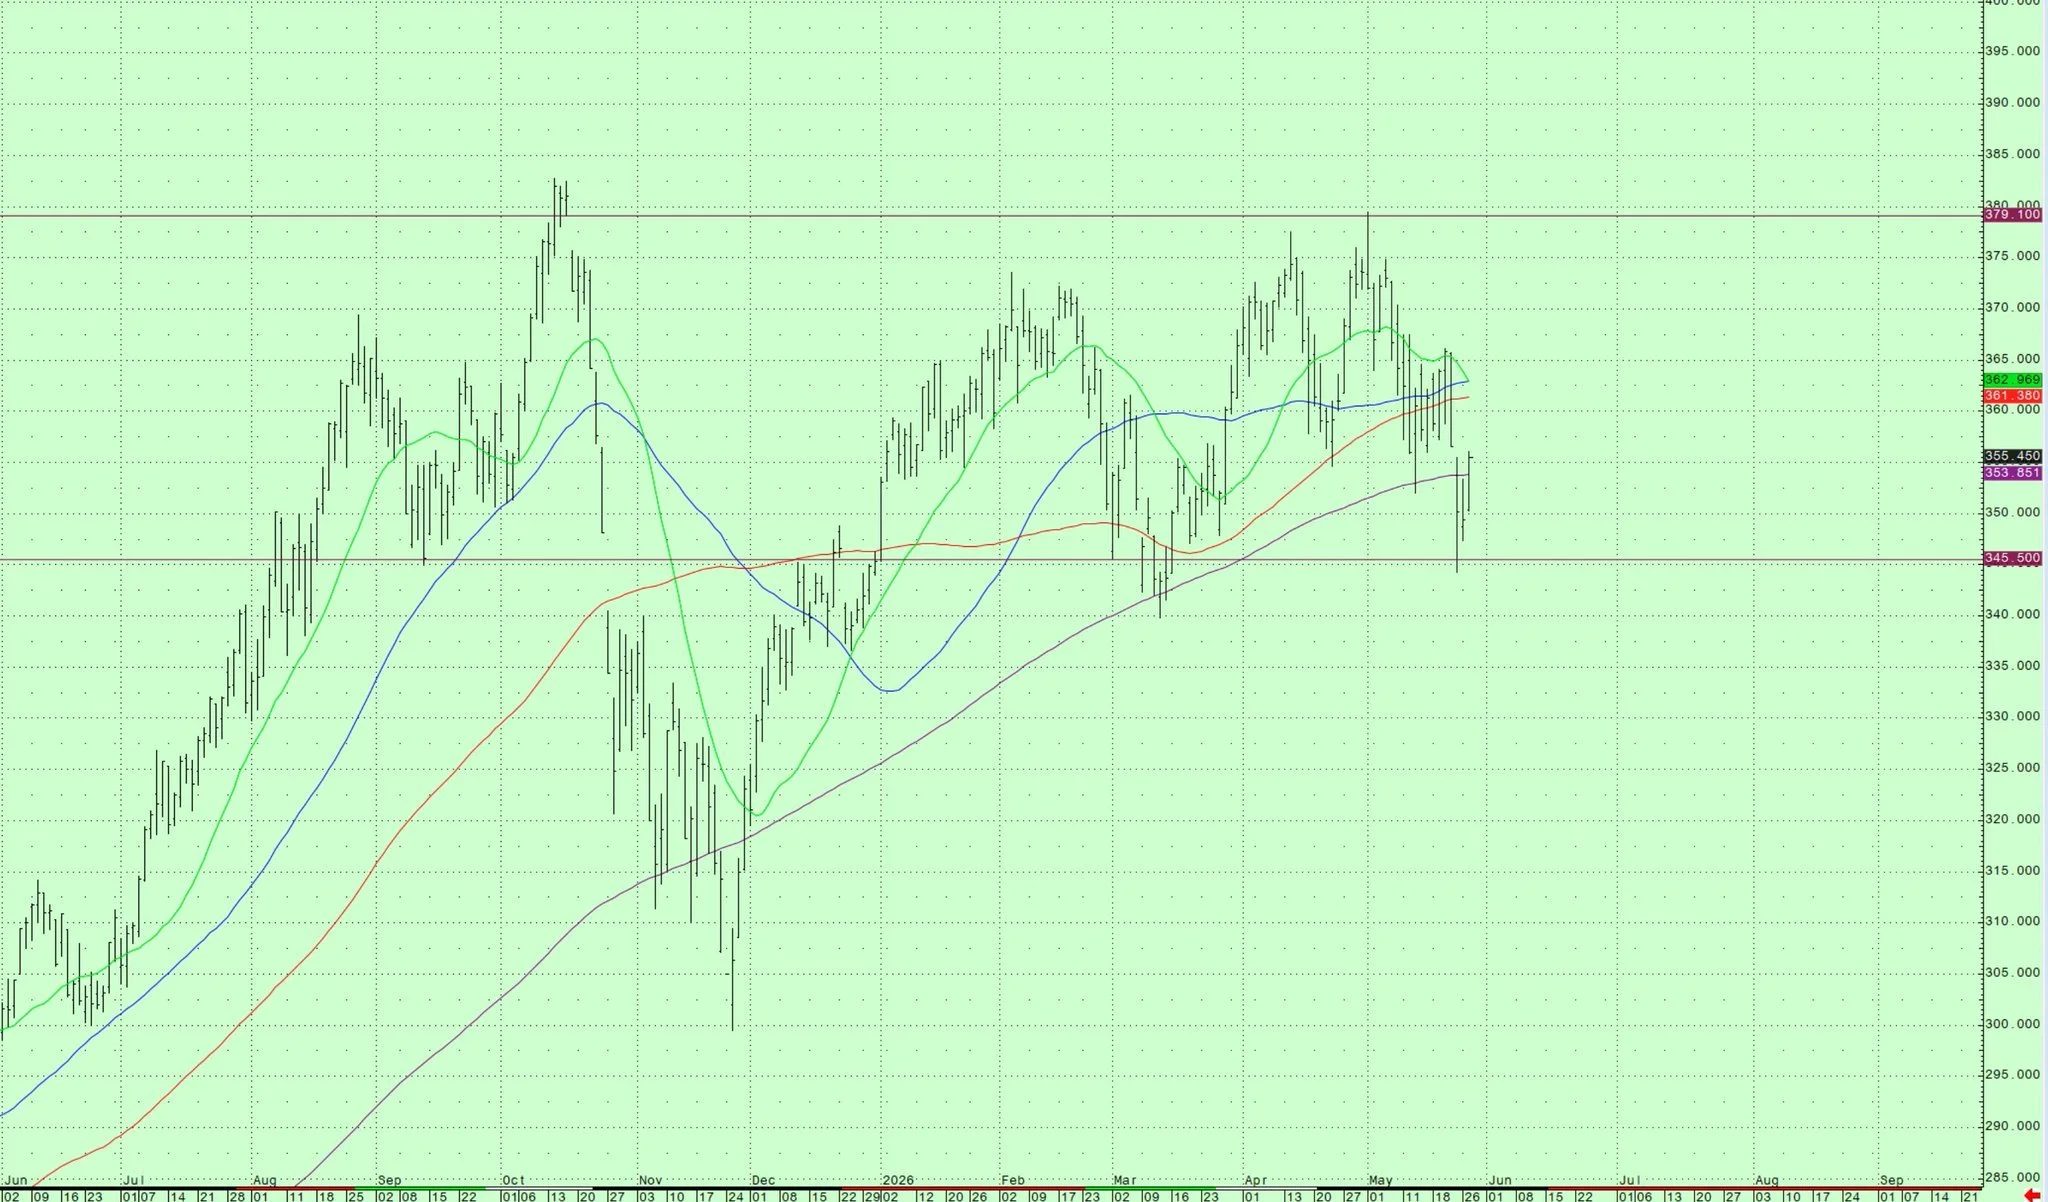
Feeders Average Daily Continuation Chart:
If we look at the average daily continuation chart, we held the yearly open at 345.50
So that will be a key level and pivot spot.
Big money likes to use yearly opens.
So if we break below Friday's lows, it's probably a sign we are in for a deeper correction. Likely into that purple box on my first chart.
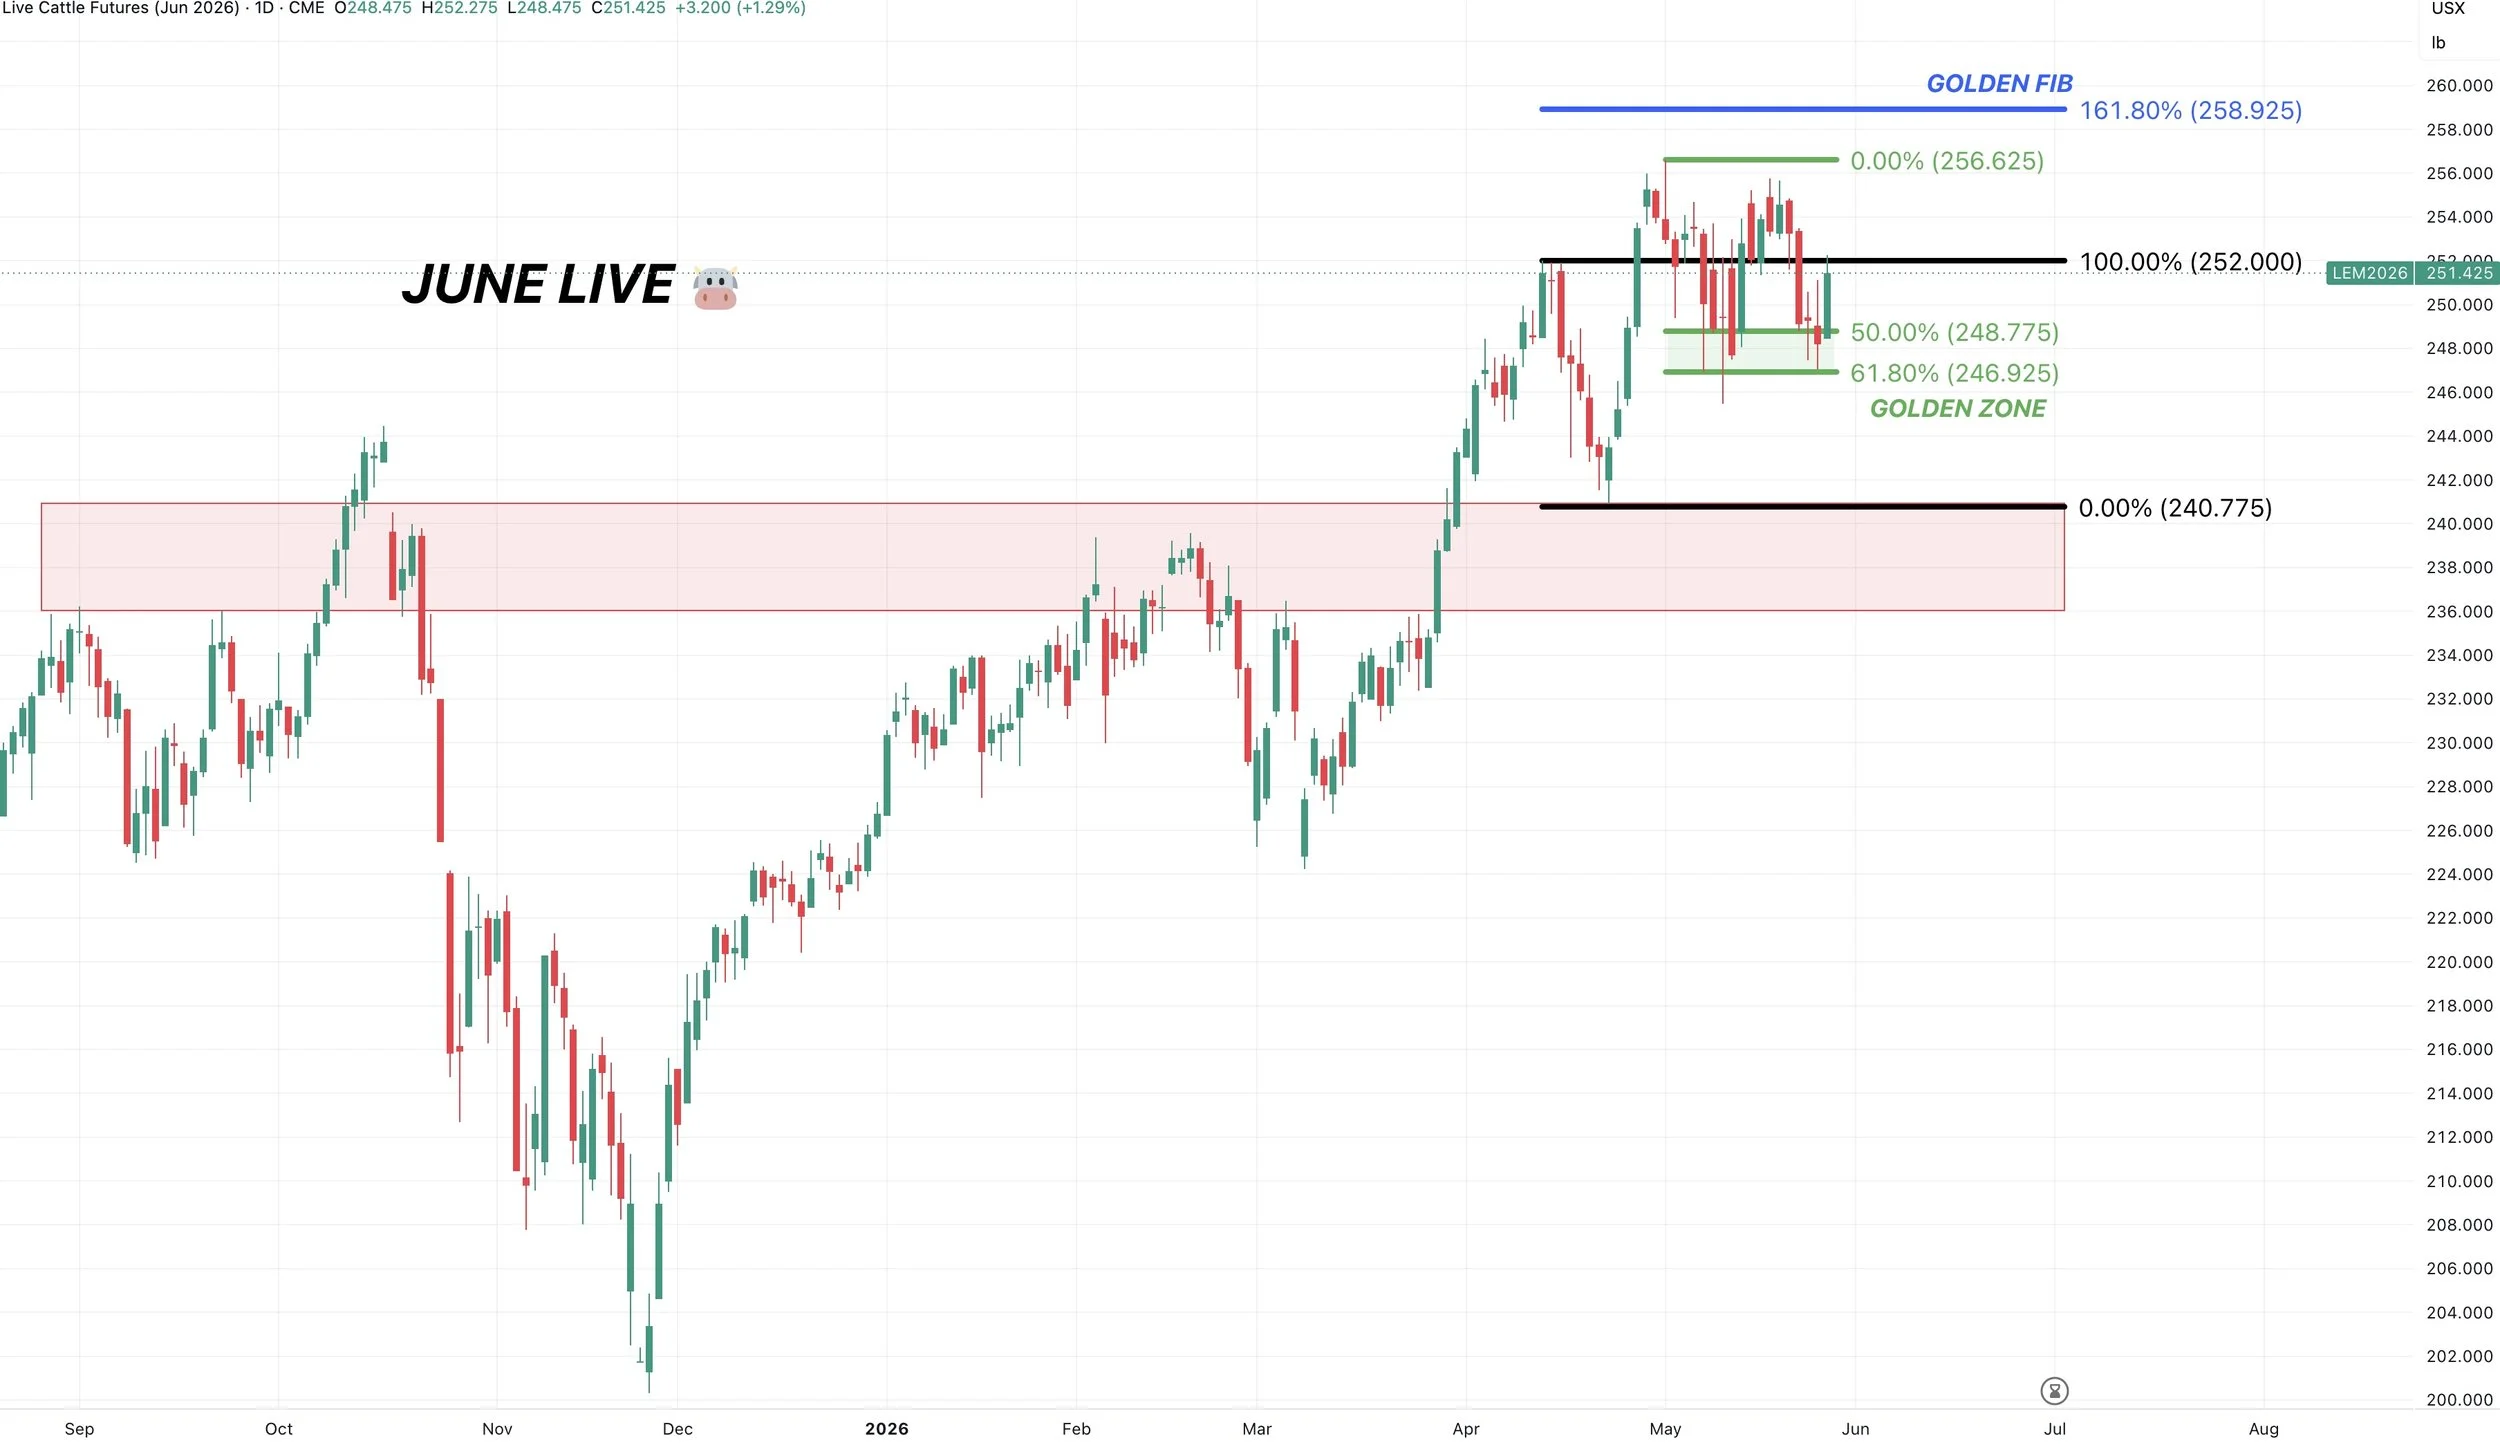
June Live Chart:
Unlike feeders, live cattle continues to hold key support.
The golden zone down to the April lows.
Break below that level and we probably head towards the red box.
So bulls want to hold that level.
Want to Talk?
Our phones are open 24/7 for you guys if you ever need anything or want to discuss your operation.
Jeremey & Office: (806)484-1214
Sebastian: (605)280-1186
Email: sfrost@dailymarketminute.com
Hedge Account
Interested in a hedge account? Use the link below to set up an account or give us a call.
Recent Signals
May 13th, 2026: 🌱
Soybean sell signal & hedge alert.
CLICK HERE TO VIEW
April 28th, 2026: 🌾
KC wheat specific signal.
CLICK HERE TO VIEW
April 27th, 2026: 🌽
Corn catch up sell signal.
CLICK HERE TO VIEW
April 10th, 2026: 🌽
Corn buy signal.
CLICK HERE TO VIEW
March 19th, 2026: 🌱
New crop soybeans signal & hedge alert.
CLICK HERE TO VIEW
March 9th, 2026: 🌱
Soybeans signal & hedge alert. Sent via text.
CLICK HERE TO VIEW
March 6th, 2026: 🌽 🌾
Corn & wheat sell signal & hedge alert.
CLICK HERE TO VIEW
March 3rd, 2026: 🌽
Old crop & new crop corn sell signal & hedge alert.
CLICK HERE TO VIEW
Feb 26th, 2026: 🌱
Old crop & new crop beans sell signal & hedge alert.
CLICK HERE TO VIEW
Feb 19th, 2026: 🌾
KC wheat sell signal & hedge alert.
CLICK HERE TO VIEW
Feb 6th, 2026: 🌽 🌱
Old crop corn & soybean sell signal & hedge alert.
CLICK HERE TO VIEW
Feb 4th, 2026: 🌱
Soybean sell signal & hedge alert.
CLICK HERE TO VIEW
Nov 17th, 2025: 🌱
Soybean sell signal & hedge alert.