
NEARING SINK OR SWIM LEVELS
MARKET UPDATE
You can scroll to read the usual update as well. As the written version is the exact same as the video.
Timestamps for video:
Overview: 0:00min
Corn: 2:35min
Beans: 10:20min
Wheat: 12:10min
Cattle: 16:10min
Want to talk?
Office: (806)484-1214
Your free trial has ended
If you’d like to keep receiving future updates and signals, here is our planting sale from this weekend in case you missed it
Futures Prices Close
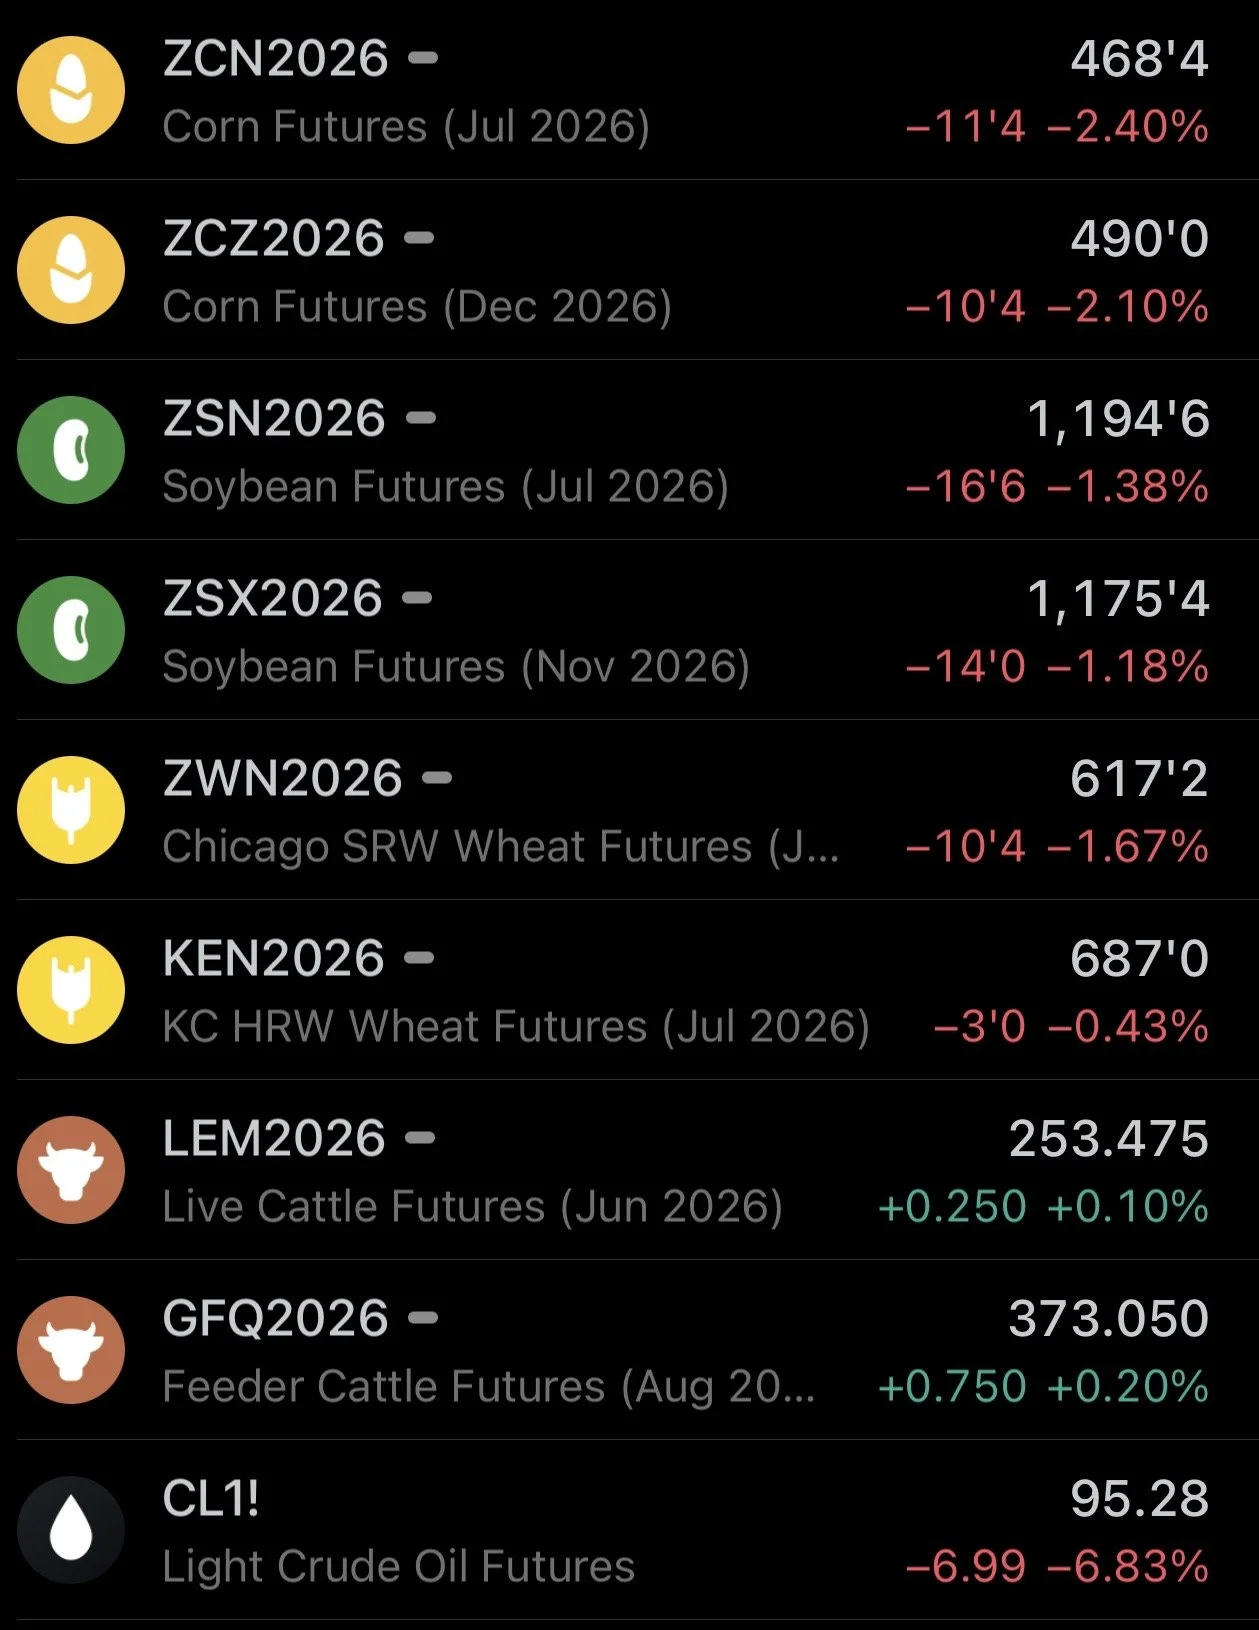
Overview
Blood bath across the grains today, with everything down around double digits.
Why the sell off?
It all came from more Trump and war headlines.
The news today was that the White House has paused project freedom and a deal between Iran is reportedly close.
Trump pretty much said it's a deal now, or new bombings.
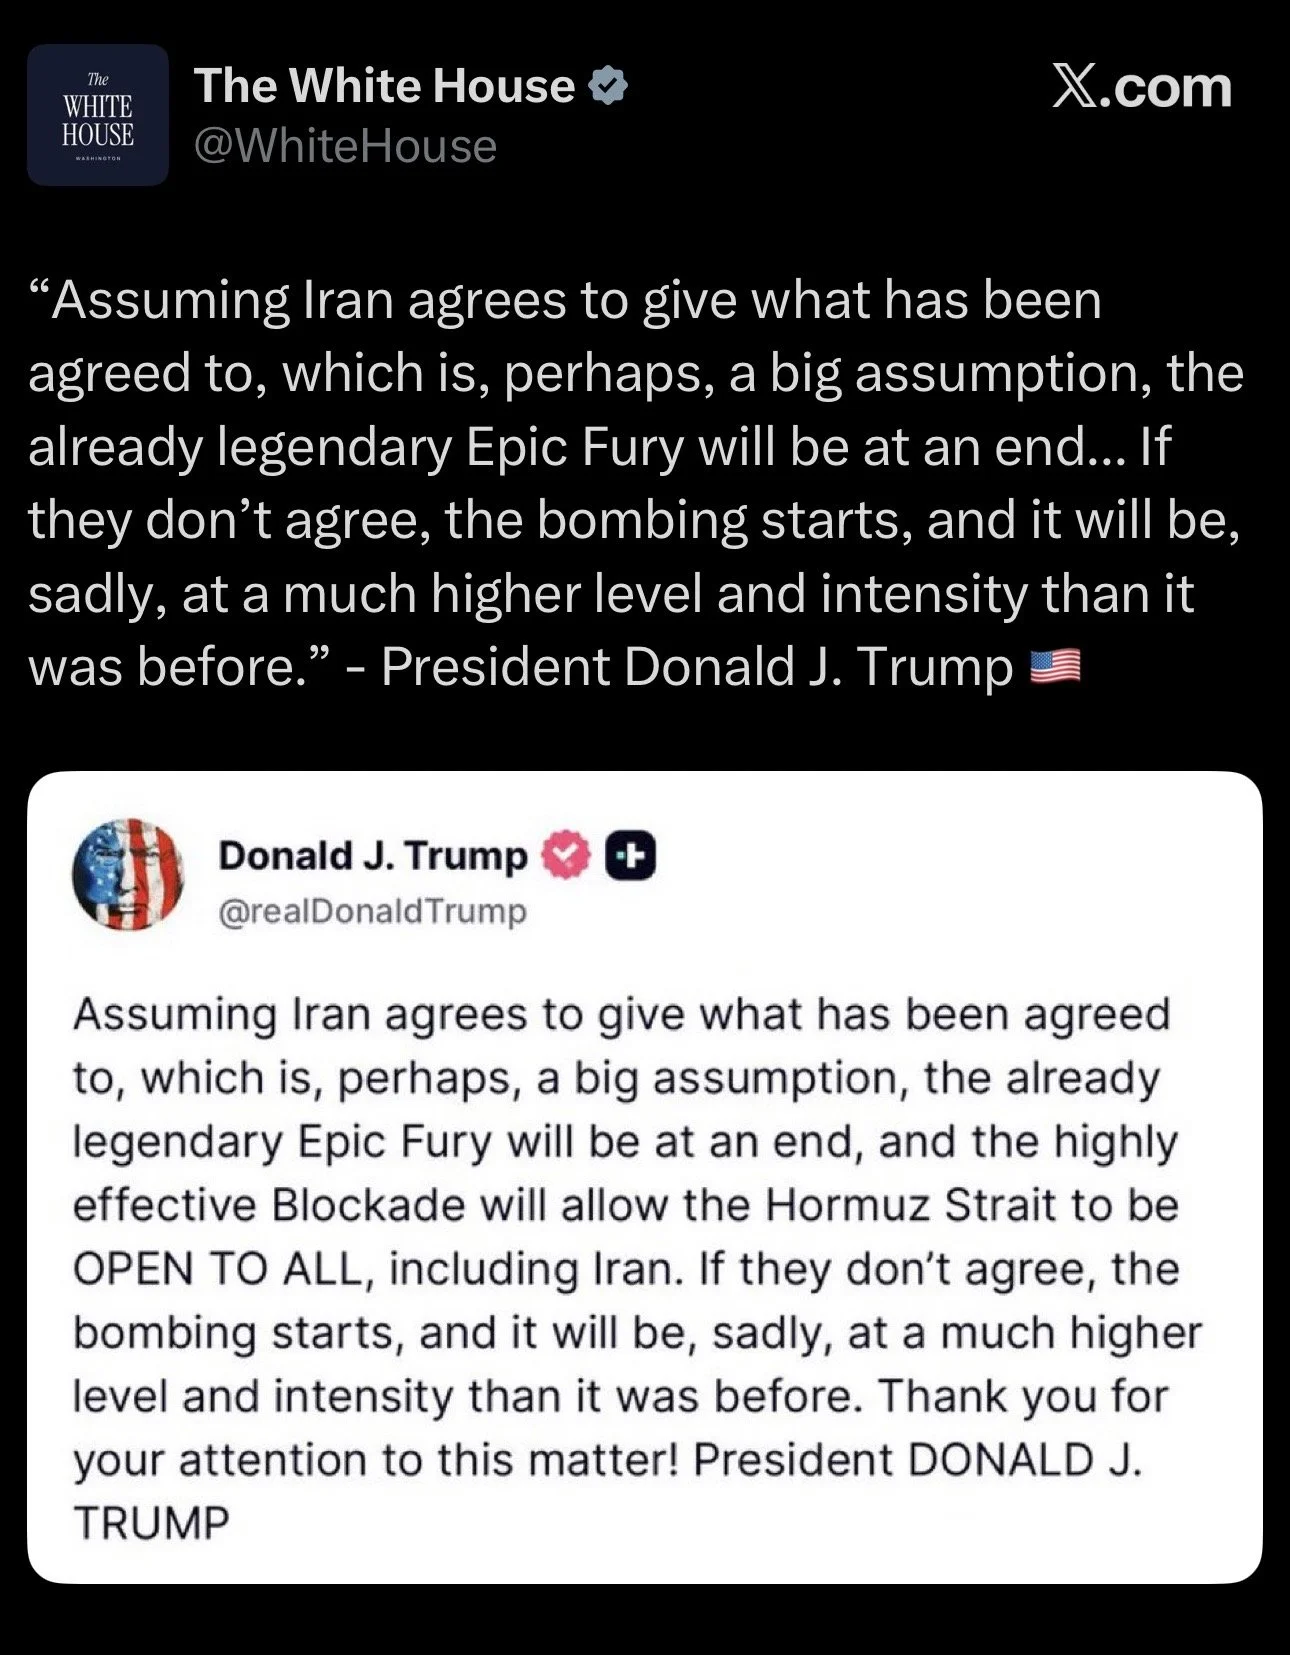
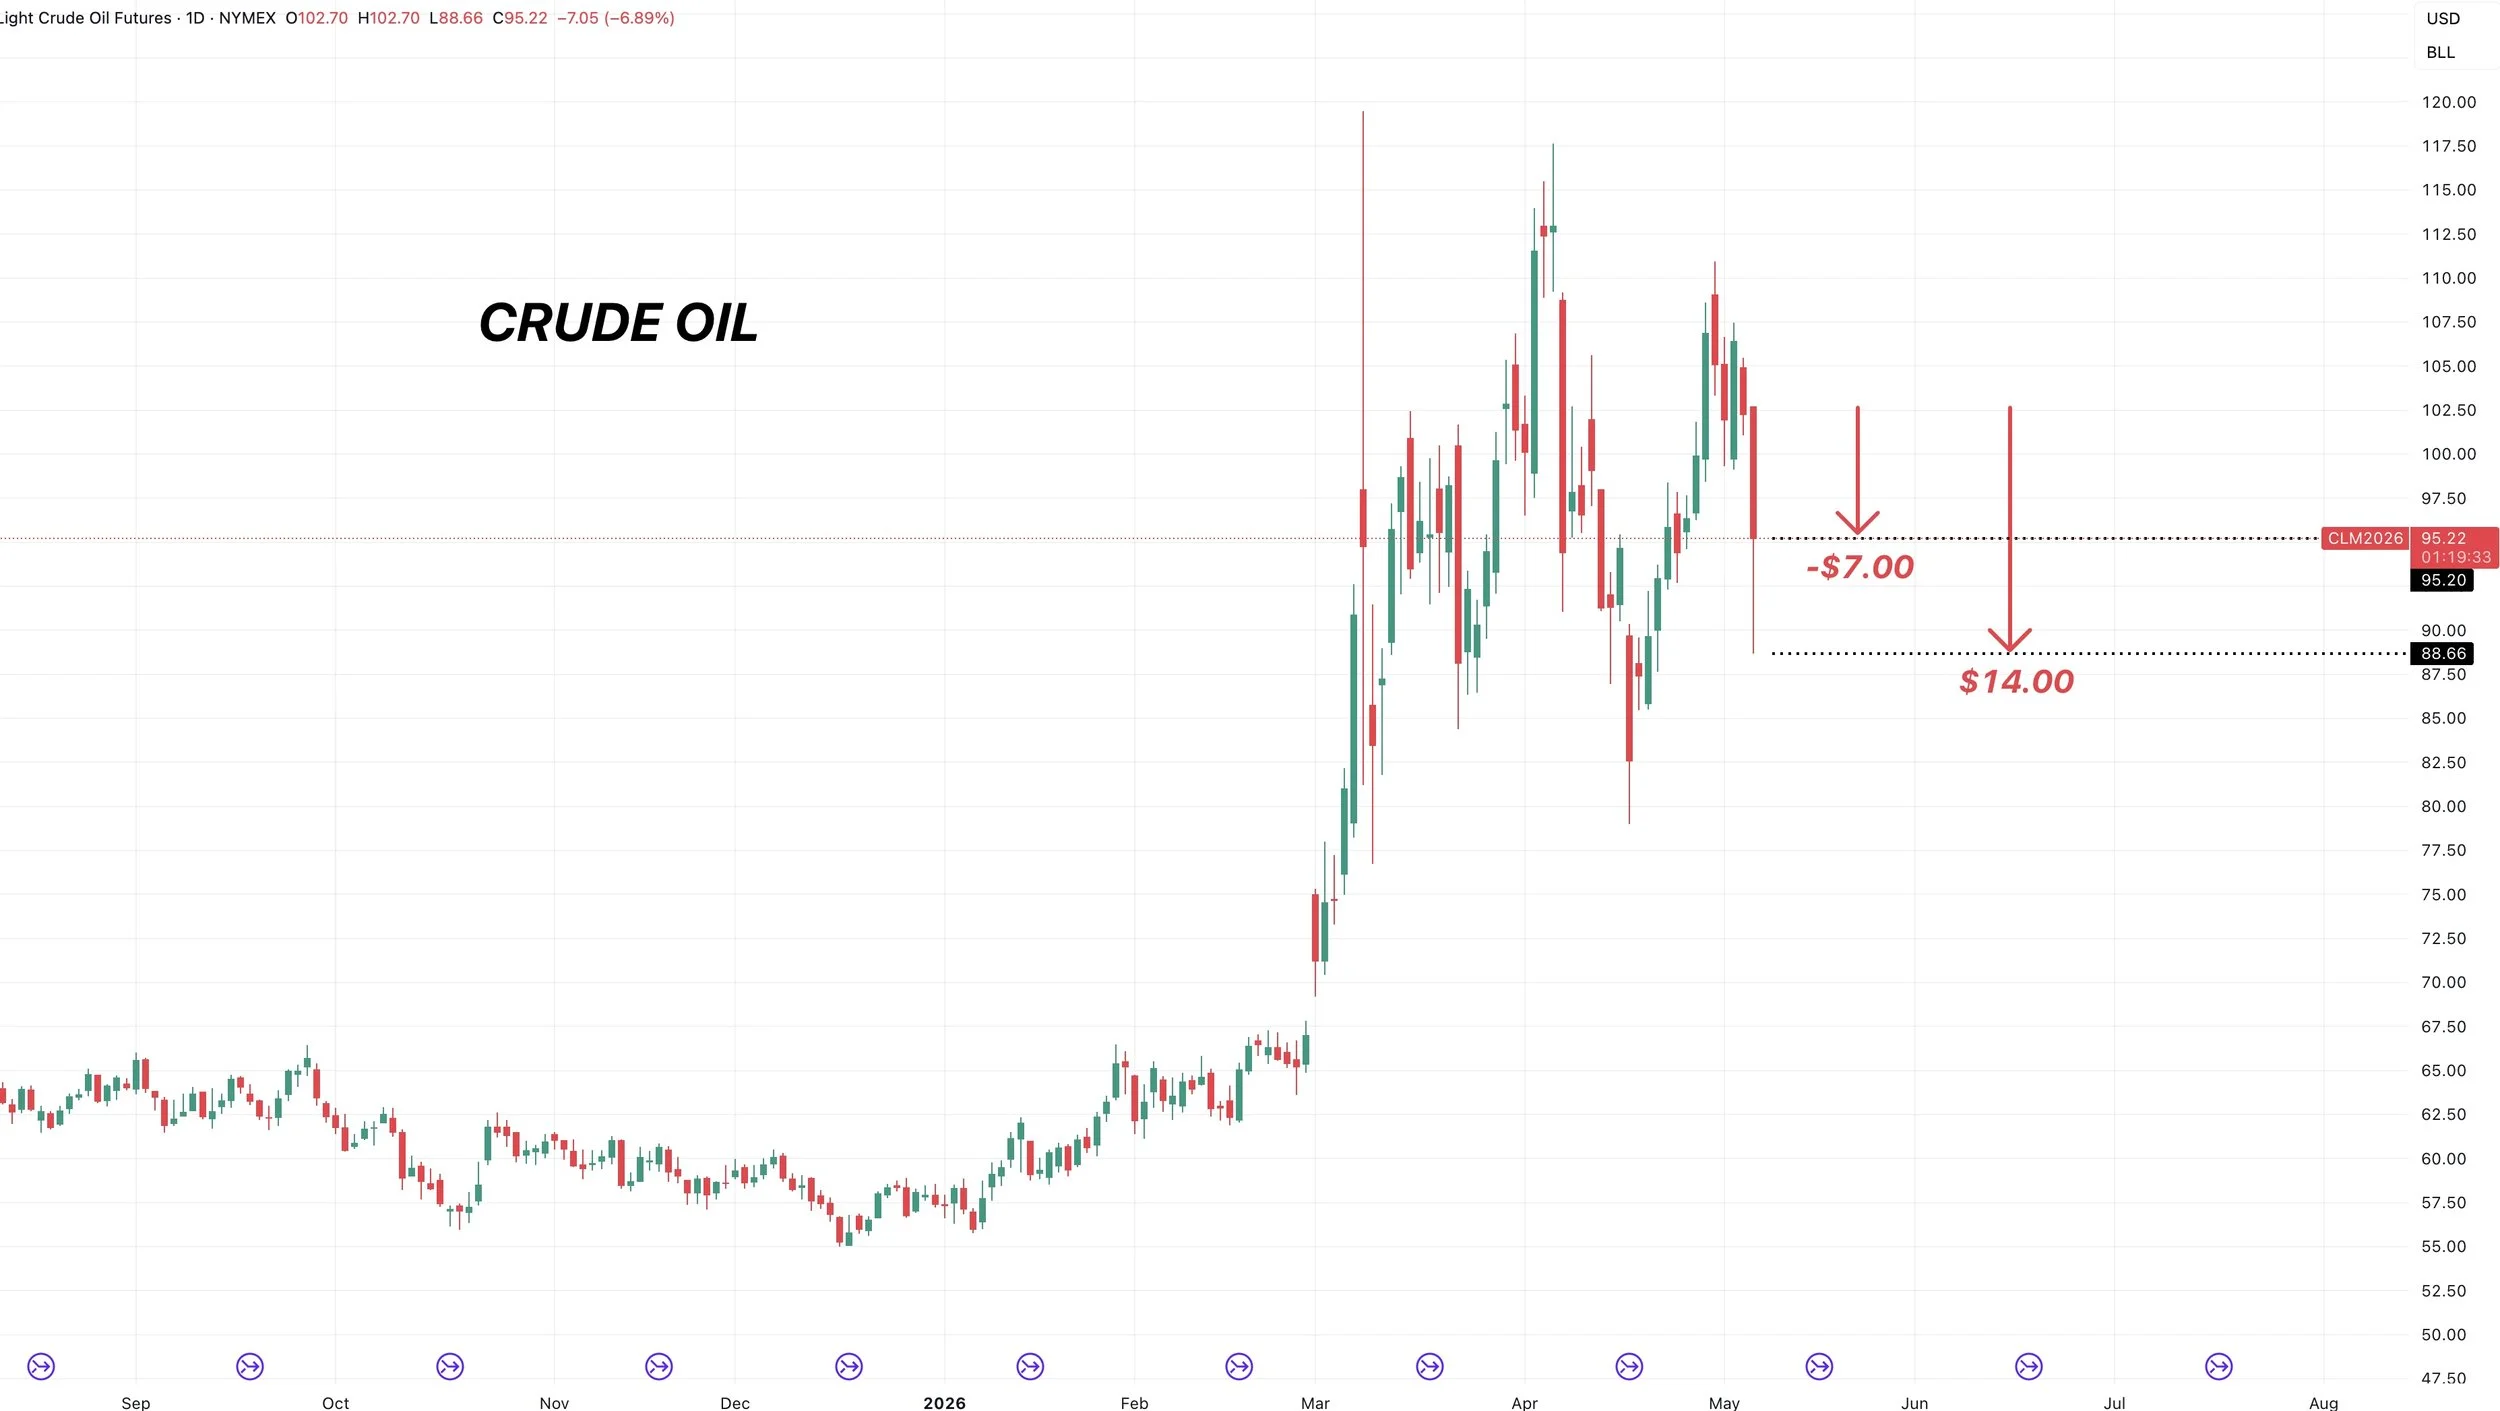
As a result, the crude oil market saw a big pullback and grains followed suite.
As crude dropped -$7.00 (7%) and at one point was down as much as -$14.00 trading below $90 a barrel.
Grains don’t follow crude every single day. It's not some perfect relationship by anymeans.
However, when you get a big move like this, money flow typically tends to spilll into the ags.
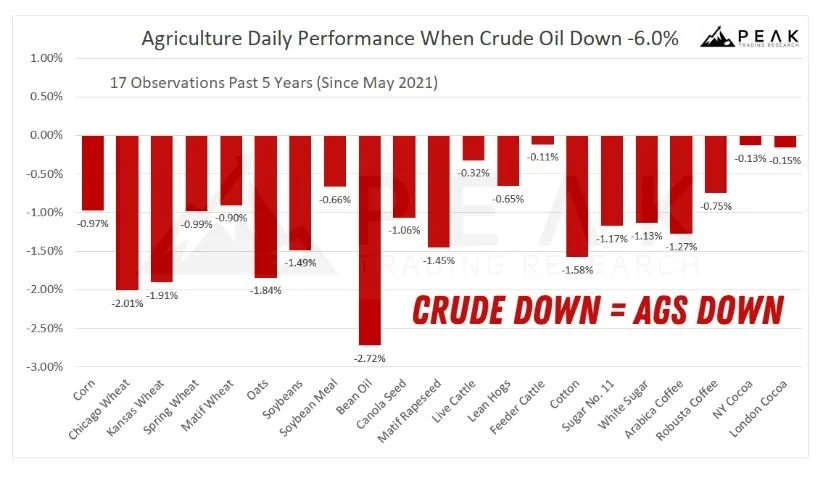
Here was a nice piece of research I saw today from Peak Trading Research (@PeakTrading on X).
This is the 18th time we've seen crude down by more than 6% in the last 5 years.
Anytime crude is down this much, weakness usuallly follows in grains.
When crude is down this much, here is the average moves we see in the ag complex:
Bean Oil: -2.70%
Chicago Wheat: -2.00%
KC Wheat: -1.90%
Soybeans: -1.50%
Corn: -1.00%
So it was clear today's sell off was all about crude oil.
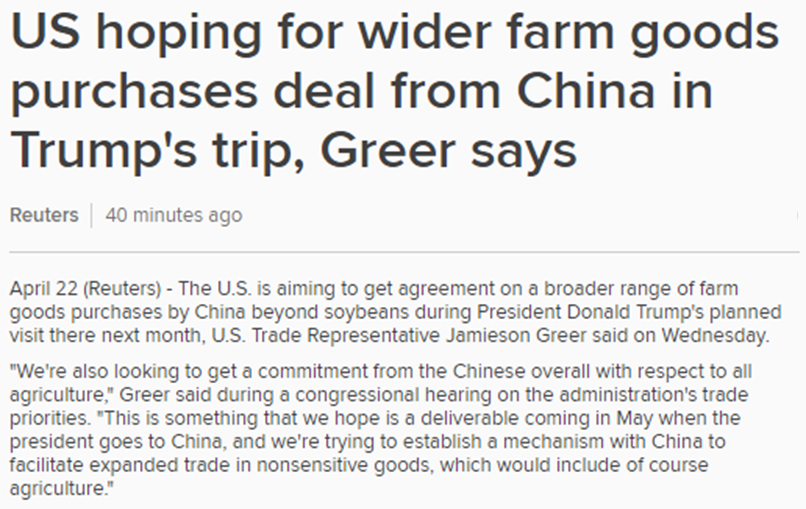
We have the meeting between Trump and China scheduled for next week.
On Thursday, May 14th.
Trump claims a deal with Iran might be reached before the meeting.
If you remember, the meeting originally got postponed due to the war. And China has made it clear they want a war deal to meet.
So a deal might be required if we want to get that meeting with China.

All eyes are still going to be on this meeting with China.
A lot of times, we will see China make some good faith purchases ahead of meetings like this. So you have to wonder if we'll see them step in and buy some soybeans over the next week.
The other big wild card is corn.
I've heard a lot of chatter that they could potentially be looking to buy some corn.
As the US announced they want China to also buy "non-soybean" ag products.
That would be a huge win if they do. But again.. it's just chatter.
We should know next week hopefully.
Either way, I don’t see why this meeting would be a bearish item. Unless it of course goes bad and our relationship with China worsens and they don’t buy anything. That would be the only risk.
In other news, we do have the May USDA report out next Tuesday on May 12th.
This report will give us our first offical look at the new crop balance sheets.
The other big question going into this report has to be how does the USDA see this wheat crop?
Today's Main Takeaways
Corn
Window of Opportunity is Here:
Last week I went into the seasonals, but I wanted to again go over them and just provide some additional context.
Because we are entering that usual time frame where we post our highs. Between now and the middle of June is historically when we want to price the majority of the grain we are going to price for the year.
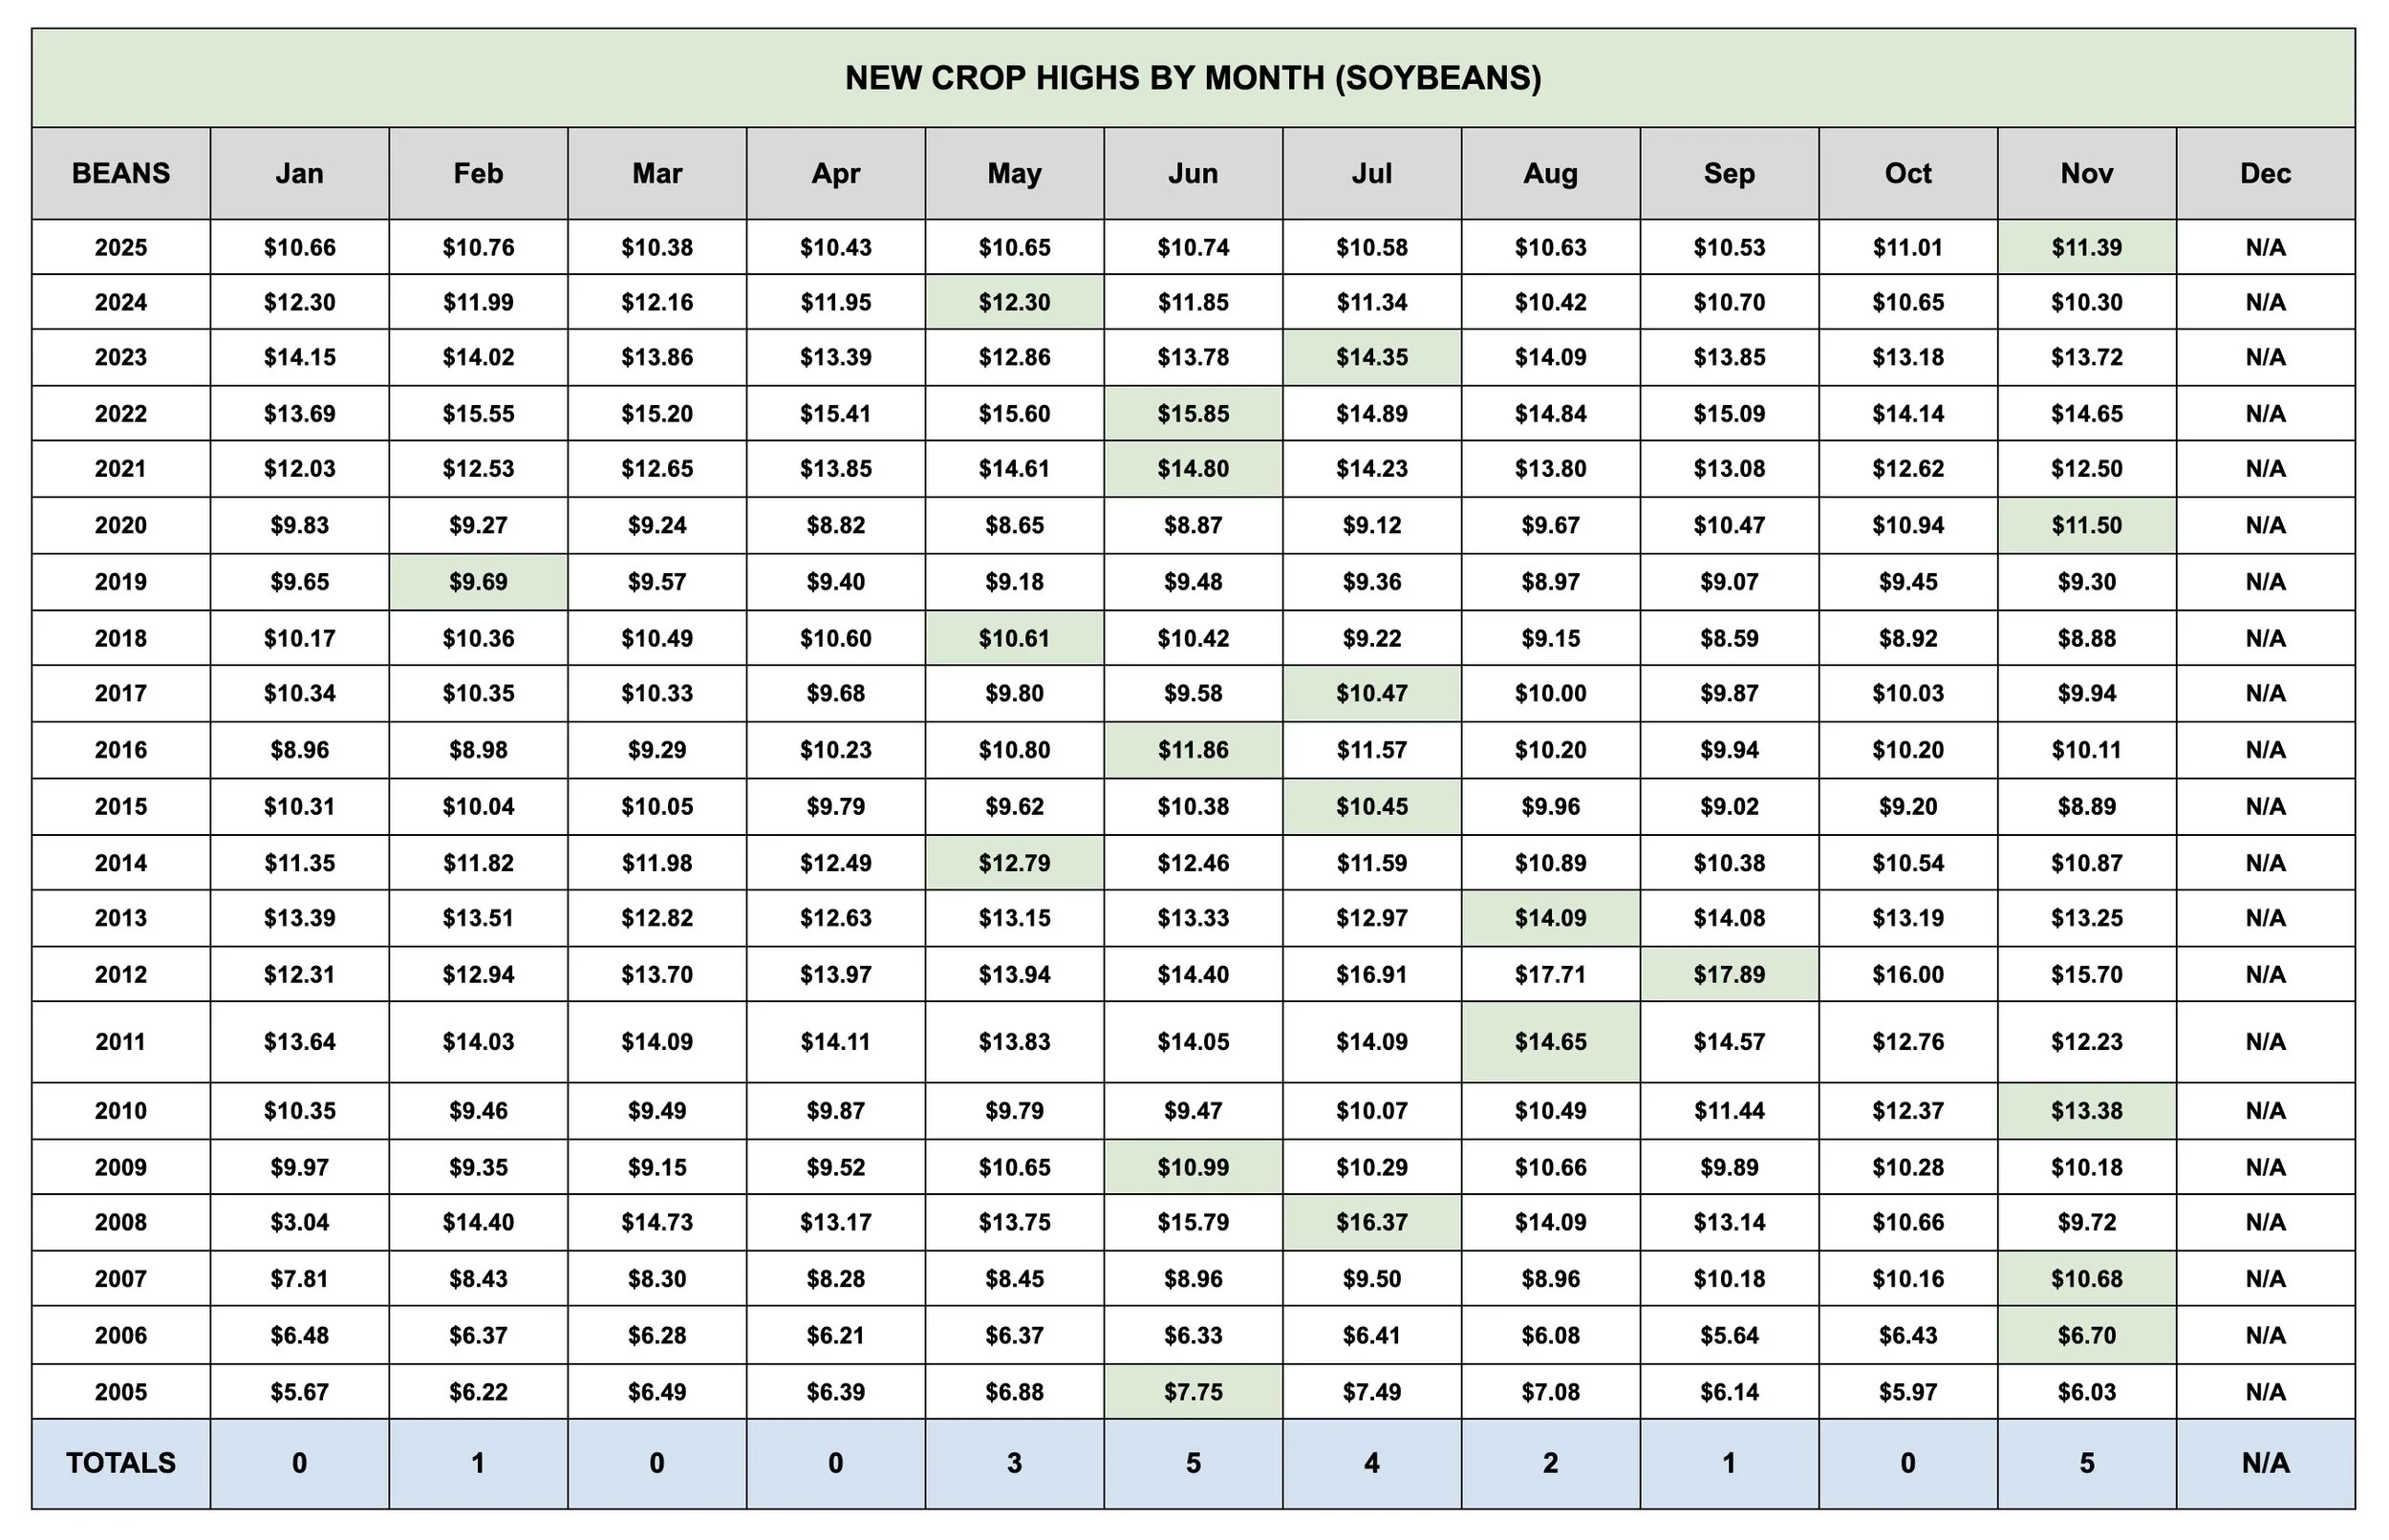
Here is Dec corn's highest price for every single month since 2005 to give you the full picture.
If we look at just the last decade, the top has primarily come between May and June.
They've marked the highs the last 6 of 10 years.
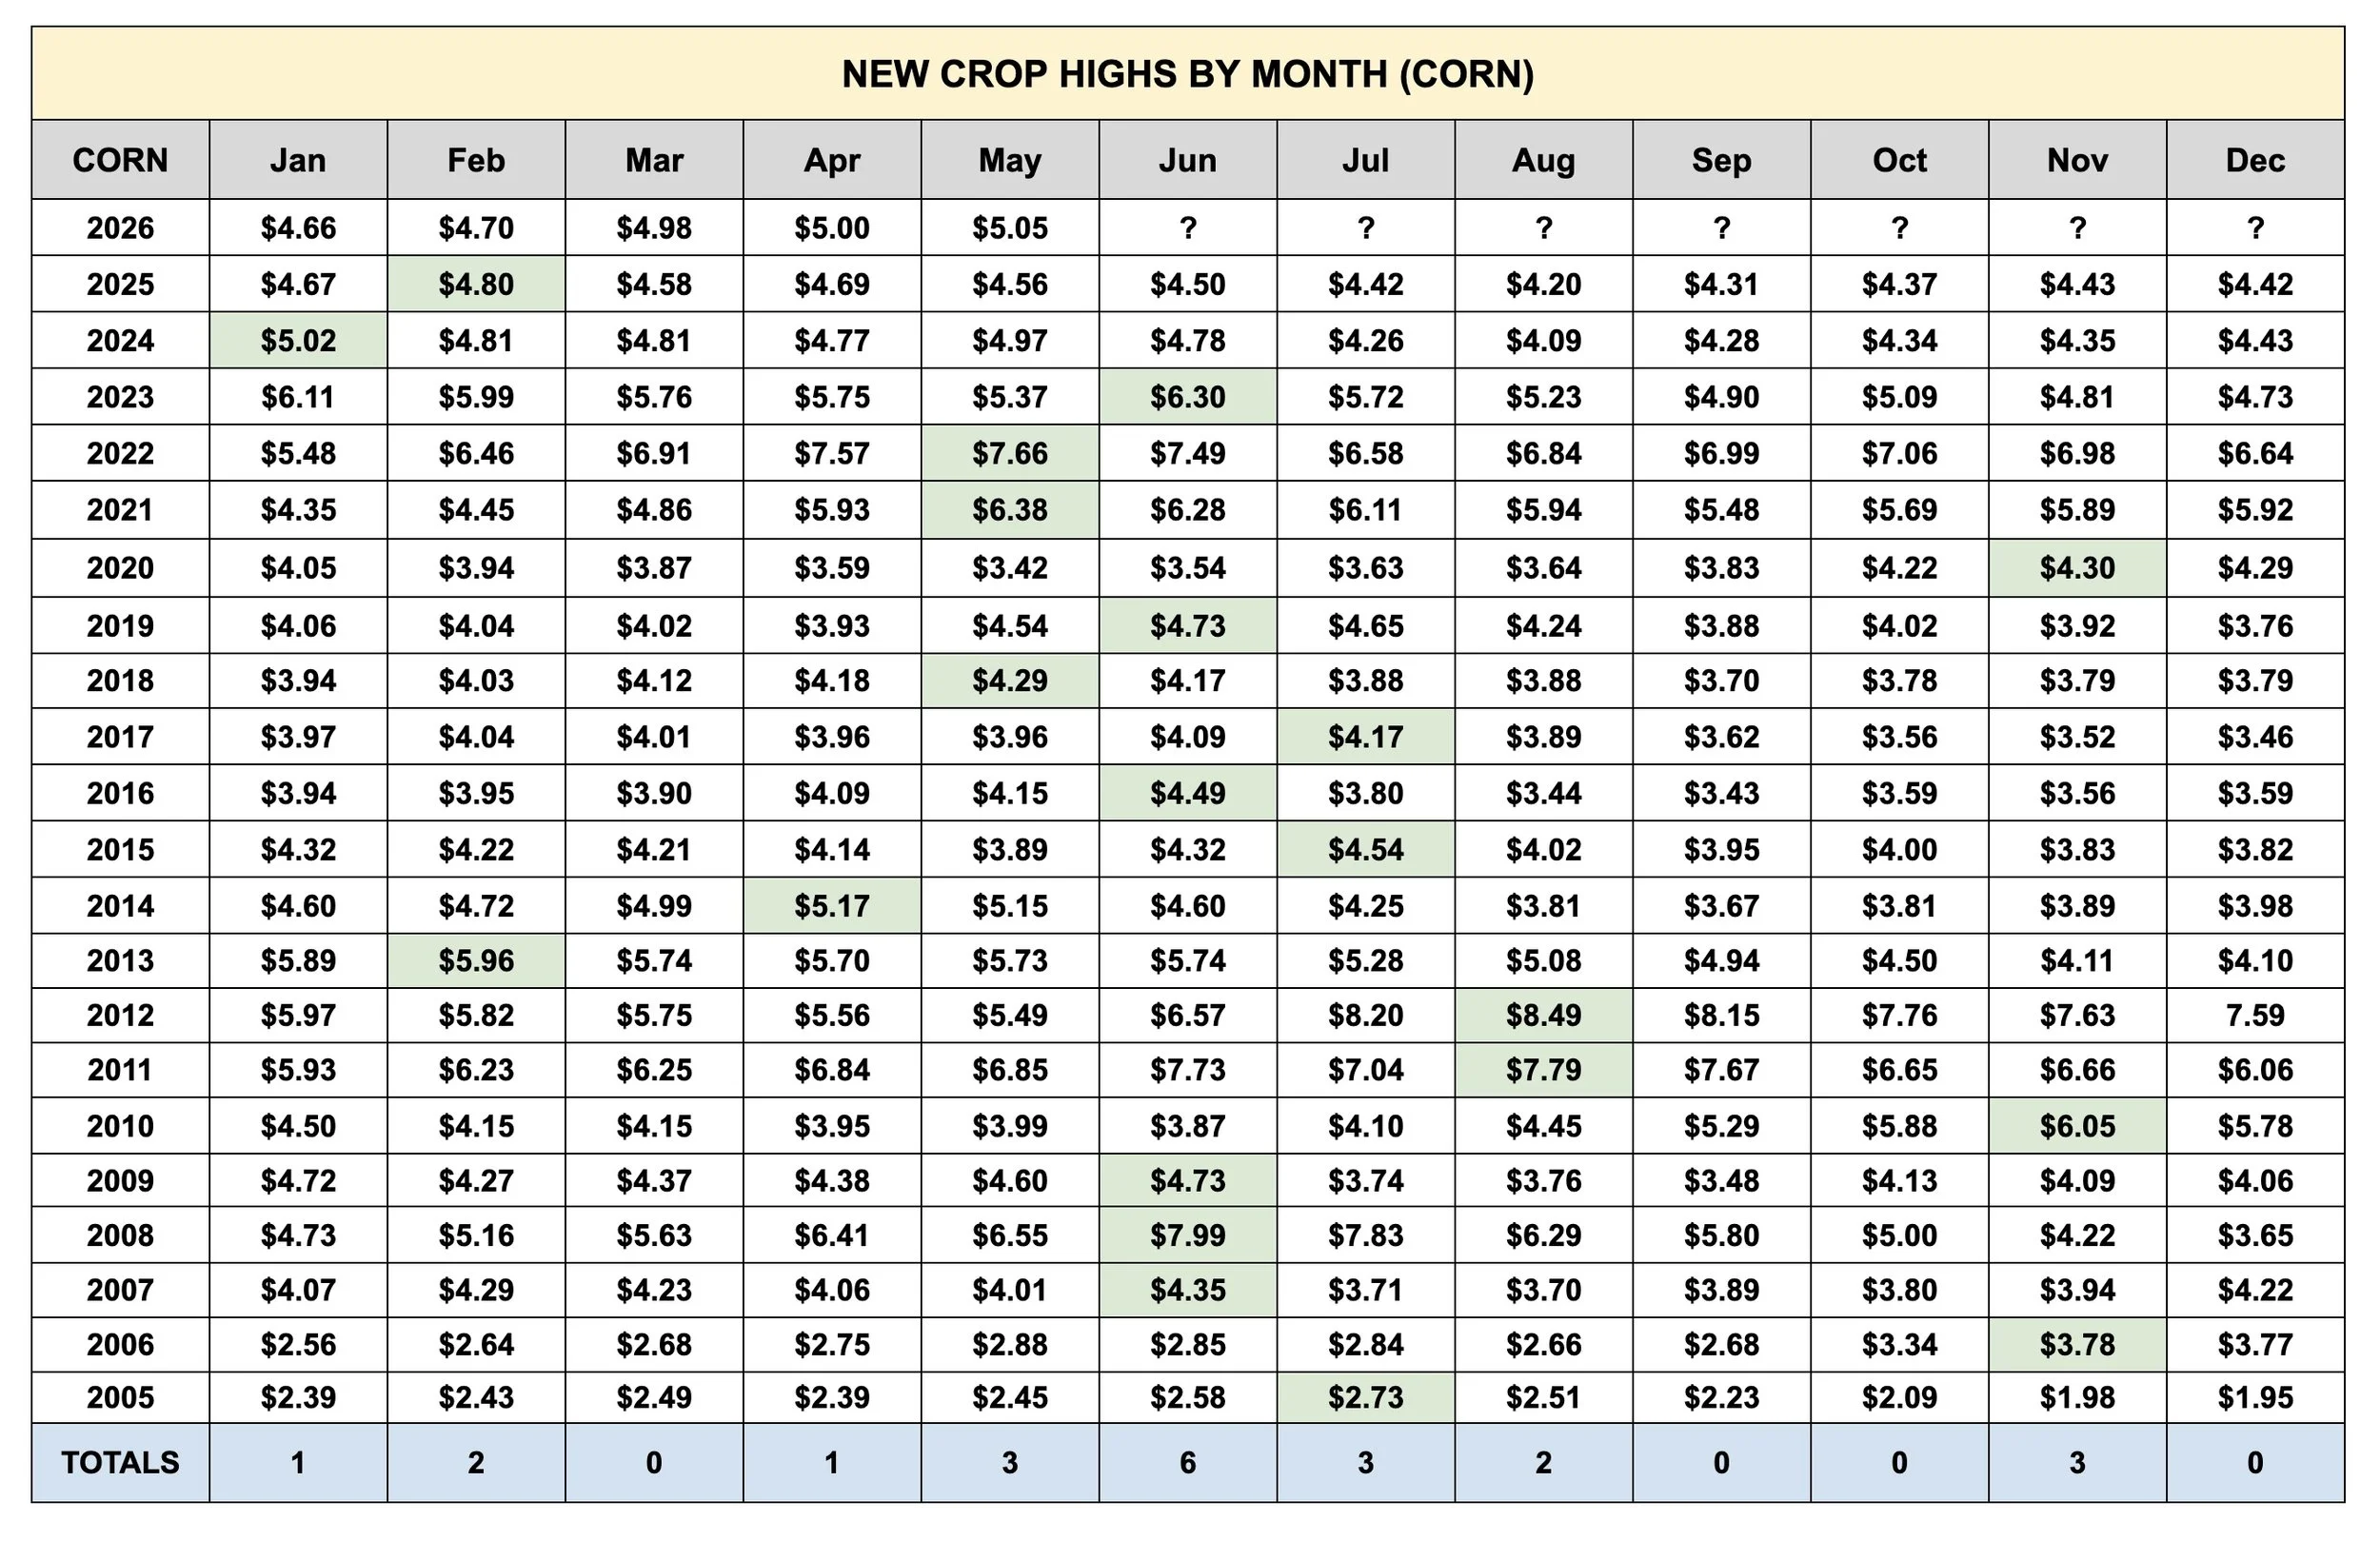
The last two years were unconventional. They featured 2 of the only 3 times we ever topped out before spring.
The only other time before the last two years was 2013. Which happened because prices were essentially in a free fall all year long coming off the record highs in 2012.
So 2024 and 2025 were anomalies. Where the market basically said prove me wrong early on, and there was never a real concern surrounding production.
Some other things to take note of:
We haven’t printed our highs in July since 2017.
Highs in July almost always have to come off the back of a weather scare.
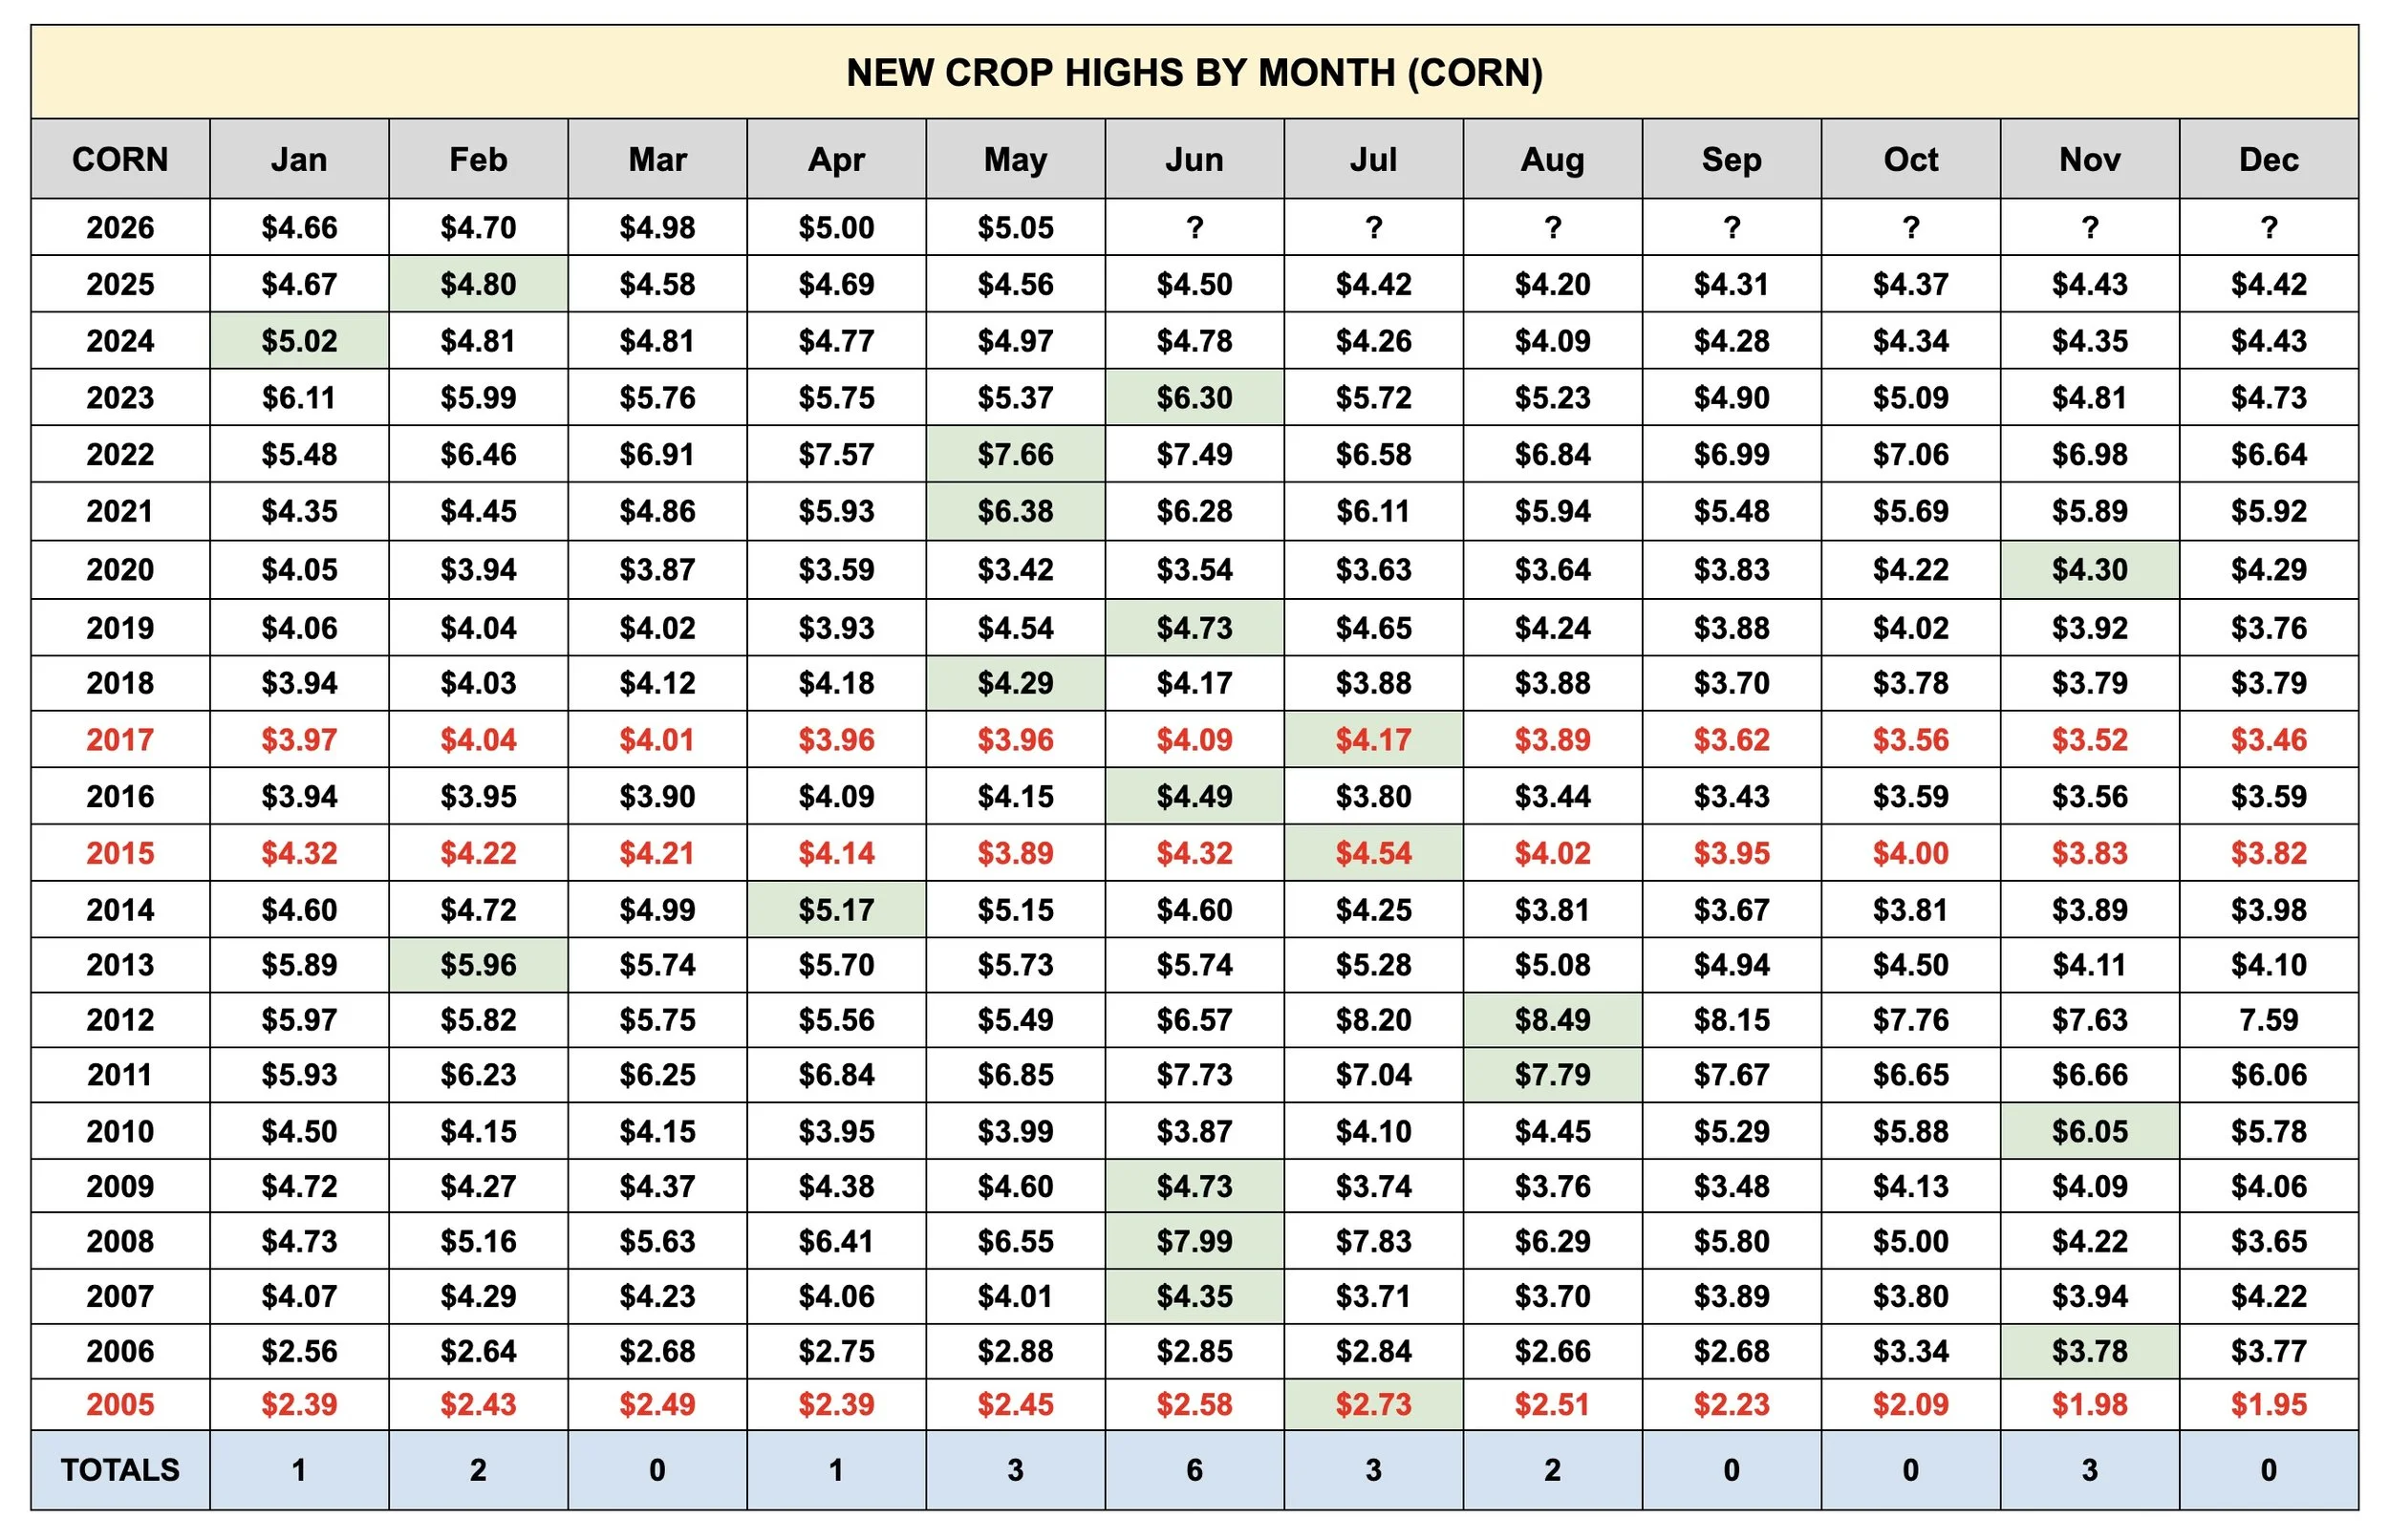
The last and only times we've ever printed our highs in August were back in both 2011 and 2012.
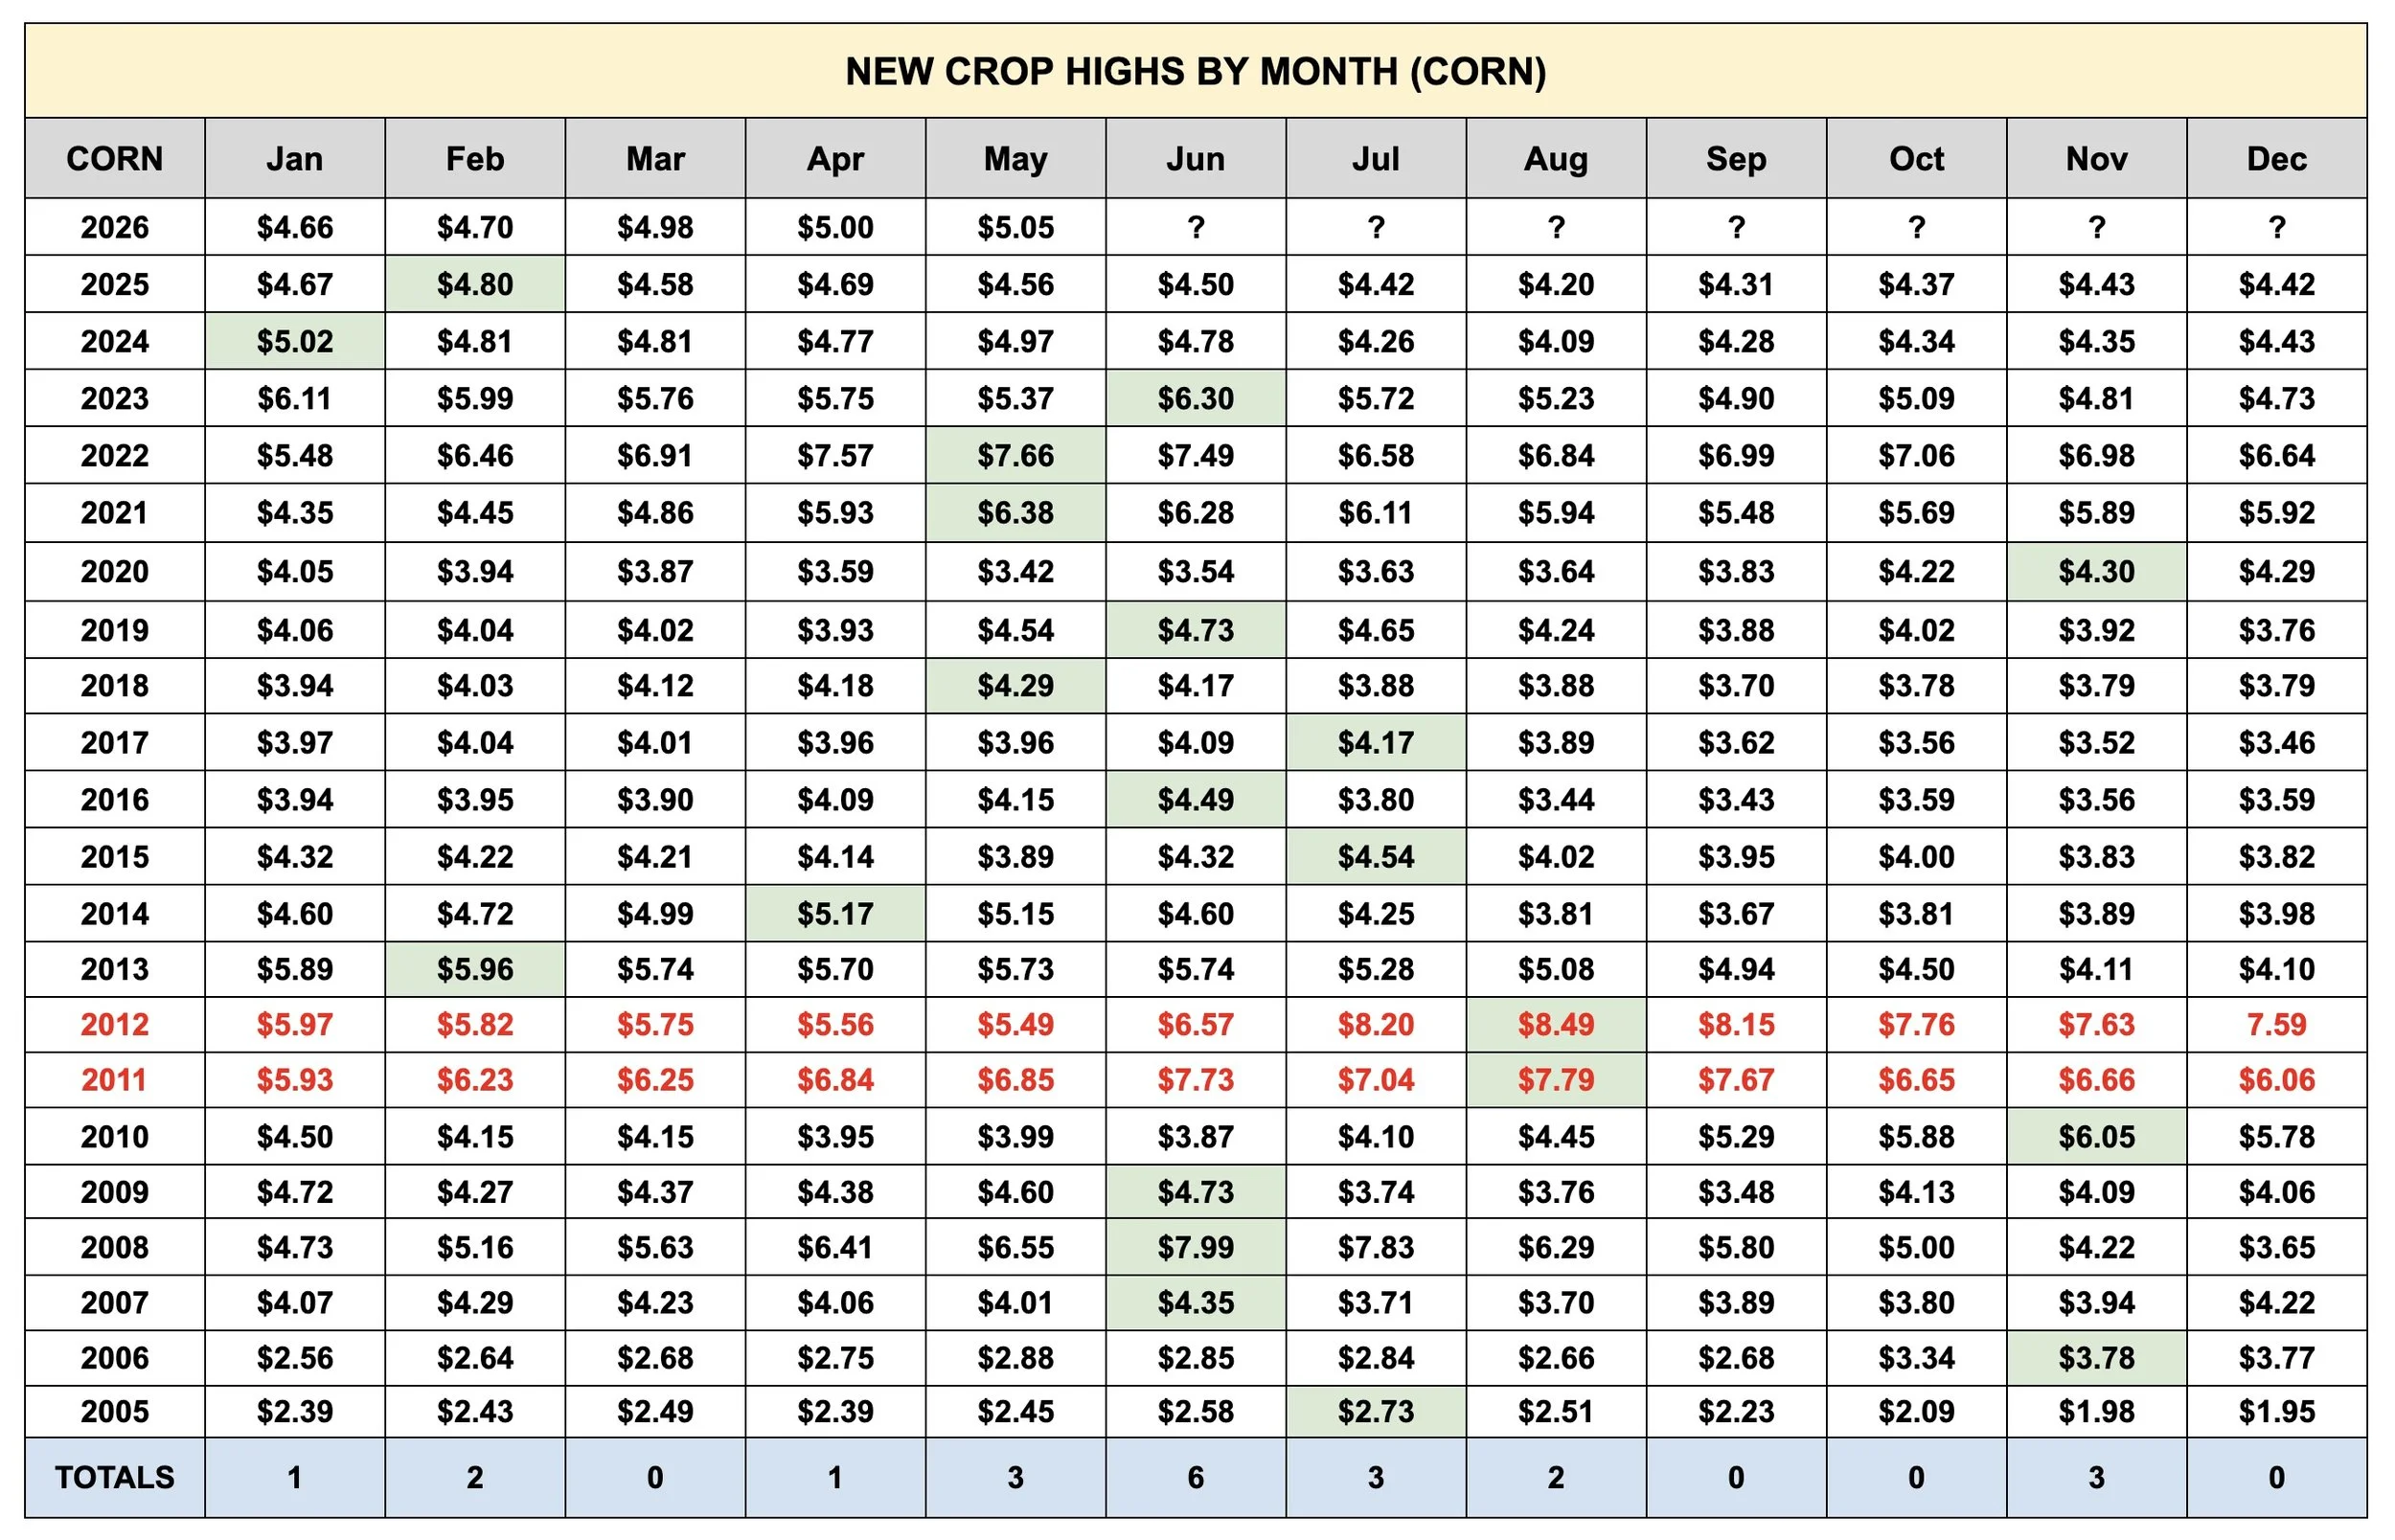
We rarely post our highest price for the year in November.
It's happened 3 times.
But what typically happens when we do?
2010 and 2020 were the last two times this happened.
Coincidentally, much higher prices followed over the next 1-2 years.
2010 to 2012.
2020 to 2022.
Could even argue that 2006 could be included in that data as well.
So if we post our highest price for the year at the end of the year, it could potentially be a sign that we are entering a bull market.

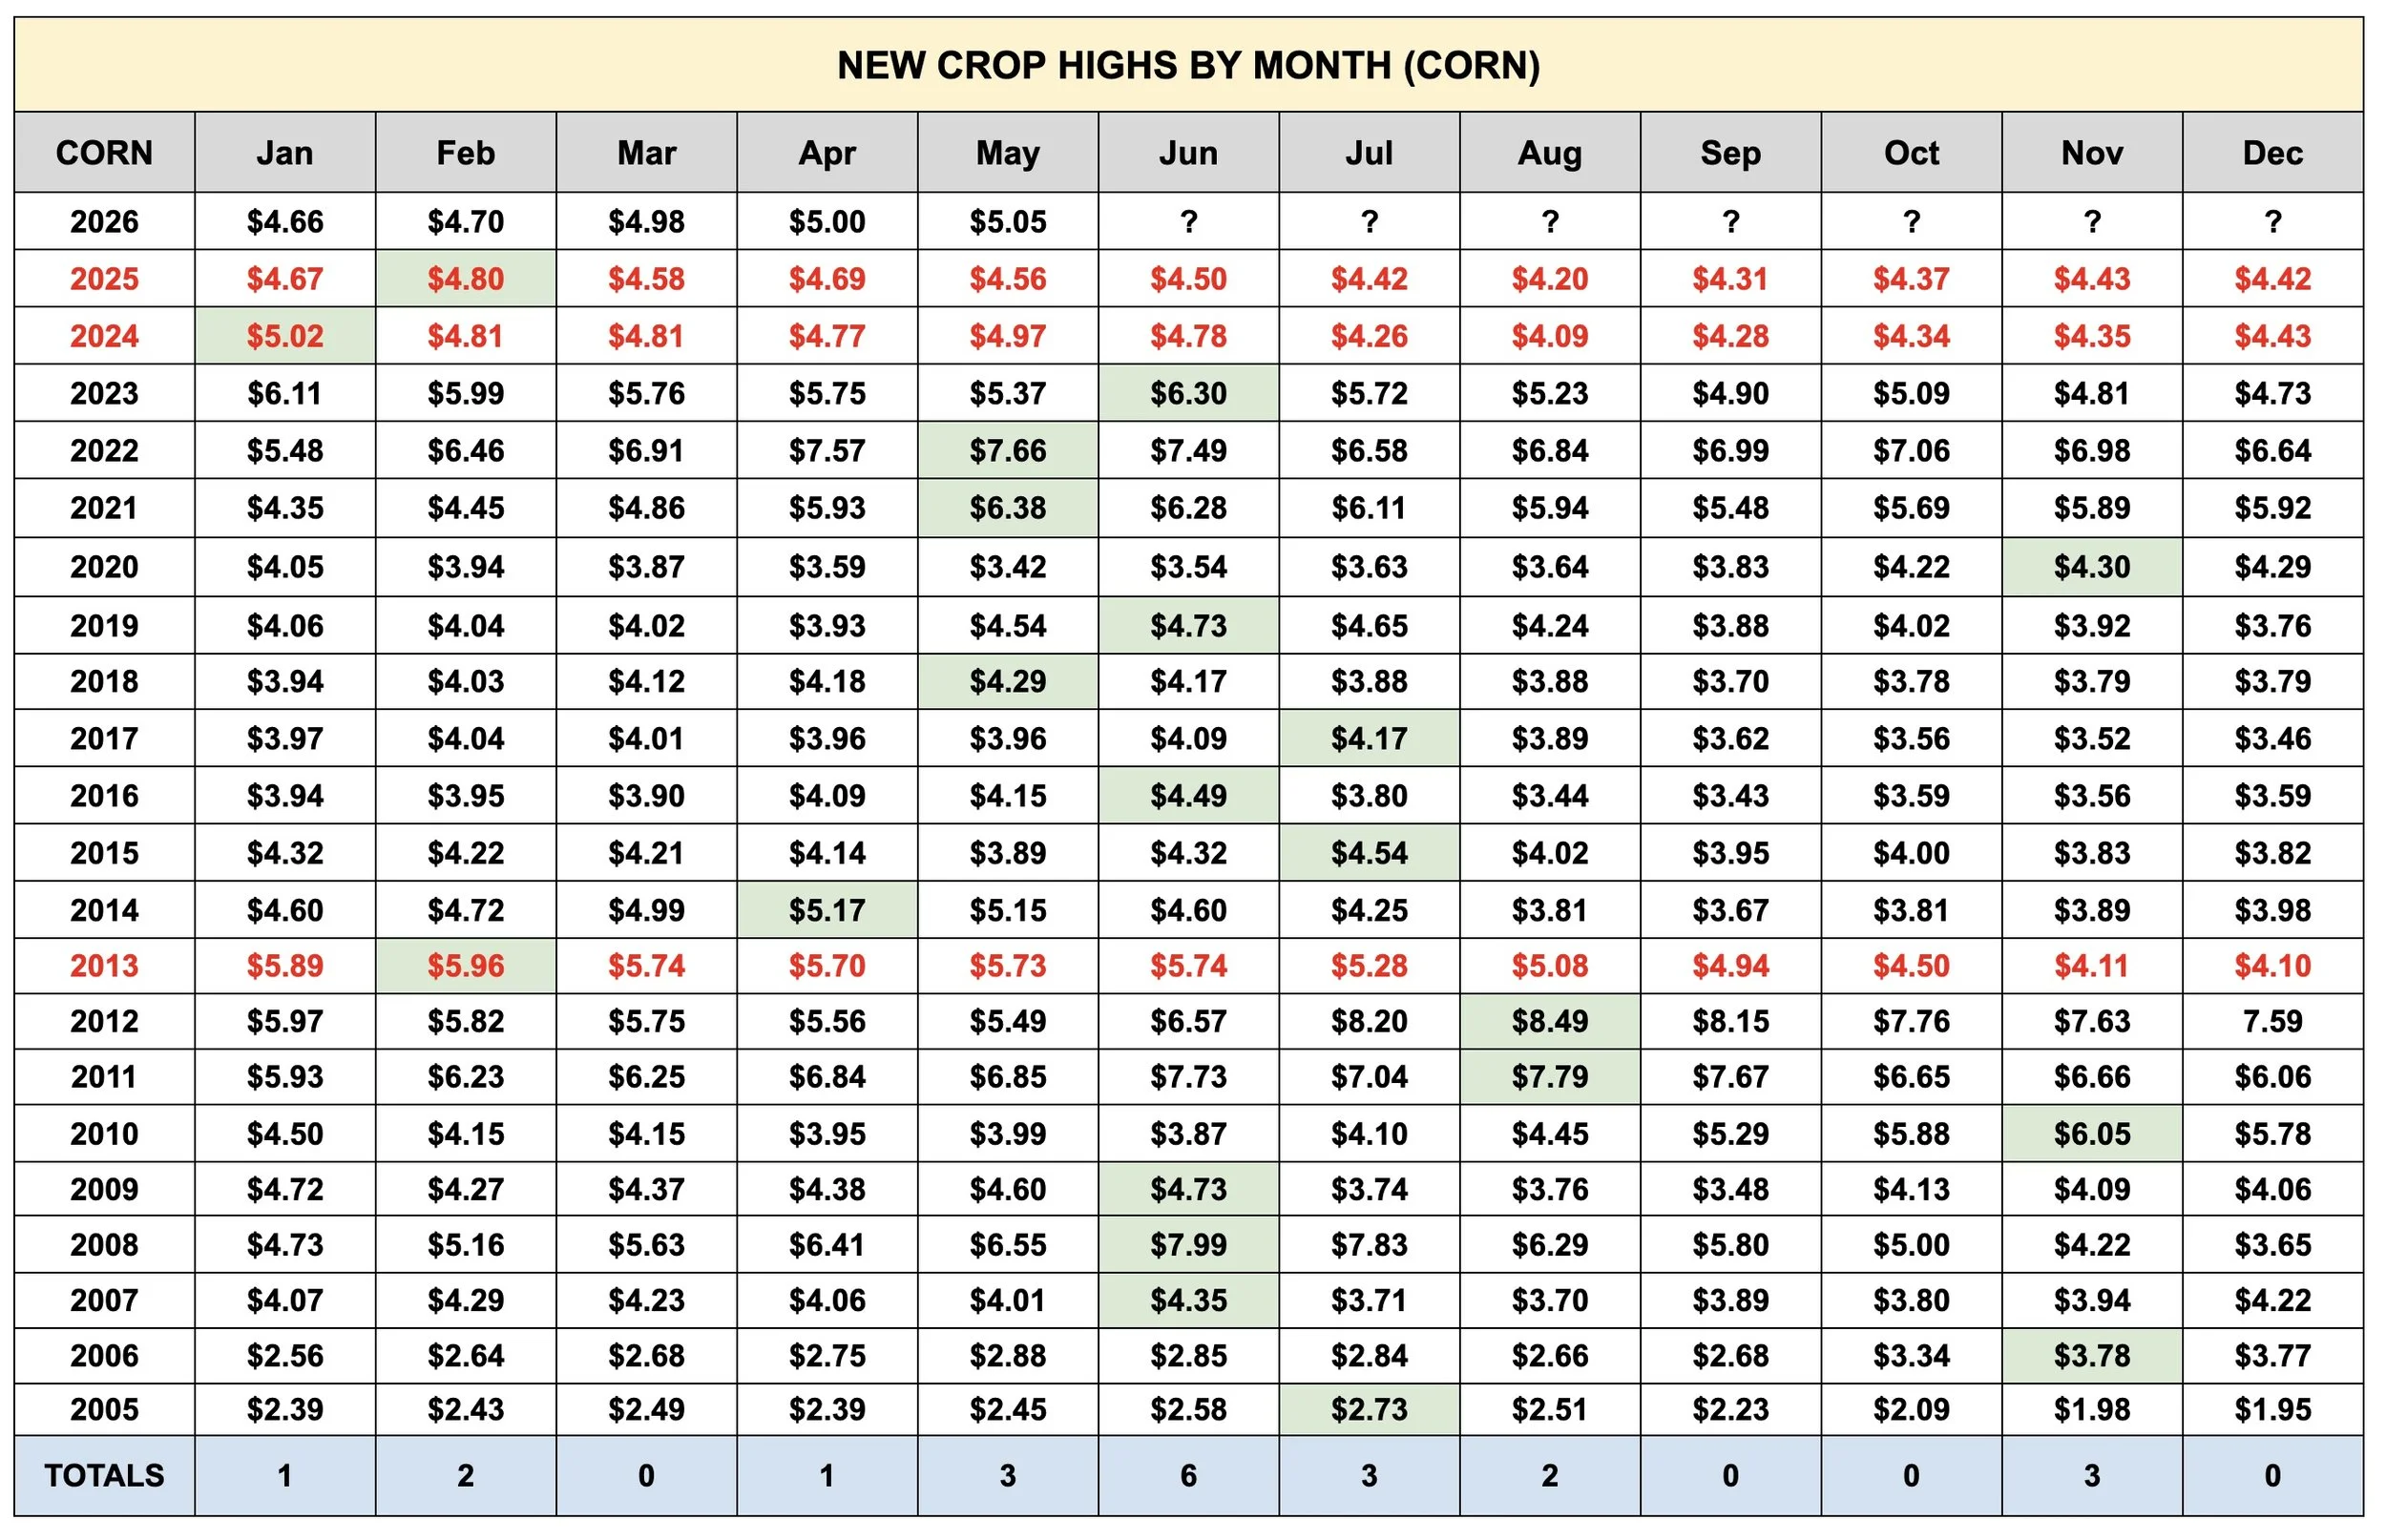
Seasonal Pressure:
I talked about this in my last update as well, but we are almost always trading lower from today by August.
Whether we go a lot higher first or not.
Eventually, we are almost inevitably lower by harvest.
That is why right now and until the middle of June is THE window.
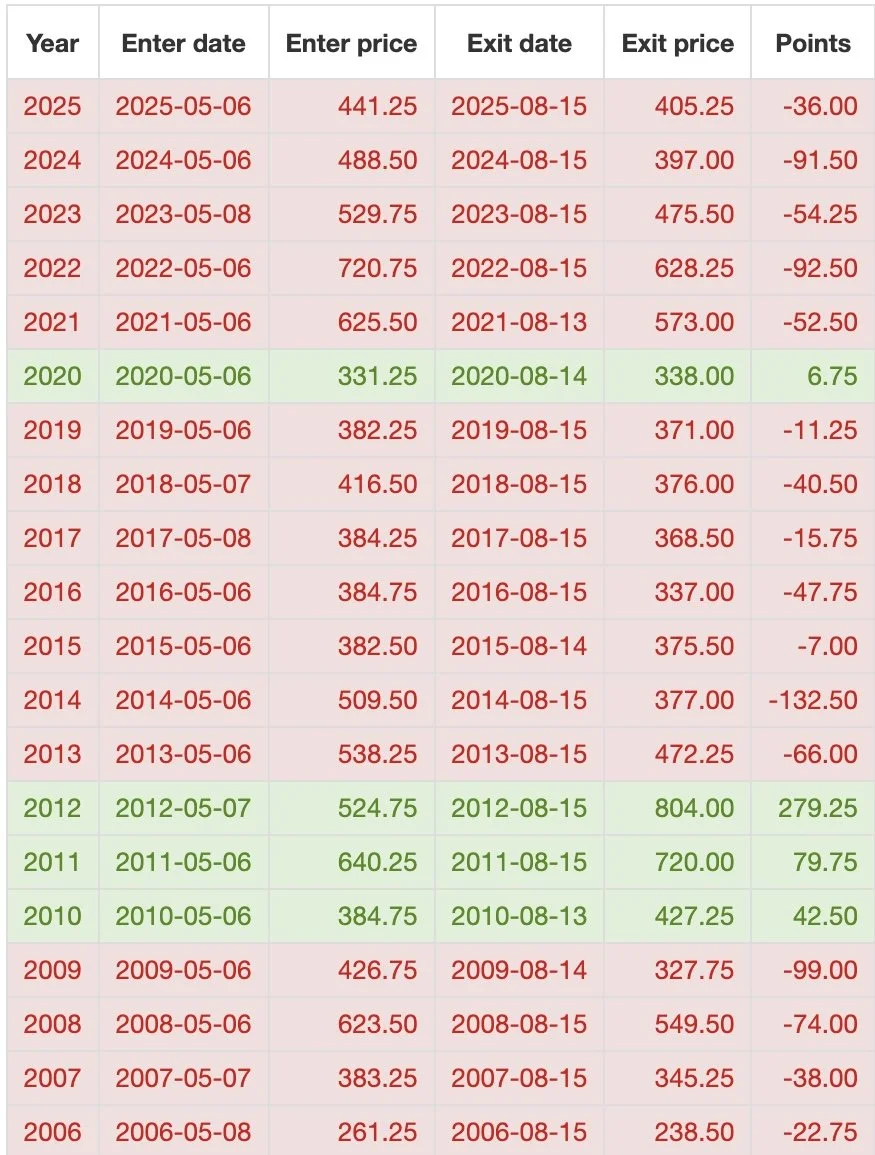
From today's date by the middle of August, we've been lower the last 12 of 13 years.
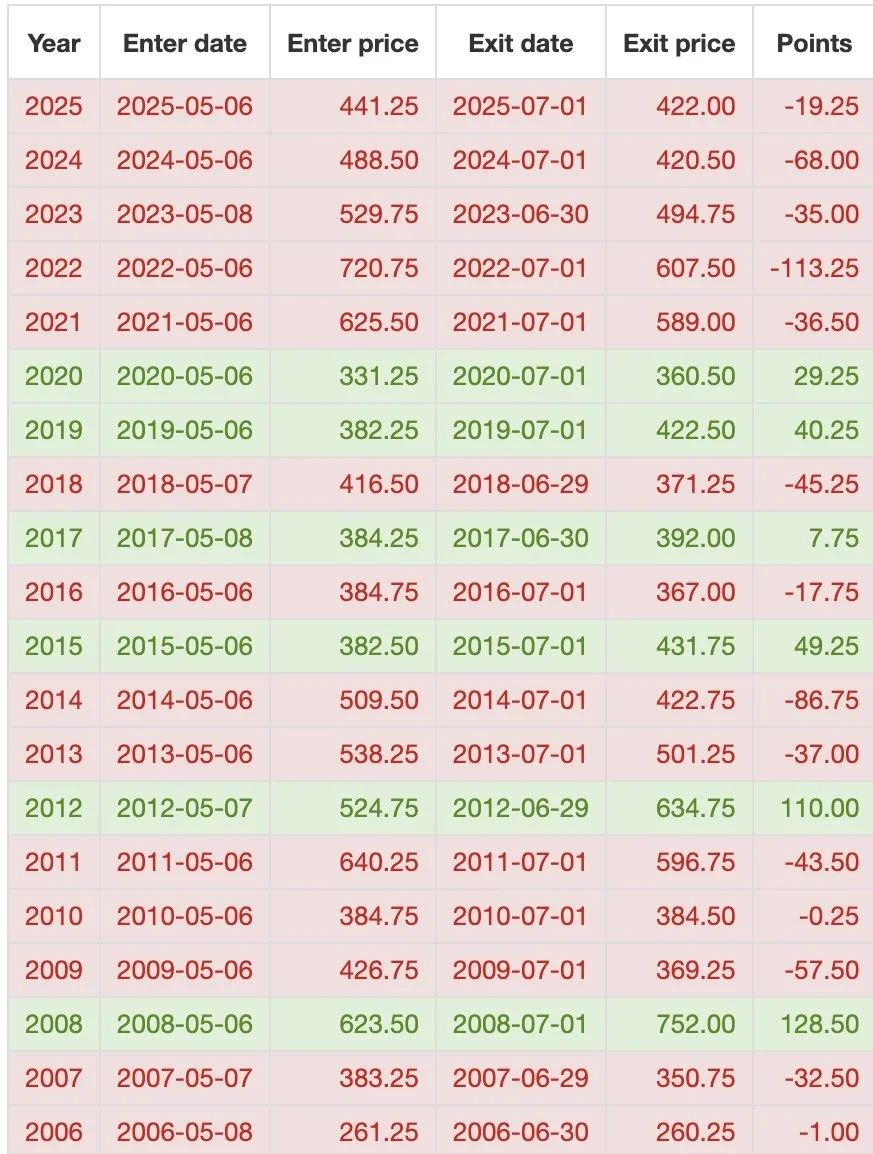
Even if you move that data from the middle of August and put it at July 1st instead, the data is still compelling.
From today's date by July 1st, we've been lower the last 7 of 10 years.
And it's happened 5 years in a row now.
Which is why most of the time, we want to have a good chunk of stuff priced before that 4th of July weekend. Especially for those who lack storage.
History favors lower prices by both July and August. Unless you get a true weather scare, then it can happen a little later.
You could argue that yes, this is not a normal year with the war and everything we have going on. But this is what the data tells us historically.
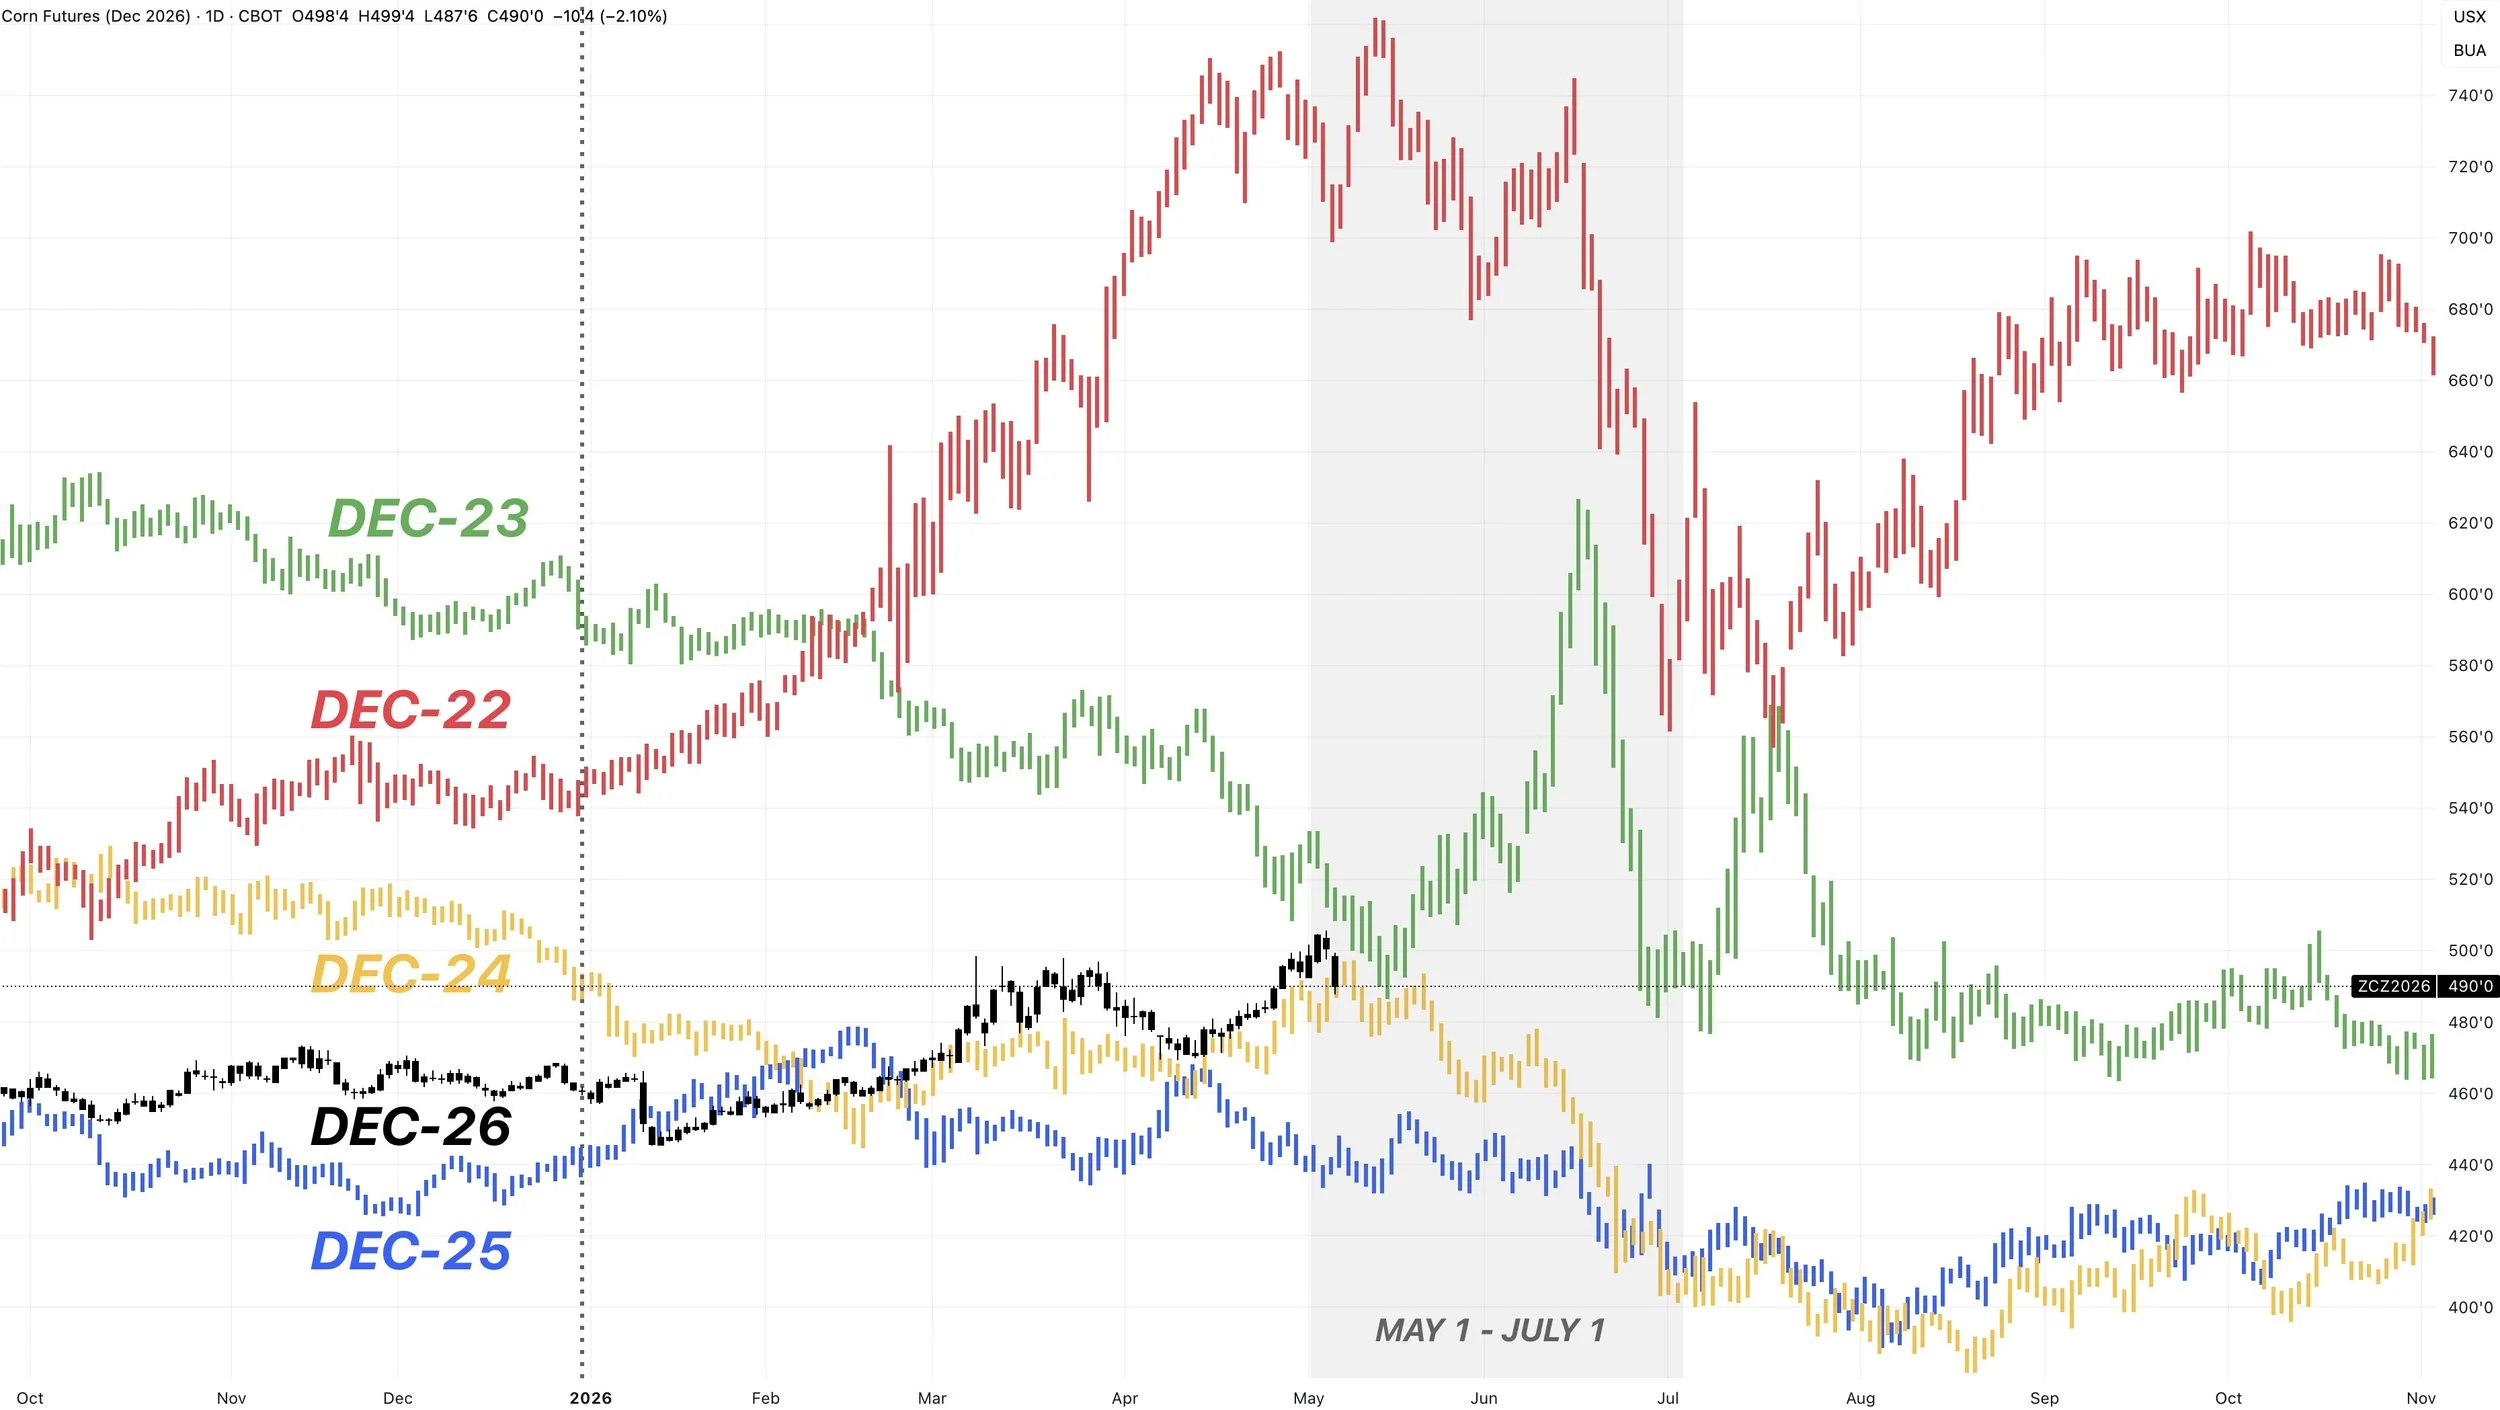
Here is a chart that shows the last 4 years of price action stacked up against this year.
Right now, Dec corn is still trading at it's highest levels since 2023.
Although I still think corn has potential, if you are someone who is behind etc you cannot ignore 3-year highs.
The one thing the last 4 years all have in common?
All were lower by July 1st.
2023's weather scare. 2022's bull market. All lower by July 1st.
Even though the last two years didn’t feature a conventional seasonal rally. Both ultimately suffered seasonal pressure.
We can potentially go higher from here. The point is that the window of opportunity is here, and it usually doesn’t last longer than the next month or so.
That doesn’t mean we can’t be higher later this year or by early next year, as I do think new crop has a compelling story looking towards next year.
But even in some bull market years, we sold off heading into August before going on a bull run after finding lows at harvest.
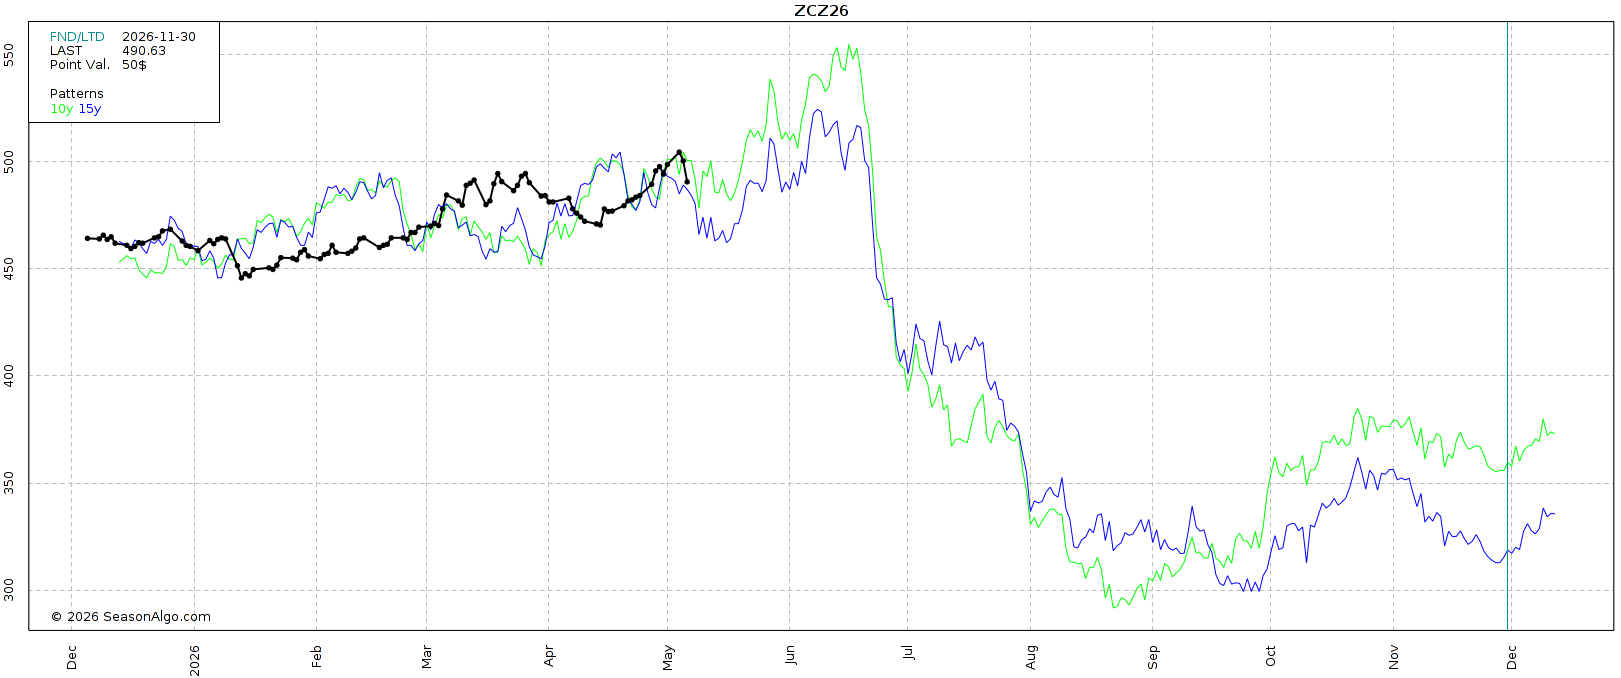
Next let's look at the actual seasonal patterns.
How does the 5-year compare to the 10-year or the 15-year?
First here is the 10-year and 15-year.
They are pretty similar.
Both feature us topping in early to mid-June.
Before falling apart until August or September.
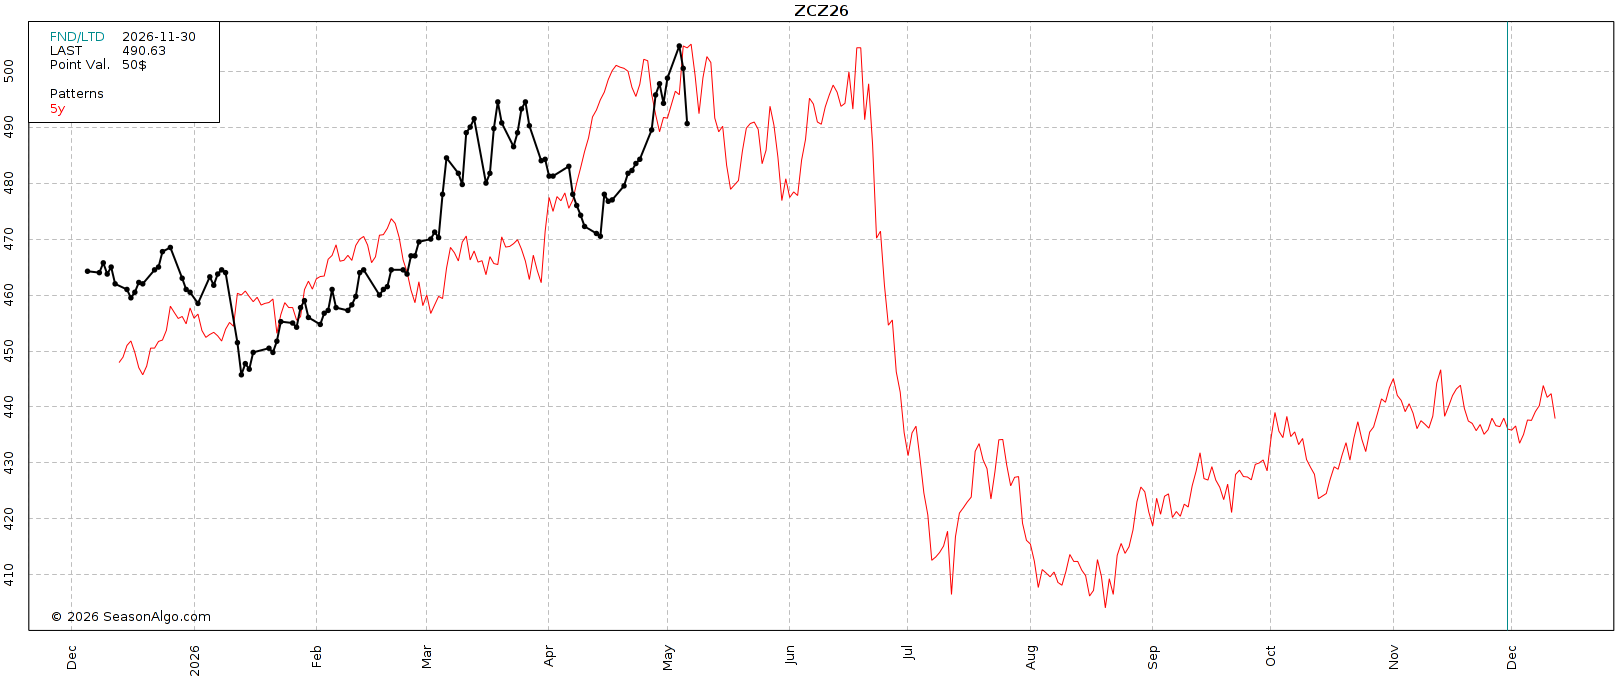
Here is the 5-year.
We on average have made one top in early May, then make another top in June.
Before falling apart heading into July and August.
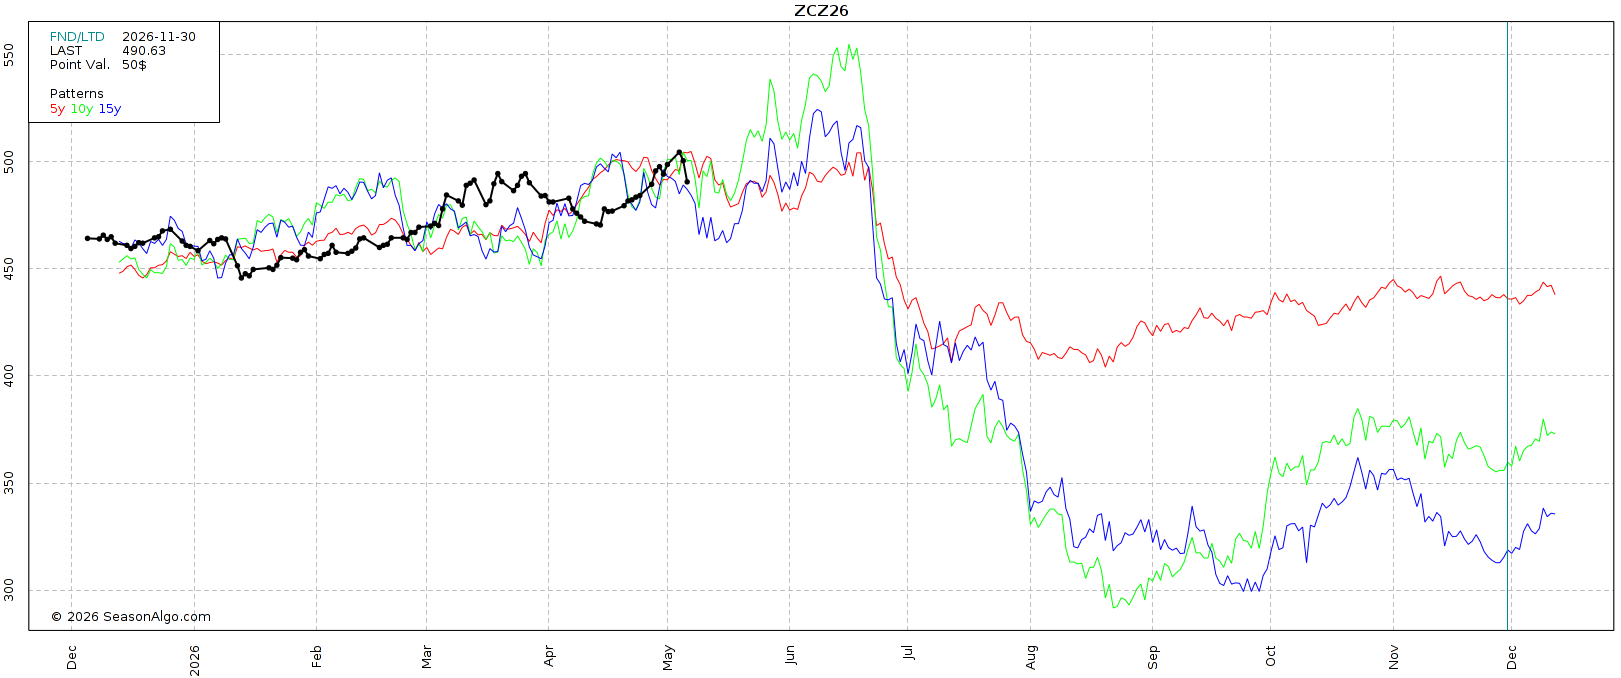
If we compare them, there are a few differences.
The 5-year has seen less of a June pop compared to the 10-year and 15-year.
During the last 5-years, the sell off going into harvest hasn’t been quiet as deep, and has bottomed earlier.
For example, in the 5-year we sell off going into July but don’t really venture too far below those July lows. Before really carving out some lows in August.
Where as in the 10-year we collapse until late August, and in the 15-year we fall apart until September.
So as of recently, the harvest lows have been coming sooner, and have been getting shallower.
Regardless, we "almost always" get that sell off.
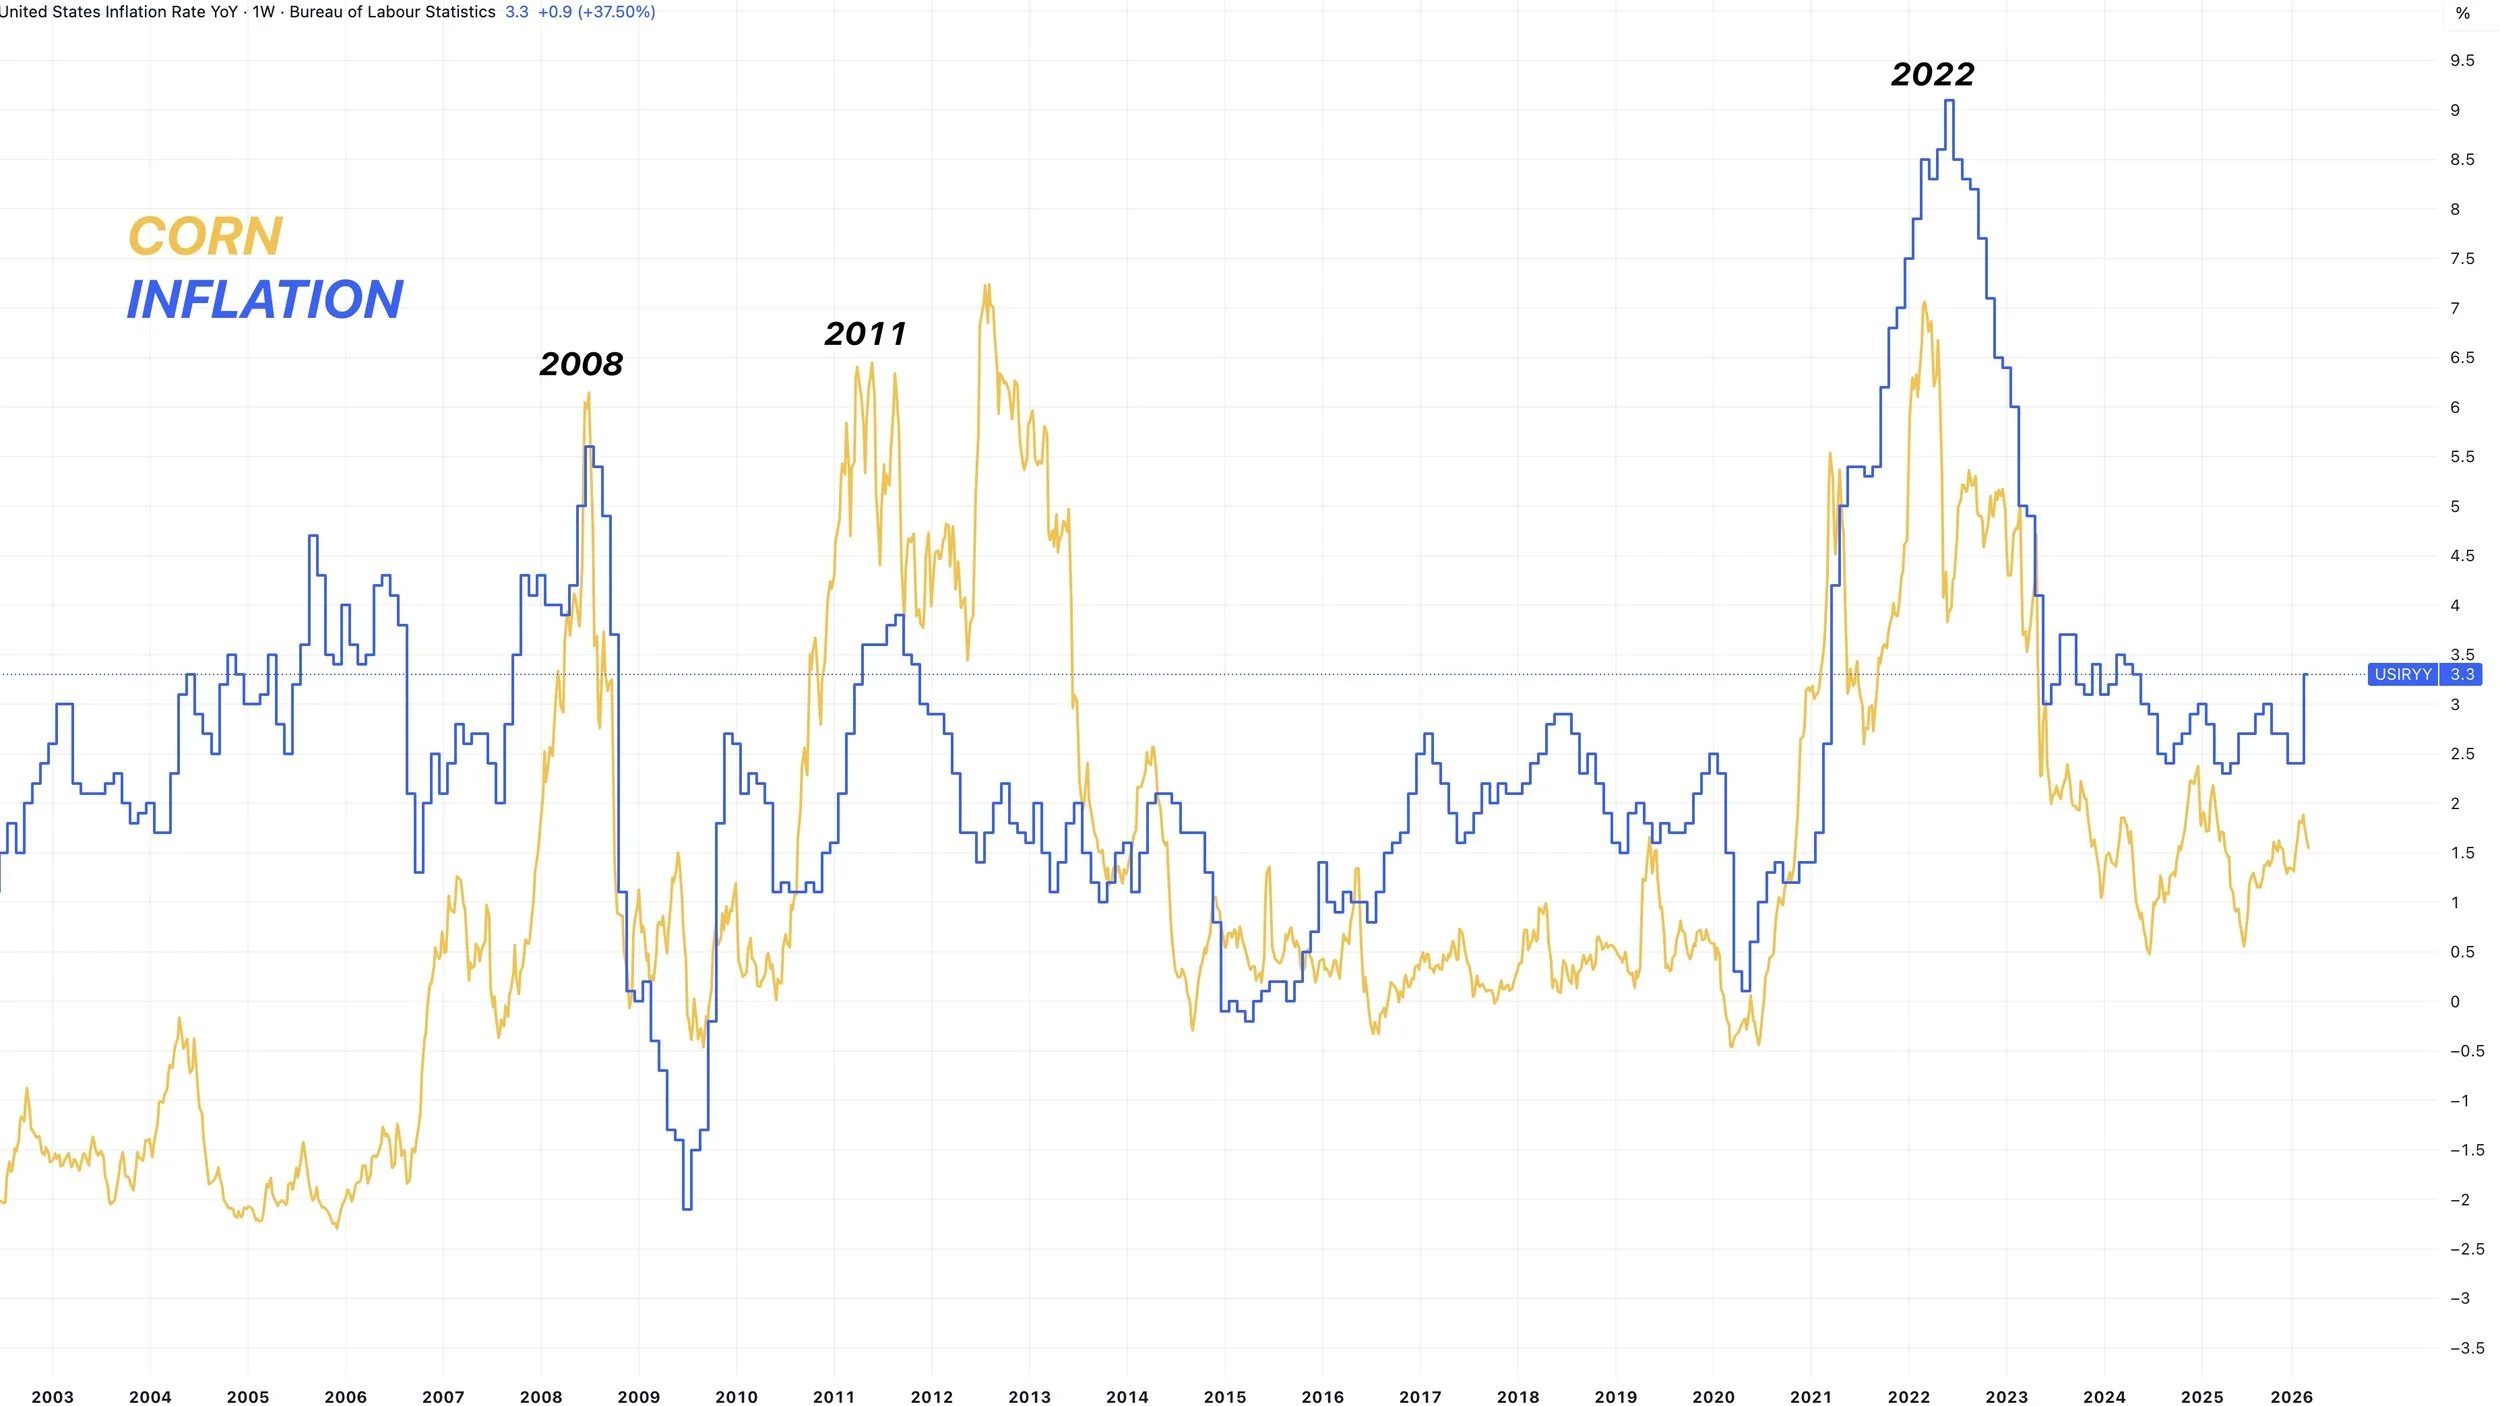
Crude vs Corn vs Inflation:
I haven’t shown these charts in a while.
But at some point, either crude has to come down, or corn might have to go higher.
We are in month 3 of crude beyond $90.
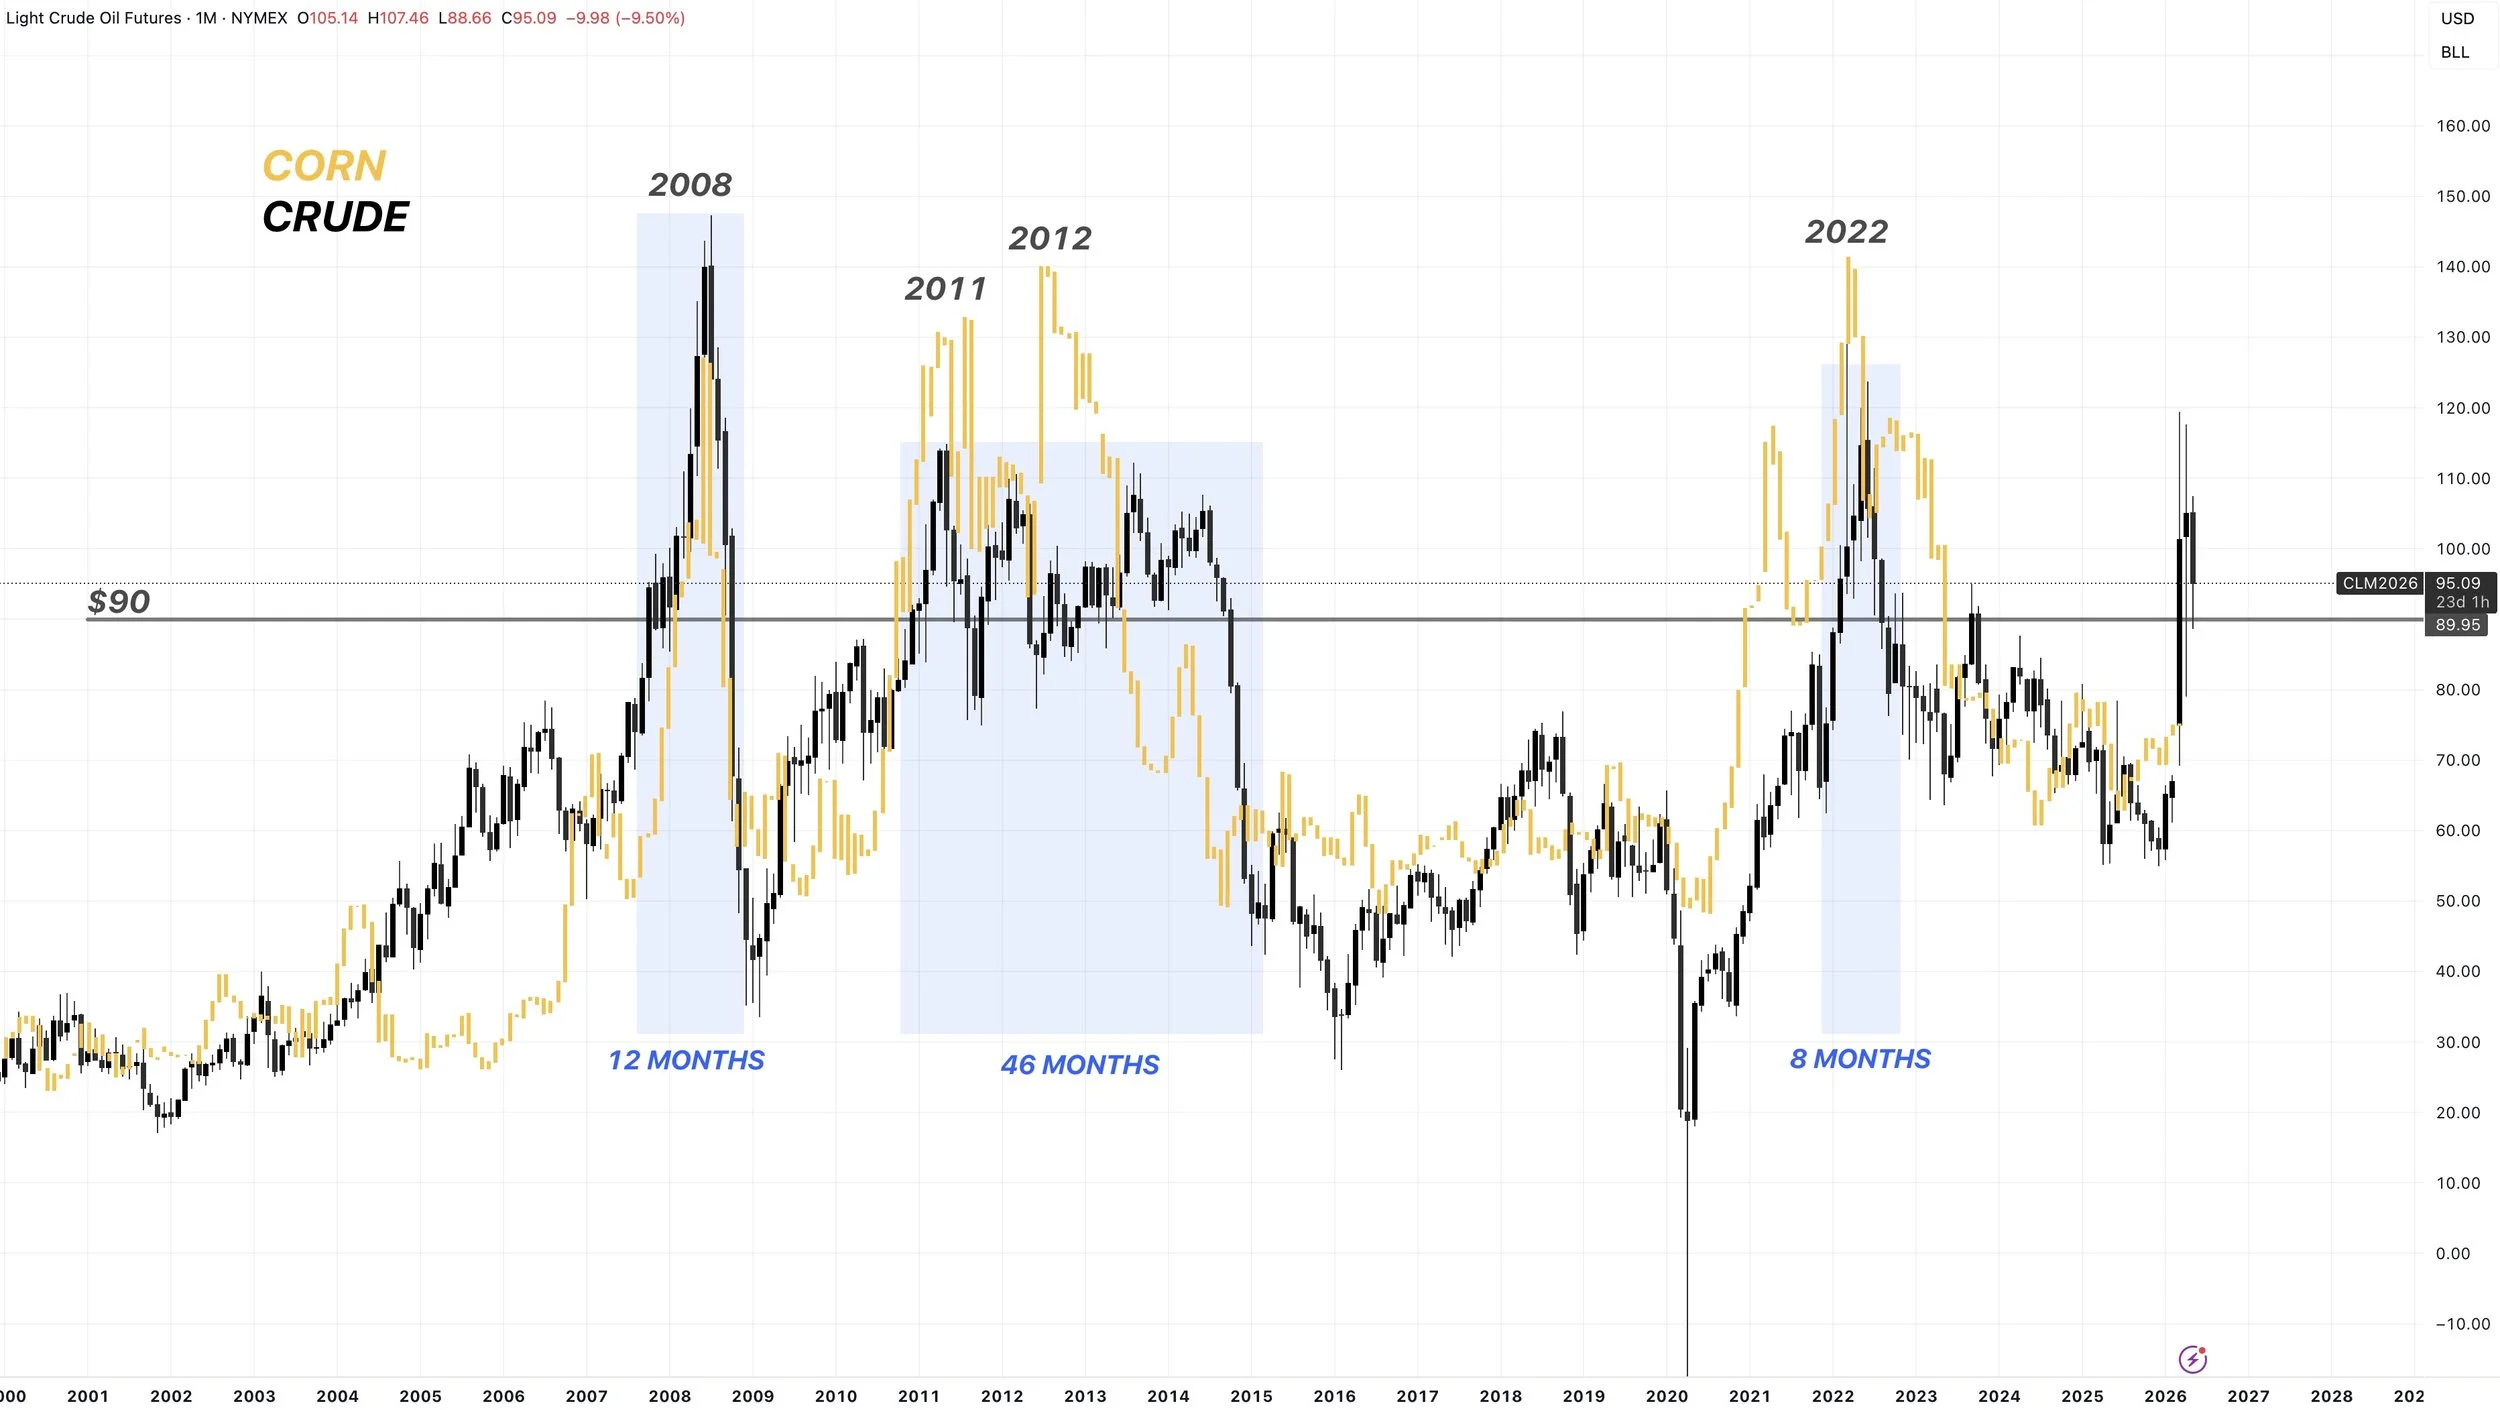
If crude is still at these levels several months from now, it could lead to higher inflation.
Long term, if inflation soars, grains tend to follow suit.
I mean it is the common factor, as each bull market has featured it.
I'm talking long term potentially over the next year or two, not tomorrow.
But of course, if inflation goes up, so will the cost of production.
That's a topic for another day if we start to see inflation rocket higher. As it's still just a big "what if" scenario.
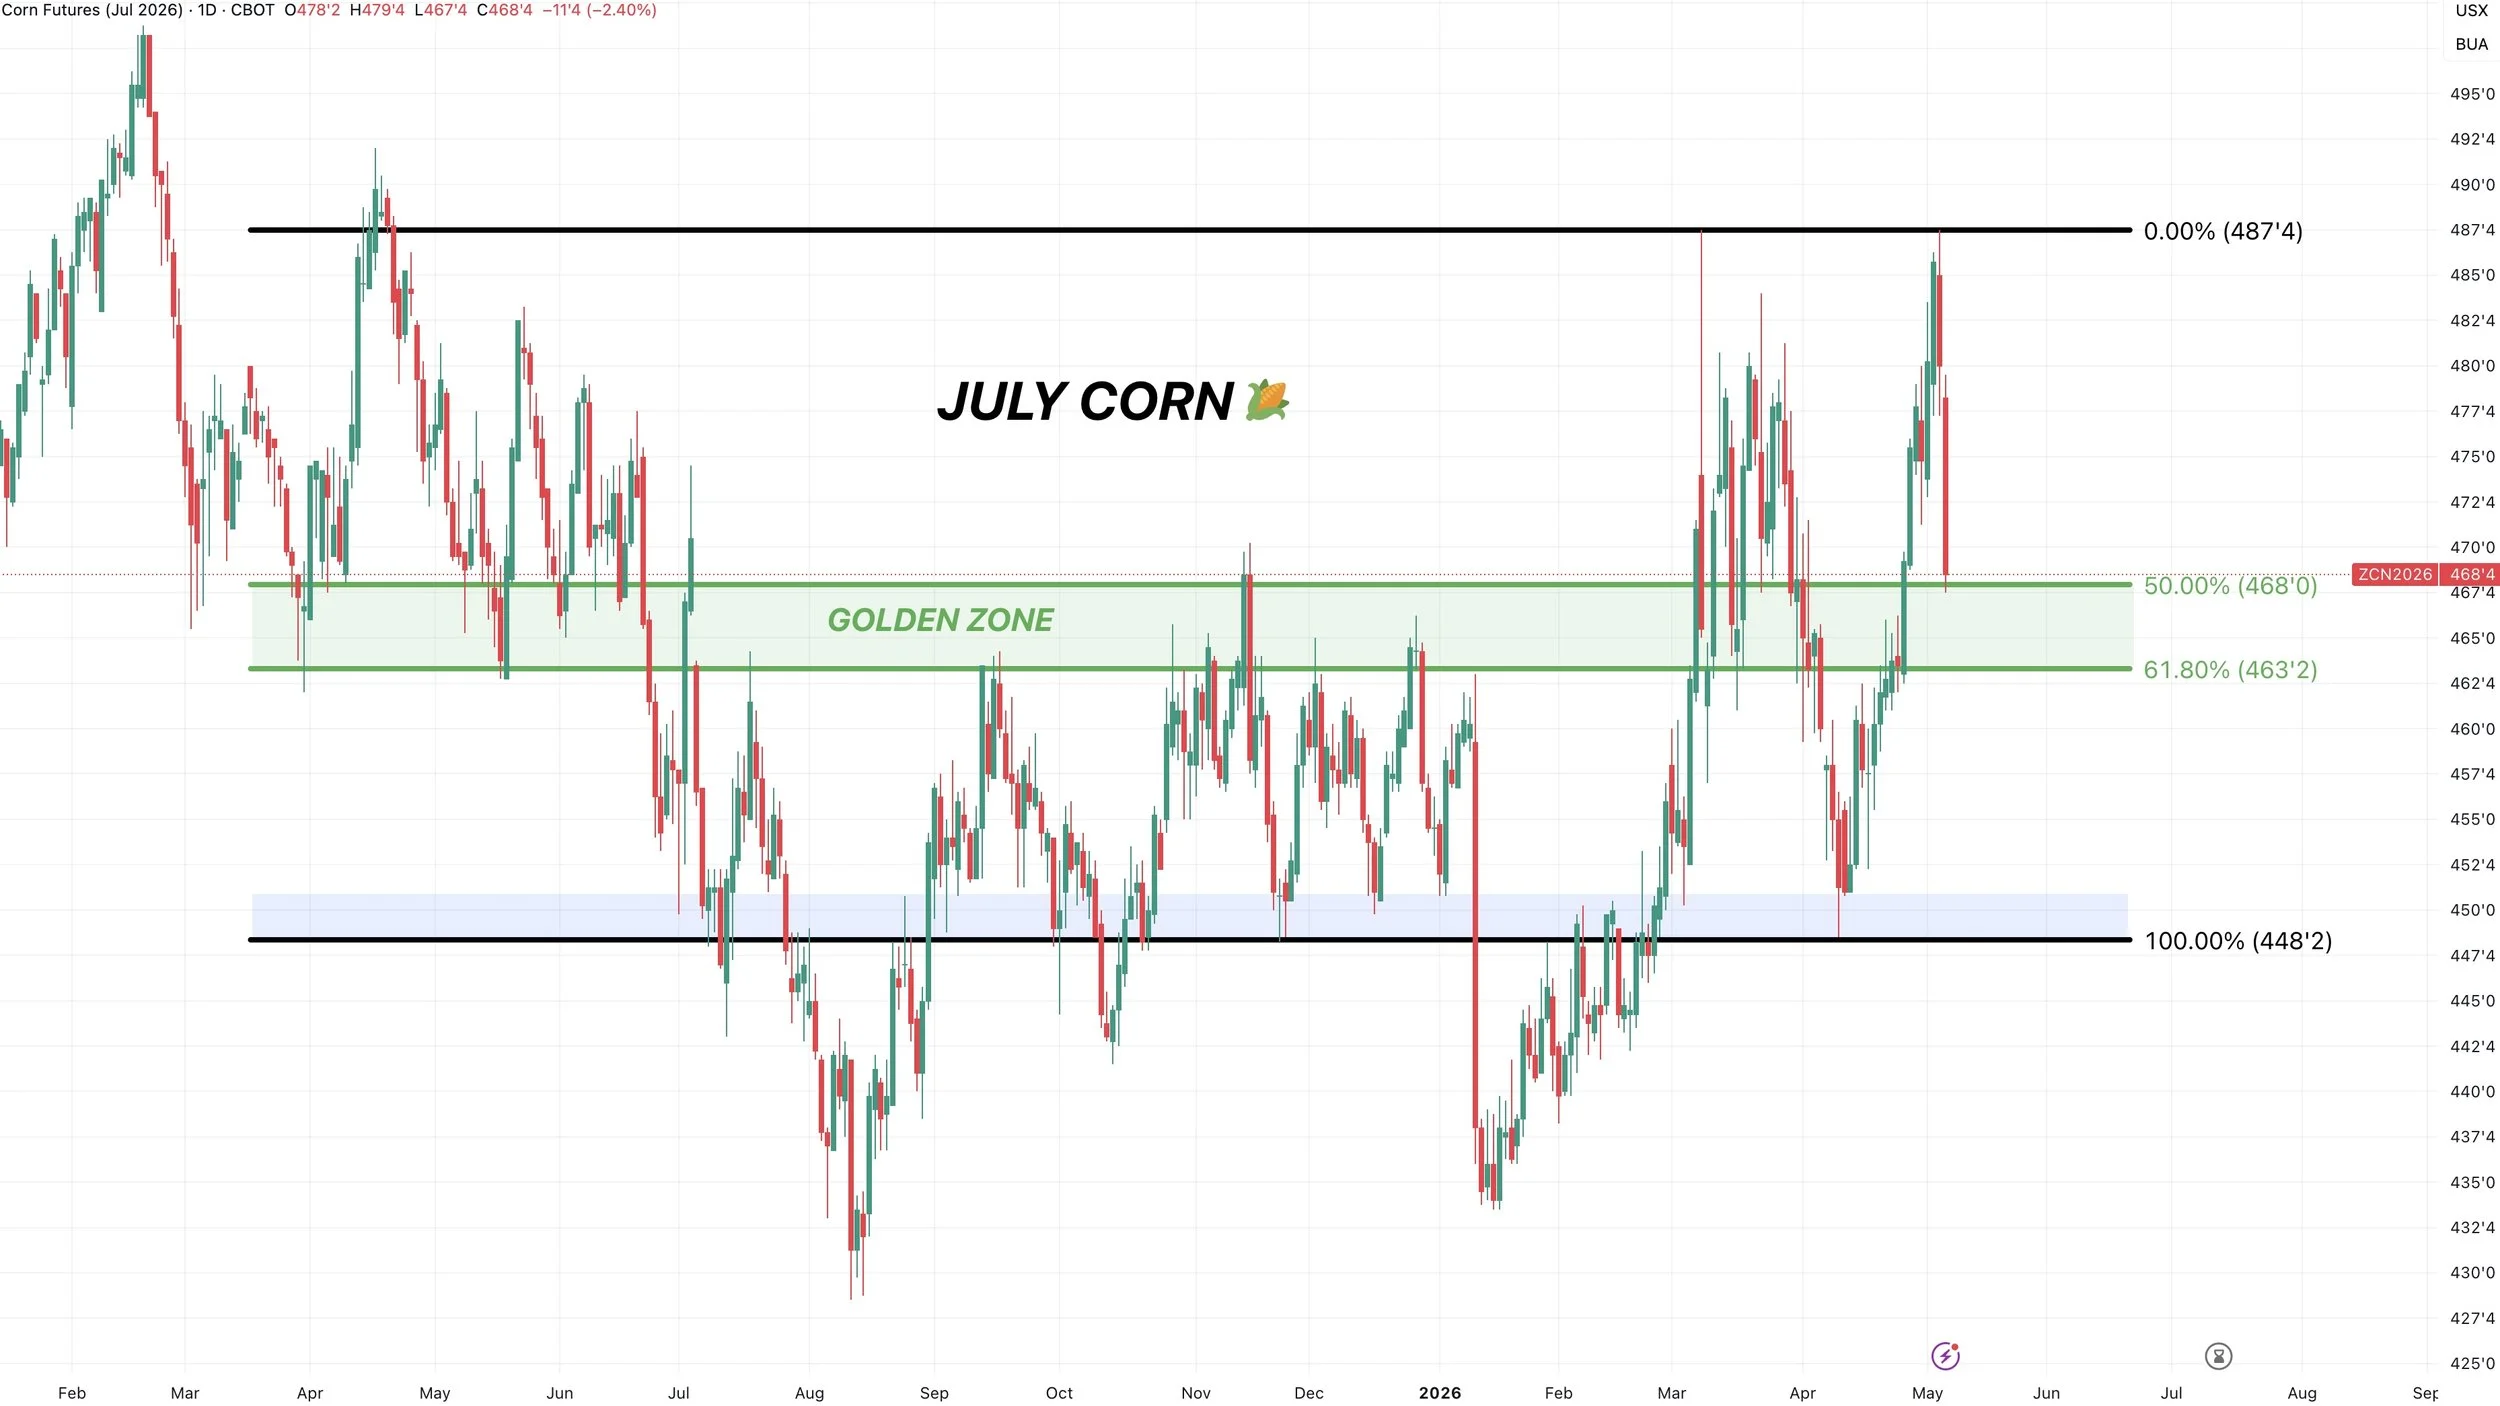
July Corn Chart:
Monday it looked like we were getting a breakout but crude oil ruined the party.
Nasty last two days.
Now what?
The trend remains higher unless we break below $4.63
That gives back 61.8% of the recent rally. Today we gave back 50%.
If this is a simple correction, we'd expect us to find a bottom anywhere between right now and $4.63
50% to 61.8% is the most common level for a normal correction.
If you take out $4.63 then we likely re-vist the prior lows.
$4.63 also lines up with that resistance from fall.
This box would be considered a "buy zone". As it's the must hold level to prevent a leg lower.
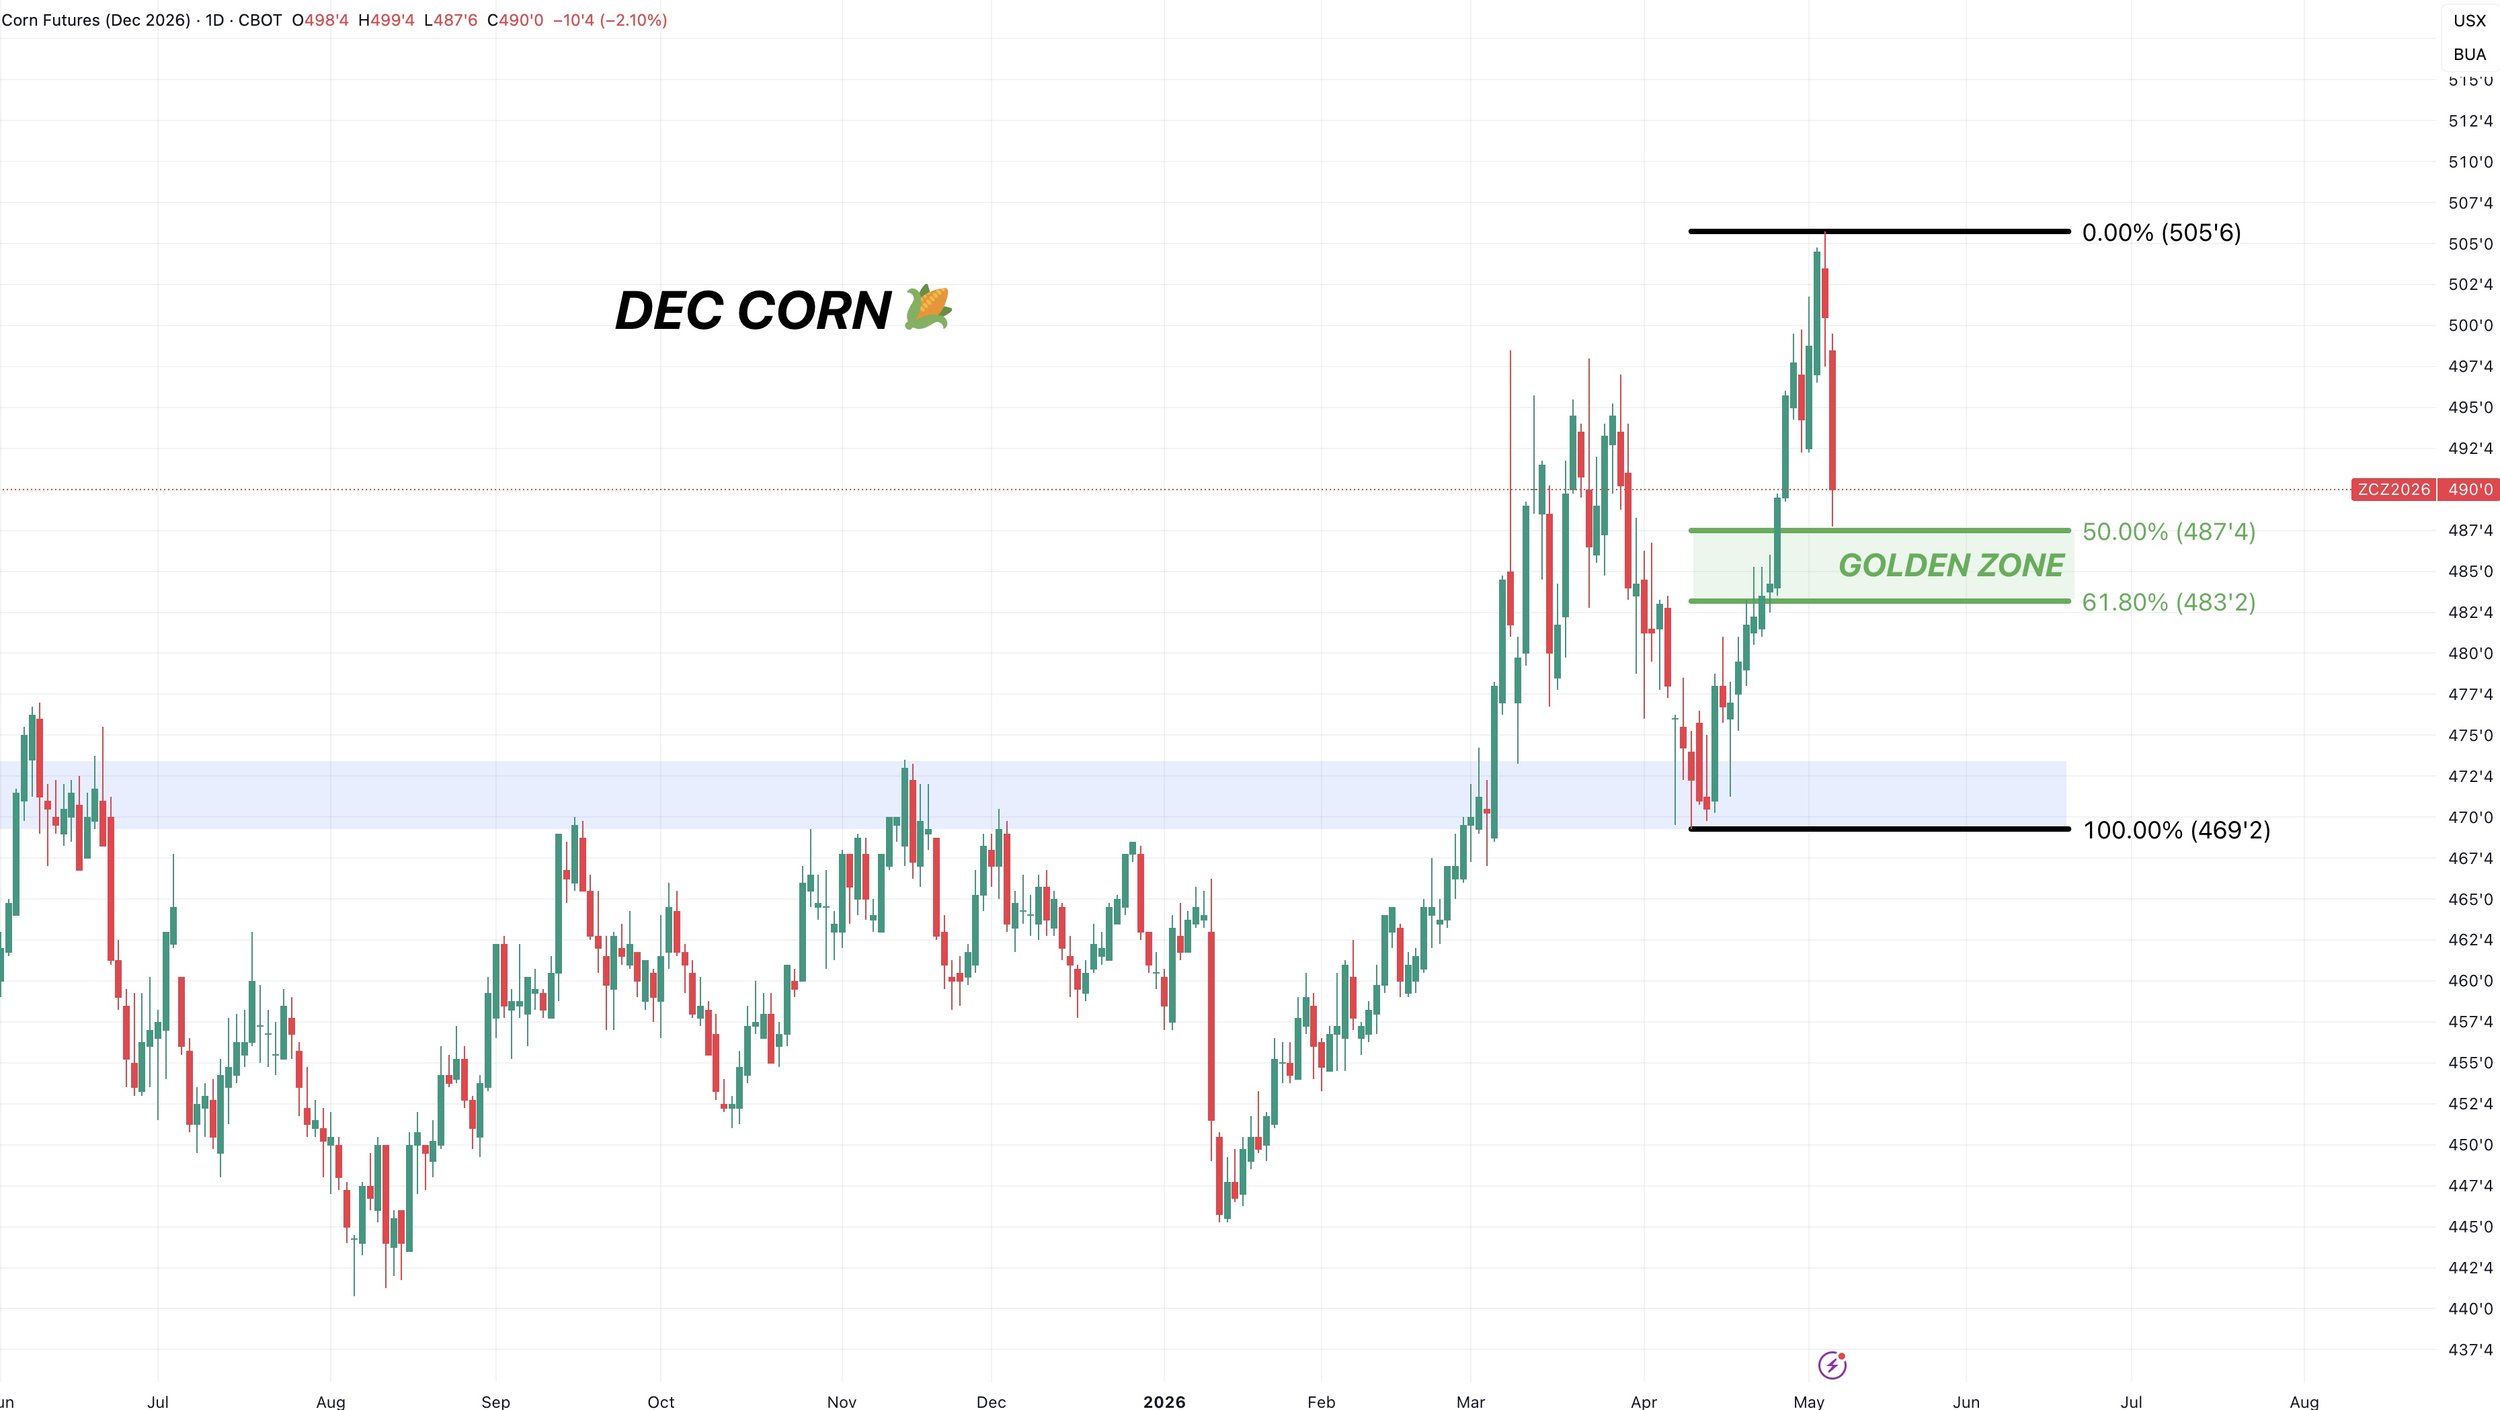
Dec Corn Chart:
Similar set up in Dec.
The golden zone is $4.87 to $4.83
If we break below $4.83 it could cause a leg lower.
But for now, this box is where we'd expect us to find some life and where the market typically decides if this is a normal correction or not.
Soybeans
I am not going to spend too long on soybeans today.
It's all about next week's meeting with China.
Soybeans are also entering that seasonal window where we want to have our marketing hats on, but that window for soybeans isn’t quite as clear cut "seasonal" as corn is.
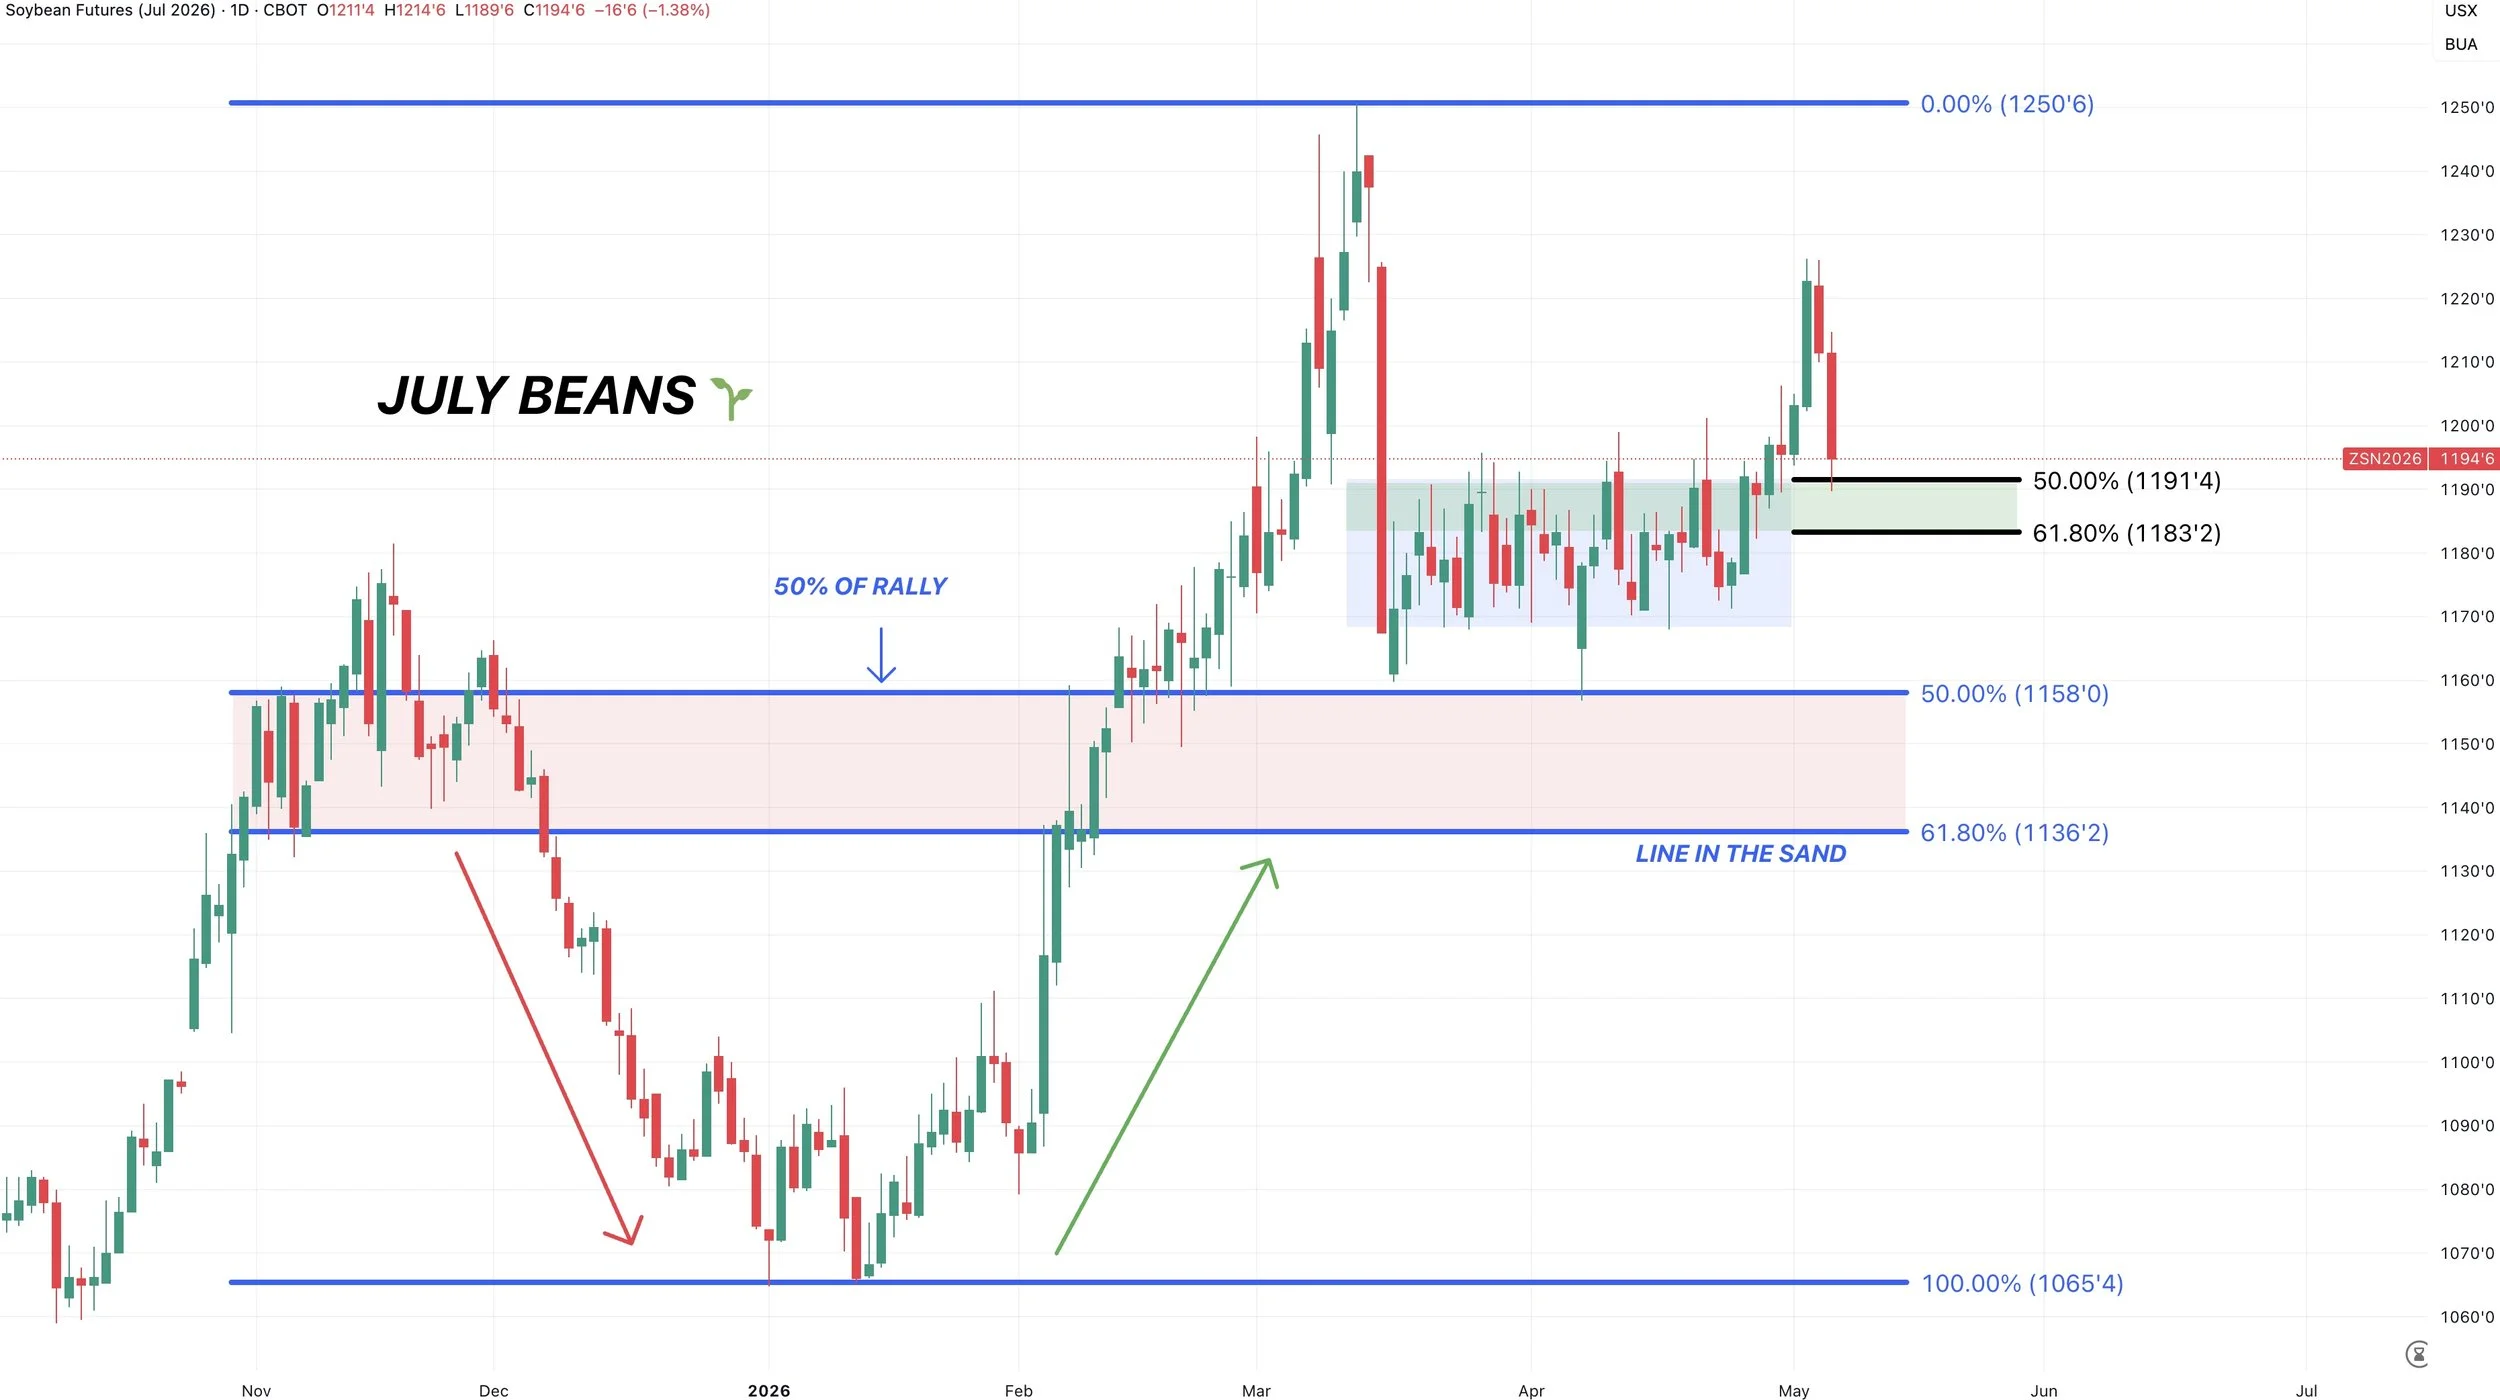
July Beans Chart:
Today we gave back 50% of the recent rally.
$11.83 is the key level we want to hold to prevent a leg lower.
As always, the golden zone usually decides if this is your typical correction or if the market is actually starting to fall apart.
We broke out of that brutal range last week.
This golden zone box would also have us re-checking that old resistance, attempting to turn it into support.
So like in corn, if we are going to bounce, this would be the area we'd expect it to happen. If not, it opens the door lower.
We should know soon.
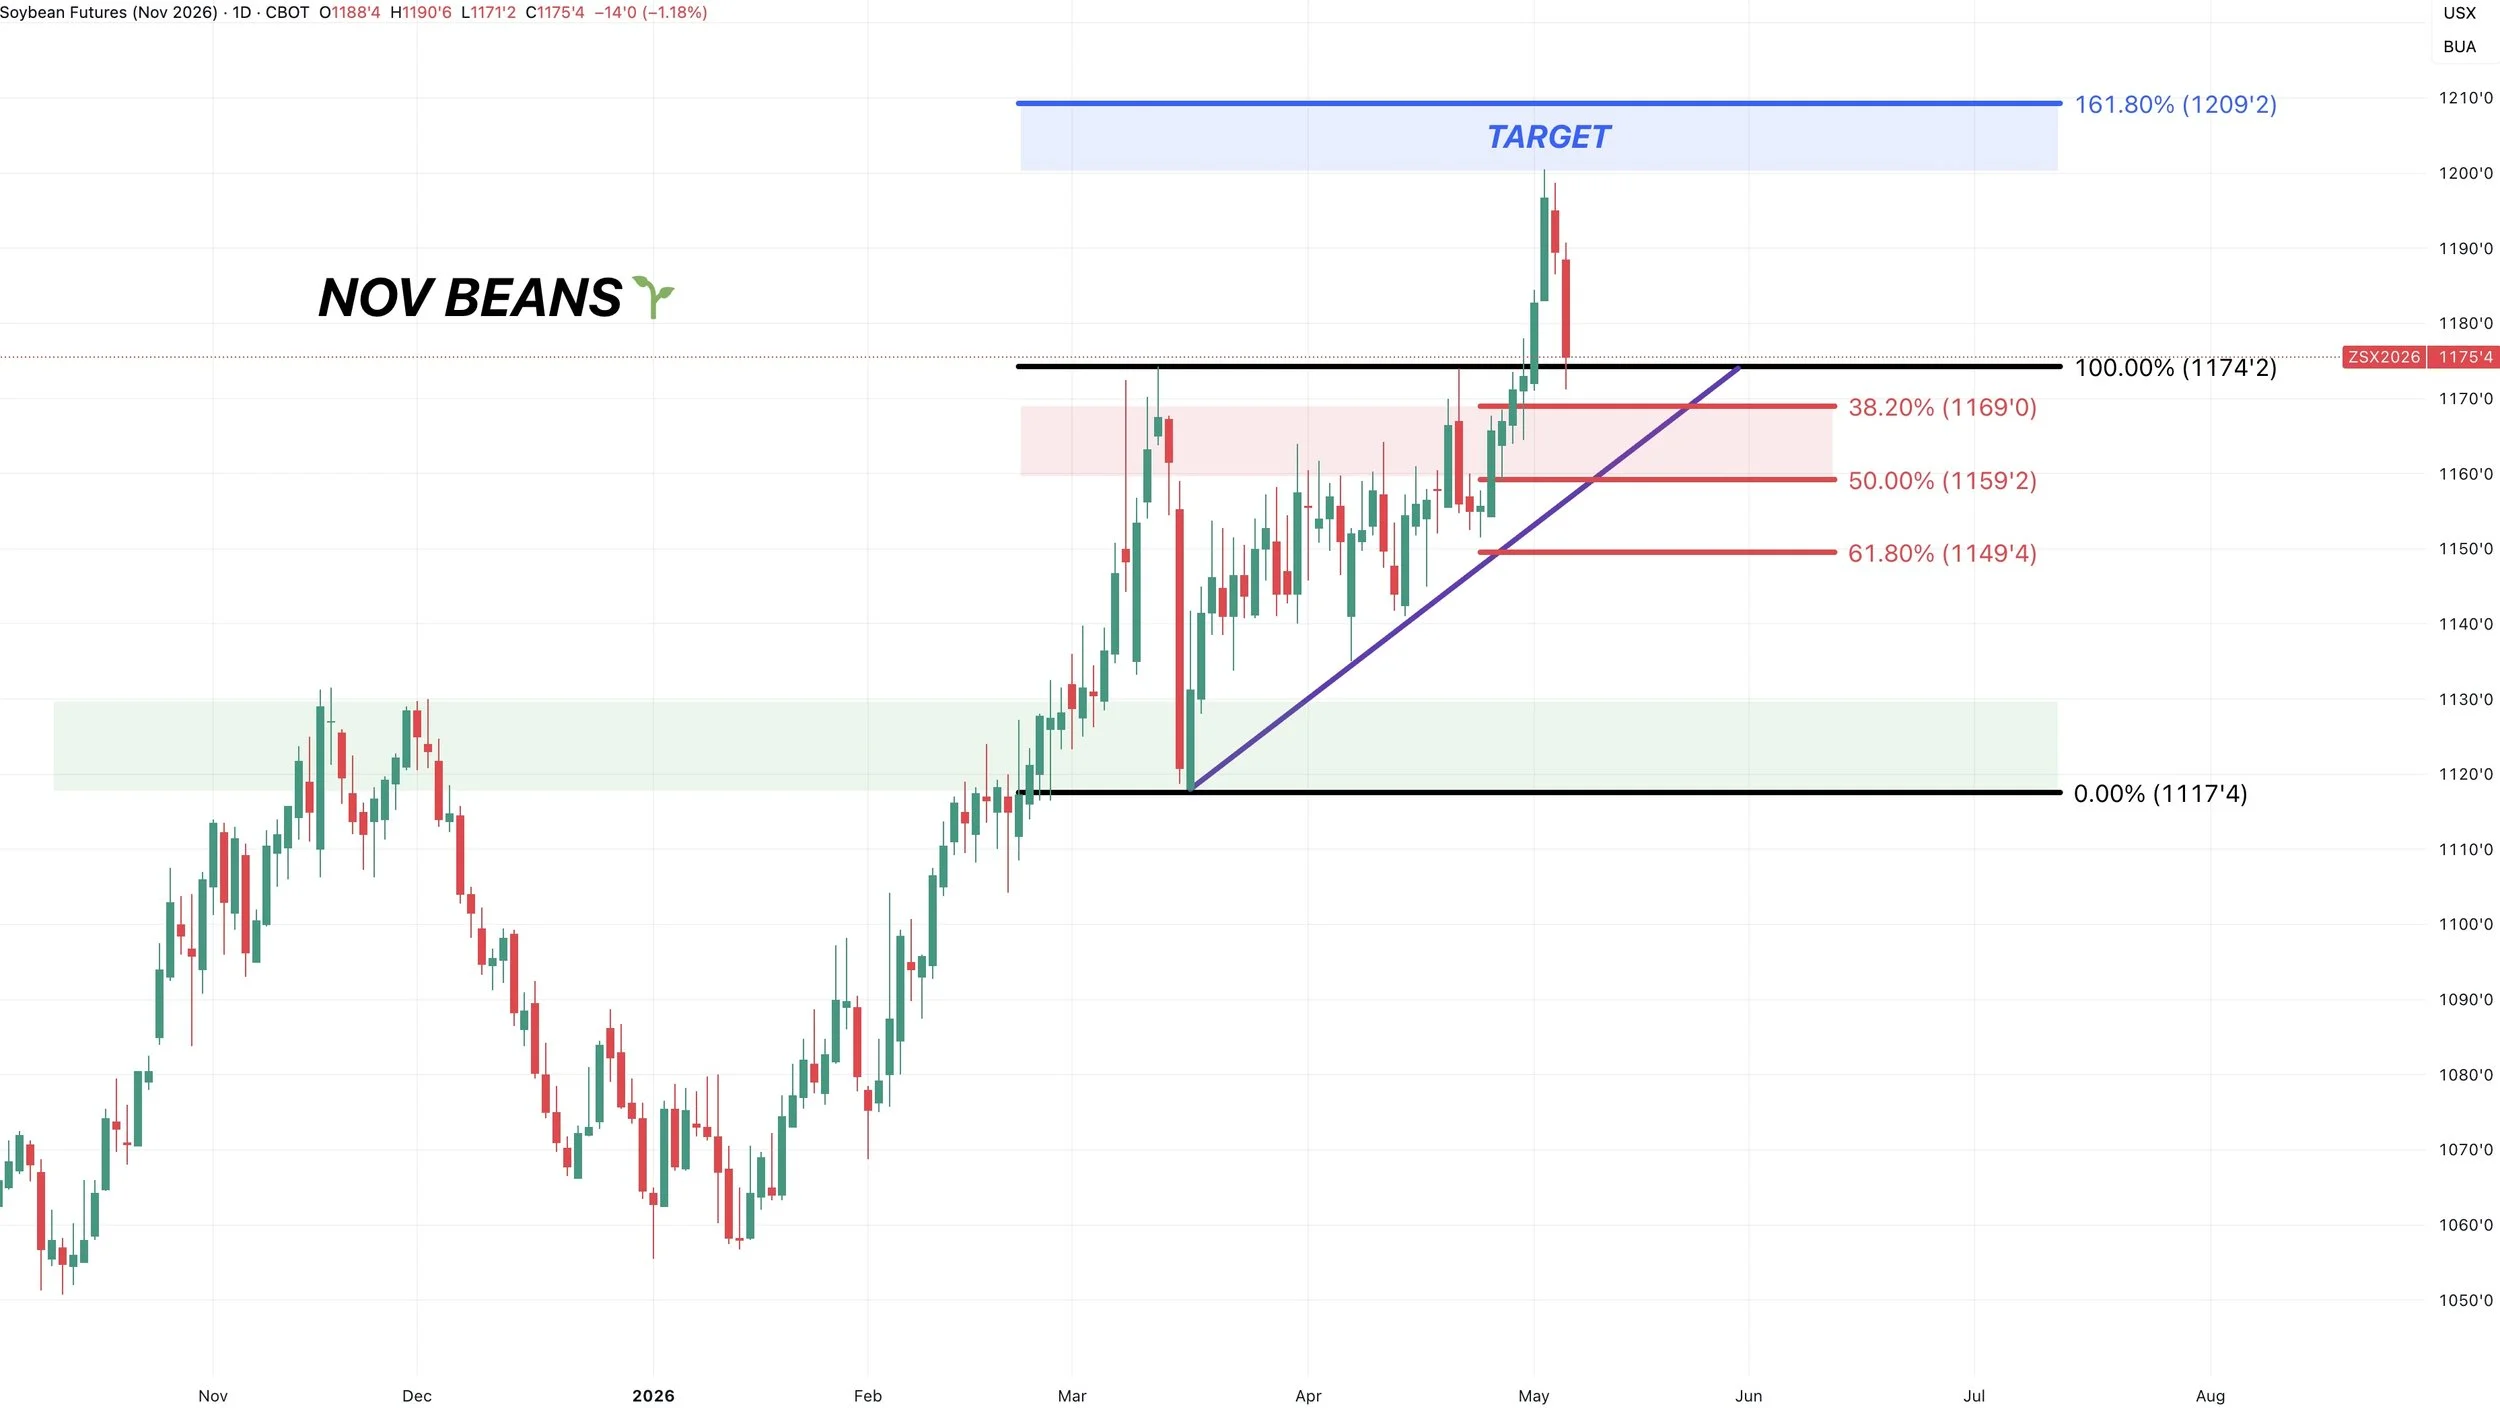
Nov Beans Chart:
Normally I look at the golden zone, which gives back 50% to 61.8% of a rally.
However, in a strong market, often times it can only be 38.2% to 50%.
If you notice, July beans are already a fib level lower than Nov beans are.
So finding some life between here and $11.59 would make sense.
This same level would re-test that prior resistance and point of breakout.
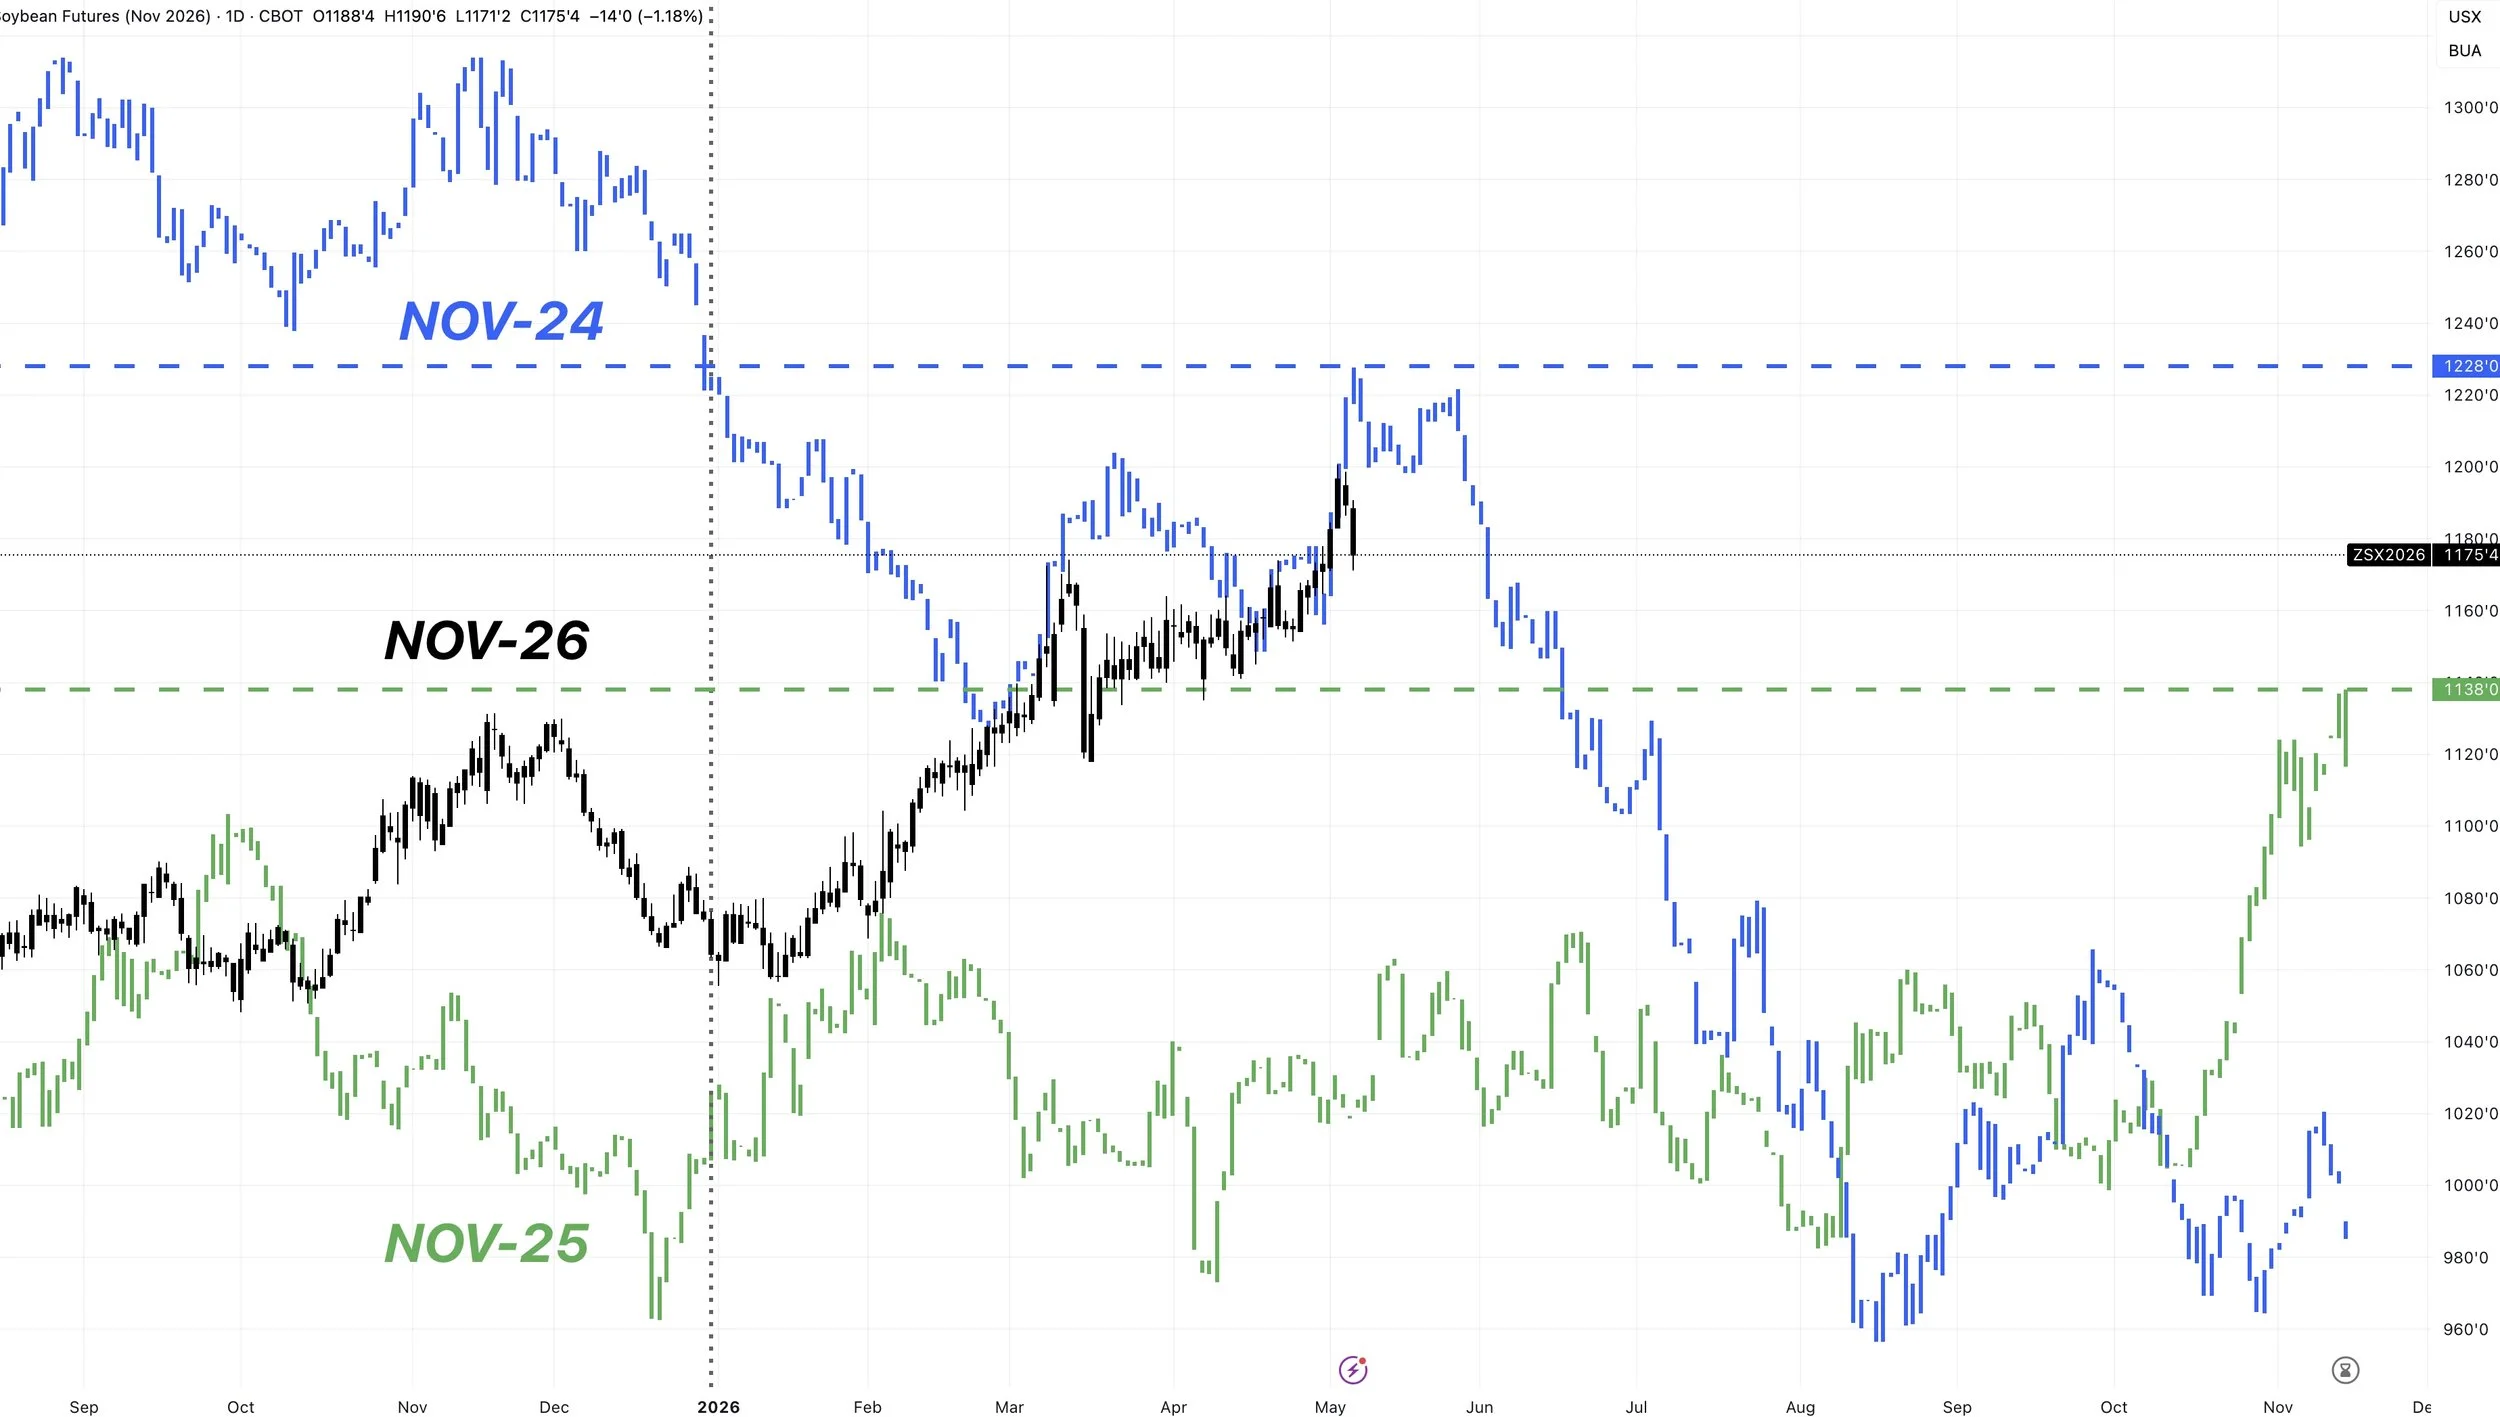
Nov Beans 2026 vs 2025 vs 2024:
We are still higher than we were all last year.
Almost on par with the highs we saw back in 2024.
So if you are someone who knows you're going to have to move soybeans, you're behind, or if you know this is a profitable level for yourself, it's never a bad idea to lock in a little bit at 2-year highs.
Wheat
Problems in HRW:
The winter wheat national ratings actually increased by 1% to 31% rated G/E.
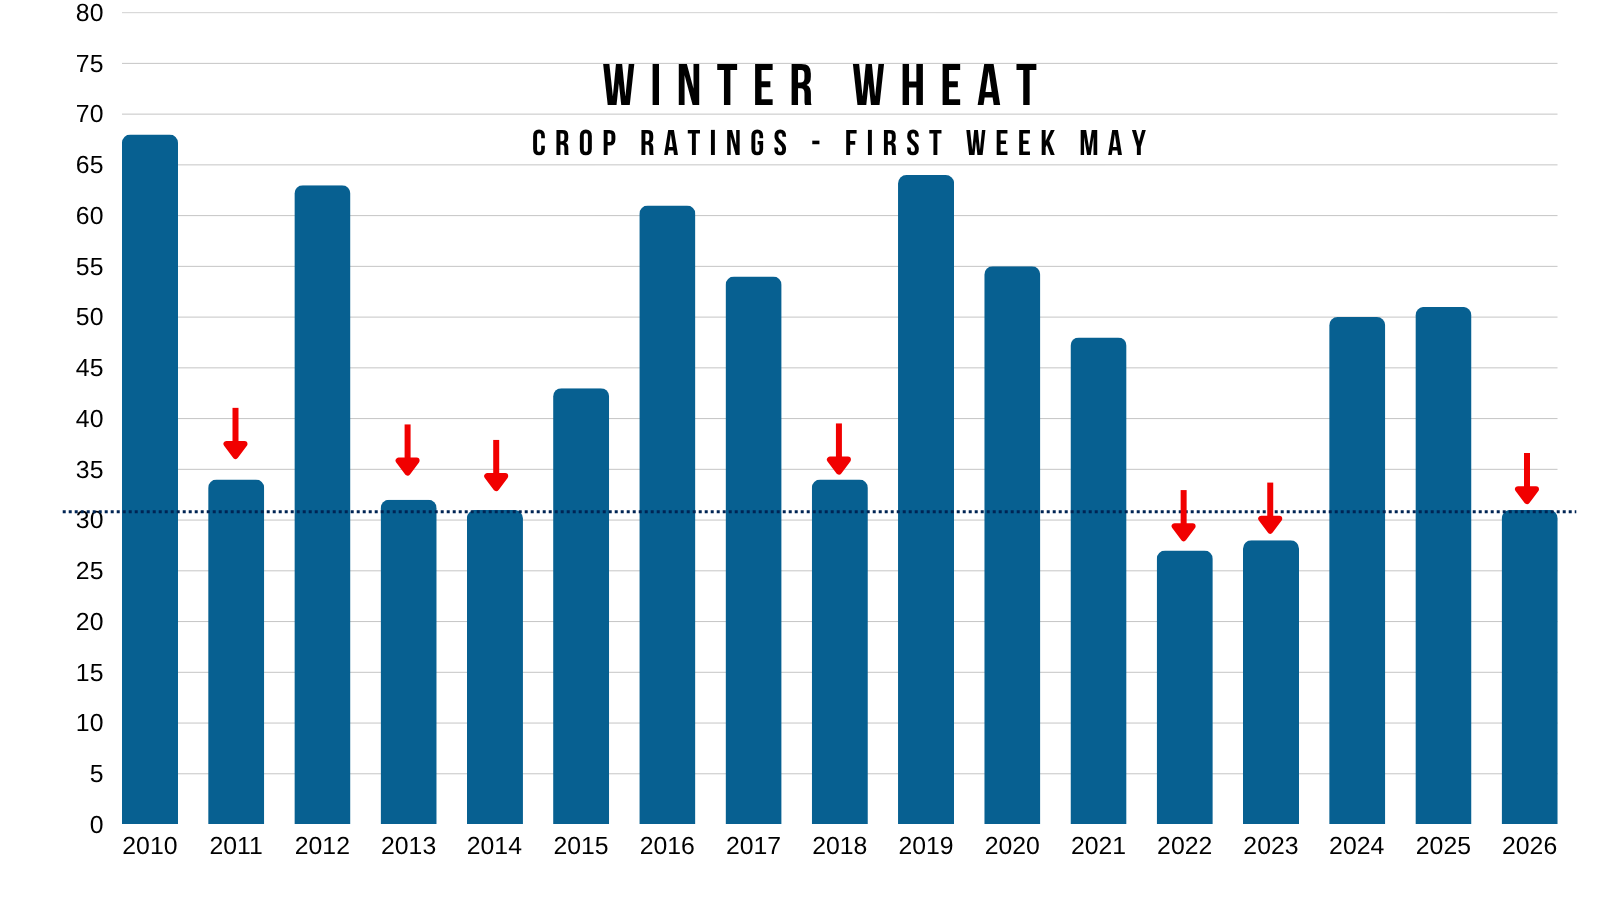
I've already shown most of this data before.
But this alone would suggest a below trendline crop when you compare where the yield came in at in years that had similar ratings.
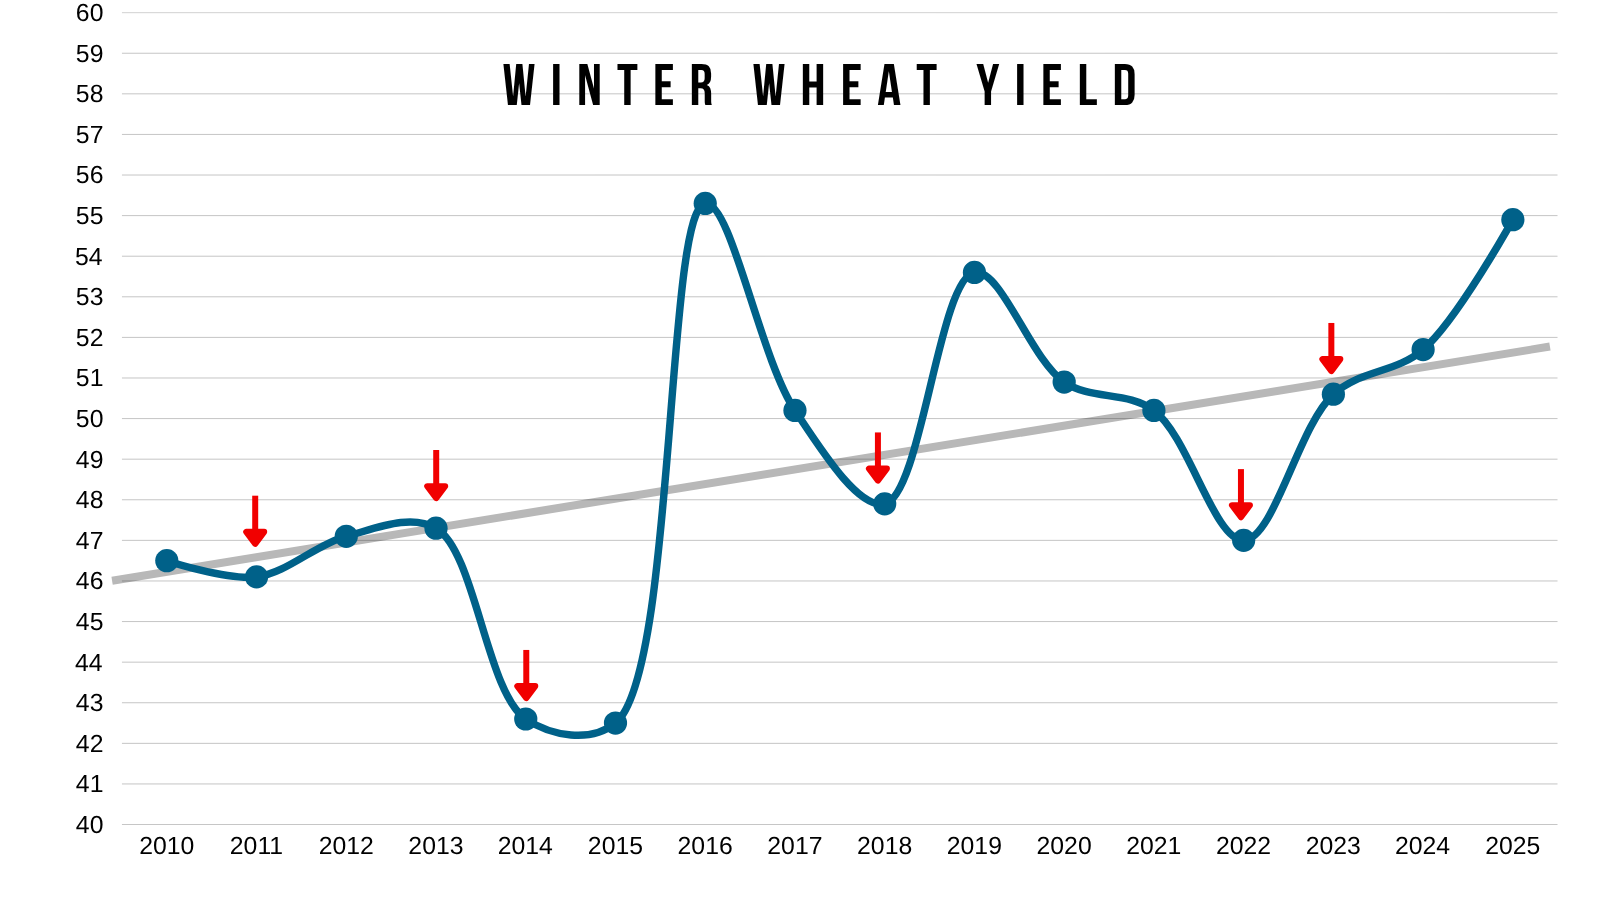
However, as we've talked about several times before, that still doesn’t tell the entire story.
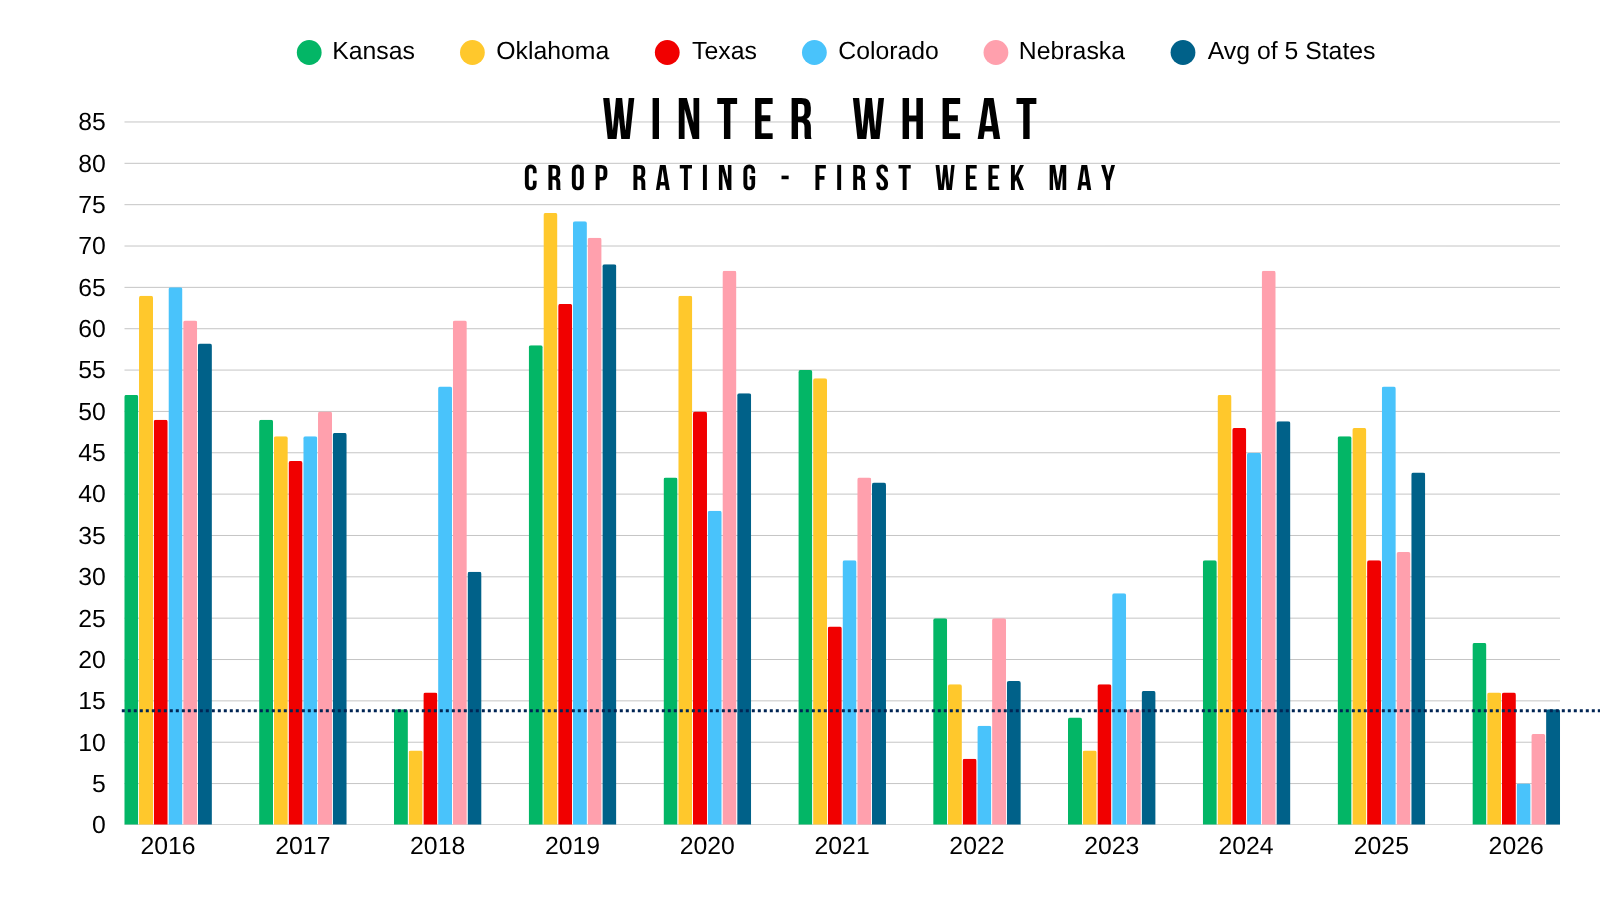
It's the HRW states that are struggling. Meanwhile the SRW states provide a boost to national ratings.
Here is an update on that chart I always show that compares the top 5 HRW states ratings over the years.
All of them are one of their worst in at least a decade.
If you take the average ratings of these 5 states, you get 14% G/E.
The lowest of all-time.
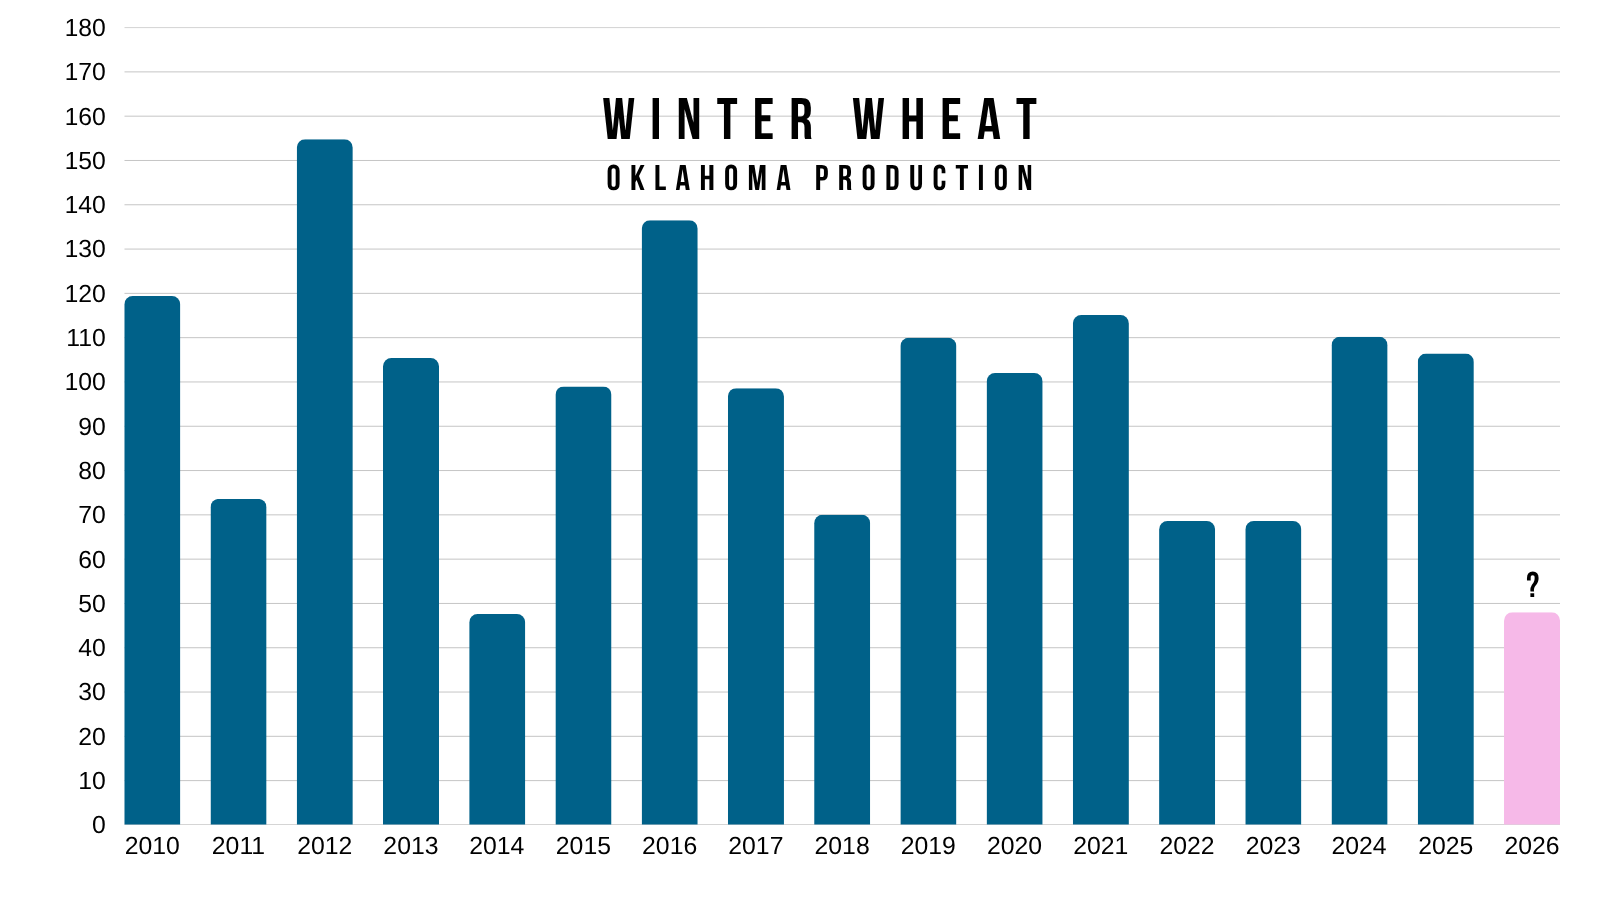
We have crop tours going on right now.
The tours in Oklahoma are estimating production to be roughly 48 million bushels.
Last year, Oklahoma had over 106 million, and the 10-year average is 95 million.
Which means that this crop in Oklahoma is potentially HALF of what it normally is.
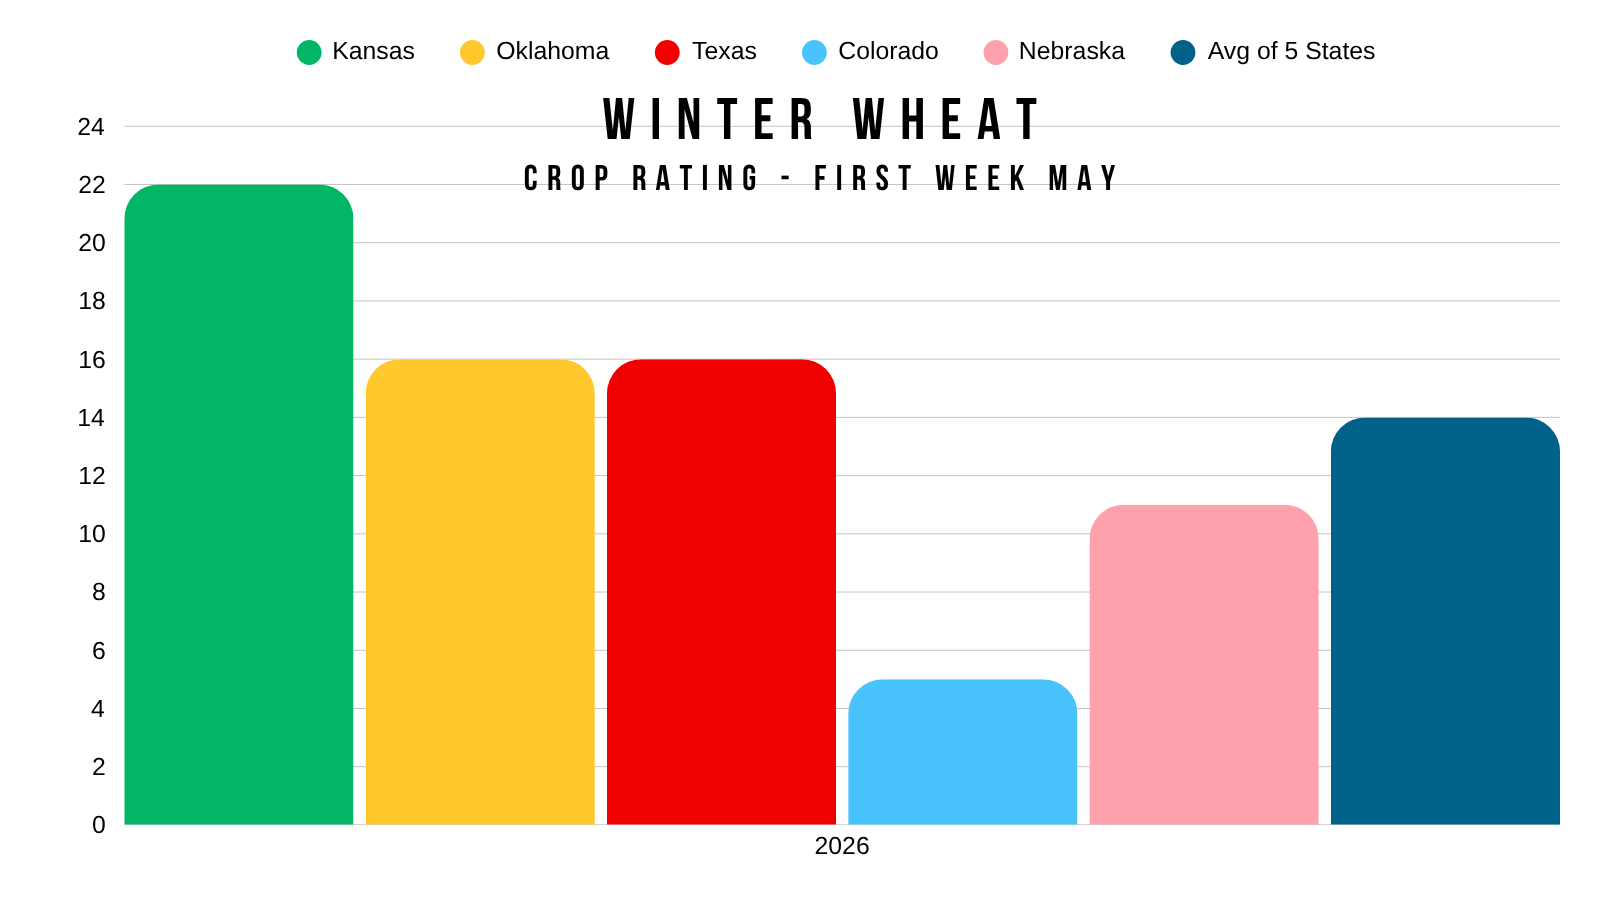
If you simply look at the current ratings, Oklahoma actually has a better rating than the other top states aside from Kansas.
Kansas: 22%
Oklahoma: 16%
Texas: 16%
Colorado: 5%
Nebraska: 11%
5-State Avg: 14%
National: 31%
The crop tours should be starting in Kansas next week.
I'm sure a lot of this drought story is partly priced in by now.
But you still have the fertilizer story impacting countries such as Australia.
You still have record low wheat acres.
I still think the LONG term trend has shifted higher for wheat, given that this is the most sustained rally we've seen in 5-years. Along with the fact we posted our first higher high of the entire brutal 5-year bear market.
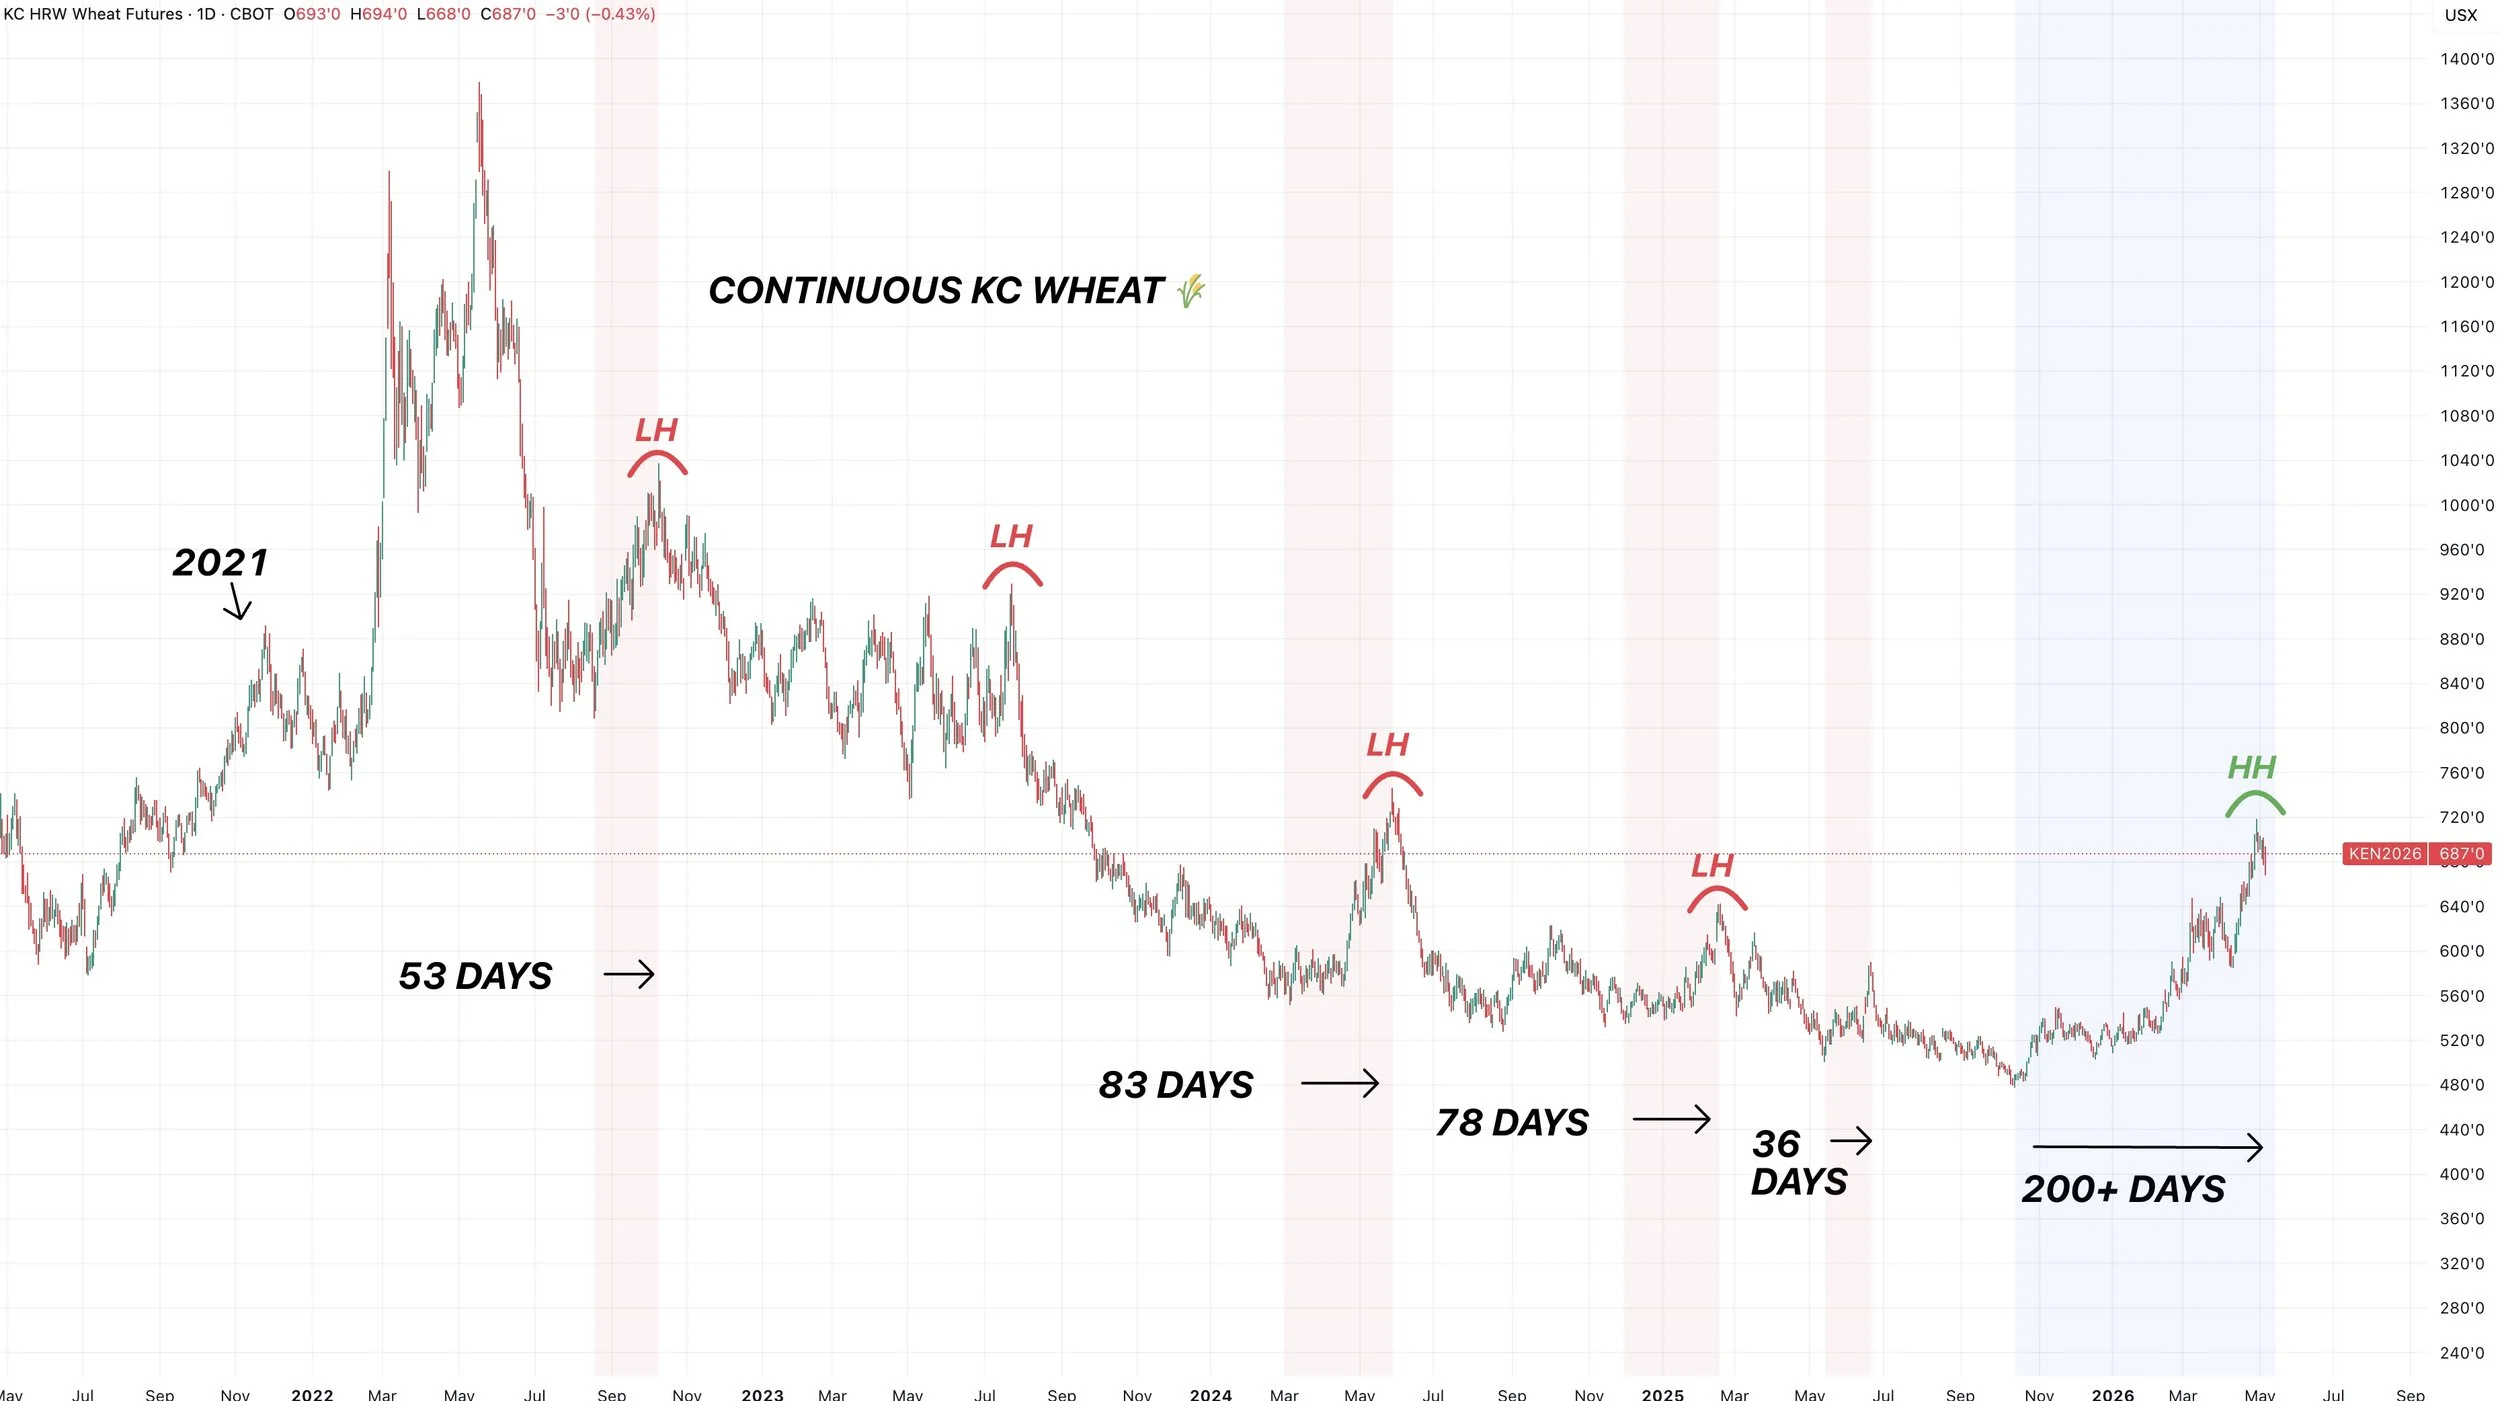
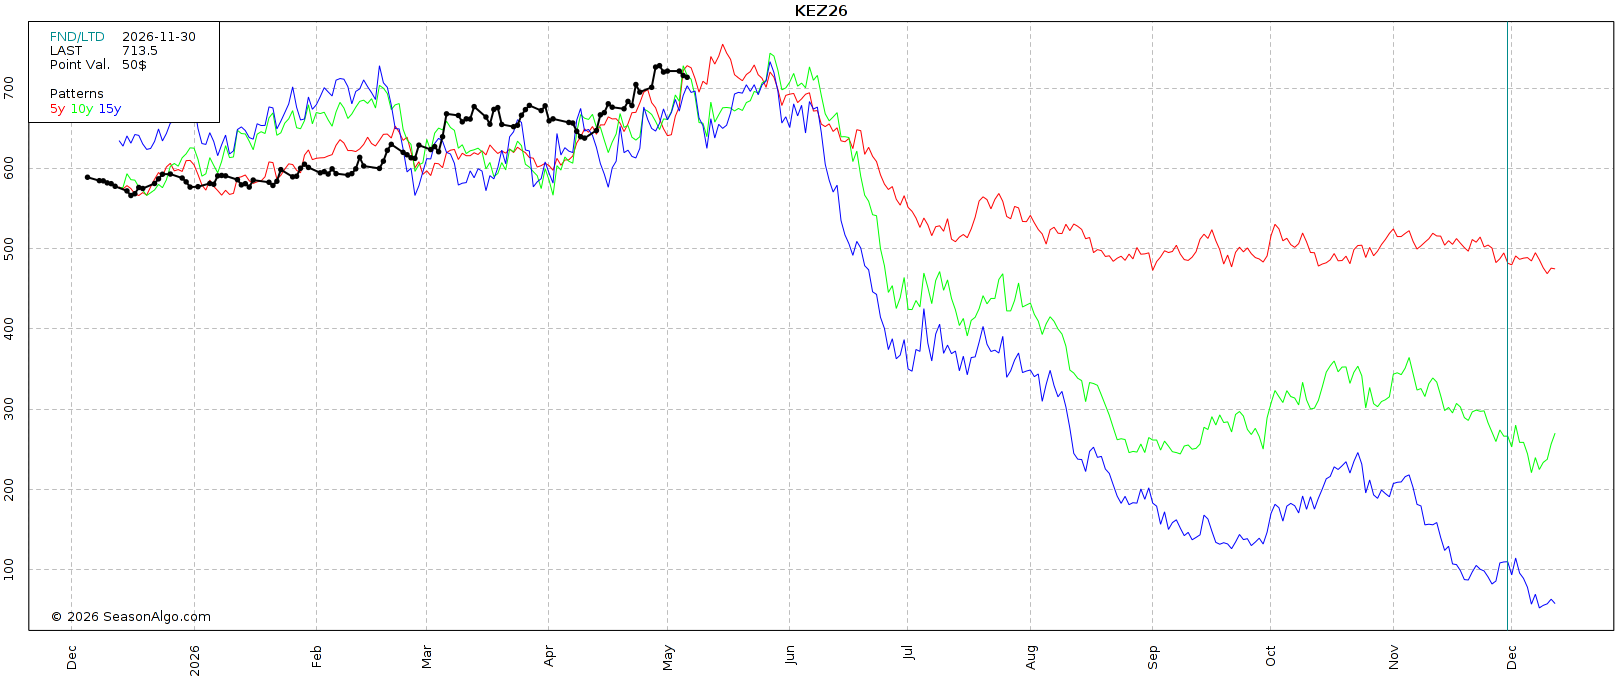
We do however need to be aware that seasonally, this is also your window of opportunity in the wheat market here soon.
Wheat doesn’t follow seasonals as closely as corn, given that it's more of a global crop.
But wheat does tend to sell off in June.
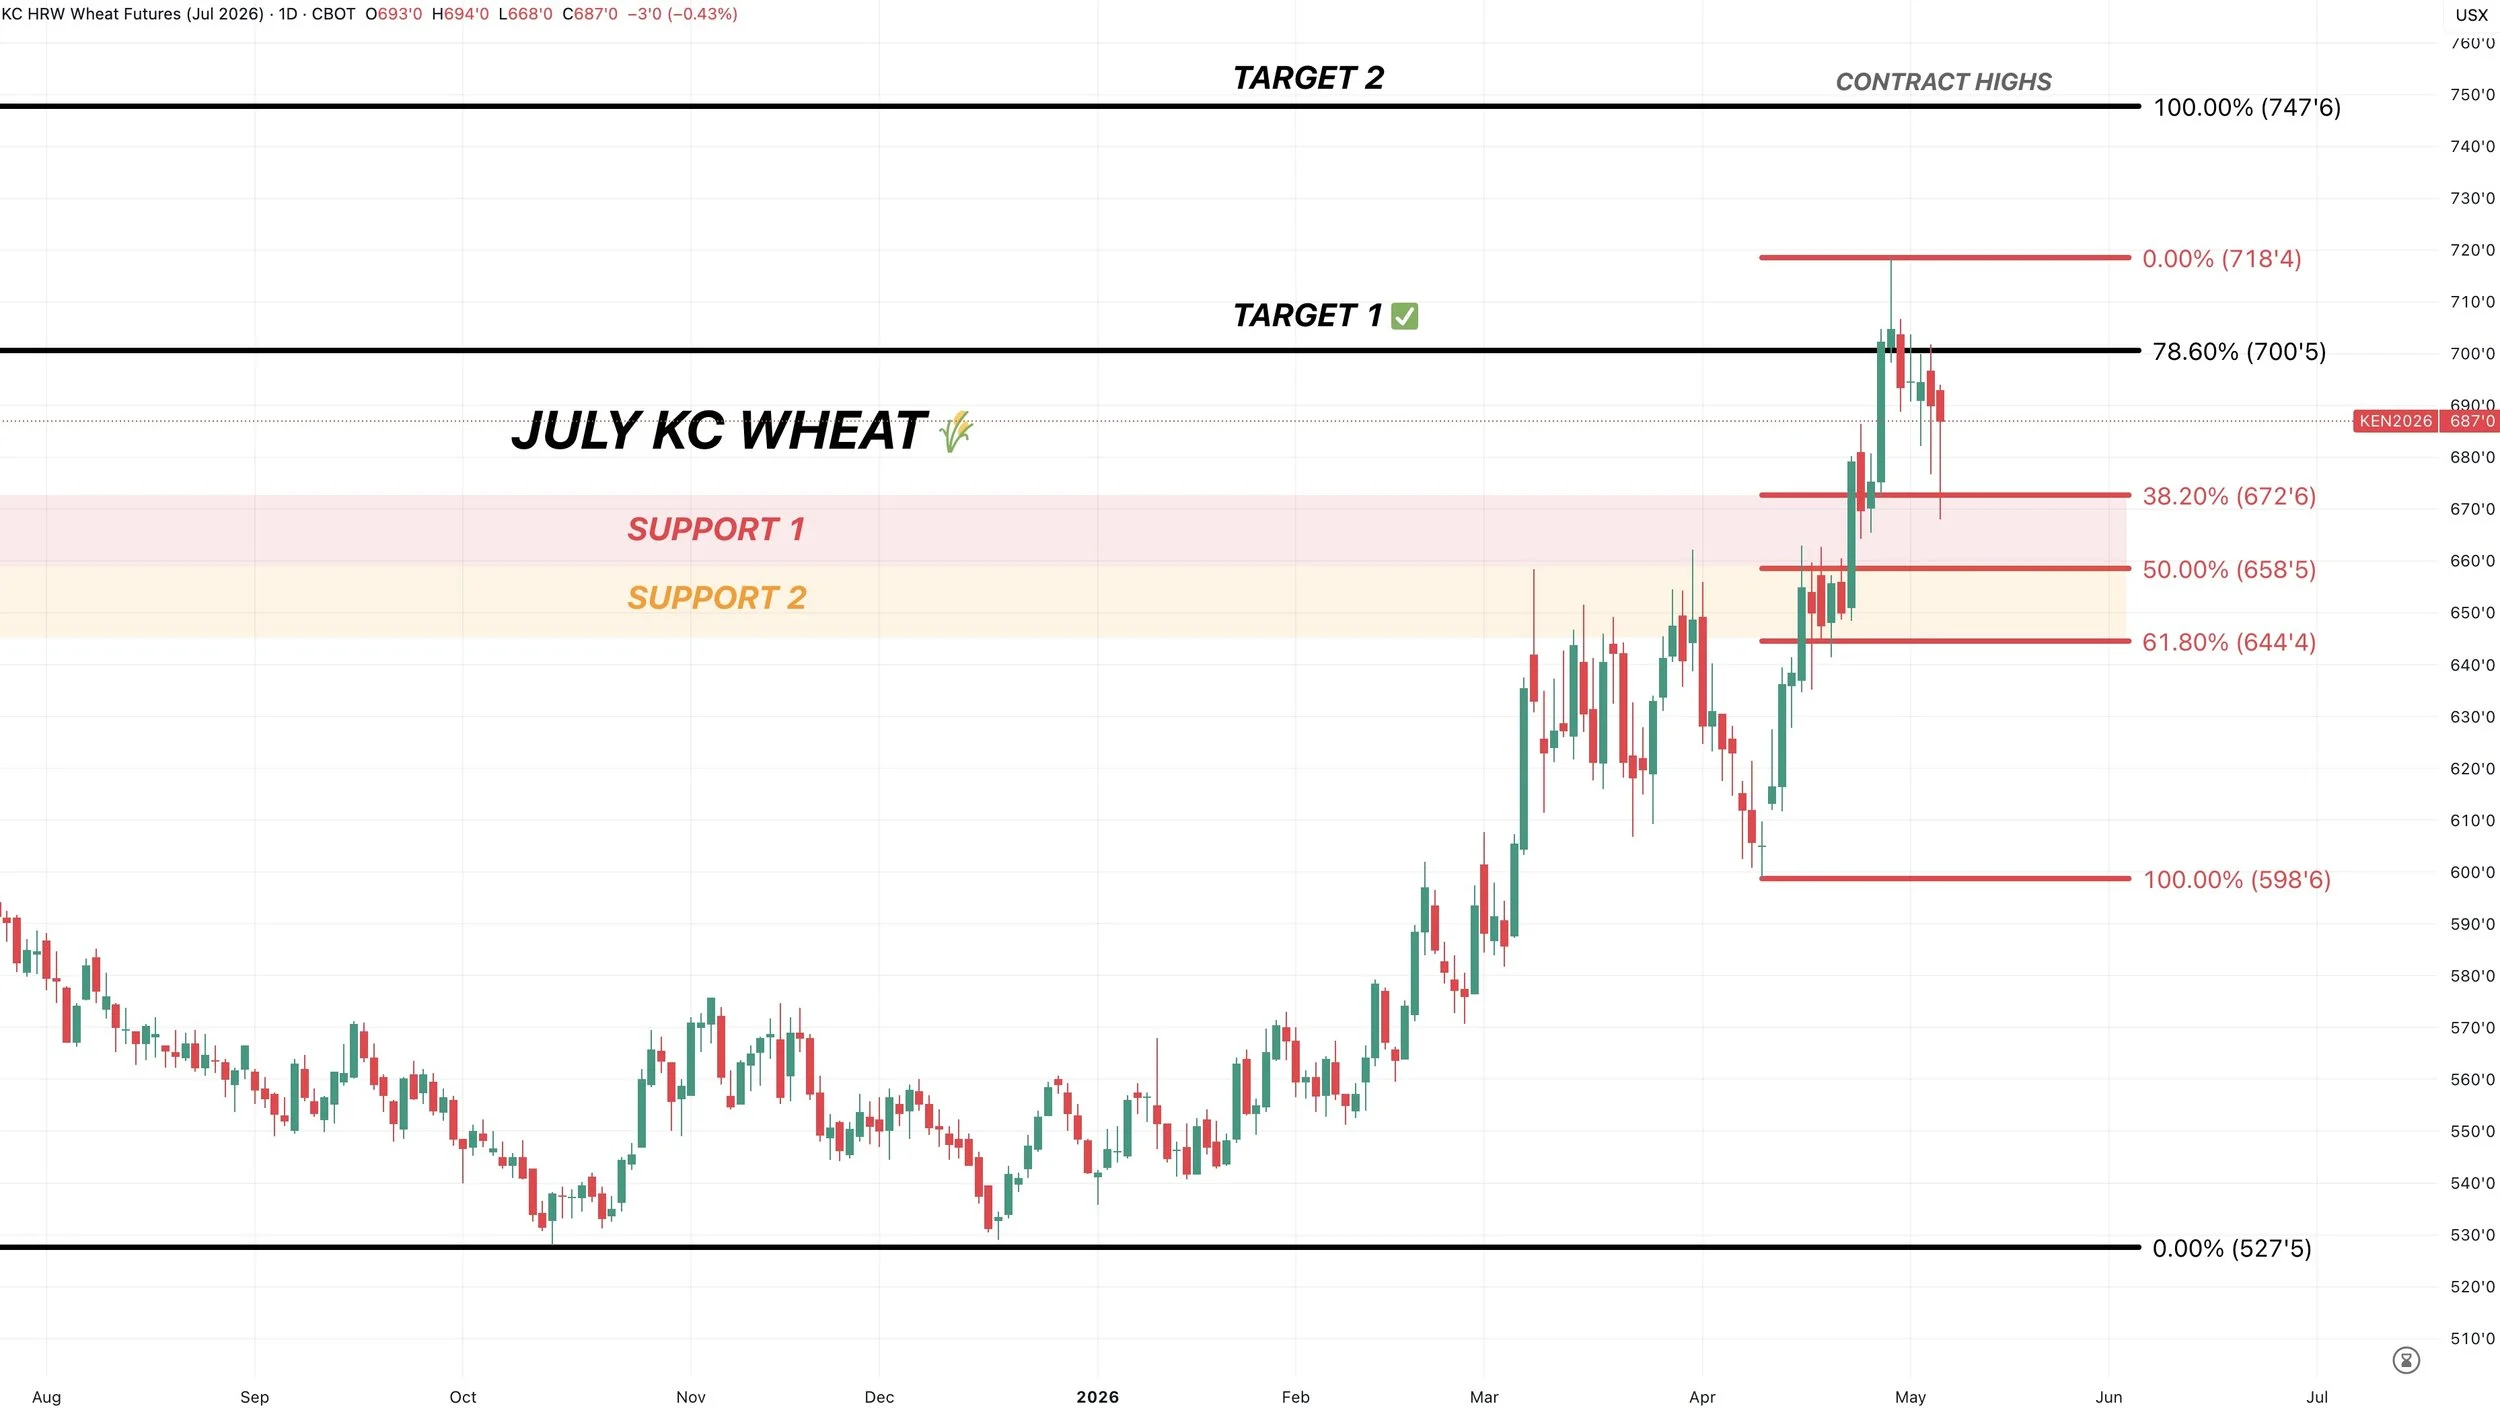
July KC Chart:
Still struggling at that original $7.00 target.
We issued that sell signal a week or so ago at $7.00, which was more for those who lack storage or have hedge accounts.
So if you lack storage, I would be looking to take advantage of wheat sitting at 2-year highs near $7.00
We can’t completely ignore the fact that wheat was trading at $4.75 just back in October
Click Here for Signal
However, like corn and soybeans the wheat market is approaching some levels where it might make sense to find some support.
Again, in a strong market like Nov beans or KC wheat, the correction doesn’t have to be as deep.
So KC could find a bottom between the 38.2% and 50% level of the recent rally. We already tagged the 38.2% level before closing well off our lows.
The must hold spot is $6.44 and 61.8% level. So the trend is still higher unless that level gives out. Then you'd have to be concerned.
Next target is still $7.45 to $7.50 and the contract highs.
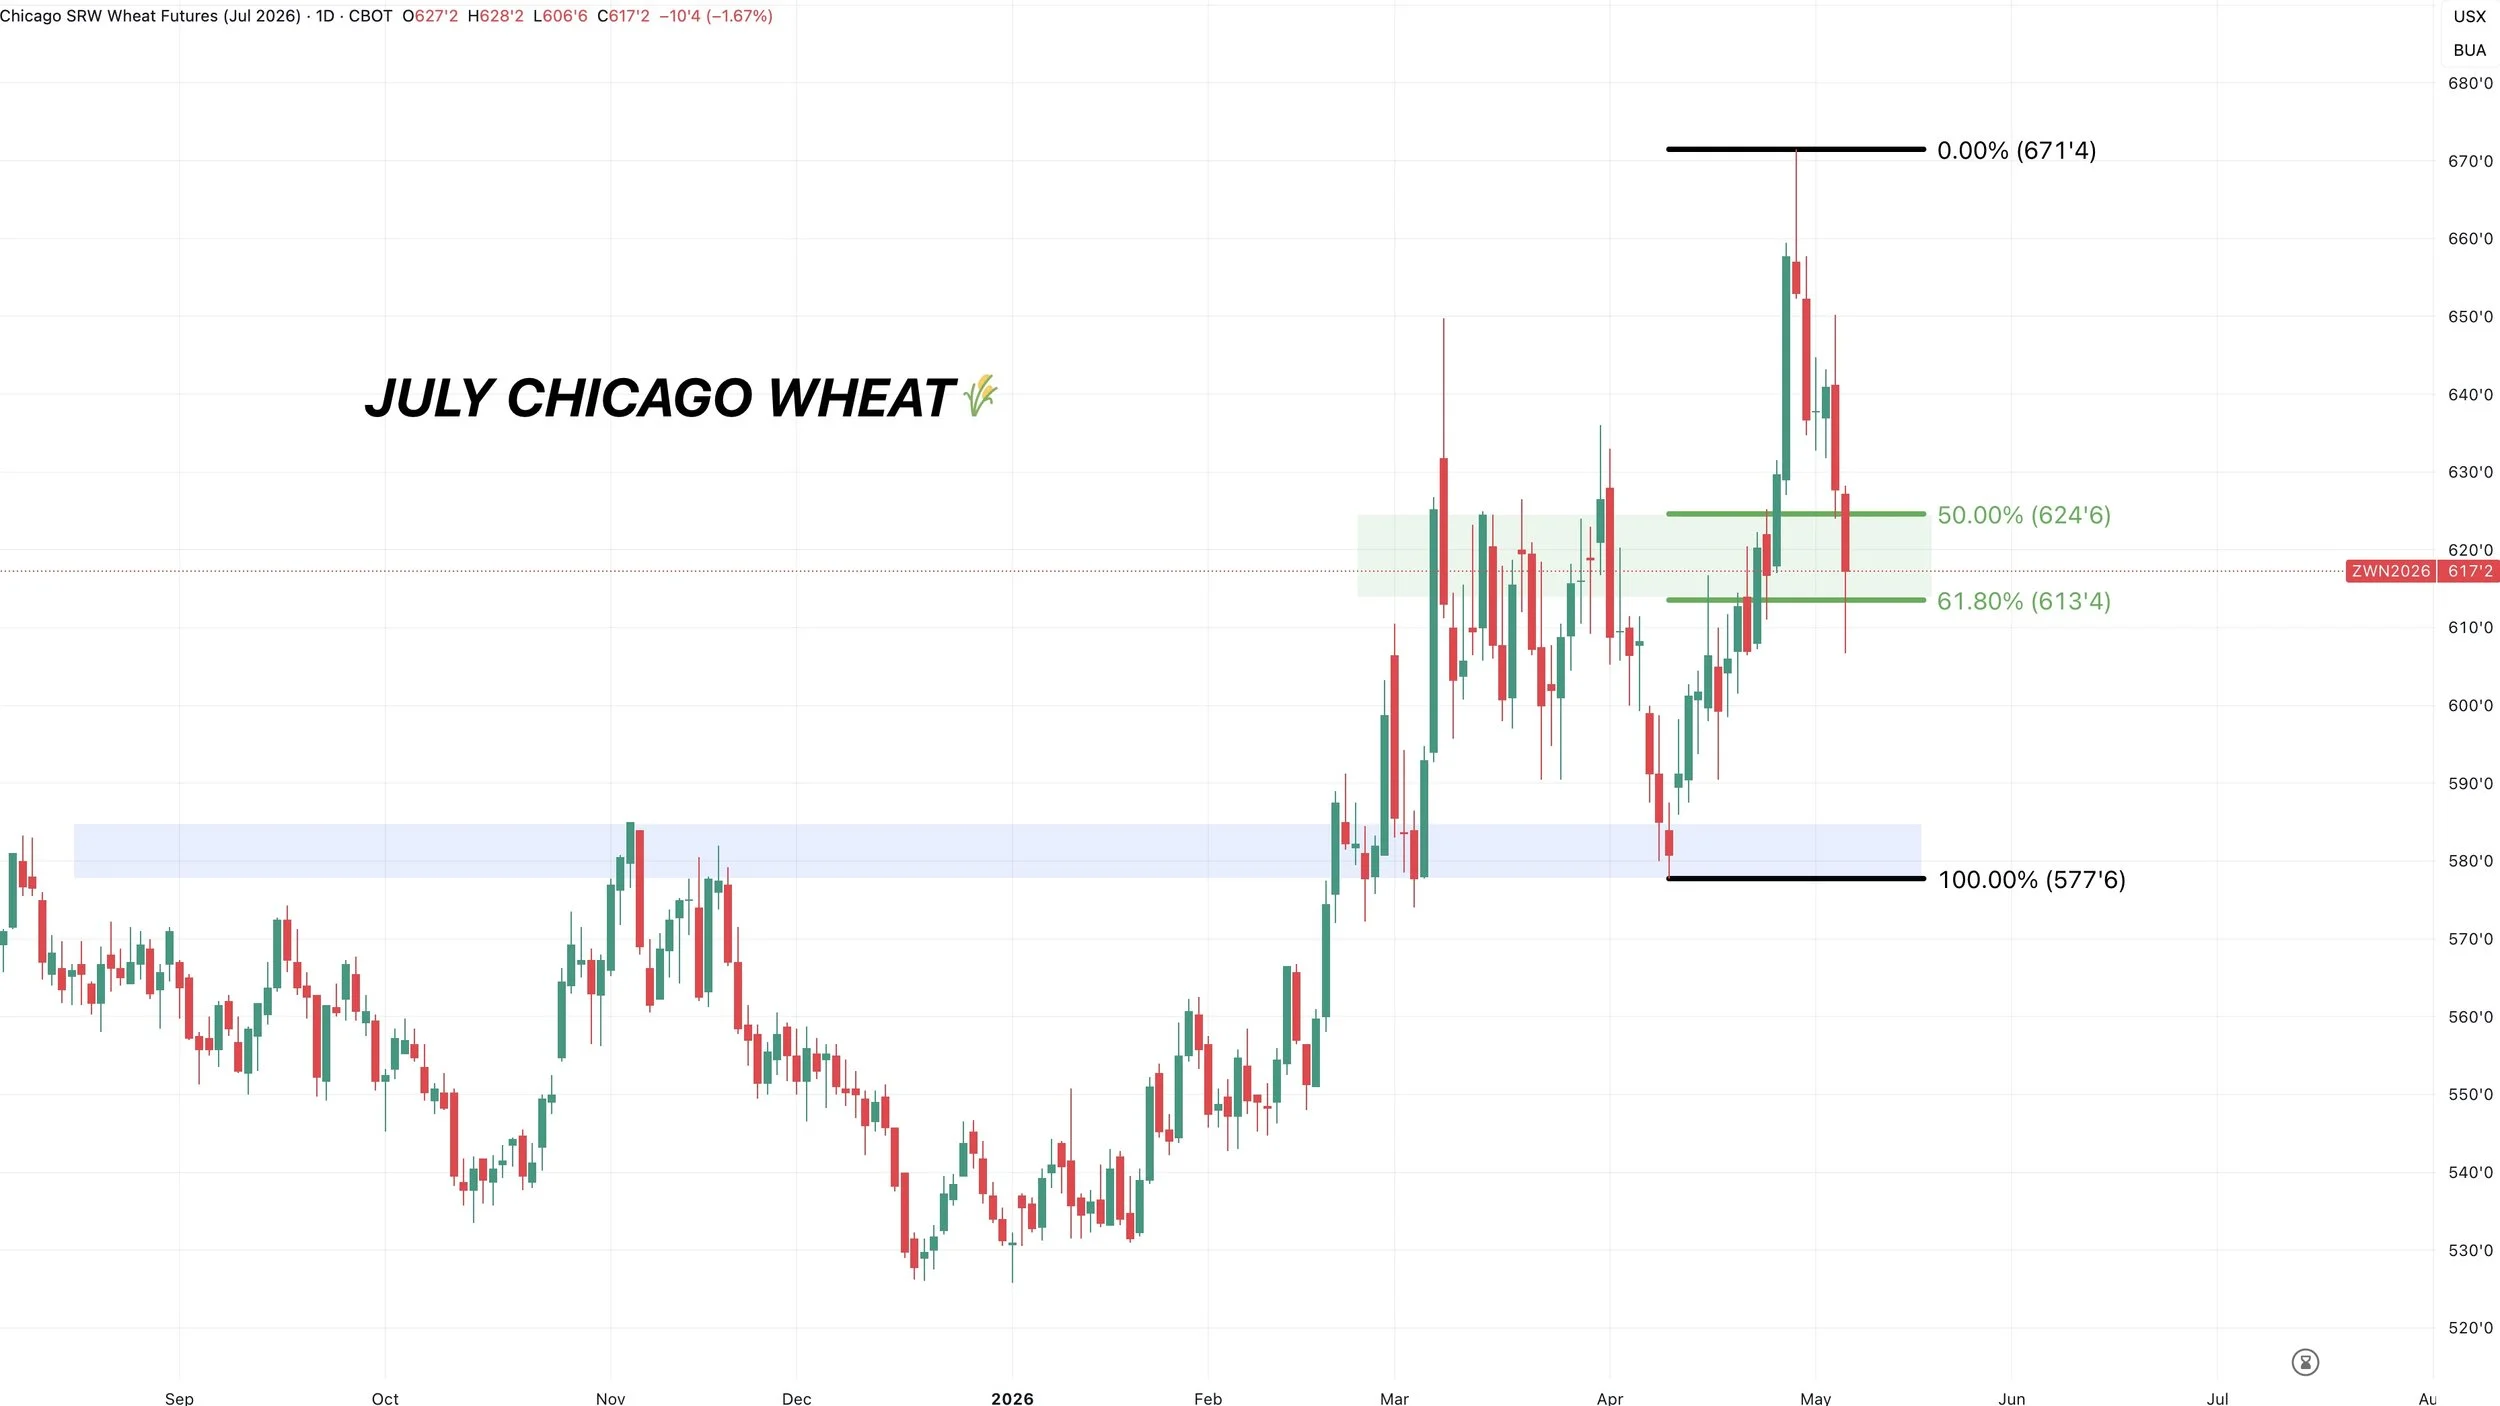
July Chicago Chart:
Here is another reason to think wheat could be near some support.
It's pretty much do or die time for Chicago.
We gave back 61.8% of the rally already.
Failure to hold that level is typically not a good sign.
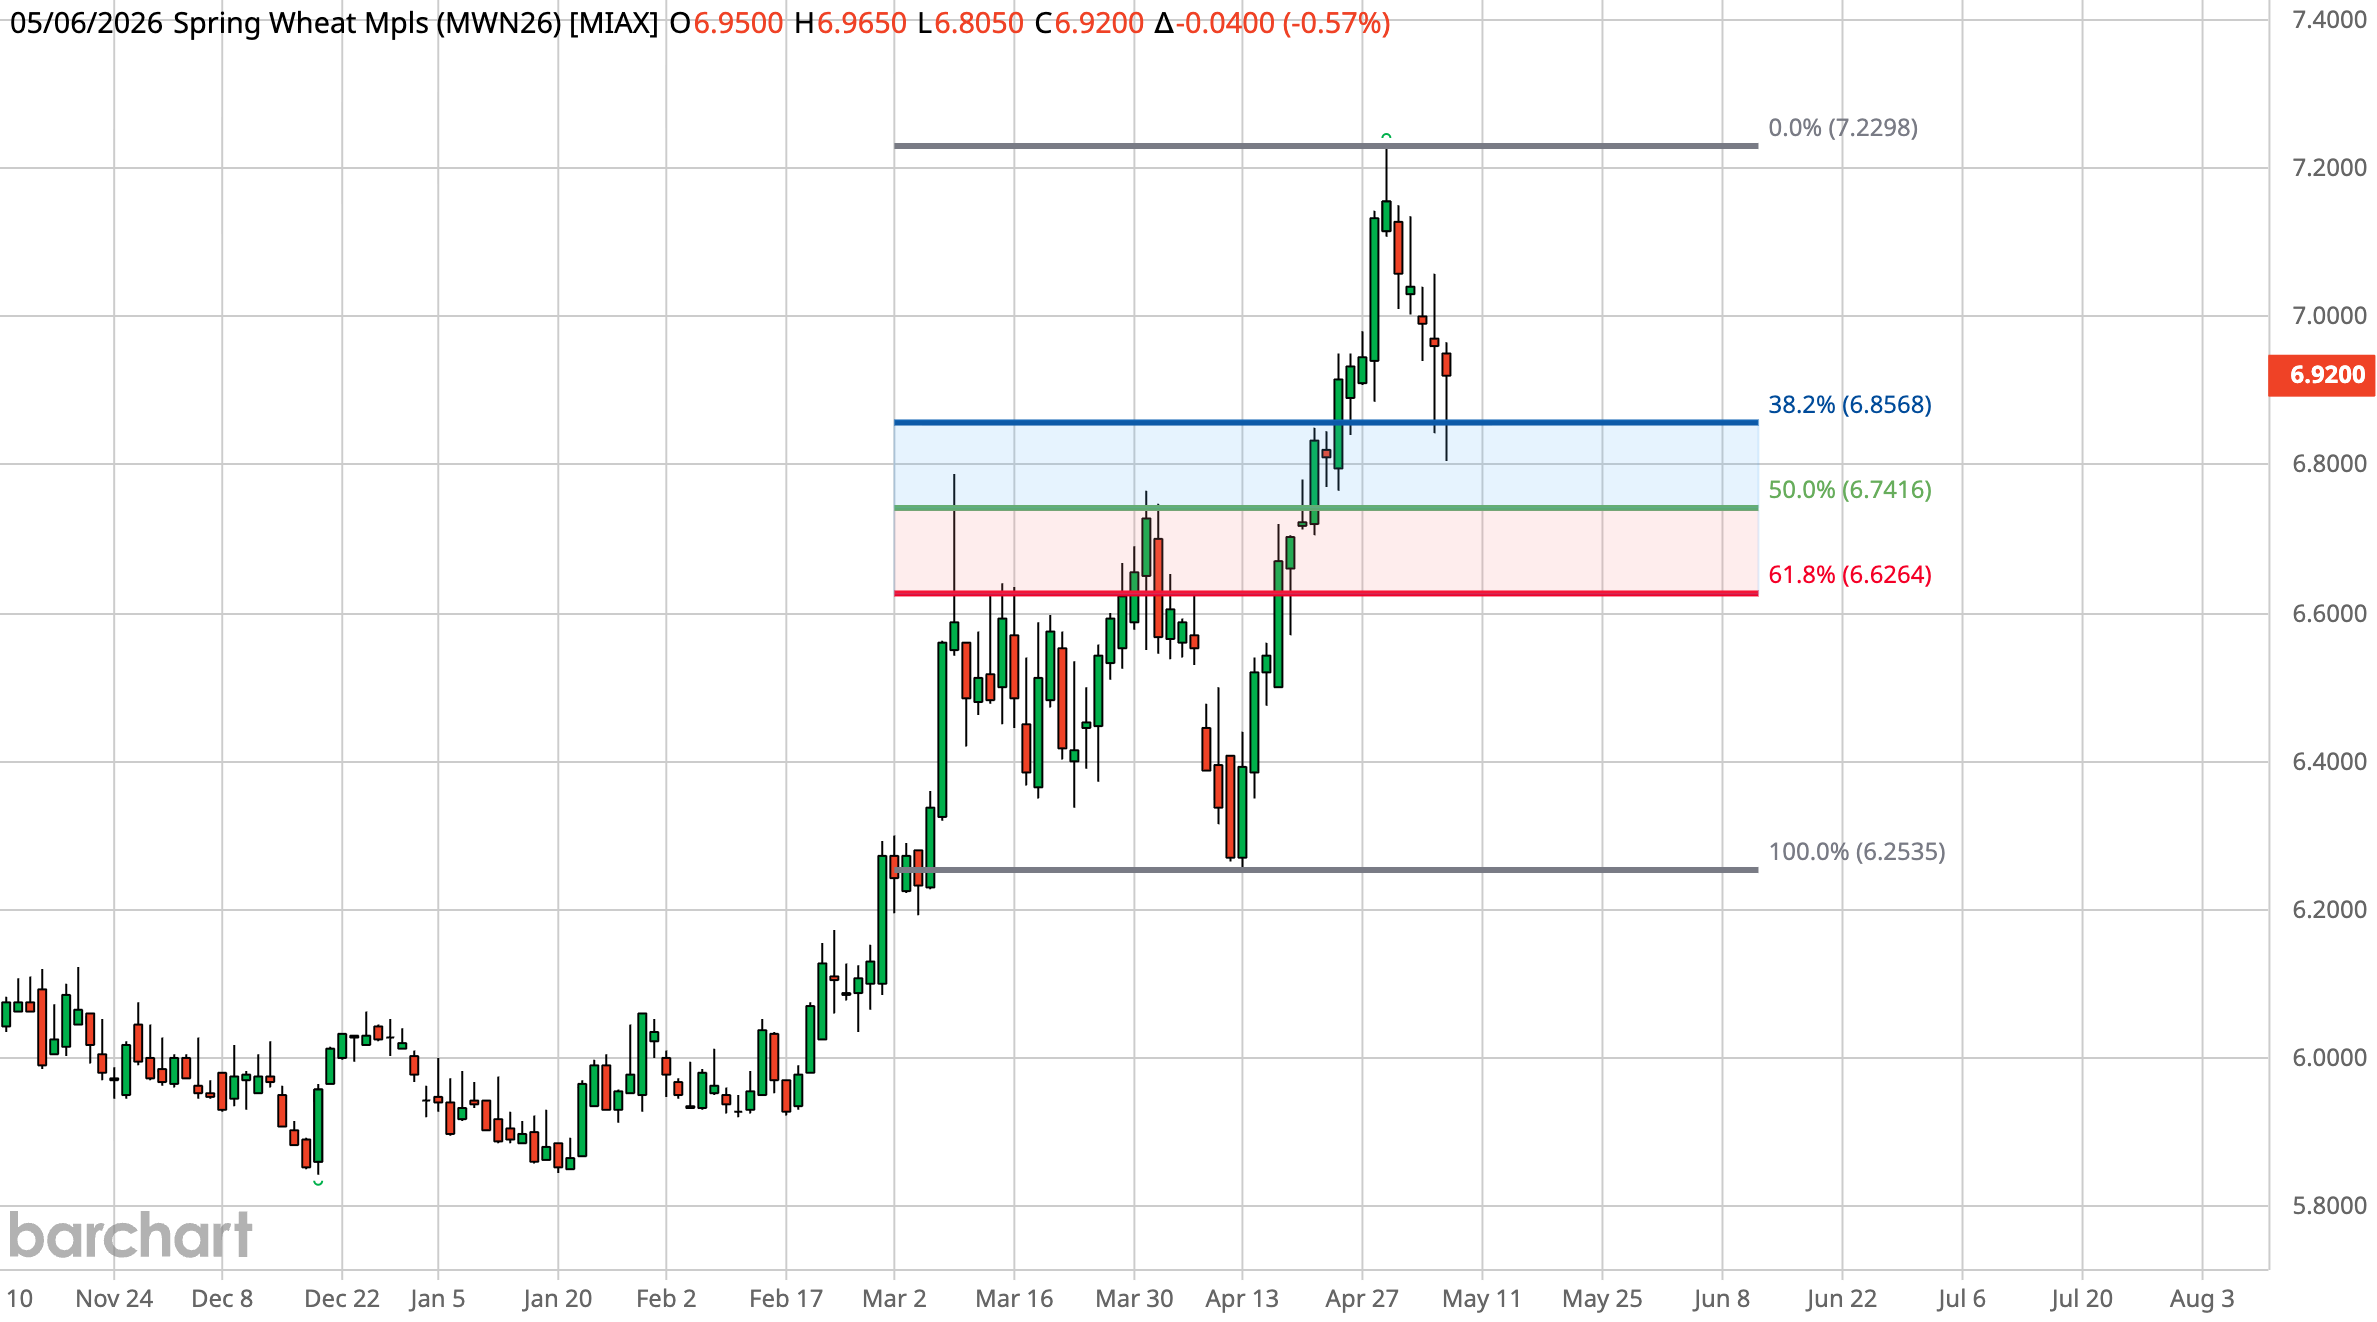
July MPLS Chart:
Similar look to KC wheat.
Came into the first support box that aligns with prior resistance.
The must hold level is $6.26 at the 61.8% level.
Cattle
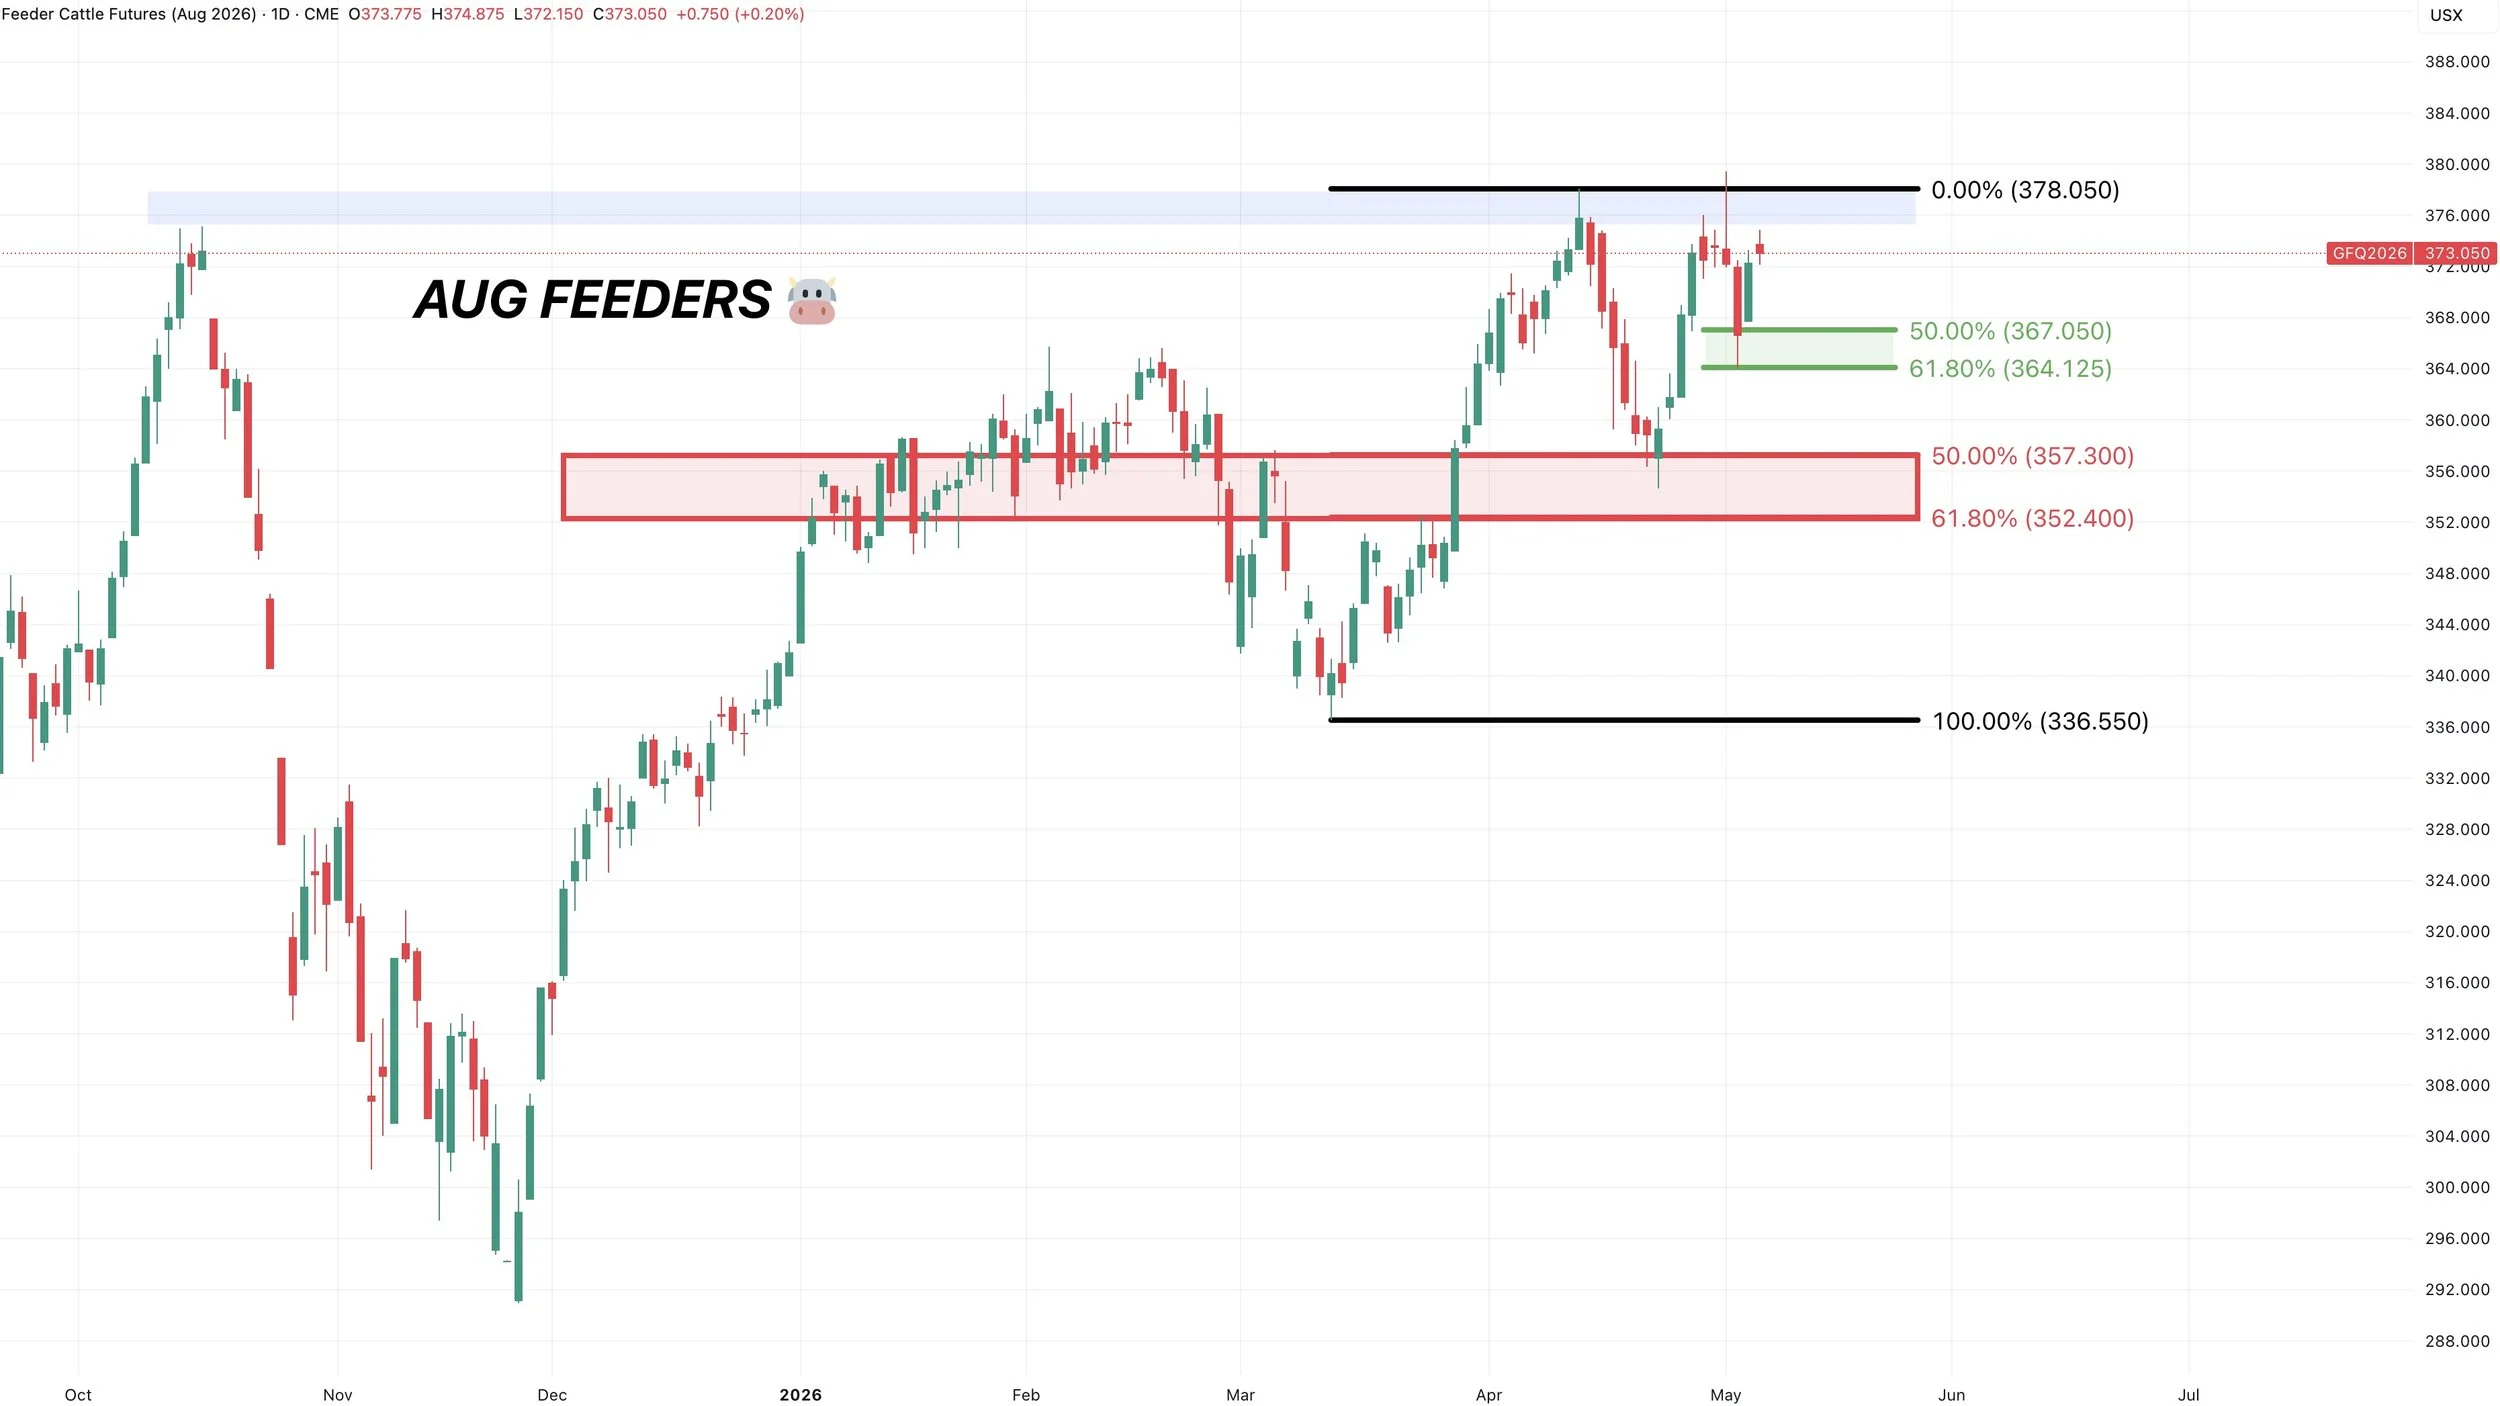
Aug Feeders Chart:
Not much to update here.
Chopping around near the highs, waiting to see if we breakout of reject.
We did however bounce after giving back 61.8% of the recent rally.
So we'd like to hold that level to prevent further downside.
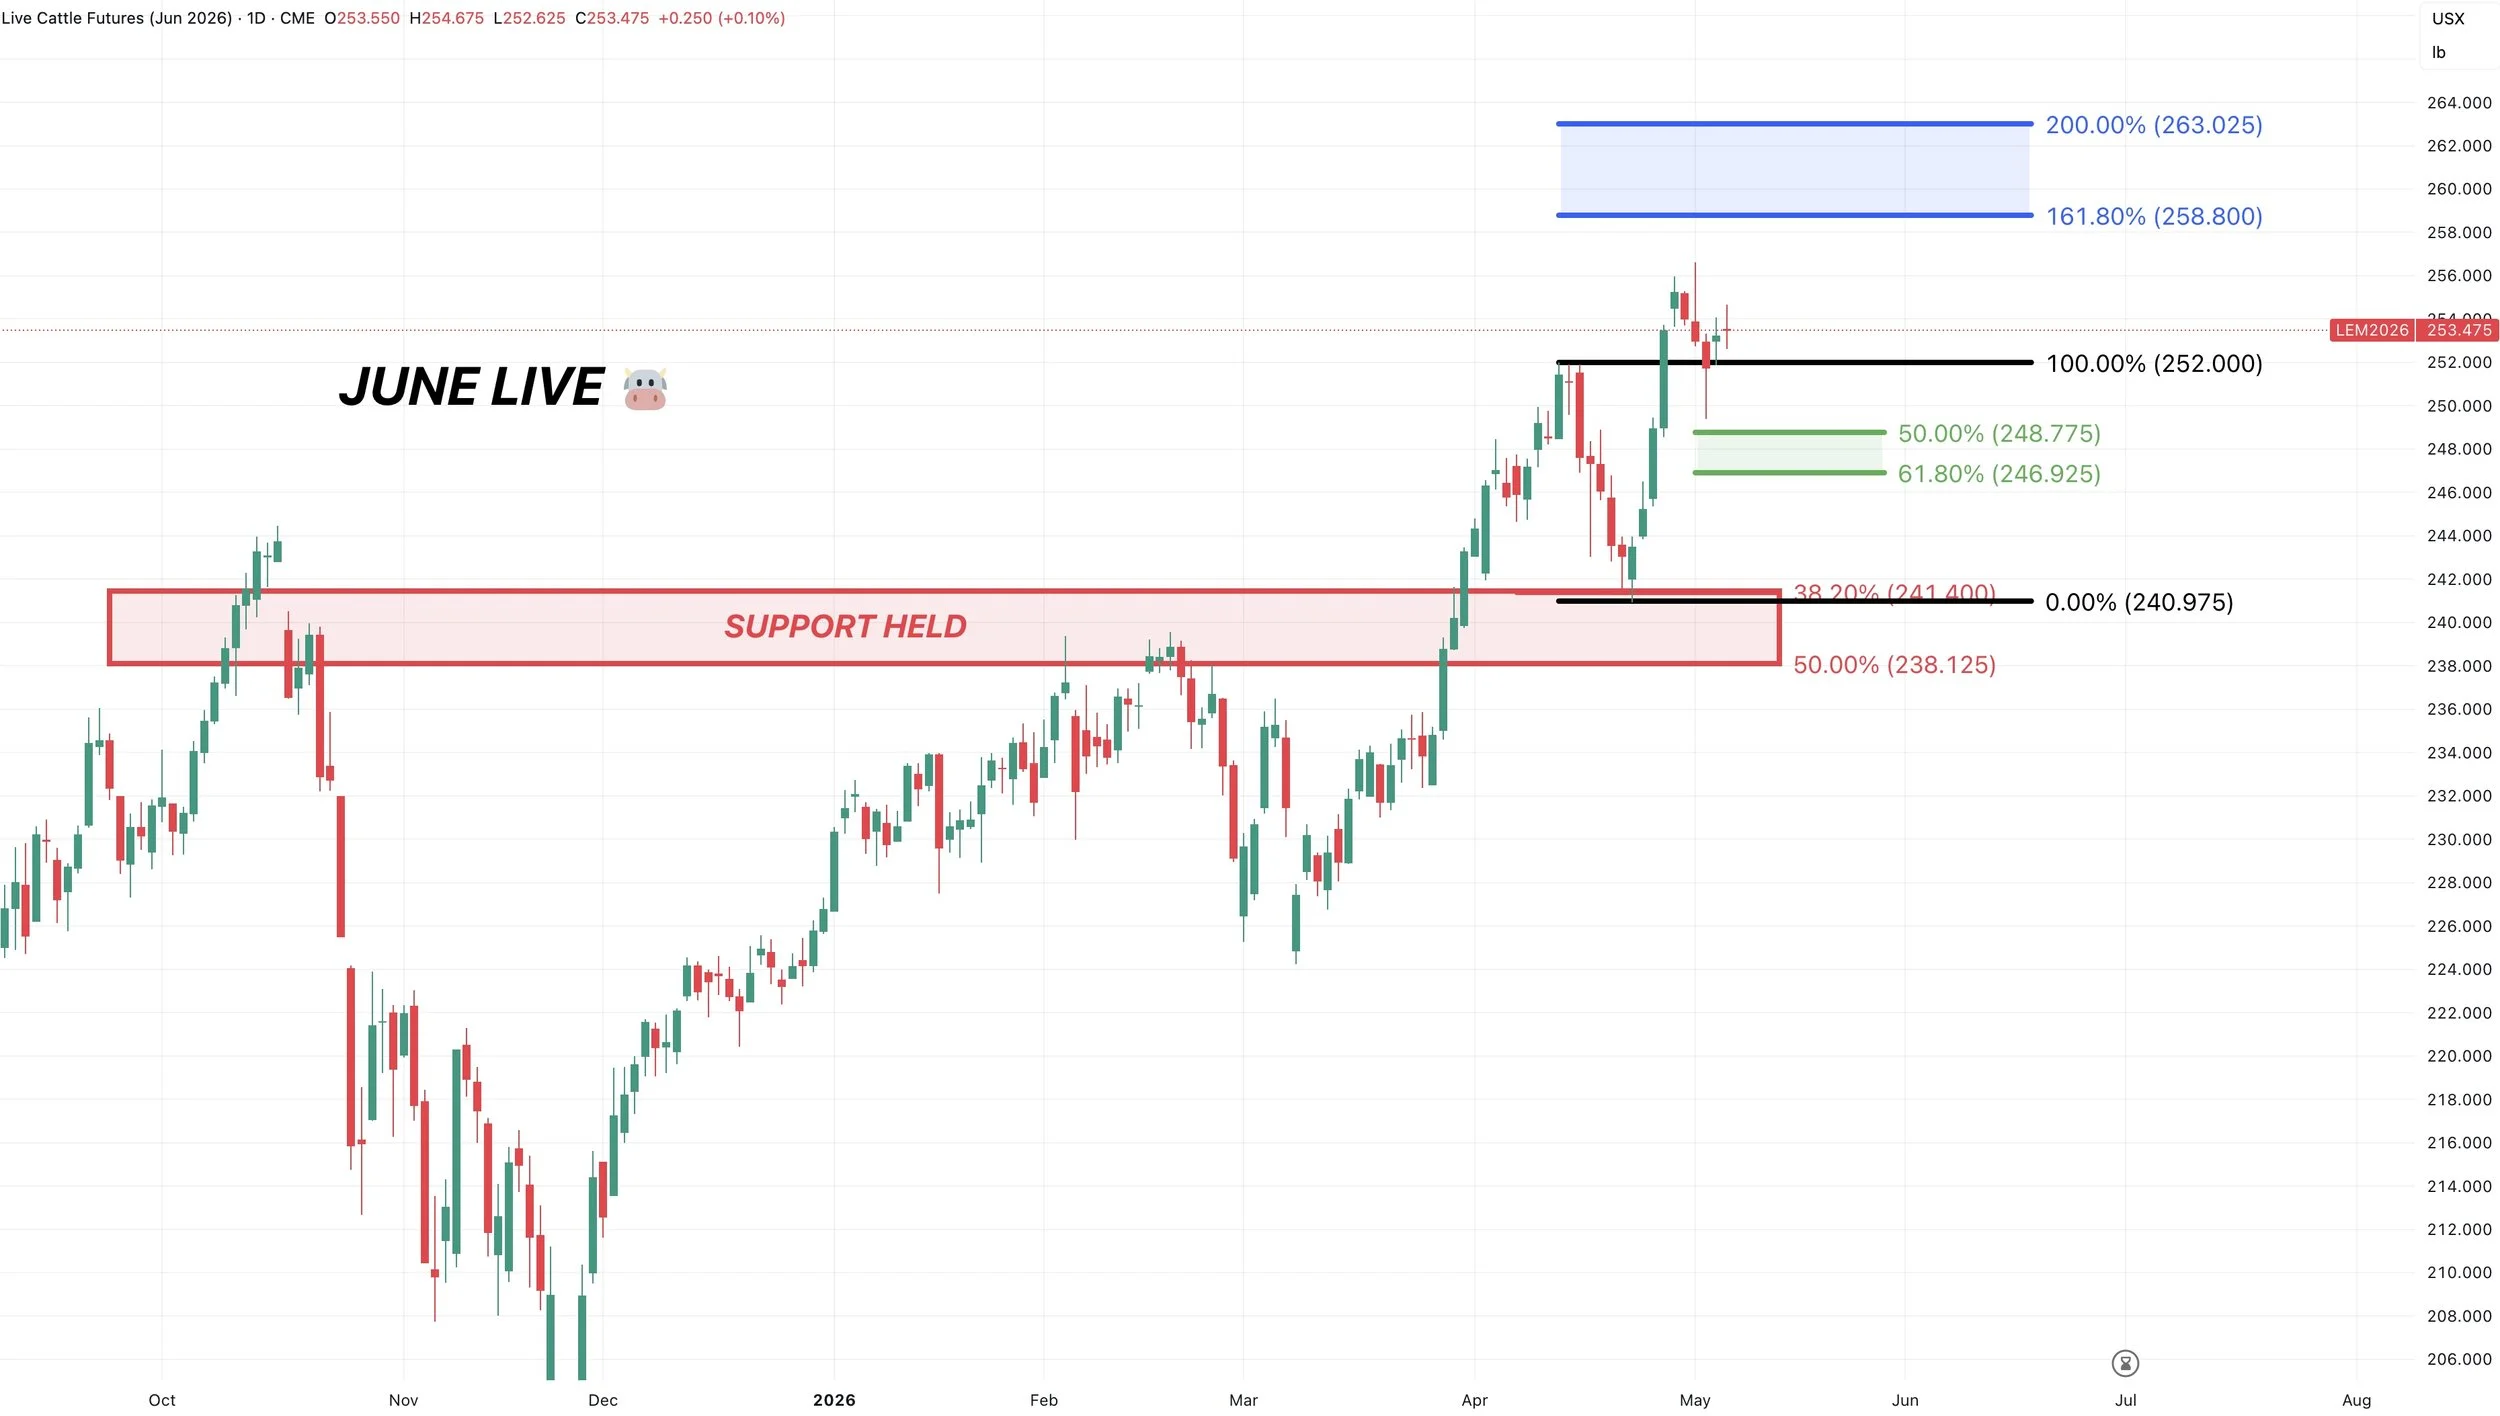
June Live Chart:
Currently finding some support at those prior highs.
Overall, the trend remains higher unless we break below the golden zone and 247.
The blue box between 259 and 263 would still be a common continuation target.
Want to Talk?
Our phones are open 24/7 for you guys if you ever need anything or want to discuss your operation.
Jeremey & Office: (806)484-1214
Sebastian: (605)280-1186
Email: sfrost@dailymarketminute.com
Hedge Account
Interested in a hedge account? Use the link below to set up an account or give us a call.
Recent Signals
April 28th, 2026: 🌾
KC wheat specific signal.
CLICK HERE TO VIEW
April 27th, 2026: 🌽
Corn catch up sell signal.
CLICK HERE TO VIEW
April 10th, 2026: 🌽
Corn buy signal.
CLICK HERE TO VIEW
March 19th, 2026: 🌱
New crop soybeans signal & hedge alert.
CLICK HERE TO VIEW
March 9th, 2026: 🌱
Soybeans signal & hedge alert. Sent via text.
March 6th, 2026: 🌽 🌾
Corn & wheat sell signal & hedge alert.
March 3rd, 2026: 🌽
Old crop & new crop corn sell signal & hedge alert.
Feb 26th, 2026: 🌱
Old crop & new crop beans sell signal & hedge alert.
Feb 19th, 2026: 🌾
KC wheat sell signal & hedge alert.
Feb 6th, 2026: 🌽 🌱
Old crop corn & soybean sell signal & hedge alert.
Feb 4th, 2026: 🌱
Soybean sell signal & hedge alert.
Nov 17th, 2025: 🌱
Soybean sell signal & hedge alert.