
HOW LOW COULD GRAINS GO?
MARKET UPDATE
You can scroll to read the usual update as well. As the written version is the exact same as the video.
Timestamps for video:
Overview: 0:00min
Corn Charts: 1:50min
Bean Charts: 4:10min
Wheat Charts: 8:00min
Cattle Charts: 10:00min
Want to talk?
Office: (806)484-1214
Your free trial has expired
Lock in our harvest sale so you don’t miss our next sell alert or future updates
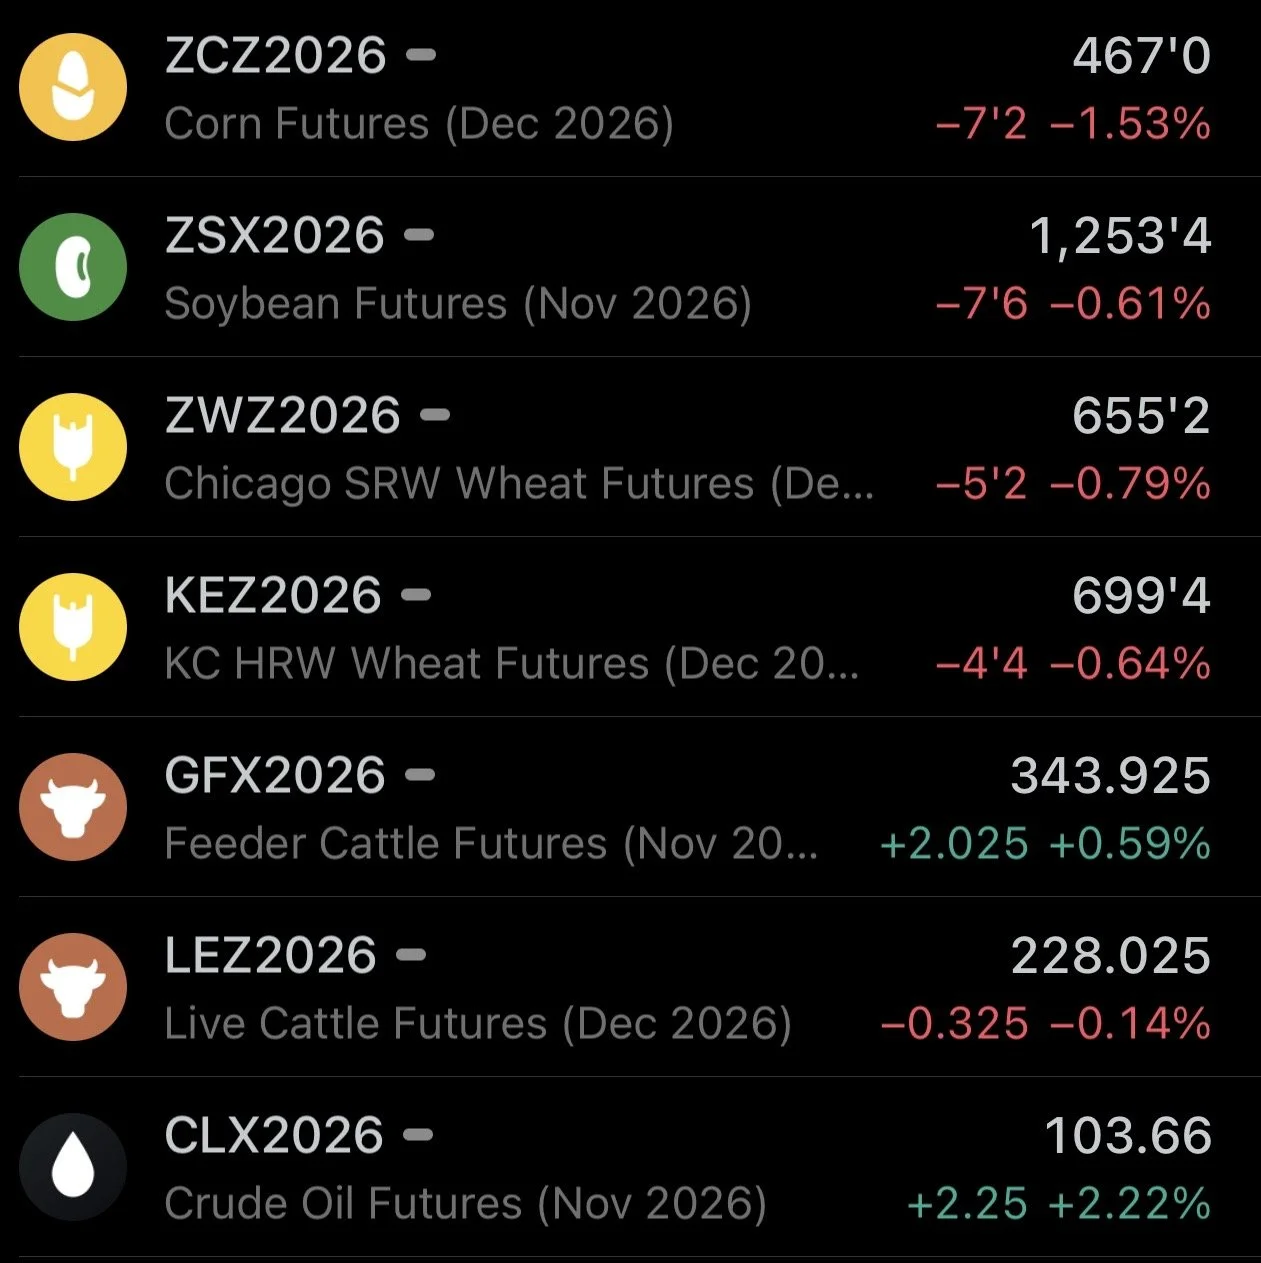
Futures Prices Close
Overview
Grains continue to puke lower, posting new lows across the grains.
Harvest pressure and technical selling are what's helping push this thing lower. As bulls just lack a catalyst for this market to find some life.
The forecasts look dry for the next week, so harvest progress should continue to ramp up.
Corn weekly export inspections came in at two year lows, which didn’t help things.
Crude oil is back above $100 but the grains don’t seem to care for now.
China continues to pile in and buy a ton of soybeans, but the market just doesn’t care about that right now.
There are a lot of thoughts about a record yield in soybeans adding weakness to this market. Soybeans are also seeing a lot of farmer selling in both the US and Brazil.
But despite the selling, beans have held on a lot better than corn and wheat have for the last month or two. I think this is a good sign for beans, and long term I still think beans have plenty of potential once we get through this harvest pressure.
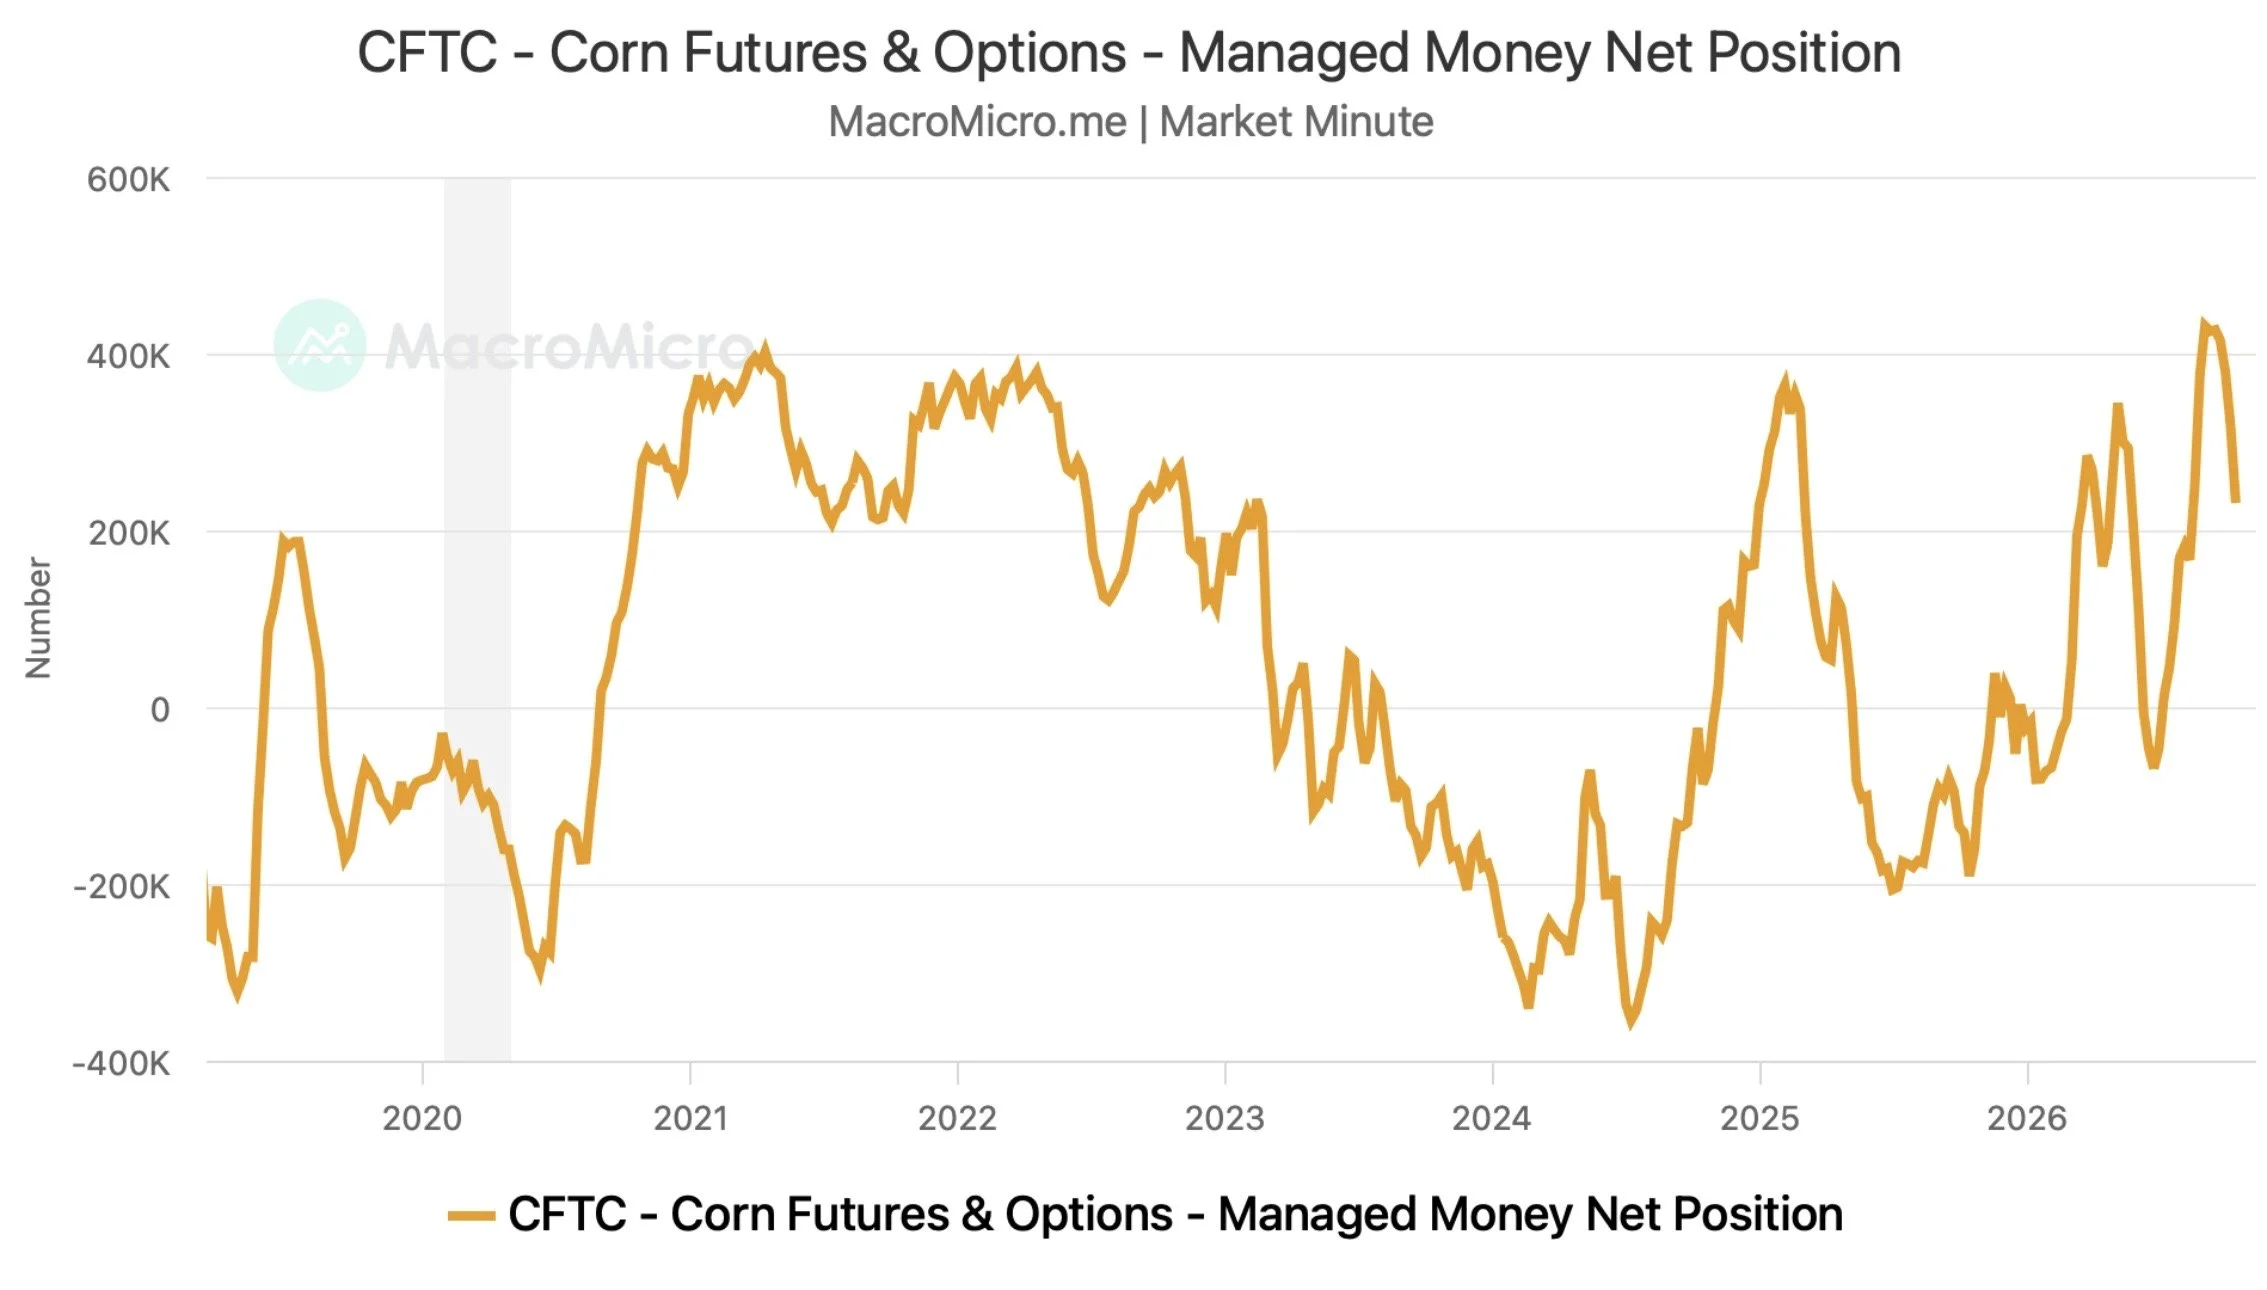
The funds have sold about half of their corn position, but are still relatively long. So we will have to see if they continue to liquidate or hold tight.
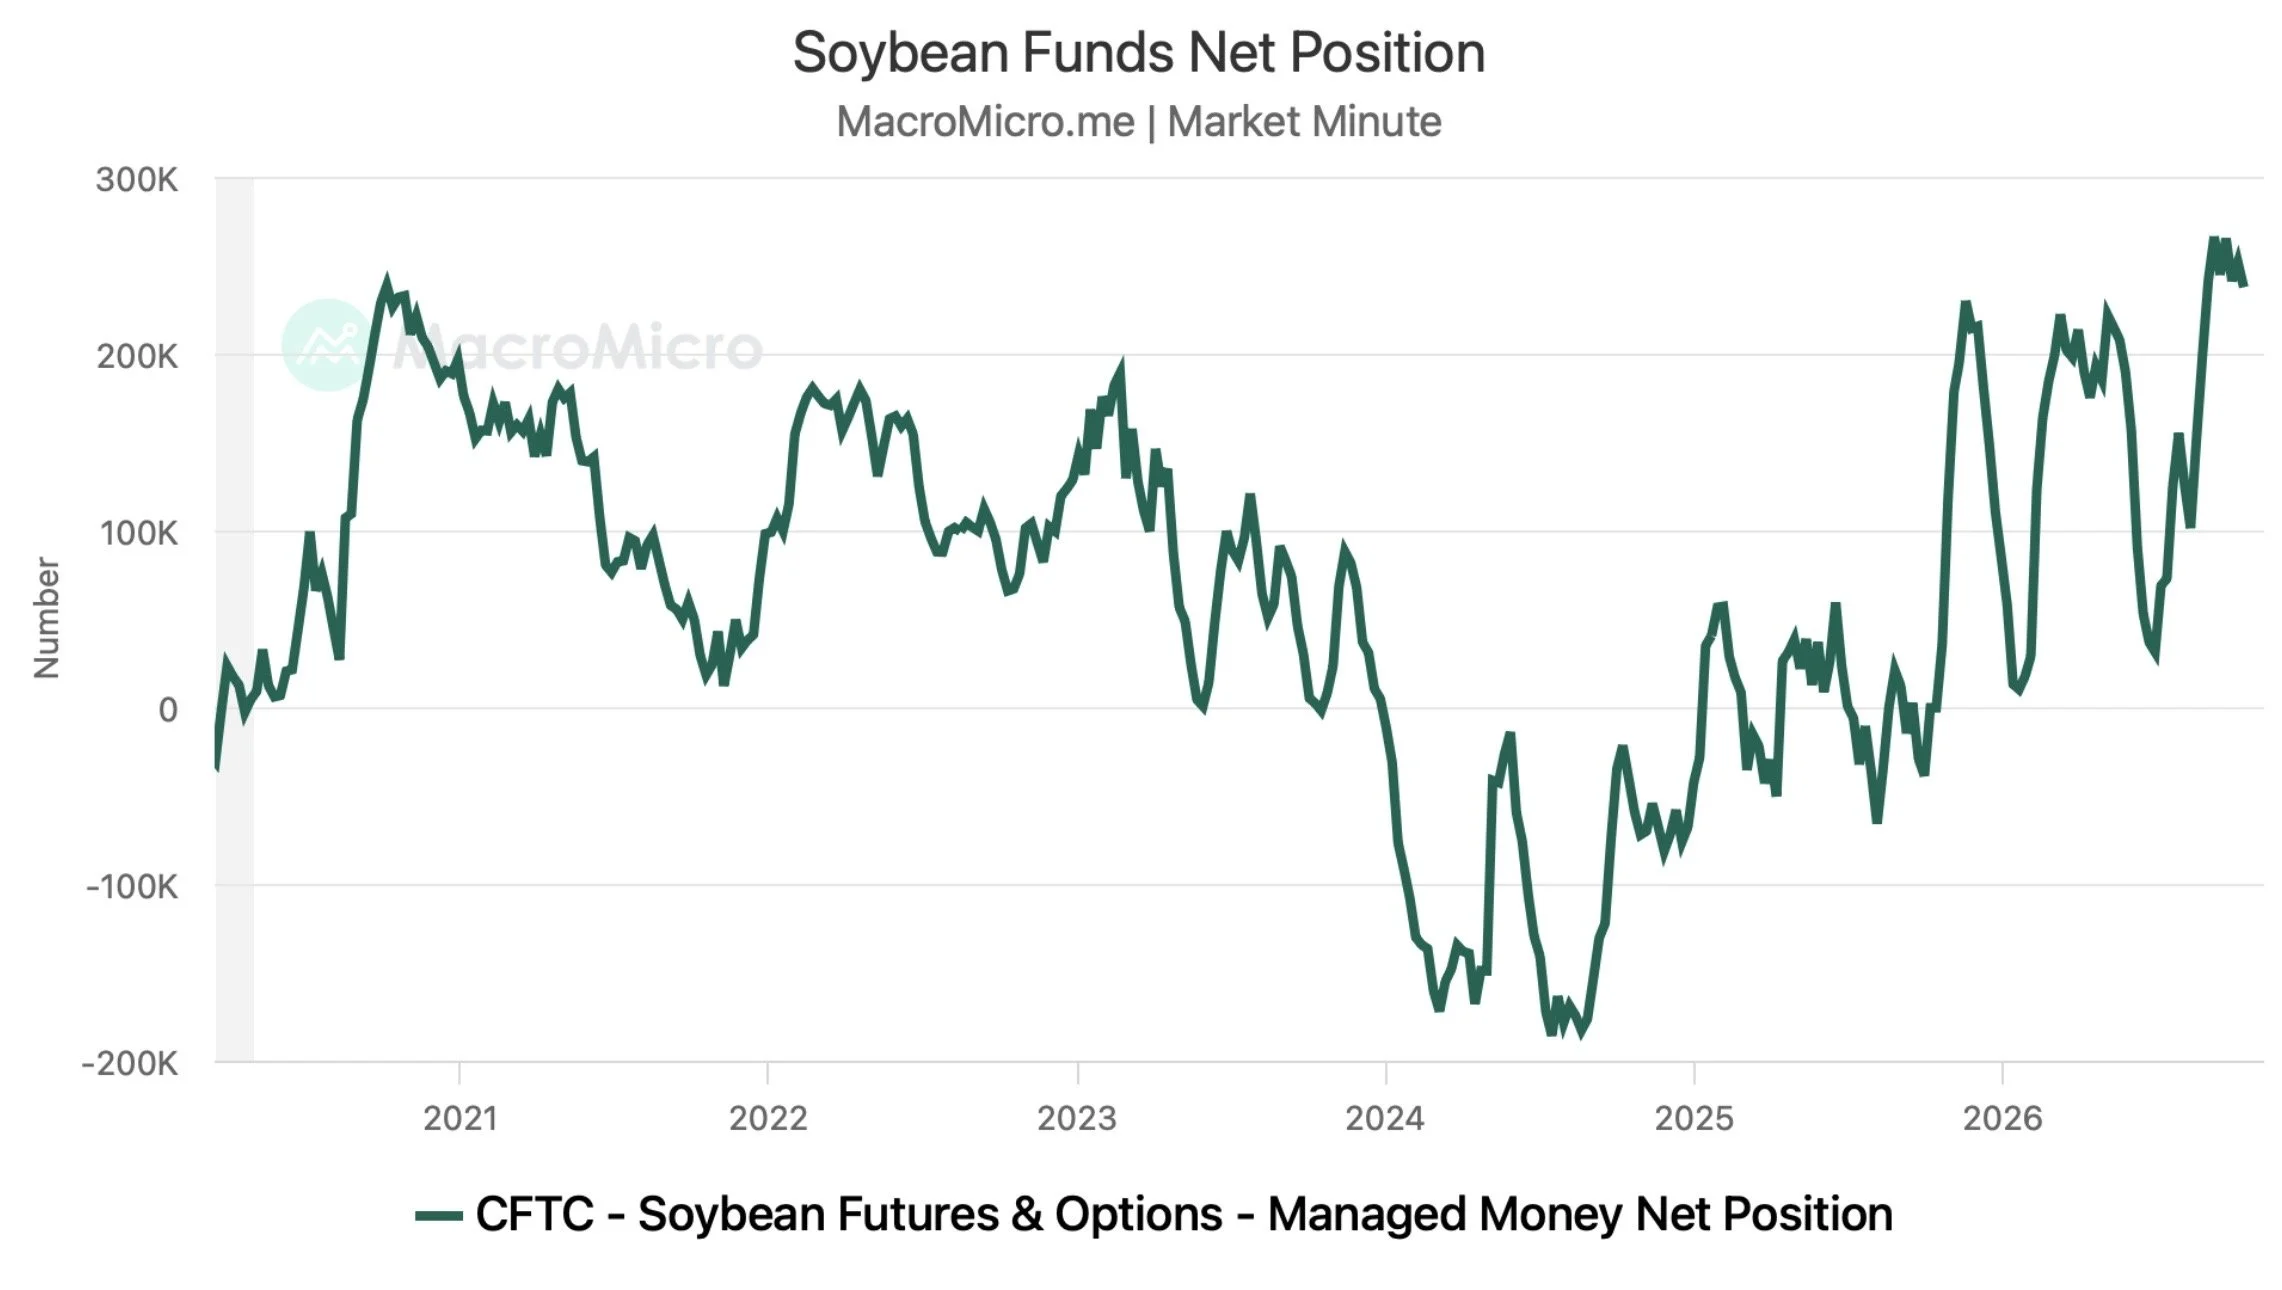
The funds however must see a story in soybeans. As they have defended that soybean position a lot harder than they have in corn.
We do still have plenty of Brazil weather season left, along with the possible impacts from the Super El Niño.
Funds Positions
It's going to be a shorter update than usual today, as fundamentally I don’t have much to add from Friday's video and there is just simply a lack of fresh news in this market.
Link to Friday's Video: Click Here
However, on the charts there are some important things to watch.
Over the next several months and heading into next year, I think grains still have a lot of potential, which we'll get into more later this week, but for now the charts are going to be a key thing to watch short term.
As some of these fundamental stories, such as if corn yield really is lower, isn’t going to matter to this market today.
So today is just going to be a quick run down on the charts.
Let's jump right in.
Chart Breakdowns
Corn
Charts
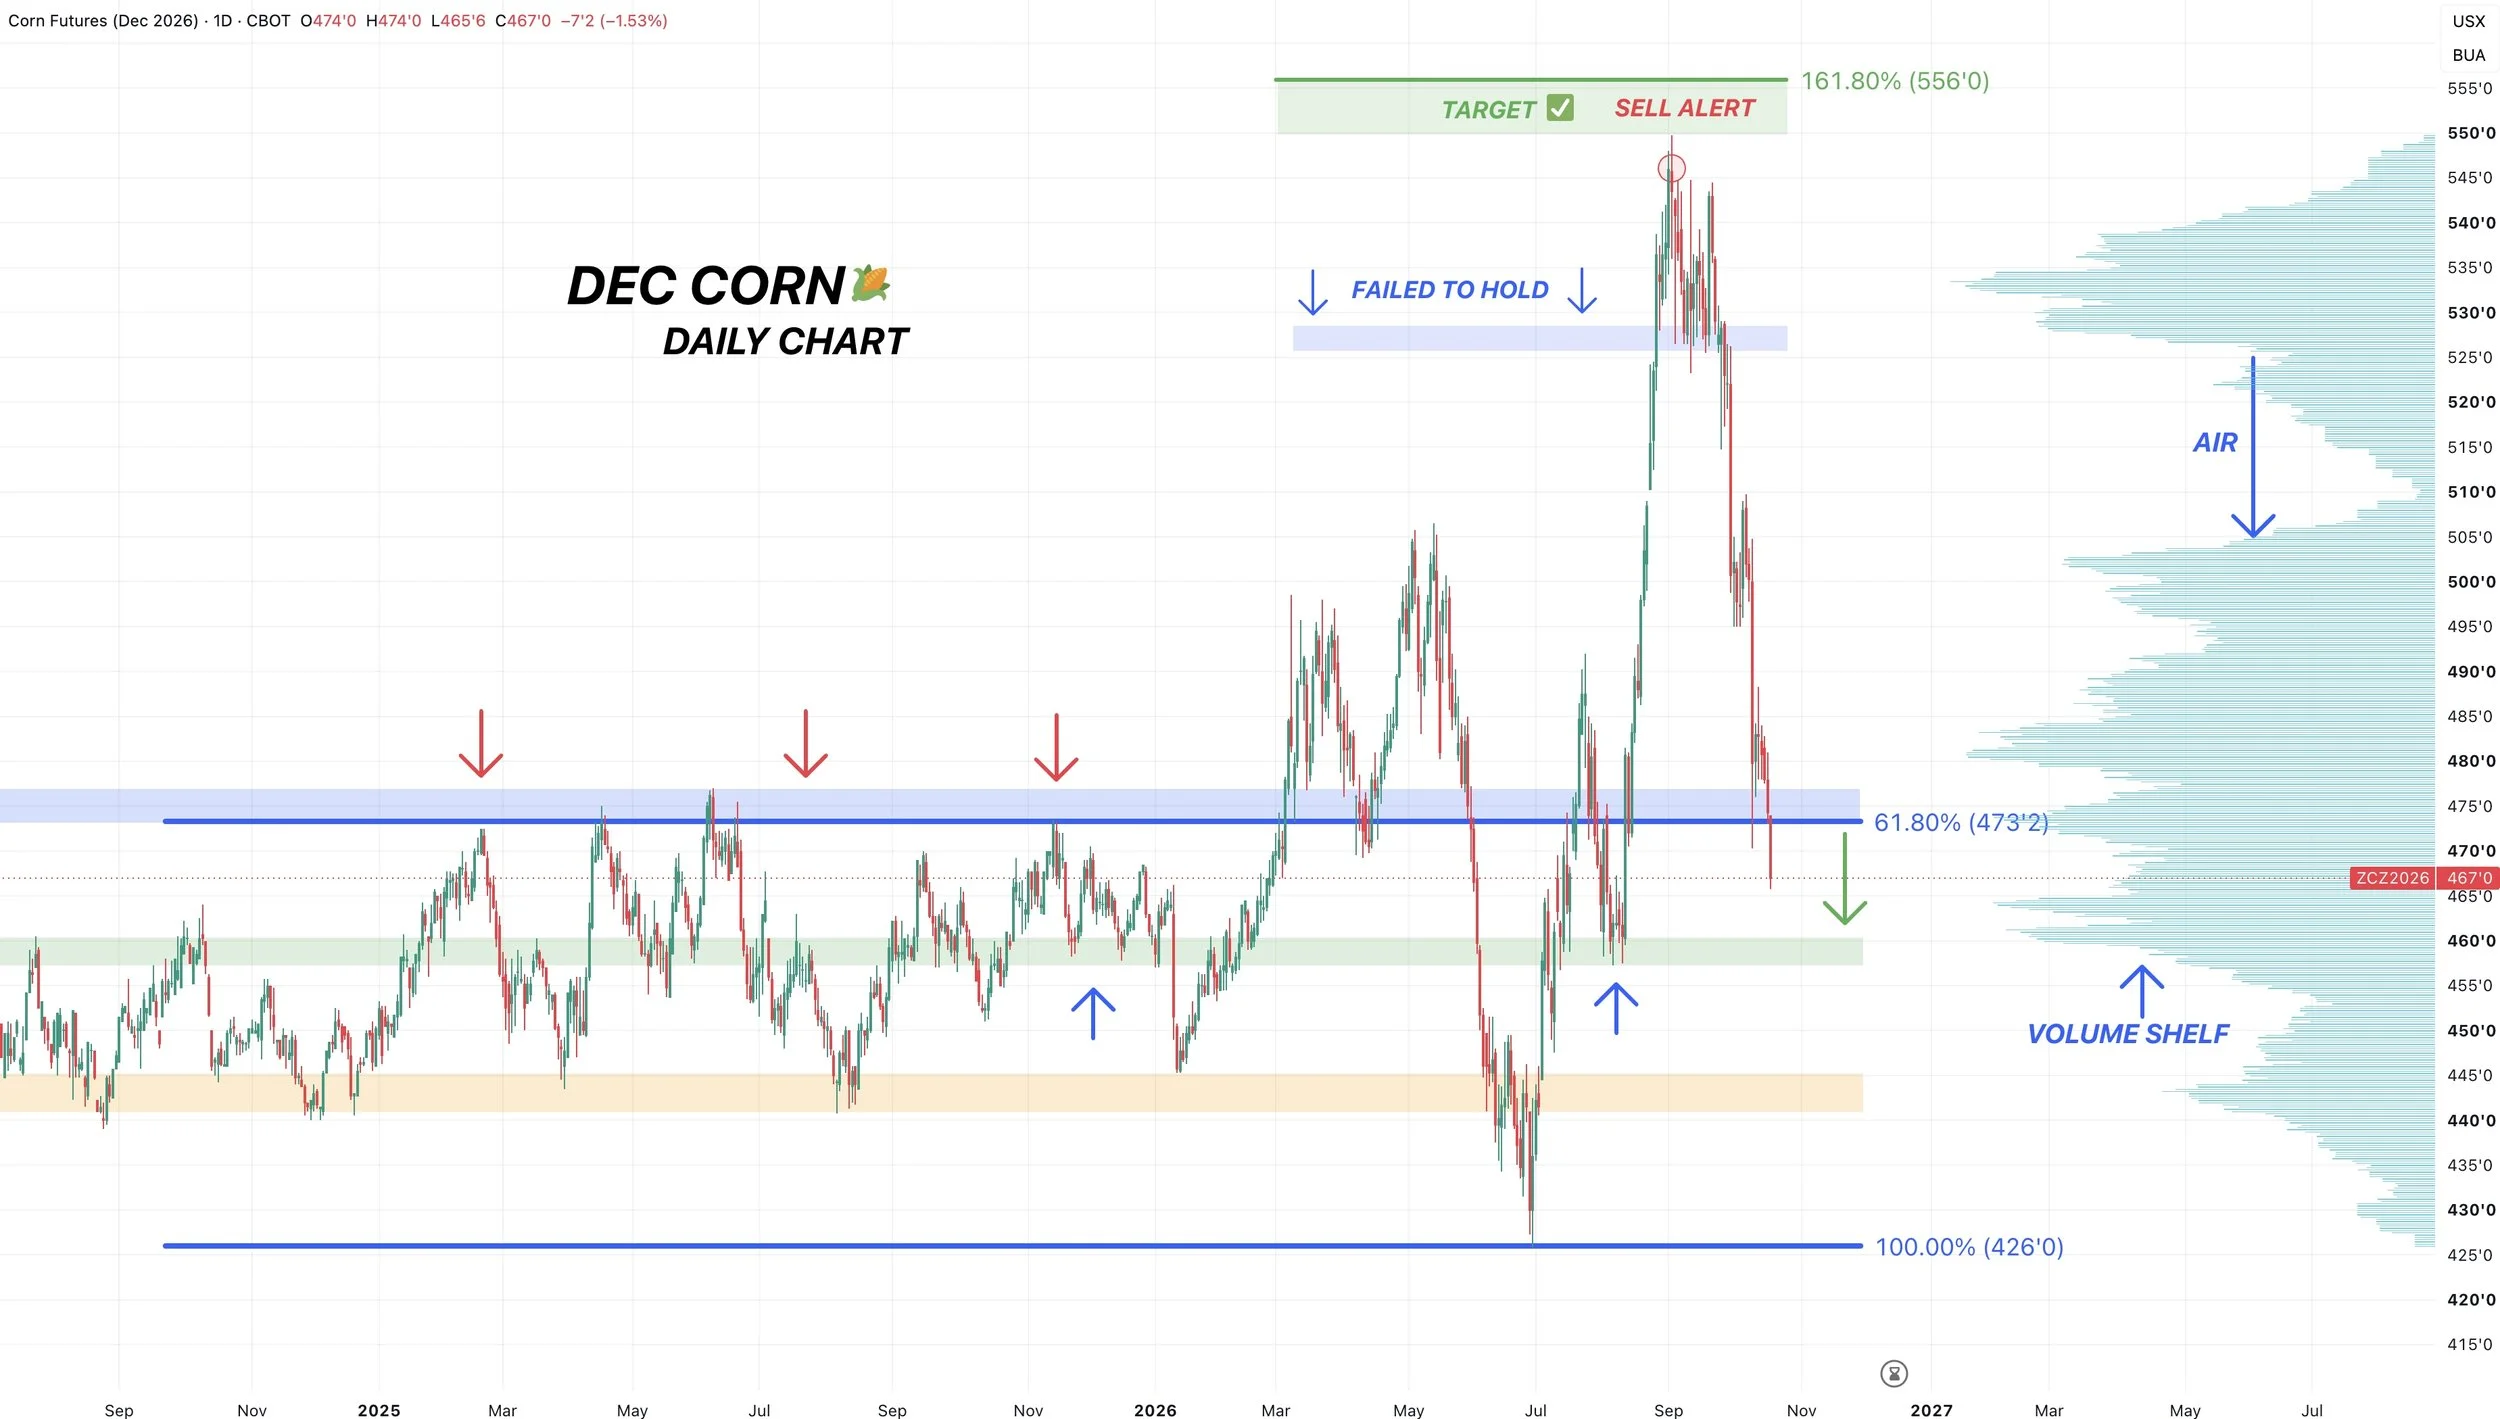
Dec Corn Chart:
Corn continues to puke lower. Breaking some key support along the way.
As we broke below the lows from the USDA report day.
That same level was the 61.8% retracement from the contract highs down to the contract lows.
It was also the top end of that range we were trapped in last year. So that is not a good sign short term.
So now what?
Like we talked about last week, if this level failed to hold it would likely spike a last leg lower. As breaking support opens the flood gates lower towards the next level of support.
The next point of interest is going to be around $4.57 to $4.60 range or possibly 7-10 cents lower from here.
Which is those lows from August and the bottom of that old range from last year.
If you look at the volume profile, that is also where the last shelf of volume sits. Which can act as a magnet and support.
If we are going to bottom, we want to see it happen there. As there is going to be very little support holding this thing up below that shelf.
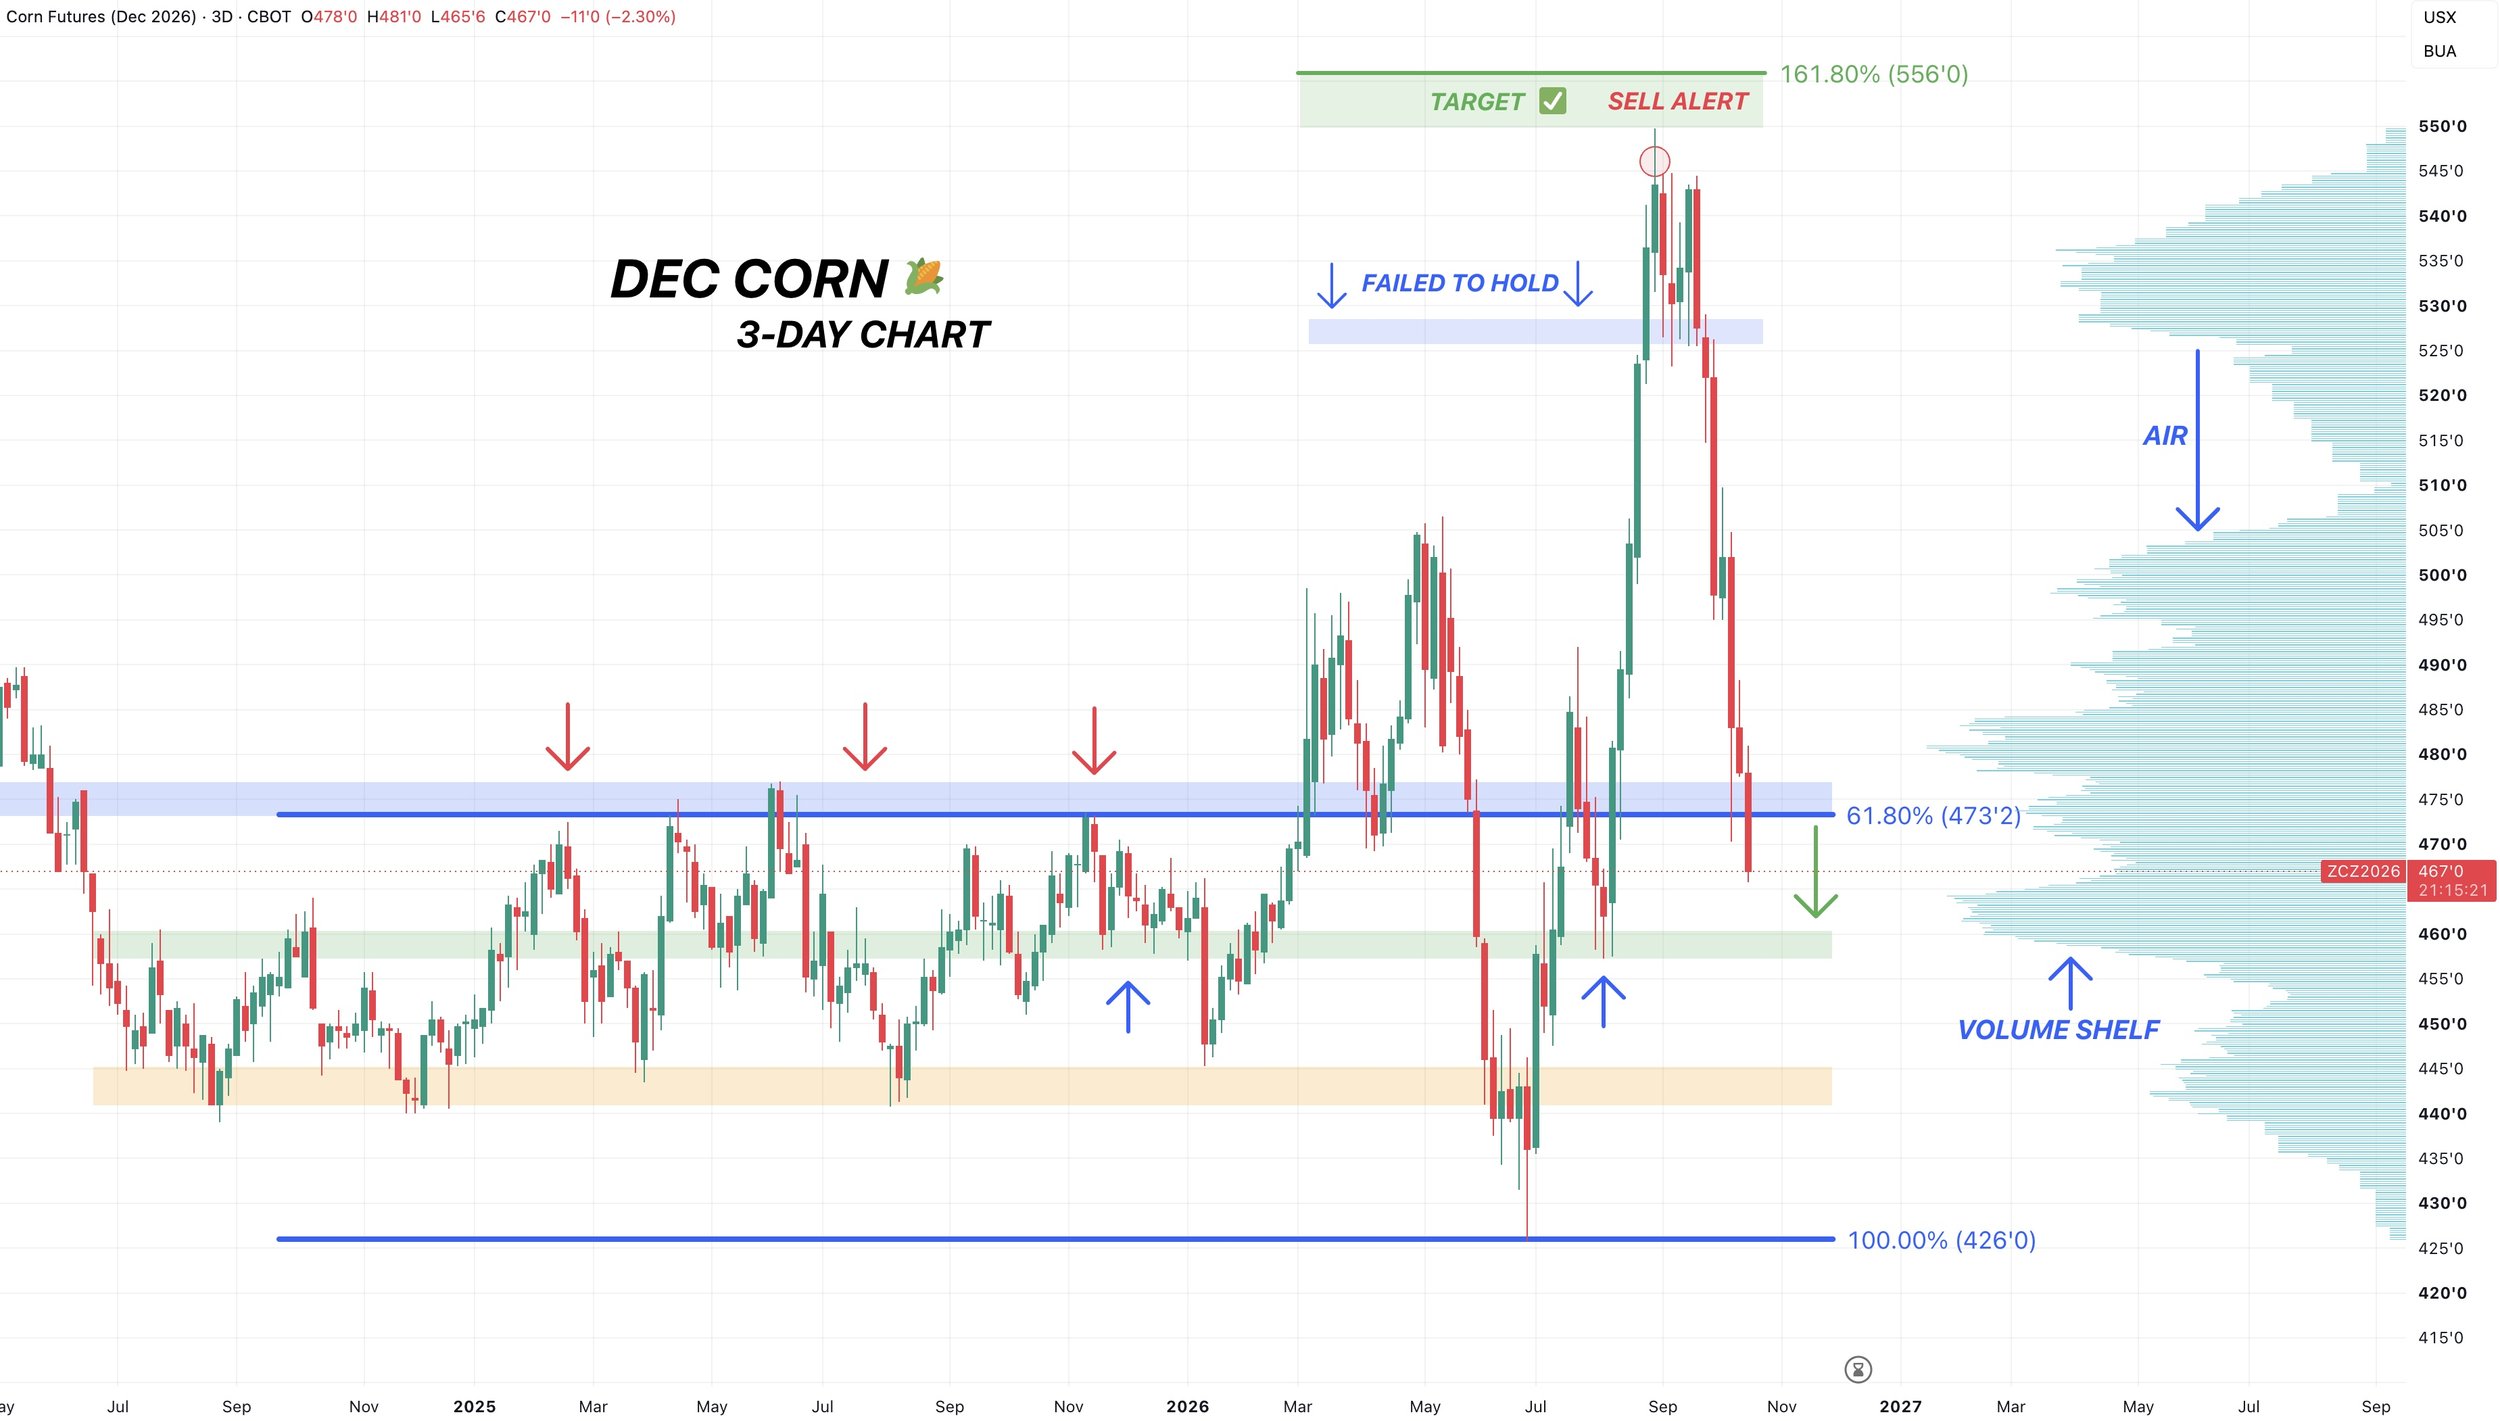
3-Day Chart:
Here is the 3-day chart for some additional context.
Sometimes a chart like this helps reduce some of the noise from a daily chart.
But again, you can see the key levels here.
We broke the top of that old range. So we might want to come down and test the bottom of that old range now.
Again, you have that huge shelf of volume sitting there. So you'd like to imagine the market stabilizes down there.
RSI:
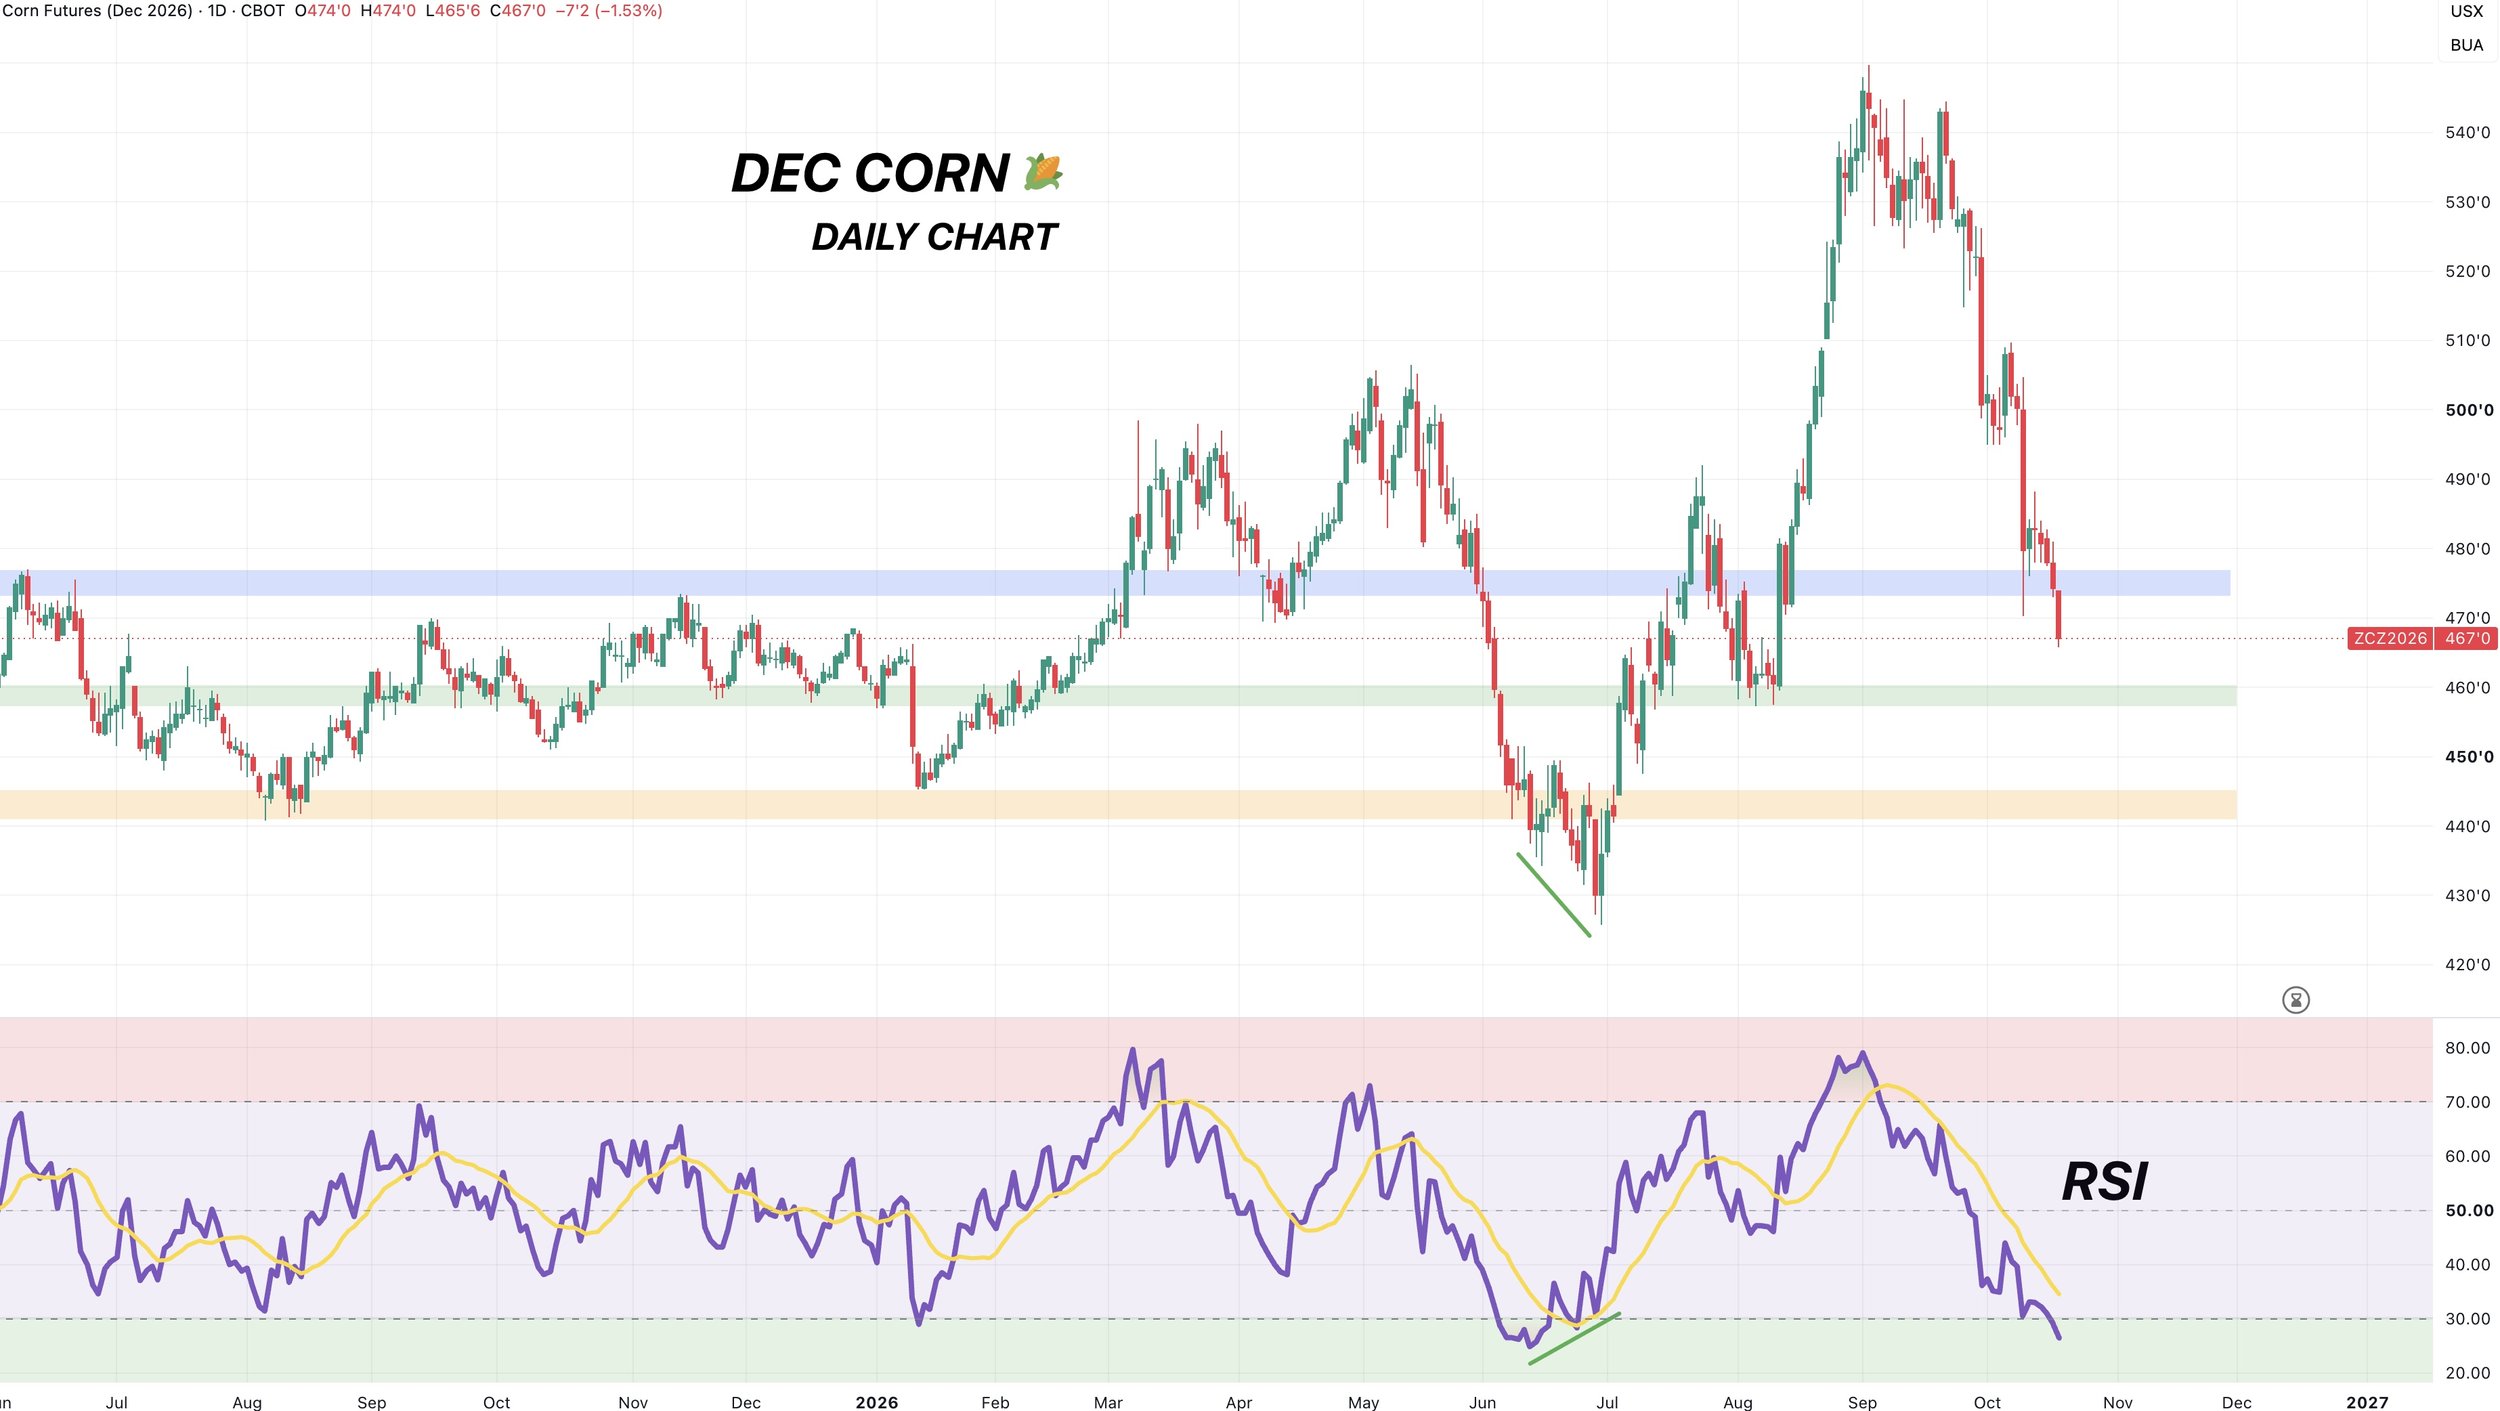
Dec corn is the 2nd most oversold this contract has ever been.
The most oversold was the June lows.
So you would expect a bounce relatively soon as we are entering into very oversold territory.
However, I could see a similar situation play out here like we saw in June.
Back in June, the market was super oversold. The RSI then bottomed out, yet prices kept grinding a little lower. Posting some bullish divergence as we posted one final leg lower.
But overall we broke support, so waiting to see some sort of confirmation of a bottom.
Soybeans
Charts
Nov Beans Chart:
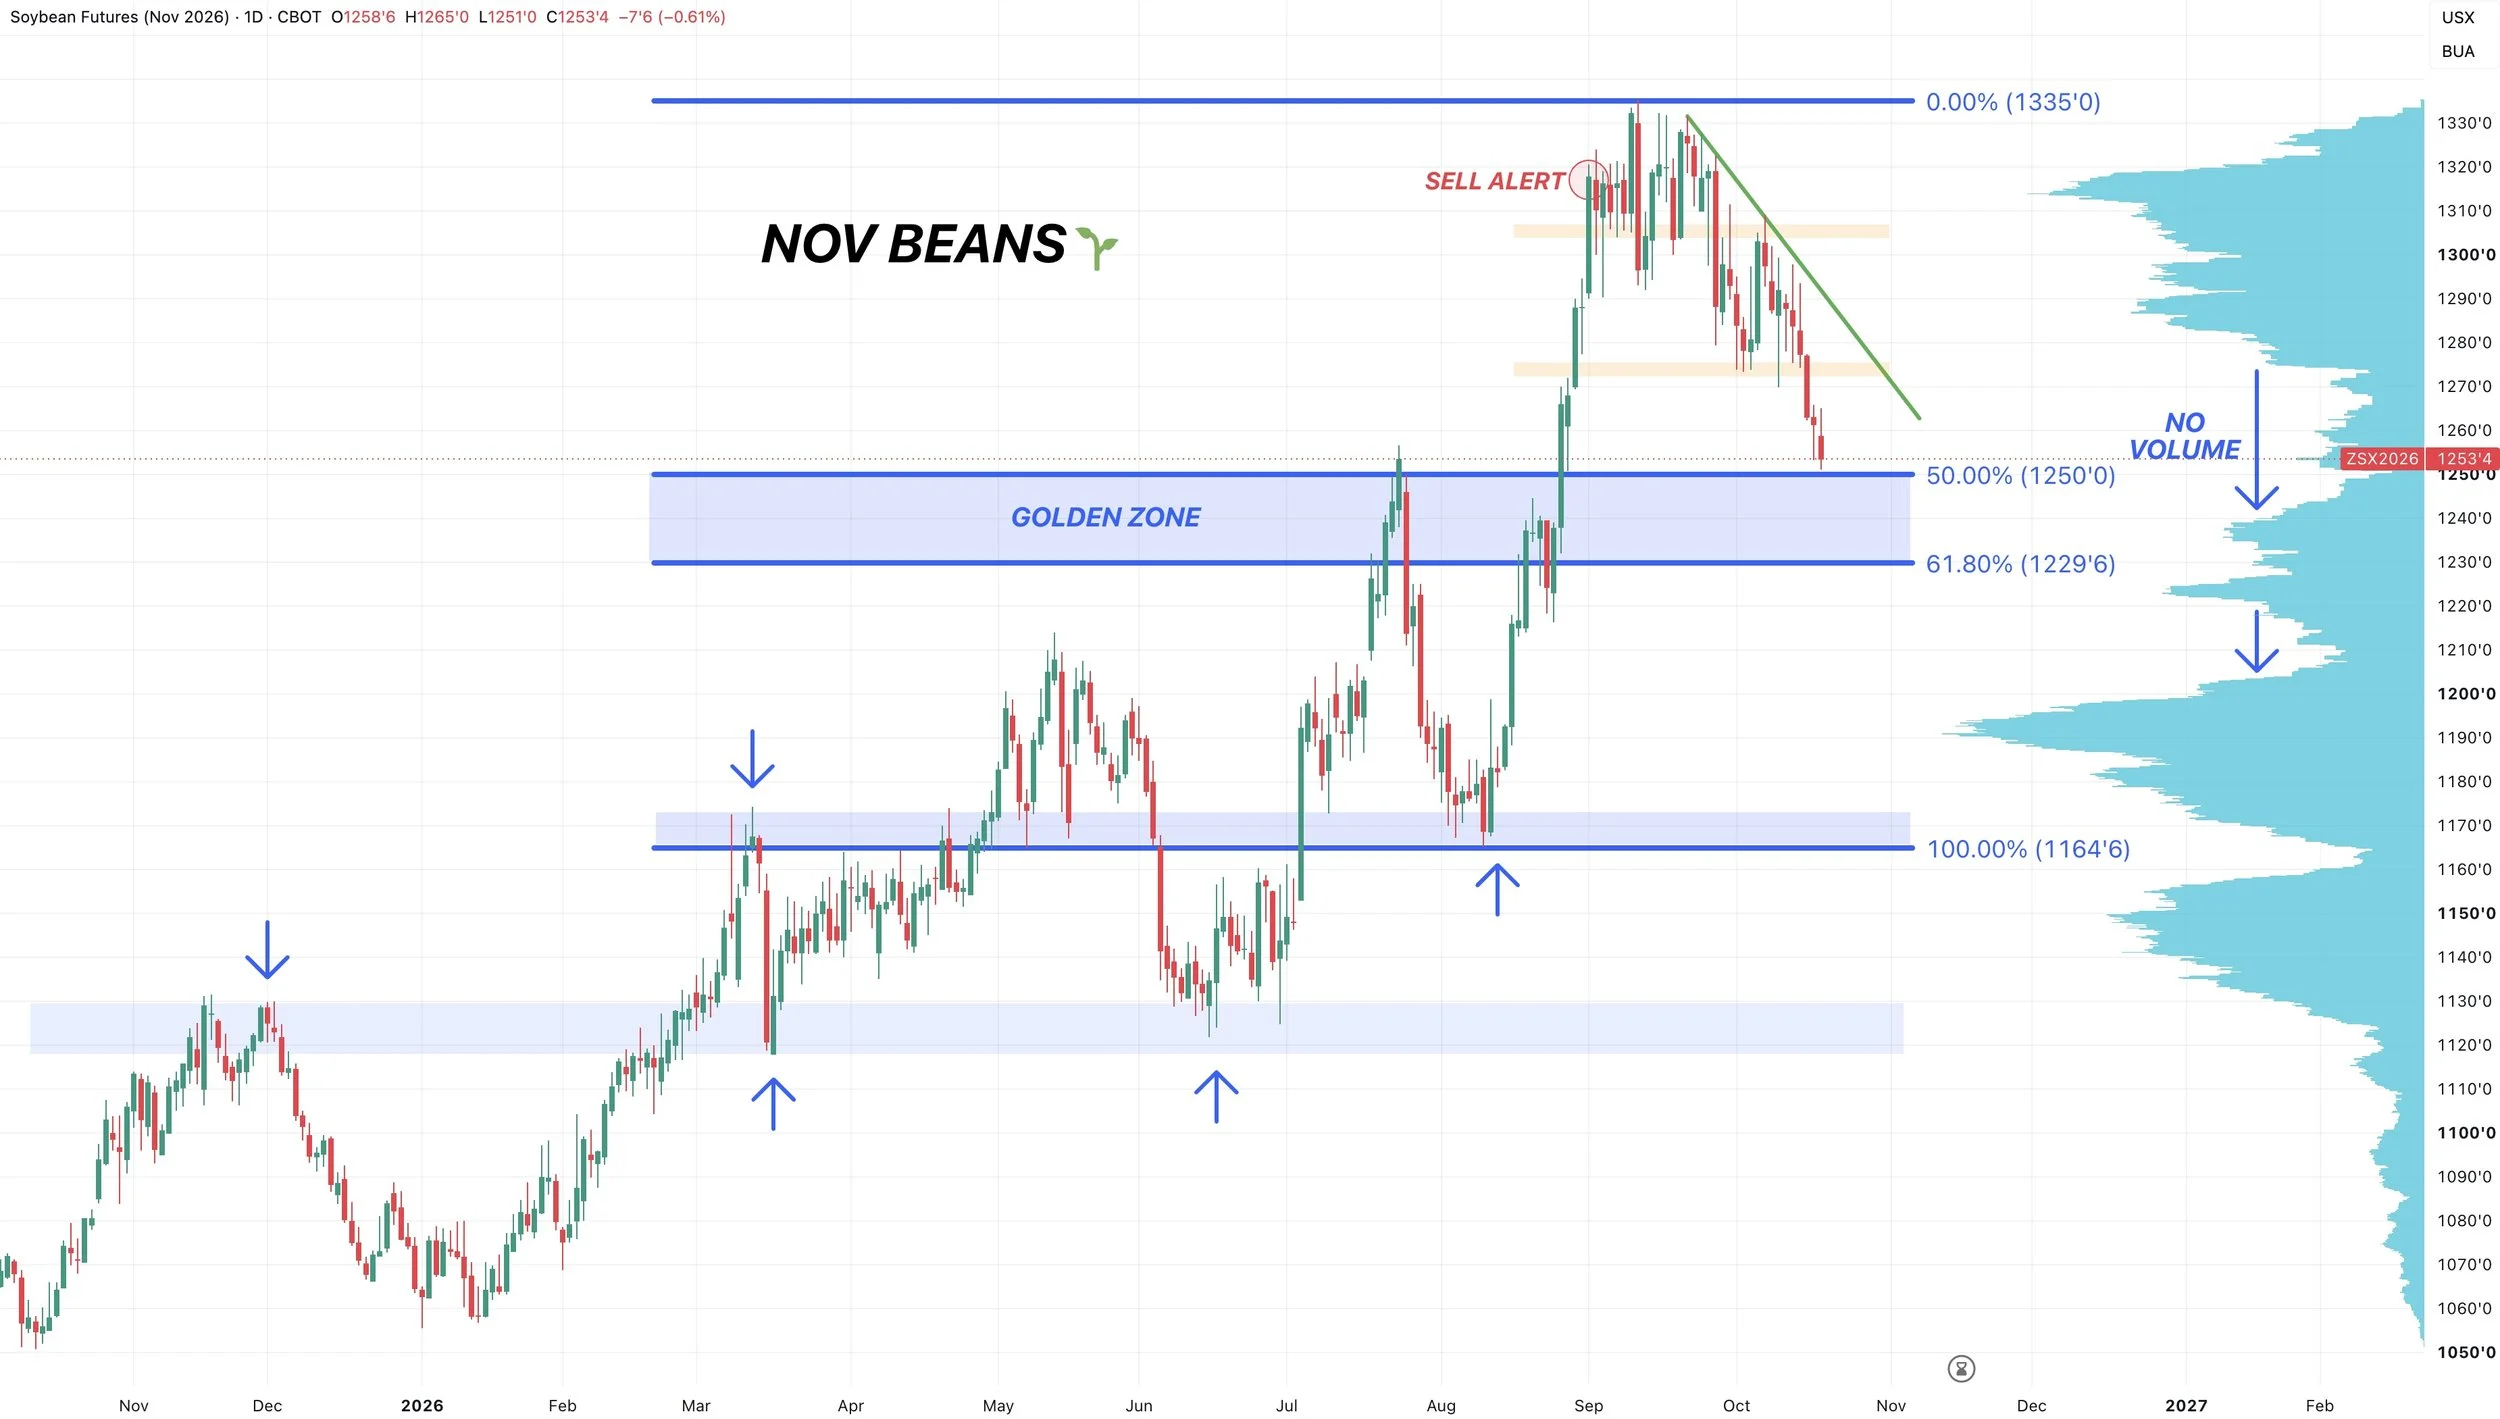
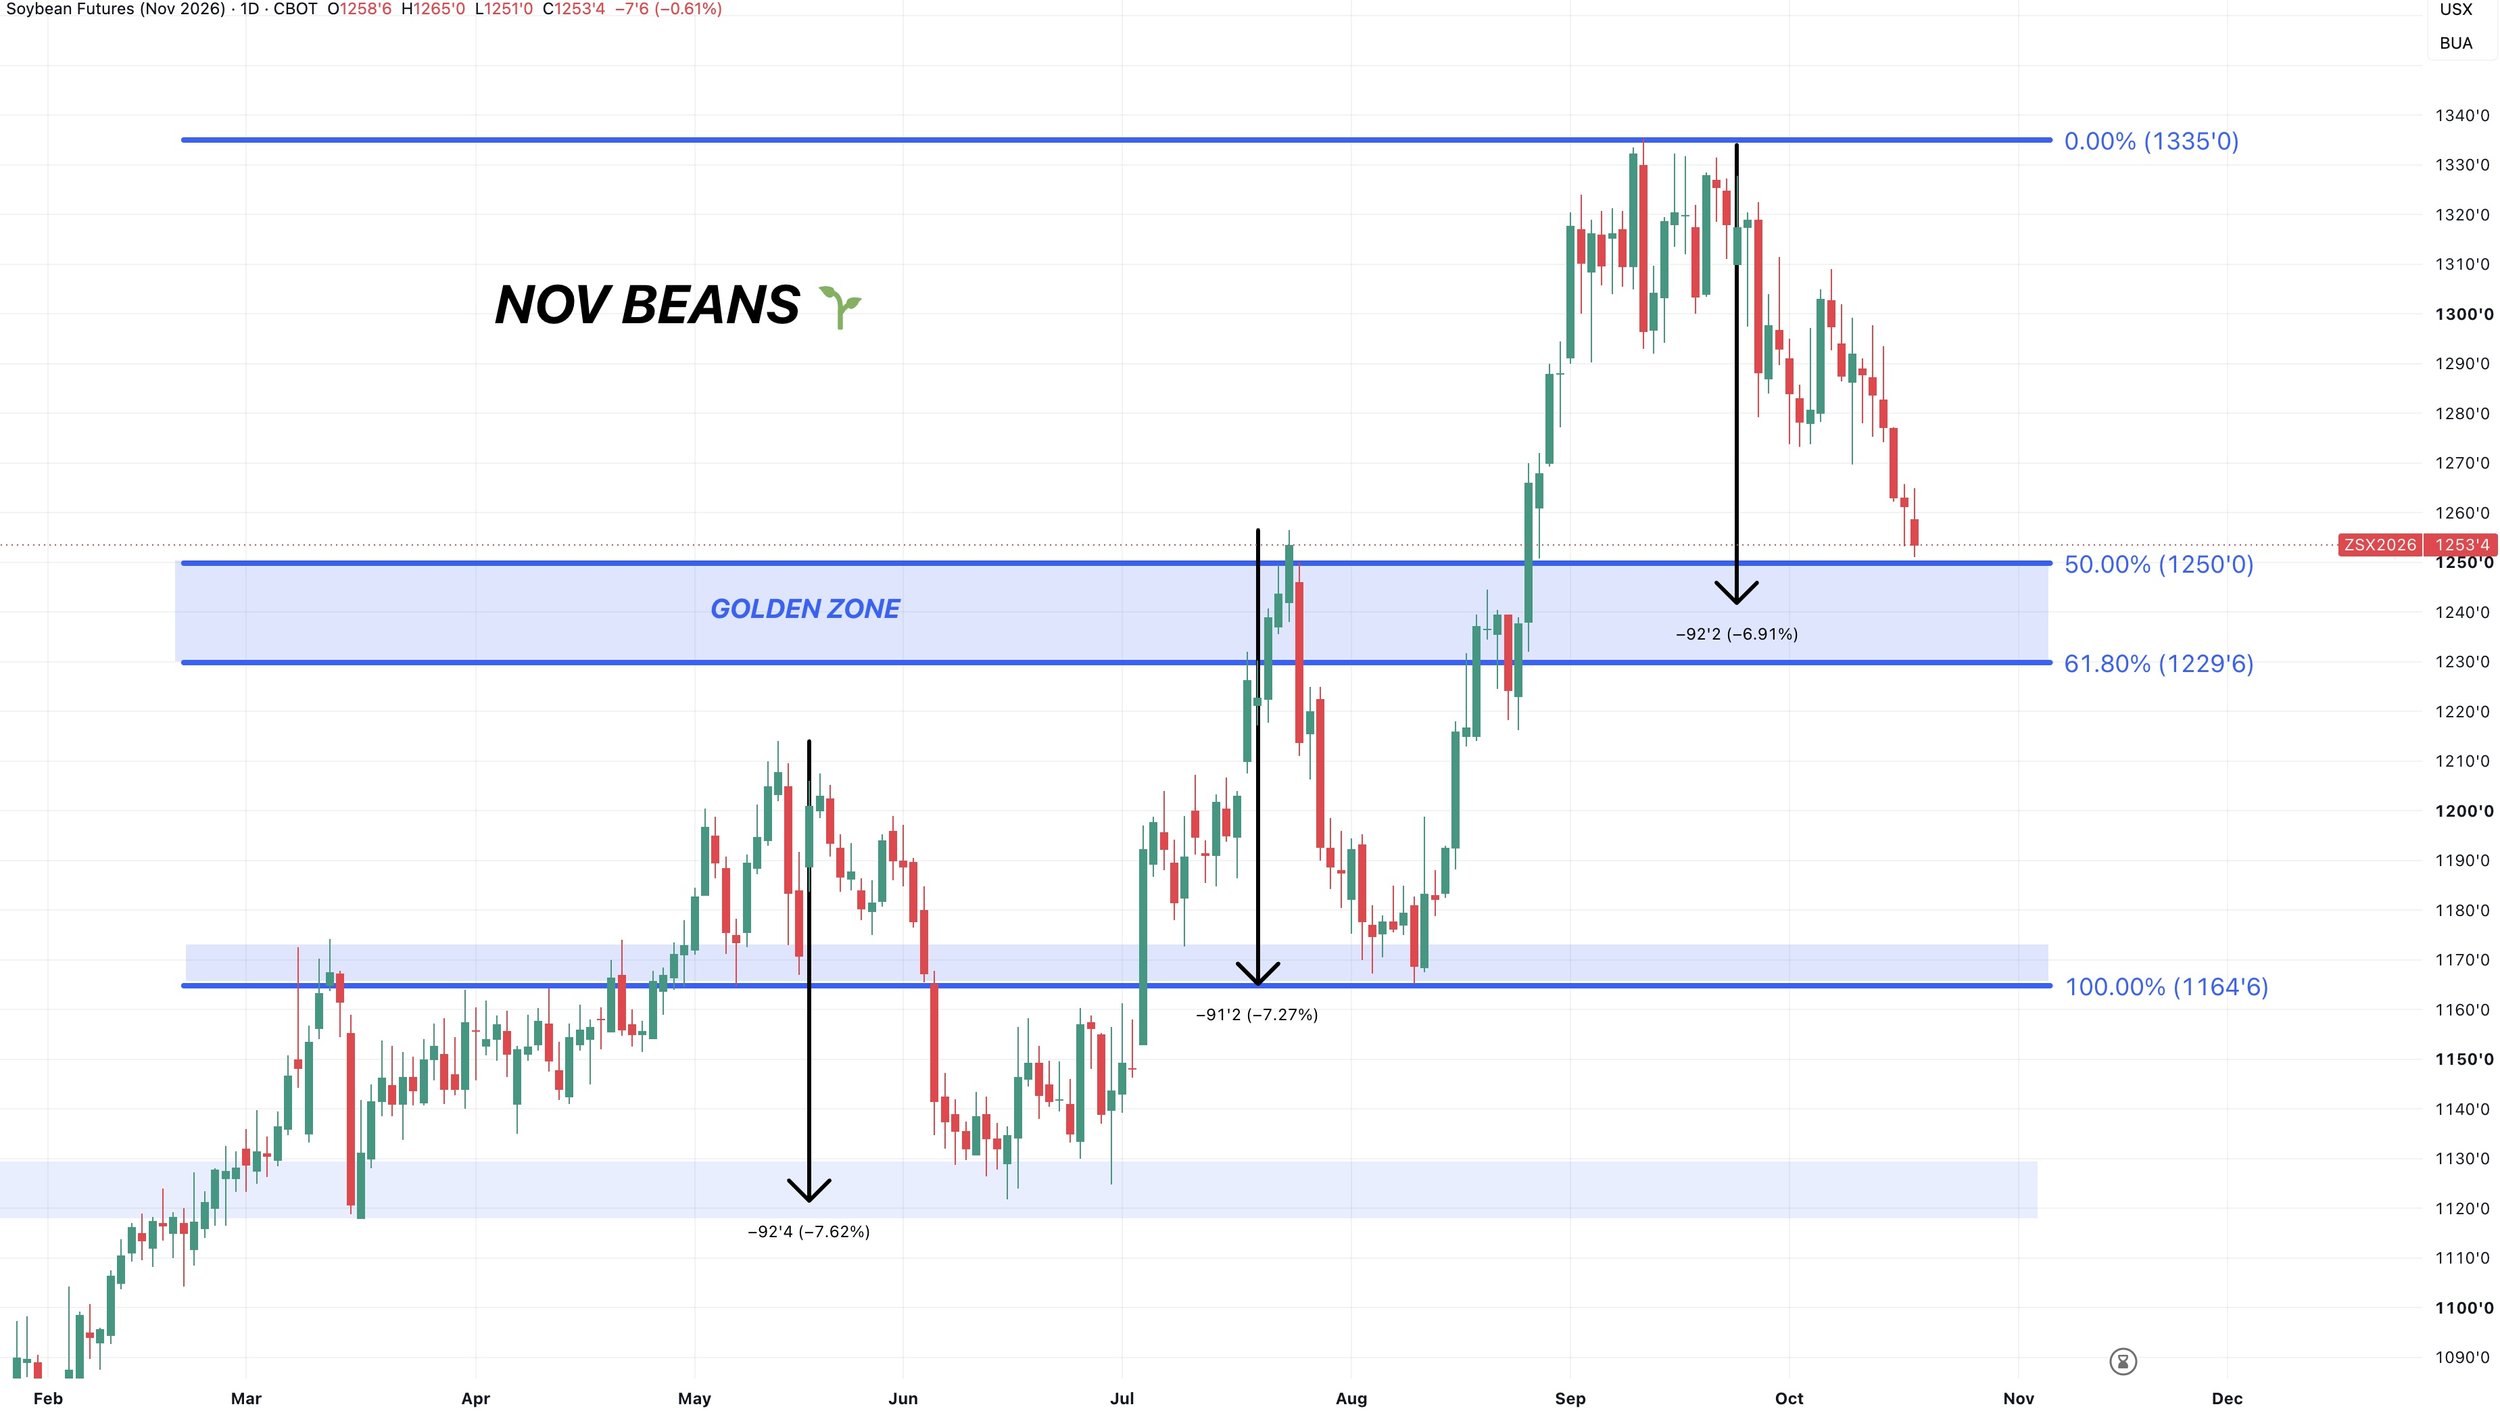
Last week soybeans broke that key support we had been talking about.
As we had been talking about, below that support there was a massive volume gap to the downside. Prices often tend to slice through volume gaps. Which we are now seeing happen.
We entered the volume gap and saw selling accelerate.
So where could the bottom be?
We are approaching the golden zone down to the August lows. The most common spot for a correction to end. As giving back 50-61.8% of that rally puts us between $12.30 to $12.50
If you notice, that $12.30 to $12.40 range is also where the volume picks back up after slicing through this volume gap.
This area also re-tests the highs from July. The soybean market has a high tendency to turn old ceilings into floors.
The August lows came at the March highs.
The March and June lows came in at the November highs from last year.
So this box is your support and where you'd expect us to carve out some lows.
However that 61.8% level at $12.30 is the absolute must hold spot. If you break below that level there is another volume gap to the downside. But for now, this is the area we'd look to get defended.
For now, my personal bias is that we get one last little leg lower towards $12.30 to $12.40 before carving out some lows.
3-Day Chart:
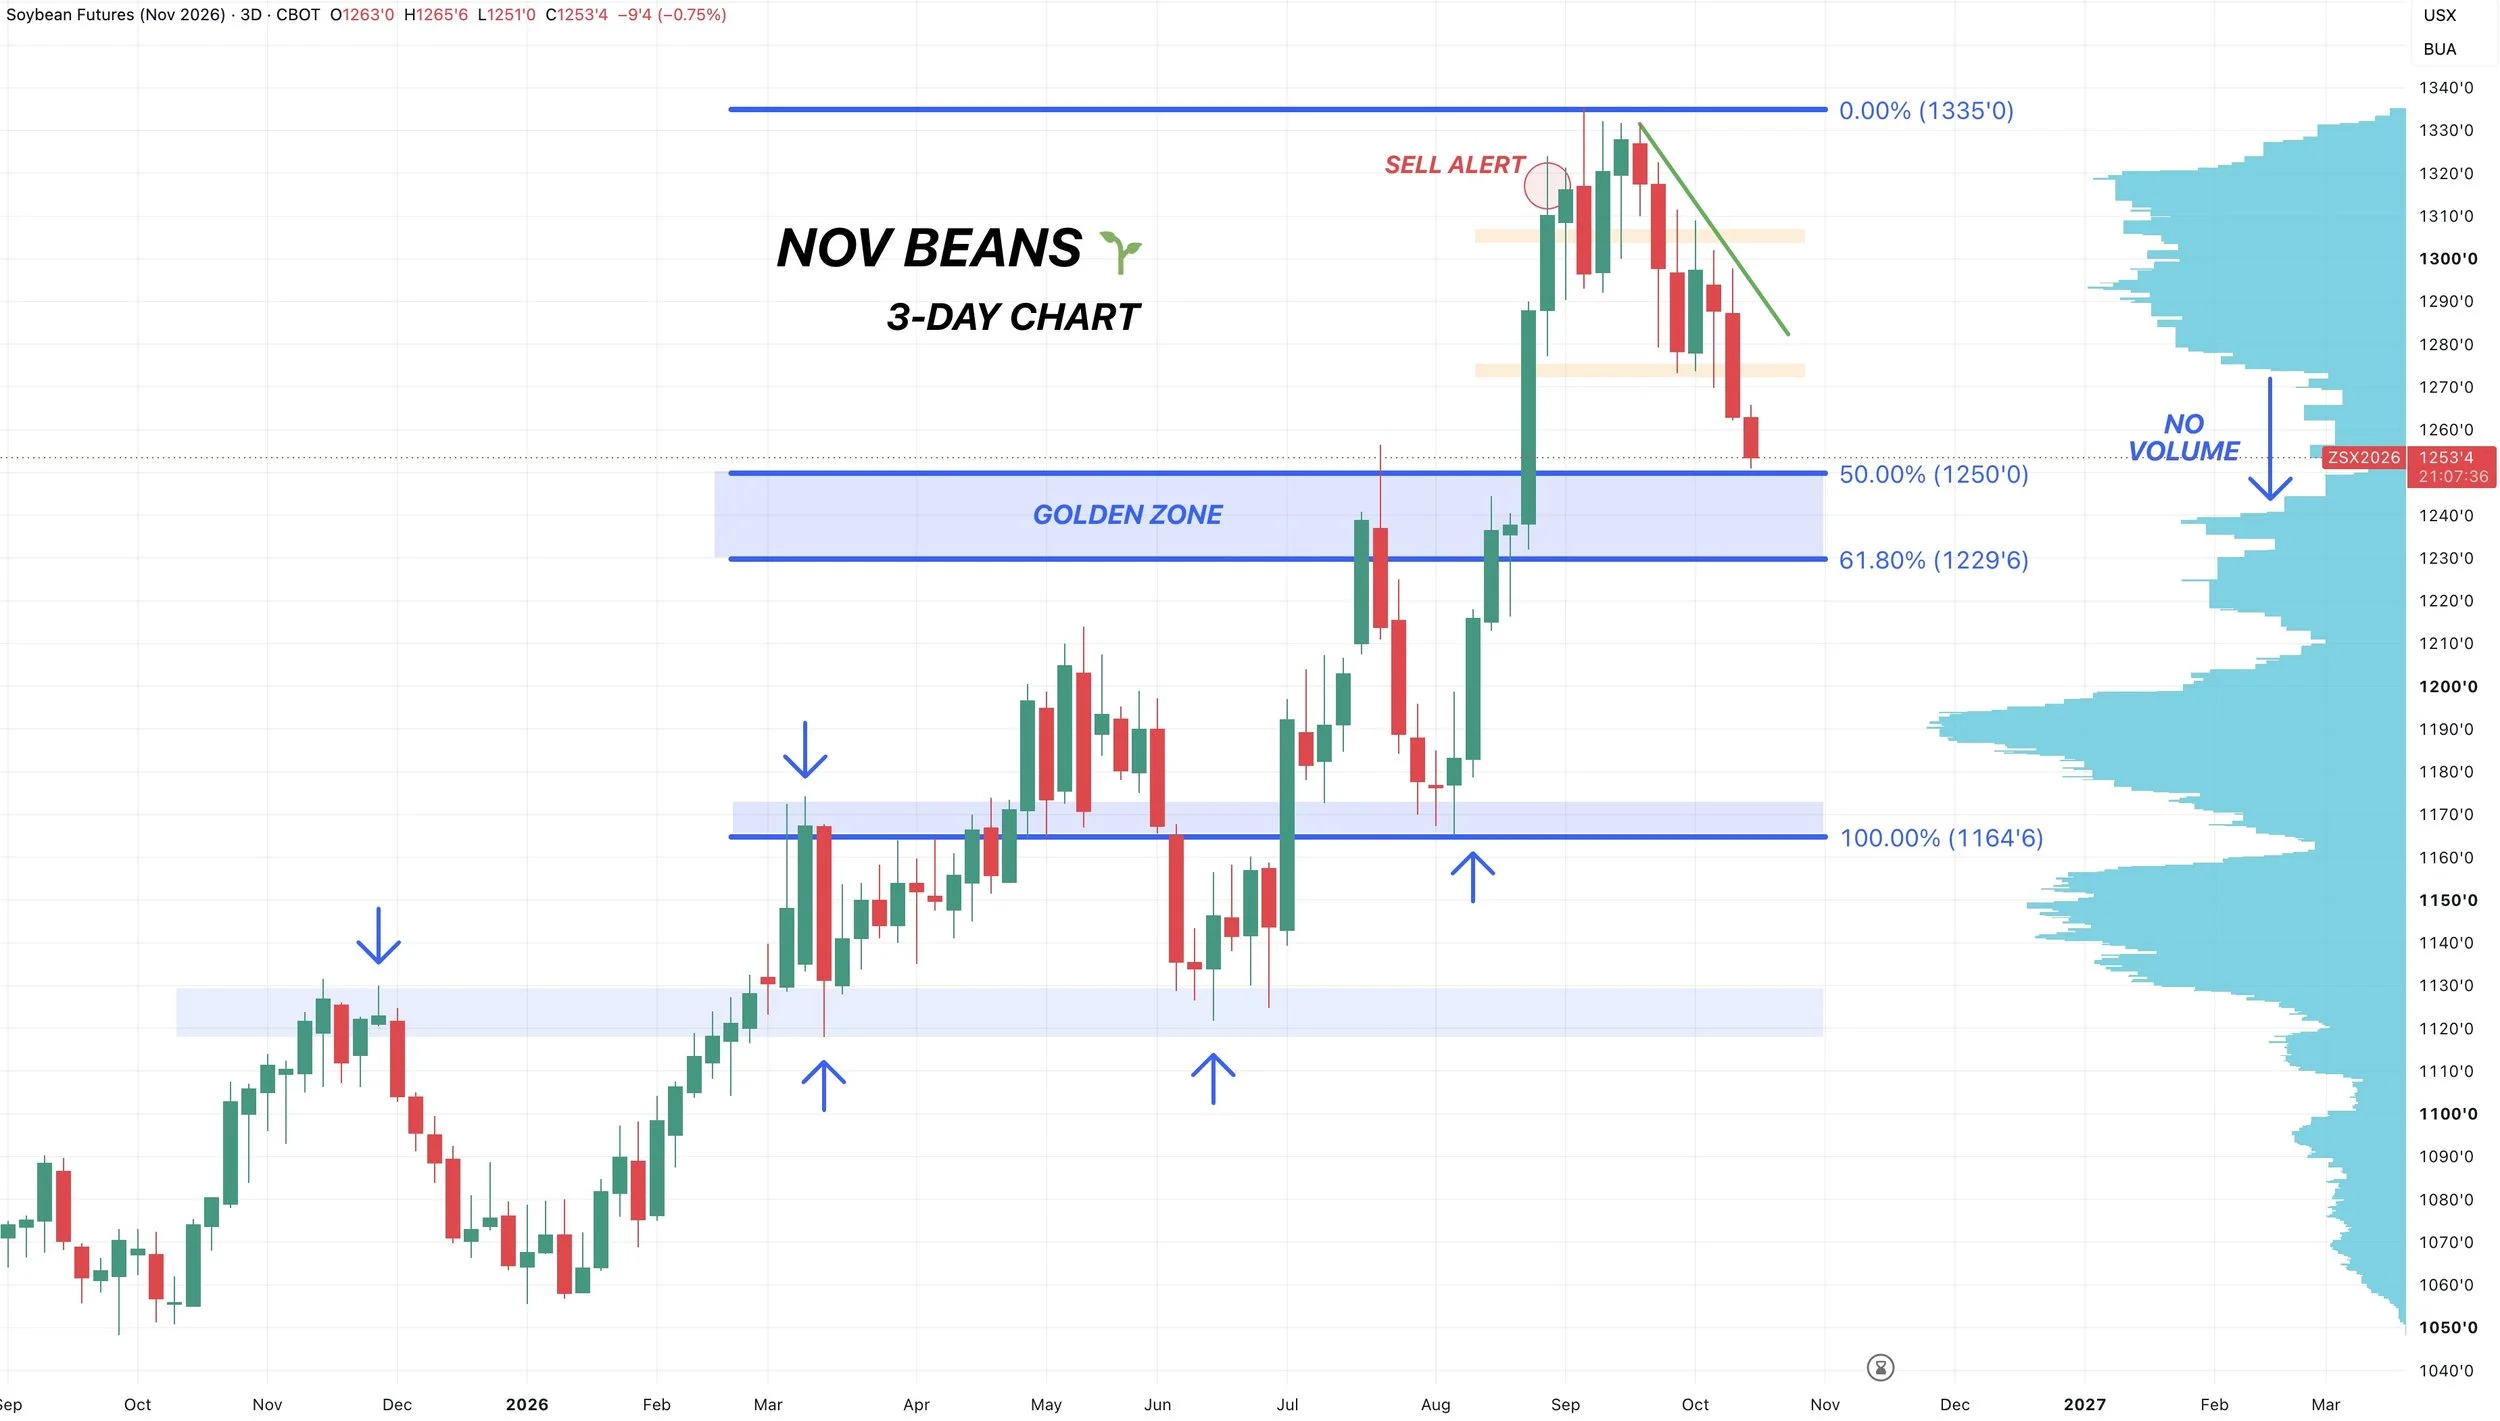
Here is the 3-day chart for another visual.
Again, this just helps clean up some of the noise.
You can clearly see the shelf of volume sitting at that golden zone. Which volume gaps above and below.
This also gives a nice visual as to how this could be a clean re-test of the prior highs. Just like we've seen several times before in soybeans.
Past Corrections:
Now let's look at the last two corrections.
The June sell off was -92 cents.
The August sell off was also -92 cents.
If this market once again dropped -90 to -95 cents it would put us right in the middle of that support box as well.
Weekly Chart:
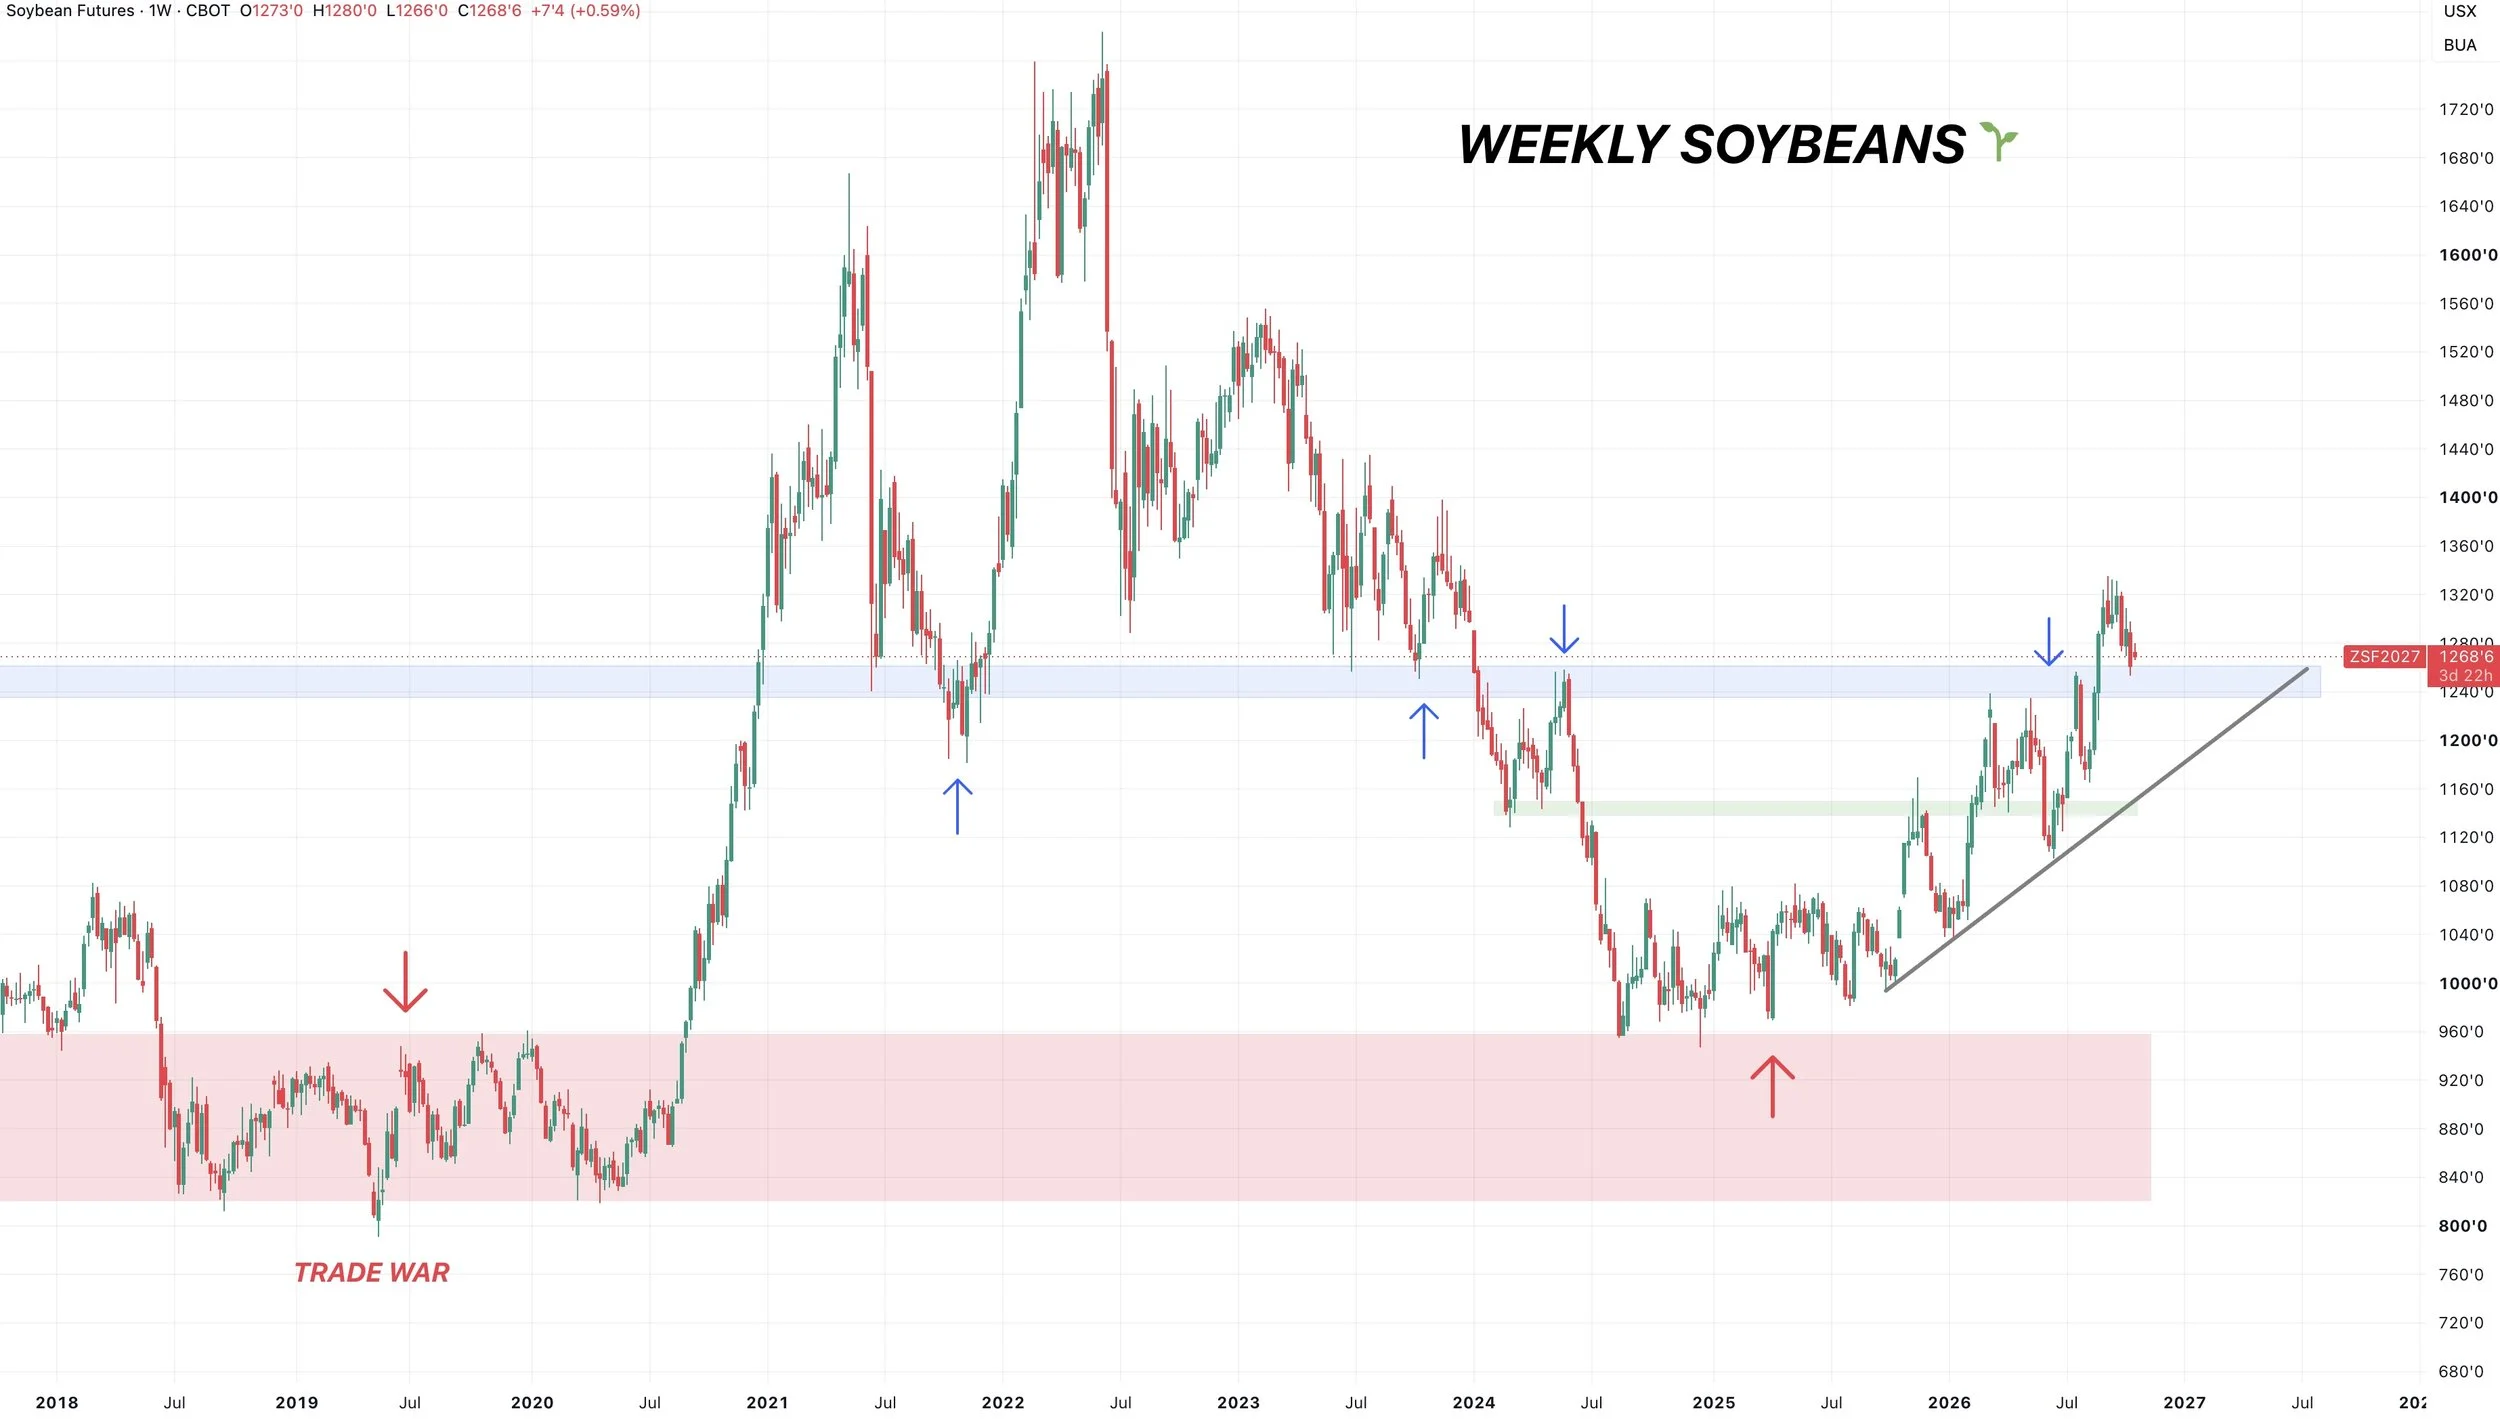
This is one of the most bullish long term charts in the grains.
Currently we are simply re-testing a key support and resistance area.
It was support in 2021.
It was resistance in 2024 and earlier this year.
Now trying to turn it into support once again.
Which is not bearish at all.
Jan Beans:
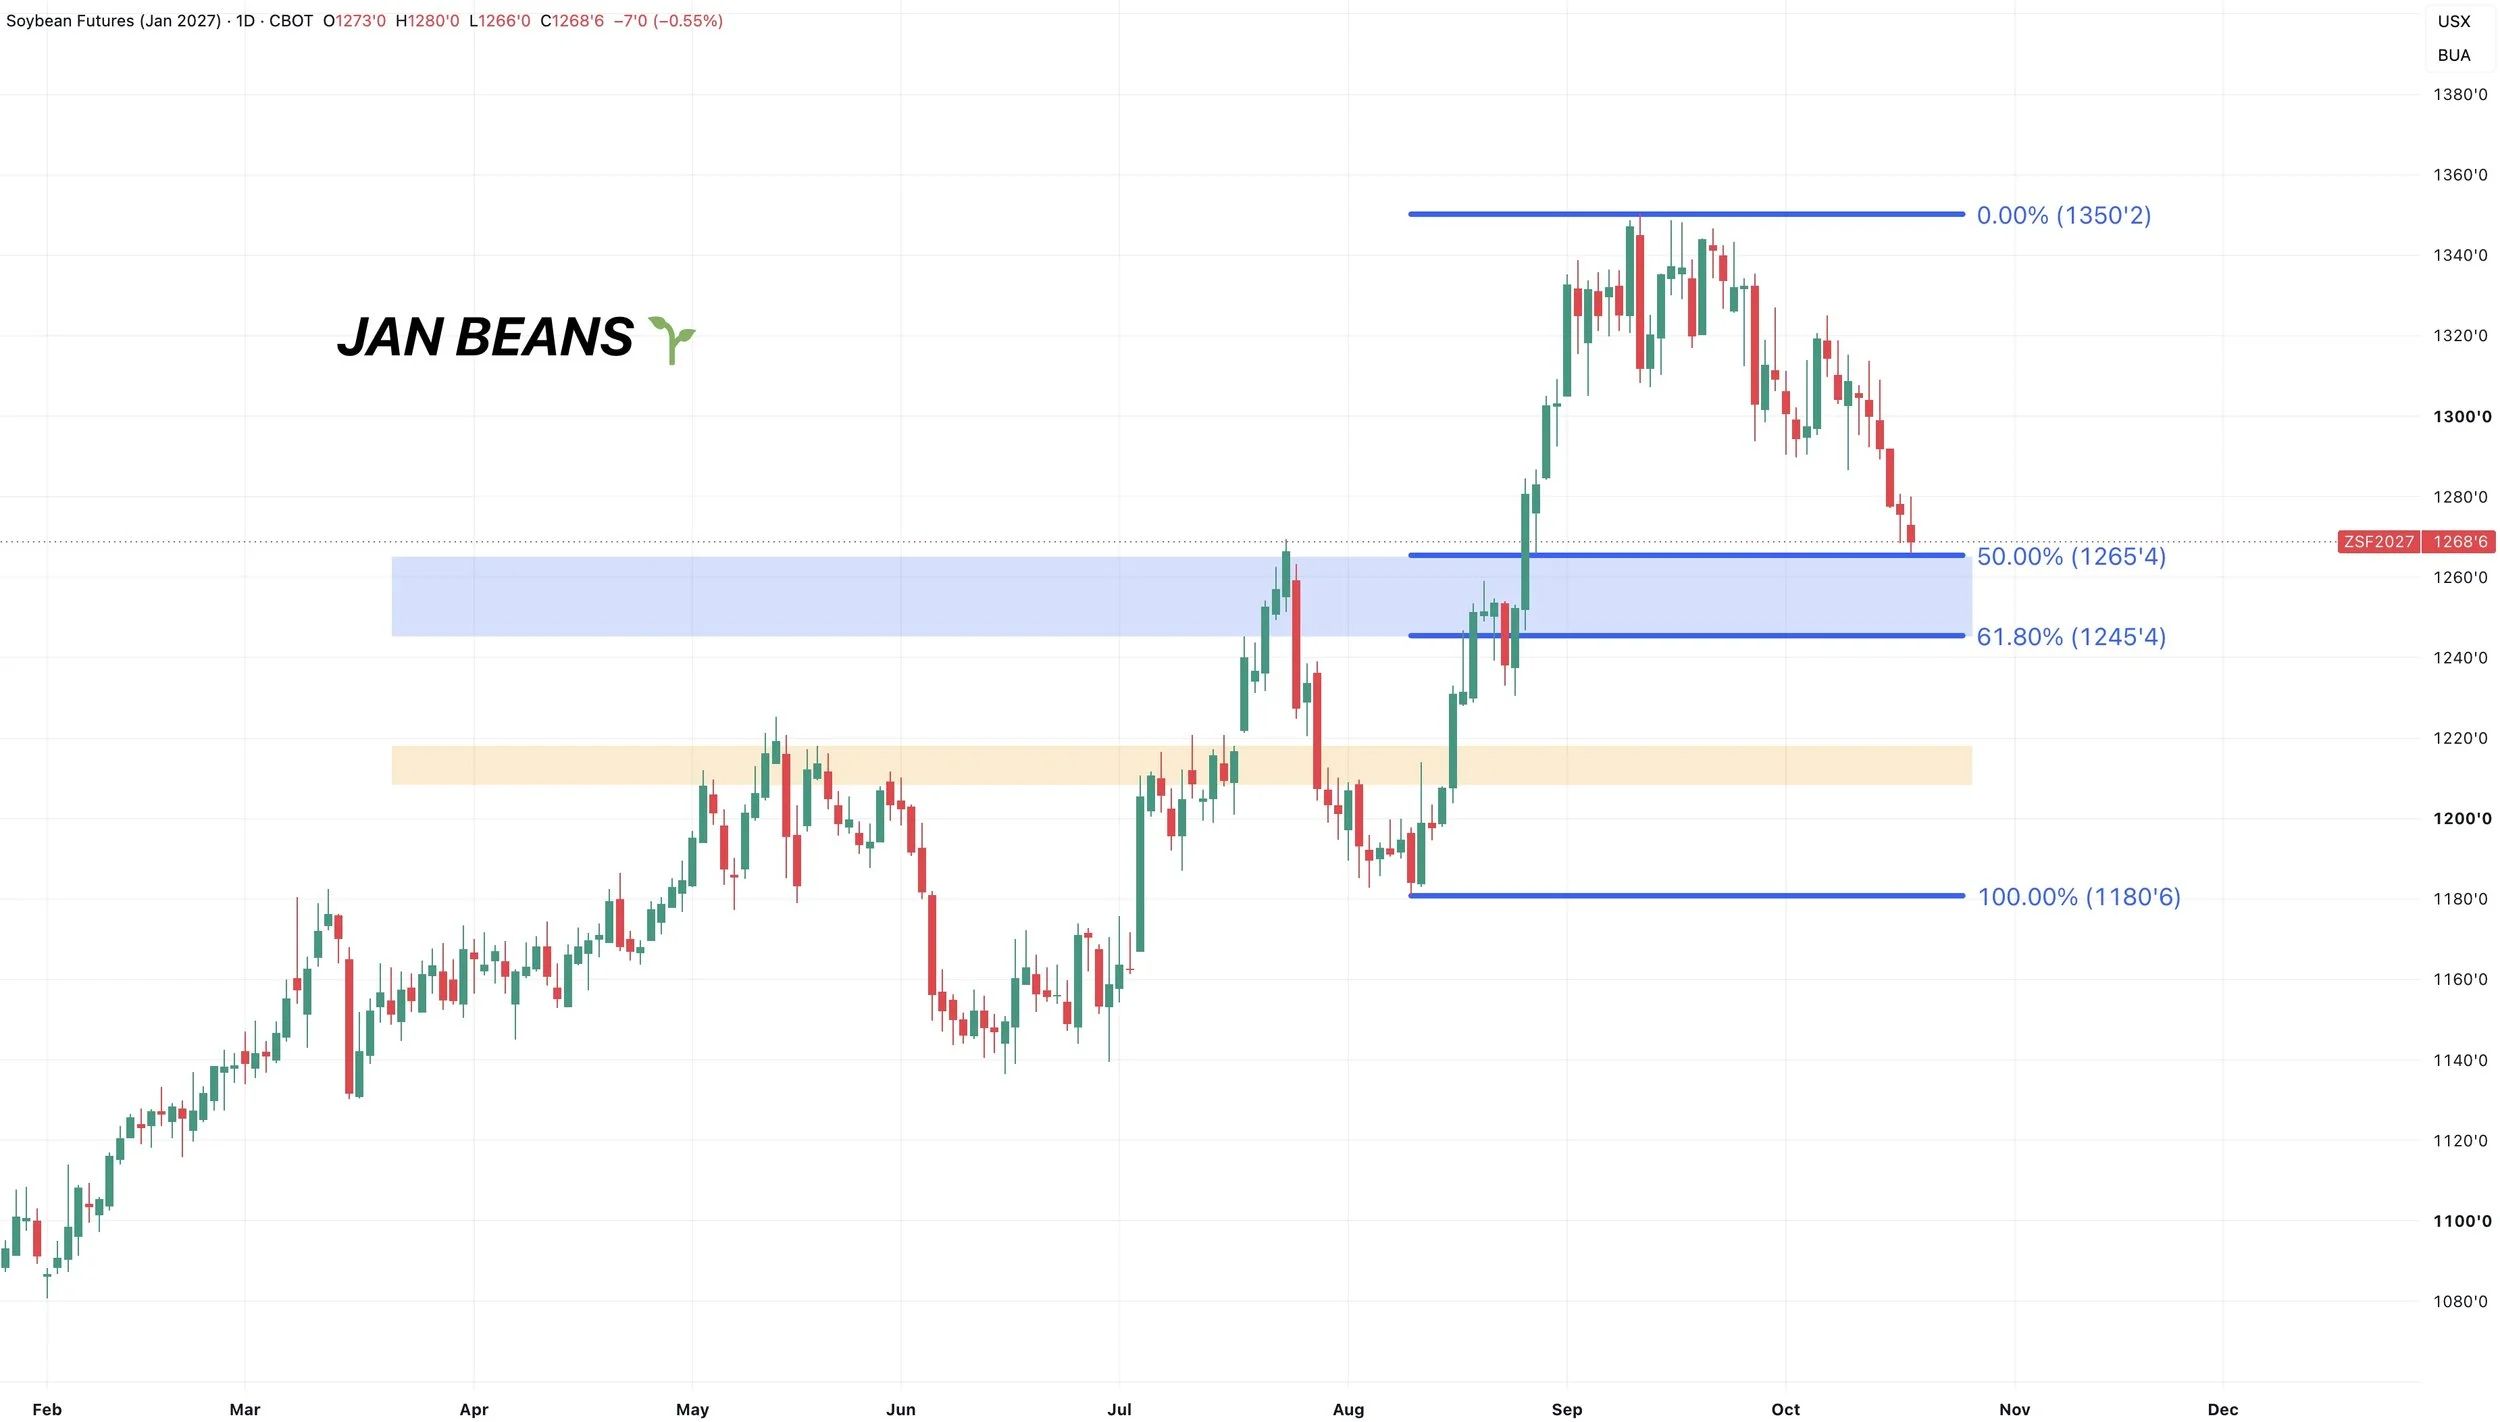
This chart becomes the main one soon.
Same look here.
We are entering into that golden zone down to the August lows.
Which also re-challenges those previous highs.
This would be a point of interest for us to carve out some lows.
I'd like to think we hold this box. But if we do not, we'd likely then take a trip to test the May highs around $12.18. As there is some air below the first box.
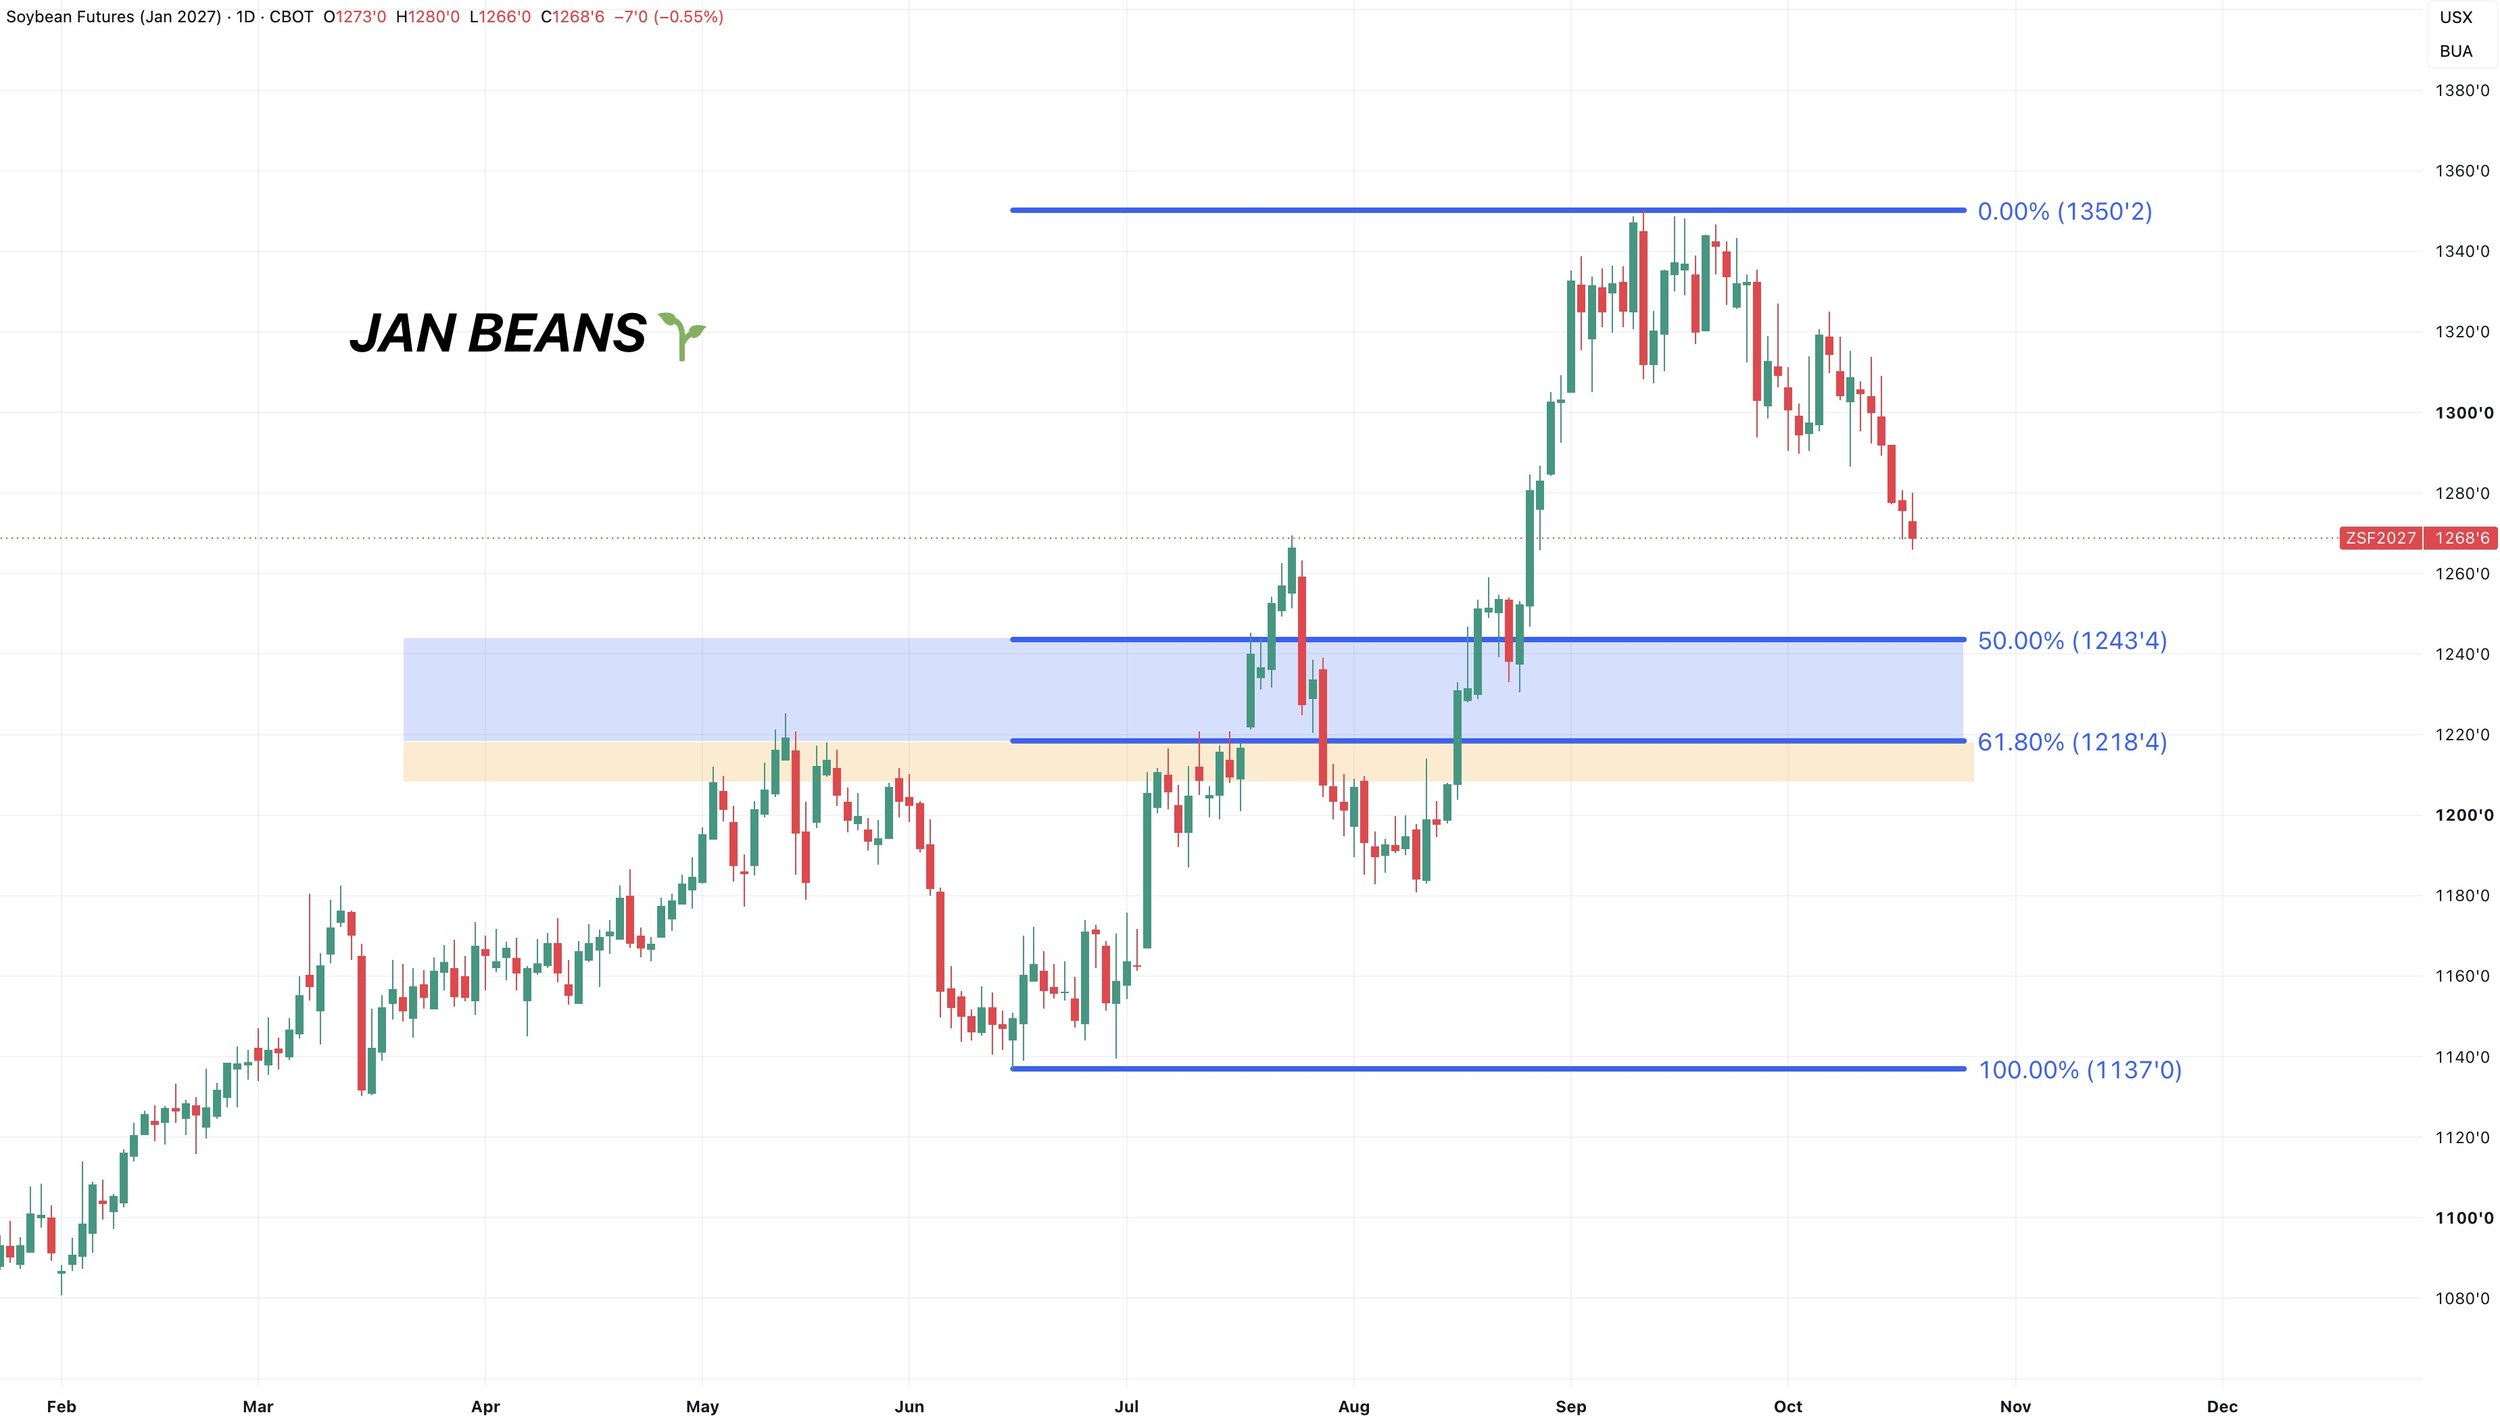
And because here is the golden zone down to the June lows rather than the August lows.
50% of the June lows is the same level as 61.8% of the August lows. ($12.45)
The 61.8% level down to the June lows is $12.18 and those highs from May.
But for now, I lean towards the first level holding.
Wheat
Dec KC Chart:
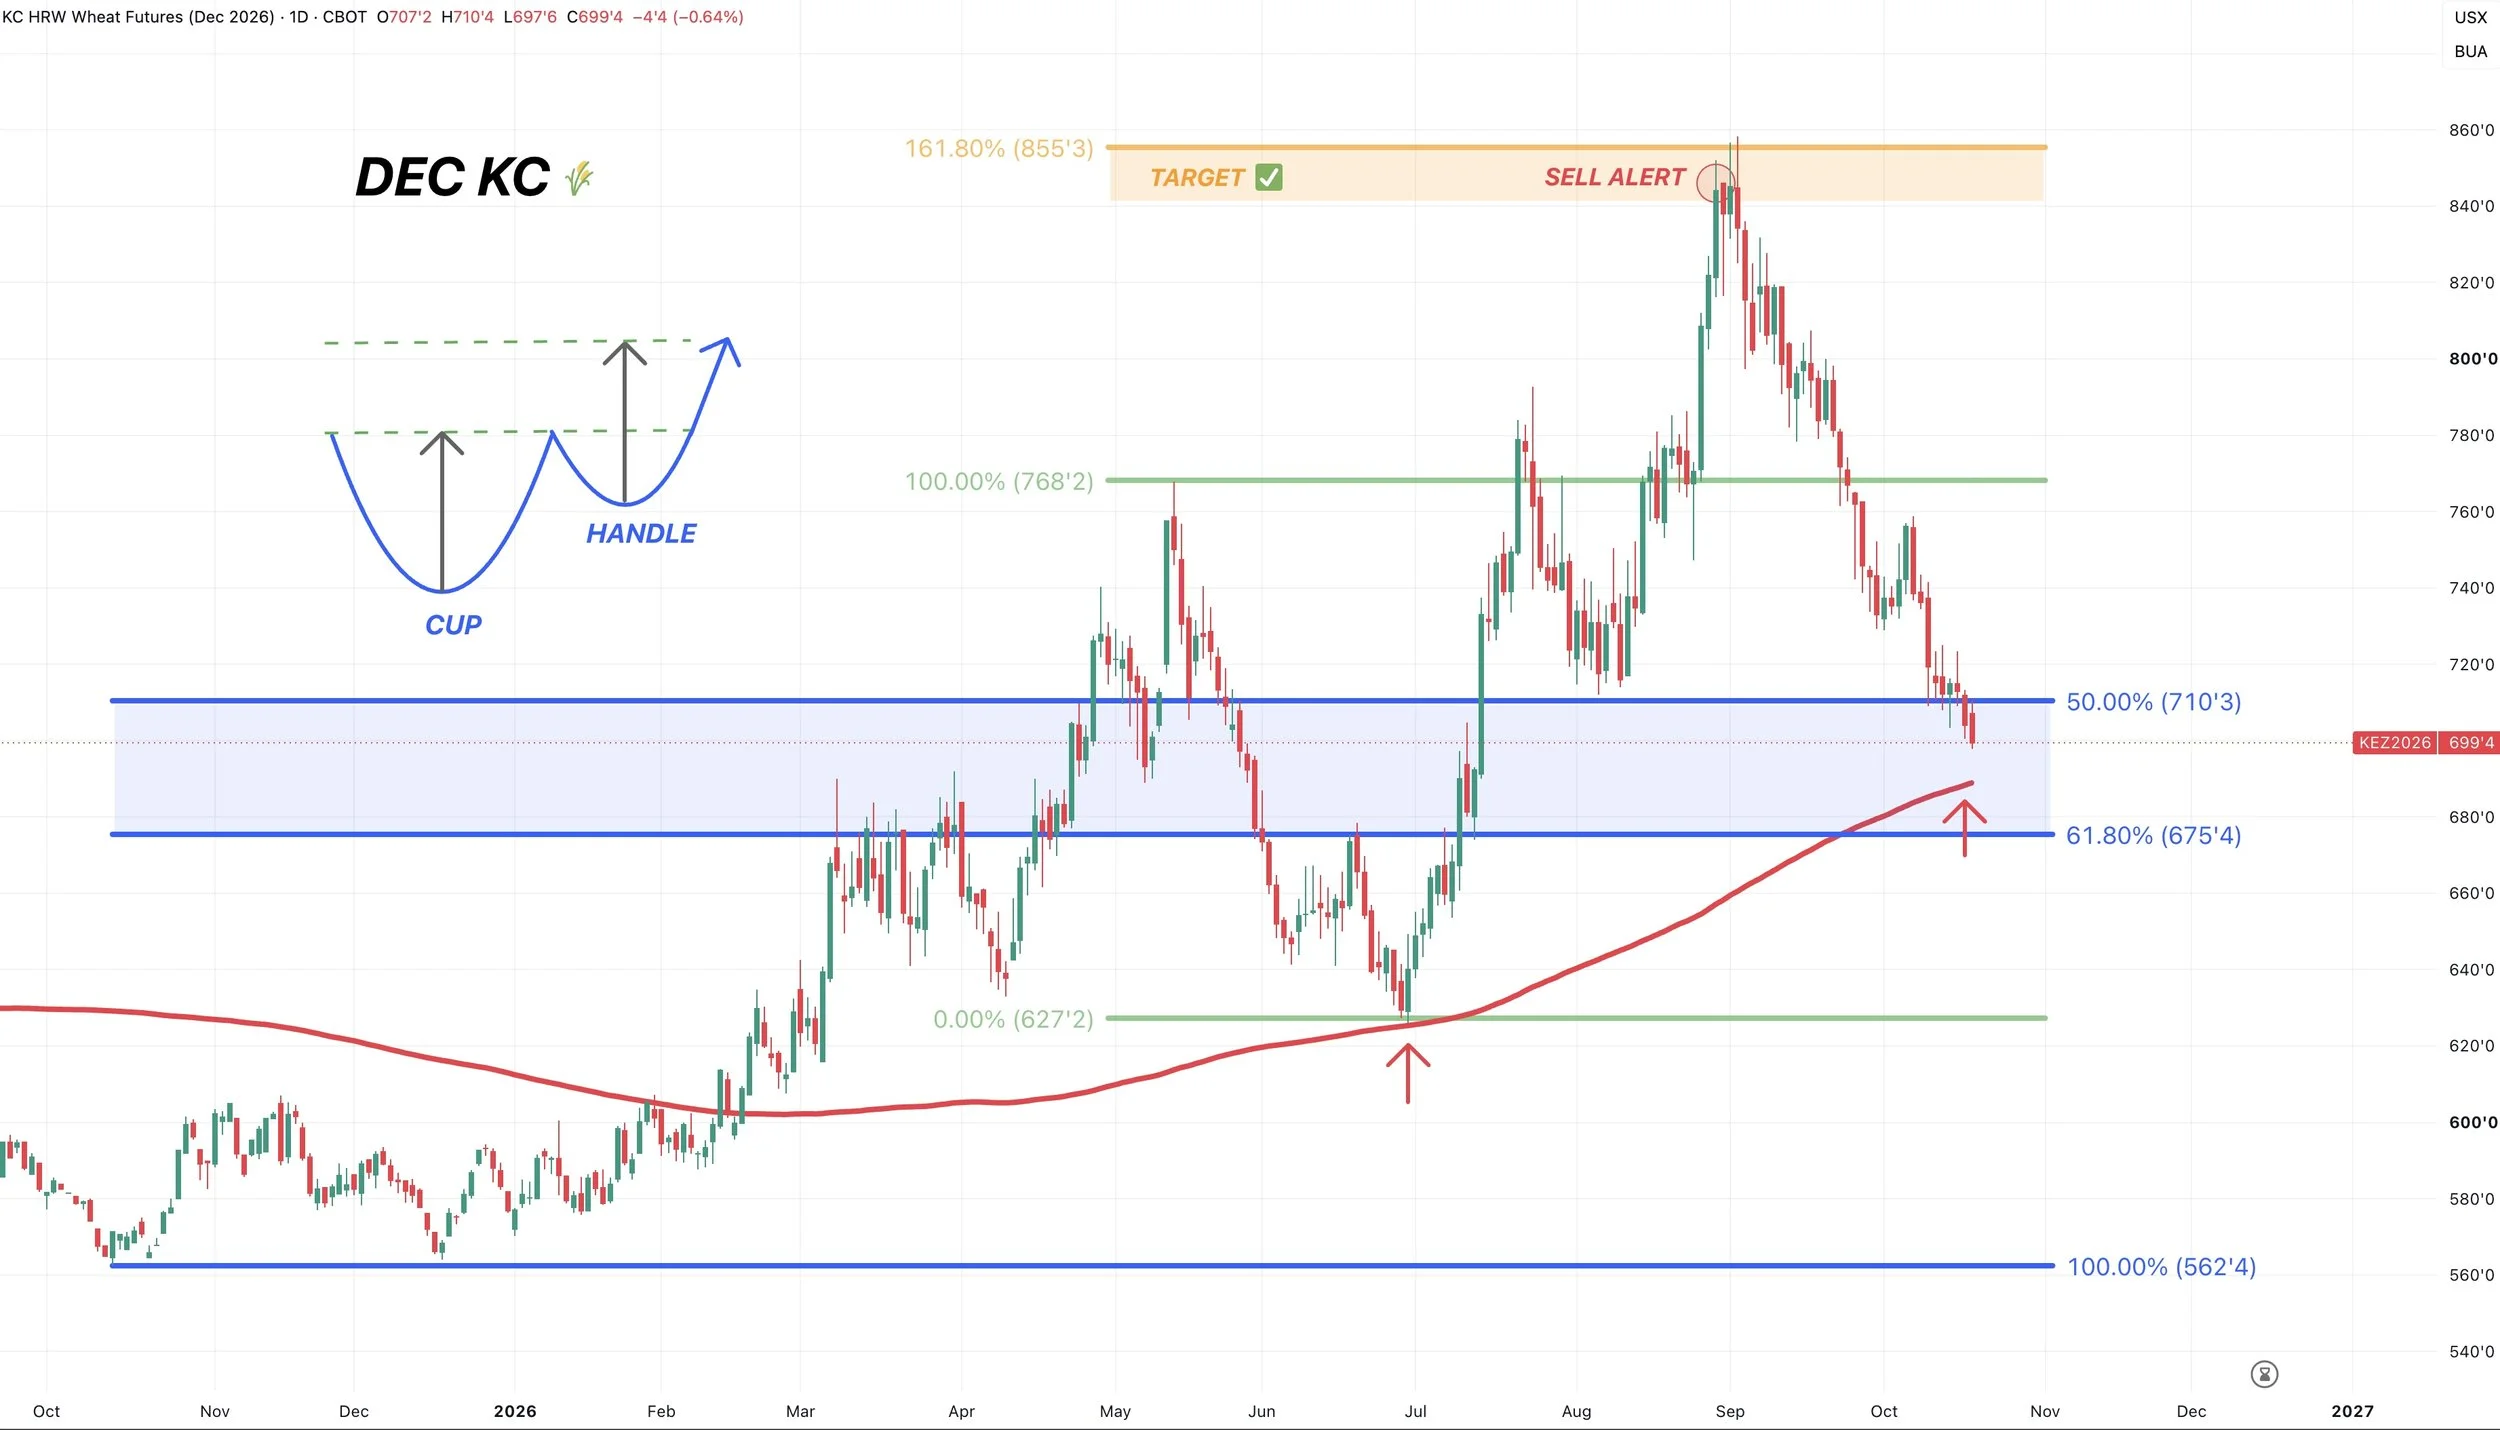
Wheat continues to grind lower.
We are sitting in the golden zone from contract highs down to contract lows.
One thing I am watching here is the 200-day MA. Which sits about 10 cents lower.
The 200-day marked the exact low back in June. So I could see us going to bounce off of it once again.
The line in the sand for KC wheat is $6.75. If that level breaks it would not be a good sign at all.
So we'd like to see market bounce around this 200-day and hold that 61.8% level. We also have those old highs from March that should add further support.
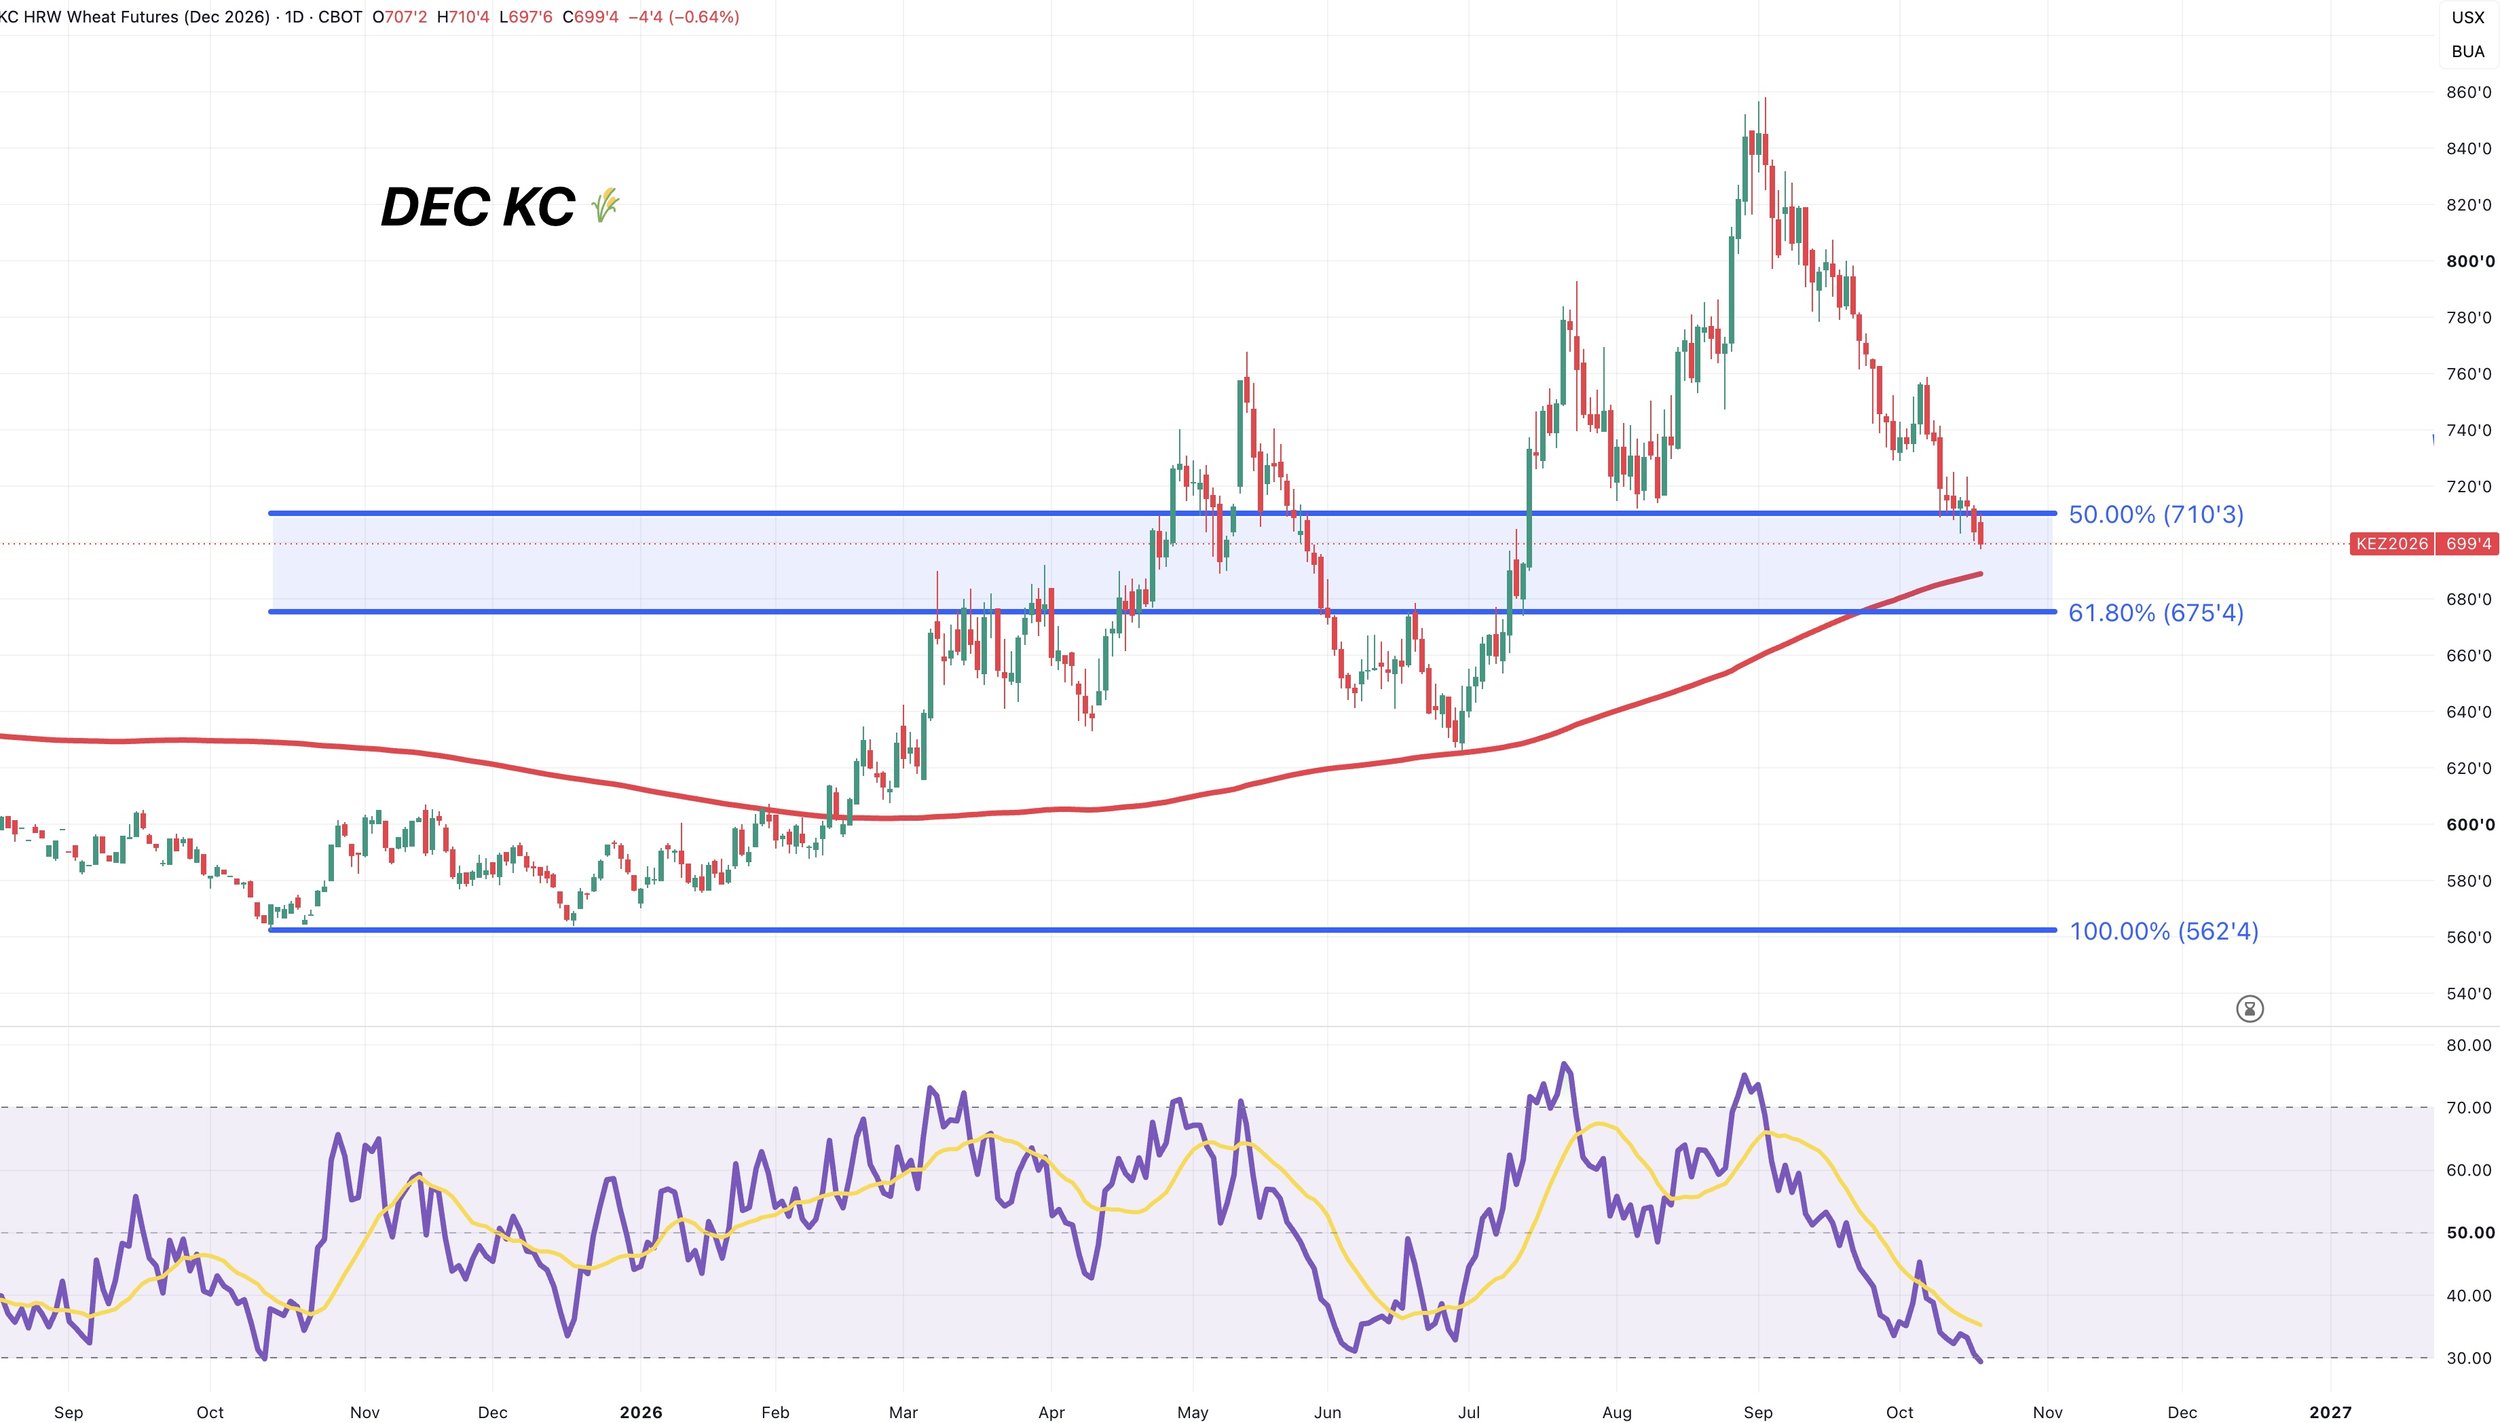
KC wheat is currently the most oversold it has ever been for this contract.
This does not confirm a bottom, but that is something we are watching here as well as we approach some of these support levels.
As you are getting very oversold heading right into some pretty heavy levels of support.
Dec Chicago Wheat Chart:
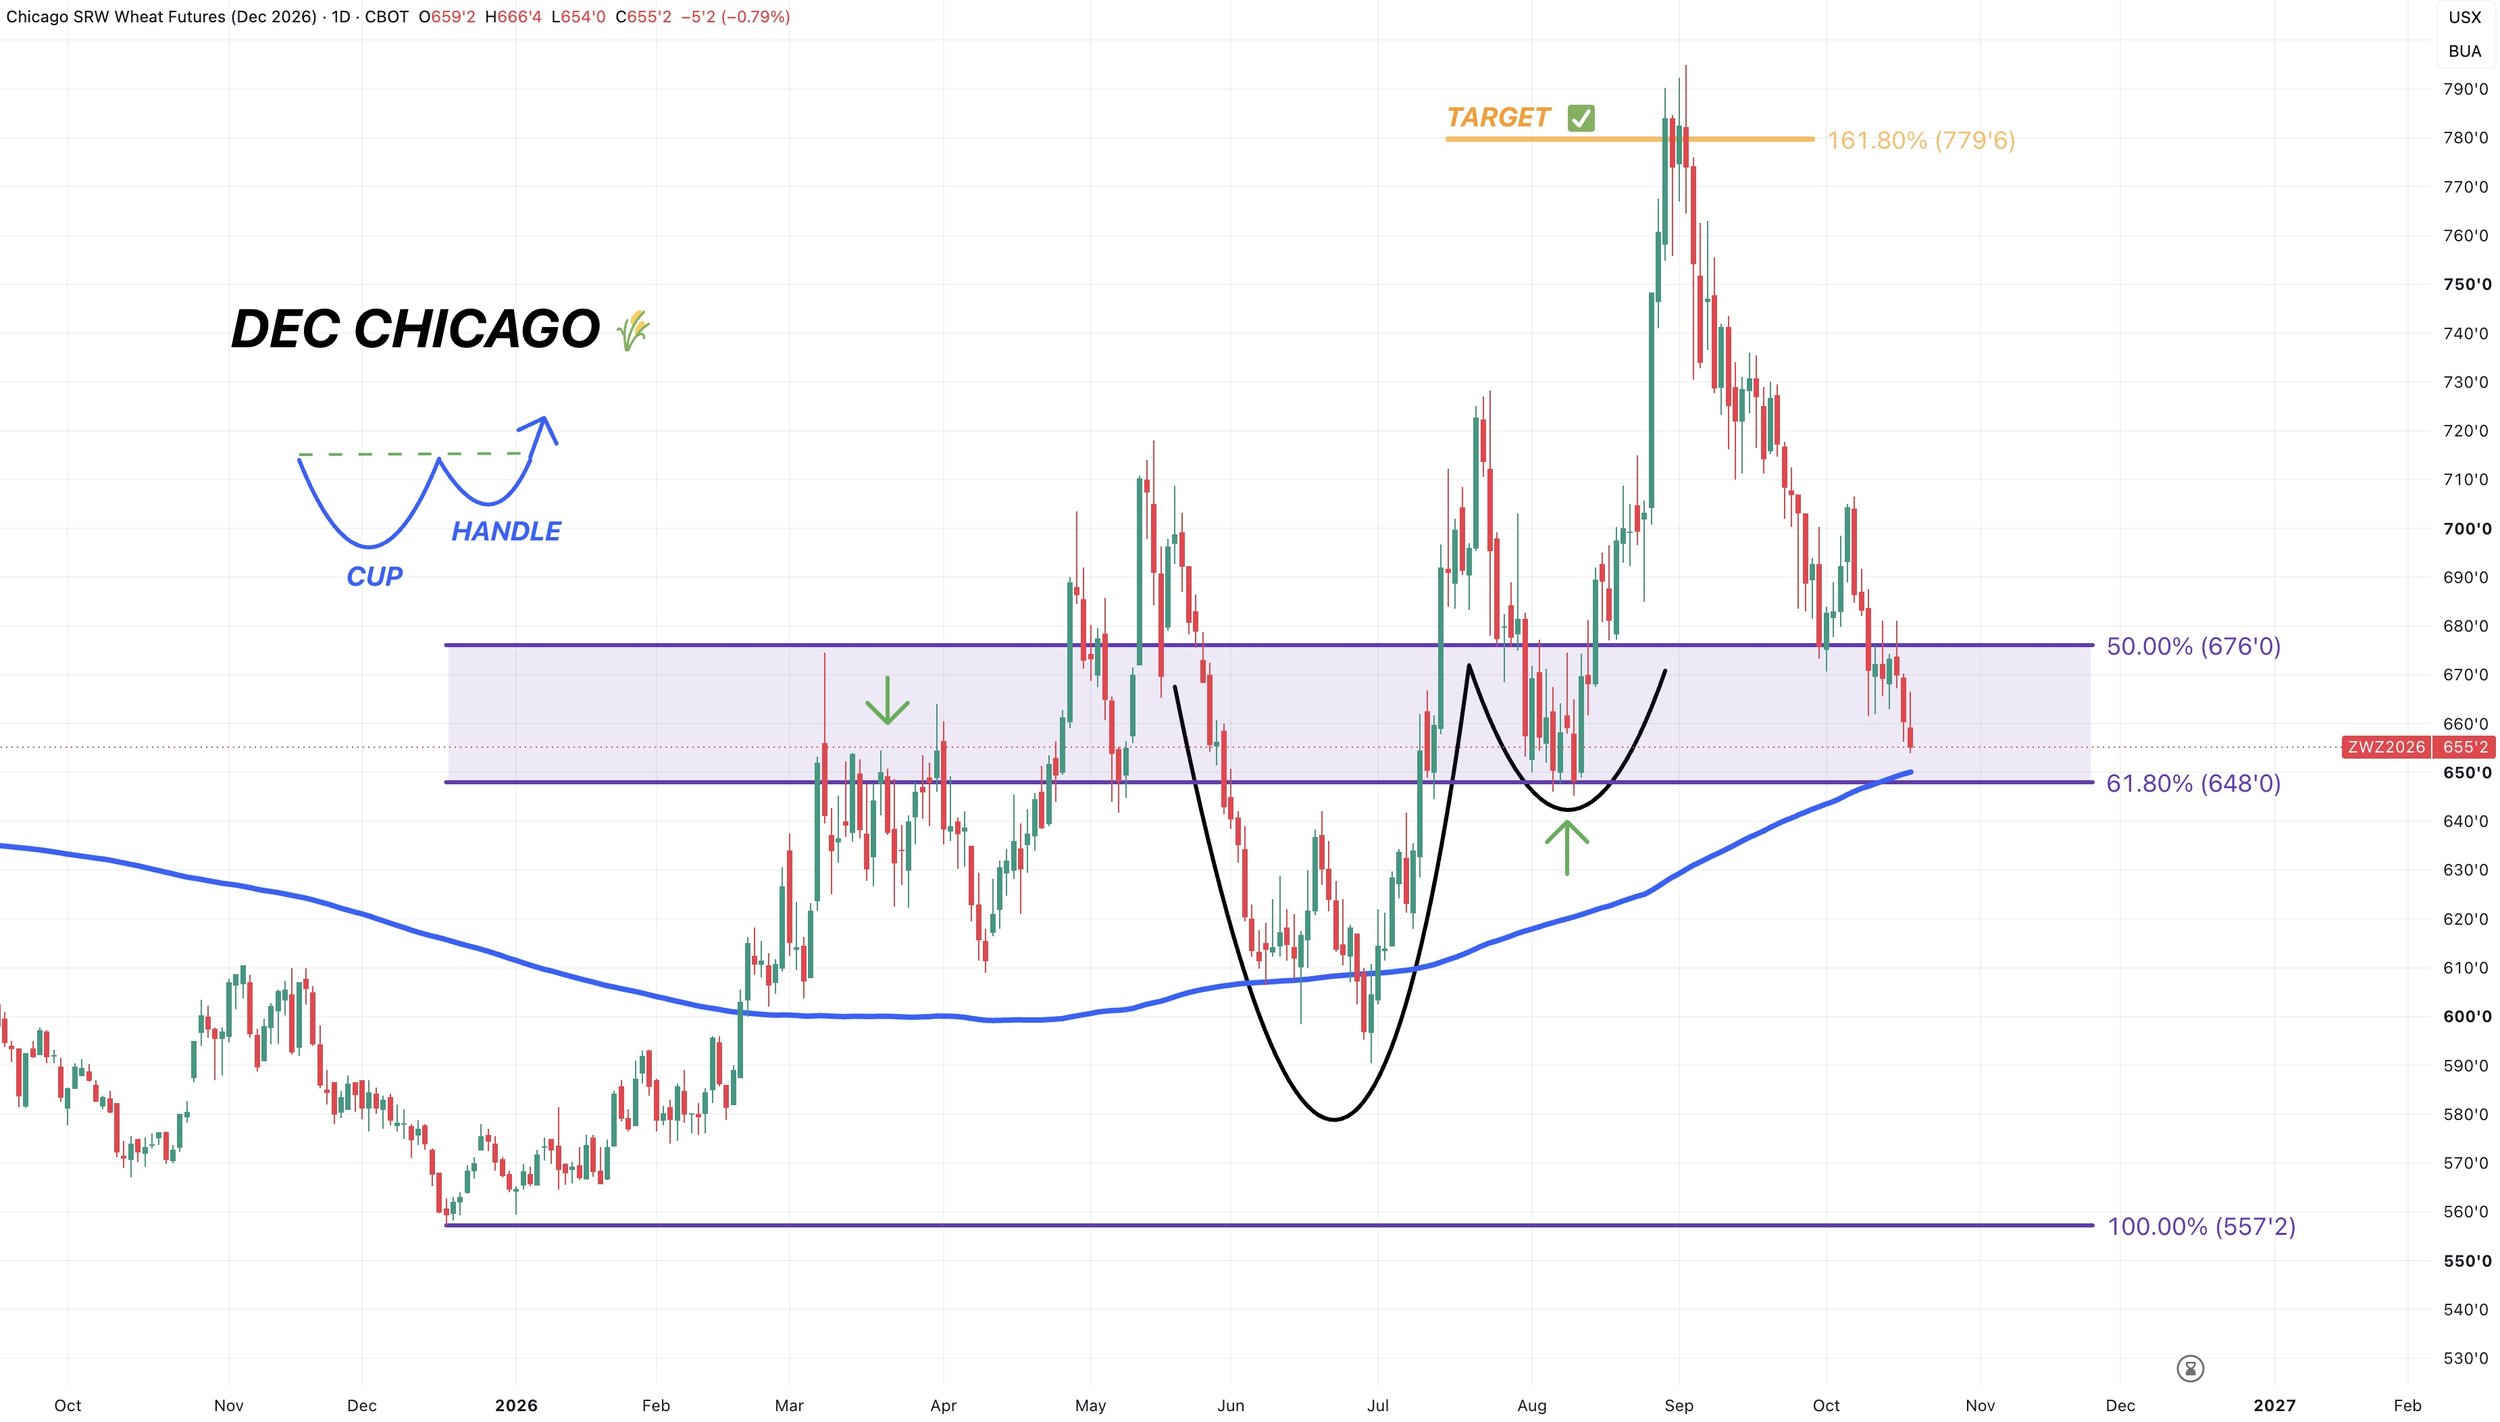
Chicago wheat is quickly approaching a major level.
The 61.8% level from contract highs to contract lows.
This same area has acted as key support and resistance several times now.
It was the March highs. It was the May lows. It was the August lows.
We also have the 200-day MA sitting right here as well.
So if wheat is going to find a some life, we'd like to see it happen down here at this support.
MPLS Wheat Chart:
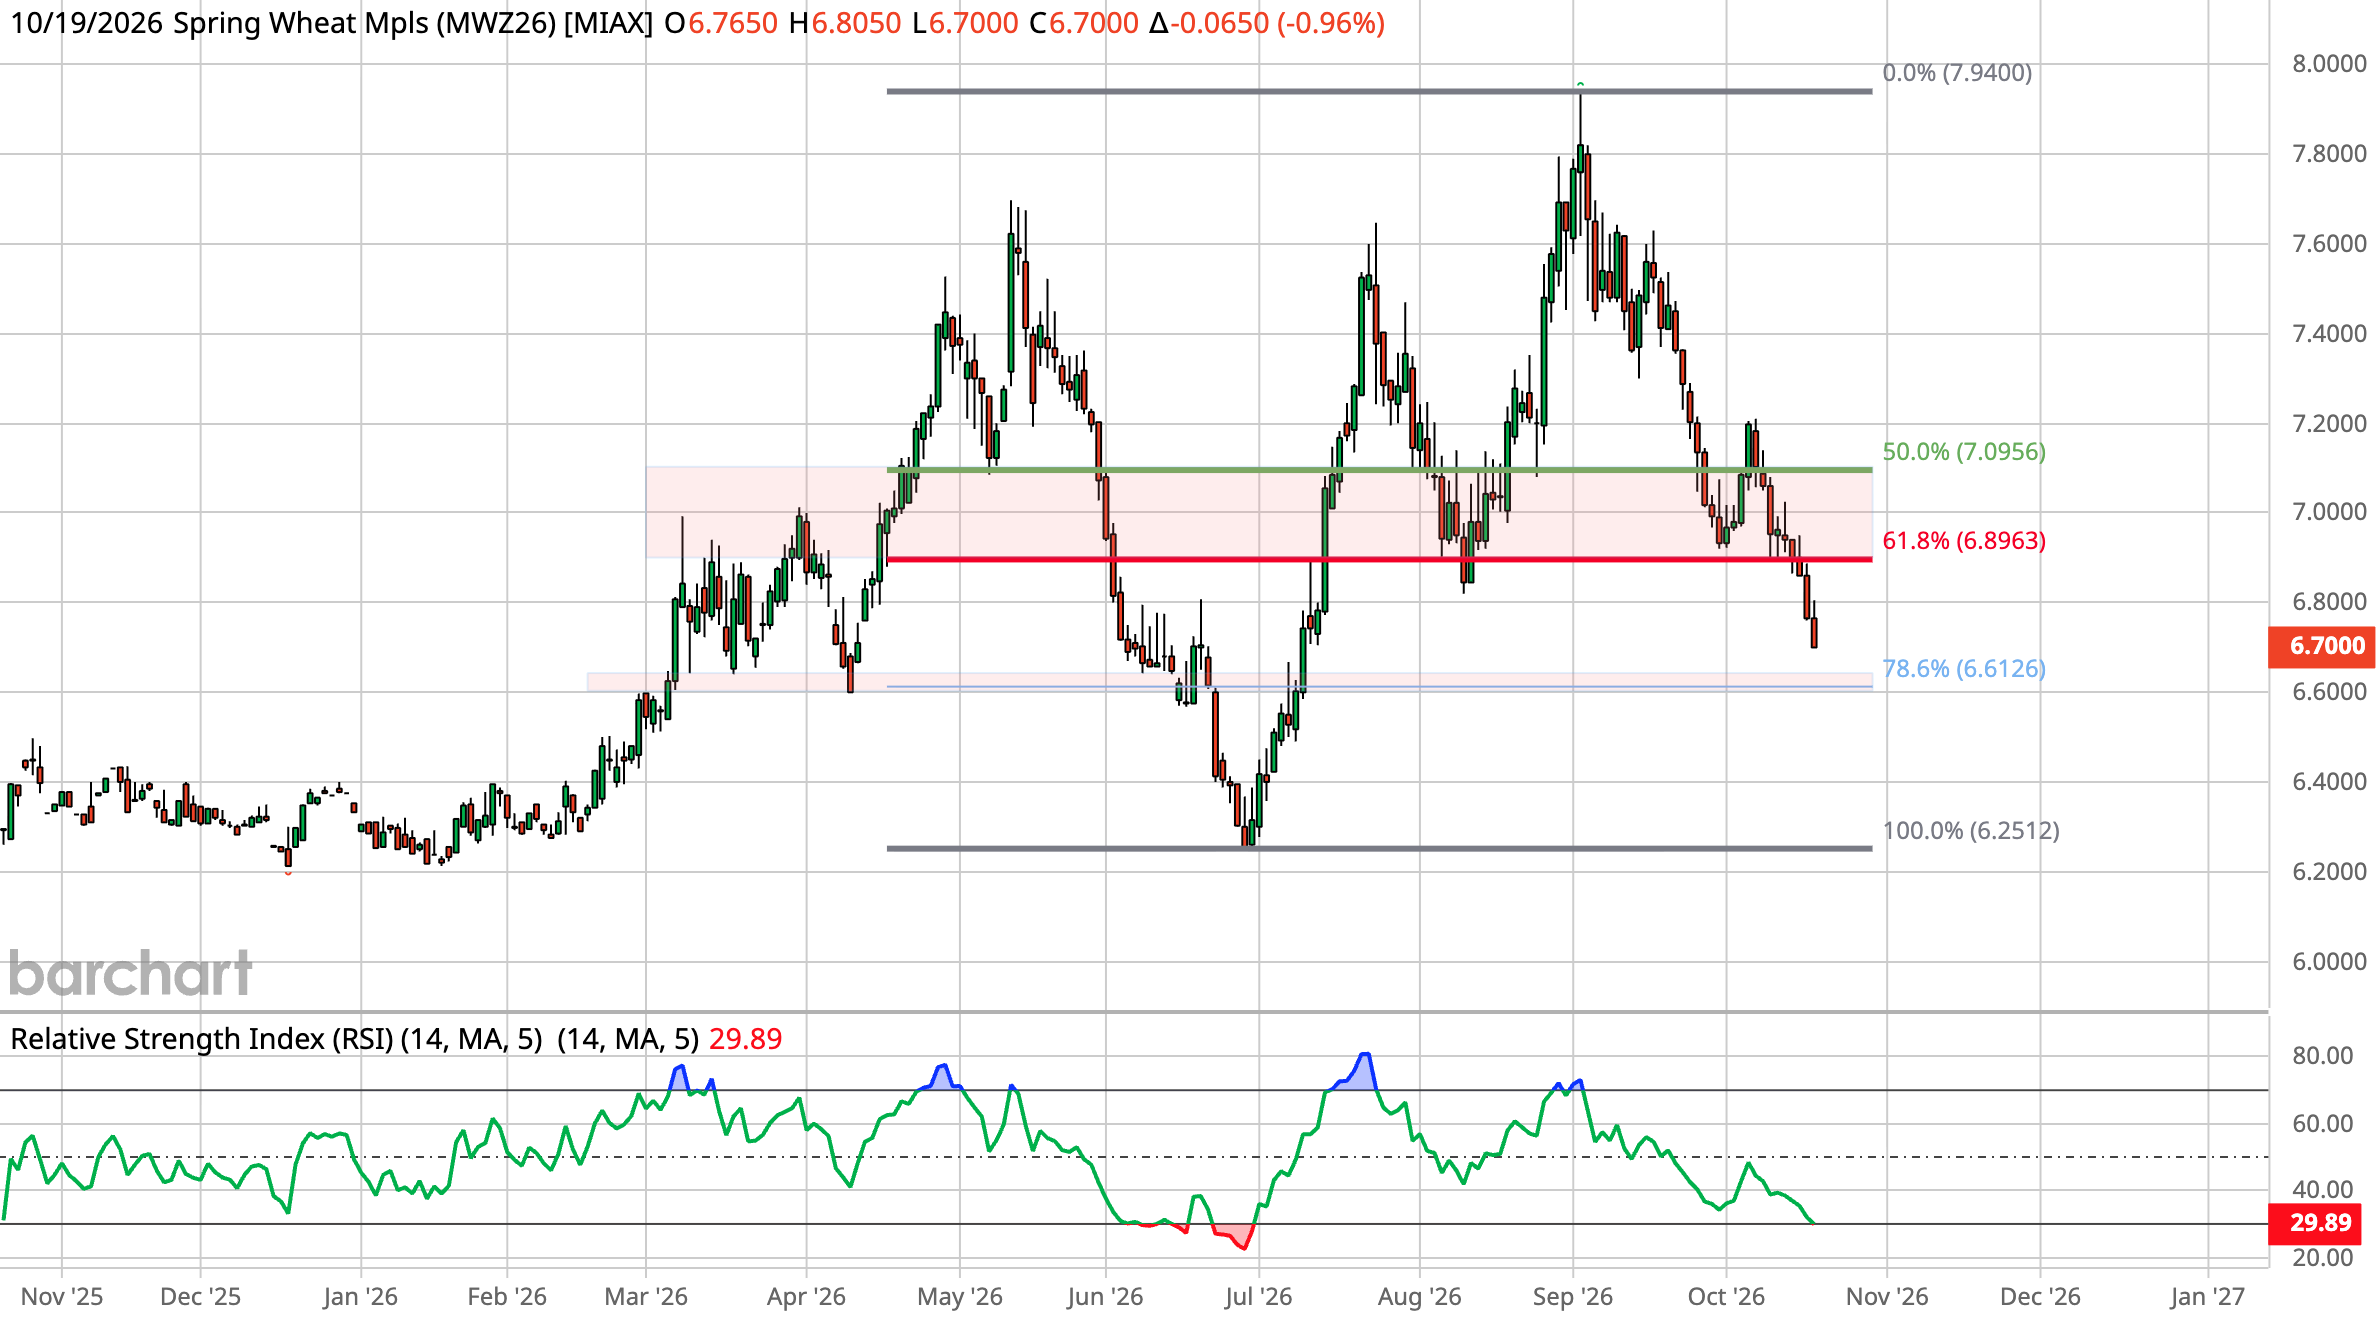
MPLS also approaching another major level after breaking below that key support last week.
We failed to hold the 61.8% level and some other levels of support.
The next point of interest is the 78.6% level, which is about 10 cents lower.
This is virtually the last support on this chart.
If you do not hold this level, it opens the door to the June lows.
So we'd like to see us hold here soon.
Cattle
Nov Feeders Chart:
Friday we sent out a hedge alert for cattle.
I could see us pushing a little higher from here, but overall I feel like this is a great spot to start doing something in your risk management.
If you missed the alert: Click Here
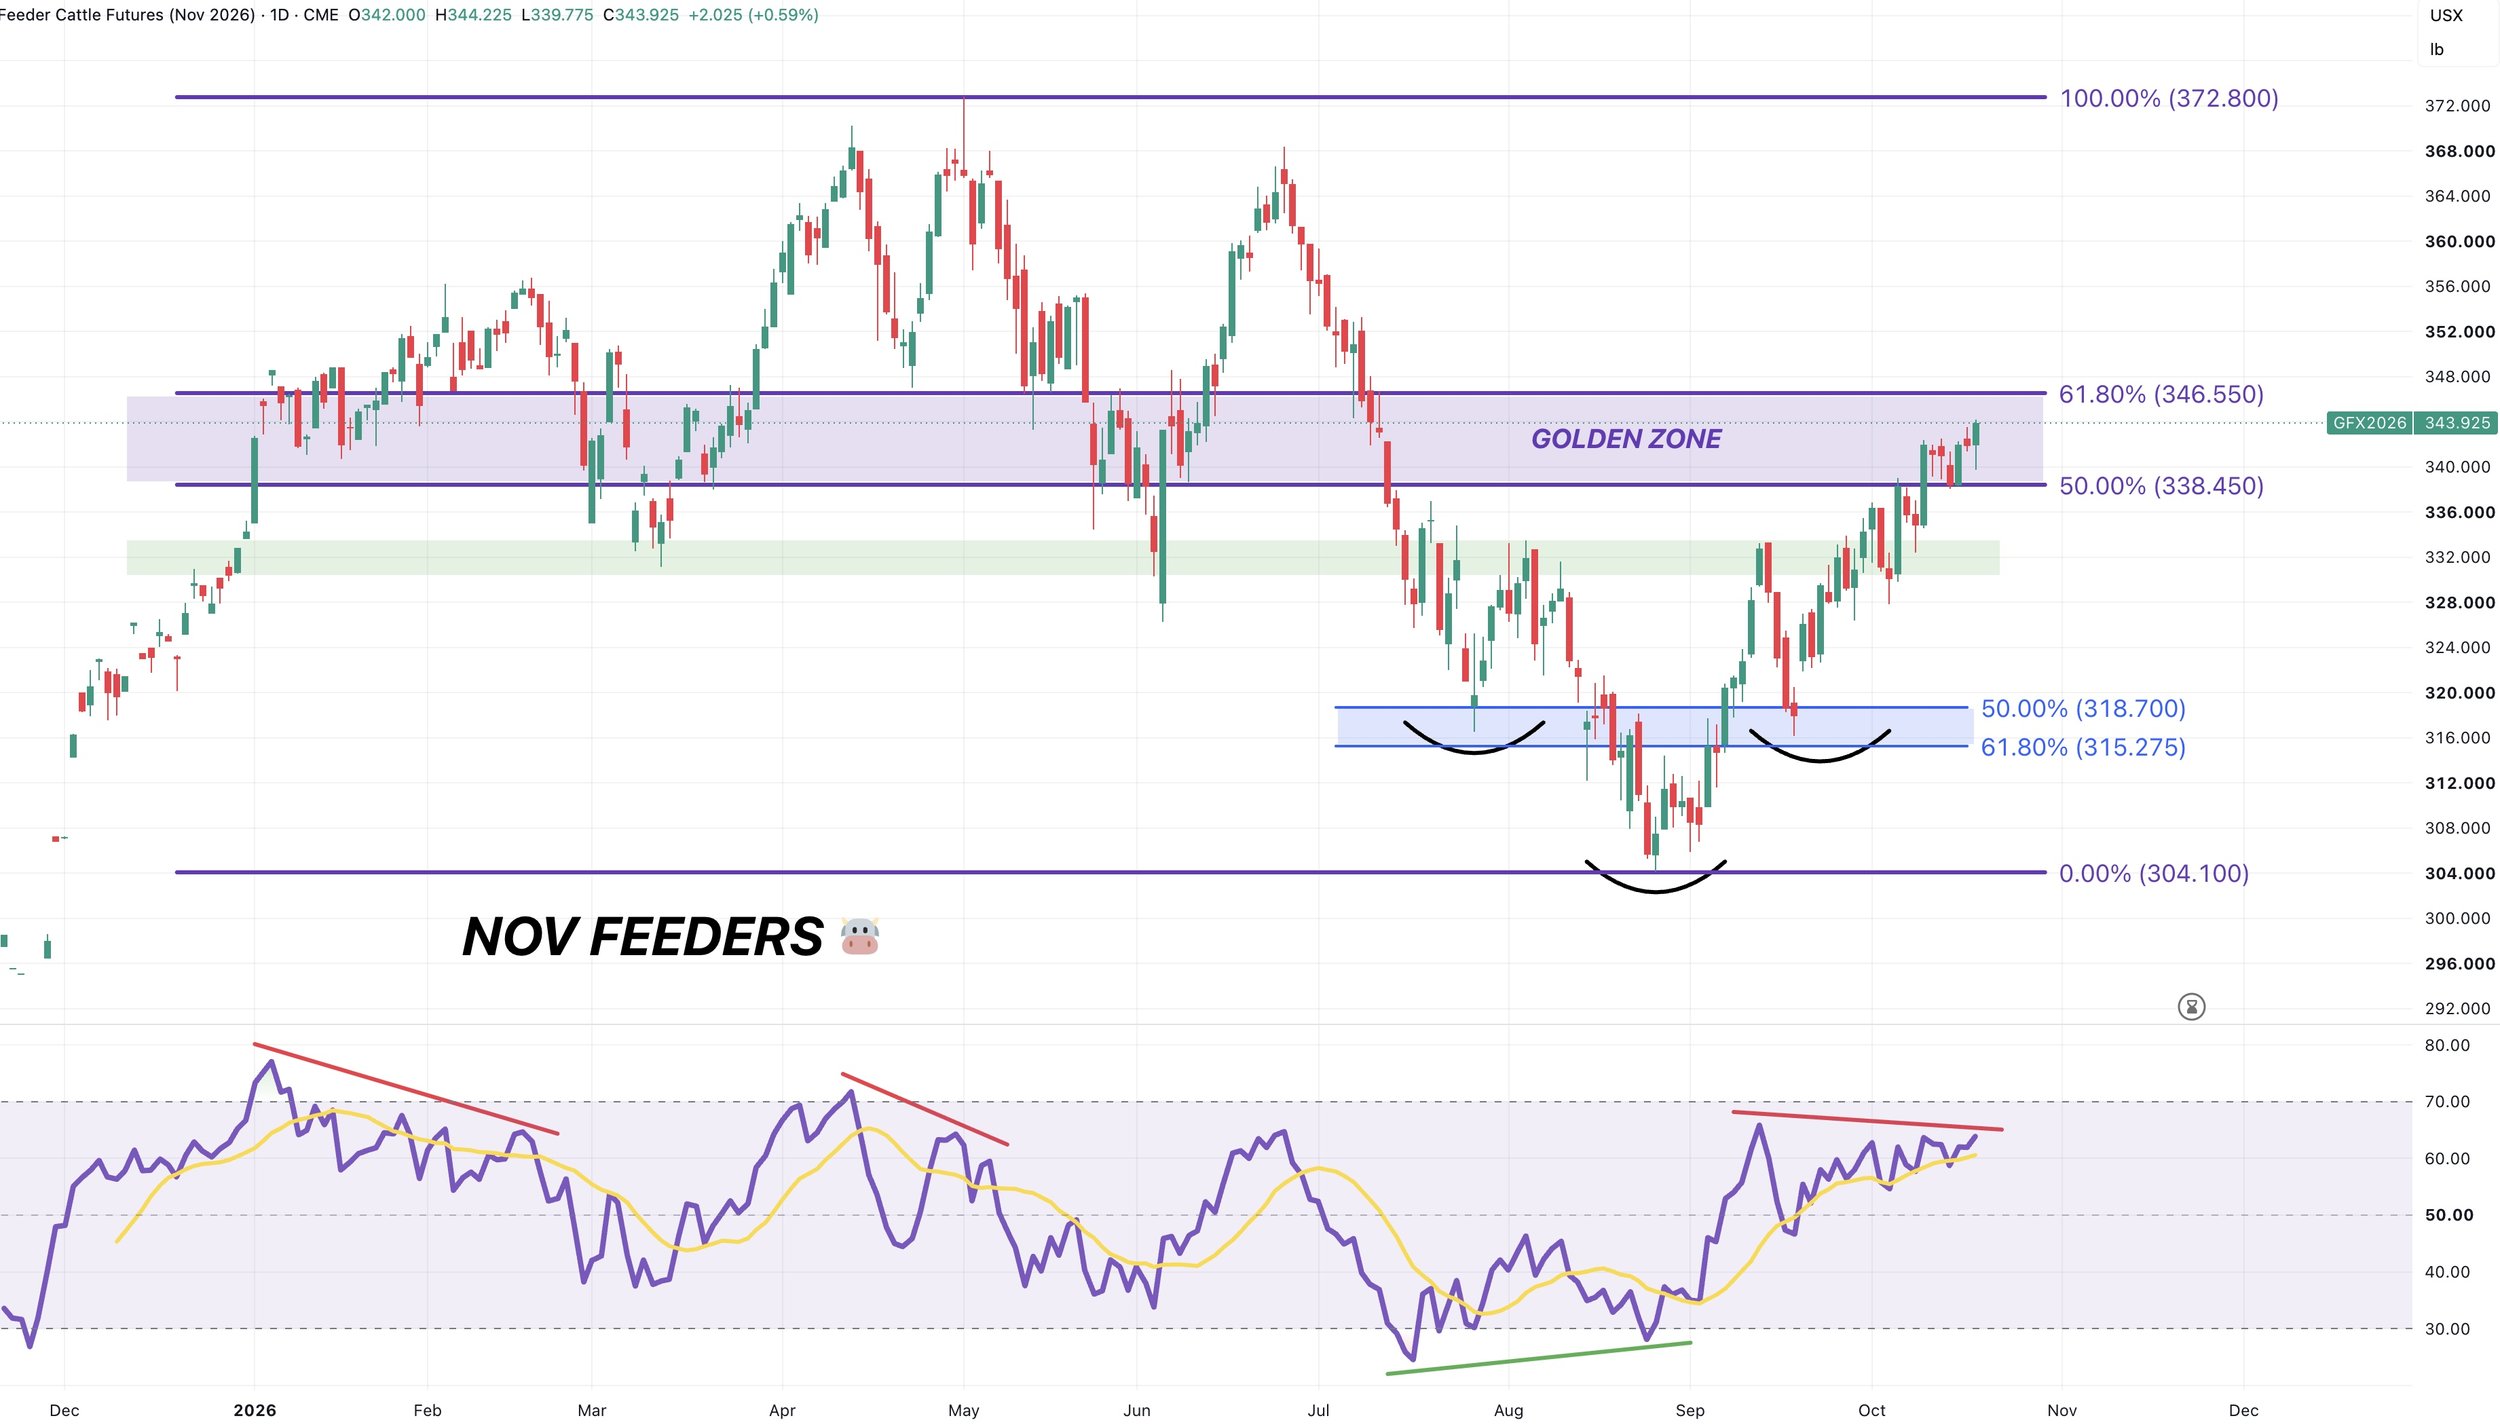
For starters, we are right up inside this target box we've had our eyes on for a long time.
The golden zone up to the May highs, nearing that 61.8% level.
If this market is still in an overall downward trend, this would be a very common spot for this market to stall out before resuming the trend lower.
If you break above this box, we could have room to run. But for now it's viewed as an area to defend.
The other big factor and reason I have some caution in this market is because we still have bearish divergence on the RSI.
Prices continue to grind higher. Yet the RSI is not. Which can be a sign that the upside momentum is getting weaker. This doesn’t mean we cannot go higher, but this would be a reason for caution.
RSI divergence has been pretty accurate in this cattle market.
Bearish divergence marked both February and May highs.
Bullish divergence marked the August lows.
So I like getting a start on some risk management.
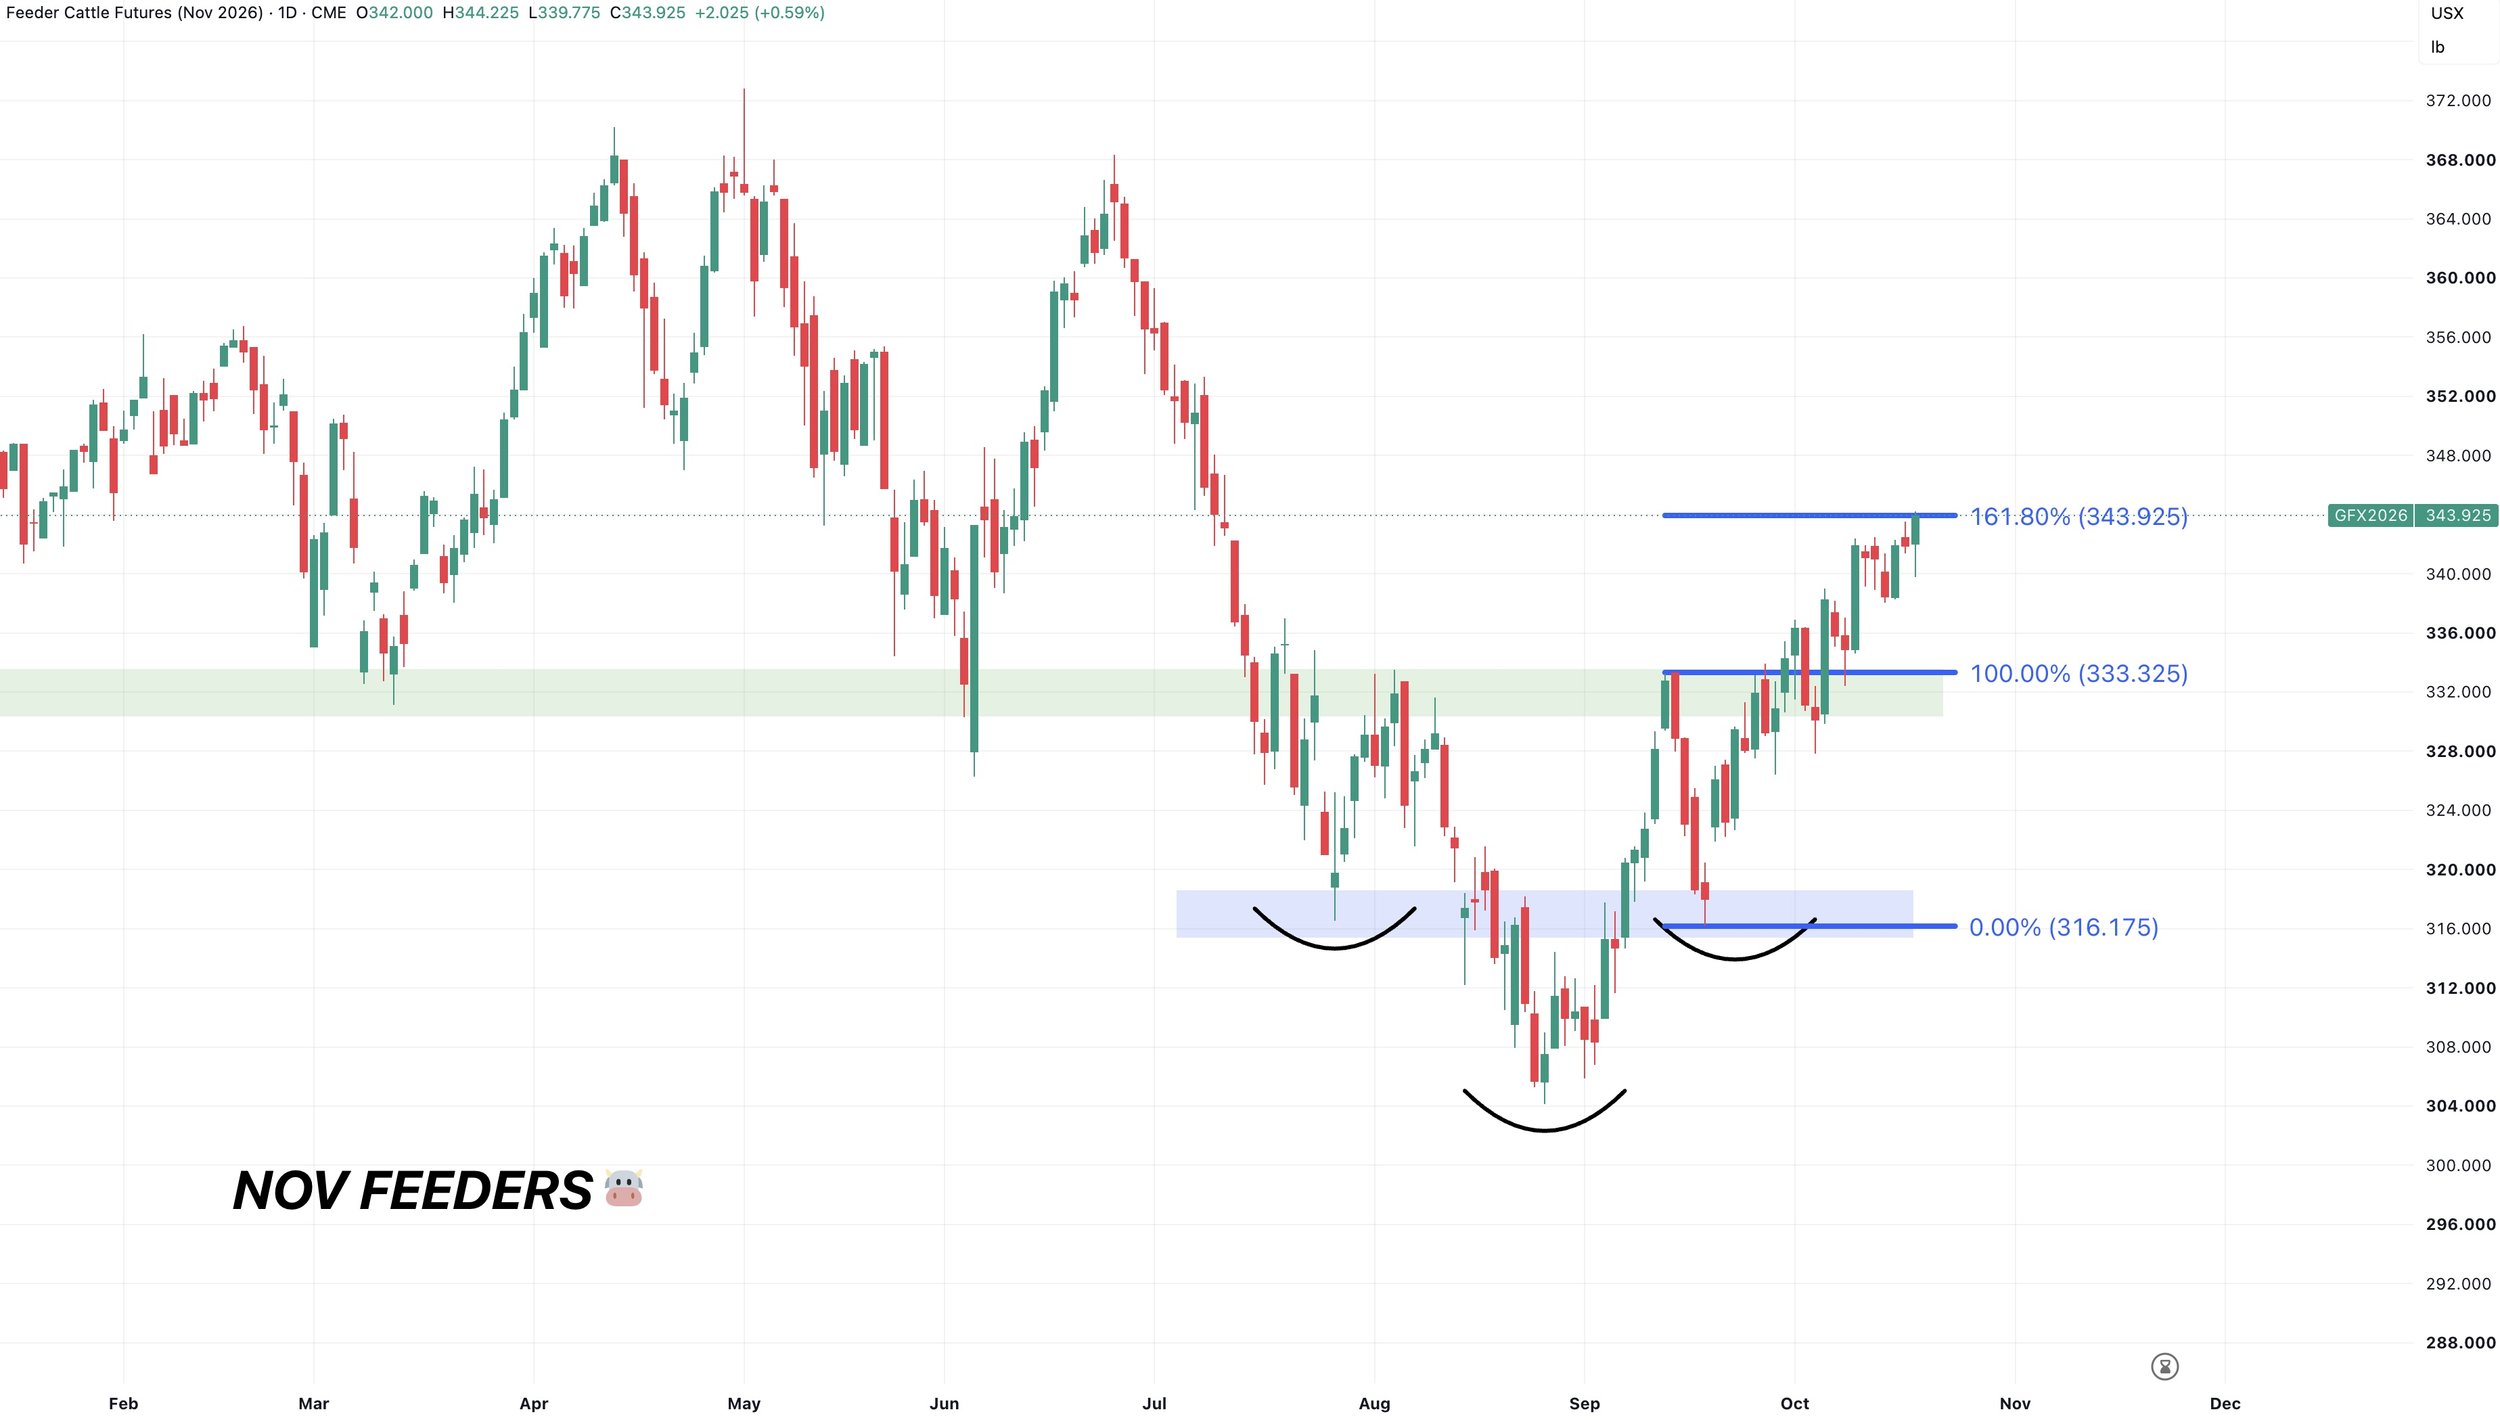
Feeders have also hit the golden fib extension from the intial rally.
Which means this rally is 161.8% of the recent lows up to the September highs.
Another common target.
This fib extension was how we found our methodology behind our corn, soybean, and wheat sell alerts back in late August and early September.
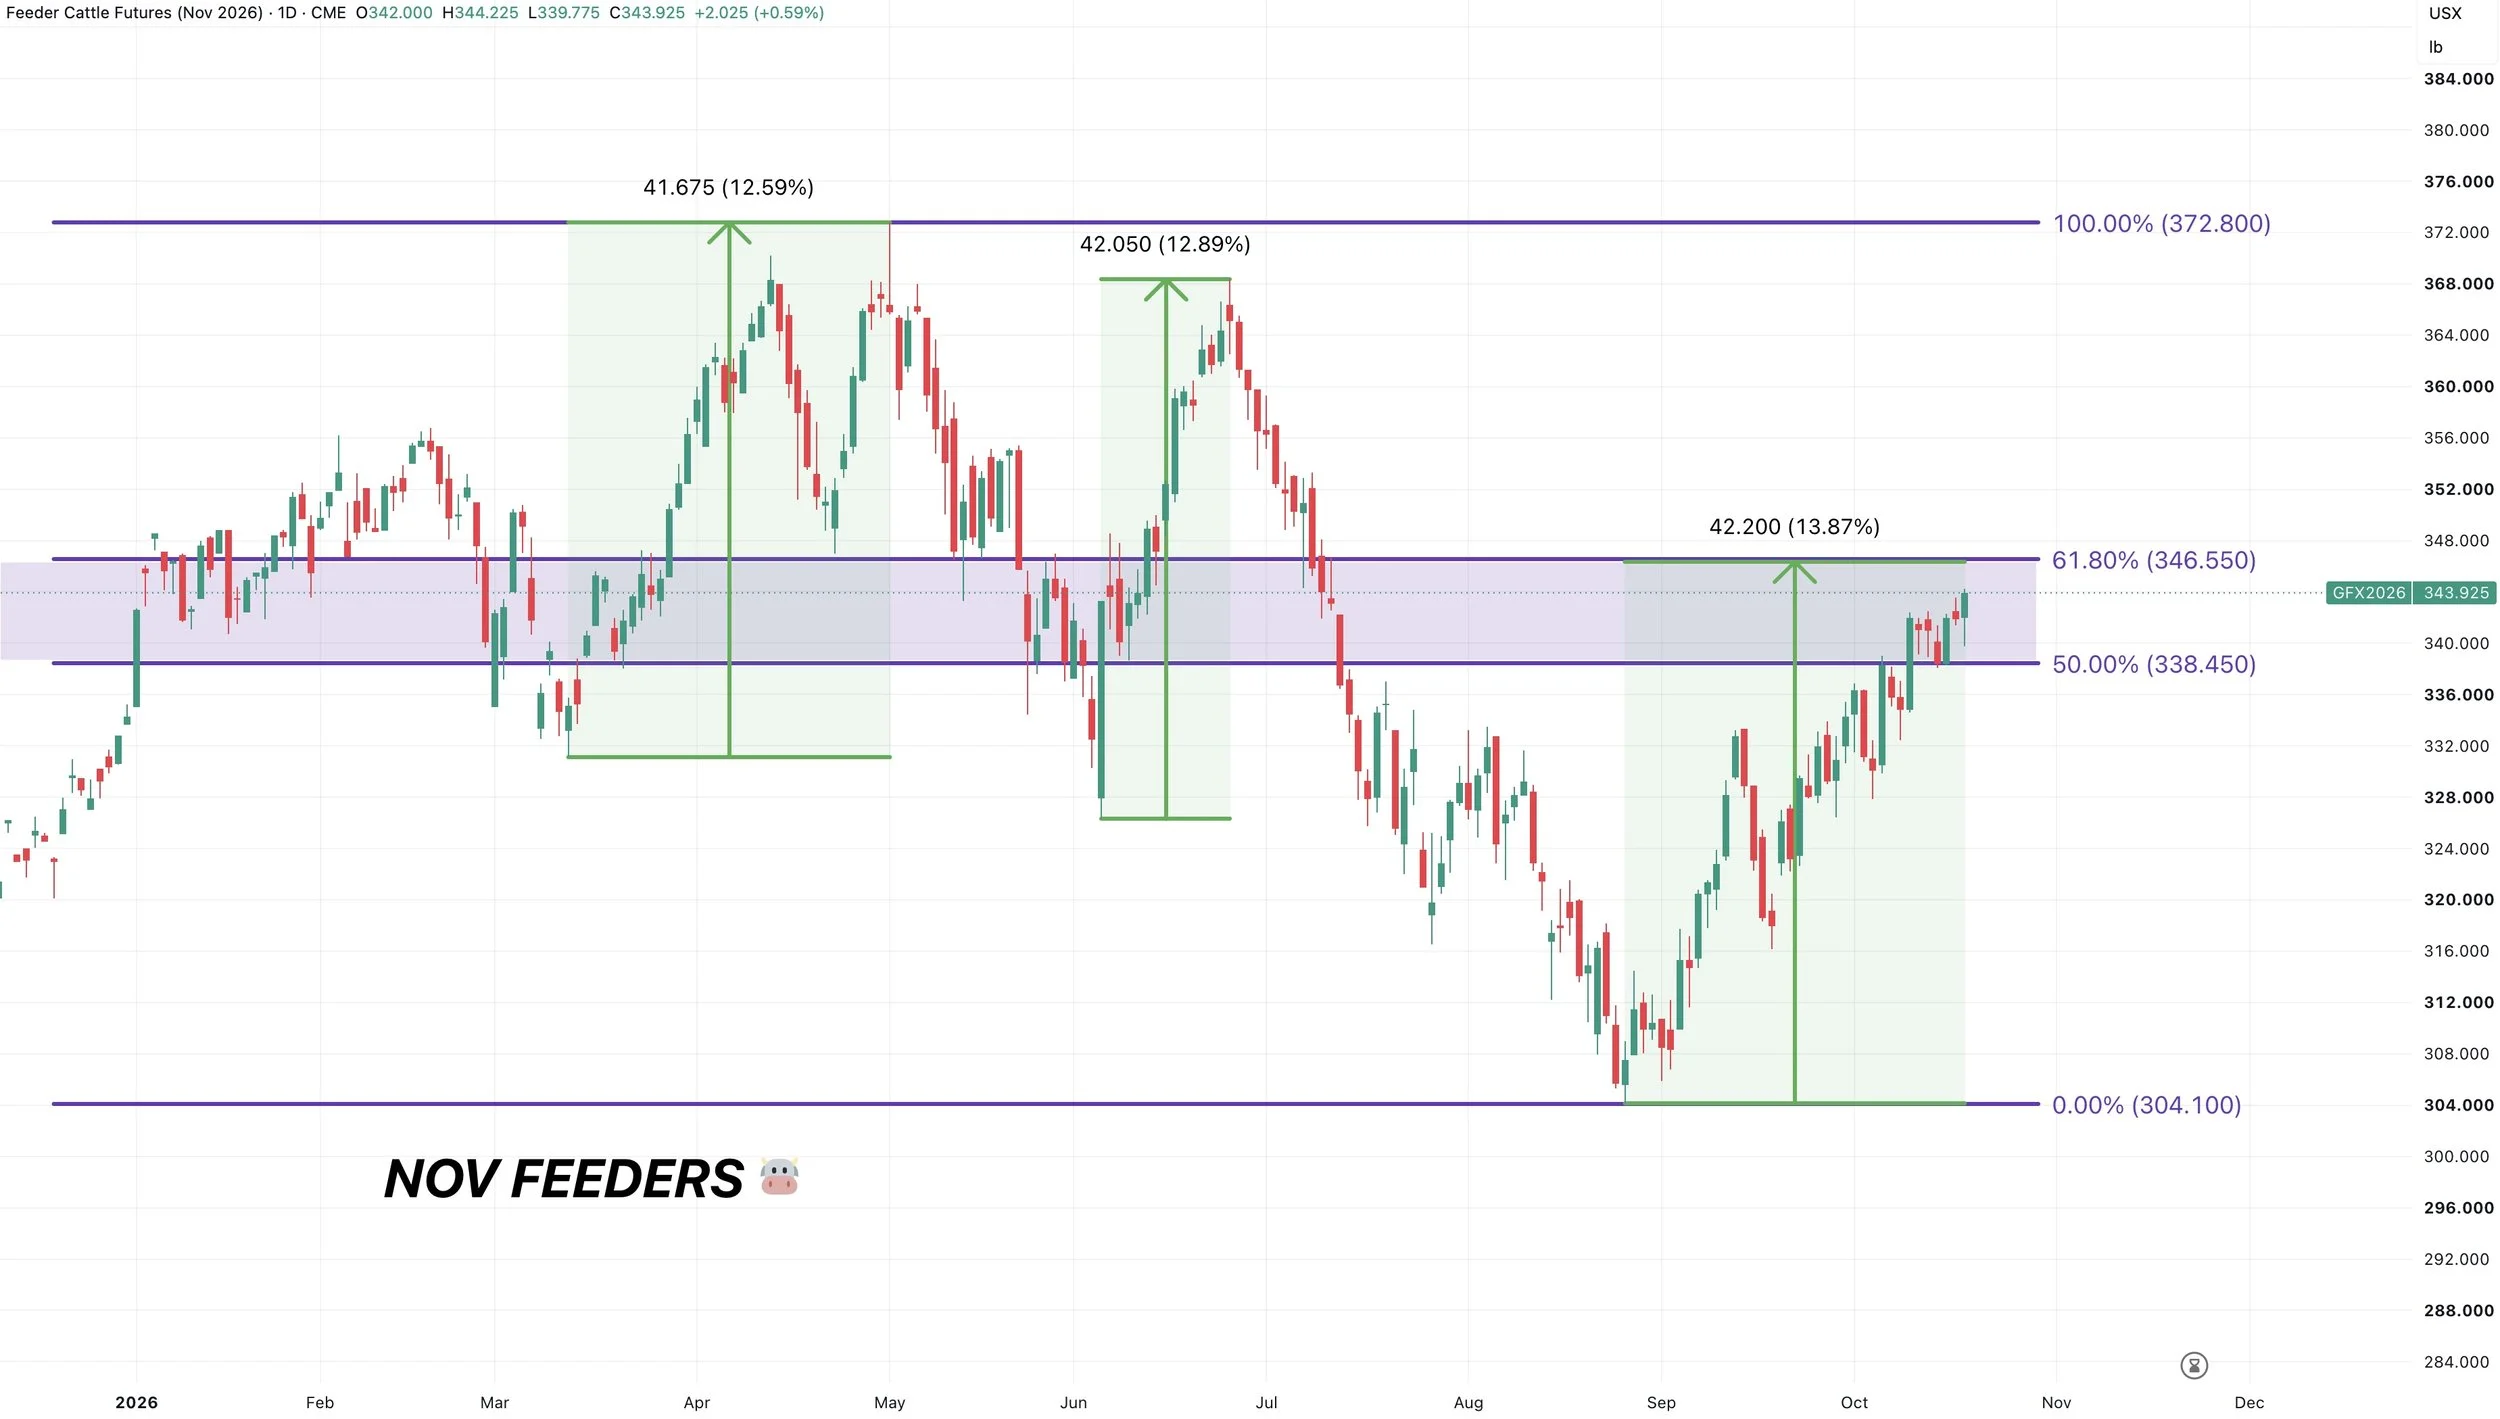
Lastly, if you look at the last two major rallies in this market.
Both of them were right around 41 to 42 ticks.
If we saw the exact same size of rally this time, it puts up right up near where are right now as well. Up near this 61.8% level.
So there is a few reasons why I like getting a start on doing something up here and I just like taking a few chips off the table.
Dec Live Chart:
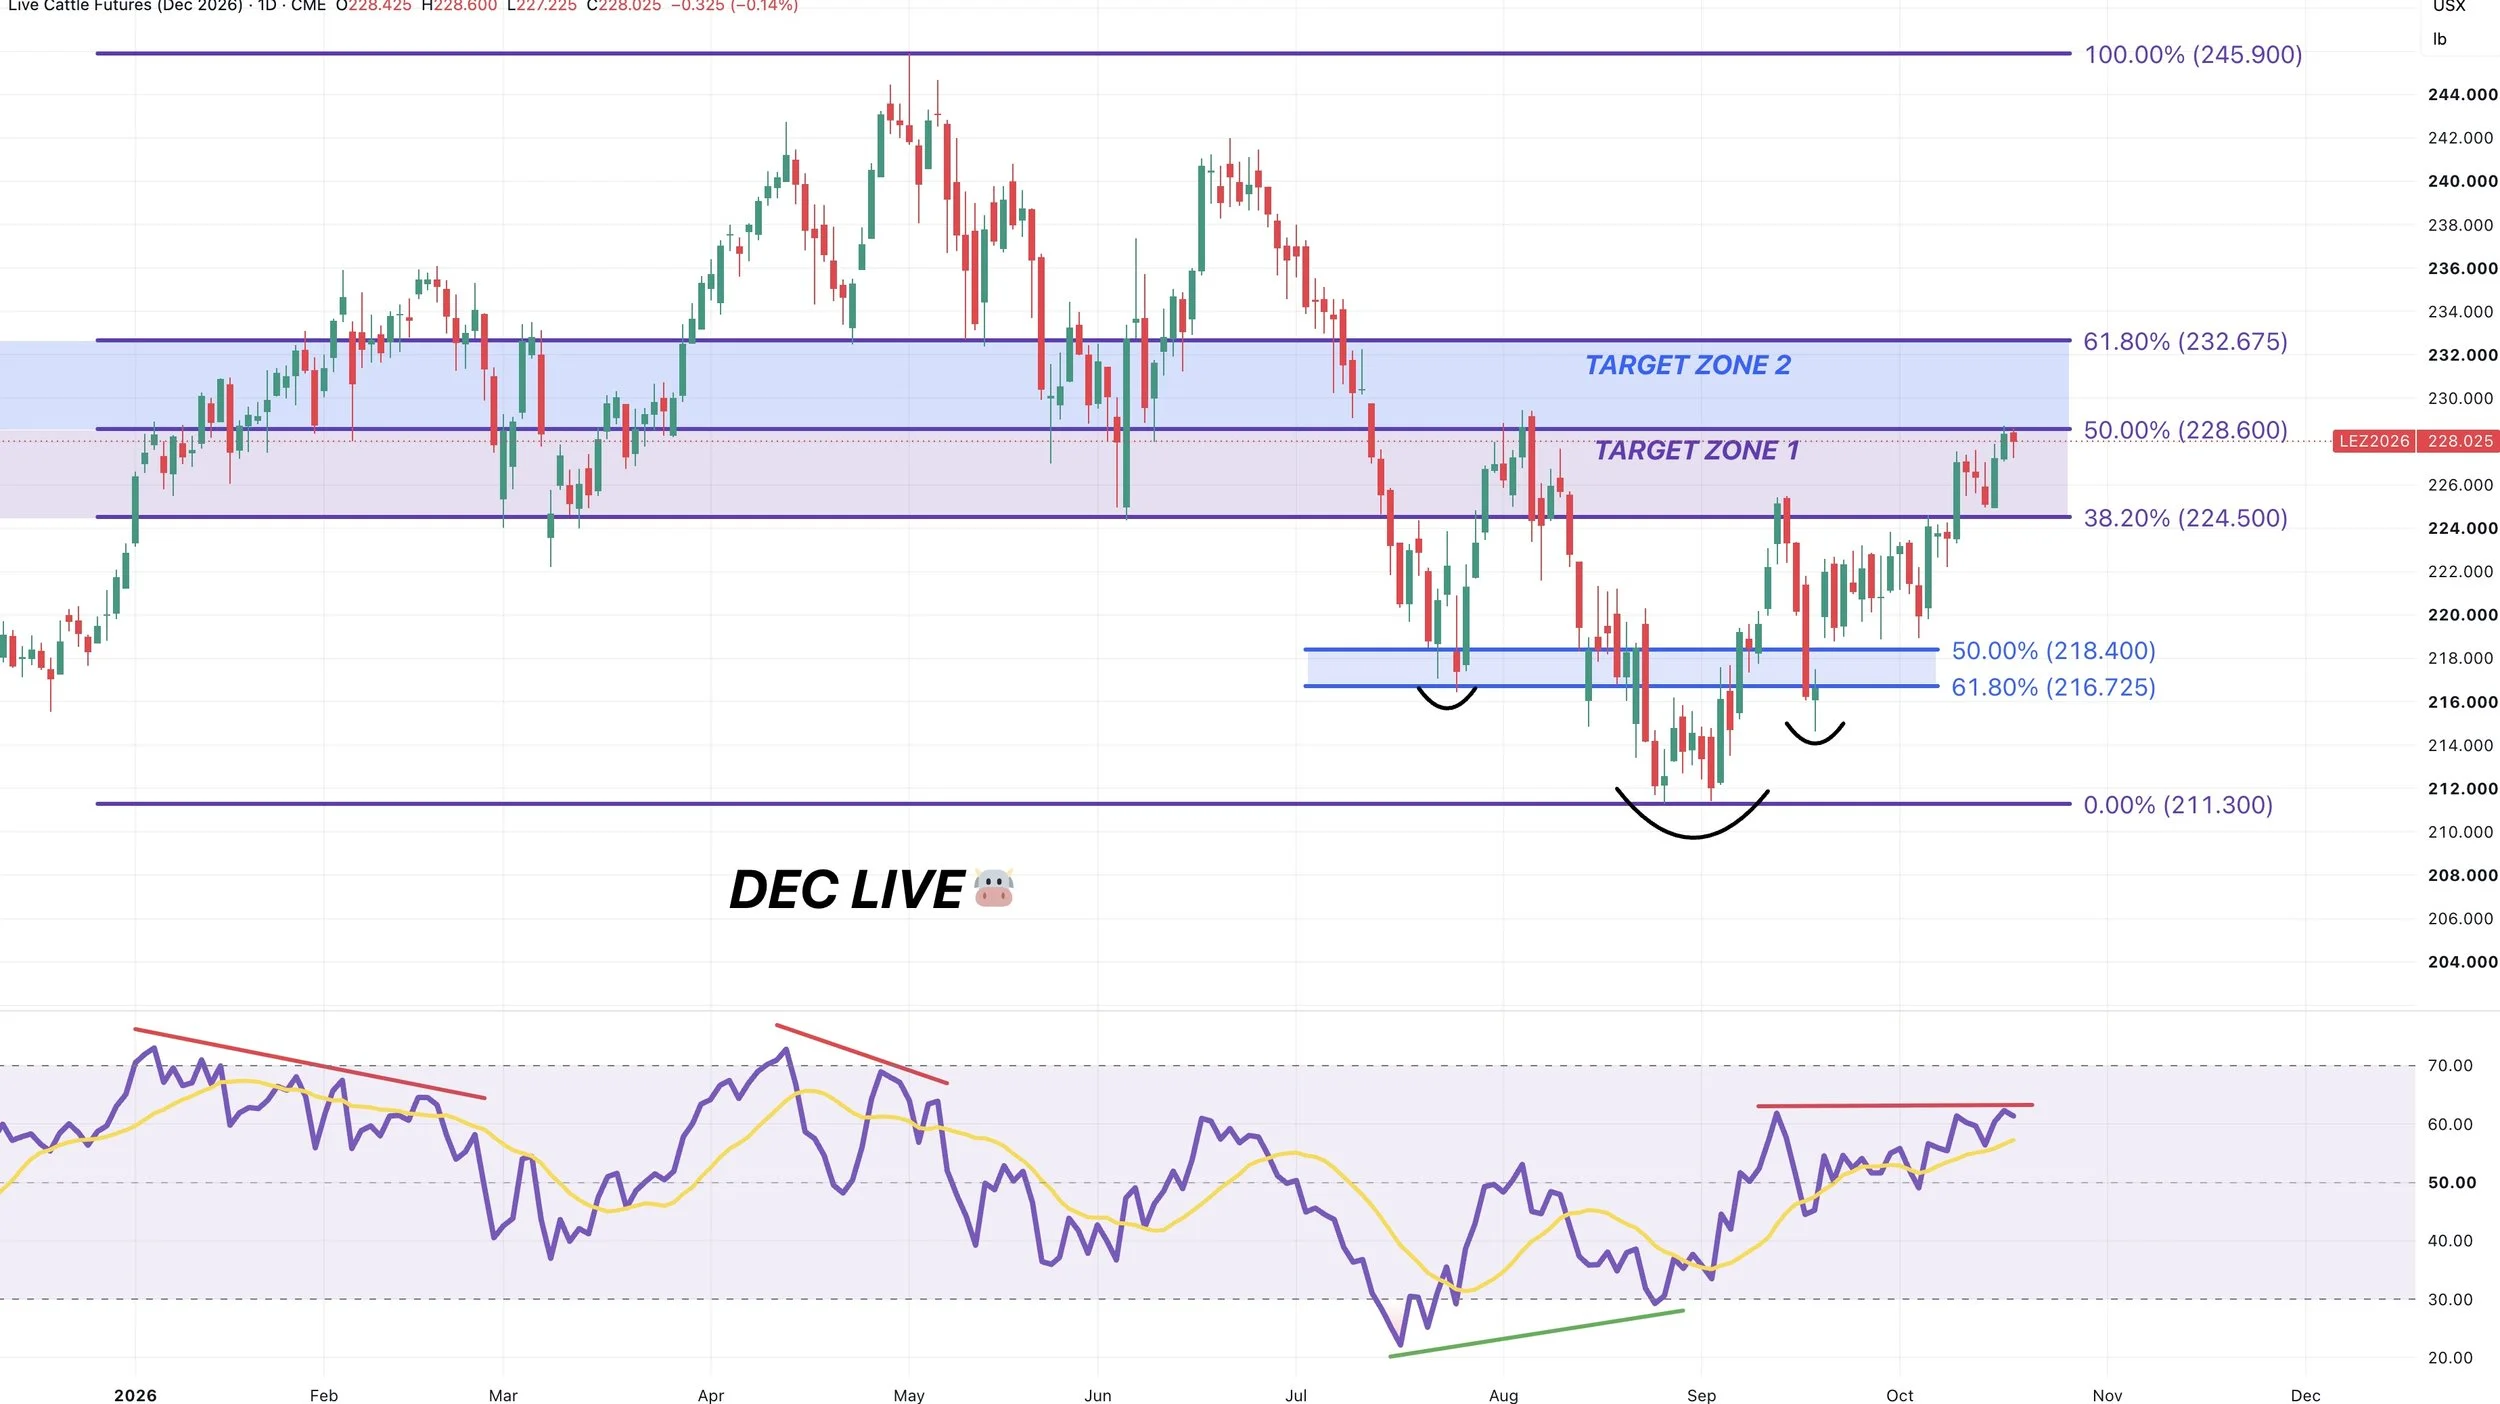
Very similar look here, except the targets for live cattle are a set of fibs lower due to the relative weakness compared to feeders.
Live cattle has clawed back 50% of the entire sell off. Where as feeders are sitting at the 61.8% level.
This same area has offered support and resistance in the past.
You also have prices making new highs but the RSI struggling to do so.
So I like getting a start on defending this level.
If you crack above this level, the next point of interest would be the 61.8% level.
Want to Talk?
Our phones are open 24/7 for you guys if you ever need anything or want to discuss your operation.
Jeremey & Office: (806)484-1214
Sebastian: (605)280-1186
Email: sfrost@dailymarketminute.com
Hedge Account
Interested in a hedge account? Use the link below to set up an account or give us a call.