
GRAINS CONTINUE TO BLEED
MARKET UPDATE
*I apologize this is getting out late as we had some issues with our video software
You can scroll to read the usual update as well. As the written version is the exact same as the video.
Timestamps for video:
Overview: 0:00min
Corn: 1:45min
Corn Charts: 10:30min
Beans: 12:30min
Bean Charts: 14:15min
Wheat: 16:15min
Cattle: 17:55min
Want to talk?
Office: (806)484-1214
Futures Prices Close
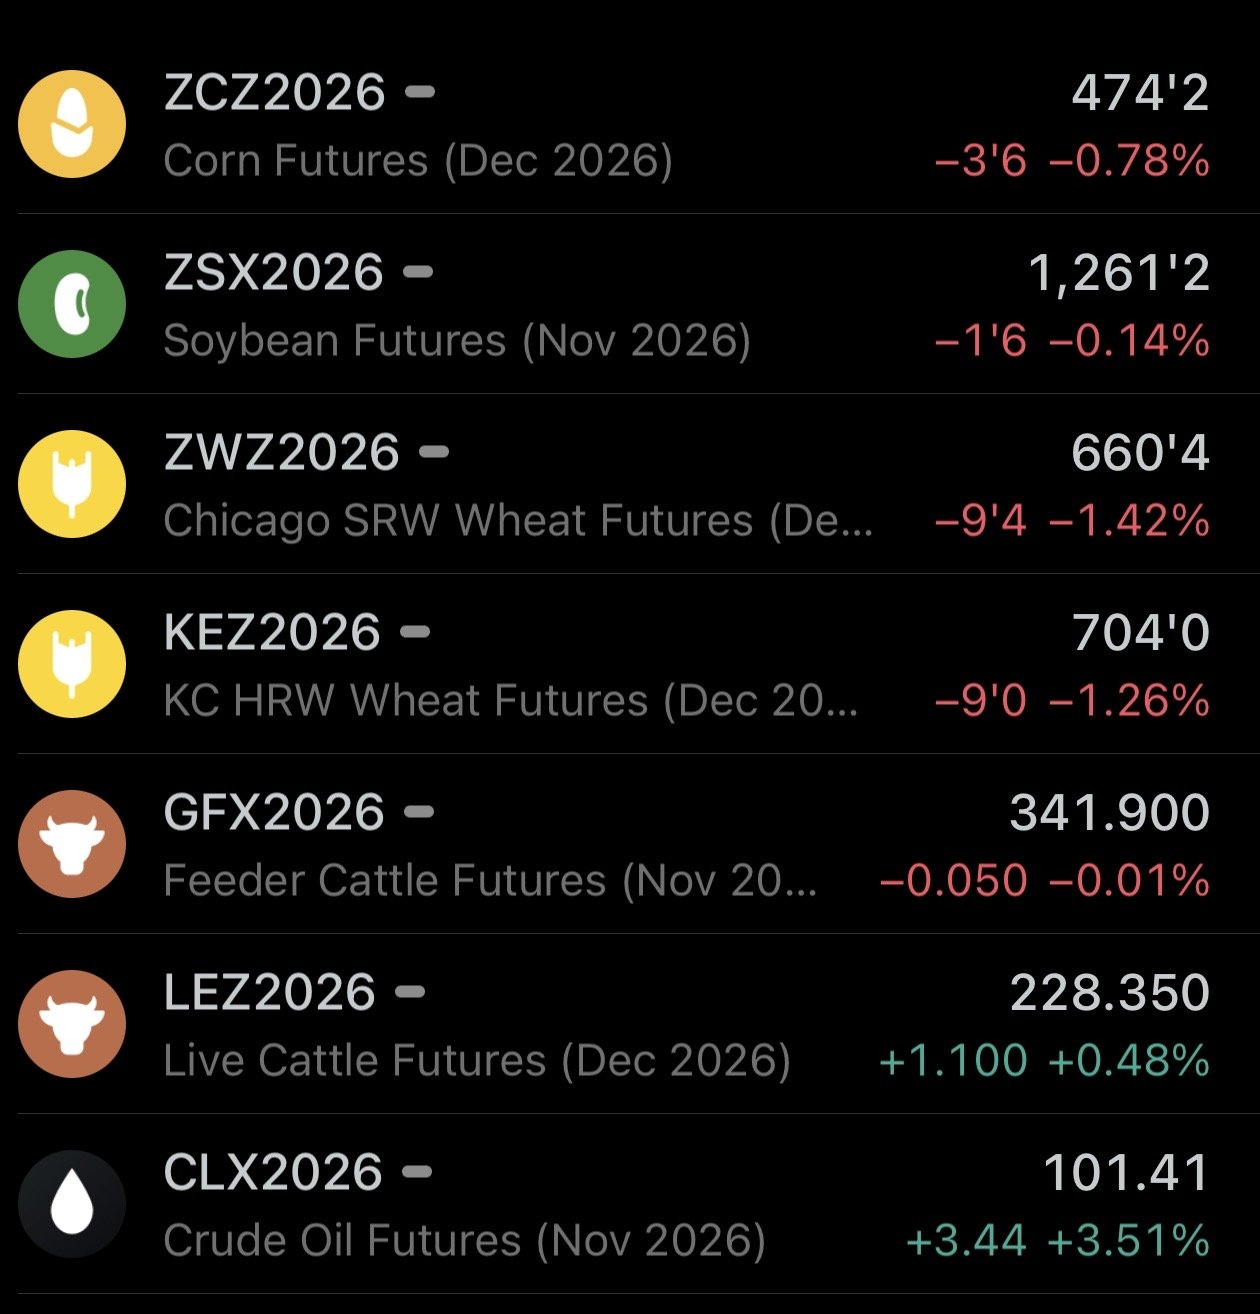
Overview
Grains continue to fade lower while cattle continues to grind higher.
The grains continue to be weak as there is just a lack of fresh news for bulls to grab on to. As there just isn’t anything new for this market.
We're in the middle of harvest so harvest continues to keep some pressure on the market.
Soybeans continue to be weak despite China stepping in and buying a ton of soybeans the last few days. They had been absent since that China meeting, but have been seeing consistent flash sales so that's a positive.
Questions to USDA
We emailed the USDA a bunch of questions about the October report.
They did finally respond and say that they are working on answering the questions.
Here were the questions we asked. The questions were a lot longer and in more detail, but here is a quick summary:
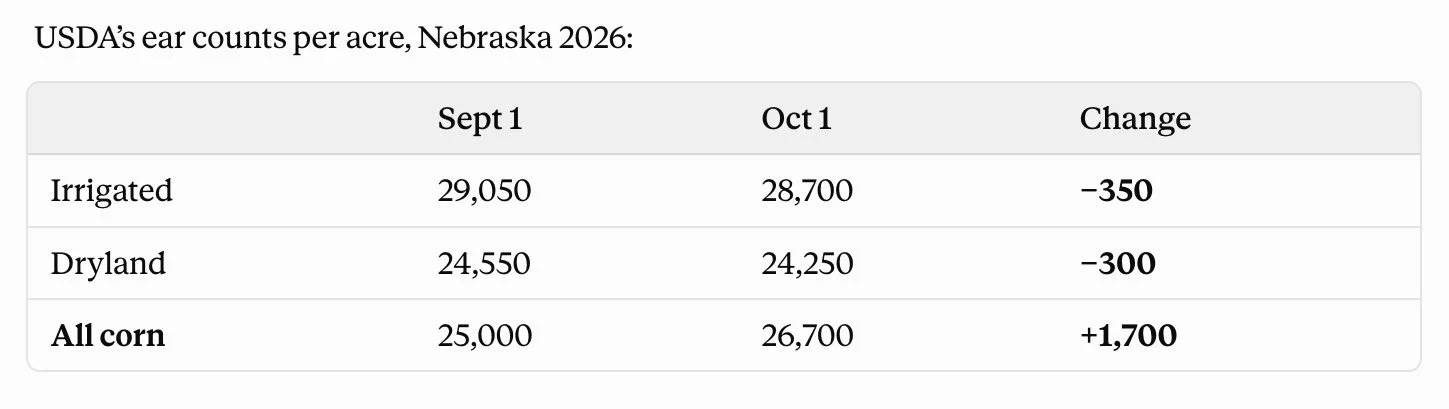
1. How did the statewide ear counts for Nebraska rise when both irrigated and dryland ear counts fell?
2. If those numbers are wrong, would correcting them change Nebraska's yield estimate?
3. Were enough Nebraska fields sampled in September, and could missing samples have effected the estimates?
4. Acres not harvested for grain. How is corn chopped for silage, grazed, or abandonded handled in the yield estimates, and when will acres reflect those losses?
5. How much of October's yield estimate came from actual grain weights vs projected weights?
6. Why did yield estimates rise while crop conditions declined especially in Nebraska and SoDak?
7. What information went into the October yield estimates, and how were field samples, farmer surveys and other sources combined?
So hopefully we’ll get an answer to some of these. But let's jump into today's update.
Today's Main Takeaways
Corn
Nebraska Yield Artificially Inflated?
Nebraska was the main reason for the massive bump in yield from the USDA.
As they raised yield in Nebraska by +11 bpa. Which alone accounted for +1.2 bpa of the +2.7 bpa increase we saw from the USDA.
Now the reason why the USDA jumped Nebraska by so much in the first place was actually probably due to a sampling issue. The amount of non-irrigated was heavier in September than it should have been.
They had irrigated and dryland ear counts both down, vs last month, yet all corn was higher.
It doesn’t really make any sense. They need an explanation for it because one isn’t right.
The USDA didn’t change harvest acres in the report.
If the acres are down, you could overstate the yield.
Just a random example:
If you have 10 acres, and it's 200 bpa. That's 2,000 bushels.
If the bushels don’t change, yet you only harvest 9 acres. Now it's 222 bpa.
So production didn’t change, But yield went up.
This could possibly explain part of the yield increase.
Nebraska Ratings vs Yield:
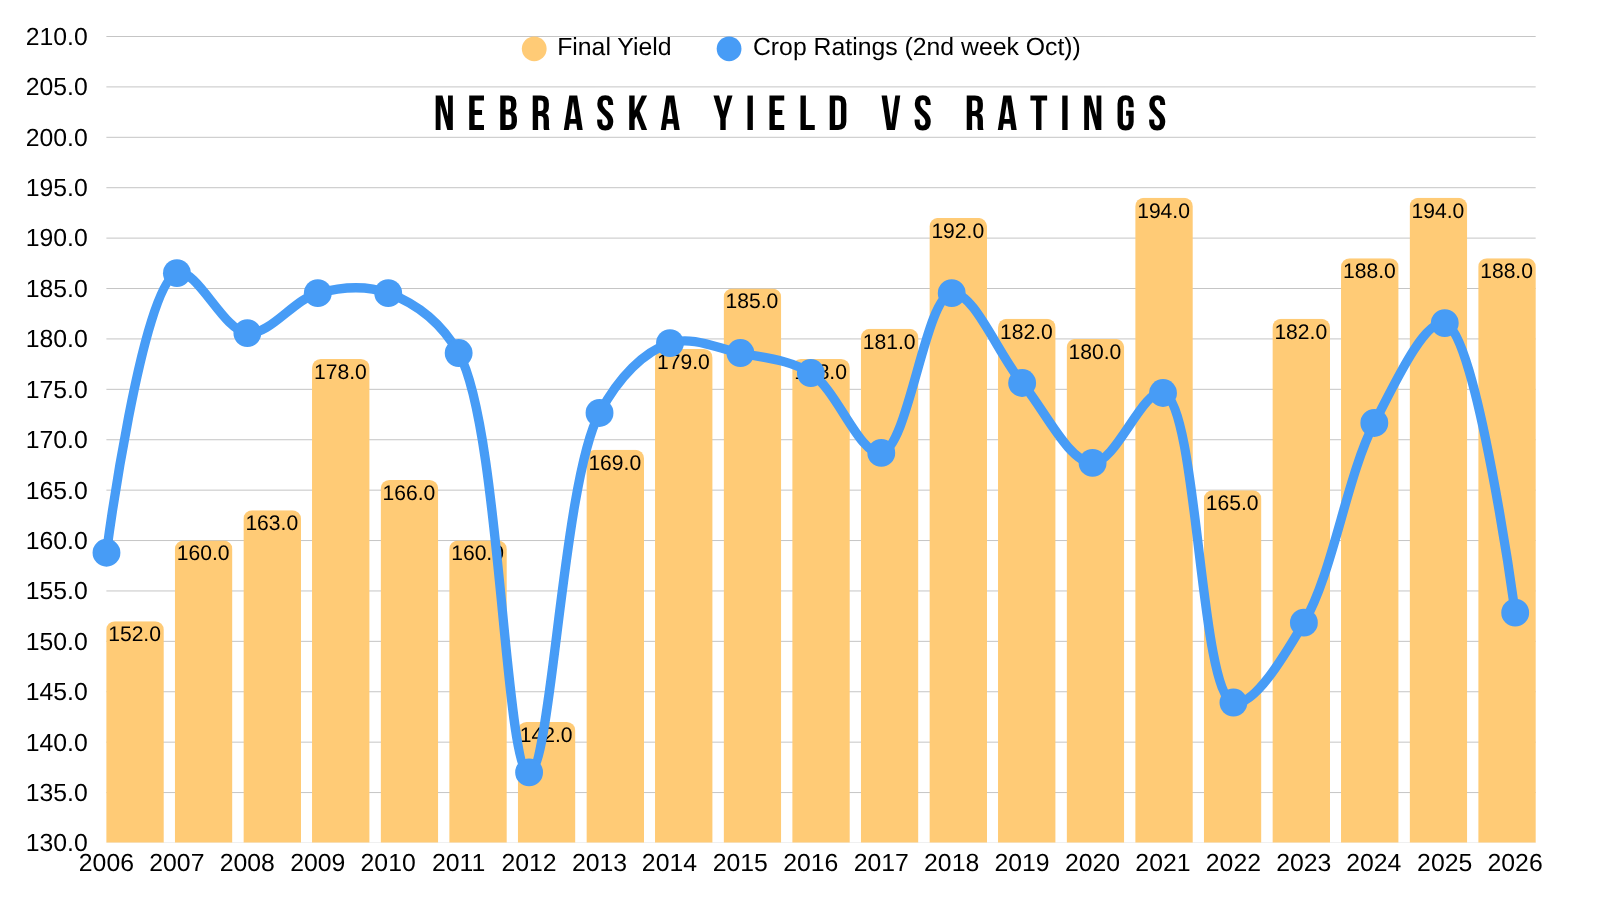
Nebraska's corn is rated 48% G/E.
Which would be one of the worse rated crops on record.
Here is a comparison of the yield vs ratings.
This chart alone does make you lean towards that number being a little high.
Some Iowa Data:
Almost everyone agrees that Illinois yield should be coming down.
But what about Iowa?
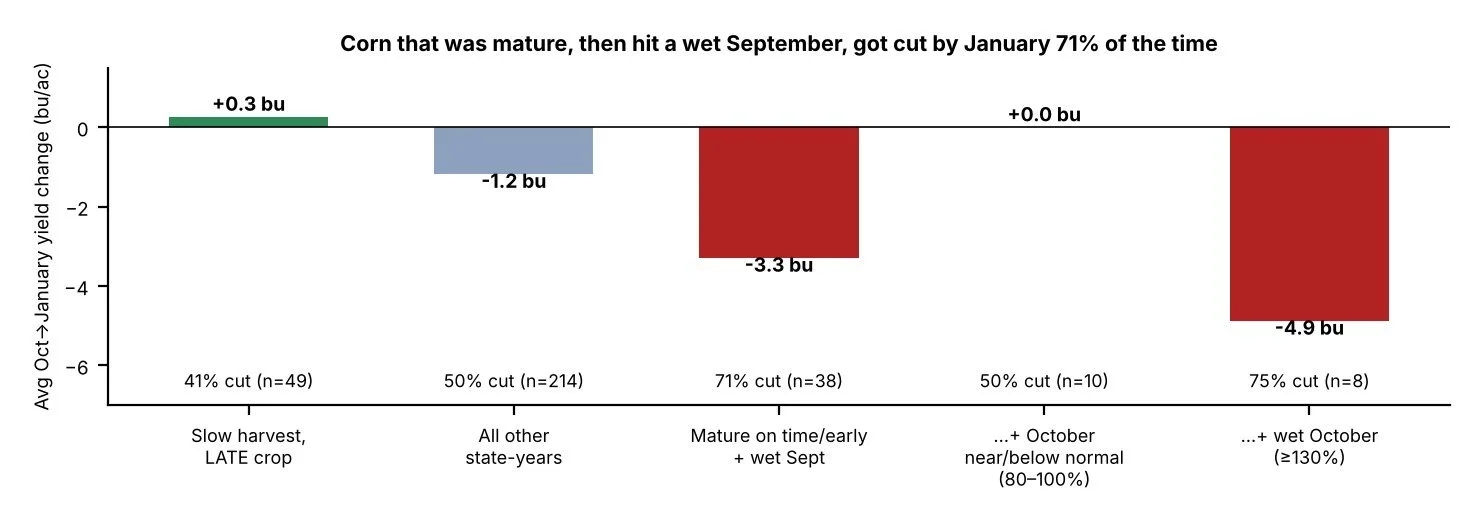
Iowa is having a slow harvest. But not all slow harvests are the same.
Mature corn that got wet in September was cut by the January report 71% of the time over the last 15 years. Aka phantom yield loss.
Late corn that was harvested late, saw virtually no change.
Basically, if the corn is ready to go and they can’t get it, the crop size can be smaller.
If it stays wet this becomes an even bigger problem.
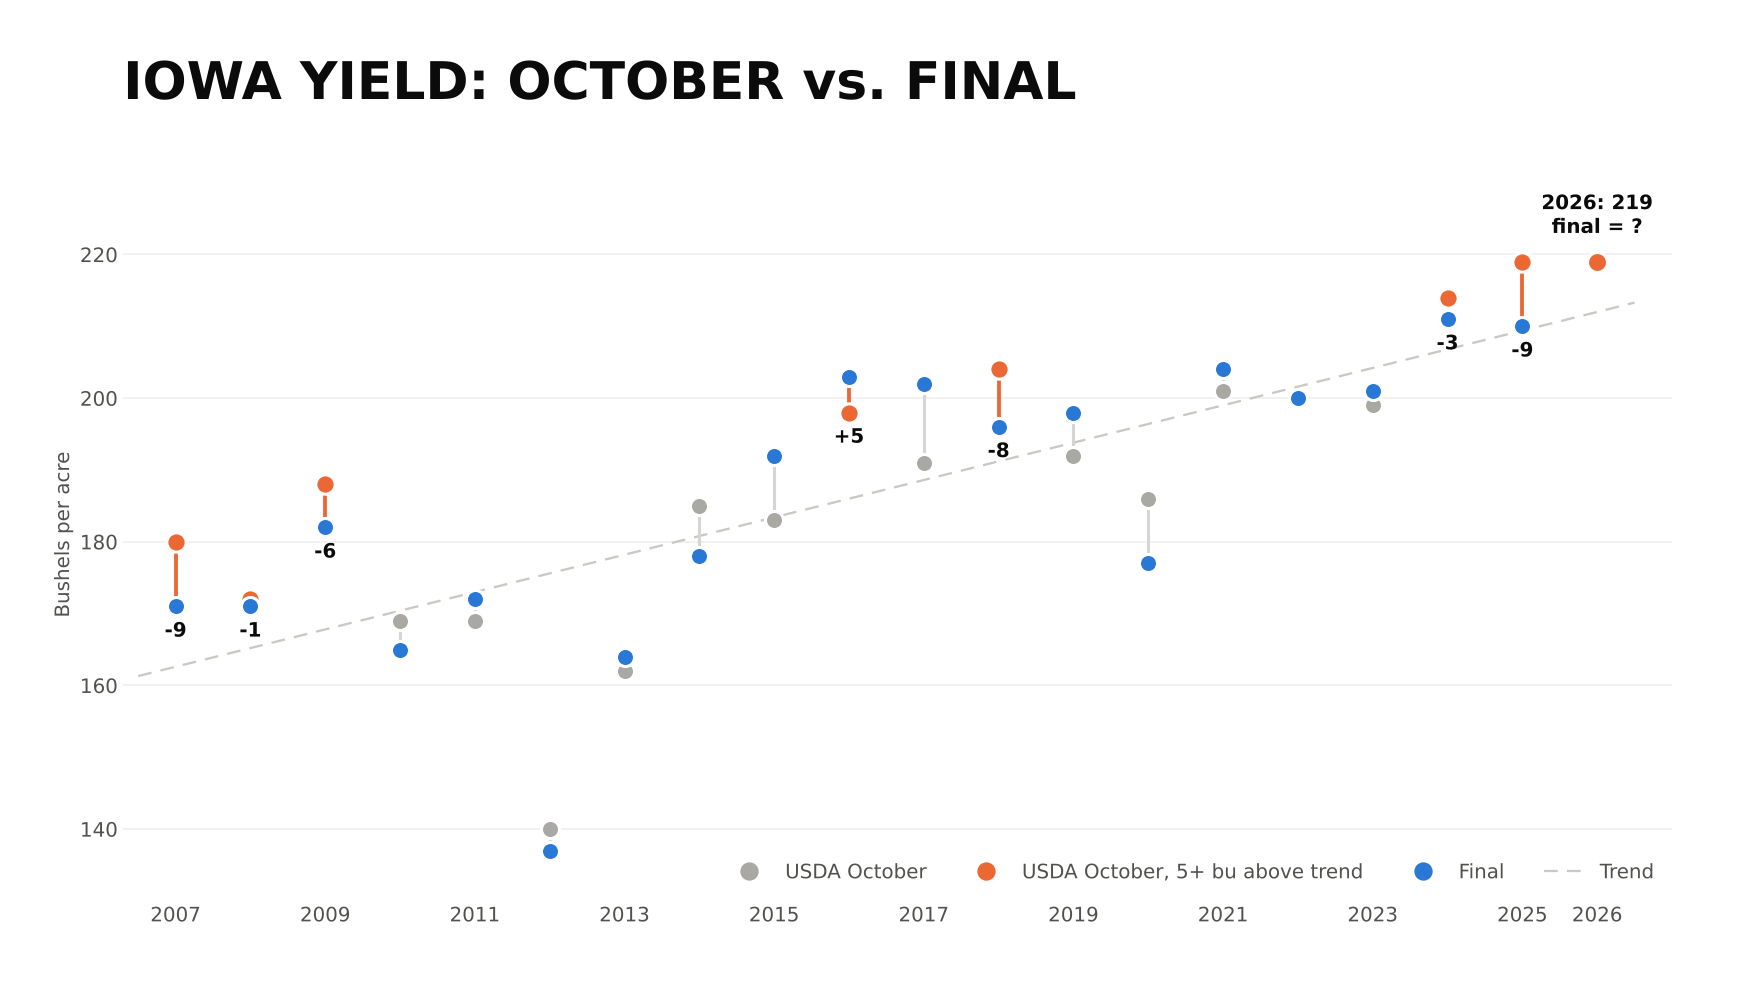
The USDA has Iowa at a record 219 bpa yield.
Which would be 7 bpa above the USDA's trendline.
What happened in other years where the USDA had their October yield this far above trend?
There is 6 other years where the USDA had Iowa's October yield 5+ bpa above trend.
It was ultimately lowered in 5 of the 6 years by an average of 6 bpa.
(Orange is Oct yield that was 5+ bpa above trend. Grey is other Oct yields. Blue is final yields)
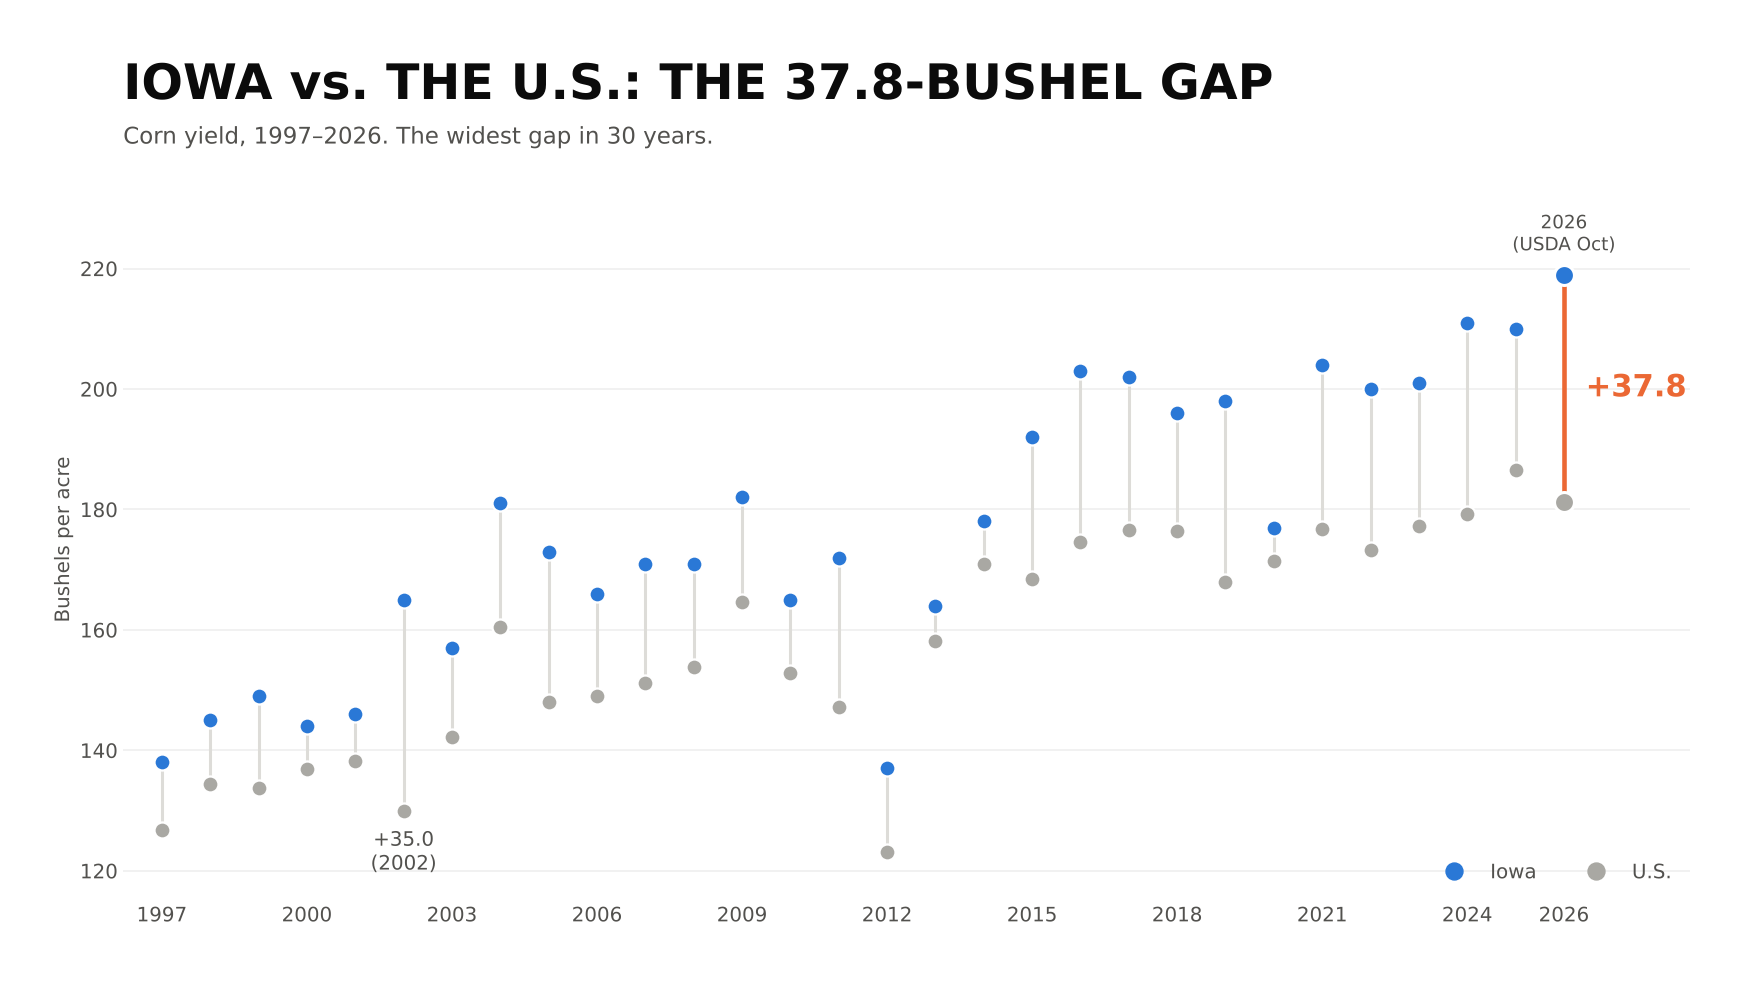
If you compare Iowa's corn yield vs the National corn yield.
The difference between the two would be the largest on record.
Which is pretty interesting.
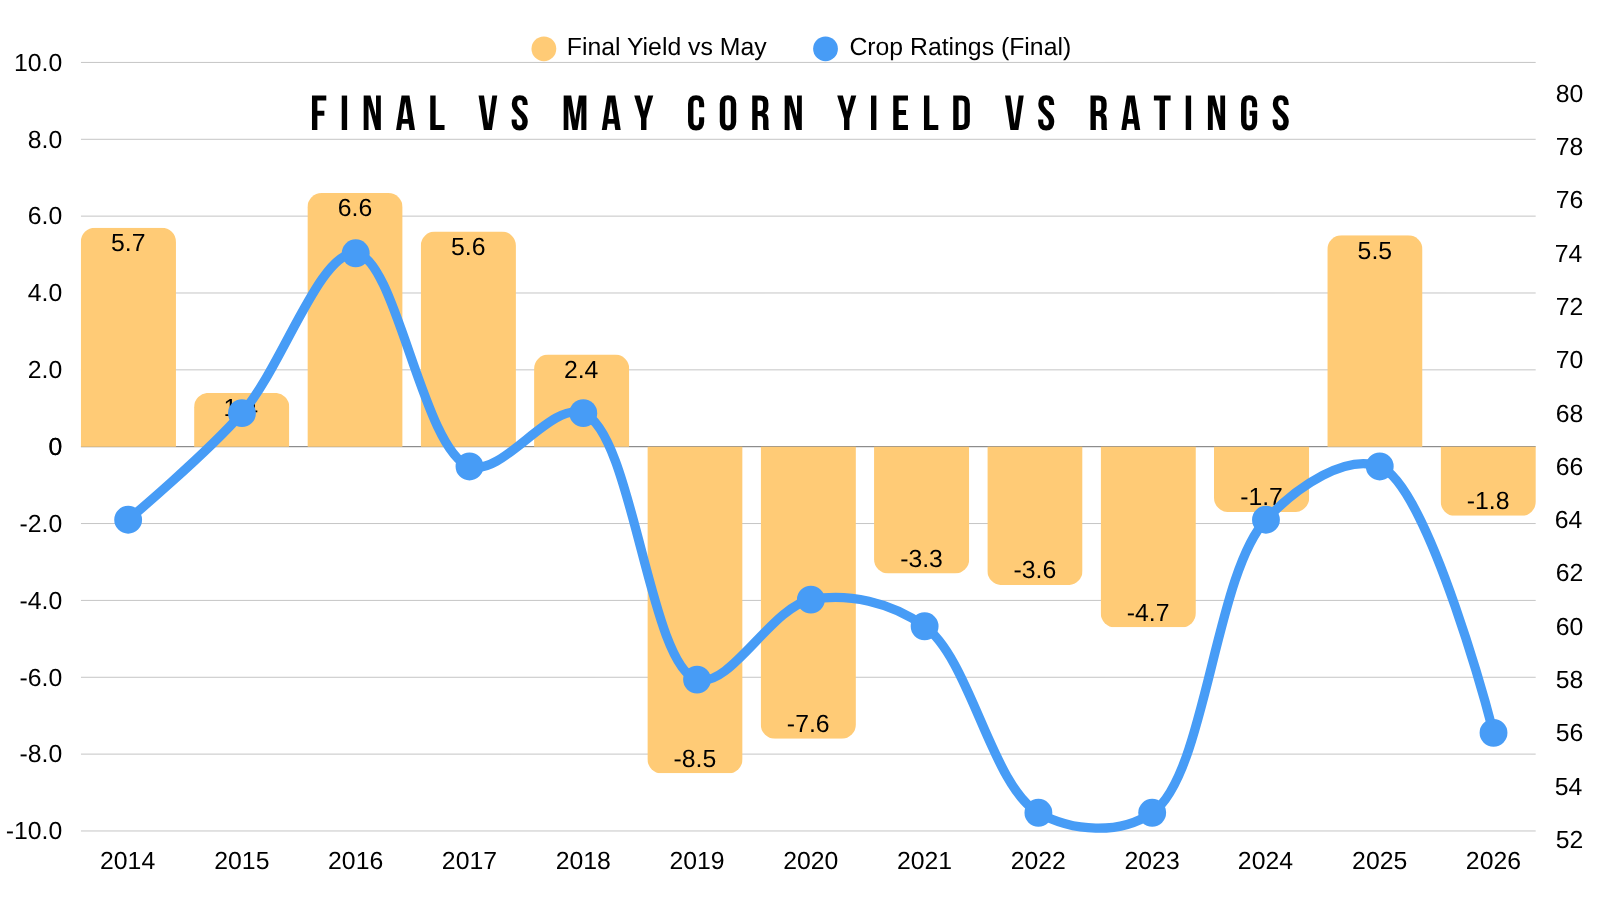
Crop Ratings vs National Yield
If you look at crop ratings vs yield, there is no true correlation at face value like we've talked about many times before. But there is a correlation to how yield deviates from trend.
This chart shows that there is a clear correlation between good ratings and above trend, and bad ratings and below trend.
We have some of the worst crop ratings we've seen, yet the USDA doesn’t have yield deviating very far below trend.
Our ratings are on par with 2022 and 2023. Where we saw around a 4-5 bpa deviation from trend.
The USDA currently has us just -1.8 bpa below trend.
Every year we have had conditions at this level, yield has deviated further below trend than they currently have.
So if I had to guess, I'd take the under on yield from here.
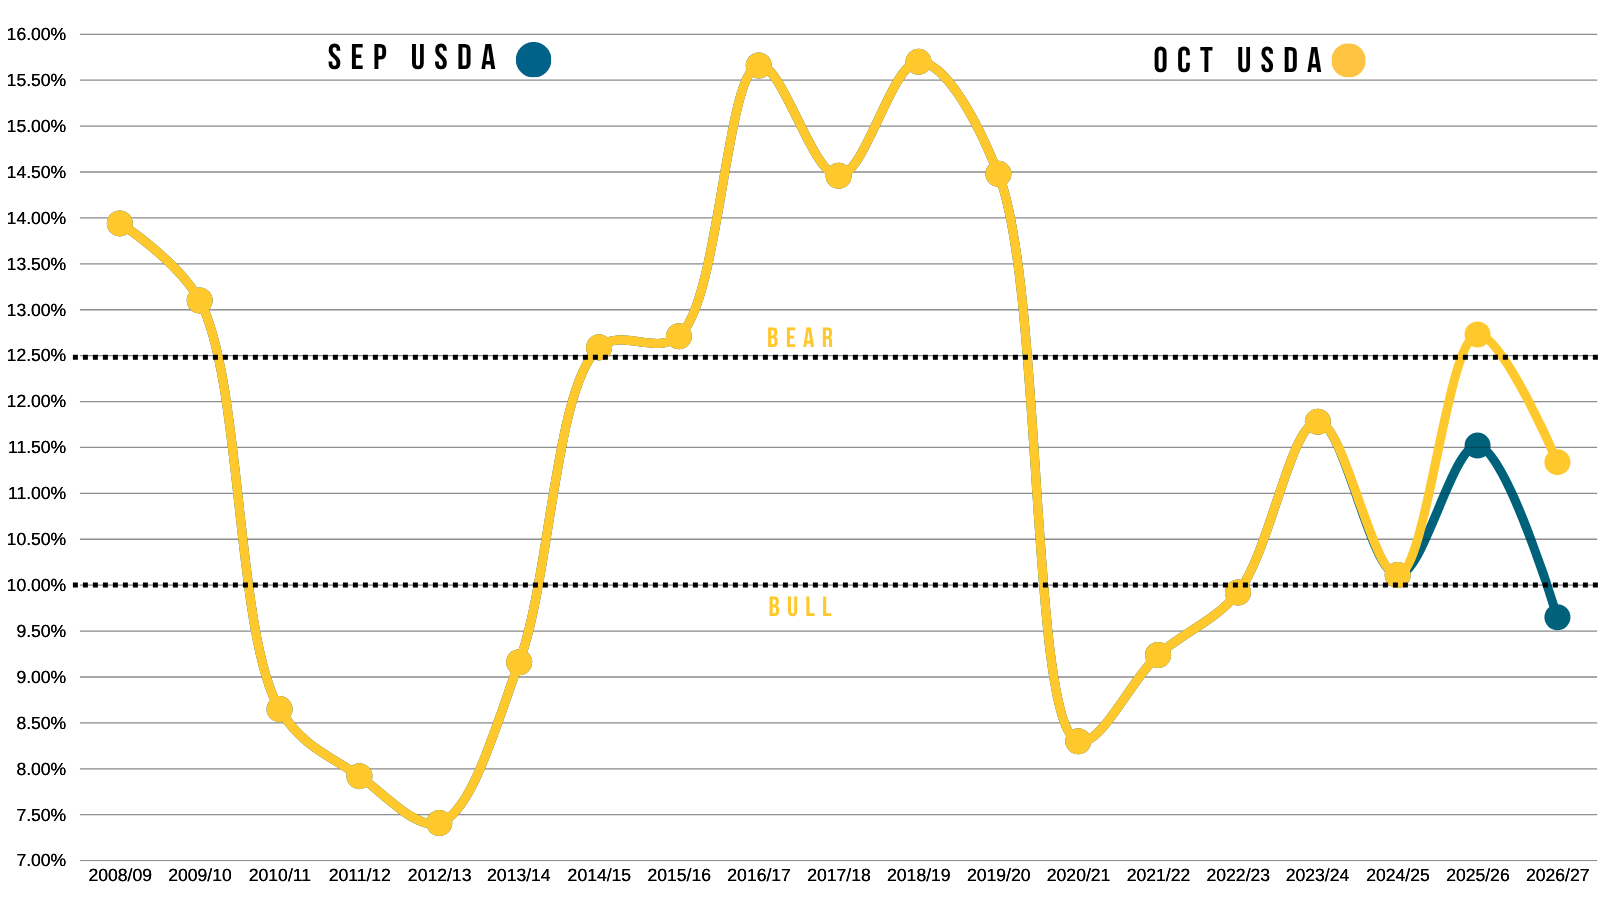
What would it take for a bullish balance sheet?
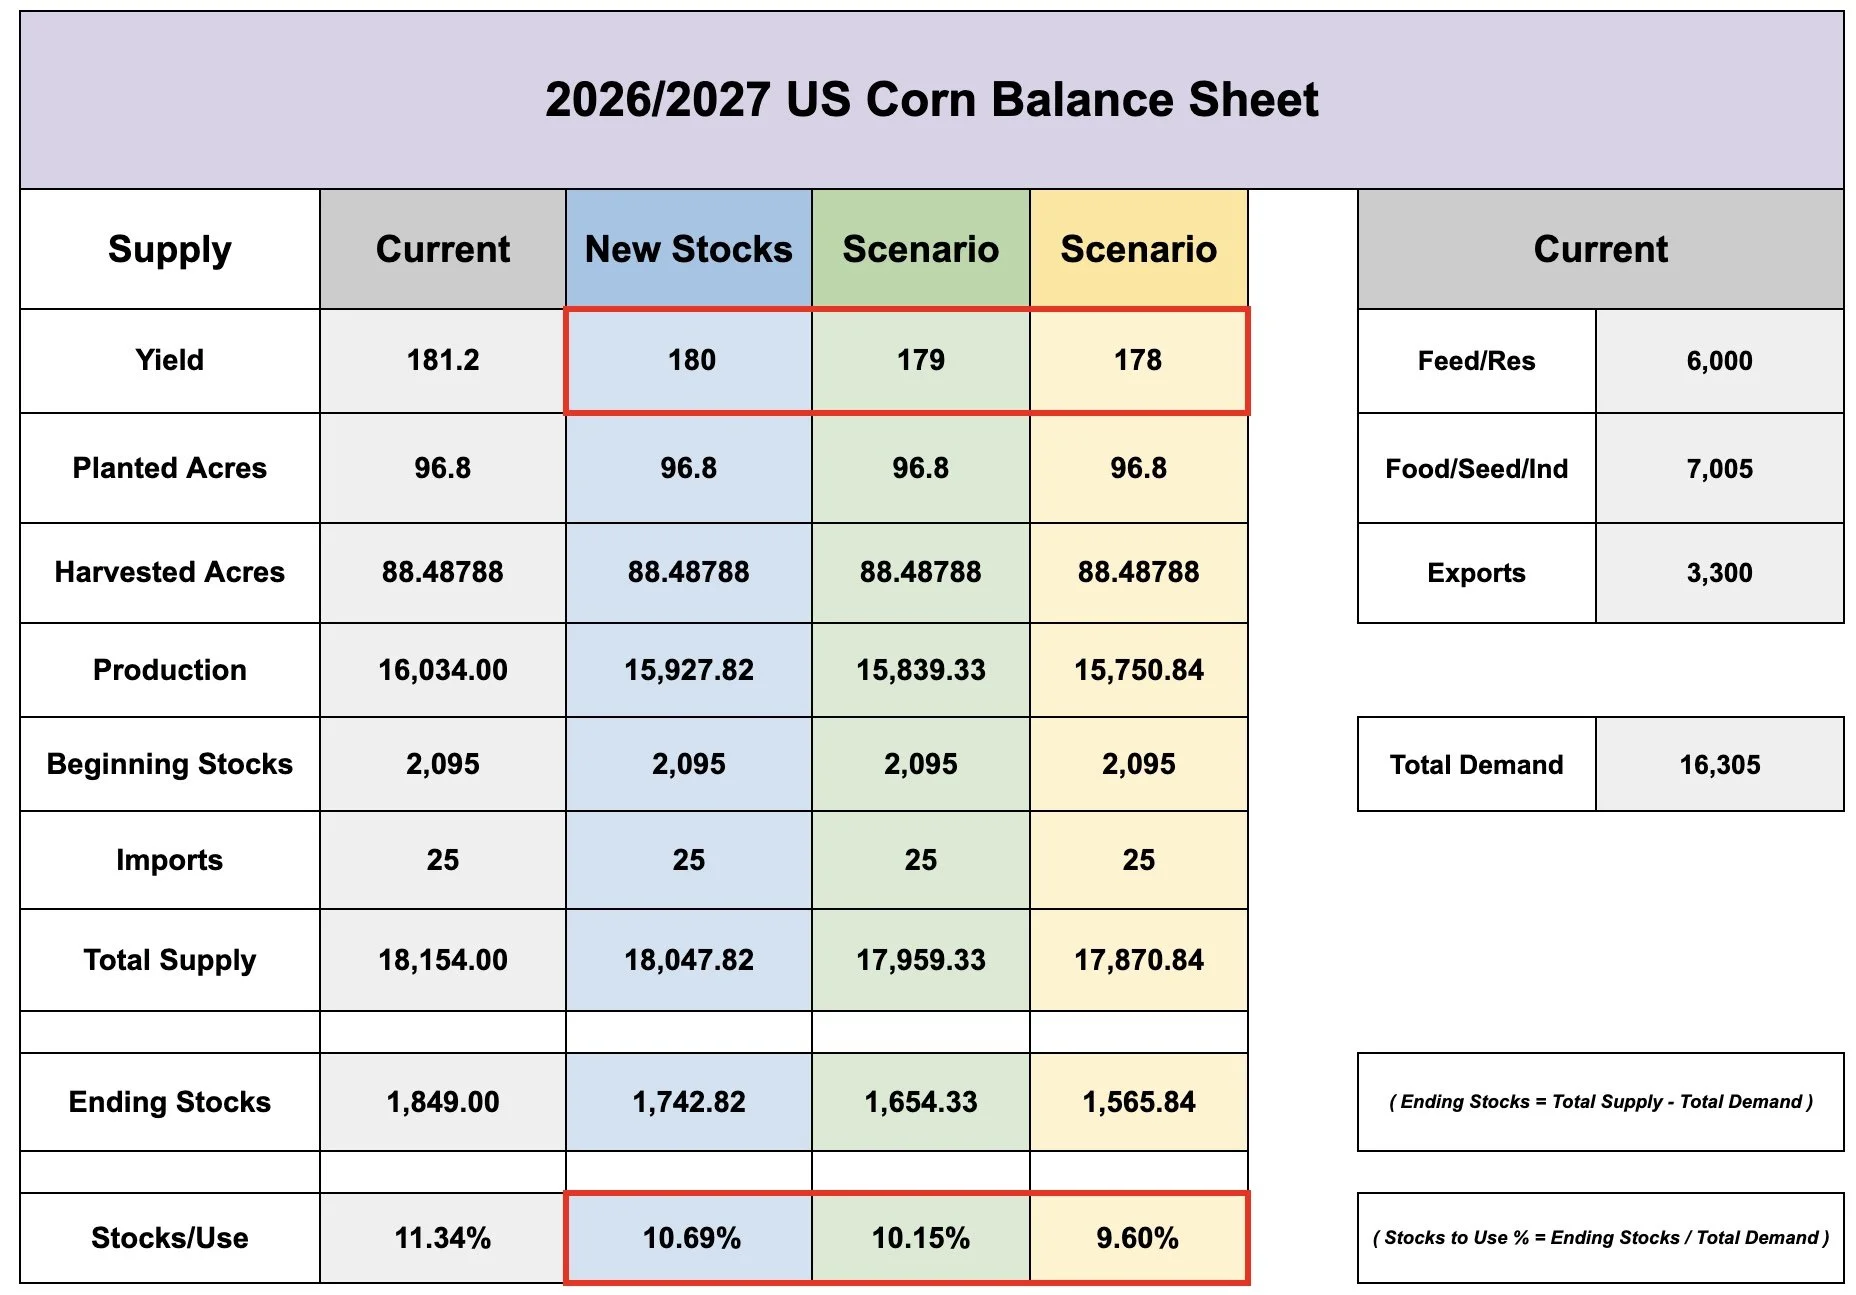
The USDA changed the balance sheet from a 9.7% to 11.3% stocks to use in the span of just two weeks.
Taking us from the most tight situation since 2022, to not so tight at all just like that.
So what would it take to get that back below 10%?
If you dropped yield down to 179 bpa, that gives you about a 10% S/U before touching demand.
A 178 yield drops it back below 10%.
So a "bullish" balance sheet is still not impossible from here. As I think there is a good chance yield ends up closer to 178 than the current 181.
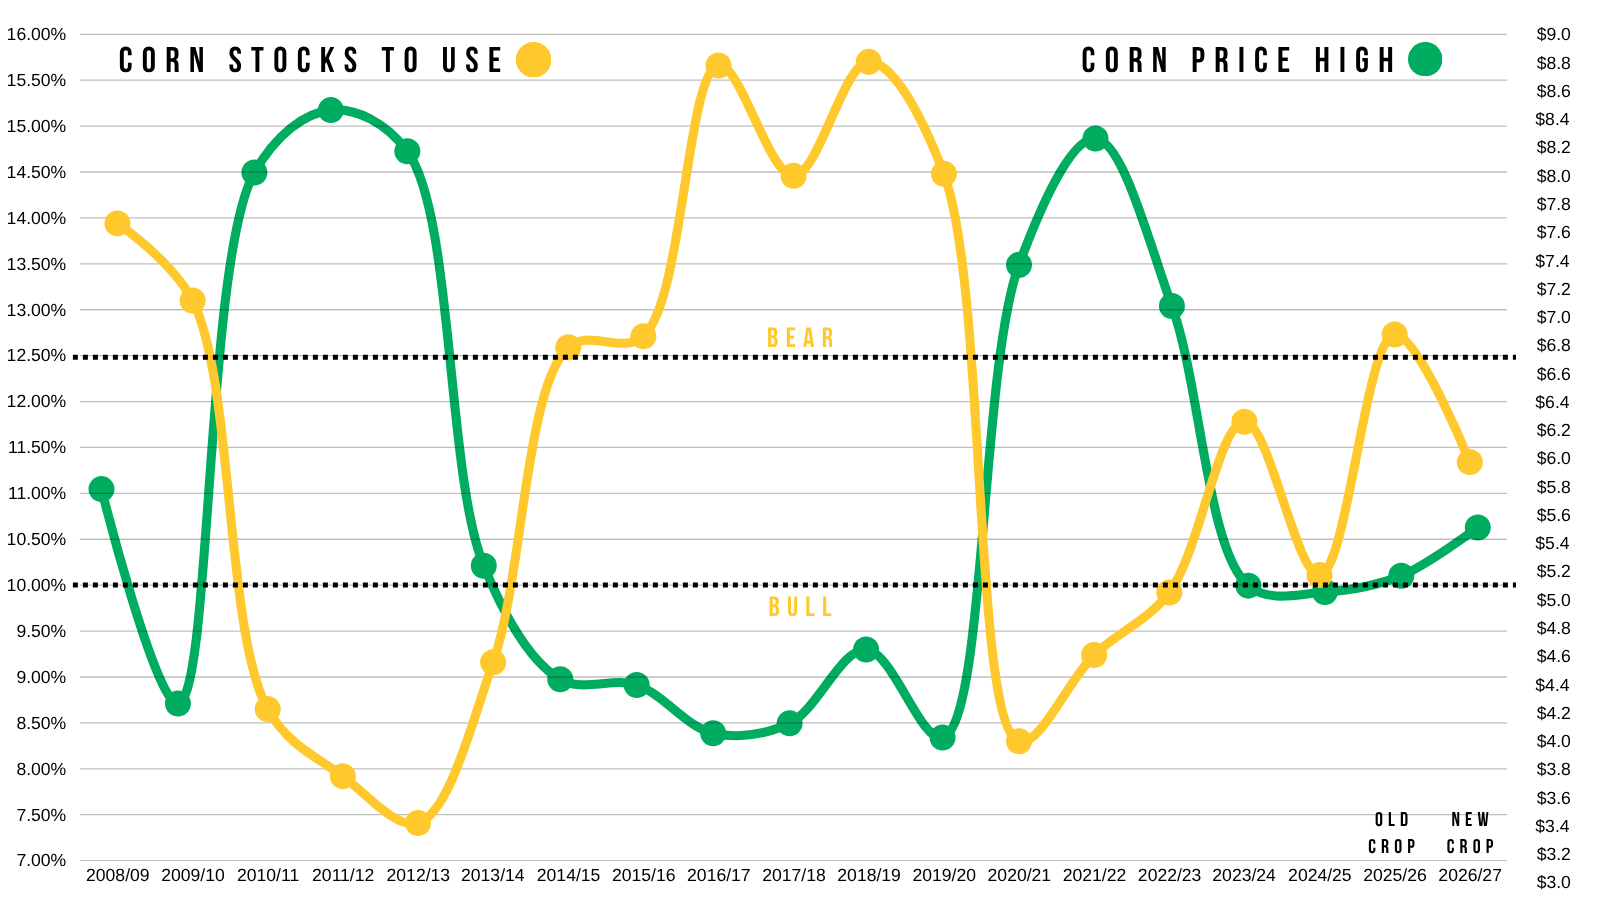
If we want to see corn back much above $5.00 and to stay there, we will likely need to see that S/U fall back below 10%.
If the S/U stayed where it is today, it would not imply +$5.00 corn.
So we are going to need to see this balance sheet tighten back up to justify corn staying back above $5.00
If yield truly is not there, there is always the chance the USDA doesn’t acknowledge it until January.
Which we've seen before.
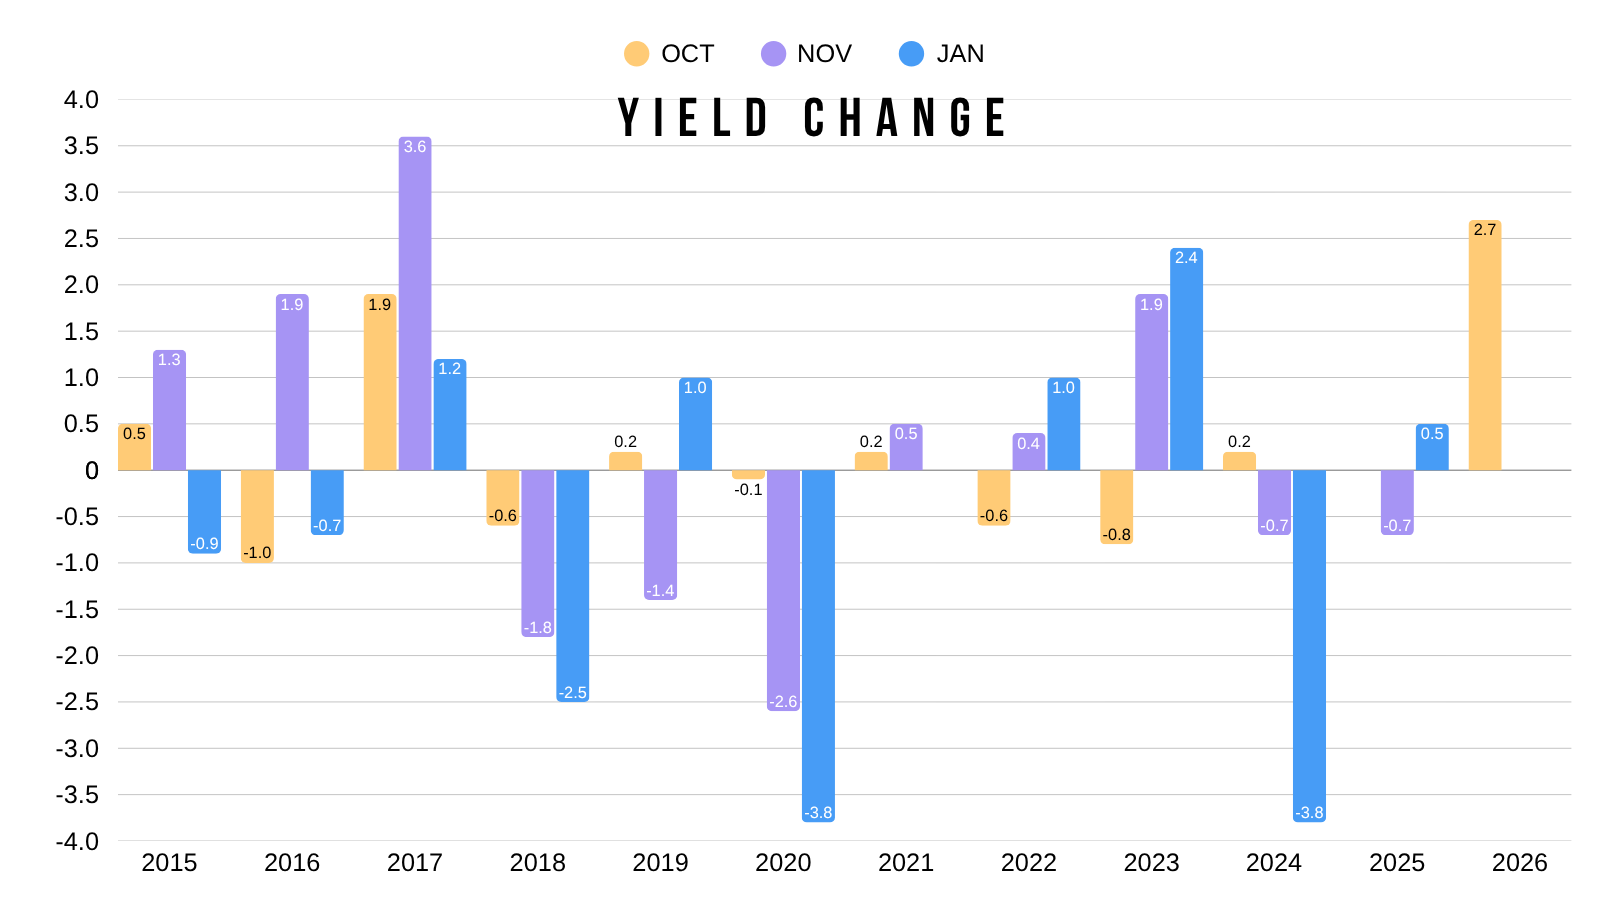
Below is a chart that shows the last 10 yield changes for Oct, Nov, and Jan.
Here is some tidbits:
1. For starters, as you probably know, this October yield raise was the largest ever.
2. October to January yield on average changes 2.8 bpa. Only 5 of the last 10 years landed within 2 bpa of each other. (So seeing a 178 to 179 yield would not be historically rare at all).
3. Both the November and January report on average see a +/- 1.5 bpa change.
4. 3 of the 4 largest cuts came in the January report.
Inflation:
This story seems to have lost attention.
But CPI and PPI data just came in hotter than expected. So inflation hasn’t necessarily gone anywhere.
It's not bad enough to cause grains to be an inflation hedge yet.
But it's still definitely something that could impact things long term if they aren’t able to cool inflation.
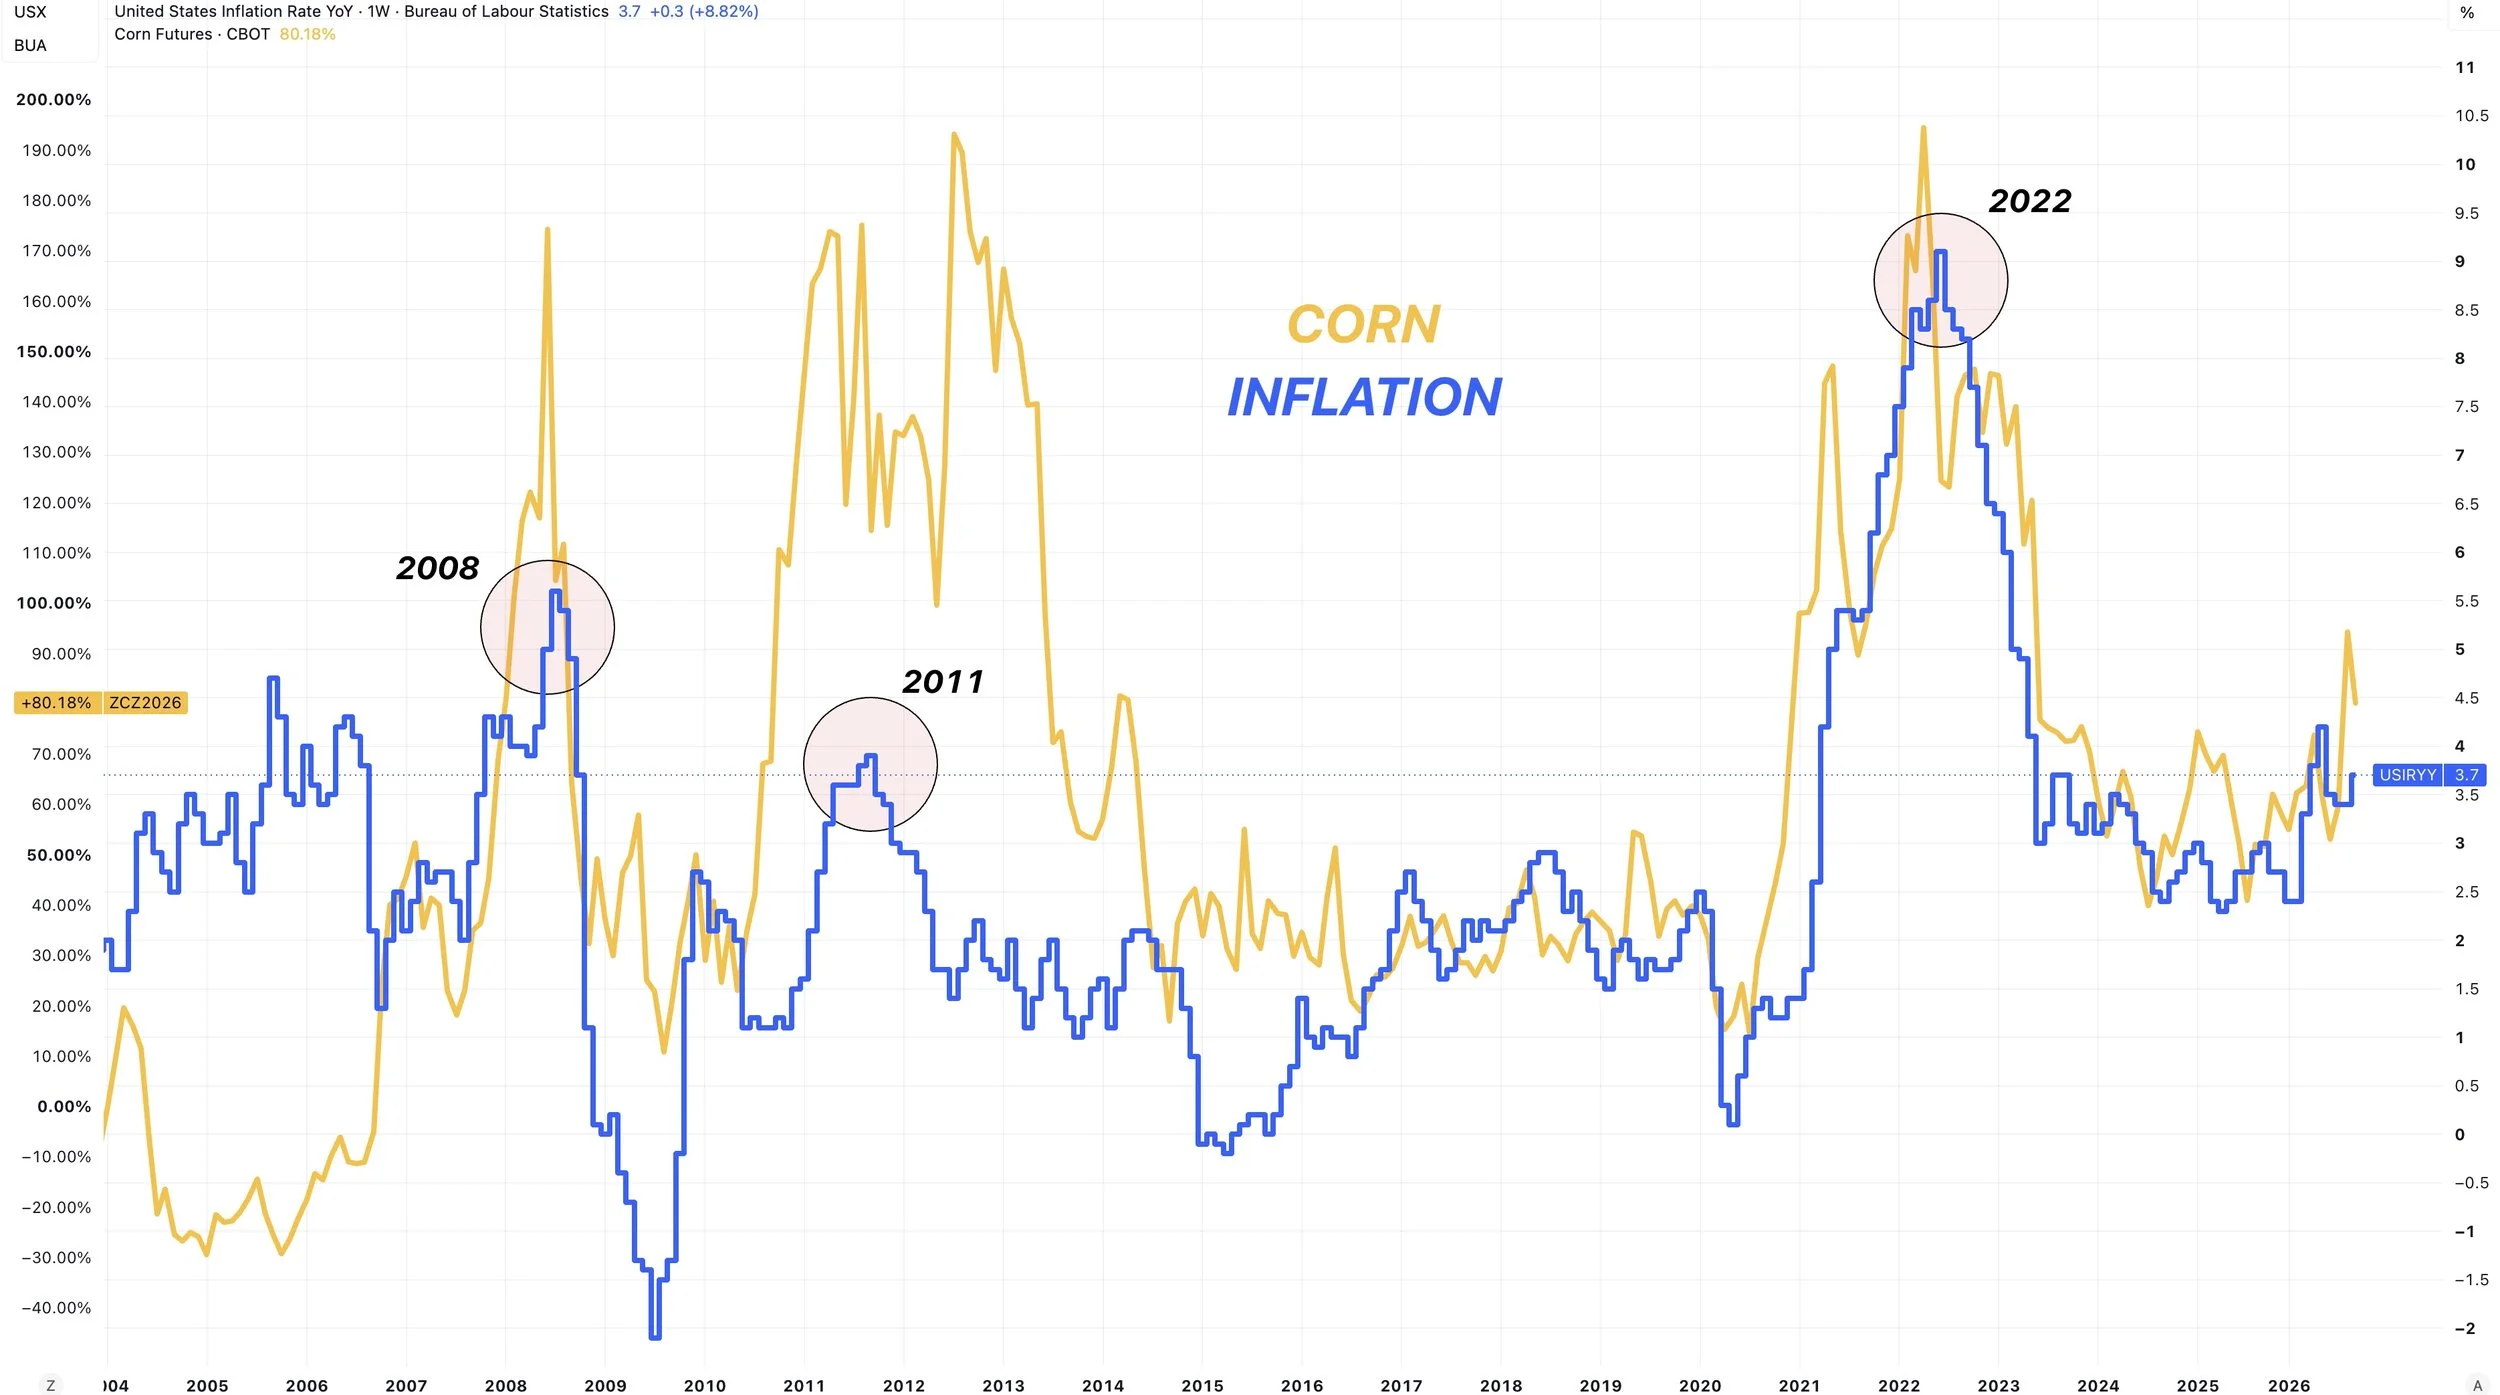
Just for reference, here is corn vs inflation rates.
The one common theme with a bull market is sticky inflation.
Bottom line, it might feel like it right now, but I don’t think the corn story is "dead". Although yes, the USDA did just make it a lot harder to paint a bullish picture.
I think yield tightens up from here.
Some are concerned about demand, but we clearly are not yet at prices that are going to justify us losing any of that record demand.
The last month has been brutal, but I still think corn has potential heading into next year. That potential just might not unfold as fast as any of us want it to. Short term it is hard to overly bullish until the market gives us a reason to be.
Call Options vs Storage:
Should you store corn or re-own it with a call option?
Let's run through the numbers.
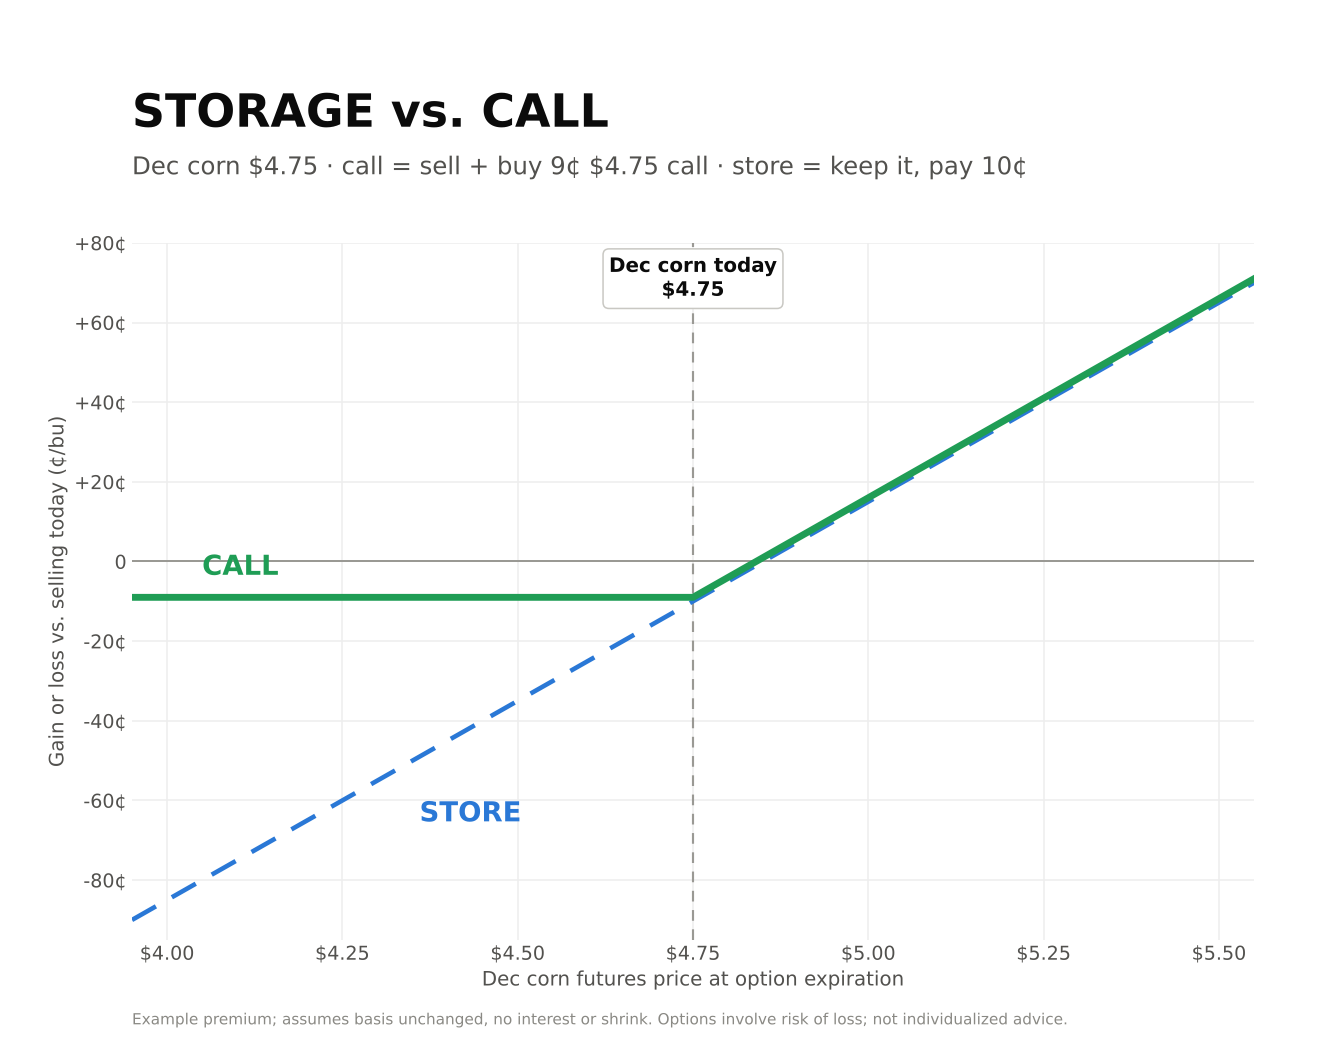
Let's say you are paying 4-5 cent a month for storage.
You could buy an ATM Dec corn call for around 9 cents. Which would be 2 months worth of storage costs.
A March call would be around 20 cents or 4 months of storage is you're paying 5 cents a month.
What would the benefit be of selling corn and re-owning with a call?
If your basis looks attractive, selling the grain and re-owning with a call elimates downside risk. As the most you can lose would be the cost of the call. At the same time, it keeps your upside open.
So you're basically taking the storage money to buy a call.
If you are borrowing money and paying interest, that would be another expense on top of storage.
If you are paying more like 7-8 cents a month for storage, call options instead might make a lot more sense.
One reason why you may not want sell and re-own with a call would be if you think basis will improve from here.
If you are selling something off the combine, options have became a lot cheaper than they were just a few weeks ago.
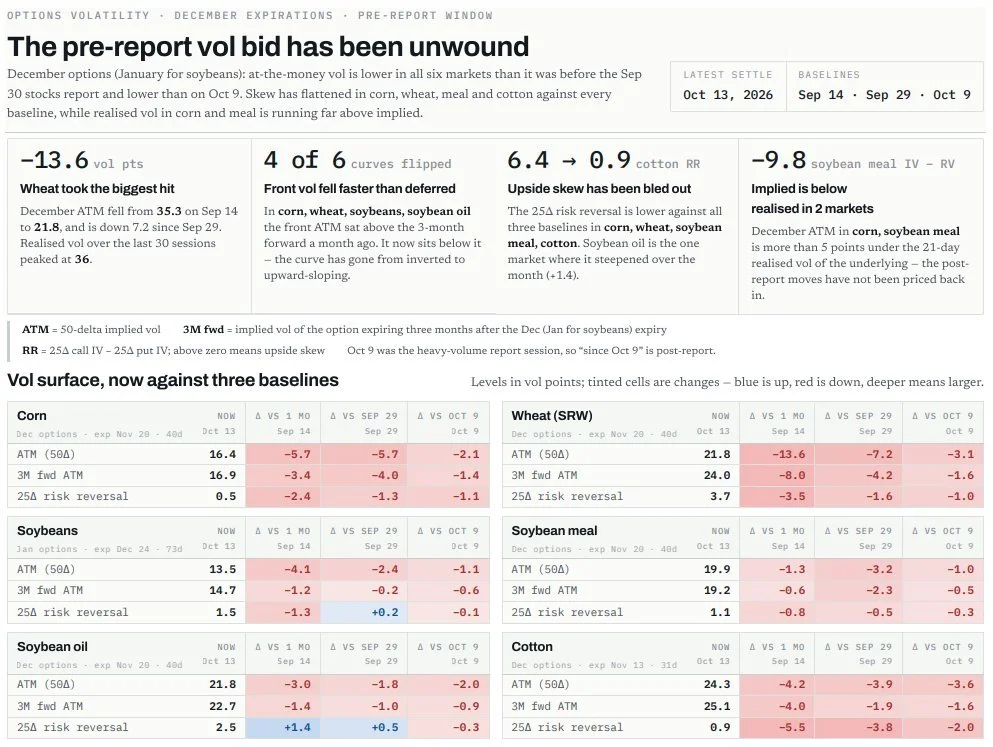
Implied volatility has gotten cheap.
So if you're wondering why you might not want to sell puts as a form of re-ownership anymore, it would be because options have become cheap, when they are cheap it makes more sense to own options than it does to sell them.
Here is a pretty nice graph from NicoAIQ on X.
It shows how options volatility has came down.
Volatility for options is lower than it was before the Sep 30th report for almost everything.
Charts
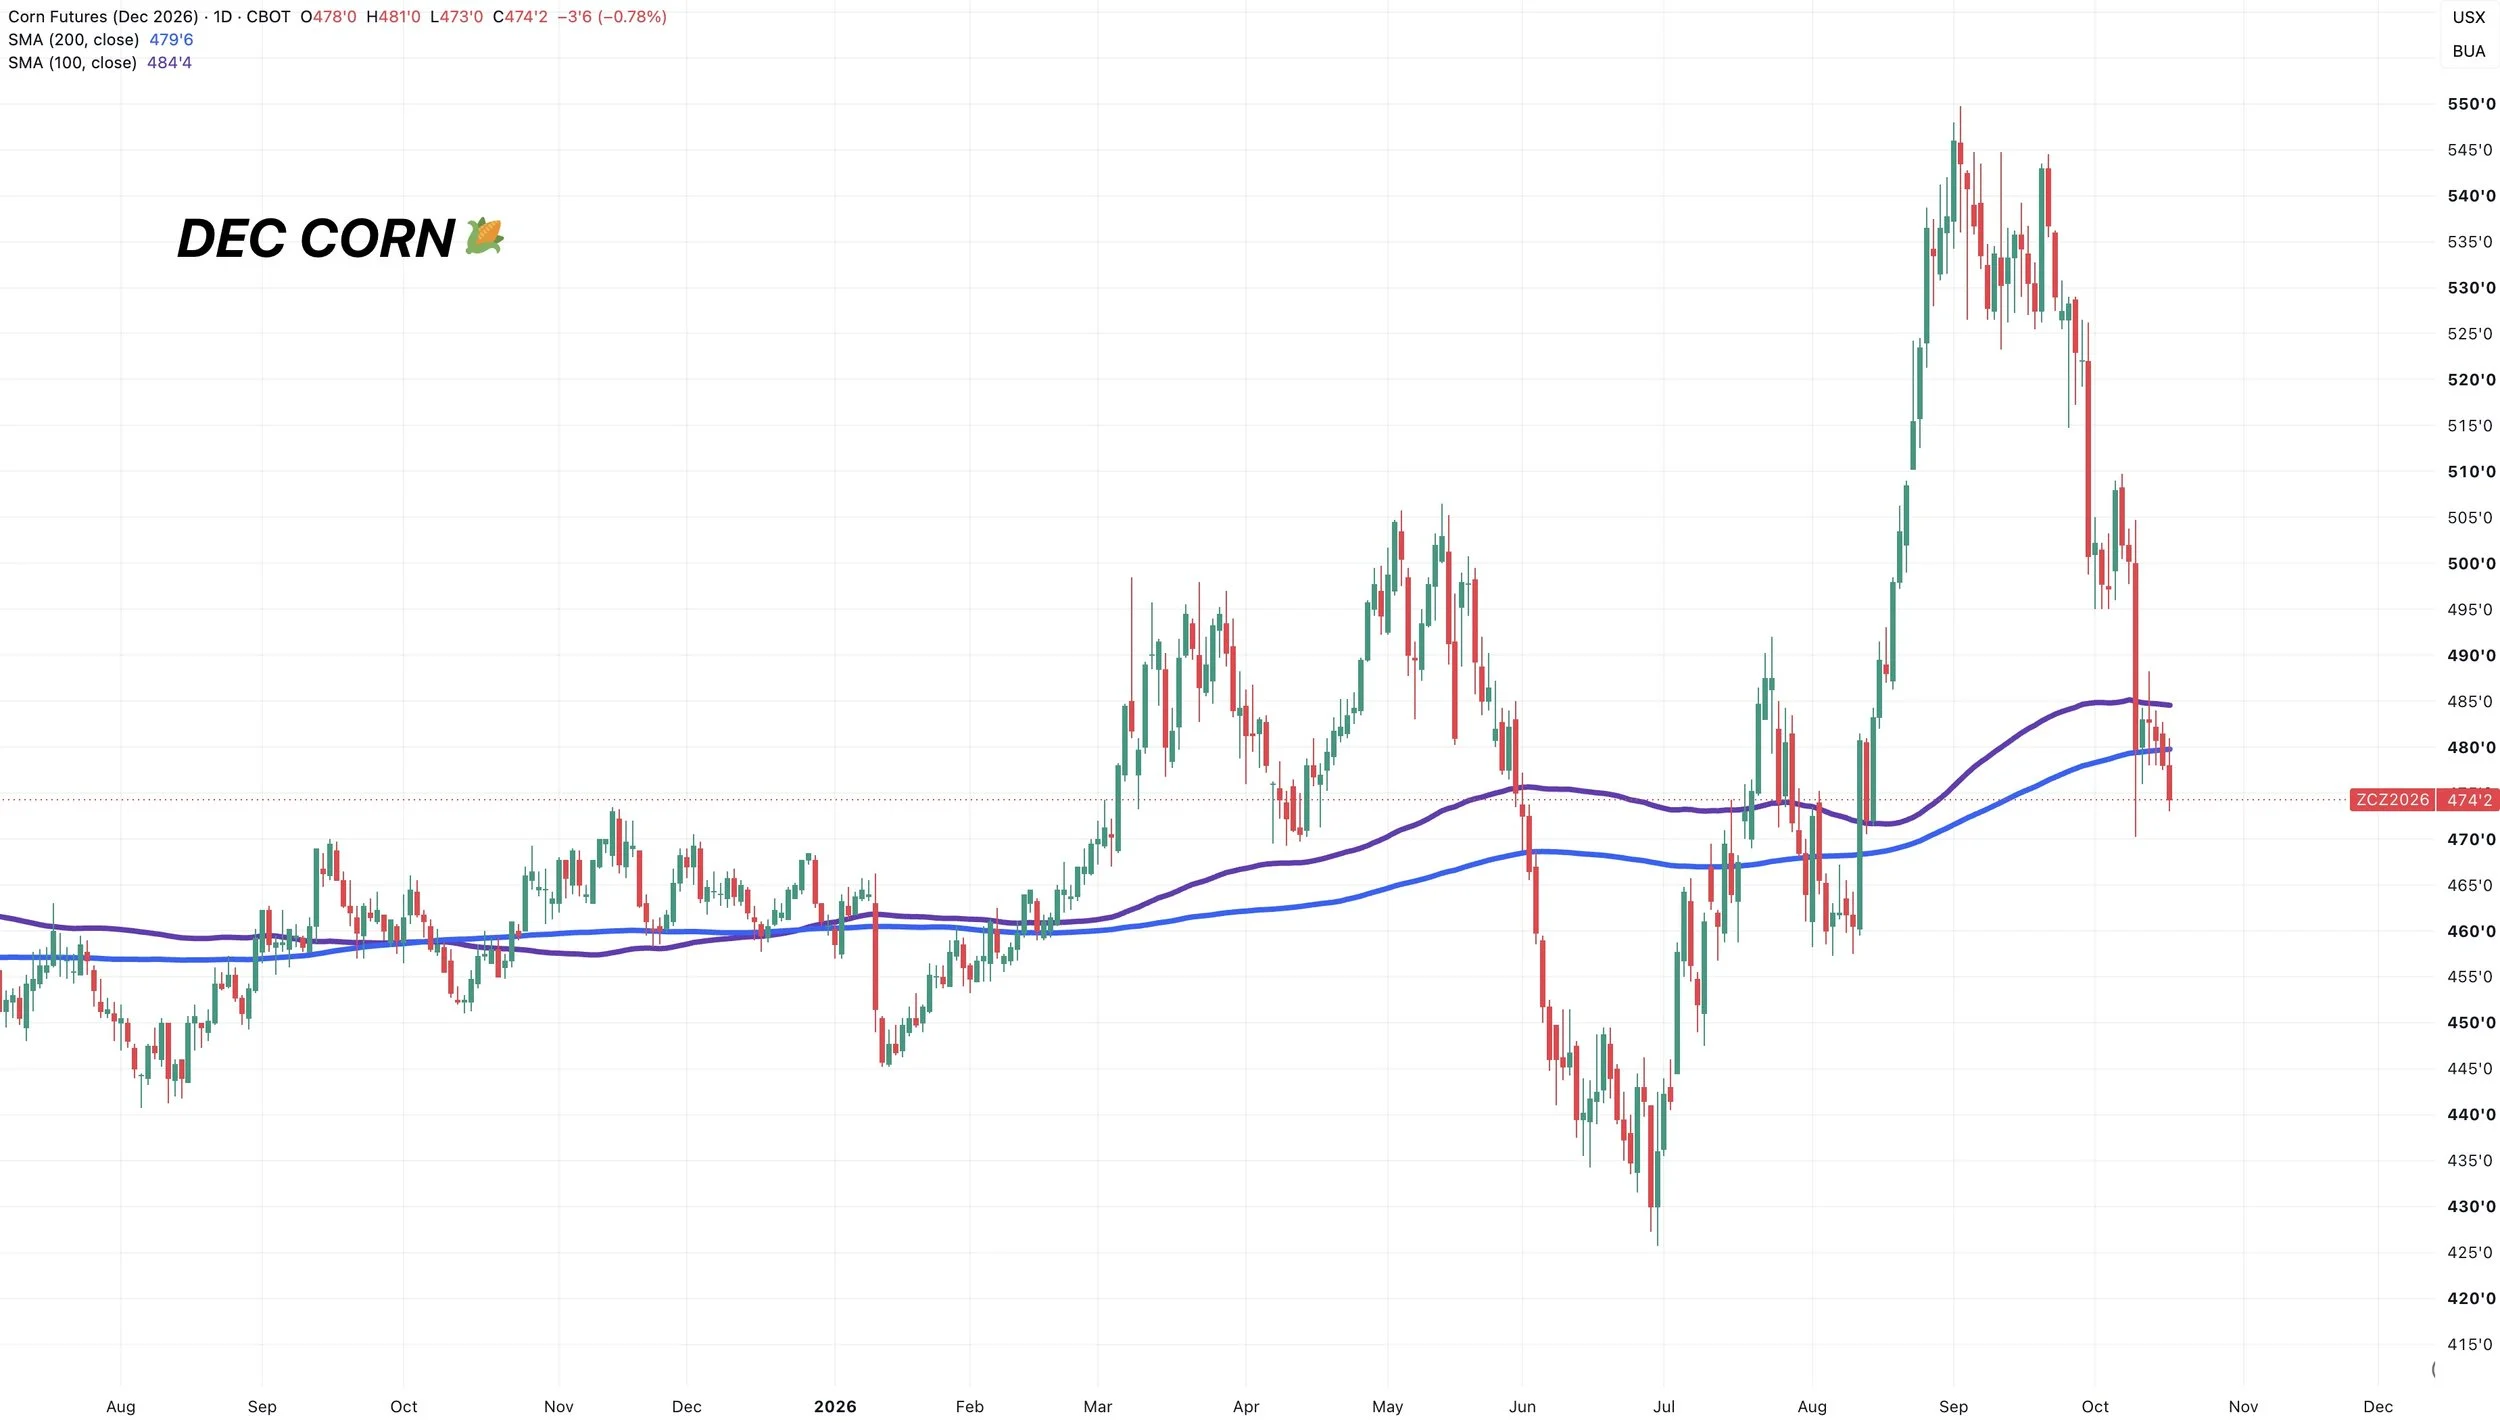
Dec Corn Chart: Fighting to Stay Alive
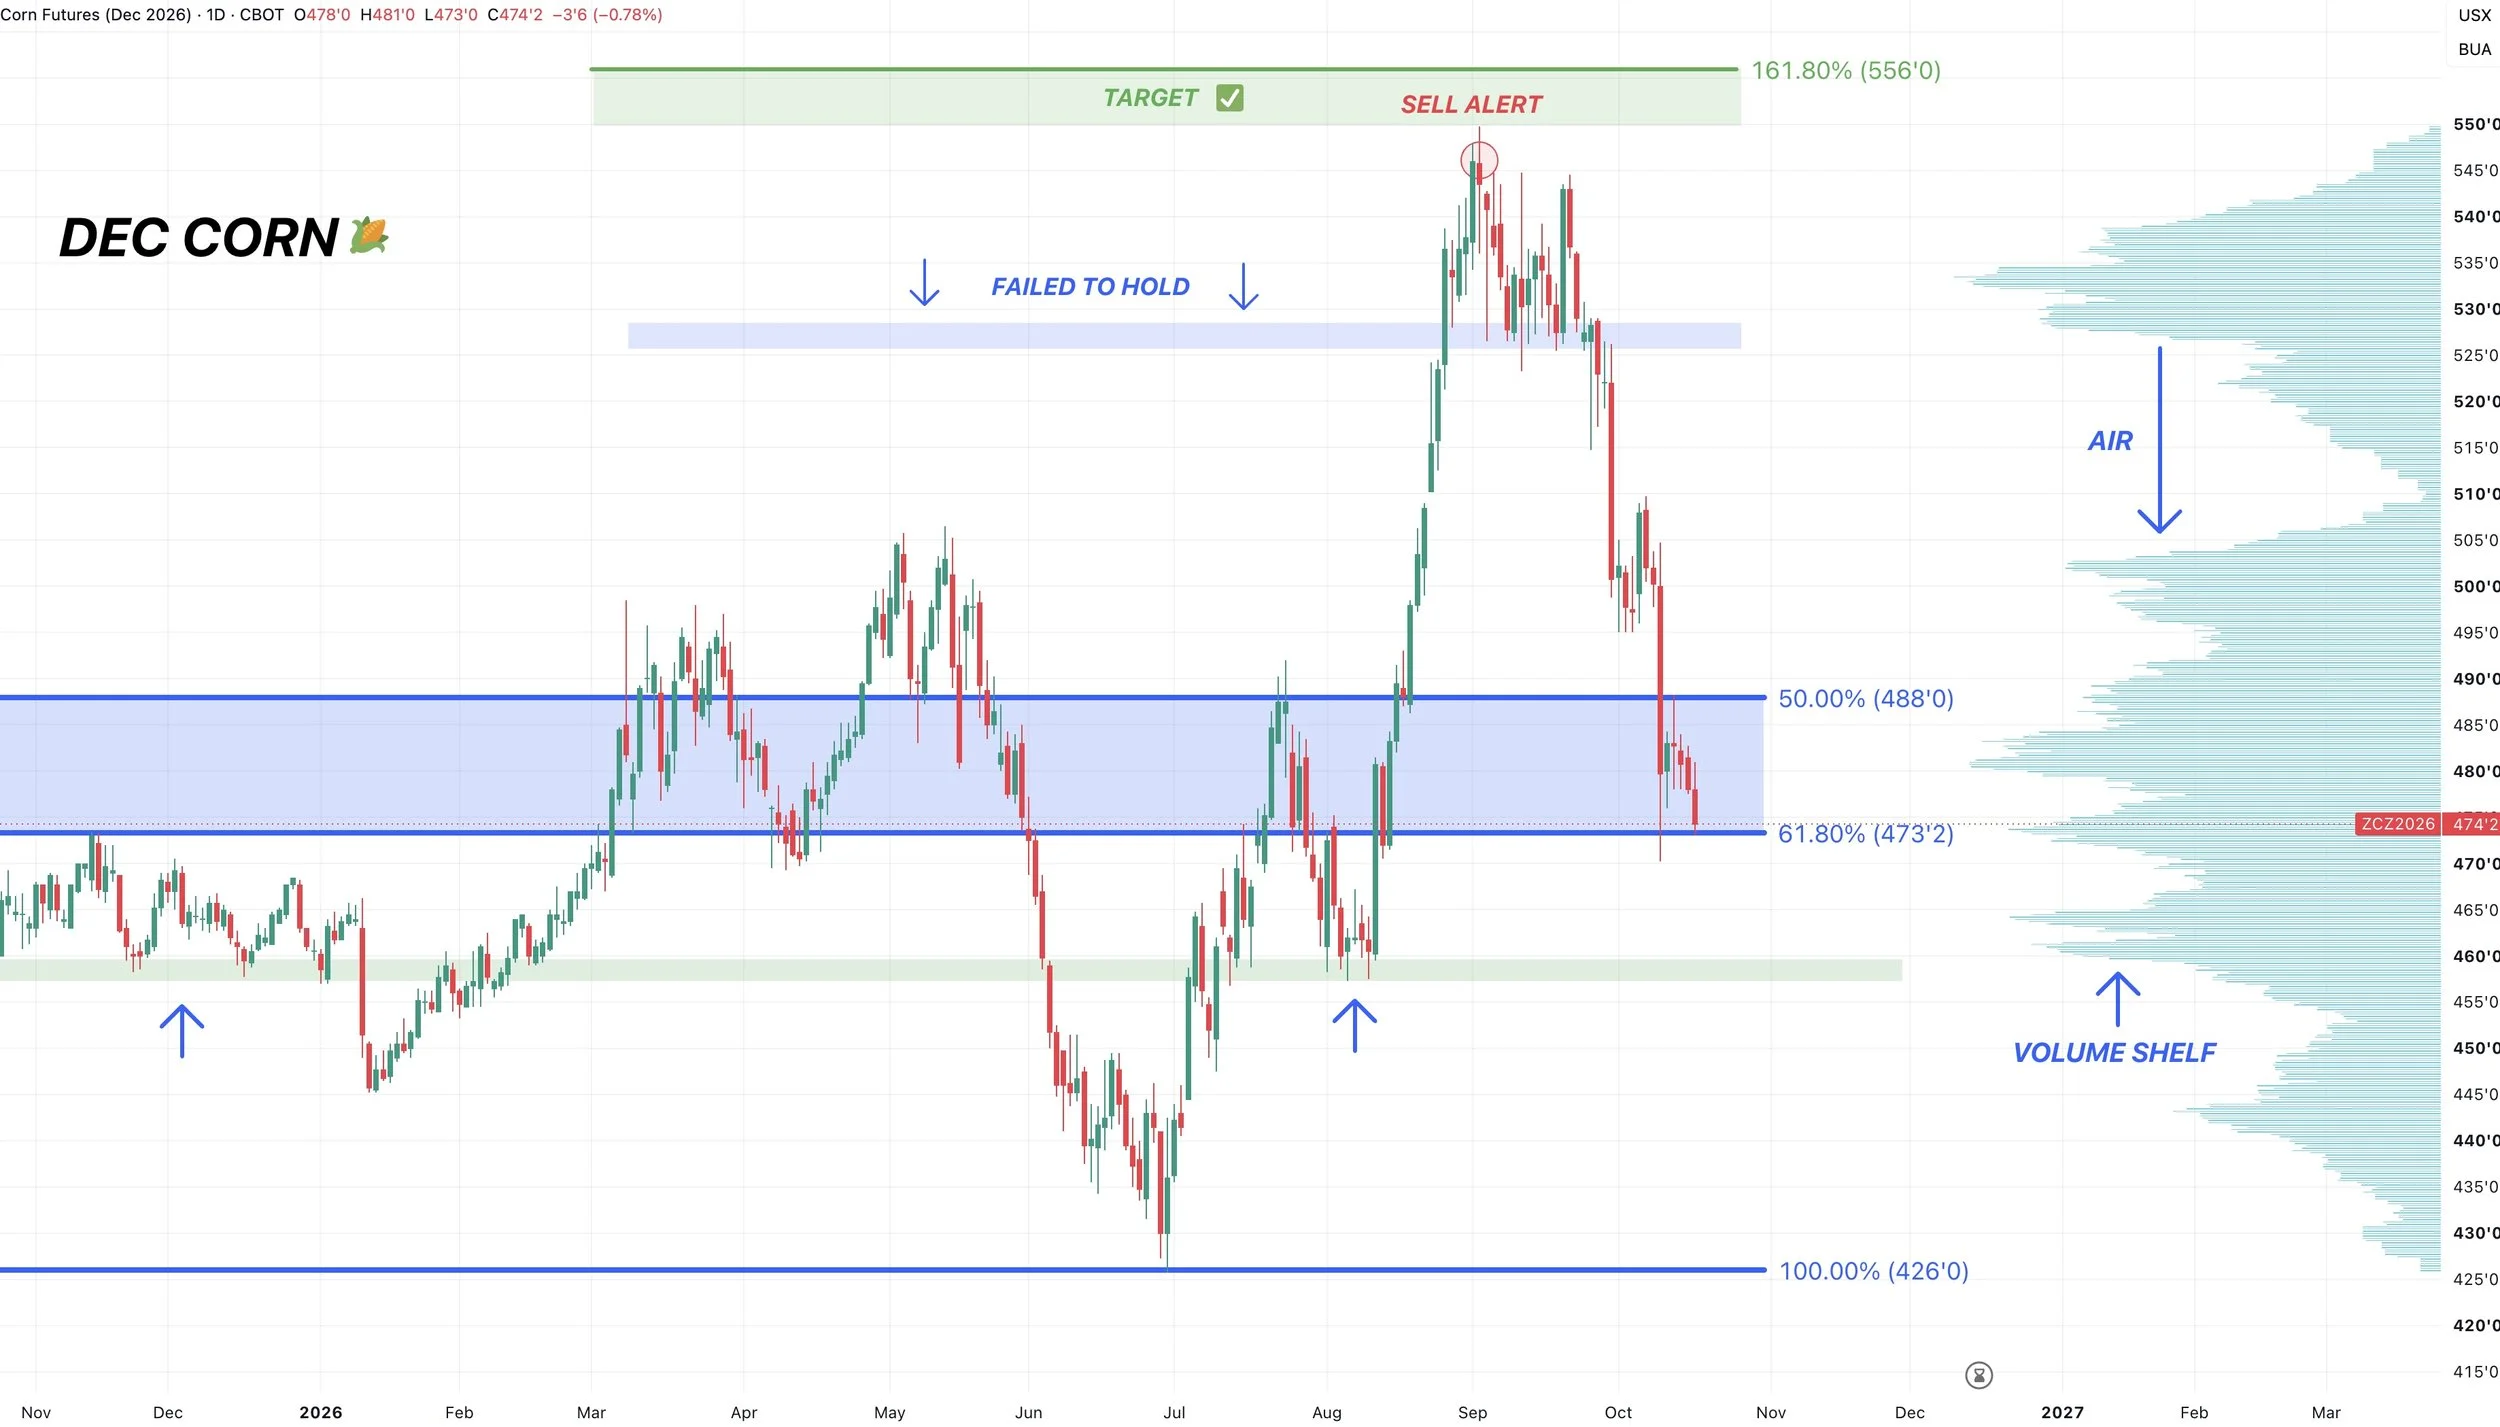
Very disappointing price action the last few days in corn.
We once again tagged the 61.8% level from contract highs down to contract lows. As we are fighting to hold the lows from the USDA report.
I thought there was a good chance we could hold this zone after stabilizing after the report and seeing massive volume, but it's not looking too promising if we fail here.
Bulls would like to bounce right about now or there is another 15-20 cents of possible downside from here. We are oversold but still have zero confirmation of a bottom until the chart says otherwise.
If we are unable to hold these lows, the next logical spot to find a bottom would be those August lows.
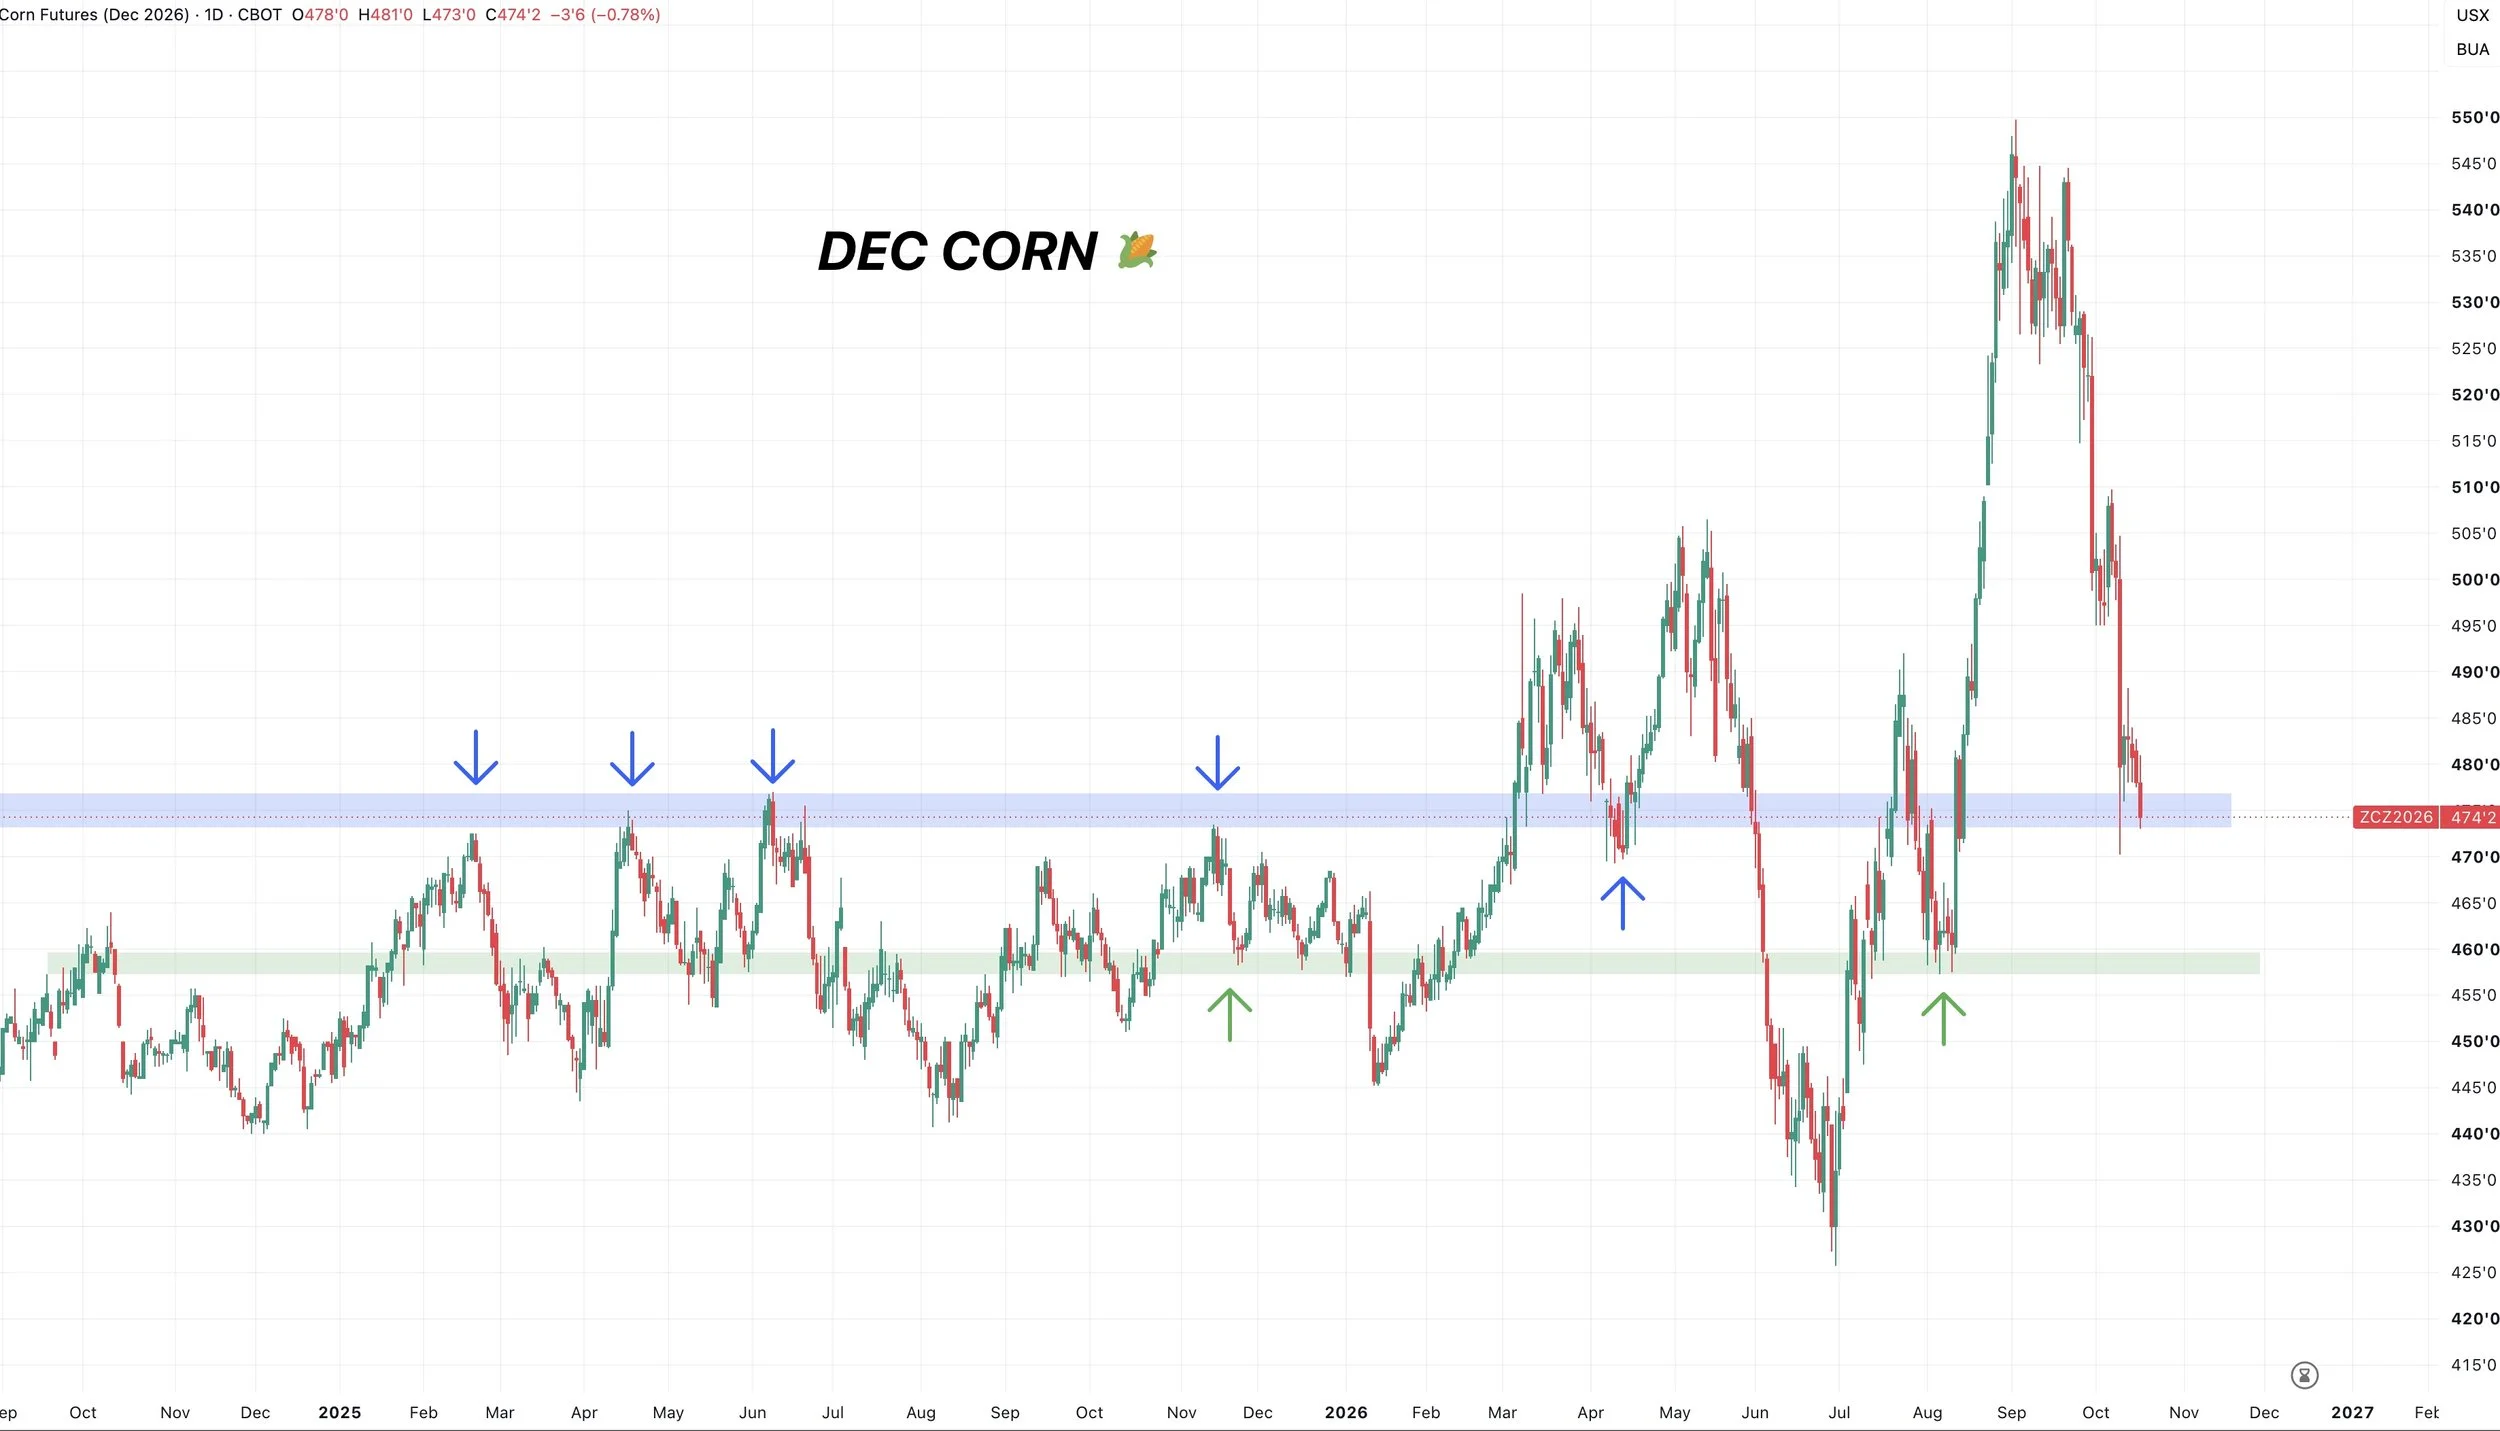
Here is another simple example of why this is a crucial level.
We are at the top of some old key resistance we want to see us turn into a new floor.
If we fail to hold here, it opens the door towards the bottom of the old range.
So we either bounce right now, or we go towards that next level of support.
As once support breaks it opens the door lower.
So that's the biggest thing to watch. If we fail here we likely get one last leg lower.
There were some potential signs of a bottom earlier this week, but so far nothing has confirmed one.
100 & 200-Day MA:
We talked about wanting to hold the 200-day MA earlier this week.
We are now currently below all major moving averages, which is not a great sign as for the funds to have more interest in this market they probably want to see crawl back above those.
RSI:
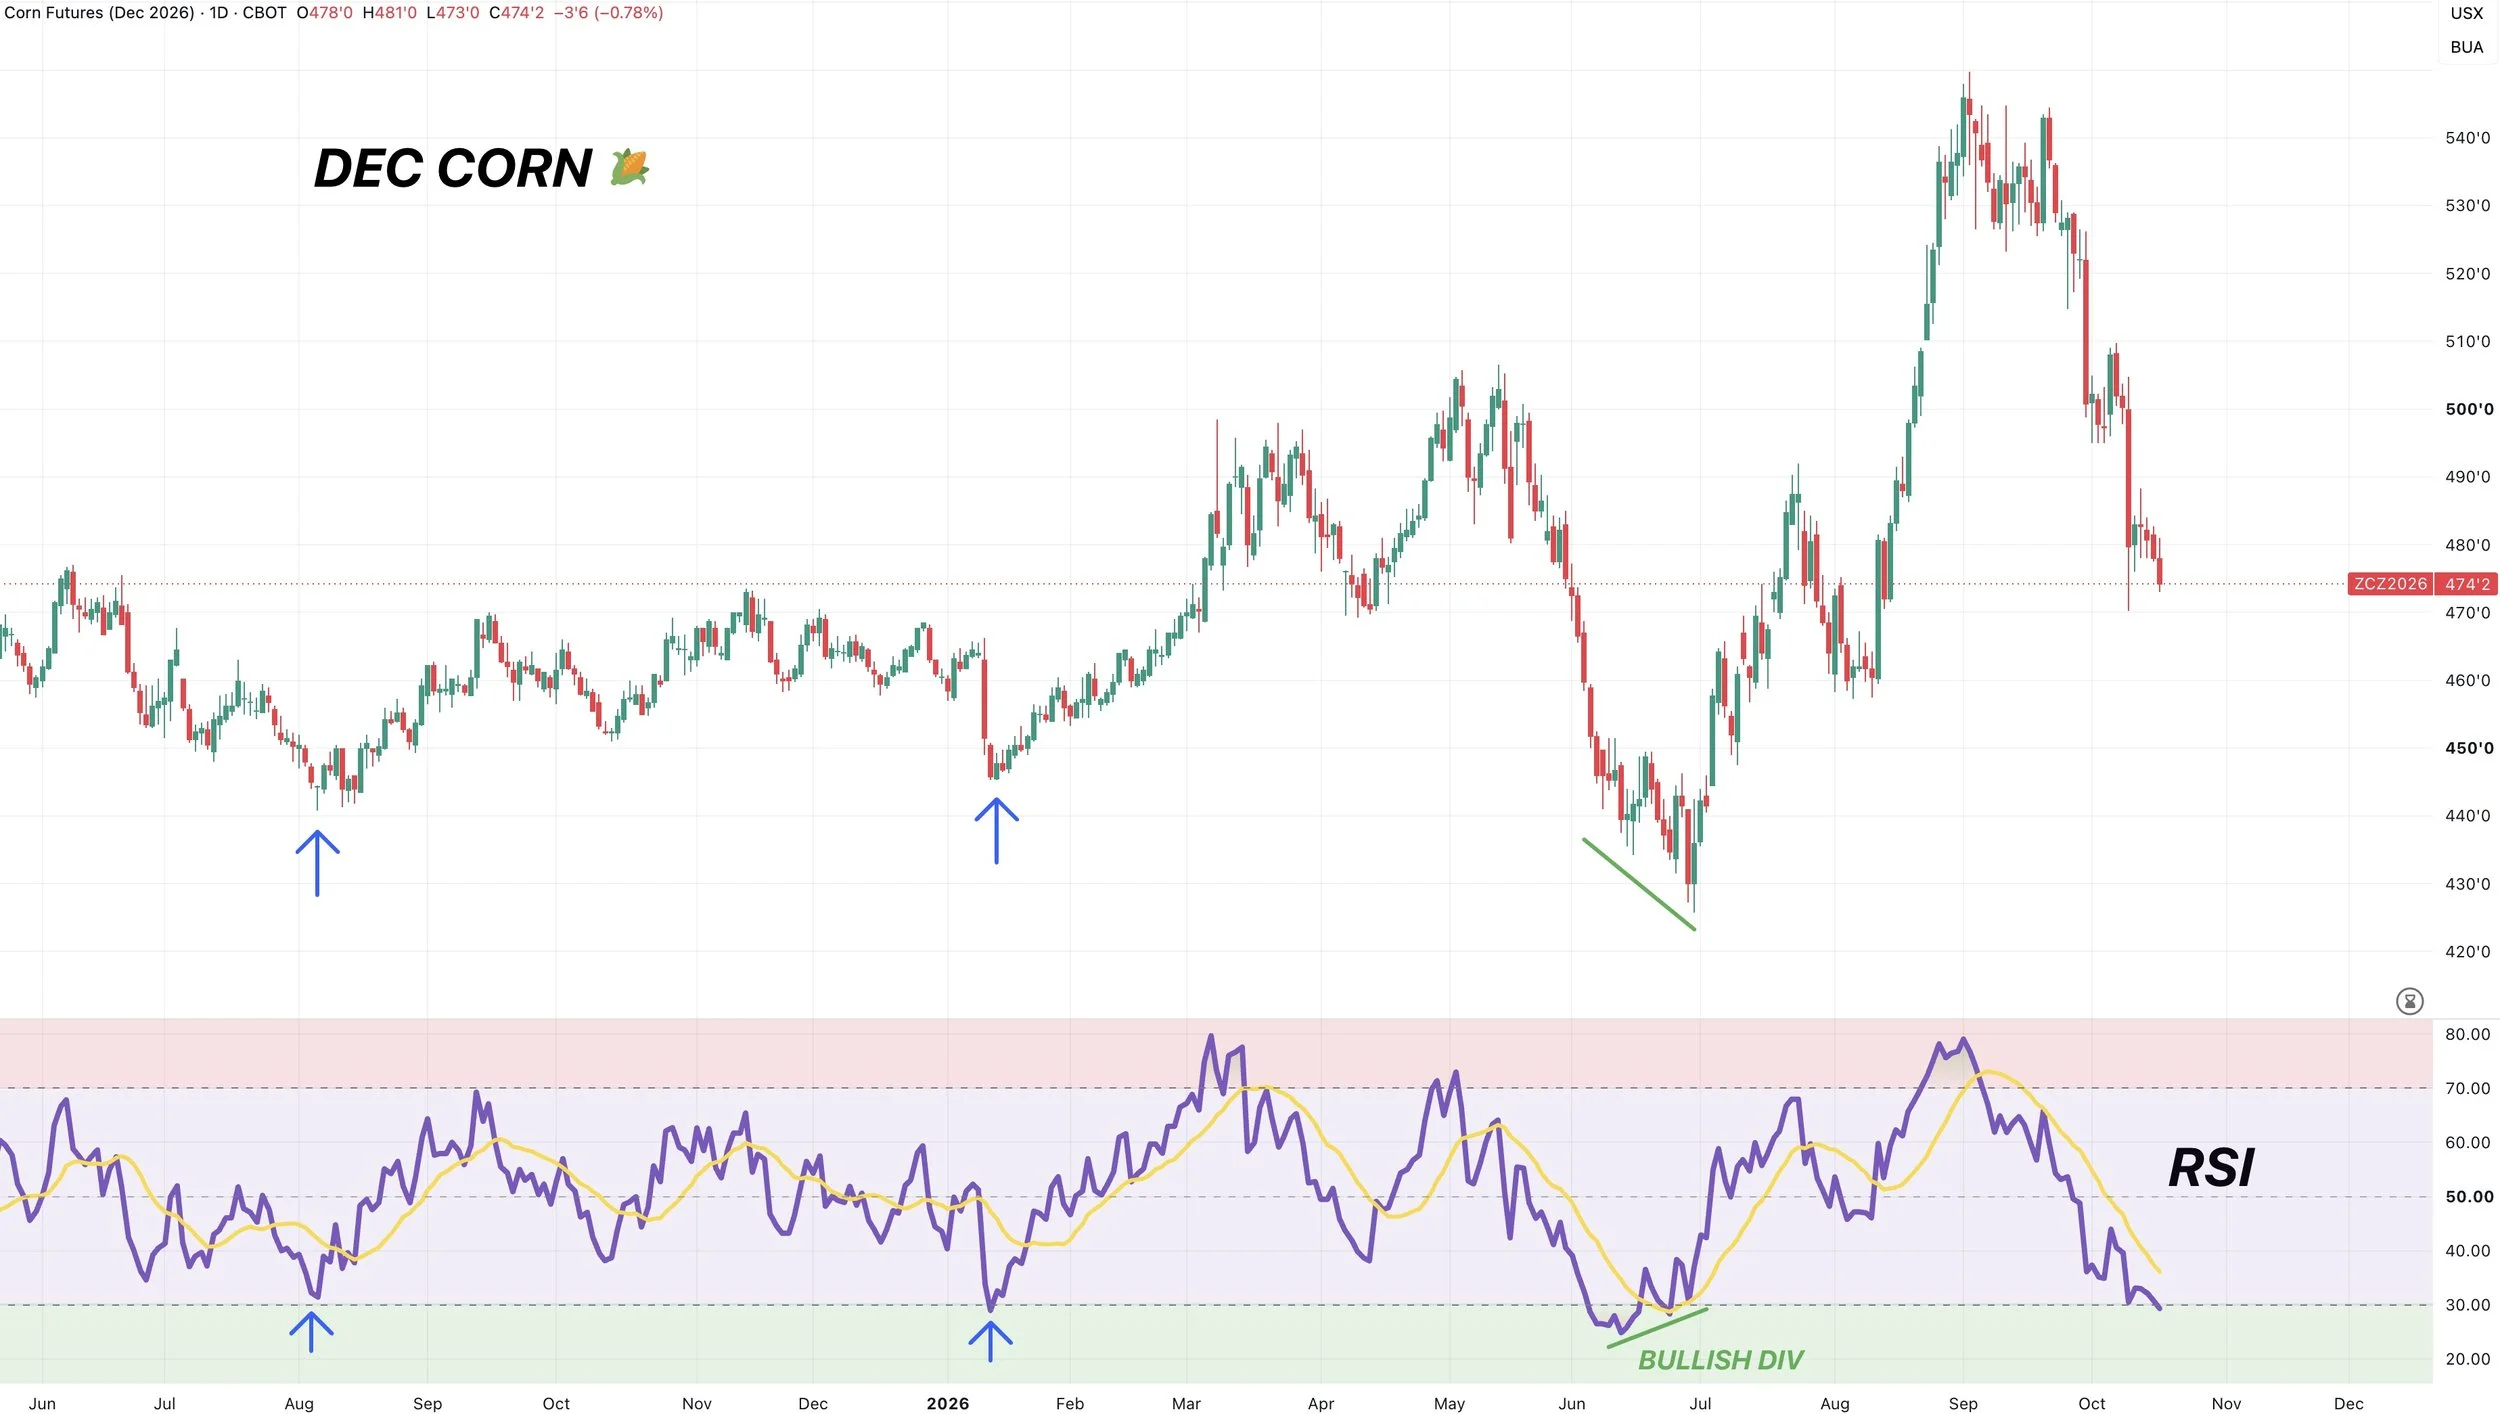
The last few times corn was this oversold, a bottom closely followed.
However, it could be a similar situation to those June lows.
Where we get super oversold, but still get one last leg lower. By doing so we create bullish divergence that gives us some lows.
Soybeans
Fundamentals:
You have projected record crops out of both the US and Brazil.
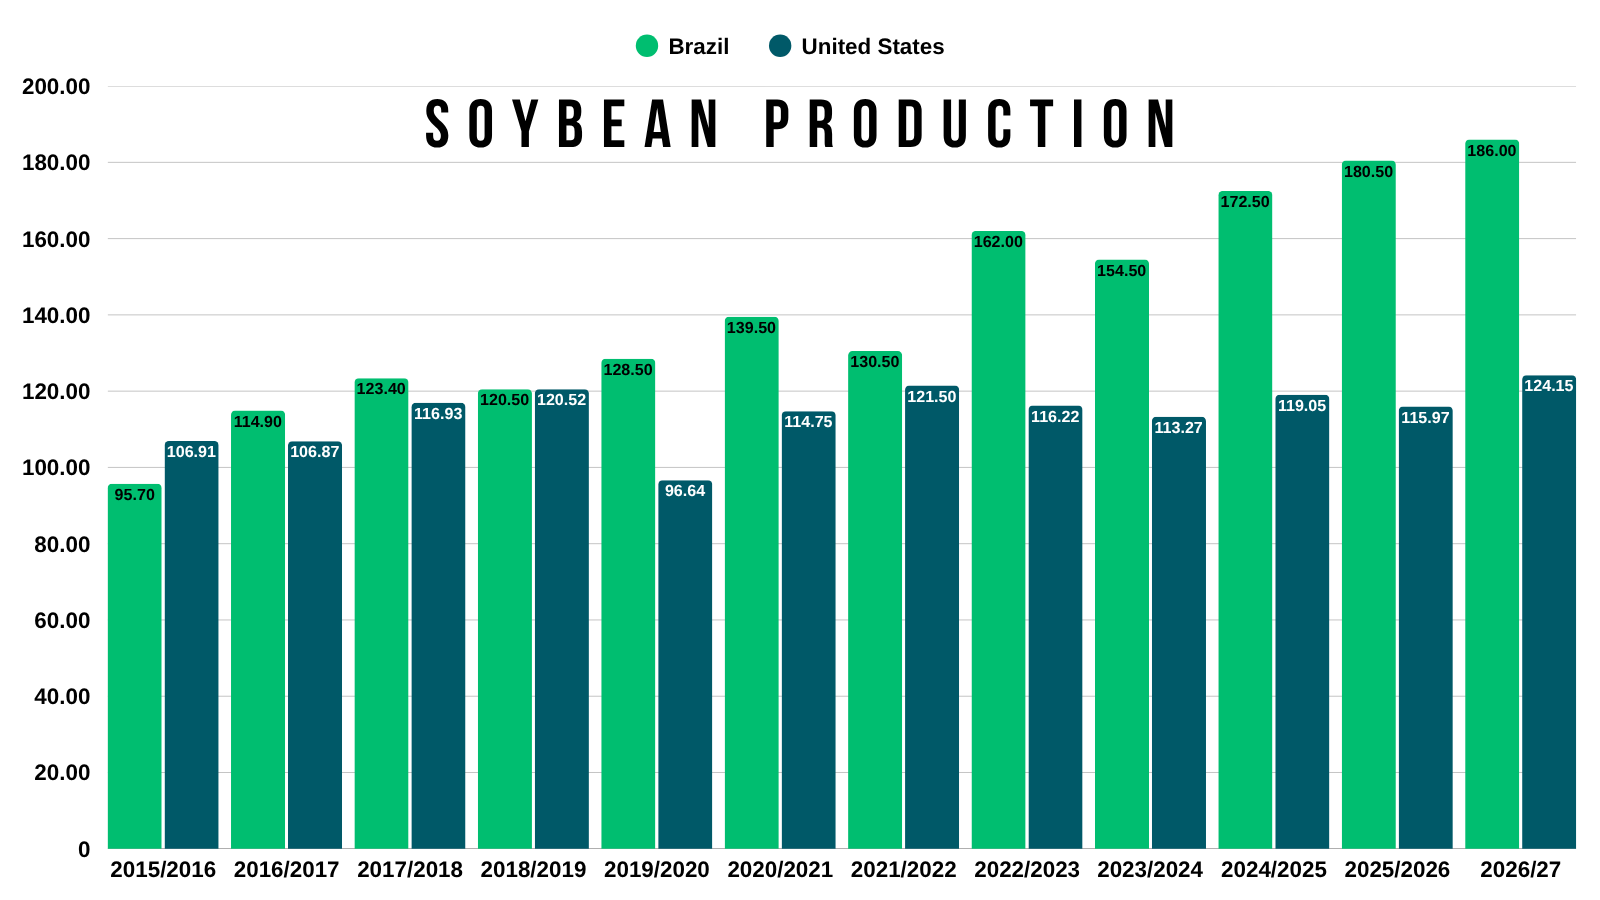
If you look at world carryout, it's sitting up near record highs.
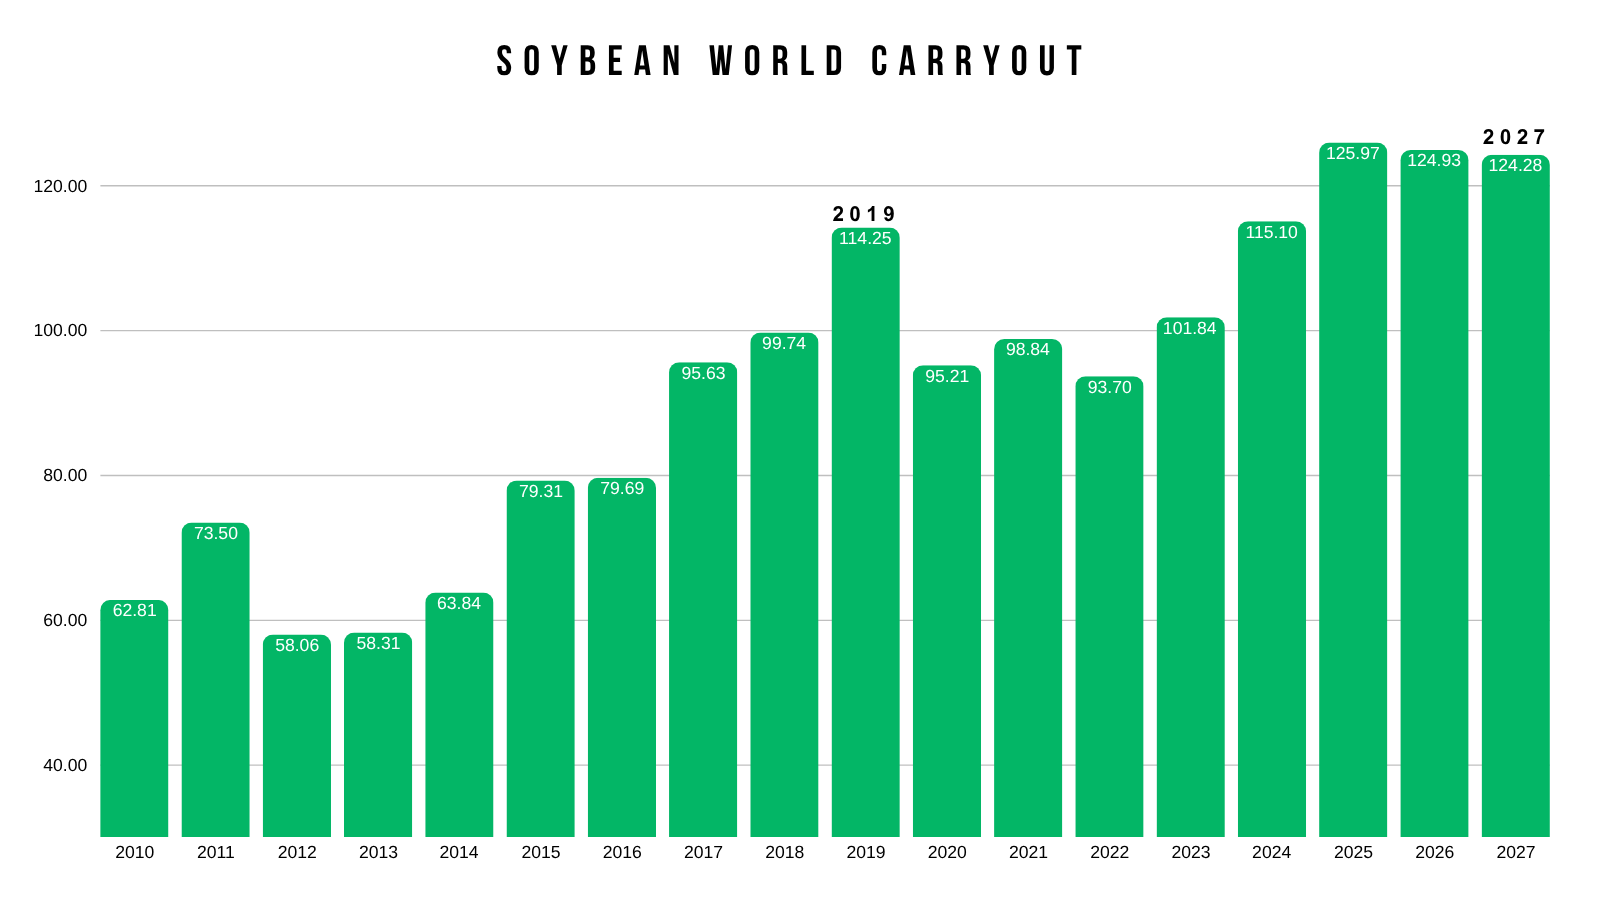
Despite this, the world stocks to use aka the balance sheet is actually getting tighter.
By a sizeable amount.
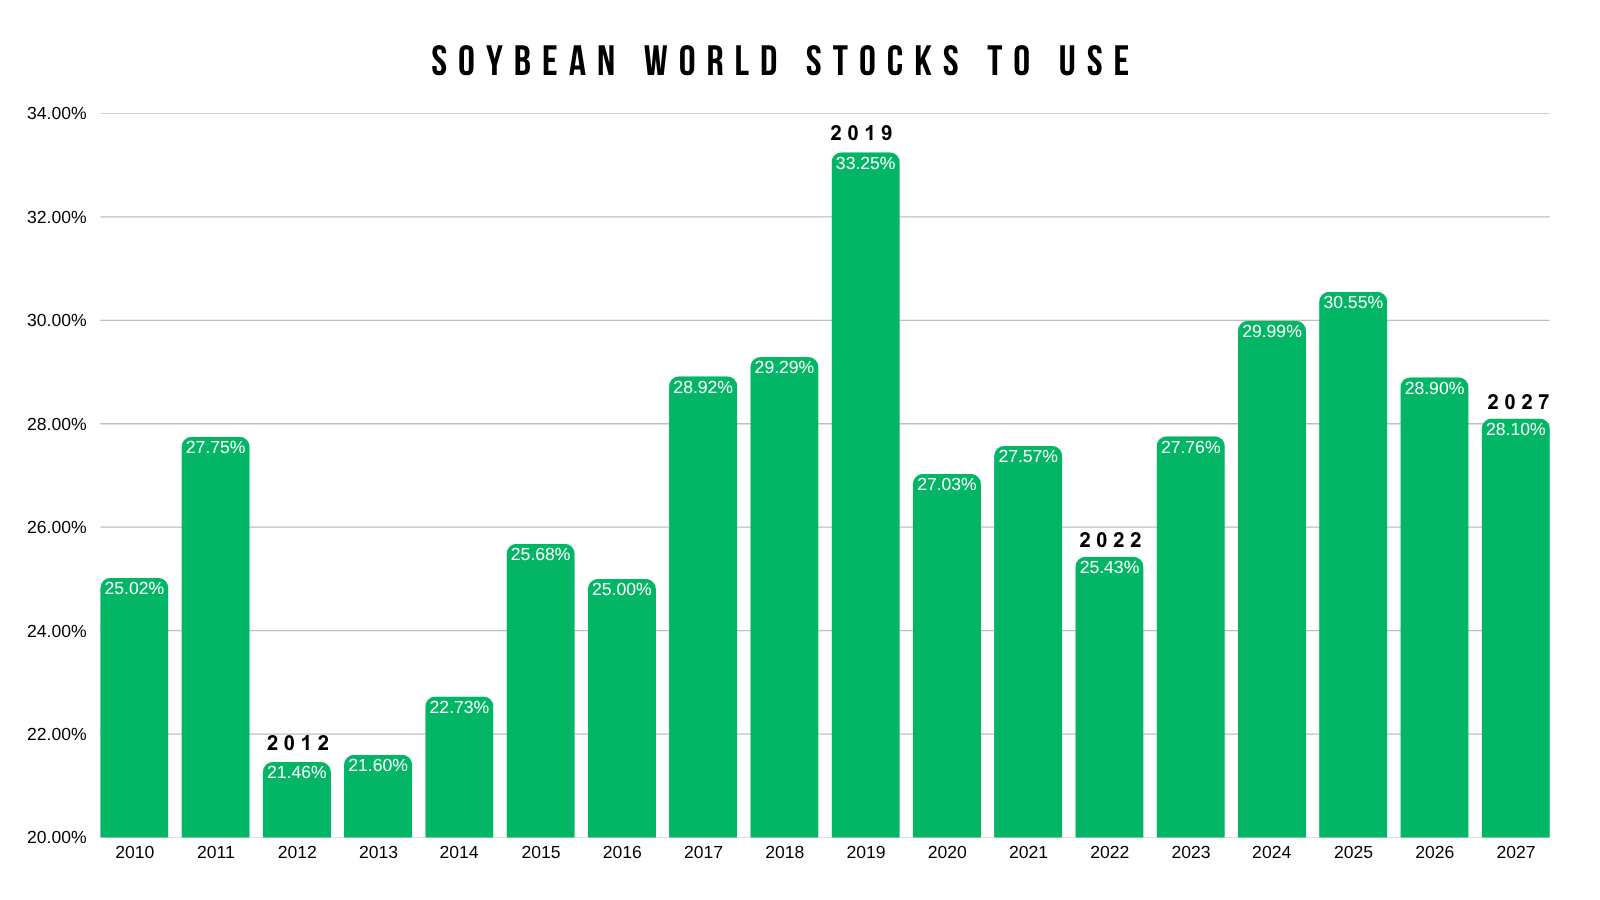
Because demand for soybeans is just that impressive.
Which isn’t bearish.
We have a record Brazil crop.
We have a record US crop.
Yet.. this isn’t enough for the world situation to grow.
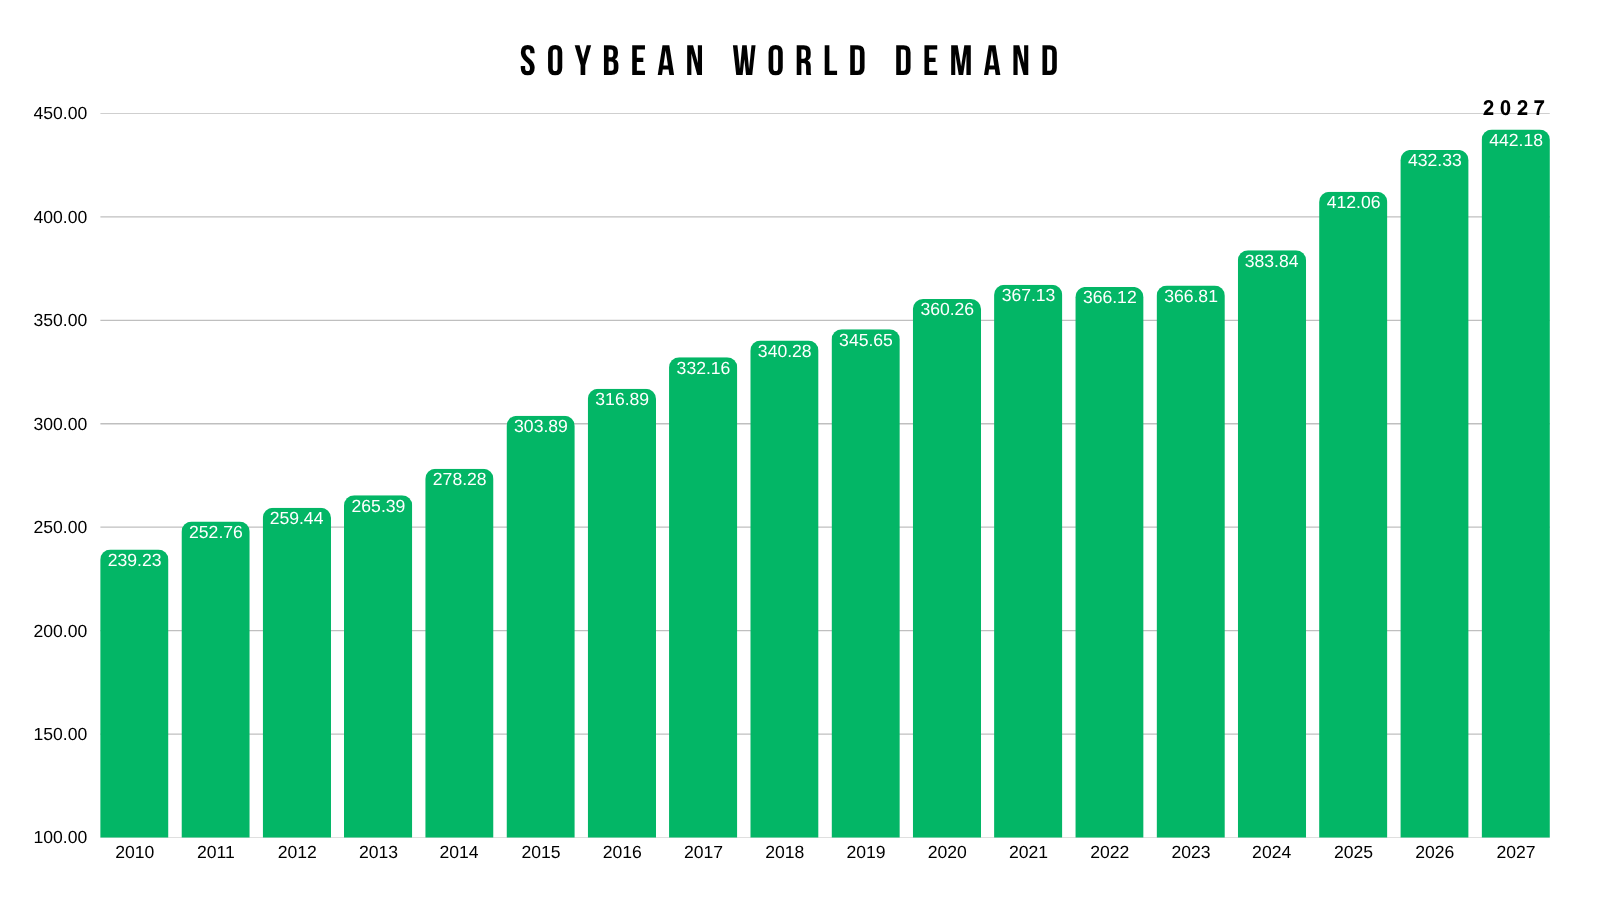
Look at world demand. During the last bull market growth was pretty flat. Now the last few years during the bear market, we created all of this demand and it's ramped right up.
What happens if our supply slows down?
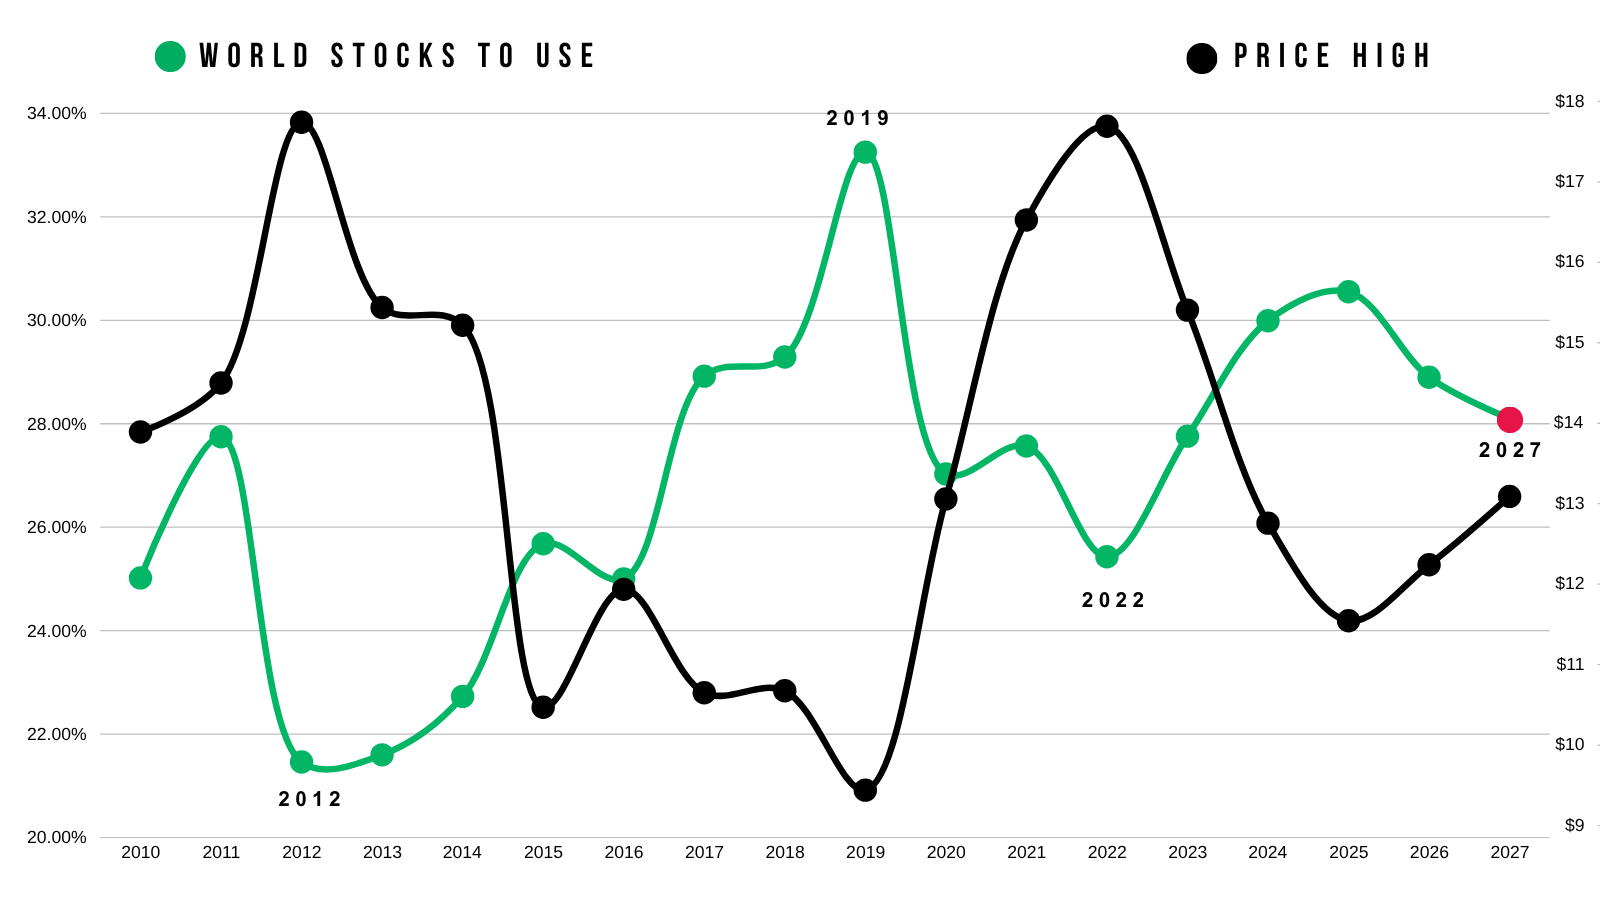
There is a very clear correlation to the world balance sheet and soybean prices as I've discussed countlelss times.
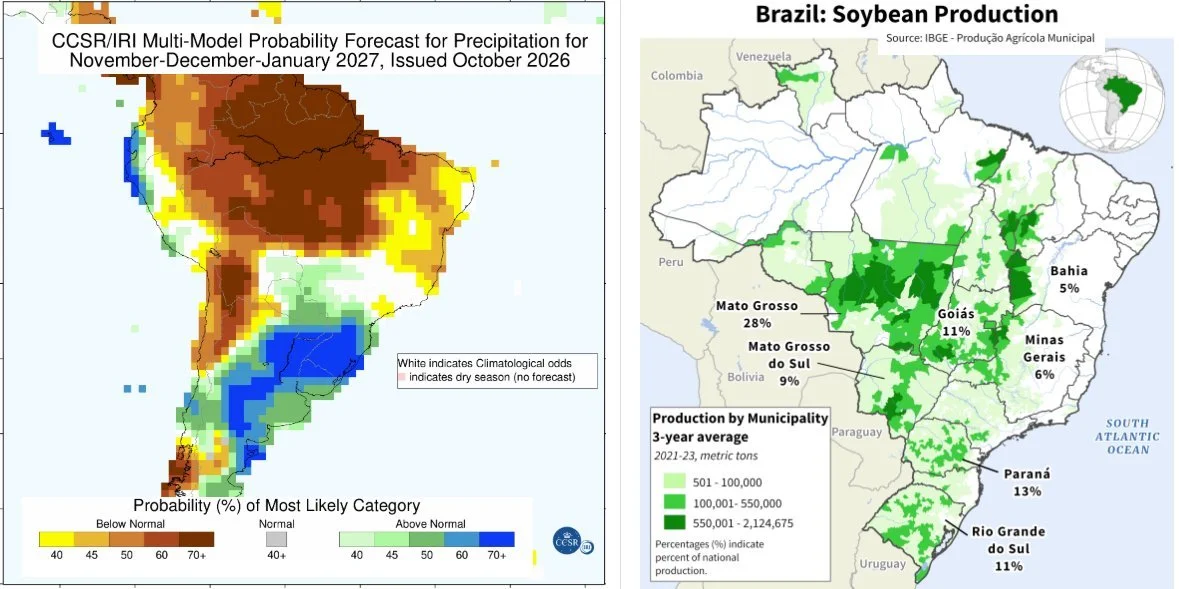
Now you have a Super El Nino.
Who knows the impacts this will have, but if it does cause any negative impacts to Brazil, that world balance sheet could be in some trouble.
Even here in the US. You have a balance sheet that has 6 million more acres compared to last year.
Which alone added nearly 300 million bushels of supply.
Yet the carryout is the same. Which isn’t bearish either.
As it tells you just how impressive demand is.
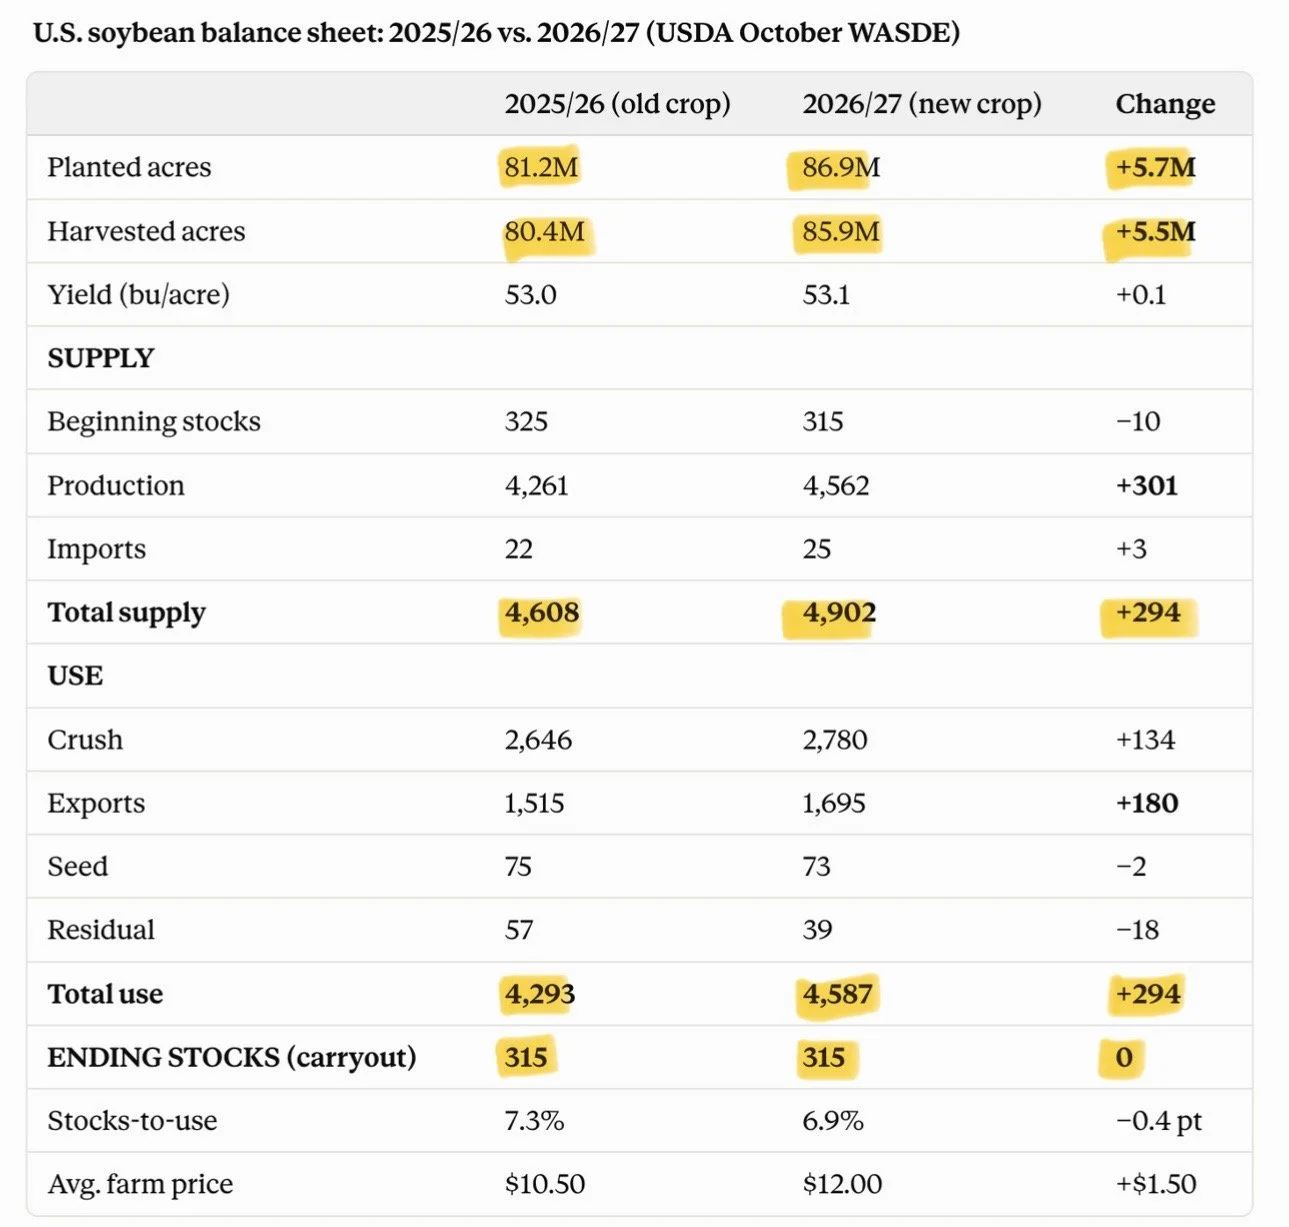
Bottom line I think soybeans still have a story long term.
Unlike in corn, most do believe there is a chance that bean yield creeps higher from here which would be a risk and potential negative factor.
But demand is phenomenal.
China is still buying exactly like they said they would. And you could still argue we don’t have the available supply to meet that goal without rationing some demand to non-China.
Charts
Nov Beans Chart:
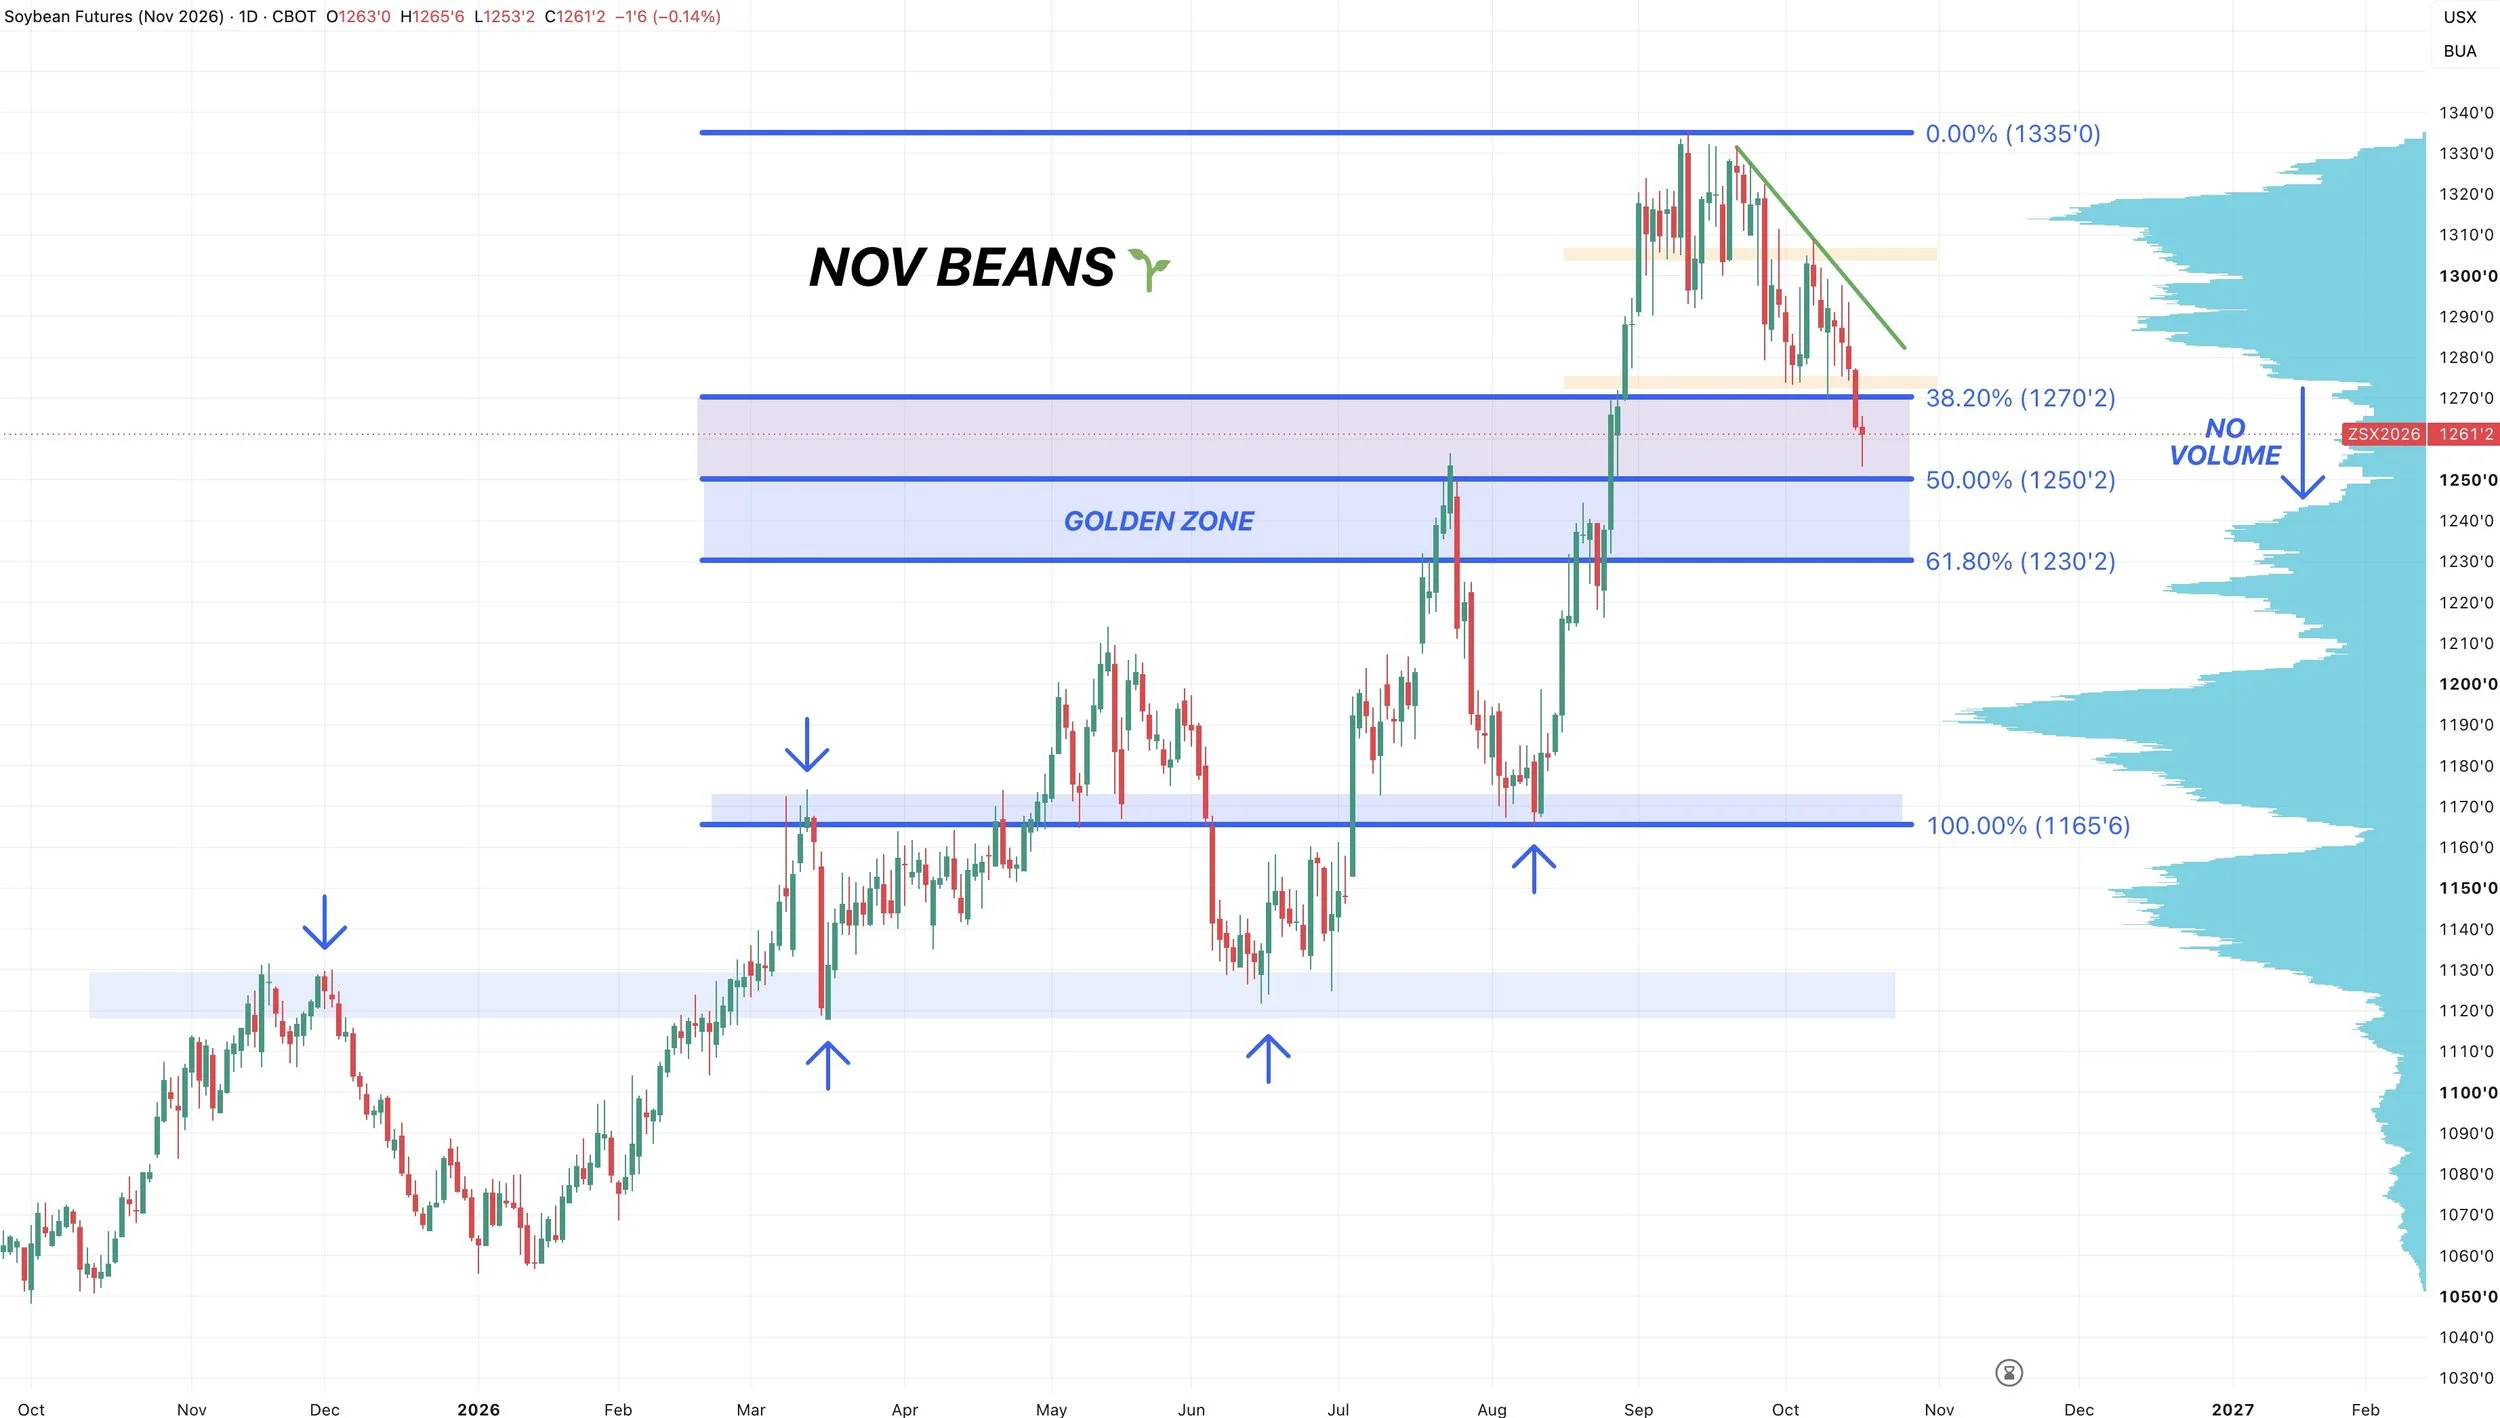
Soybeans broke that support and the lows from the USDA report.
So now what?
Like we talked about, if this support broke it opened the door lower towards the next levels of support.
As if you notice there is zero volume or support below that support level we broke to catch this market.
If you are unable to reclaim that support, it opens the door towards the 50-61.8% retracements down to the August lows.
This is where volume picks back up, and it would be a re-test of those July highs. Which we did tag today.
Soybeans tend to test prior highs pretty often and turn them into new support.
The August lows came at the March highs.
The March and June lows came at the November highs from last year.
So that would be the area we'd expect to find a bottom.
We had a nice close today. As we rallied off the lows. But no confirmation of a bottom. If we are able to claw back above that broken support, this could be a possible bear trap. But until that happens, the risk is lower towards the $12.30 to $12.50 levels.
Either way, it's arguably the best looking chart long term of the grains, and it's held up a lot better than corn and wheat have. Considering they are testing the 61.8% retracements to contract lows, where as soybeans haven’t even given back half of the rally from August.
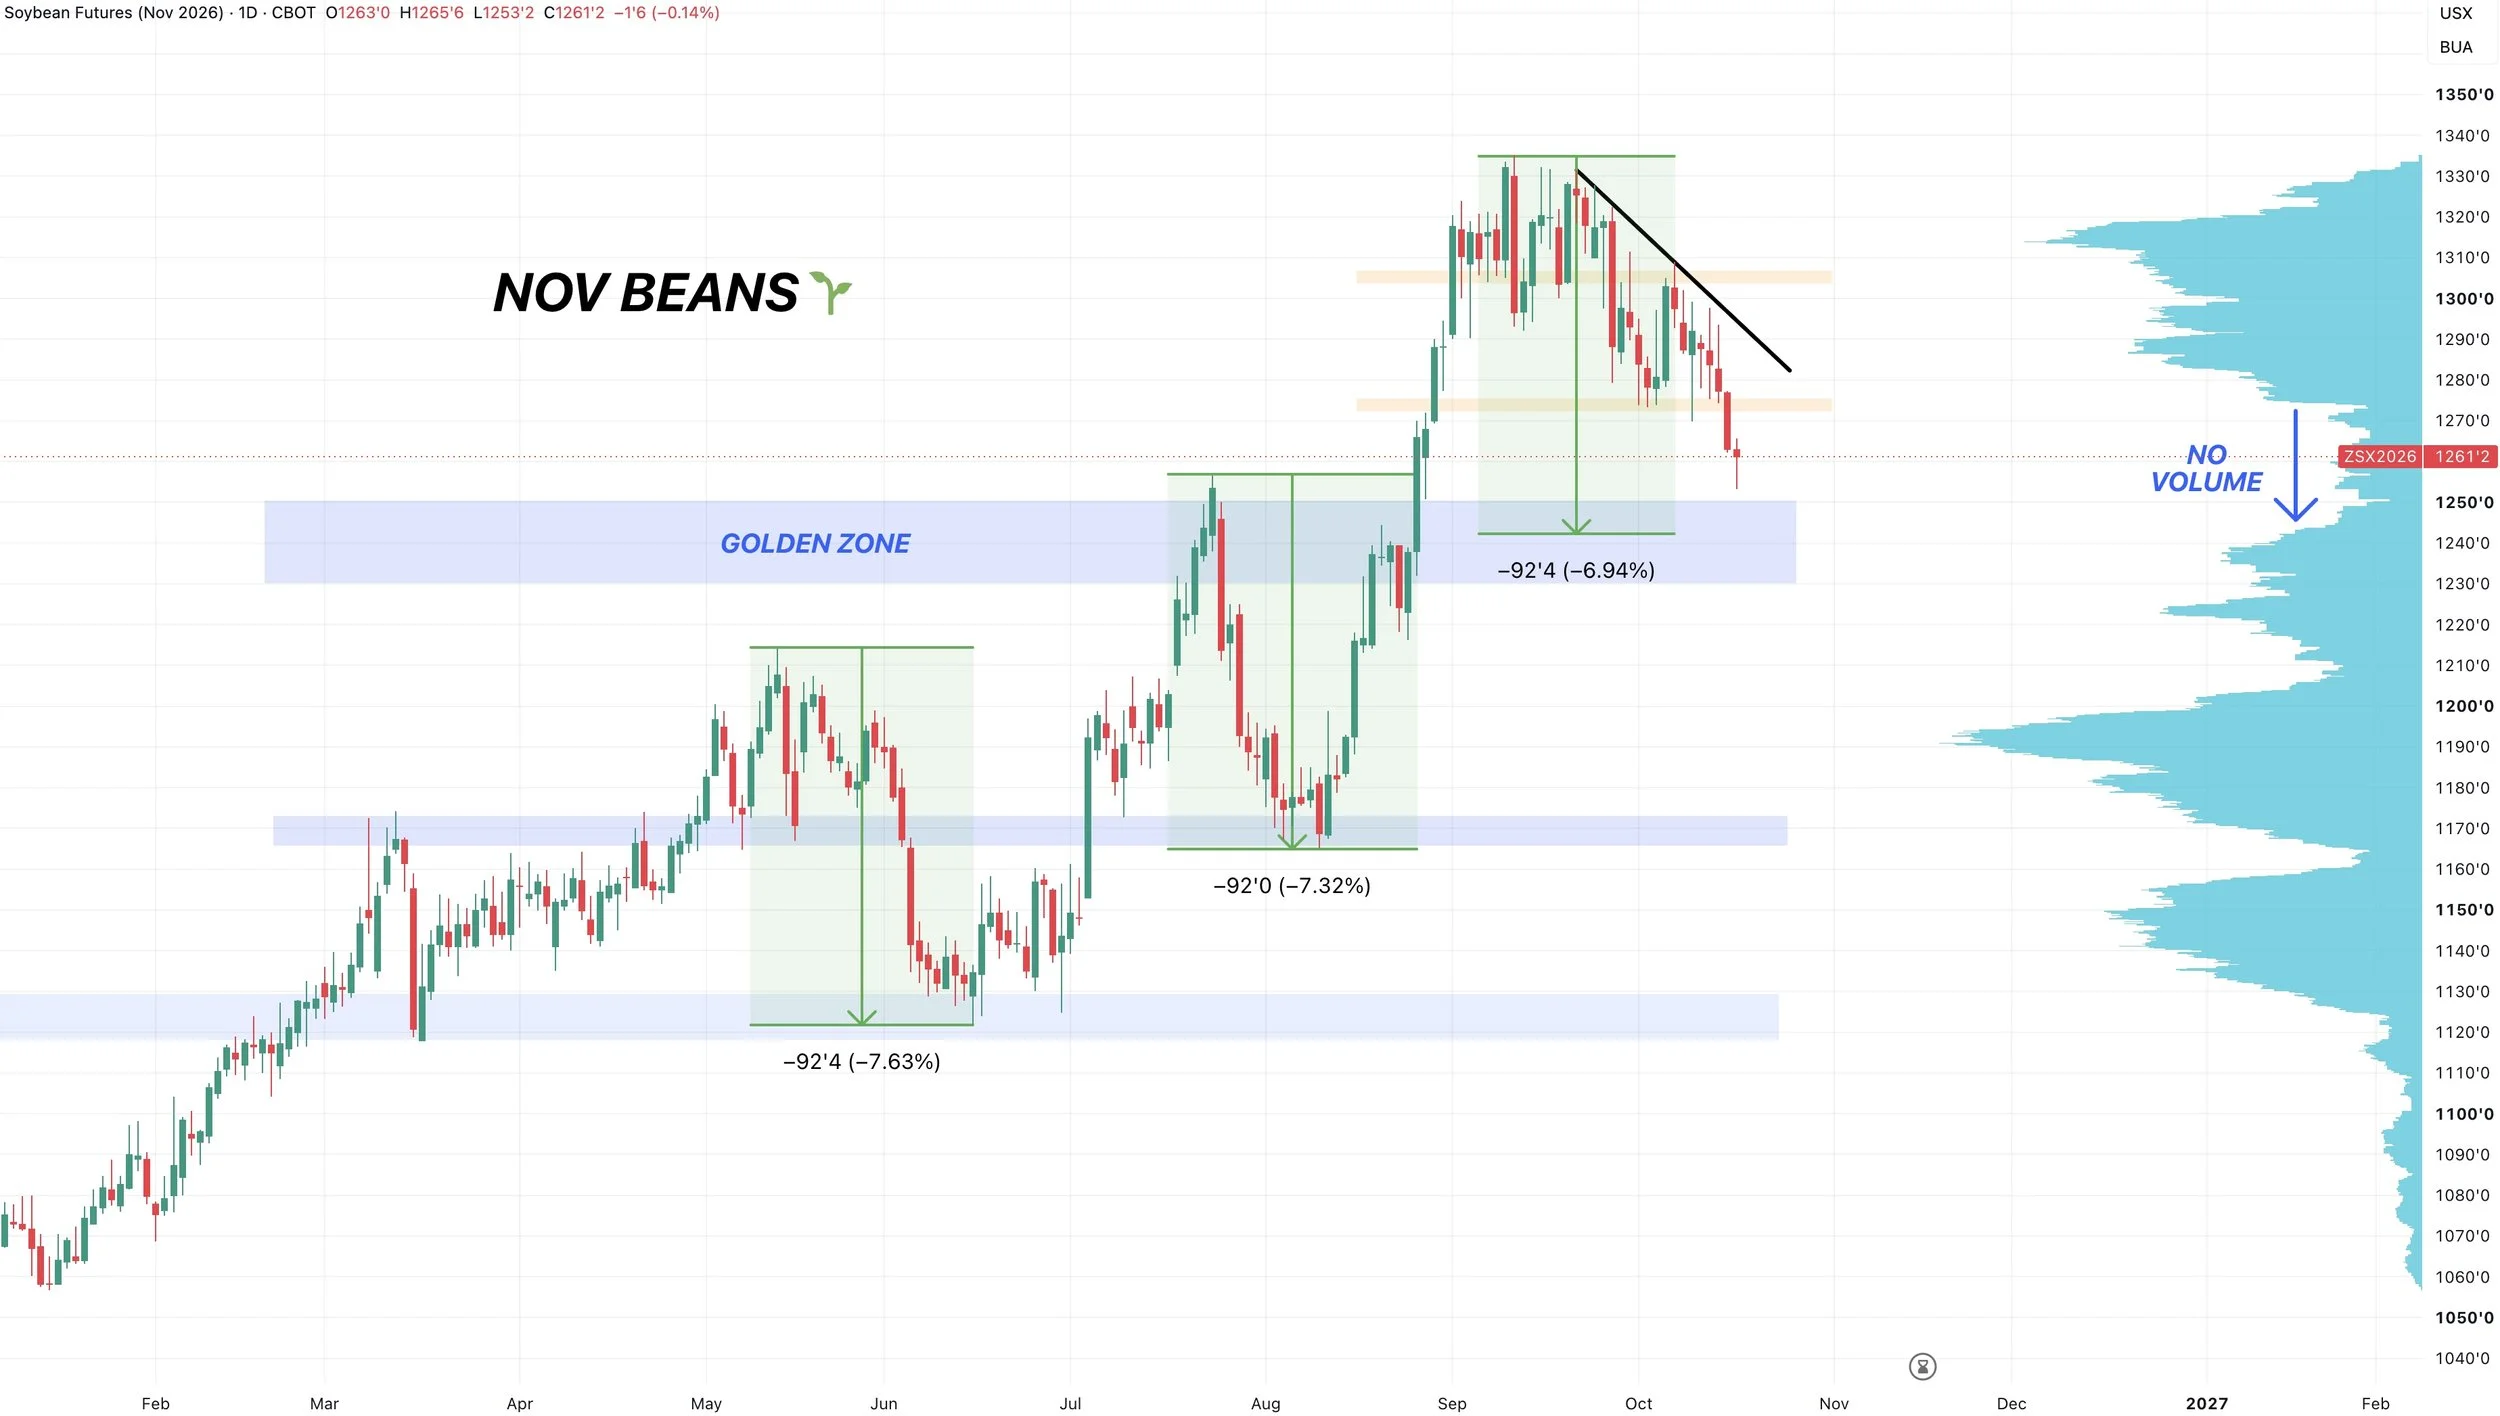
Here was something interesting I found.
The last two corrections in soybeans were exactly -92 cents.
If we fell -92 cents from the recent highs, it would put us right around $12.40
Which lines up with that support zone.
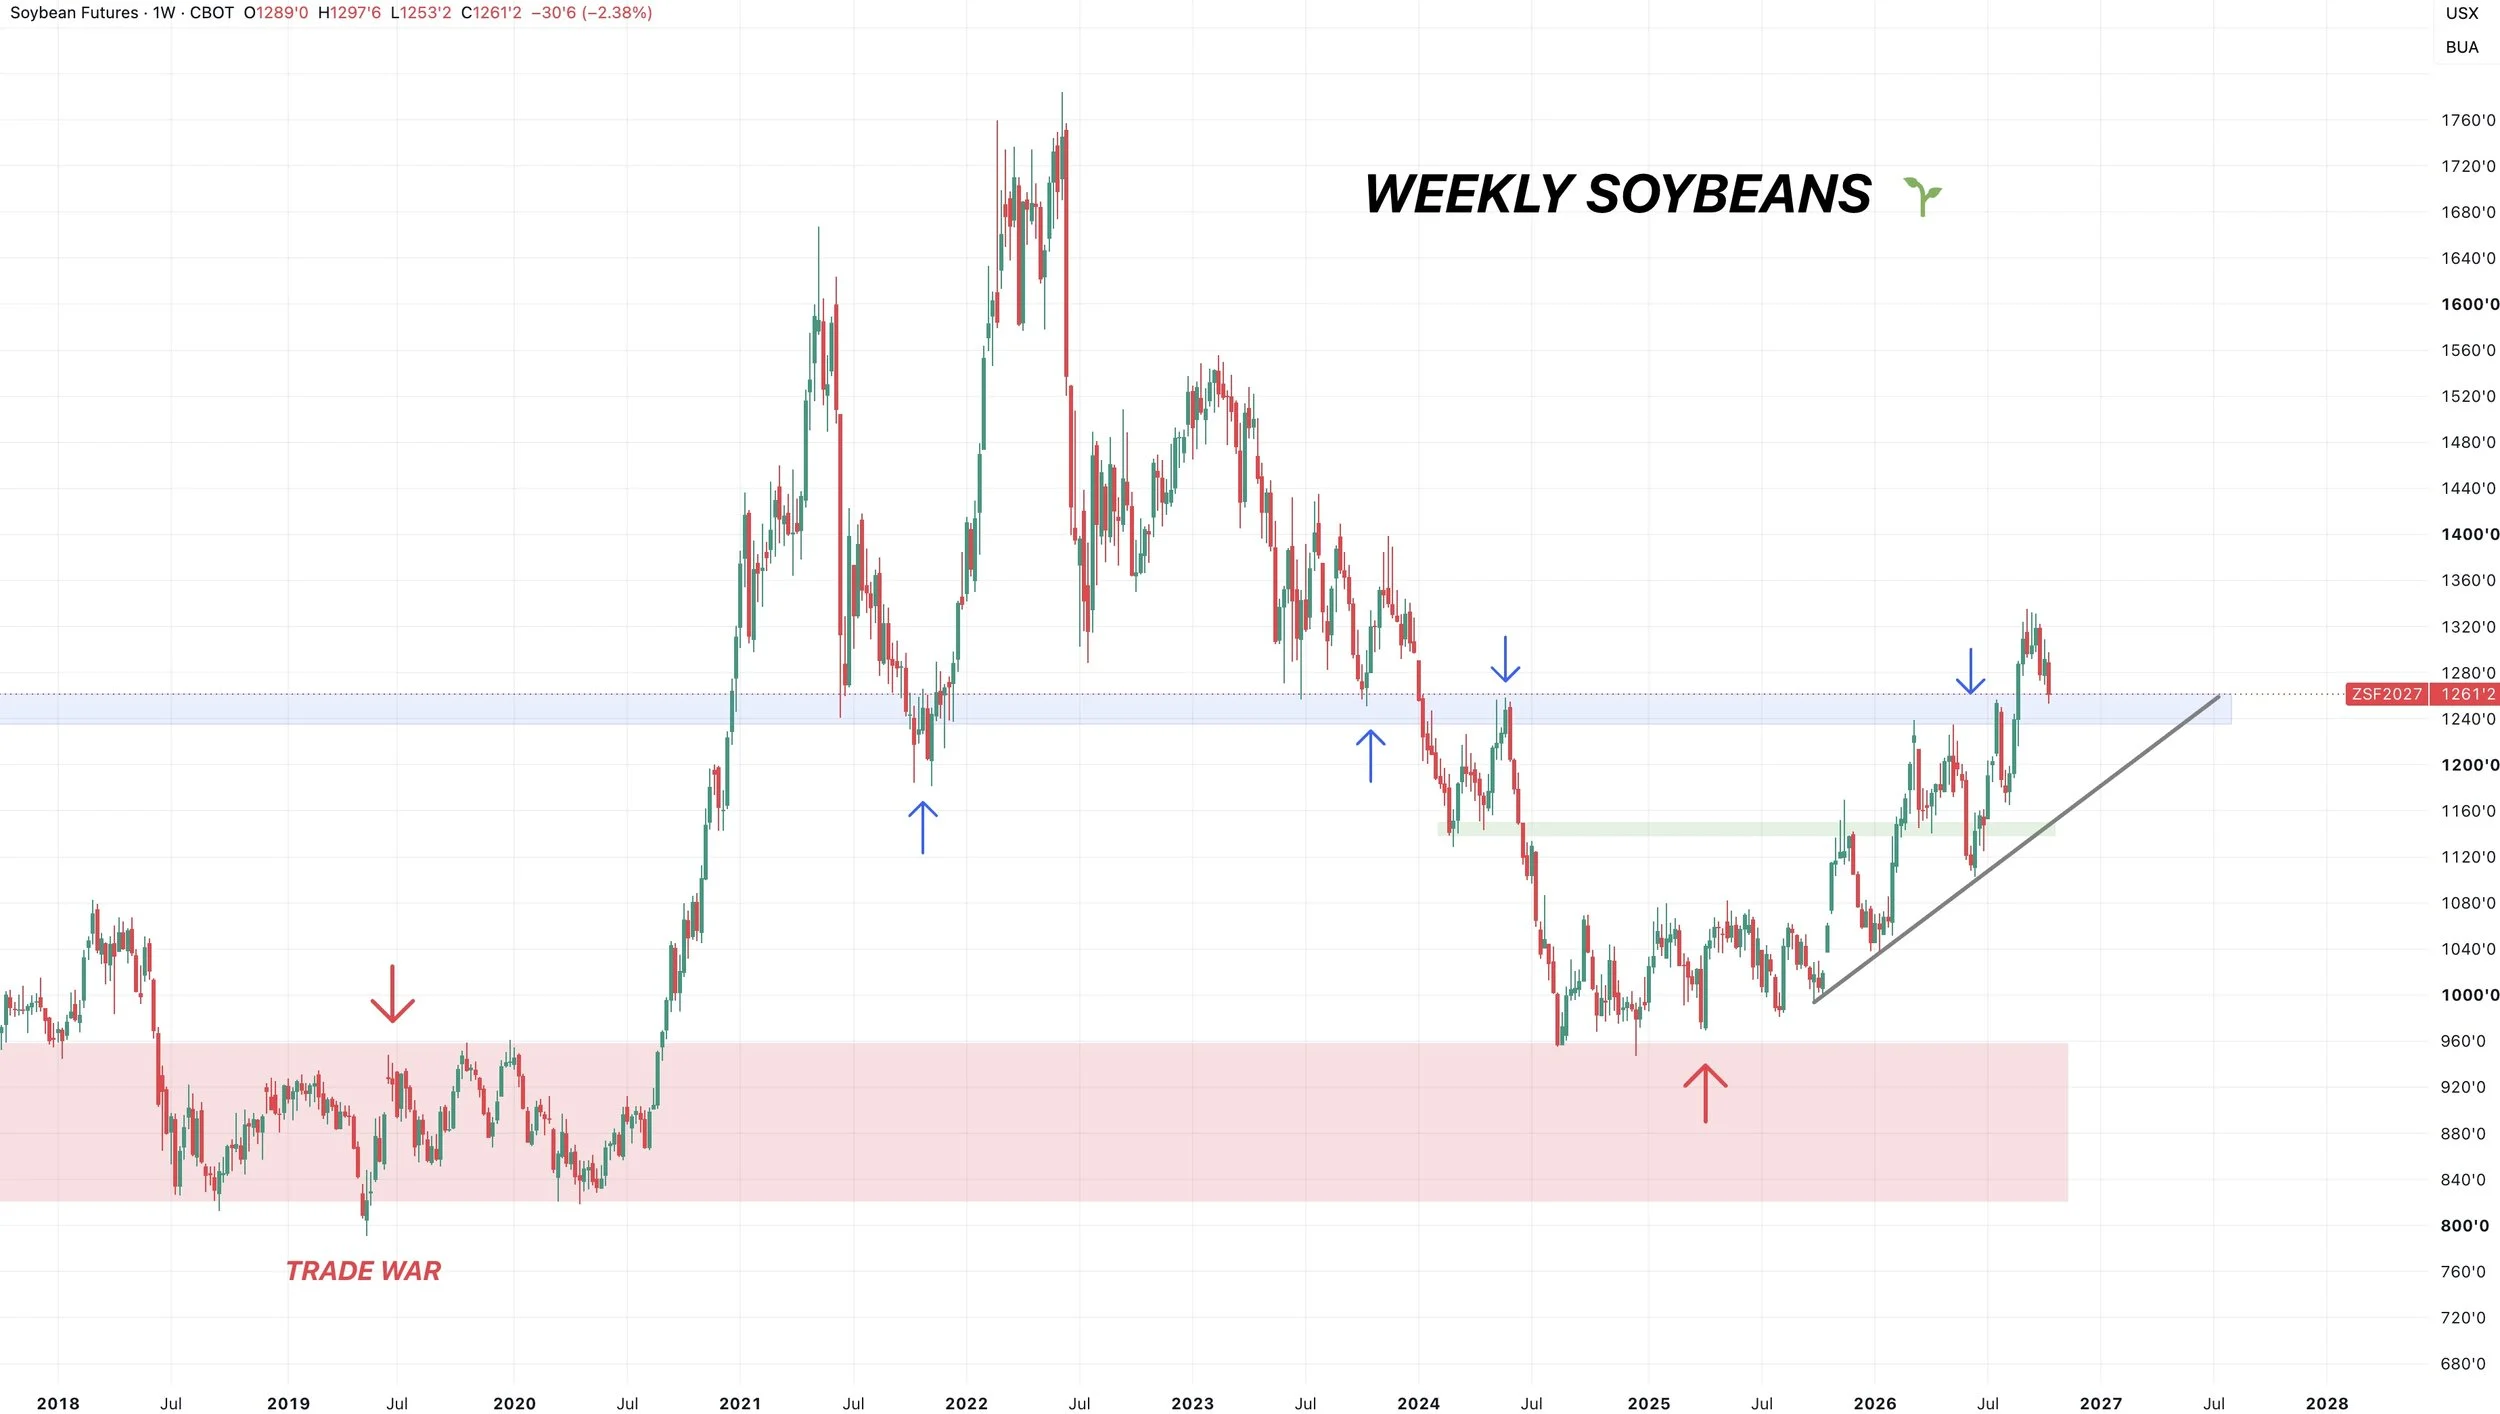
But if you zoom out and look at soybeans.
You can’t tell me this chart is bearish long term.
Wheat
Dec KC Chart:
The wheat market continues to drift lower, taking out support along the way.
We are now below that key support and the 61.8% level down to the June lows.
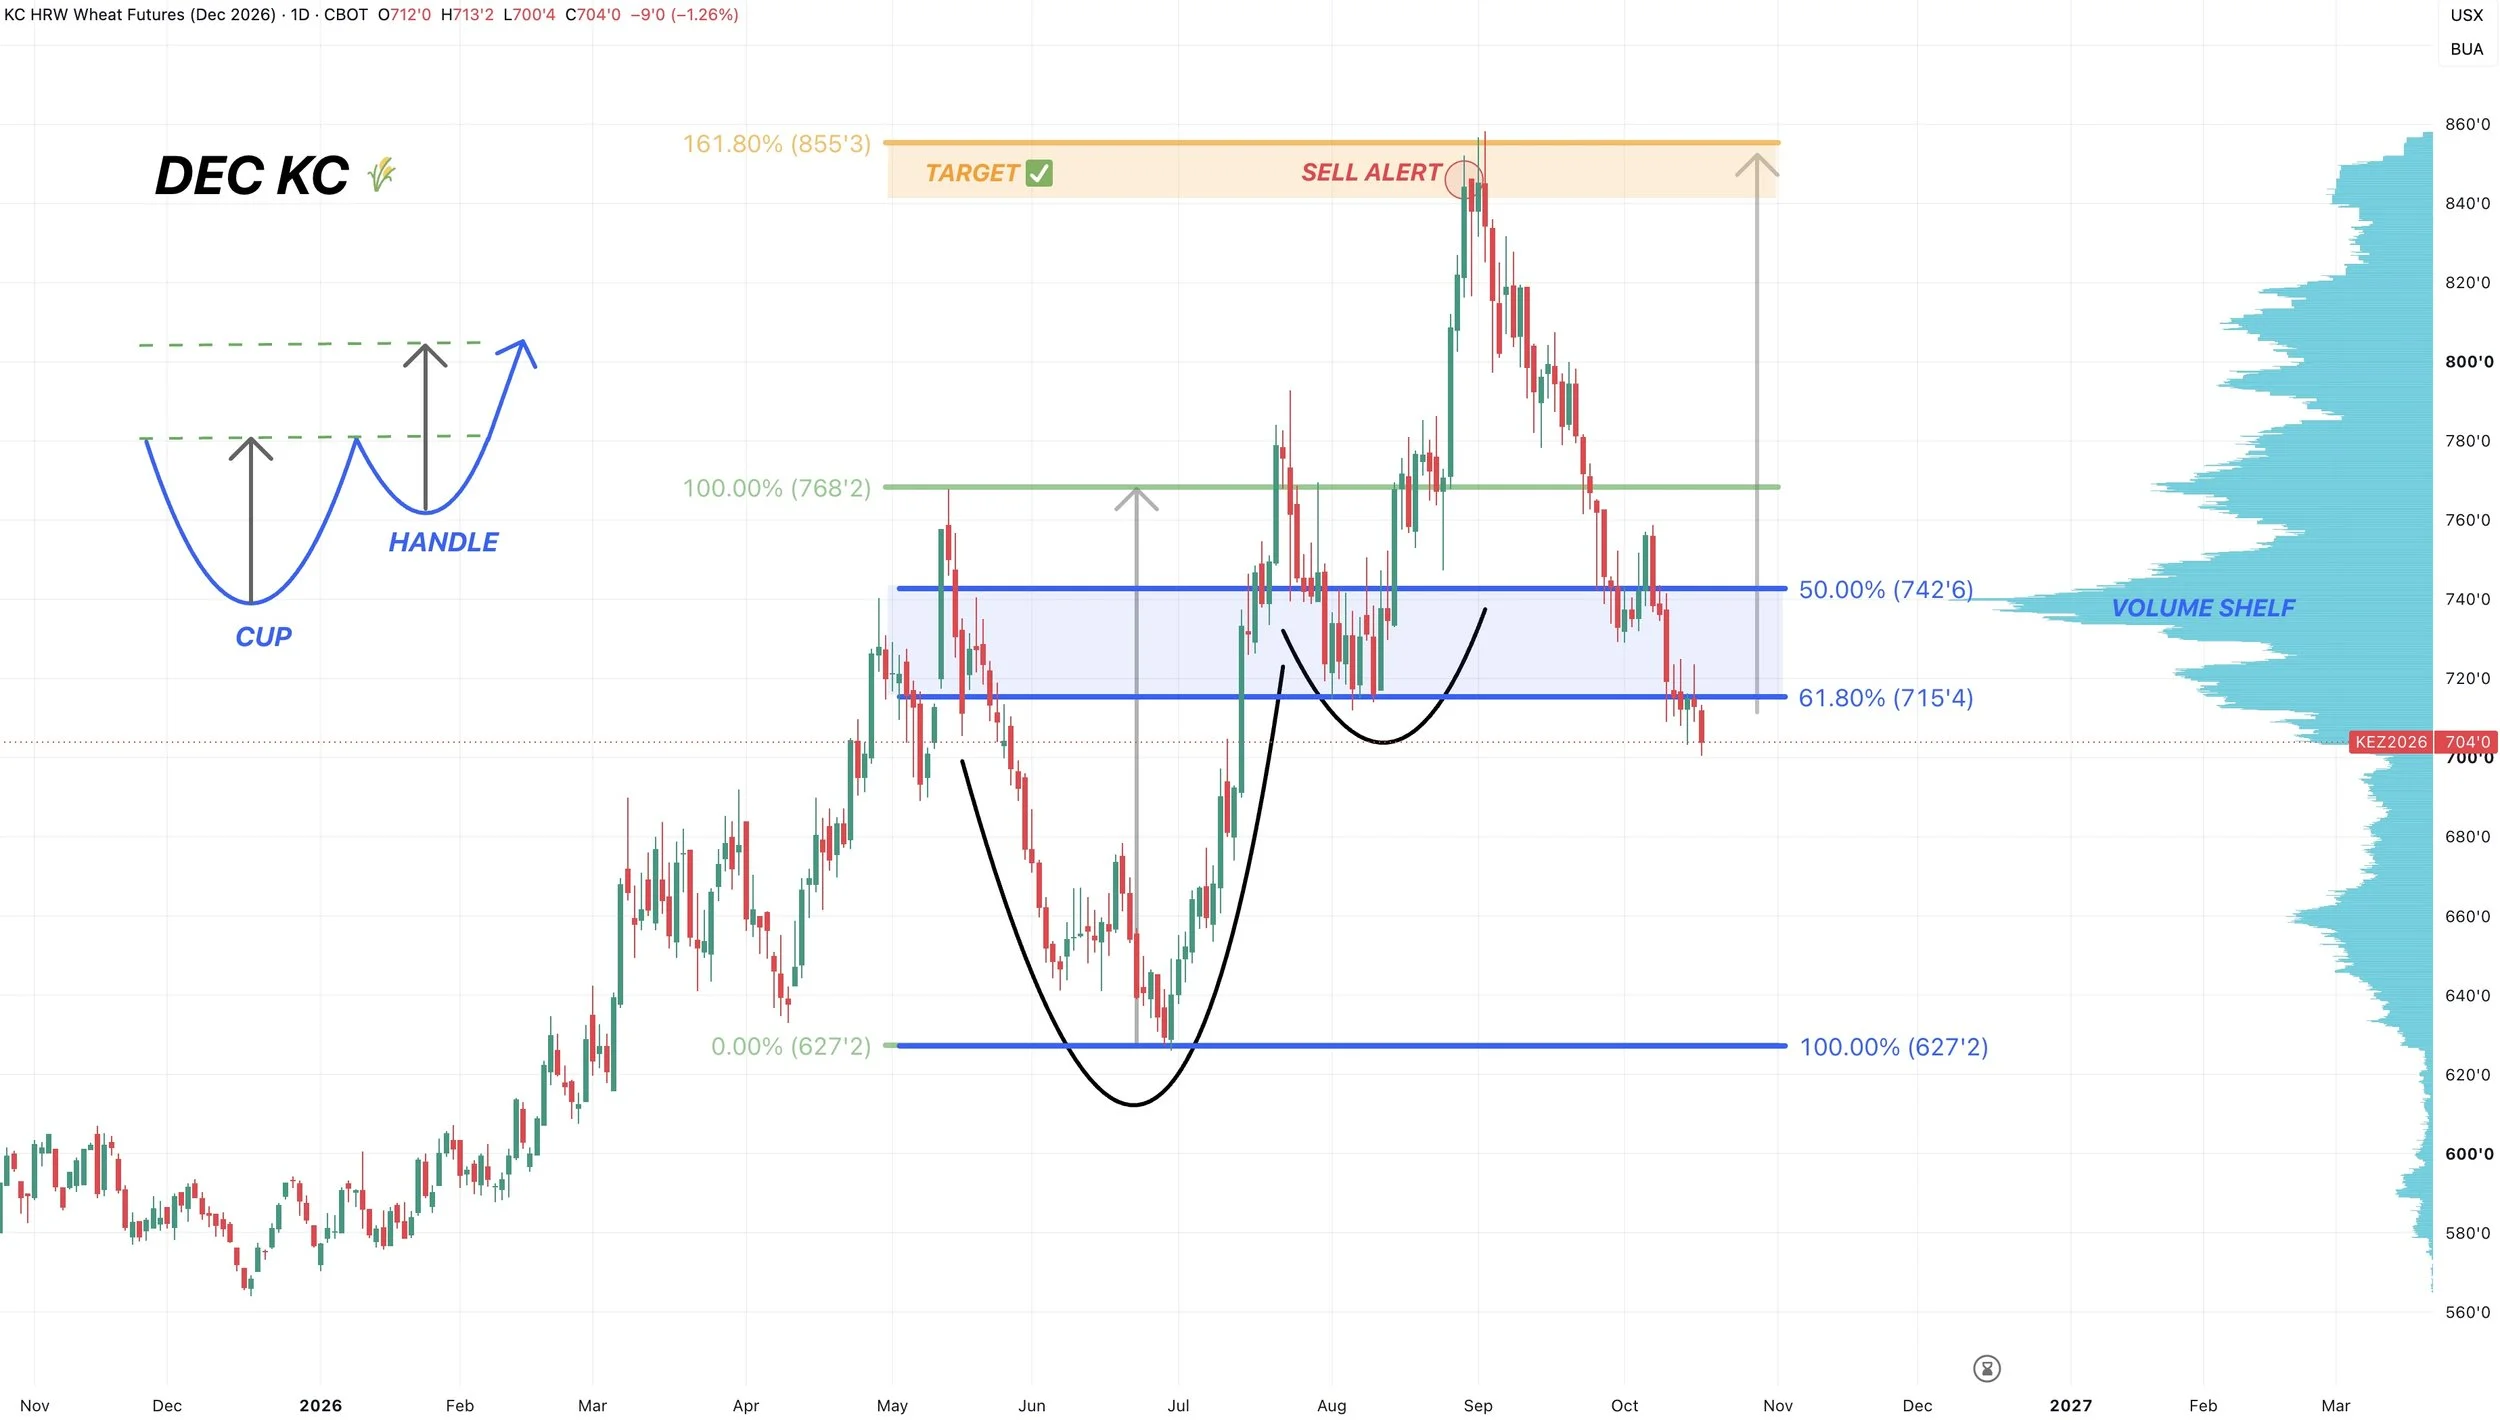
But now what?
Well, we are now entering the golden zone from contract highs down to contract lows.
That 61.8% level would essentially be the absolute line in the sand for this wheat market.
If you are unable to hold that level, the structure would not look great.
If we are going to carve out some lows, it has to be in this zone or the structure is simply broken.
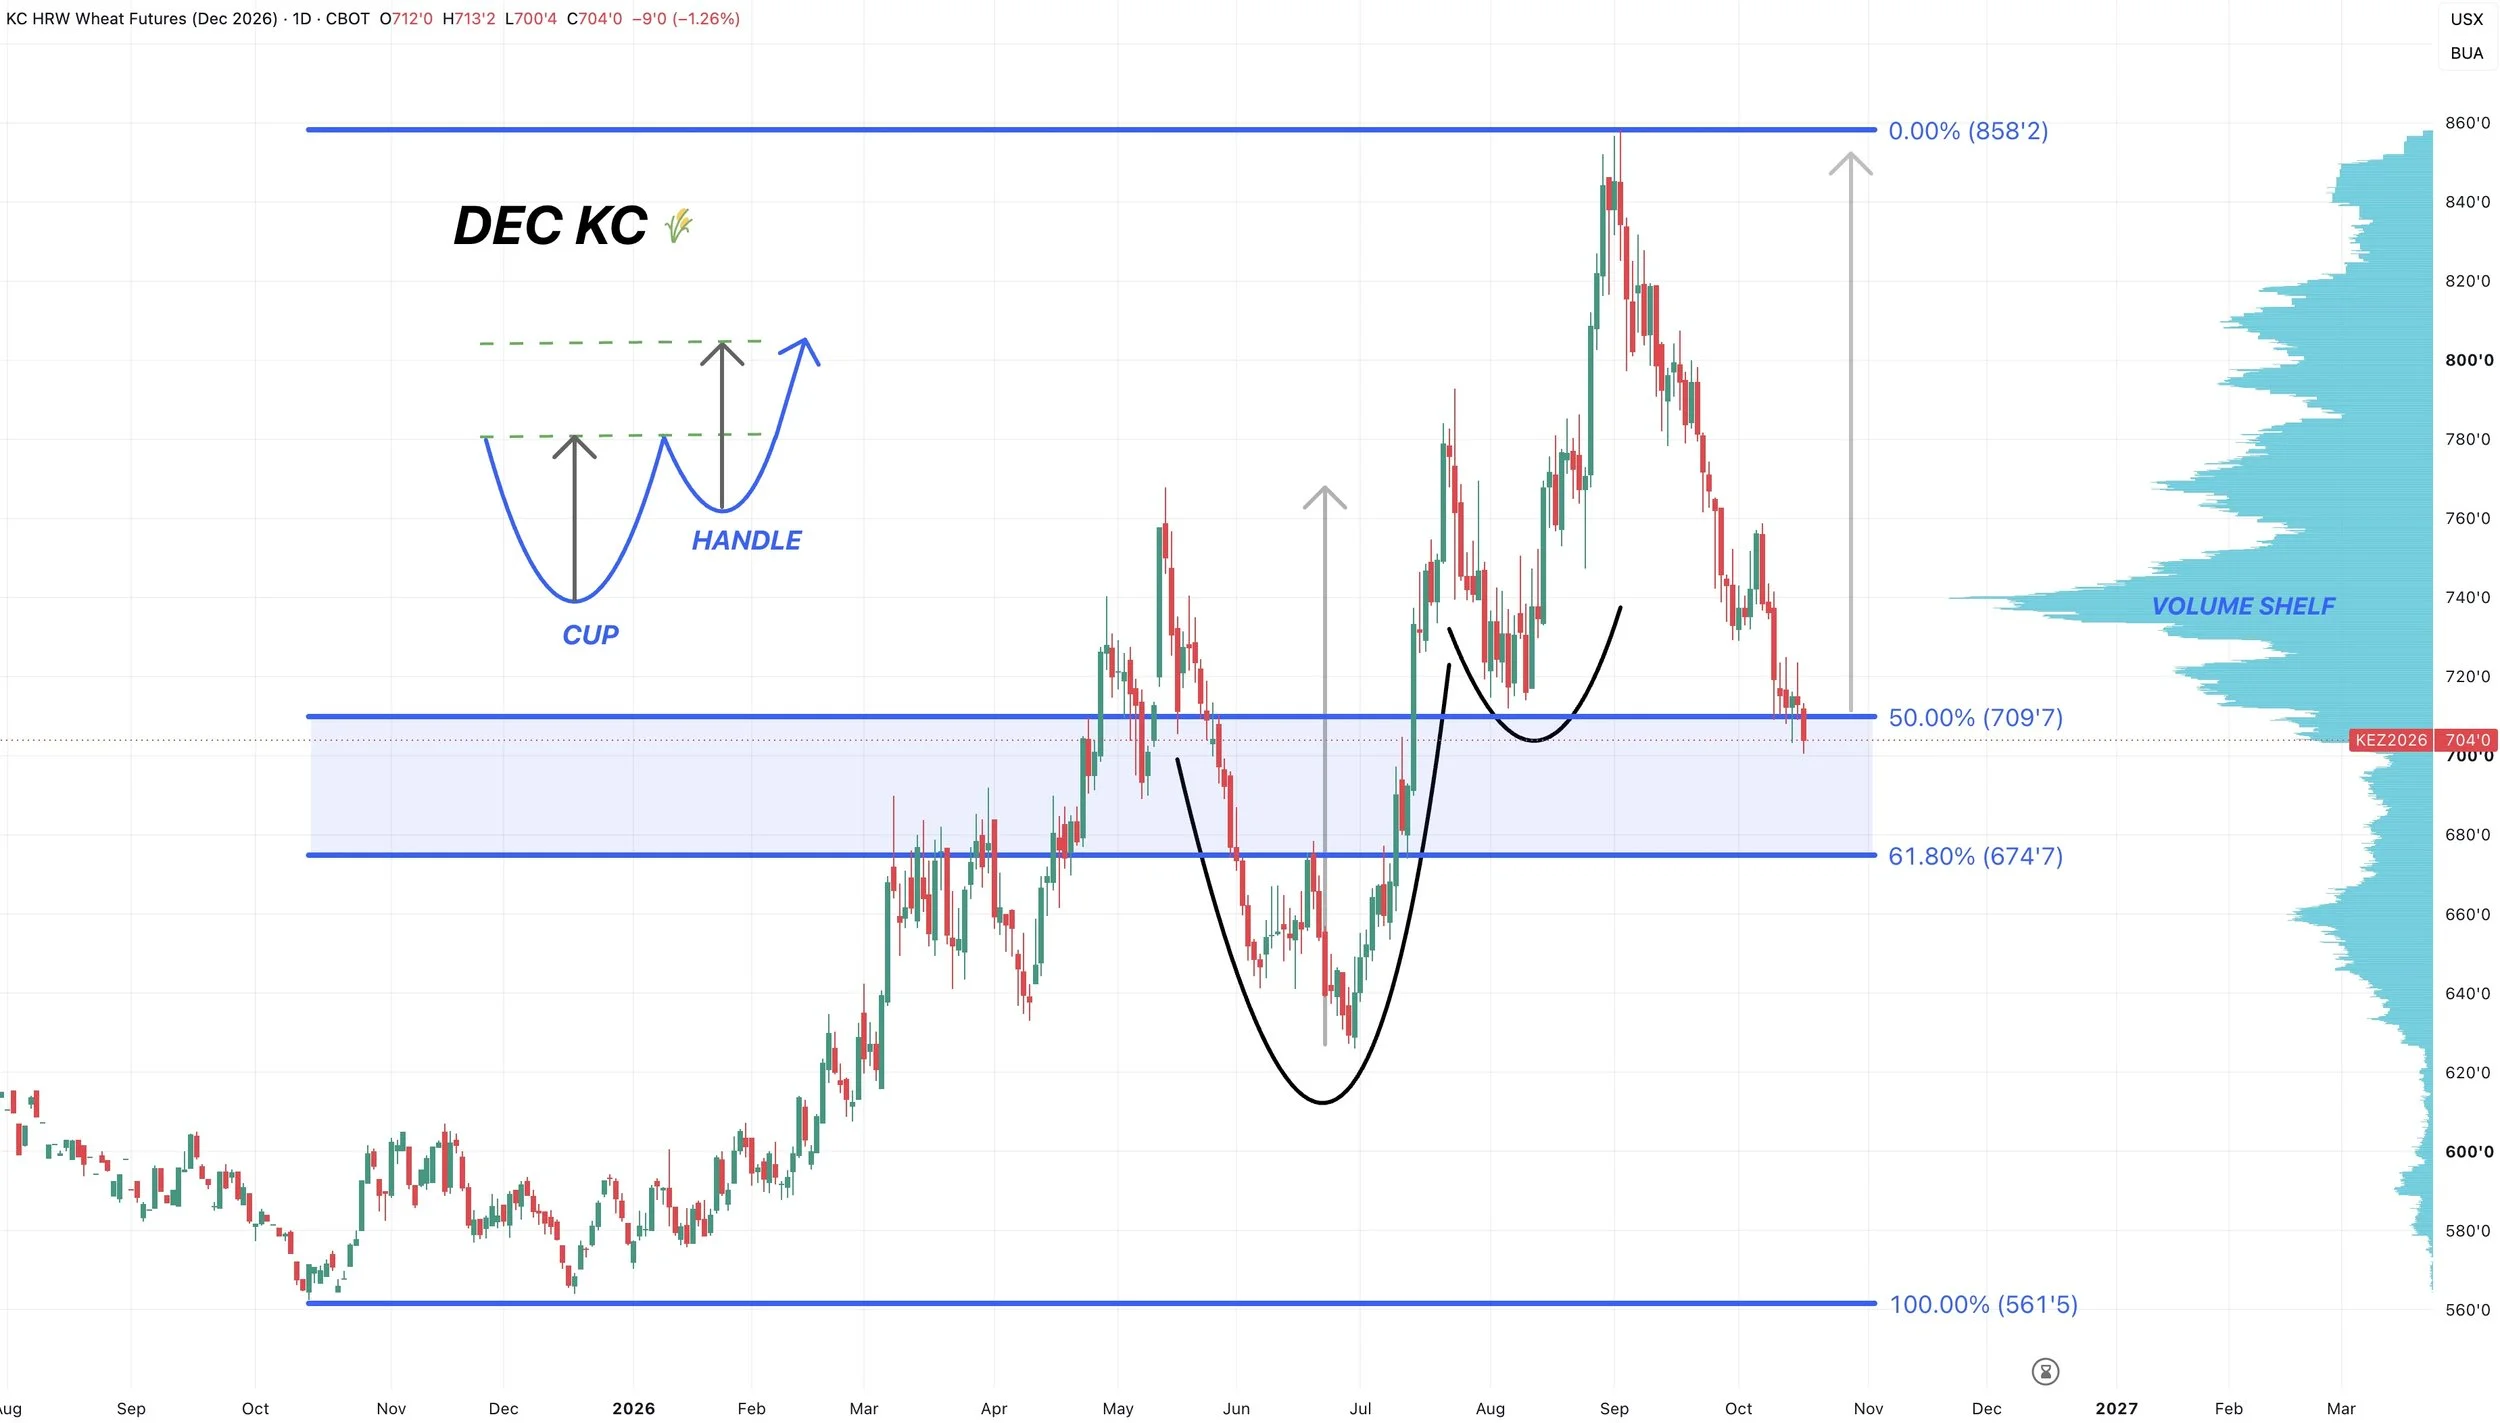
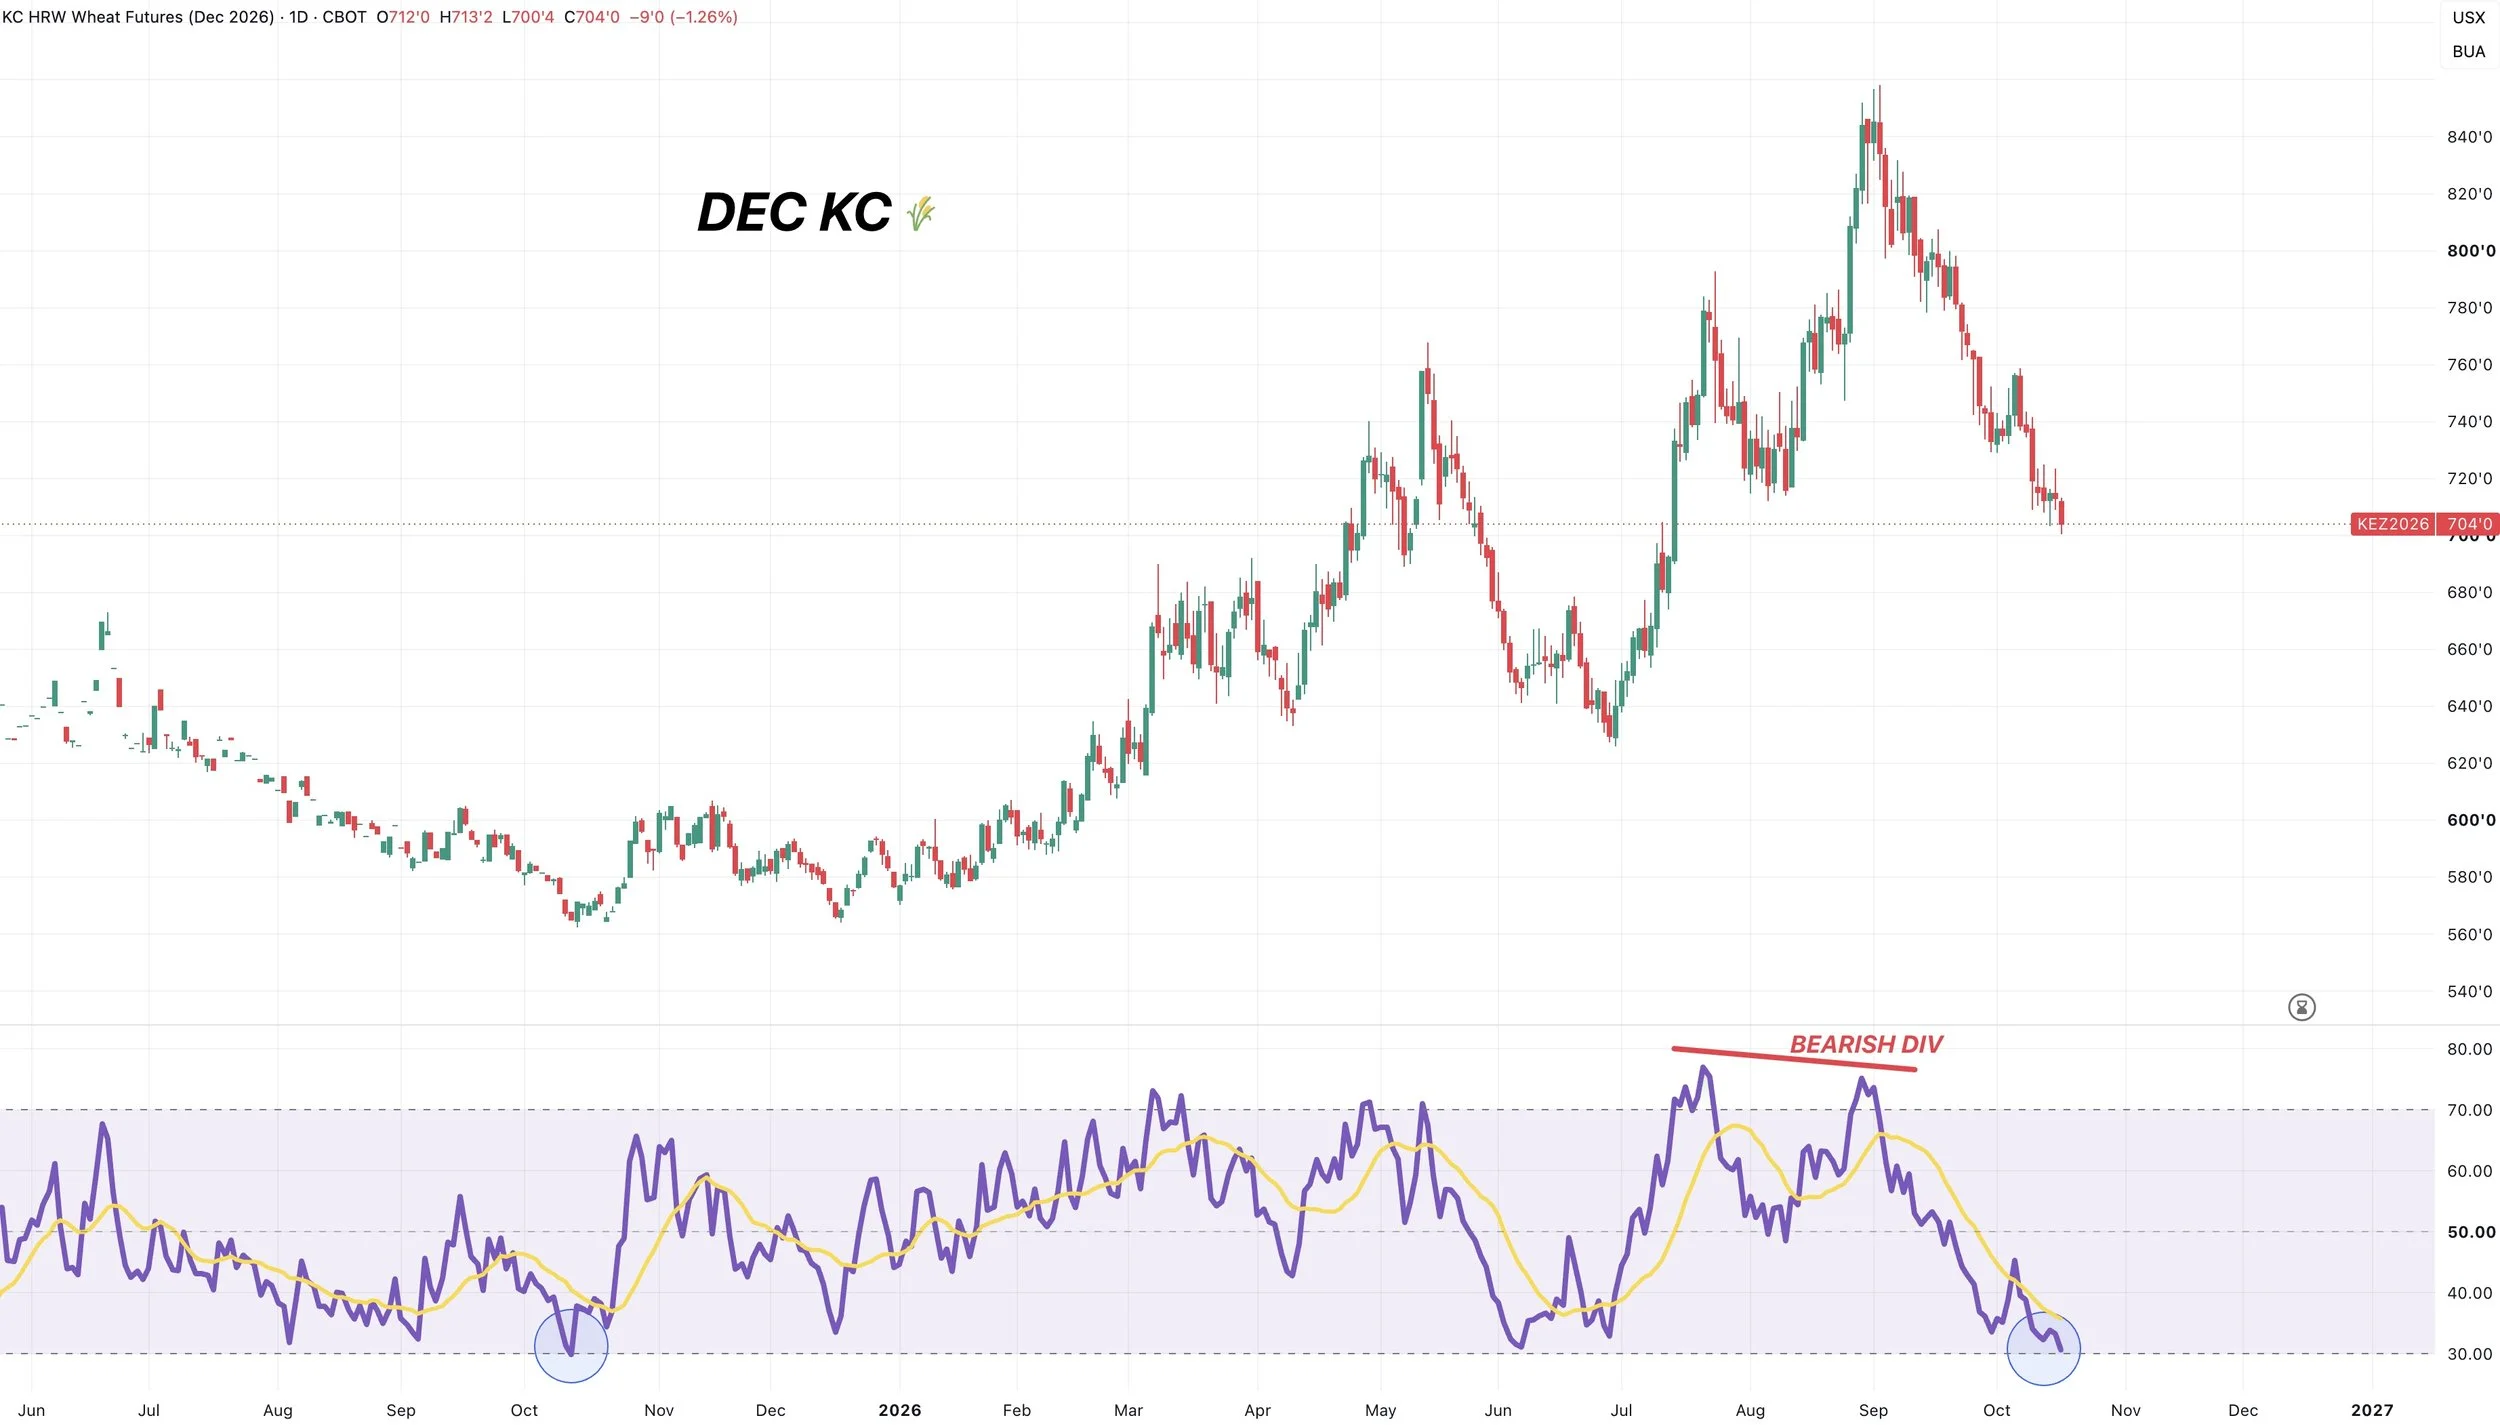
KC wheat is the most oversold it has been since those October lows from last year.
So clearly we're very oversold but no confirmation of a bottom quiet yet.
Dec Chicago Wheat Chart:
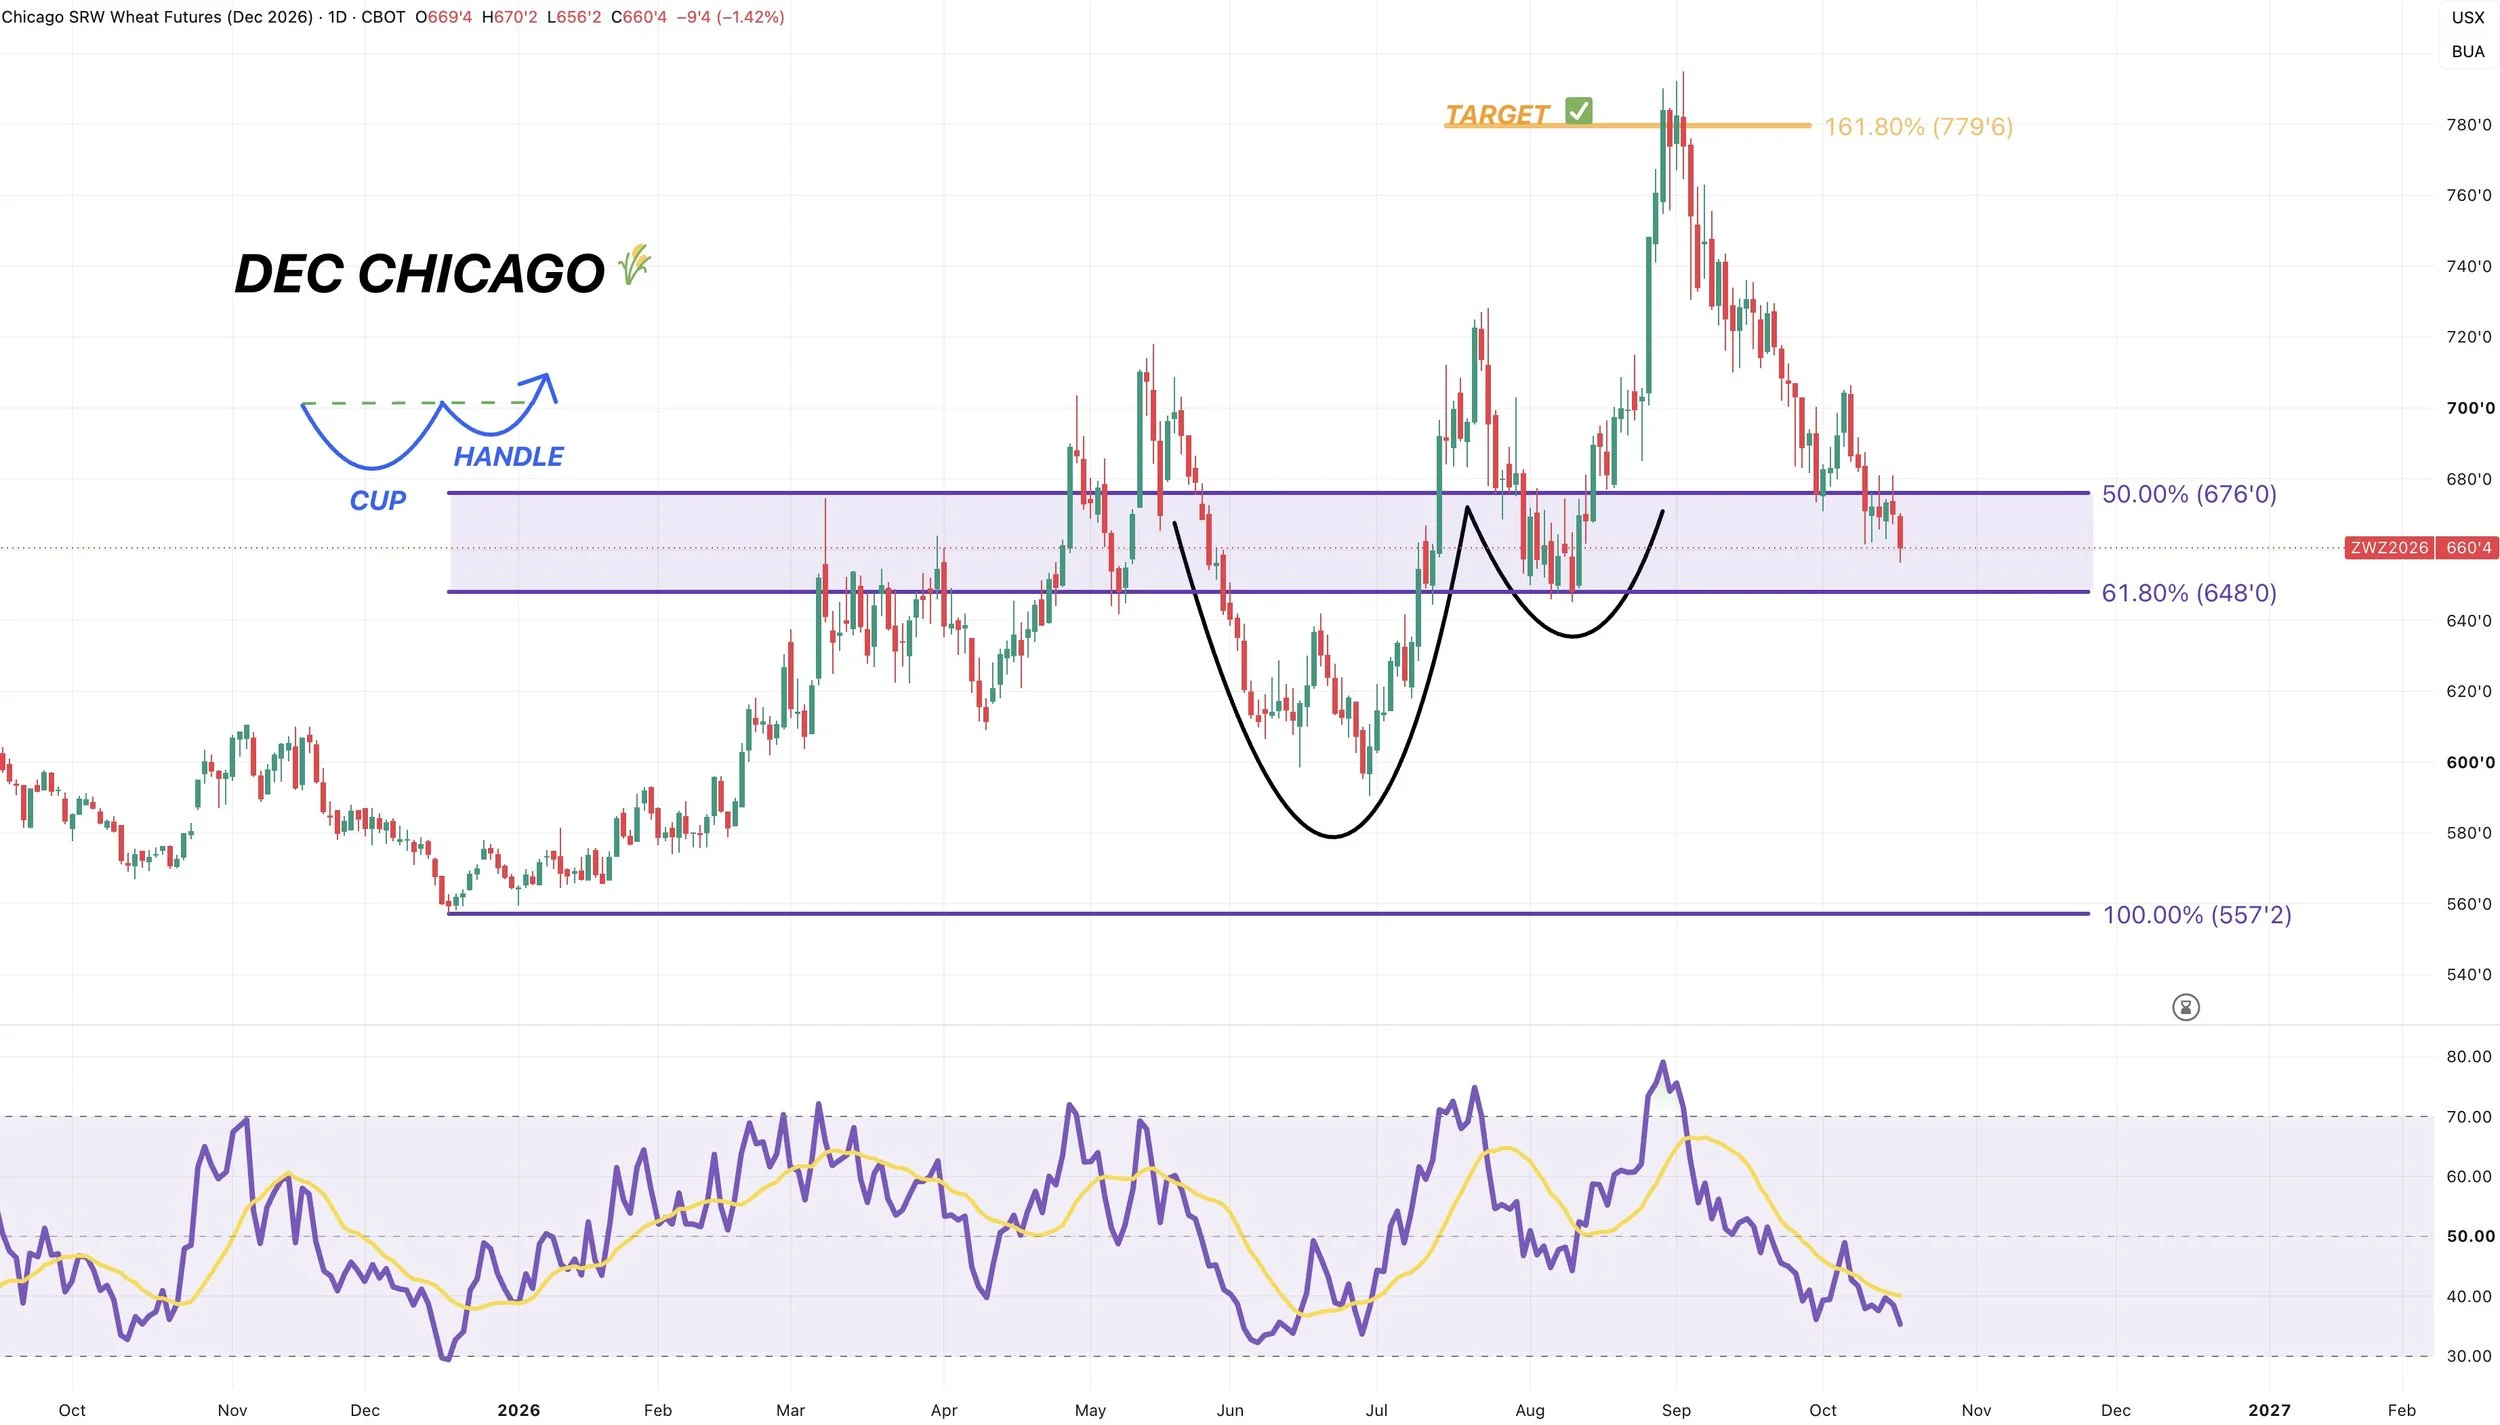
Now it's a little different set up in Chicago.
Chicago is essentially nearing it's absolute line in the sand already.
We've almost given back 61.8% of the contract highs down to the contract lows.
This would be viewed as one of our last supports on this chart.
It tests those lows from August and highs from early spring.
So bulls really want to hold this box or things don’t look pretty. If we are going to bounce this would be where want to see it happen. As this is virutally our last support.
I did want to note that we no longer have bullish divergence on the RSI as it became invalidated when the RSI made a new low.
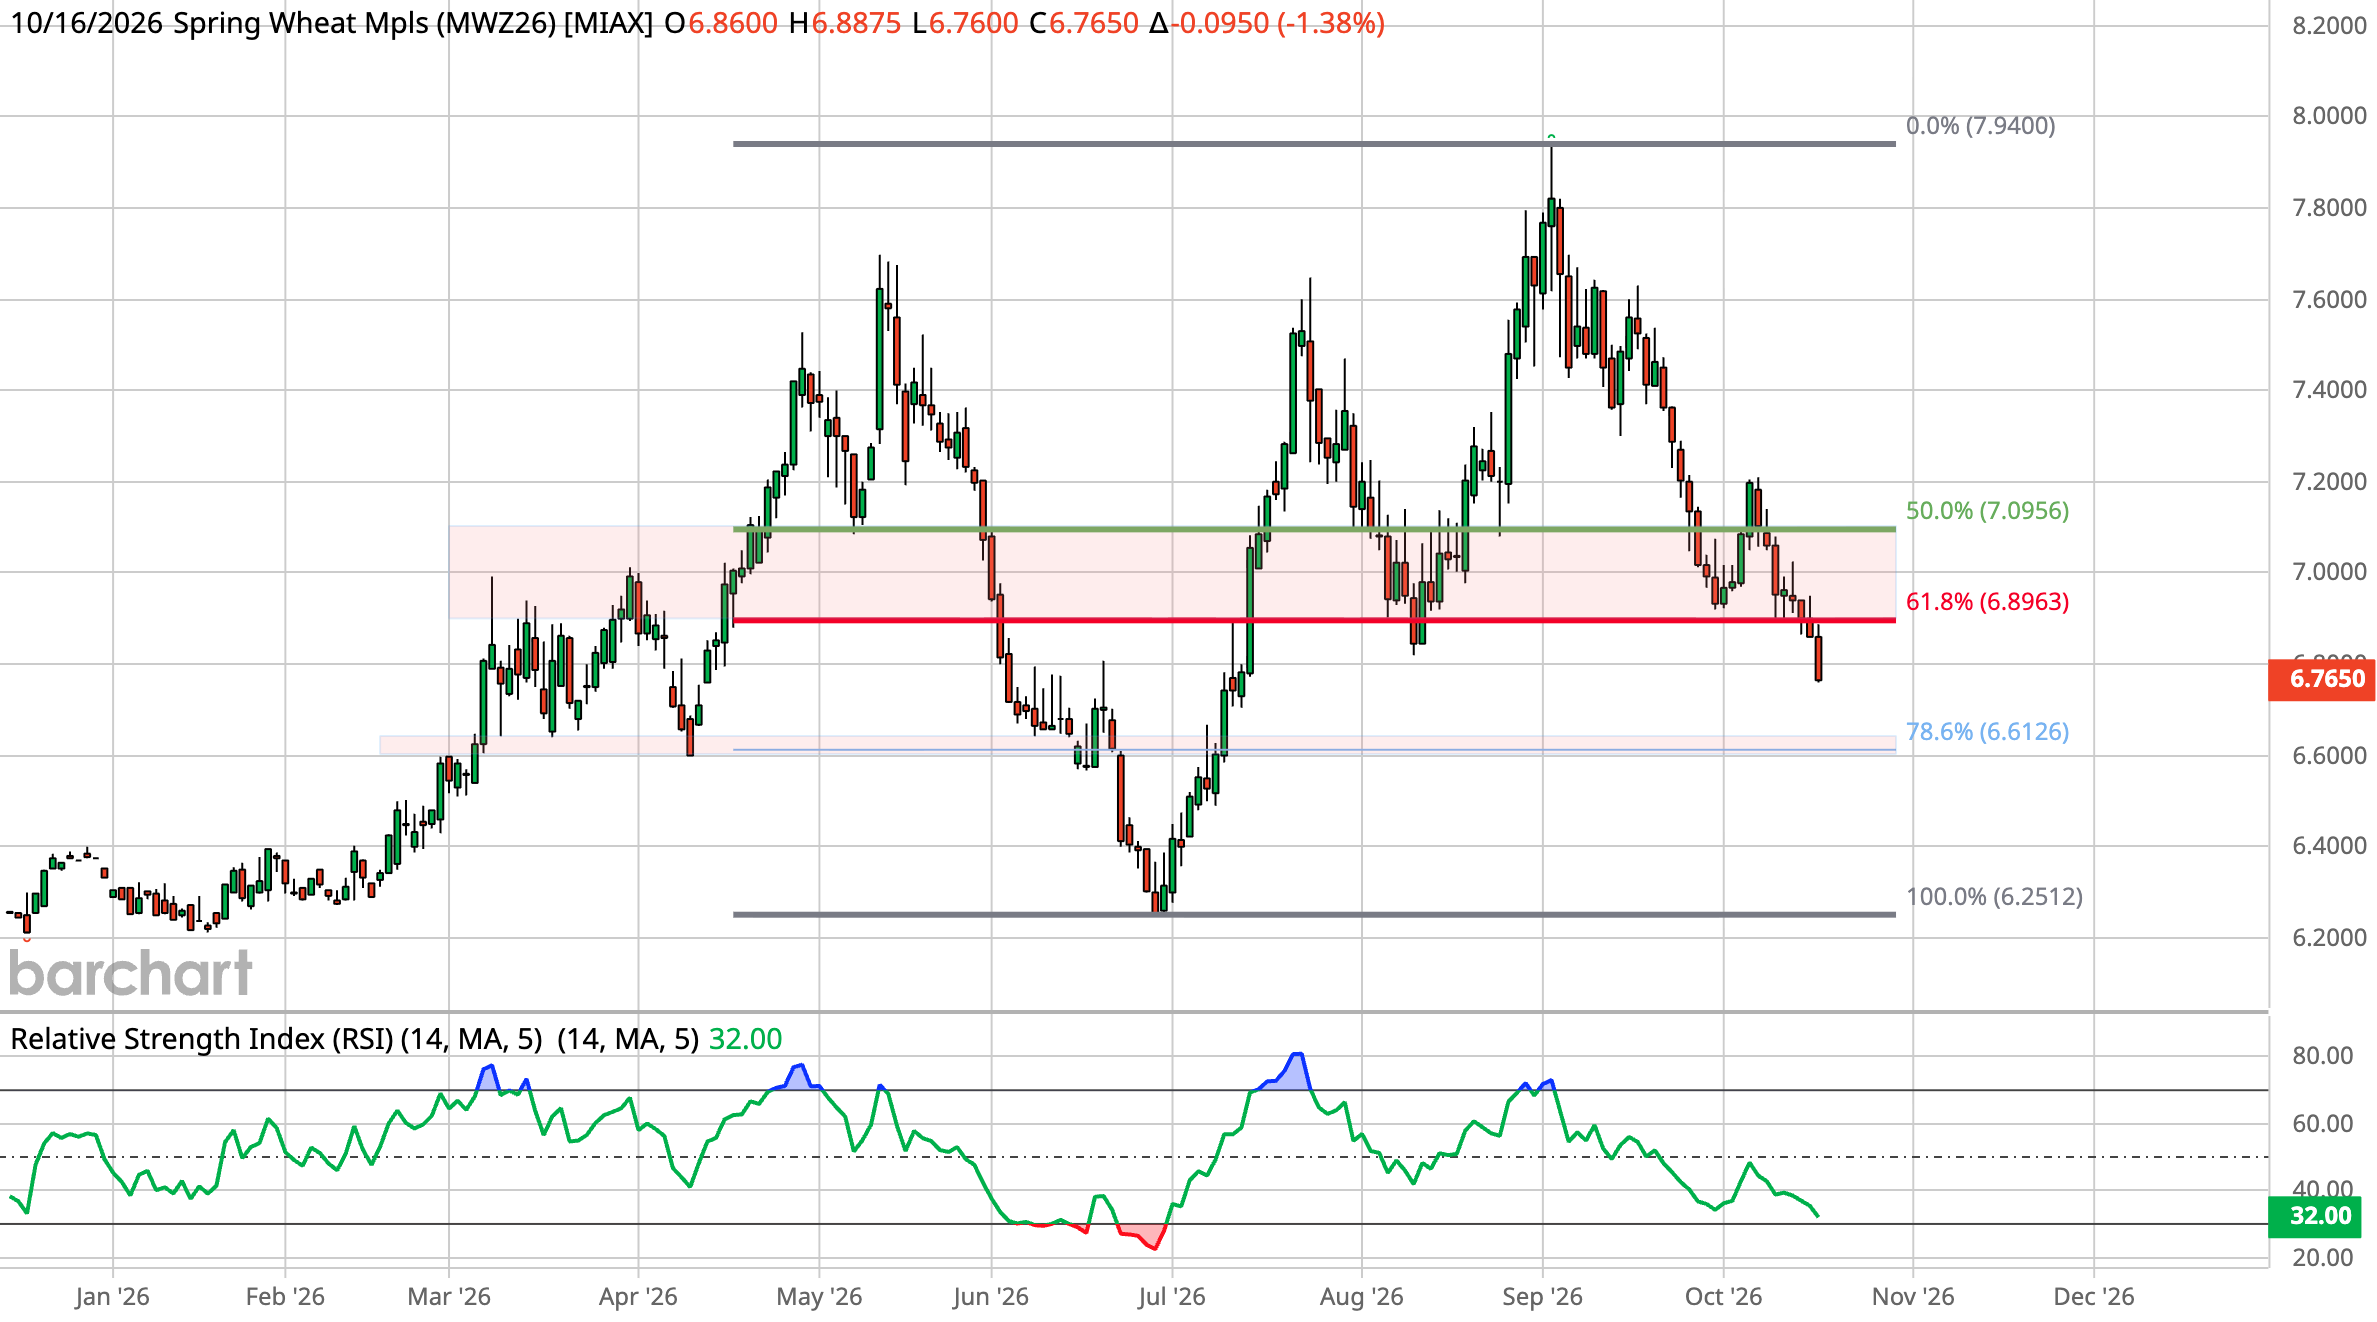
MPLS Wheat Chart:
MPLS doesn’t look to hot as we broke below that key support and the 61.8% retracement.
The next level of support is the 78.6% level which lines up with some prior support as well.
Cattle
Nov Feeders Chart:
Today we did issue a hedge alert for cattle.
Cattle could push higher from here but we feel like this is a good spot to start managing some risk.
If you missed the alert: Click Here
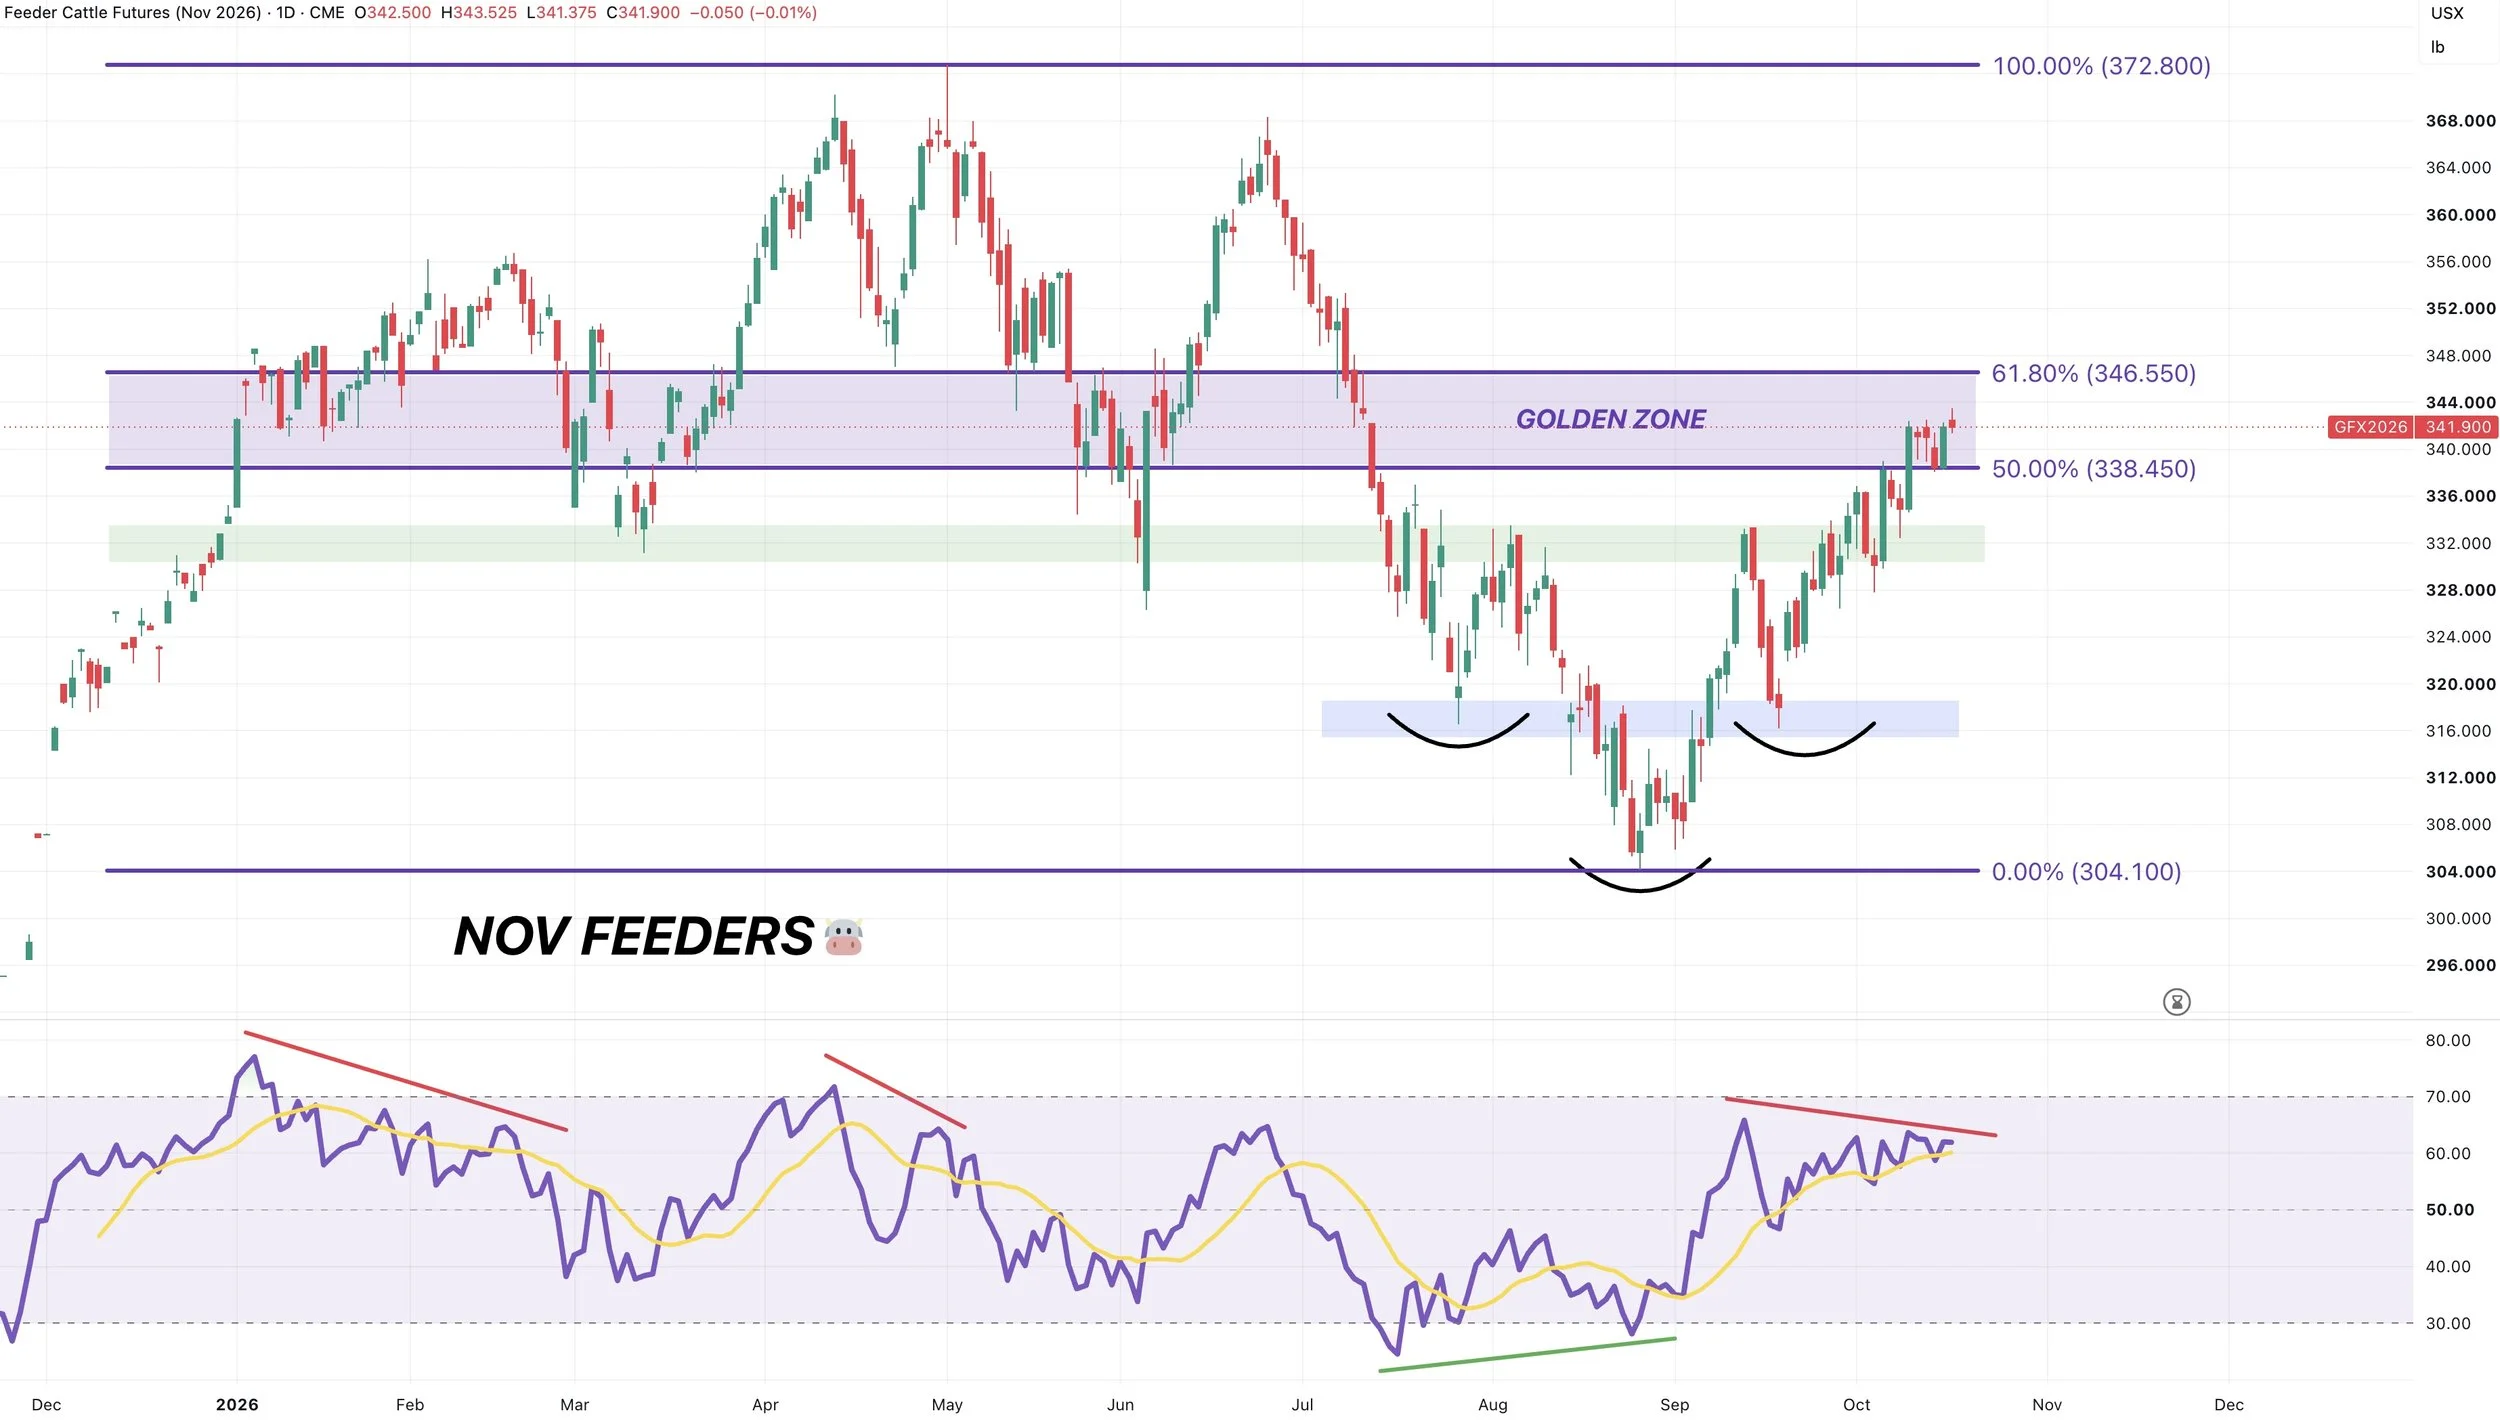
Feeders have had a great rally following that text book inverse head and shoulders bottom.
Feeders are now sitting at some key resistance levels.
We've clawed back 50-61.8% of the entire sell off from May. If this is a rally inside a broader downtrend, this would be a common area to stall. If you take this box out, then you could have more room to run.
But for now, we are also showing some bearish divergence on the RSI.
Prices are making new highs but the RSI is not. This does not mean we cannot keep rallying. But this is often going to be a warning sign. As bullish and bearish divergence has marked plenty of tops and bottoms in cattle this year.
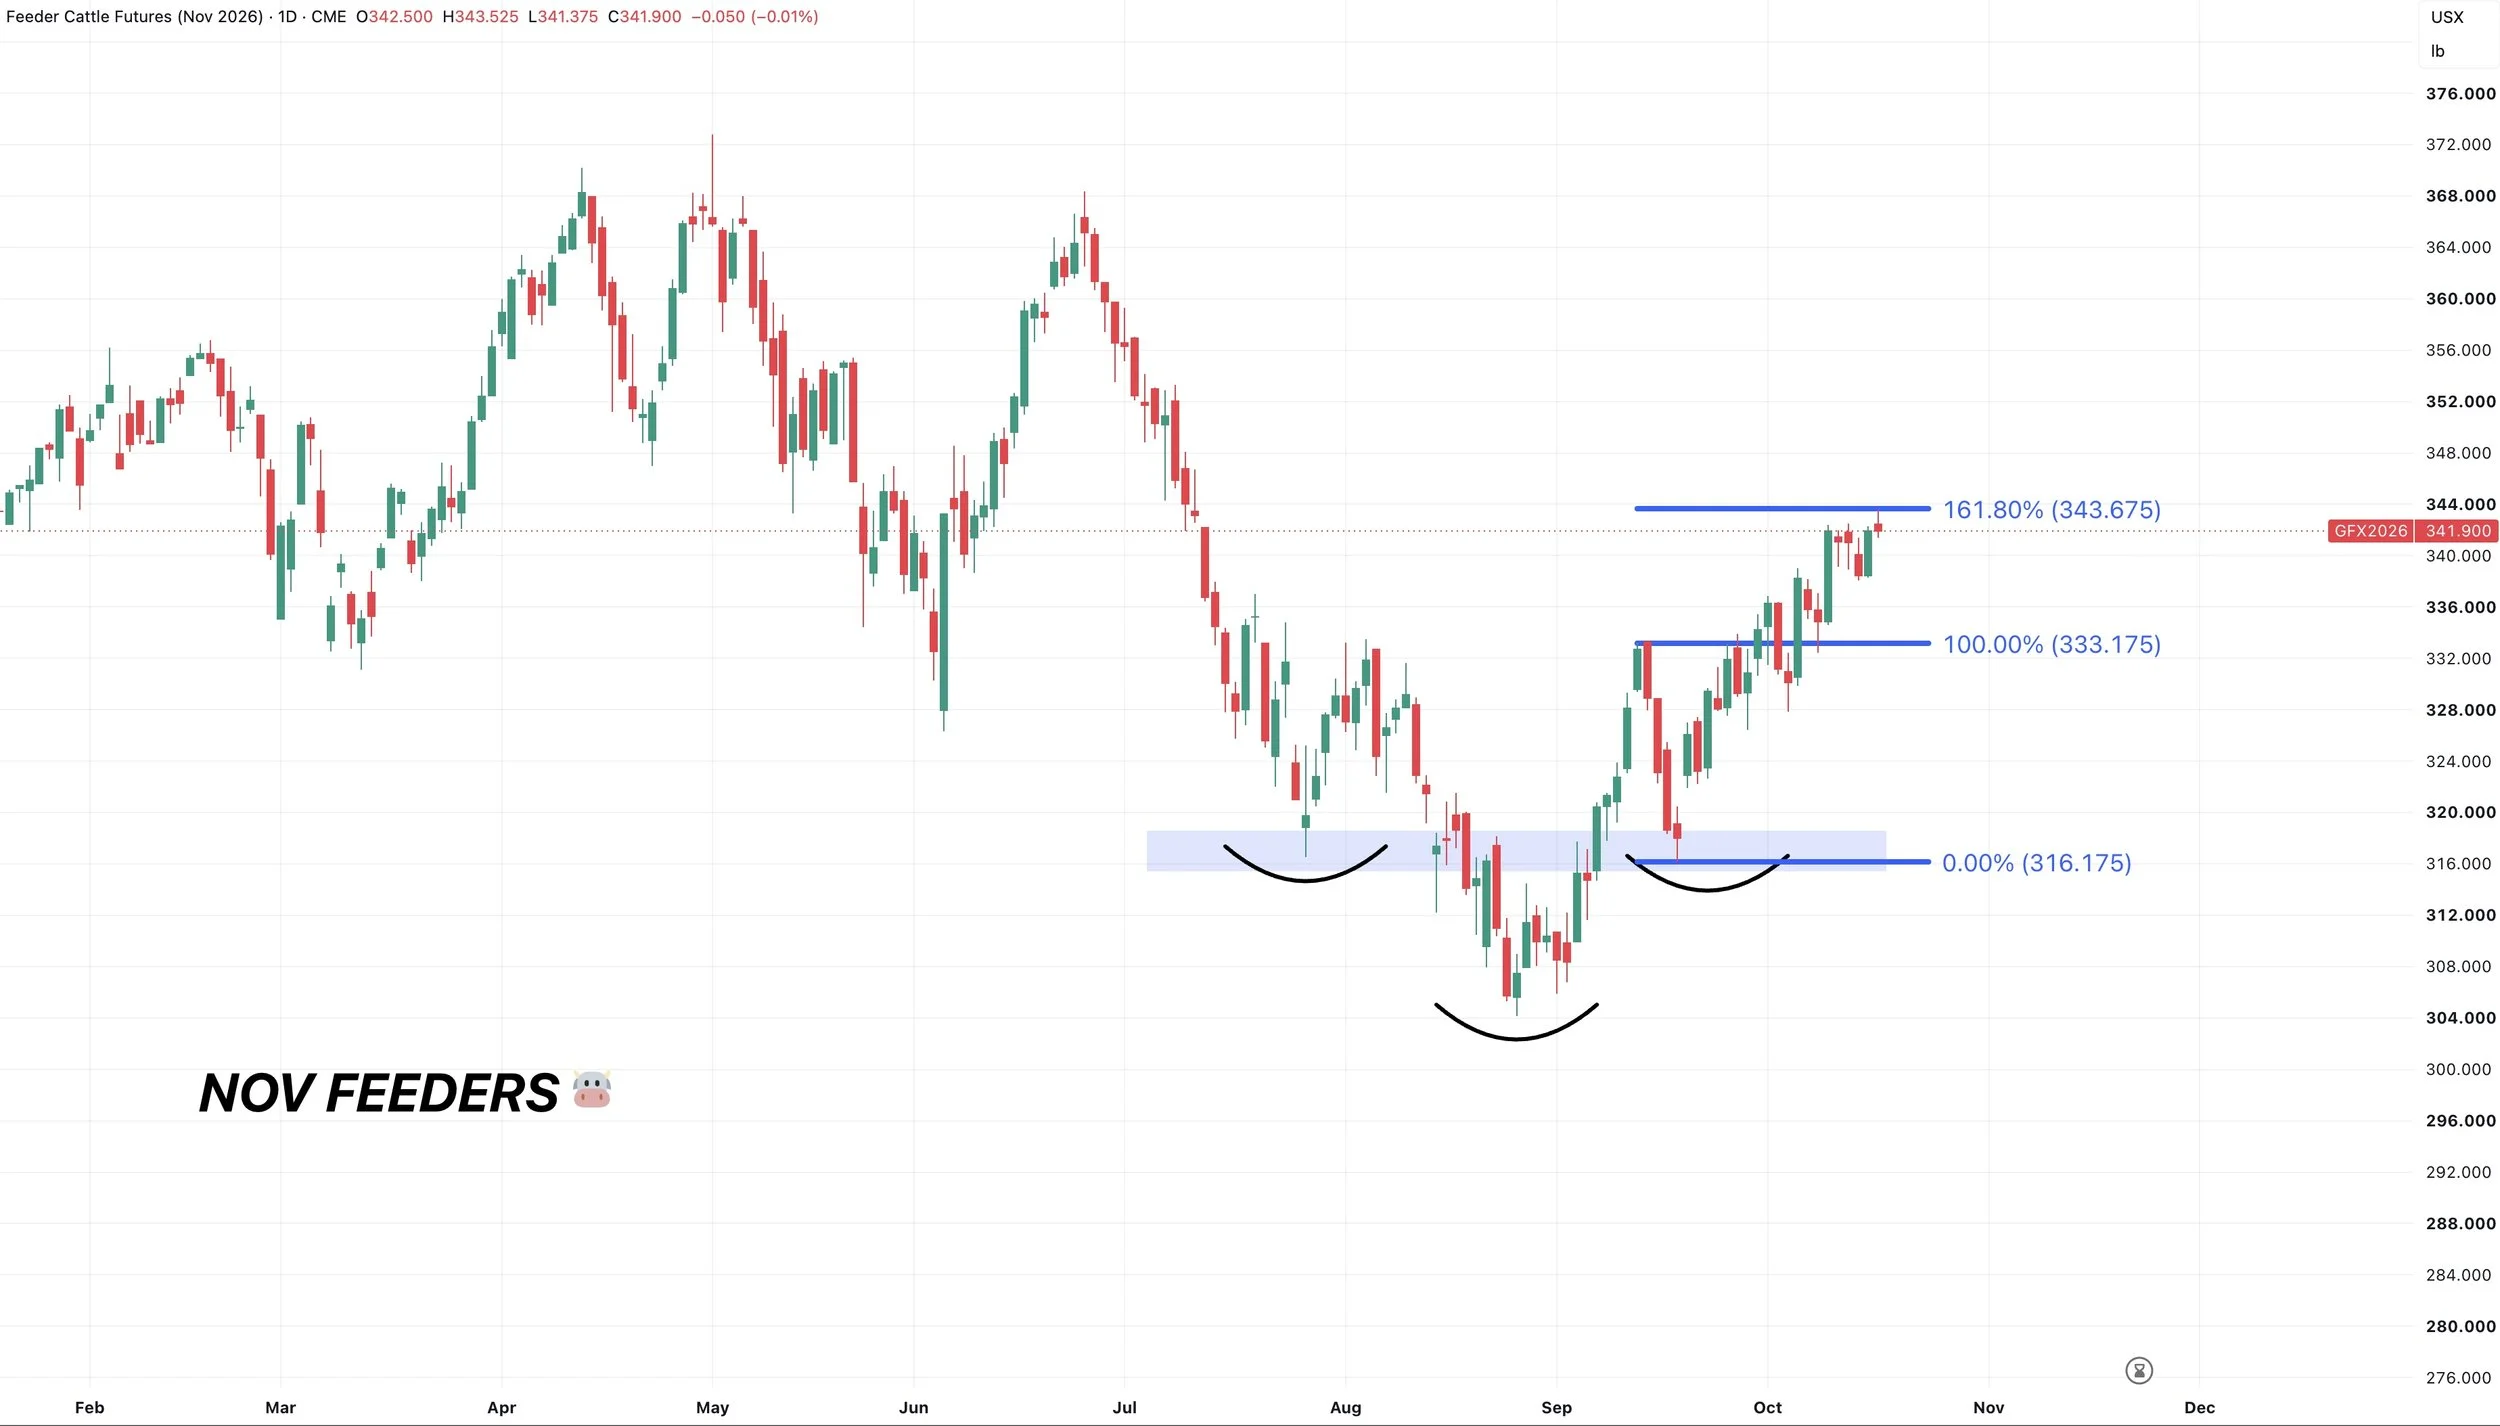
Feeders also tagged the 161.8% level from the recent lows up to the September highs.
Which is another common spot for a target.
At the same time, this current rally is also the exact same size as the first rally we saw off the lows.
So given all of these factors, we like getting a start on managing some risk.
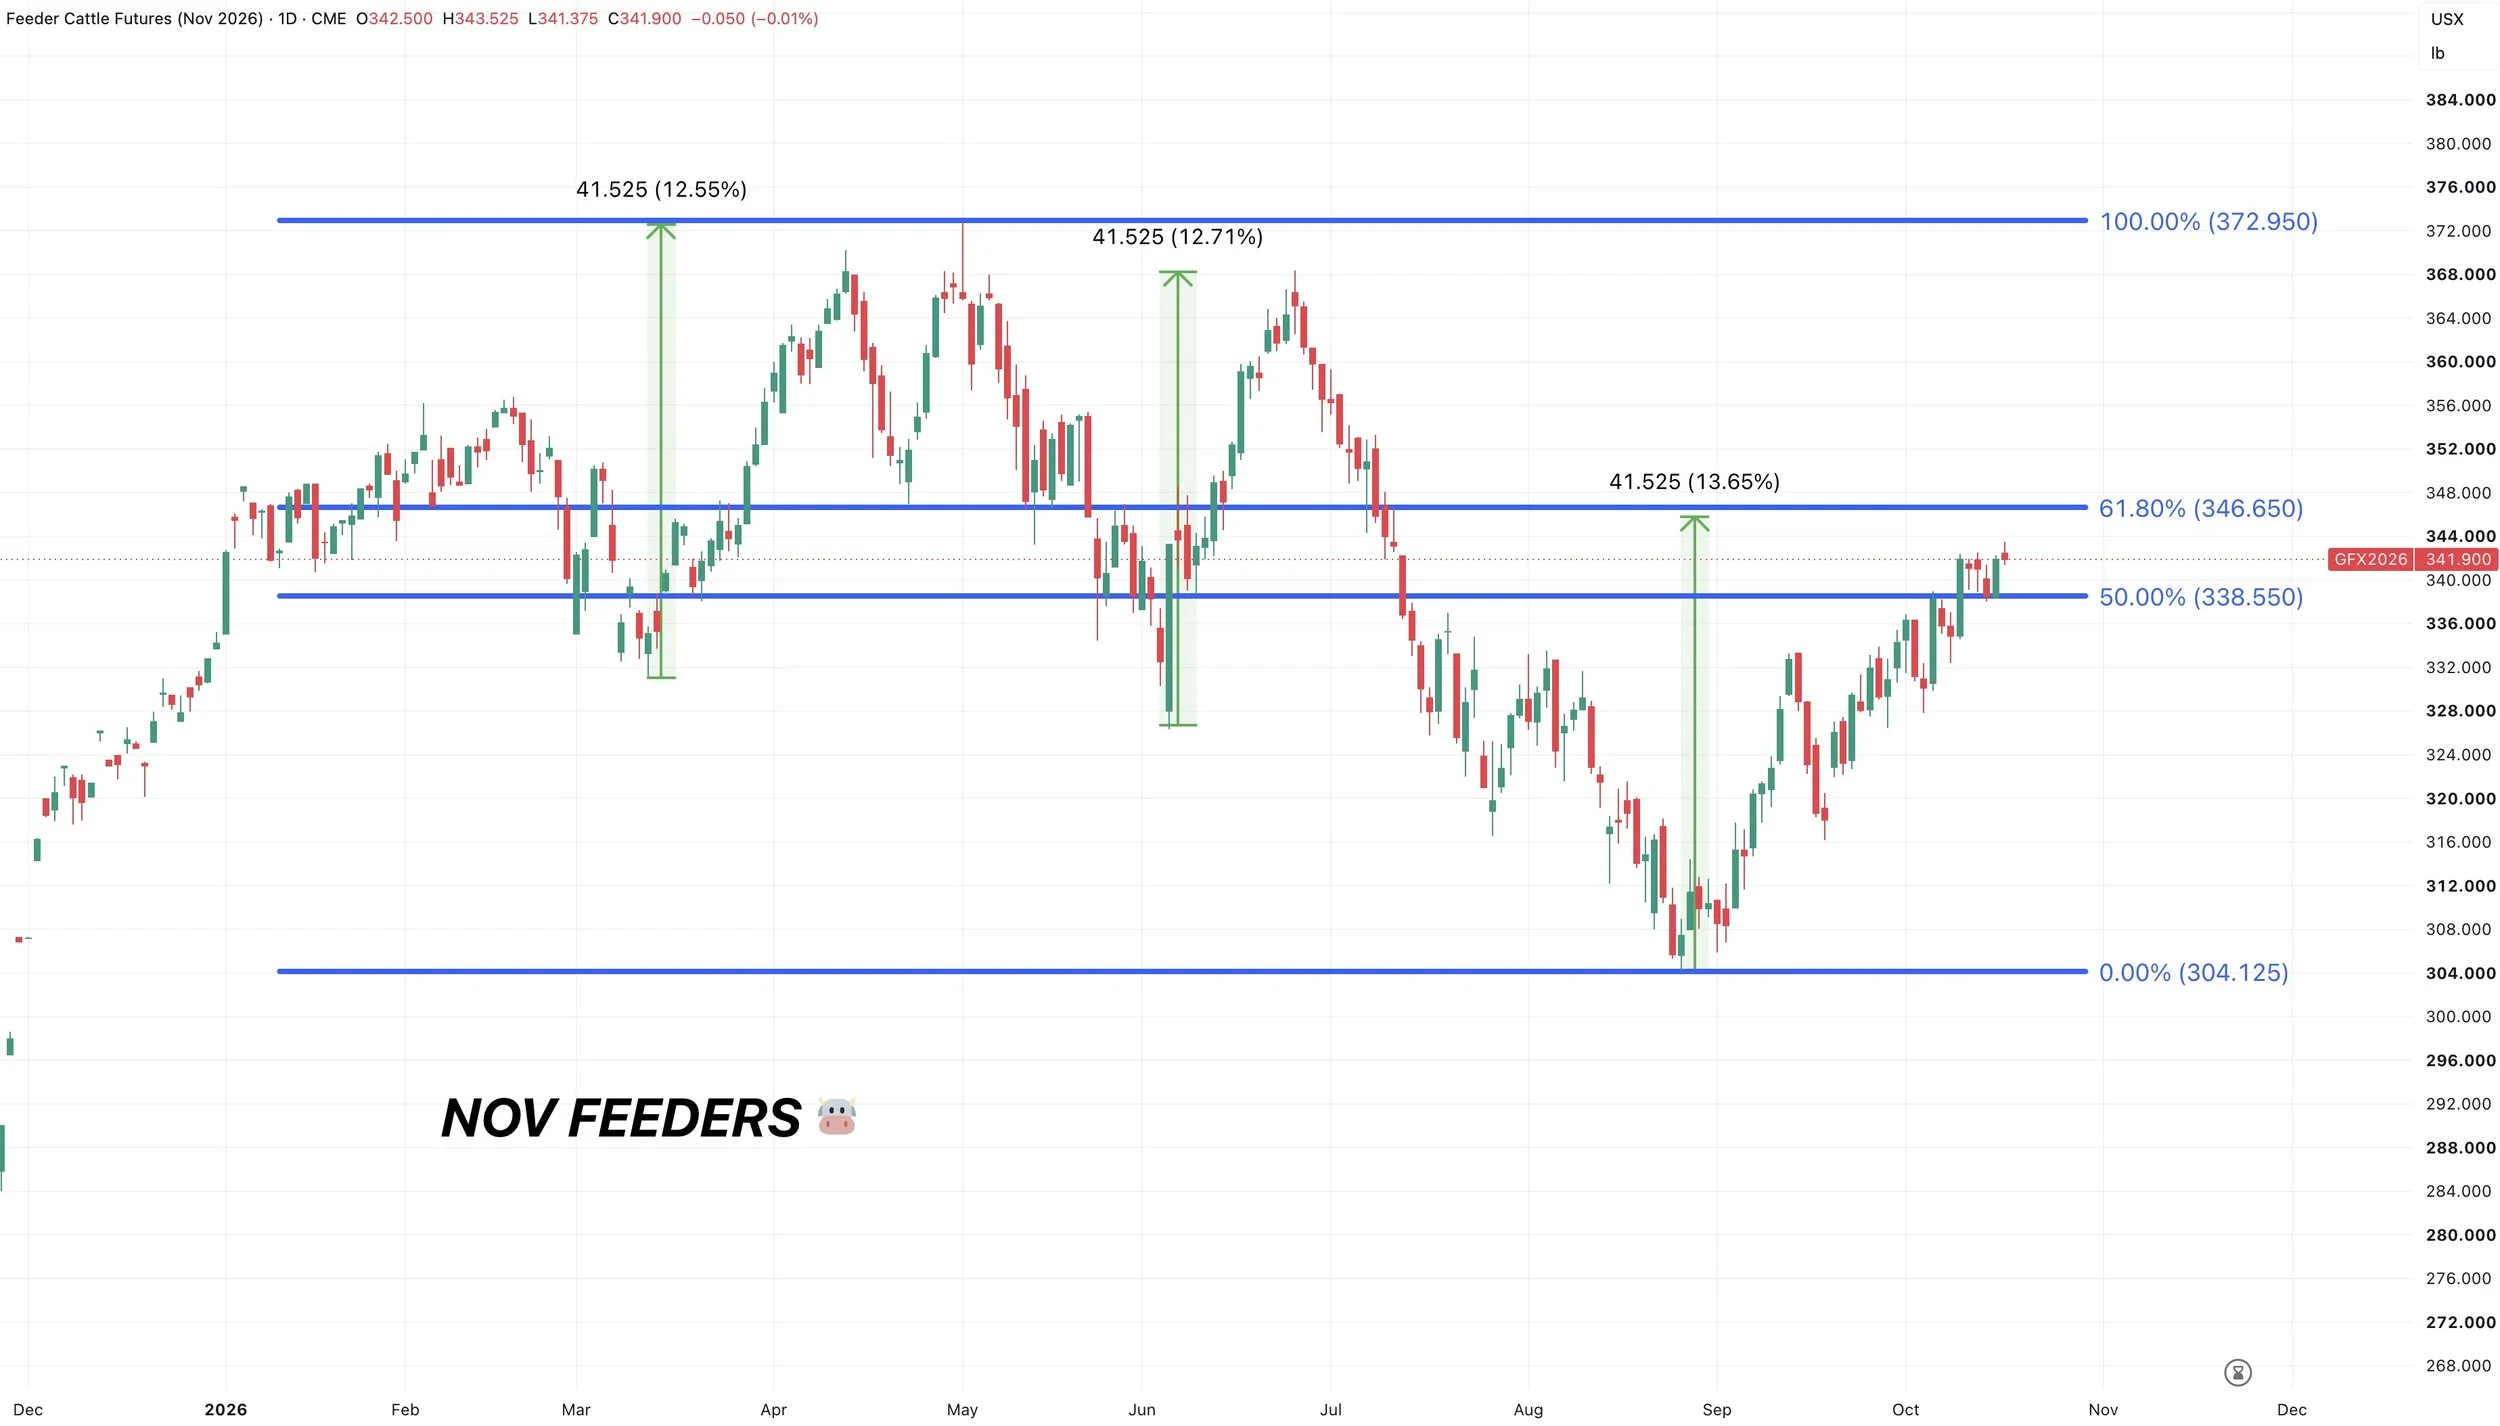
This entire rally off the lows is also about the same size as the previous two rallies in this market.
I thought that was interesting.
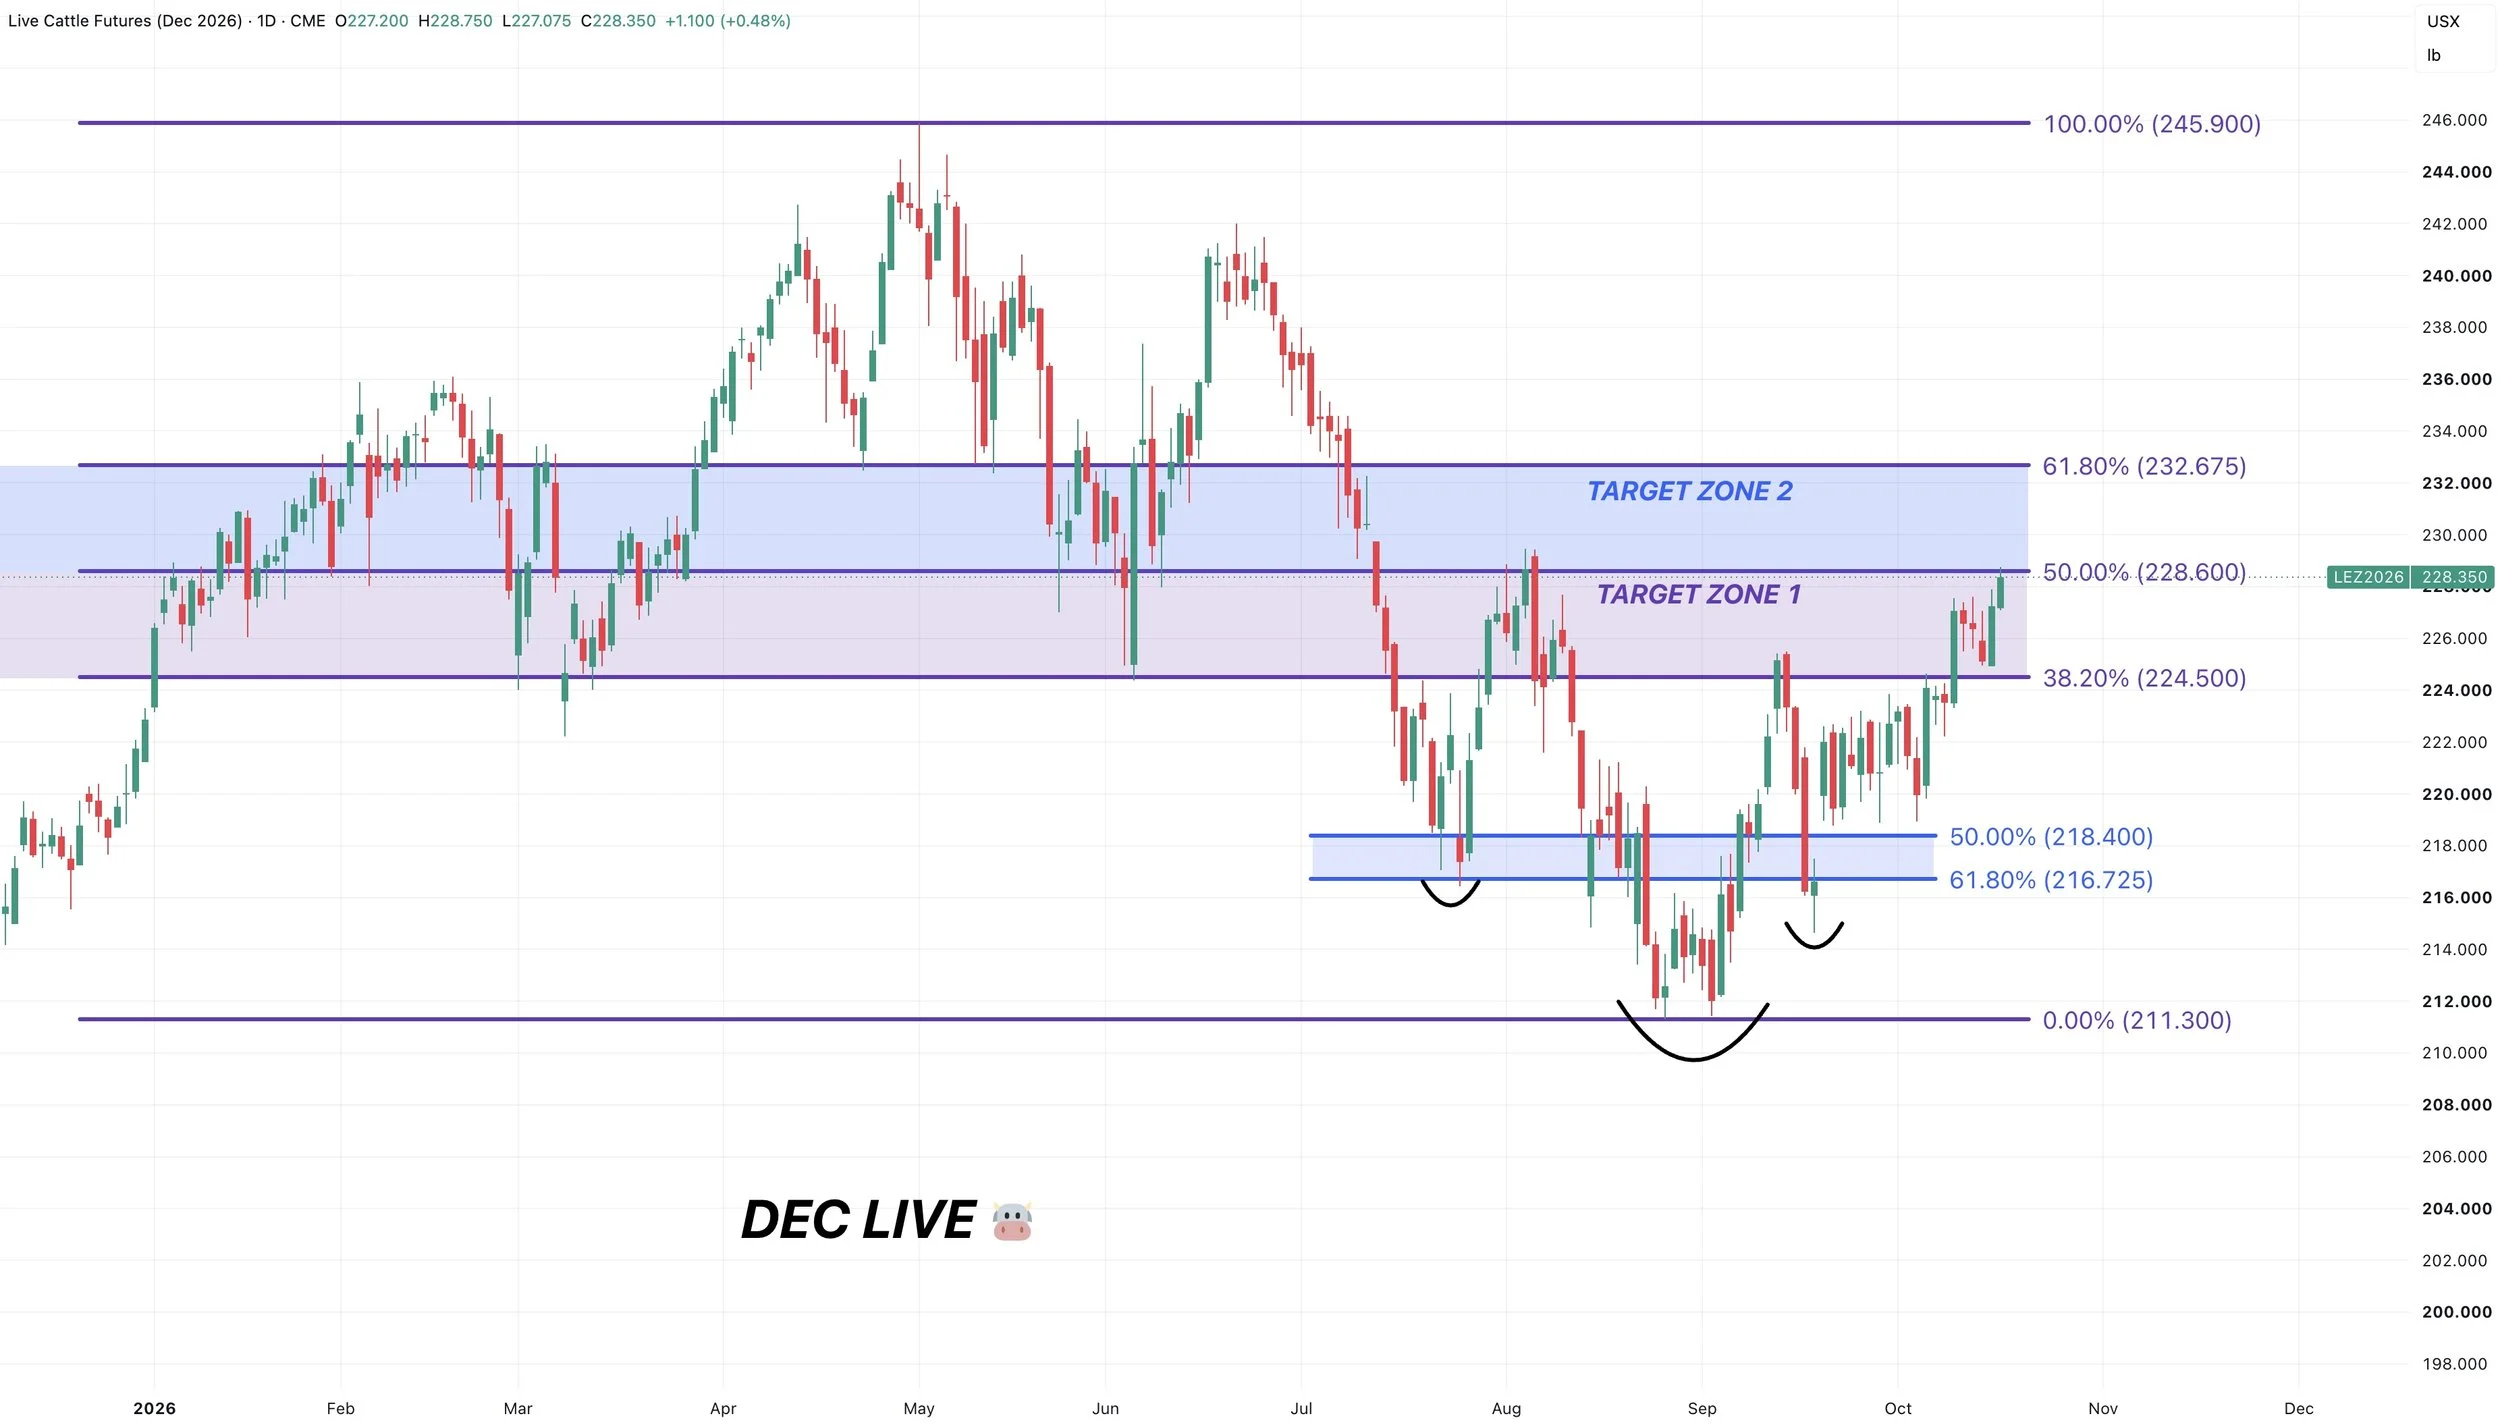
Dec Live Chart:
Live cattle has clawed back 50% of the entire sell off.
This same area has offered support and resistance in the past.
This rally is the exact same size as the first rally off the lows.
If you are able to clear this level, the next point of interest is the 61.8% level.
But for now like getting started on some risk management.
Want to Talk?
Our phones are open 24/7 for you guys if you ever need anything or want to discuss your operation.
Jeremey & Office: (806)484-1214
Sebastian: (605)280-1186
Email: sfrost@dailymarketminute.com
Hedge Account
Interested in a hedge account? Use the link below to set up an account or give us a call.