
AUDIO COMMENTARY
Corn inside USDA range
What first notice day could bring
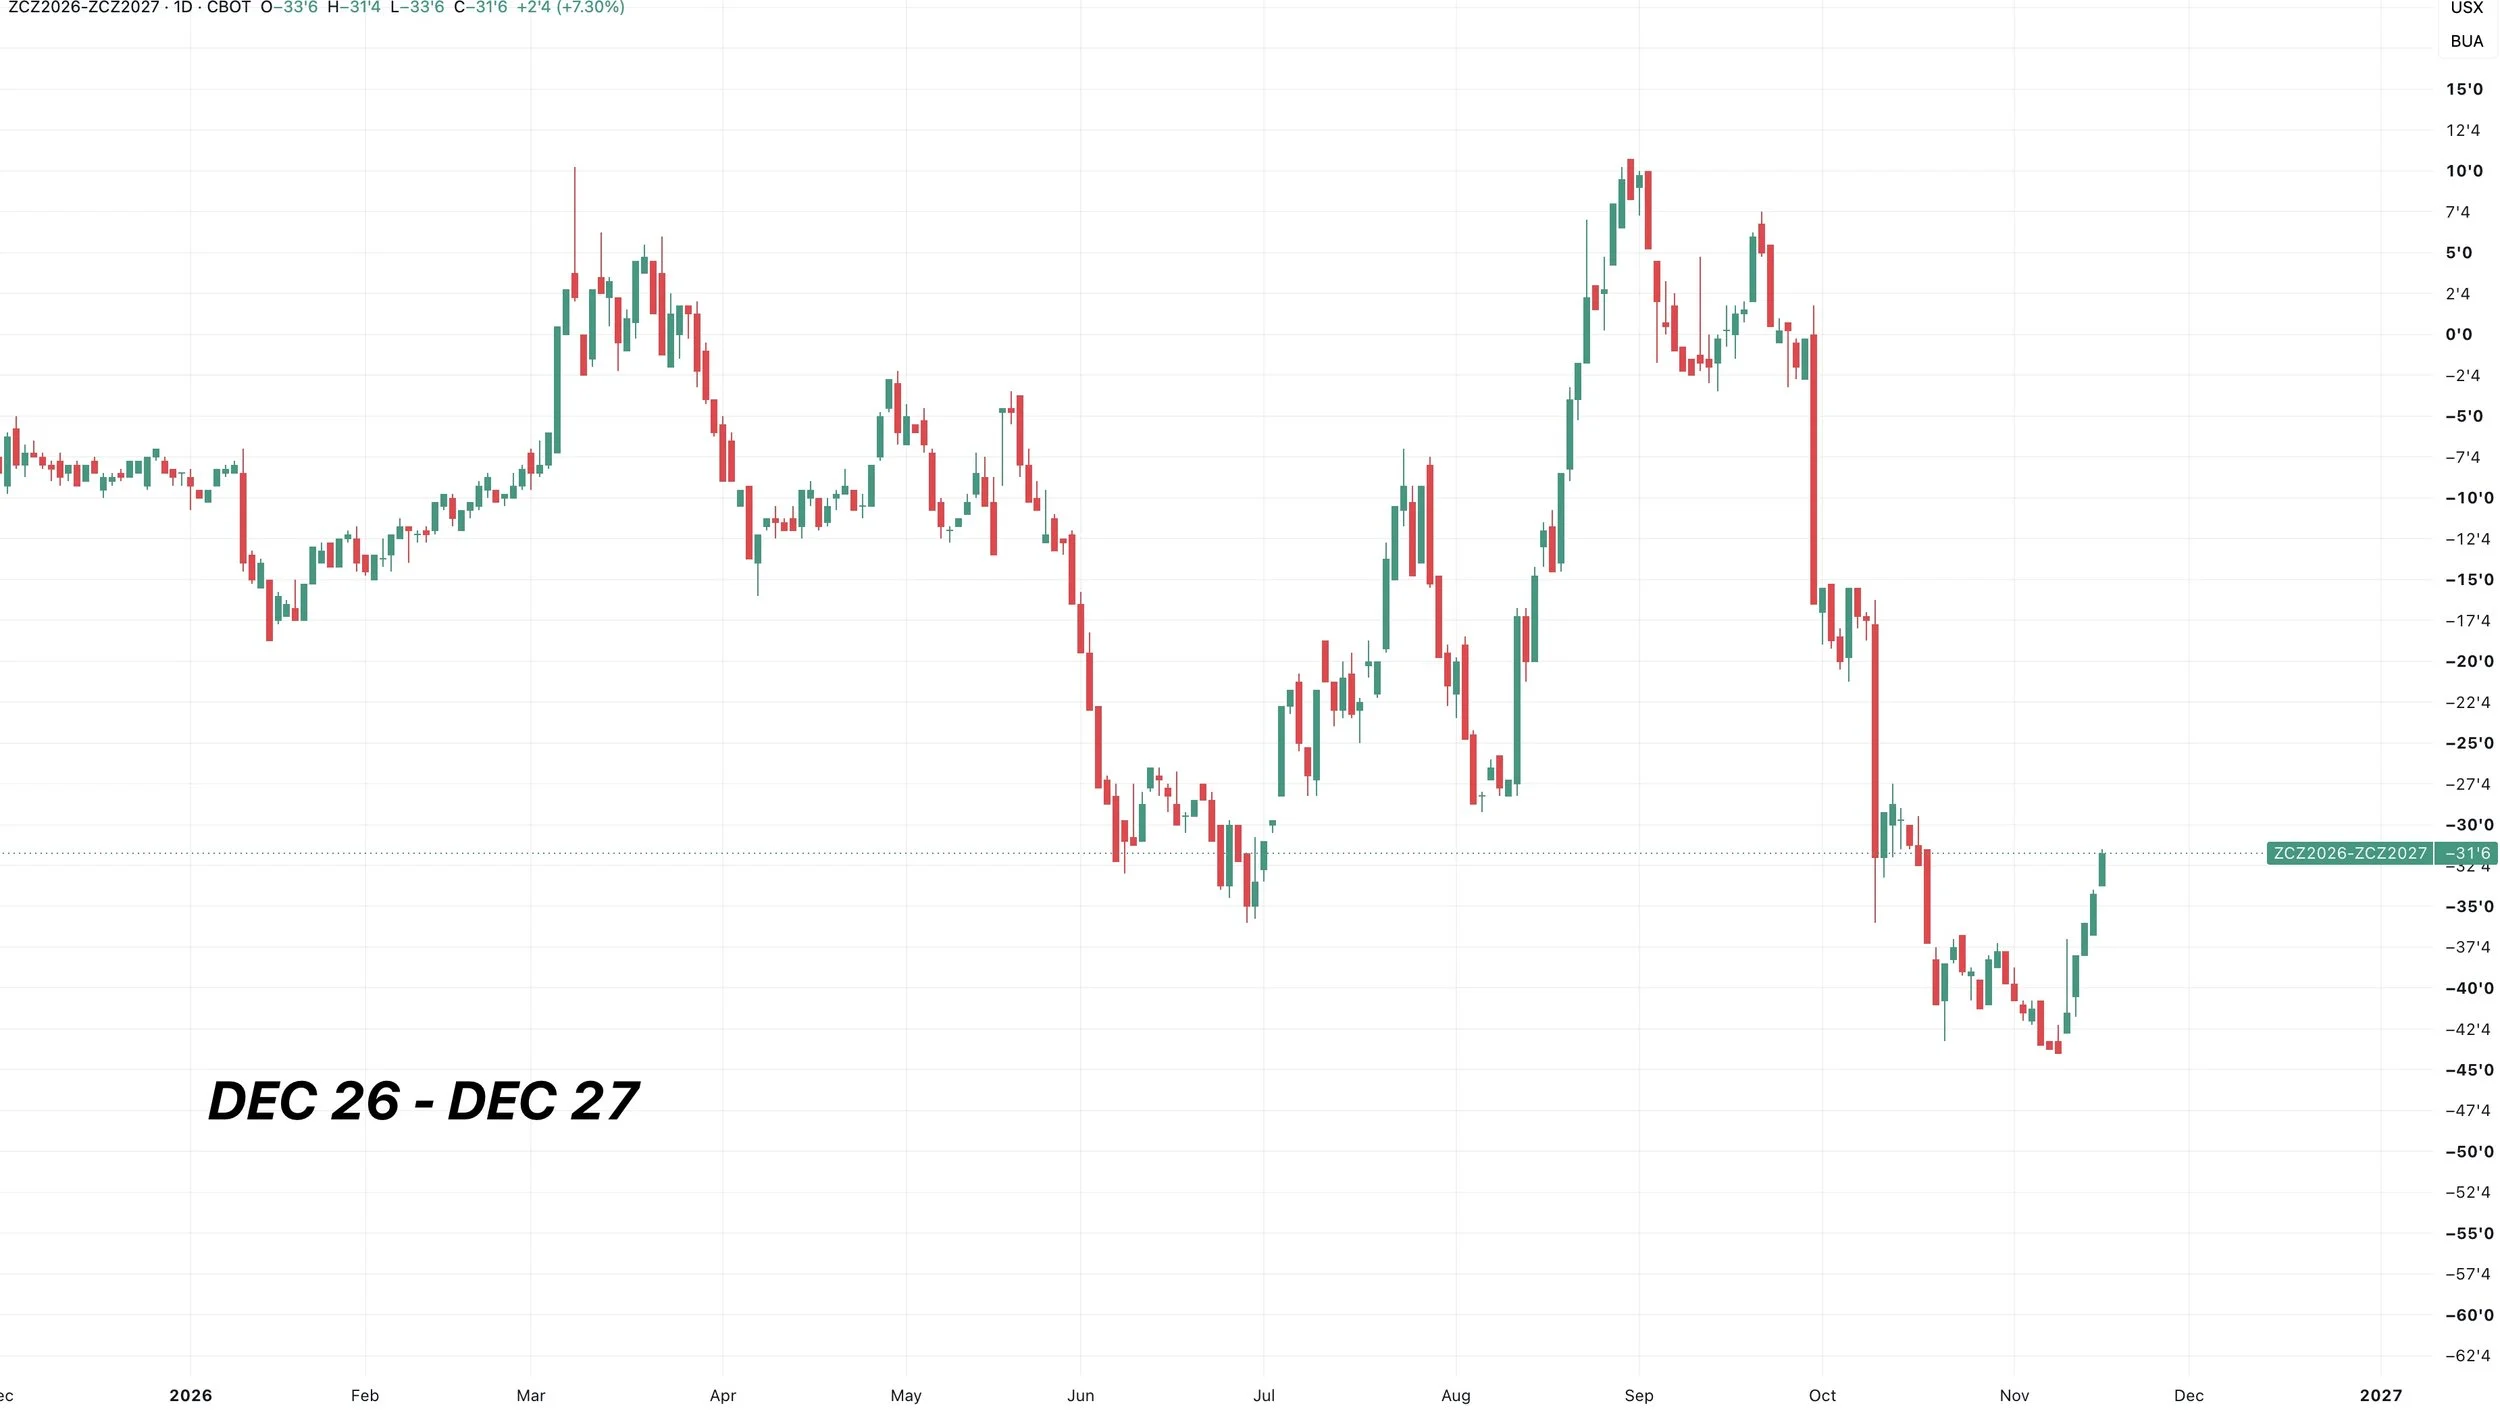
Corn spread firmed 5 days in a row
Spreads showing a good sign
If spread continues to firm it will be a sign the market is telling us the supply is not quiet there
Best wheat inspections in a long time
KC is at a discount to MPLS now
MPLS taking some carry out
What to know when selling & hedging wheat
Divergences in wheat. KC wheat posting new lows while MPLS and Chicago are not
Why wheat could put in longer term lows
NOPA numbers were great
South America weather and demand
Iowa harvest back more in line
USDA answered some of our questions
Could acres come down?
The USDA needs to give more answers
We think balance sheet could shrink from here
Home run type of trades on watch
Until demand slows, feels like upside is there
When to expect corn exports to improve
When would corn exports become a concern?
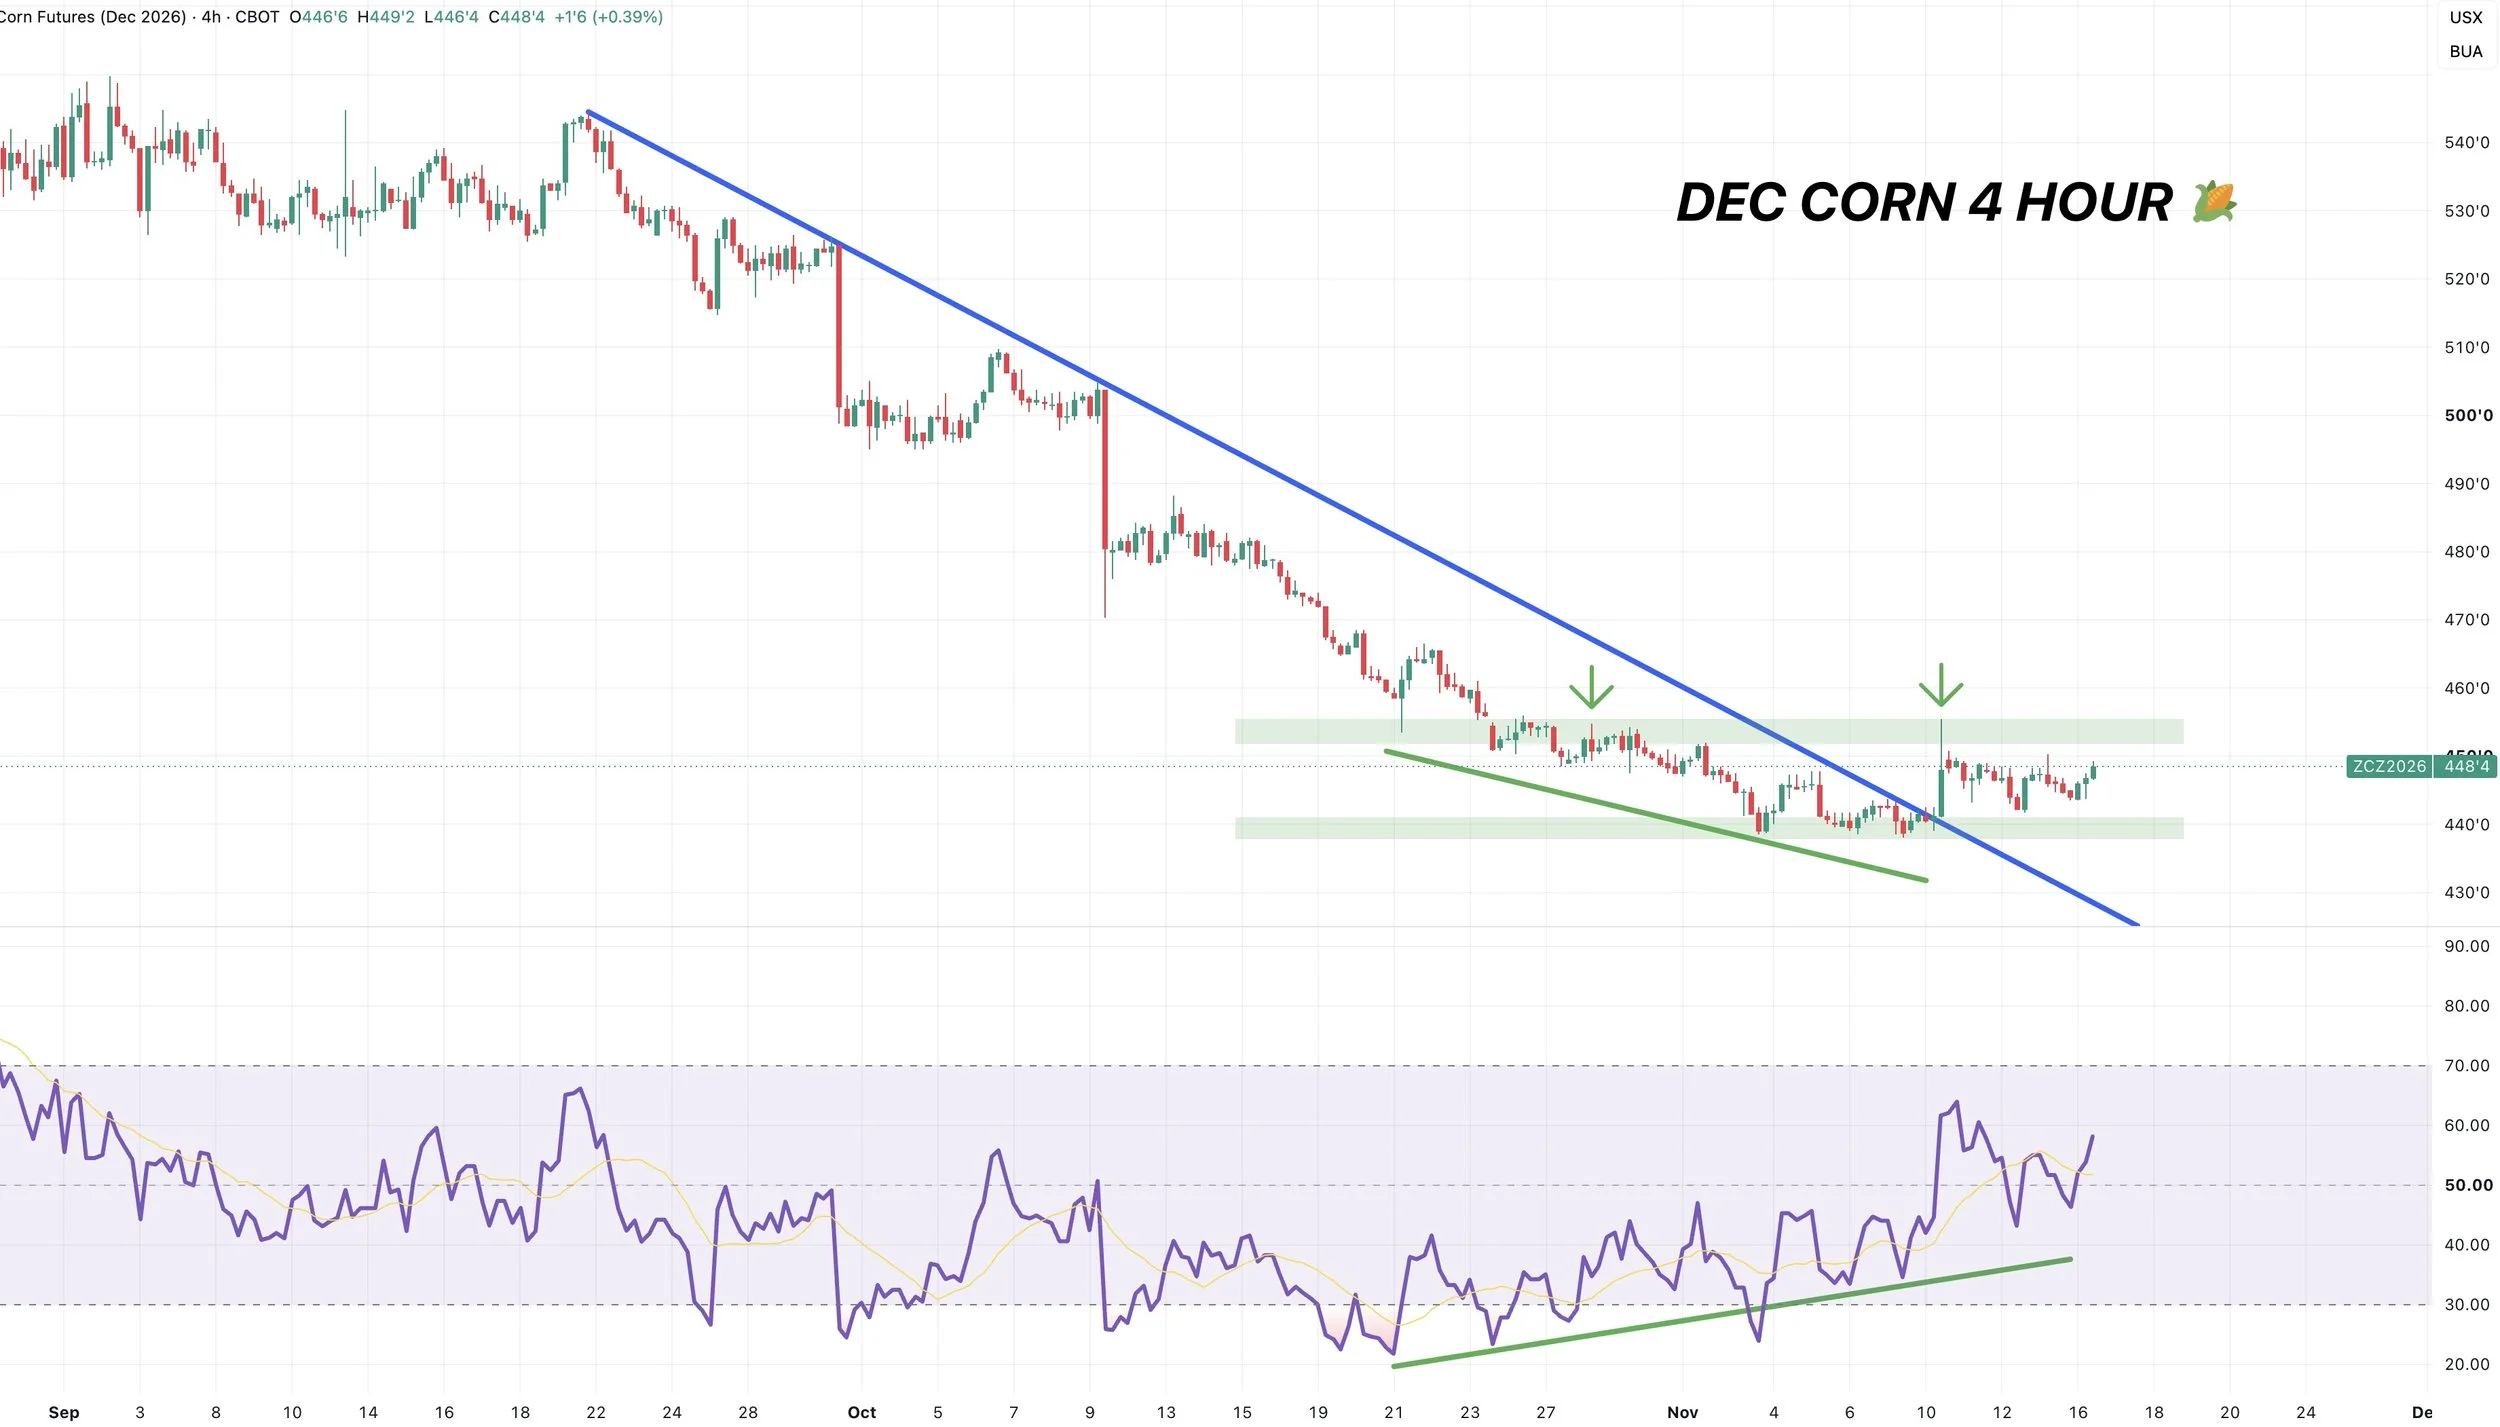
Bullish divergences on the RSI in both corn & wheat (charts below)*
USDA answers attached below audio*
Listen to today’s audio below
Want to talk?
Office: (806)484-1214
USDA QUESTIONS ANSWERED
Here is a link to the all the questions we asked and the replies we received and did not receive.
CORN & WHEAT CHARTS
From Sebastian:
I will have full chart breakdowns on everything in tomorrow’s update. I just wanted to once again show the bullish divergences that have been building in the corn and wheat market and why we are watching them.
Dec-26 to Dec-27 Spread:
First off I just wanted to show the corn spread chart.
Like Jeremey mentioned in the audio, it has traded higher for 5 days in a row even on the days where corn has traded lower.
If this continues to firm up, it is viewed as a friendly sign.
Dec Corn: 4 Hour
We have clear bullish divergence that has been building.
However, we need to break above the USDA report day highs to spark a leg higher.
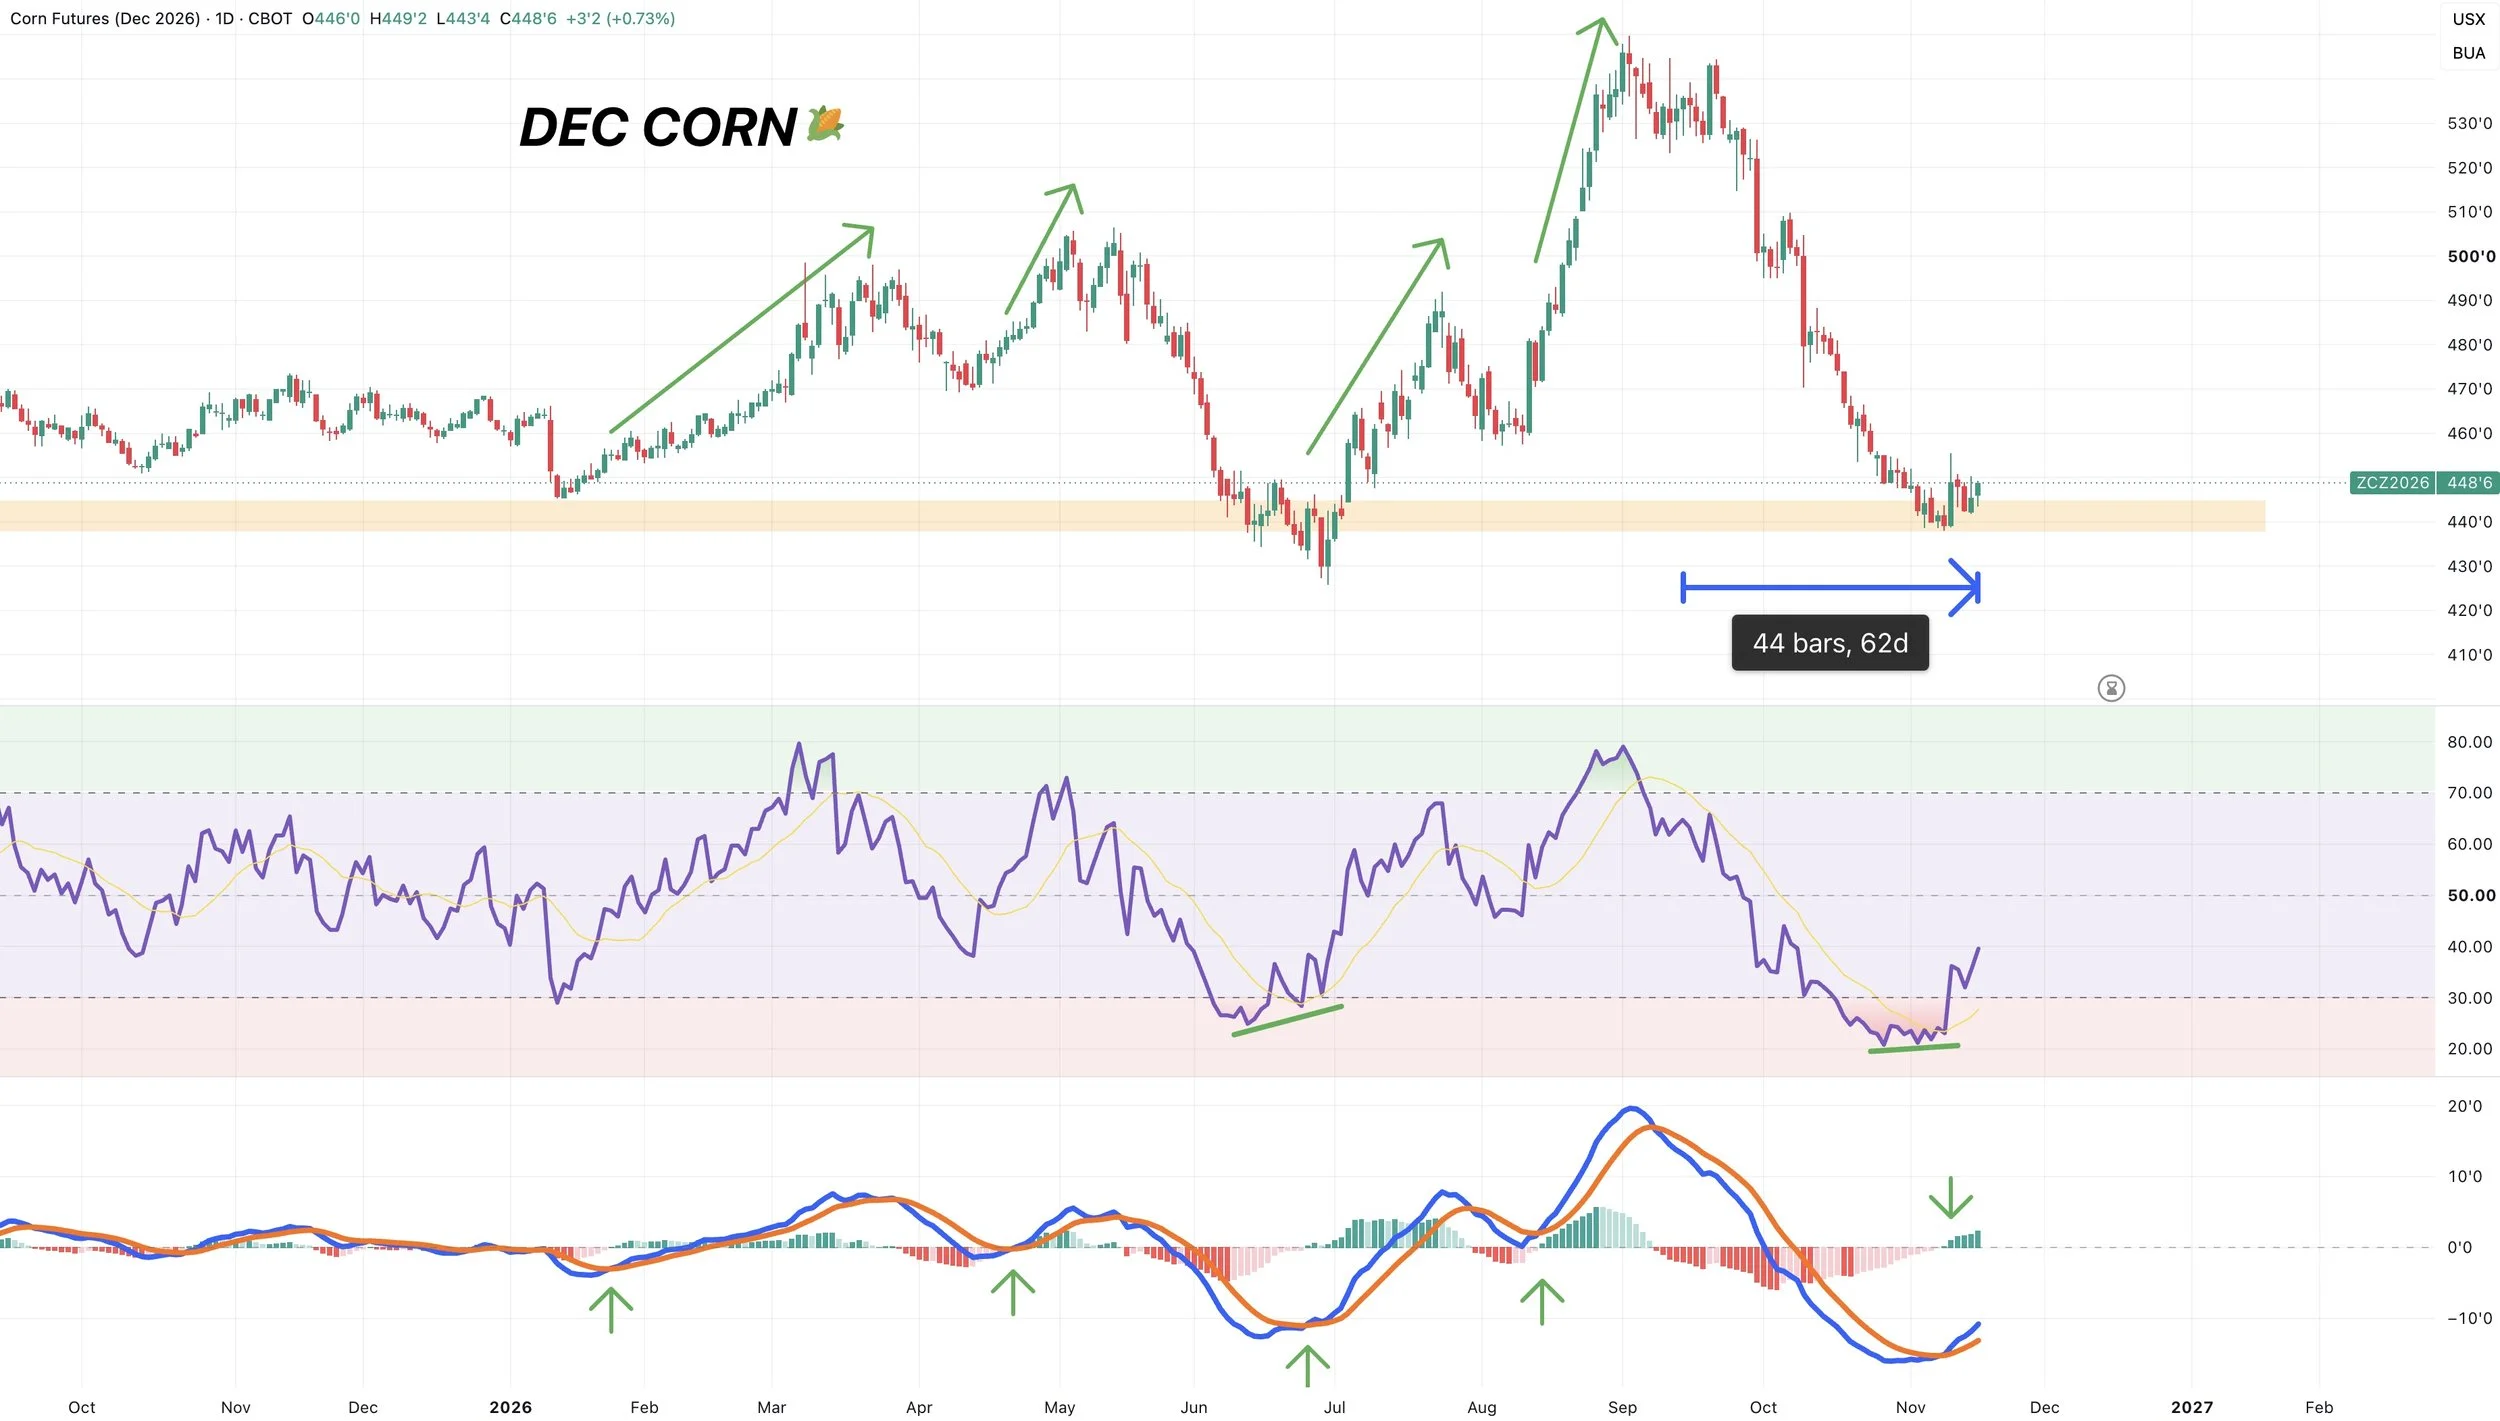
Dec Corn: Daily
We have bullish divergence on the RSI. The last one marked the June lows.
We had the MACD cross bullish last week.
So far.. each time at least a nice bounce has followed.
So the potential signs of a bottom are there. By far the best sign we’ve had of one.
Also this was corn’s first time closing higher for back to back green days in 62 days.
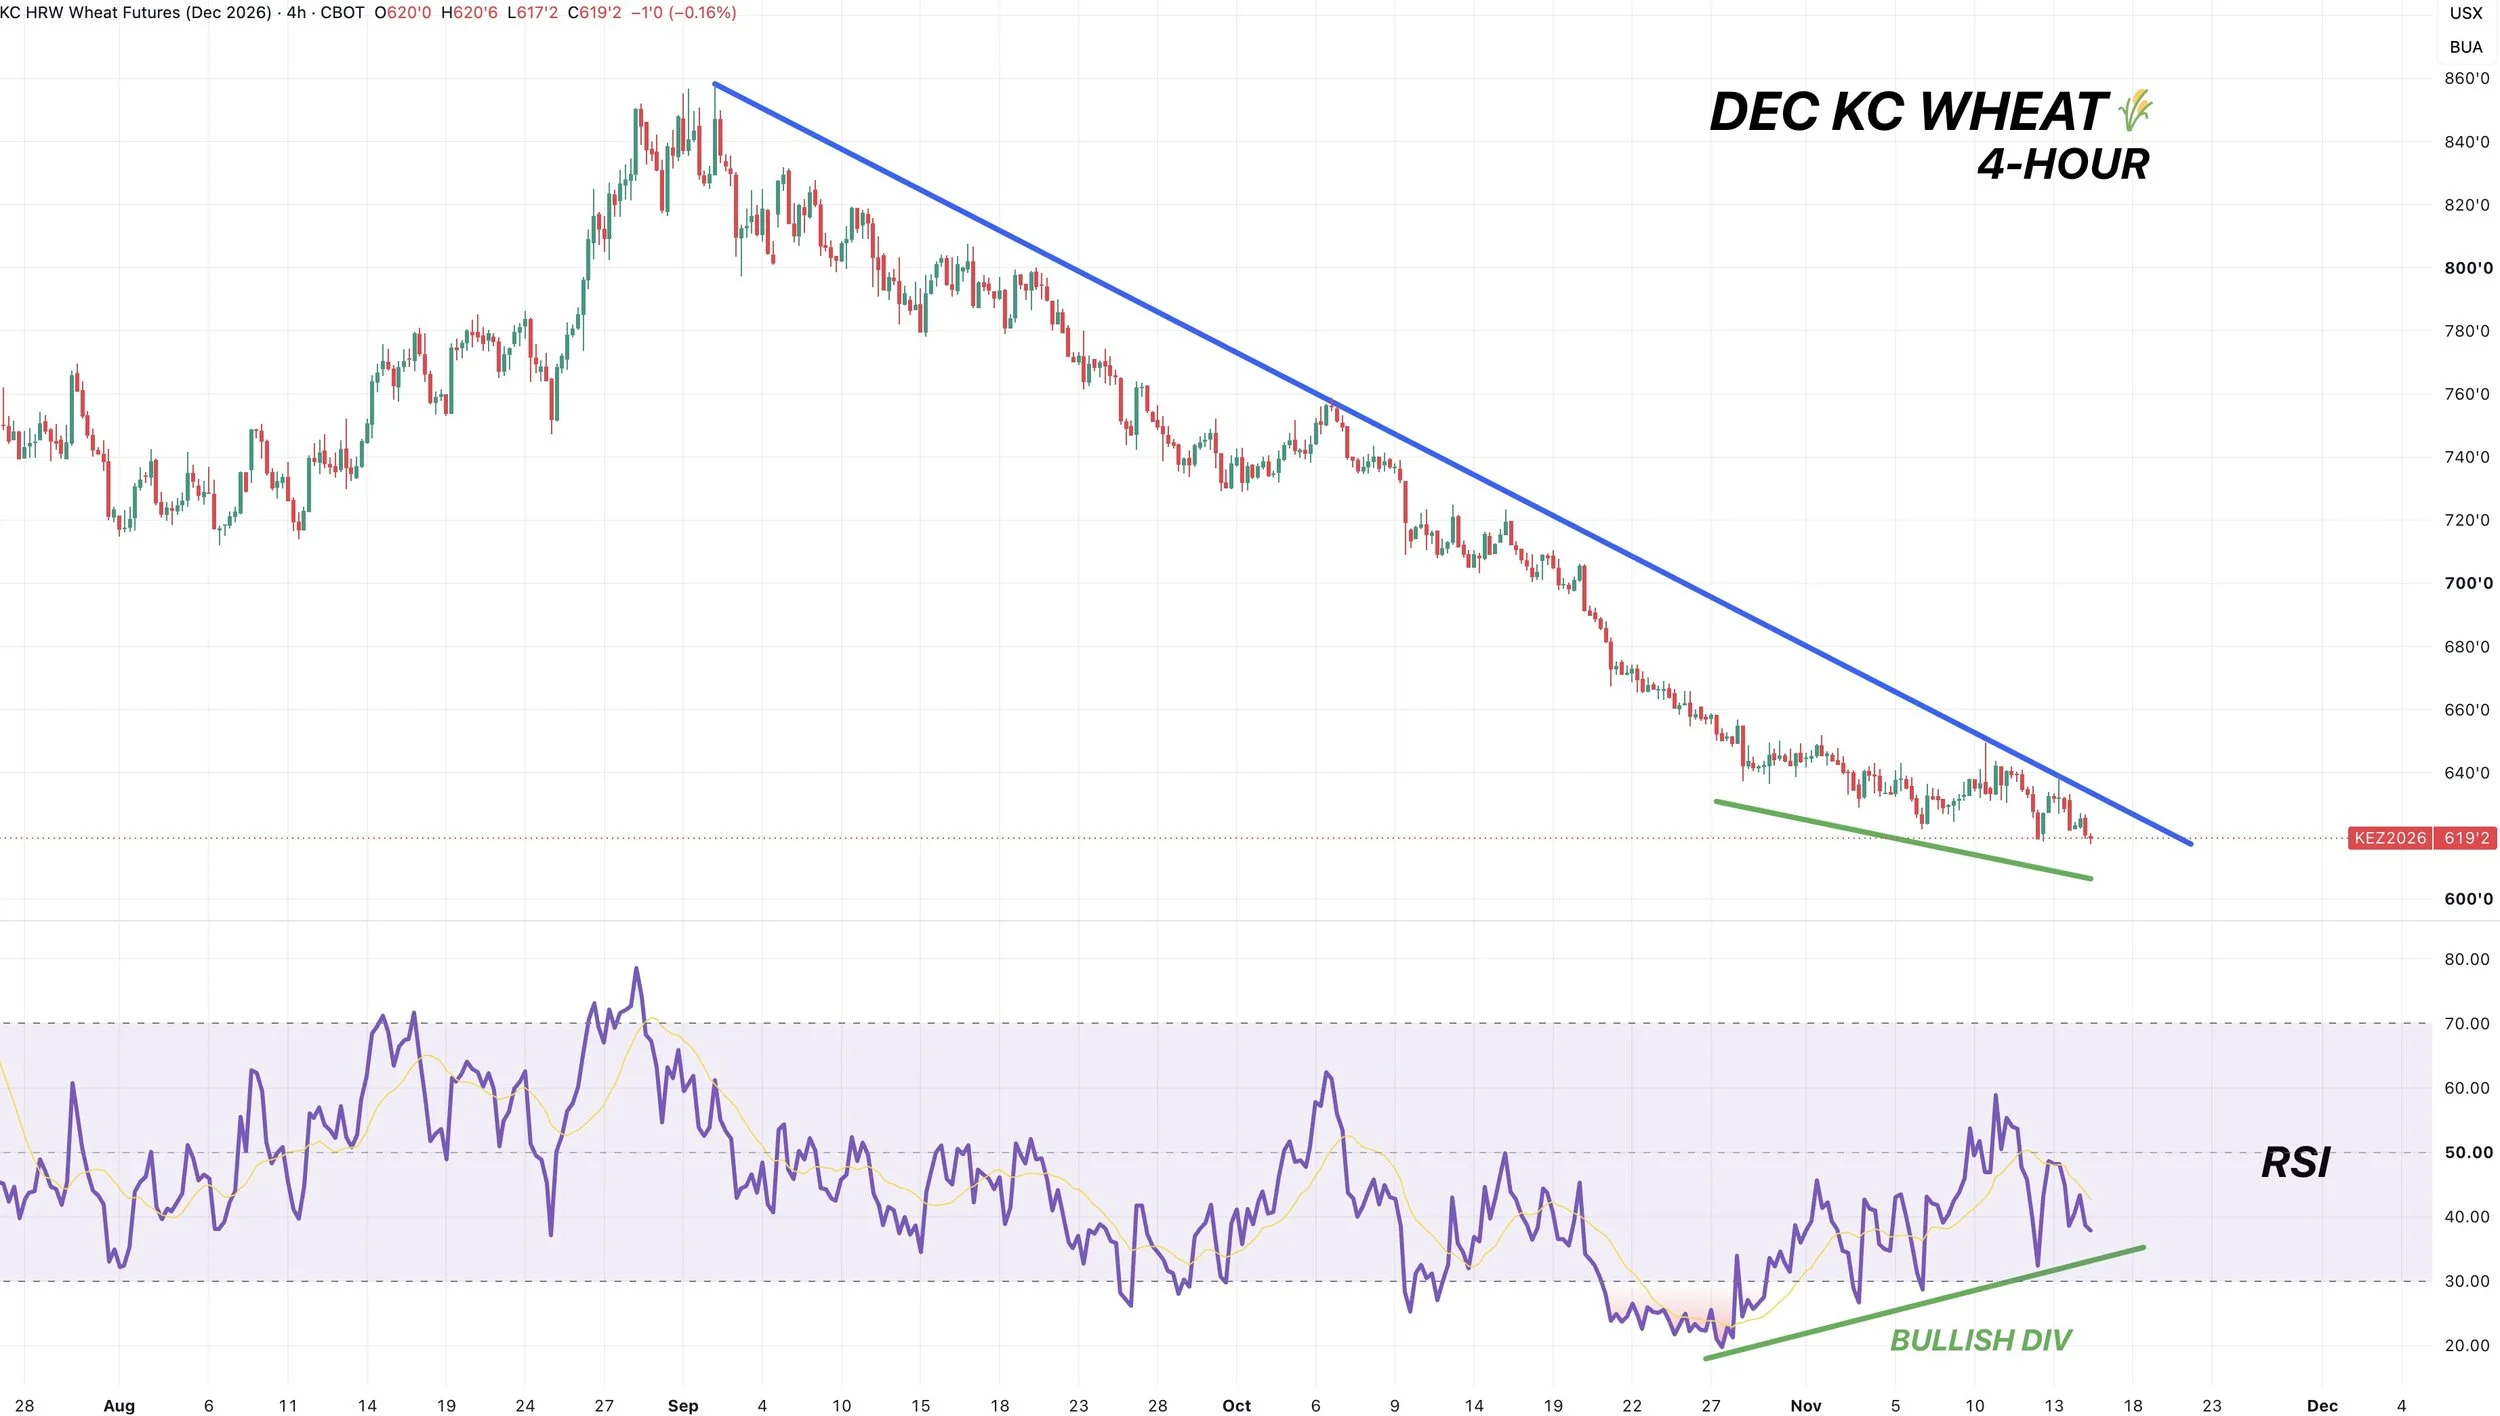
KC Wheat: 4 Hour
Wheat sucks. We posted new lows yet again.
Despite this.. we continue to print bullish divergence.
The RSI continues to print higher lows and is not following the prices.
Look at prices. Then look at where the RSI is. Every new low in prices has been met with a higher low on the RSI.
This is seen as a bullish sign, as it signals the sellers are losing steam.
It’s not an automatic confirmation of a bottom, but it is viewed as bullish. And is one potential sign of a bottom.
For some confirmation of a bottom, we want to see us break that downtrend resistance. We’ve respected and rejected that several times the entire sell off.
Want to Talk?
Our phones are open 24/7 for you guys if you ever need anything or want to discuss your operation.
Jeremey & Office: (806)484-1214
Sebastian: (605)280-1186
Email: sfrost@dailymarketminute.com
Hedge Account
Interested in a hedge account? Use the link below to set up an account or give us a call.