
MARKET UPDATE
You can scroll to read the usual update as well. As the written version is the exact same as the video.
Timestamps for video:
Overview: 0:00min
Corn: 2:35min
Corn Charts: 7:25min
Beans: 10:30min
Bean Charts: 14:10min
Wheat Charts: 16:10min
Cattle Charts: 17:30min
Want to talk?
Office: (806)484-1214
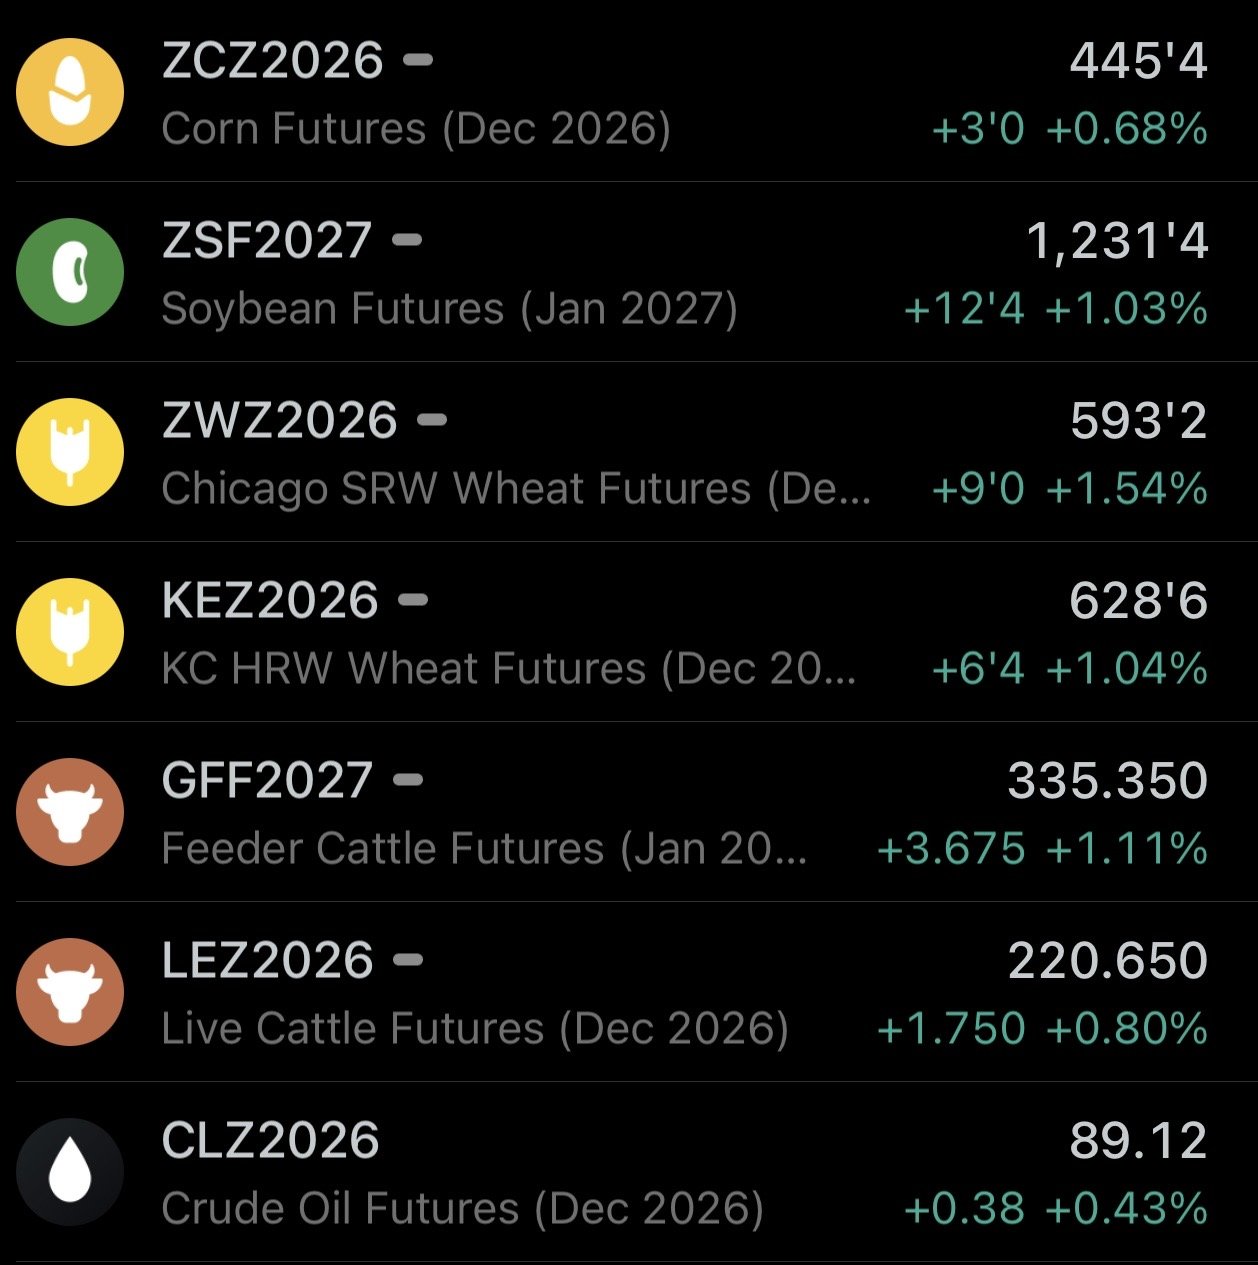
Futures Prices Close
Overview
It was a decent day and way to end the week for the grains as we closed higher across the board.
Although it was a fairly disappointing close. As we closed well off the early highs in everything.
Corn was up nearly +8 cents but finished up just +3.
Soybeans were up over +22 cents but ended up just +12.
KC wheat was up +17 cents but closed up just +6.
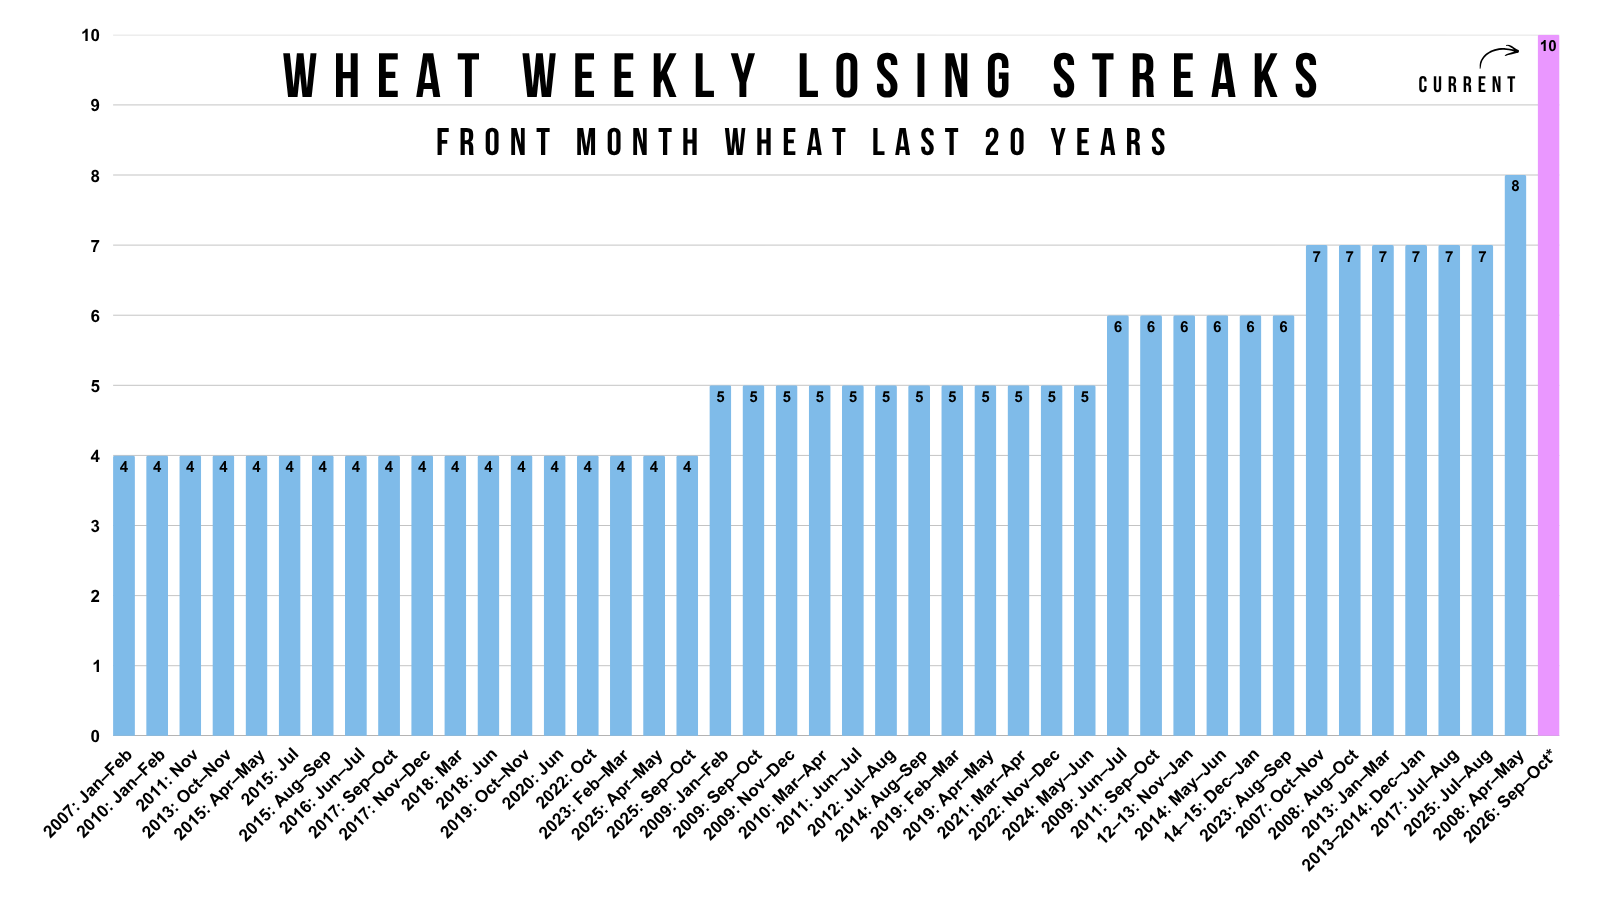
Wheat did however, finally snap it's all-time record losing streak.
As Chicago wheat ended the week fractionally higher. Up a whole +2 cents this week.
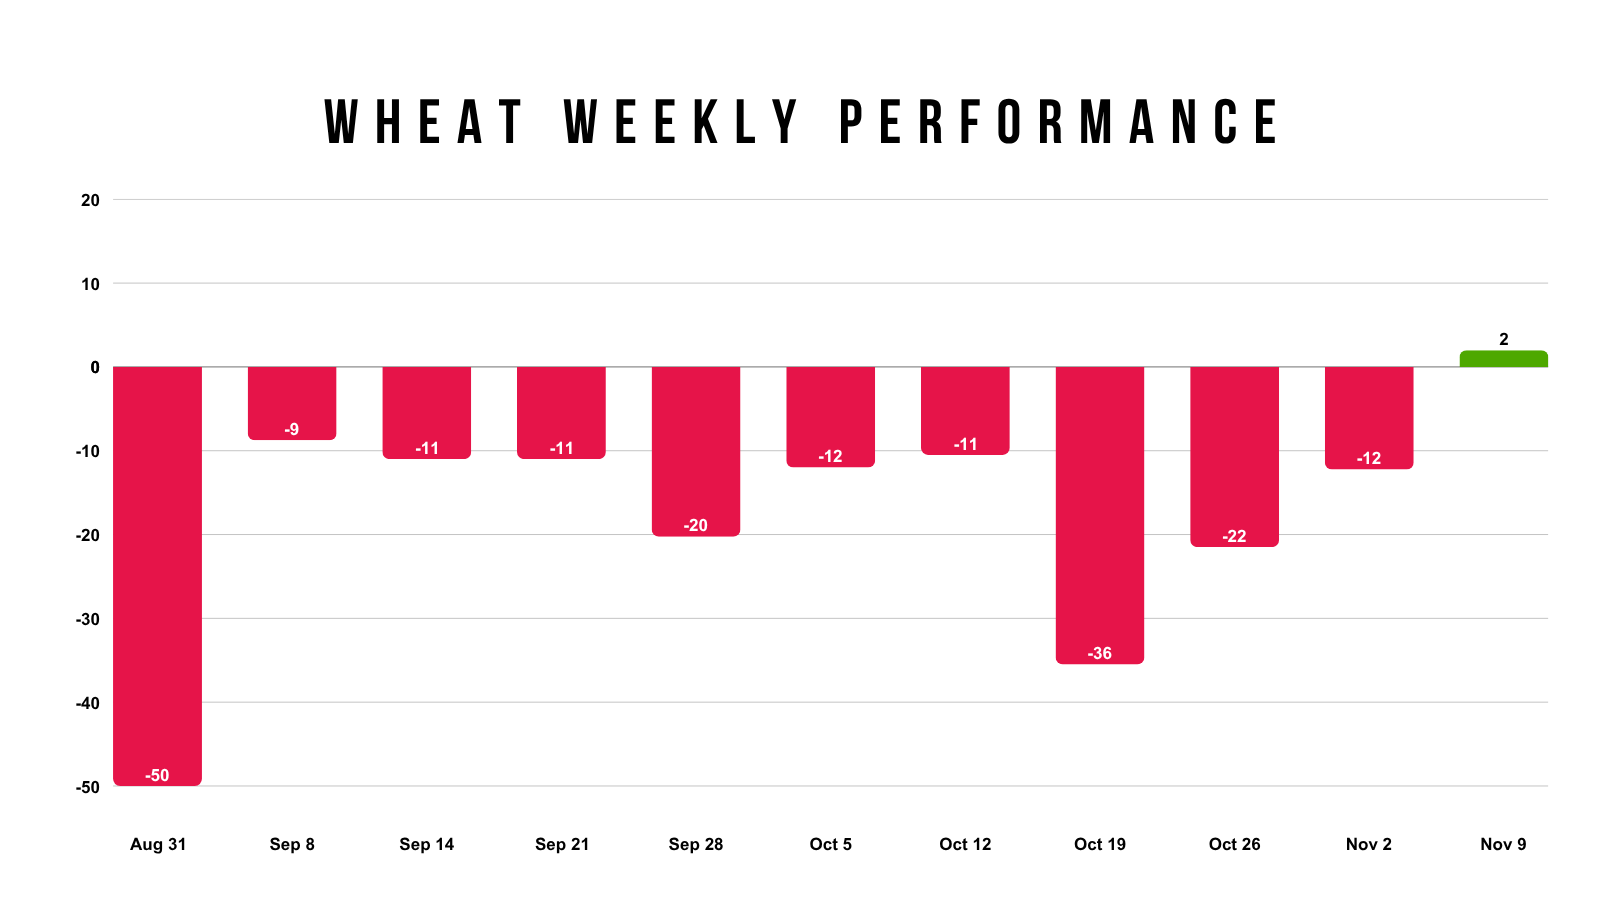
Obviously not much, but this is the first time we haven’t traded lower in 10 weeks. So nice to see.
This record shattered the previous losing record.
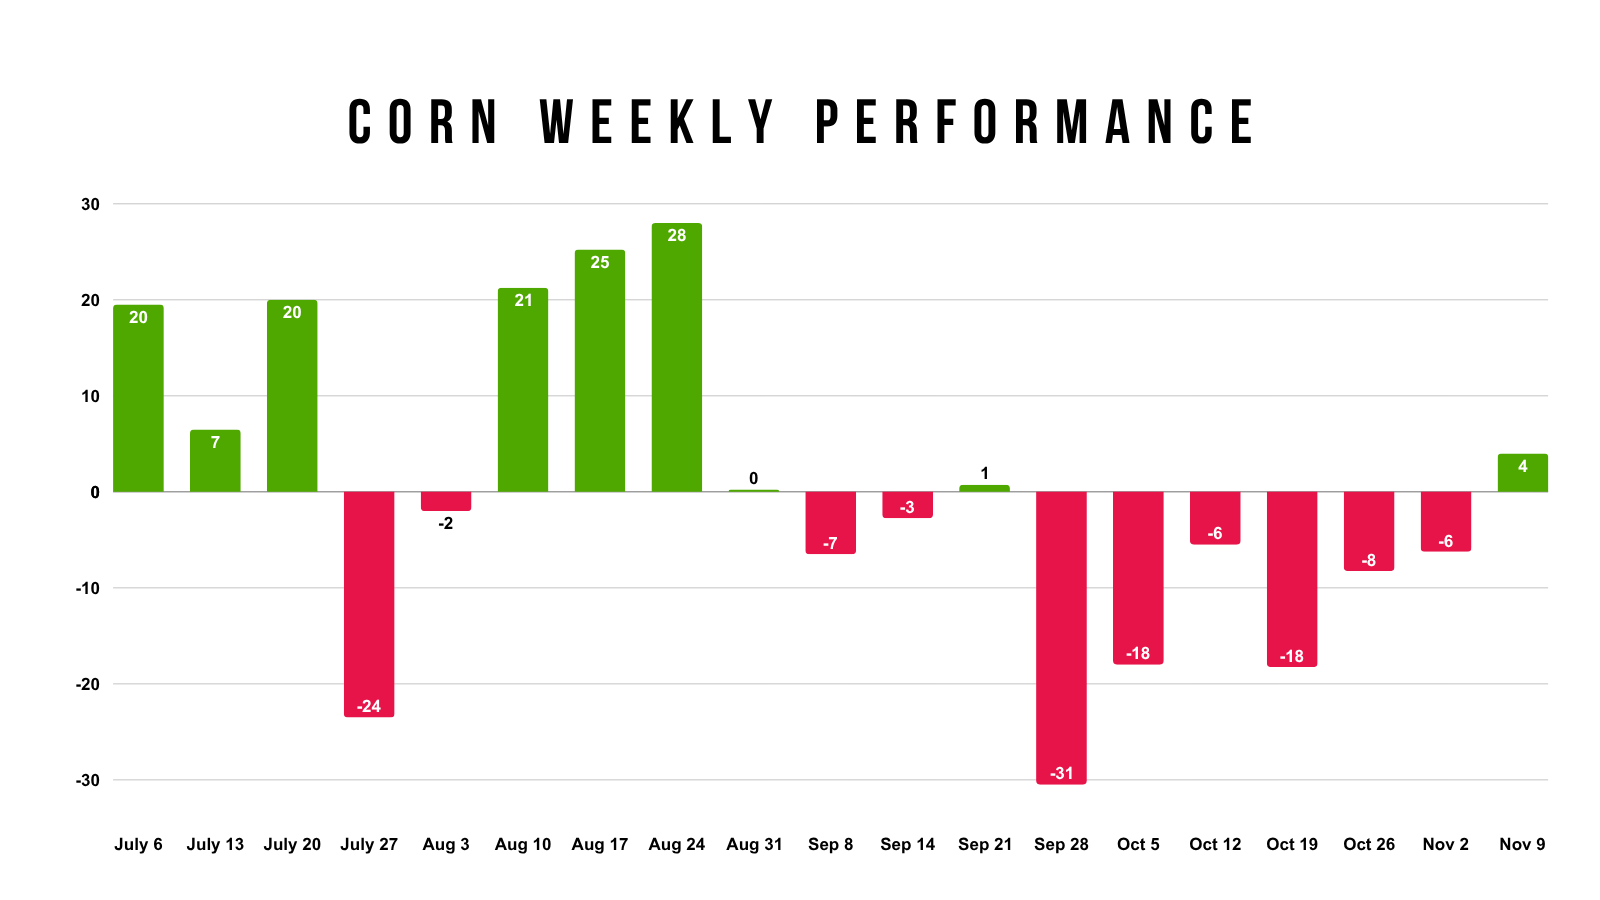
Corn also finally snapped it's losing streak as well.
Closing higher for the week after being down for 6 weeks in a row, which was one of the longest streaks ever.
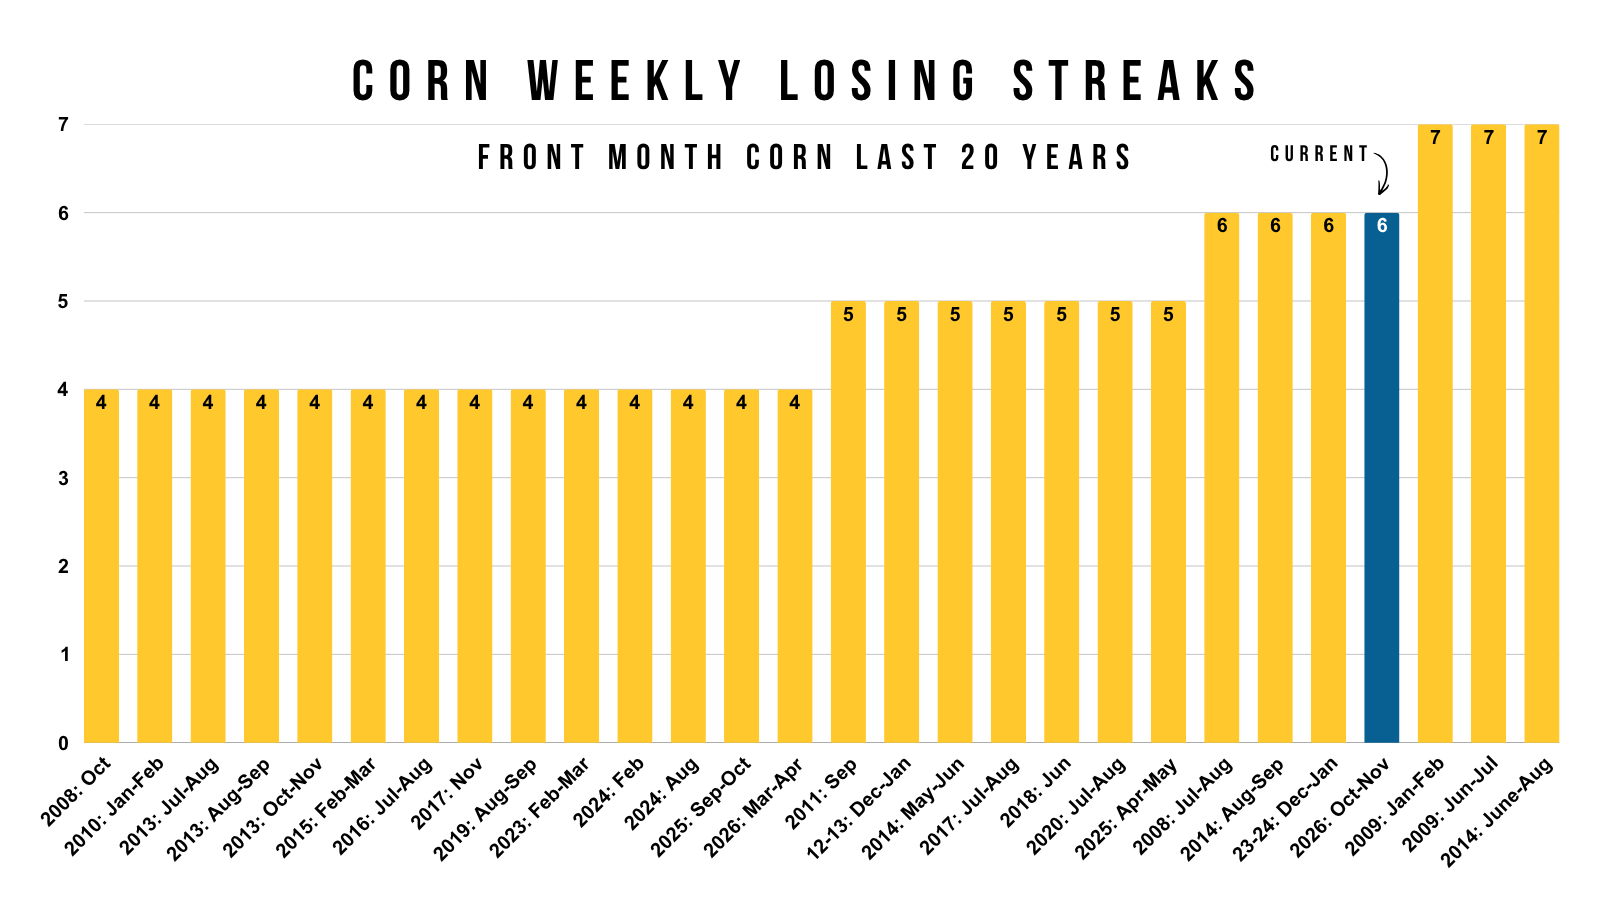
As we ended up +4 cents on the week.
Which is somehow the best week we've had since all the way back in August 3 months ago.
Export Sales
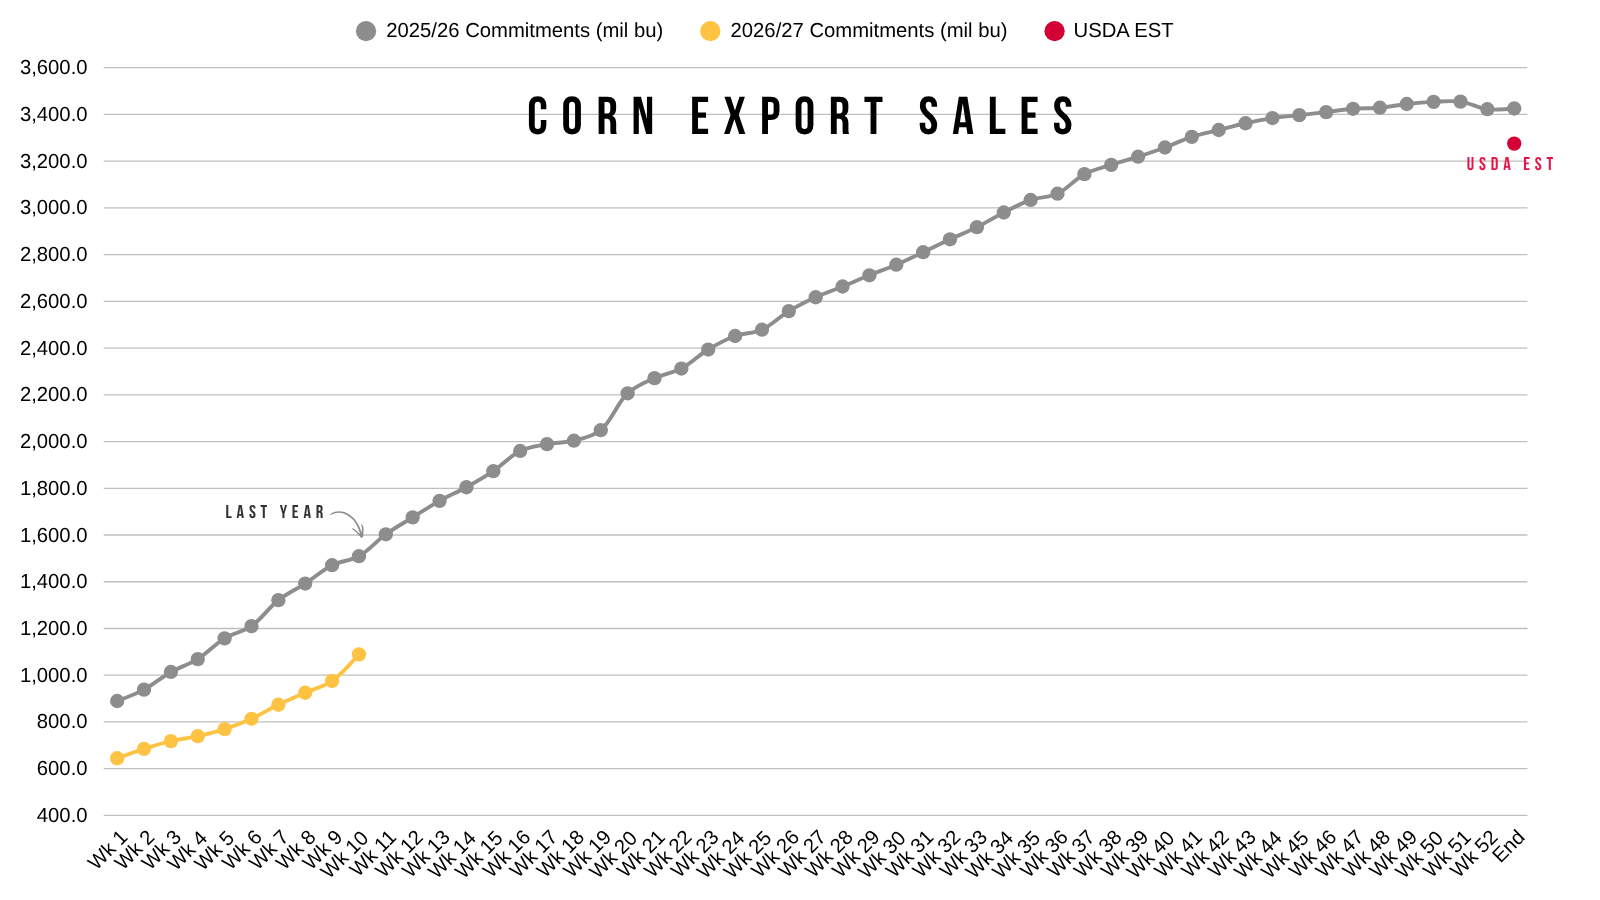
Phenomenal export sales from corn last week.
It was a marketing year high for corn export sales.
Although we still trail last year's record pace by about -28%.
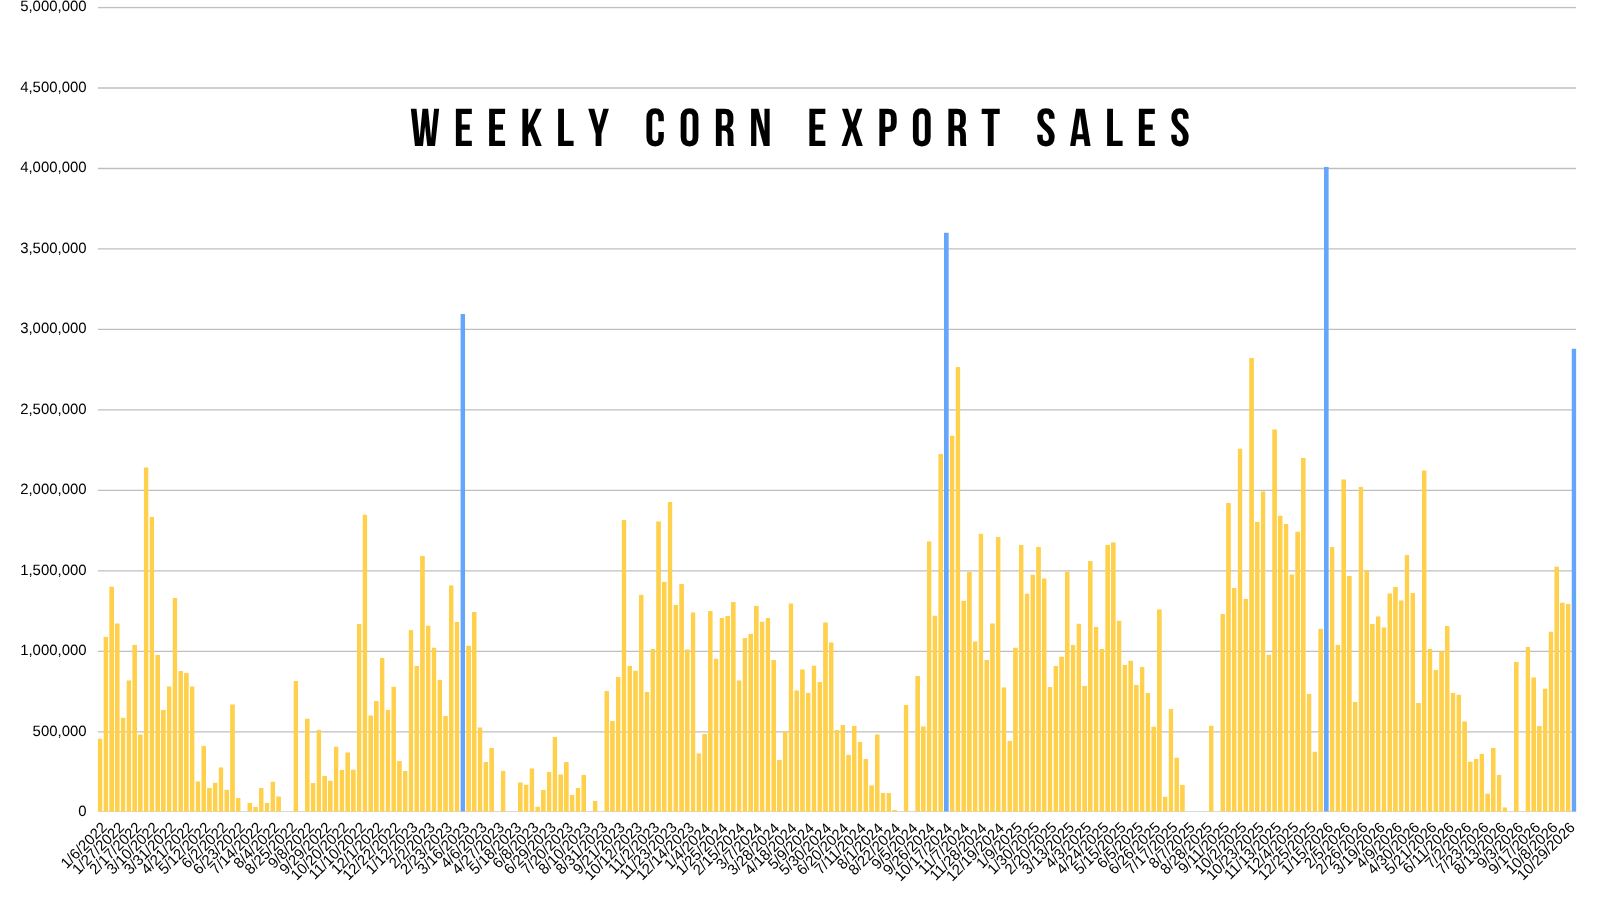
But this was a very impressive number.
This was the 4th largest weekly sales number for corn over the last 5 years.
Yes, it's a slight concern that we are running so far behind last year's pace. But like we've talked about before, we still think it's largely a timing thing.
Soybeans are astrologically better than last year, so naturally we won't be shipping as much corn, and corn still has plenty of time to improve as it's very early.
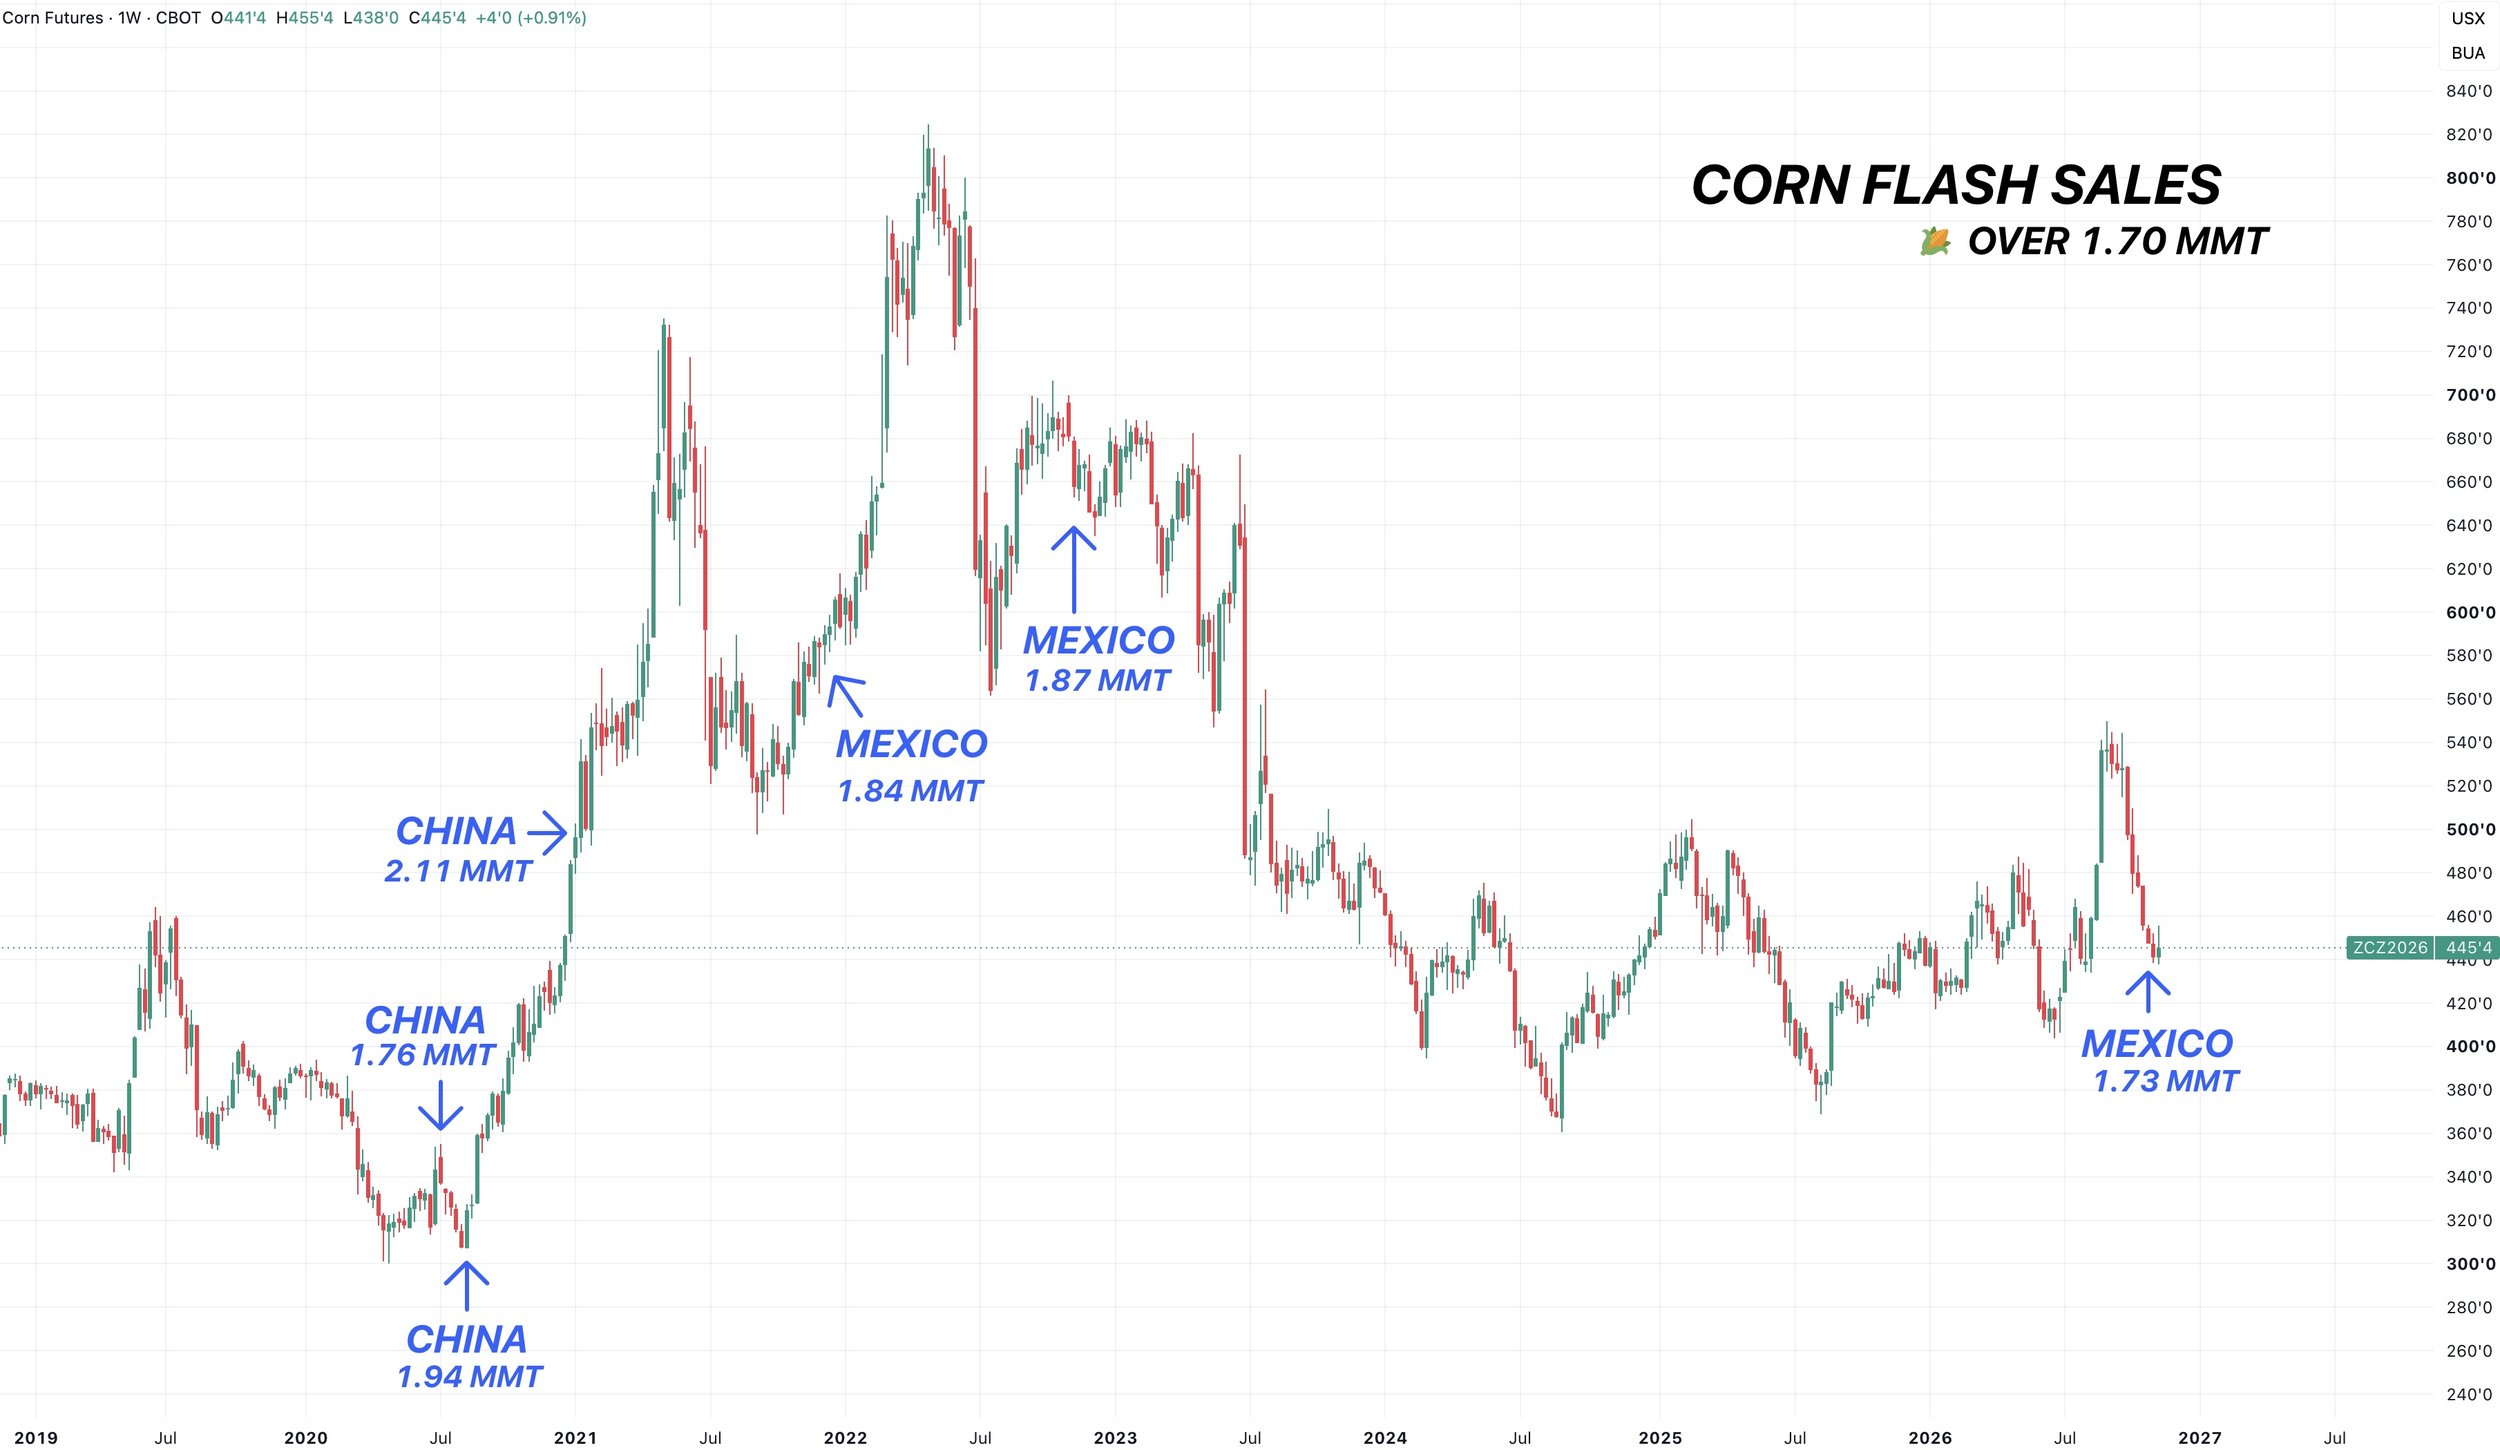
We did just see Mexico buy one of the largest flash sales ever a week or two ago.
As it was the largest flash sale since 2022.
So it feels like we might be finding some demand down at these levels.
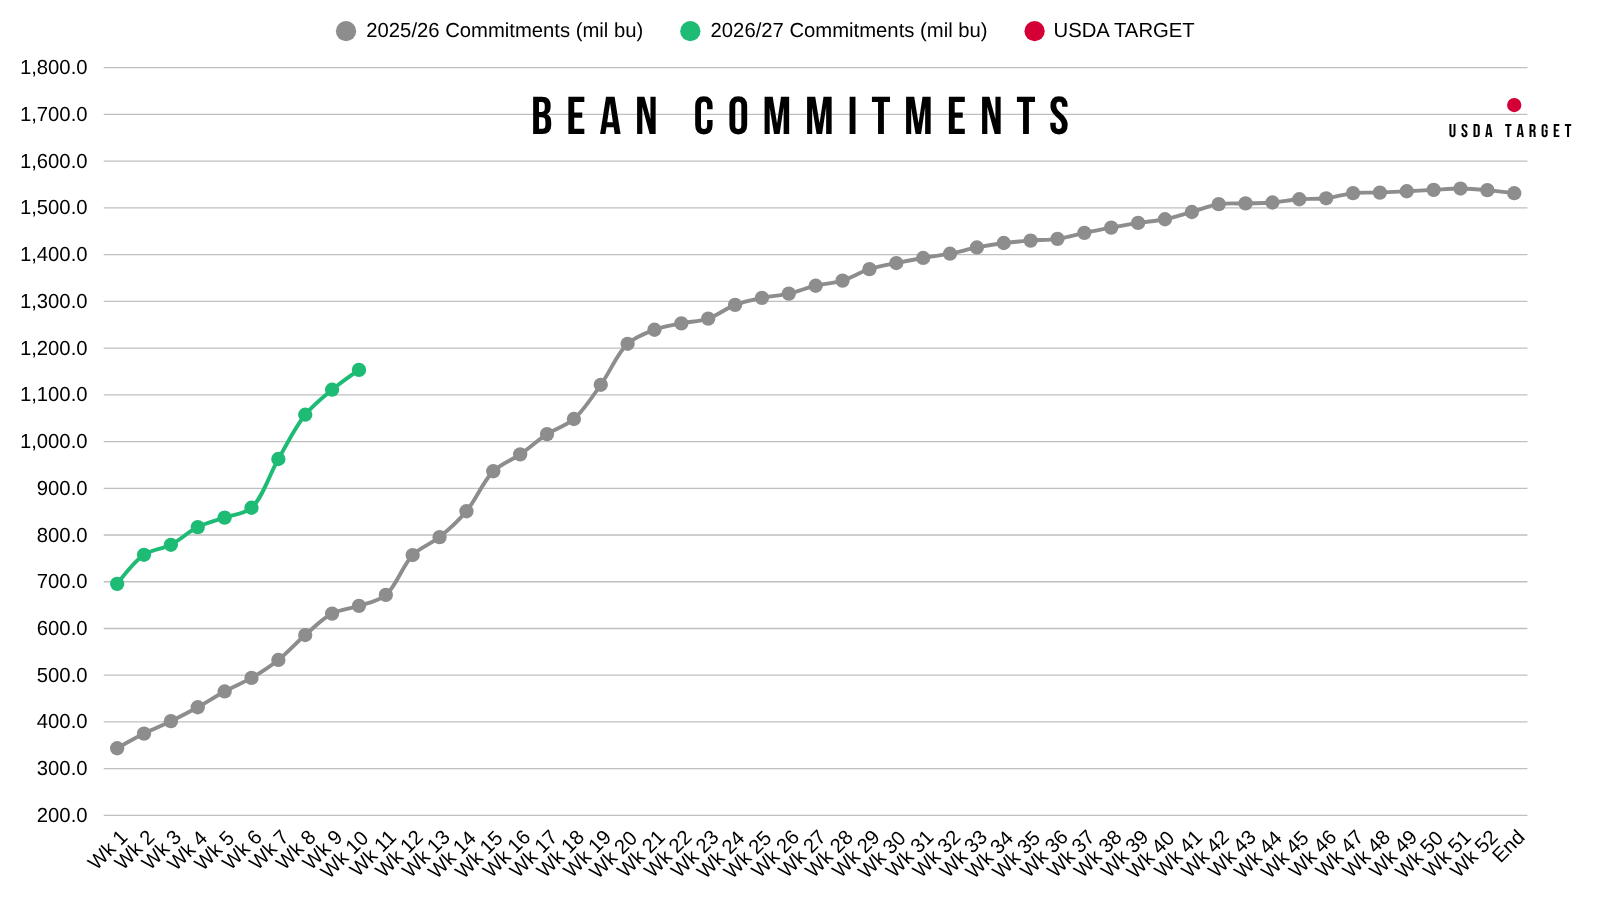
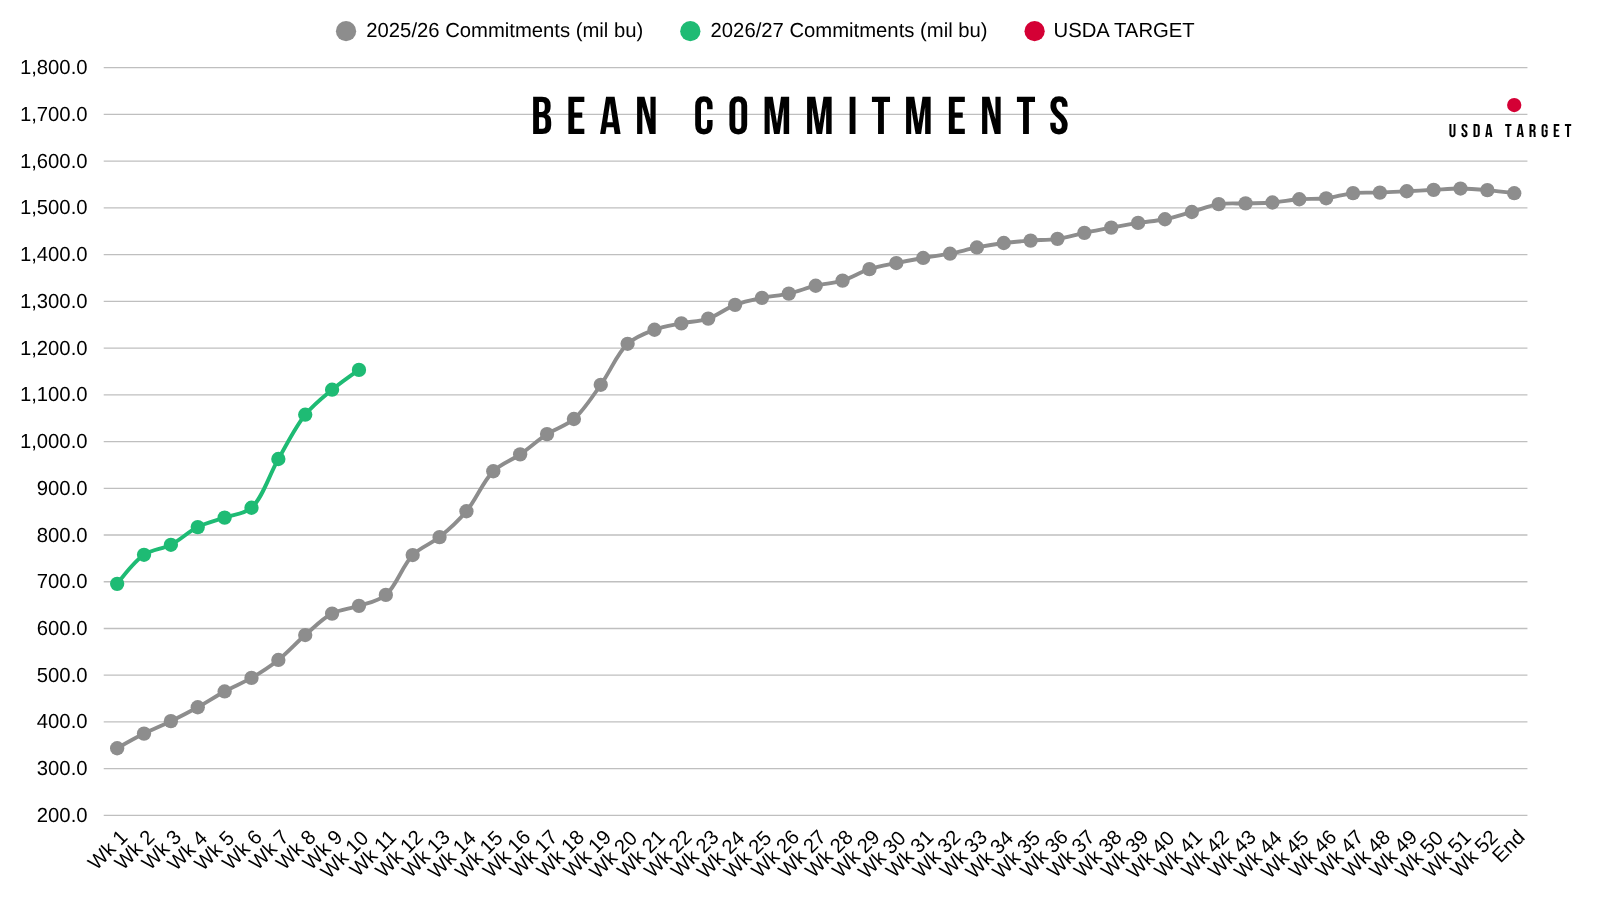
Soybeans exports are now nearly +80% above last year's pace.
As bean demand continues to shine.
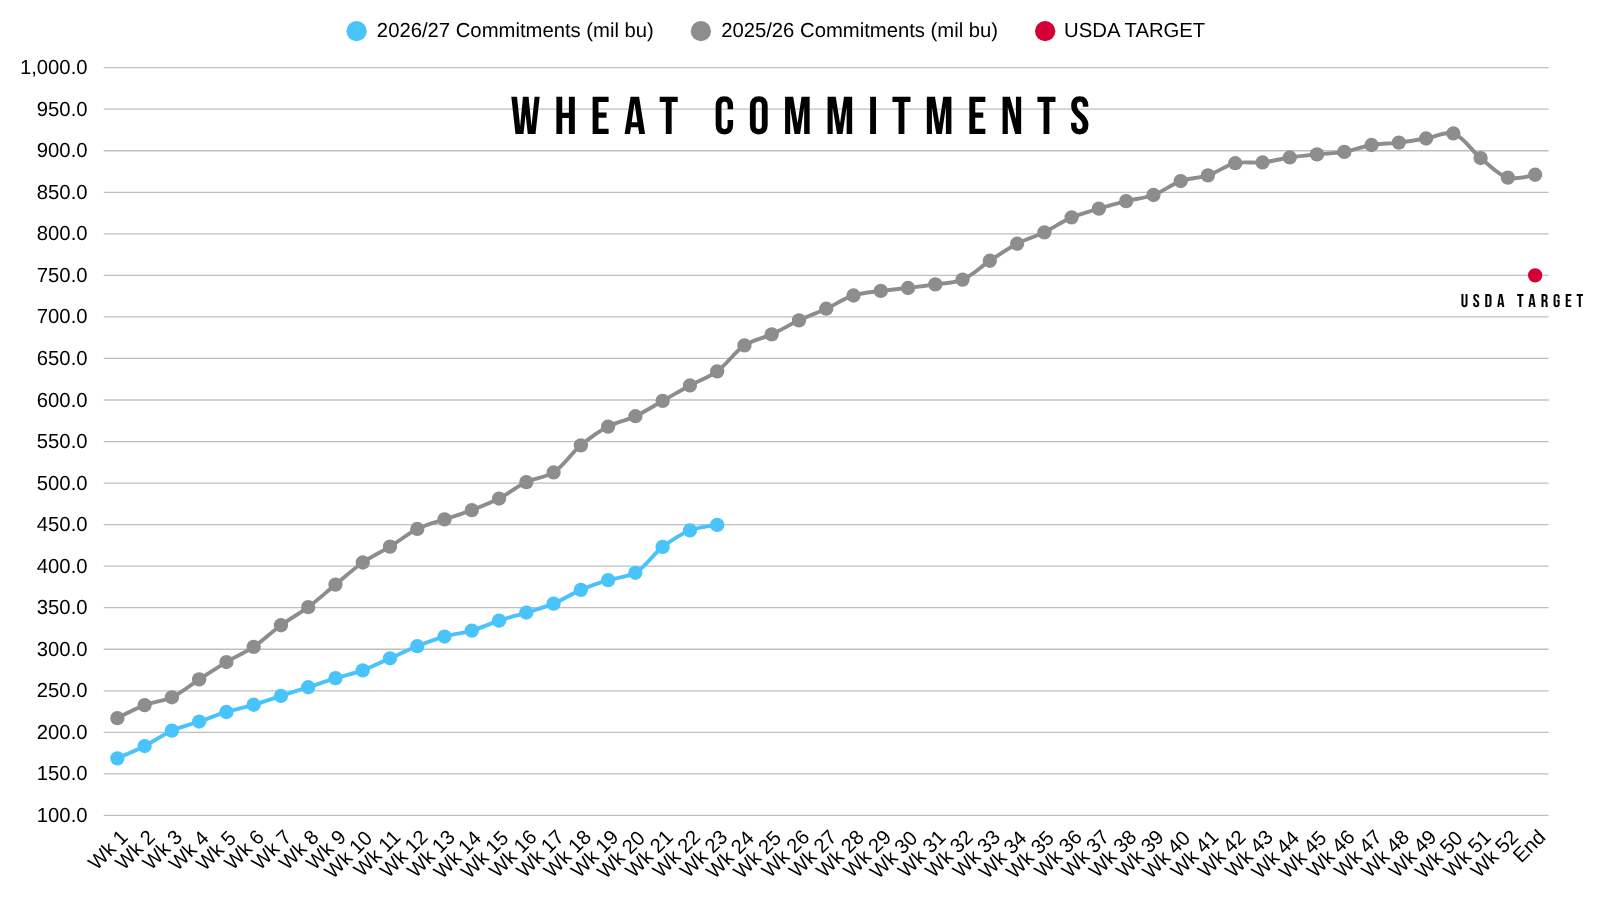
Wheat on the other hand continues to disappoint.
As export sales came in at a marketing year low last week and are well below last year.
Outside of that, not much for fresh news to close out the week.
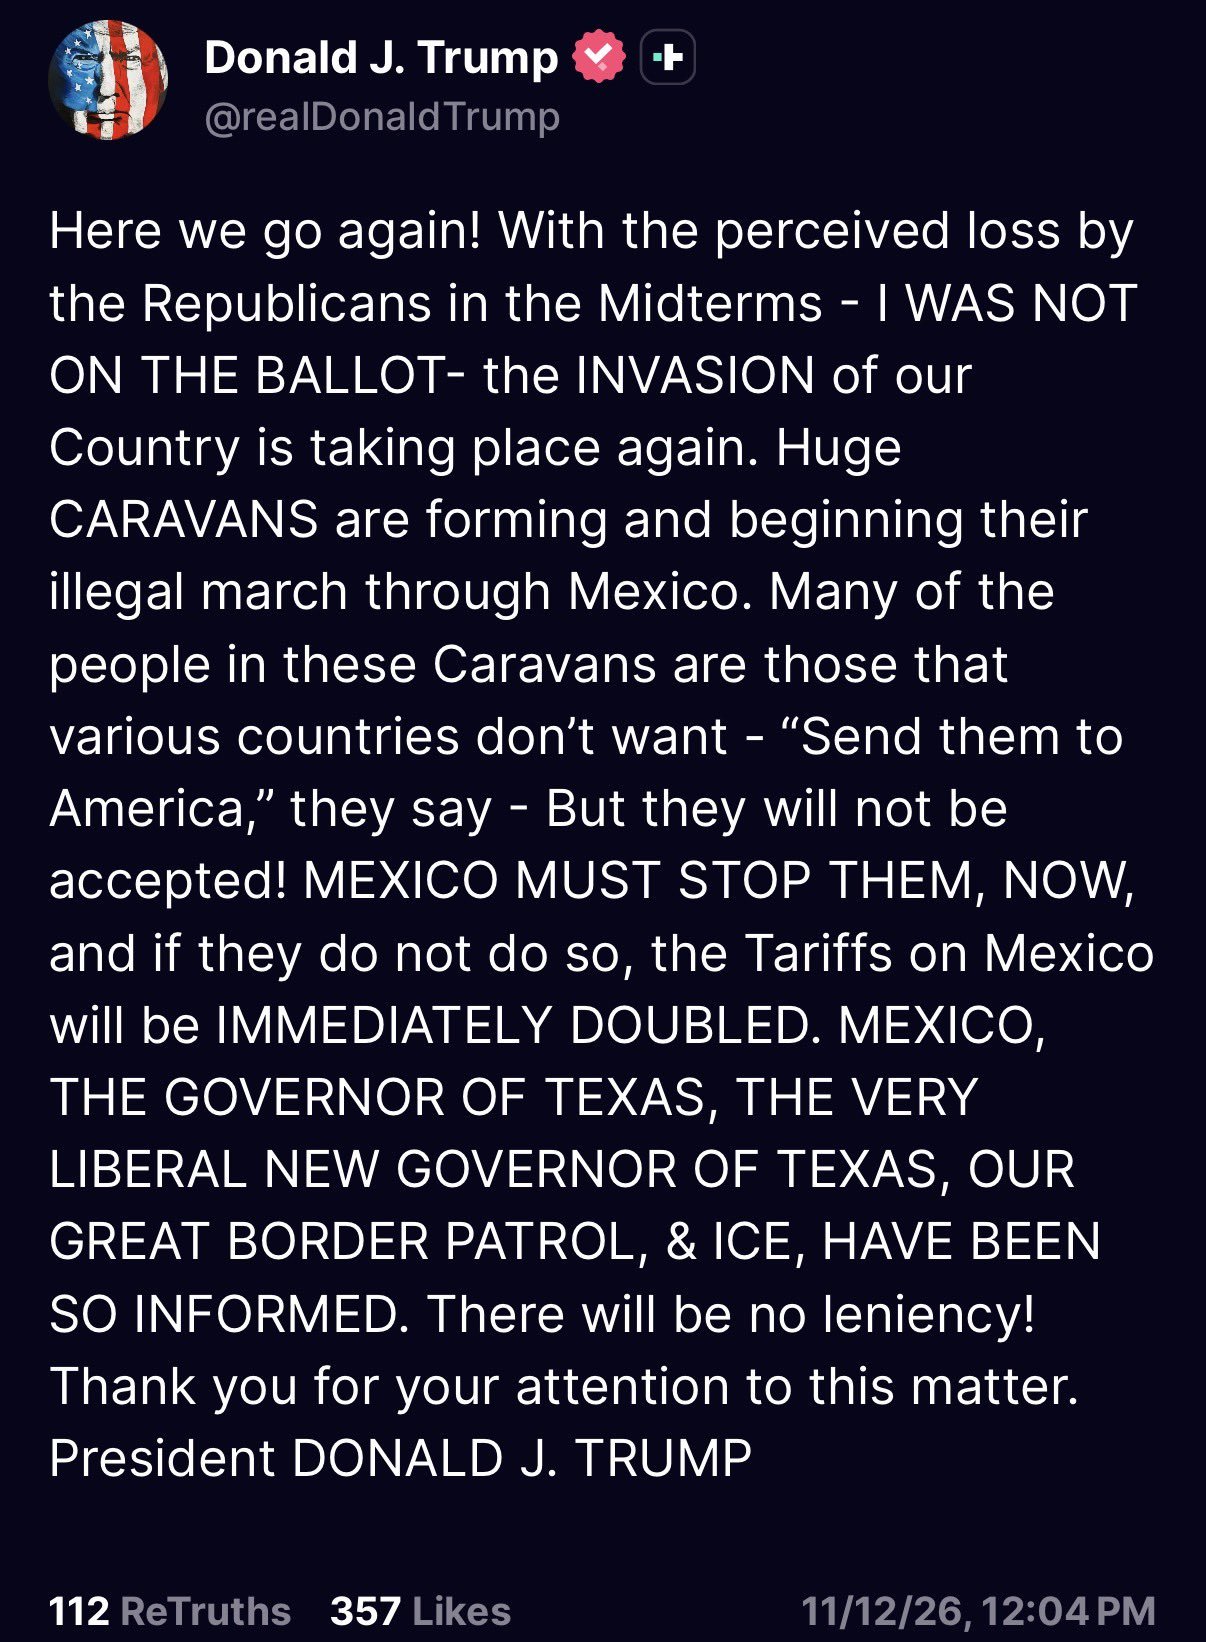
Yesterday we saw Trump threaten to double the tariffs on Mexico if they don’t stop "caravans" from entering the US.
This was probably a big part of the weakness yesterday as Mexico is by far the world's biggest buyer of US corn. And it's not even close.
So if trade relations with them did go sideways, it would clearly be negative.
Today's Main Takeaways
Corn
Fundamentals:
I think corn has become undervalued here.
We just spent the last few months pricing in a big crop.
Now the USDA finally walked back about half of that increase from the last few reports.
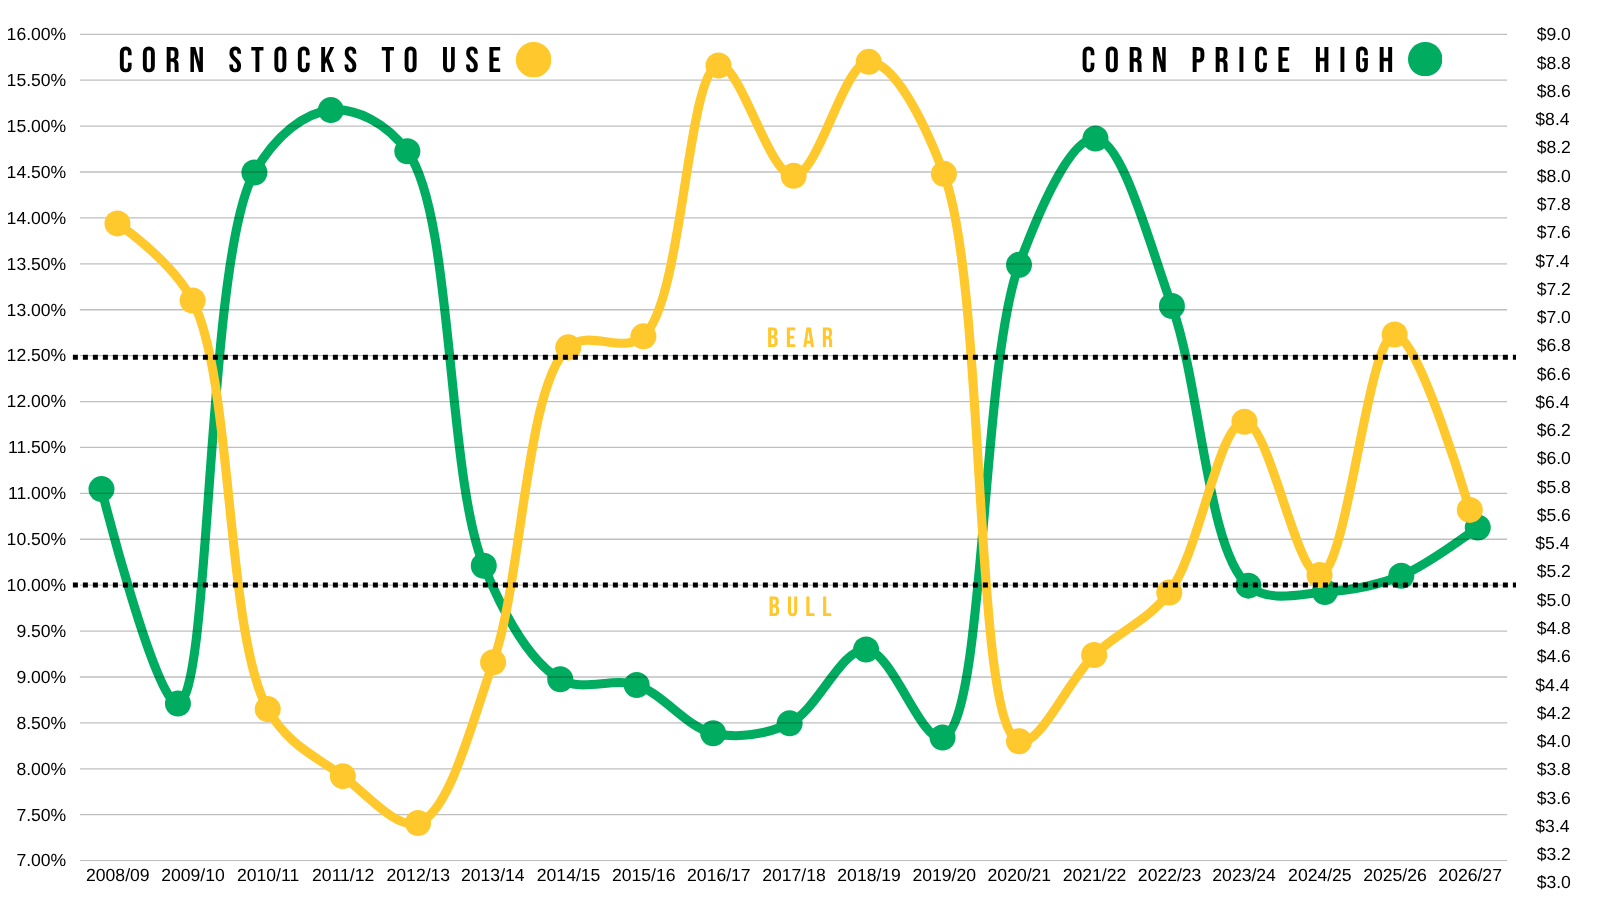
We still have a sub 11% stocks to use ratio. Which no, is not wildly bullish.
But this is still more bullish than it was last year.
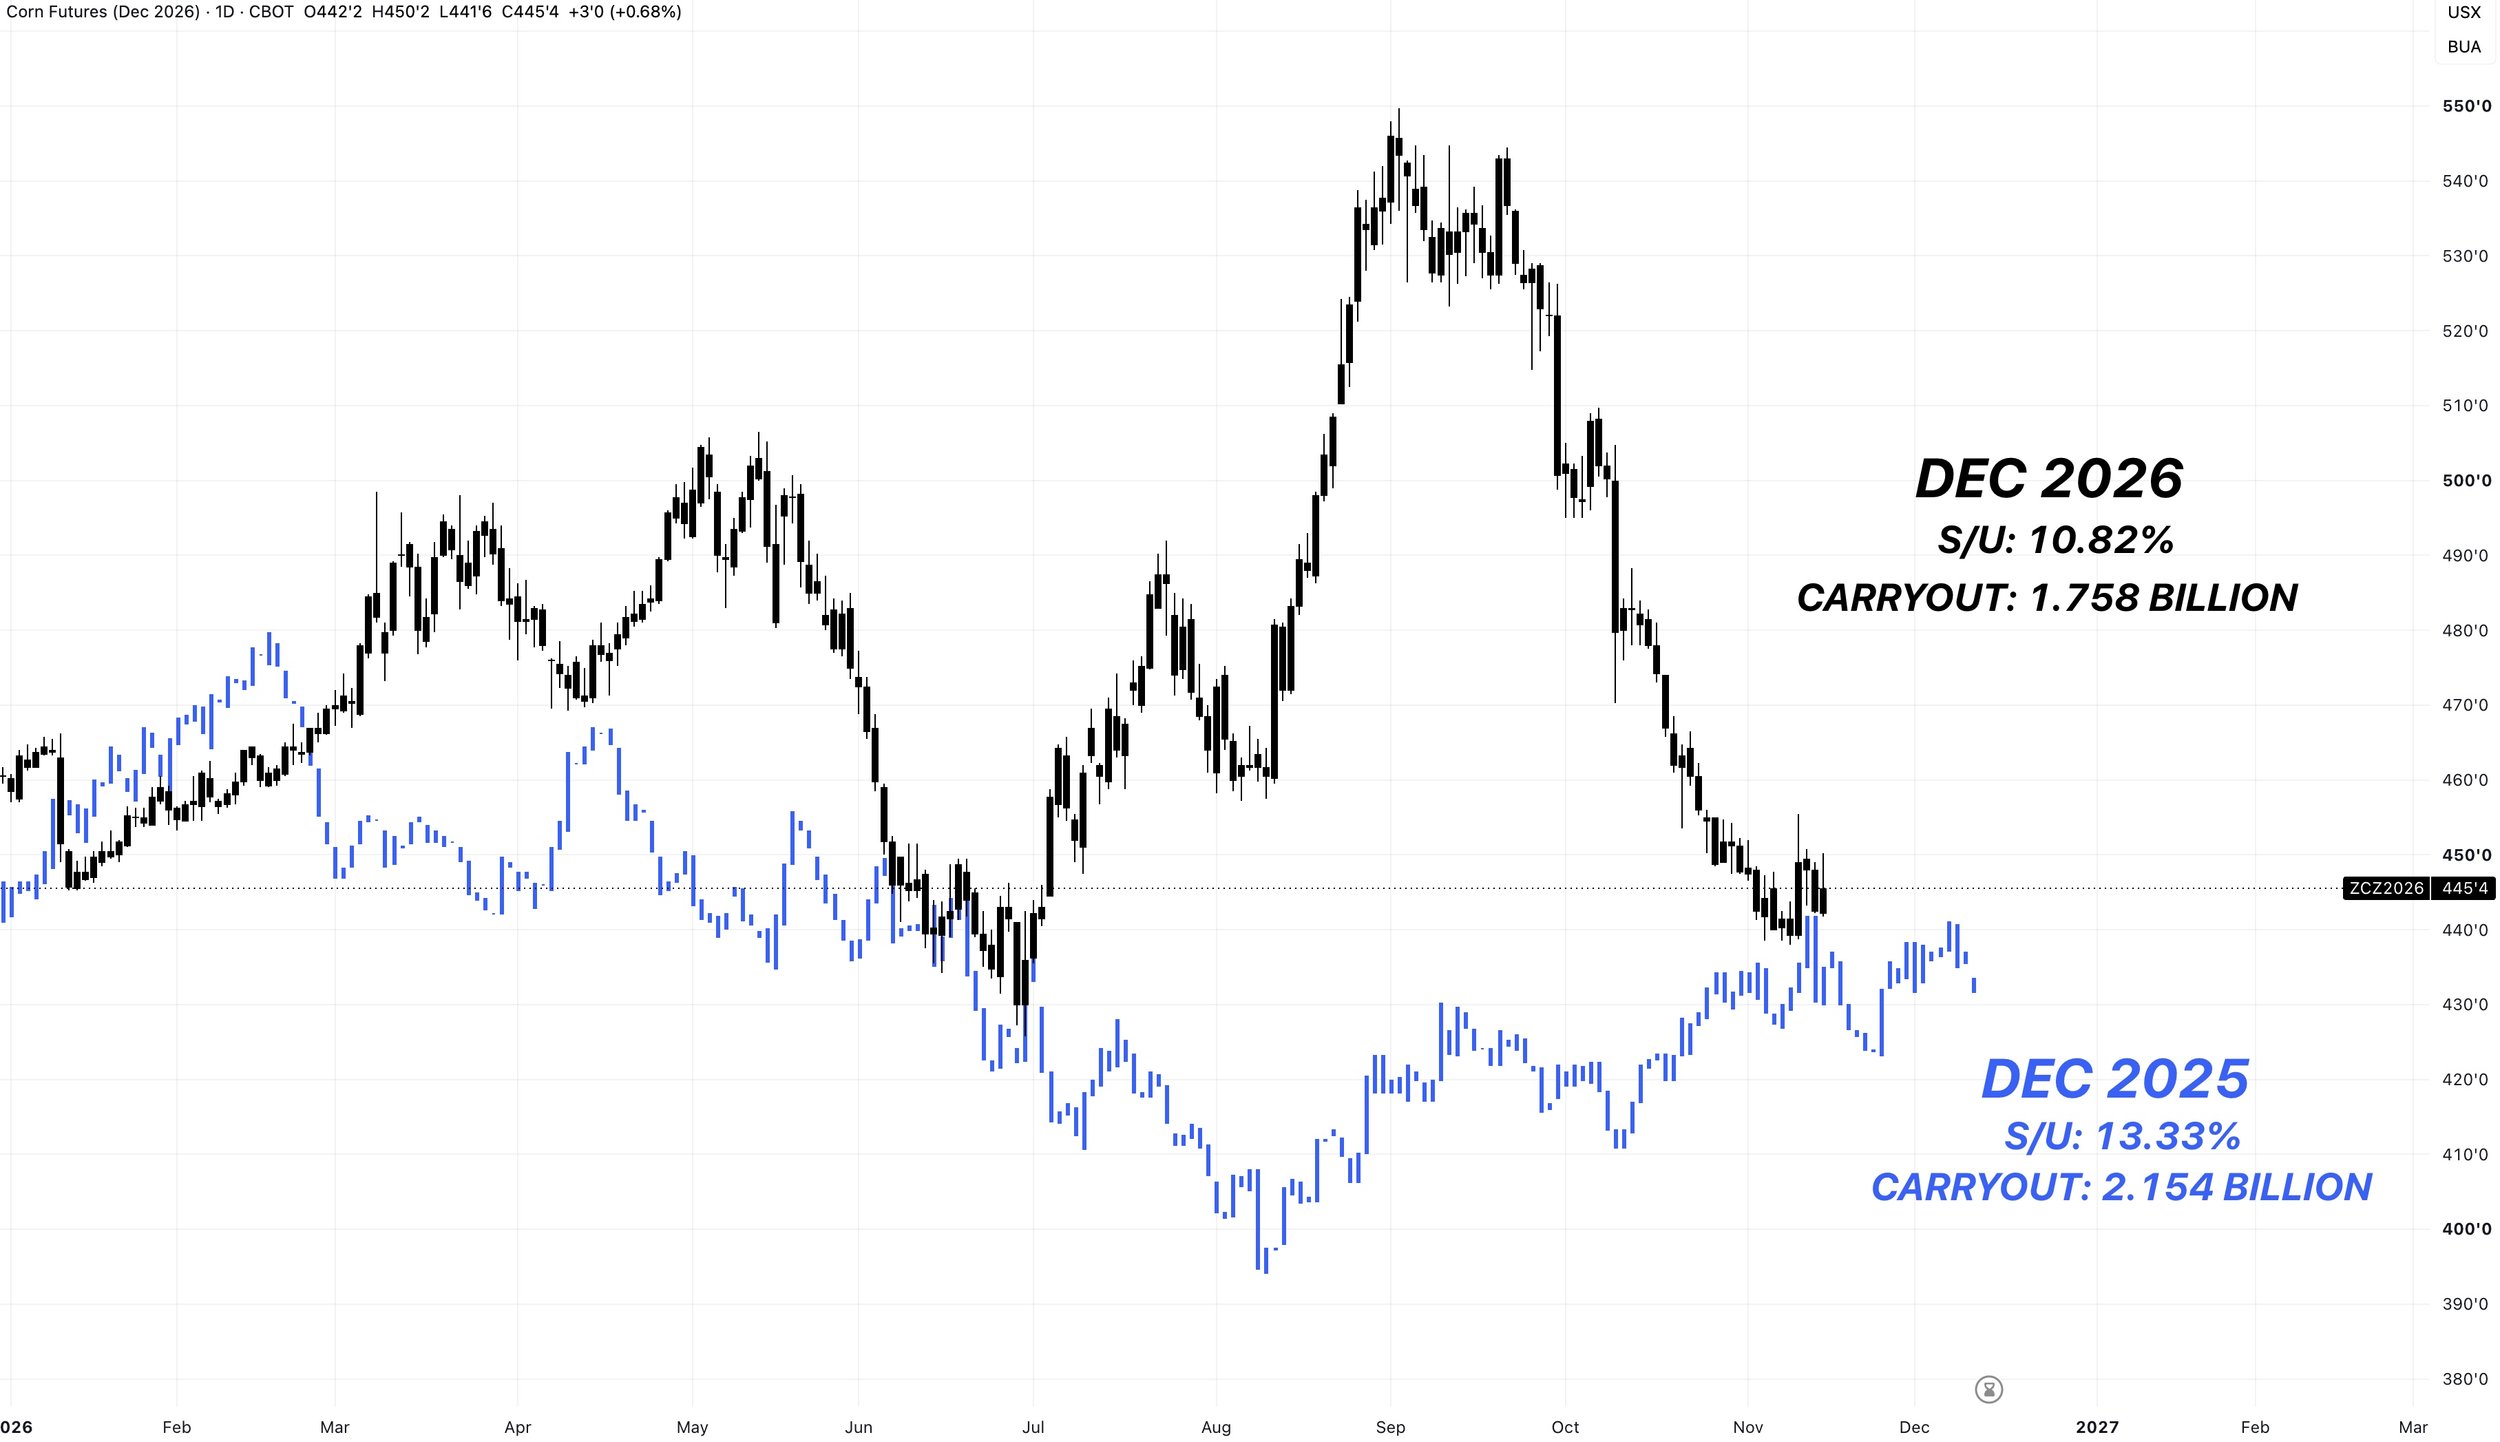
If you compare Dec-25 corn to Dec-26 corn.
Last year at this time we were trading in that $4.30 to $4.40 range.
We have a much more friendly situation compared to last year.
So I don’t think Dec corn fundamentally belongs down here.
Sure, last year corn went as low as $3.90 and had a high of $4.80.
But last year at this time we had a 13.33% stocks to use and a 2.15 billion bu carryout.
Compared to the current 10.82% and 1.76 billion bu carryout we have right now.
Yet for this time of year, we are essentially at the same prices we were last year.
Long term I think the friendly possibilities are absolutely still there.
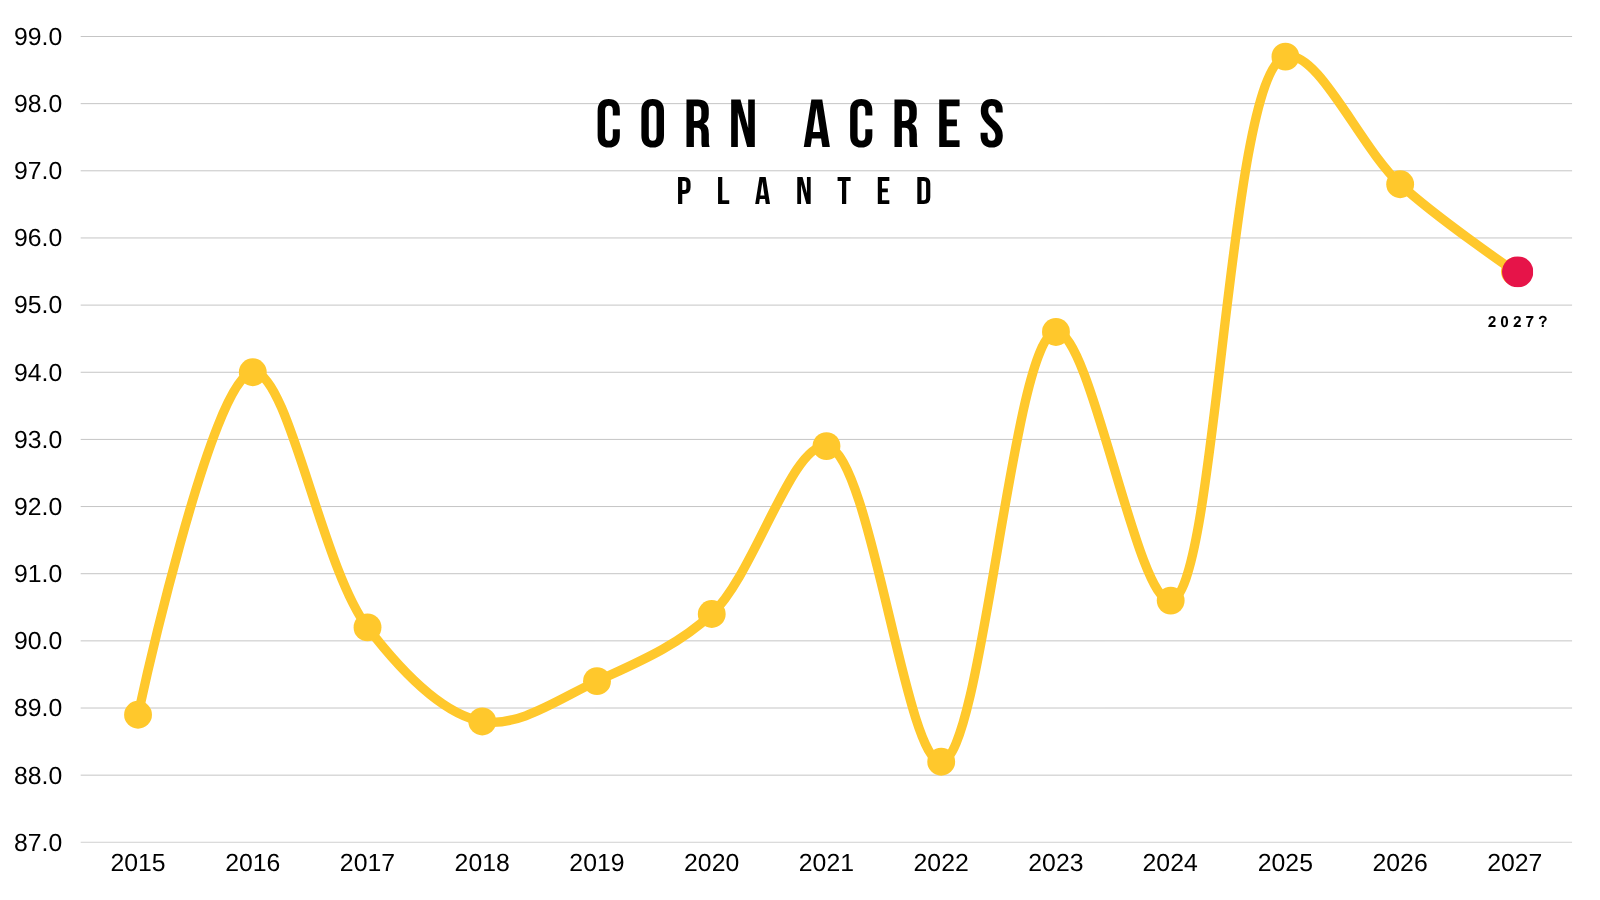
The USDA's preliminary balance sheet for next year has acres down again.
Down from 96.8 to 95.5
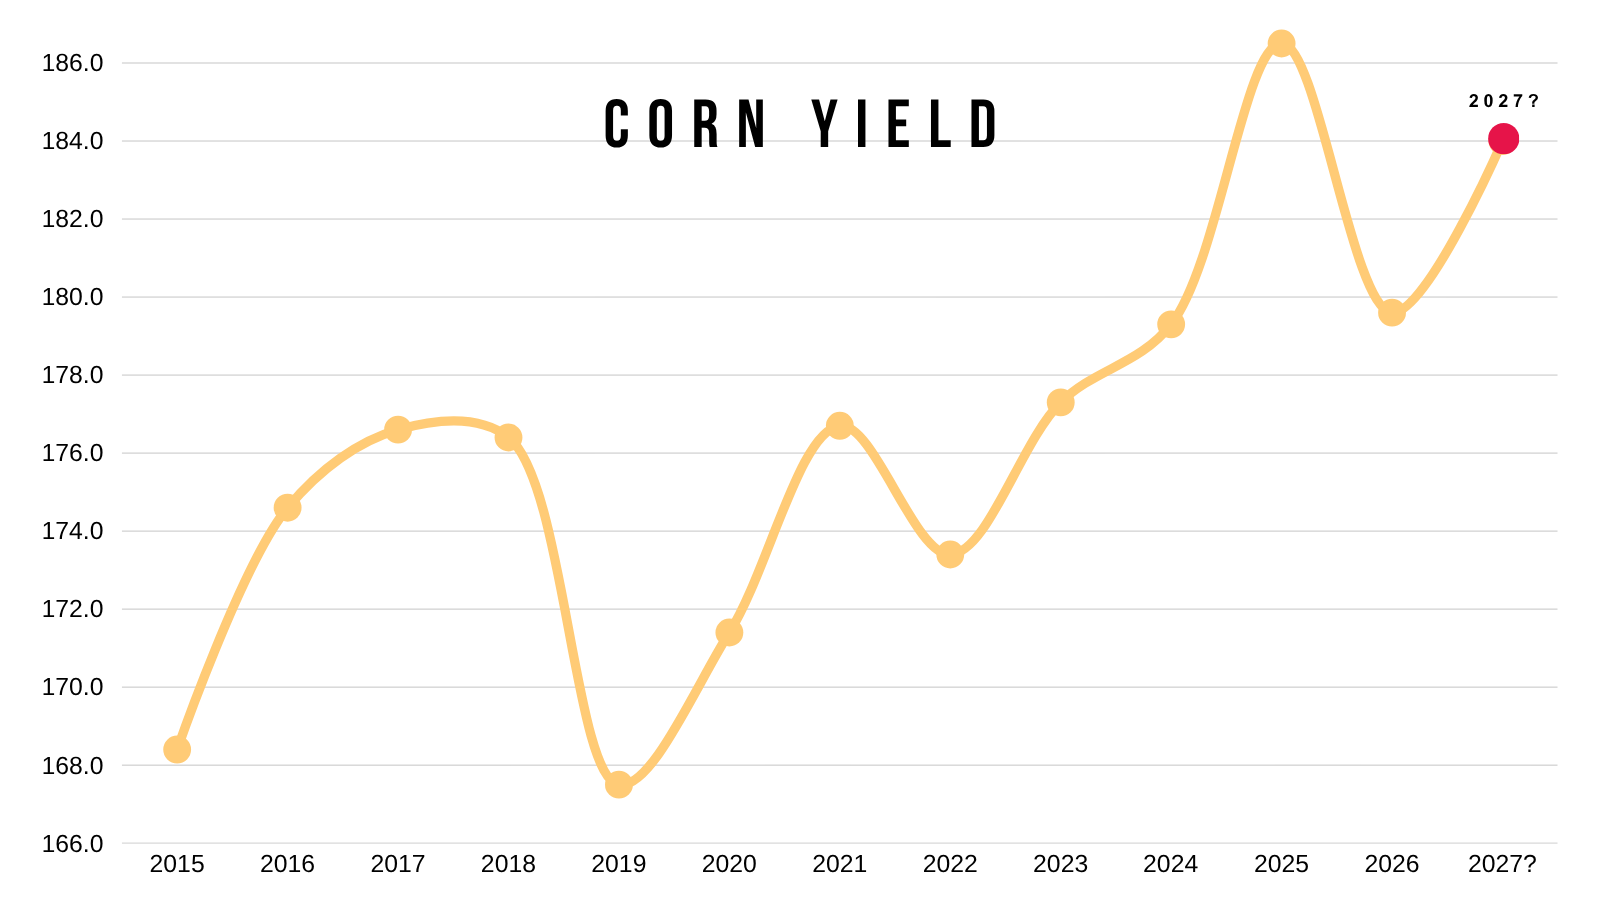
Along with a 184 yield, which seems far from a given.
You could also add on to the opinion that I still think the crop could get smaller from here.
As there are certainly a few question marks surrounding states such as Nebraska and Iowa for example.
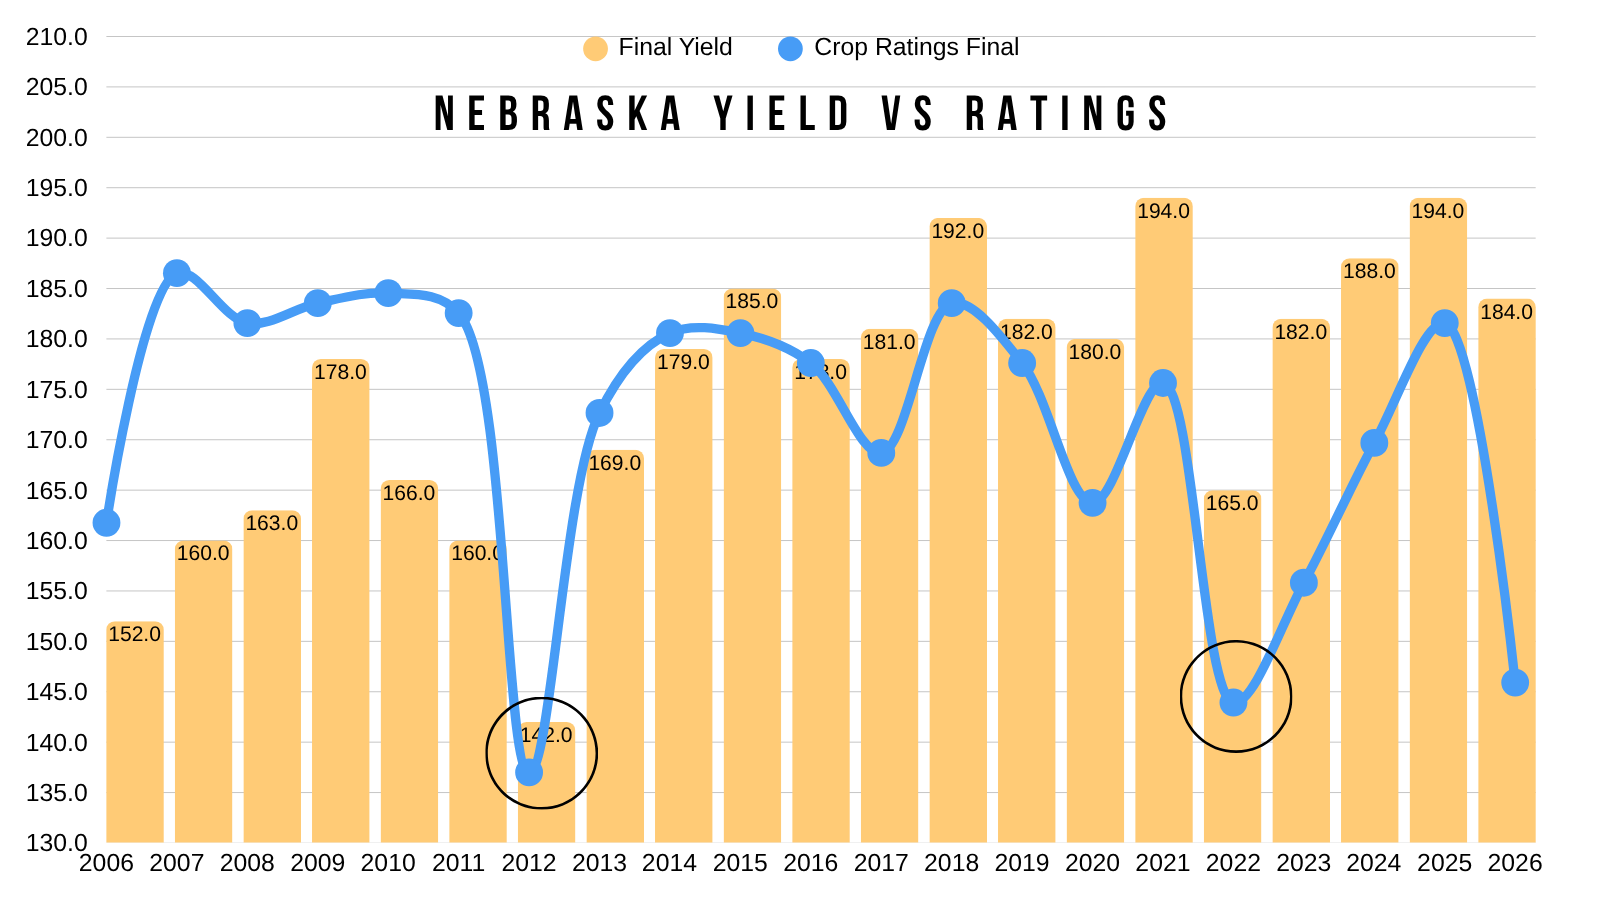
Like I mentioned earlier this week, when you compare Nebraska ratings to yield one year clearly sticks out and doesn’t necessarily add up.
The last two times crop ratings tanked like they did this year, yield fell dramatically.
Ratings vs yield will never be perfect. But something seems off here.
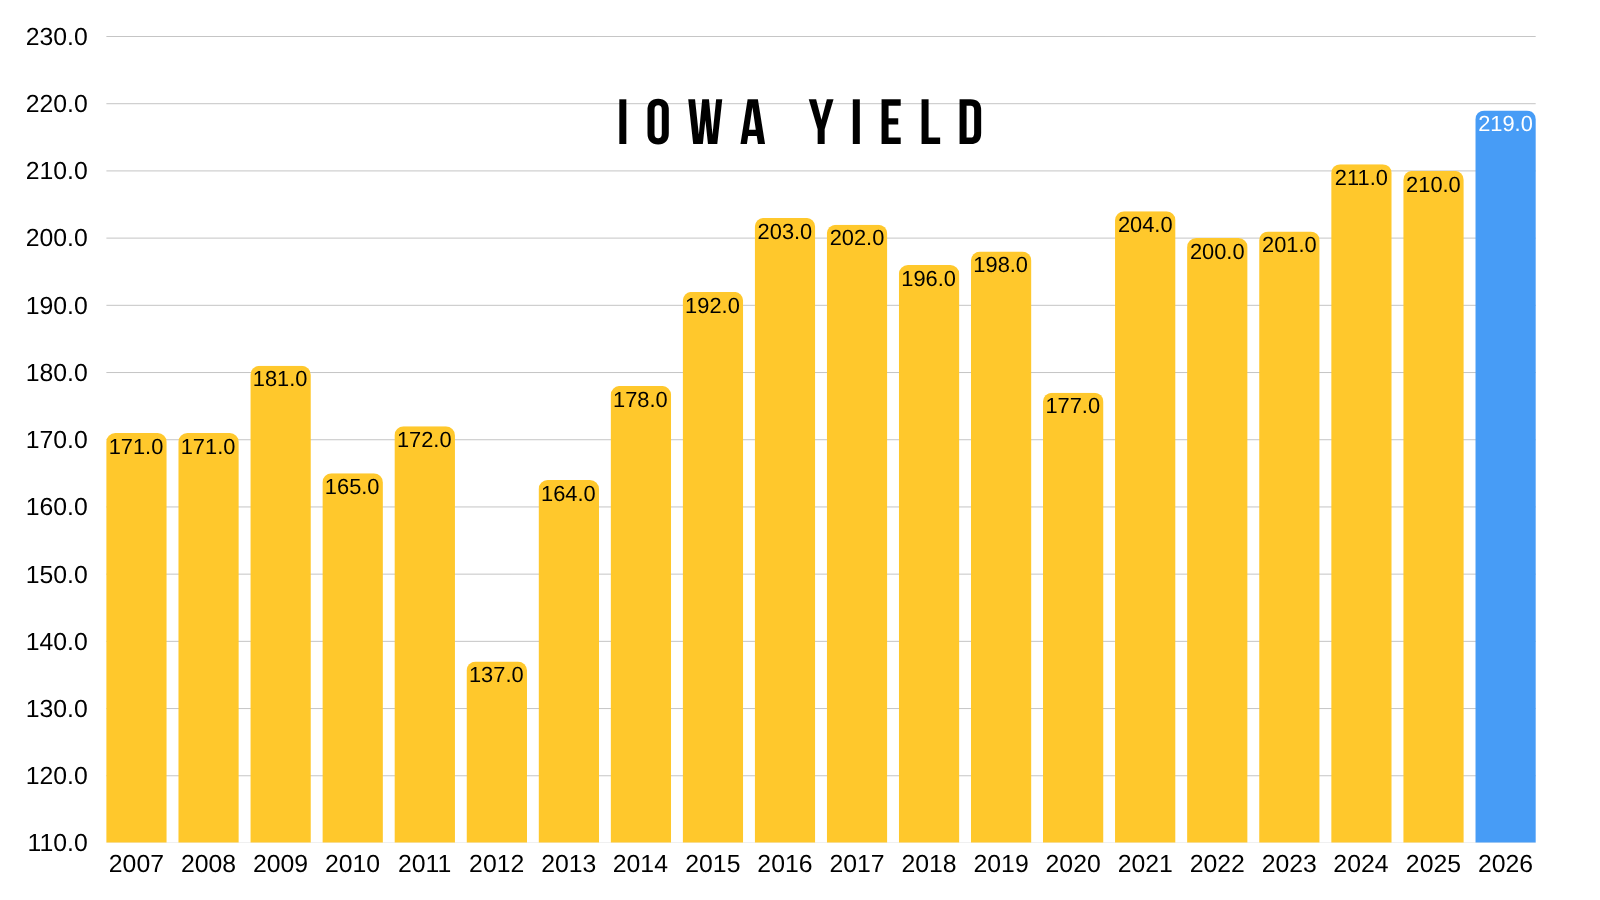
Then you have Iowa.
Iowa still has like 1/4th of their crop in the ground, along with the crop being mostly mature.
Iowa has a good crop, no doubt, but is their crop really +8 bpa above the previous record?
Then you still have the Brazil growing season.
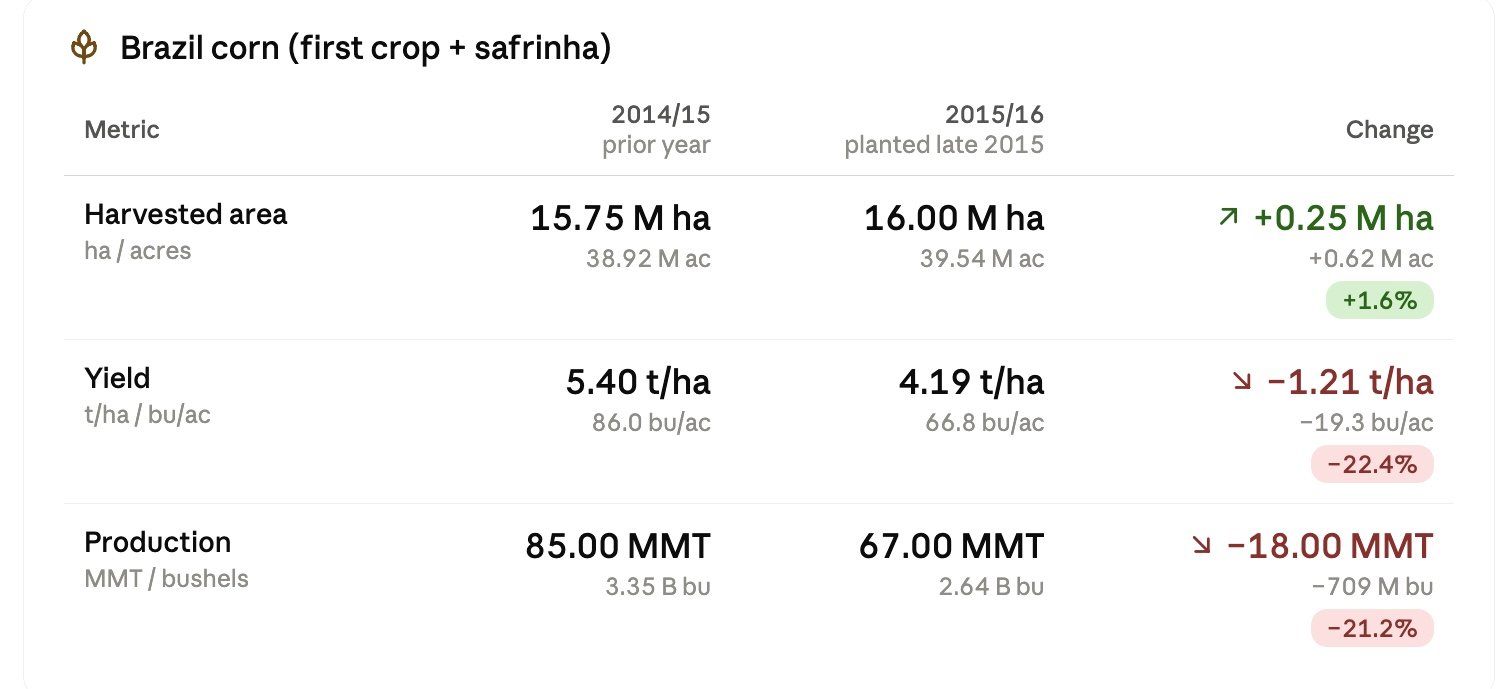
What happens down in South America isn’t just going to impact soybeans, it's also going to impact corn.
Last time we had a Super El Niño in 2015, we did see Brazil corn production drop by -20% that year.
So if the Super El Niño has a relatively similar impact this time, it would be a bullish factor.
Spreads:
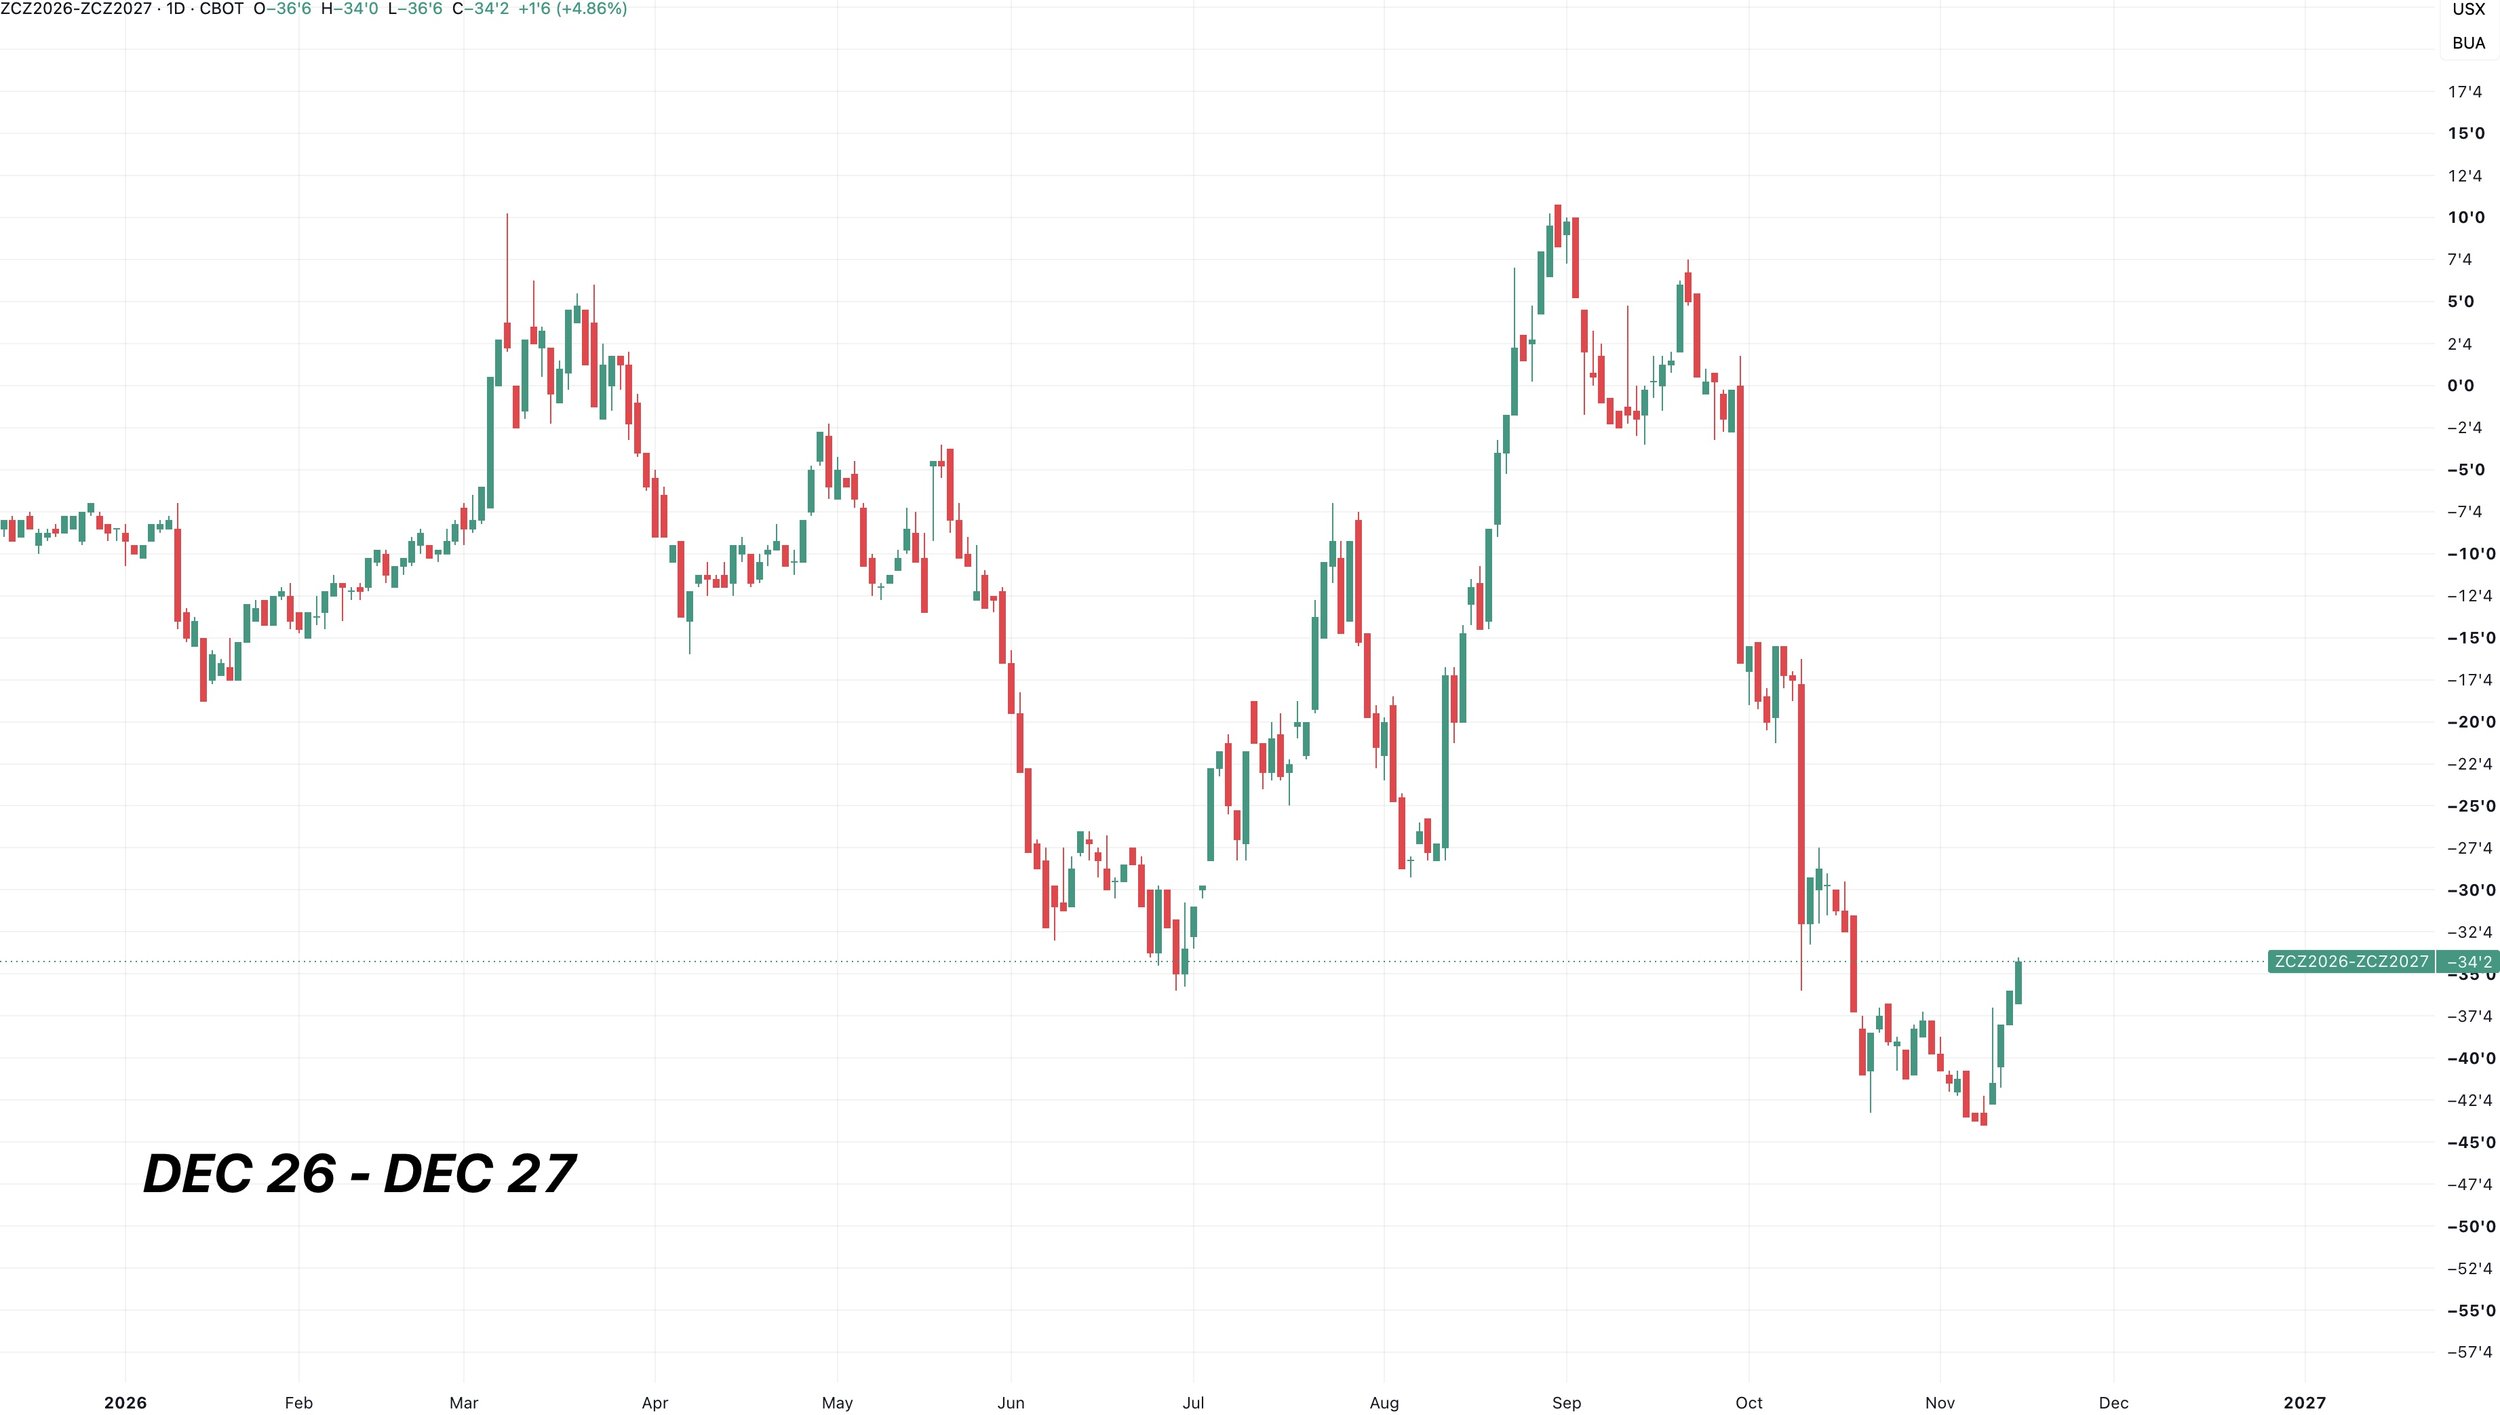
The spreads have actually acted friendly the last few days.
Corn traded lower yesterday and Wednesday, yet the spreads firmed up both days.
As the spread has traded higher for 4 days in a row now.
That could potentially be a friendly sign and a hint that maybe the market is getting tired of going lower.
But of course we want to see those spreads continue to firm.
Ratio Trade Idea:
Disclaimer: there is risk of loss trading futures and options. Past performance does not necessarily indicate future results. This is our opinion and should be treated as such.
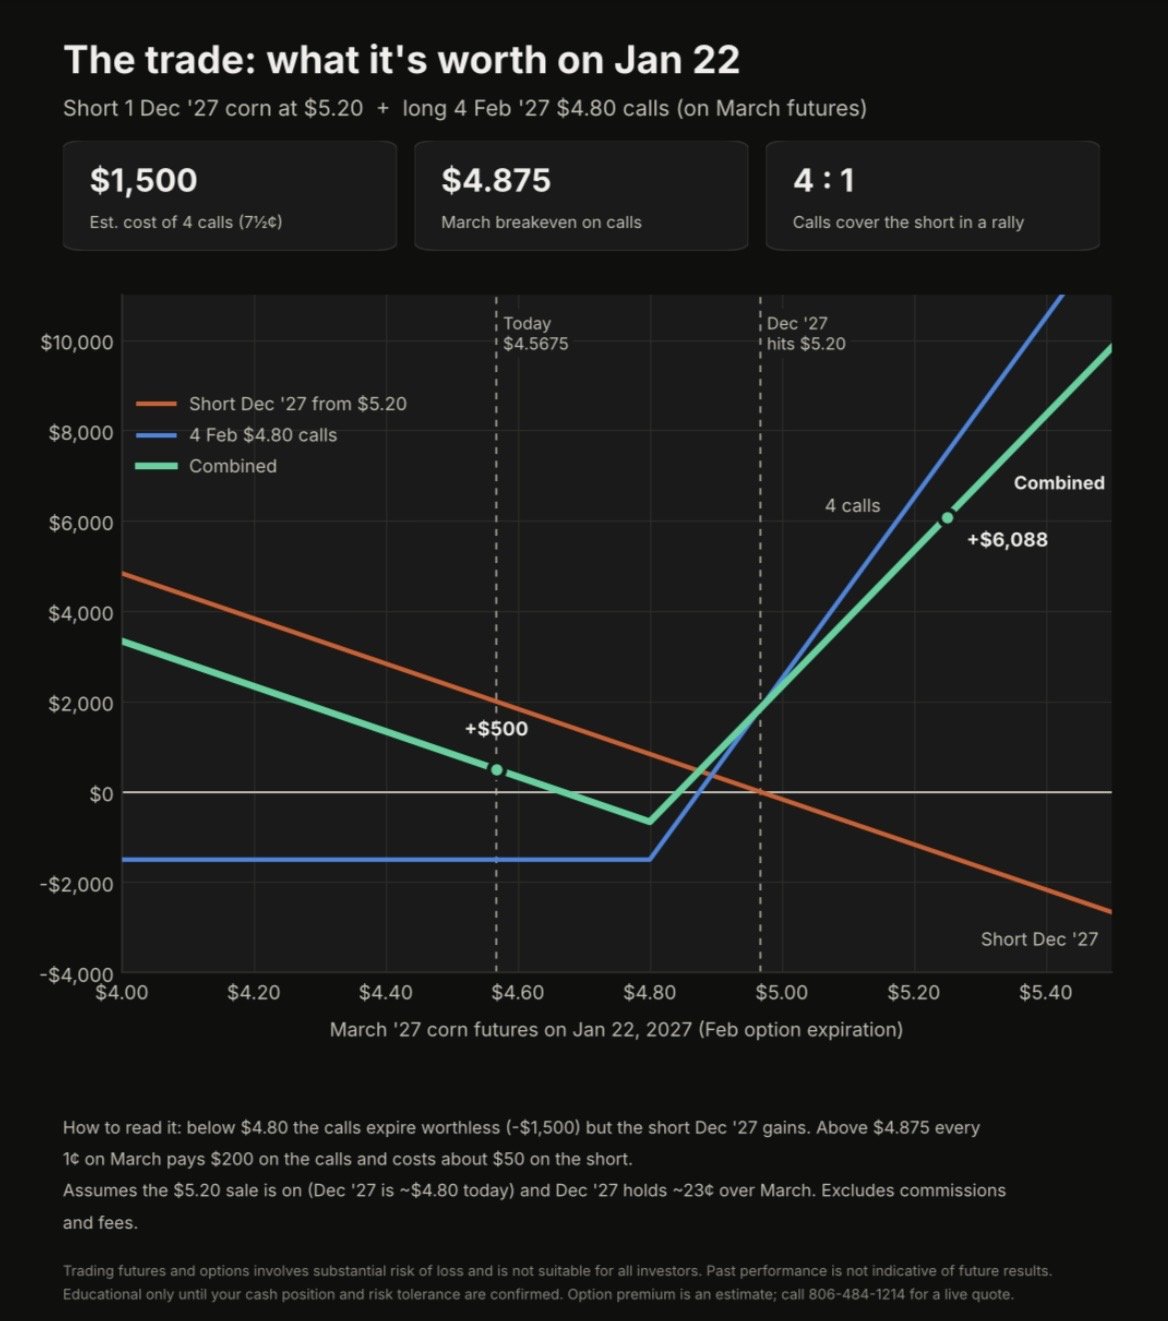
If you want to re-own corn, you could always consider calls as they have become a lot cheaper. We do like the idea of owning corn into next year for some of you.
However, here is a trade idea from Jeremey and Texas Hedge.
This is a ratio trade.
So what you could consider doing is:
Buying more than one call for a few months out, while at the same time selling one call for next years crop.
You could use a different month such as March, but an example of this would be:
Buying four Feb-27 $4.80 calls, while selling one Dec-27 $5.20 call for about even money.
This trade would involve margin because you are selling an option. However, selling the farther-out call helps pay for buying the shorter-term calls.
This comes with two possible exit strategies:
1. The Market Goes Up
If the market takes off, you could make money on the calls you bought and potentially have lost money on the calls you sold.
Since you bought more calls than you sold, it helps compensate for the loss on selling the call.
And if we do rally, the closer month should gain more than next year's crop.
2. Near Options Expire Worthless
The calls you bought expire and are worth nothing. The call you sold may help offset some of the losses from the bought calls.
If this happens, you will have the opportunity to buy back the Dec call that you sold for less than you sold it for.
So that is just one possible strategy you could consider.
But as always please reach out if you want to discuss what makes the most sense for you and your operation. As not everyone should consider strategies like this.
Office: (806)484-1214
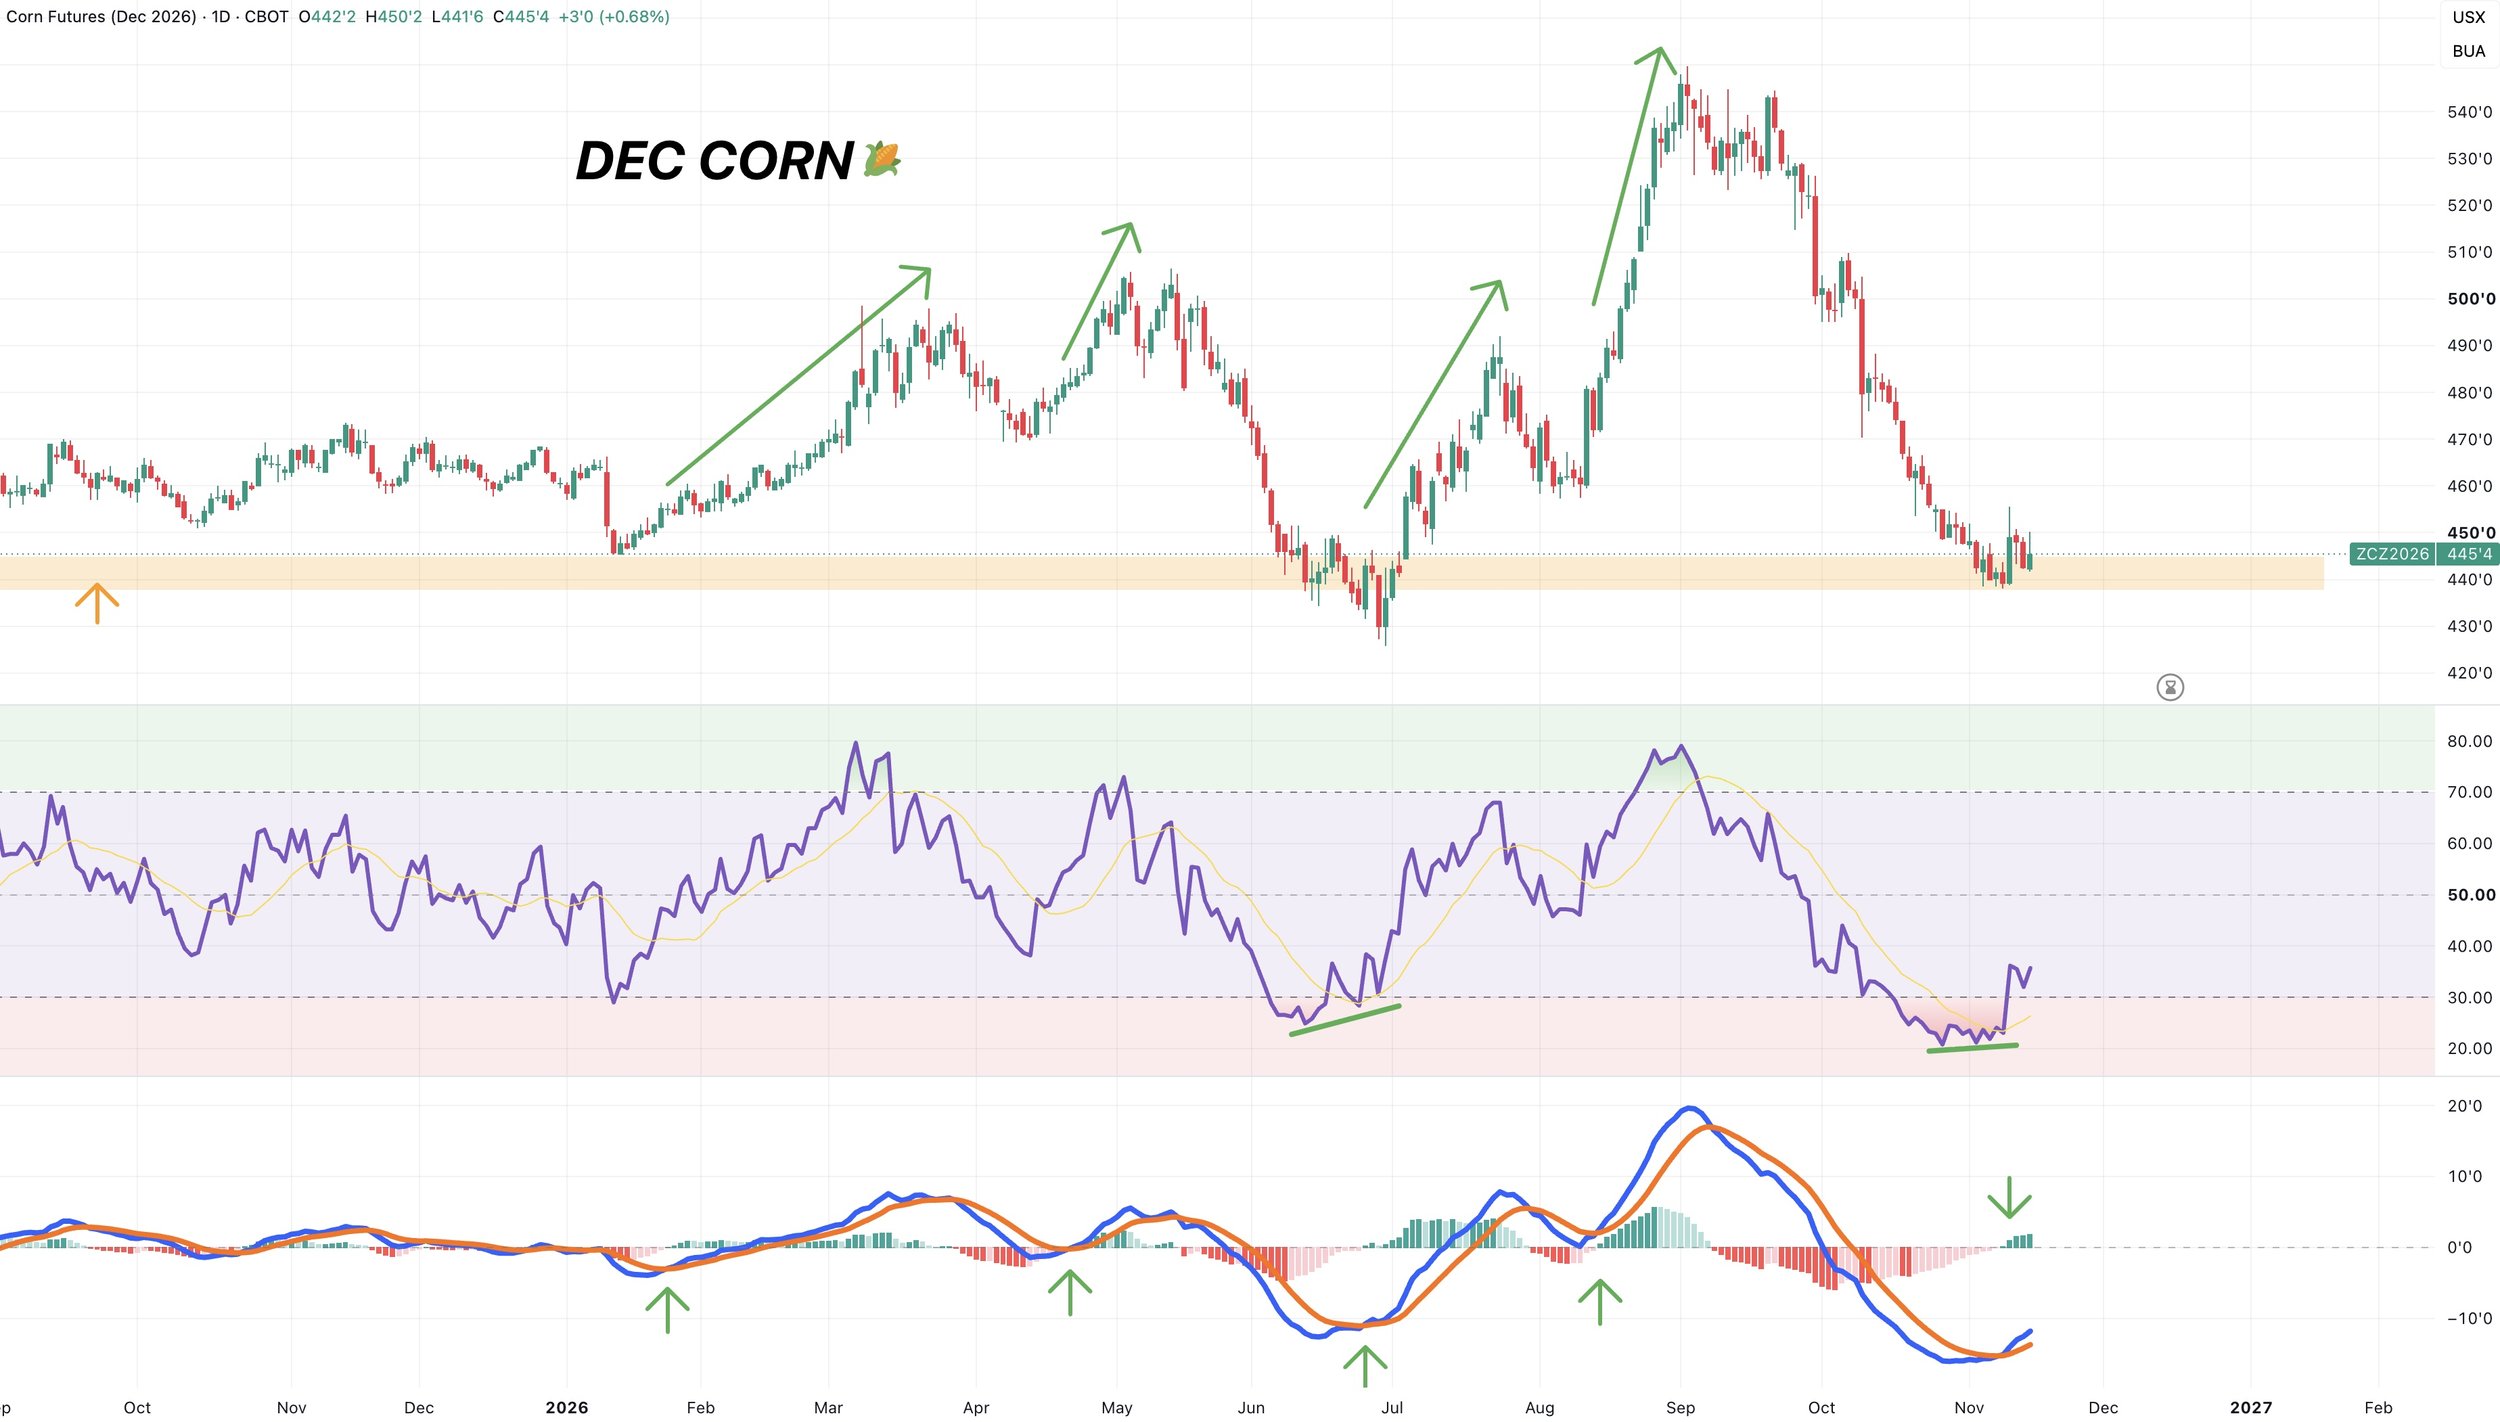
Dec Corn Chart:
Corn still has bullish divergence on the RSI and just saw the MACD cross bullish for the first time since August.
The last time we saw bullish divergence was the June lows.
So far, every single MACD cross has resulted in some upside.
So the indicators are giving positive signs. And suggest the bottom should be close if not already in.
4 Hour Chart:
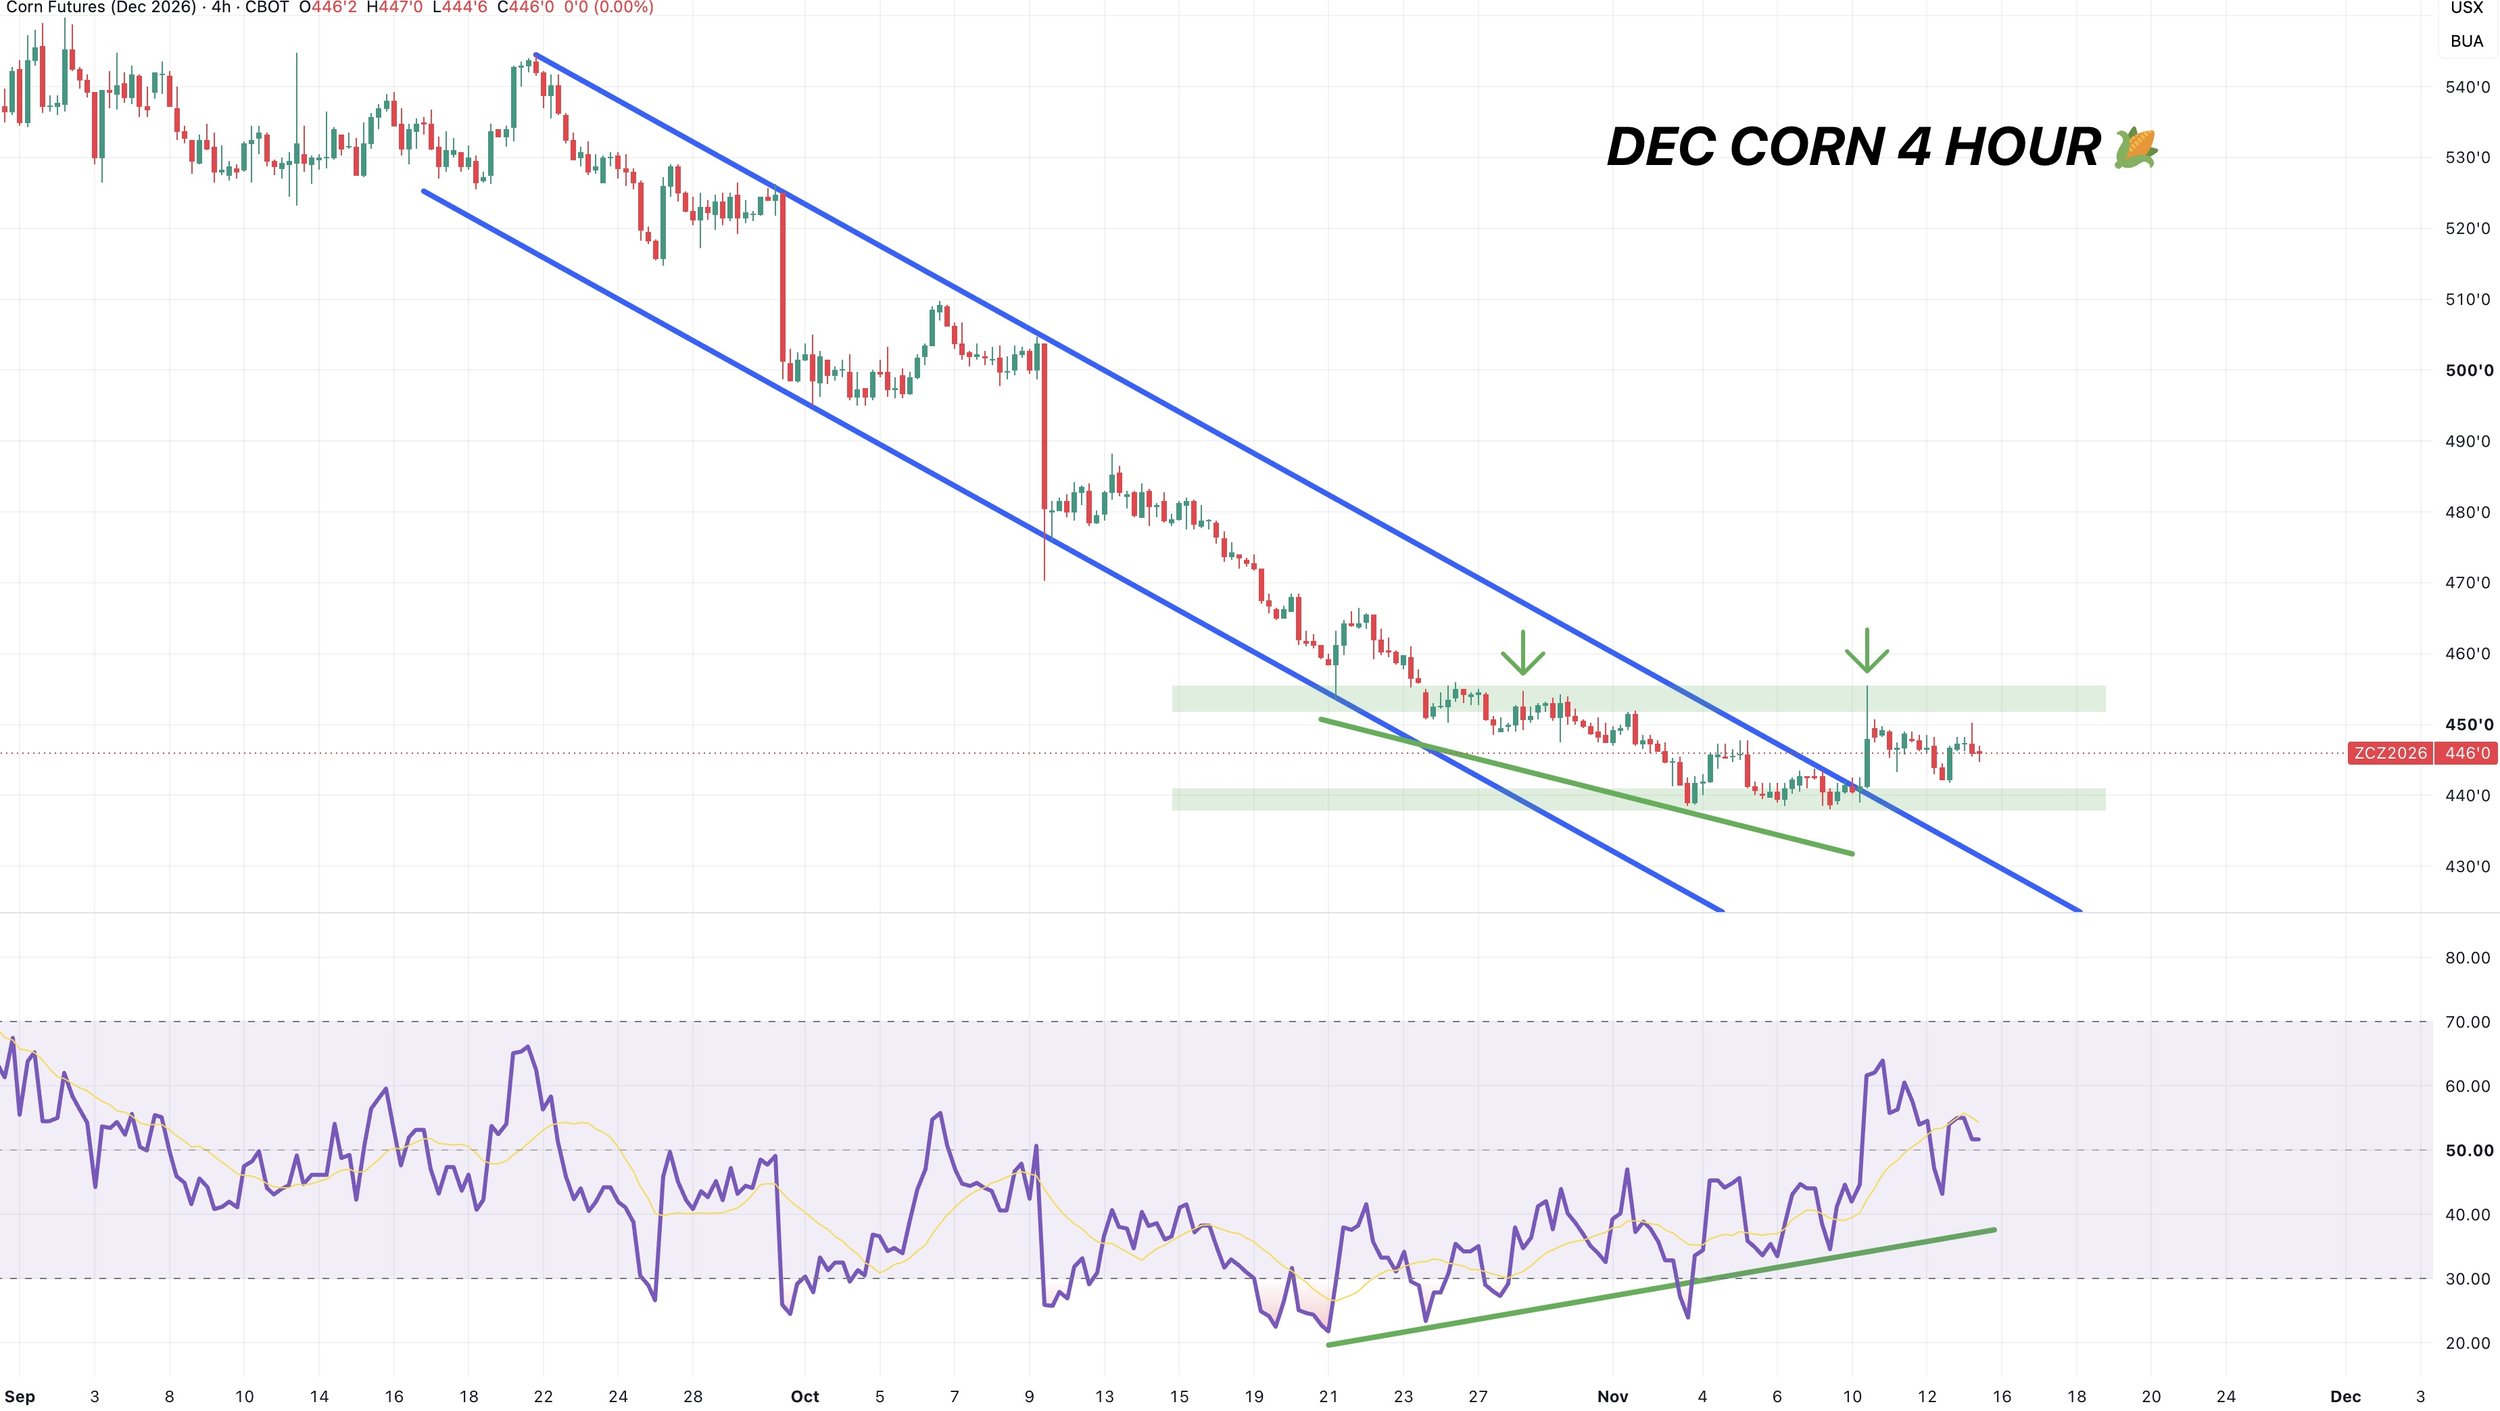
Let's zoom in here.
We had a clear downward channel we had been trapped in. We broke out on the USDA.
The level we need to break above to spark further upside is going to be that $4.55 range and recent highs.
If you are able to do that, it would be a good sign we are ready for the next leg higher.
I once again wanted to point out that we have been building bullish divergence on the RSI.
Which no, does not automatically mean we have to bottom, but it's often a sign that sellers are getting tired.
Ideally we hold those recent lows. As getting a pretty bullish USDA report and then going on to post new lows wouldn’t be the best sign in the world.
But for now, the signs of a bottom are there.
Bollinger Bands:
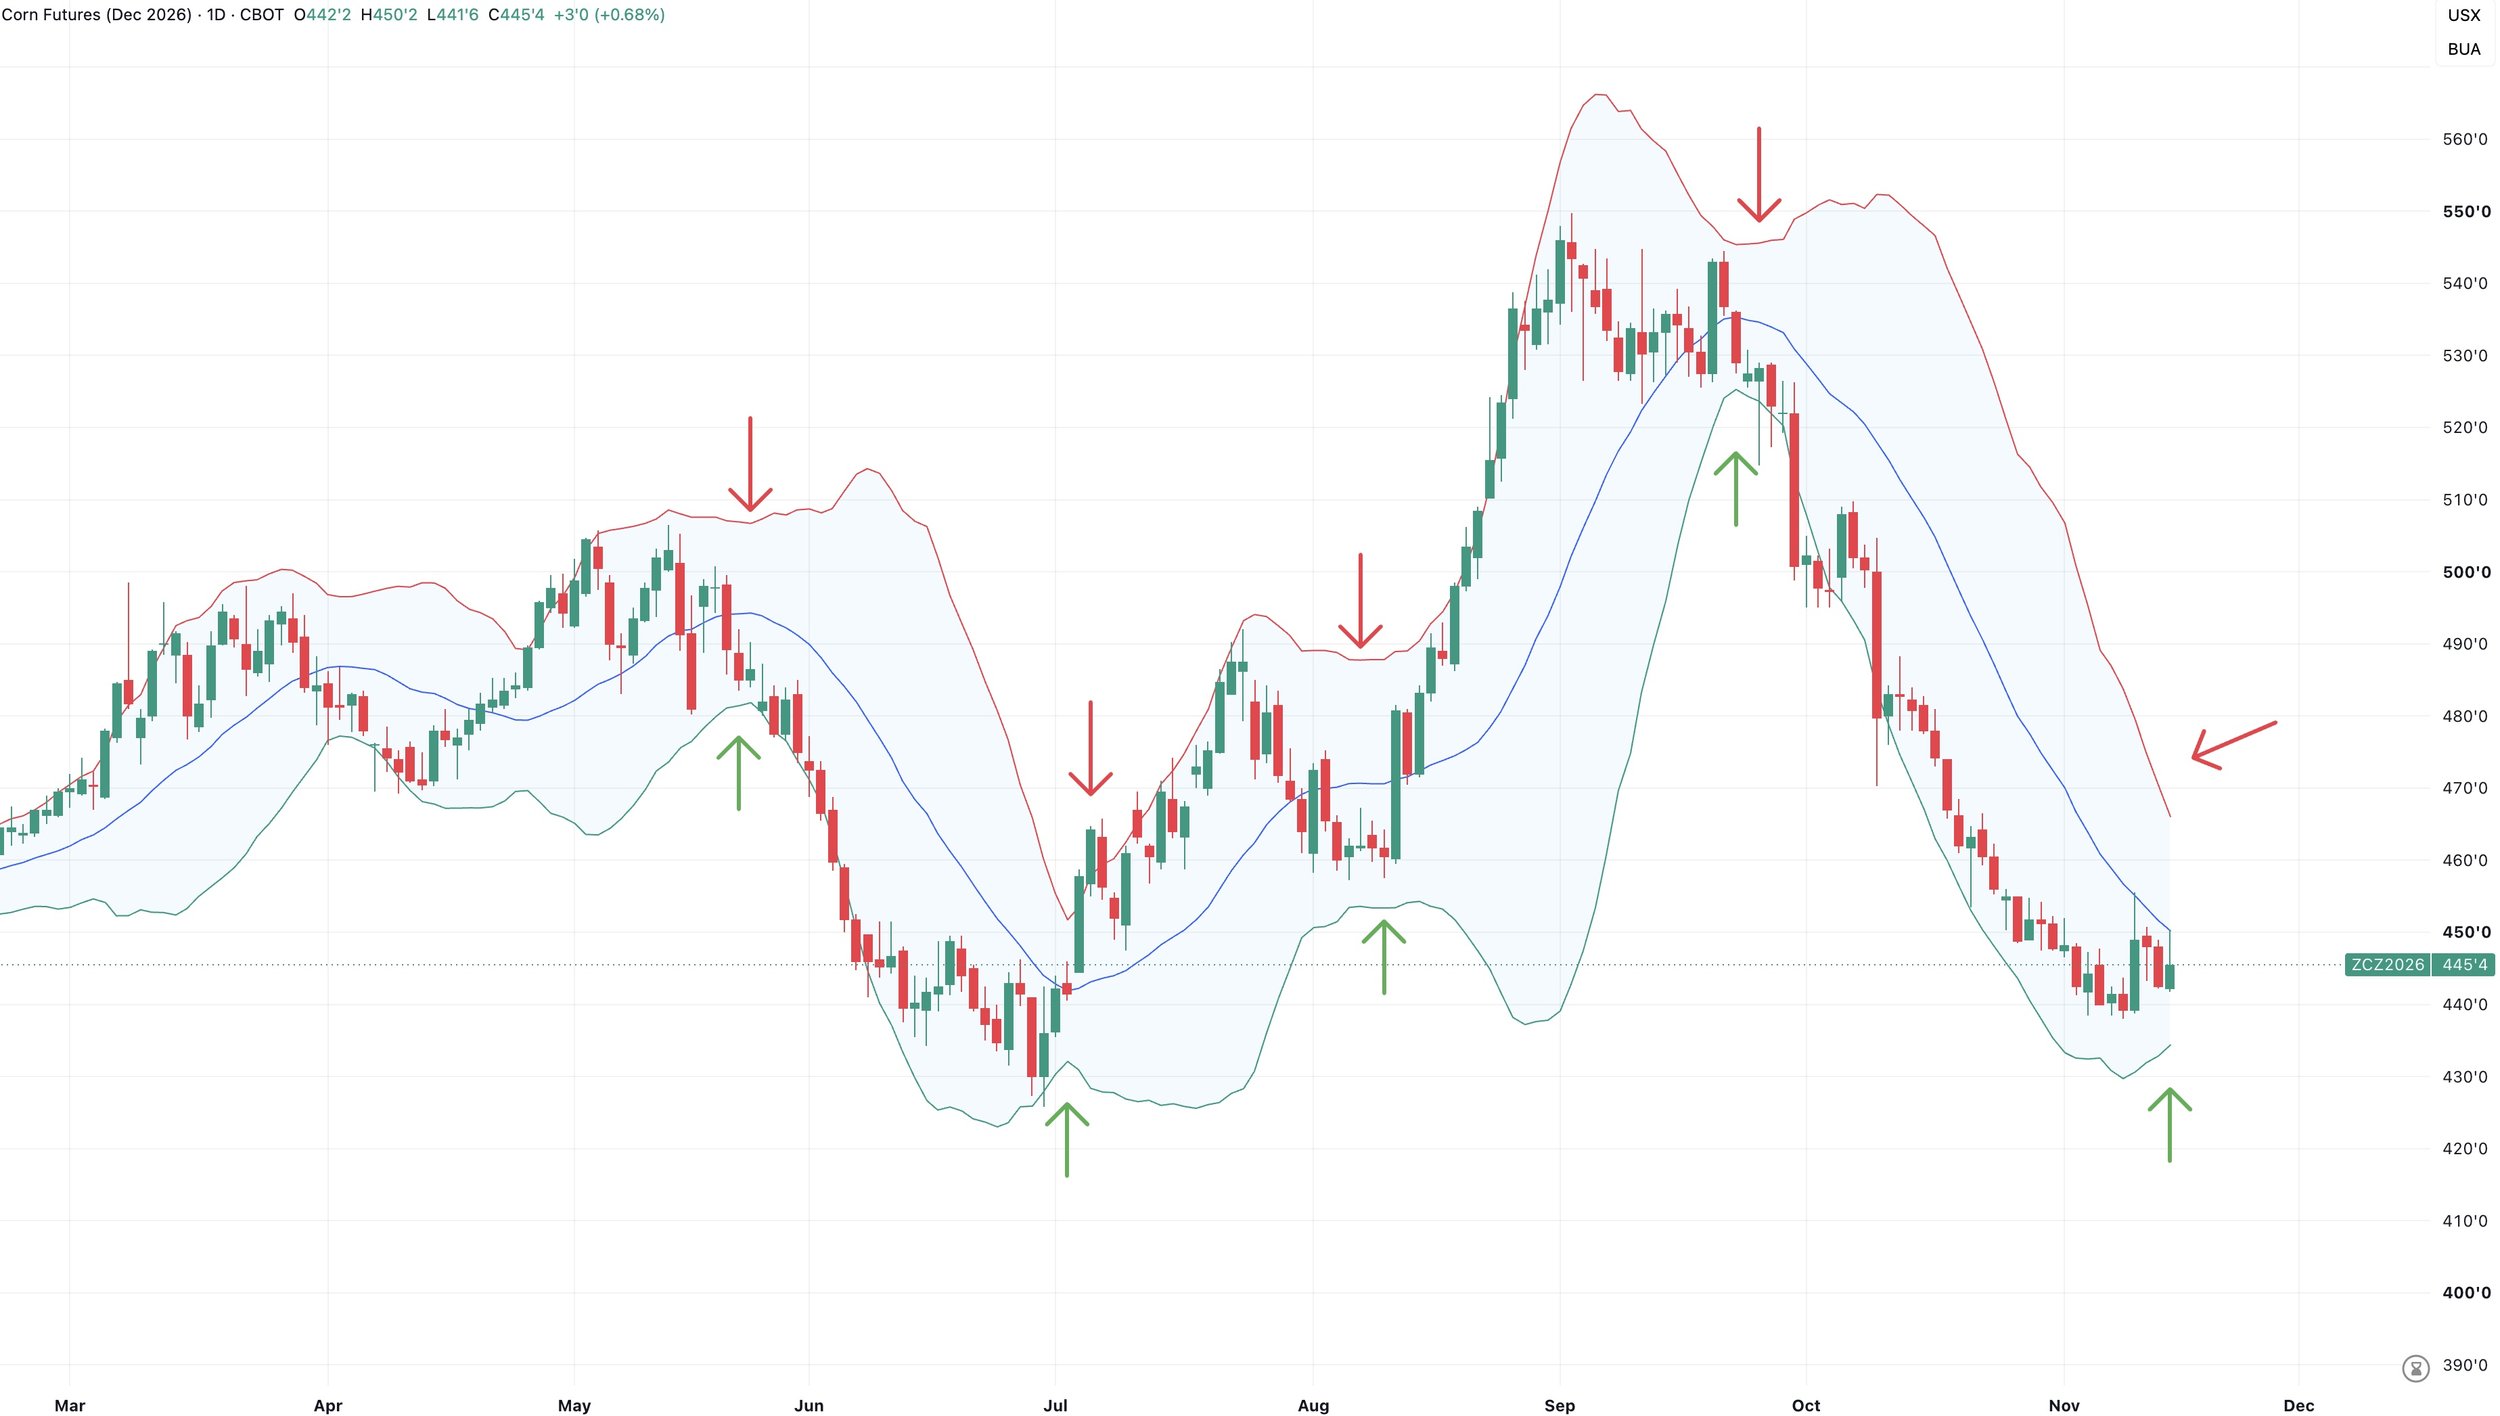
Here is an indicator I've never shown before.
These can sometimes help anticipate when a big move is coming.
When they start to squeeze and move towards each other, it sometimes signals a bigger move is brewing.
When they are squeezing together, it means that volatility is declining. Then they expand on price swings.
Why does this matter?
Because period of low volatility can set the stage for bigger moves.
Which we've seen in the past, and the bands have shown this.
Before the July and August rallies, the bands started to squeeze closer.
Before the massive melt down in October, they started to squeeze closer.
Now, they've started to move closer again for the first time since those highs.
If you notice, the bottom band is curling higher. The top band is still headed lower. Bringing them closer together.
This does not mean a big move has to happen immediately, as it does not tell you exactly when nor does it tell you the direction of the move. But it's a reason it should be on our radar as we are finally starting to show a little life down here.
The tighter they squeeze, the more we want to watch for some expansion.
Currently they are not nearly as tight as they were on any of the last big moves, but are starting to tighten for the first time.
First Potential Target: March Corn
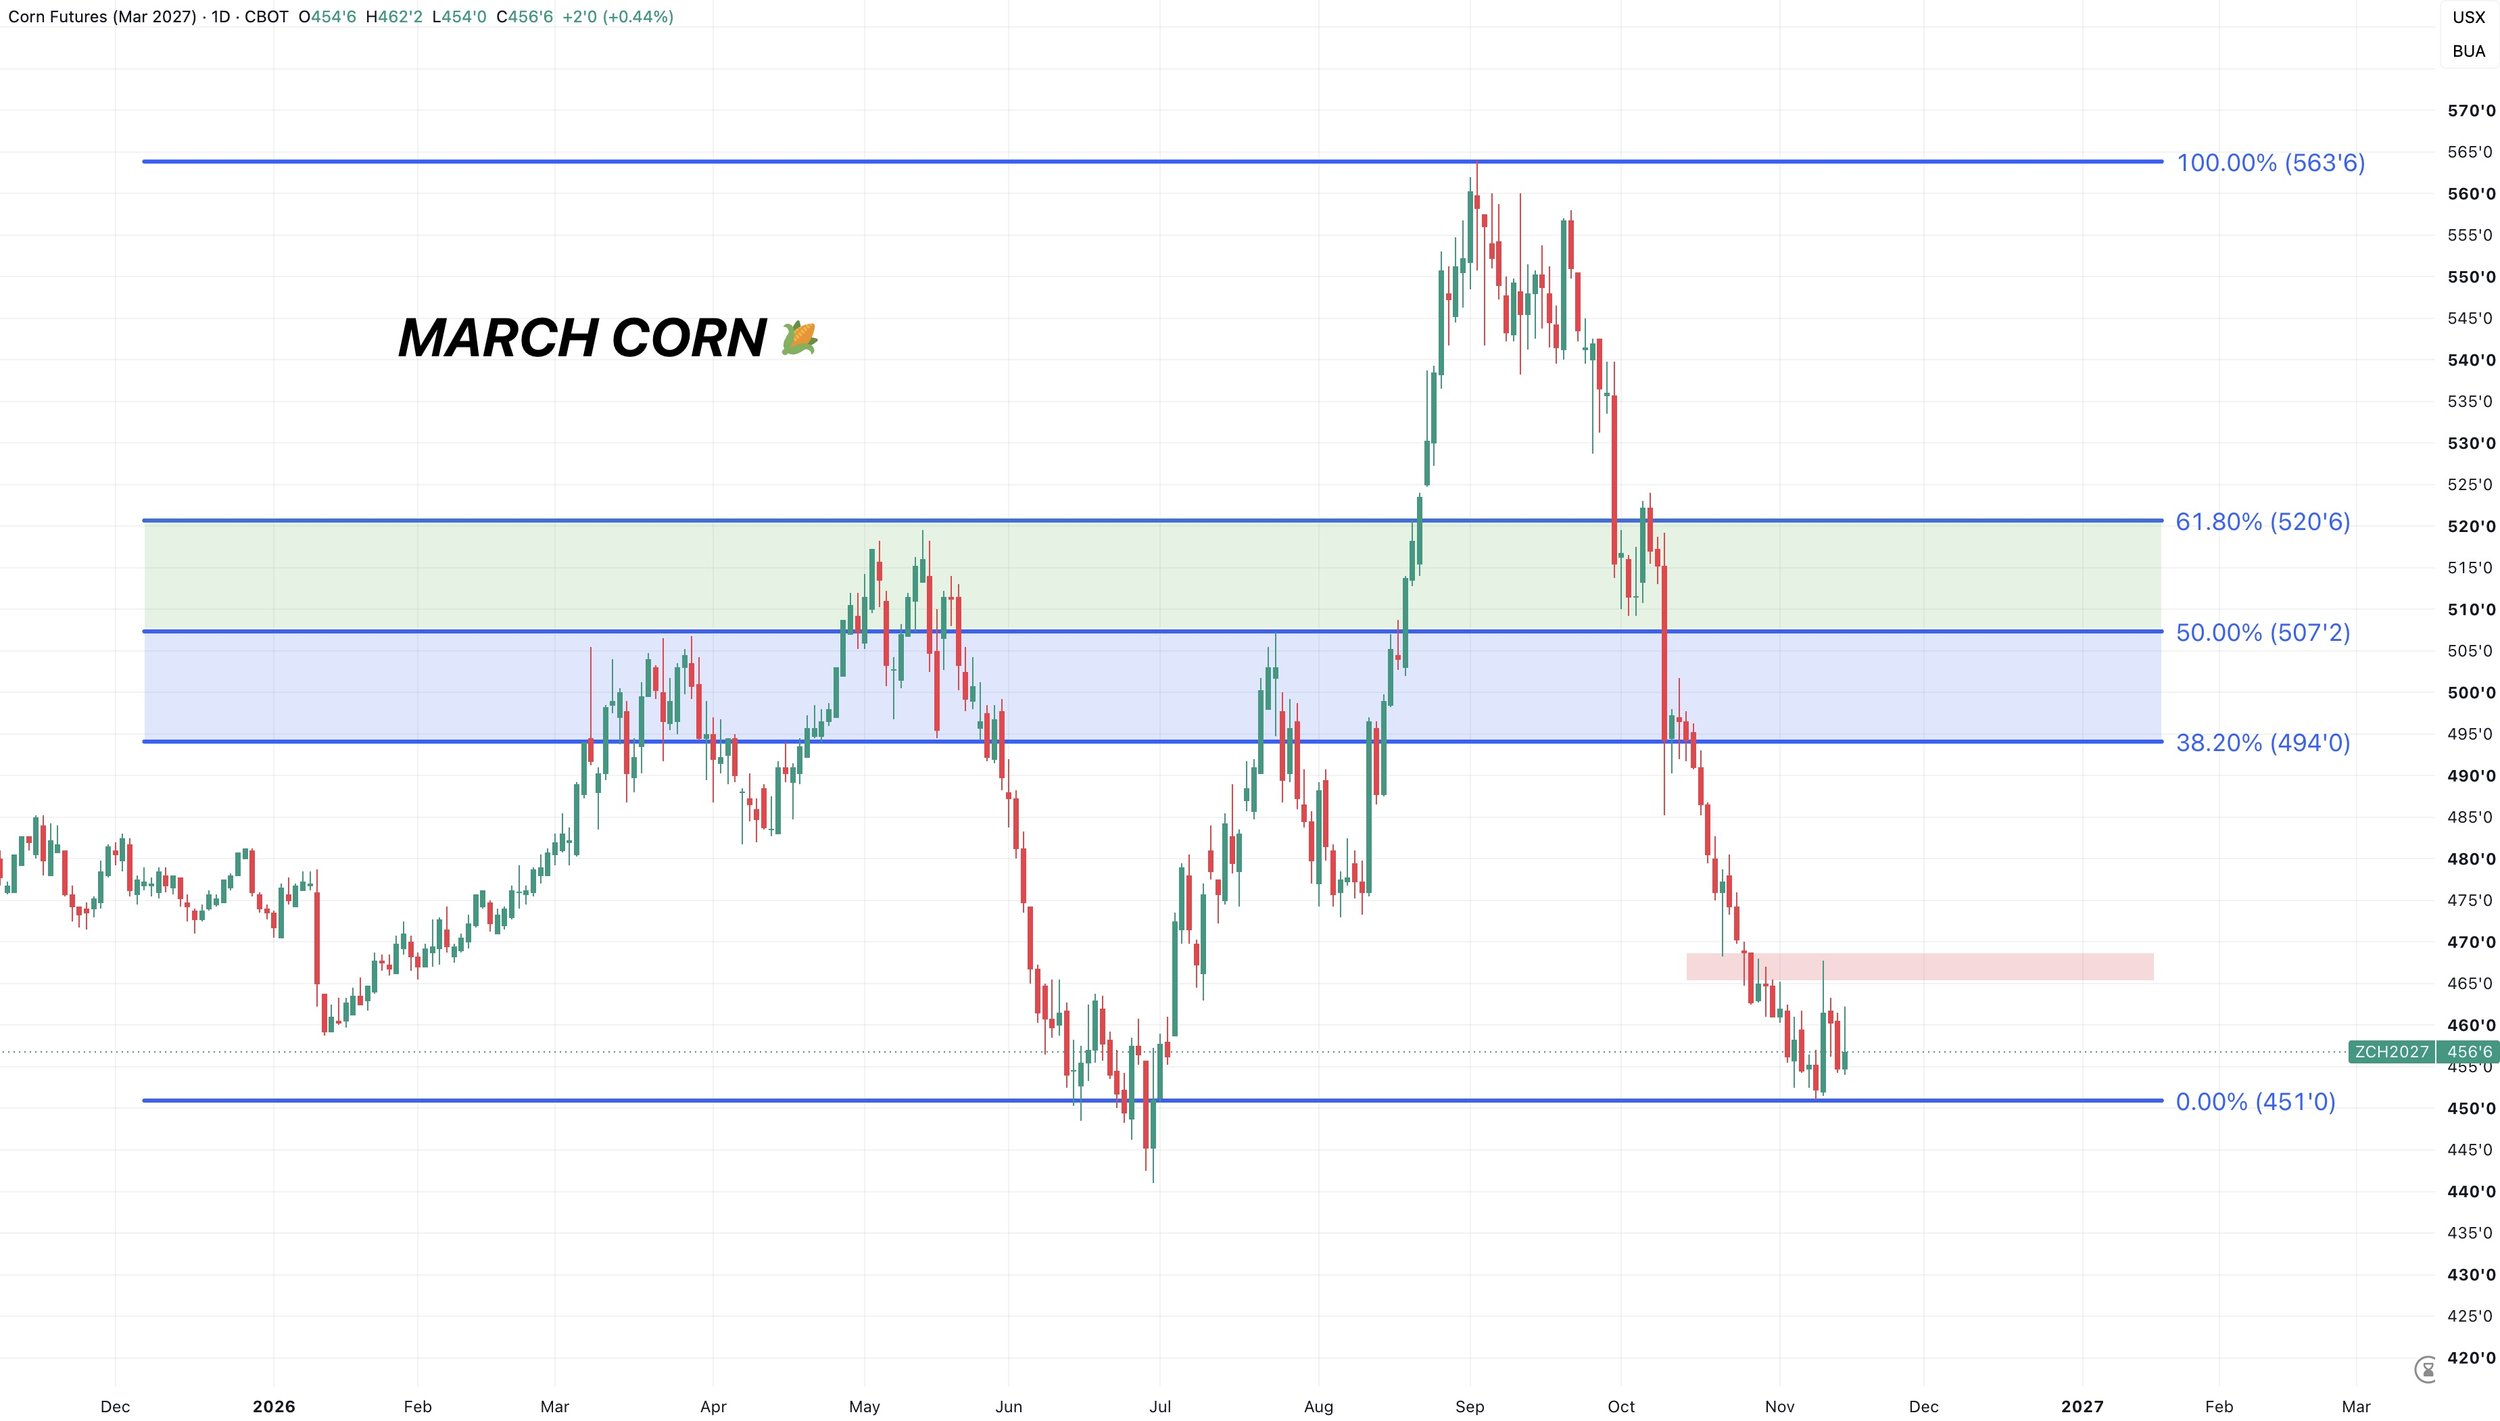
Dec doesn’t have much time, so let's look at some upside targets in March.
The first level we have to clear of obviously these recent highs. We need to see some higher highs, as we have not seen one since September.
If this is the bottom, at minimum we would be looking for a move towards $4.94 to $5.07
Which claws back 38.2% to 50% of the entire sell off. That same range was resistance back in spring.
Targets are subject to change, but for now that's the level I am watching.
Soybeans
Fundamentals:
I went over the US fundamentals earlier this week, so I don’t want to spend much time here.
We just saw our largest yield print of the year.
Yet.. we also saw our smallest carryout print of the year.
Because demand is simply that strong.
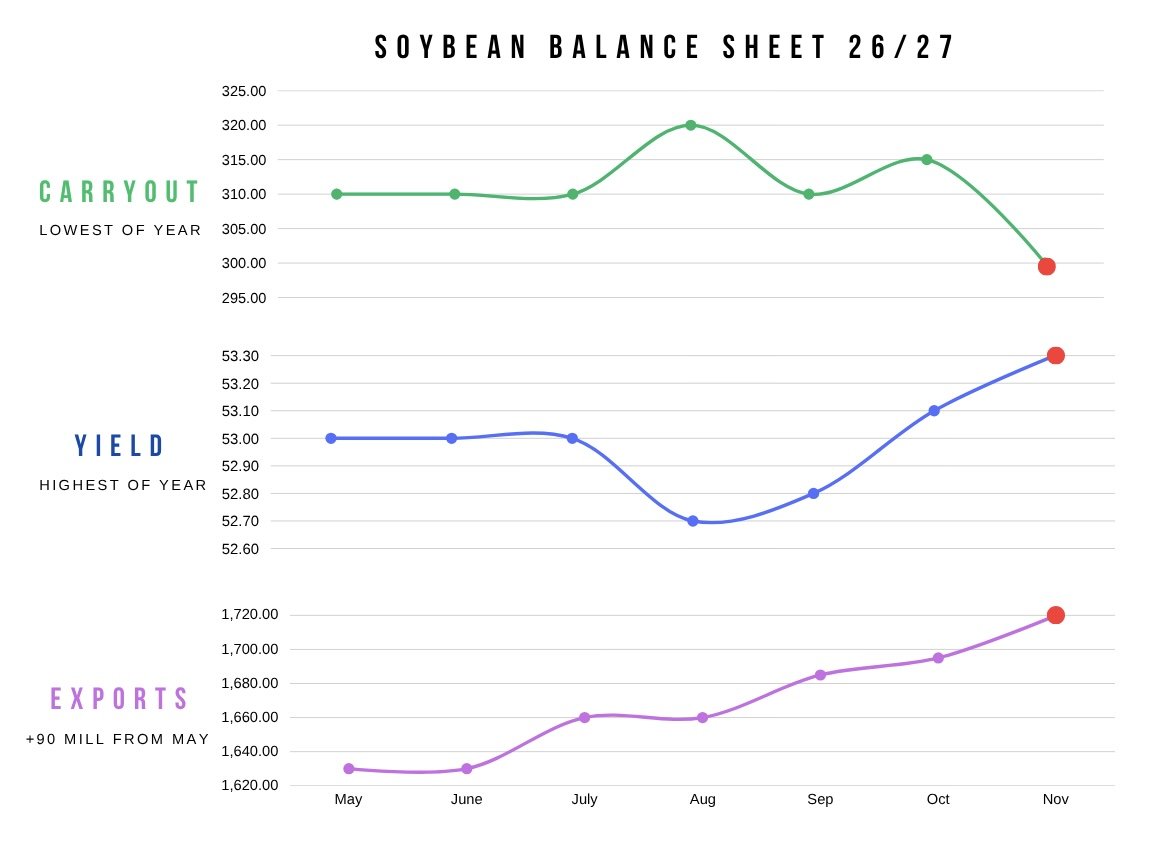
I would argue the USDA probably has to raise exports again.
Given that we are +80% ahead of last year while the USDA only has exports up +14% vs last year.
If the USDA raises yield (which would not be surprising), it should be met with more demand to help offset any extra supply.
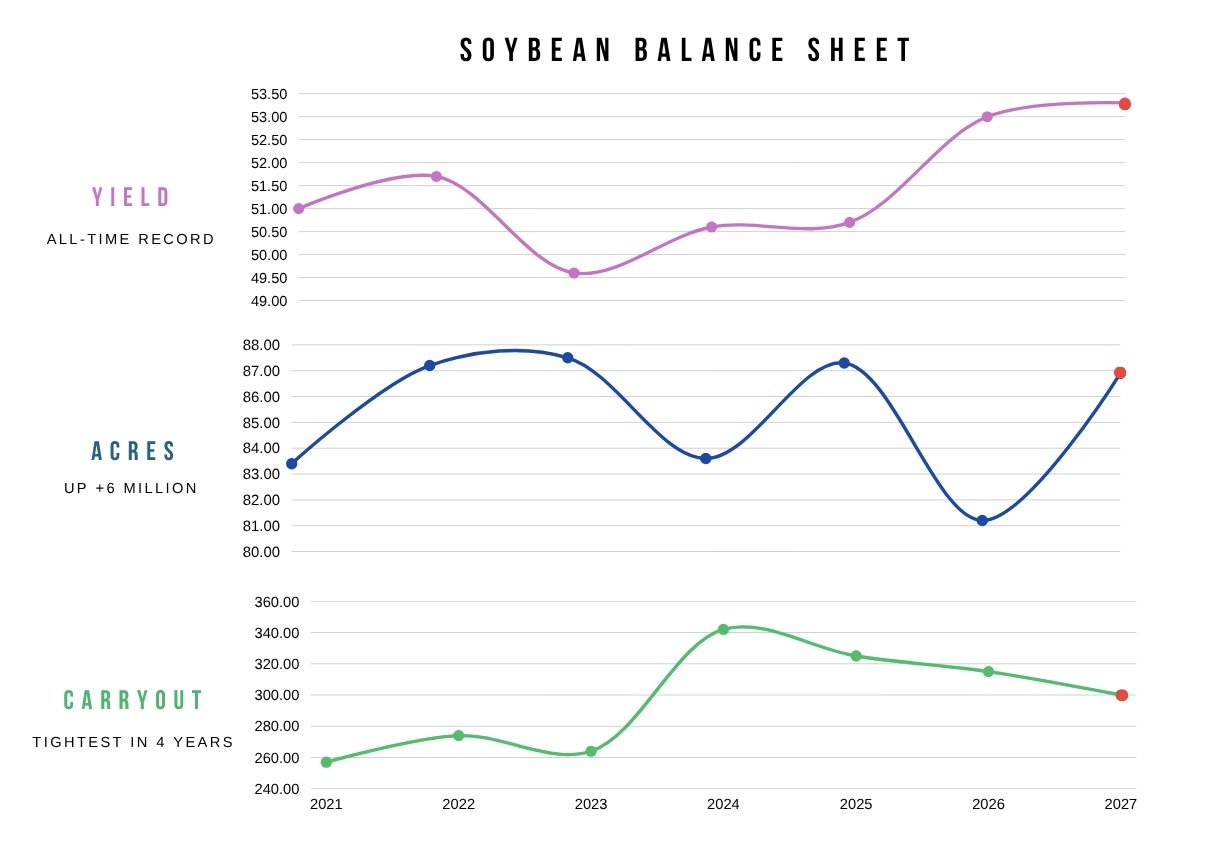
Demand is so impressive that we have nearly +6 million more acres this year, a record yield, and a record amount of production.
Yet a tighter balance sheet compared to last year.
The US balance sheet isn’t wildly bullish at a 300 million bu carryout.
But the balance sheet getting tighter on a record crop is not bearish.
Big demand has to be met with a big crop.
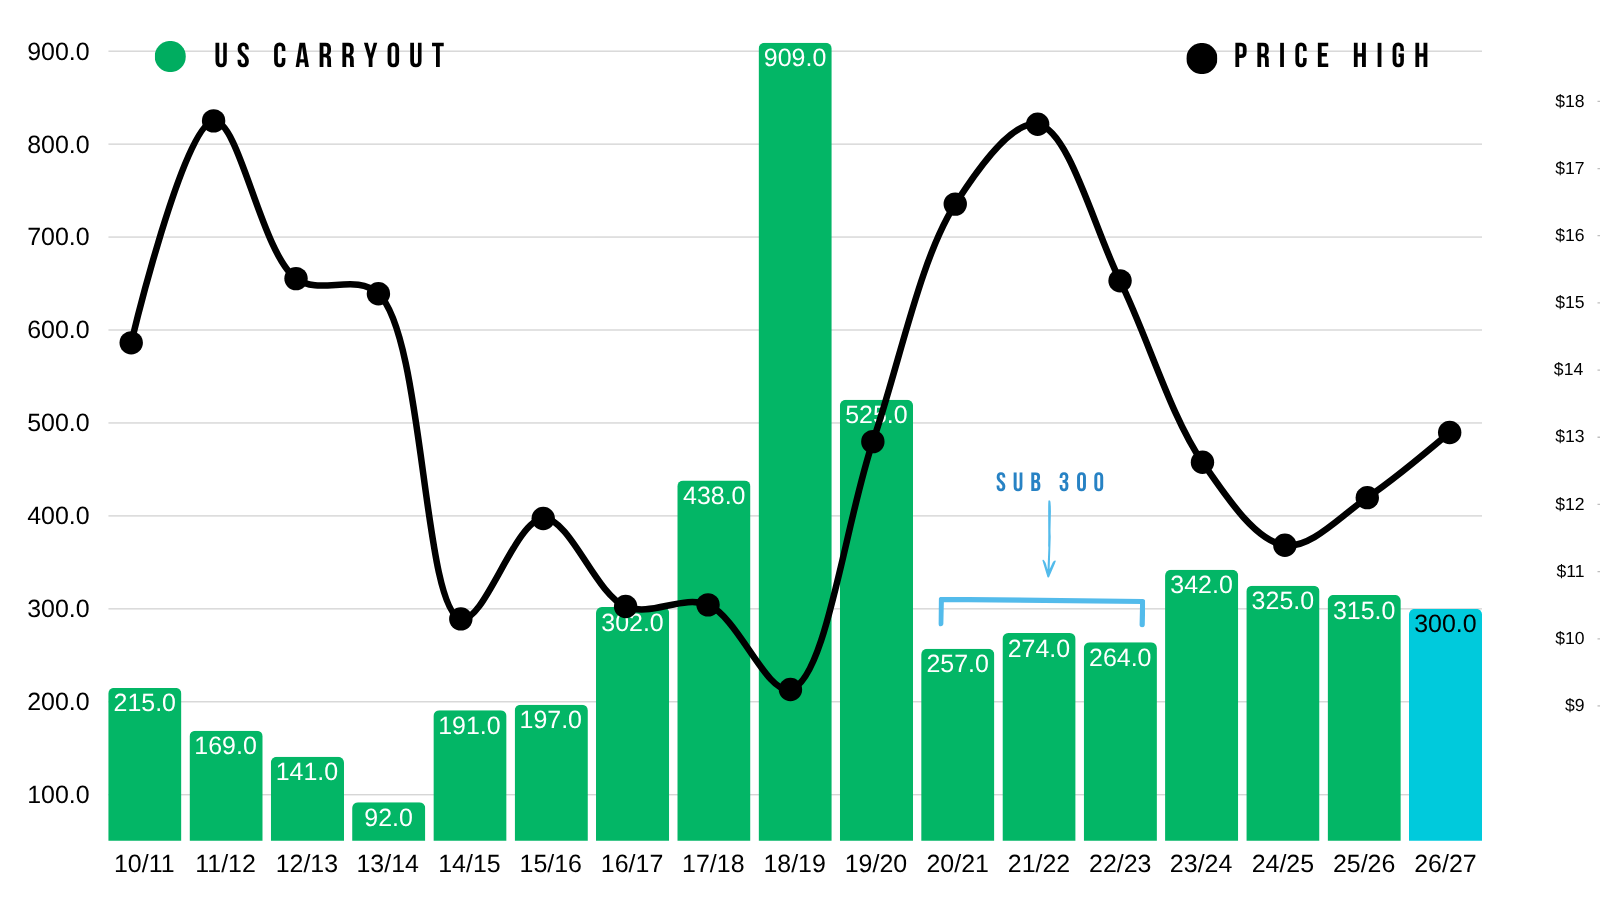
If you look just at the US balance sheet, again 300 million isn’t crazy bullish.
It's tighter than the last several years, but not on par with the bull market.
In the bull market, all years feautured a sub 300 million carryout.
What this USDA report just did though, is that it made South America weather that much more important.
All Eyes on Brazil:
What happens down in Brazil is probably going to have an even bigger impact than whatever the USDA does to the US situation.
I am probably beating a dead horse, as I have talked about a thousand times at this point, but it's important.
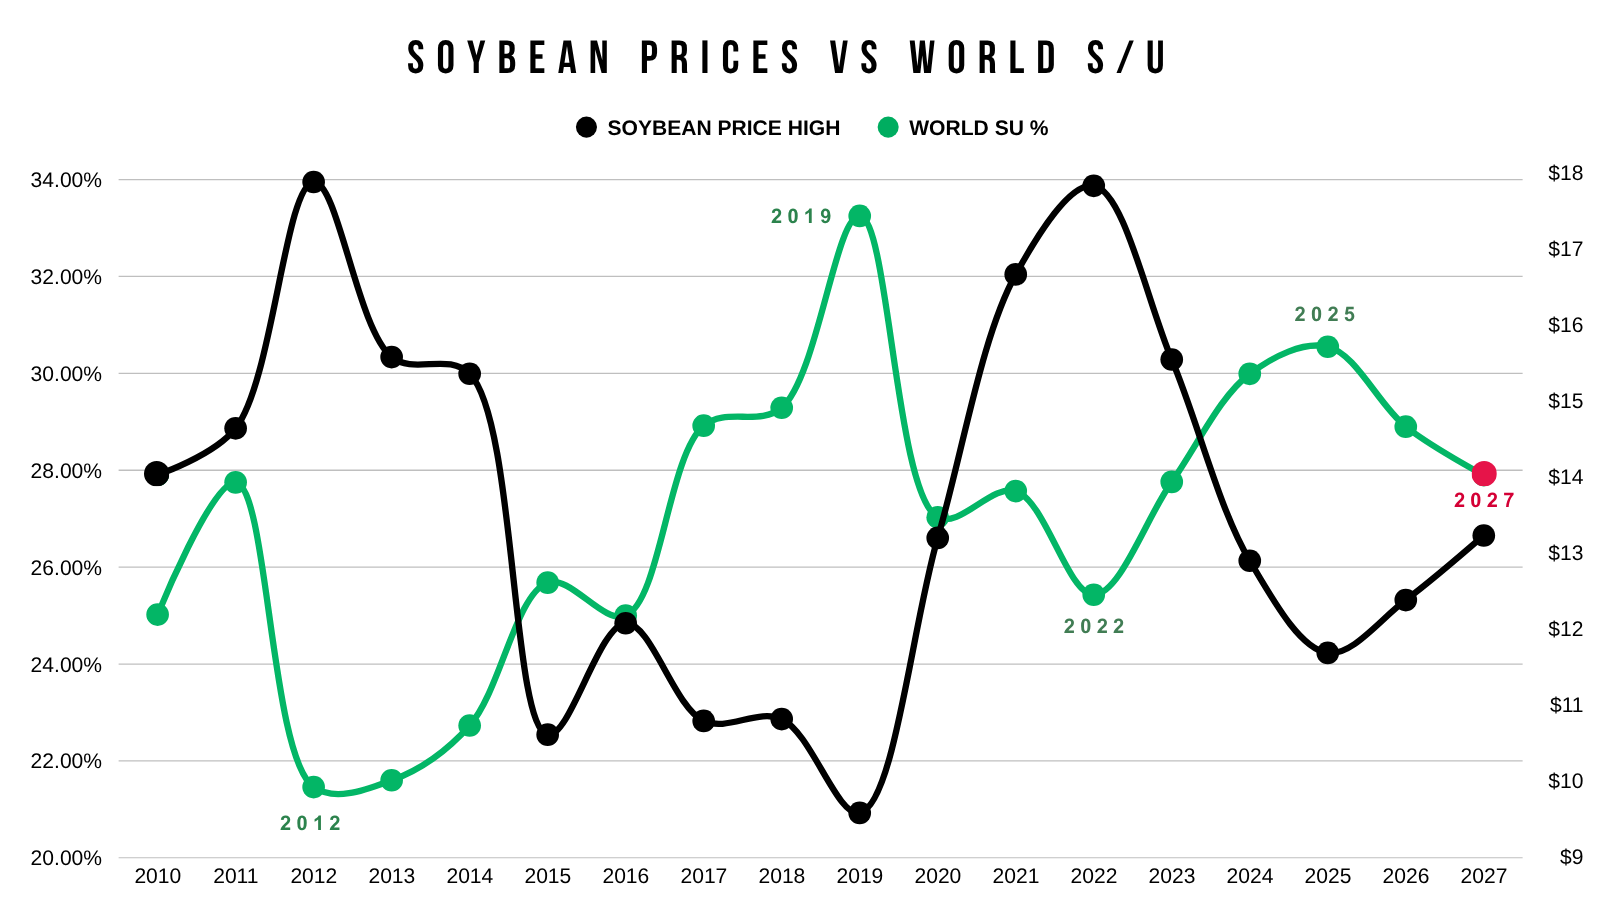
The world situation has a very high correlation to soybean prices.
Whereas the US situation has a more loosely tied correlation. Because Brazil is the king of soybeans now.
2025: High World S/U = Low Prices
2022: Tight World S/U = High Prices
2019: Very High World S/U = Very Low Prices
2012: Tight Low World S/U = High Prices
And so on.. it's really that simple.
Now, the world situation has been grinding lower for the last several years. As a result, prices have followed higher.
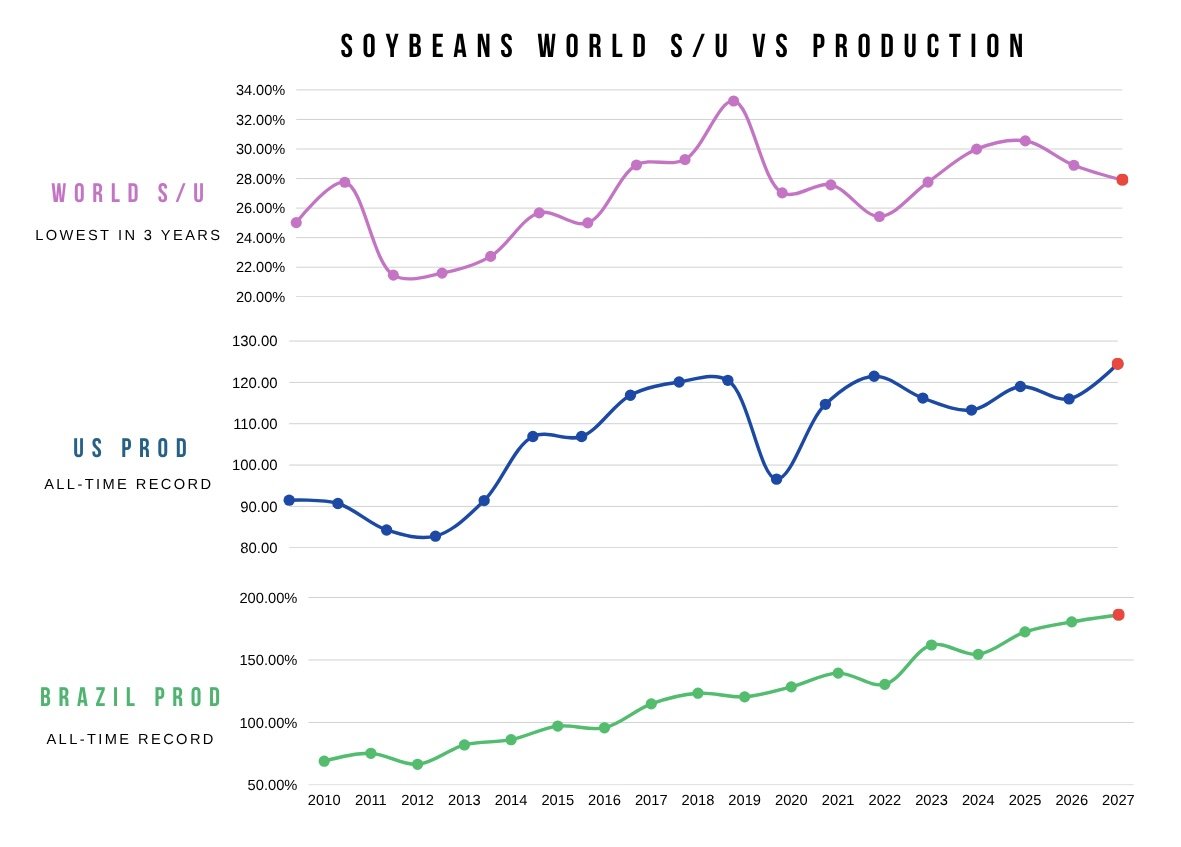
At the same time, BOTH the US and Brazil have RECORD crops.
Yet.. the world situation is shrinking.
If record crops is not enough for the world balance sheet to grow.. what do you think happens if the worlds #1 grower runs into an issue?
The world simply cannot afford a problem in Brazil.
Whether Brazil runs into an issue or not remains the million dollar question.
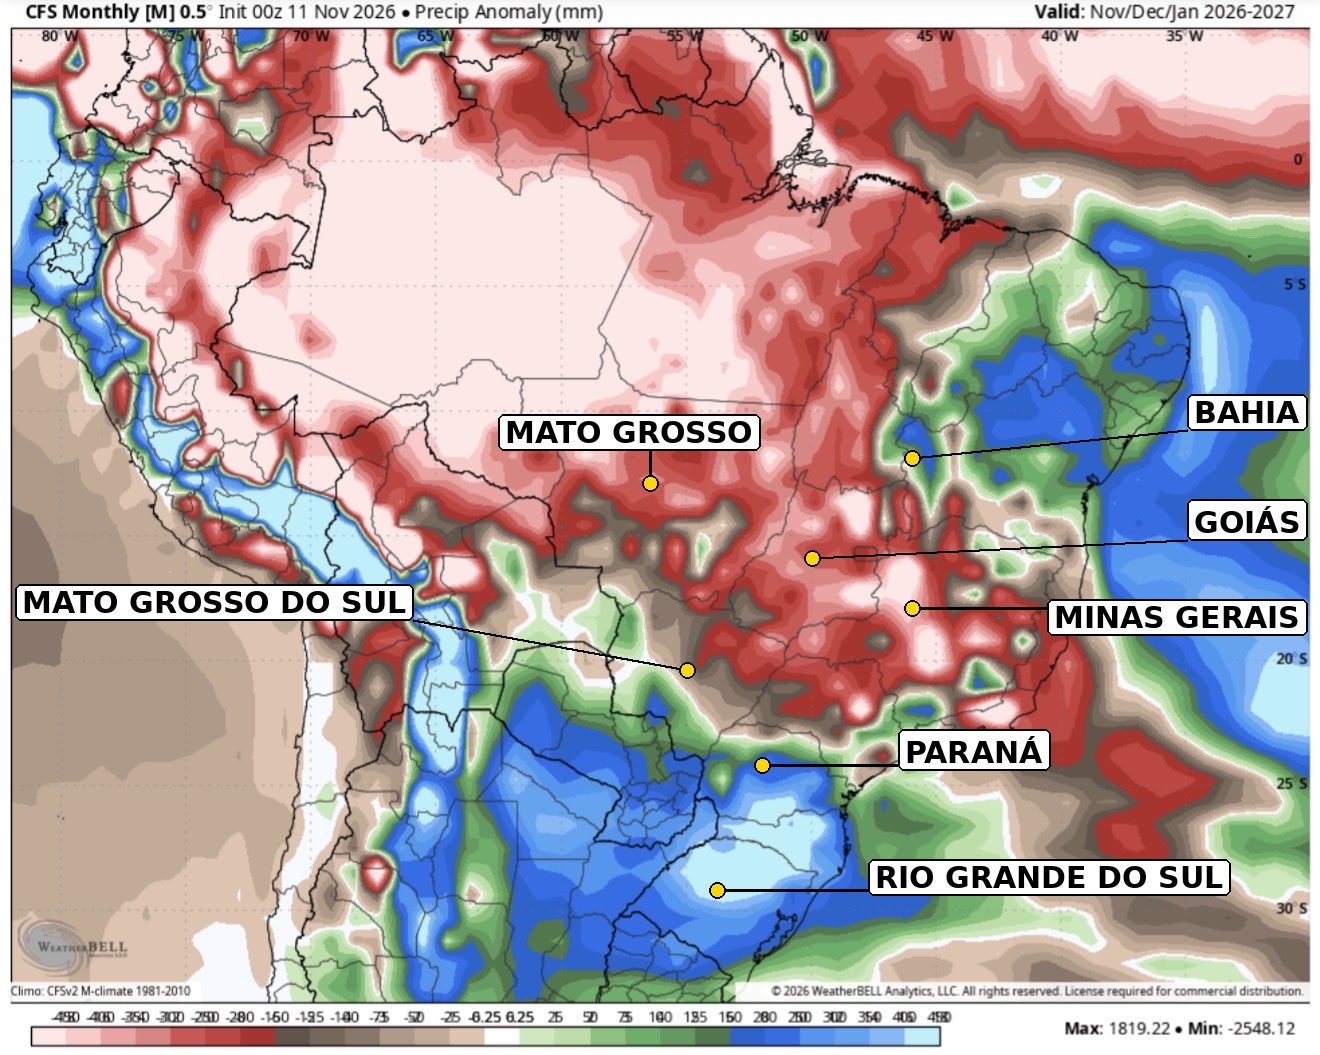
Right now, they are actually getting too much rain.
So that has some talking about potential planting delays.
Here is the Nov-Jan outlook.
It still has the north super dry in areas such as Mato Grosso.
With super wet conditions down south in Paraná.
As we've talked about before.
The last Super El Niño was 2015.
This one is suppose to be stronger.
It's anyone's guess as to if it's going to impact things the same.
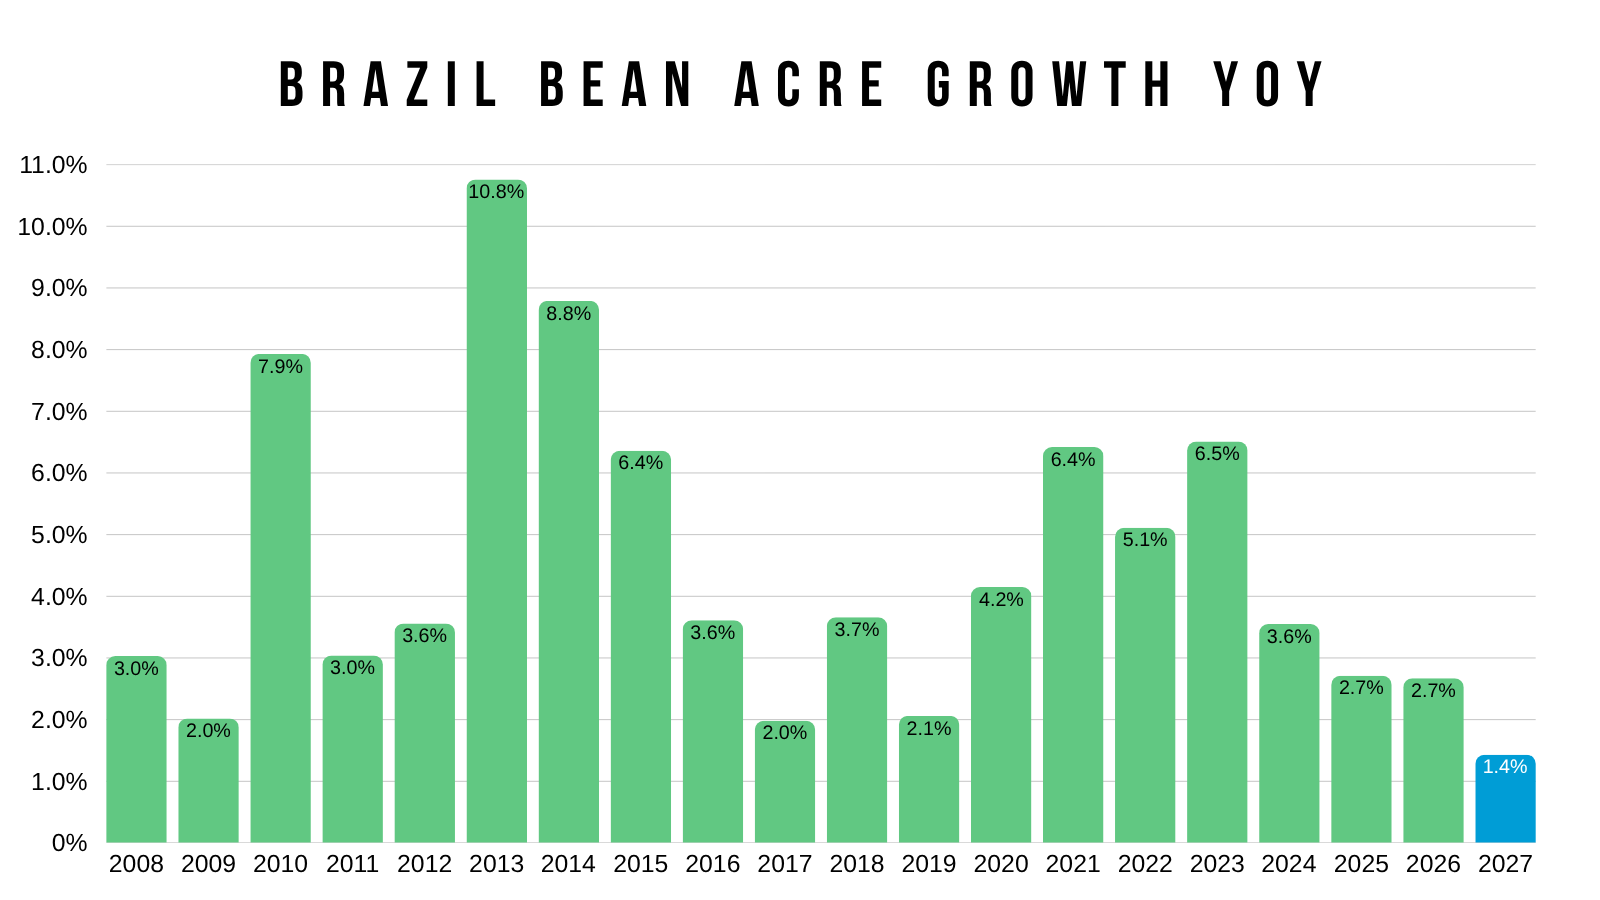
However in 2015 soybean yield was down over -4%. But more acres prevented production from dropping much.
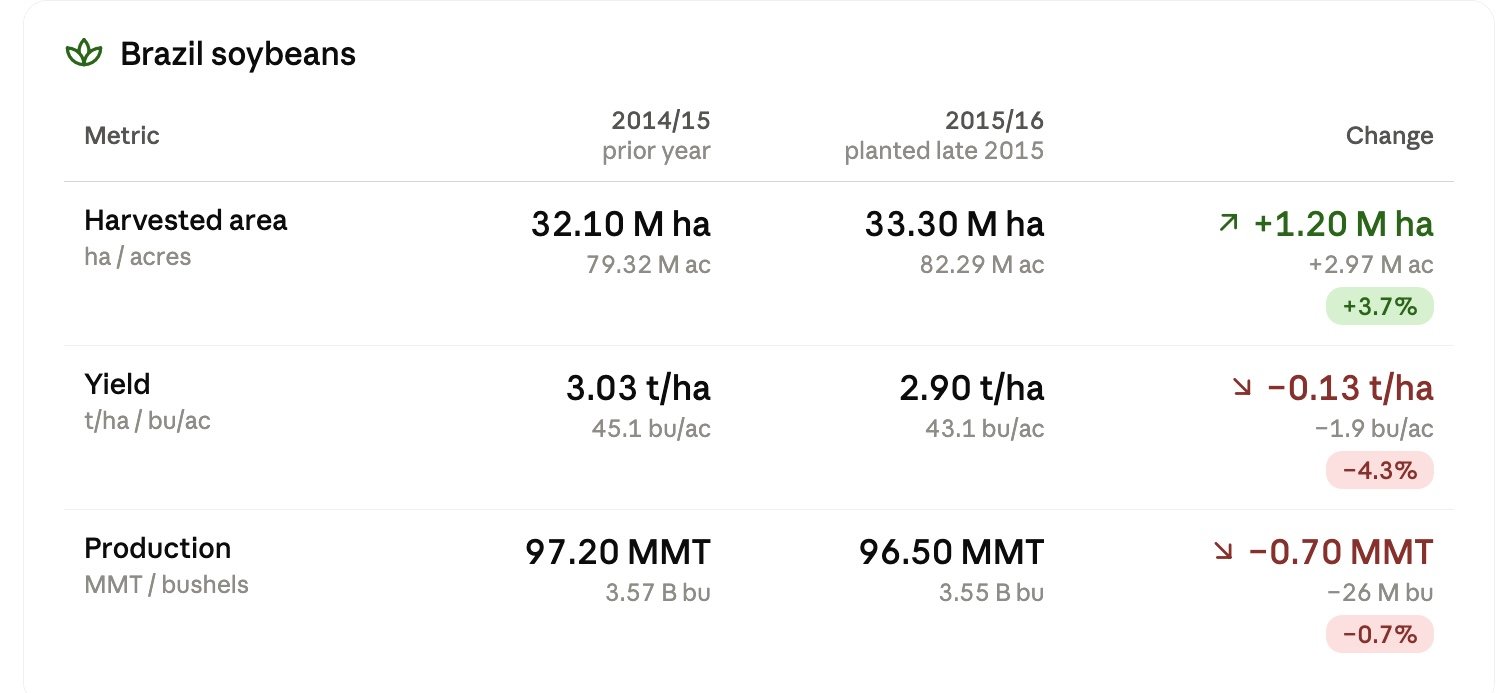
But according to CONAB, this year acres in Brazil are expected to see their smallest growth in over 20 years.
So I don’t think acres save the day if the crop gets trimmed.
Who knows how it will all shake out.
I might sound like a broken record when it comes to the Super El Niño.
But that's your wild card and by far the biggest driving factor when it comes to how high soybeans can or can't go.
An SA issue could very well be the difference between $14 soybeans and sub $12 soybeans.
The world simply can’t afford it if it happens.
Jan Beans Chart:
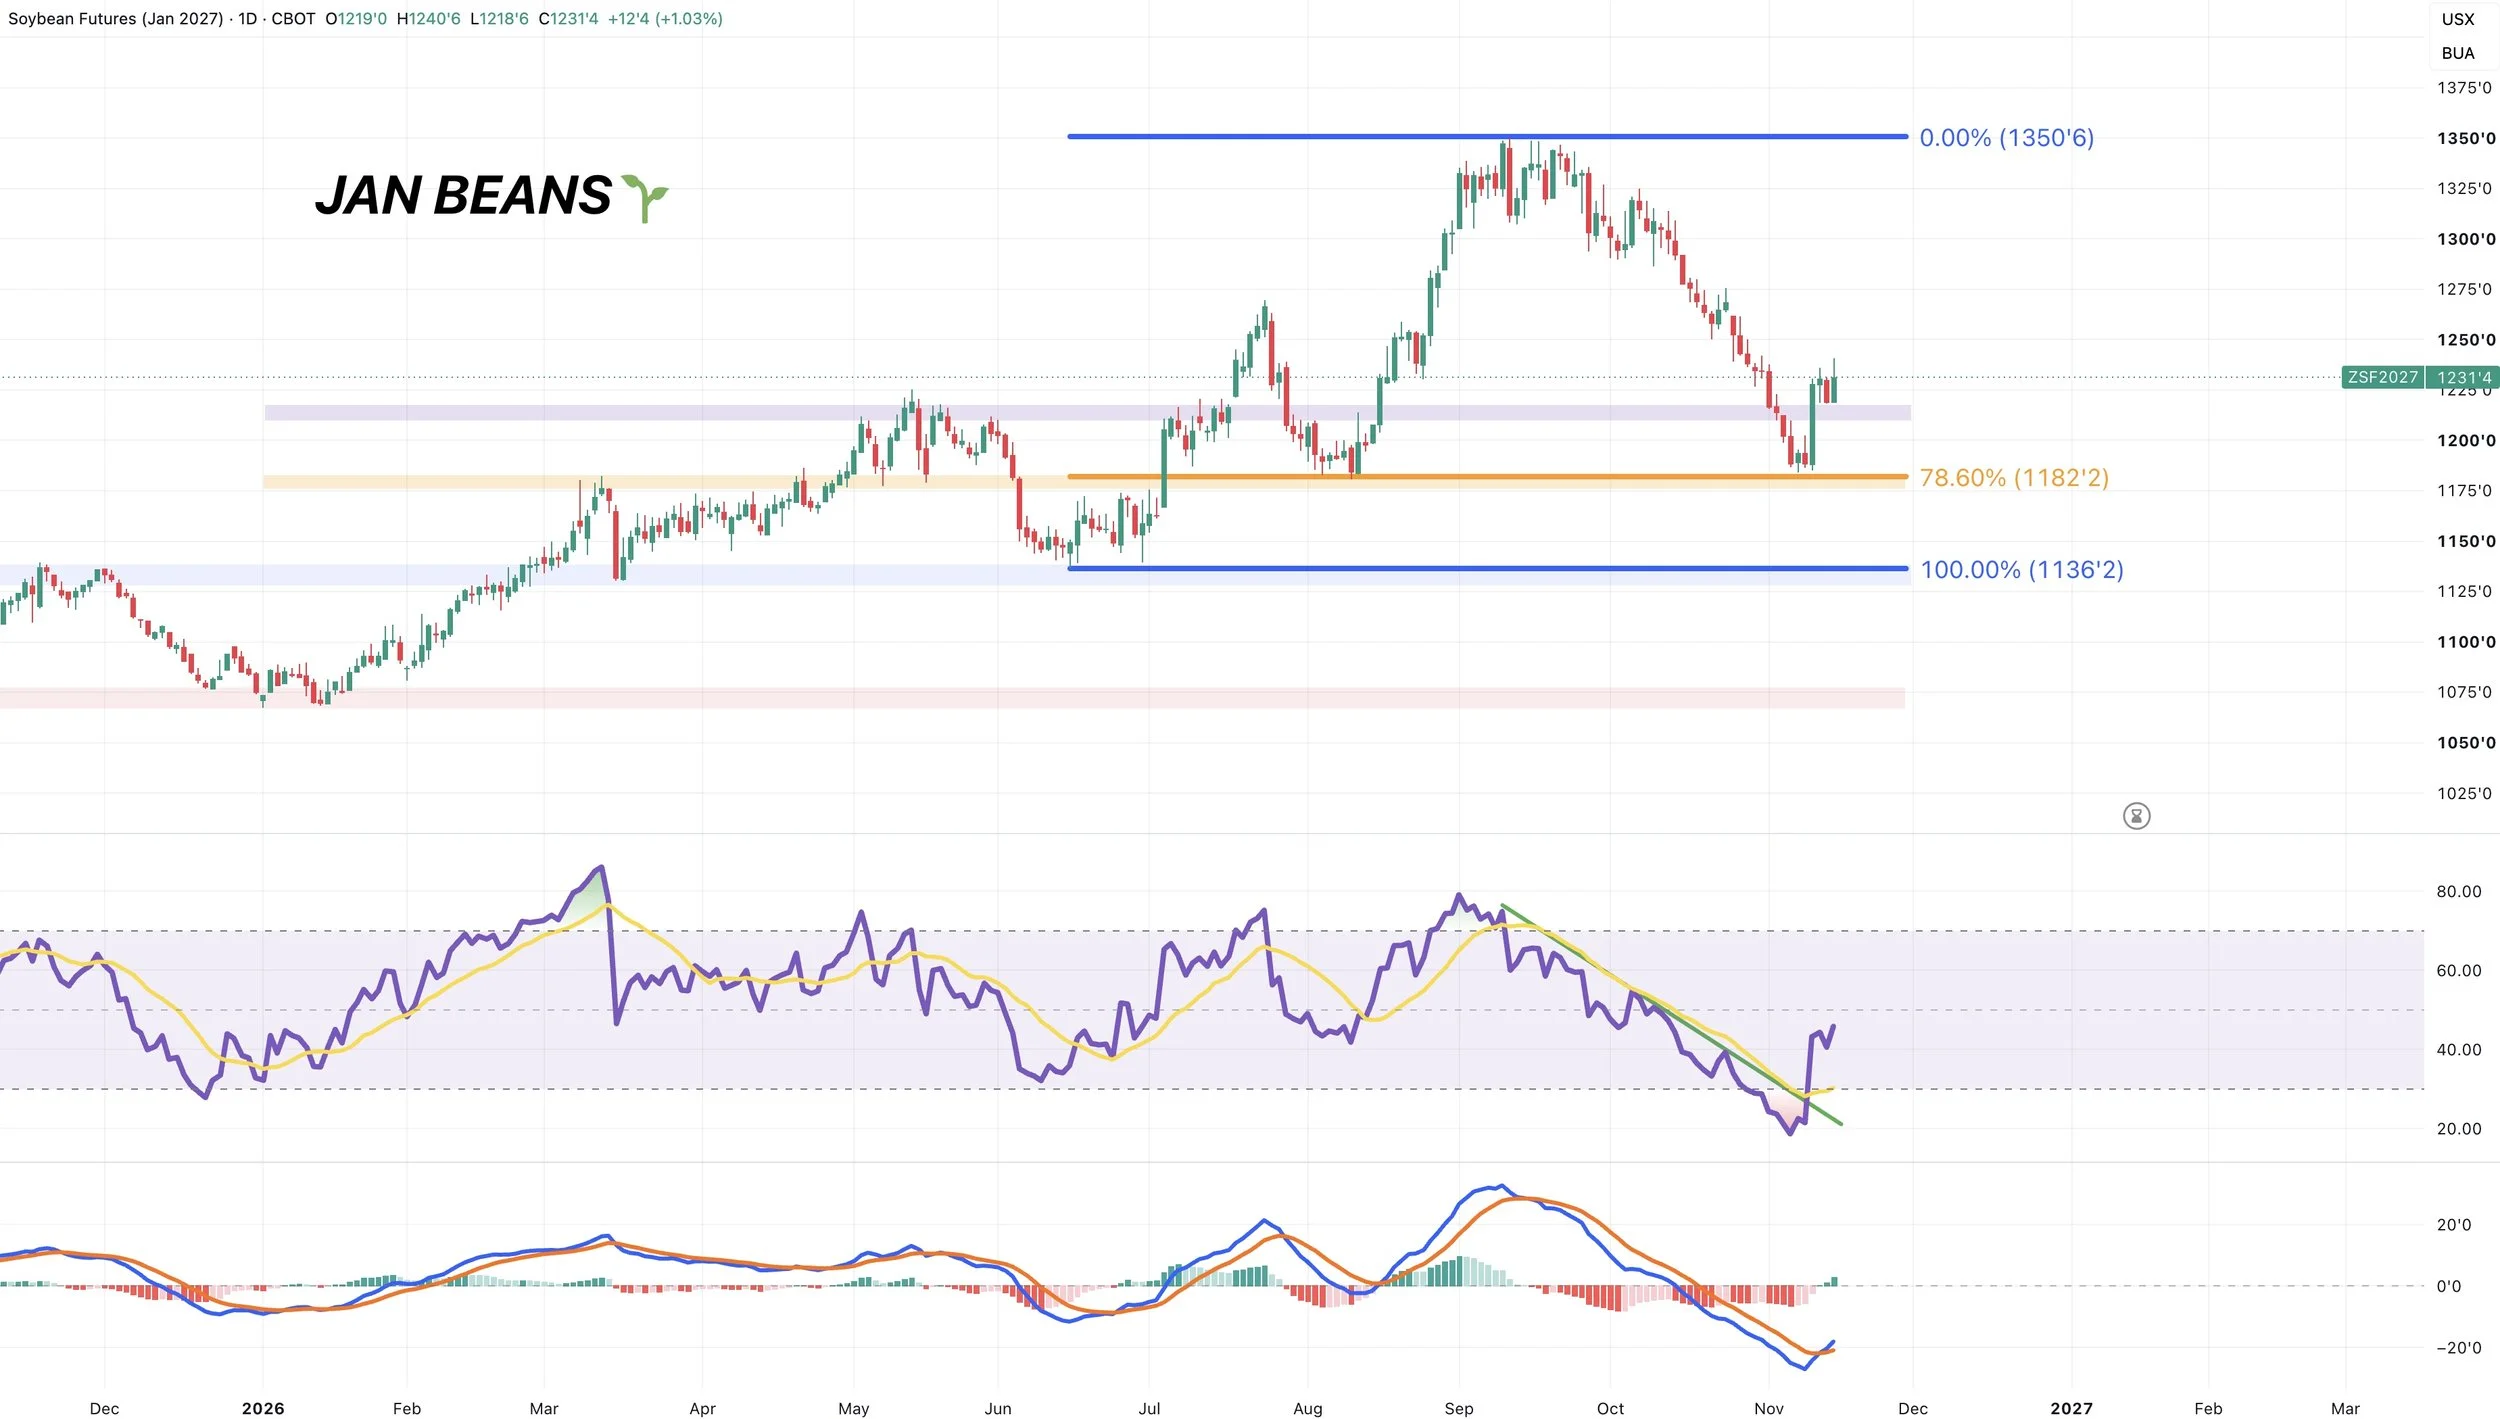
The soybean chart looks pretty solid.
We had that double bottom at the August lows. Holding right where we needed to.
We had the RSI breakout and MACD crossed bullish for the first time since the August rally. Both positive signs.
4-Hour Chart & Target:
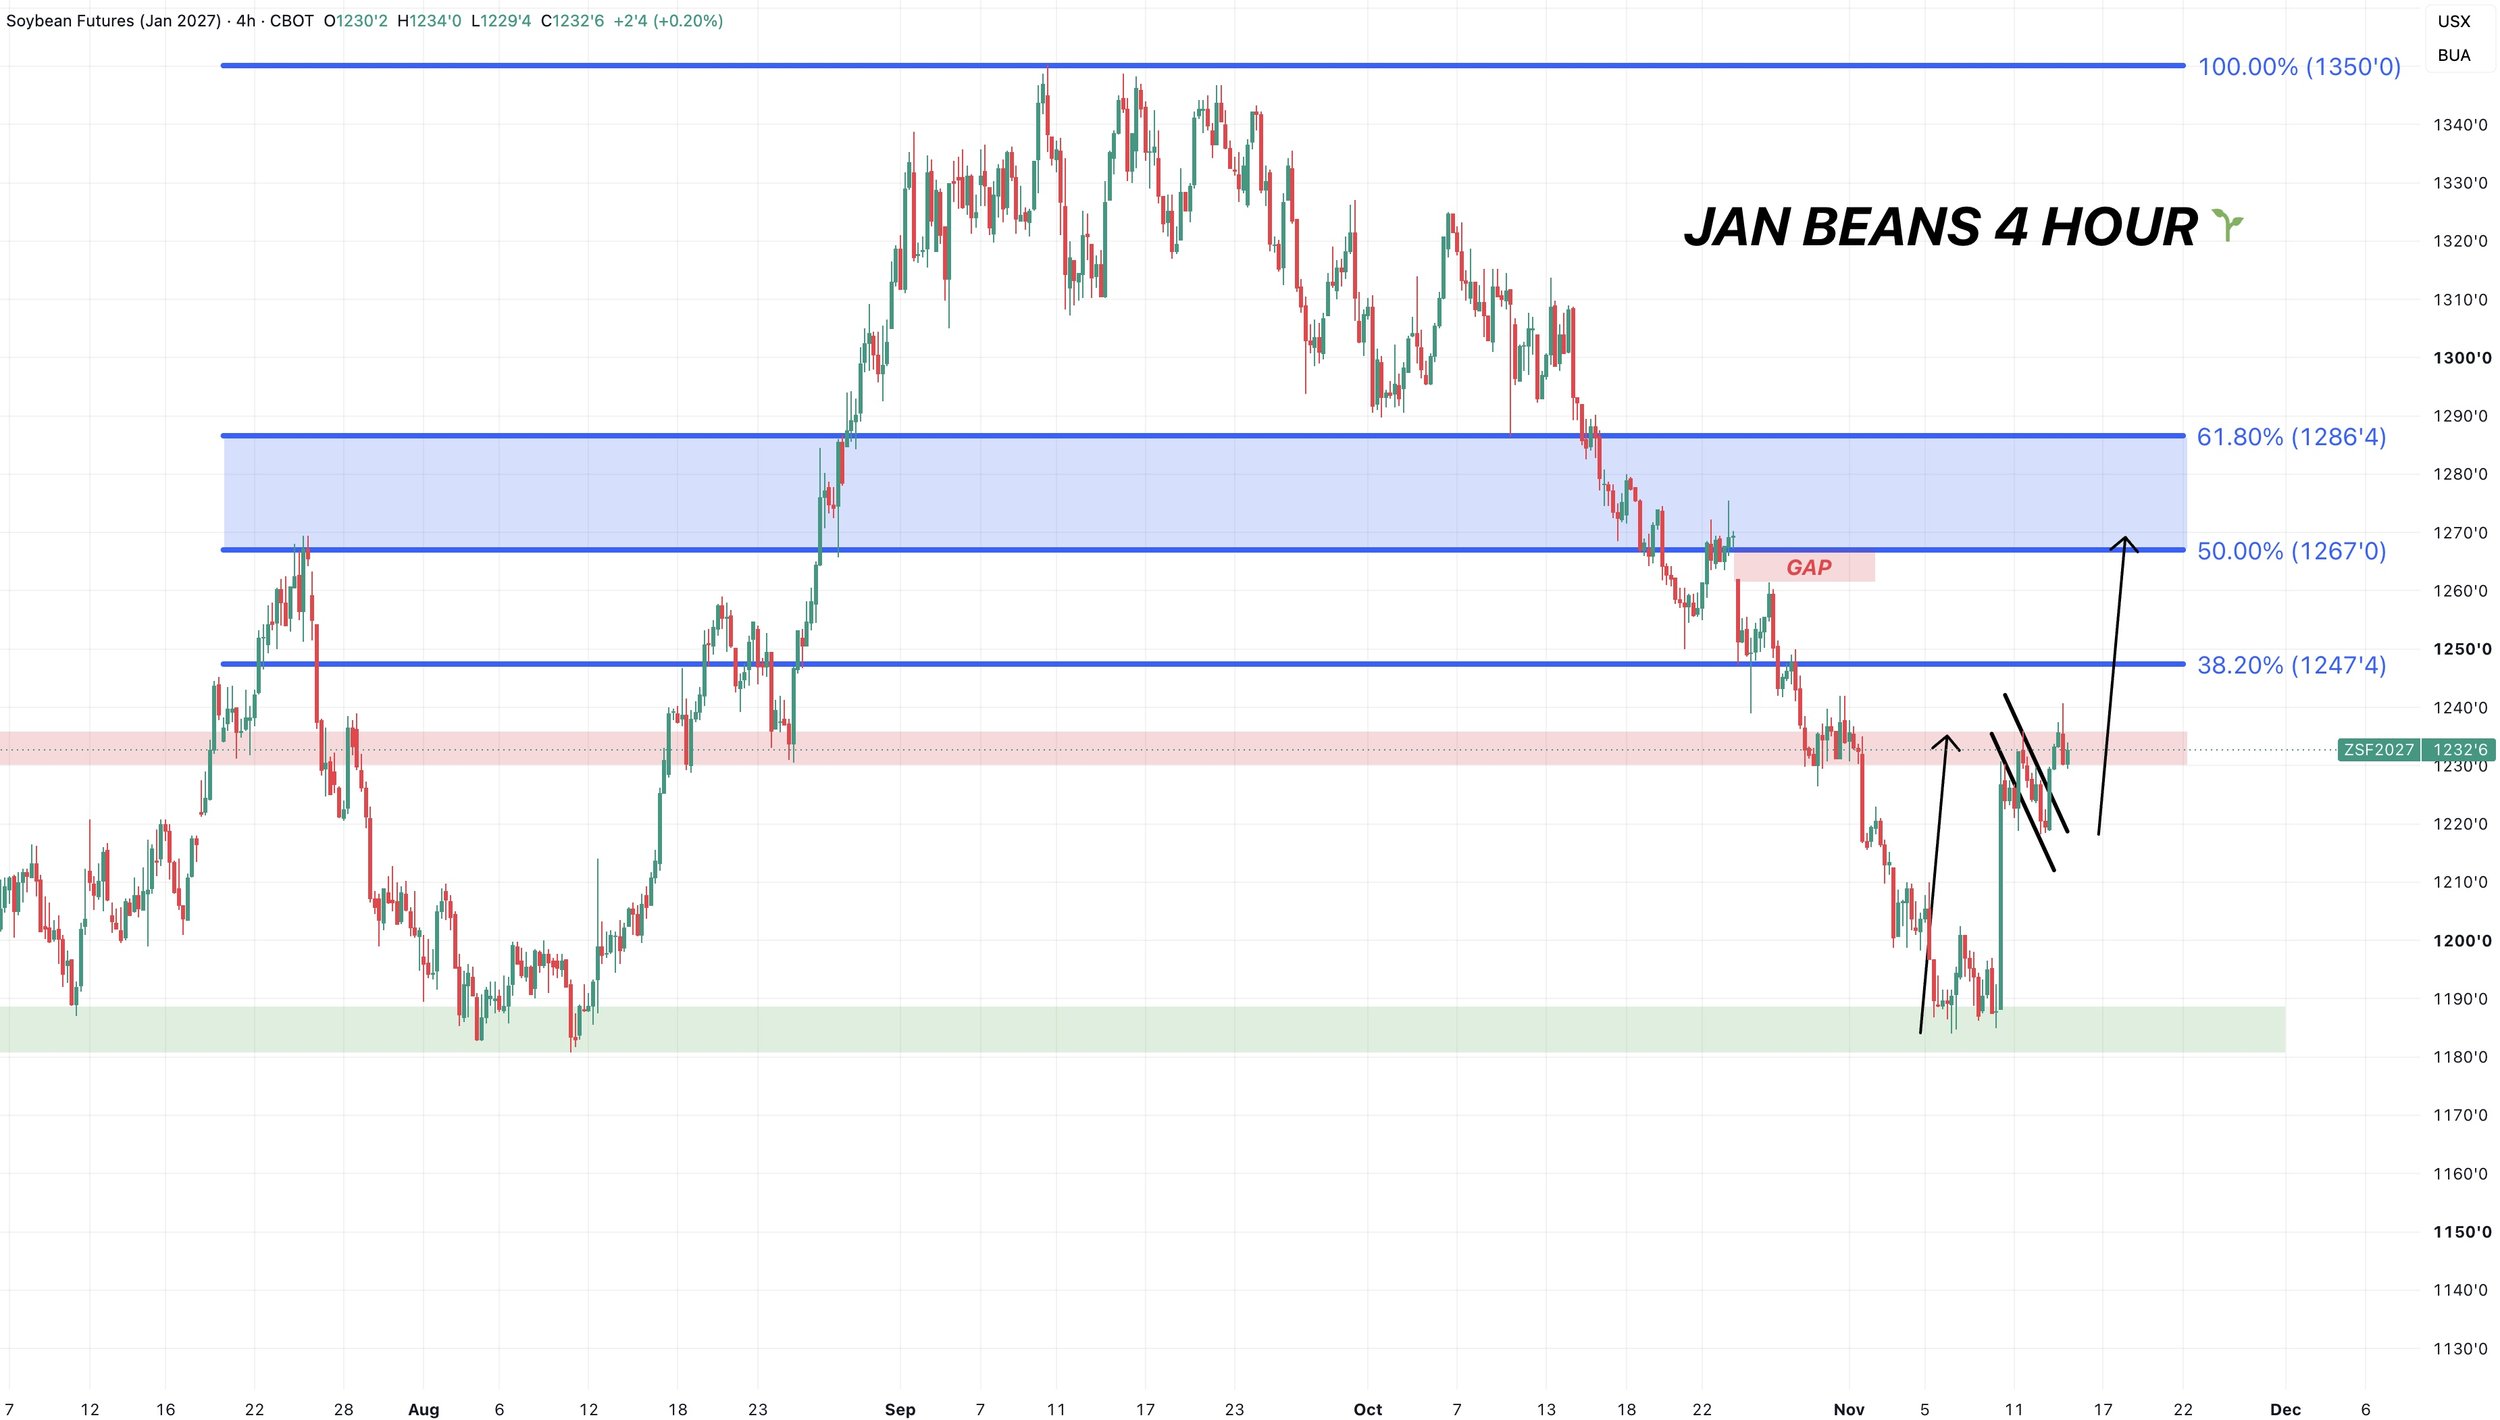
First we need to clear this resistance. Which is the August lows and recent highs.
Beyond that, the big point of interest I have my eyes on is that $12.65 range.
We had a potential mini bull flag that we broke out of. The implied move takes you up to that level.
$12.65 also claws back half of the entire sell off.
That same level is also the highs from July.
Lastly, we do have that open gap that sits right there as well.
So for now, that is going to be our shorter term upside target.
If you have to move beans by the end of the year, that would be a spot where you could consider having some target orders in place.
As that 50-61.8% level is often where the market tells us if this is just a relief bounce or the start of a bigger rally.
Big Picture:
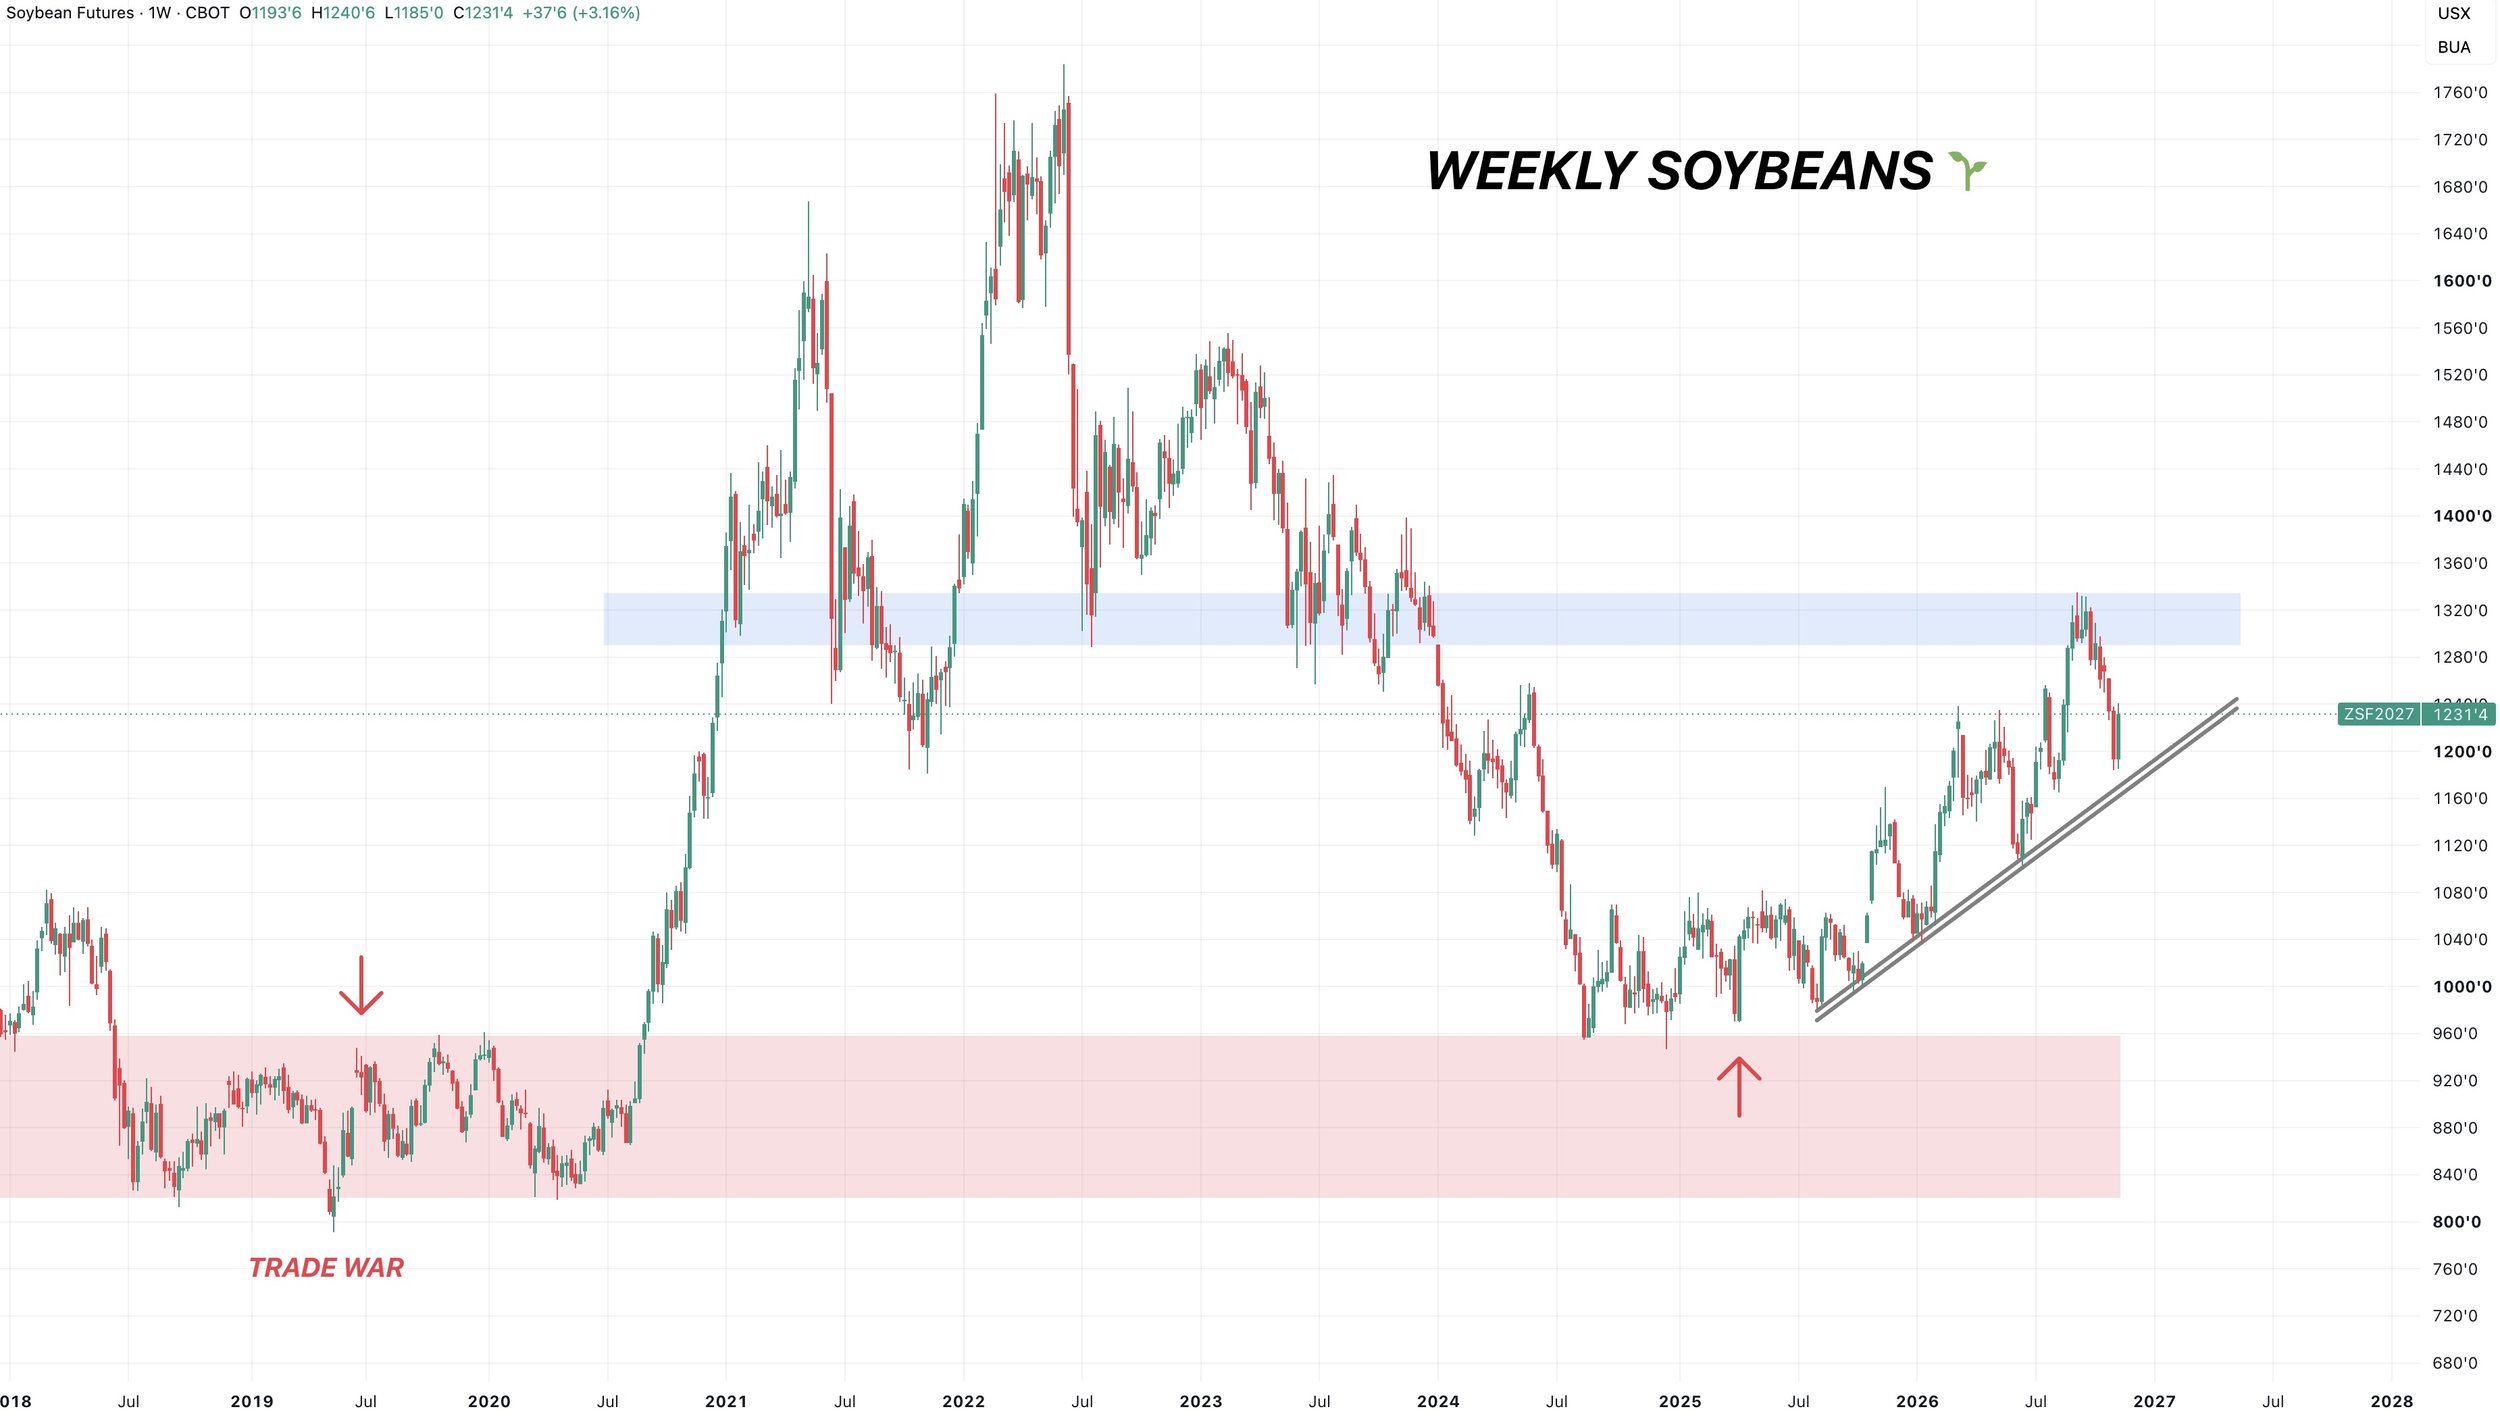
Long term I think soybeans have a lot of possible upside.
Out of all of the grains, they are by far structurally the most bullish.
Soybeans have the best odds of going to post new highs, which I think has a good probability of happening at some point next year.
The weekly chart on soybeans is not bearish at all.
Take out those recent highs and the upside is there.
Long term, just based on looking at this chart and nothing else, $14 to even $15 soybeans does not look like it's out of the realm of being a possibility.
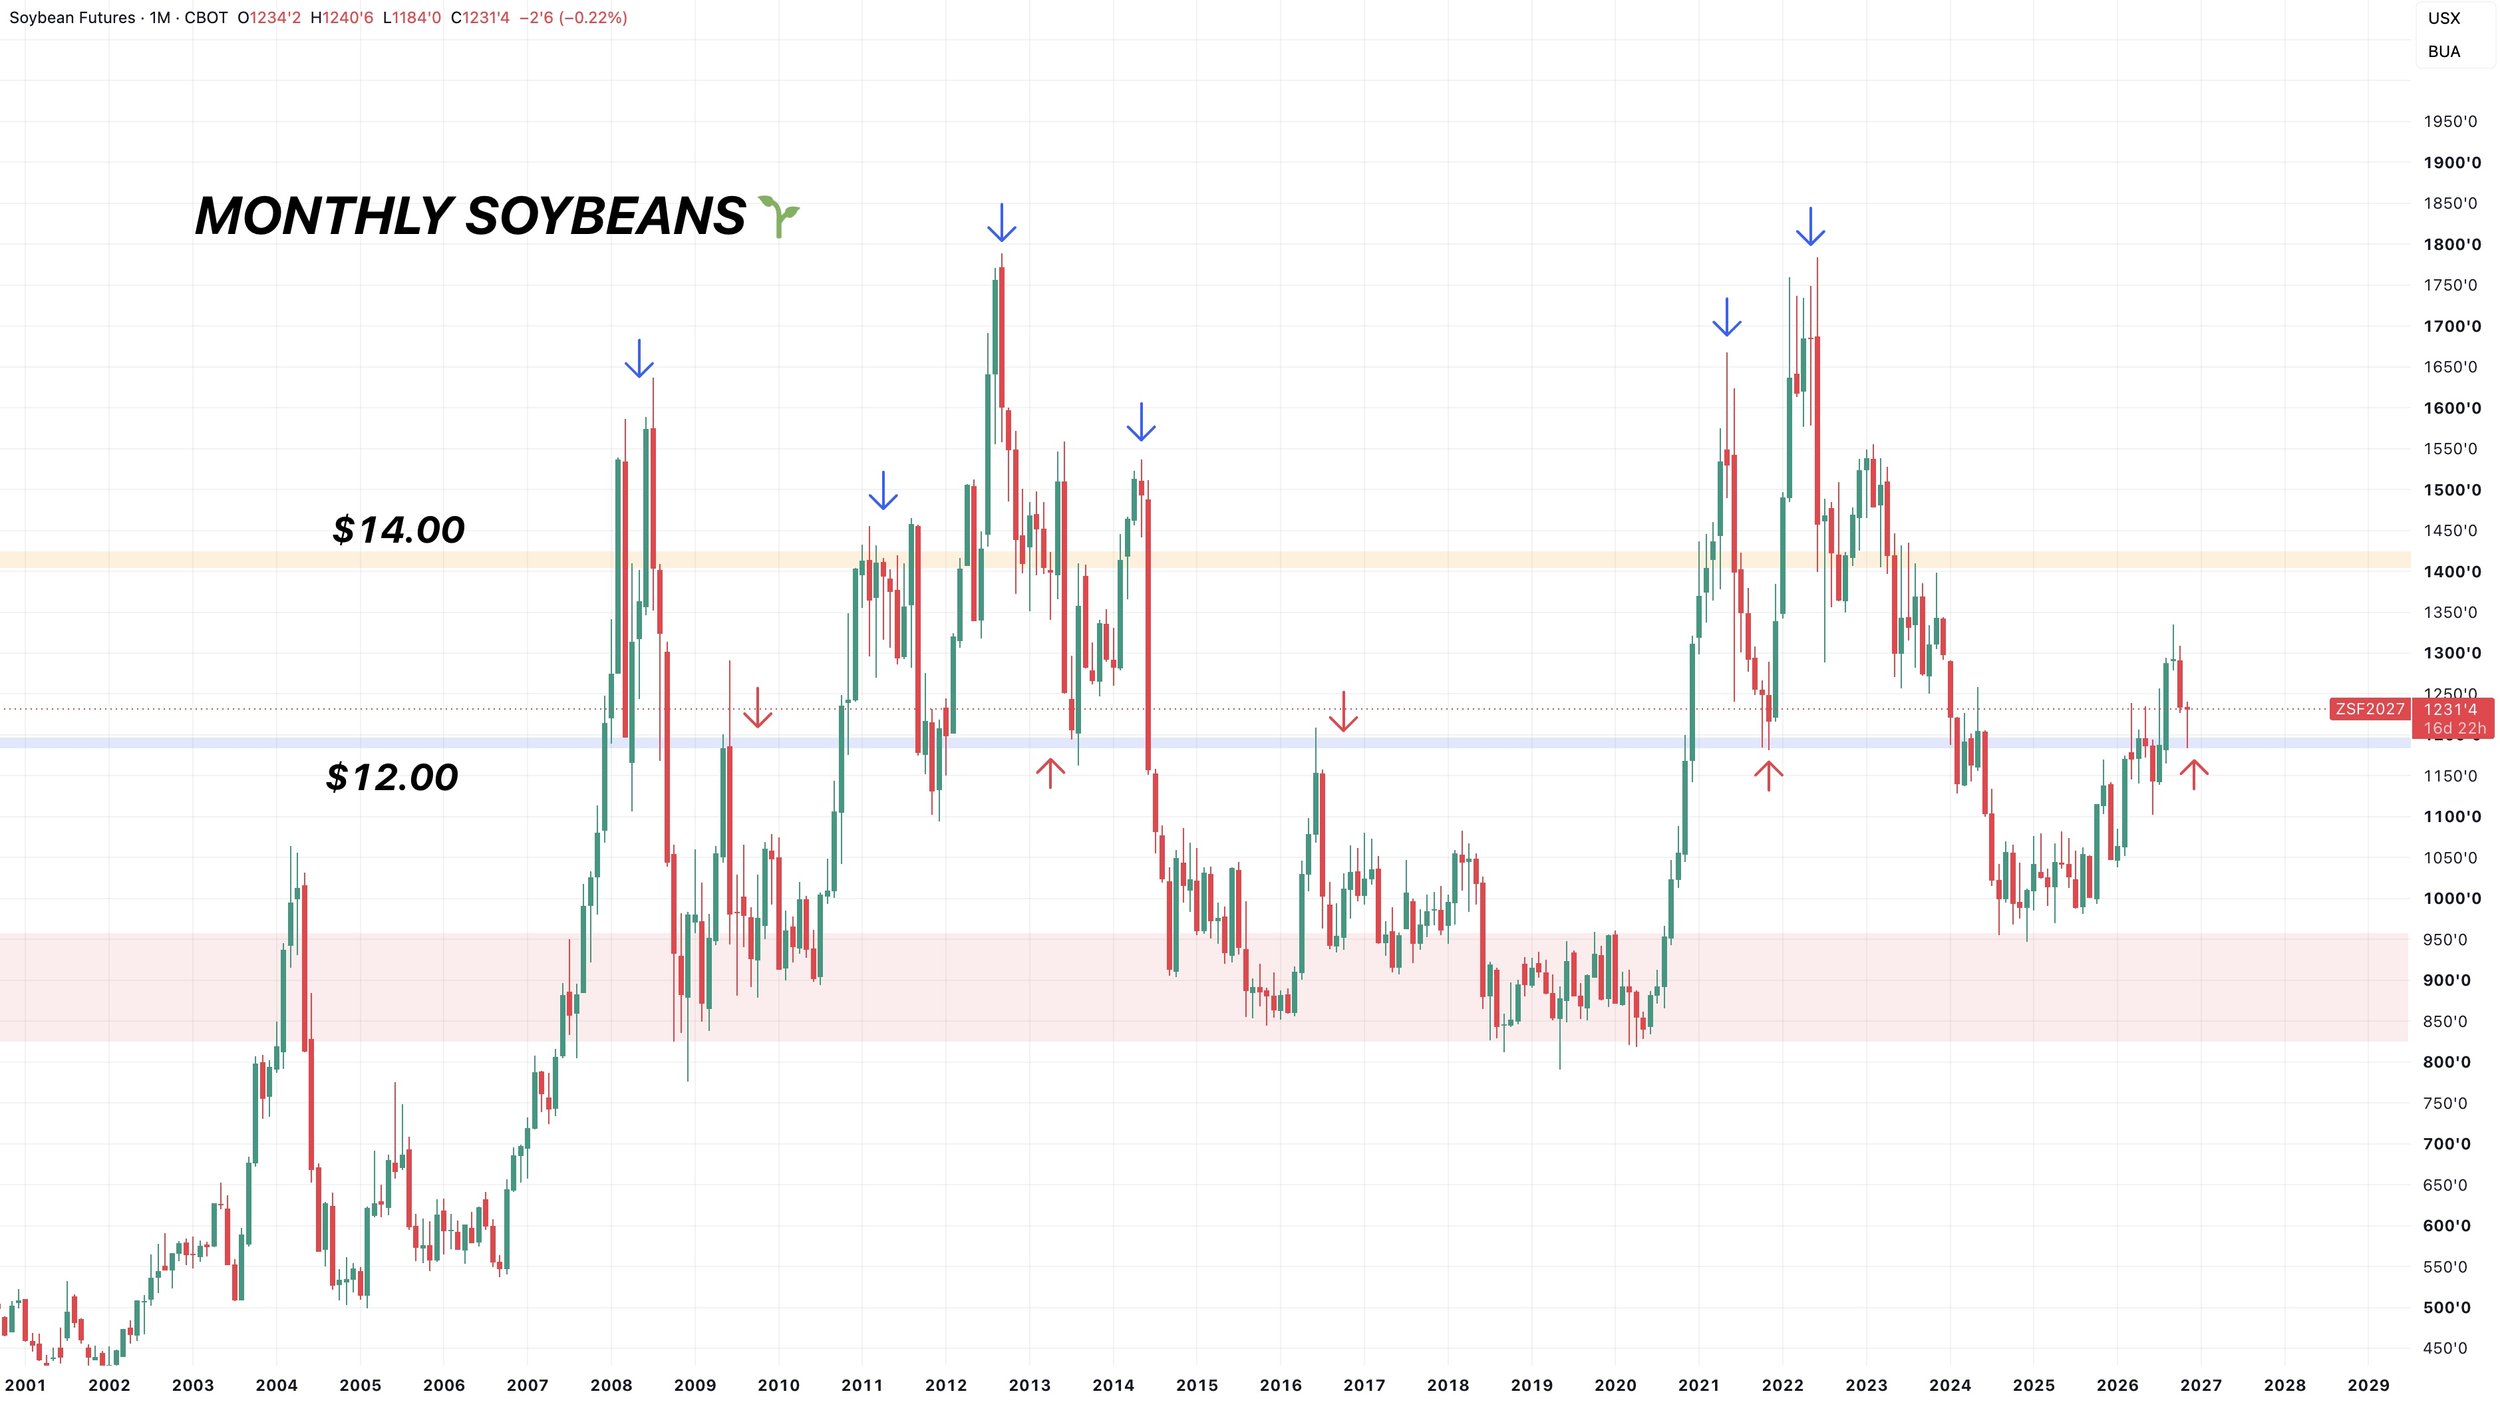
Monthly Chart:
If soybeans are in a bullish market.
This $12.00 area has tended to act as a floor for soybeans.
This week we bounced right off that level.
I did want to note that every time soybeans have broken above $12, they have eventually went to at least $14.
If soybeans failed in the $13.00's here, it would be the first time we've failed in the $13.00's.
Wheat
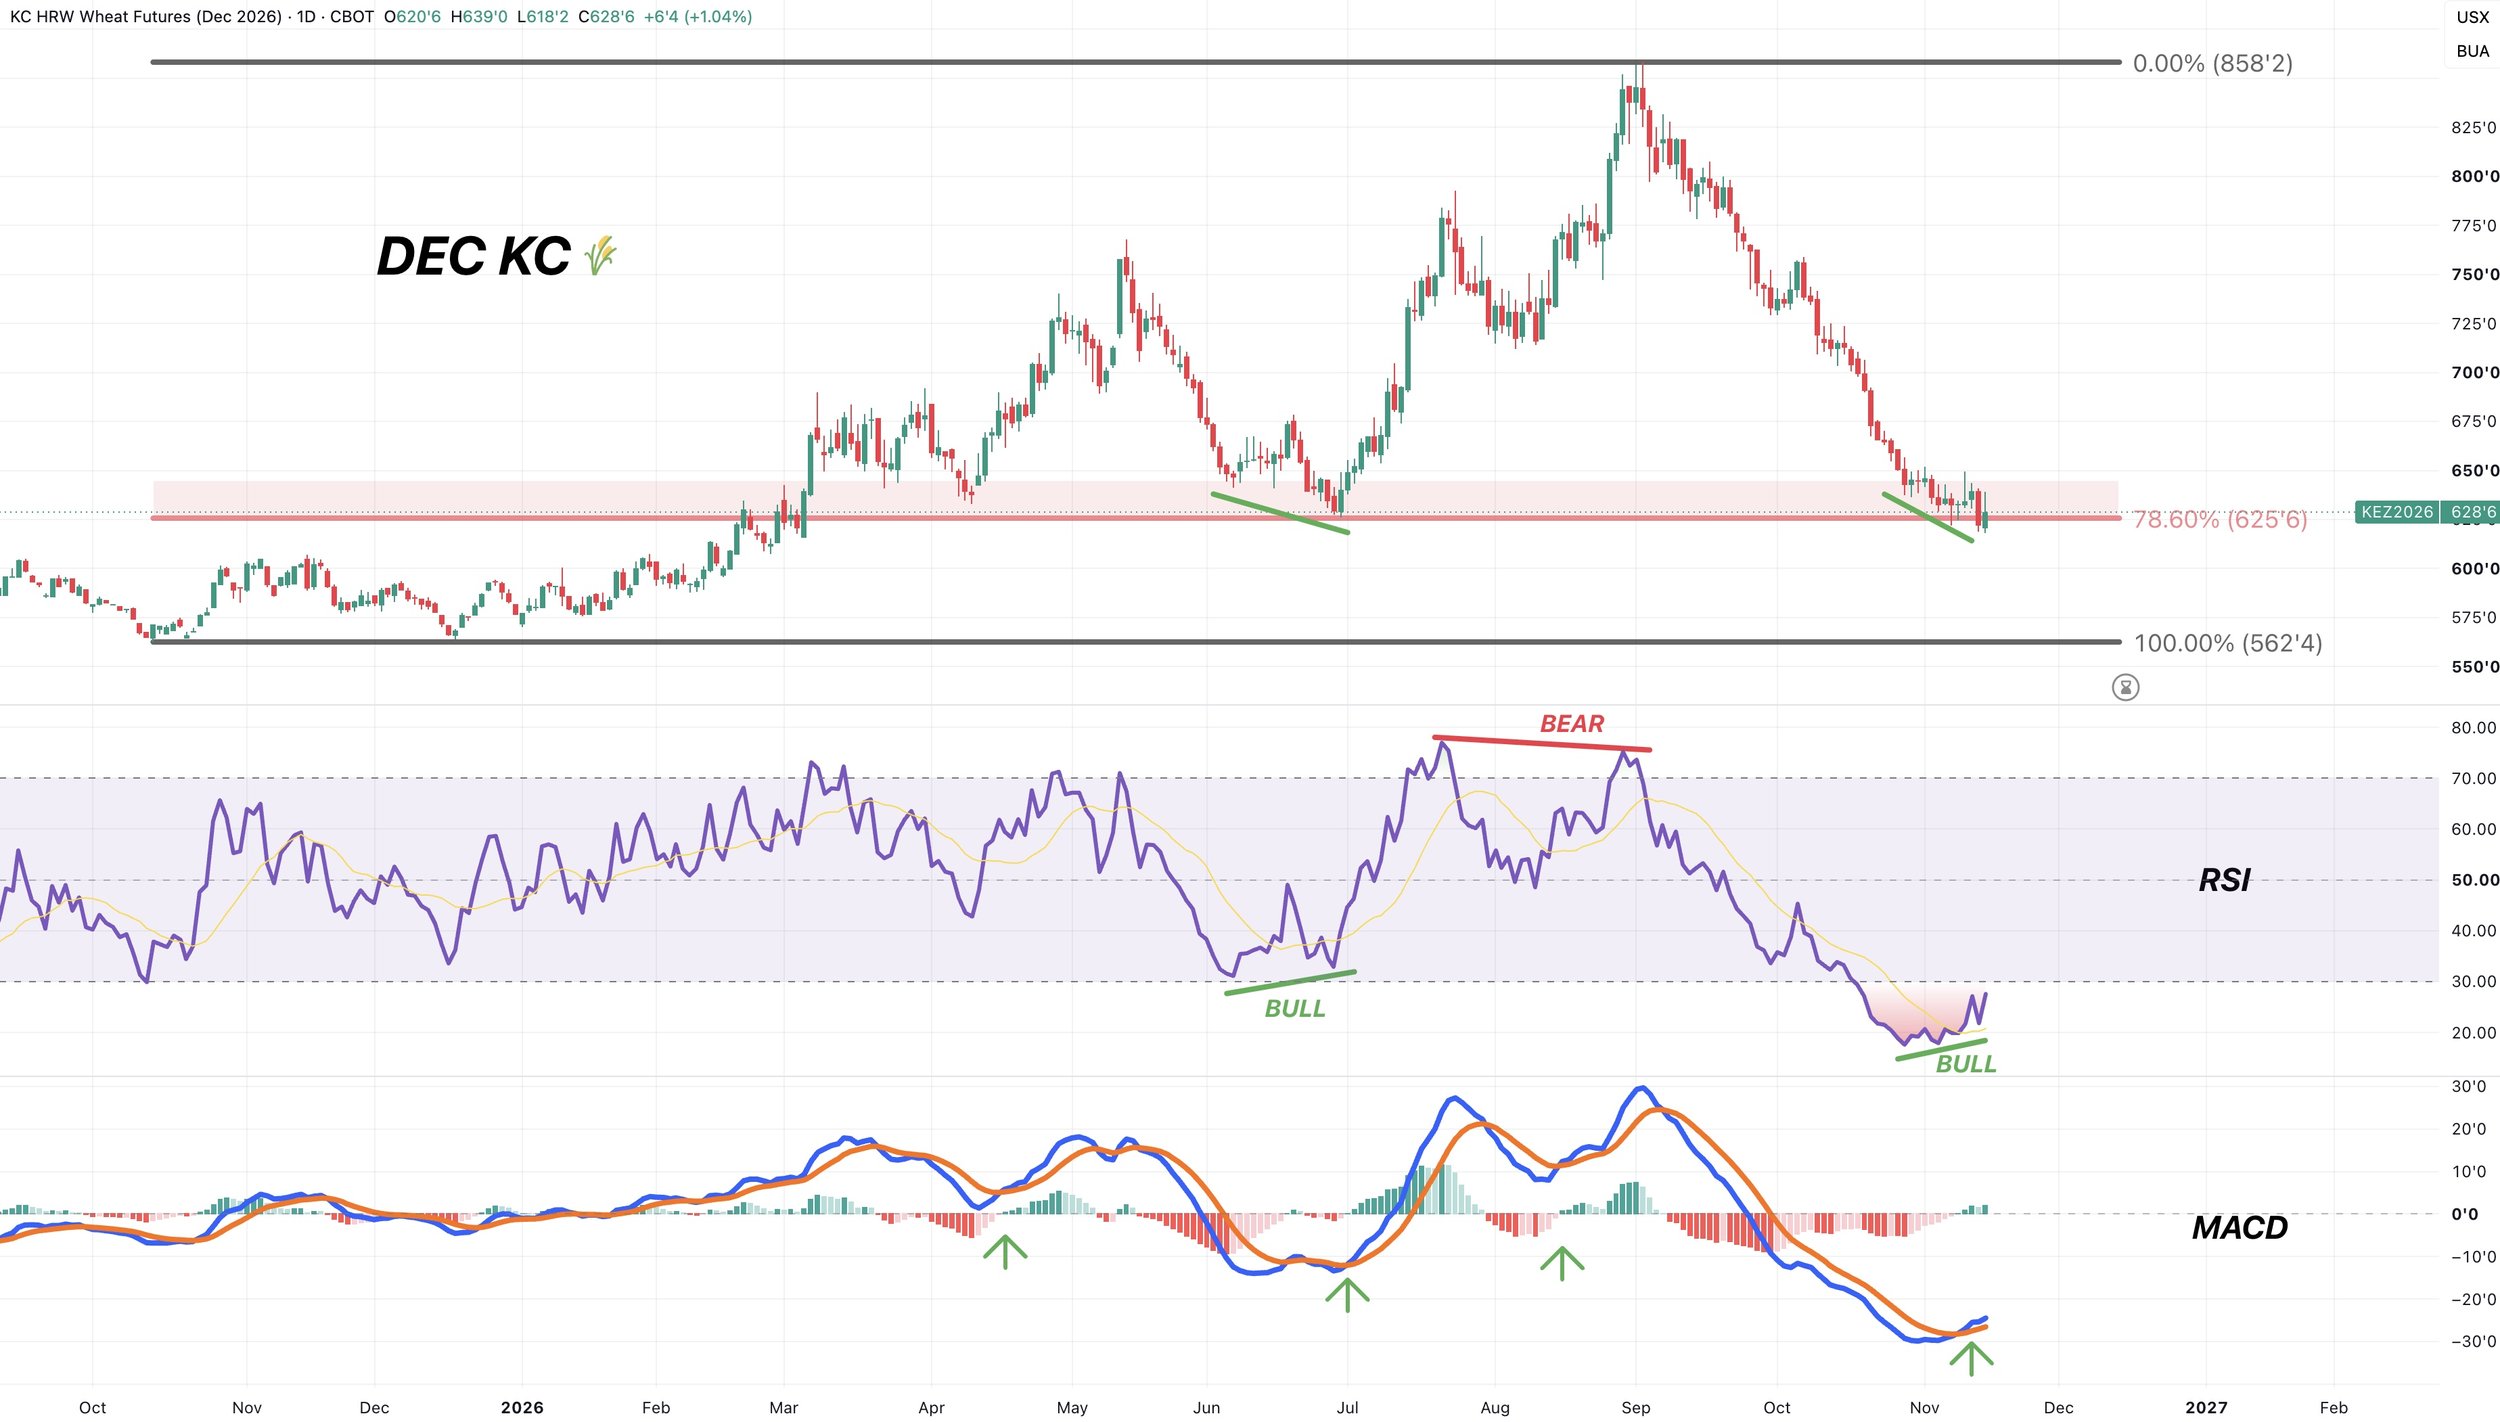
Dec KC Chart:
Nothing fresh on wheat today.
The only real news we saw was that China was buying non-US wheat the other day, as they bought a bunch of wheat from France. So the market took that as a negative headline given US demand has been very lackluster.
But the wheat charts are starting to show some possible signs of life.
KC broke below those summer lows fractionally, but closed back above them today.
We still have bullish divergence on the RSI. Which looks pretty similar to what happened on those June lows.
We also had the MACD cross bullish for the first time since the August rally.
Both would be potential signs of a bottom.
4-Hour Chart:
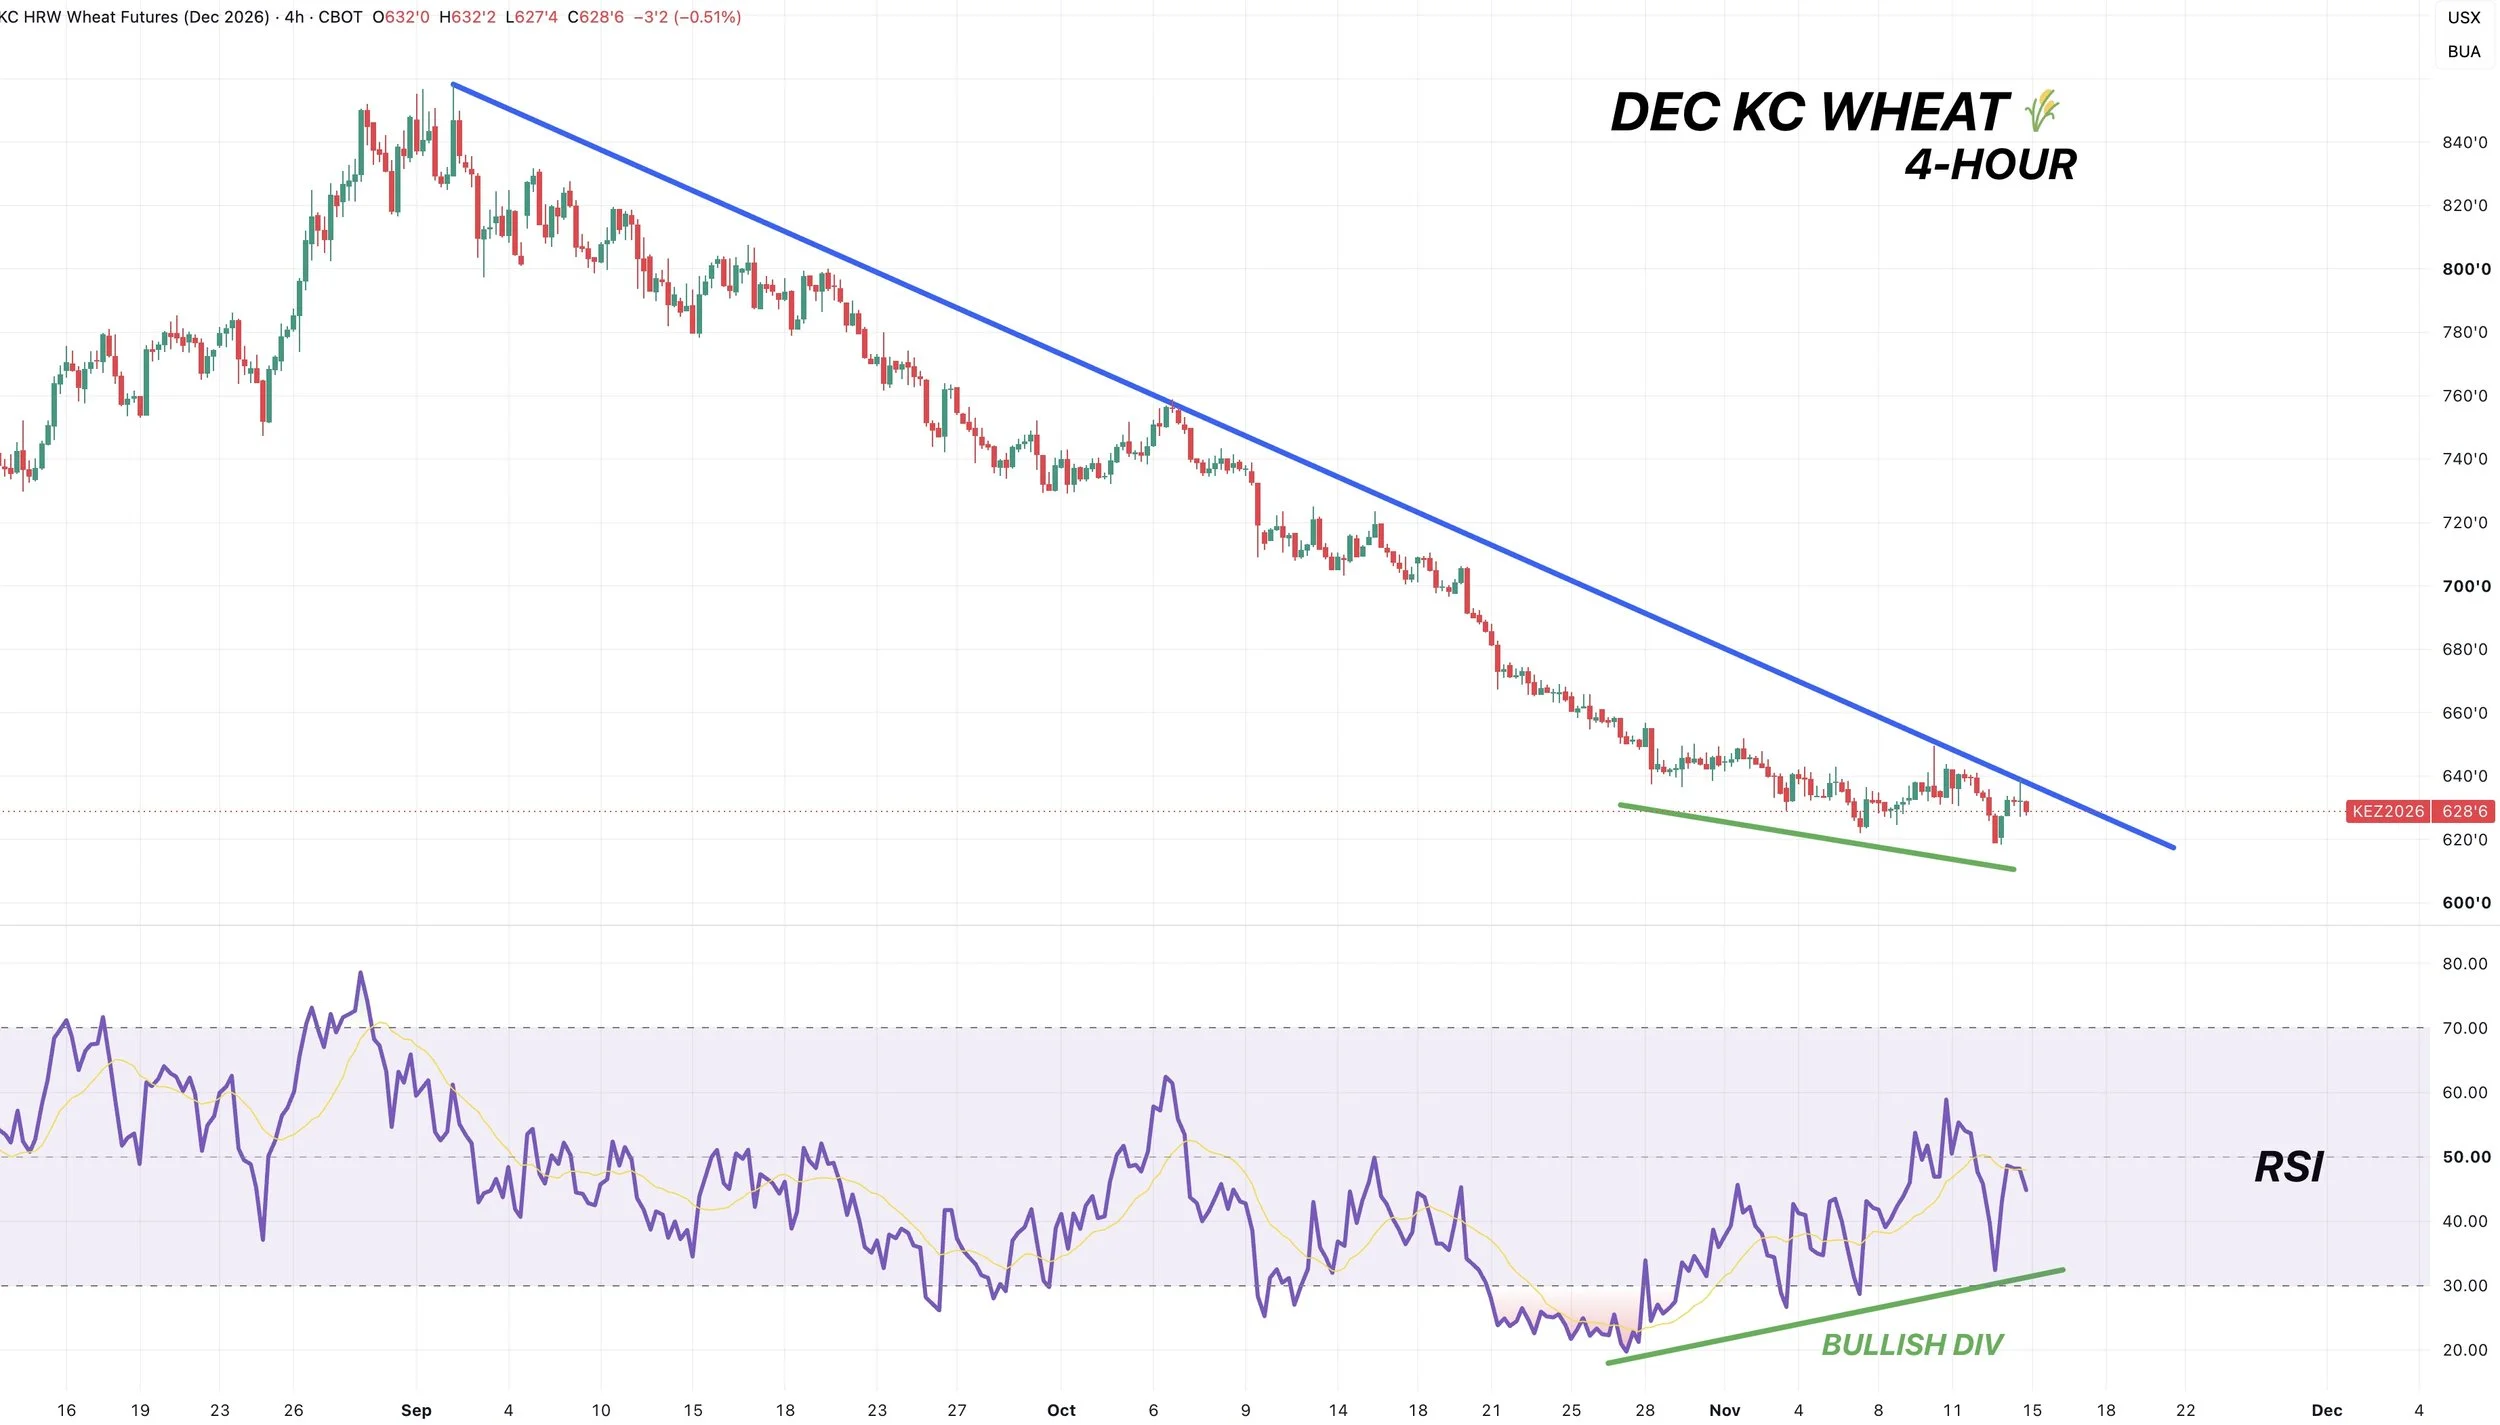
If we zoom in here.
You can clearly see the bullish divergence.
Prices keep making new lows. But the RSI has stopped following prices lower the last 2 weeks.
Instead the RSI has been putting in a series of higher highs.
This suggests sellers might be running out of steam soon.
But the other big thing to watch here is this simple downtrend resistance.
We have respected and rejected off this simple line countless times on the entire sell off. We even rejected there once again today.
So if you are able to break above that, that would be a good first indication that perhaps the bottom is finally in.
We can’t really talk about targets until we have confirmation of some lows first.
Cattle
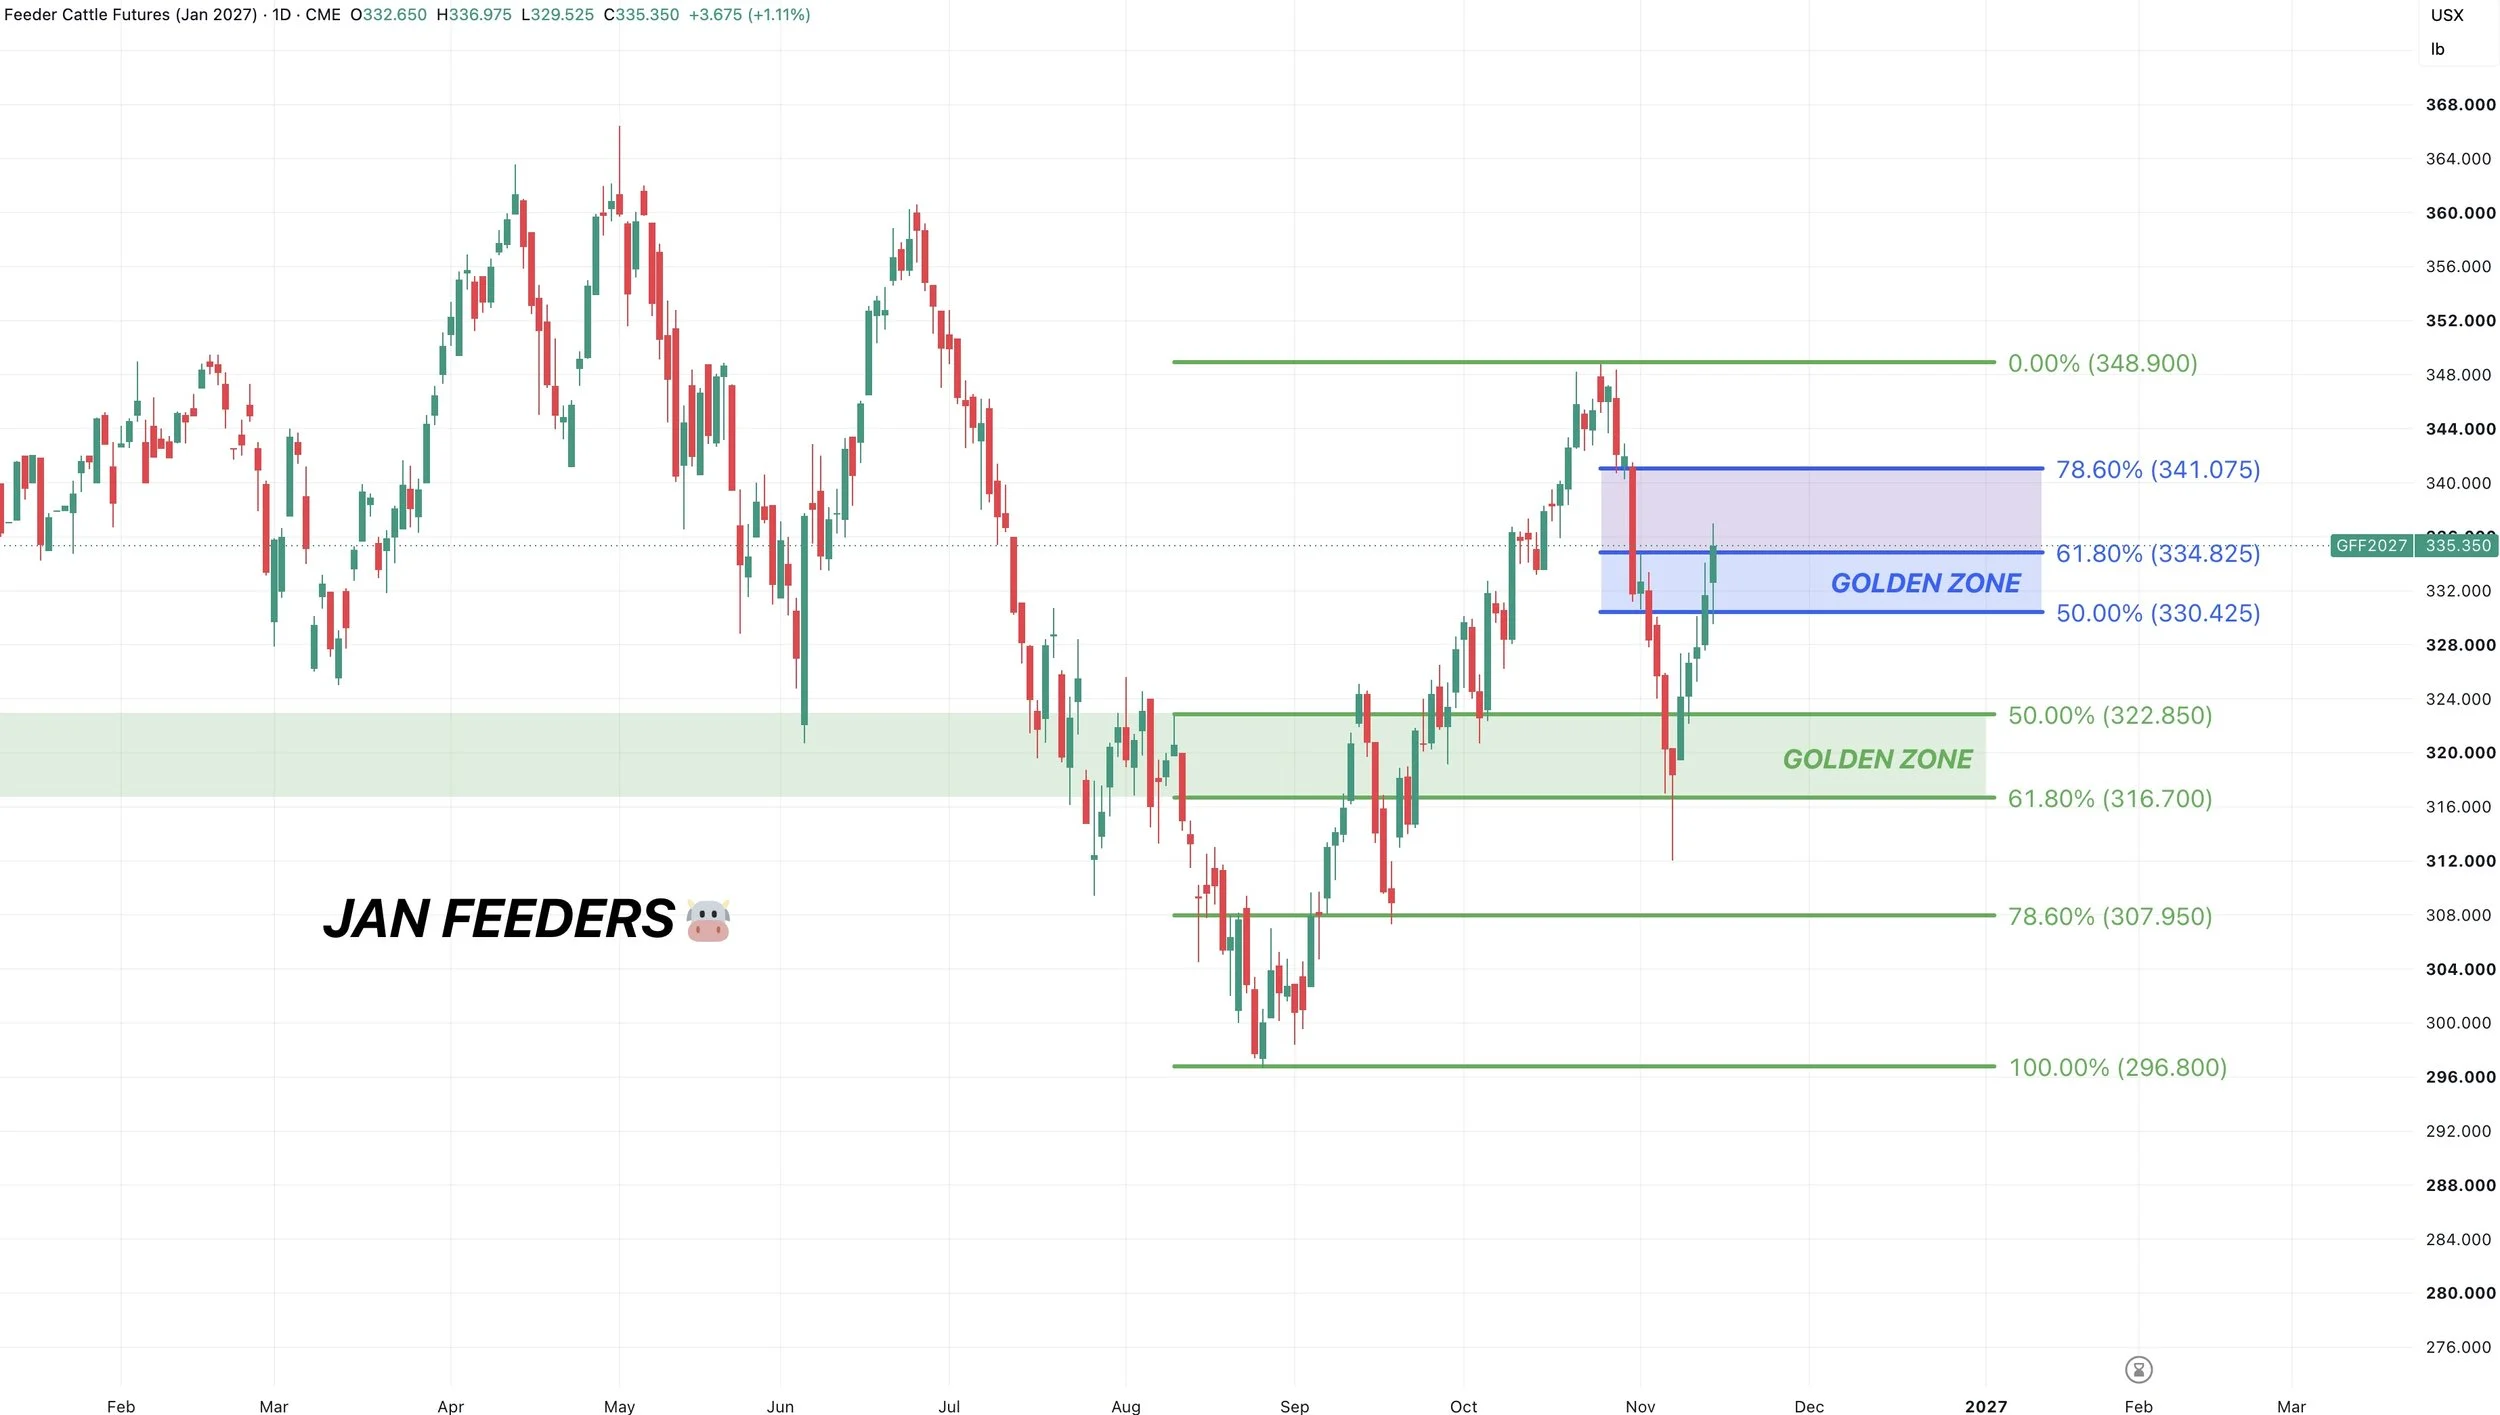
Jan Feeders:
Yesterday we did send out a cattle hedge alert, for those that did not take some chips off the table on our October alert near the highs.
To the downside, feeders had a perfect bounce out of that golden zone. So we held the structure on the chart.
Now to the upside, we are right at some big levels.
This golden zone to the upside (50-61.8% retracements) is often where the market tells us if this is simply a dead cat bounce or something more.
If this is a dead cat bounce, this would be a common area to fail. So we want to treat it as one until proven wrong. Just makes sense to manage your risk following the impressive bounce if you have not yet done anything in cattle.
Feeders closed right above that 61.8% level today. But if we look at live cattle, they have lagged behind and are not as far into their retracement zones.
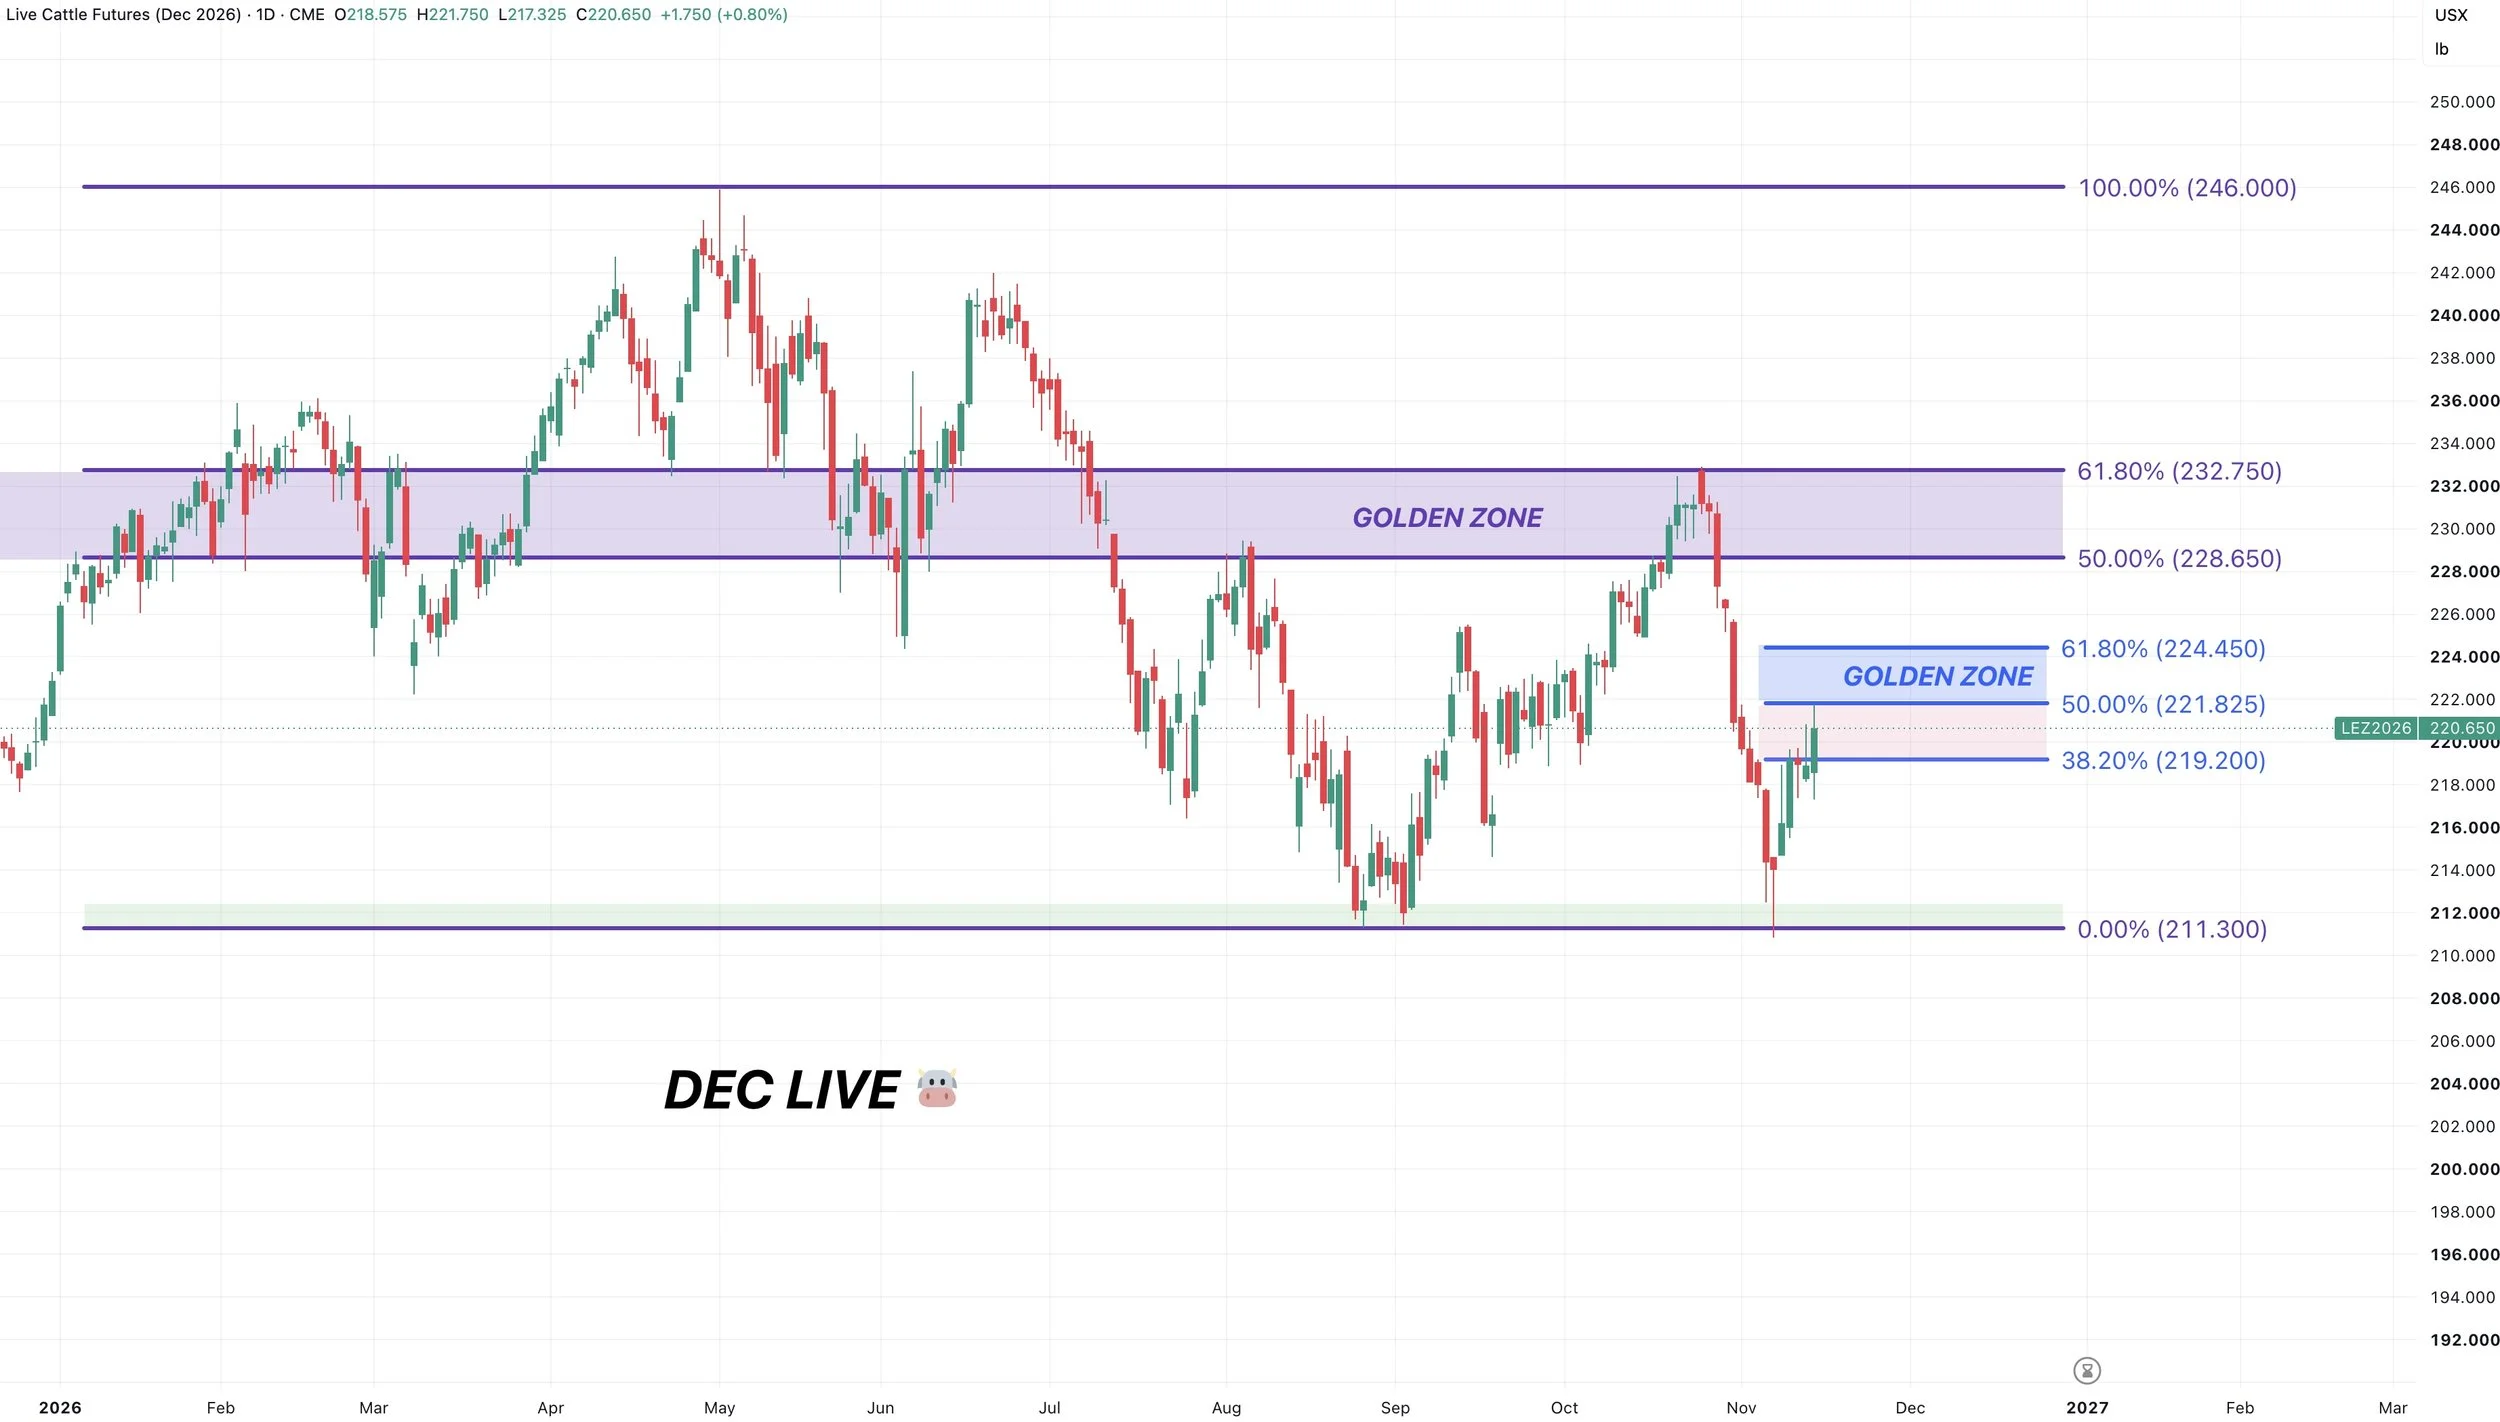
Dec Live Chart:
In live cattle, we sit a set of retracements lower than we do in feeders.
Feeders hit the 61.8% level. Live cattle hit the 50% level.
Which is exactly what we saw happen on the last rally. Live cattle lagged behind while feeders went slightly past what a normal relief typically looks like. As live cattle continues to lag.
Live cattle tagged the 50% retracement of the sell off today.
Again, if this is just a relief bounce, then between here and the 61.8% level would be where we would expect us to struggle.
Until both live cattle and feeders break above the 61.8%, I am looking at this as a relief bounce.
If both happen to break above, then perhaps this is actually the start of something more. But until then, we like managing some additional risk, especially if you missed the October highs.
It's not about outguessing the market and hitting every single top, it's about managing risk where it makes sense to do so.
Currently, I still view the cattle market to be in a broader downward trend until we are proven wrong.
Want to Talk?
Our phones are open 24/7 for you guys if you ever need anything or want to discuss your operation.
Jeremey & Office: (806)484-1214
Sebastian: (605)280-1186
Email: sfrost@dailymarketminute.com
Hedge Account
Interested in a hedge account? Use the link below to set up an account or give us a call.