
TRUMP PLAYING CATTLE MARKET
AUDIO COMMENTARY
Trump and cattle news
Trump says he is the reason cattle guys have it good because of the tariffs he put on
Trump said he is going to have more cattle imports coming in from South America
Need to be having protection in this cattle market
Feels like wheat is cheap vs everything else
Ethanol stocks lowest in a year
Basis continues to firm in some areas. It feels like there is more demand than supply right now in corn
DTN suggests possible 167-177 corn yield
Despite the lack of Chinese demand, we could be fulfilling that demand from other places
If we get a trade deal and below avg yields there is a potential path for higher prices
Re-ownership is still cheap
Might be past harvest selling pressure
Approaching must hold spot in cattle (charts below)*
Corn at big spot we need to break (chart below)*
Beans also at big spot to know what direction we are going to head from here (chart below)*
Chart breakdowns below audio*
Listen to today’s audio below
Want to talk? (605)295-3100
CHART BREAKDOWNS
Dec Corn 🌽
We are at a major spot.
We’ve clawed back 61.8% of the Sep highs.
Now rejecting here 5 days in a row.
This level if where the market tells us if this is simply a releif bounce before heading lower or if this is the start of a larger rally.
As 61.8% is the most common place for a relief bounce to fail.
More often than not, if we break above this level it indicates more upside is ahead.
This level is also trendline resistance from May and Sep.
$4.35 is still our first target.

Nov Beans 🌱
We have a same set up in beans like corn.
Beans are also at a major decision point.
Right up against that 61.8% retracement up to the August highs.
Also right up against trendline resistance.
If we break above it usually tells us that this market is ready to head higher. Because if we break above, this is usually seen as more than a corrective bounce.
I have a target of $10.52 right now, but it is subject to change.
$10.52 is the golden fib from that mini rally we saw in Oct
(Scroll to check out the next chart if you want to see exactly how this target was calculated).
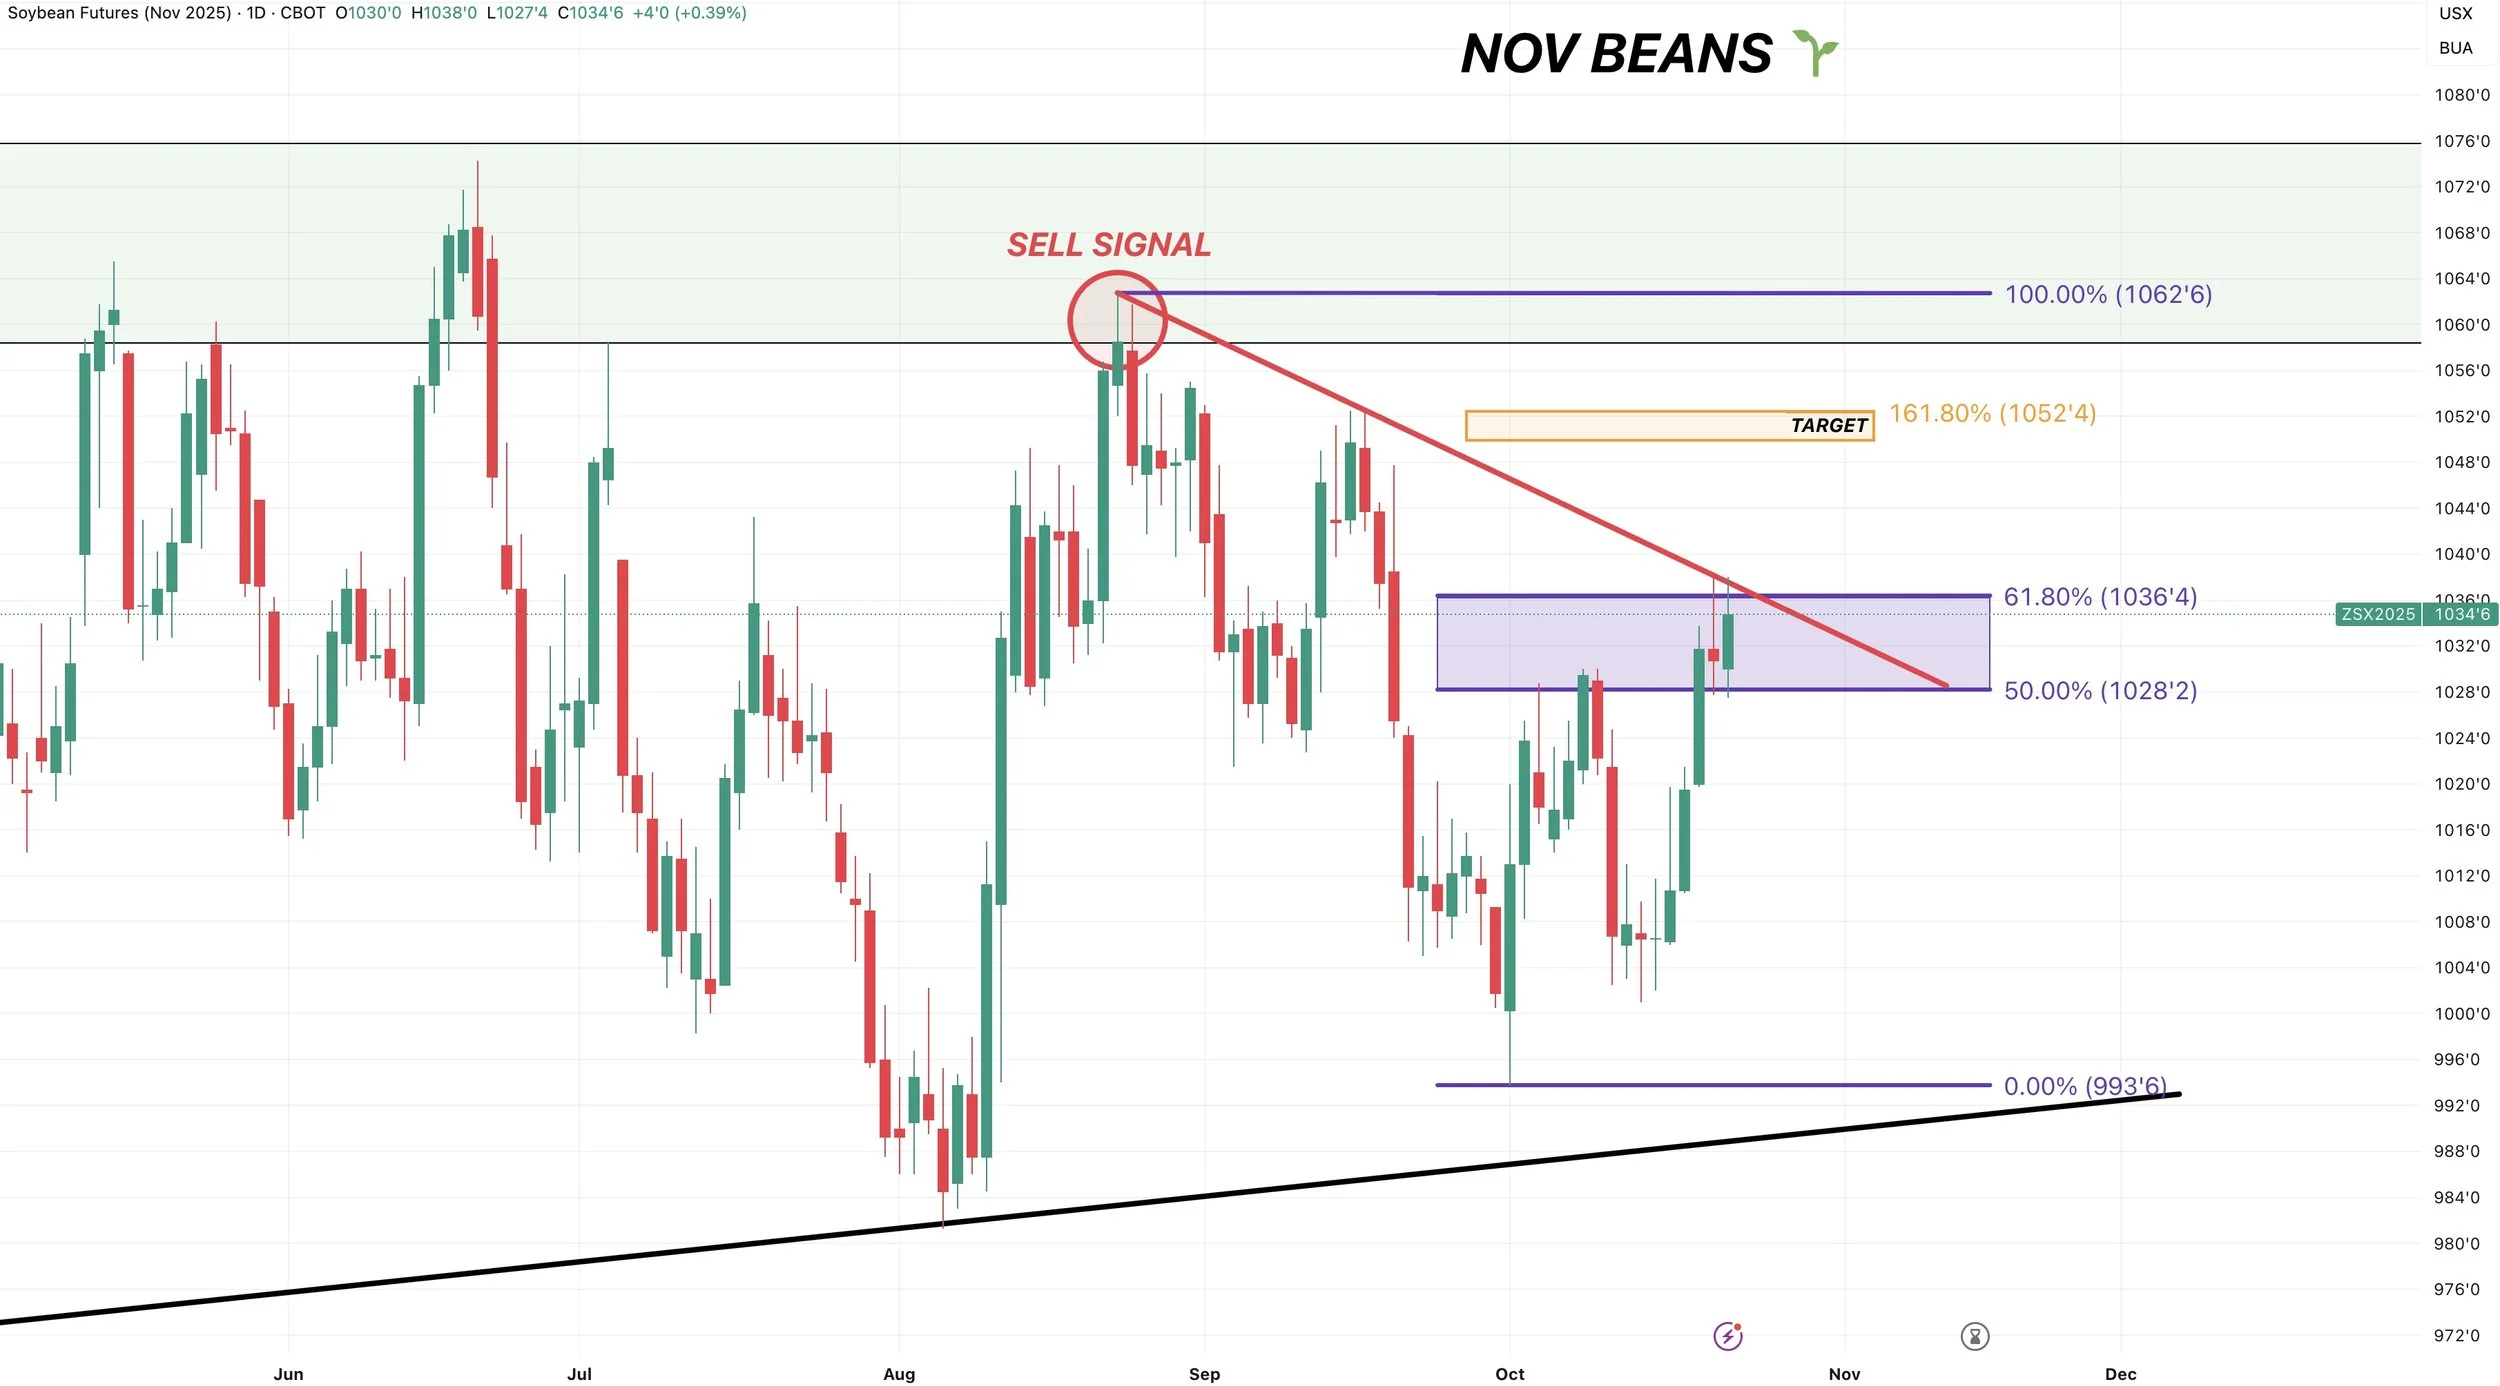
This is how that $10.52 target was calculated.
161.8% of that first rally we saw is $10.52
Which is a common spot for a 2nd rally to pause.

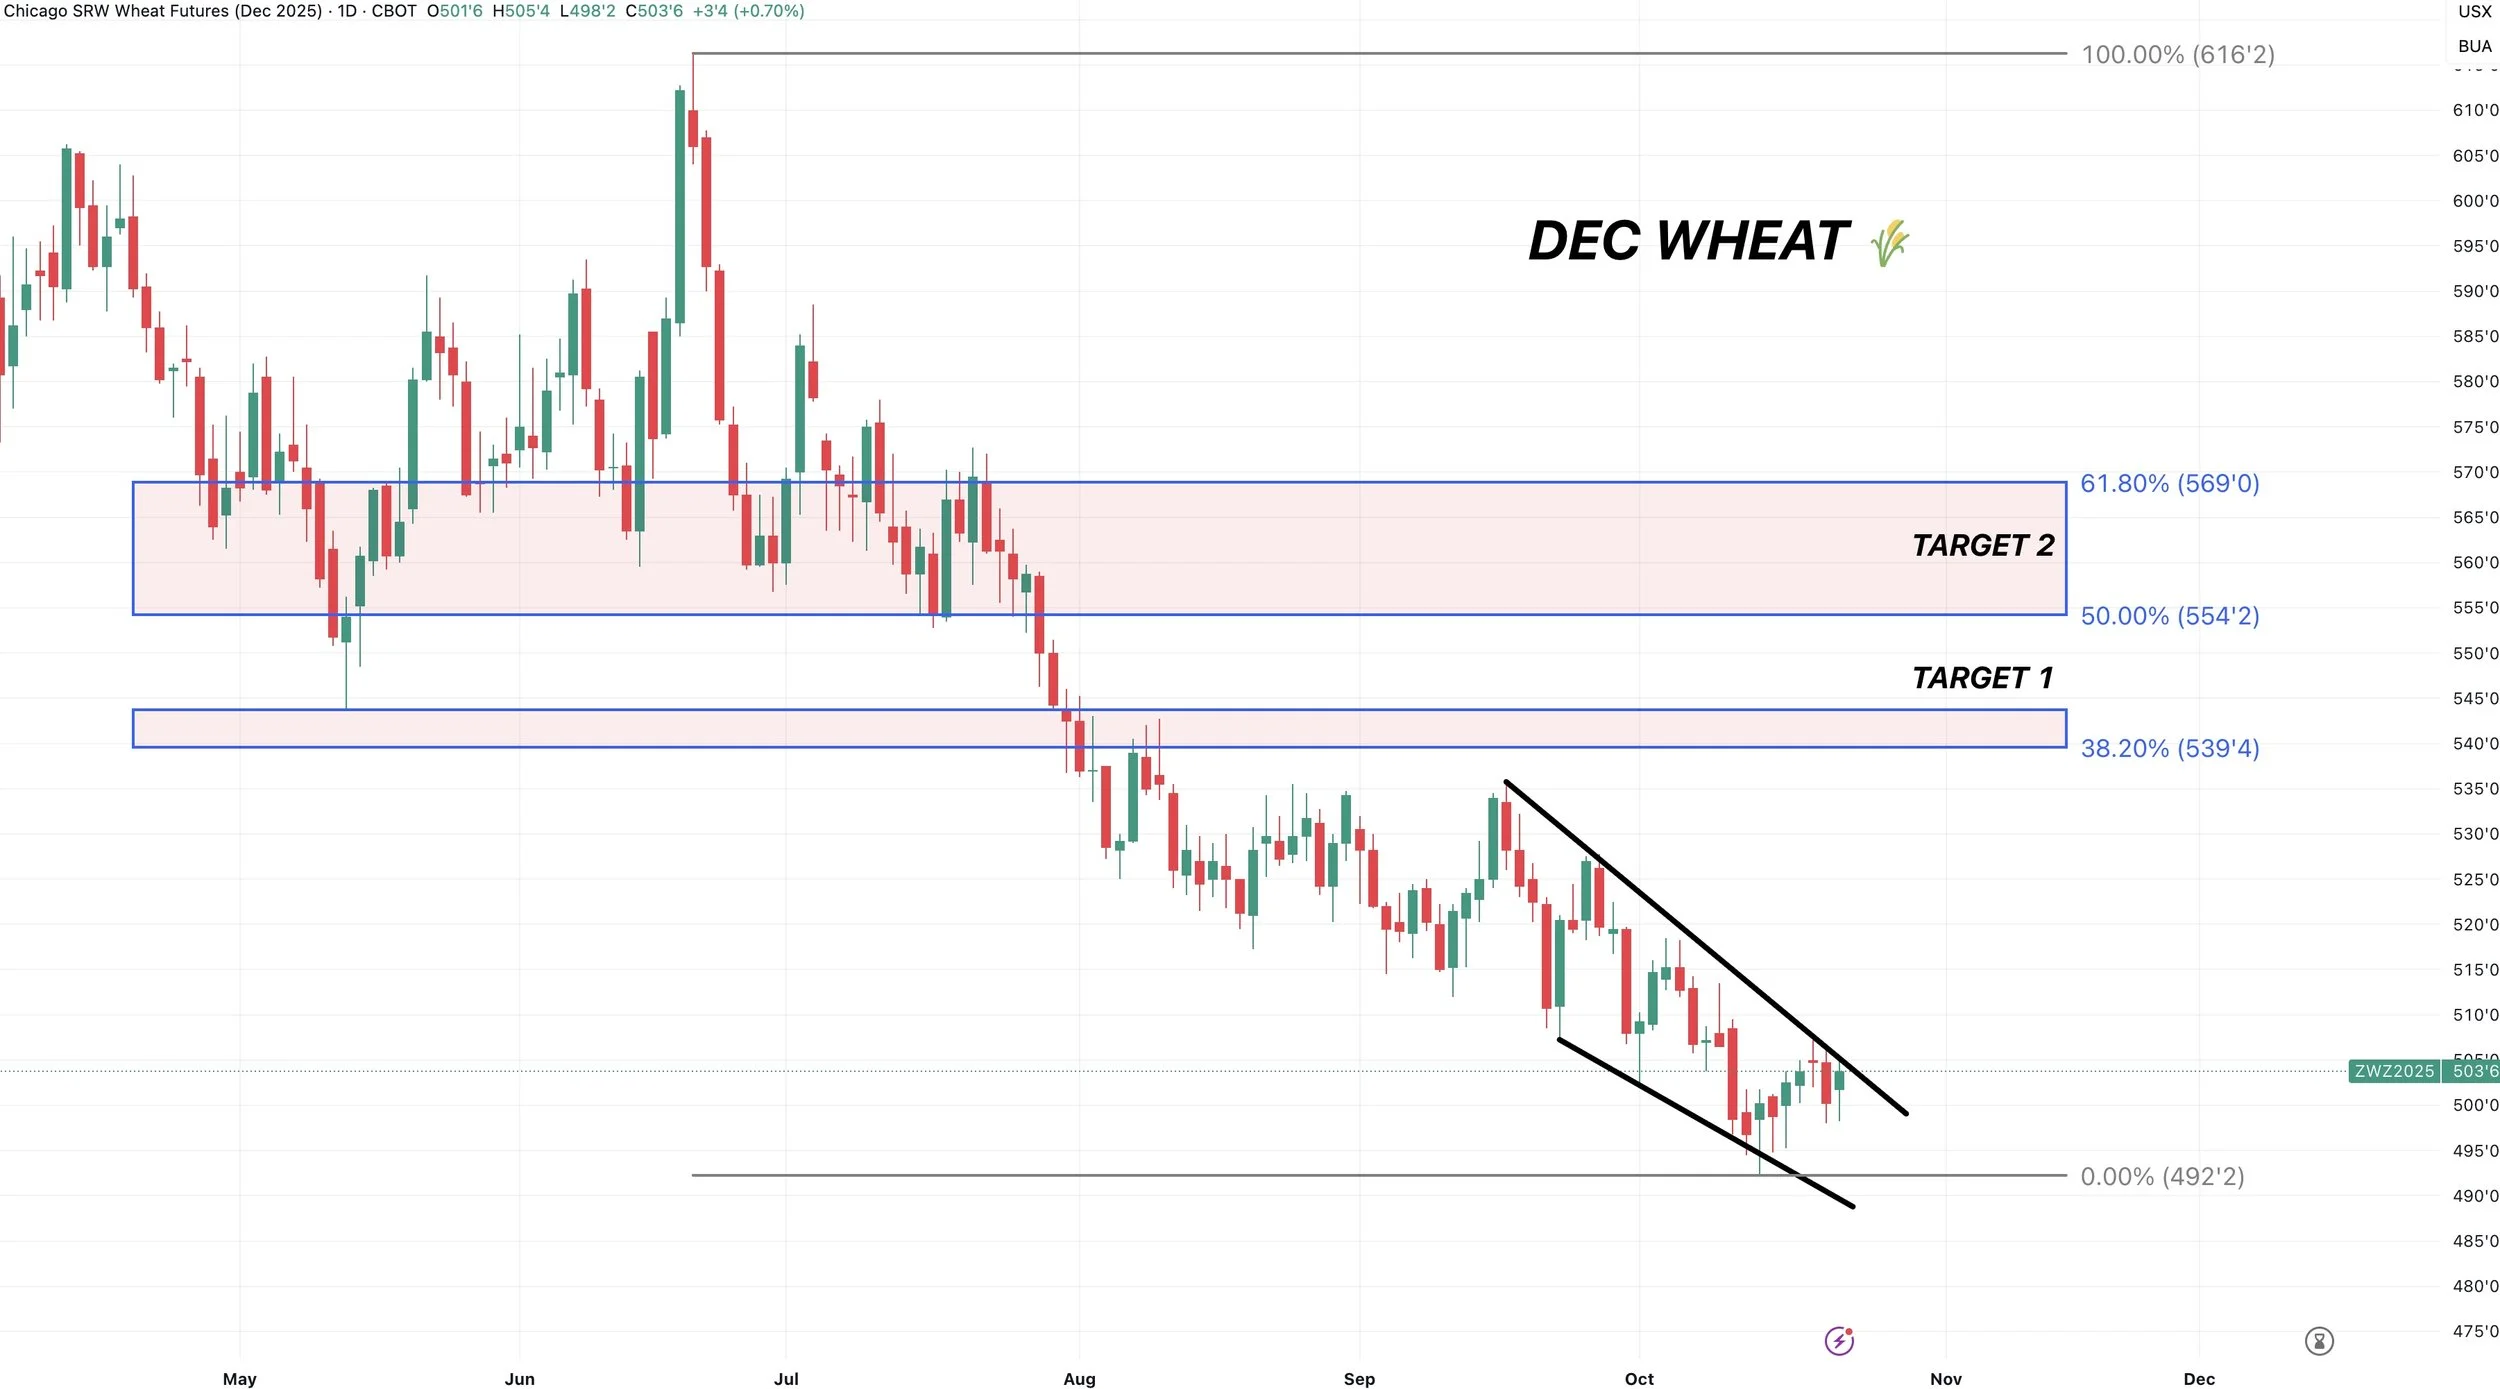
Dec Wheat 🌾
The wheat market still sucks, but we are now up against some trend resistance again.
If we can get the breakout, we have plenty of room to run.
Still too early to call a bottom. But optimistic if we break trendline resistance.
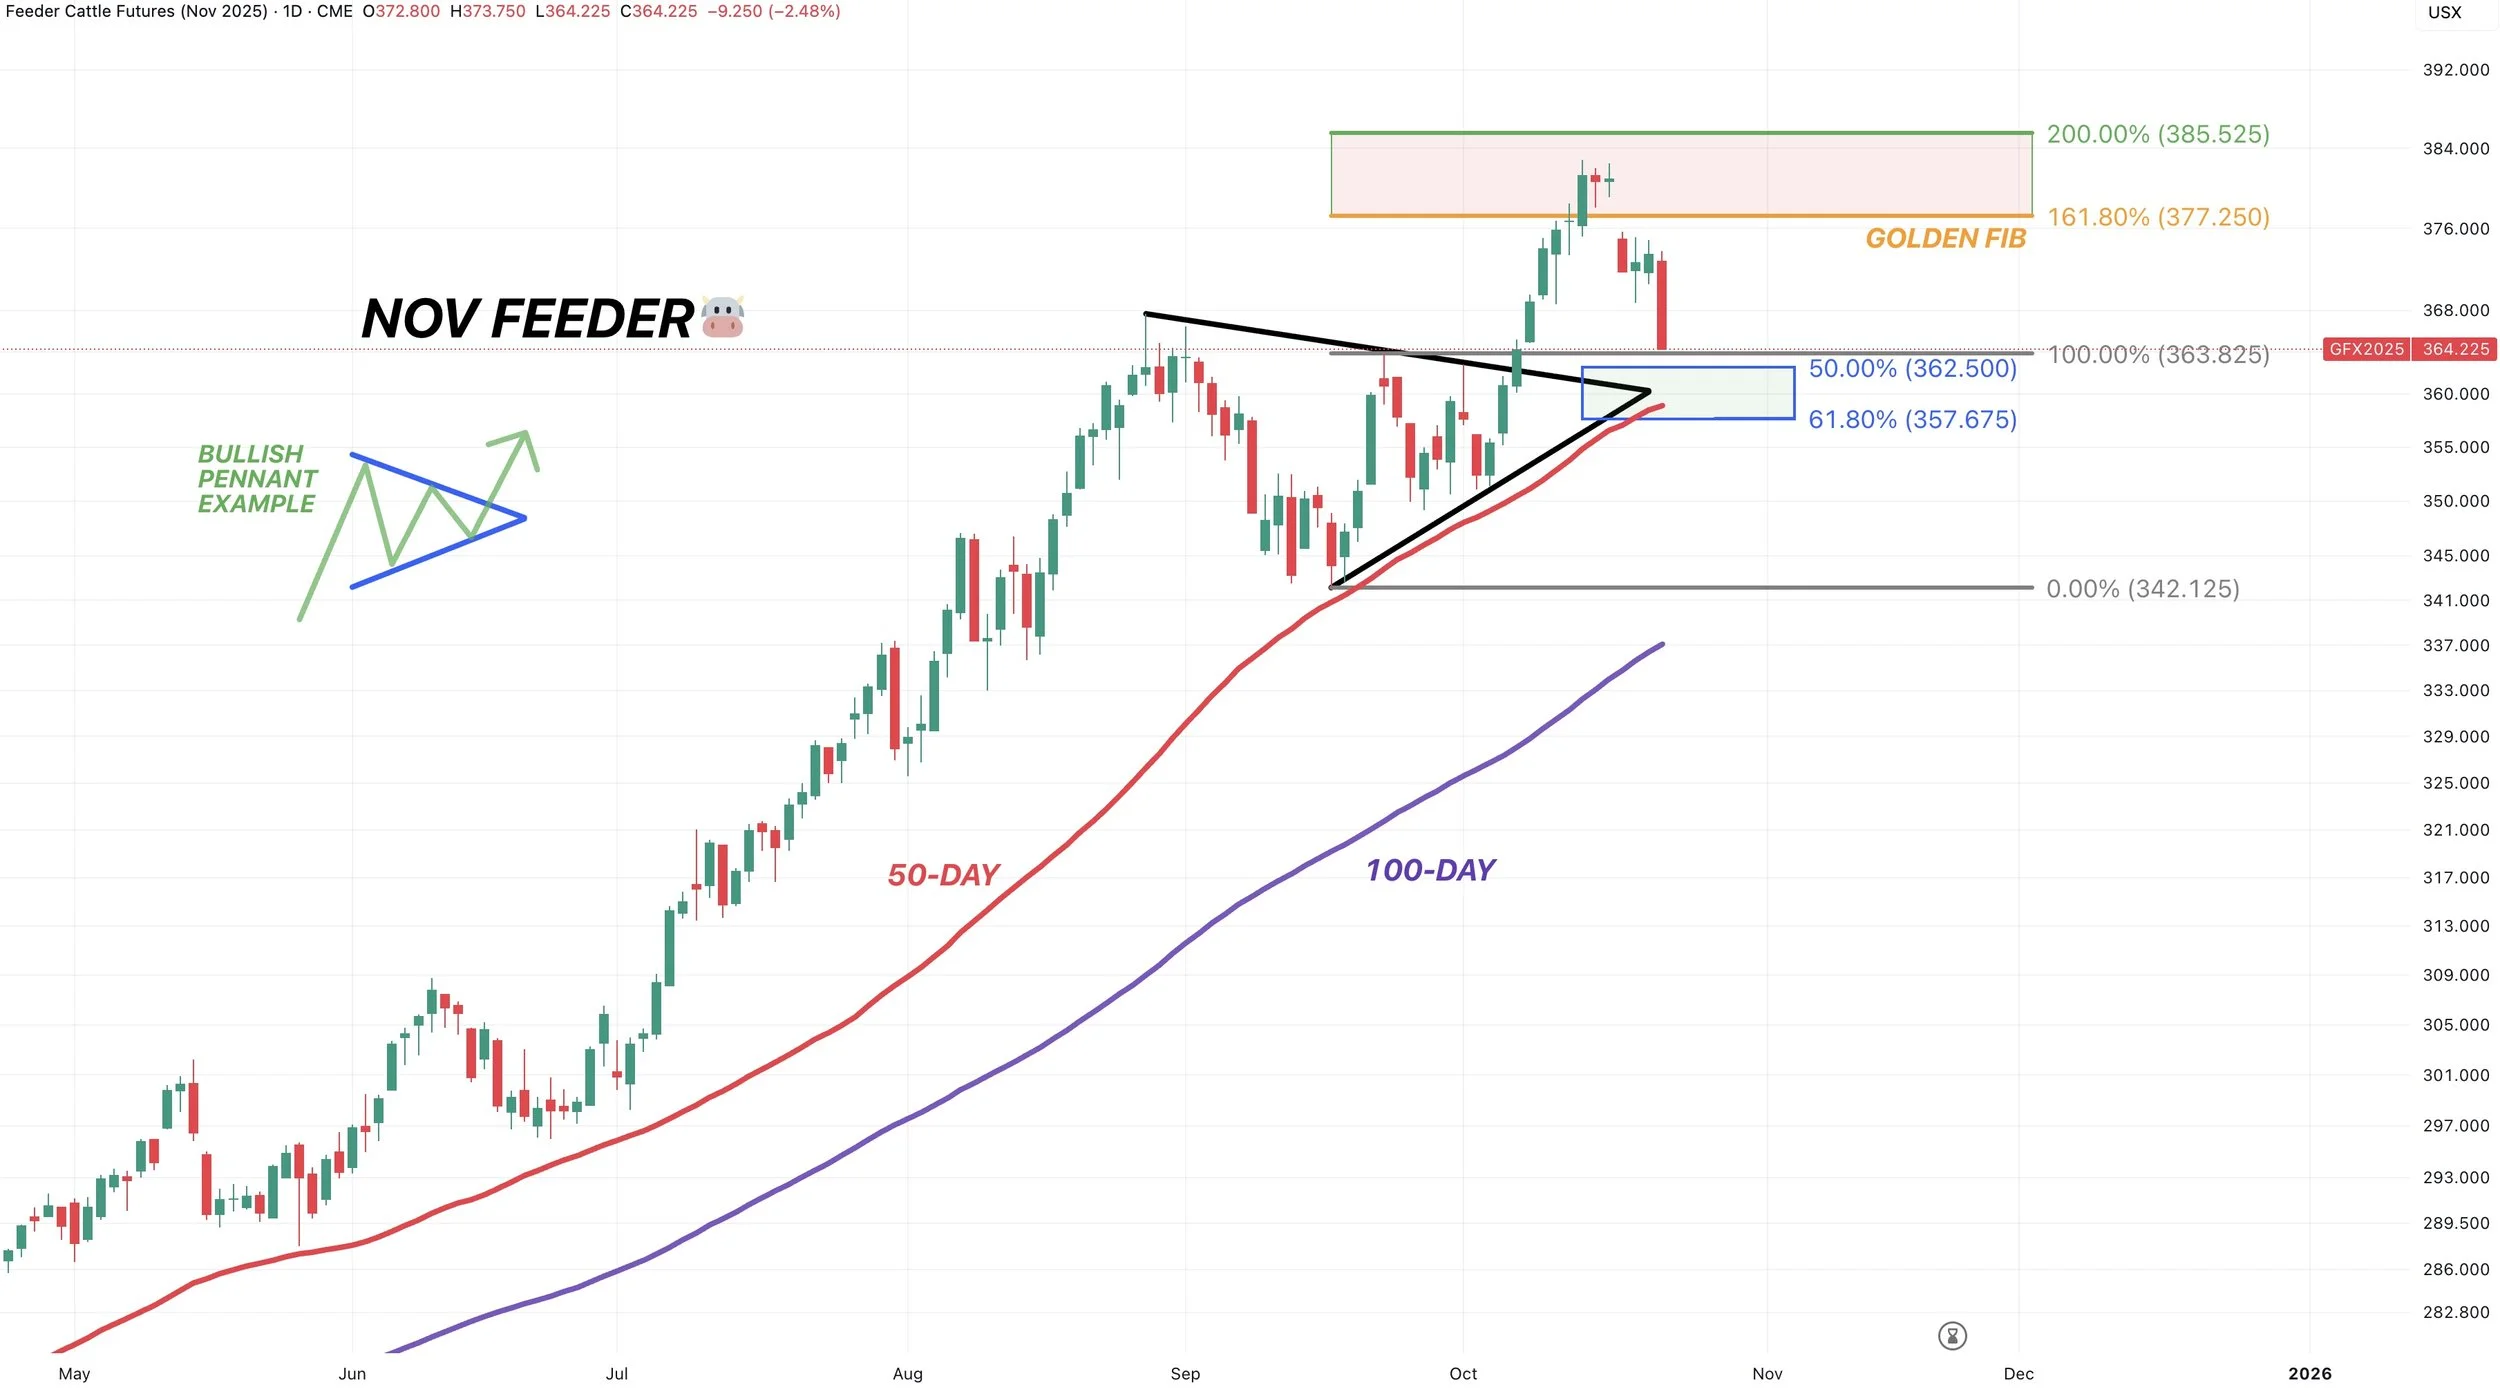
Nov Feeder 🐮
We are approaching a must hold level.
That blue box gives back 50-61.8% of this recent rally.
That is where the market tells us if this is simply a small correction, or the start of something bigger.
Not only that, but the 50-day MA lines up perfectly in that box.
The 50-day MA has acted as a major level of support all year long.
If that gives out, it probably sparks another leg lower.
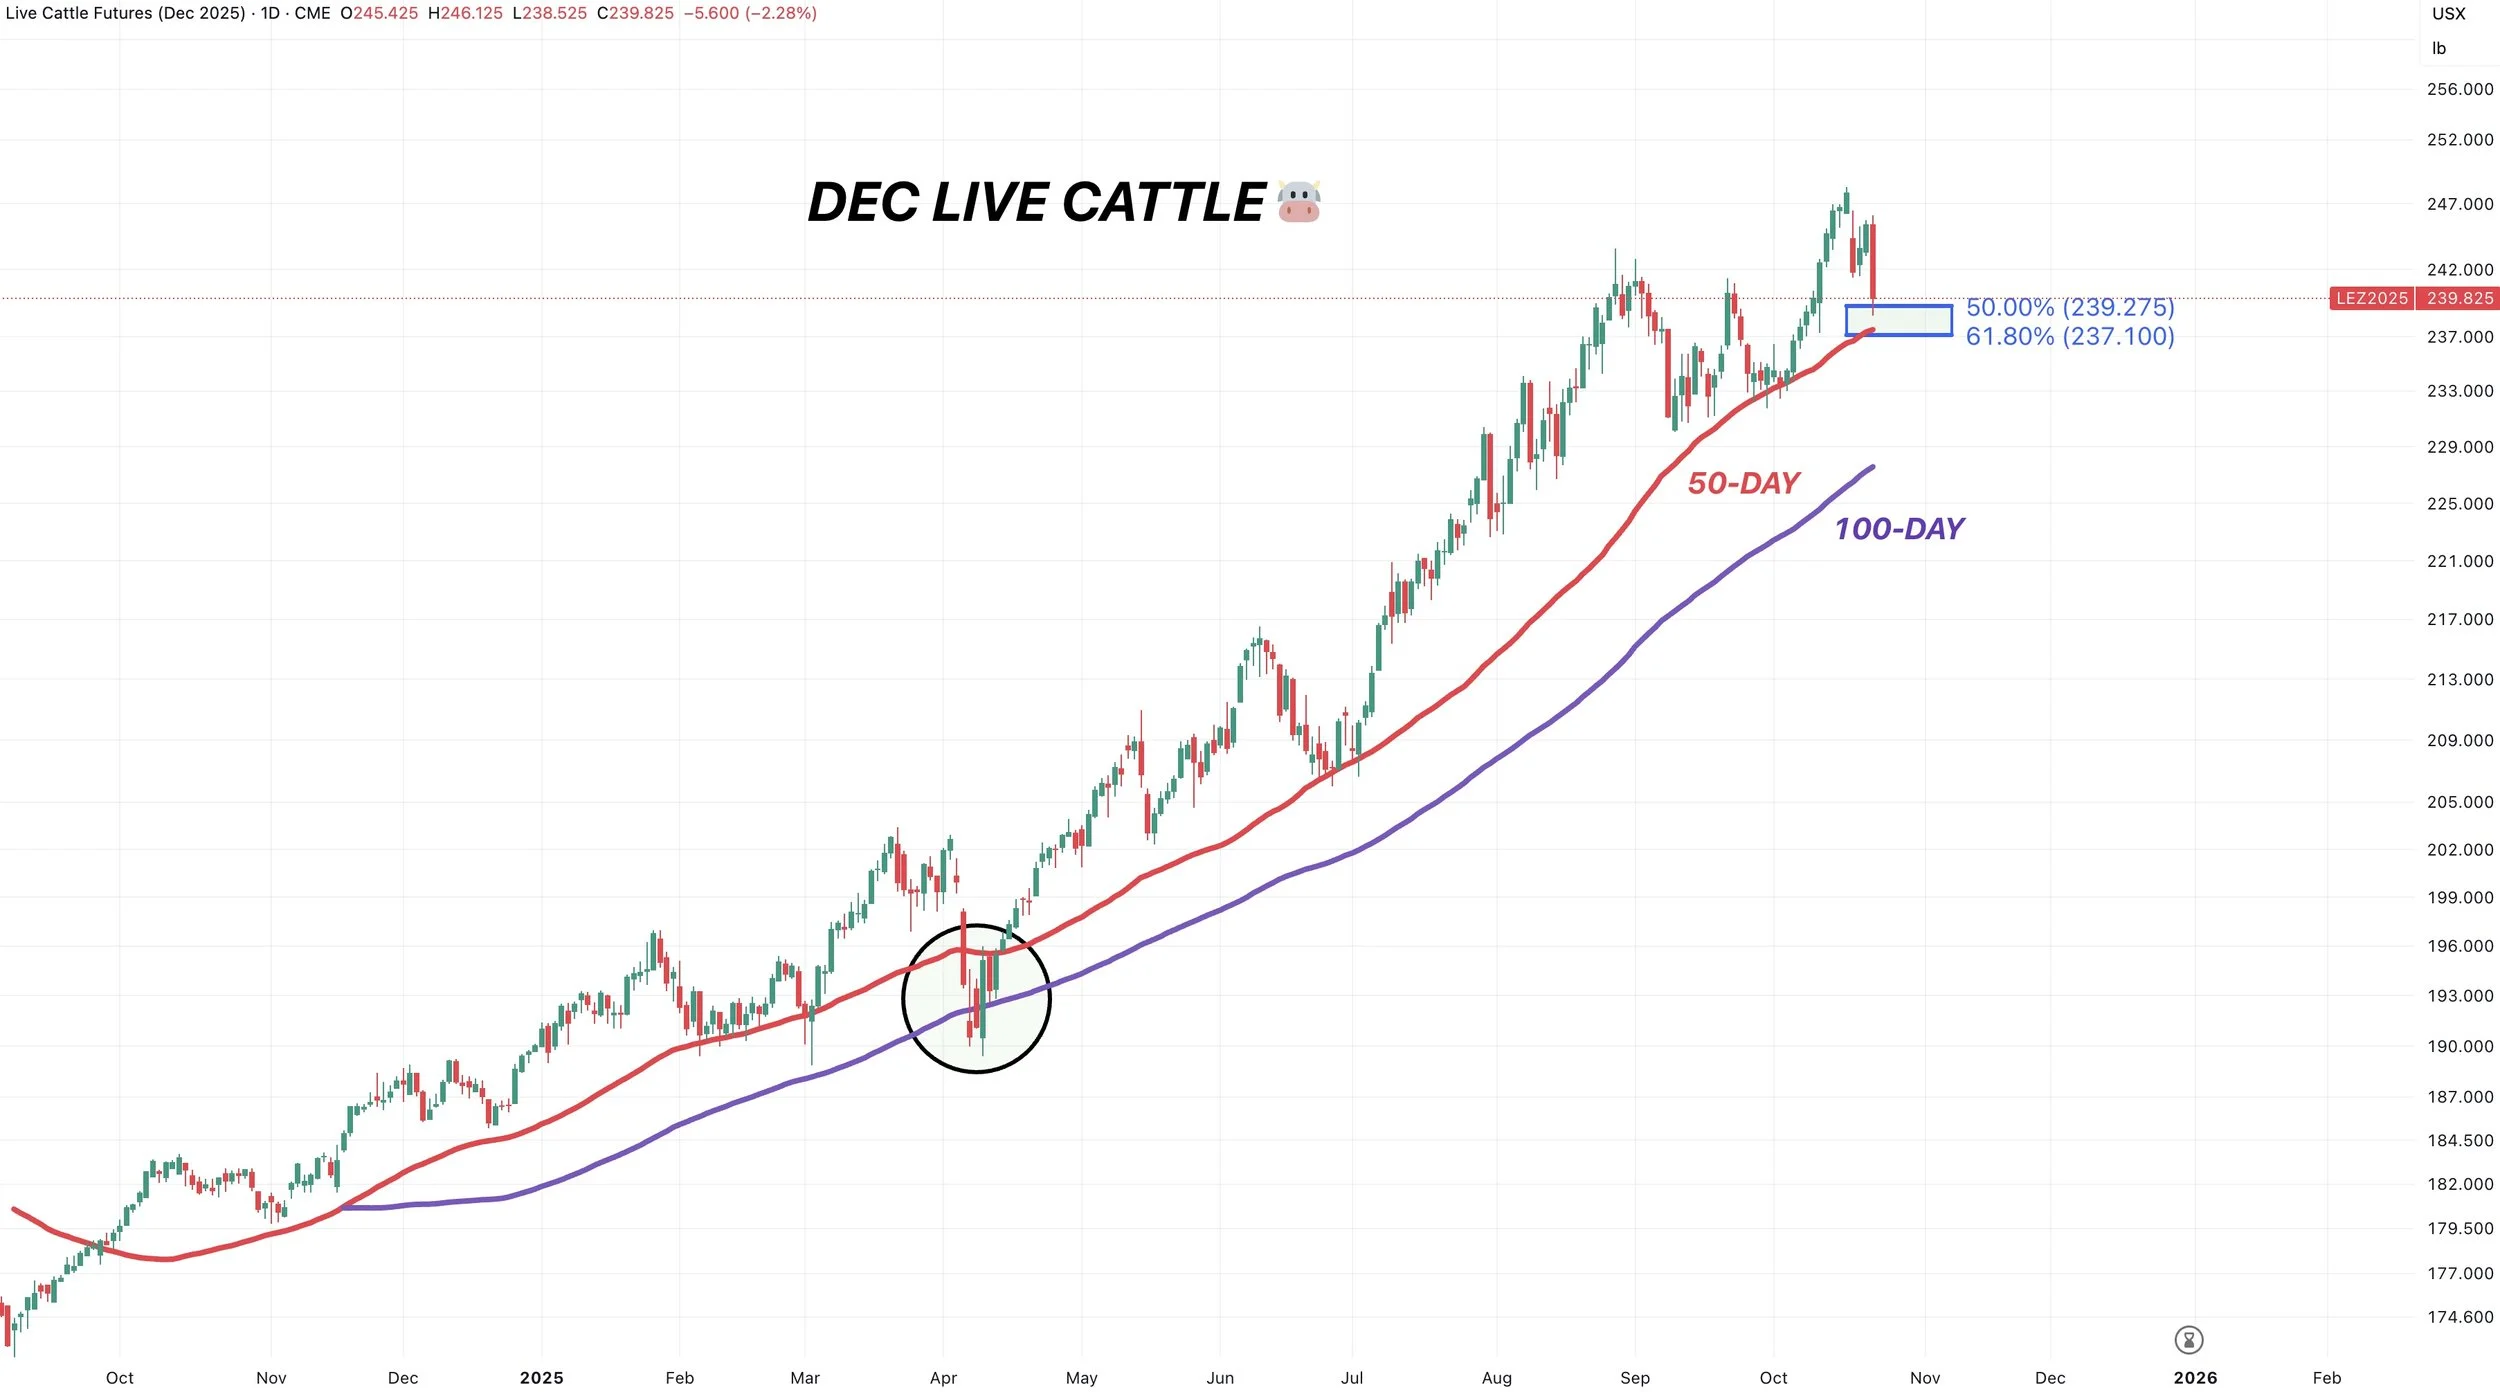
Dec Live 🐮
Exact same set up in live as feeder.
Approaching that golden zone box.
The 50-day MA also sits right there.
Bulls absolutely need to hold there or it could open the doors lower.
(Scroll to see how massive of a support the 50-day has been all year)

Here is a zoomed out chart.
The 50-day has been our floor since last year.
We broke below it one time.. back in April.
When we did that.. we visited the 100-day.
If the 50-day breaks.. it would be our warning sign this market could be in for a bigger correction.
Past Sell or Protection Signals
Oct 13th: 🐮
Cattle sell signal & hedge alert.
Aug 22nd: 🌱
Soybean sell signal & hedge alert.
July 31st: 🐮
Cattle sell signal & hedge alert.
July 10th: 🐮
Cattle sell signal & hedge alert.
CLICK HERE TO VIEW
June 5th: 🐮
Cattle sell signal & hedge alert.
June 2nd: 🌾
MPLS wheat sell signal.
April 10th: 🌽
Old crop corn sell signal.
March 19th: 🐮
Cattle hedge & sell signal.
Feb 18th: 🌽 🌾
Old crop KC wheat & old crop corn signal.
Jan 23rd: 🌽 🌱
Corn & beans old crop sell signal.
CLICK HERE TO VIEW
Jan 15th: 🌽 🌱
Corn & beans hedge alert/sell signal.
Jan 2nd: 🐮
Cattle hedge alert at new all-time highs & target.
Dec 11th: 🌽
Corn sell signal at $4.51 200-day MA
CLICK HERE TO VIEW
Oct 2nd: 🌾
Wheat sell signal at $6.12 target
Sep 30th: 🌽
Corn protection signal at $4.23-26
Sep 27th: 🌱
Soybean sell & protection signal at $10.65
Sep 13th: 🌾
Wheat sell signal at $5.98
May 22nd: 🌾
Wheat sell signal when wheat traded +$7.00
Want to Talk?
Our phones are open 24/7 for you guys if you ever need anything or want to discuss your operation.
Hedge Account
Interested in a hedge account? Use the link below to set up an account or shoot Jeremey a call at (605)295-3100.