
BUY THE RUMOR SELL THE FACT
MARKET UPDATE
You can scroll to read the usual update as well. As the written version is the exact same as the video.
Timestamps for video:
Overview: 0:00min
Corn: 3:45min
Beans: 9:00min
Wheat: 10:15min
Cattle: 11:00min
Want to talk?
Office: (806)484-1214
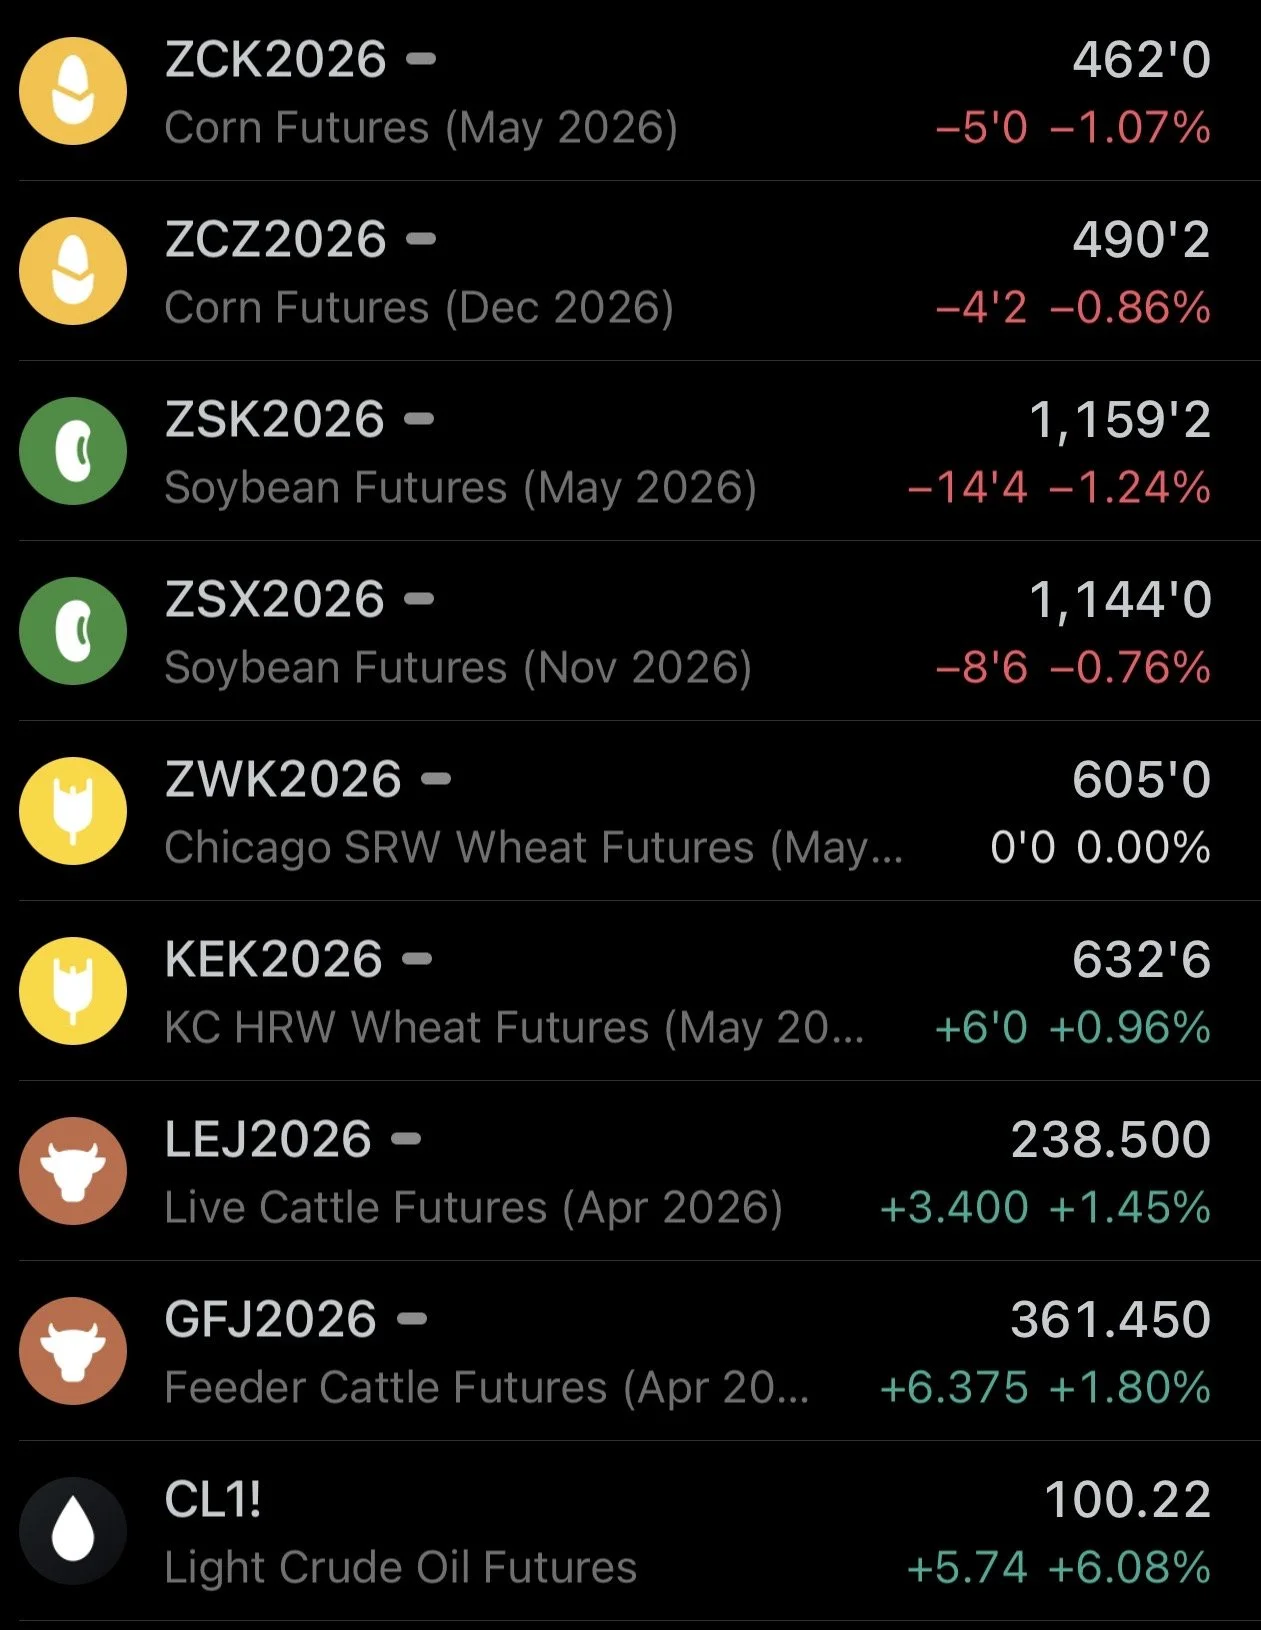
Futures Prices Close
Overview
Grains mostly lower as soybeans had a volatile up and down day, eventually falling under pressure. Meanwhile, the cattle market caught a bid.
Crude oil was strong and is back up over $100, up nearly $6 a barrel today. It was slightly disappointing that the grains couldn’t follow along for the ride.
Today's update is going to be on the brief side as all eyes are on the war headlines and what Tuesday's USDA report has to say.
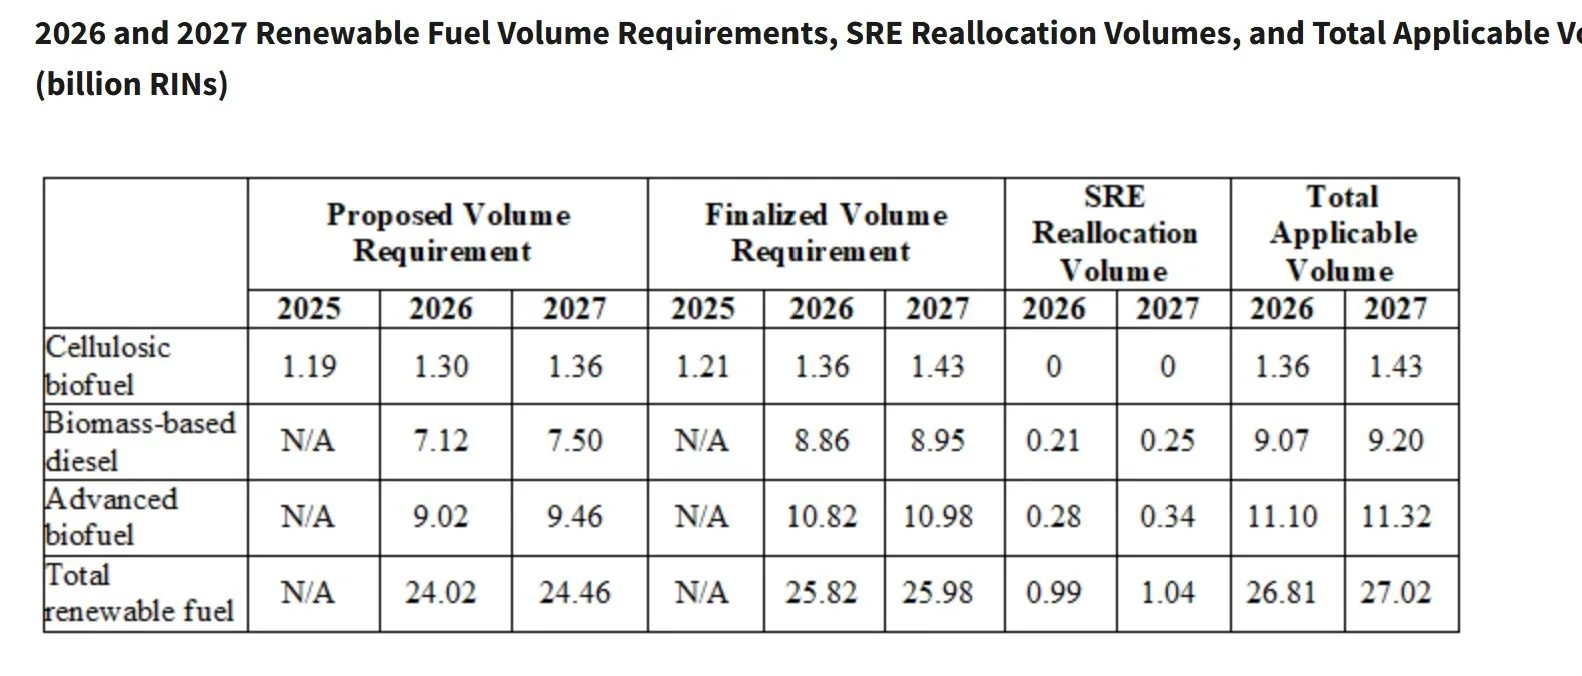
Today, we received the RVO numbers along with Trump's speech to farmers.
Here were the RVO numbers.
On paper these numbers would be considered bullish. I mean they are the largest RVOs ever and exceeded the proposed volumes. Positive for demand long term.
But the numbers were pretty close to in line with those leaked numbers from a few weeks back. So roughly what the market was expecting.
We talked about the chance for these numbers and the Trump speech to be a buy the rumor sell the fact event. Today was a classic example of one of those.
Despite the numbers being positive, people sold because it was already priced in and there were no more surprises.
How did the Trump speech go?
Overall he didn’t say anything too impactful or supportive for the markets.
He said US soybeans are now being shipped to China in record amounts. Who knows what the context of that statement meant, but soybean exports to China are actually still sitting at 19-year lows.
He announced that he was requesting additional farm relief for farmers.
He said he's asking John Deere and Caterpillar to lower their equipment costs for farmers.
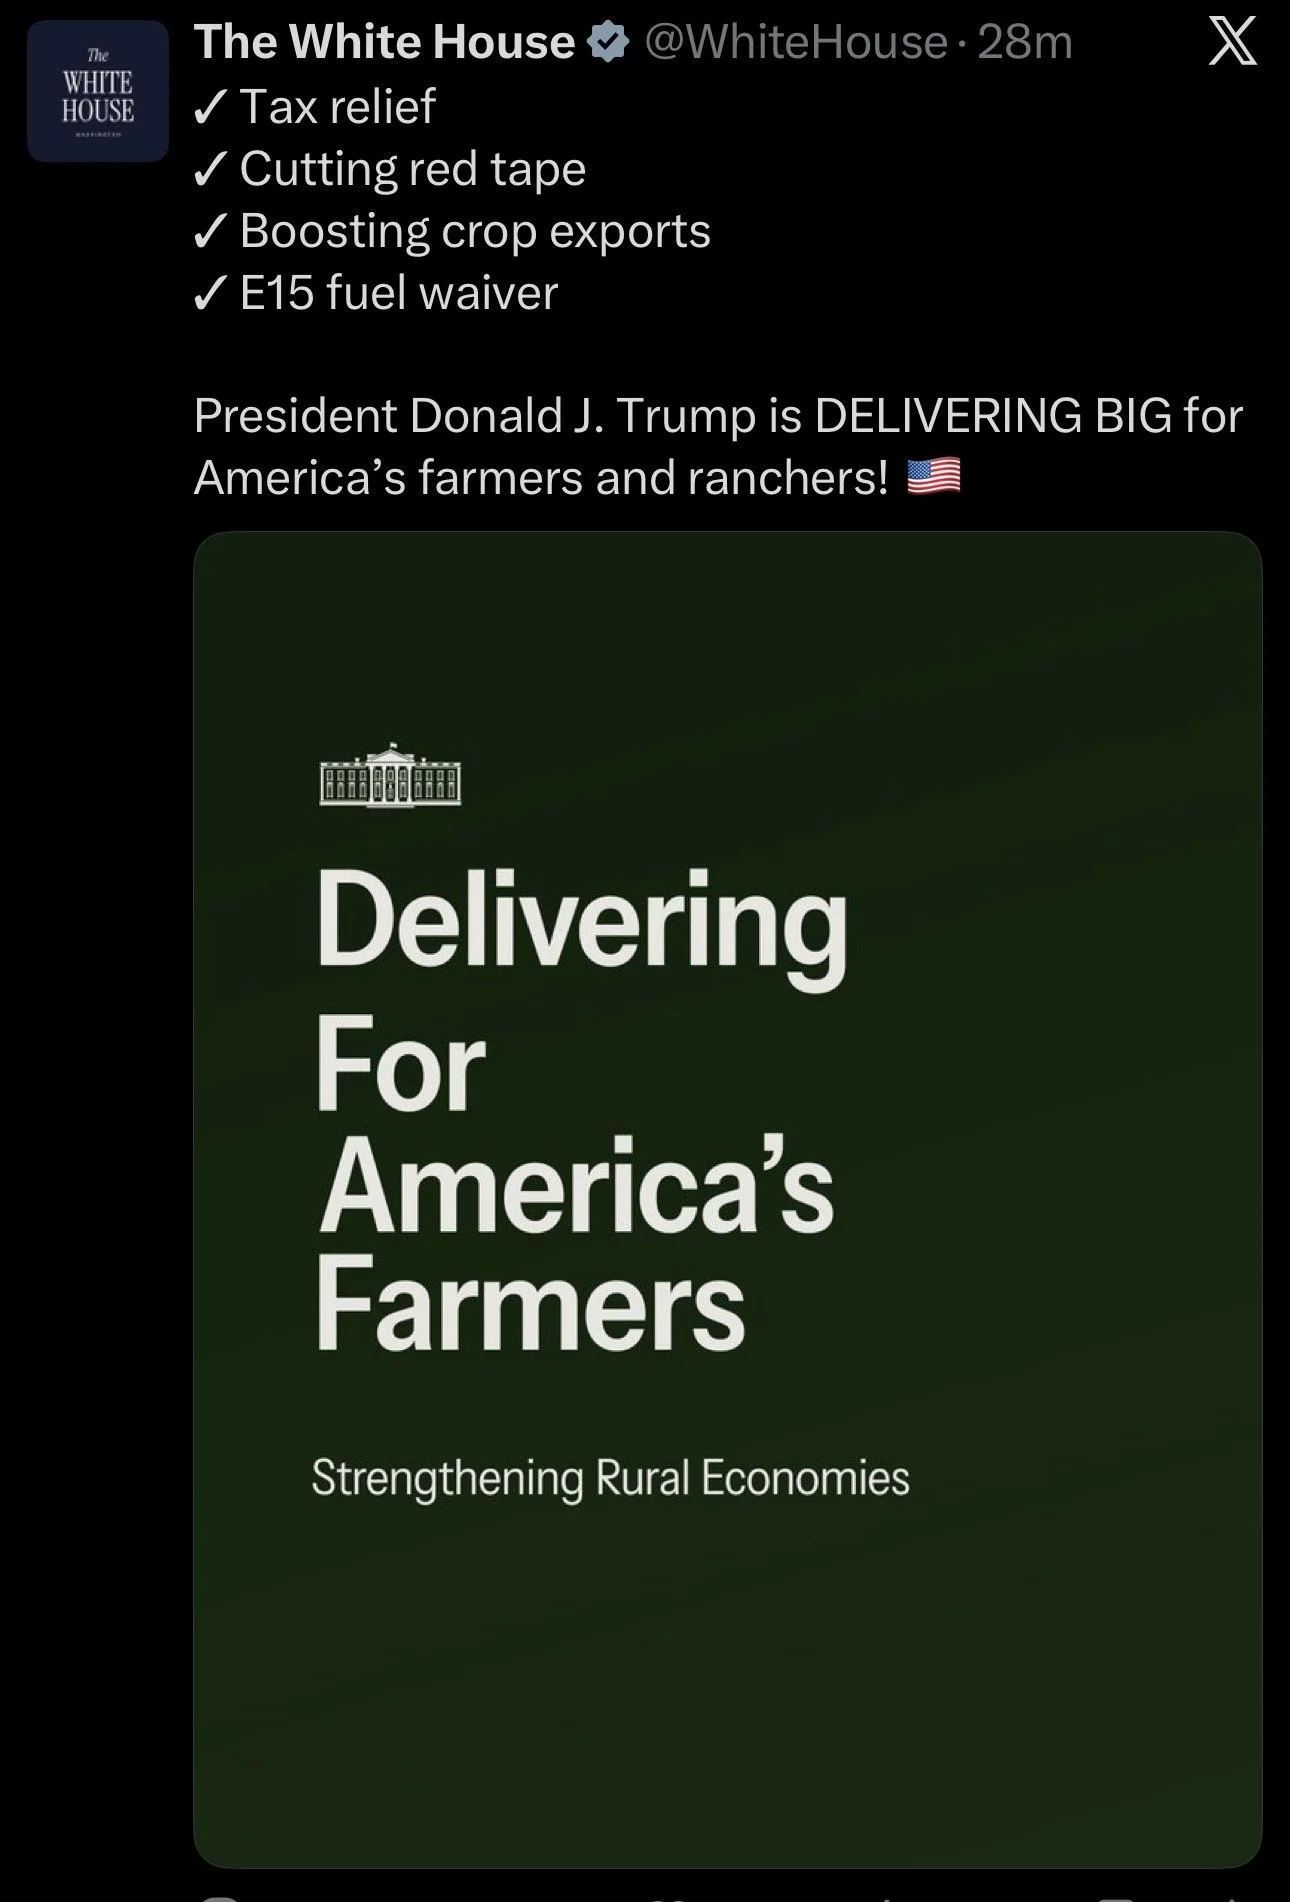
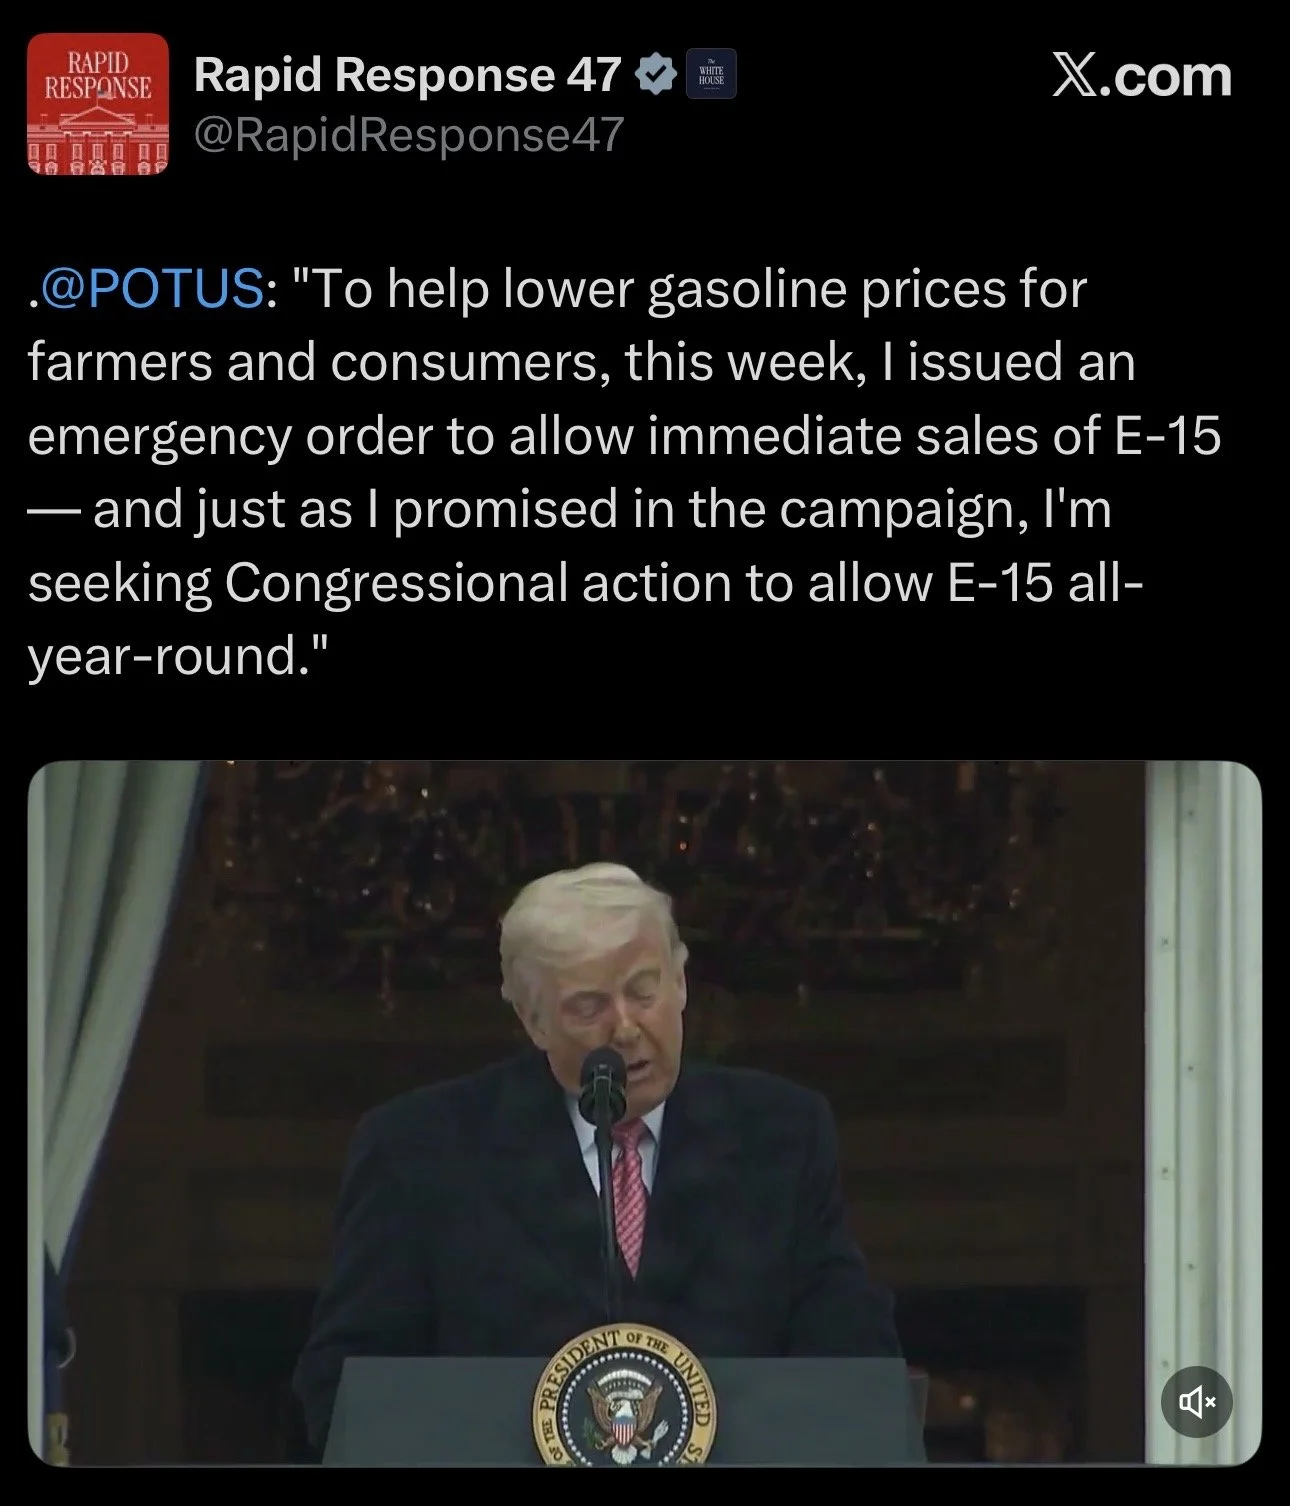
He also announced an emergency order to allow immedite sales of E-15. As he is seeking the allow year round E-15.
However, this isn’t anything new.
We've seen summer sales of E-15 for the last 7 years.
E-15 is also simply just a headline. It'll take a long time to see massive impacts from it.
This is why the market hasn’t cared about it much.
So overall, the speech wasn’t supportive for the markets and didn’t really provide any sort of surprises.
USDA Estimates
Here are the estimates for Tuesday's USDA report.
Corn:
Acres Est: 94.37
Range: 92.60 - 96
Feb Outlook: 94
Last Year: 98.8
Beans:
Acres Est: 85.55
Range: 84.25 - 86.50
Feb Outlook: 85
Last Year: 81.22
Wheat:
Acres Est: 44.79
Range: 43.05 - 46.60
Feb Outlook: 45
Last Year: 45.33

I showed this the other day.
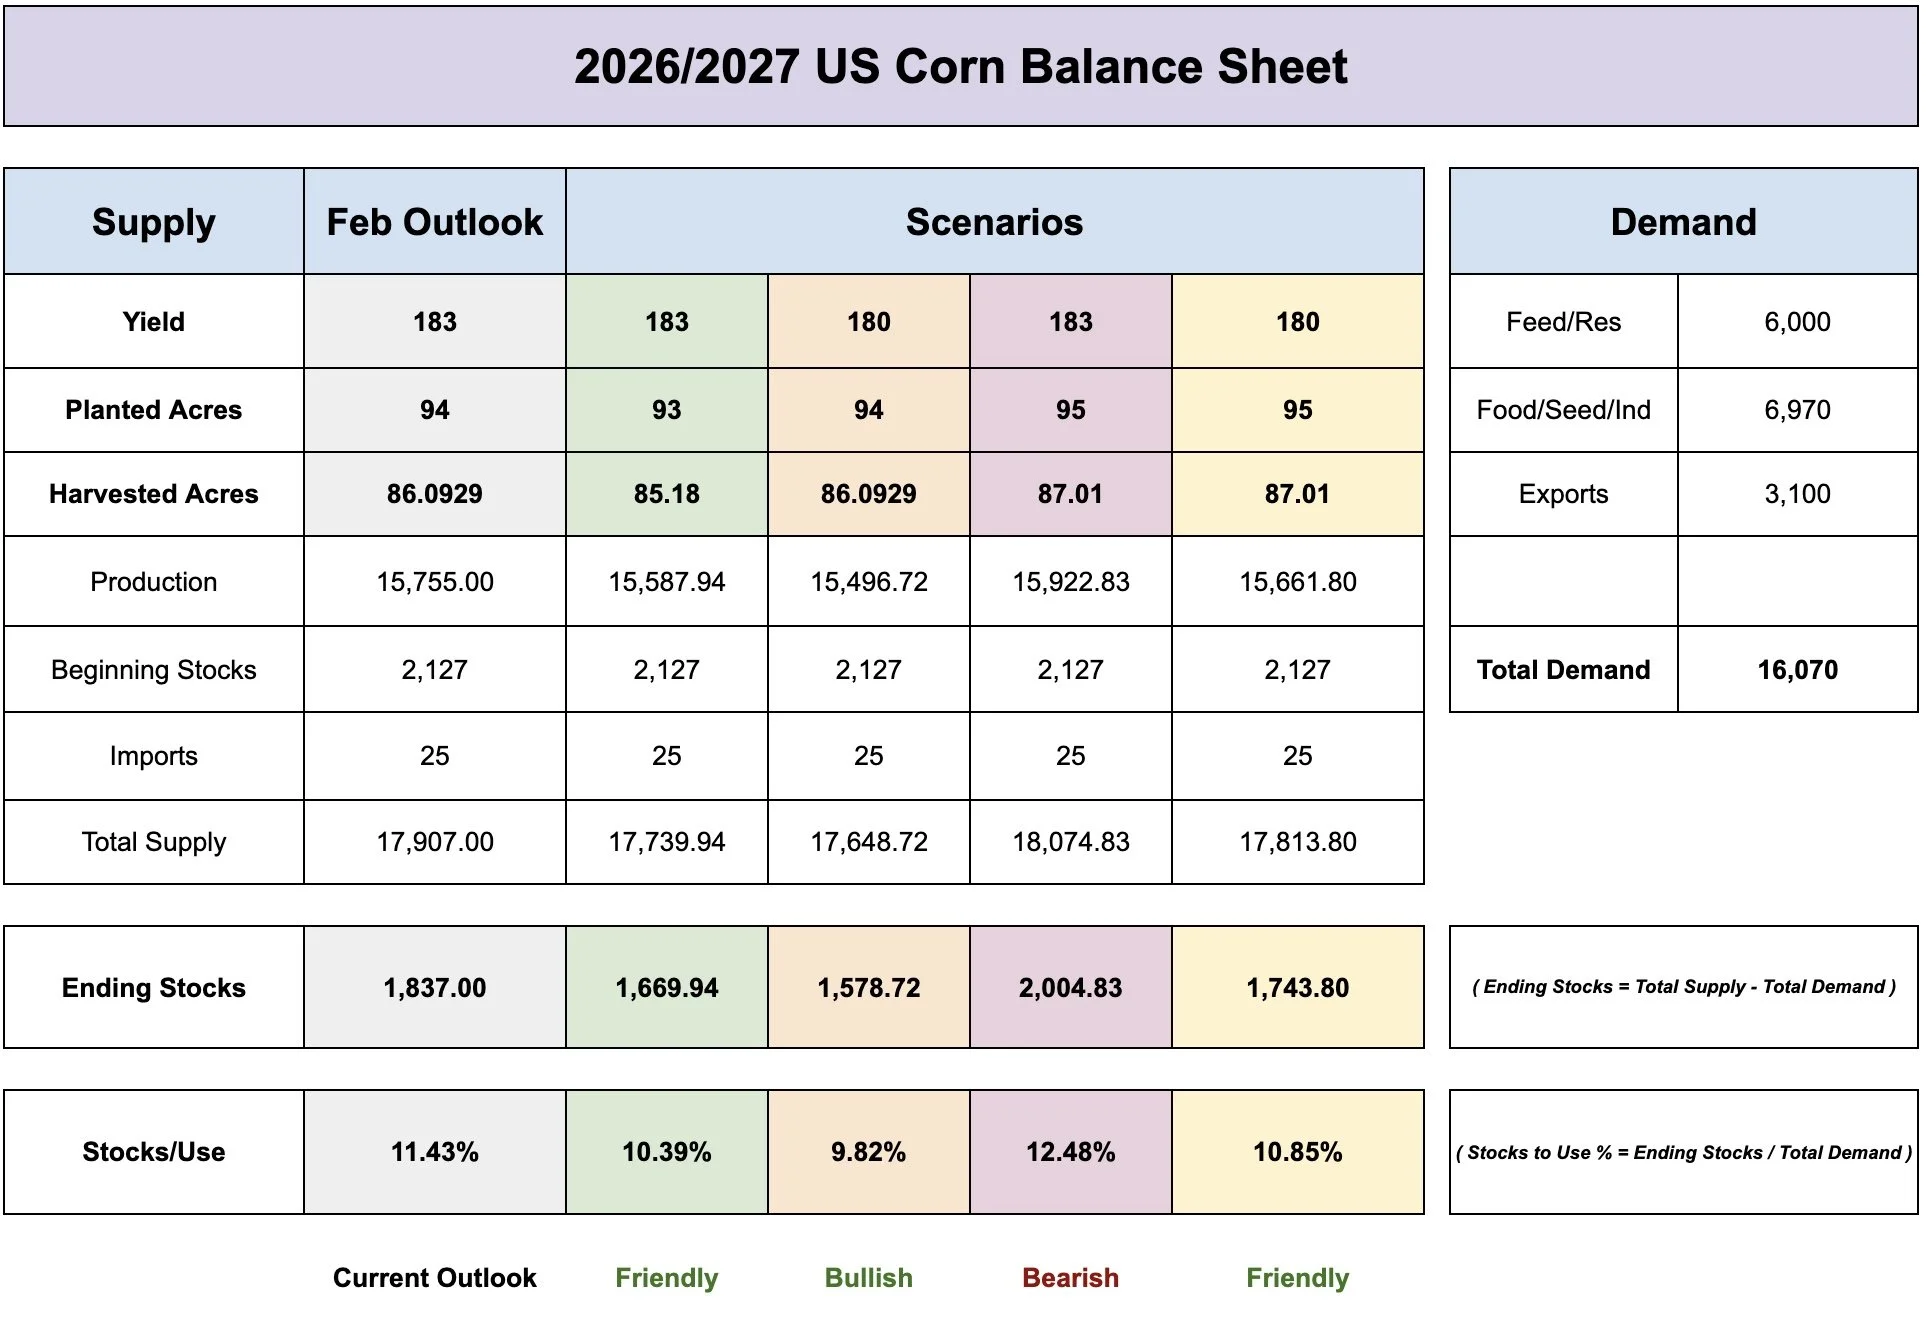
Here are a few corn balance sheet scenarios based on the Feb Outlook.
183 and 180 yields with different acre numbers.
If acres do come in on the light side, it could potentially paint a path to a friendly scenario in corn and not leave a ton of wiggle room for a production hiccup.
Who knows where actual acre numbers will come in at.
The numbers and demand side will of course change, but 93 million acres with the Feb Outlook demand numbers and a 183 yield is a decently friendly scenario in itself.
Here are the stocks estimates.
Corn:
Stocks Est: 9.04
Range: 8.42 - 9.38
Last Year: 8.147
Beans:
Stocks Est: 2.063
Range: 1.88 - 2.13
Last Year: 1.911
Wheat:
Stocks Est: 1.30
Range: 1.05 - 1.34
Last Year: 1.237

Today's Main Takeaways
Corn
How sold or hedged should you be?
On old crop, we think it makes sense to be 75% or more sold or hedged. If you are oversold, you could consider an options strategy that allows you to participate in the upside. Such as a call option etc.
What about new crop?
It really depends on your situation. No two operations are the same.
But here are some generic thoughts.
Let's break it down into a few categories based on storage, profitability, and whether you have all your inputs locked in.
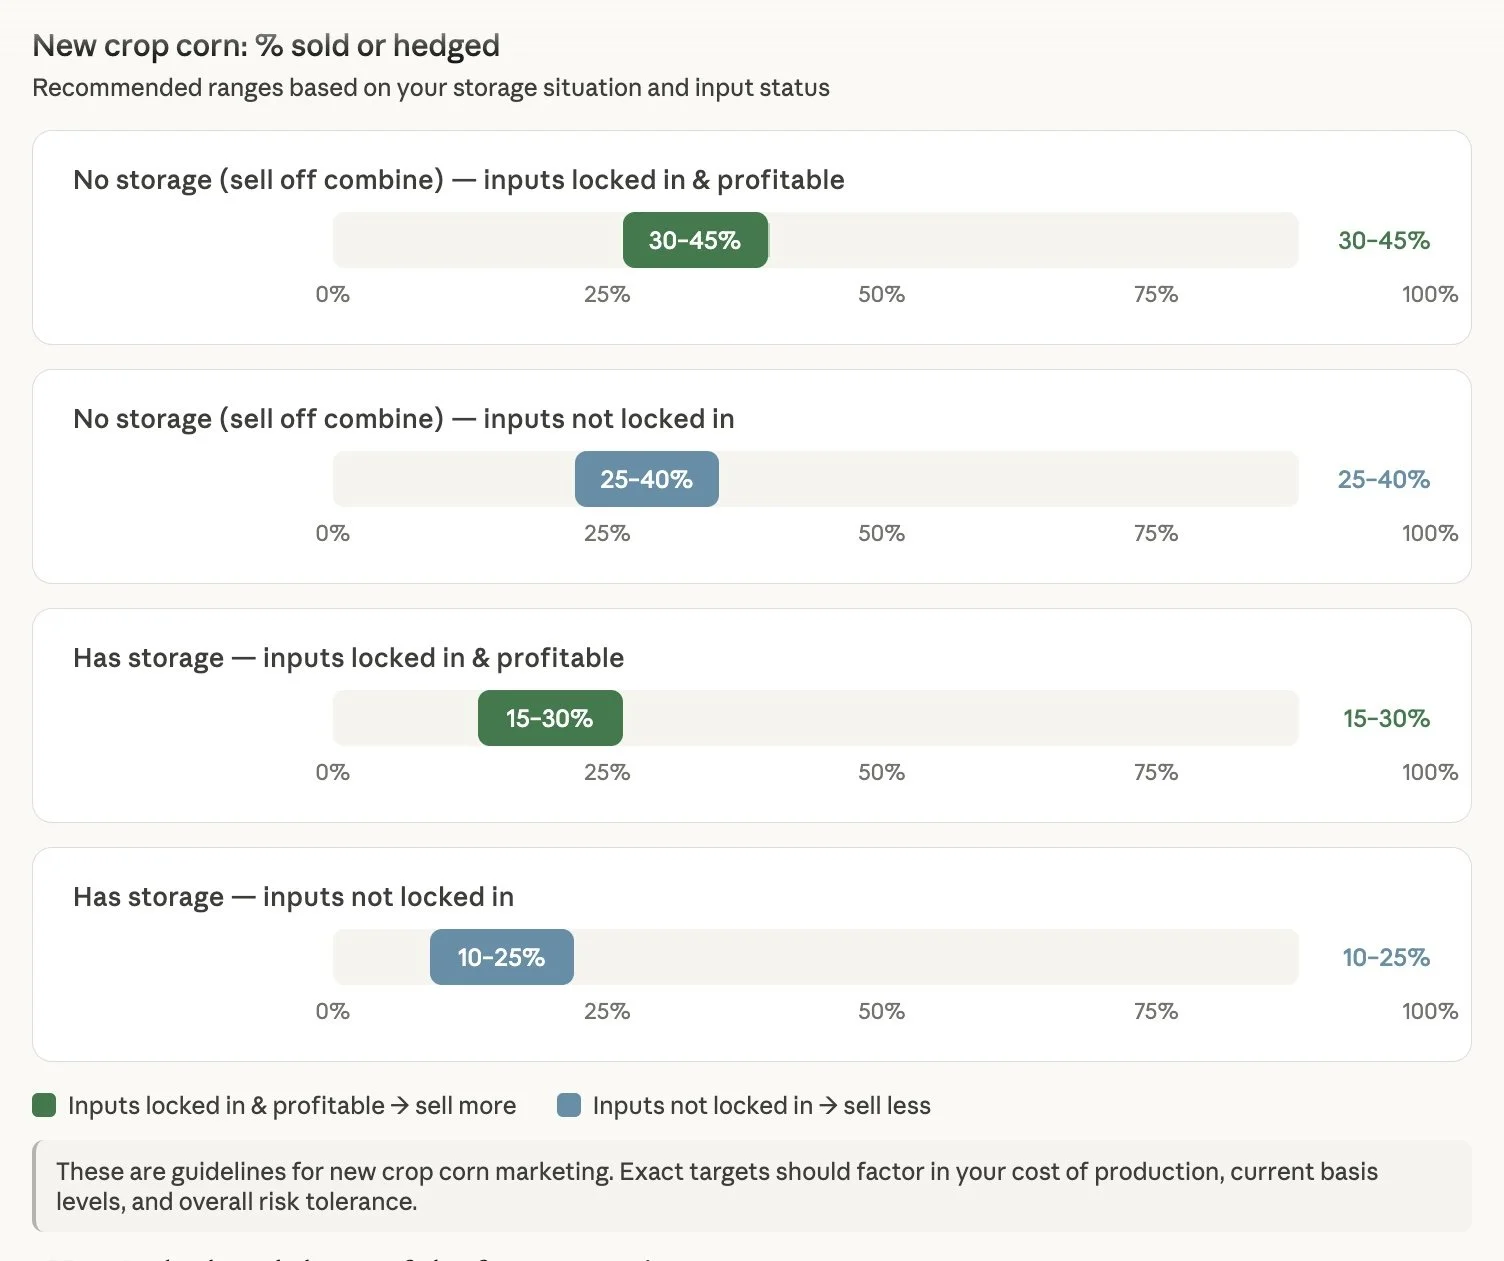
No storage (sell off the combine):
You have less flexibility, so you need to be more aggressive than someone who doesn’t have to sell off the combine.
If all of your inputs are locked in and it's profitable, being in the 30-45% hedged or sold range makes sense.
If all of your inputs aren't locked in, that 25–40% range makes sense. Although we do not recommend sales that are not profitable.
Has storage:
You can afford to be more patient. If your inputs are locked in and it's profitable, that 15-30% is a good range.
If you do not have all of the inputs locked in, then the 10–25% range makes sense. But again, we do not want to make sales that are not profitable.
So essentially if your inputs are locked in and it's profitable, you should be more aggressive than someone who doesn’t have them locked in.
If you do not have storage and have to sell off the combine, you do not have the flexibility that someone who does not have to sell off the combine does. So you should be more aggressive.
If you don’t have to sell off the combine, you have the flexibility to save more bullets for that April to June seasonal slot.
Now if you do not have anything sold and do not have any inputs locked in, you need to be proactive and figure out if you can lock things in and where you can make money. You need to find your profitability level. Because inputs could continue to rise or grains could go lower, there are several bad scenarios for being in that type of situation.
Below yesterday’s audio we included different downside strategies you could consider. Check it out if you want to view them.
Here is a generic graph based on storage etc.
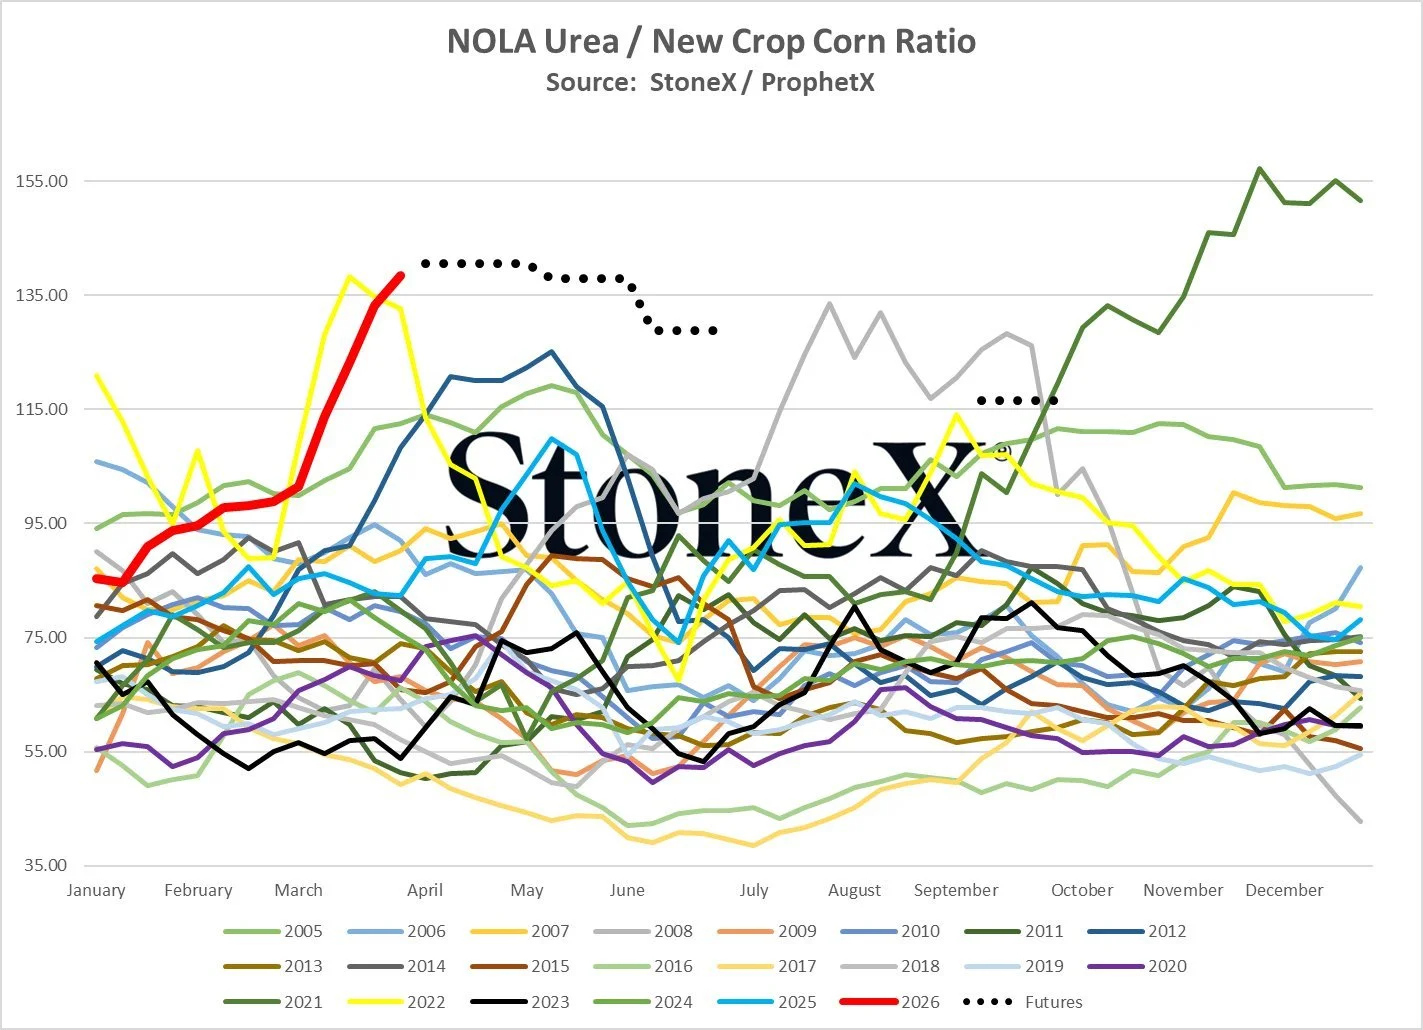
Fertilizer vs Corn
Here is a nice chart from StoneX that shows the Urea to new crop corn ratio.
It's sitting at it's highest level ever for this time of year.
Meaning it's expensive compared to corn.
One could argue that since the cost to grow corn went up, corn should go up.
But it's not that simple.
Aside from headlines and money flow, the market cares about supply. It doesn’t care about profitability.
It cares if the farmer is going to plant corn or not.
We will see if the USDA thinks this impacted acres not.
If fertilizer did stay high, I'd argue that this could be a bigger story for next year. As that could impact more planting decisions than it will this year.
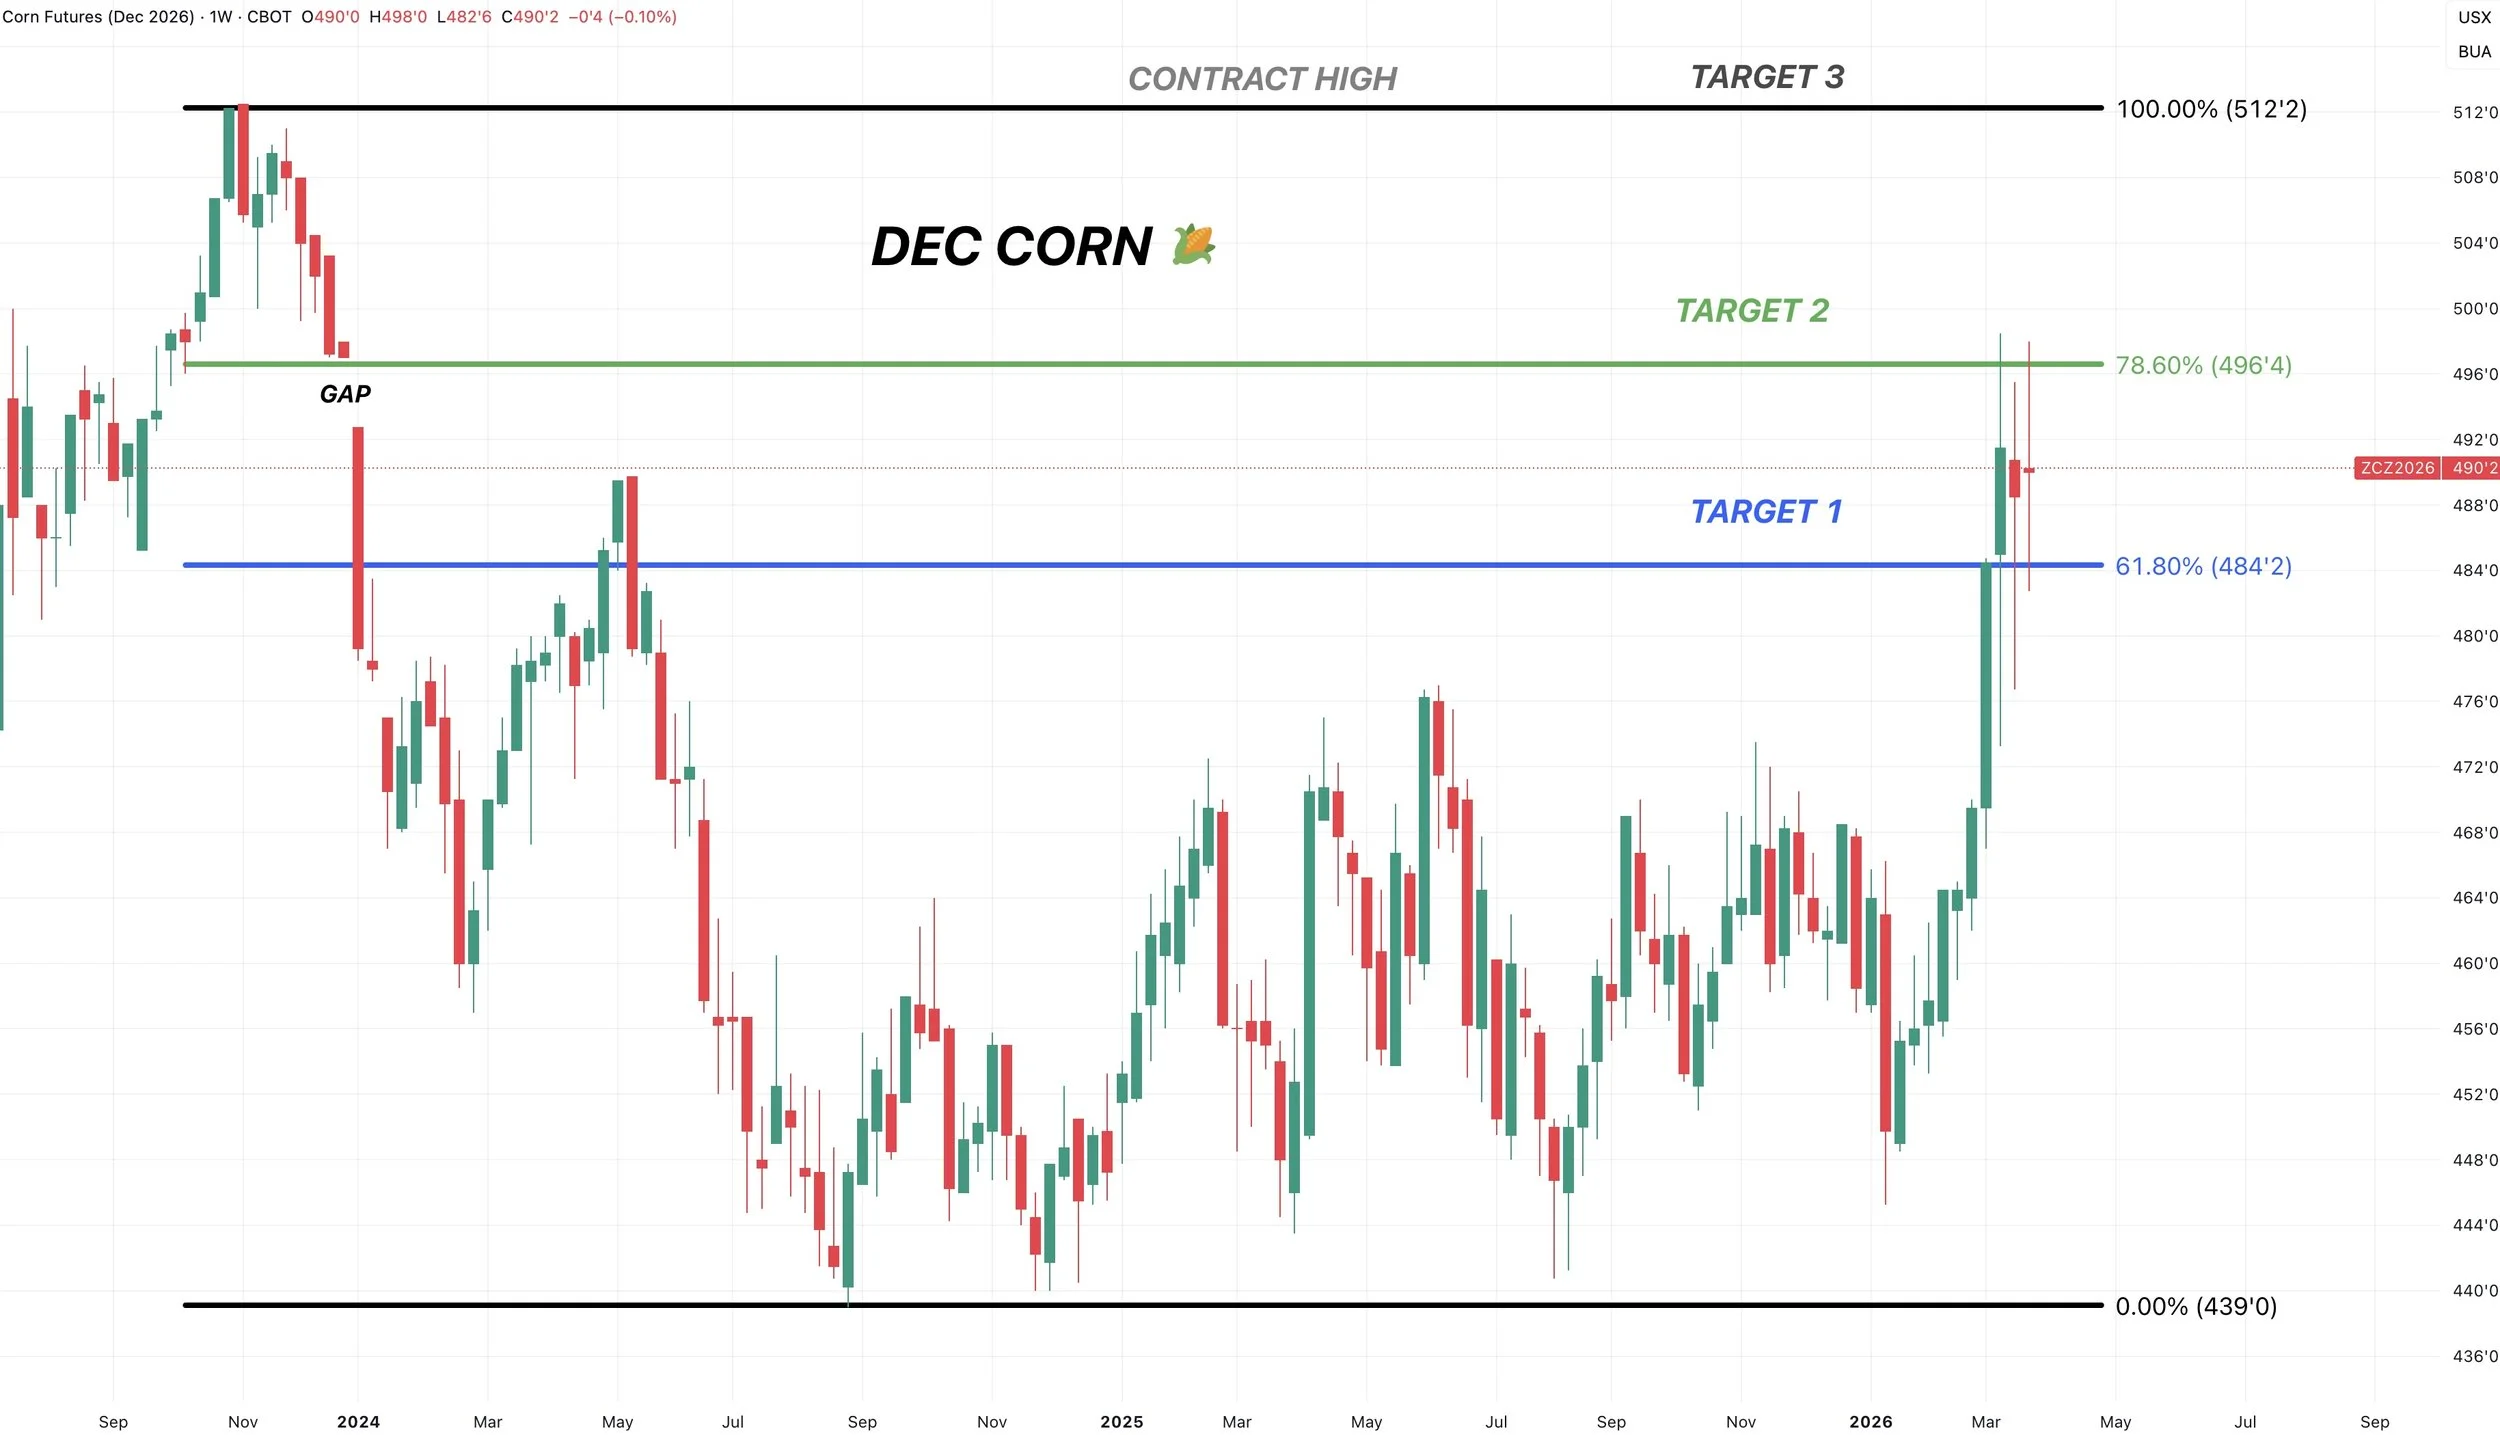
Dec Corn Target Hit:
We hit that next $4.96 target we've been talking about for a few weeks again for the 3rd time this morning.
Next target is contract highs at $5.12
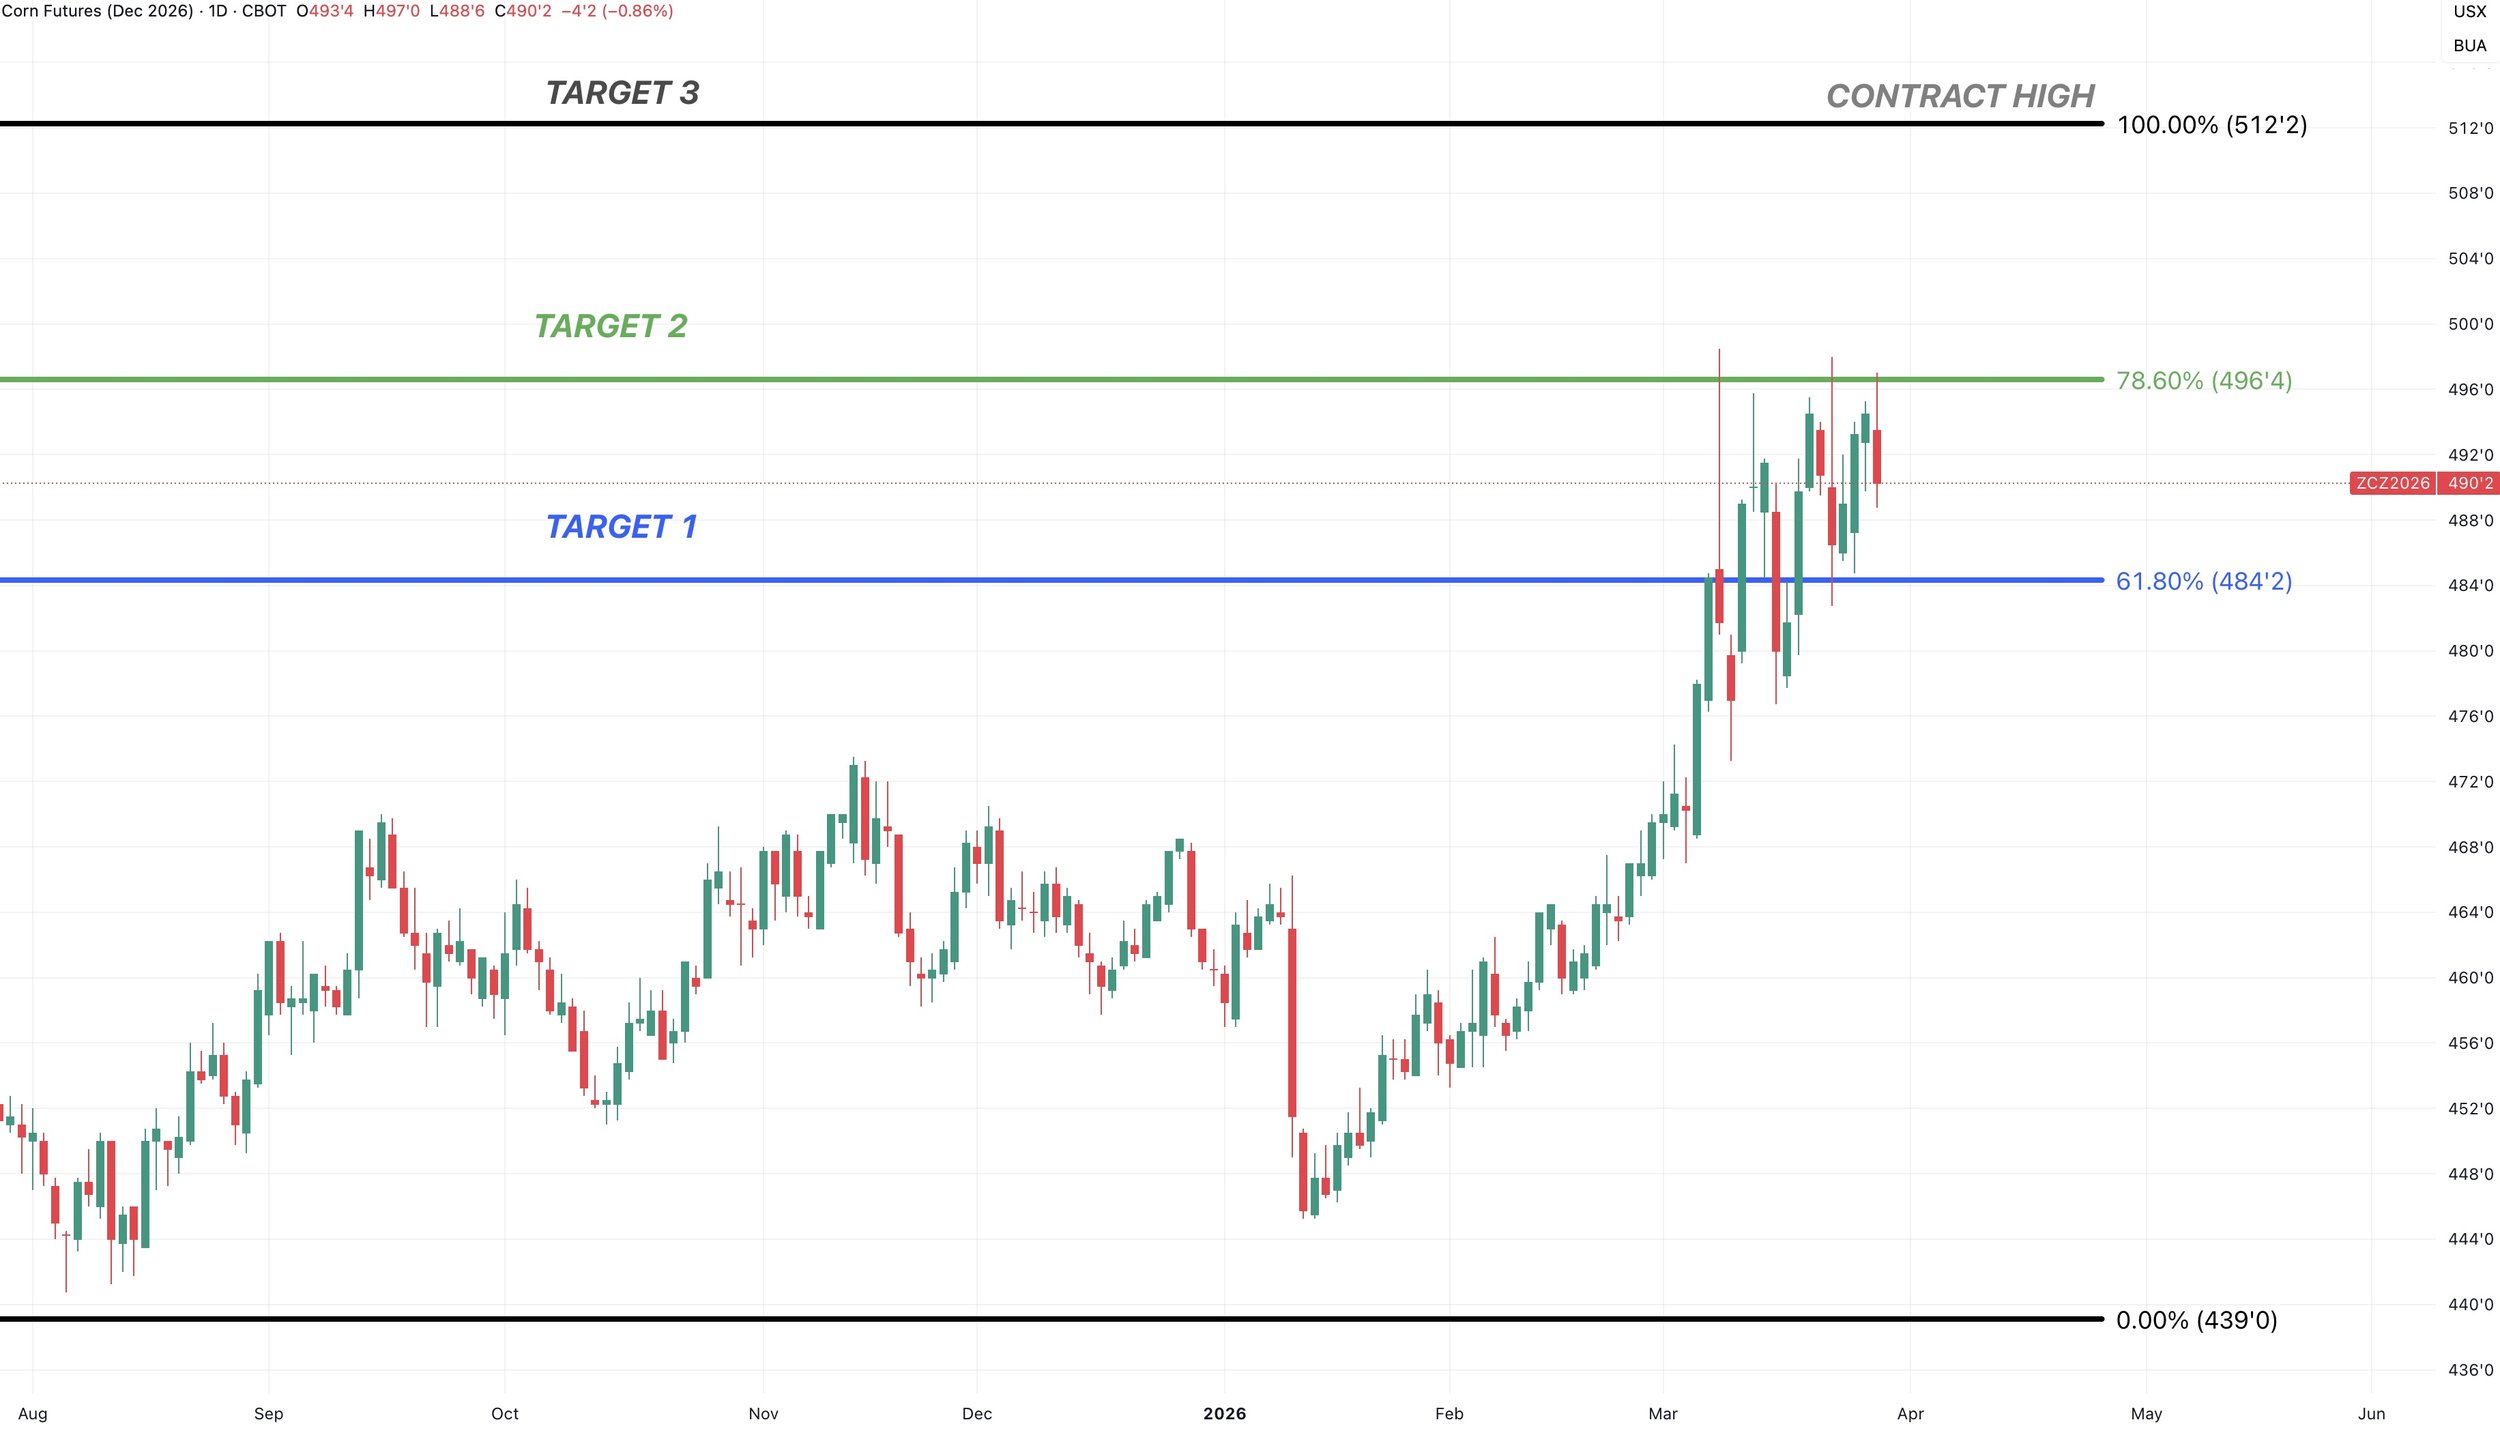
Here is a weekly chart for reference.
We tagged the 78.6% level up to contract highs again.
That same level is the big gap we left on the chart.
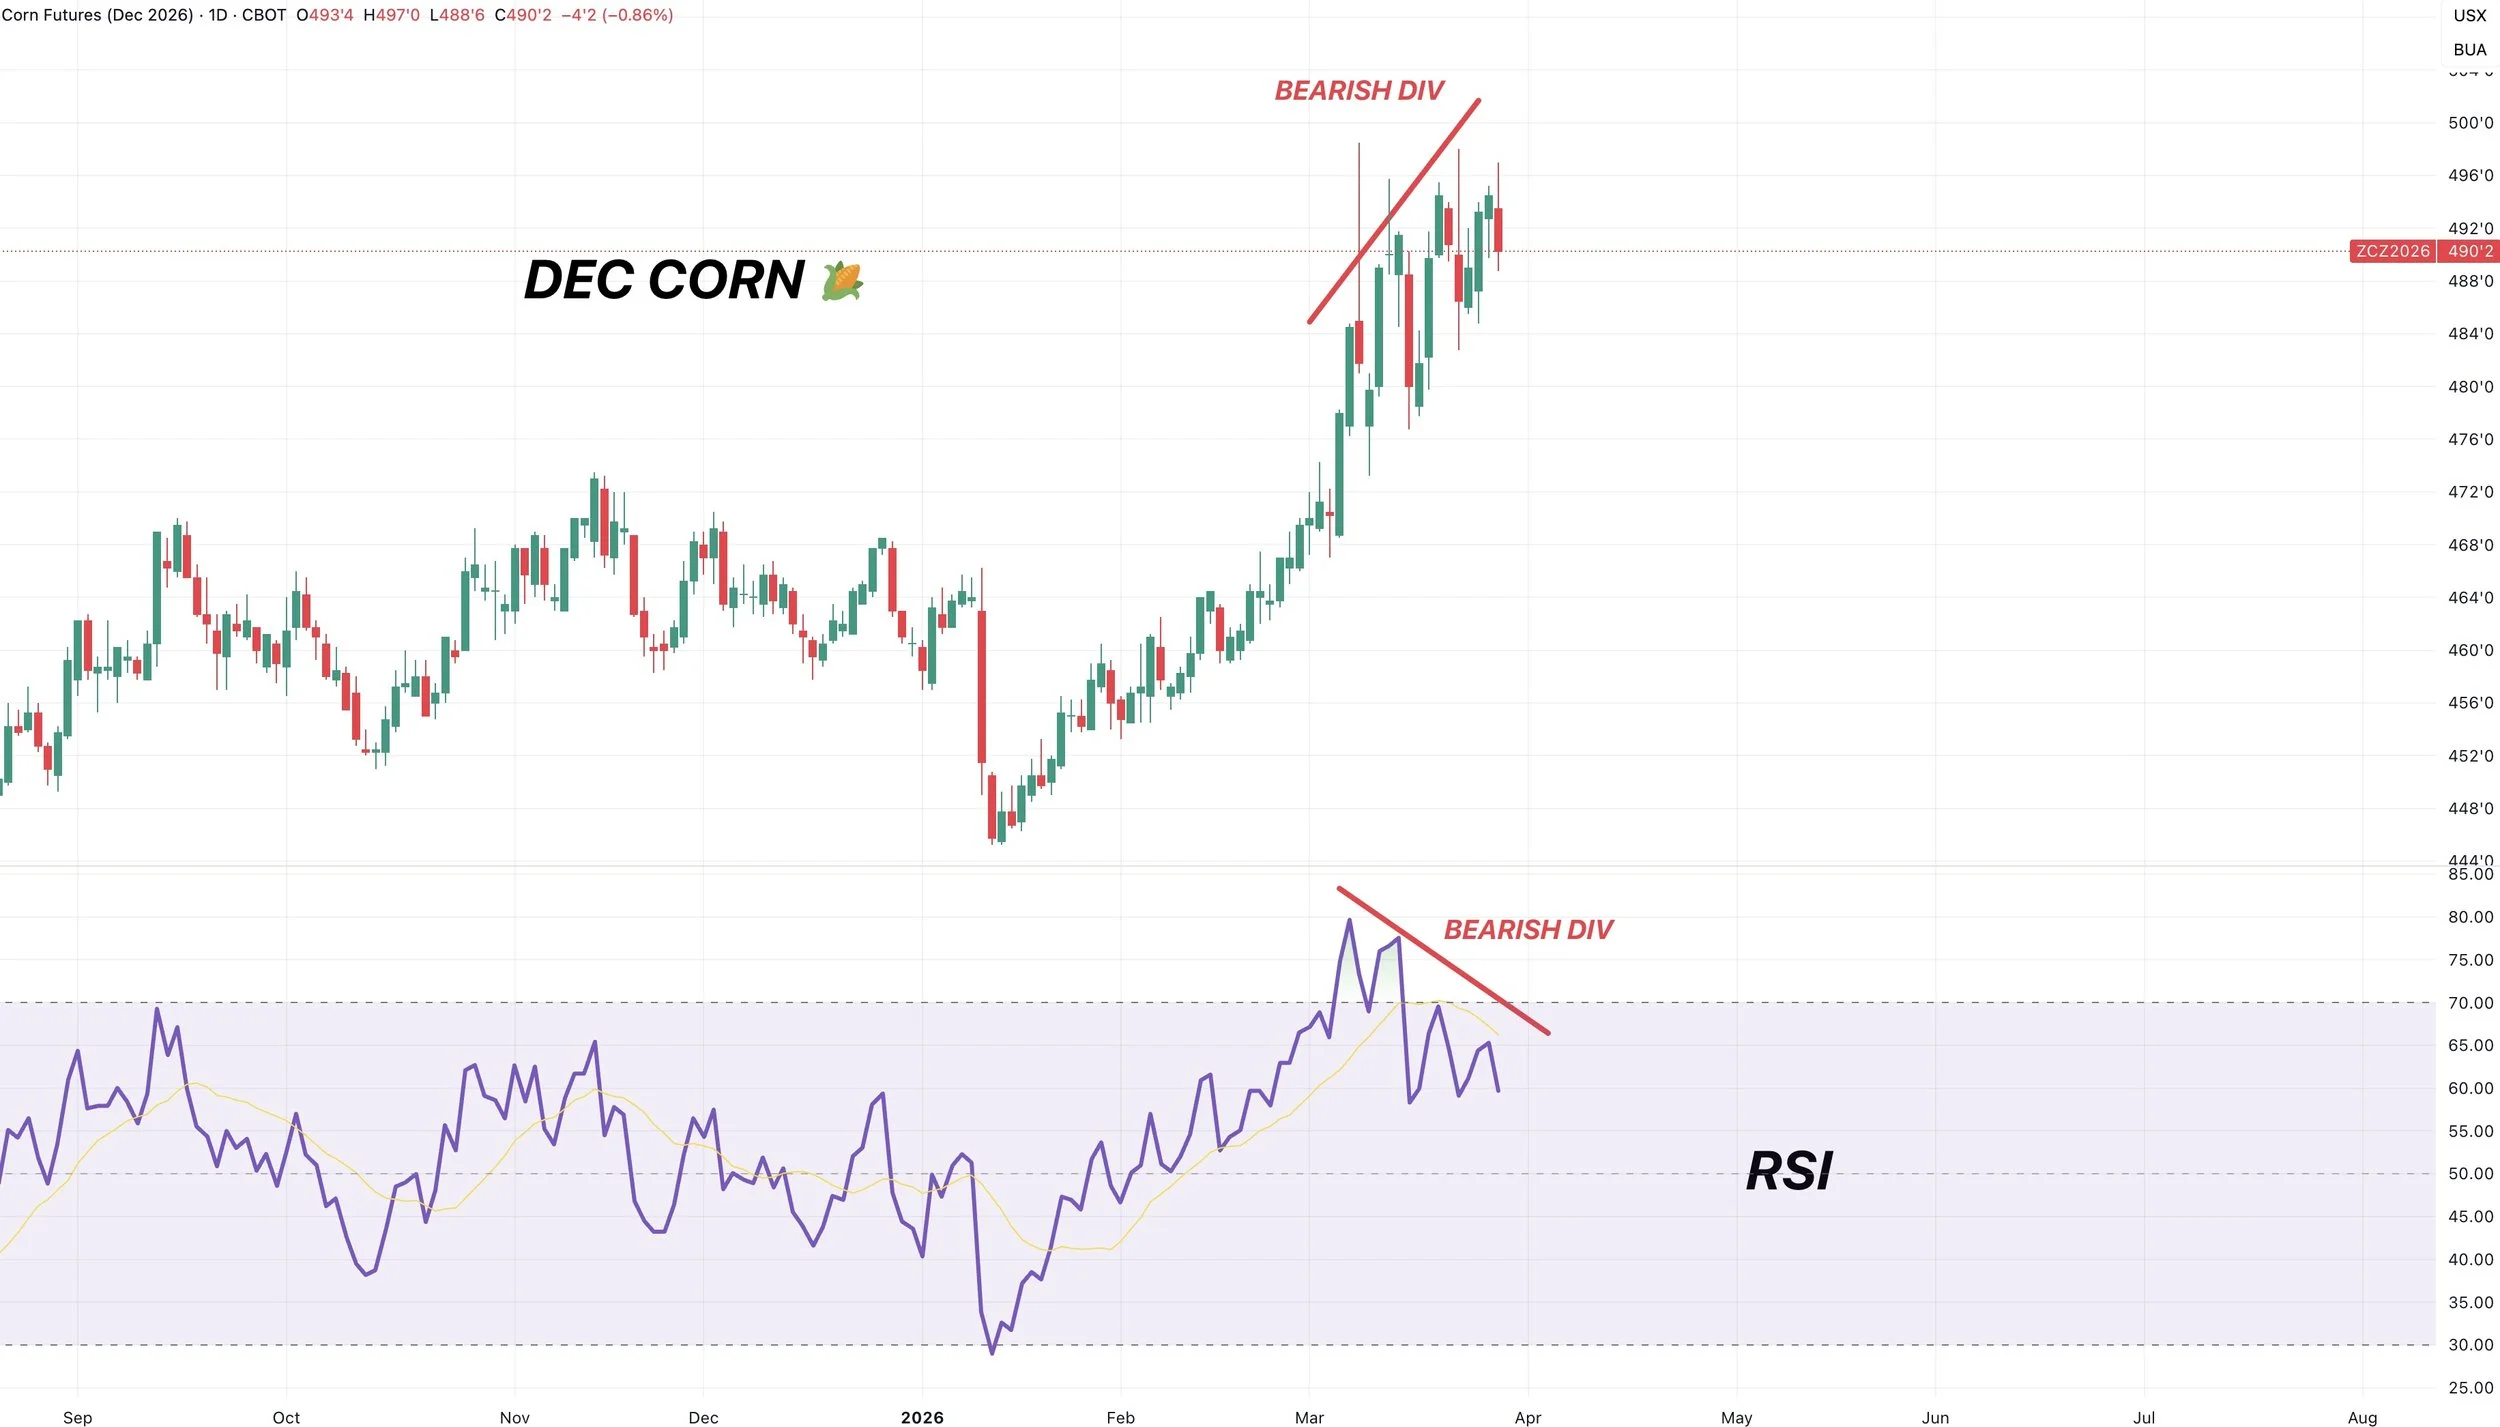
Bearish Divergence:
This makes me nervous and is a reason I'd be looking to defend this rally soon.
All contracts in corn are showing bearish divergence on the RSI.
Prices are pushing higher, the RSI is not.
That doesn’t mean we have to fall apart tomorrow.
Can we go higher? Absolutely.
It's simply a warning sign that we are starting to lose that upside momentum.
Here is Dec corn for reference.
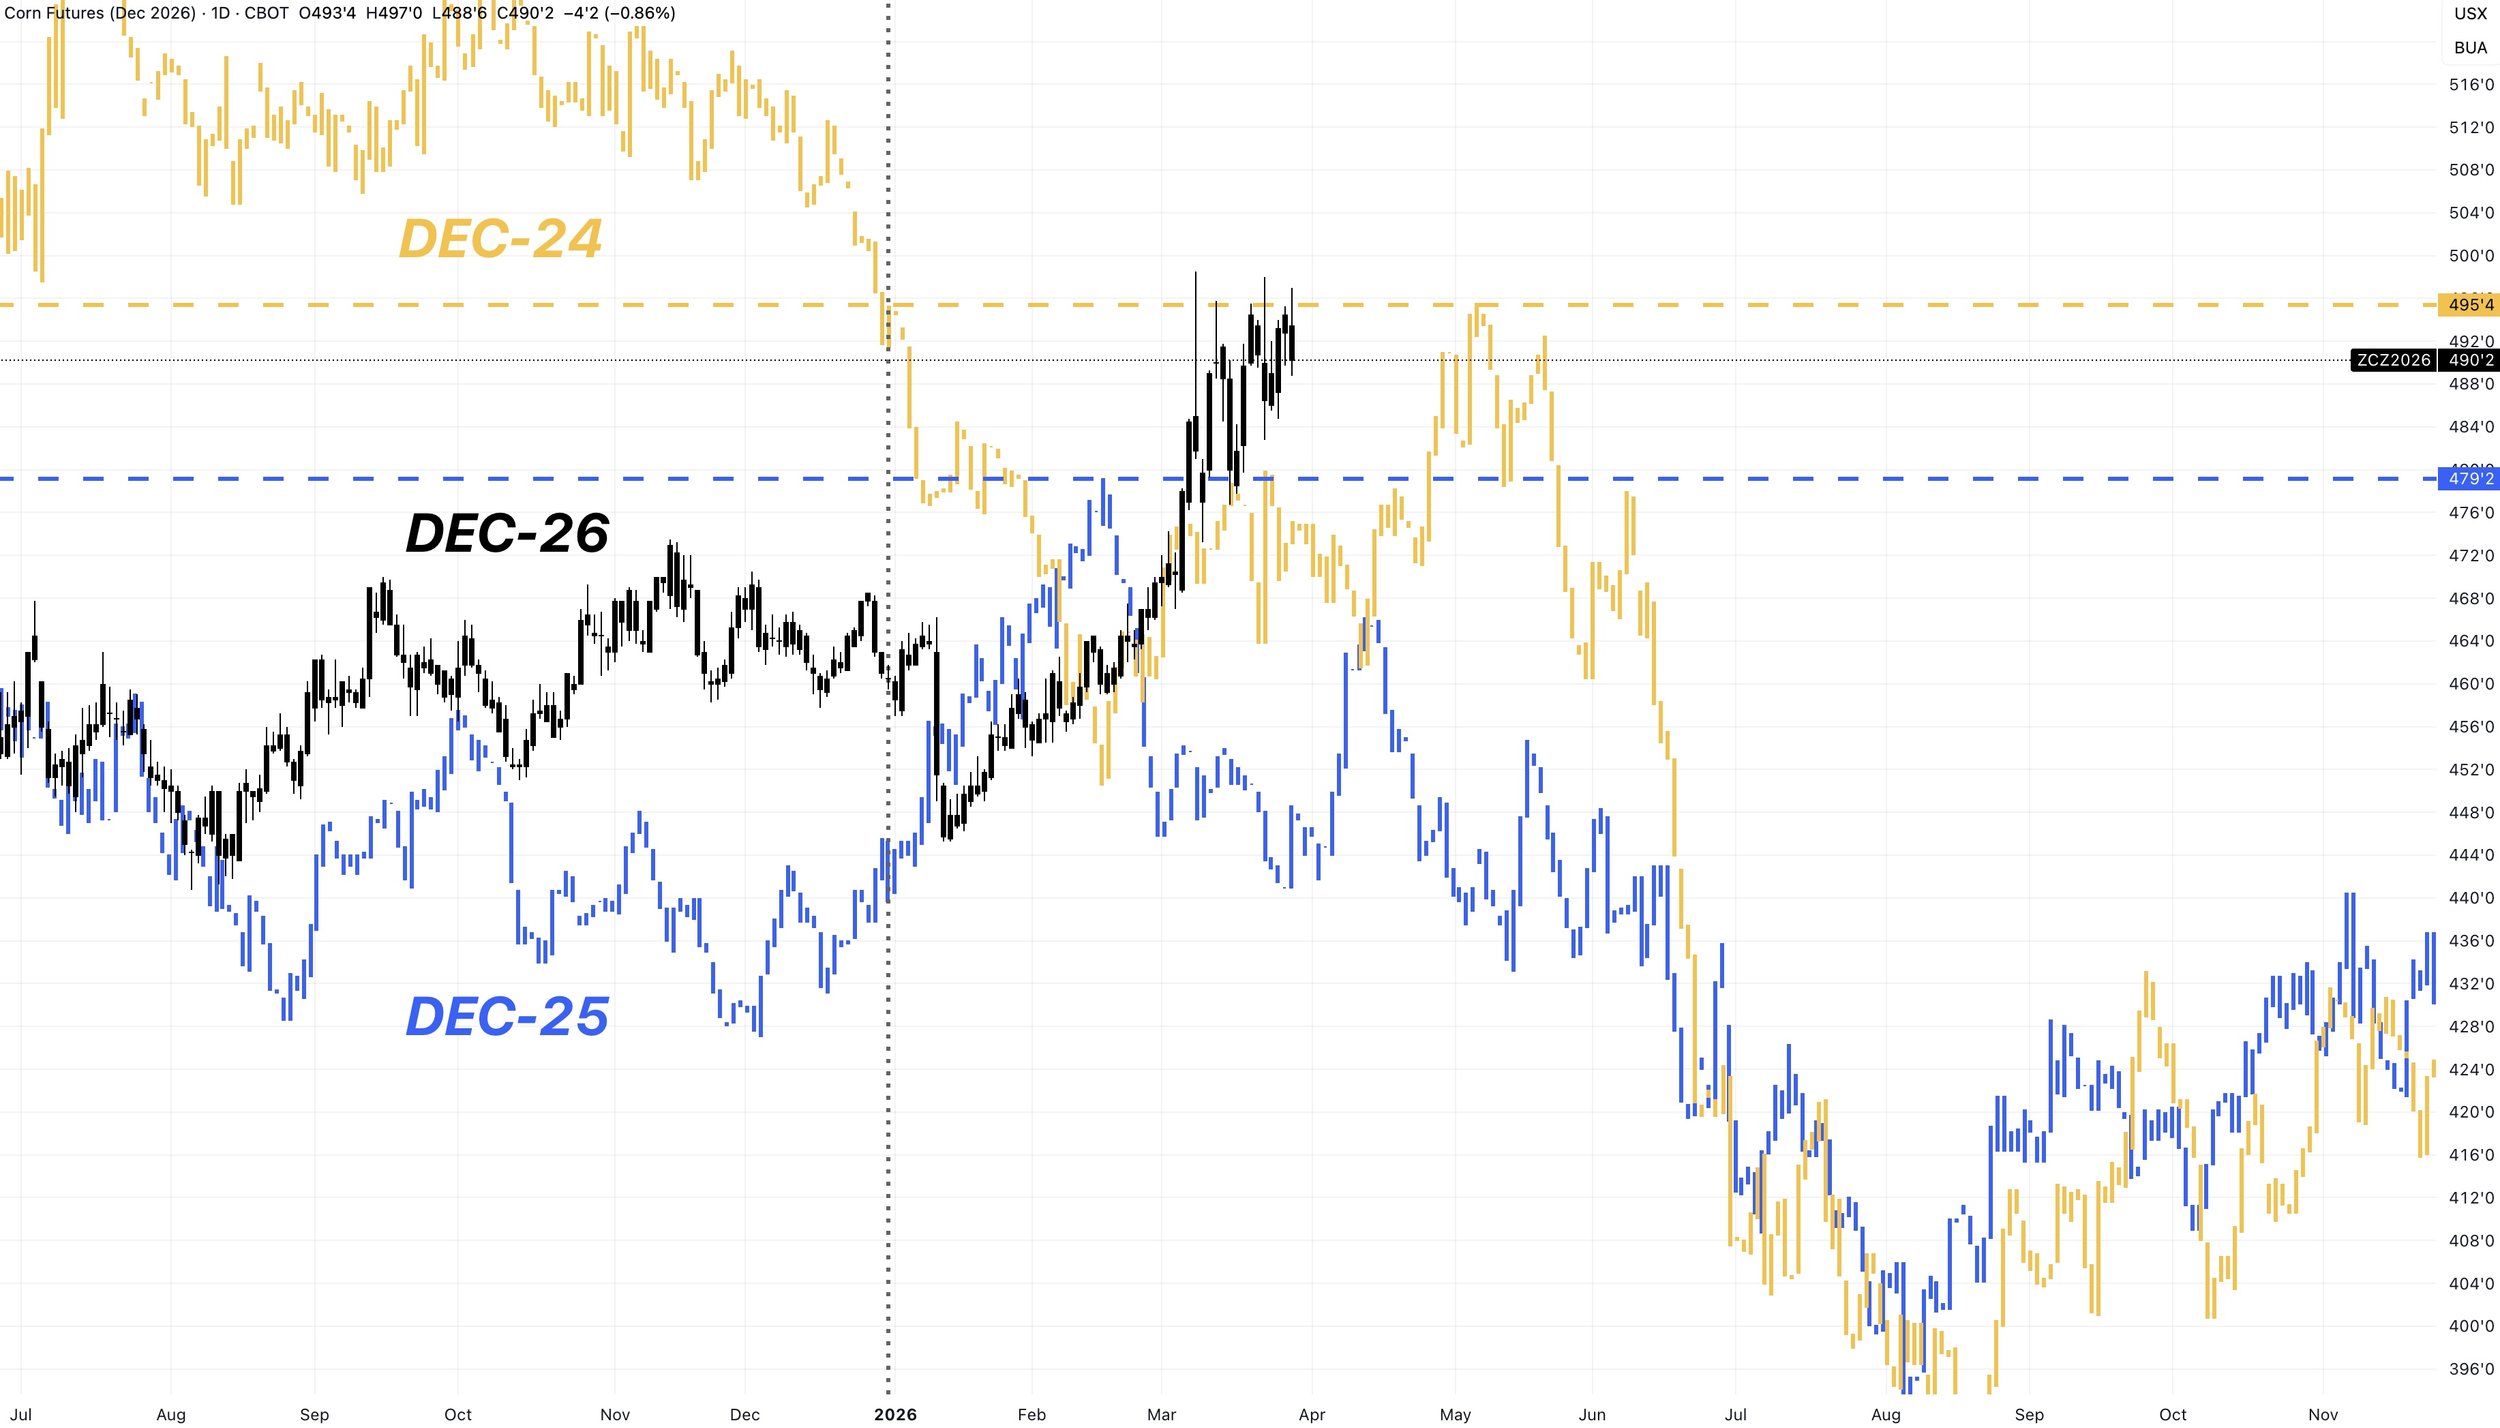
New Crop 2 Year Highs:
As I've stated in my last few updates, Dec corn is higher than it was all of 2025 and 2024.
2 year highs.
Is the upside potential higher than it was the last 2 years?
Yes it is. No doubt.
Even though there is potential, this is still not the worst spot to start to do something. Considering you haven’t had a chance at these levels in pretty much 800 days aside from that short time we spent up here in May 2024.
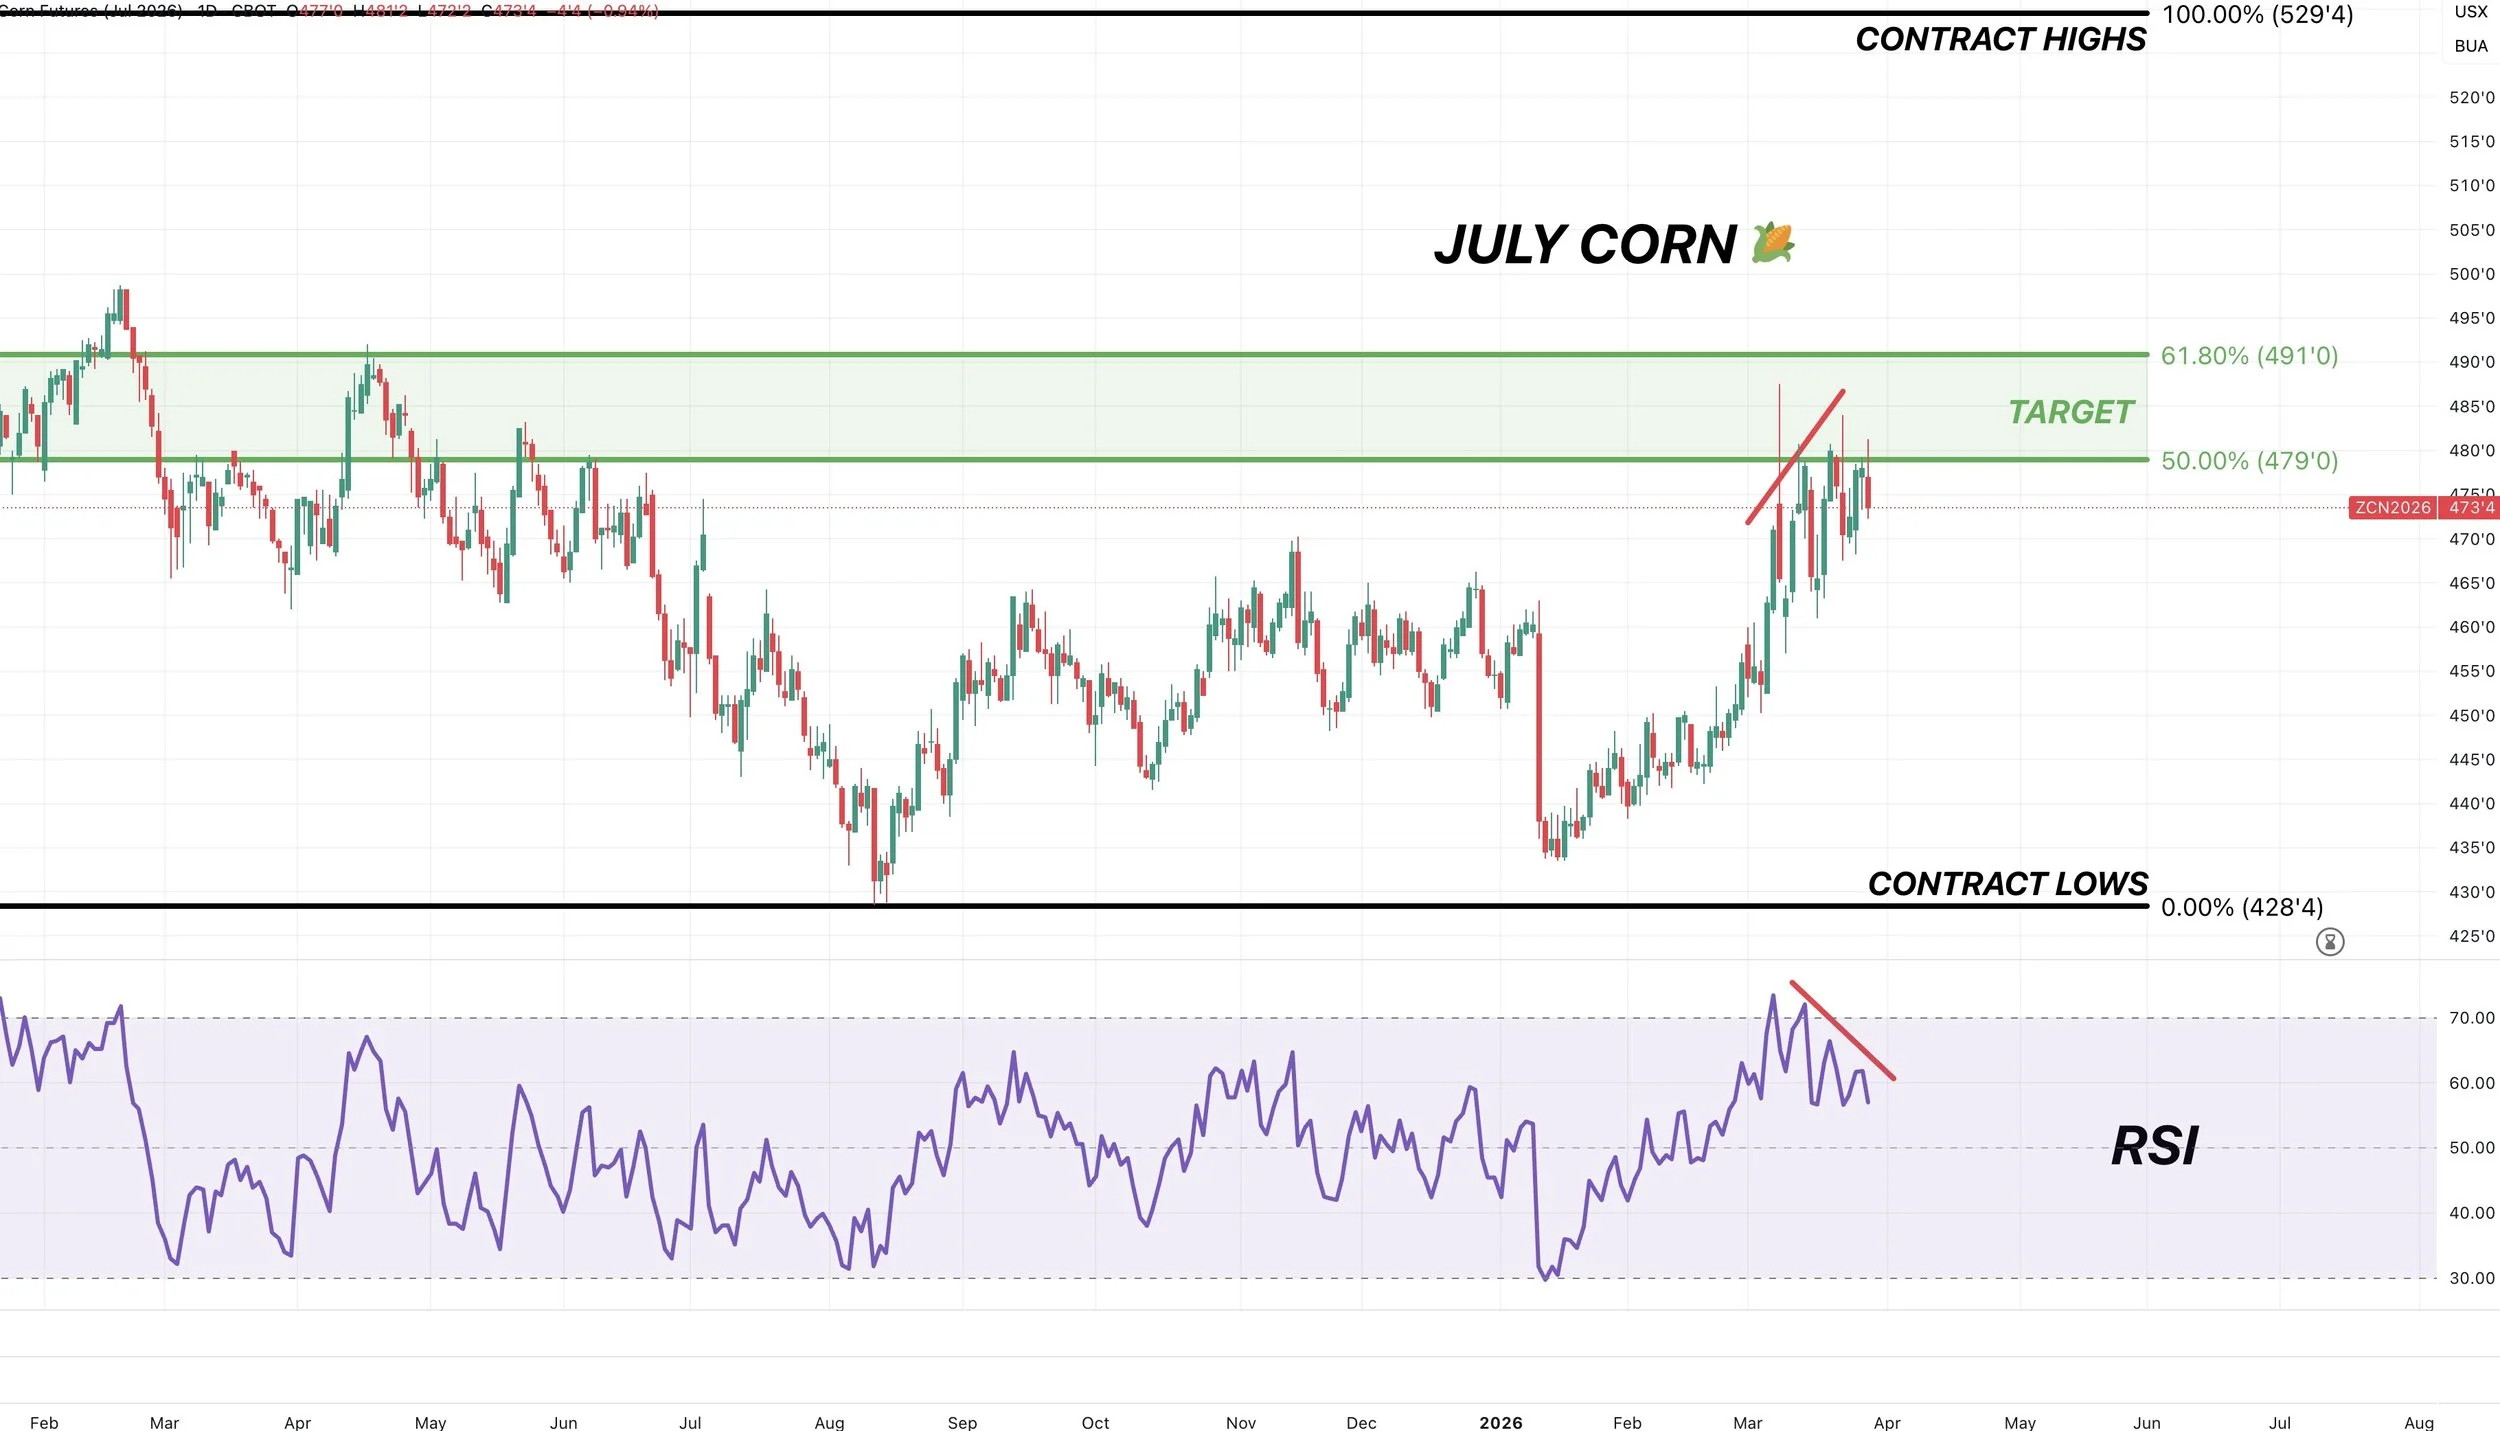
July Corn Chart:
July corn is entering it's golden zone from contract lows up to contract highs.
A common area to stall.
We can of course push higher, but this is a good spot to look to start to reward or defend in my opinion.
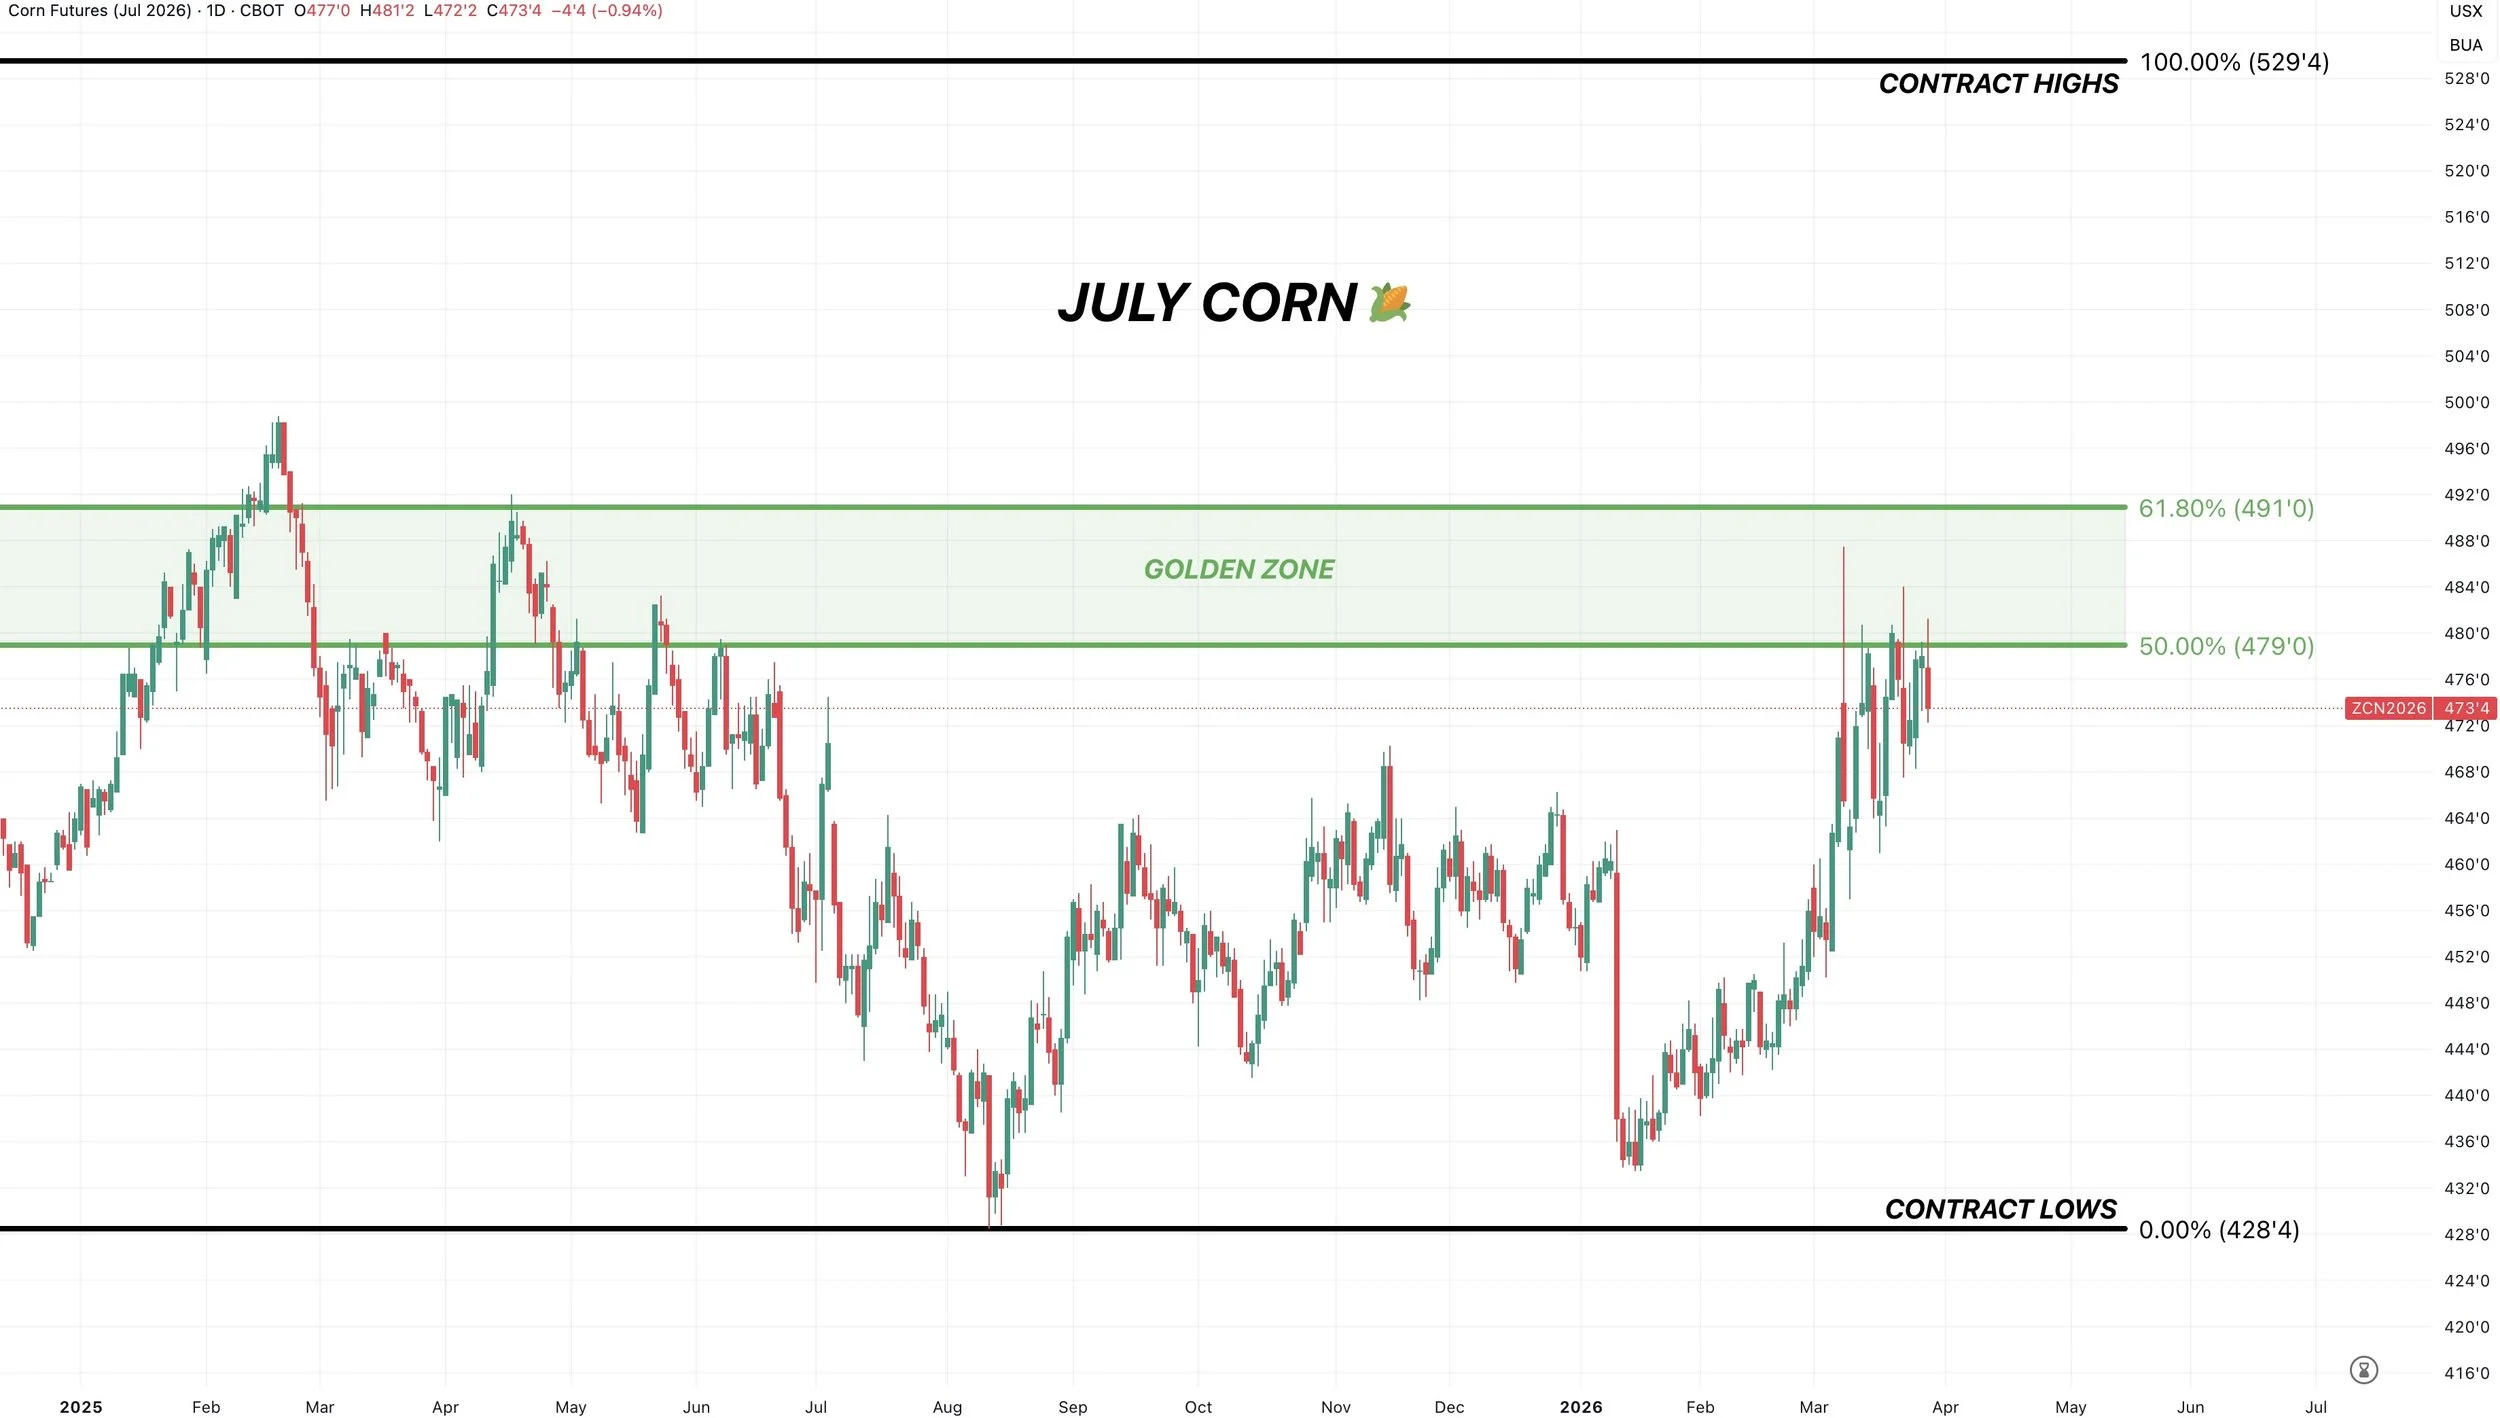
Like Dec corn, July is also showing bearish divergence on the RSI.
Again doesn’t mean we have to collapse right away or at all.
It's just a potential warning sign the upside momentum is starting to get weaker.
A reason to have some caution.
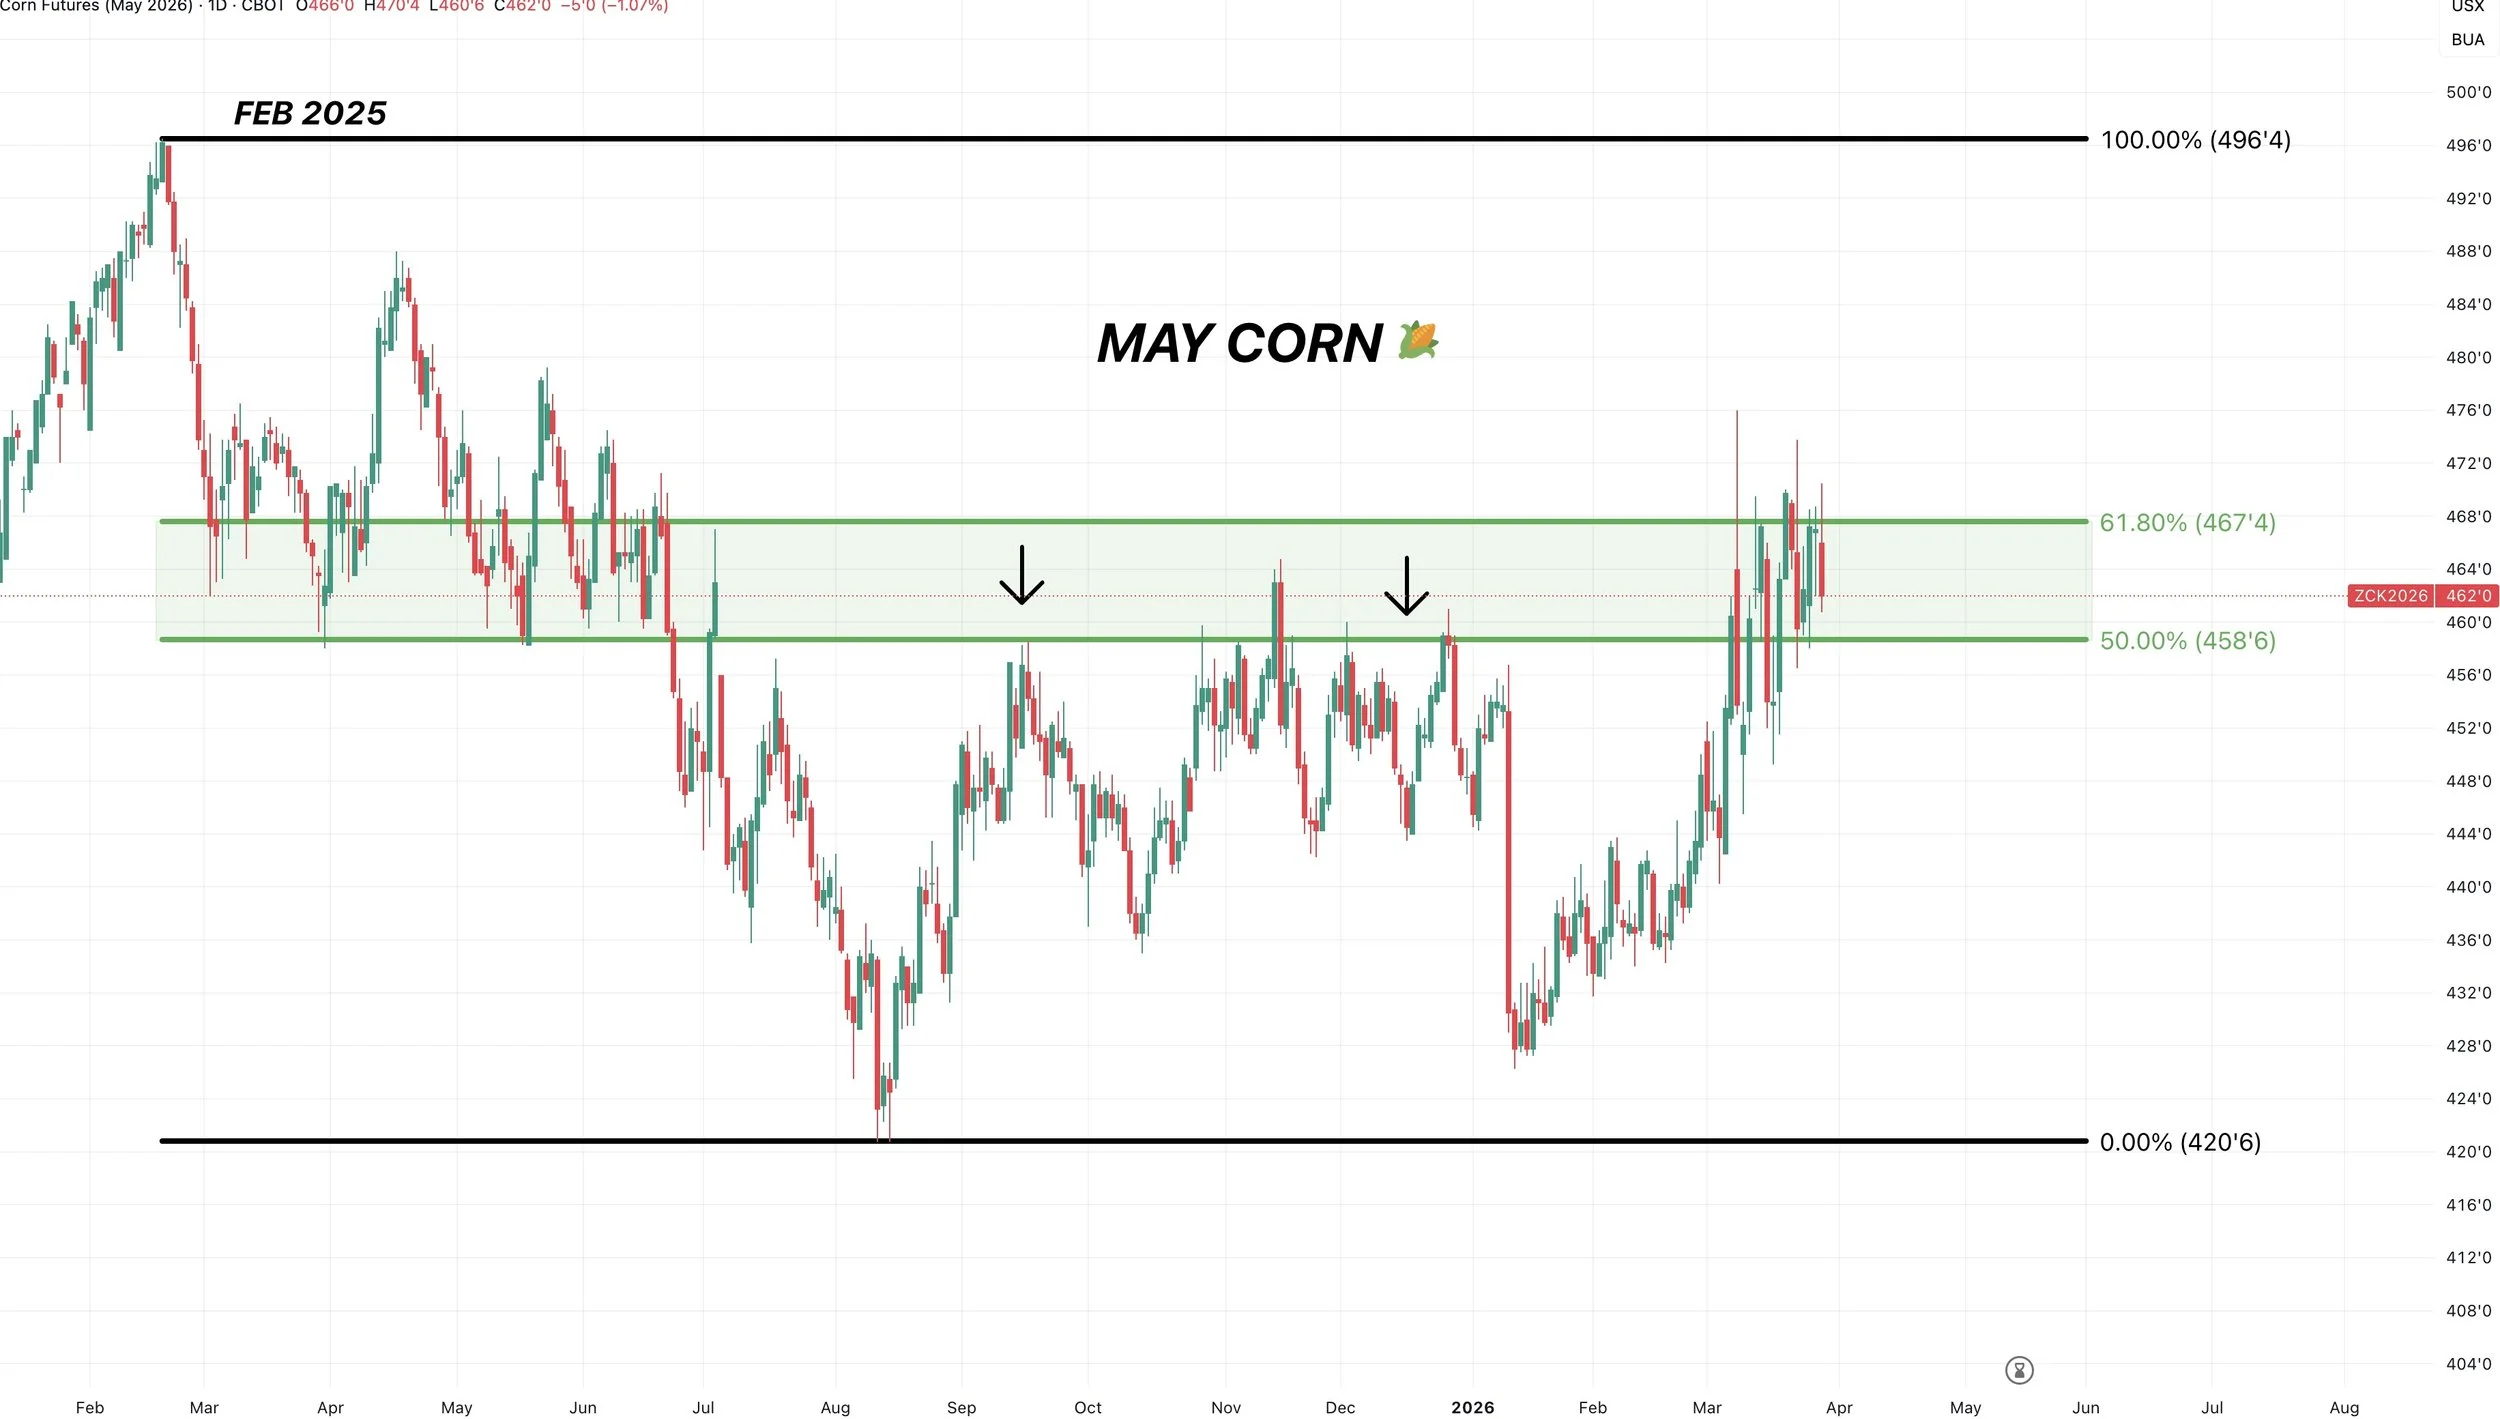
May Corn Chart:
If you take the contract lows up to the Feb 2025 highs, the golden zone comes in at $4.58 to $4.67
Which is the area we are chopping around in right now.
Not the worst area to reward or defend.
If you notice we struggled at the 50% level on that harvest rally.
We are now struggling with the 61.8% level.
Soybeans
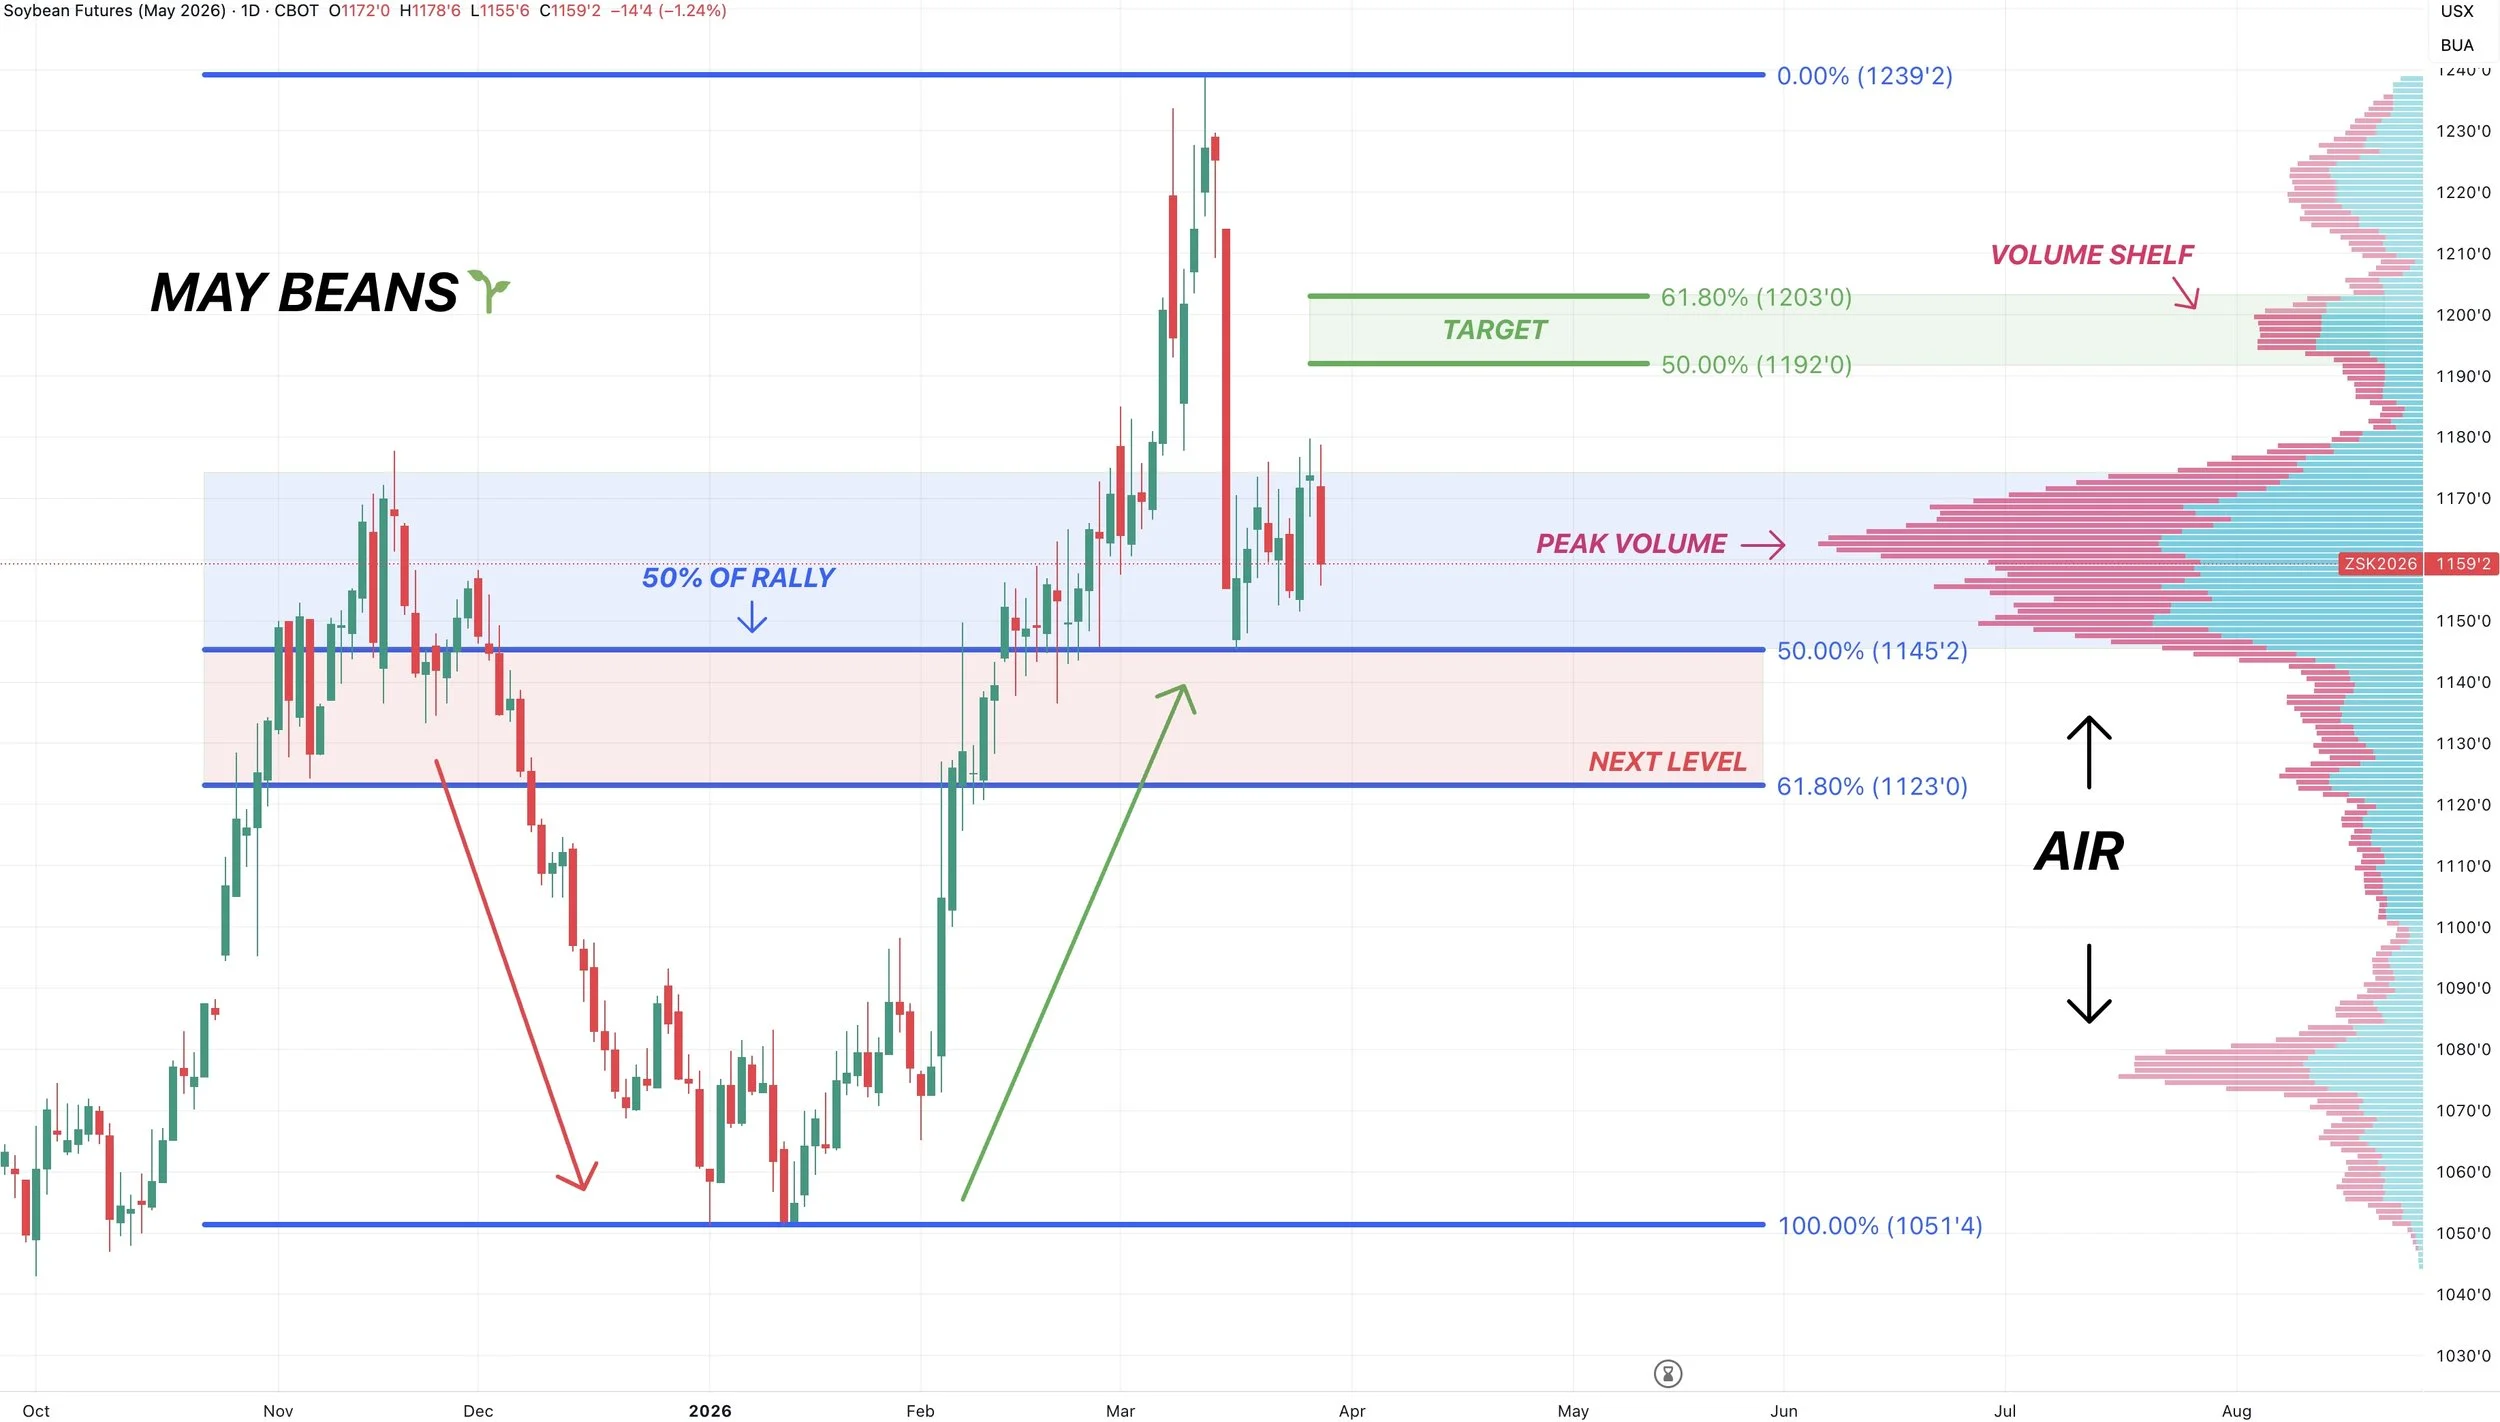
May Beans Chart:
Not much to update here.
Level we need to hold is $11.45
That is key support. It's peak volume and 50% of the entire rally.
Finding some life here makes sense, but if we break below it likely sparks a leg lower.
The next level would be $11.23 which is 61.8% of the entire rally.
Still looking to reward a bounce into the green box if it comes.
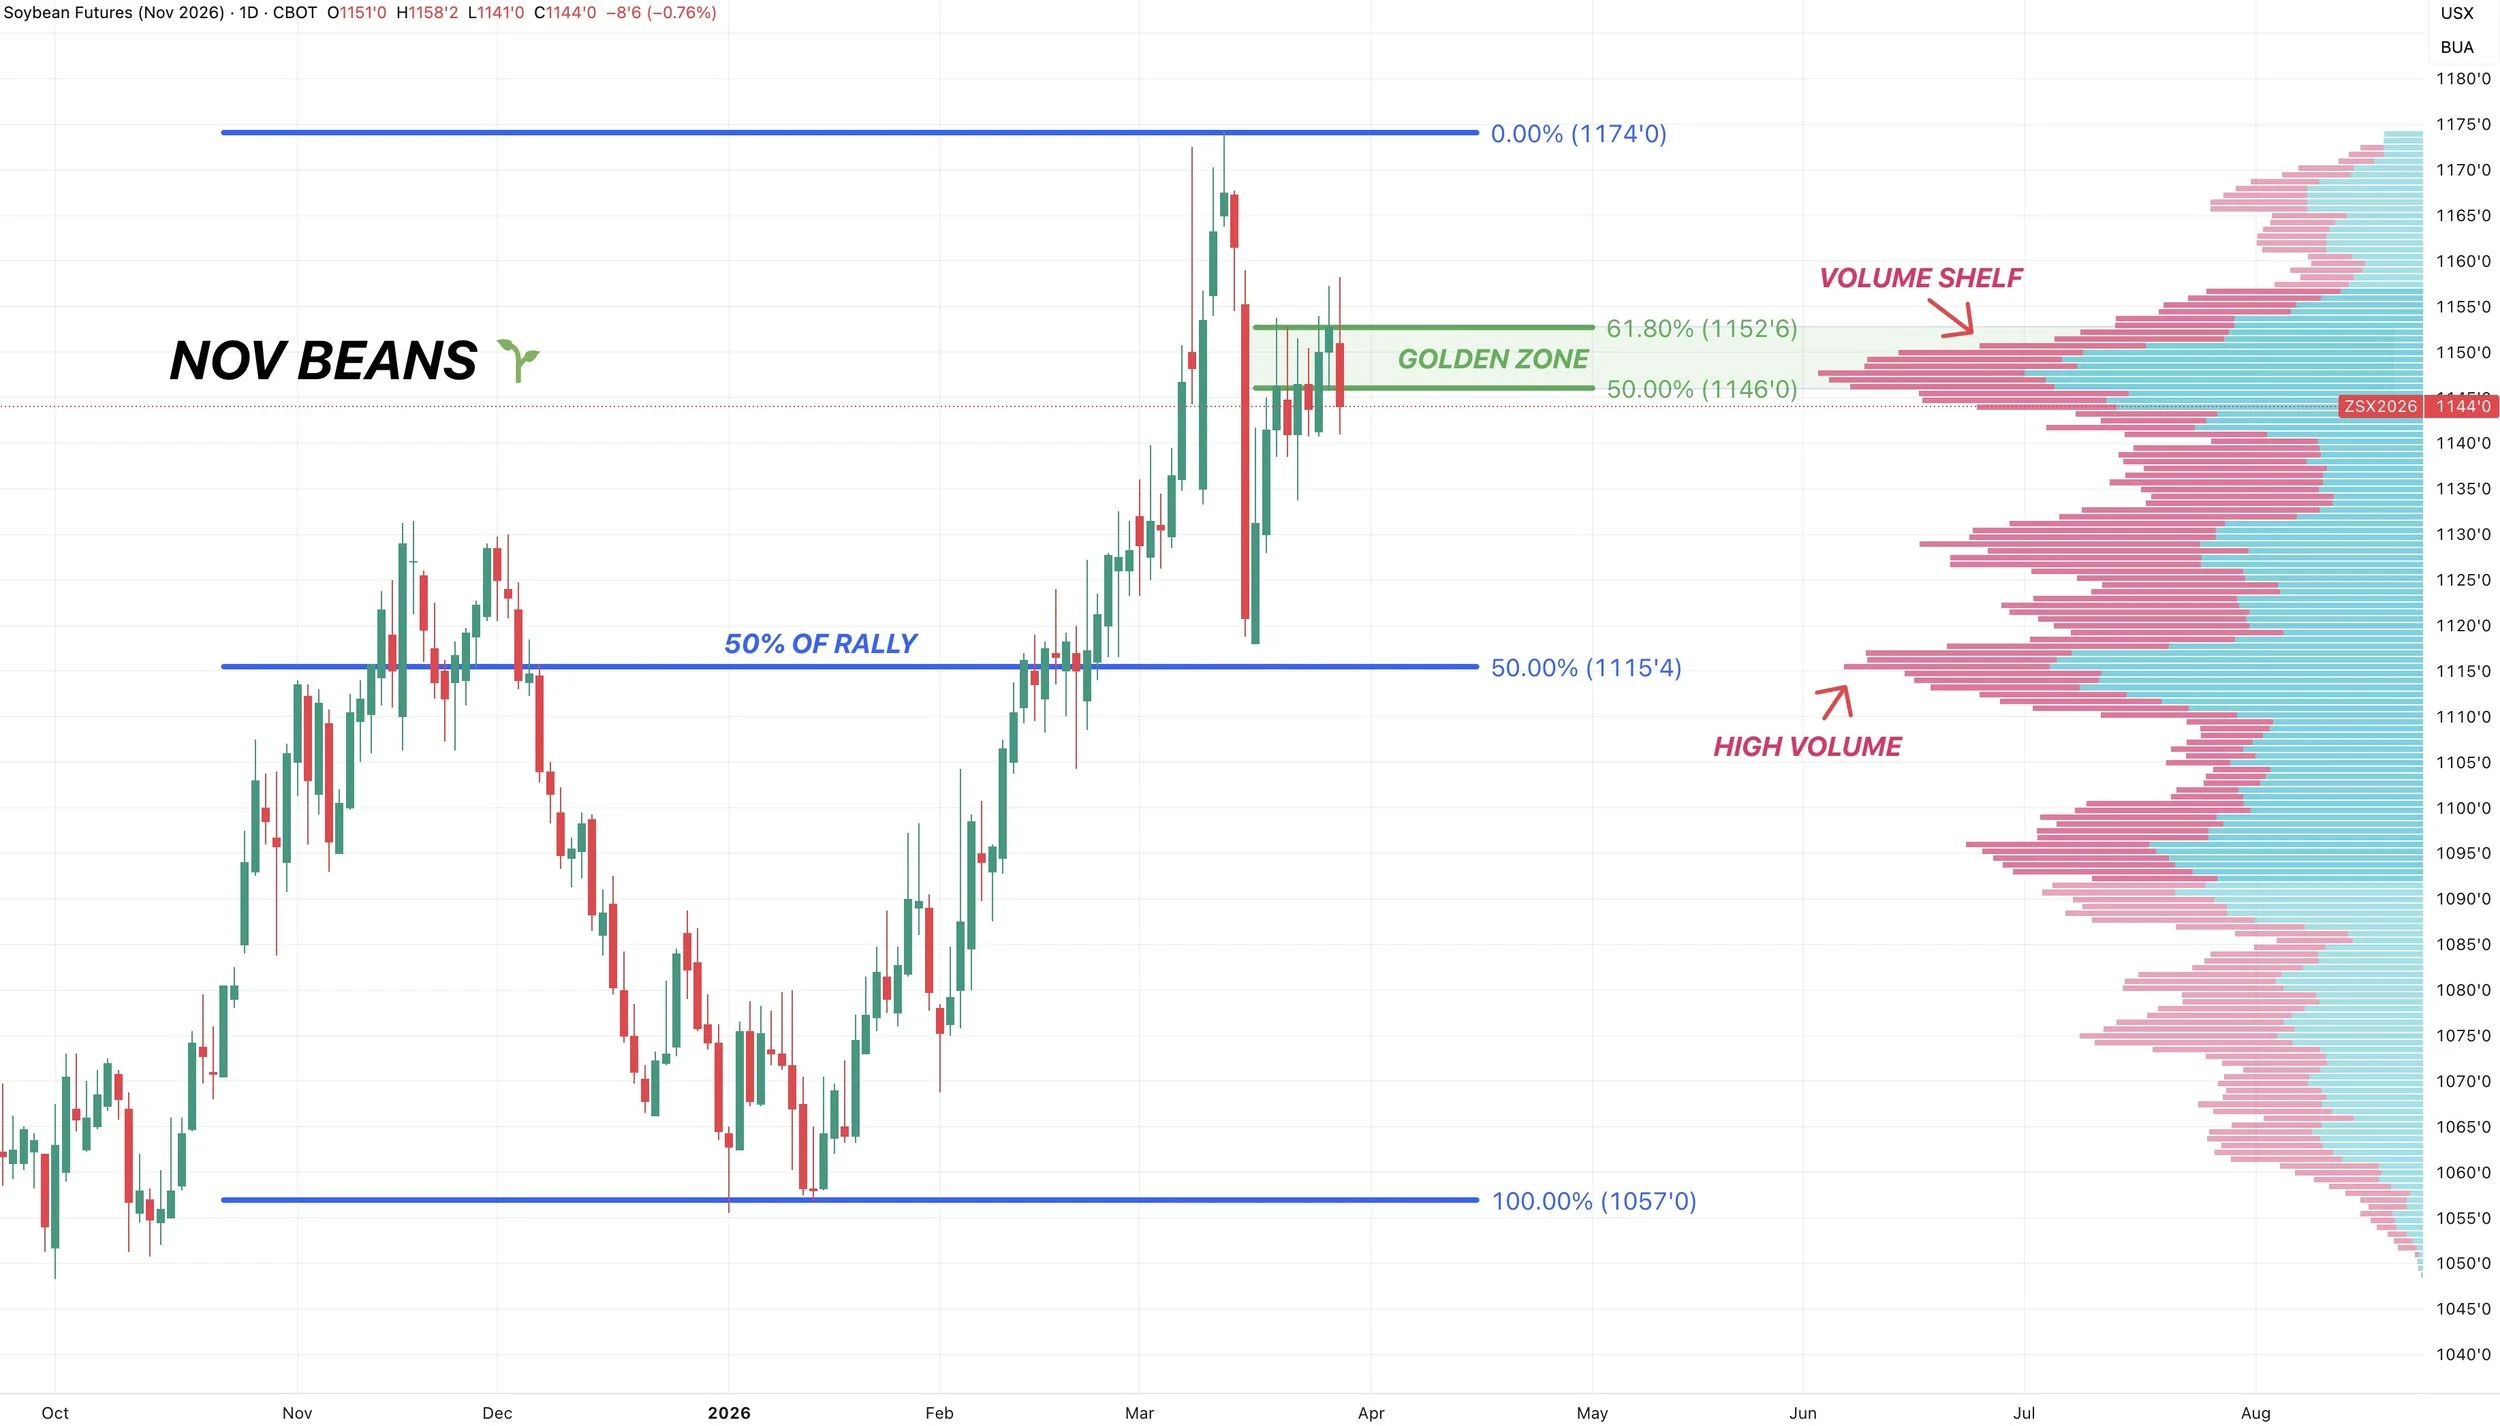
Nov Beans Chart:
Struggling right in the golden zone and where we issued that signal after clawing back 61.8% of the sell off. Also at the volume shelf which can offer resistance.
This is the most common level for a relief bounce to fail.
However, if we break above this box it usually tells us we have a chance to go and test the highs.
Wheat
May KC Chart:
I don’t have much to update in wheat either.
Wheat continues to find some life with the dryness down in the plains, hence why KC has been leading vs Chicago.
We continue to bounce around in a 30 cent range.
Now at the upper end of that range.
We did post a new high close which was nice to see.
$6.00 remains the level we want to continue to hold. As there is no support under there. So trend is higher unless that level gives out.
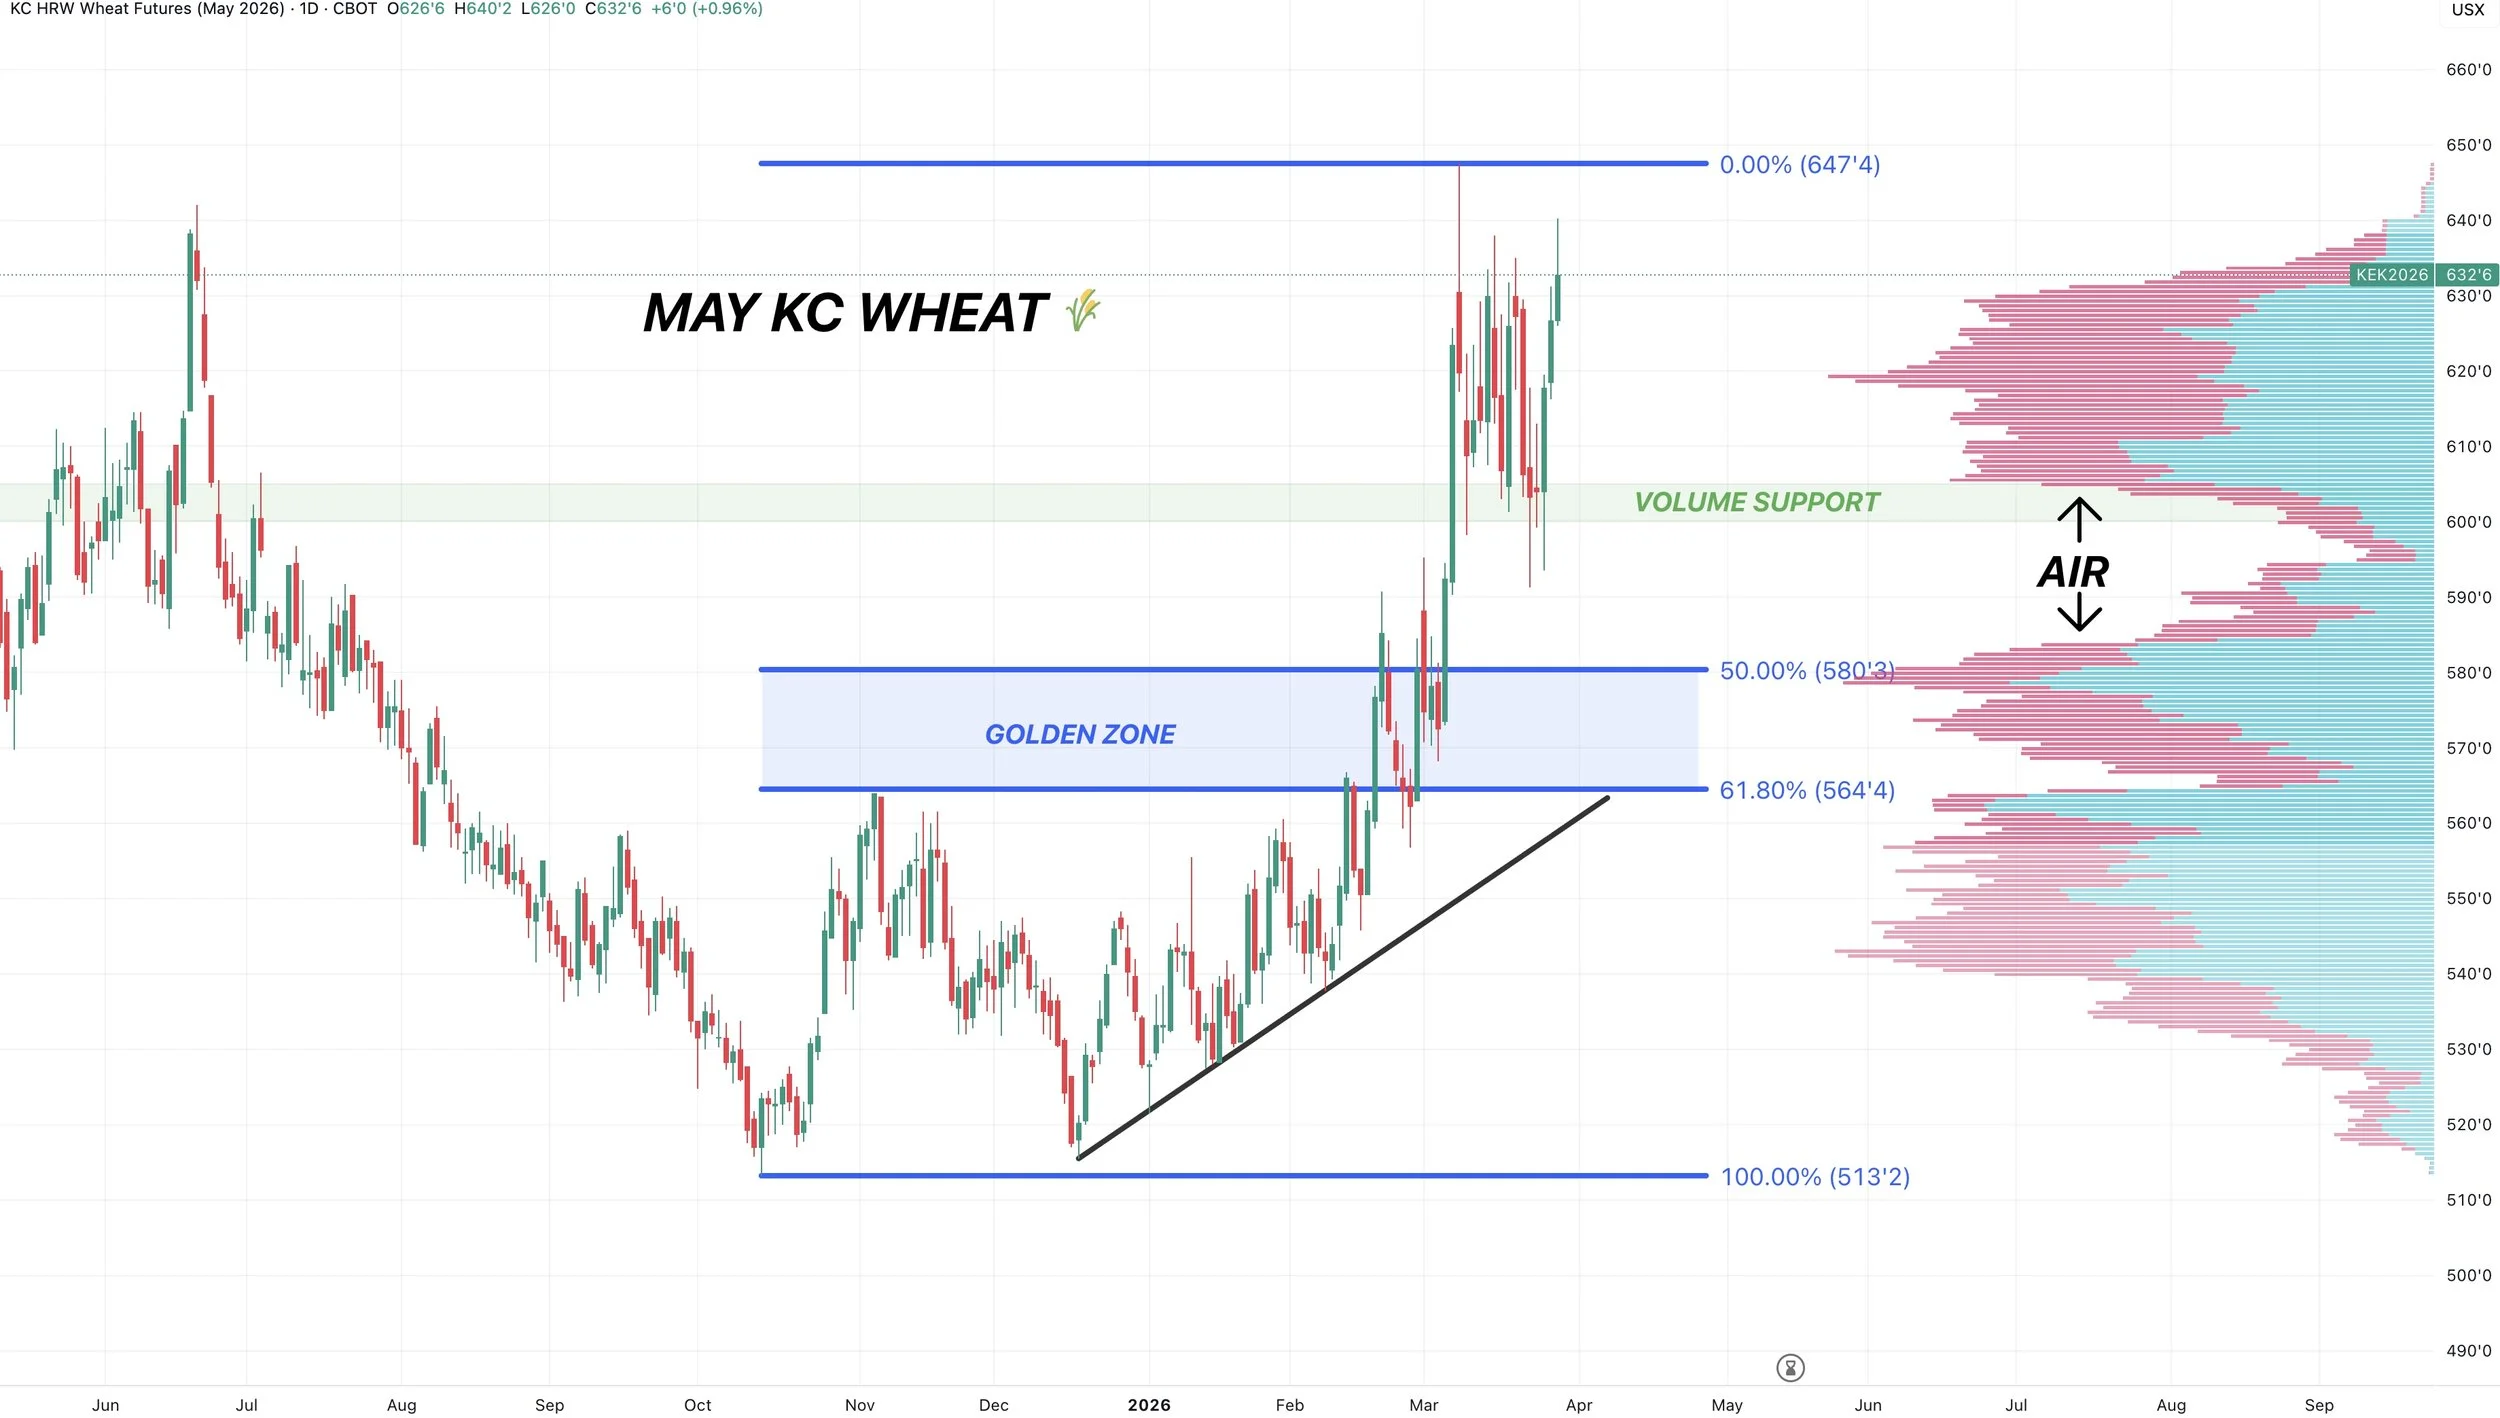
We already rewarded this rally at this level.
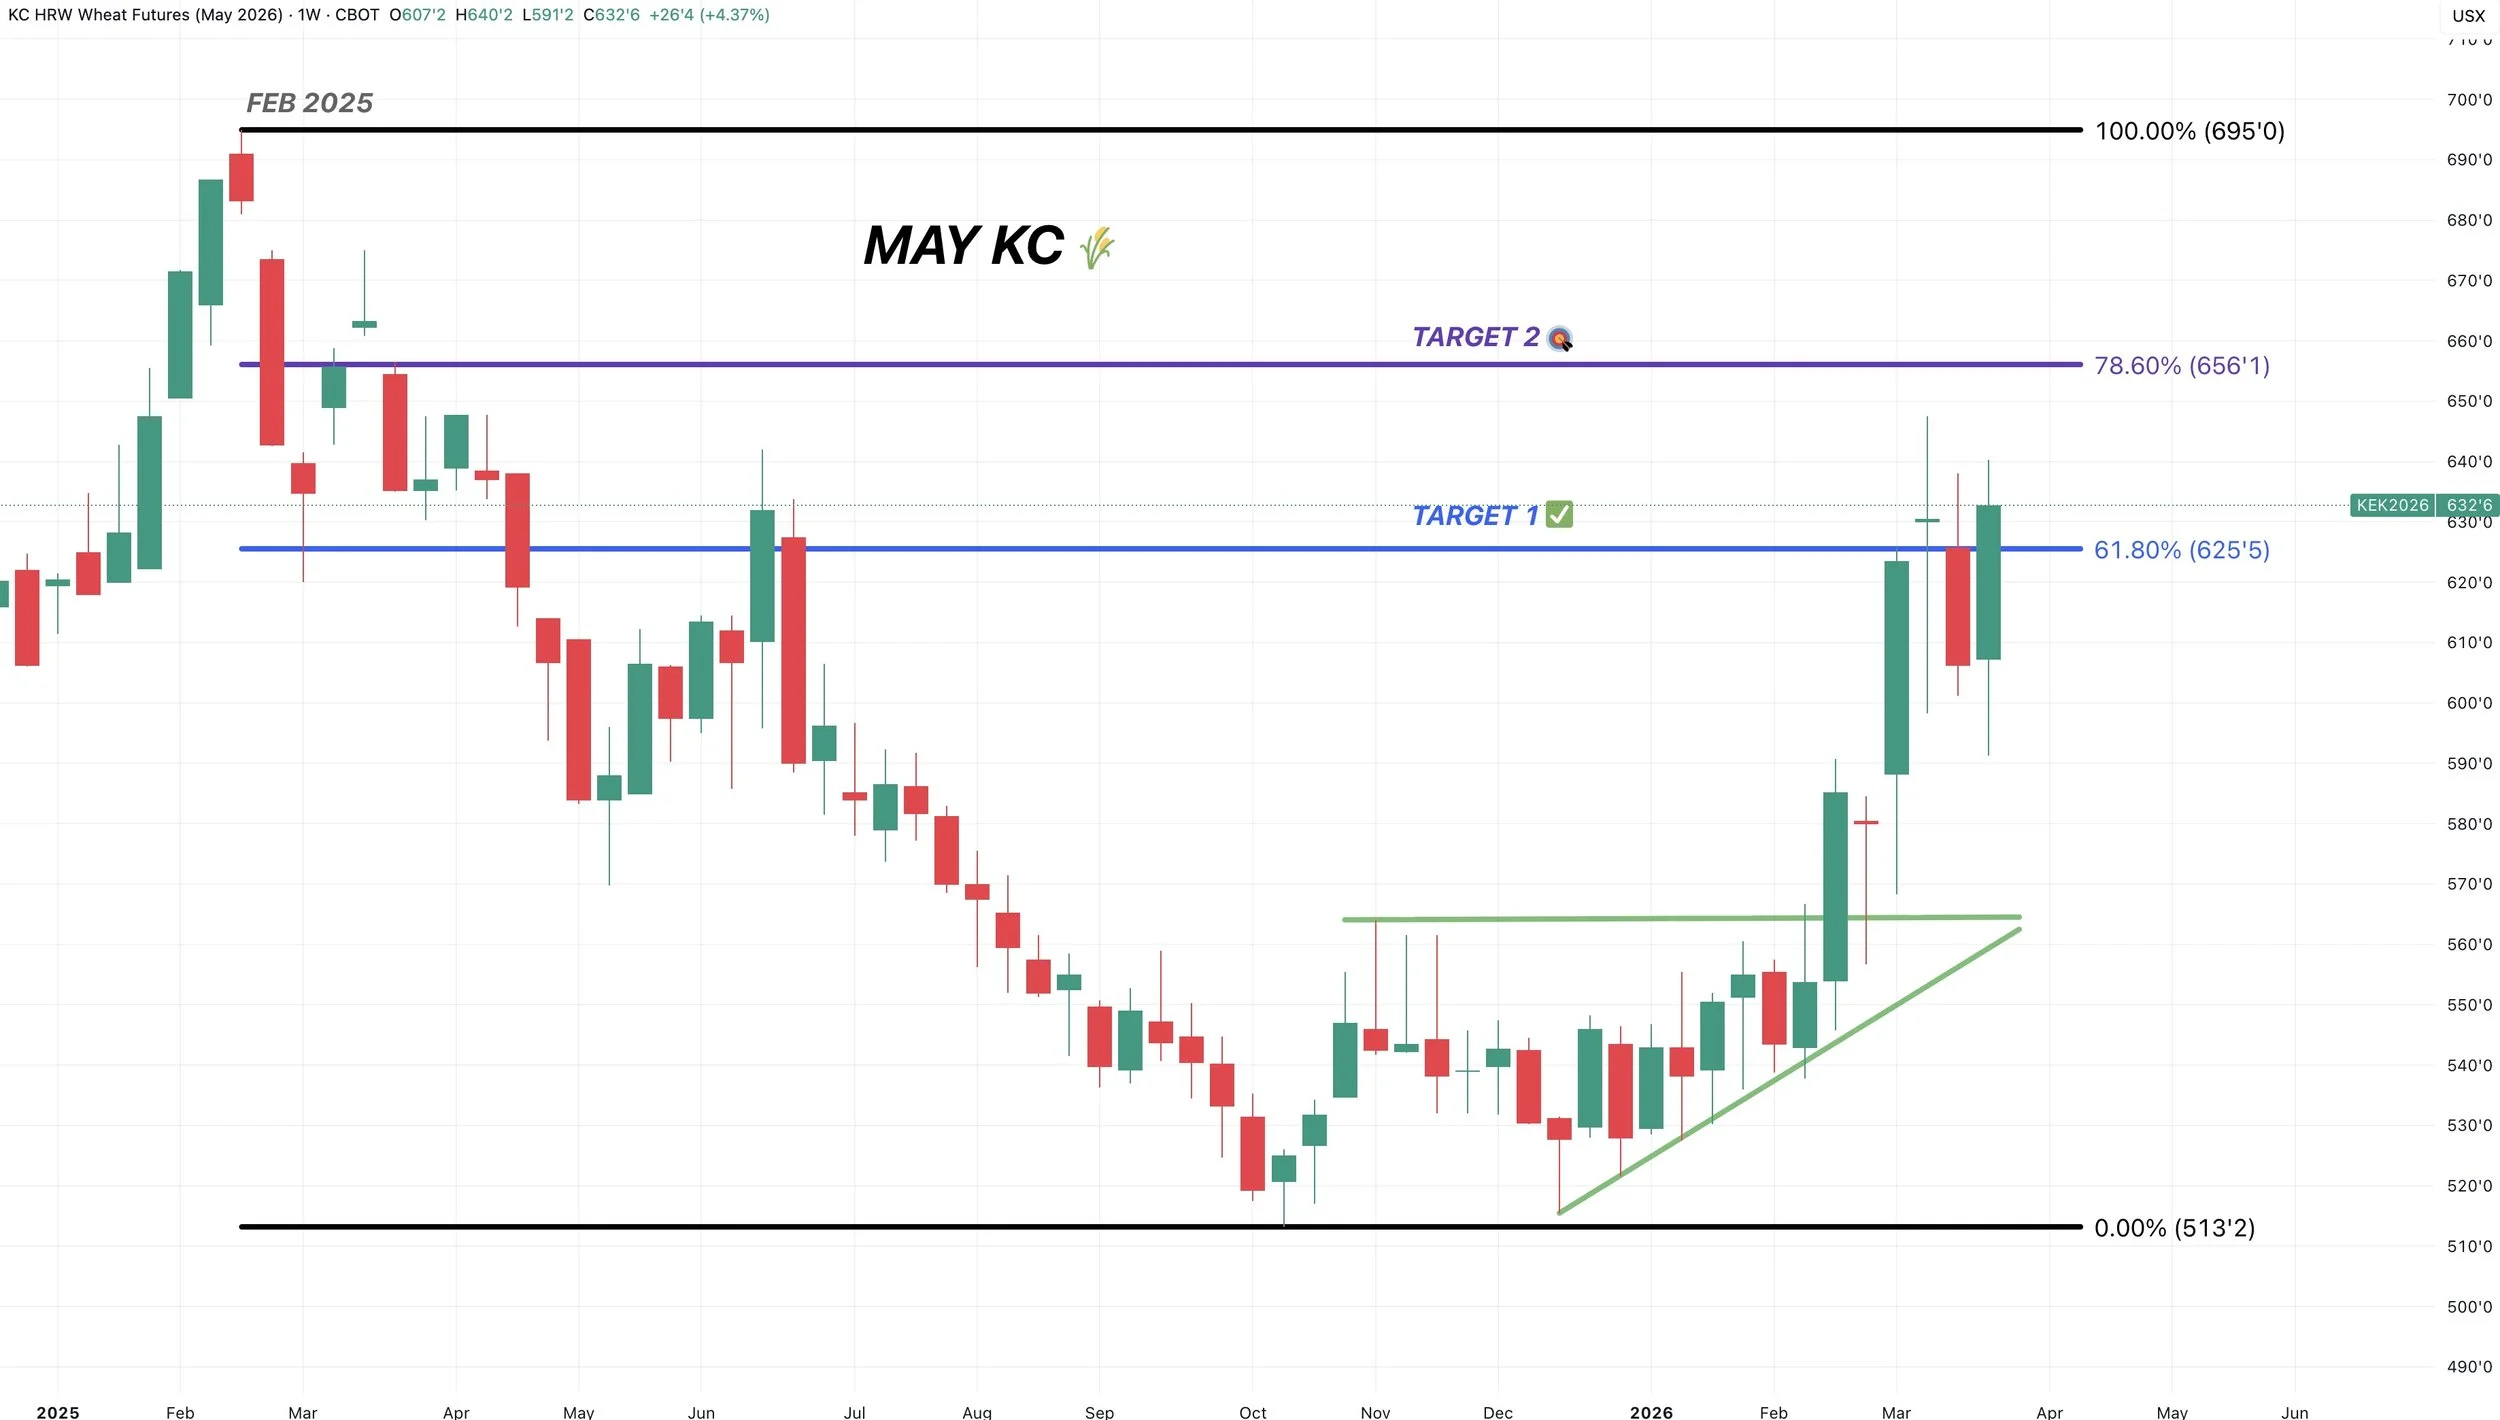
$6.55 is the next target for now but subject to change.
It's the next retracement level up to those Feb 2025 highs.
Cattle
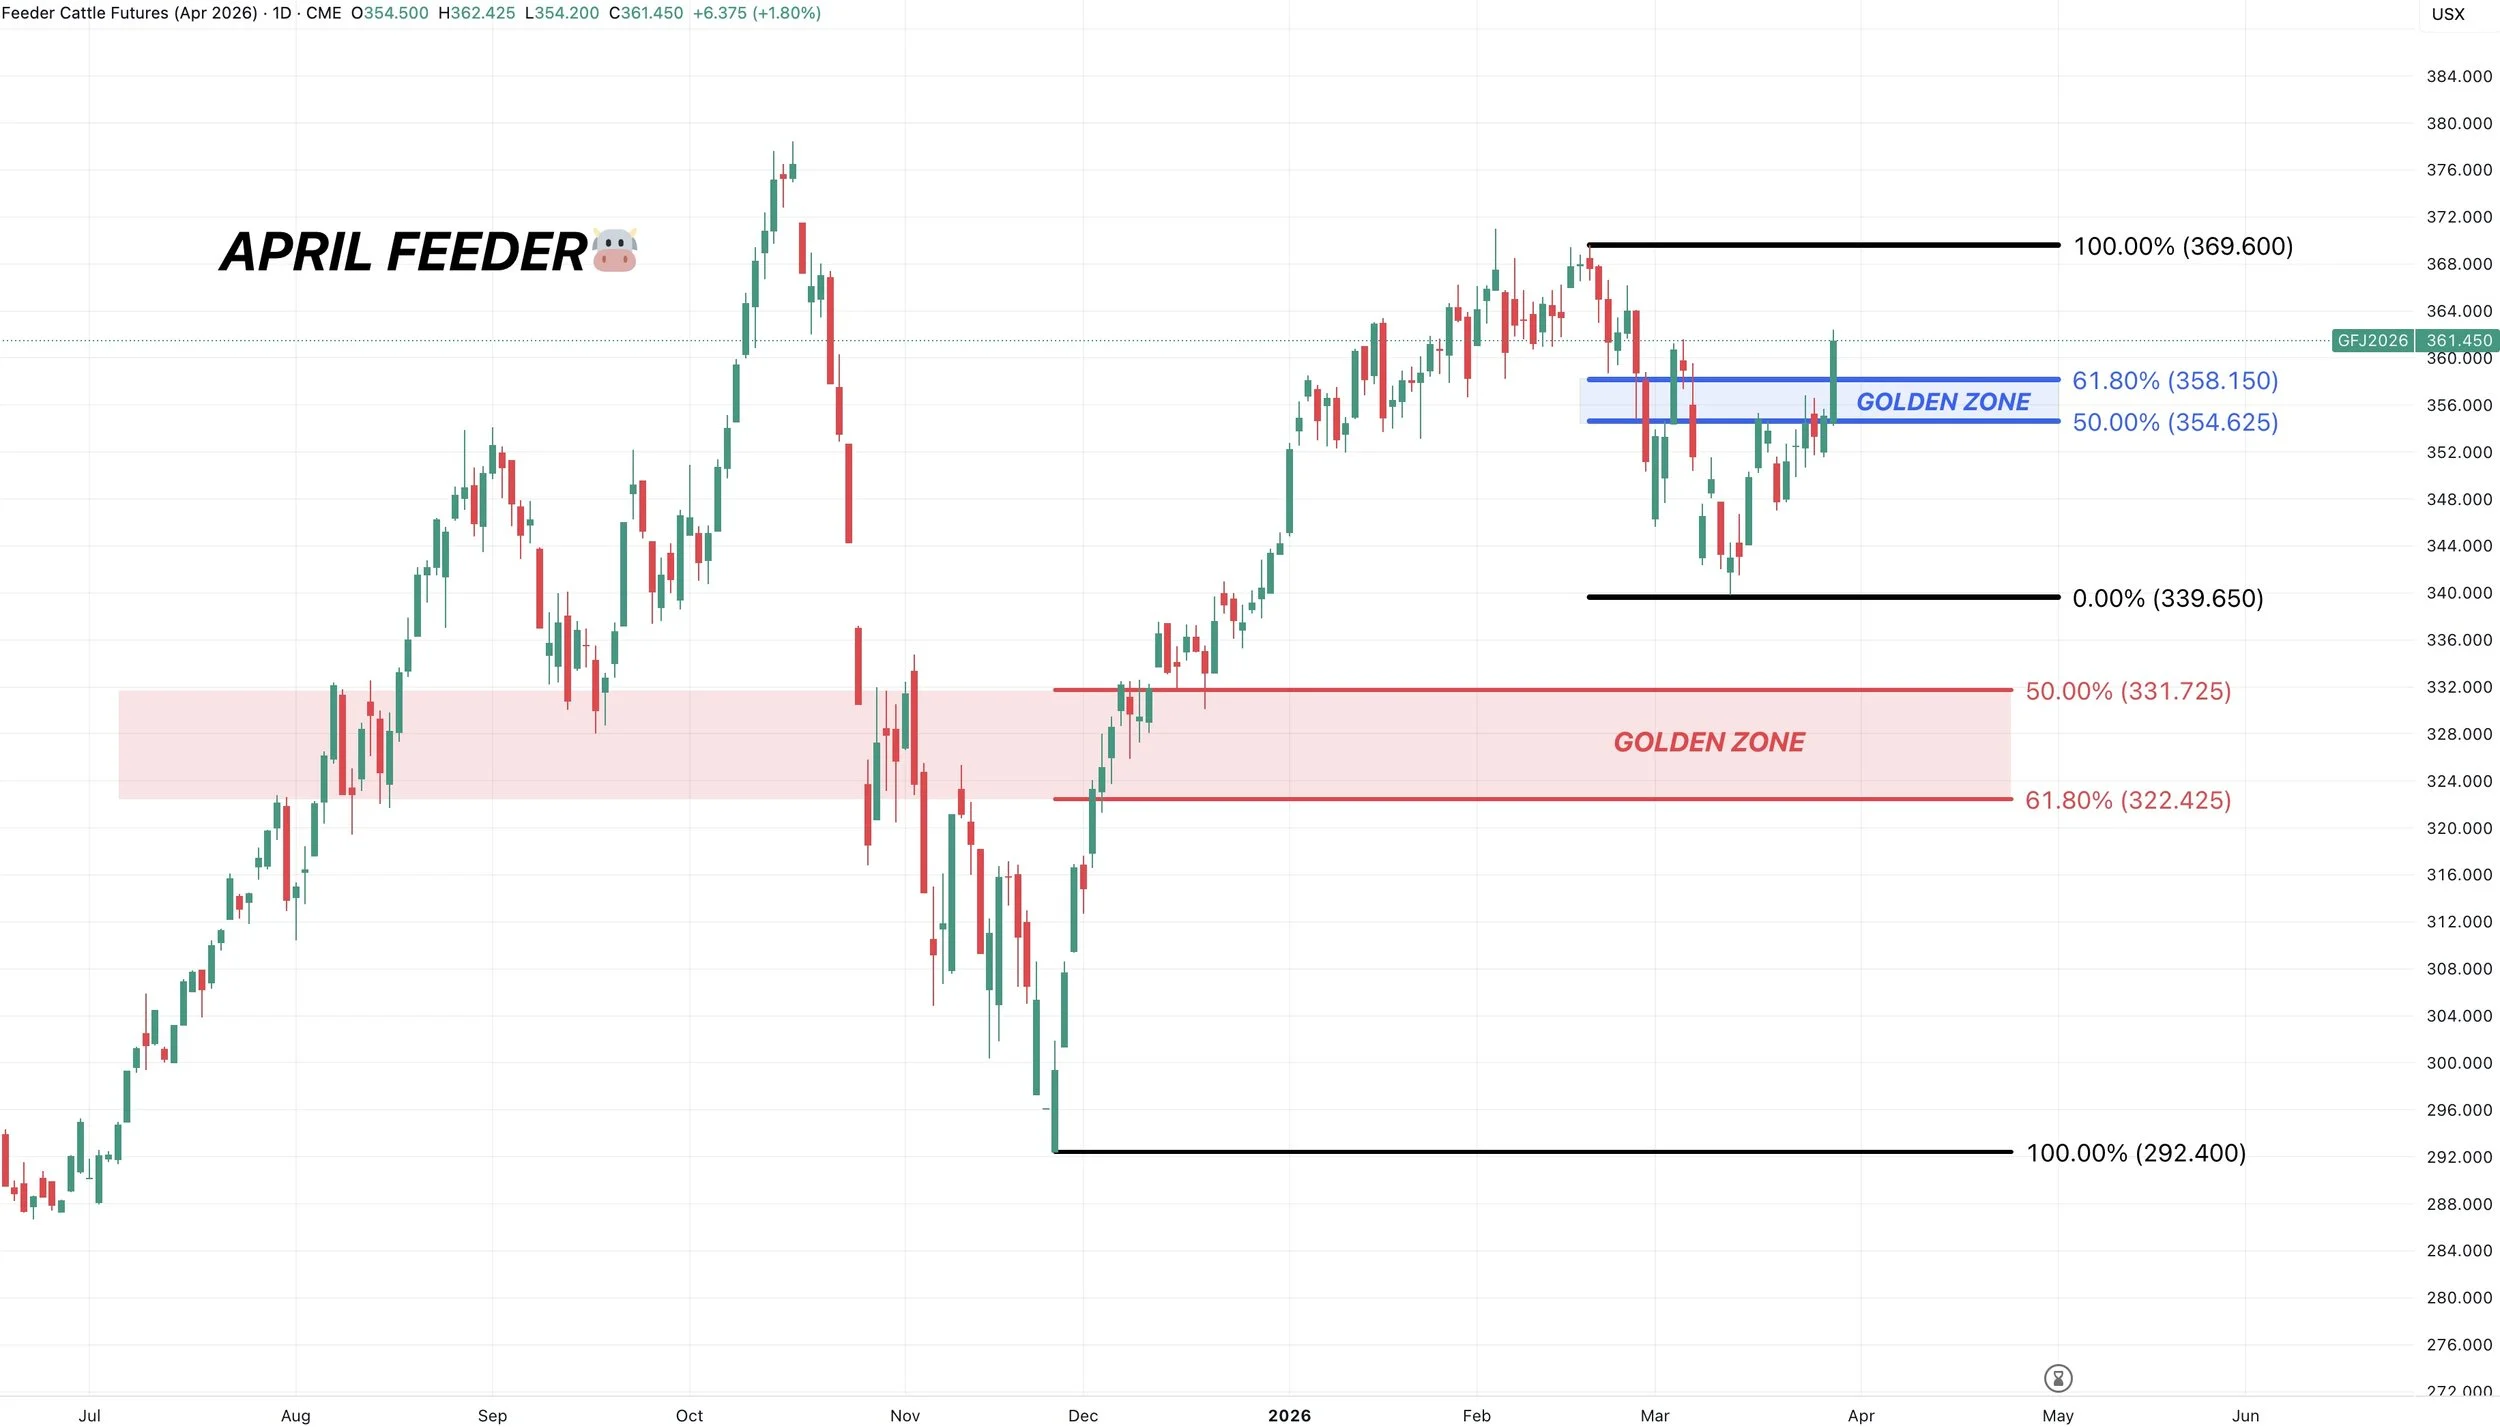
April Feeders Chart:
Huge day for cattle.
We blasted through the golden zone, which is potentially a good sign.
As often times when you break above this level, you will go and test the highs.
I haven’t seen anything news on why we got the nice rally today, but from a technical standpoint it looks like a potential breakout.
I viewed this bounce as a correctional bounce unless we broke above the box. Since we broke above the 61.8% level this bounce has the potential to no longer be a simple relief bounce.
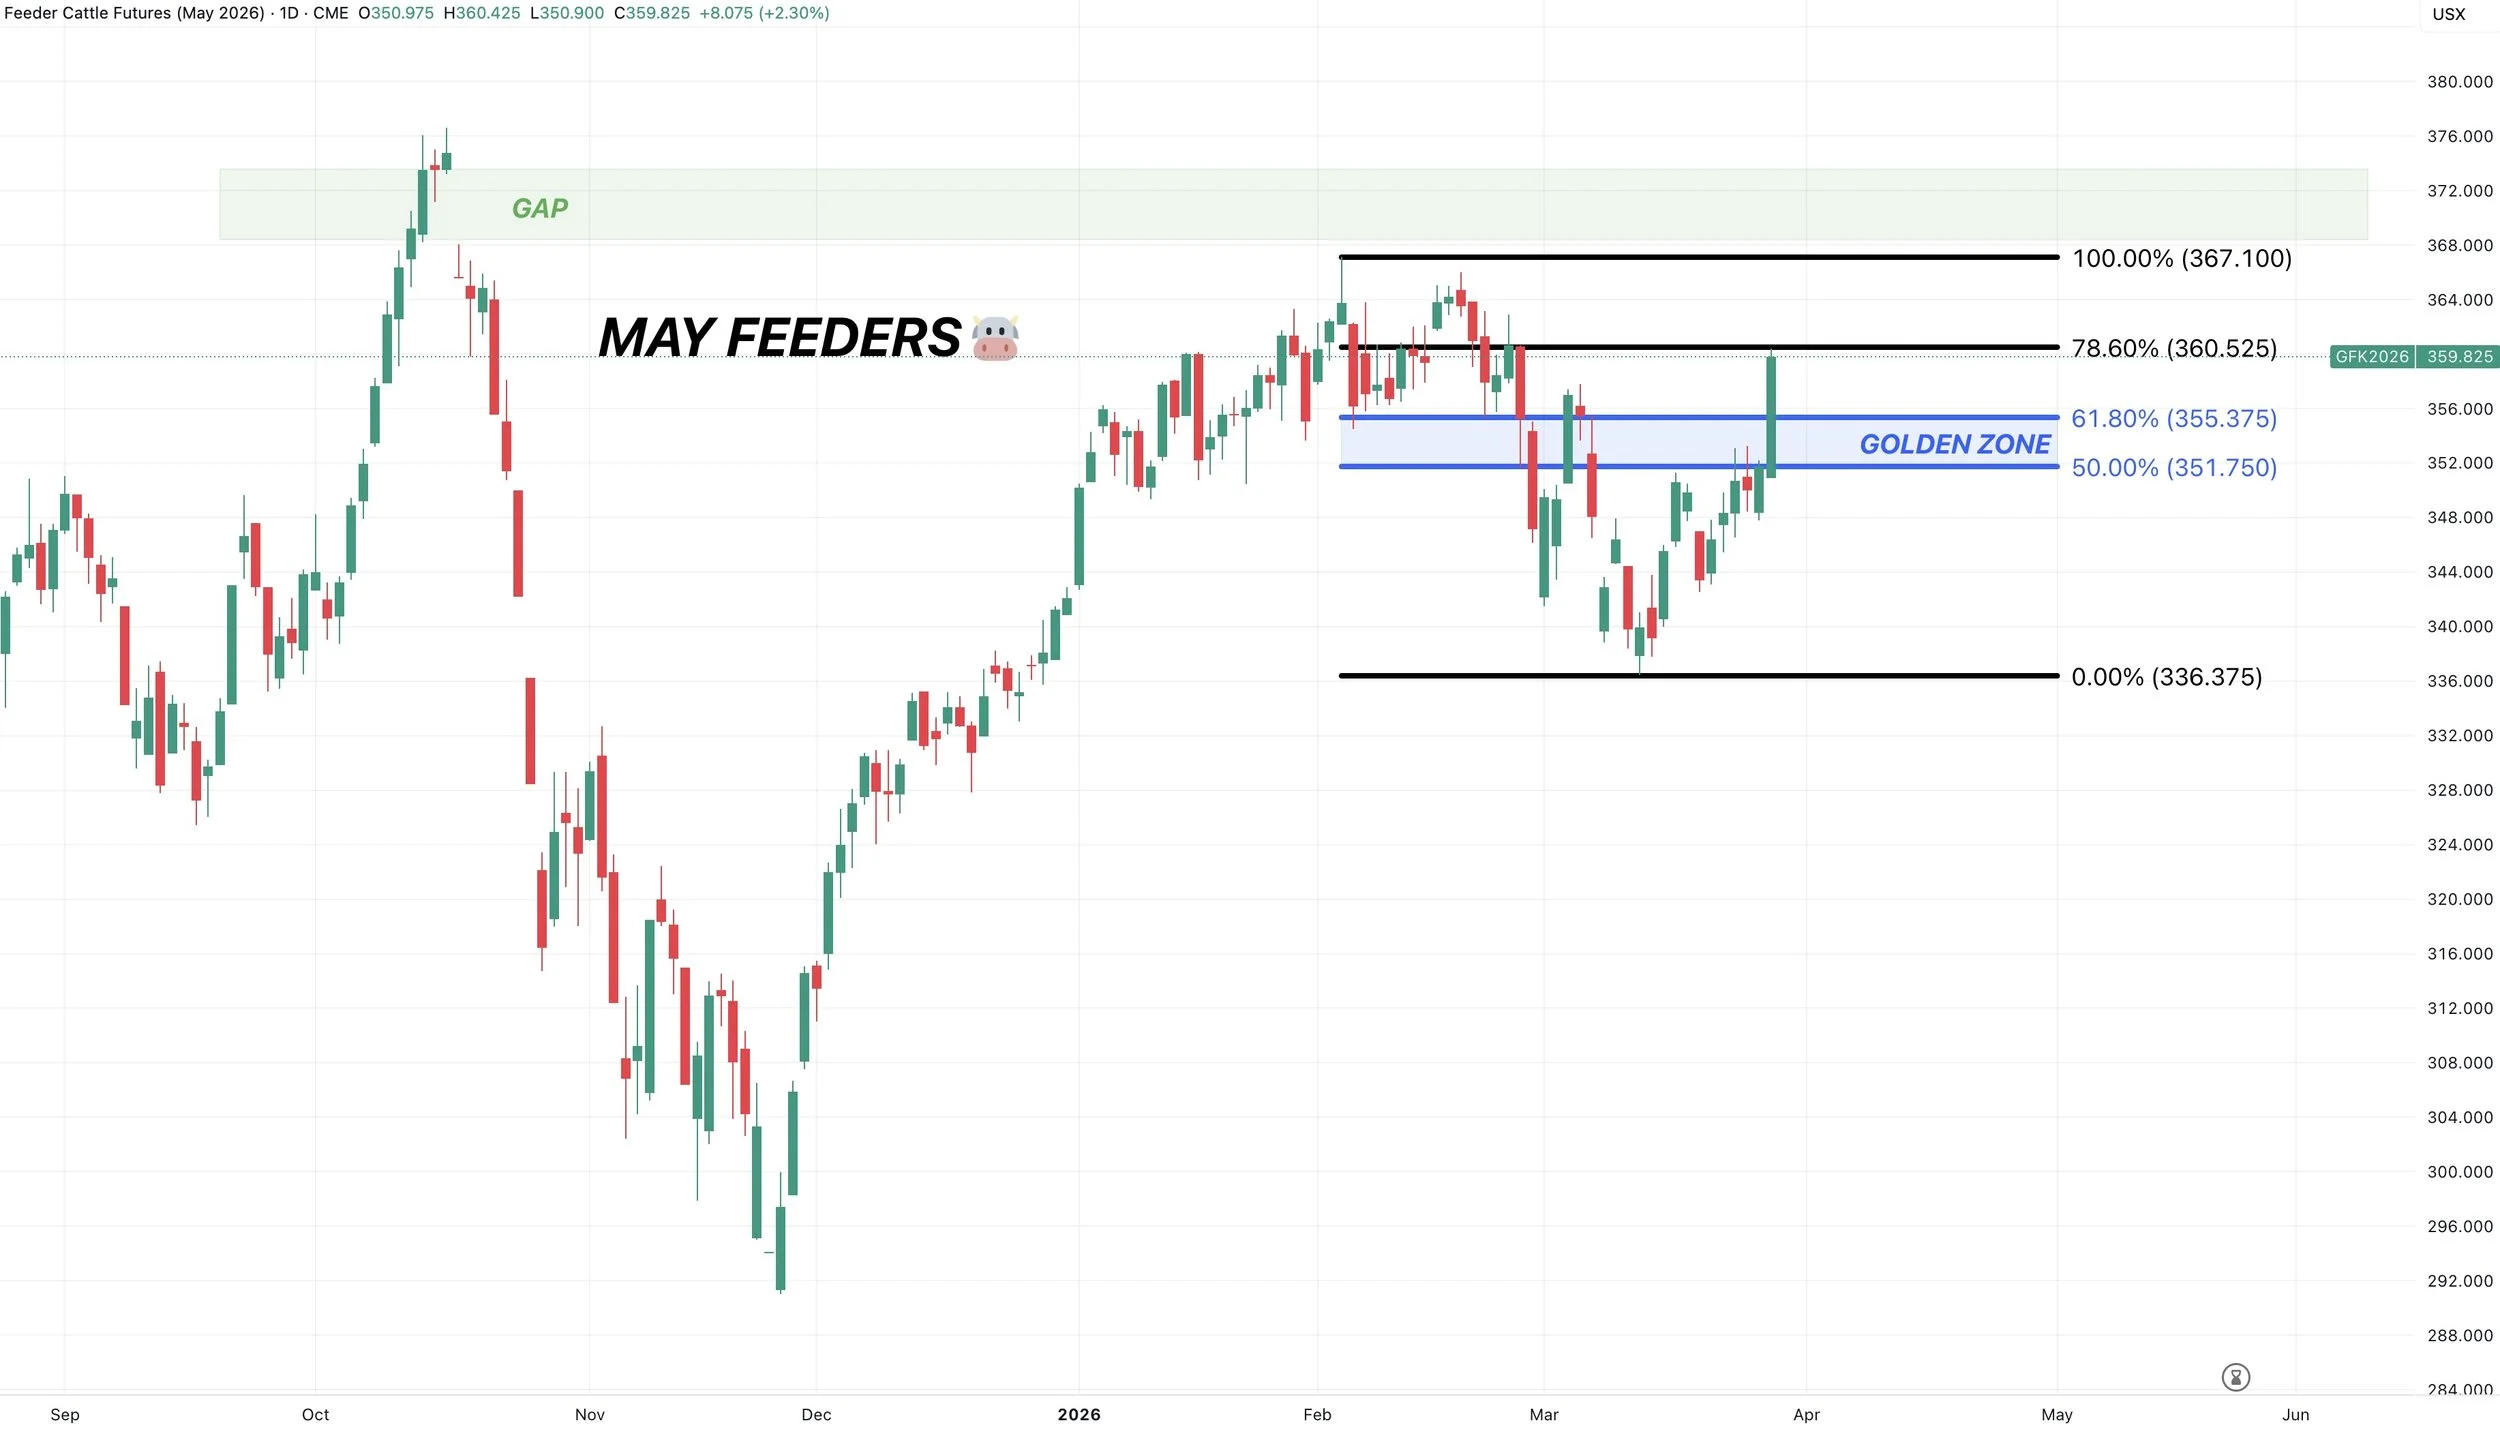
May Feeders Chart:
Volume has now rolled to the May contracts.
So this will be the chart to watch from here.
Like April, we cleared the golden zone.
Now sitting at the last retracement level. Break above here and next resistance is the highs.
There is an unfilled gap up towards 373.
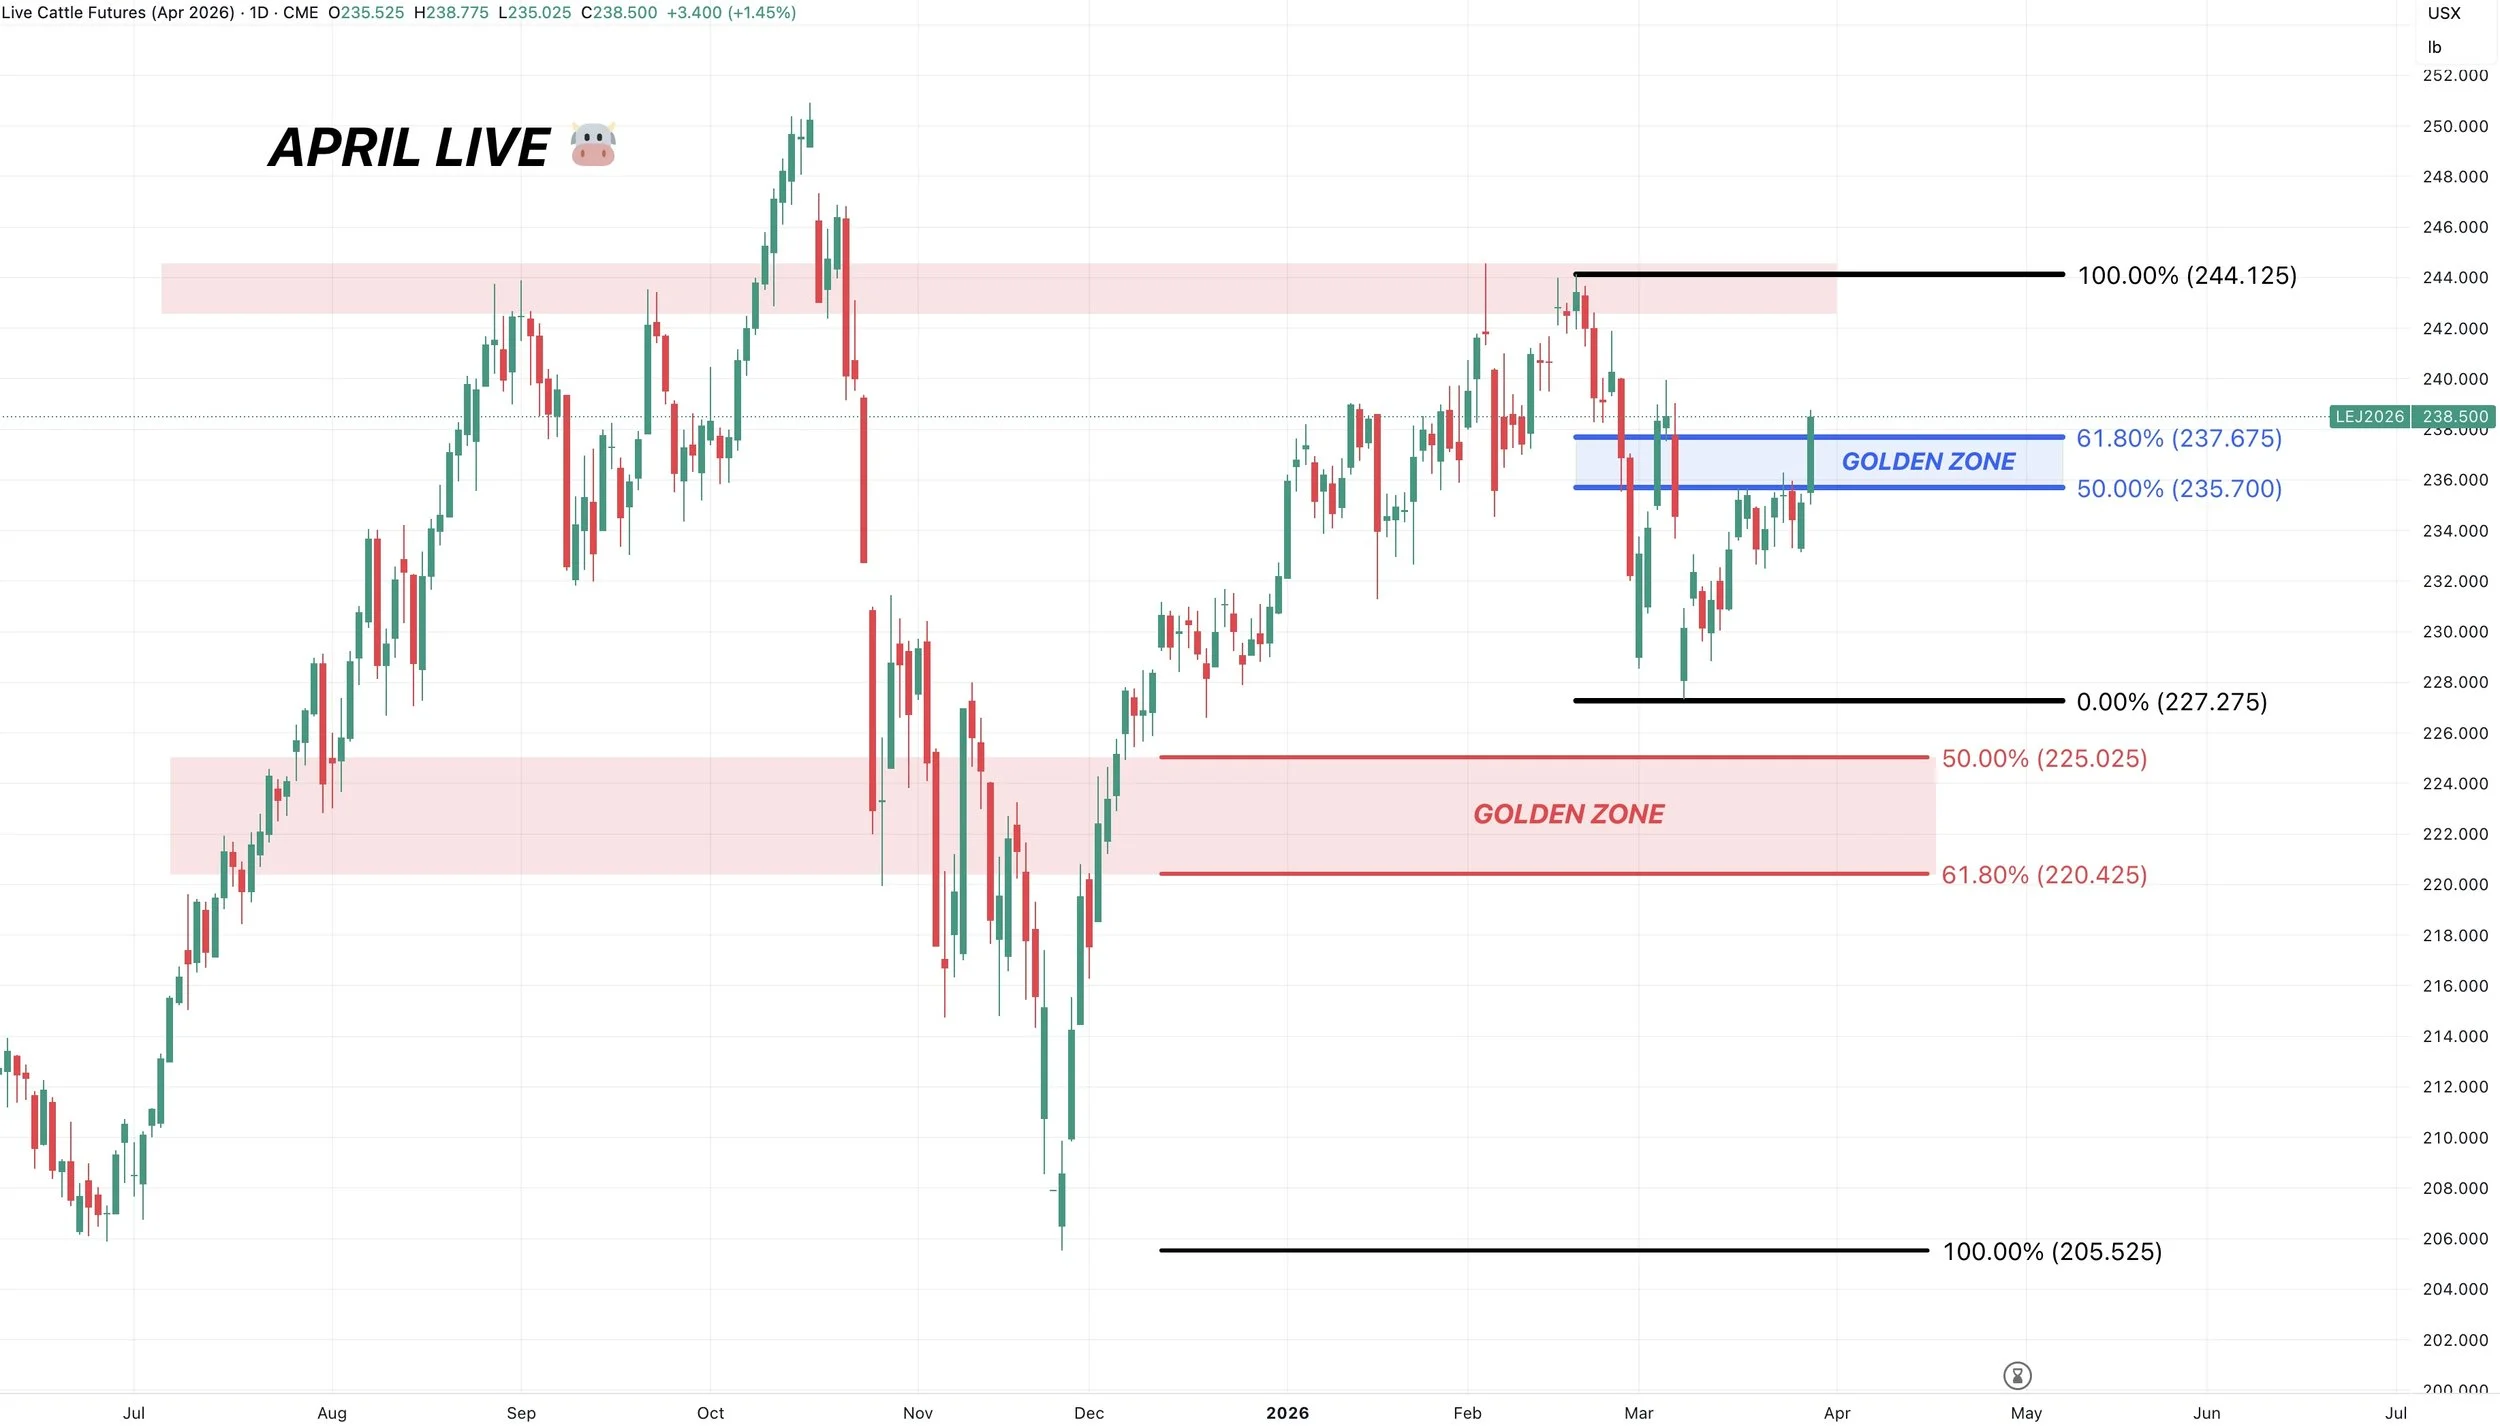
April Live Chart:
Also broke above the golden zone.
A positive sign and potential break out.
Want to Talk?
Our phones are open 24/7 for you guys if you ever need anything or want to discuss your operation.
Jeremey, Lauren & Office: (806)484-1214
Sebastian: (605)280-1186
Email: sfrost@dailymarketminute.com
Hedge Account
Interested in a hedge account? Use the link below to set up an account or give us a call.
Recent Signals
March 19th, 2026: 🌱
New crop soybeans signal & hedge alert.
March 9th, 2026: 🌱
Soybeans signal & hedge alert. Sent via text.
March 6th, 2026: 🌽 🌾
Corn & wheat sell signal & hedge alert.
March 3rd, 2026: 🌽
Old crop & new crop corn sell signal & hedge alert.
Feb 26th, 2026: 🌱
Old crop & new crop beans sell signal & hedge alert.
Feb 19th, 2026: 🌾
KC wheat sell signal & hedge alert.
Feb 6th, 2026: 🌽 🌱
Old crop corn & soybean sell signal & hedge alert.
Feb 4th, 2026: 🌱
Soybean sell signal & hedge alert.
Nov 17th, 2025: 🌱
Soybean sell signal & hedge alert.