
CORN AT KEY SPOT & POSSIBLE SCENARIOS
MARKET UPDATE
You can scroll to read the usual update as well. As the written version is the exact same as the video.
Timestamps for video:
Overview: 0:00min
Corn: 1:25min
Beans: 6:55min
Wheat: 10:00min
Cattle: 11:00min
Want to talk about your situation?
(605)295-3100
Before your trial ends
Here is extended access to our harvest sale that ended last weekend. Don’t miss future updates or signals
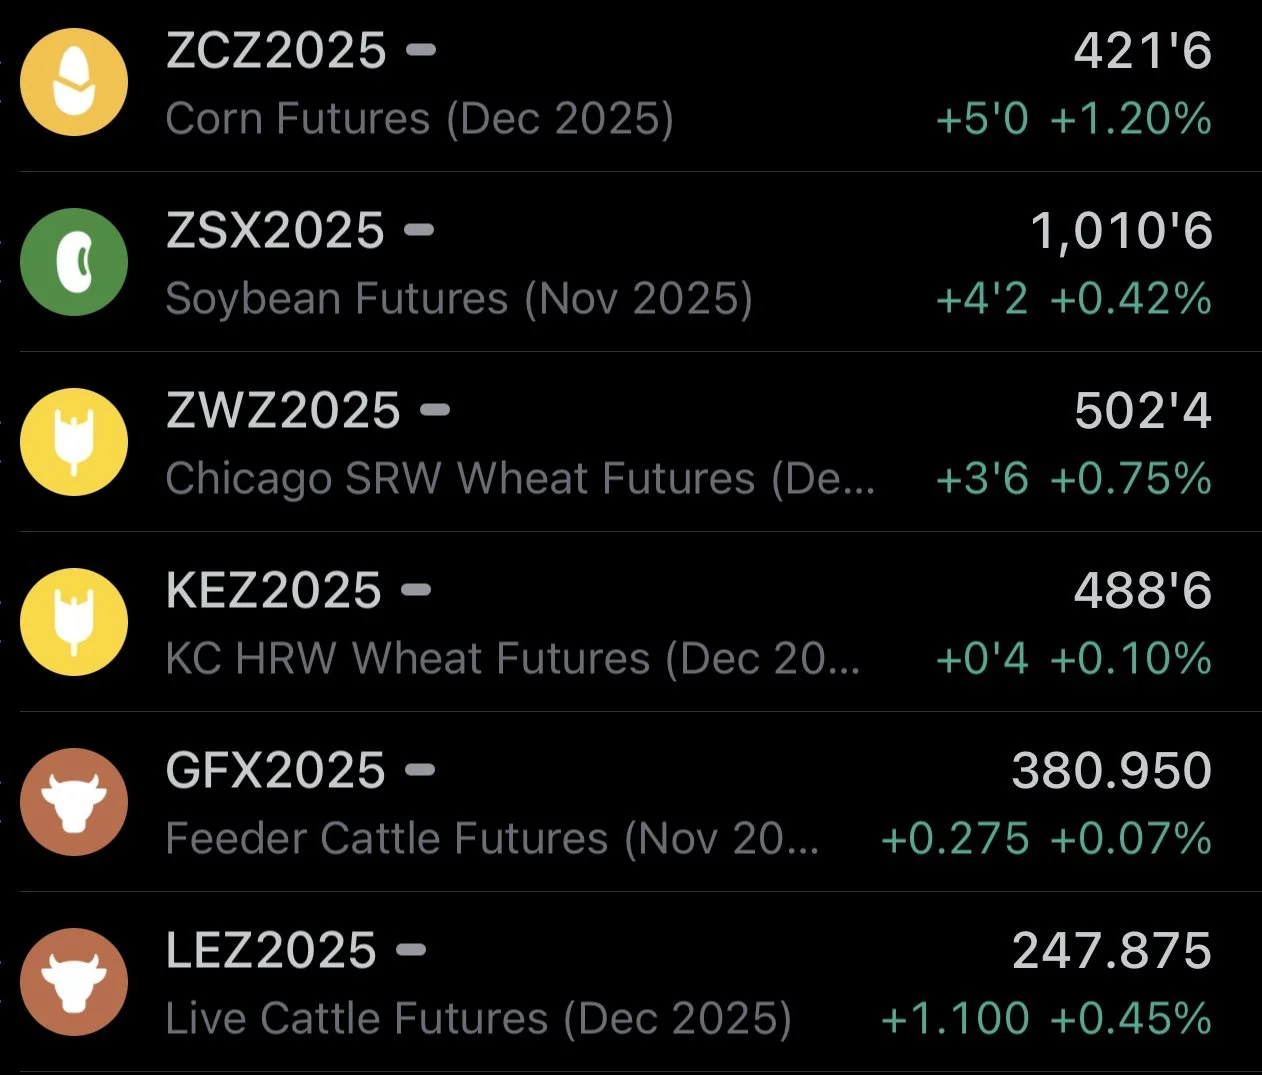
Futures Prices Close
Overview
Grains mostly higher today. Outside of the Trump and China back and forth headlines, the market still lacks news with the government shutdown.
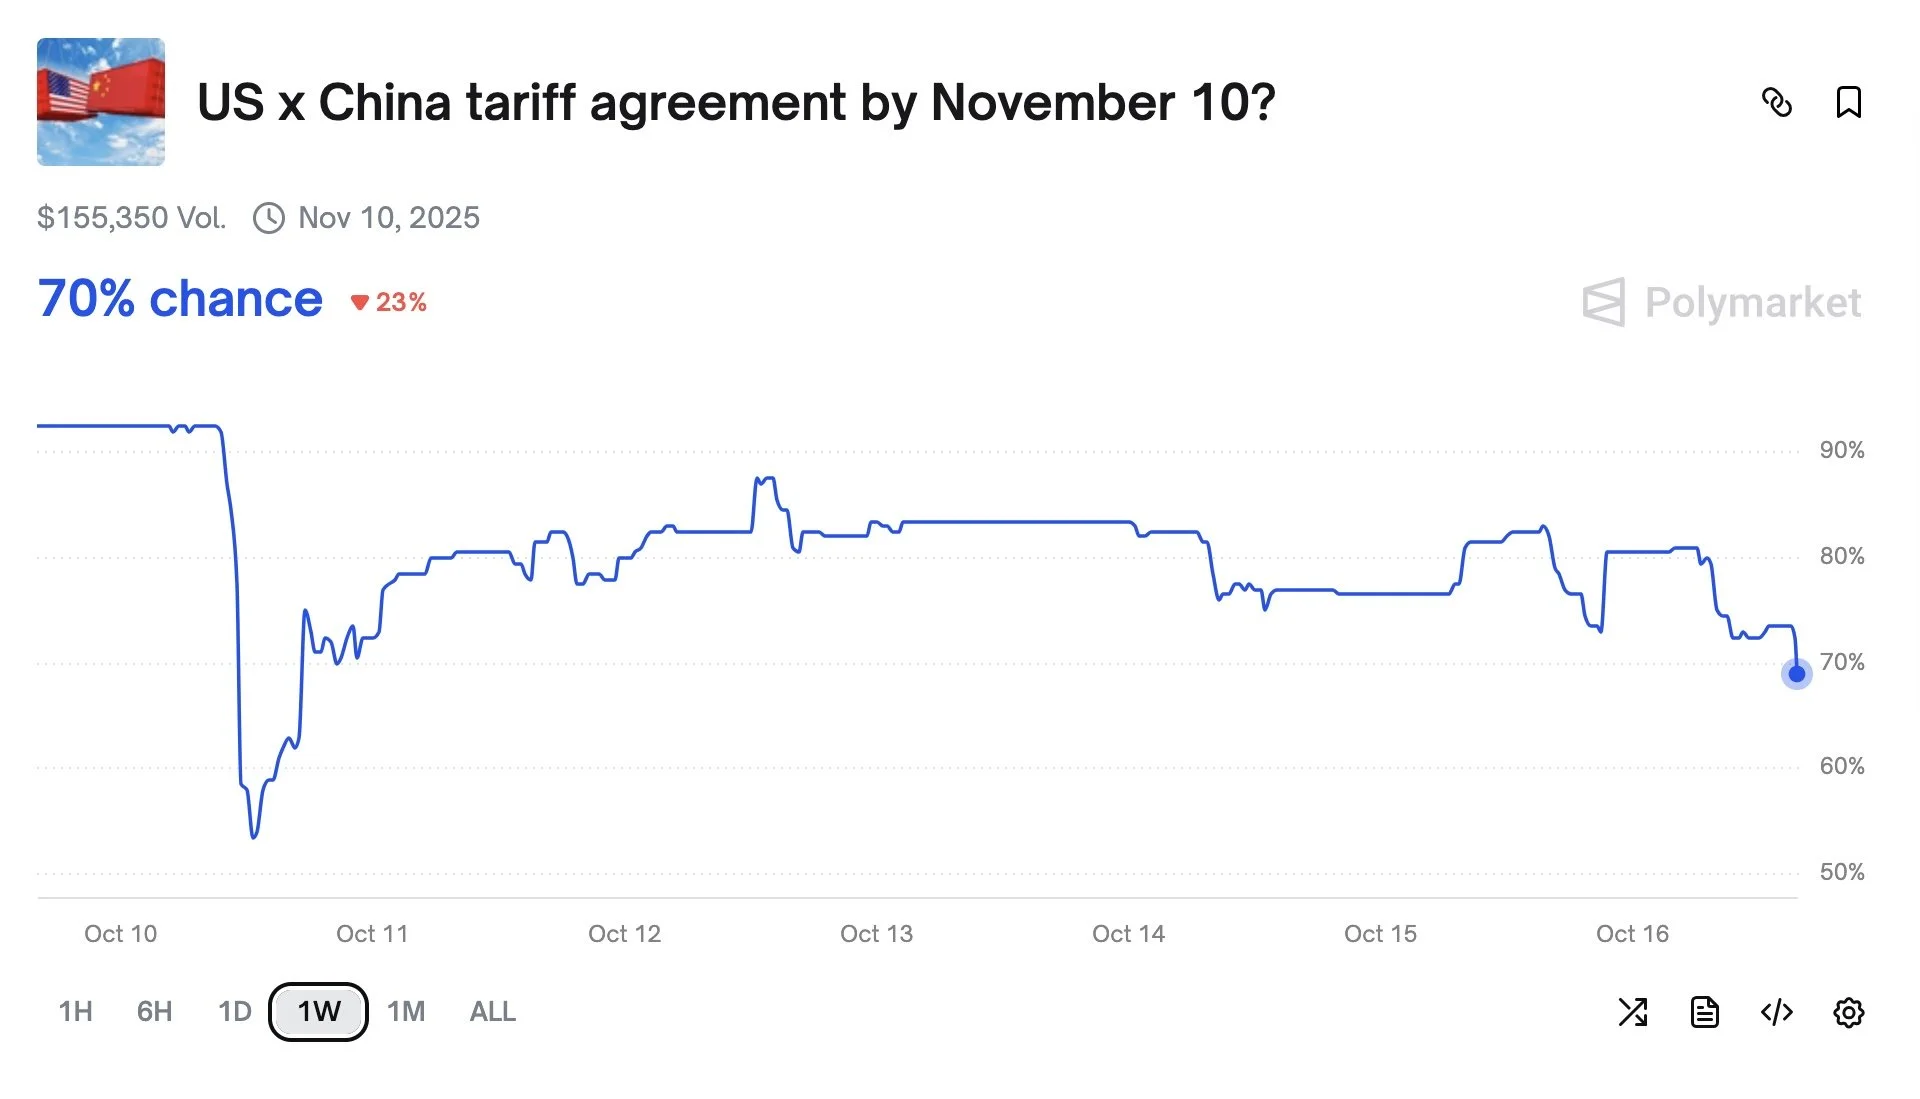
The betting odds now favor the shutdown to last nearly 40 days. Which would put us at November 10th.
Meaning we would likely not get that November USDA report. As the report is scheduled for November 10th as well.

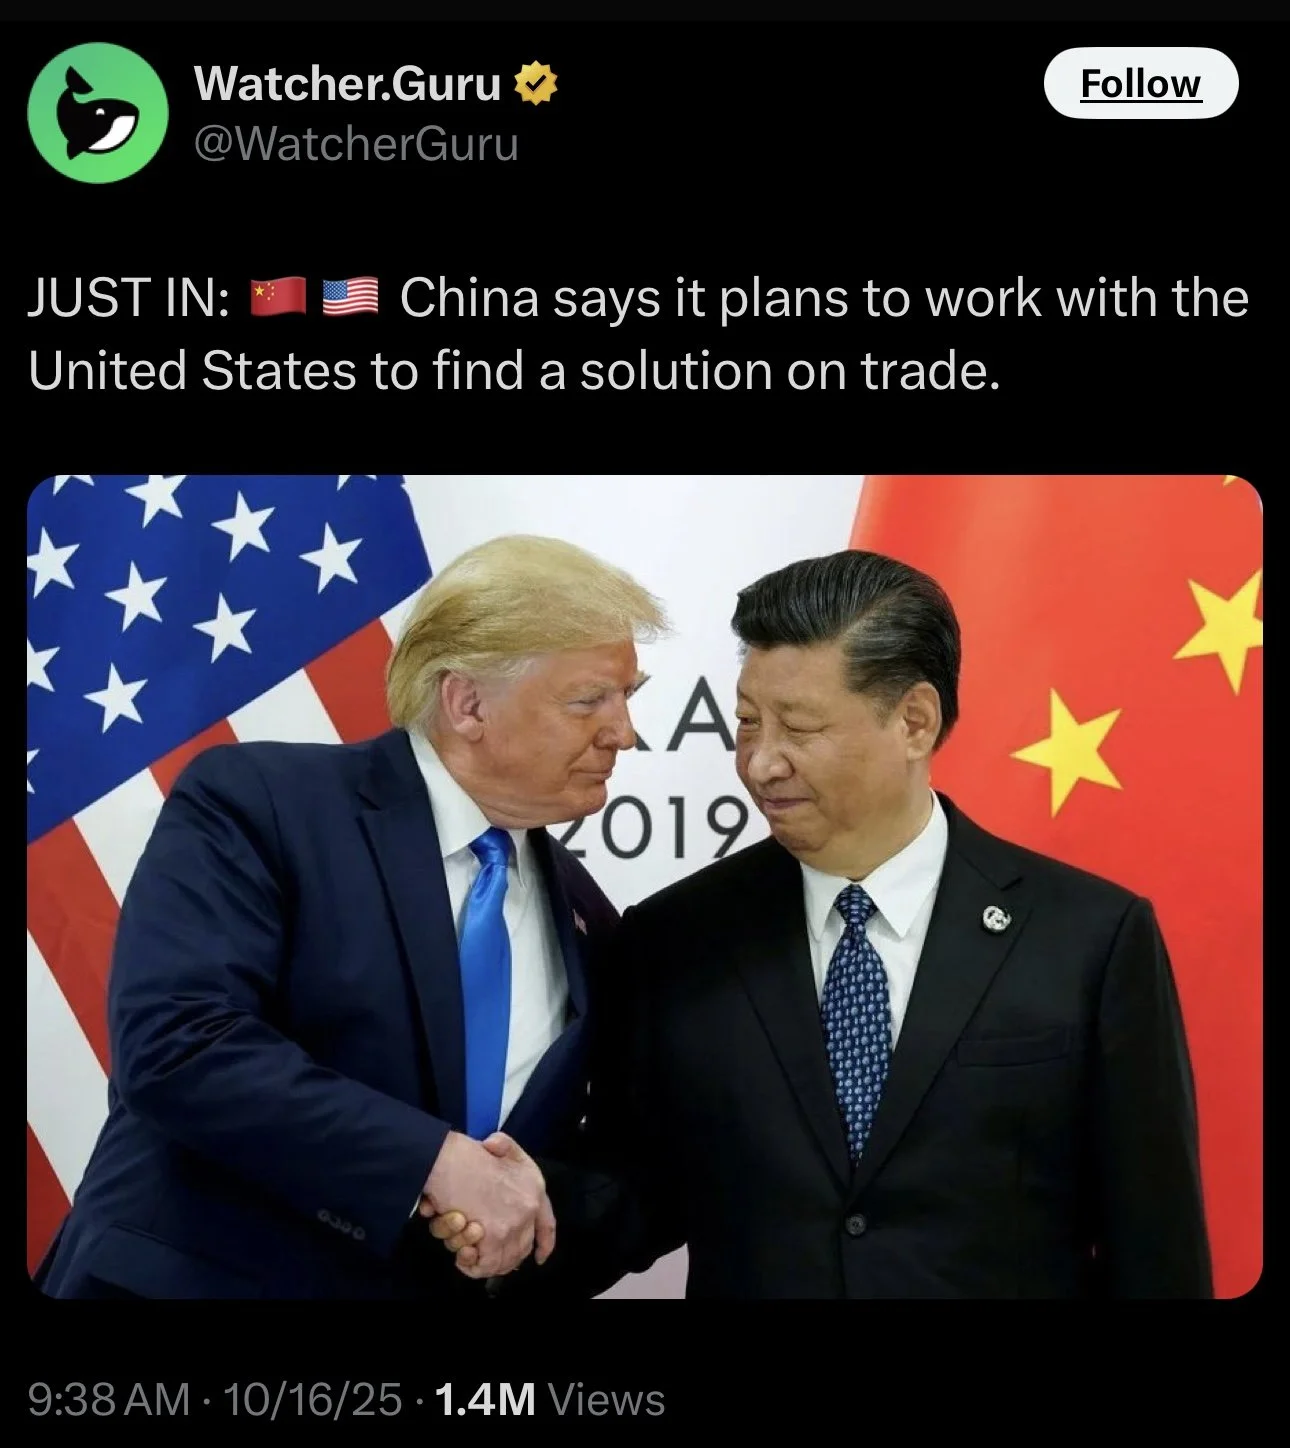
The Trump and China headlines continue.
Yesterday Trump said the US and China are offically in a trade war.

This morning China then said that it plans to work with the US to find a solution.
The headlines are a complete mess.
One hour Trump is saying everything is fine. The next Trump is saying we can’t trust China and are in a trade war.
The only other piece of news was the possible aid package. It sounds like we will be getting one.
There has yet to be any details released on this due to the government being shutdown, however it is speculated the package could be similar to last trade war.
Back in 2018, I believe the package equated to roughly $1.60 a bushel for soybeans.
We won’t know for sure what the details look like until the shutdown is over.
Basis
Make sure you are aware of your local basis and not getting taken advantage of.
We have had several calls come in from you guys where buyers are trying to tell farmers basis is going to get weaker, but in fact basis has firmed up in most locations.
Today's Main Takeaways
Corn
Fundamentals:
We haven’t received crop conditions in a long time.
The last one we saw back in September had this crop rated 66% G/E.
Crop conditions are not the best indicators when it comes to determining yield.
However, this number is relatively close to last year's 64% G/E.
Earlier this year we nearly had the highest crop ratings of all time, comparable to 2016 where yield came in far above trendline.
However, as the year went on, crop ratings dropped to roughly the same as last year.

Here is a visual that compares our starting yield to our final yield.
I also threw on the crop ratings for Sep 21st on there (the last ones we received).
Last year, we came in below with crop ratings that were roughly the same.
Our final yield hasn’t came in higher than intial May yield since all the way back in 2018.

Here is another visual that simply takes our yield deviation from May to the final yield.
Again, we haven’t came in higher since 2018.
Last year was the closest we have came.
But why would yield this year have to be +4 bpa higher than the initial May number?
Which would be the biggest jump since 2017.

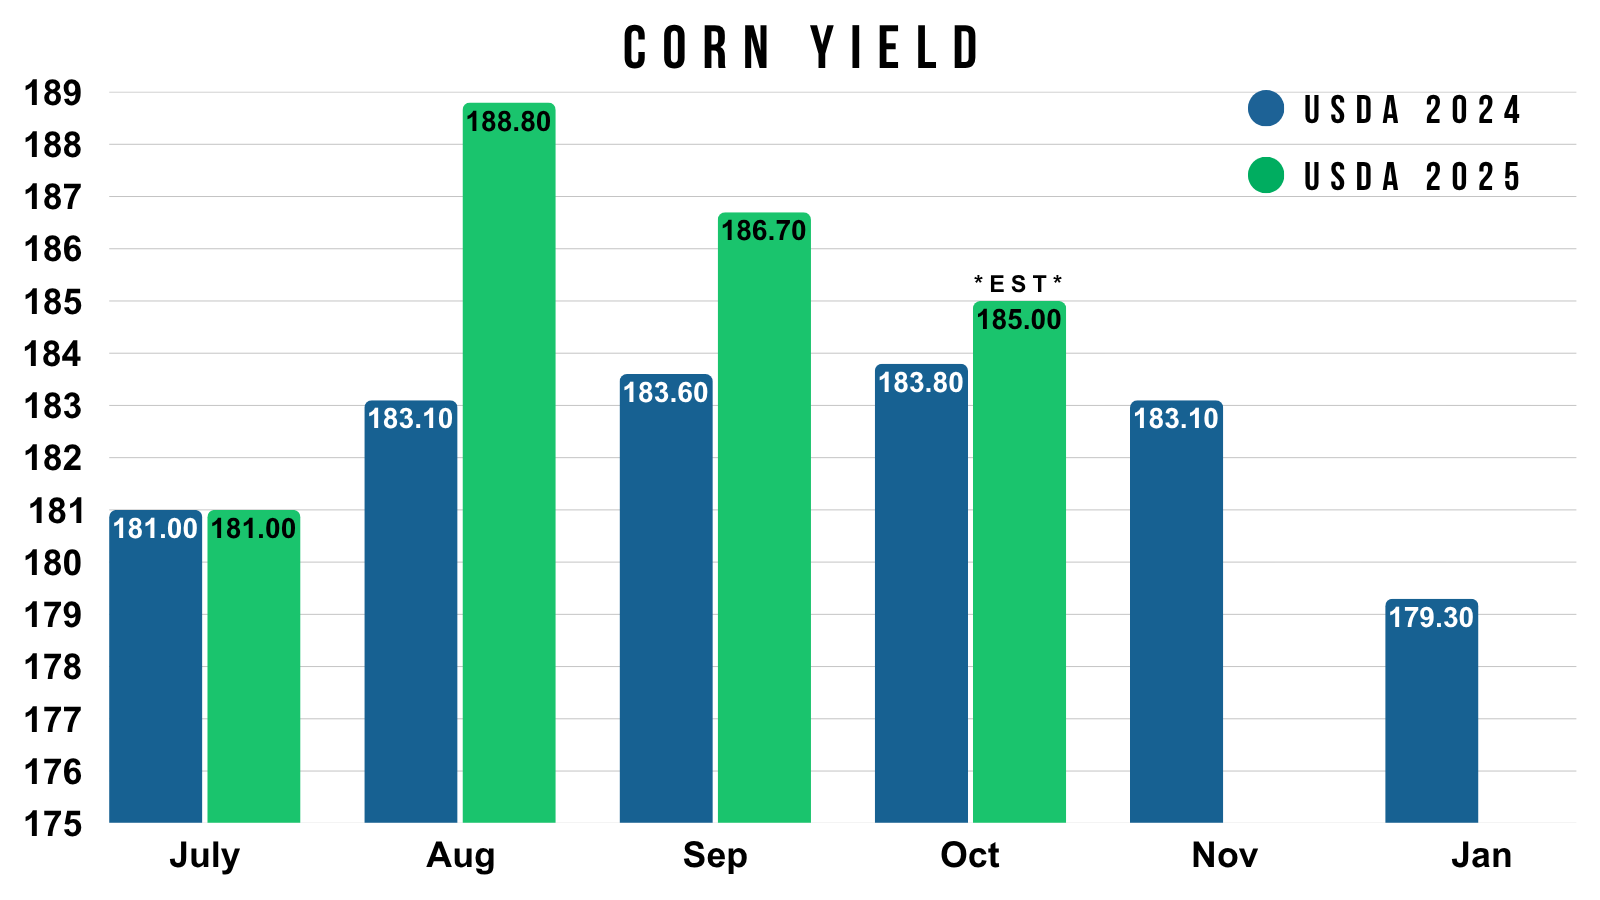
I've shown this chart a lot recently but think it gives a pretty good visual.
In August, this crop was perceived to be almost 189 bpa.
This was nearly +6 bpa higher than where the crop was in August 2024 (183.10)
Now in October, the crop is only perceived to be +1.2 bpa higher than it was in Oct 2024.
I don’t think yield is anywhere close to 185.
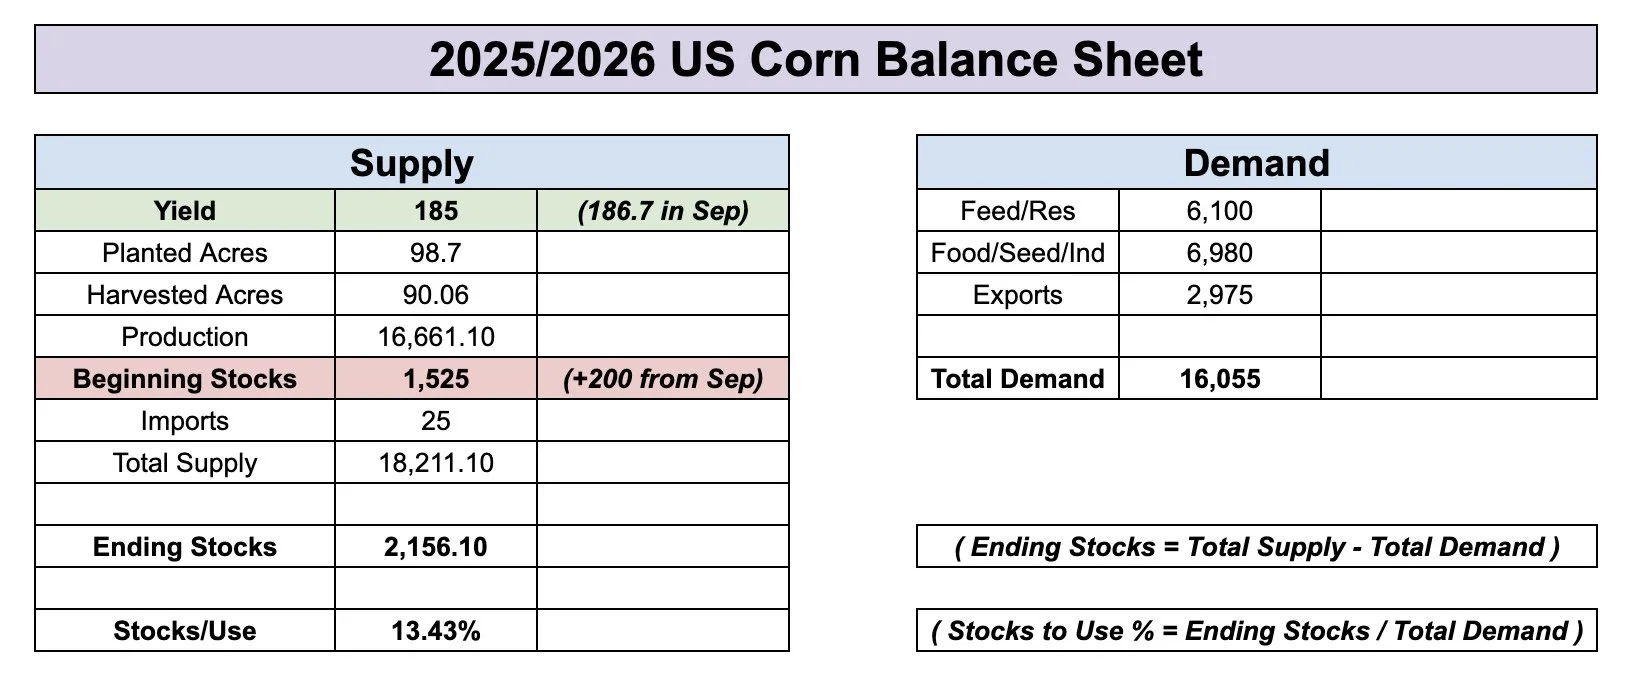
Since there is a lack of news, let's just go over a few examples on how the balance sheet could shake out.
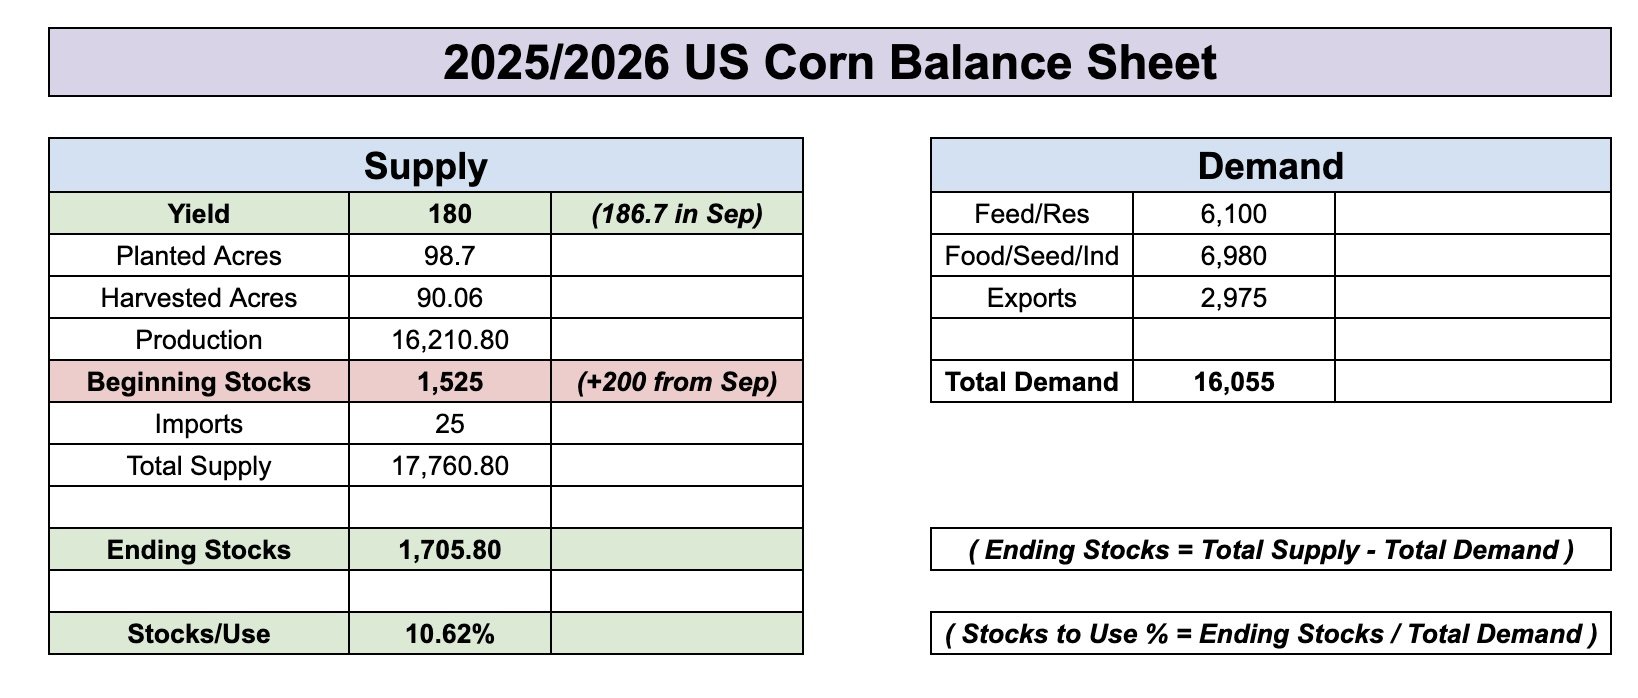
Here is the current balance sheet for reference.
Since we did not get the USDA report, I simply used the 185 yield estimate the analysts gave us.
Here is the balance sheet with a 180 yield if you leave demand unchanged.
Carryout: 1.70 (Current: 2.15)
Stocks to Use: 10.60% (Current 13.40%)
This is a lot friendlier than the current balance sheet, but this is not bull market bullish.
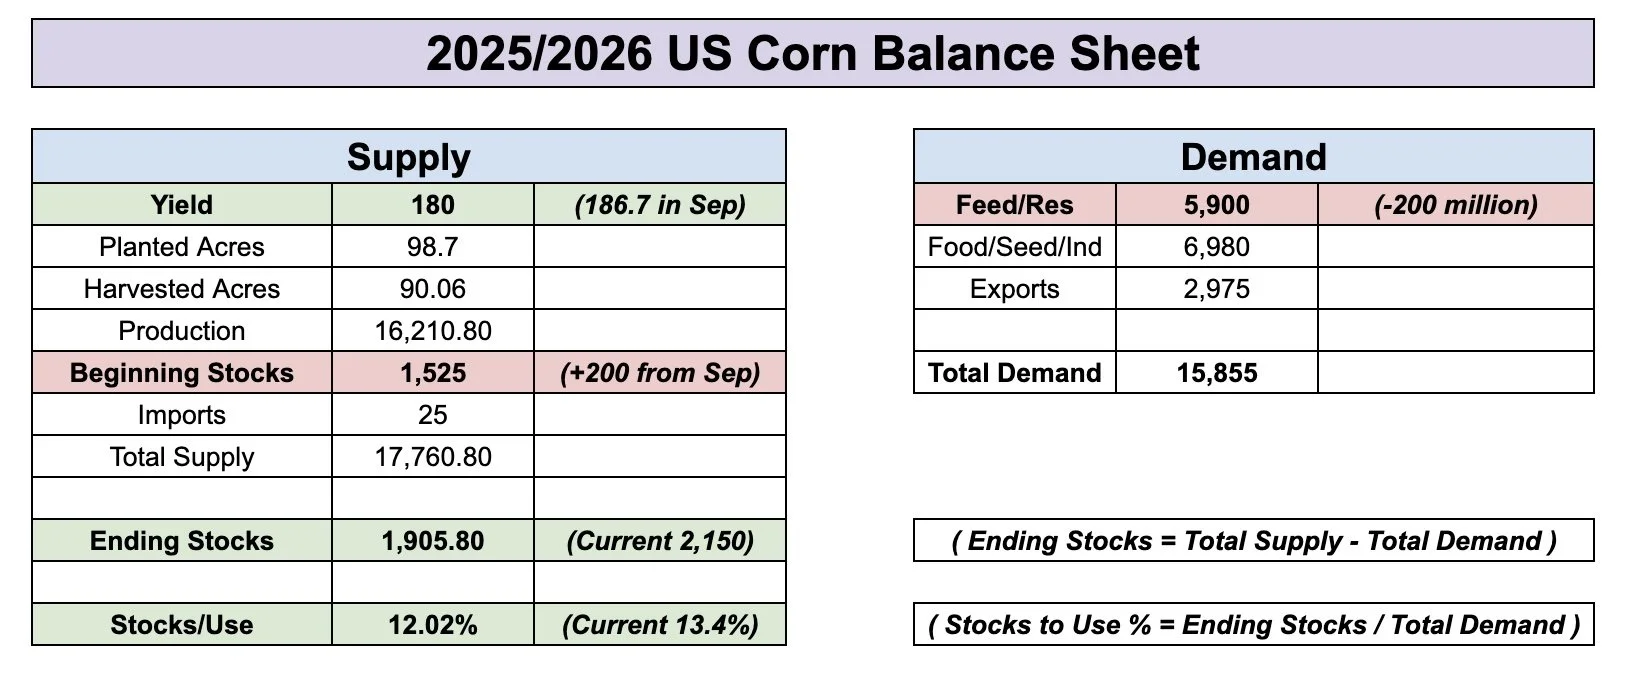
Most think our feed demand is too high.
So let's cut it by -200 million bushels.
Which is how the USDA cut our old crop feed demand in the quarterly stocks report.
With a 180 yield and -200 feed demand it spits out:
Carryout: 1.90 (Current 2.15)
Stocks to Use: 12% (Current 13.40%)
This isn’t bullish at all.
So in theory, even if yield fell all the way down to 180, but the USDA decides to cut feed demand drastically, it could still paint a bearish scenario.
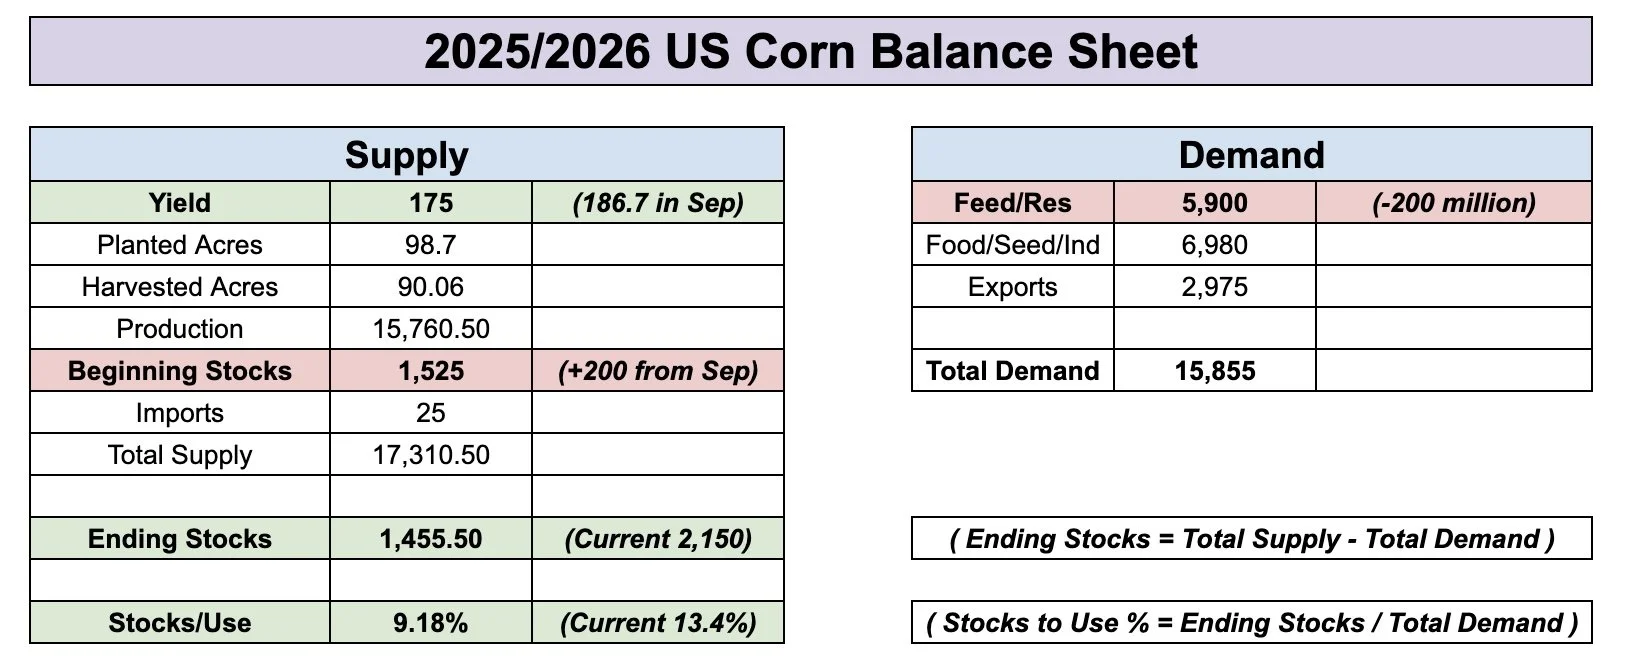
Lastly, here would be a bull case scenario.
Let's drop yield all the way down to 175.
Even if we also drop feed demand by -200 million, it paints a pretty bullish situation, if the USDA doesn’t drop demand elsewhere as well.
175 yield and -200 feed demand results in:
Carryout: 1.45 (Current 2.15)
Stocks to Use: 9.2% (Current 13.40%)
Now that would be bullish.
But it would take a pretty drastic yield cut to paint that bullish of a situation.
Overall, I think we have too much supply and too many acres to get extremely bullish and scream $5 corn is coming relatively soon.
At the same time, we've already priced about as bearish of scenarios you could possibly paint.
We had the 189 yield.
We had the record acres.
What else is there?
Yield is coming down.
We have record production, but I'd like to think record demand will keep a floor under this market.
Technicals:
Dec corn looks pretty good here.
However, we are not out of the woods yet.
We are up against a major decision point.
Not only are we up against trendline resistance.
But on today's rally, we also reclaimed 61.8% of the entire sell off before backing off the highs.
That is the most common spot for a bounce to fail at.
If we break above $4.23, then most of the time it will be an indication that we are going to head higher. So that is going to be our green light in this market.
If we can close above, I still have $4.35 as my first target.
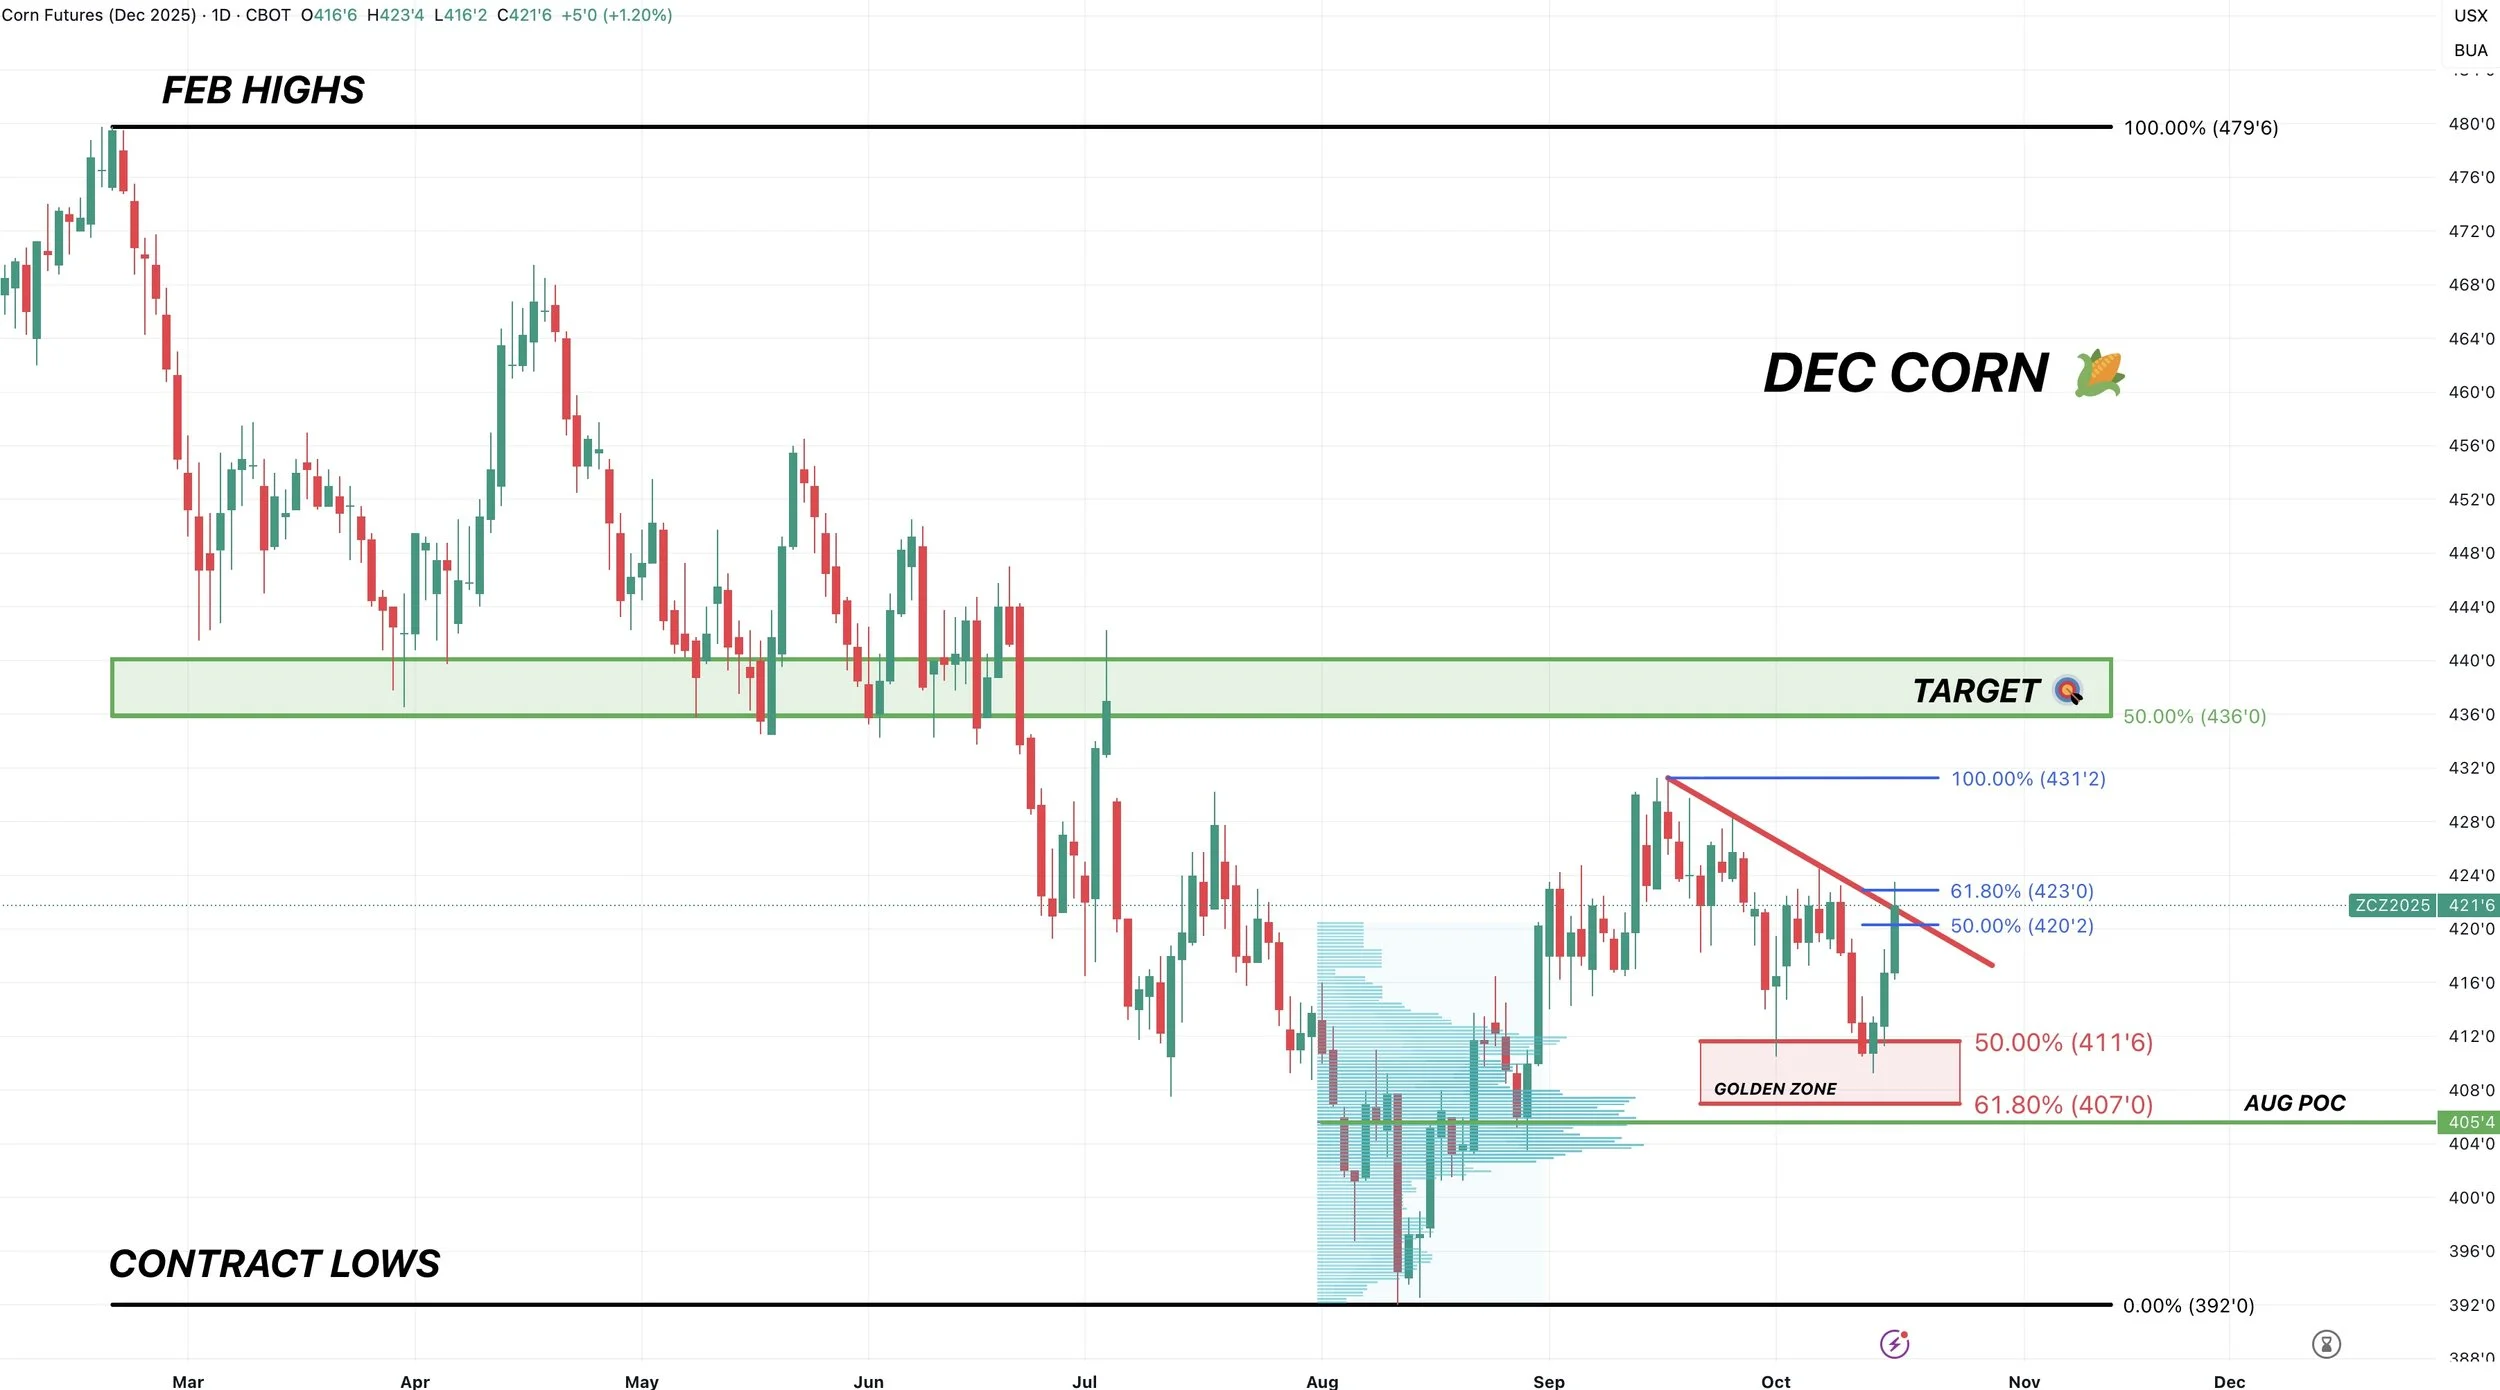
So far we have bounced right in this golden zone.
Which is 50-61.8% of the entire rally from contract lows.
This is exactly what we want to see.
I do still think this red box will hold.
Not only is this the golden zone, but $4.06-$4.07 is also the August point of control.
Which just means that for the month of August, that level was the most heavily traded area and had the most volume. Usually areas of high volume offer support or resistance.
In this case, it should help keep a floor.
As long as that level holds, my bias leans higher.
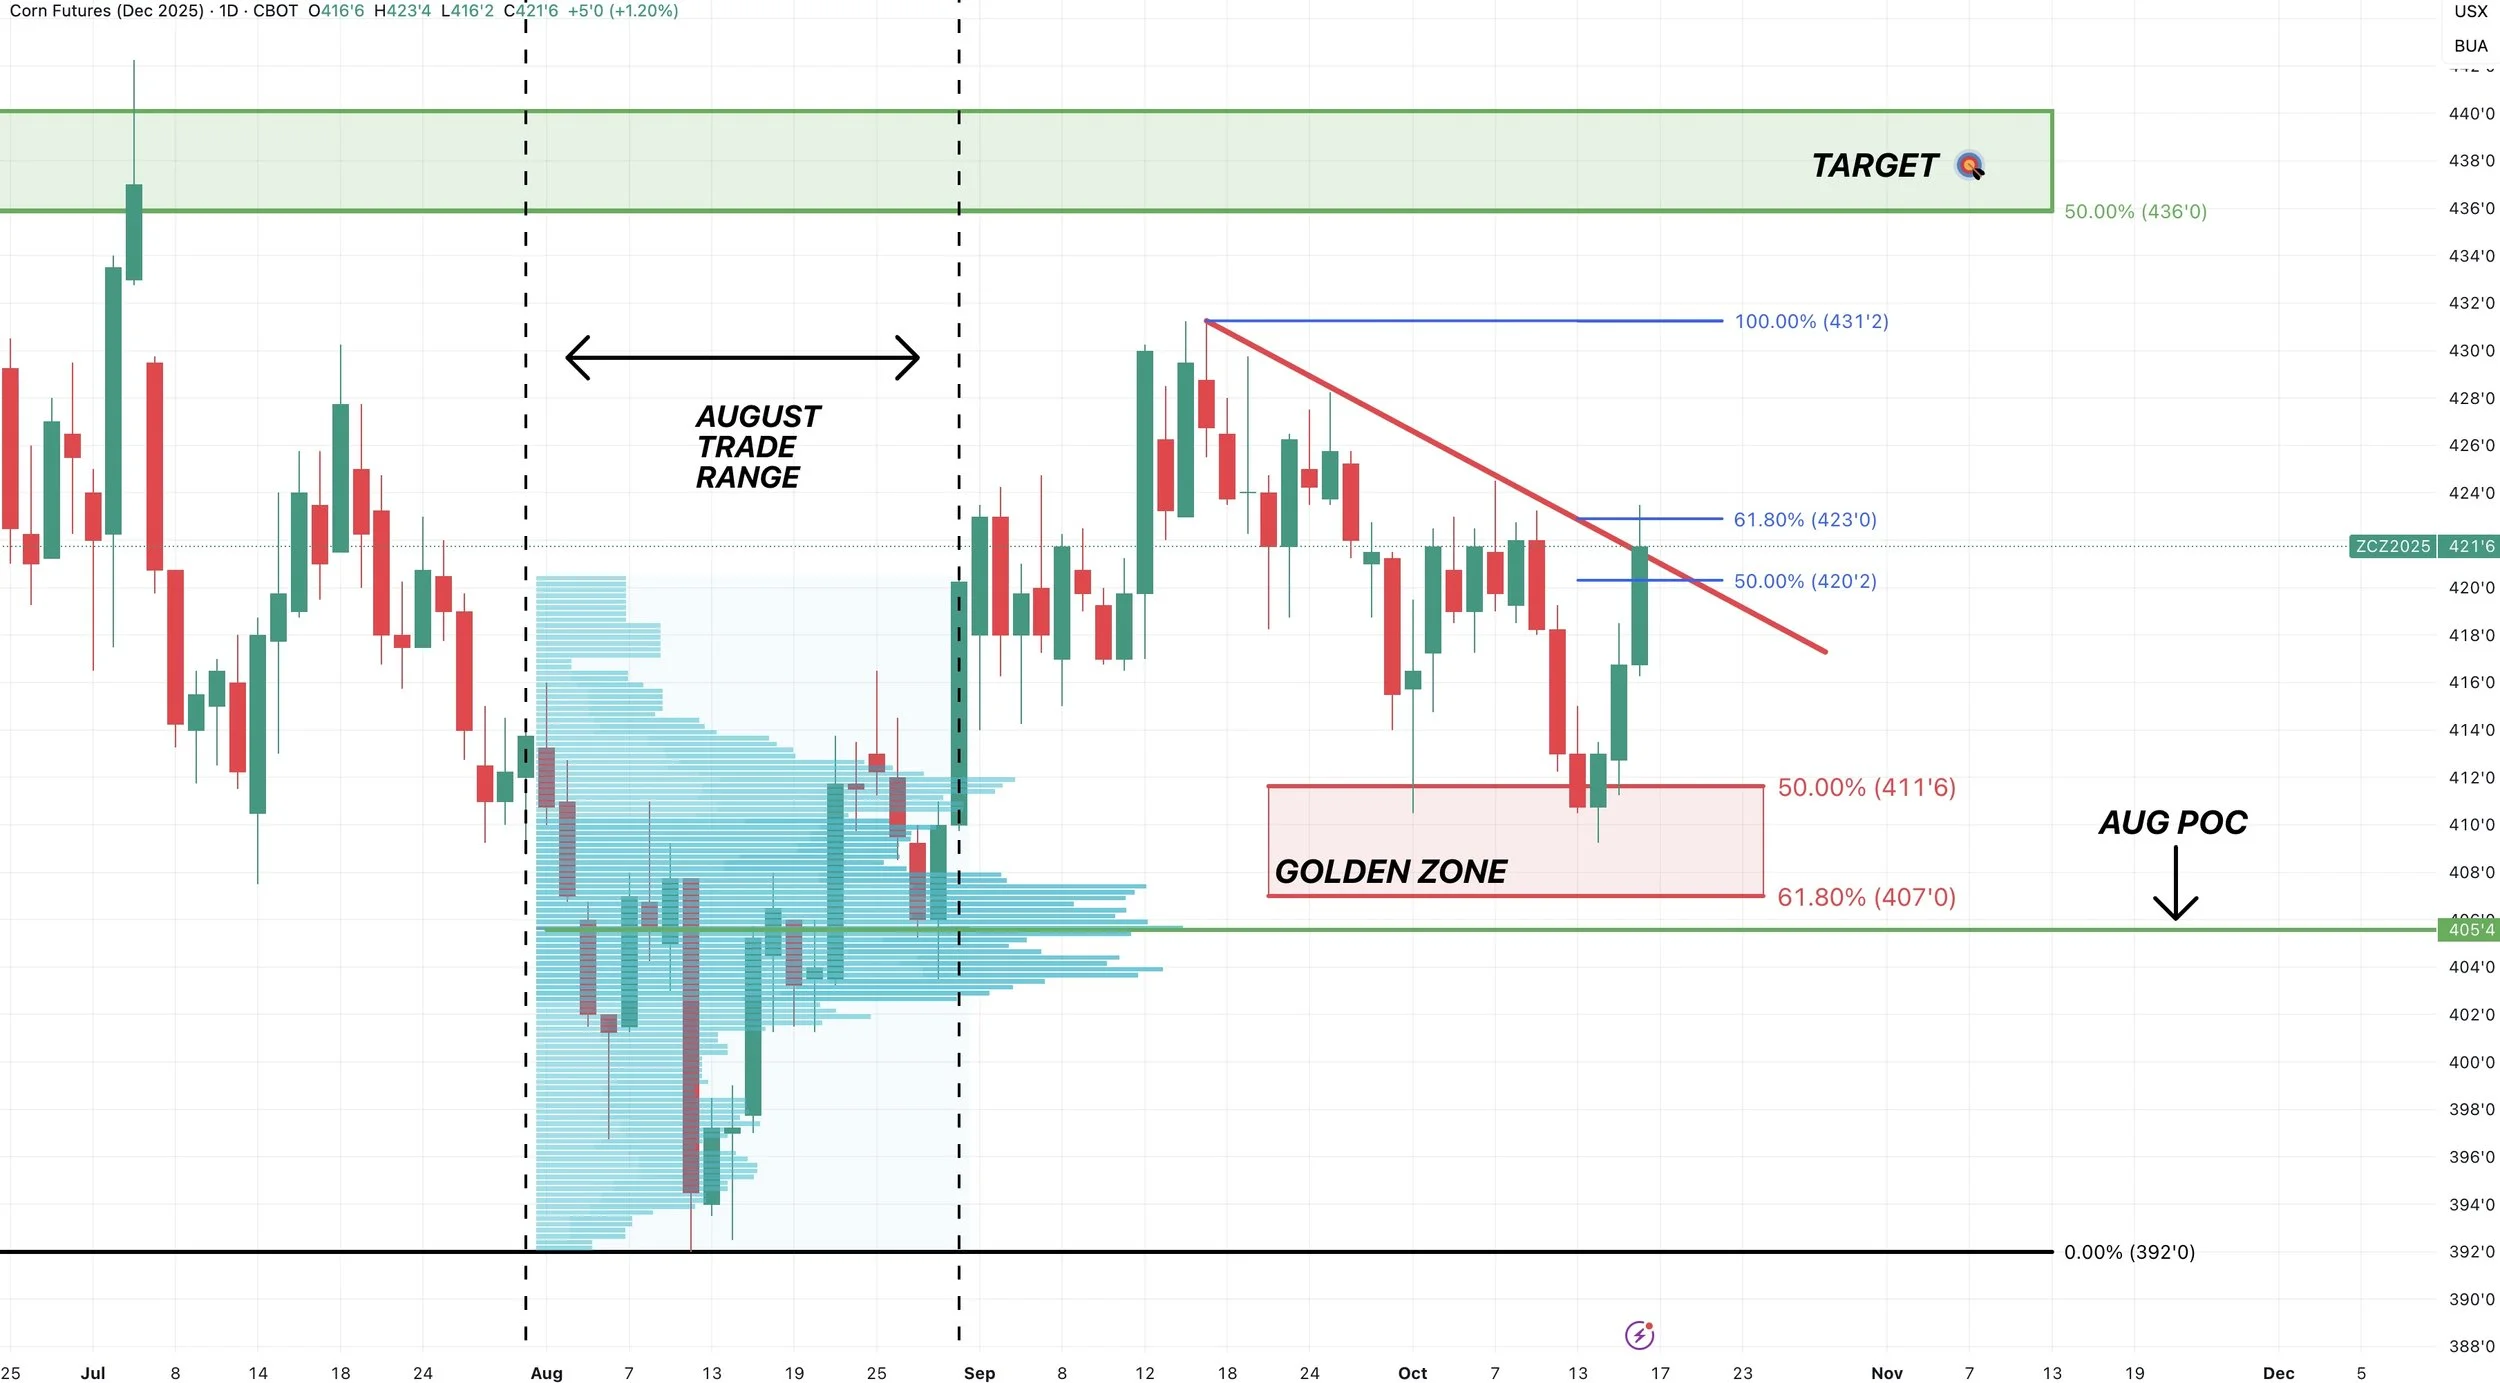
We still have a potential inverse head and shoulders pattern here that is starting to look pretty good.
I don’t want to sound too bullish, but the implied move for this pattern if it plays out takes you back up near those April highs.
Which for now, I think is an overly optimistic target at least short term.

Soybeans
Fundamentals:
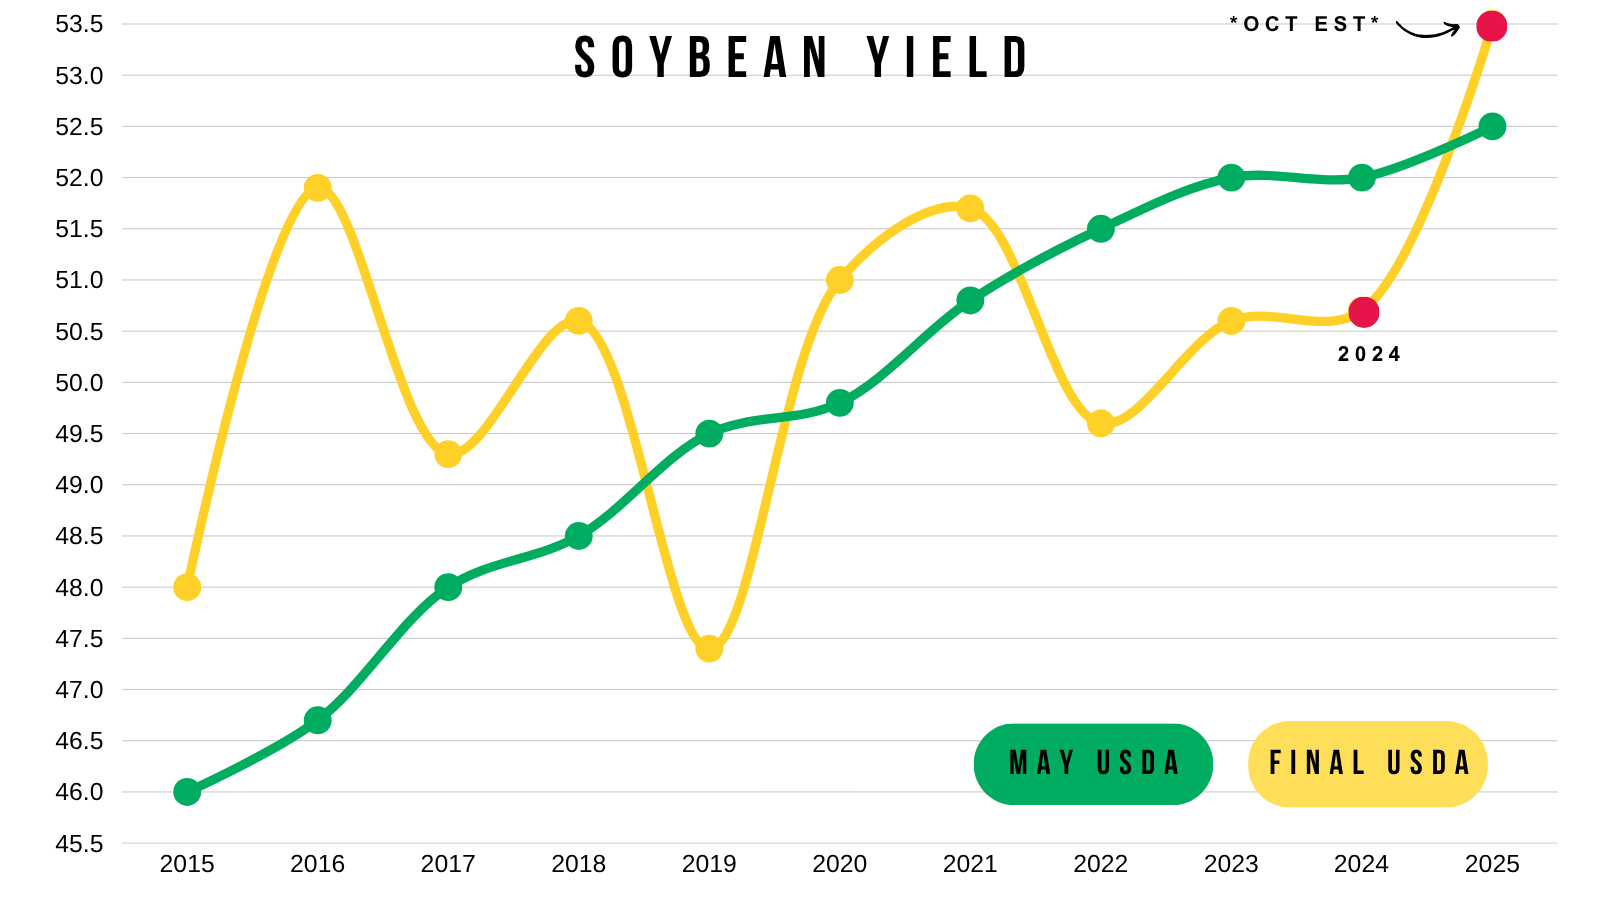
Like corn, let's look at crop conditions.
Earlier this year, we were looking at some of the highest ratings in recent memory.
Flash forward a few months and crop conditions are in the middle the pack.
Actually sitting lower than they were last year.

Here is a visual of inital May yield to final yield.
Our final yield has not came in higher than the intial May yield since 2021.
Crop conditions are not great yield indicators, but does a middle-of-the-pack crop rating really scream yield is far and away a record?
Soybeans are the trickiest market to navigate here.
Because they are going to largely be dictated by what Trump and China do next.
Will China buy any soybeans at all? If they do, you have to imagine it's still going to be a much smaller amount than originally expected.
Will the loss in demand more than offset the loss in supply?
That is the million dollar question.
Last marketing year China bought around 830 million bu of soybeans.
Last trade war marketing year China bought around 500 million bu of soybeans.
Roughly a 300 million bu difference.
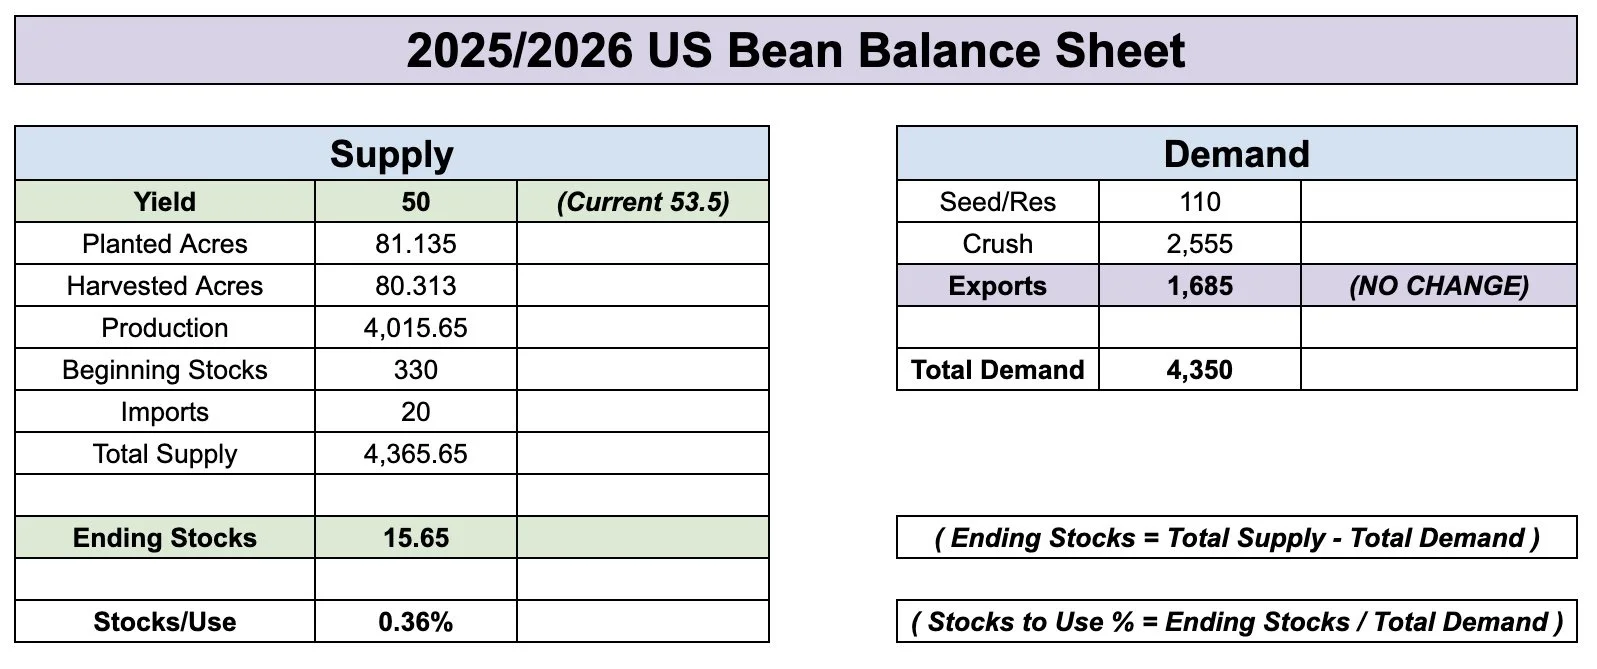
There is a scenario where yield could come in at 50 bpa, but our exports are cut by 300 million, and it would leave the balance sheet completely flat. Exactly where it is today.

Here is the current rough balance sheet for reference.
Sitting at around a 300 million carryout with a 53.5 yield.
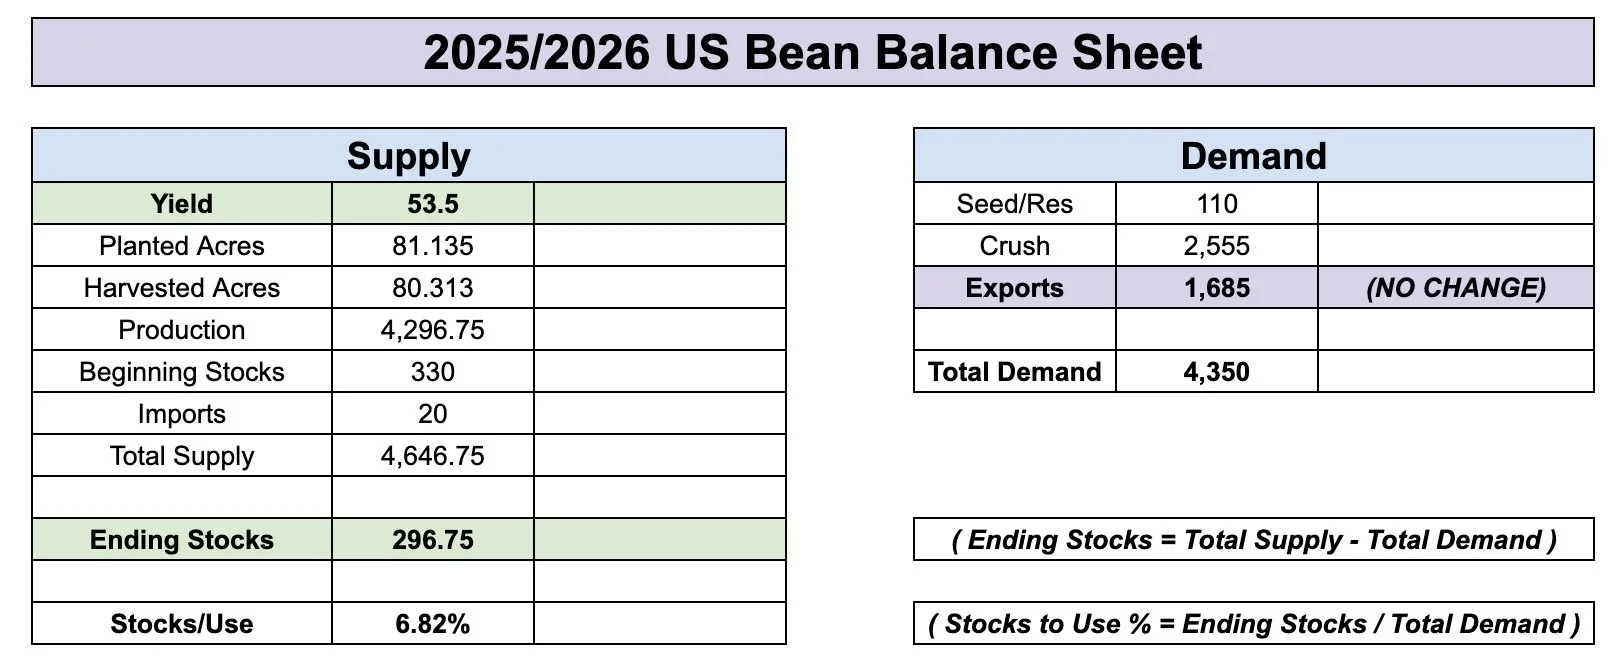
Exports will be cut to some degree, who knows by how much.
If yield gets cut, the USDA will cut some demand regardless.
This scenario could not happen, for the sake of this example, if yield came in at 50 bpa and demand was left unchanged, we run out of soybeans.
That is why this market to so hard to gauge. Because there are endless possibilities and reasons we could be $1 higher or lower in a few months.
Overall, despite all of the trade war fear, soybeans are hanging in there.
Last trade war, soybeans traded below $9.
Last trade war and this trade war are vastly differently.
I think we'll reach an agreement with China.
But who knows if the deal will have anything to do with soybeans. Maybe China buys some soybeans as a good will offer. It is impossible to know.
What we do know is that soybeans are on Trump's radar. As he's now tweeted about soybeans a few times.
You can’t get overly bullish or bearish on soybeans given all the unknowns.
Currently, there is around a 70% chance we will reach a tariff agreement with China by November 10th.
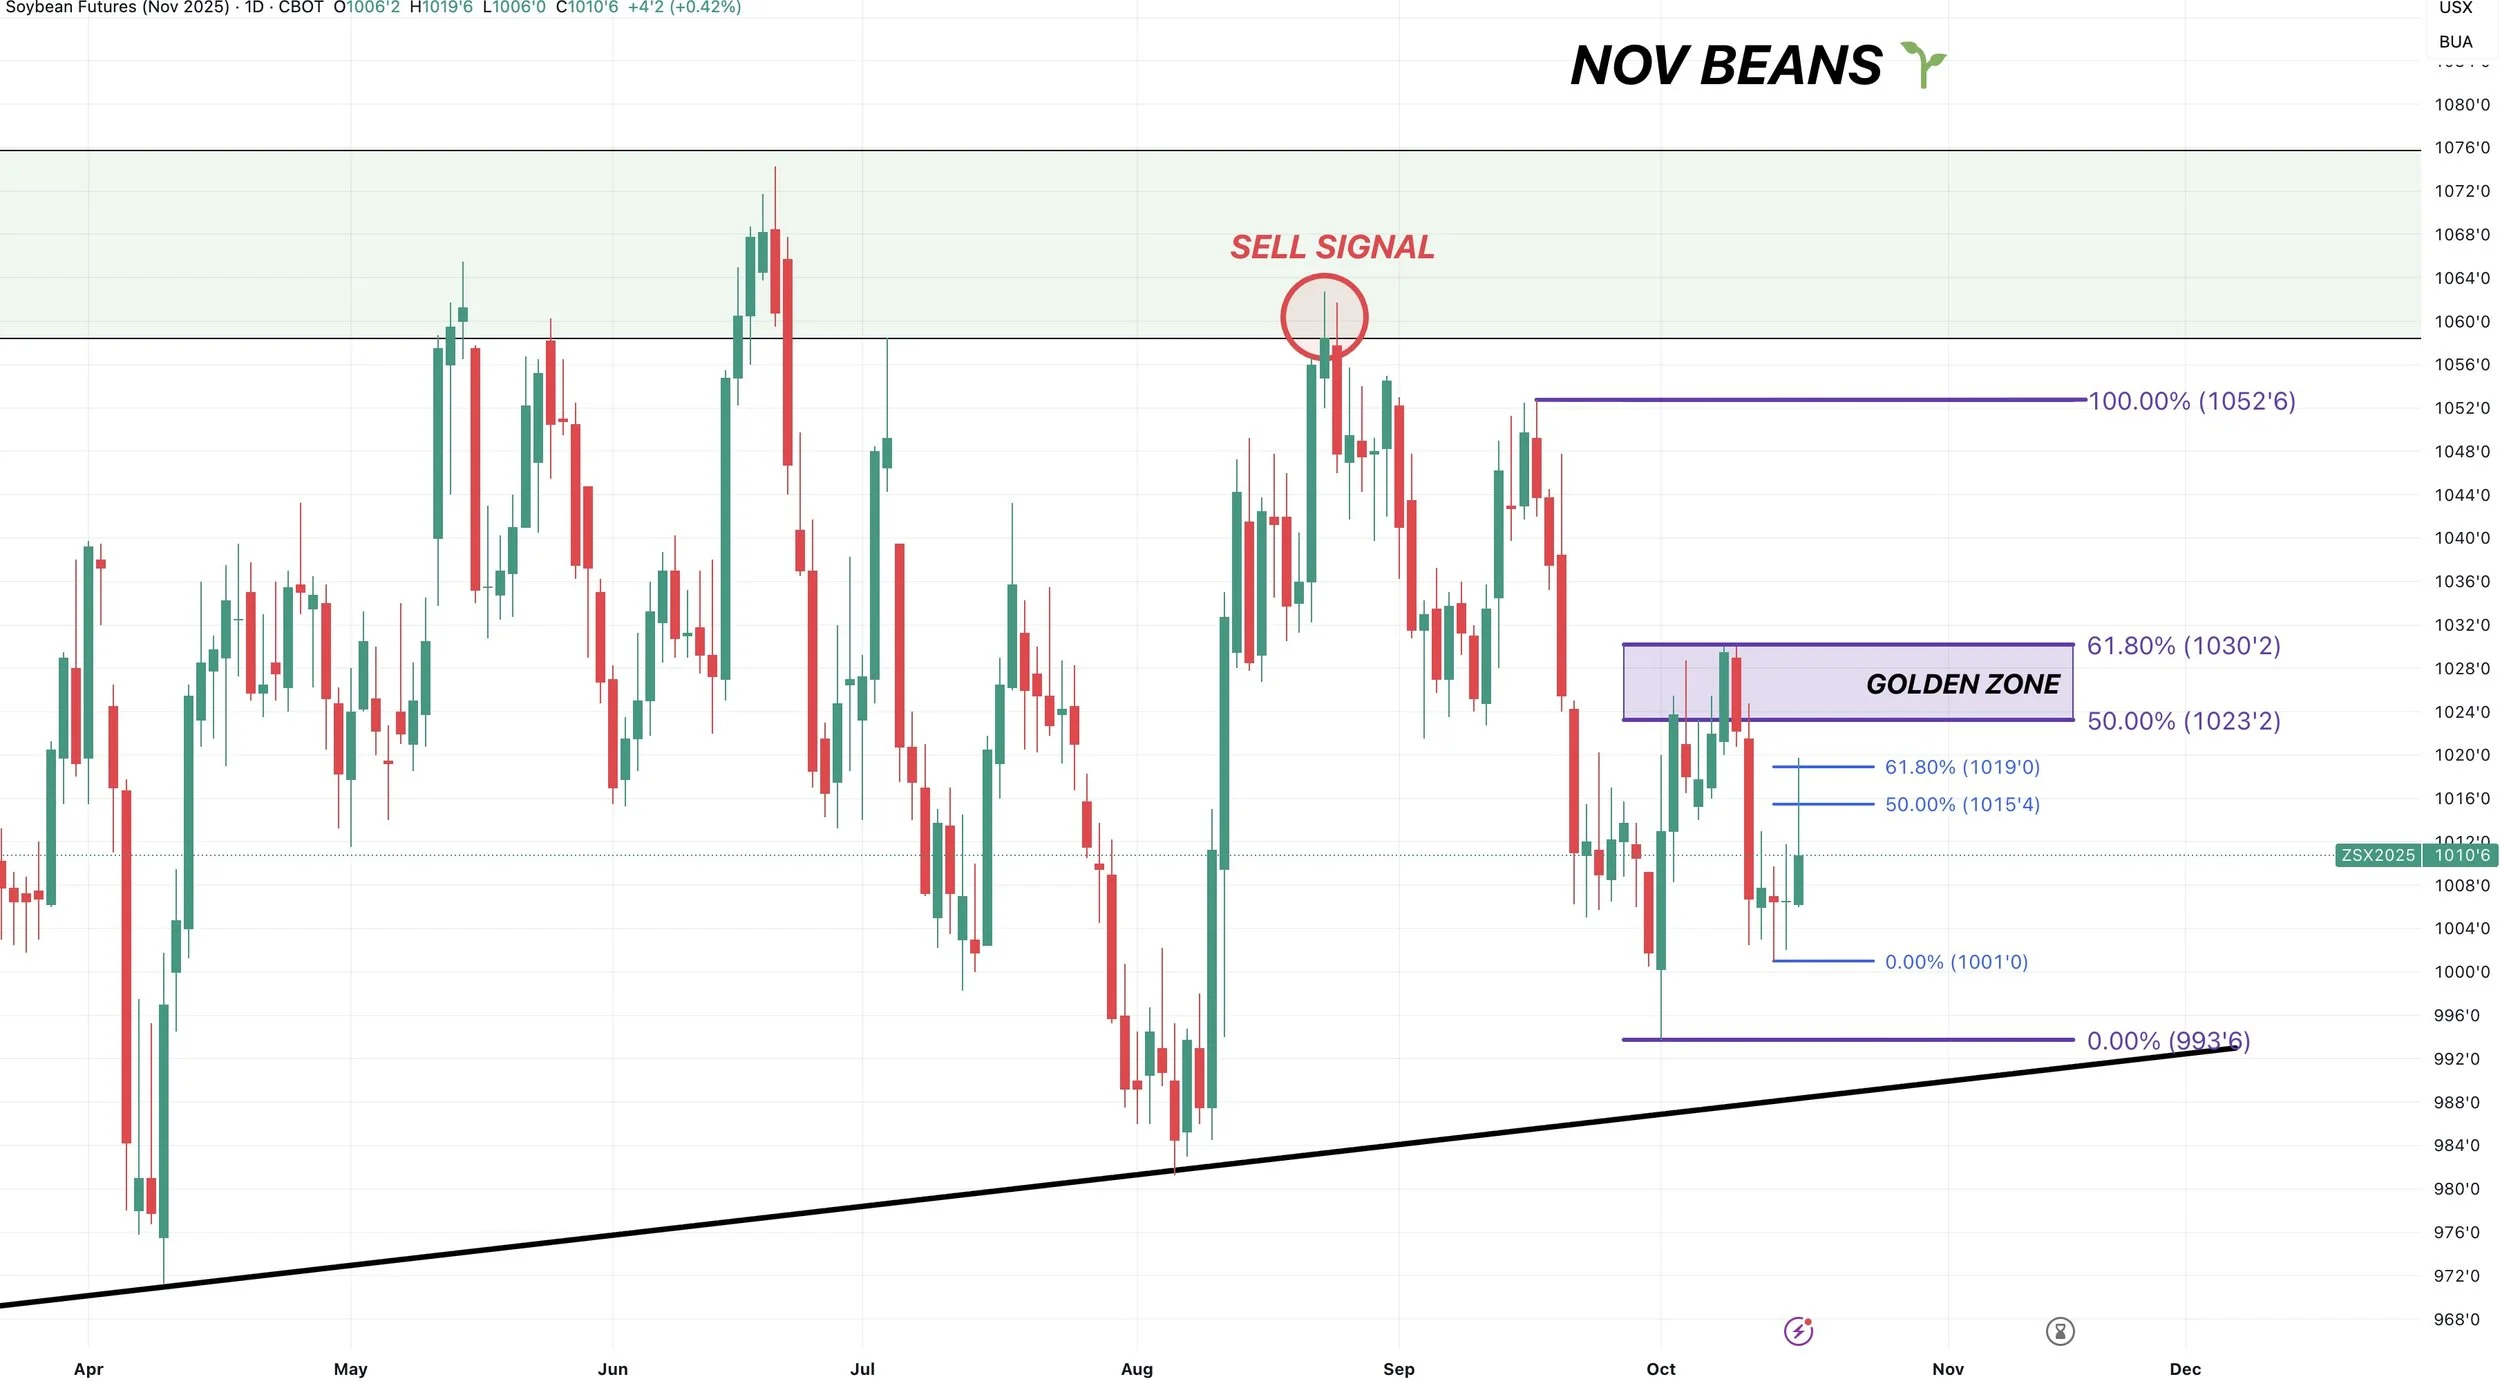
Technicals:
Today's price action was not great in soybeans.
We closed almost a dime off the highs.
Before backing off the highs, we reclaimed 61.8% of this recent sell off from last week before failing.
The most common place for a bounce to fail.
Big picture, until we close above $10.30 the risk remains lower.
Closing above there would be a sentiment shift and indicate we've found a true bottom.
Wheat
Fundamentals:
Nothing new in the wheat market.
Wheat demand has been great, which is nice to see.
Wheat isn’t buying any acres down here.
But we still lack a real reason for the funds to decide to stop pounding this market lower and ride it down.
The wheat market is one that can randomly catch a bid for no reason and offer a nice opportunity after grinding lower for months.
I am simply waiting for that opportunity, even if it takes way longer than I'd like.
We are at 5 year lows. I don’t know anyone who wants to sell at 5 year lows.
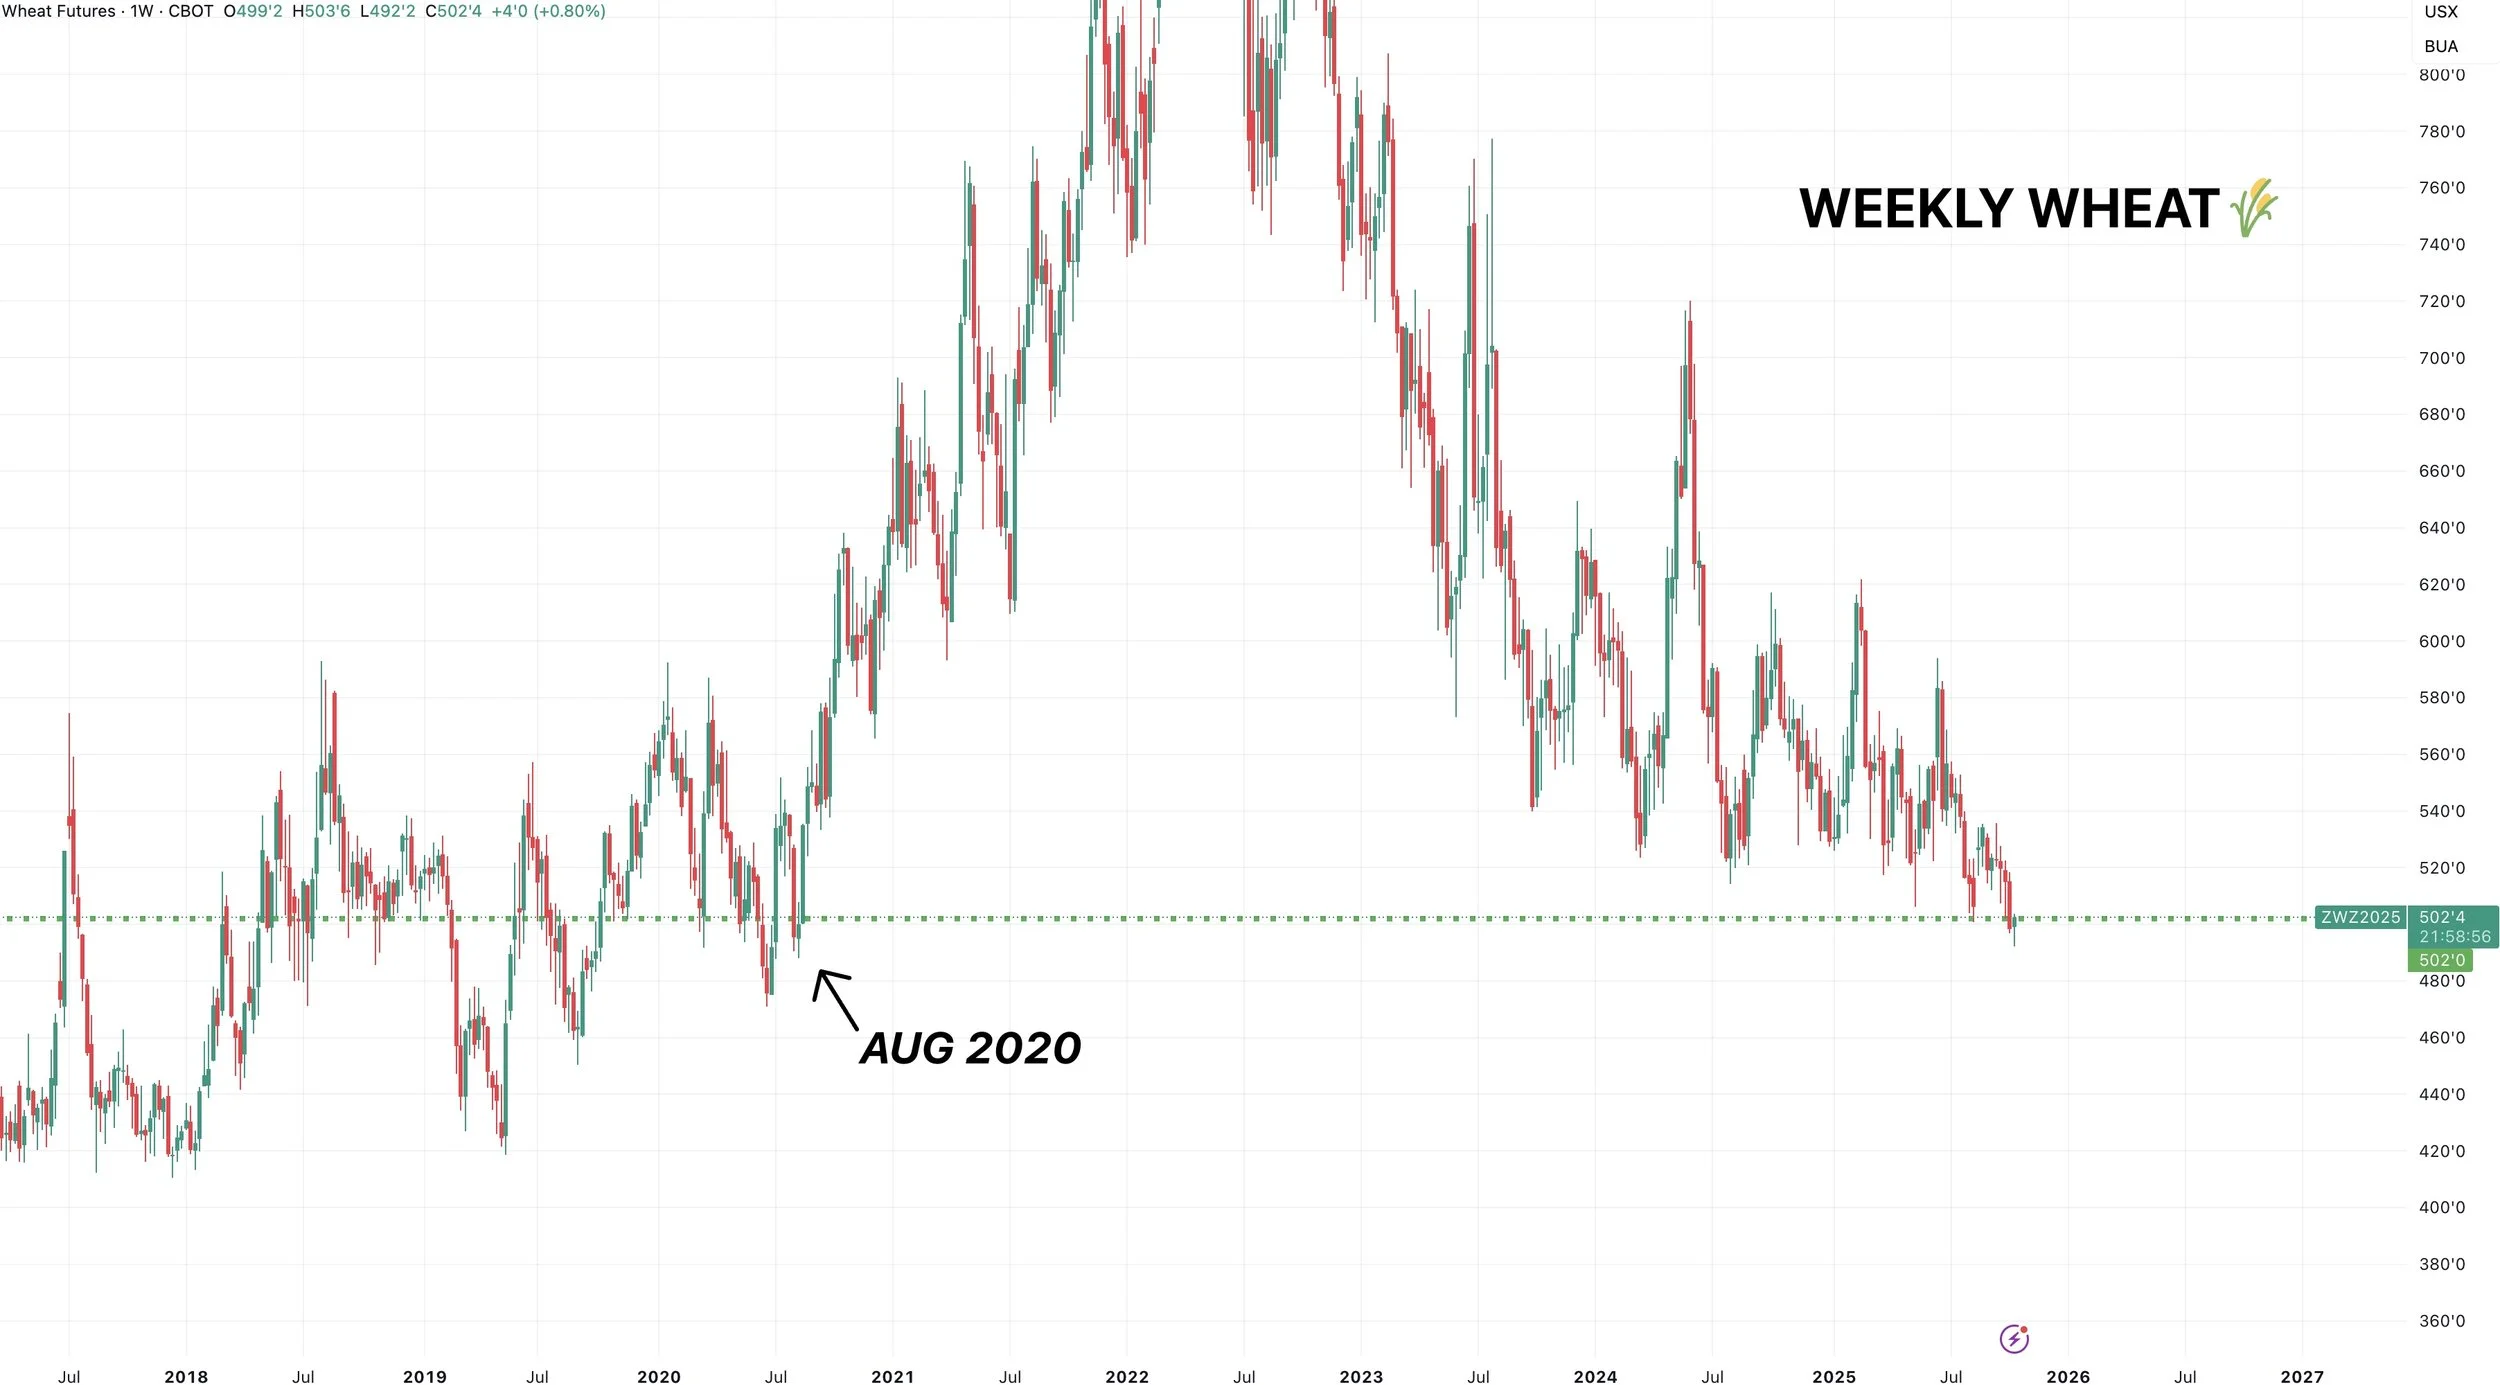
Dec Wheat Technicals:
I've liked the wheat price action the last few days.
We've rallied off the early lows for 3 days in a row now.
But this market will humble you.
I thought we would’ve posted our lows a while ago, but clearly that hasn’t been the case.
If this market decides to turn around, I think we reasonably have at least around +40 cents of upside.
With the first target being at $5.39 for now.

Dec KC Wheat Technicals:
When KC decides to turn around, I think we also have around +40 cents of upside.

Cattle
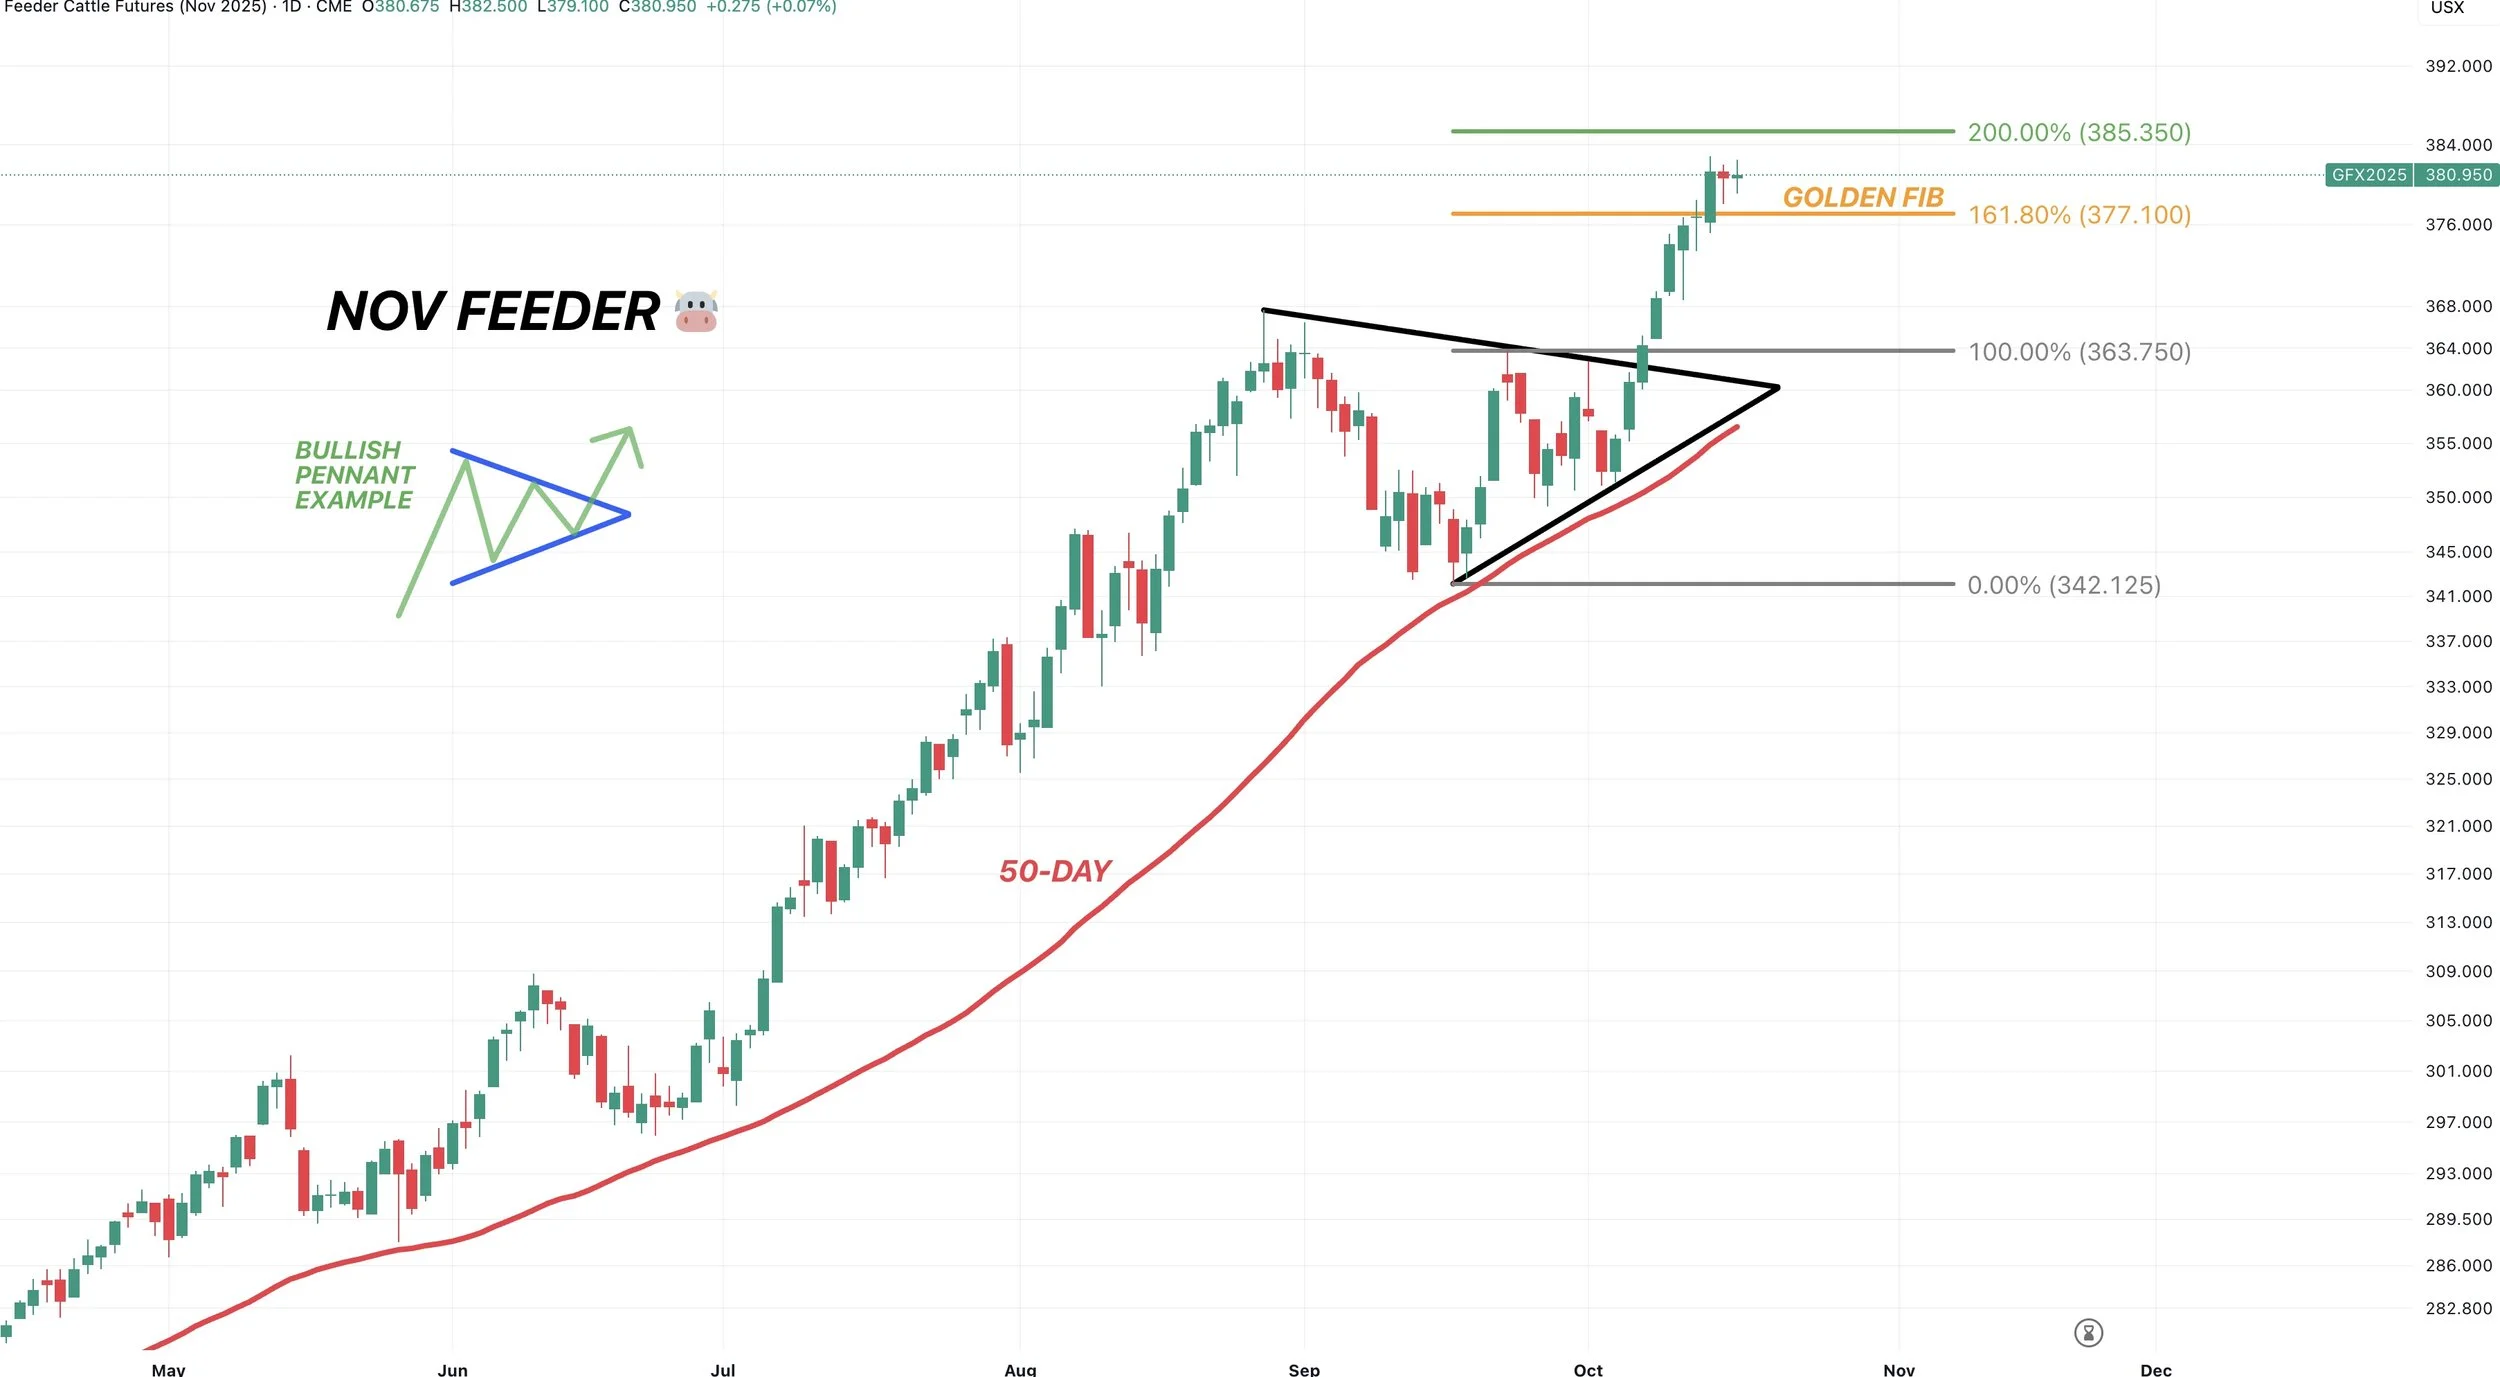
Nov Feeder Chart:
Nov feeder is smack dab in the middle of our target zone.
I like managing my risk up here in this target zone.
We are between the 161.8% (most common) and 200% retracements from that mid to late Sep rally.
This is a common spot for a rally to take a breather.
I am not calling a top in this market.
We are in a bull market. Bull markets can run higher than anyone thinks they can.
I do not want to try timing a top, I just want to manage my risk where it makes sense to do so.
Use strategies that embrace bull markets.
Call or text us if you want to talk about specific strategies you could use.
(605)295-3100.
We haven’t had a real correction in this market in a long time.
The 50-day MA is going to be our key indicator this market is ready for a real correction. If that gives out, it'll be a warning sign.
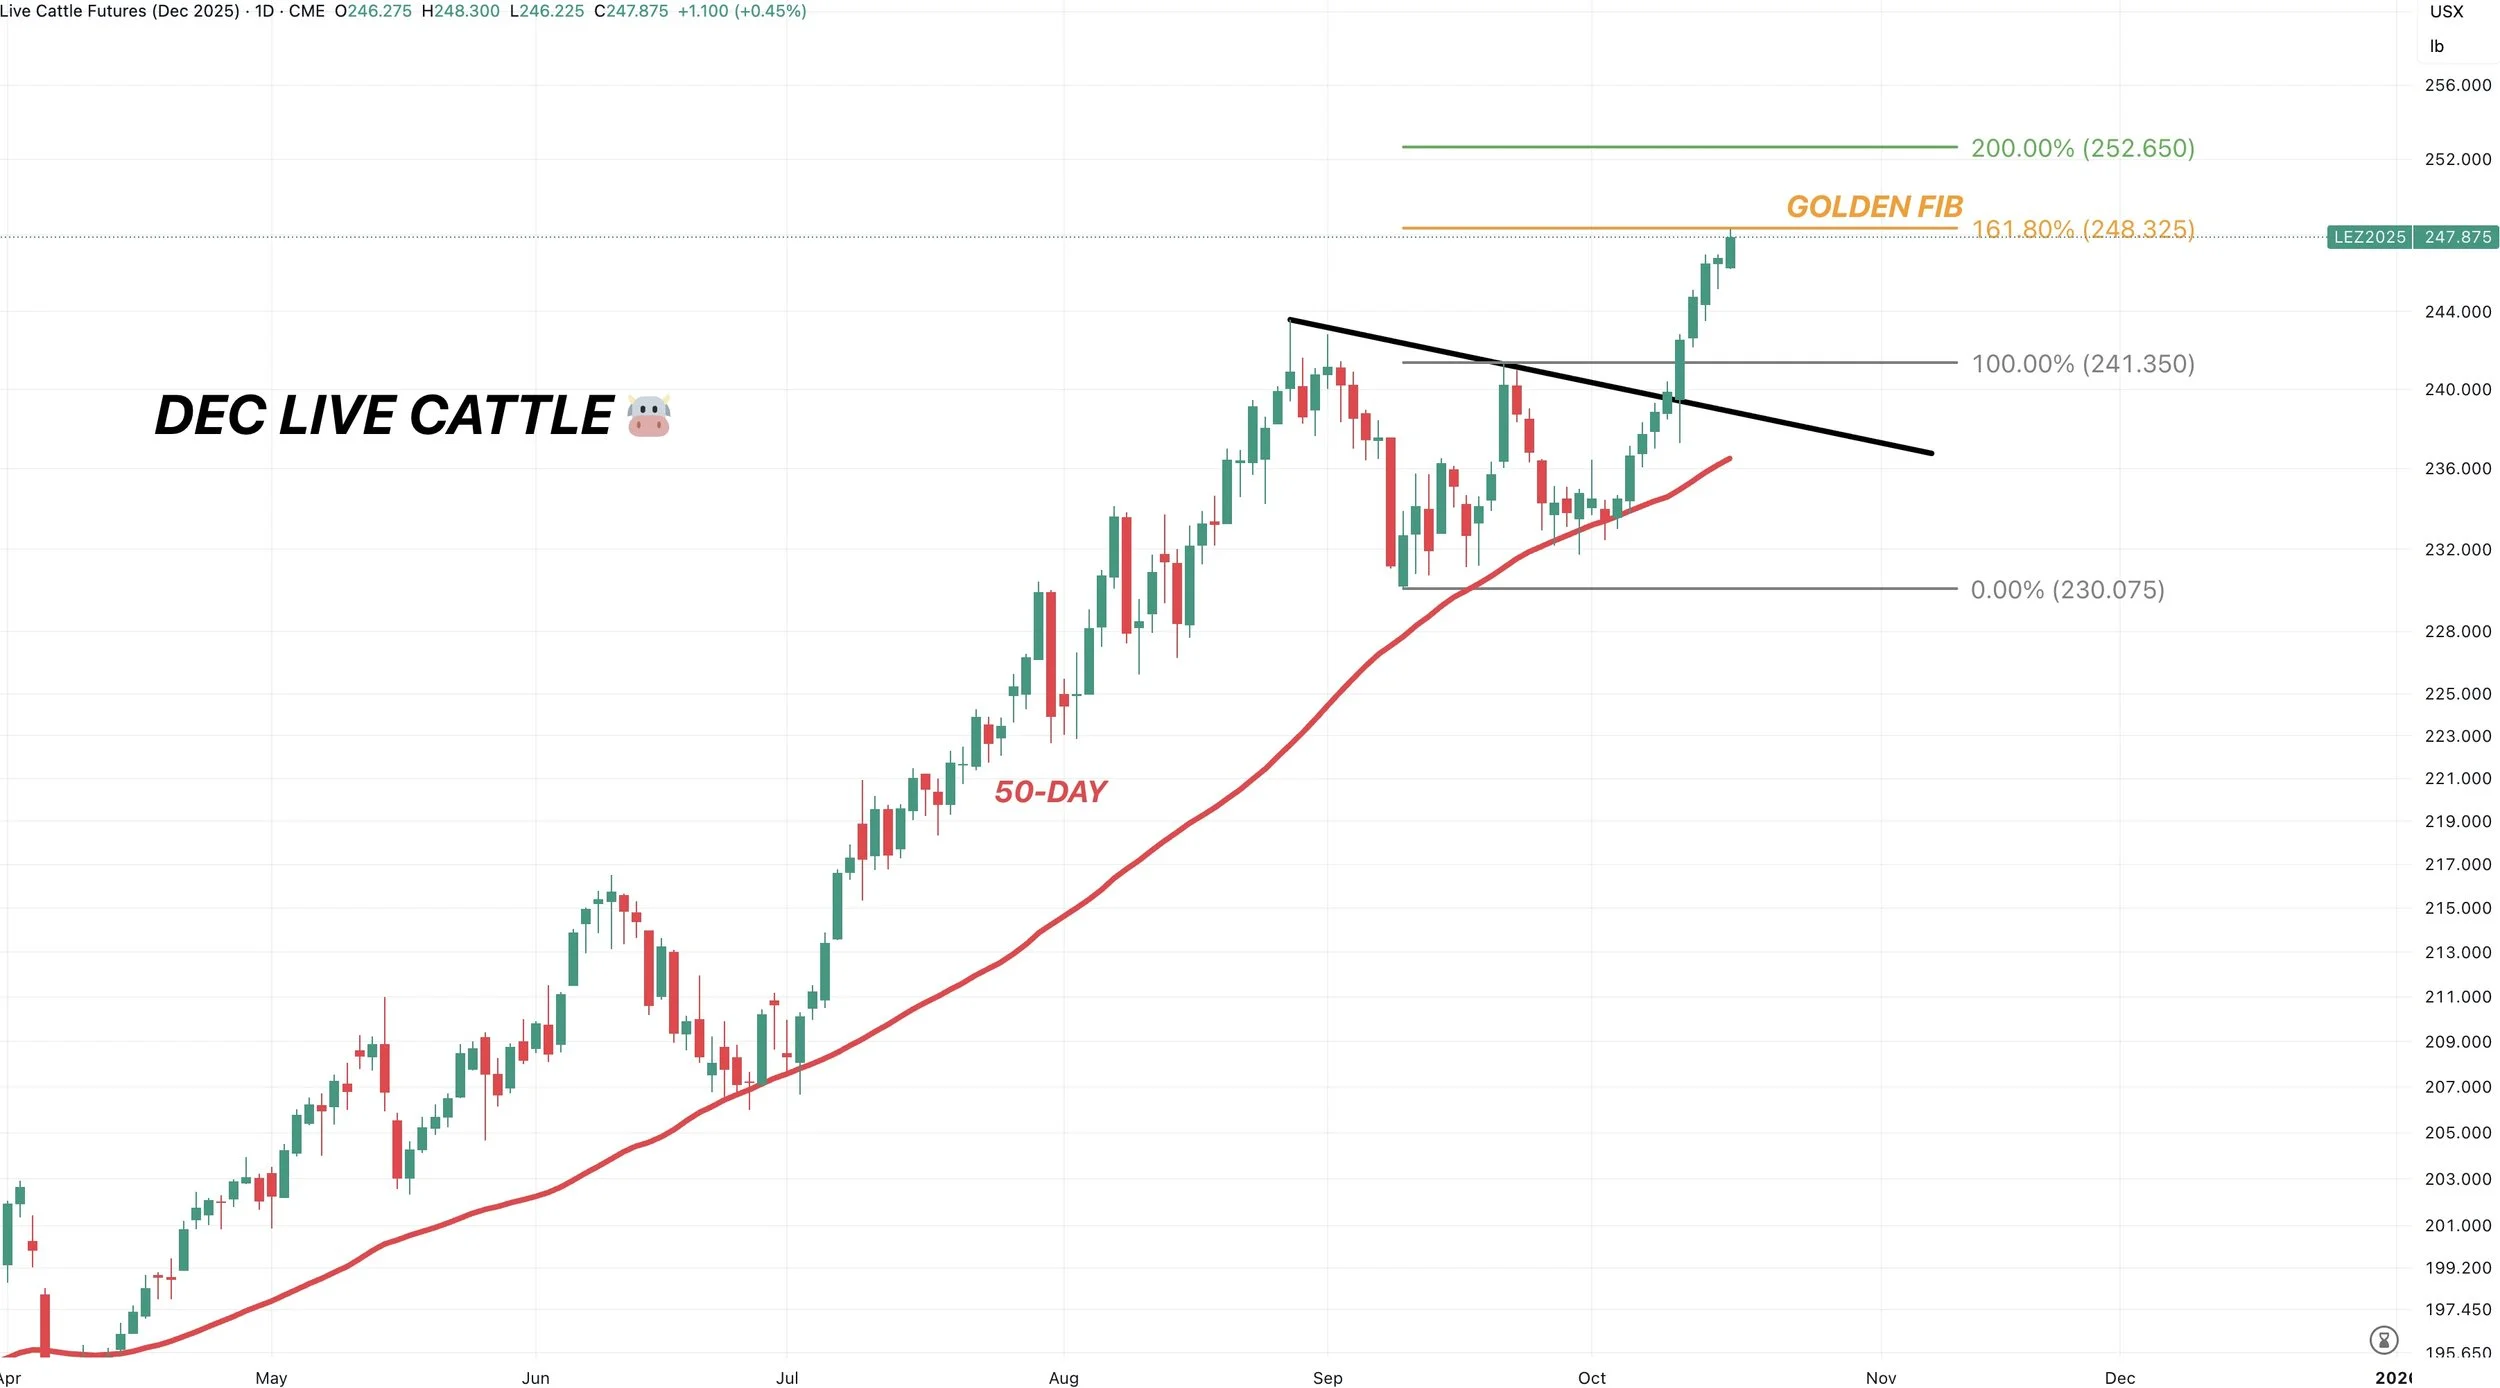
Dec Live Cattle:
Live cattle finally hit that golden fib target.
I like rewarding this rally.
Again, I am not calling a top.
However, this level is the most common spot to stall. So defending this level makes sense here.
Past Sell or Protection Signals
Oct 13th: 🐮
Cattle sell signal & hedge alert.
Aug 22nd: 🌱
Soybean sell signal & hedge alert.
July 31st: 🐮
Cattle sell signal & hedge alert.
July 10th: 🐮
Cattle sell signal & hedge alert.
CLICK HERE TO VIEW
June 5th: 🐮
Cattle sell signal & hedge alert.
June 2nd: 🌾
MPLS wheat sell signal.
April 10th: 🌽
Old crop corn sell signal.
March 19th: 🐮
Cattle hedge & sell signal.
Feb 18th: 🌽 🌾
Old crop KC wheat & old crop corn signal.
Jan 23rd: 🌽 🌱
Corn & beans old crop sell signal.
CLICK HERE TO VIEW
Jan 15th: 🌽 🌱
Corn & beans hedge alert/sell signal.
Jan 2nd: 🐮
Cattle hedge alert at new all-time highs & target.
Dec 11th: 🌽
Corn sell signal at $4.51 200-day MA
CLICK HERE TO VIEW
Oct 2nd: 🌾
Wheat sell signal at $6.12 target
Sep 30th: 🌽
Corn protection signal at $4.23-26
Sep 27th: 🌱
Soybean sell & protection signal at $10.65
Sep 13th: 🌾
Wheat sell signal at $5.98
May 22nd: 🌾
Wheat sell signal when wheat traded +$7.00
Want to Talk?
Our phones are open 24/7 for you guys if you ever need anything or want to discuss your operation.
Hedge Account
Interested in a hedge account? Use the link below to set up an account or shoot Jeremey a call at (605)295-3100.