
WAR & CRUDE PULL GRAINS HIGHER
MARKET UPDATE
You can scroll to read the usual update as well. As the written version is the exact same as the video.
Timestamps for video:
Overview: 0:00min
Corn: 4:50min
Beans: 8:30min
Wheat: 9:30min
Cattle: 11:25min
Want to talk about your situation?
(605)250-3863
Futures Prices Close
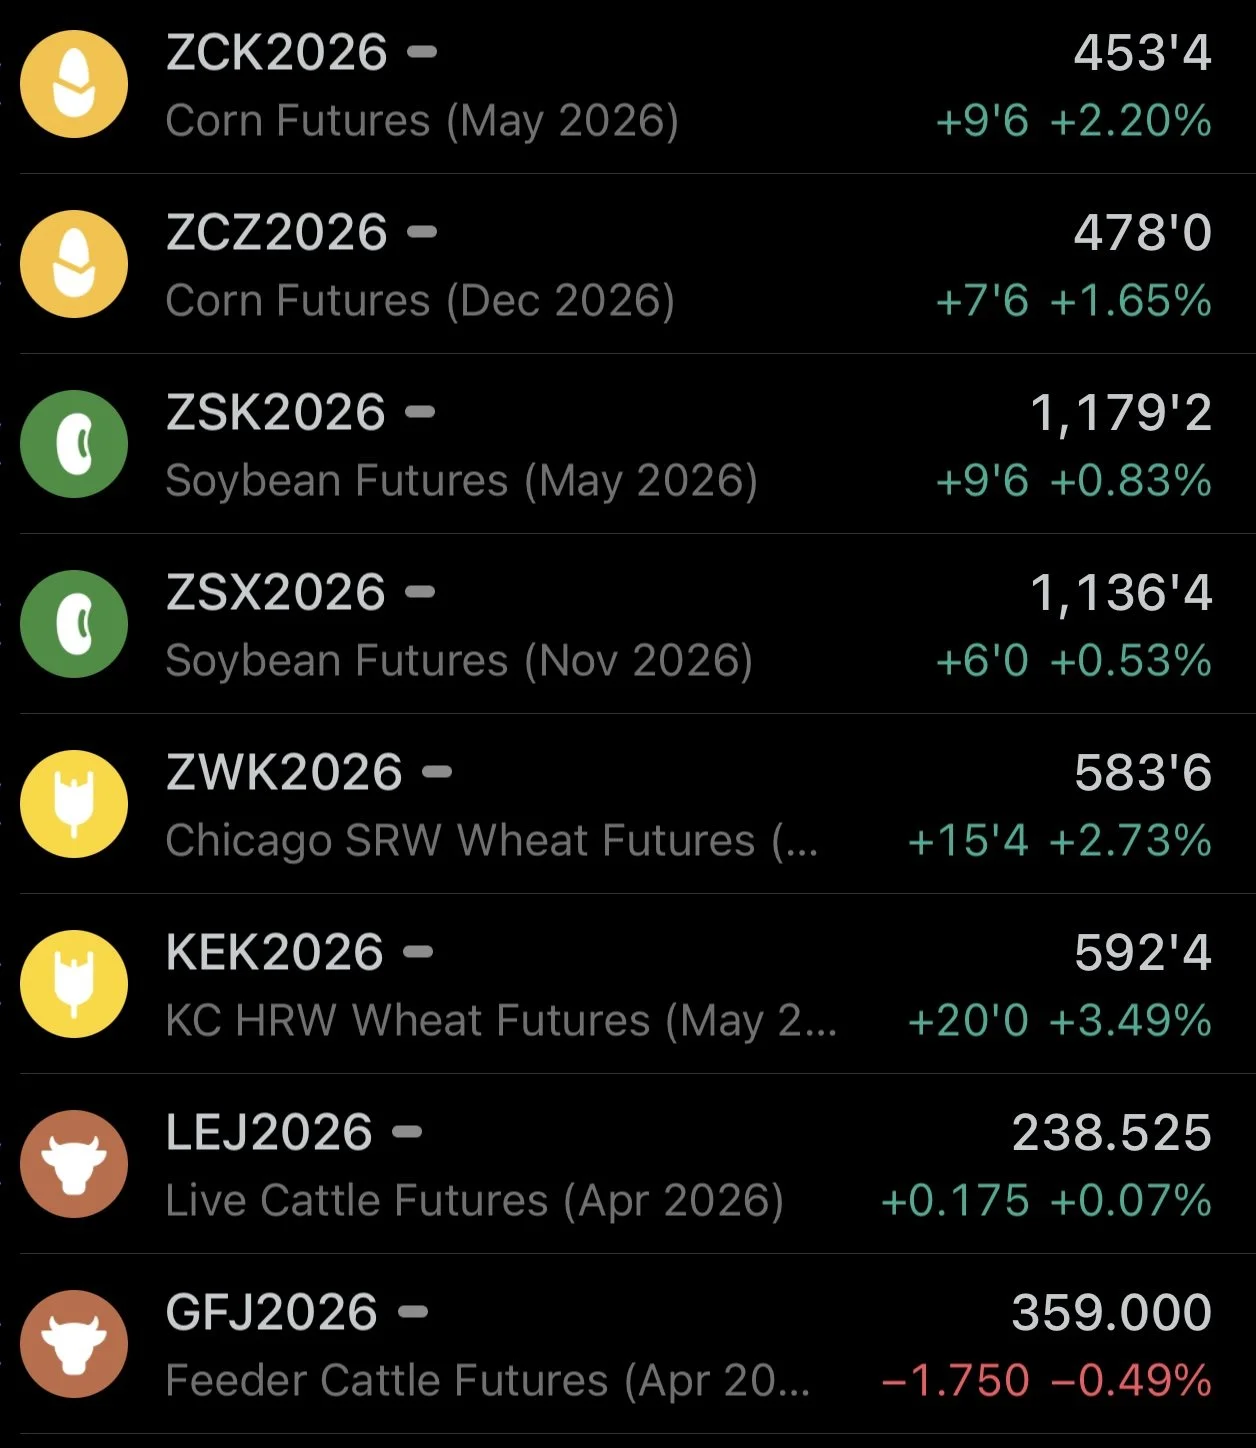
Overview
Grains catch a bid while the wheat market leads the way.
We've got a USDA report next Tuesday.
The trade isn’t expecting any major changes to the old crop balance sheets, as the March report doesn’t tend to provide any huge changes.
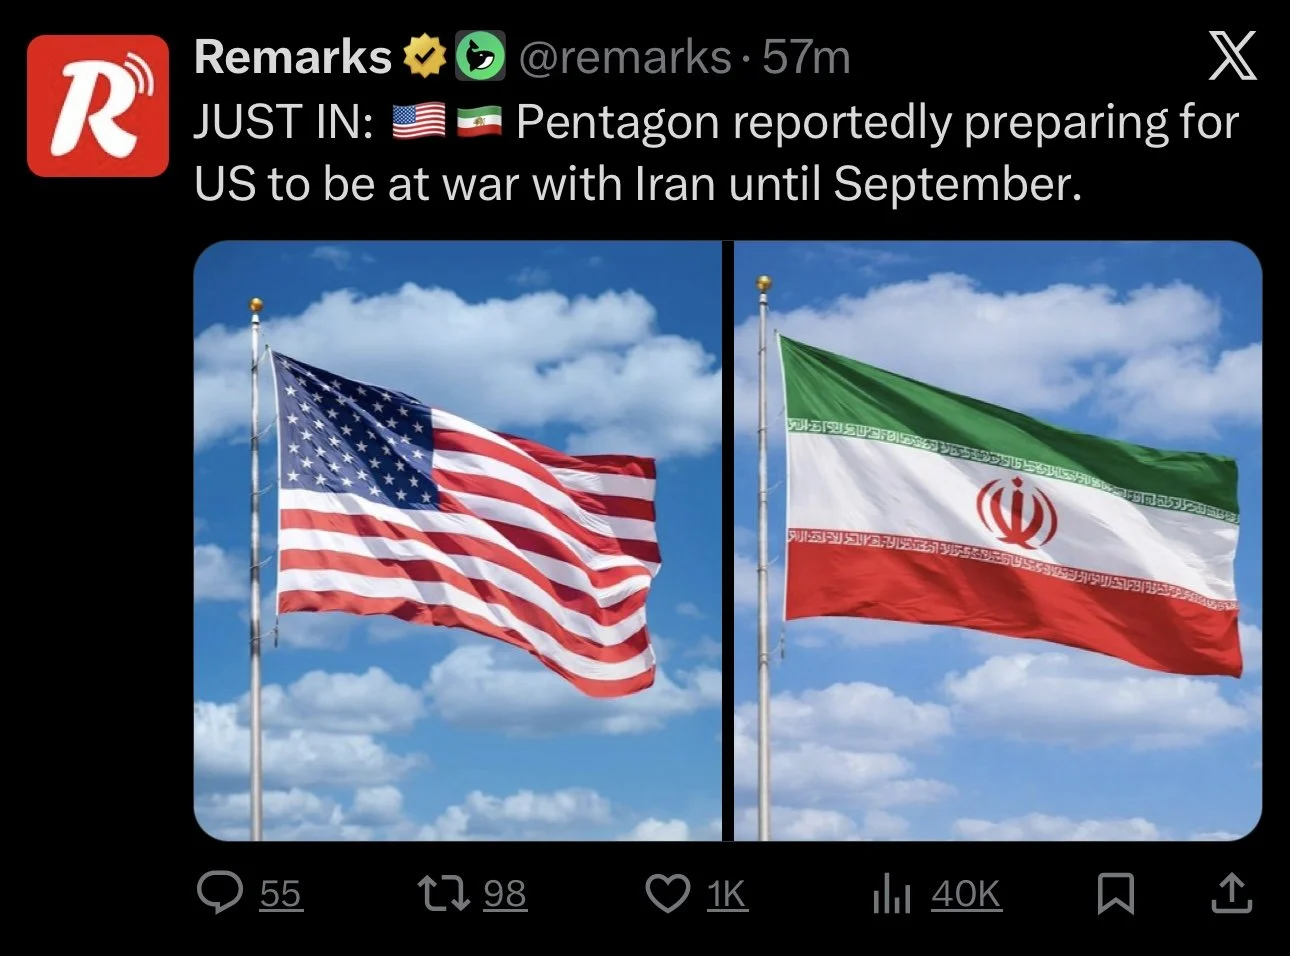
Crude oil rallied $6 today. Which helped pull corn and wheat higher, as there was reports that the Middle East tensions might not be de-escalating.
The pentagon is reportedly preparing for the US to be at war with Iran until September.
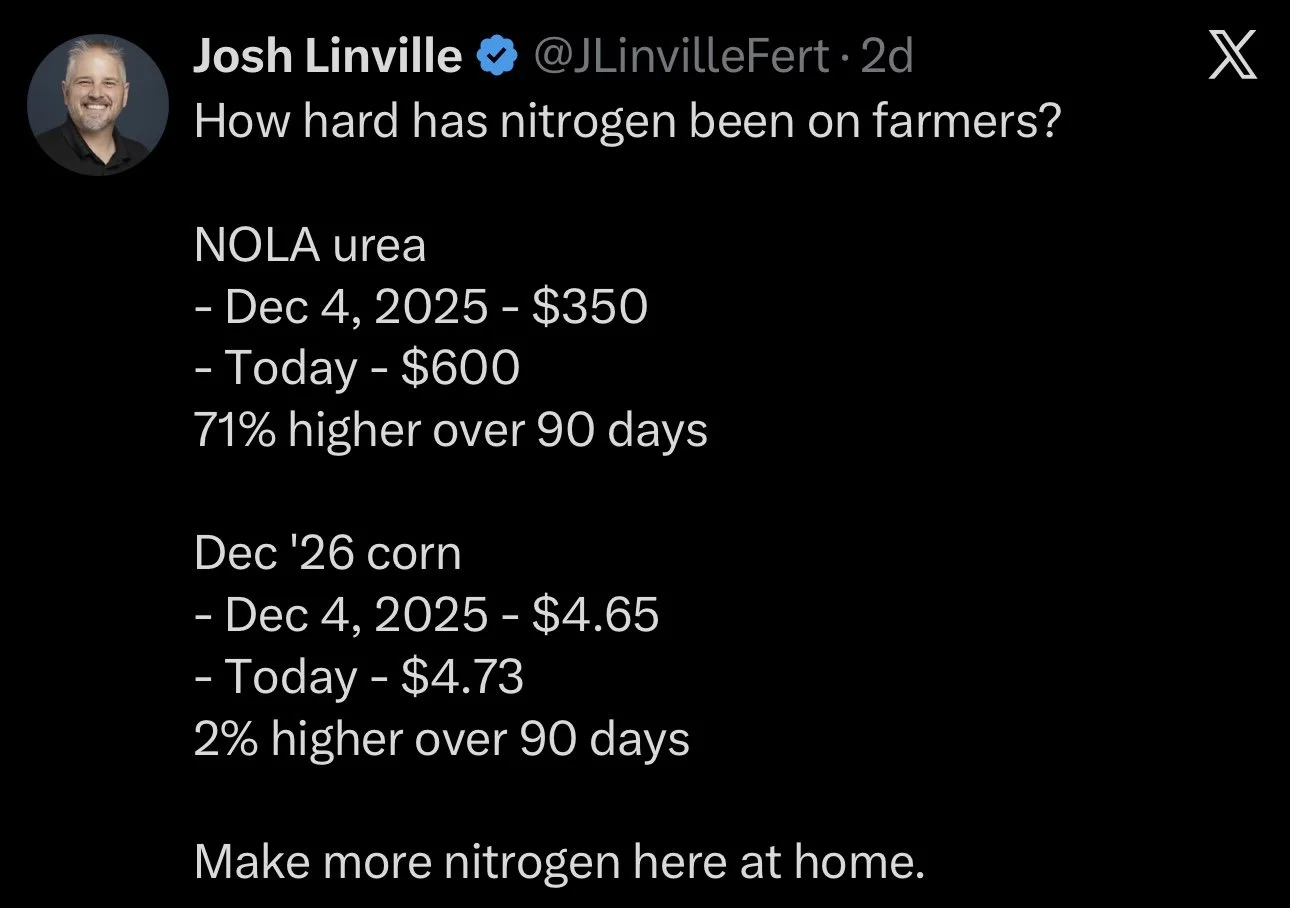
Along with crude oil, this Iran story is leading to fertilizer going through the roof.
It's up 70% over the last 3 months.
The middle east doesn’t produce any grain, but when there is geopolitical concerns, it spills over to corn and wheat. Wheat is a geopolitical commodity.
Iran doesn’t produce a crazy amount of oil. So this war doesn’t structurally change oil.
The market is concerned about the logistical issues the Iran situation creates.
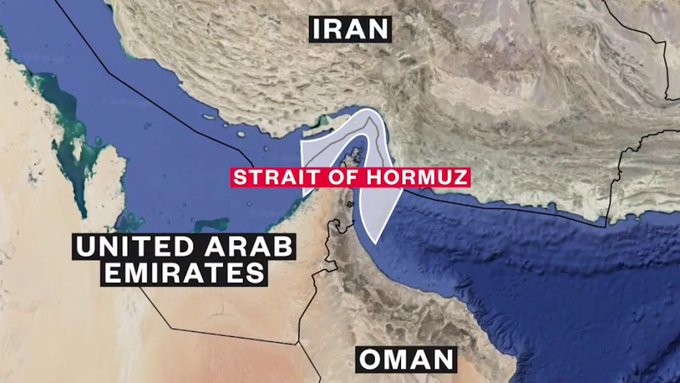
The war led to the Strait of Hormuz being effectively shut down.
Technically, it is open.
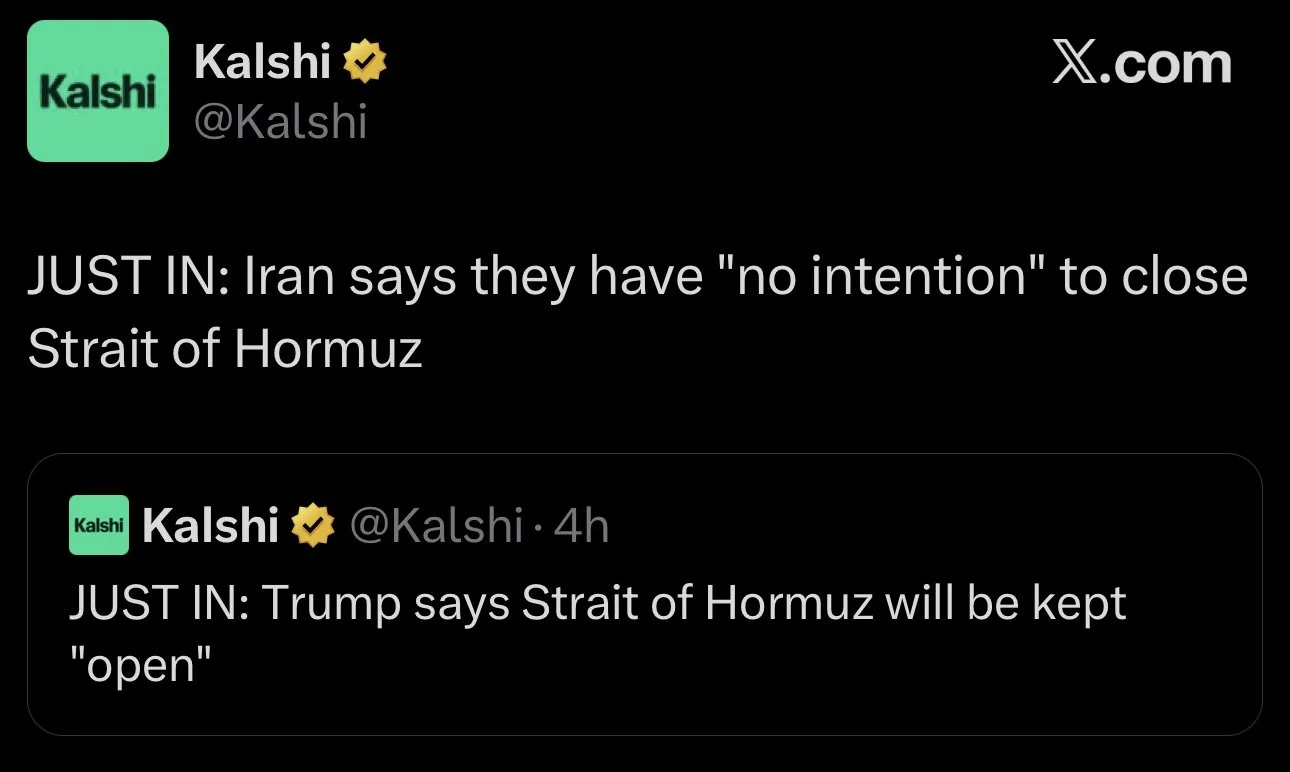
But it's basically blocked.
Here is the traffic through the strait since the strikes last weekend.
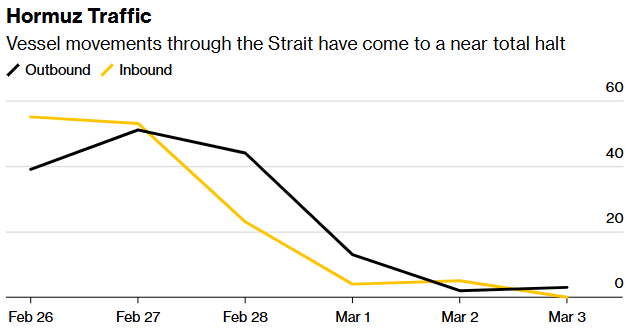
Ships won’t pass through it because insurance companies won’t insure ships passing through it. If they can find insurance, the costs have sky rocketed.
This is a big deal because 20% of the world's entire oil supply gets passed through there.
Roughly 1/3 of the world's fertilizer gets passed through there.
So it's really going to come down to when they open the Strait back up.
If they open it back up quick, the flow can start again and fertilizer prices should start to decline again.
But if it stays shut down, the concern is going to grow.
Yesterday it seemed like there was some optimism that it would re-open, but it looks like that optimism faded today.
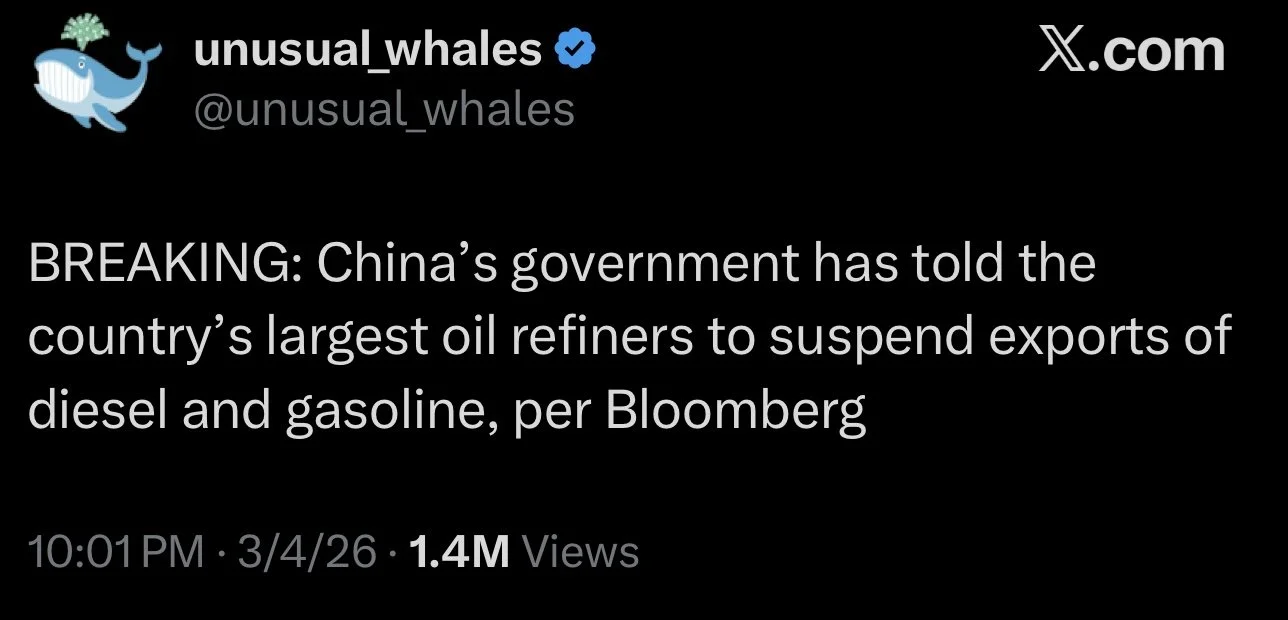
China's government ordered their refiners to suspend gasoline exports due to the closure of the Strait.
Basically China is worried about a supply crunch coming so they are stocking up.
Crude Oil
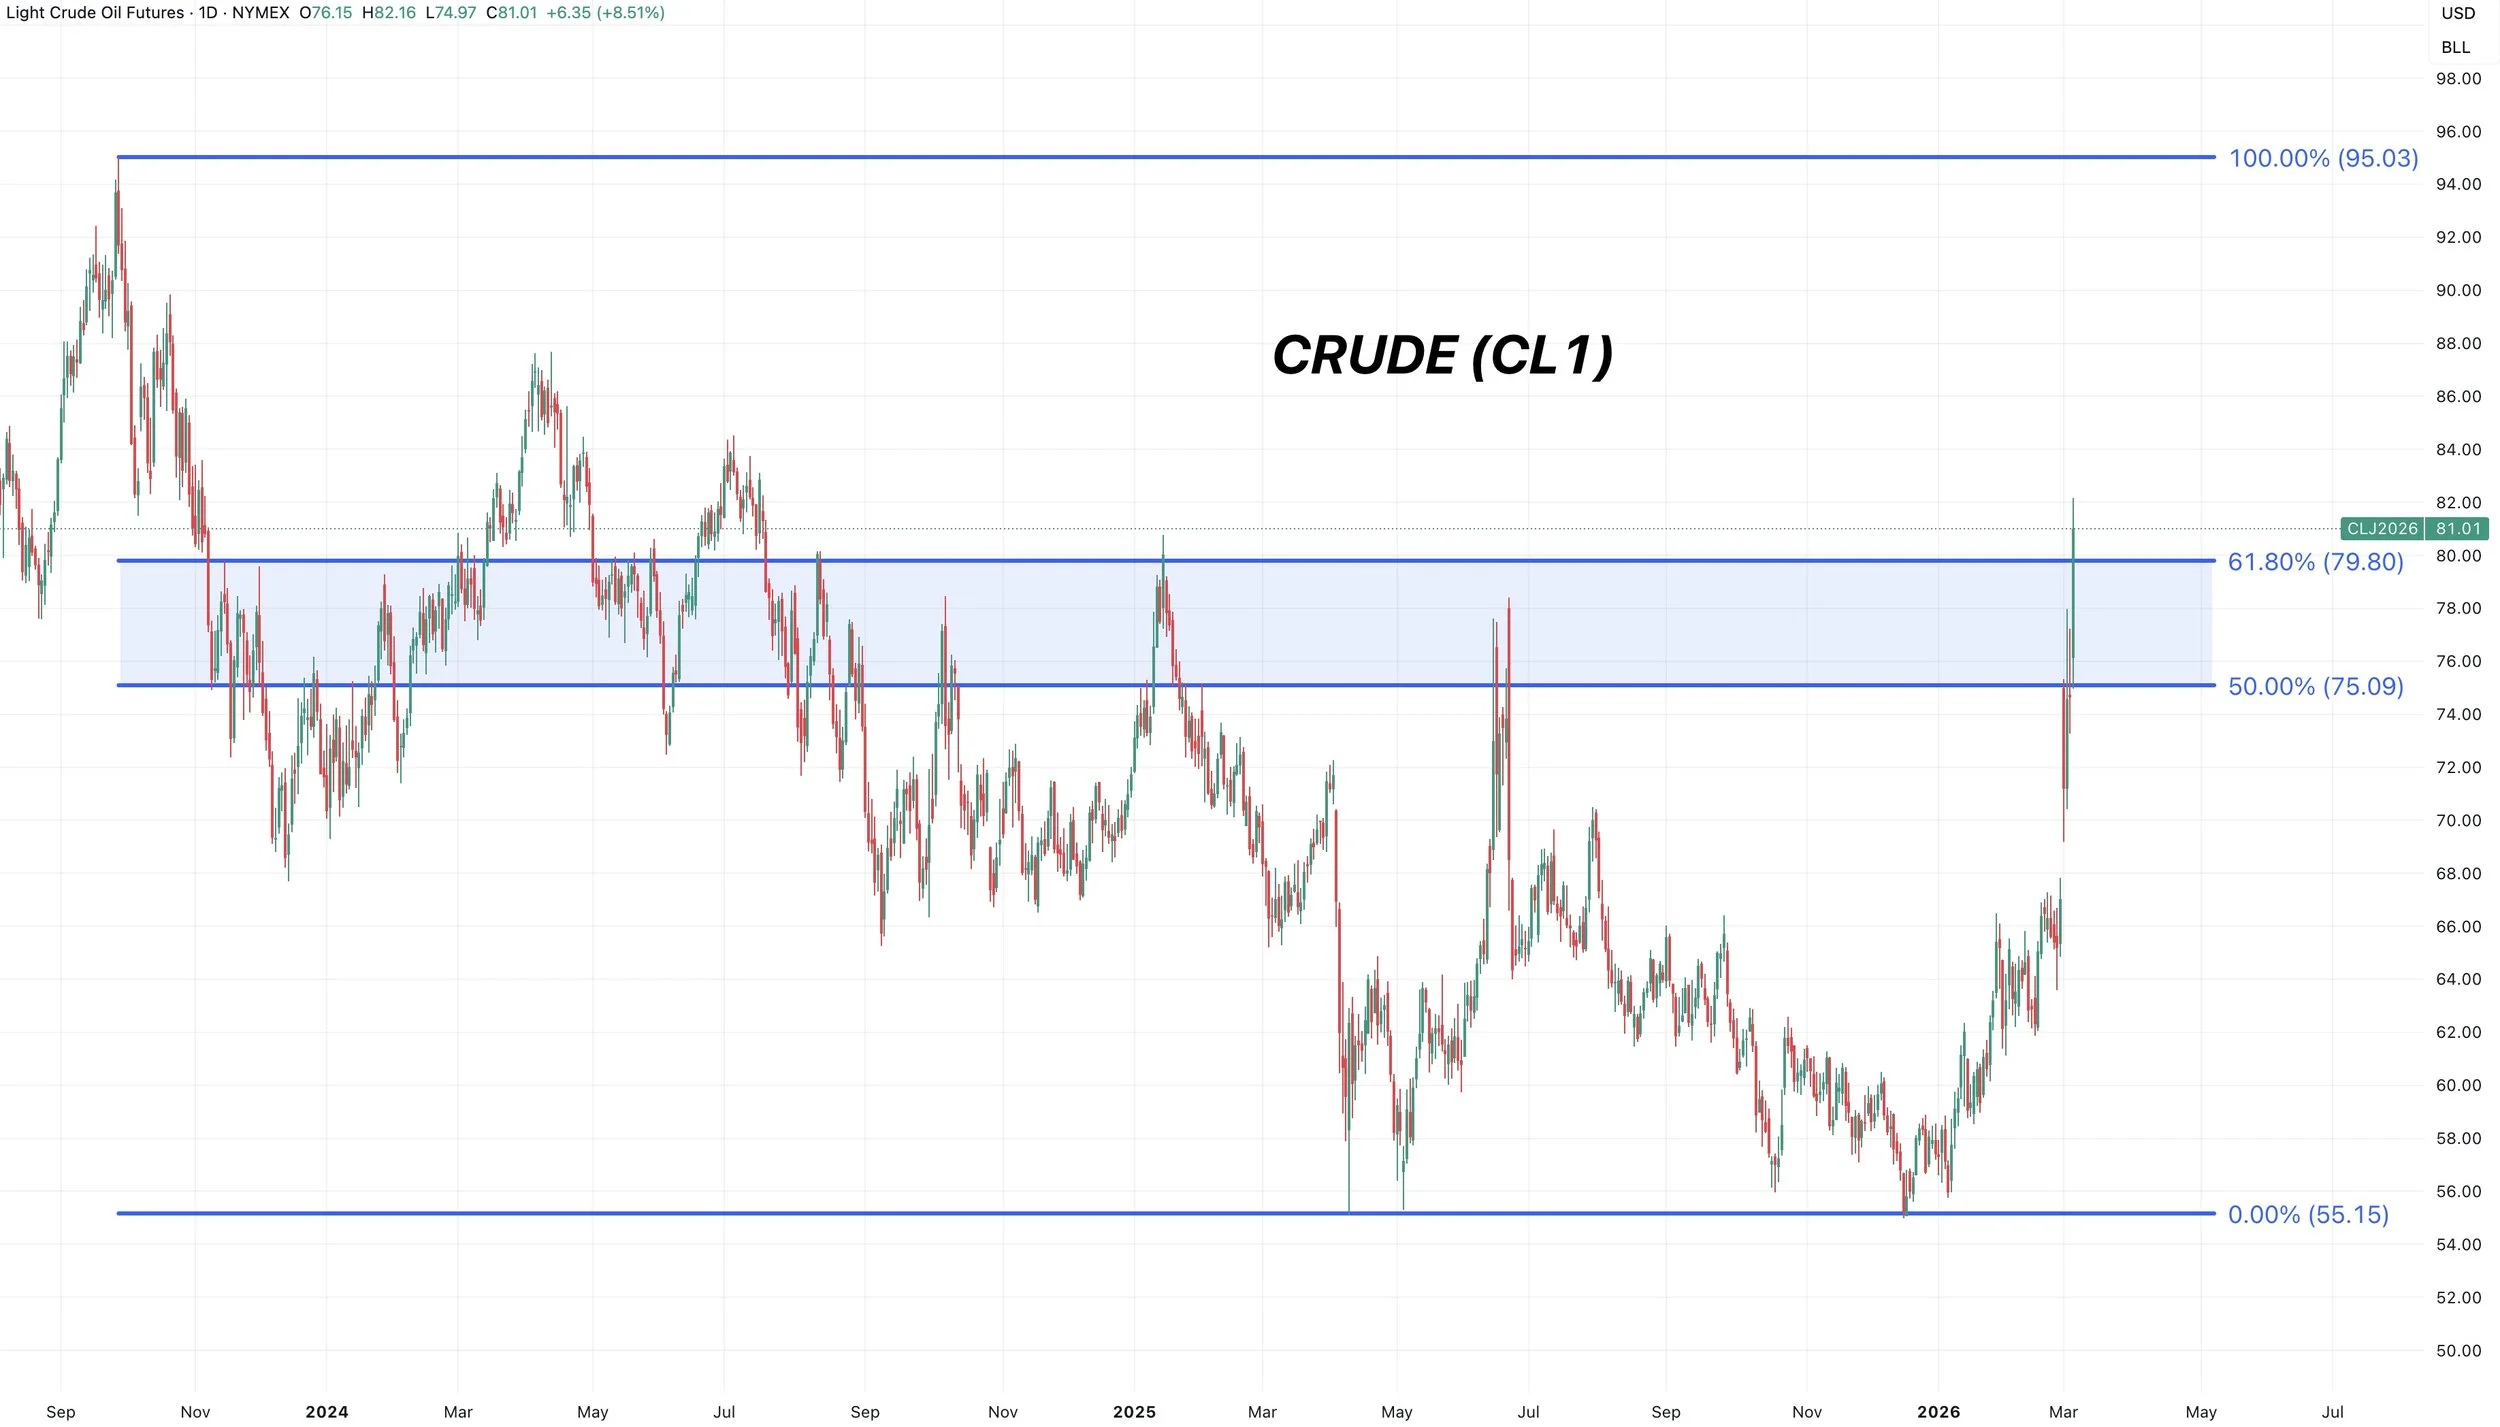
Crude is at an interesting spot here.
We are right at the 61.8% retracement level up to the 2023 highs on the continuous chart.
Is this another June type of top and then reversal?
Or is this a break out that could lead to +$90?
If we are going to fail, this would be a common spot for it to happen.
If we break above this level, it opens the door a lot higher.
But we've seen just how fast we can give back the rally, take June for example.
Where crude goes from here probably has a big impact on wheat.
Here is the crude vs KC wheat chart.
On both this rally and the June rally, they rallied almost in unison.
Not day-to-day movement, but the overall structure of the rally.
The rally in both has been geopolitically driven.
So if crude goes higher, we could expect wheat follow suite.
If crude stops, we could expect wheat to do the same.

Now What?
Oil just hit's highest levels since 2024.
Trump does not want high oil prices because he can’t afford that to happen.
If oil stays at these levels, gas prices go up, inflation goes up.
All of those are bullish for commodities as a whole if it happens. Aka an inflation play.
But it's not in Trump's best interest to let oil continue to rally.
Trump wants to elimate inflation and get lower gas prices. Those are two of his main goals.
Oil prices are actually higher than when he got inaugurated.
So that is the risk for the market. Trump steps in and does something.
Oil then heads lower, the grains then give back their war premium.
I don’t know when that'll happen, but eventually it will.
The situation can get worse before it gets better, and commodities can follow the headlines higher for now. But this isn’t World War III, and Trump doesn’t want high oil prices.
Oil prices are probably going to be the biggest indicator as to when this Iran war situation is going to be over.
If crude goes to $90 to $100, Trump will probably have to step in and do something.
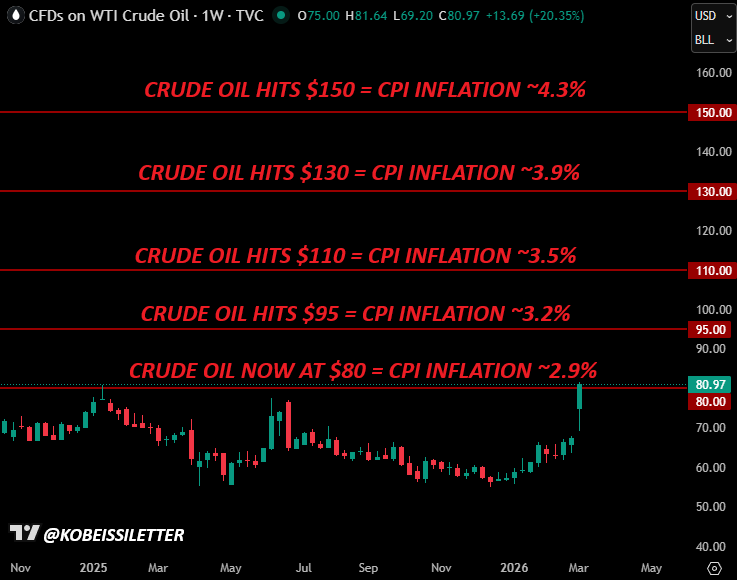
According to the Fed study, every $10 rally in crude oil can increase inflation by 20 bps.
A sustained rally in oil would be very costly to Trump in several ways.
Trump will do anything he can to prevent that from happening.
(For reference, current inflation is 2.4%)*
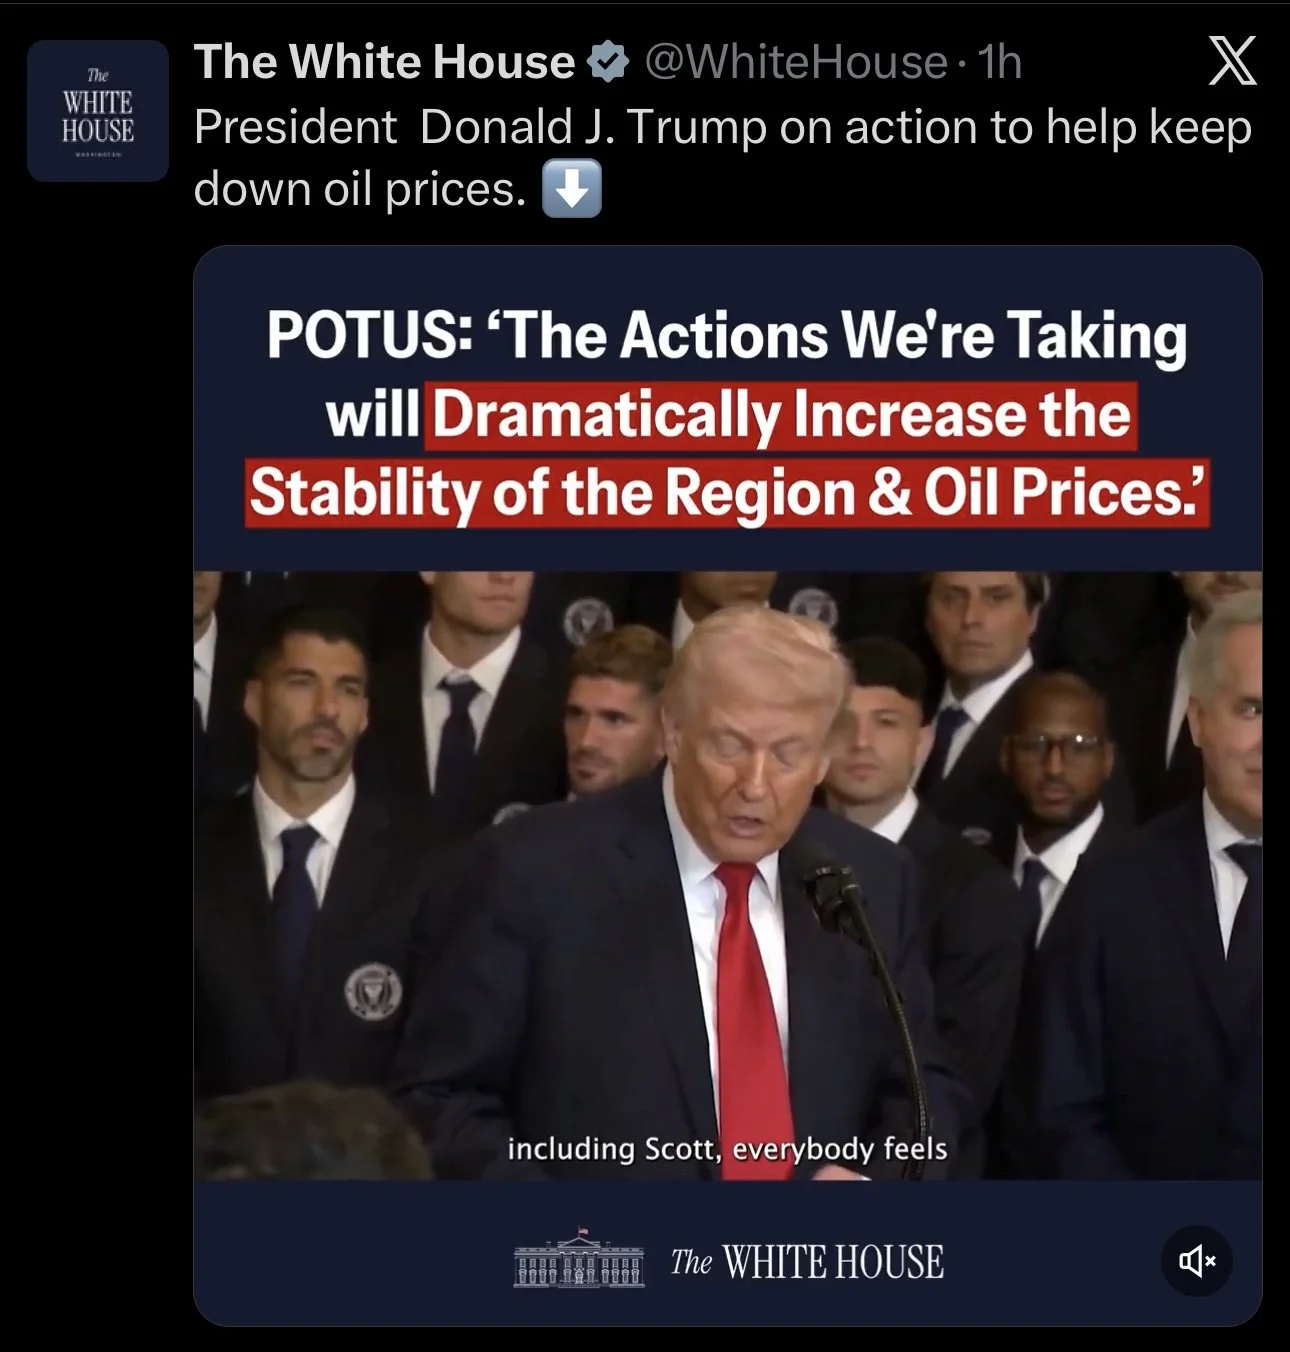
Trump gave a speech tonight on the action to help keep down oil prices.
In his announcement, he said:
"Iran is calling, asking how to make a deal".
Today's Main Takeaways
Corn
Fundamentals:
Today we are mostly going to be looking at some charts and our next targets.
But first, I wanted to go over some seasonal data.
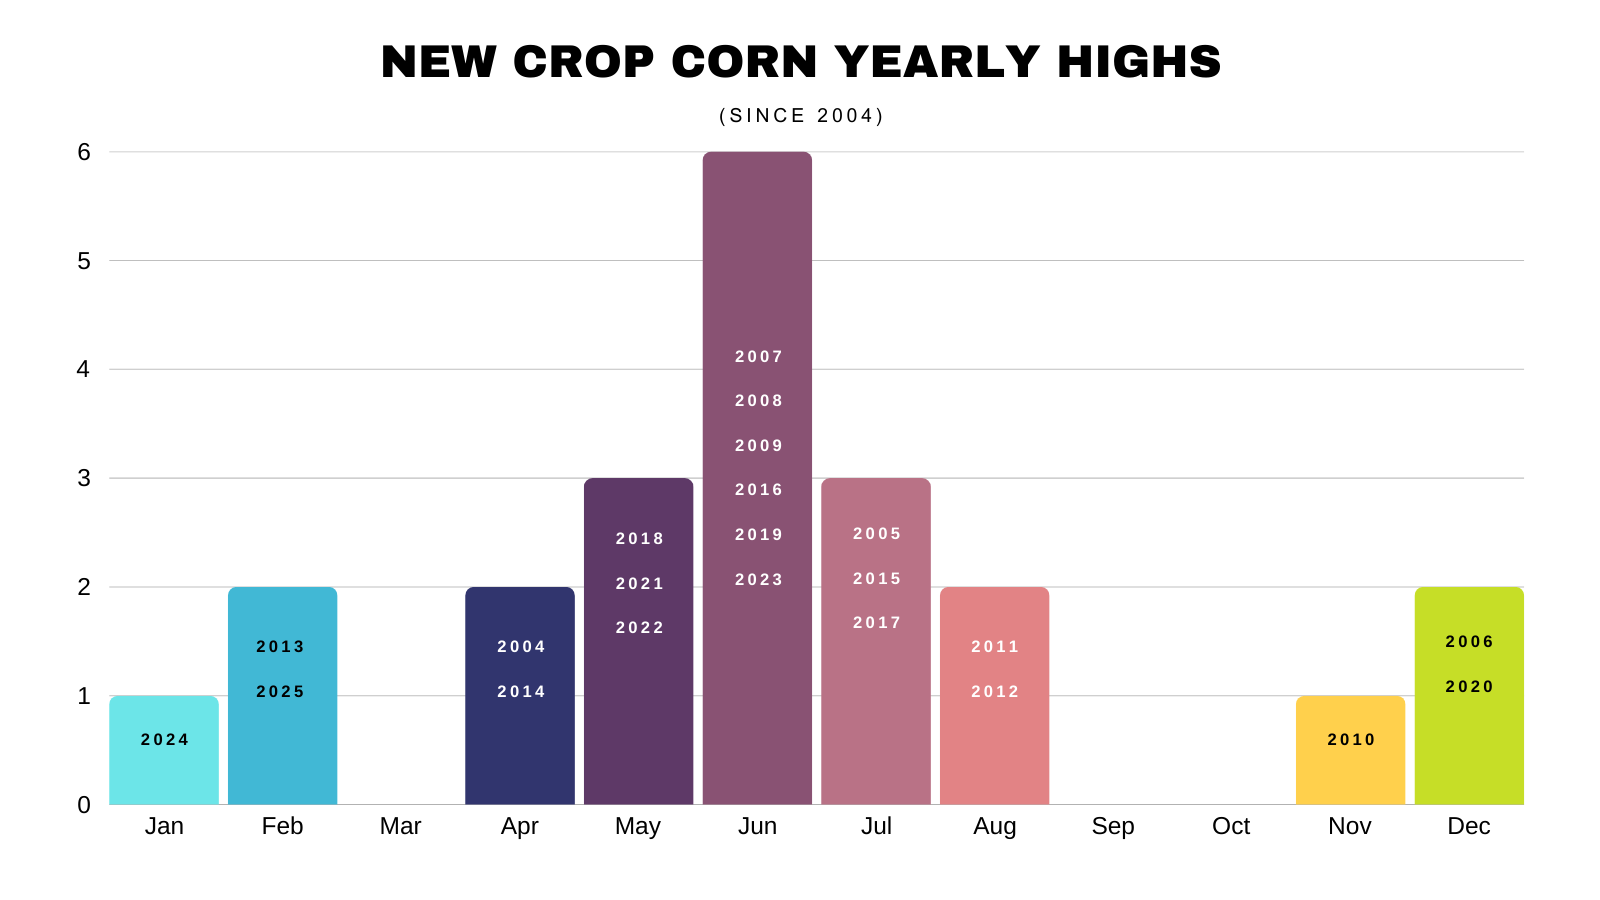
Did you know there are 3 months where new crop corn has never posted it's highest price of the year?
March, September, and October.
We've never posted our highs in March.
We just put in a new yearly high today.
12 of the last 22 years the high came between May and July.
The last two years will tell you that anything can happen, but the data favors higher prices at some point later this year.
But that is where we want to be making the bulk of our sales.
In that seasonal window of opportunity.
Because we almost always sell off going into harvest, regardless if we get a summer rally or not.
Here is the new crop seasonal.
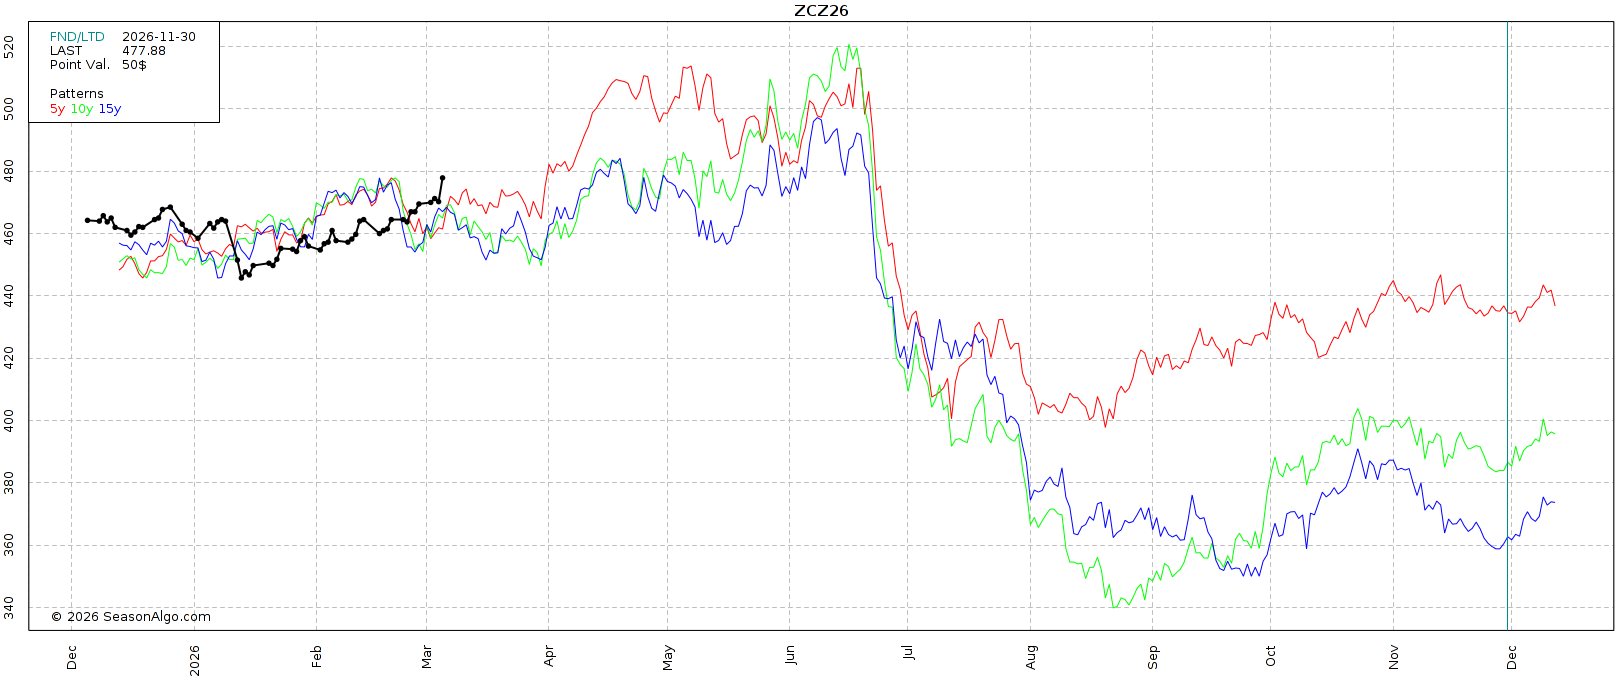
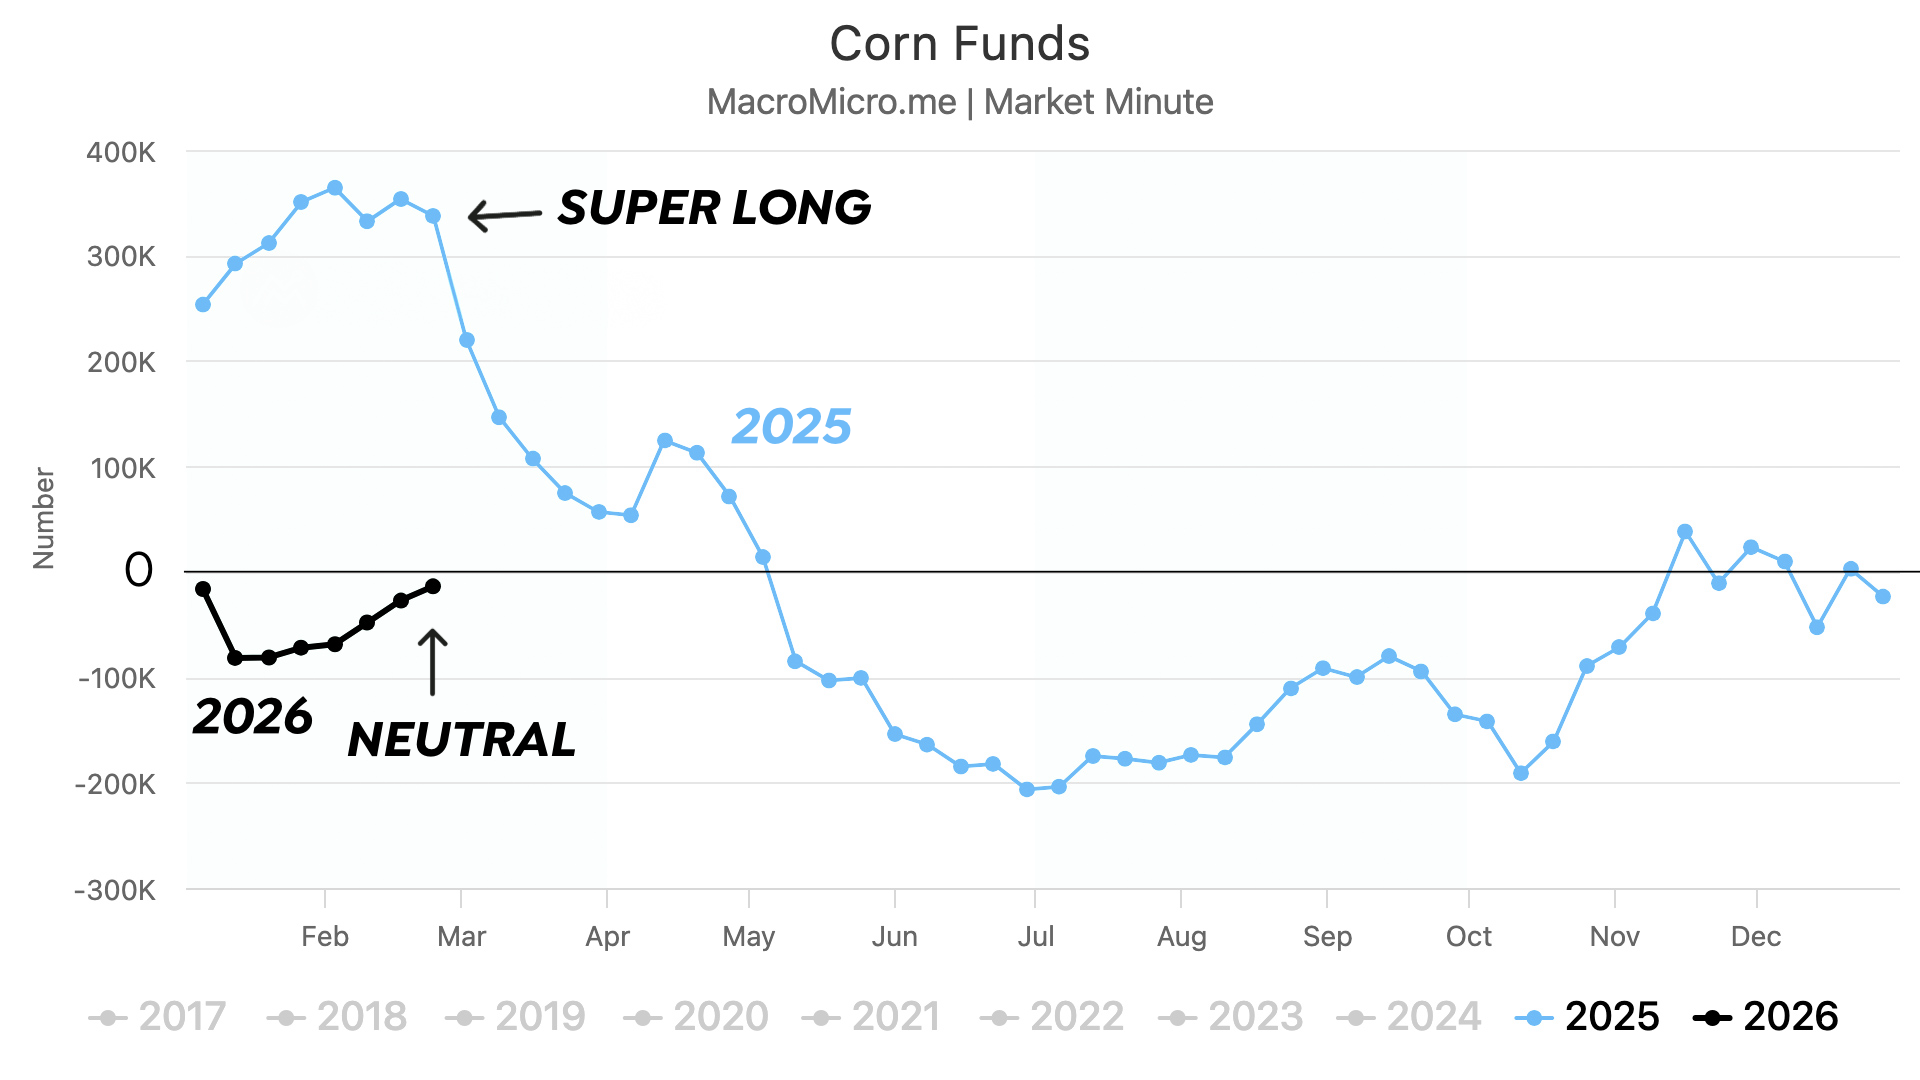
The last two years, the corn market topped in January and in February.
That might make some people nervous. Could it happen again and we top out super early in March?
Sure, it's possible.
But there is a key difference between this year and last year.
The funds were extremely long last February. They were long over +300k contracts.
They eventually sold and didn’t let up until July.
They are holding a neutral position right now.
So it feels like we might finally be due for a more seasonal year in the corn market.
Technicals:
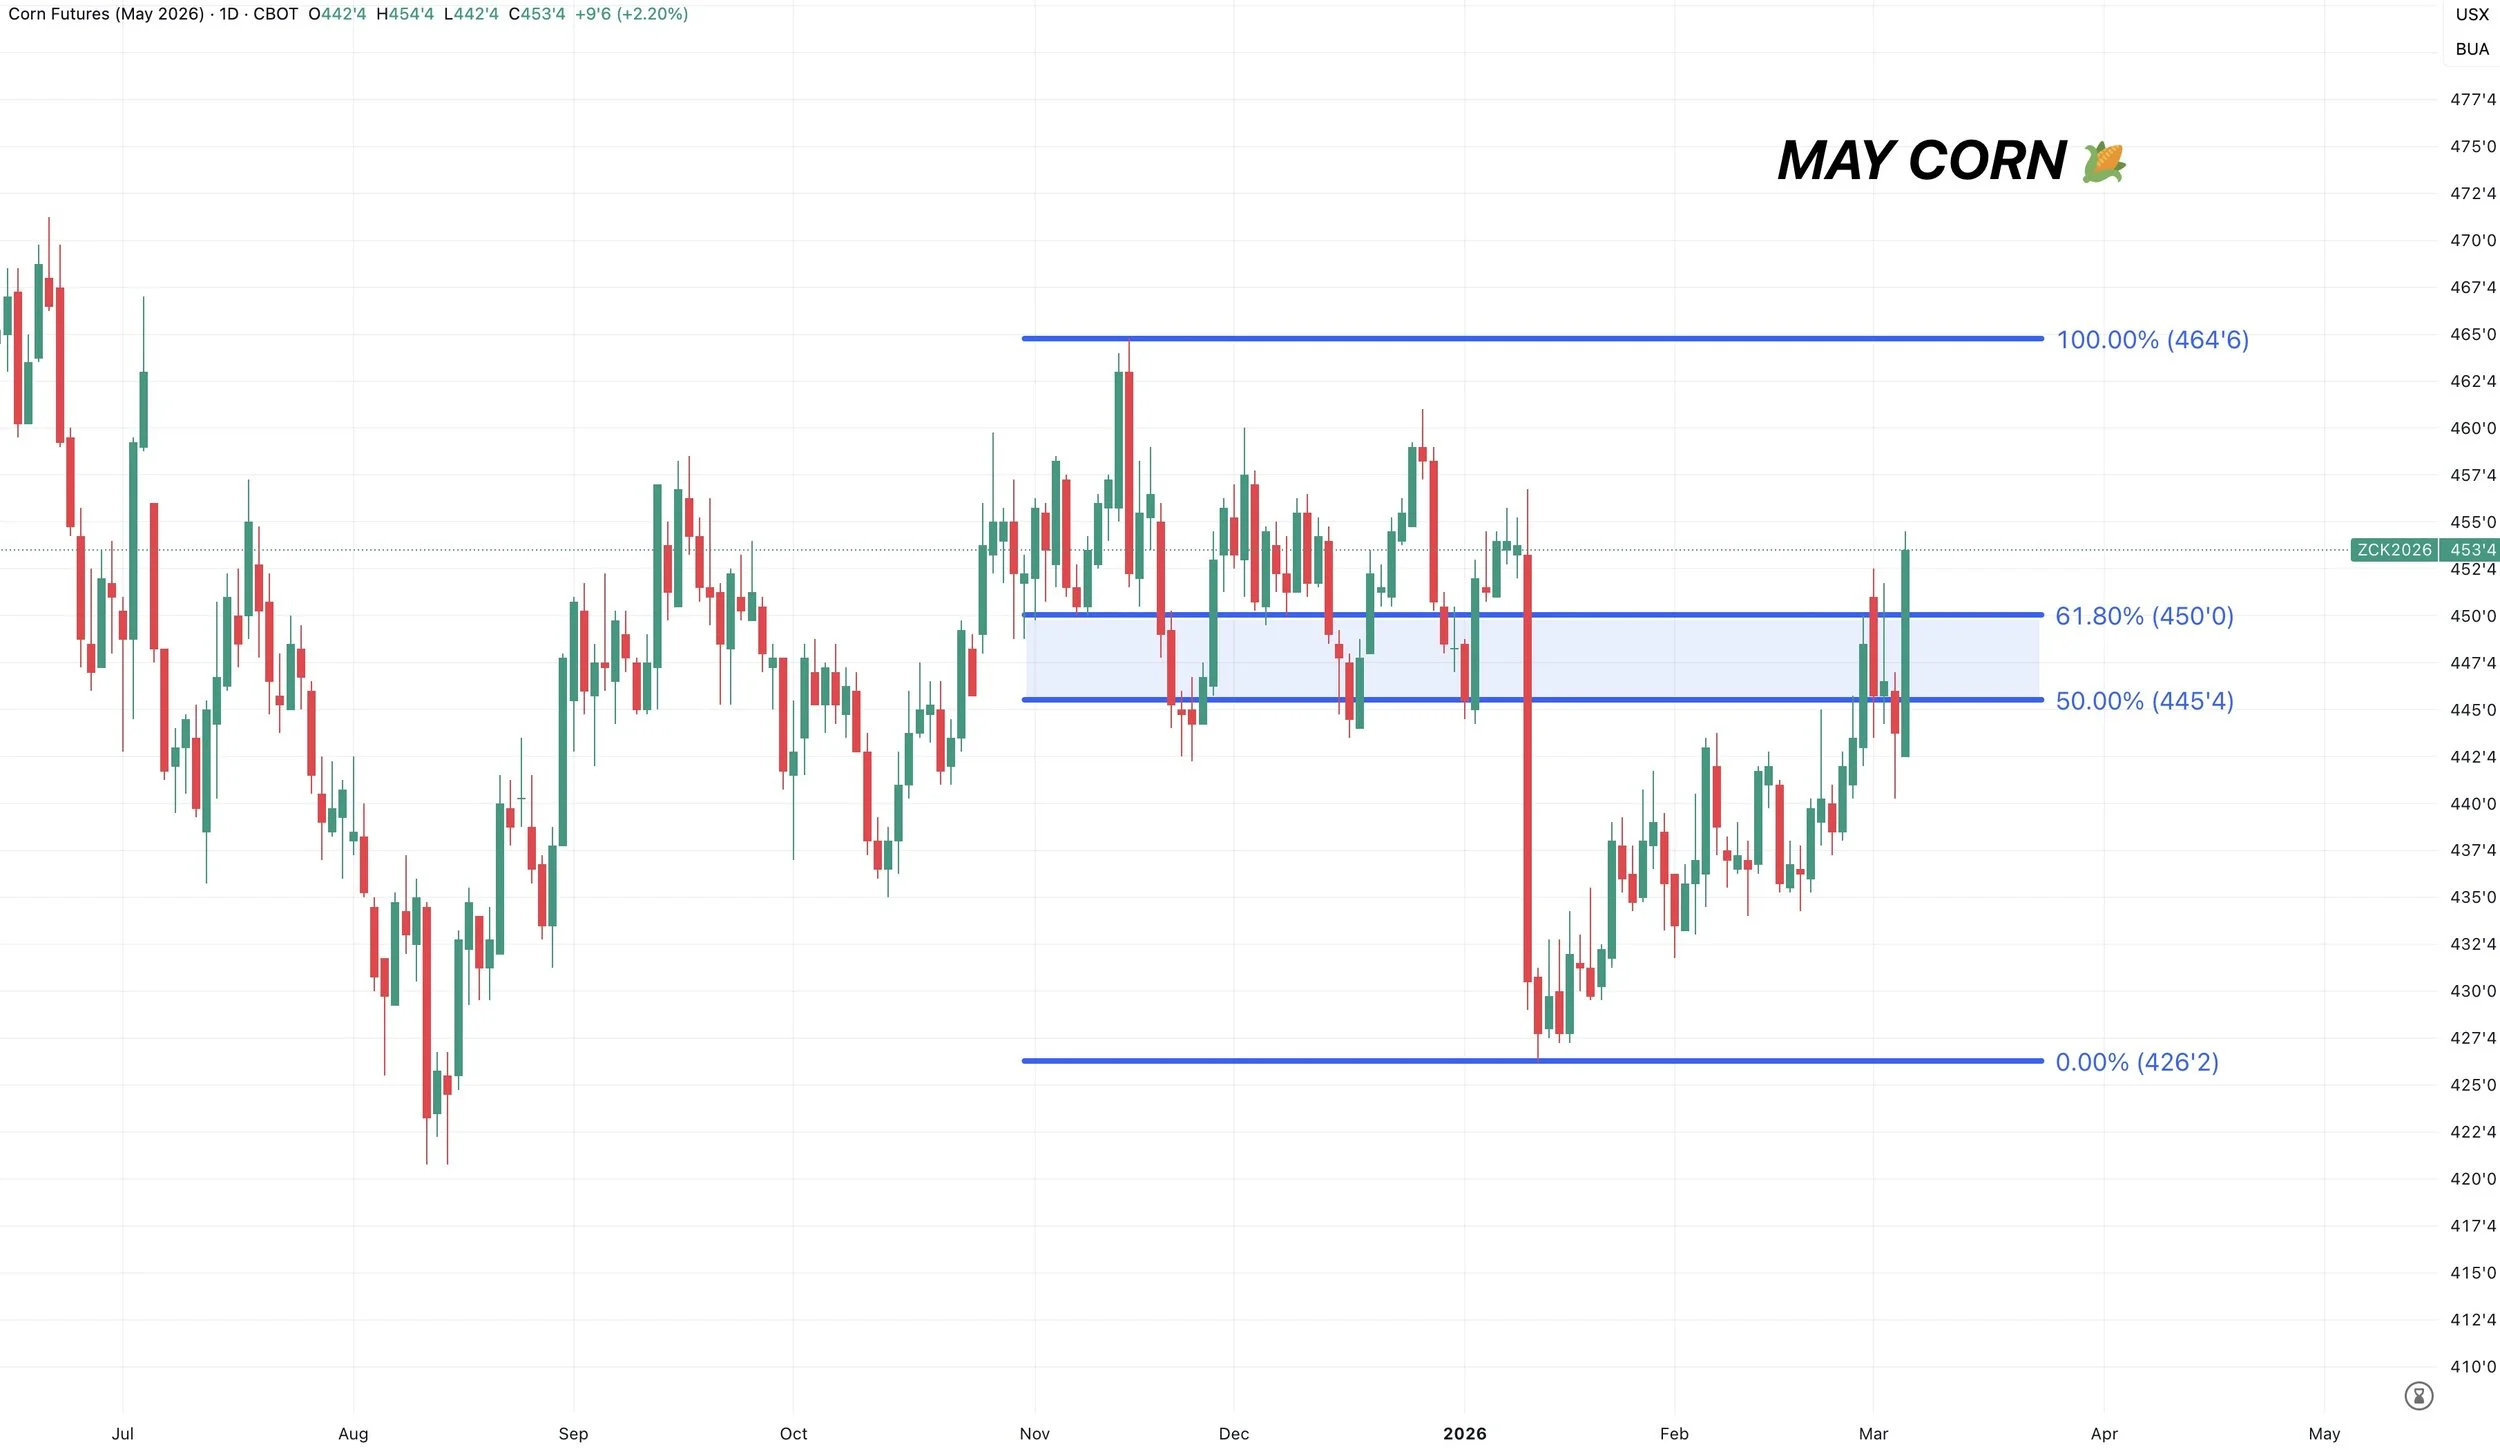
May Corn:
We did issue another incremental sell signal and hedge alert after hitting $4.50.
$4.50 is the 61.8% retracement up to the November highs.
If we close above this level for consecutive days, it often tells us that the long term trend has officially shifted higher.
As this bounce the entire rally is no longer viewed as corrective.
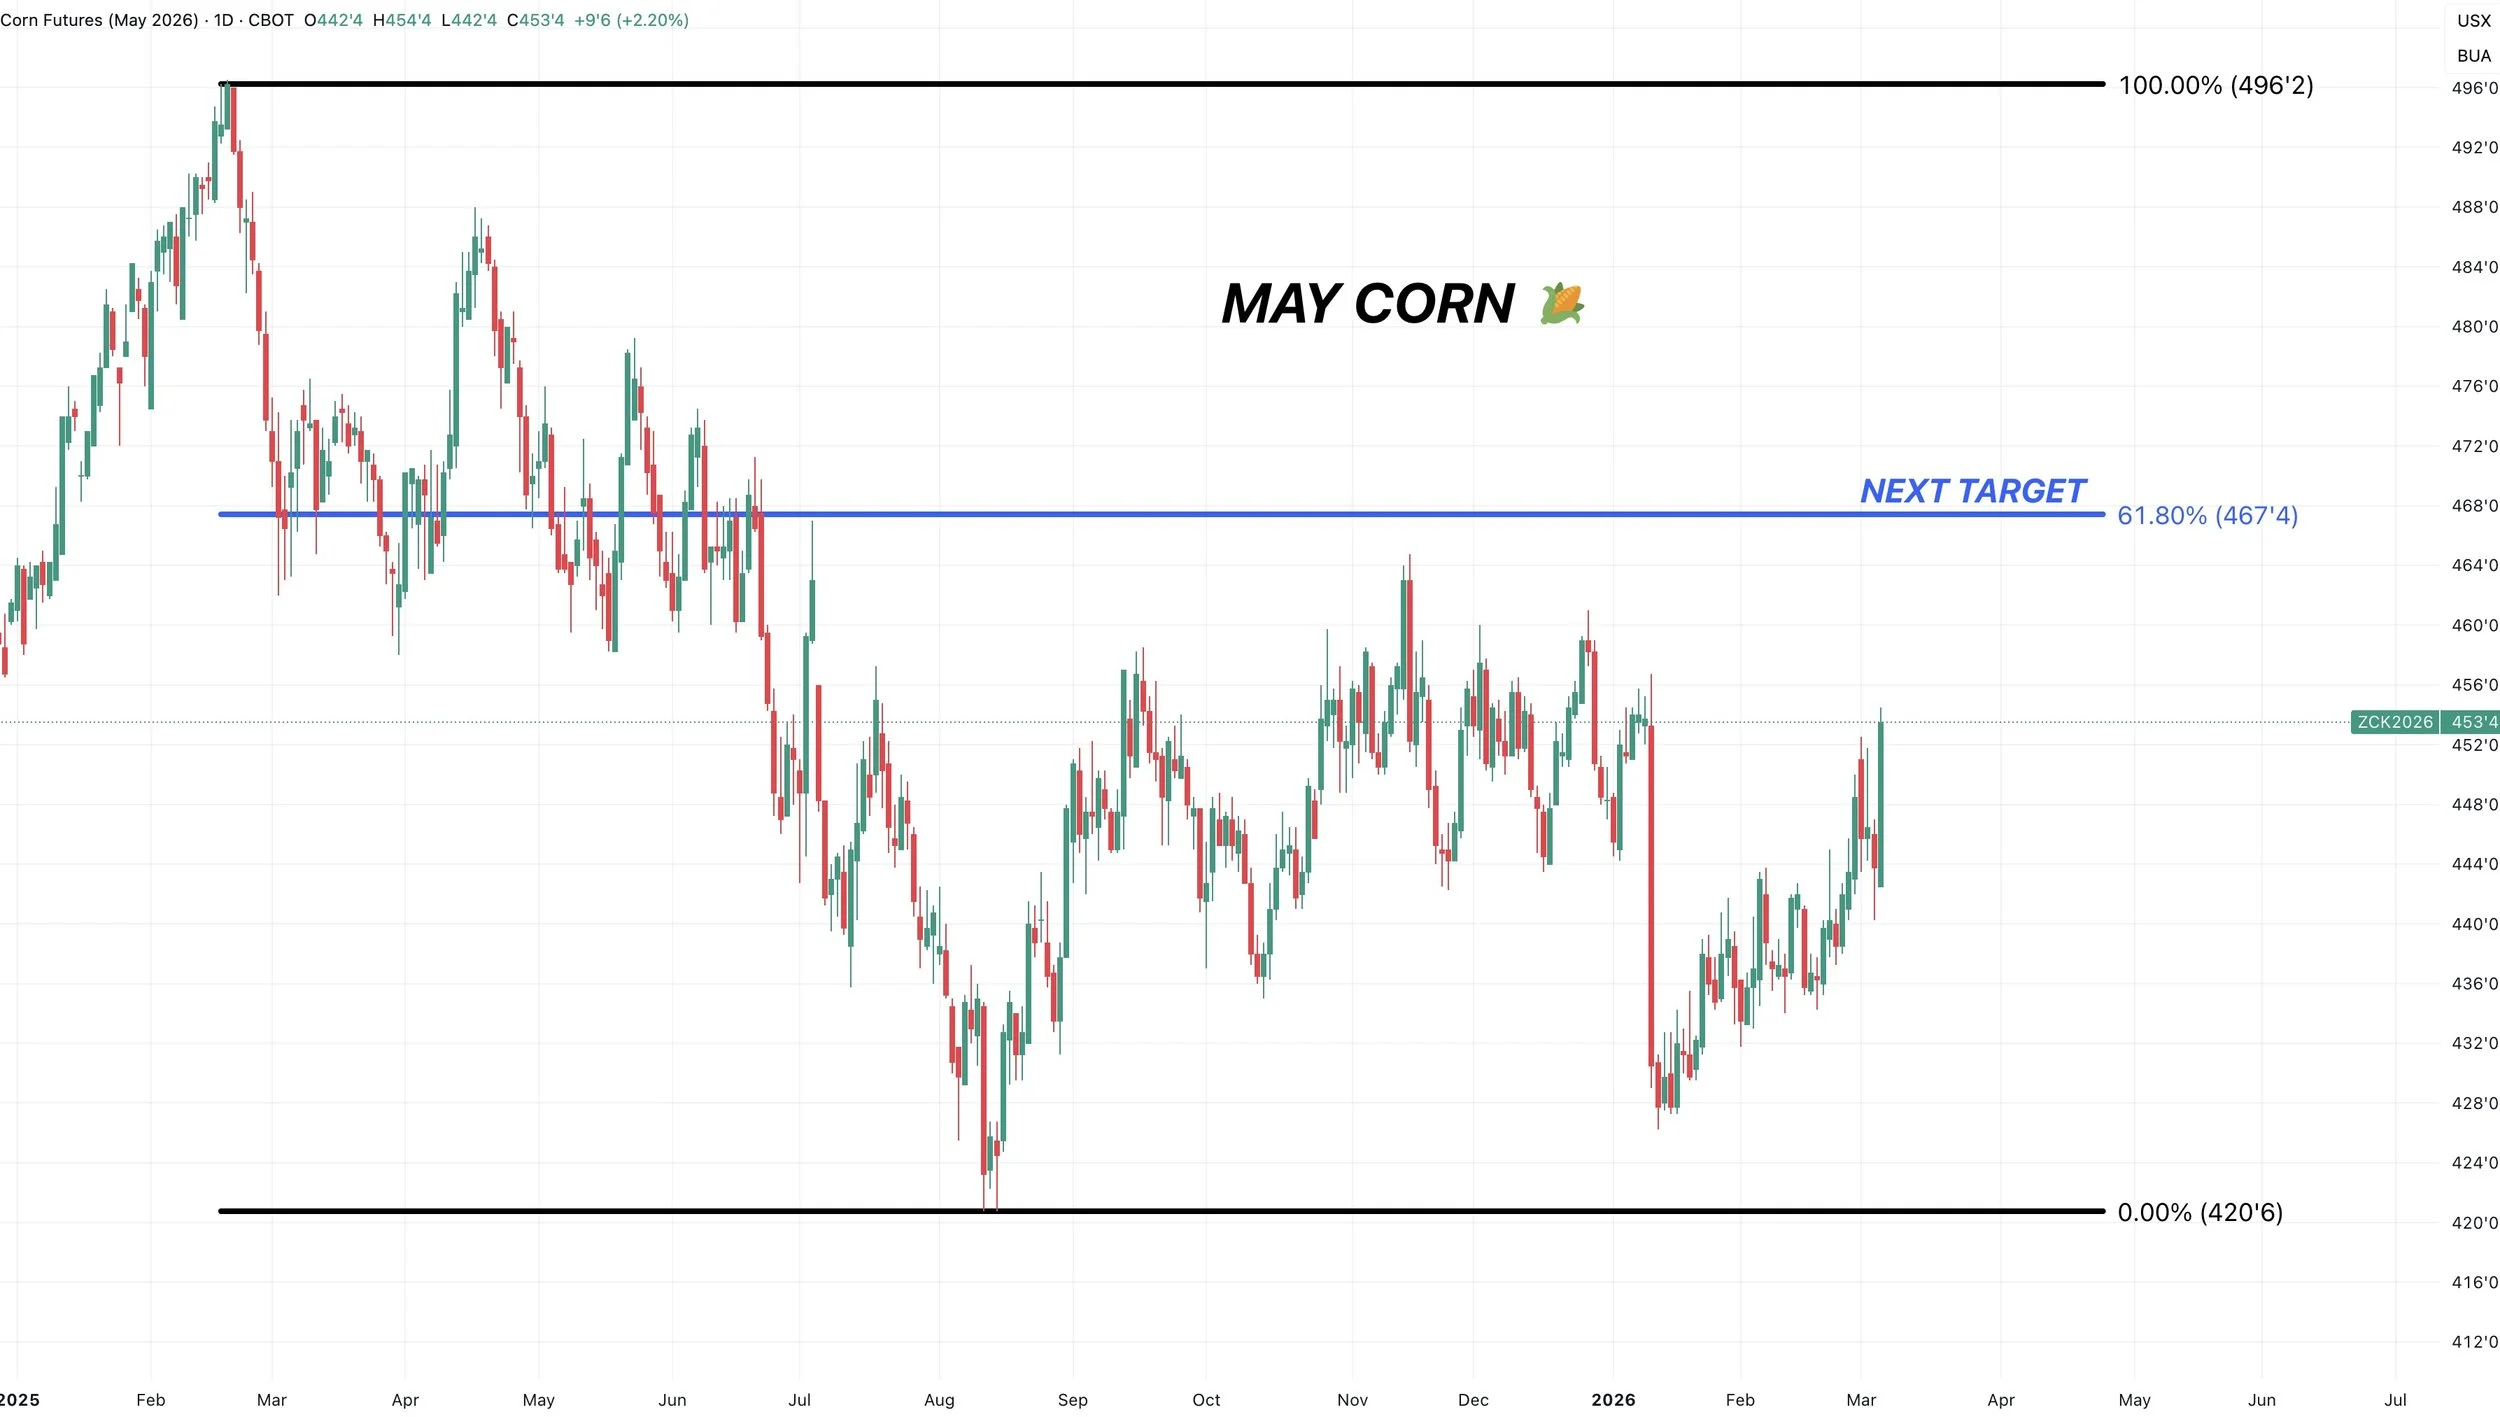
May Next Target:
Targets are subject to change, but here is what we are looking at today.
The next target is $4.67
That is the 61.8% level up to the Feb 2025 highs.
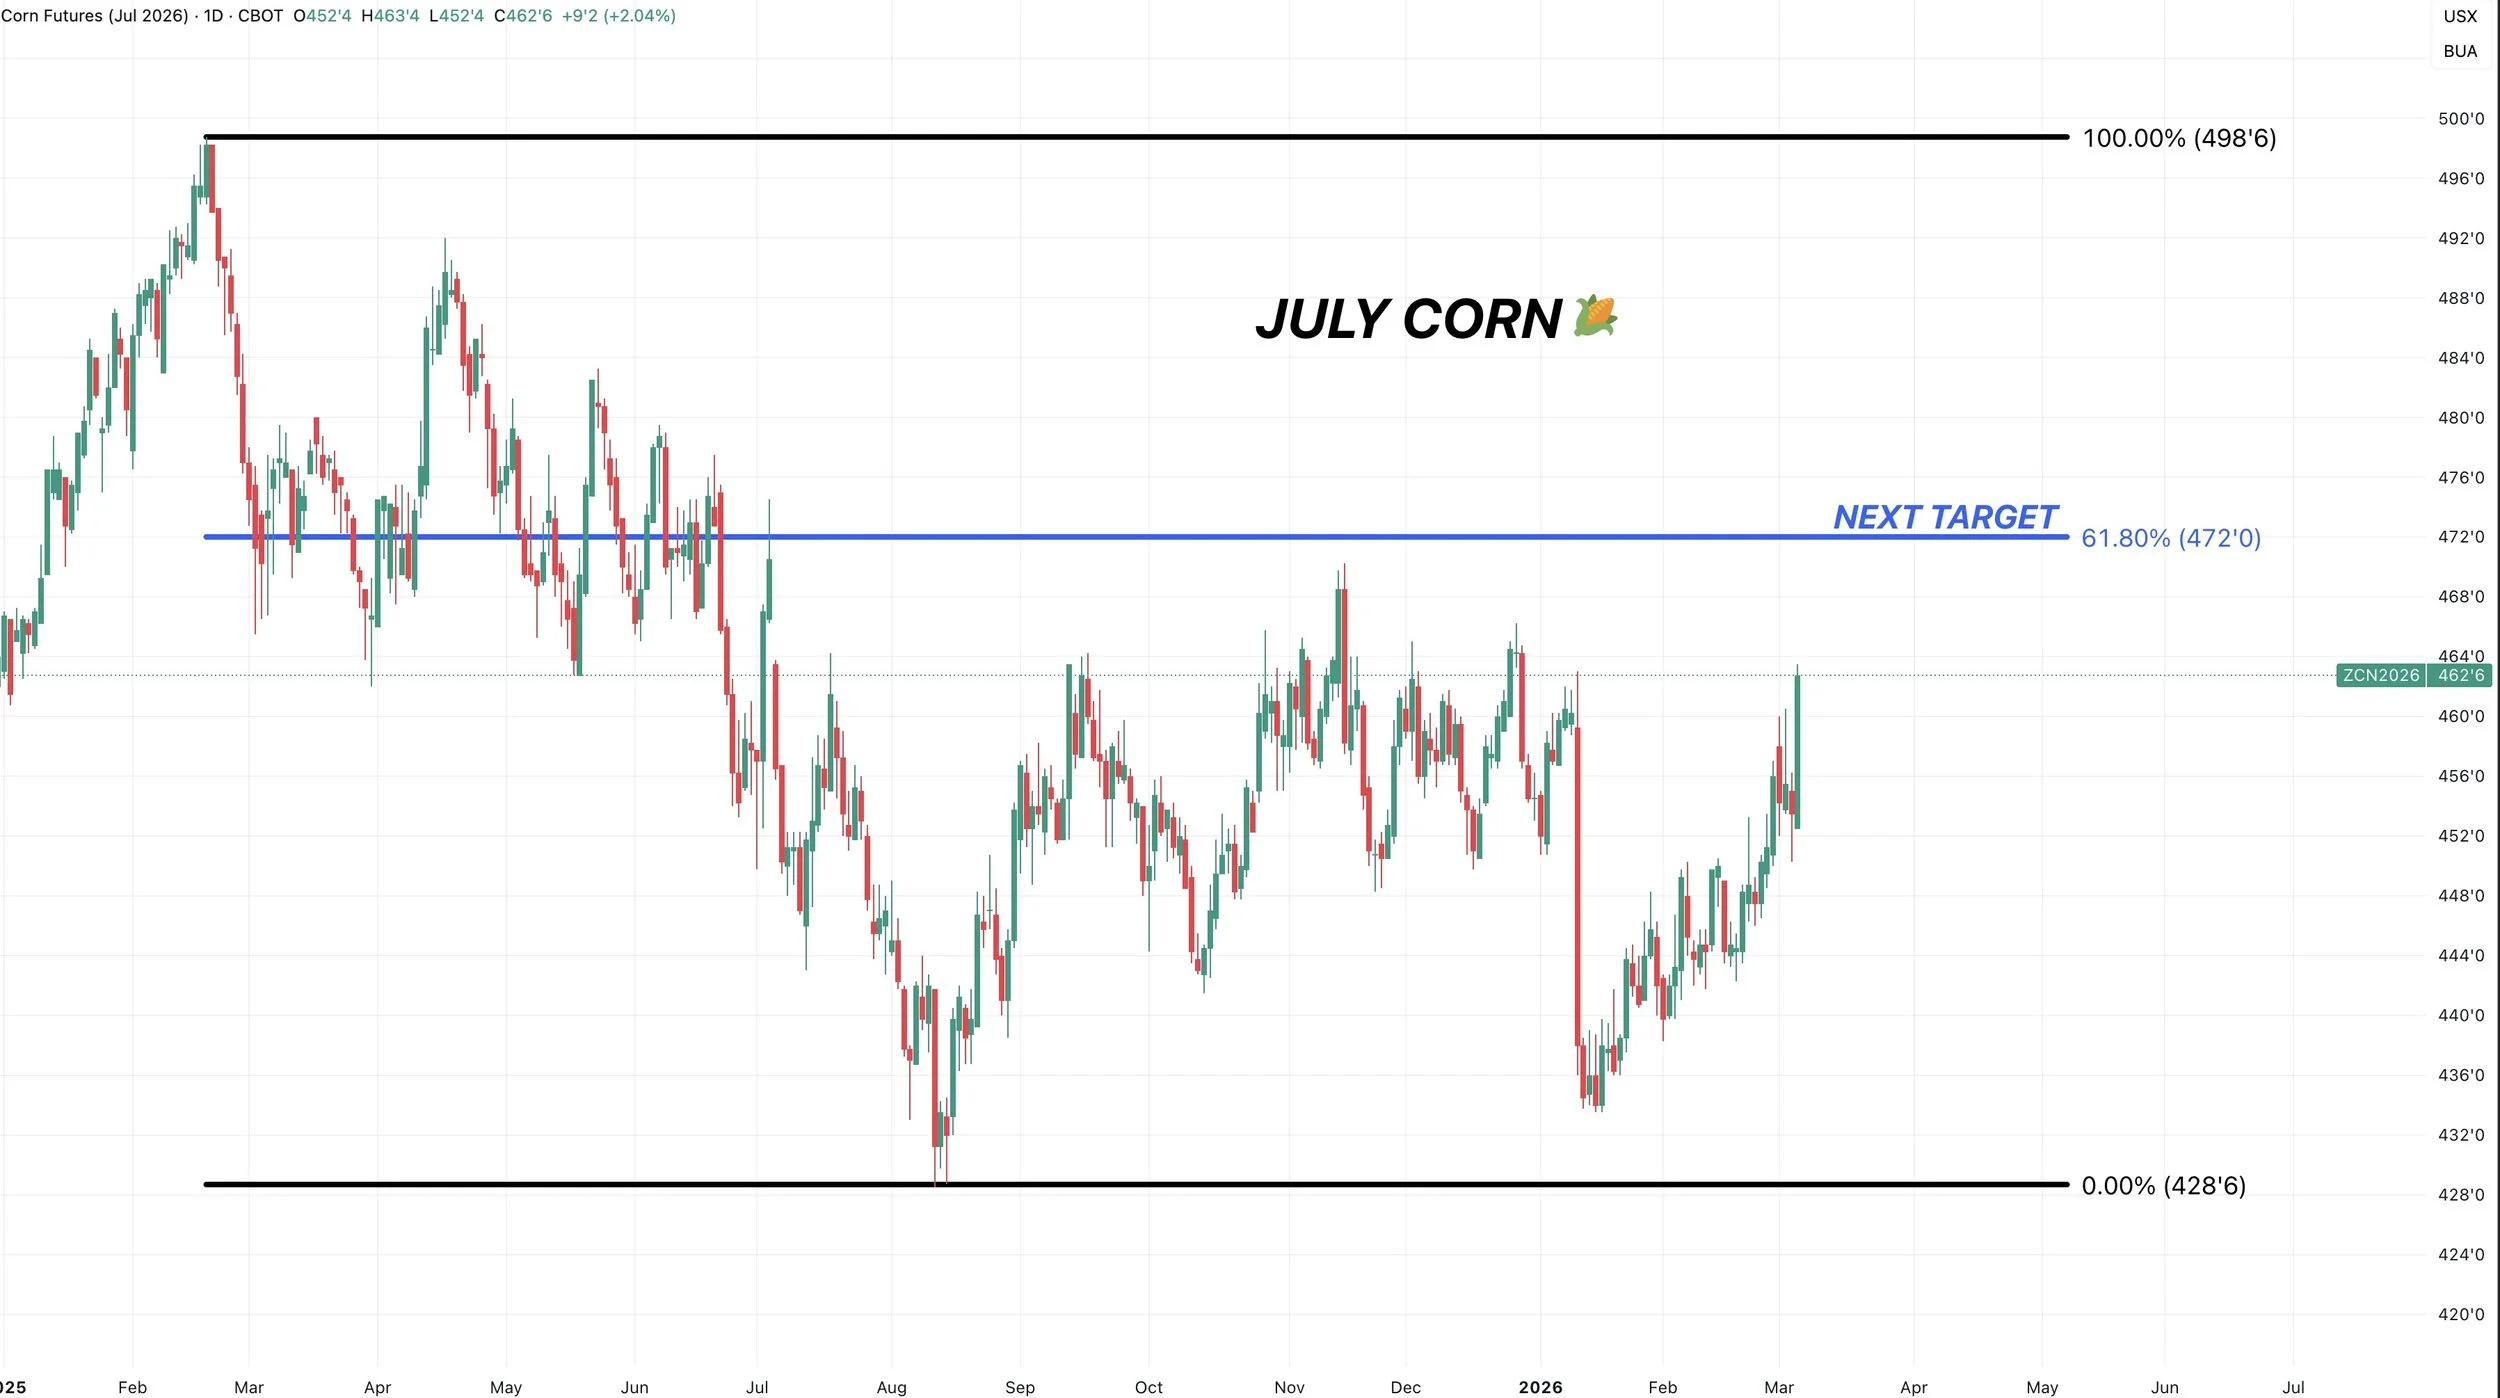
July Corn:
The next spot we want to take some chips off is going to be $4.72
That is the 61.8% level up to the Feb 2025 highs.
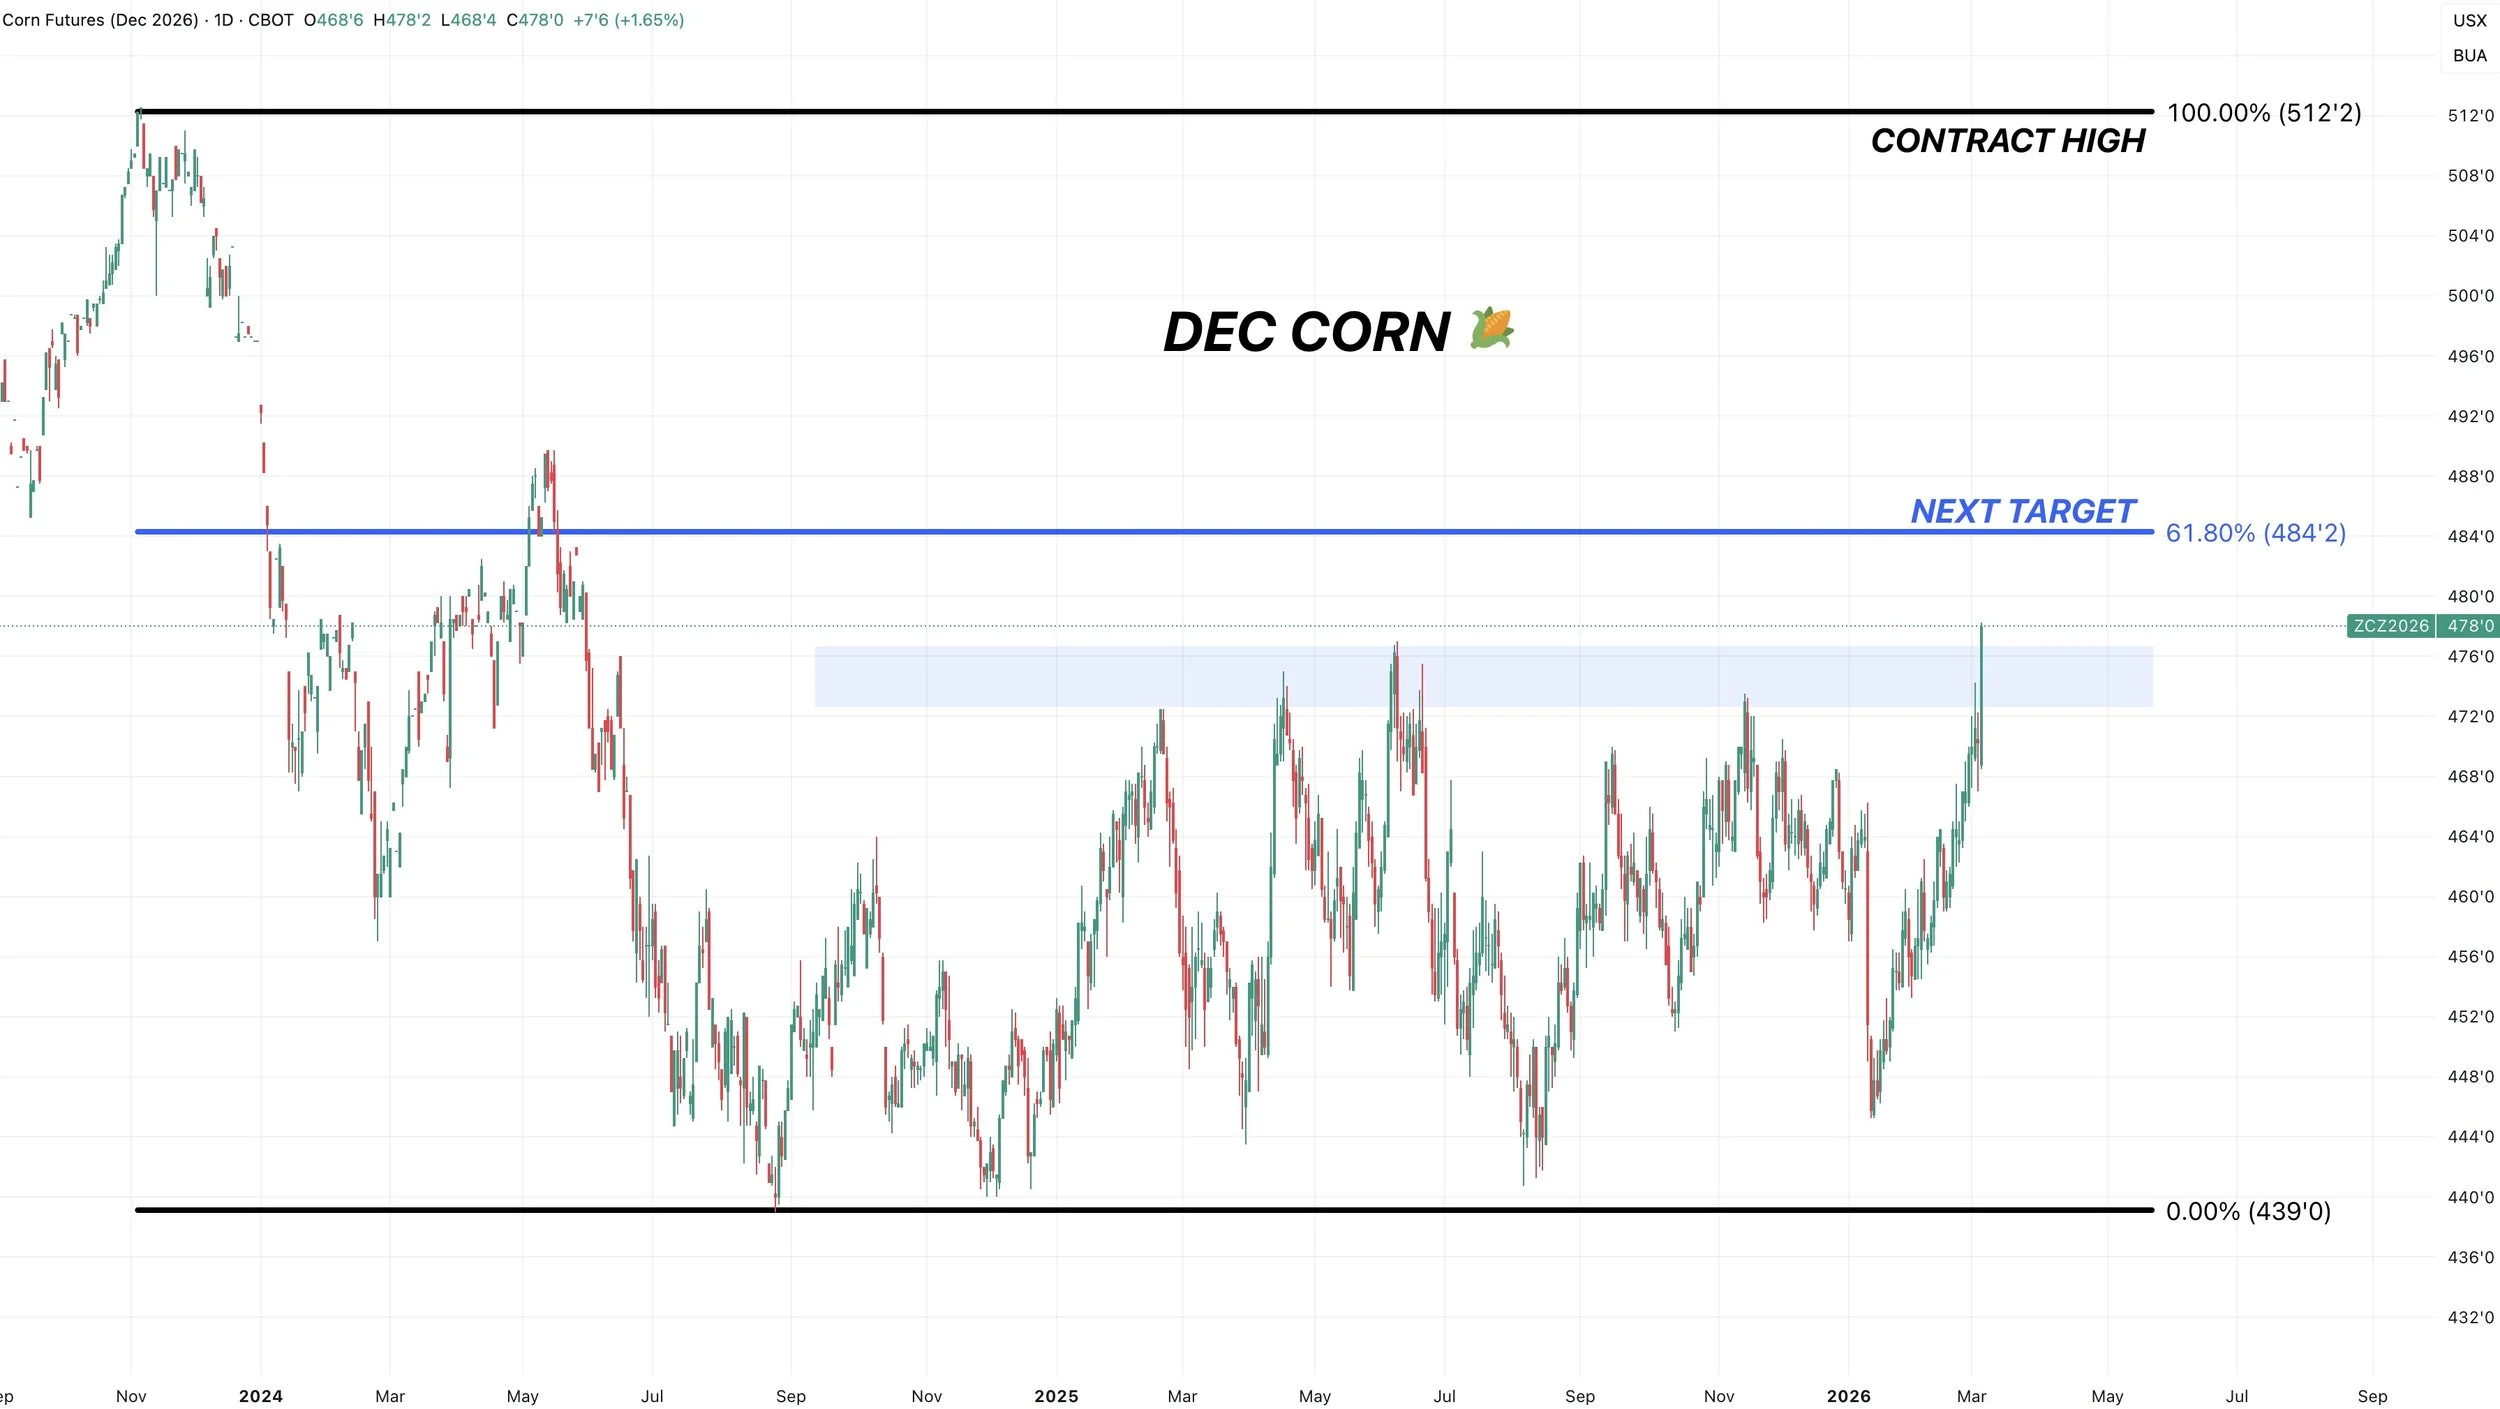
Dec Corn:
We made our first starter hedge and or incremental sale on Tuesday.
That was just a starter position.
We still like protection at these levels.
We like being at whatever percent hedged or sold you normally are at this time. Whether it's 5% or 10% etc.
Dec corn is now trading at it's highest levels since May 2024.
The next target where we want to take some additional risk off is going to be $4.84
That is the 61.8% level up to the contract highs.
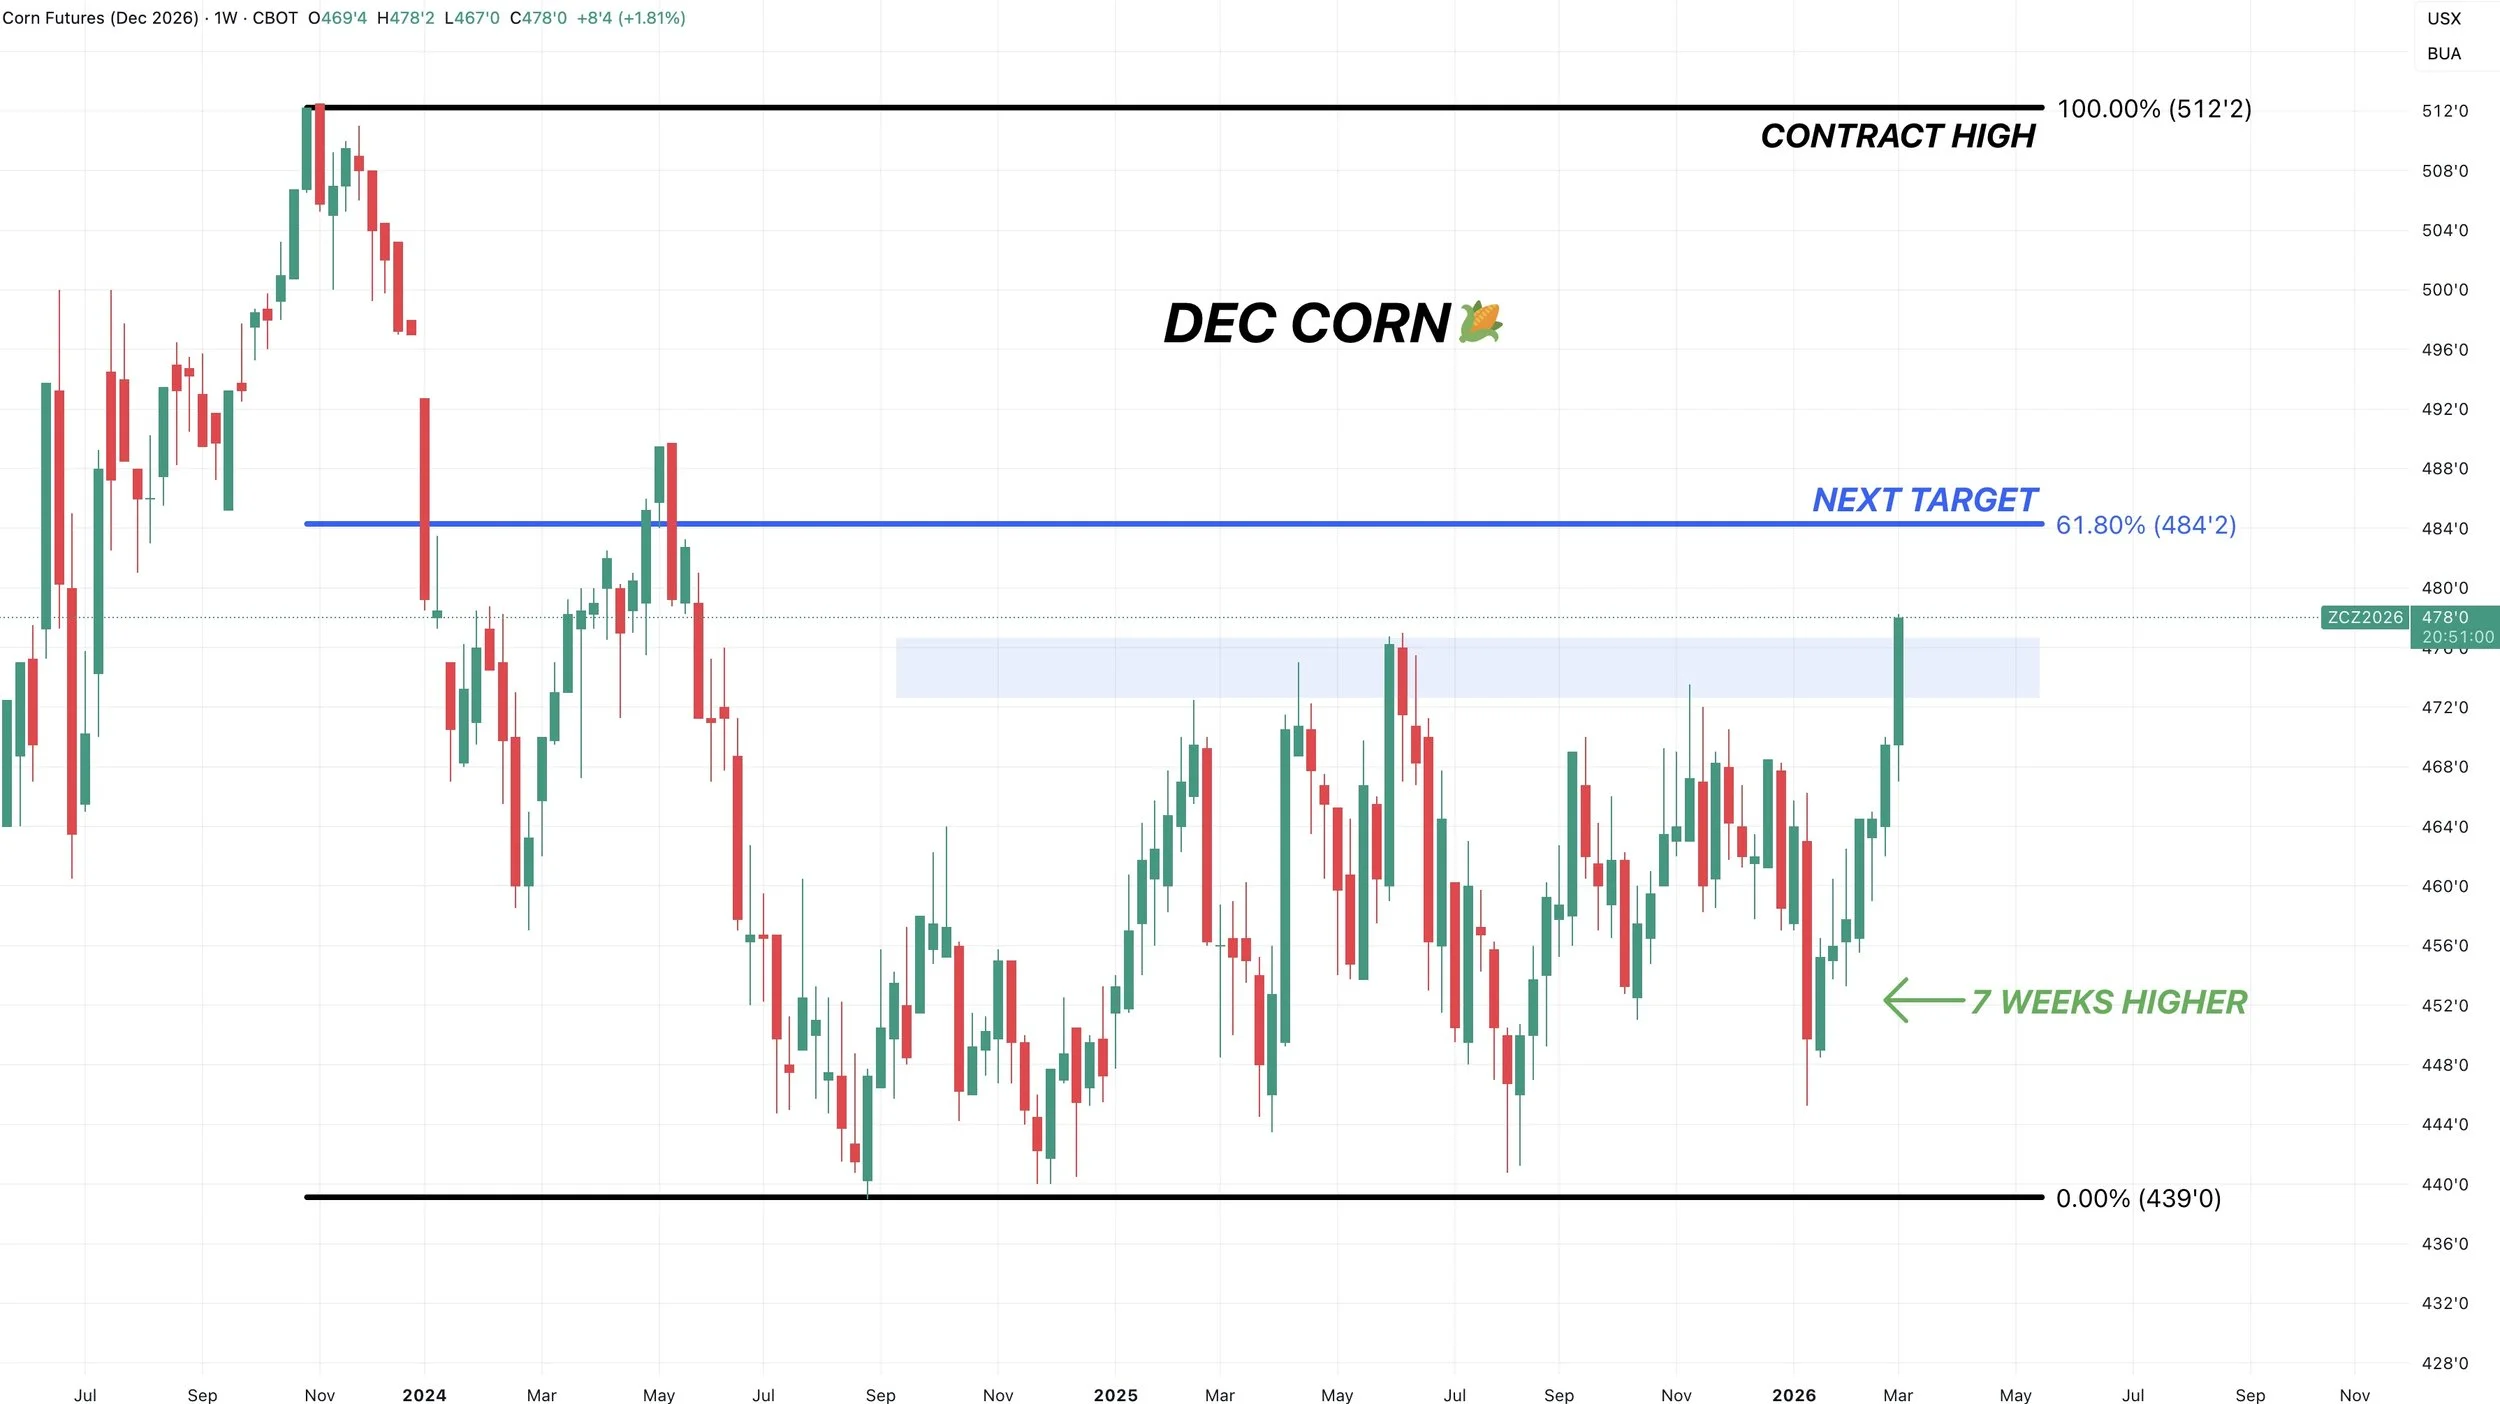
Here is the weekly chart for new crop.
We haven’t had a red week since the Jan USDA report.
The trend clearly looks higher for now.
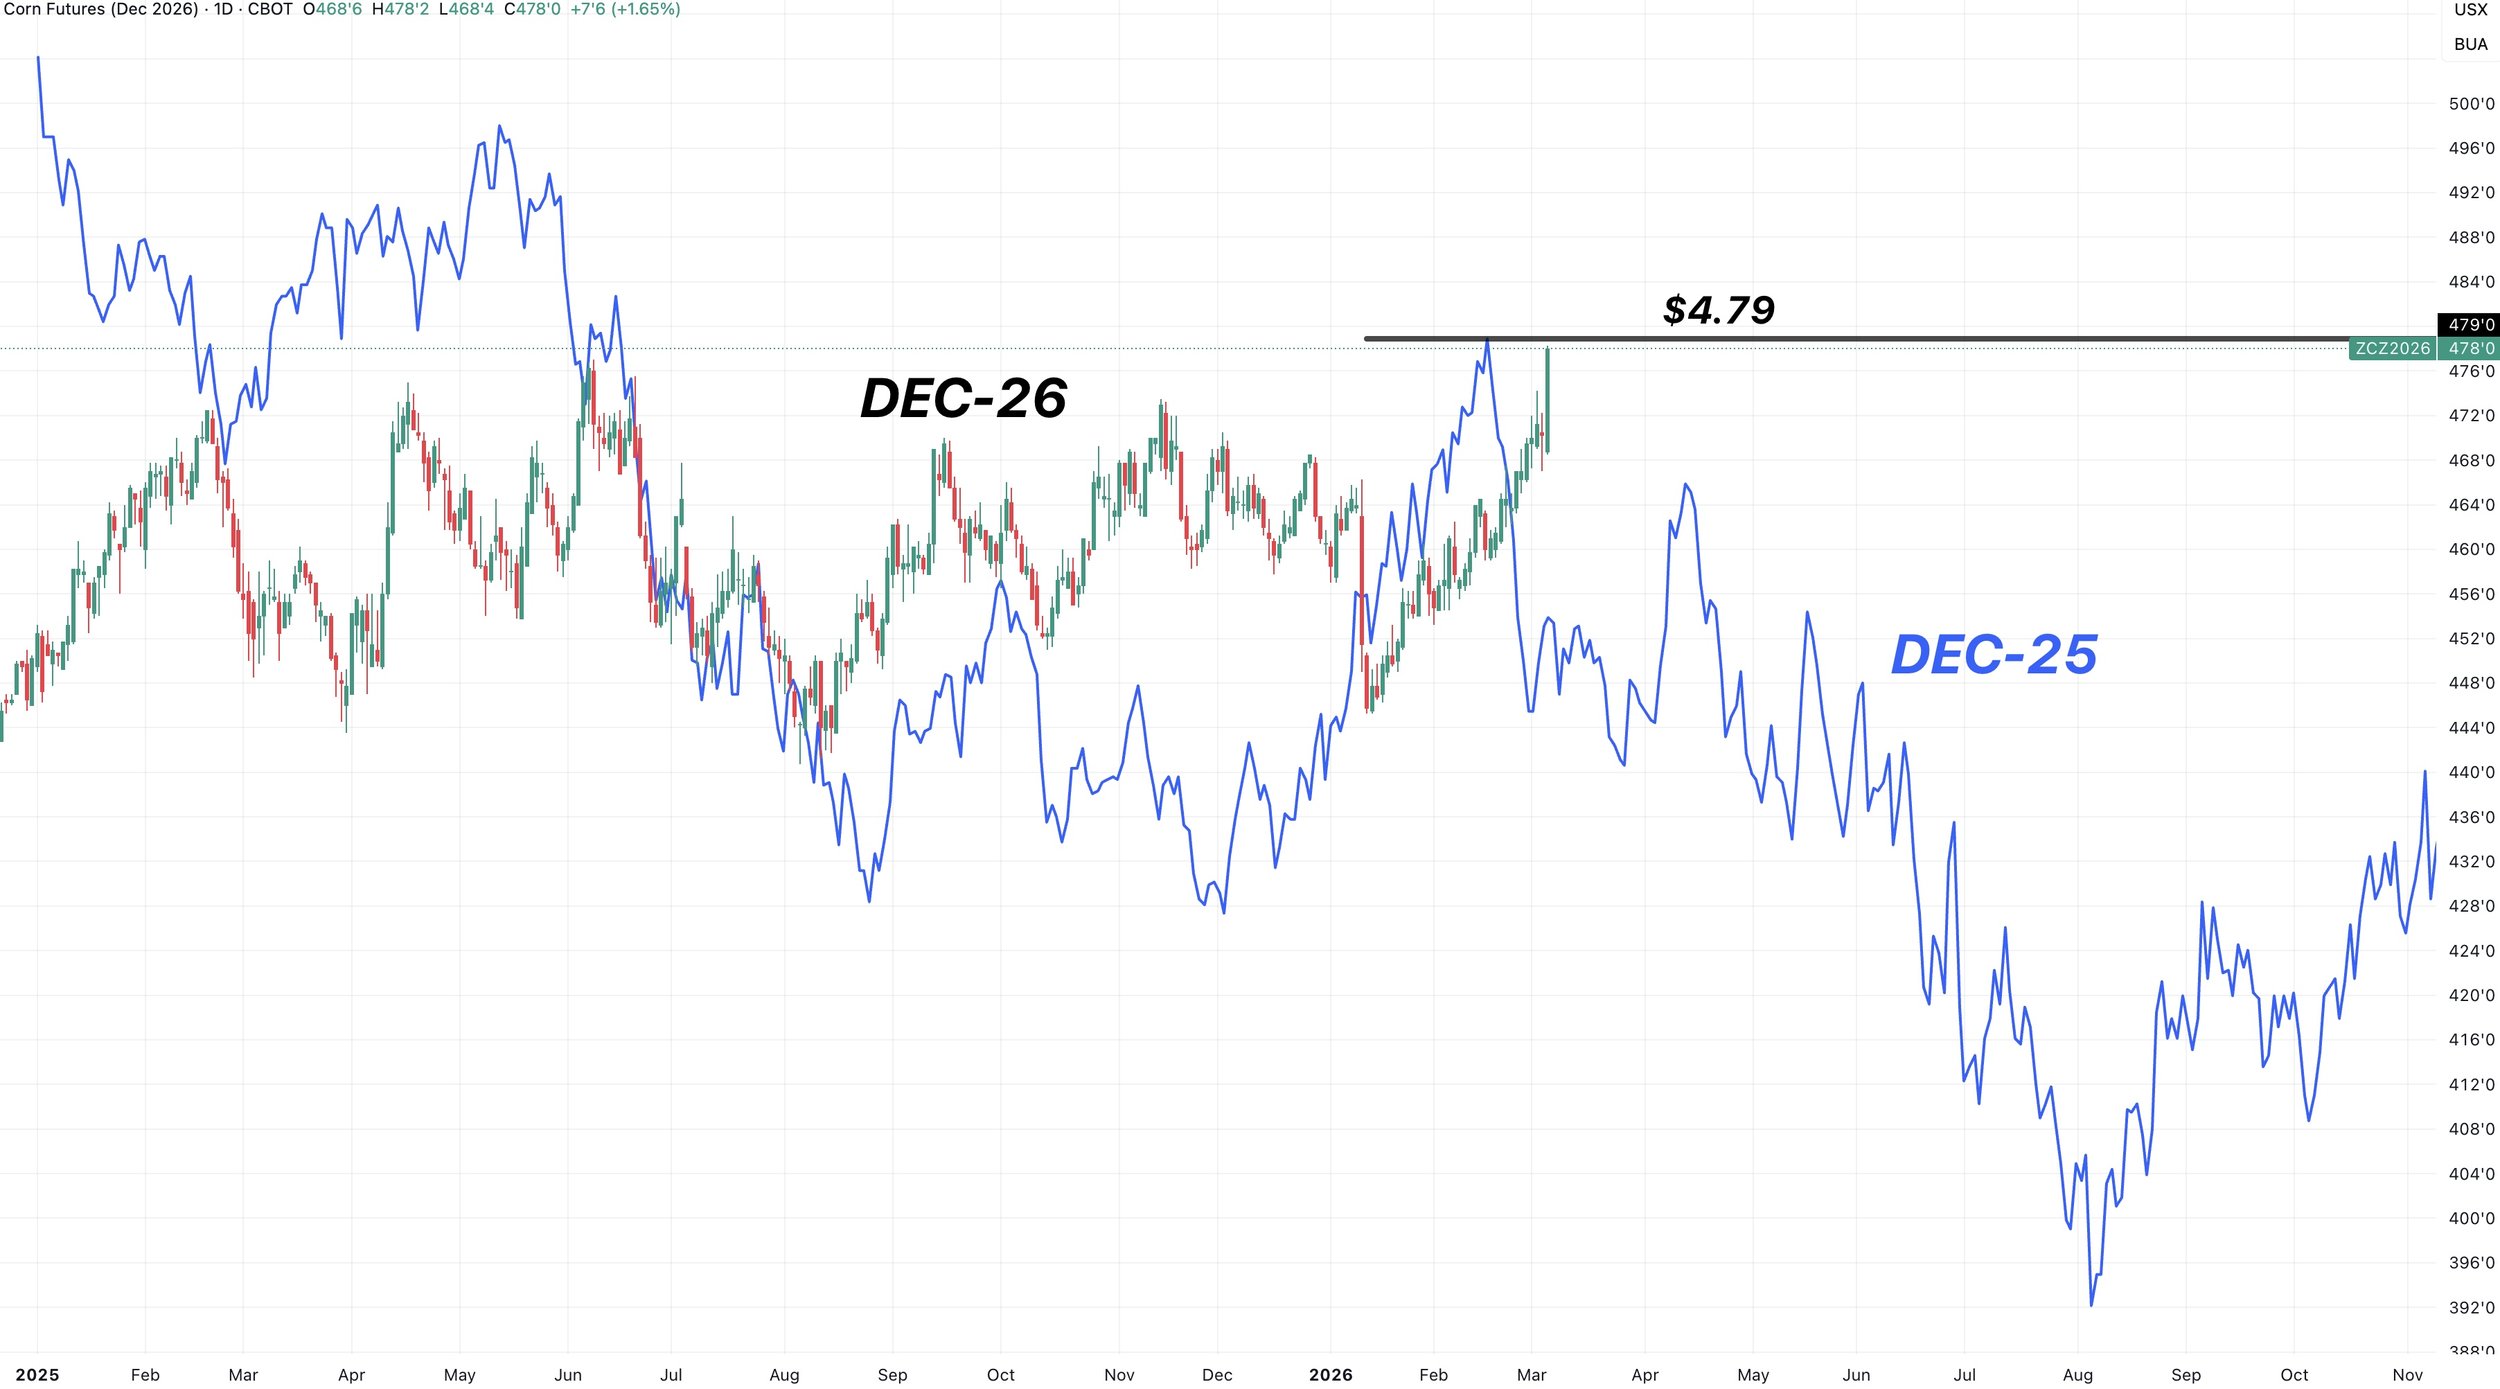
New Crop 2025 vs 2026:
Here is Dec-25 vs Dec-26.
Last year's high for new crop was $4.79
So we have the ability to start our new crop marketing this year, where this market topped out at last year.
Not the worst spot to look to start some marketing.
Soybeans
Fundamentals:
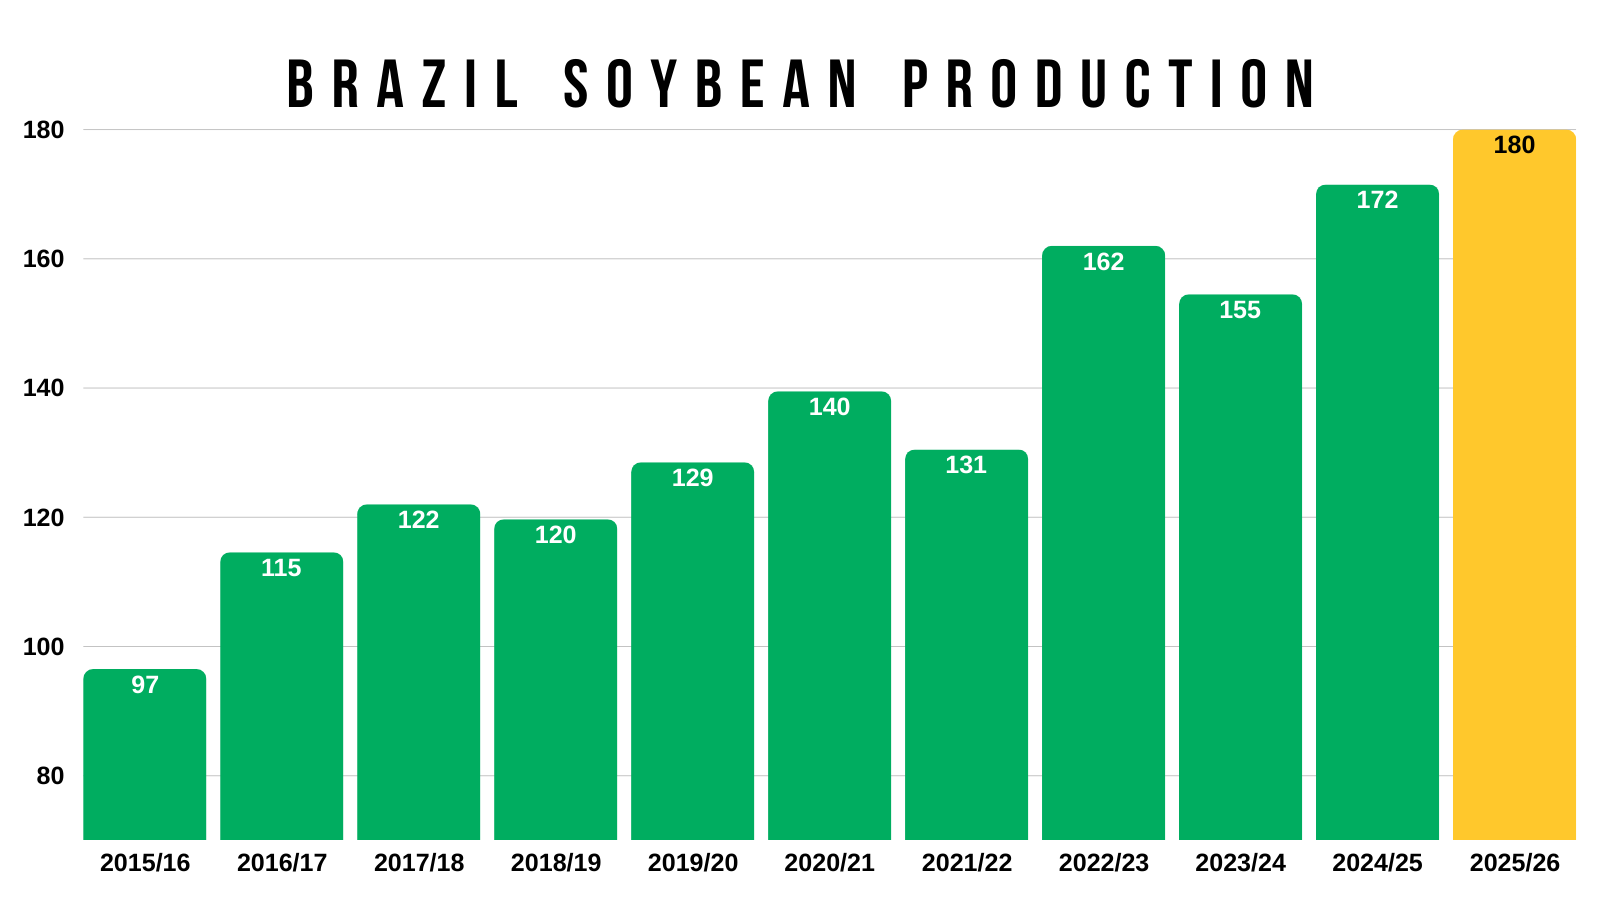
Soybeans continue to grind higher despite the Brazil harvest.
It feels like that monster crop is probably old news.
The US farmer isn’t holding on to that many old crop beans, so this rally isn’t facing farmer selling either.
Some were worried that China would cancel the meeting between them and Trump that is scheduled at the end of the month because Iran is one of China's biggest partners.
But the market doesn’t seem too worried, and sources say that the meeting is still on.
Not much fundamentally to update as it's the same old news we've had for a while.
Technicals:
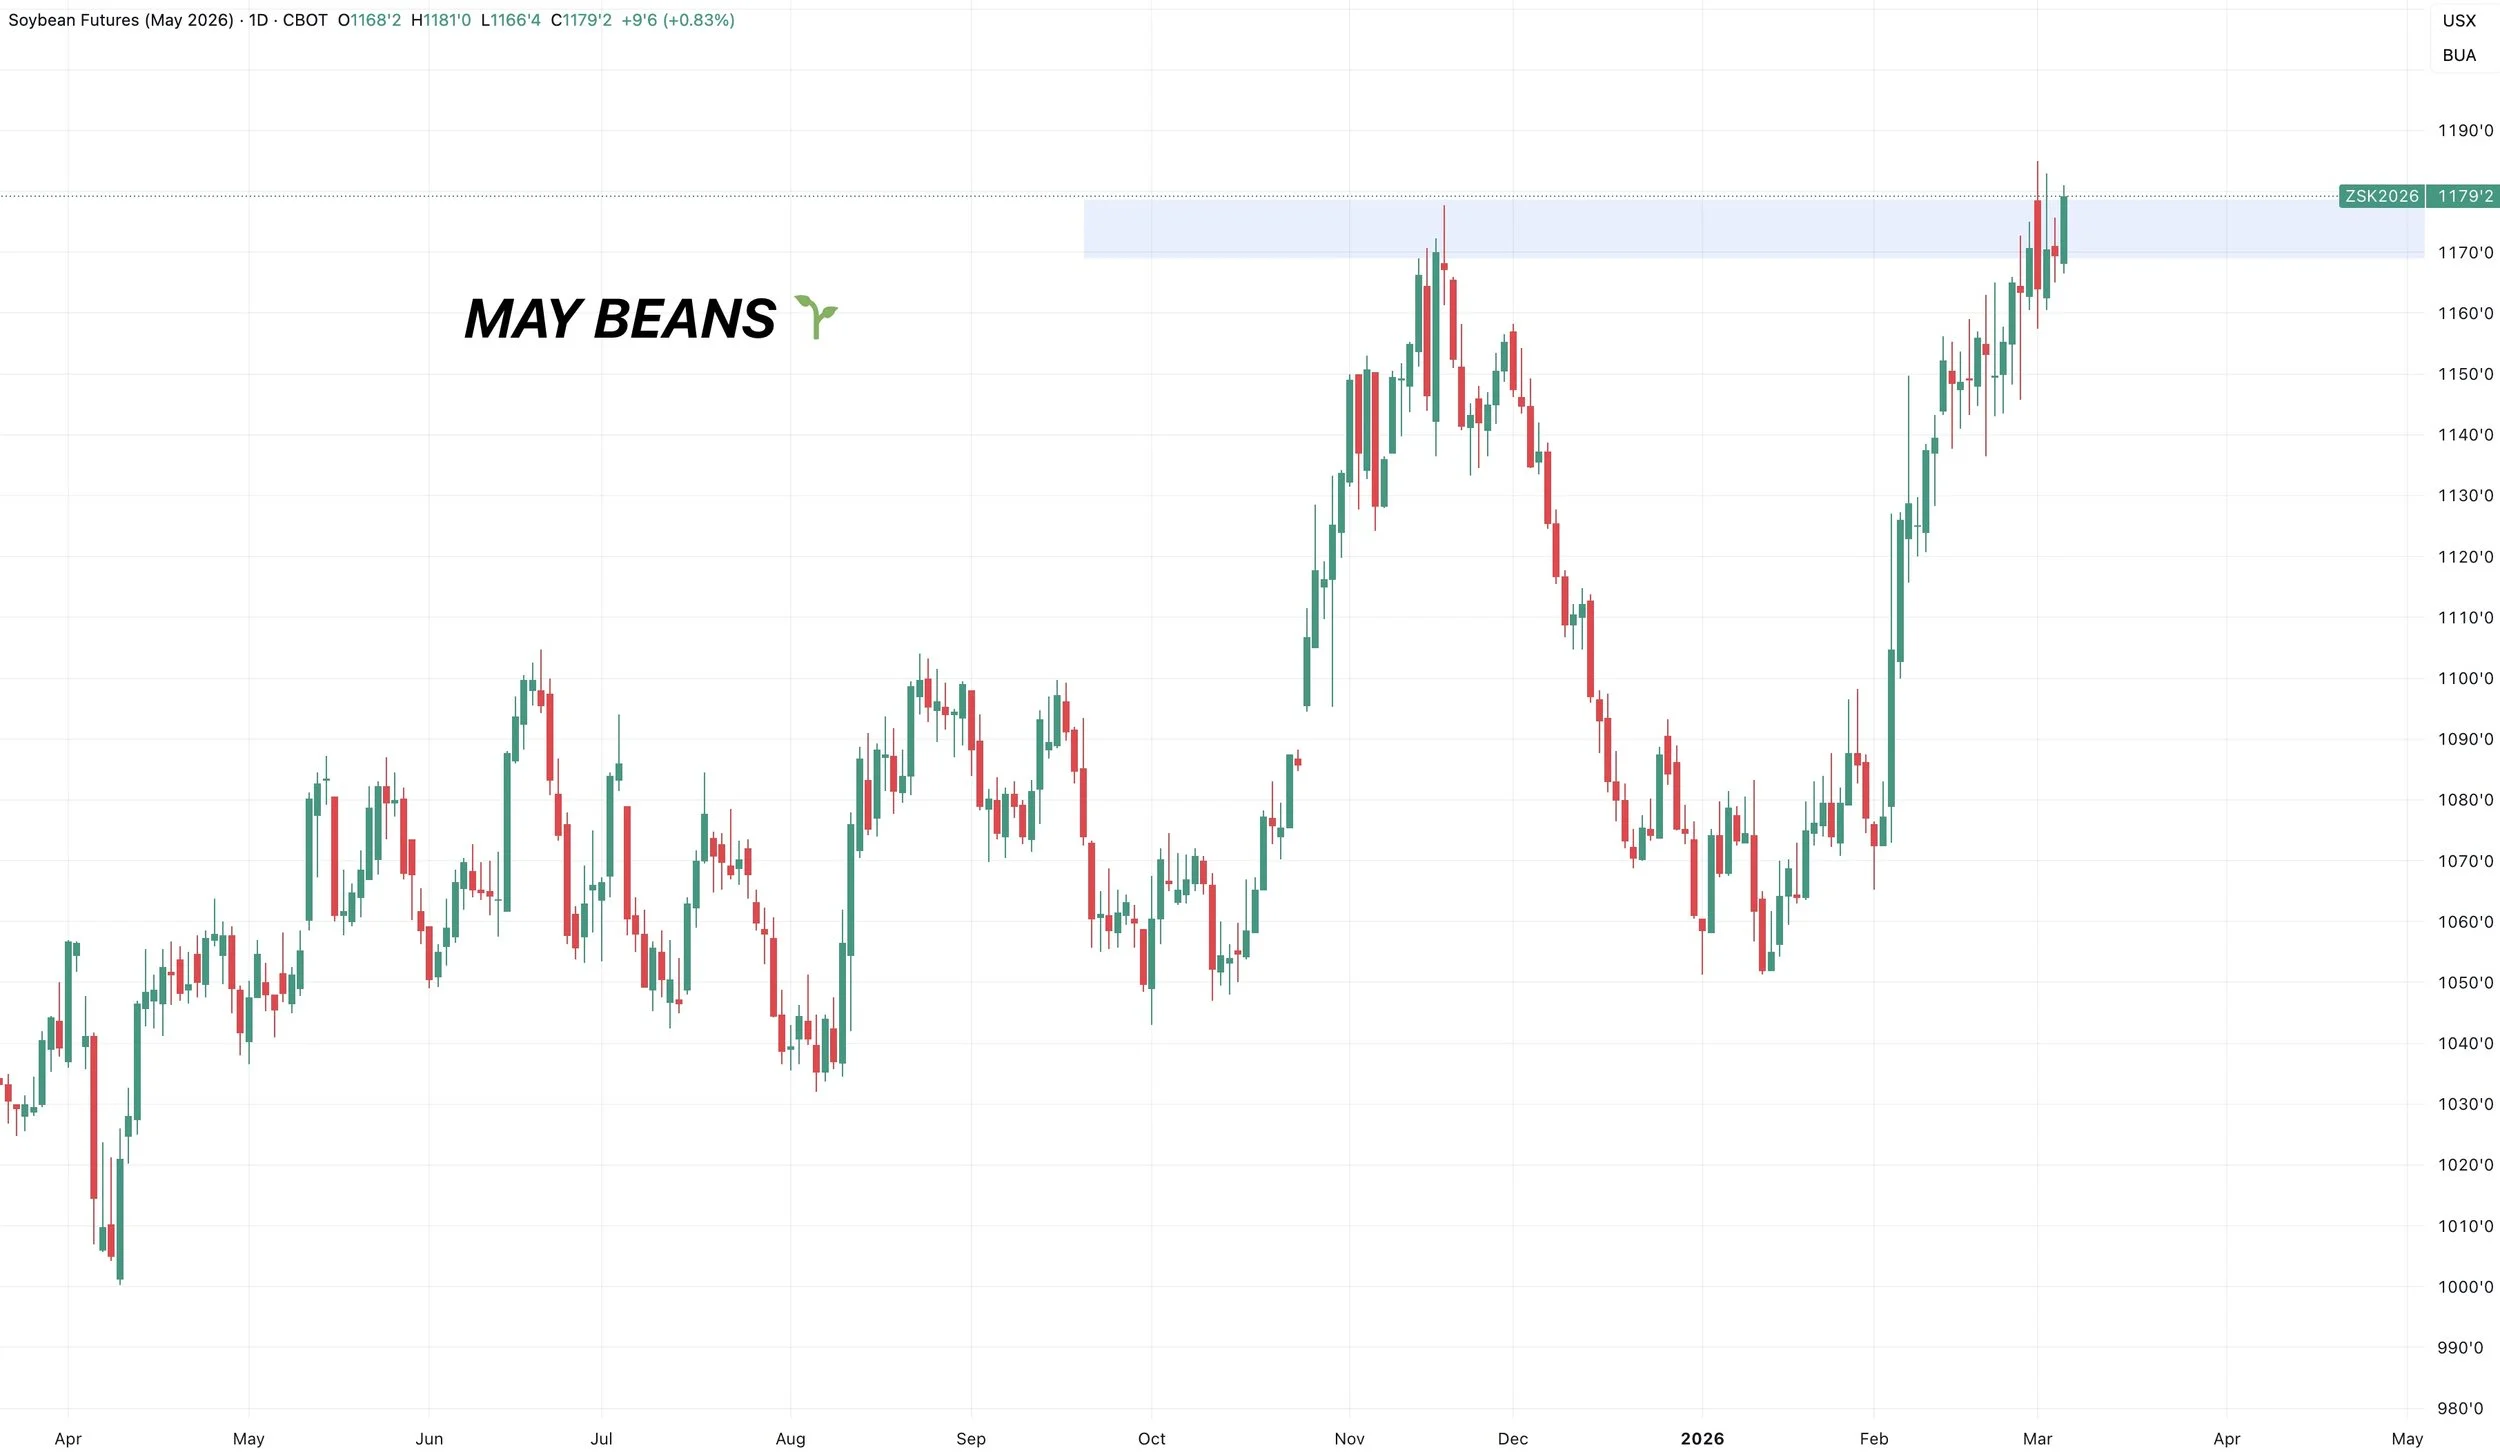
May Beans:
We already sent out a sell signal and hedge alert at these levels a week ago.
So if you haven’t rewarded the rally yet, we like doing so.
We are still battling those November highs, but if we break above it opens the door alot higher.
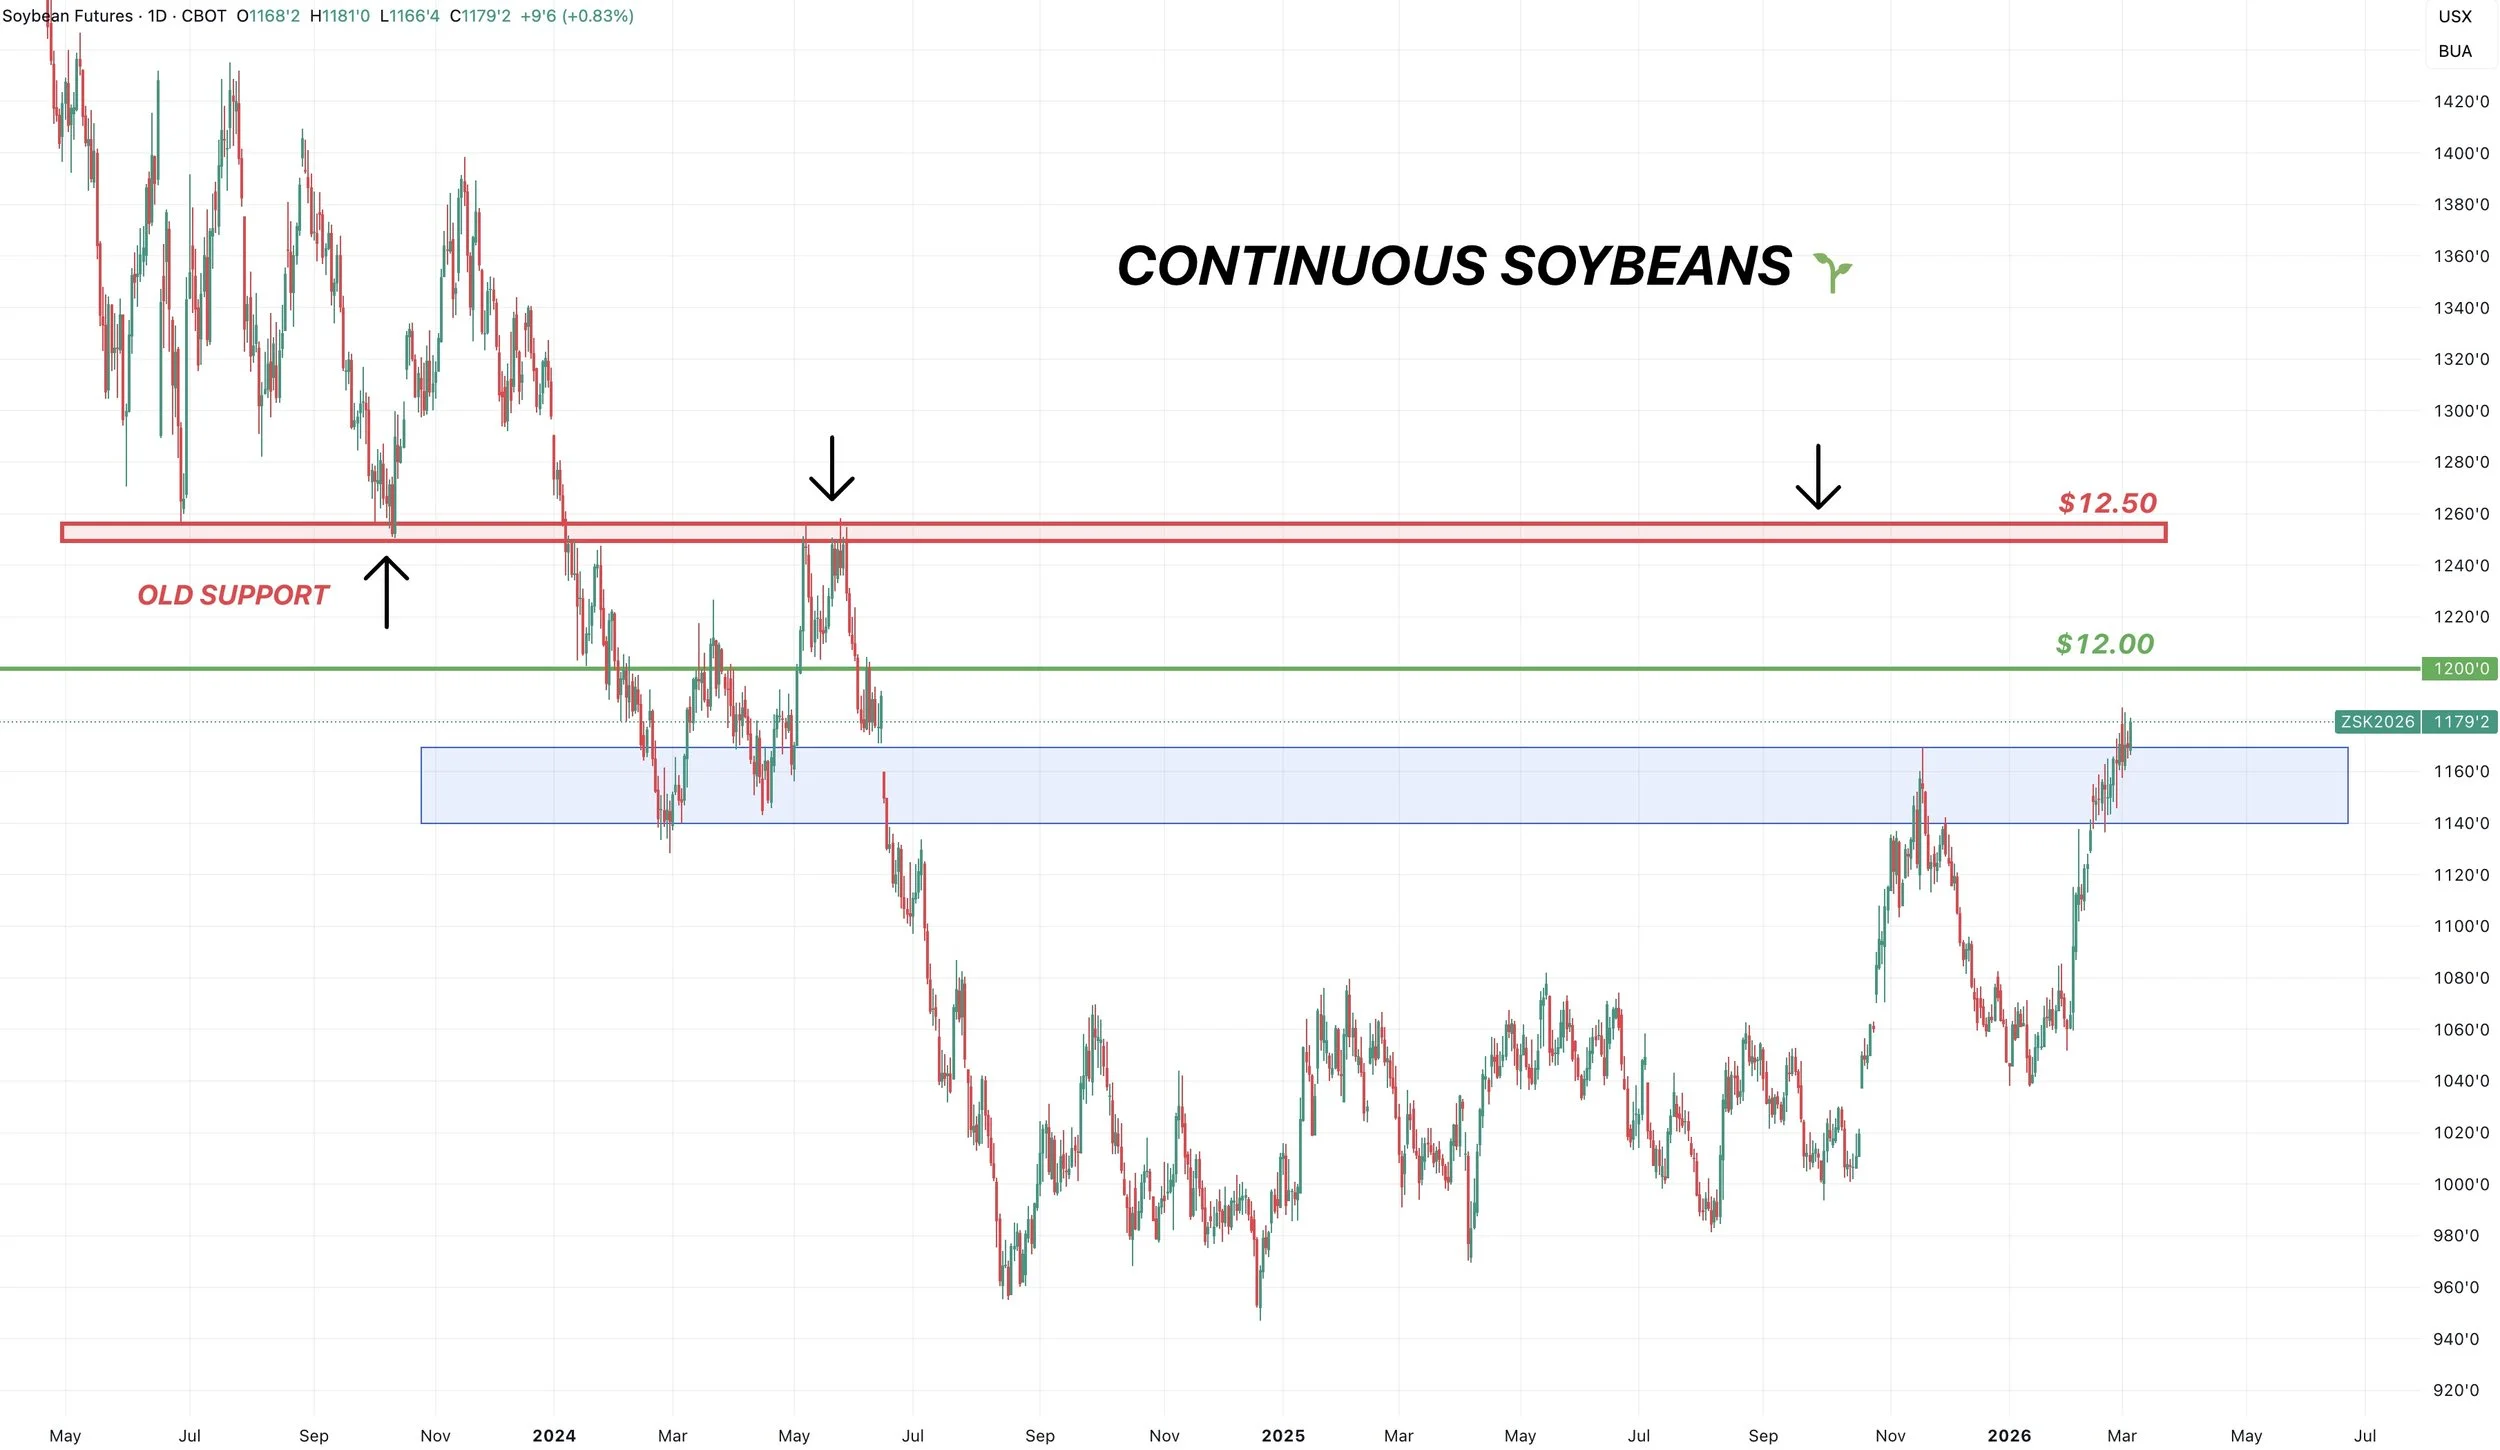
Front Month Chart:
Next targets are still $12.00 then $12.50
$12.00 is psychological
$12.50 is some key support and resistance.
Wheat
Fundamentals:
The world and US fundamental situations still aren’t considered bullish. The world still has plenty of wheat. But fundamentals haven’t mattered on this rally. Wheat is a geopolitical play and war is keeping us up here.
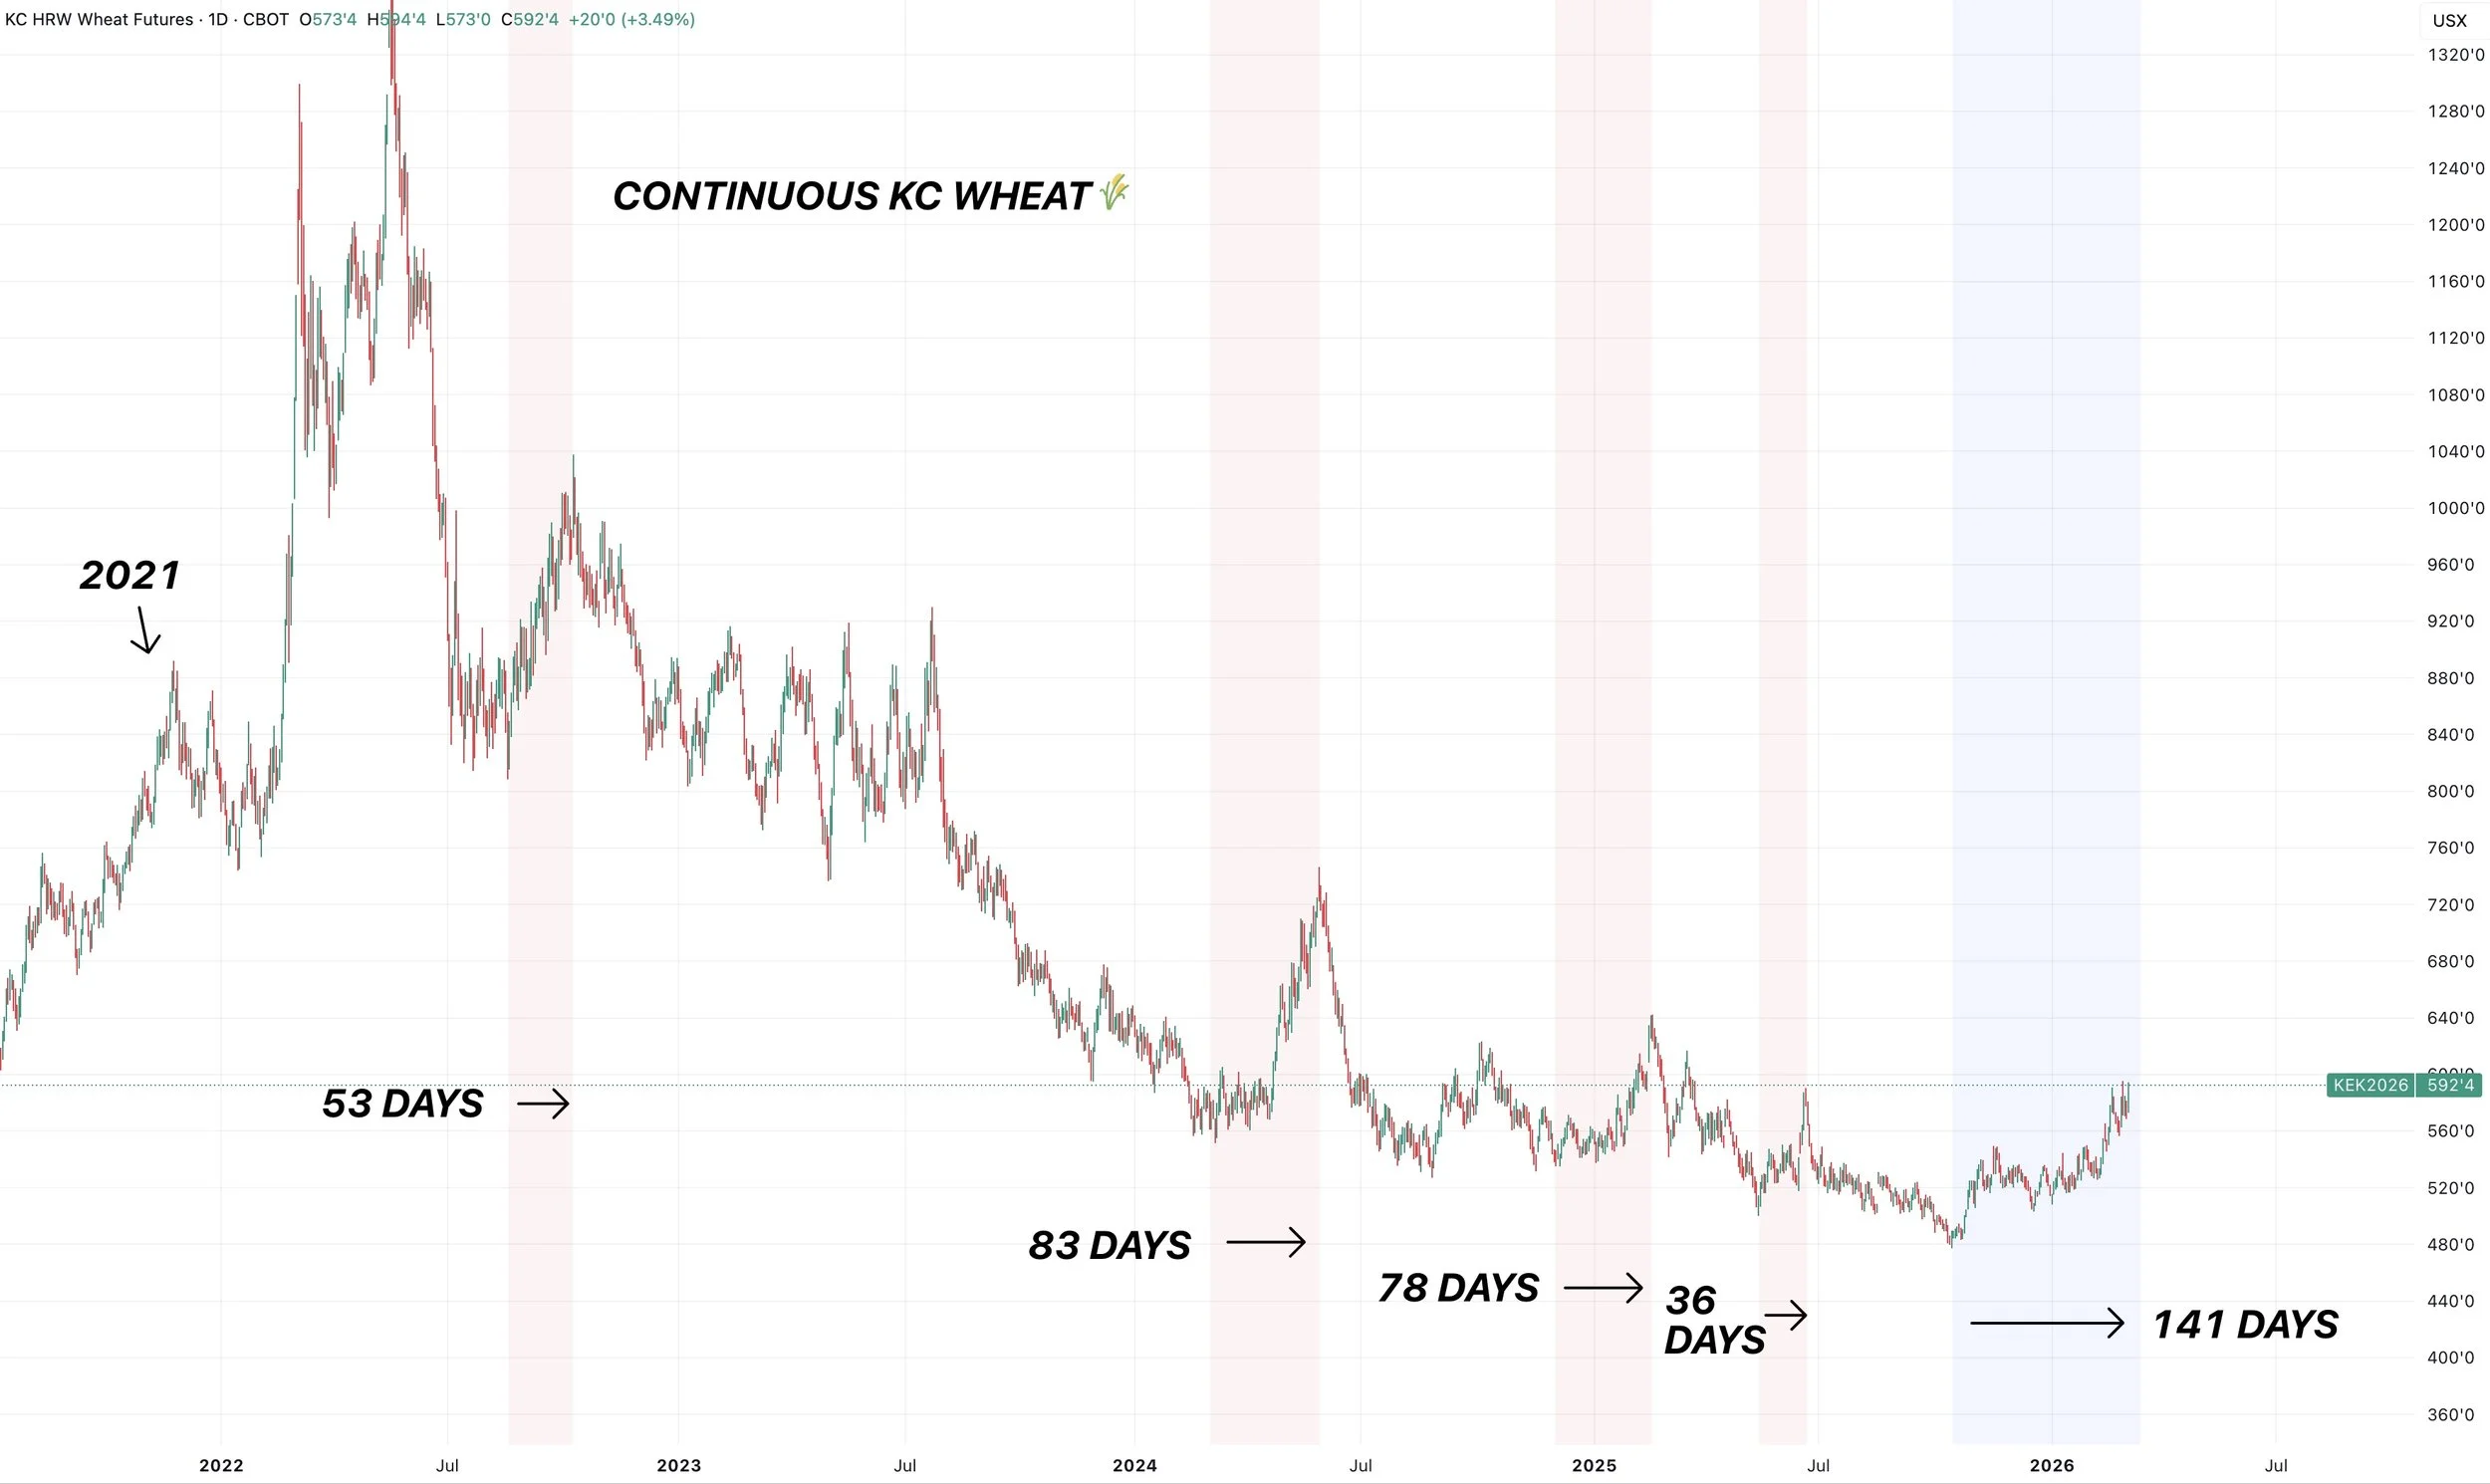
Longest Rally Continues:
I still think the wheat market has put in a long term bottom.
The rally has now lasted 141 days.
That is nearly double the length of the next longest rally we've seen since 2021.
A rally that longs this long feels like a shift in the trend.
The rally hasn’t been that massive.
But the longest sustained rally in 5 years is meaningful and tells a lot.
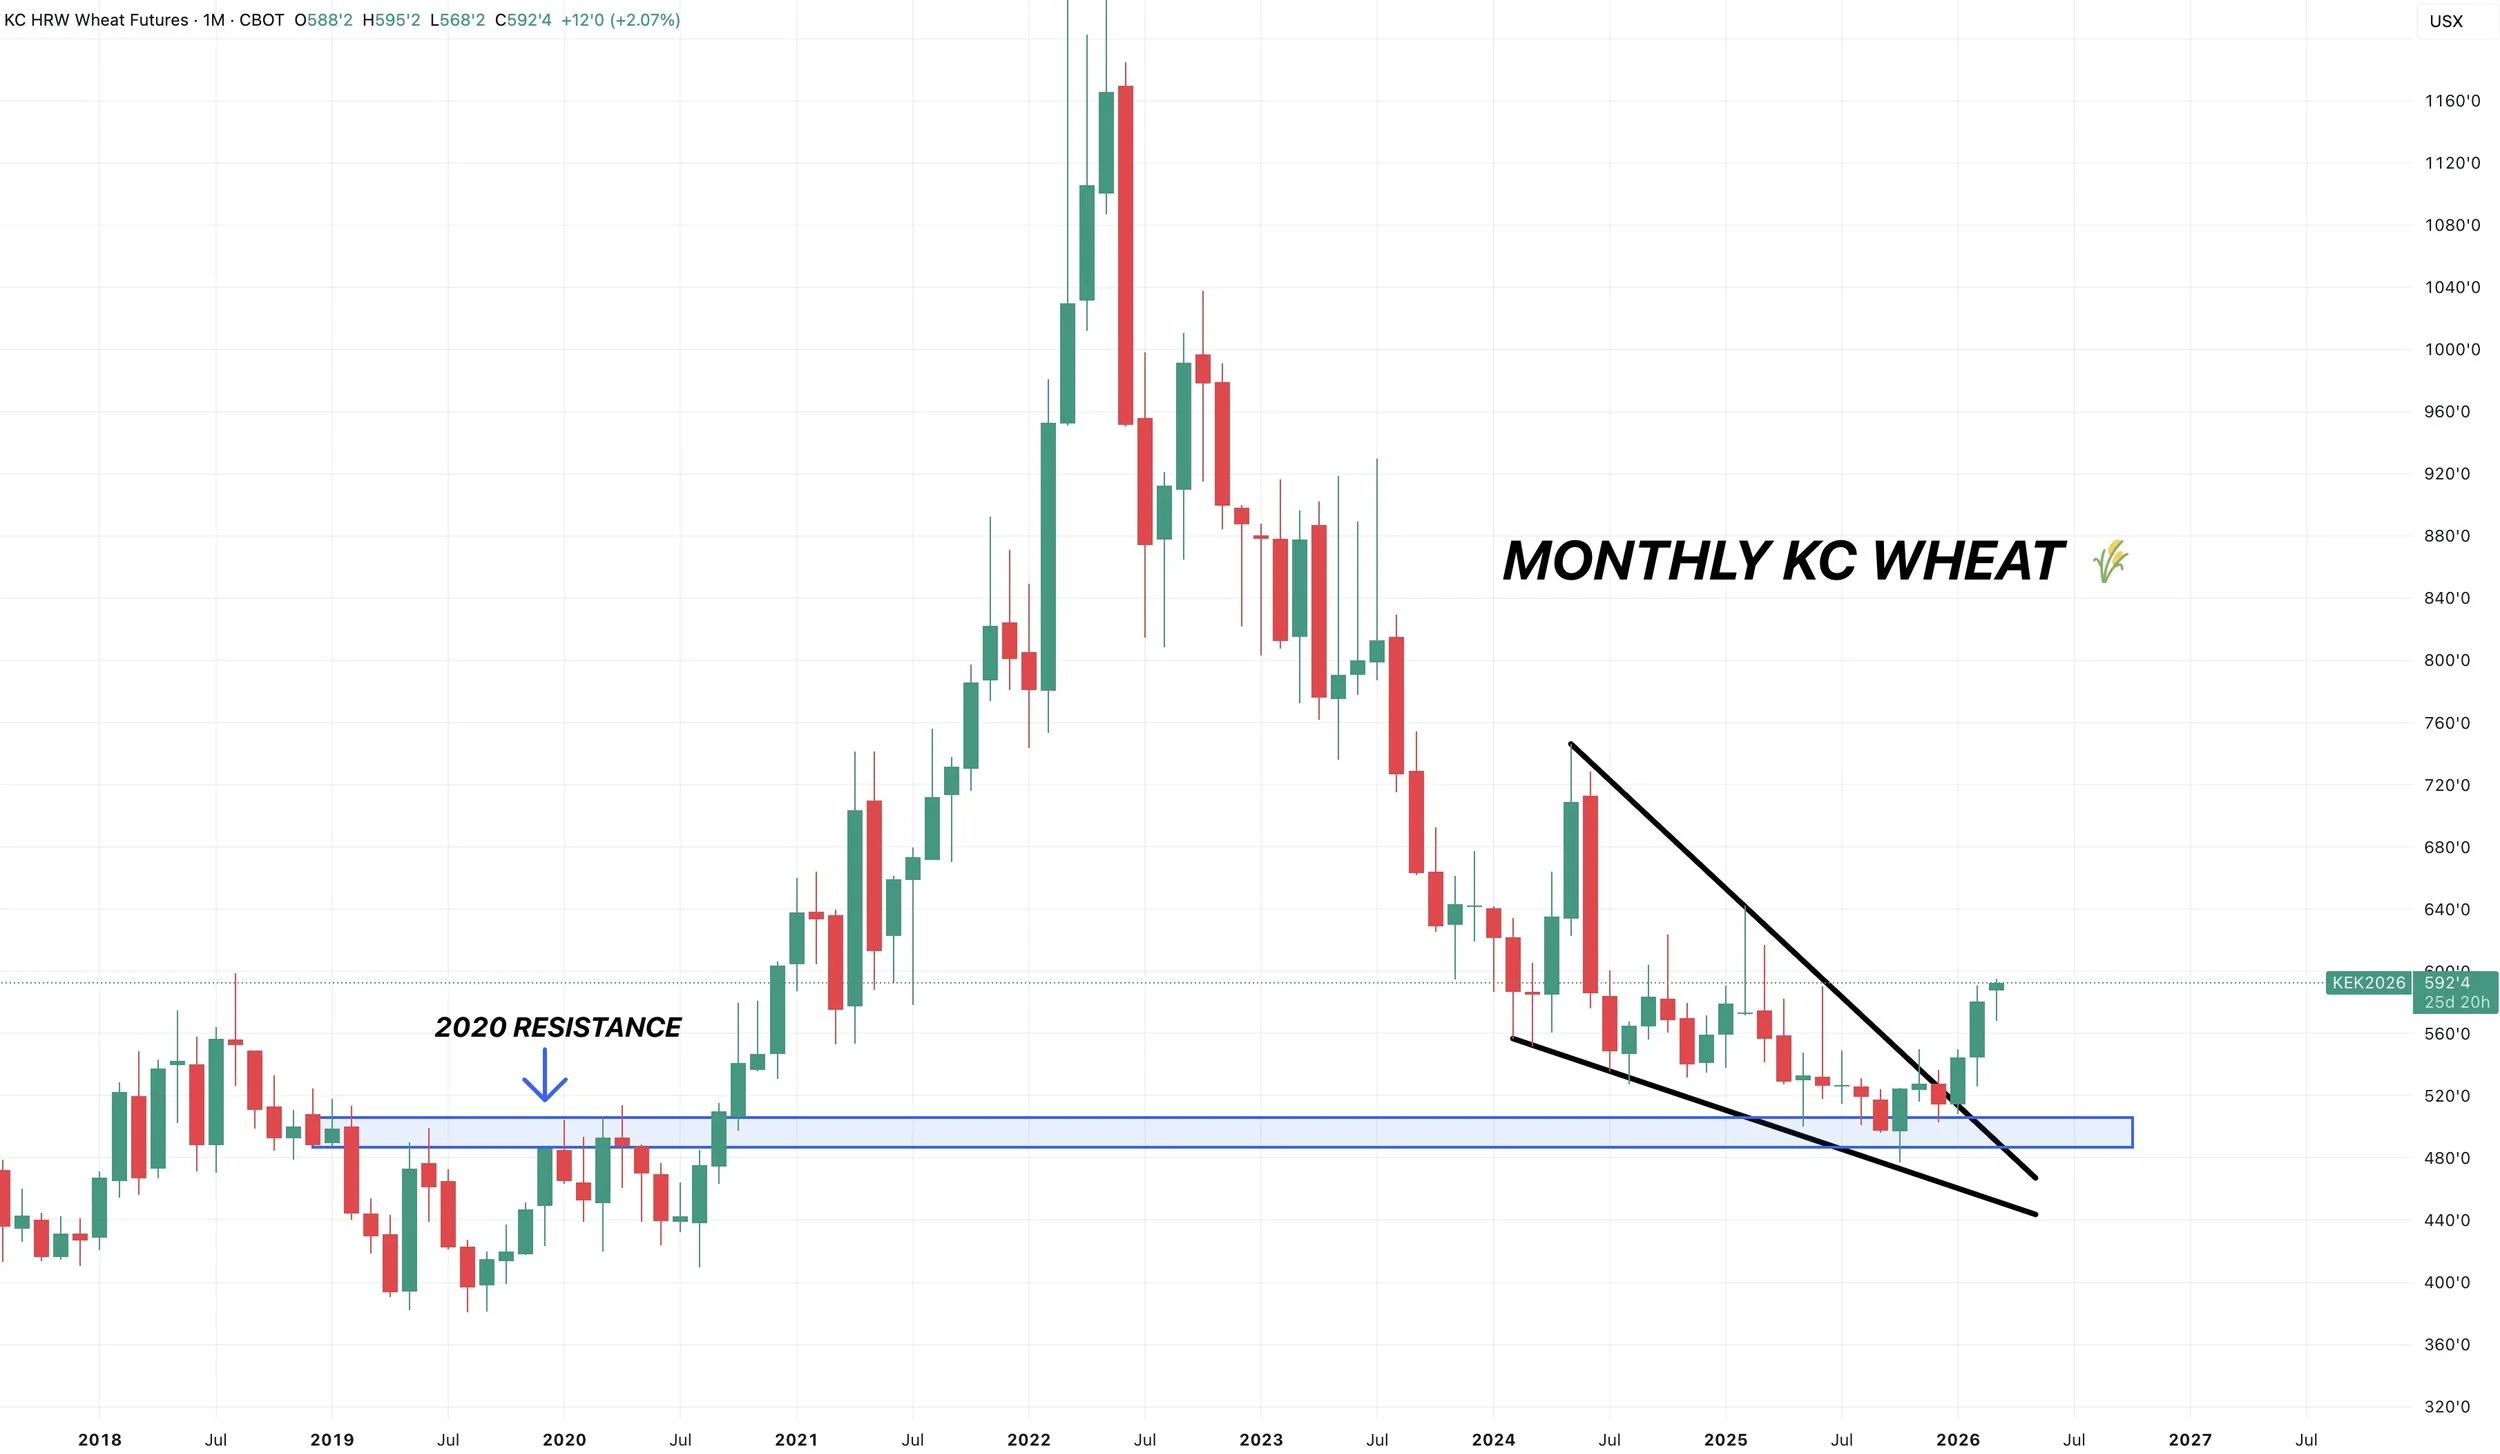
Monthly KC Chart:
You can’t deny that this chart looks pretty solid when you take a step back and look at the overall long term structure of the wheat market.
We find our bottom at those 2020 highs.
We got the picture perfect wedge breakout.
Long term this chart looks pretty optimistic.
Technicals:
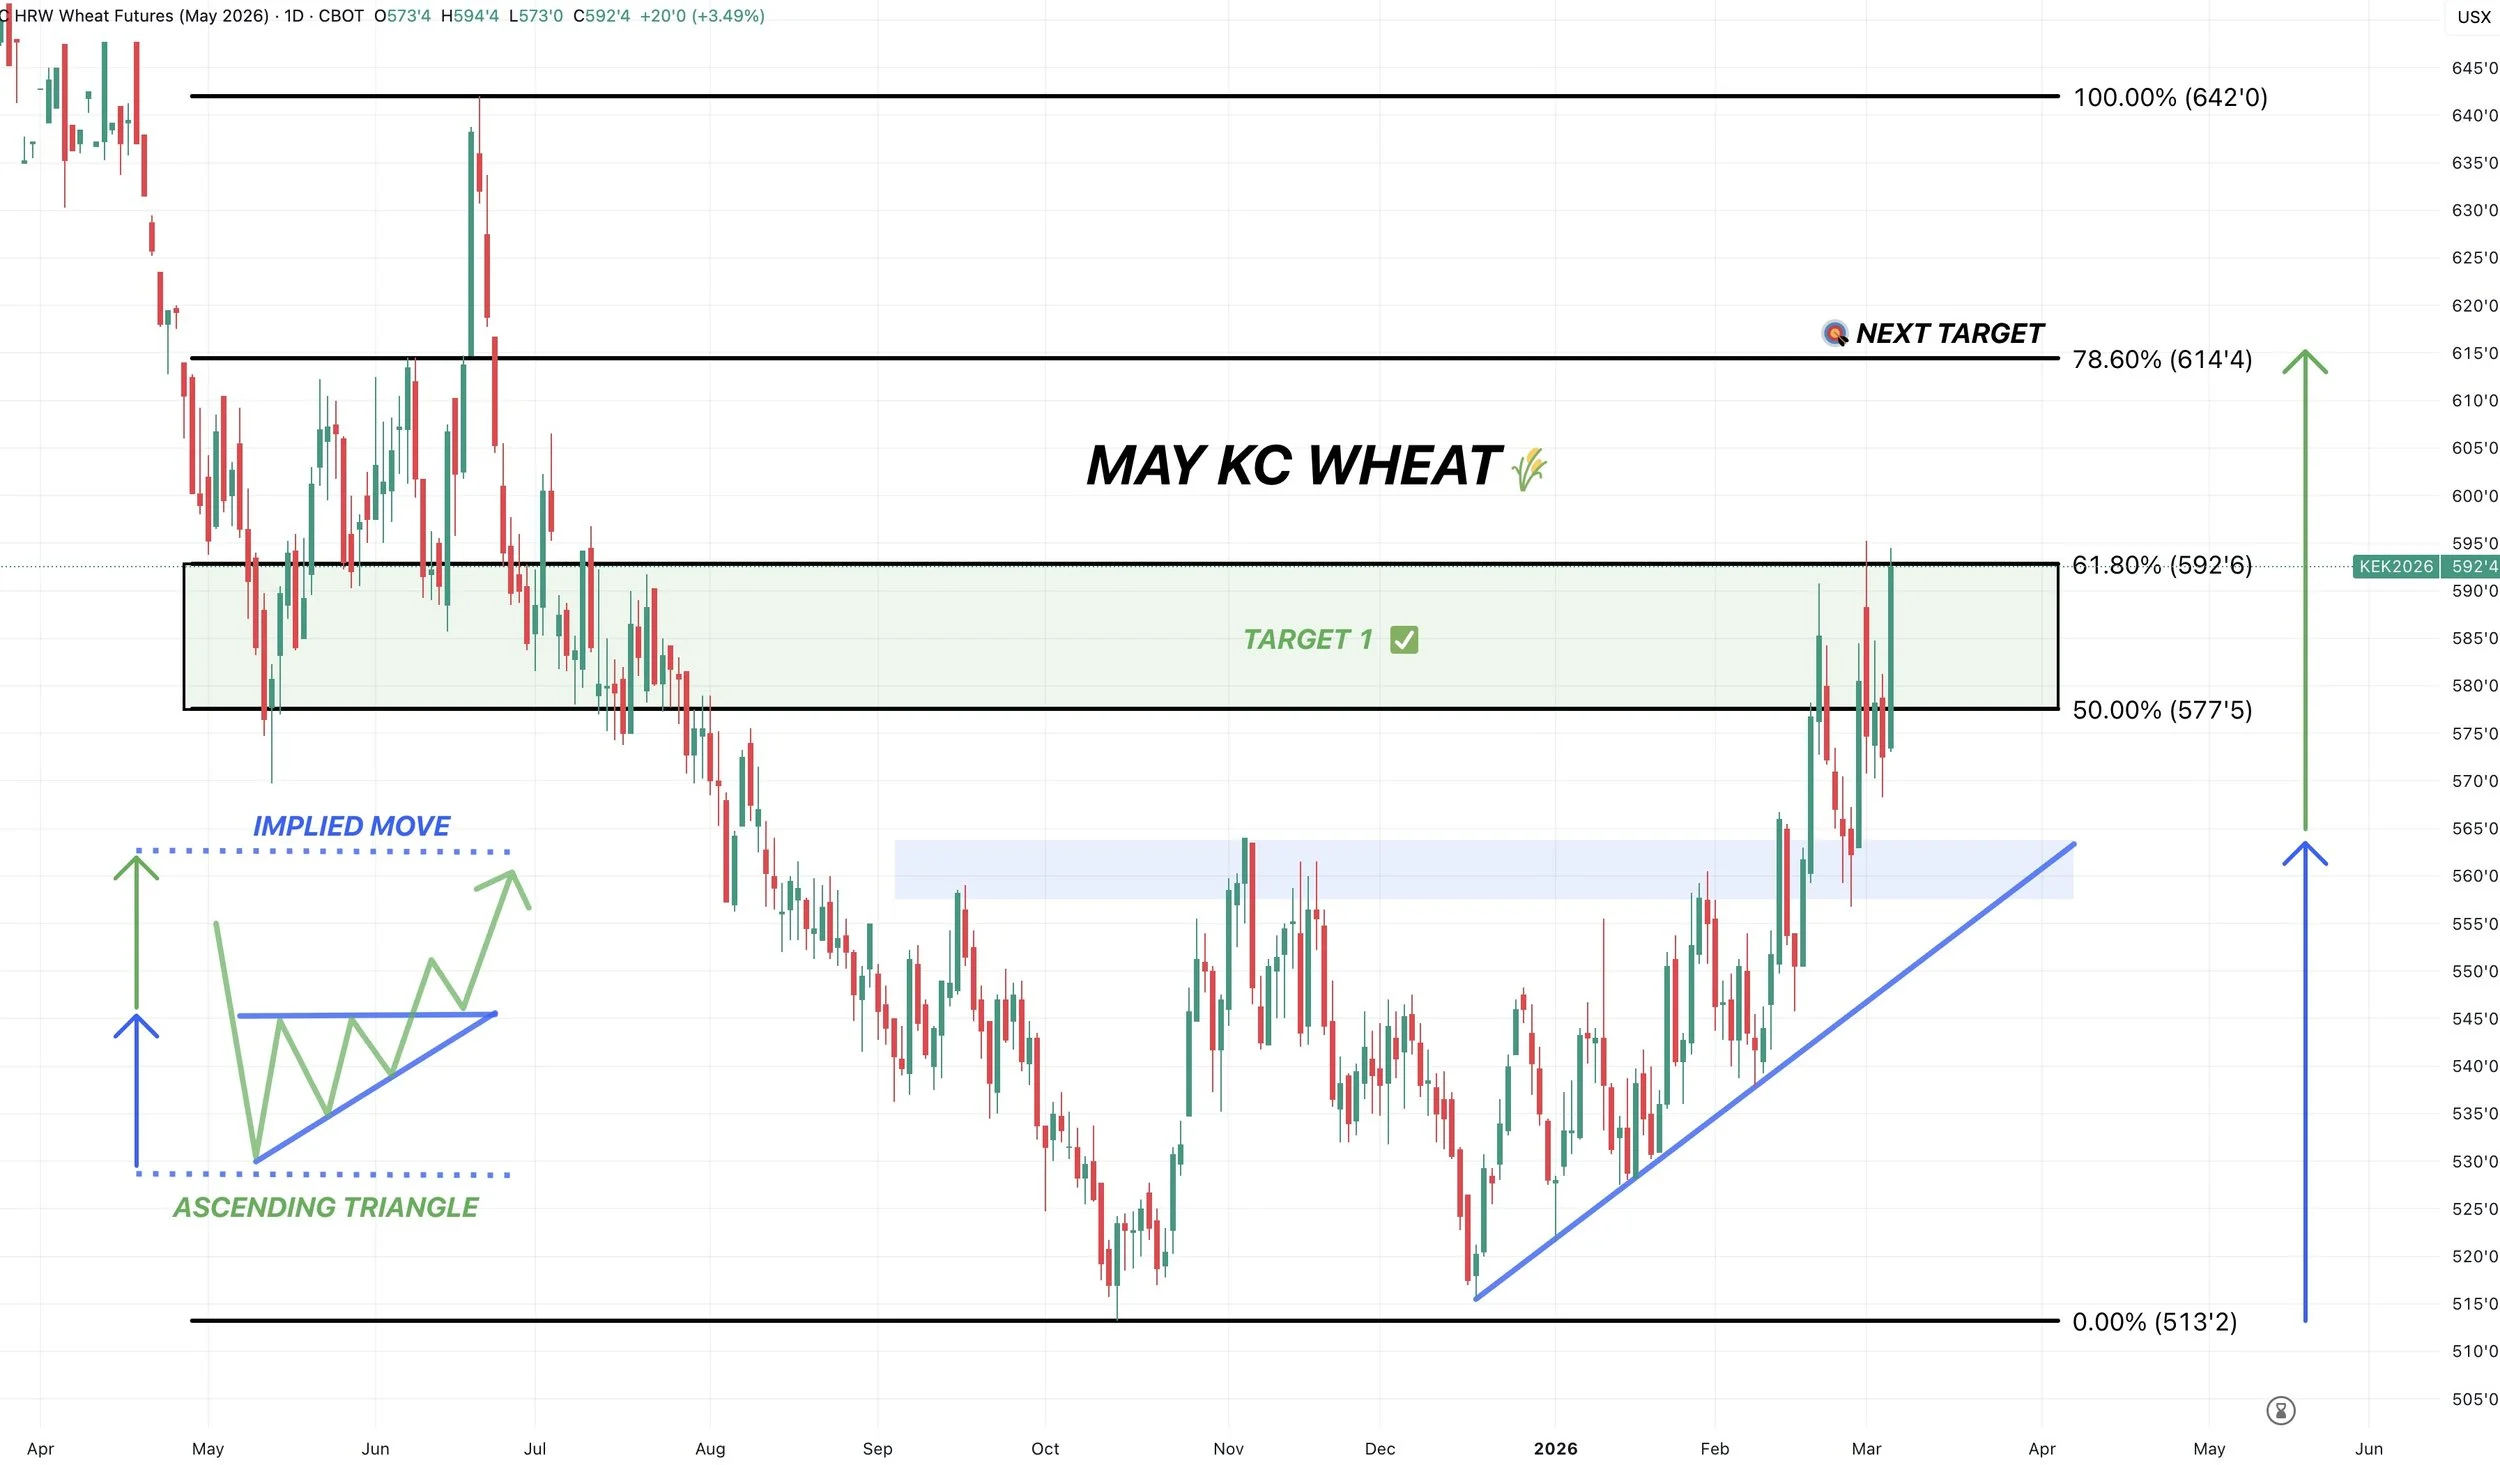
May KC:
We are still battling that first target.
The 61.8% level up to the June highs.
If we break above, the next target is around $6.15
That is the 78.6% level and the implied move of this ascending triangle pattern we broke out of.
How you calculate the implied move is you take the top to the bottom of the triangle, then add that same range on top of the point of breakout.
(Example in bottom left corner)
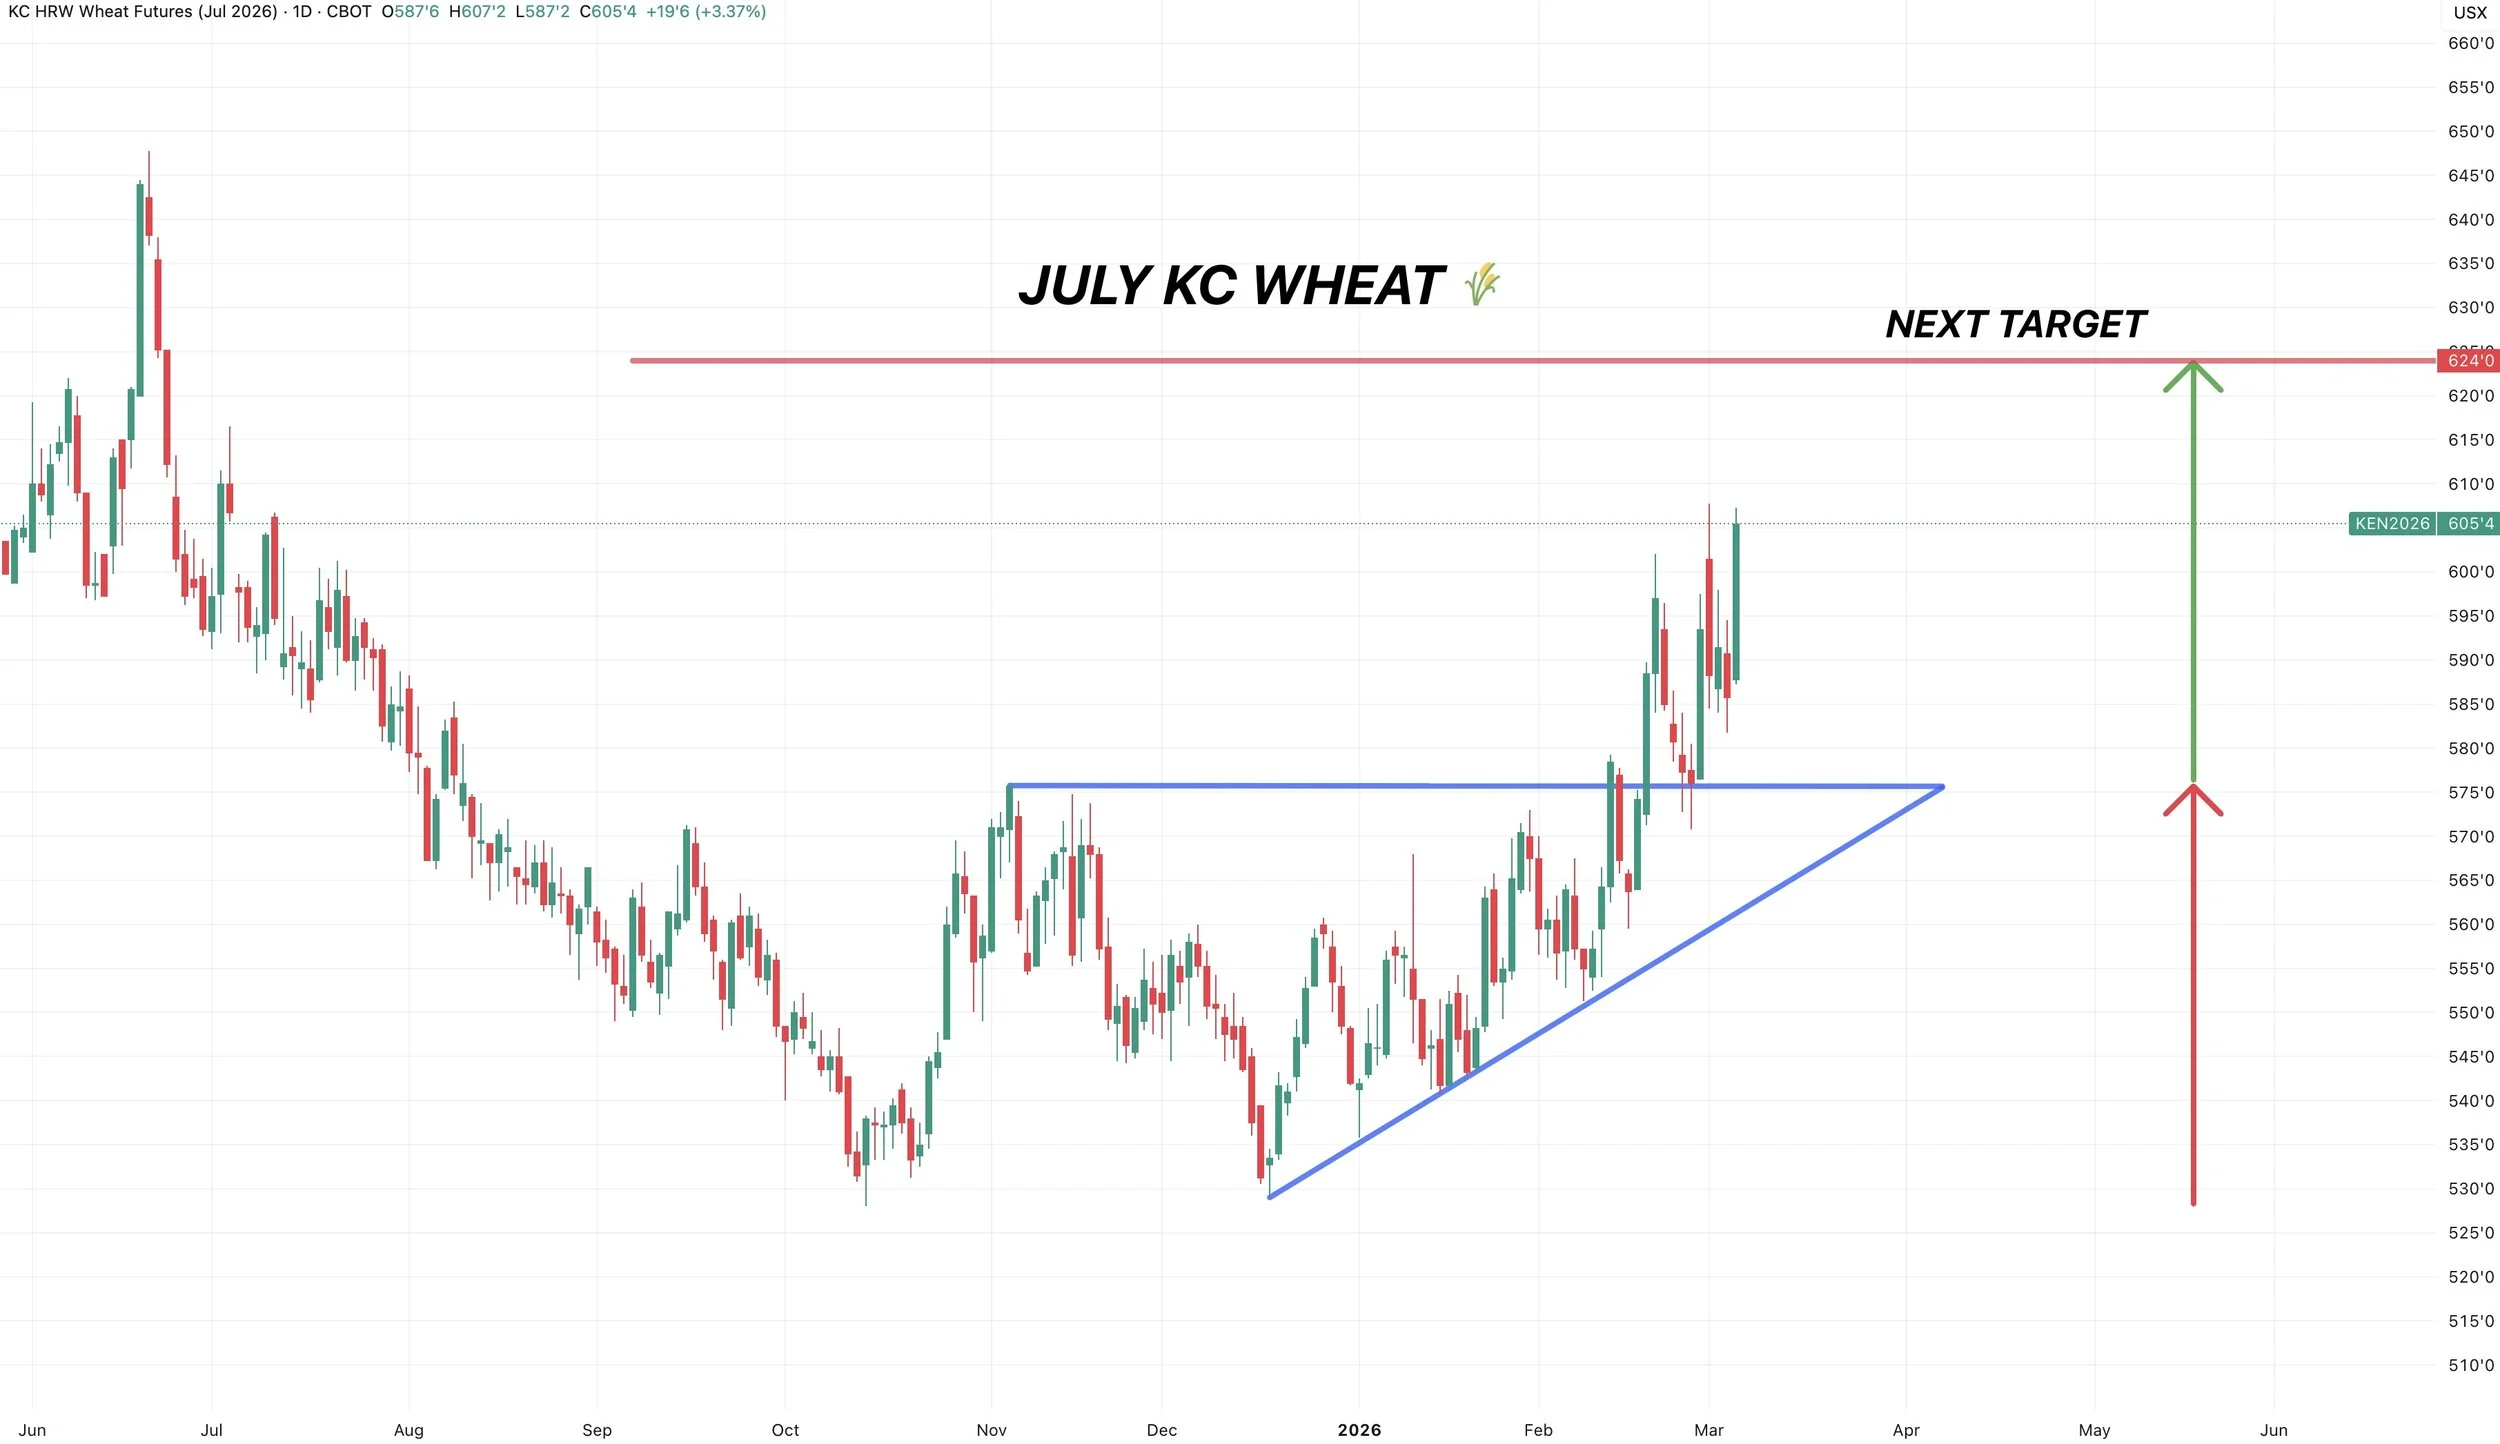
July KC Wheat:
Next target is around $6.25
Which is the implied move of the ascending triangle breakout.
That is where we want to layer into more protection or sales.
So about another 20 cents higher on both the May and July contracts.
Cattle
Technicals:
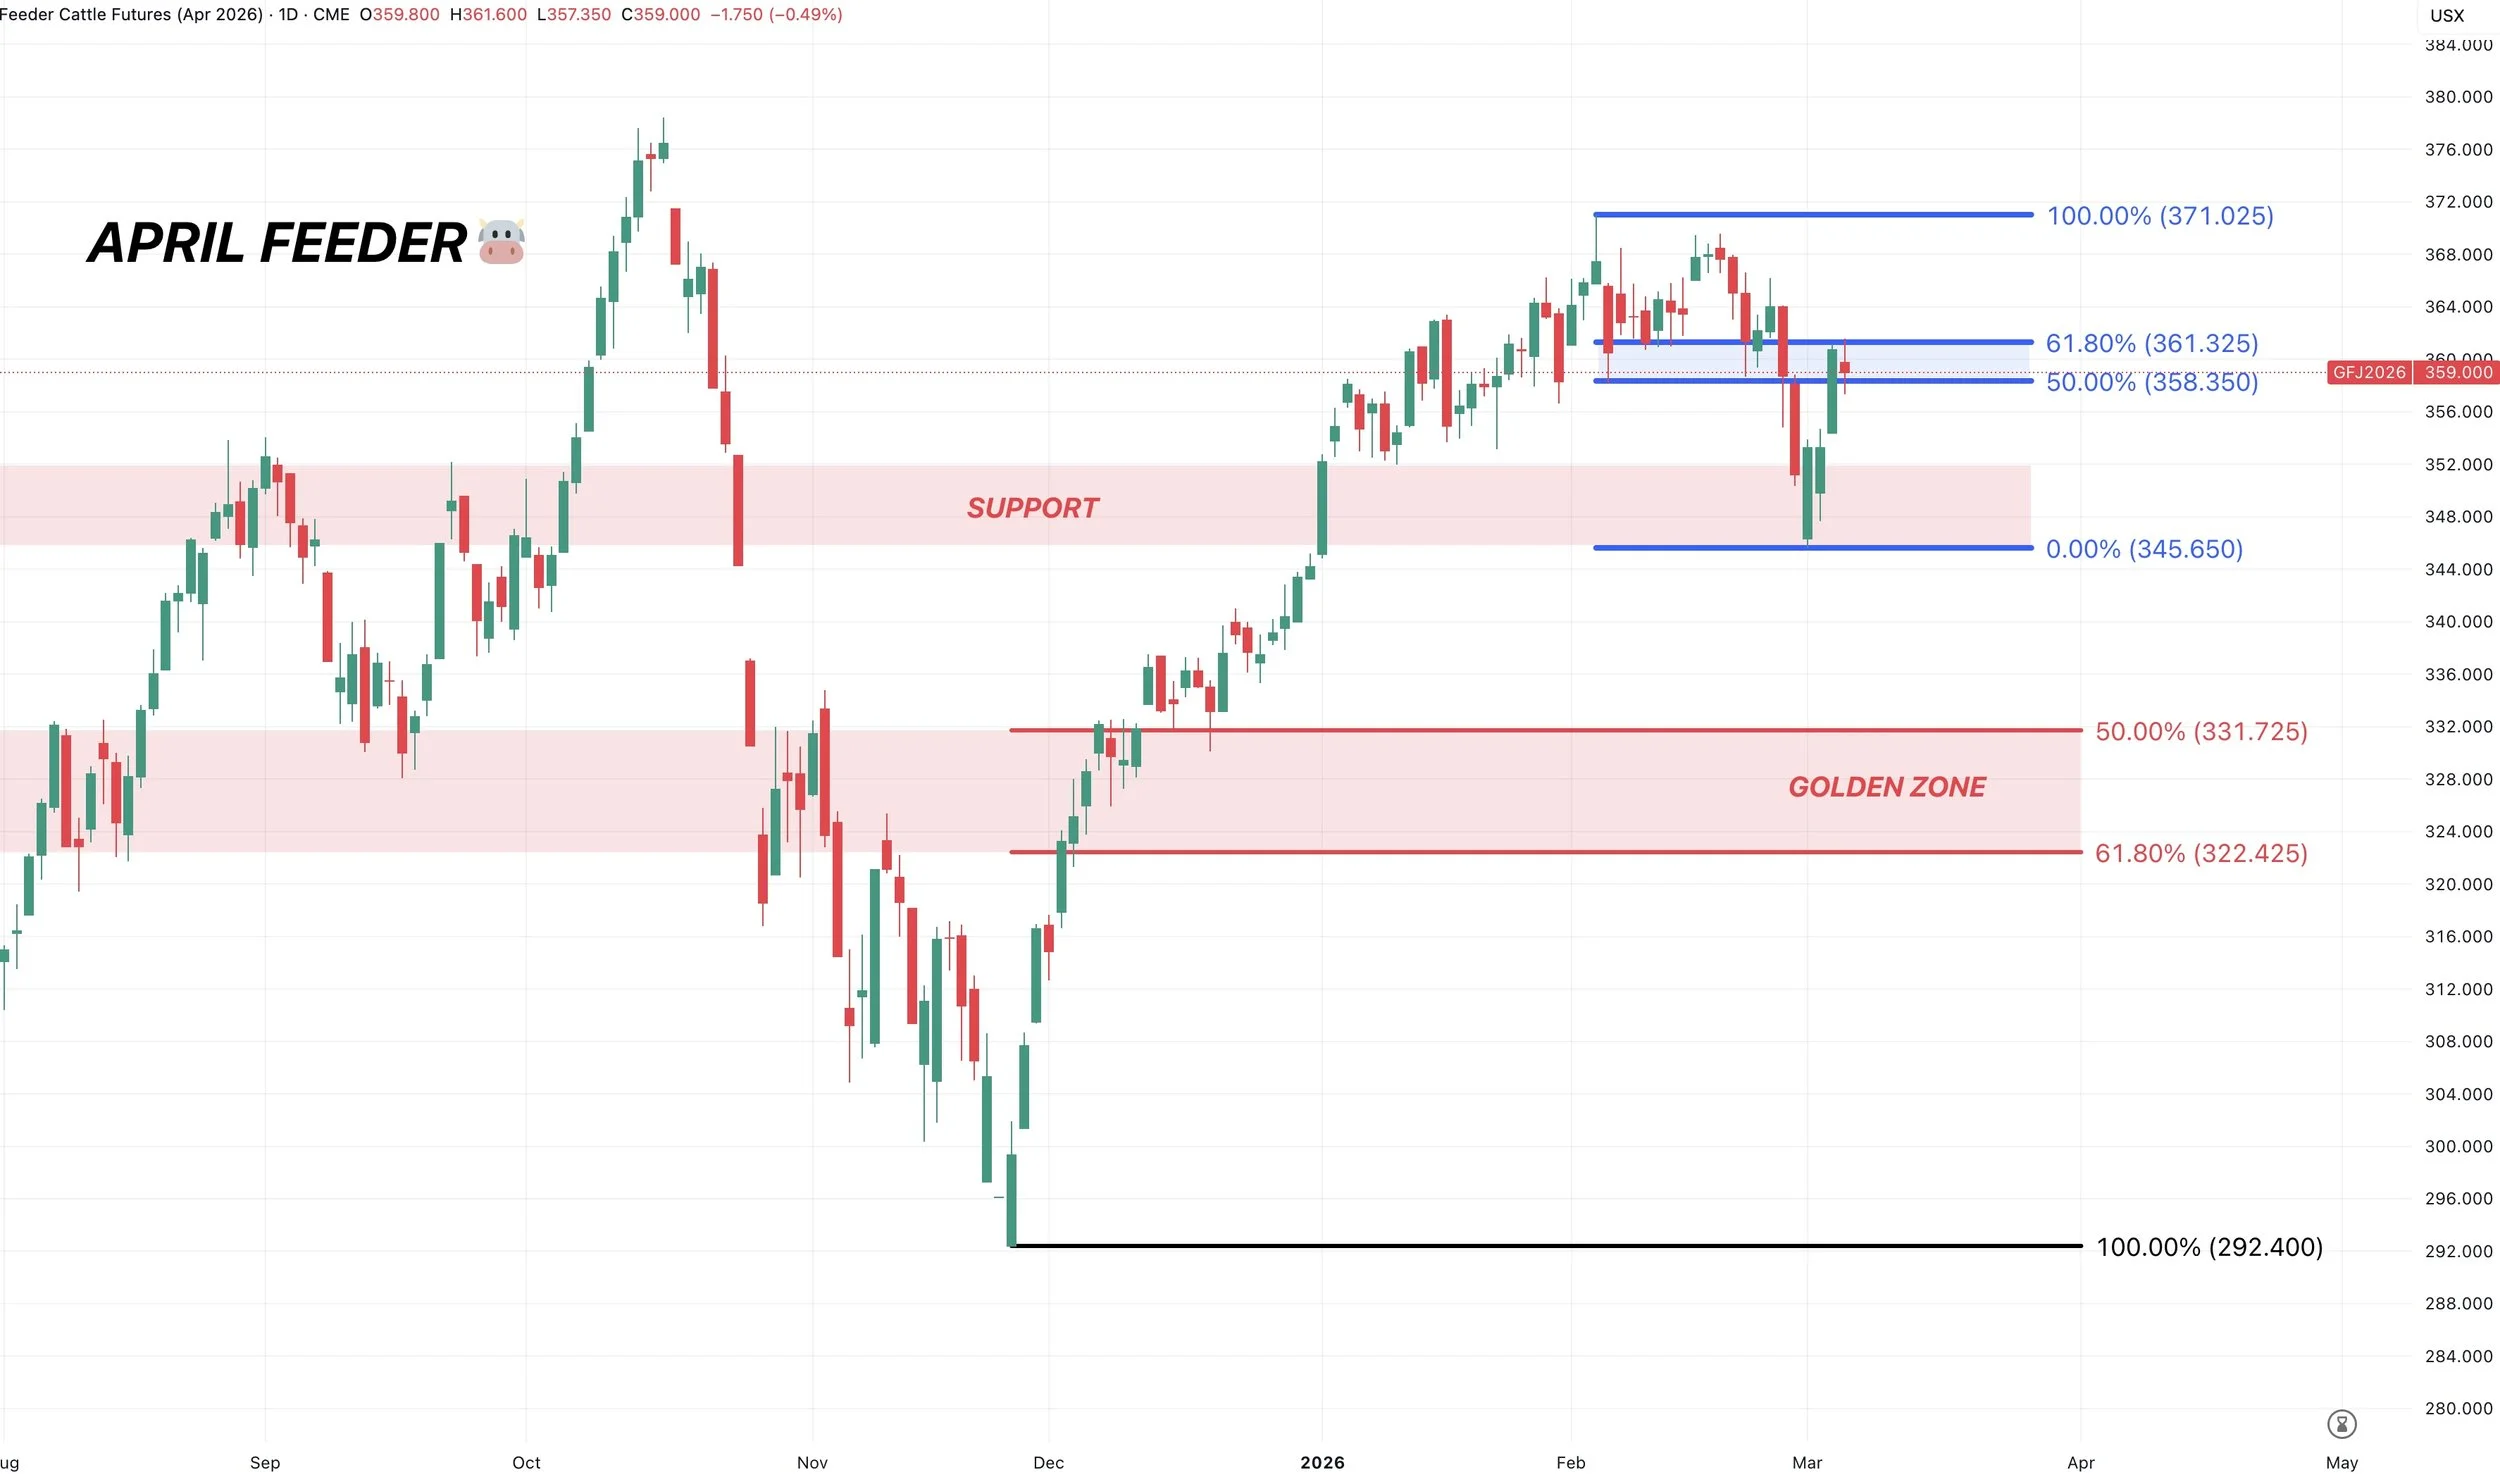
April Feeders
We clawed back 61.8% of the entire sell off.
This is a key spot where a lot of bounces can fail.
So it makes sense to add some additional protection on this bounce.
However, break above this level, and we probably go and test the highs.
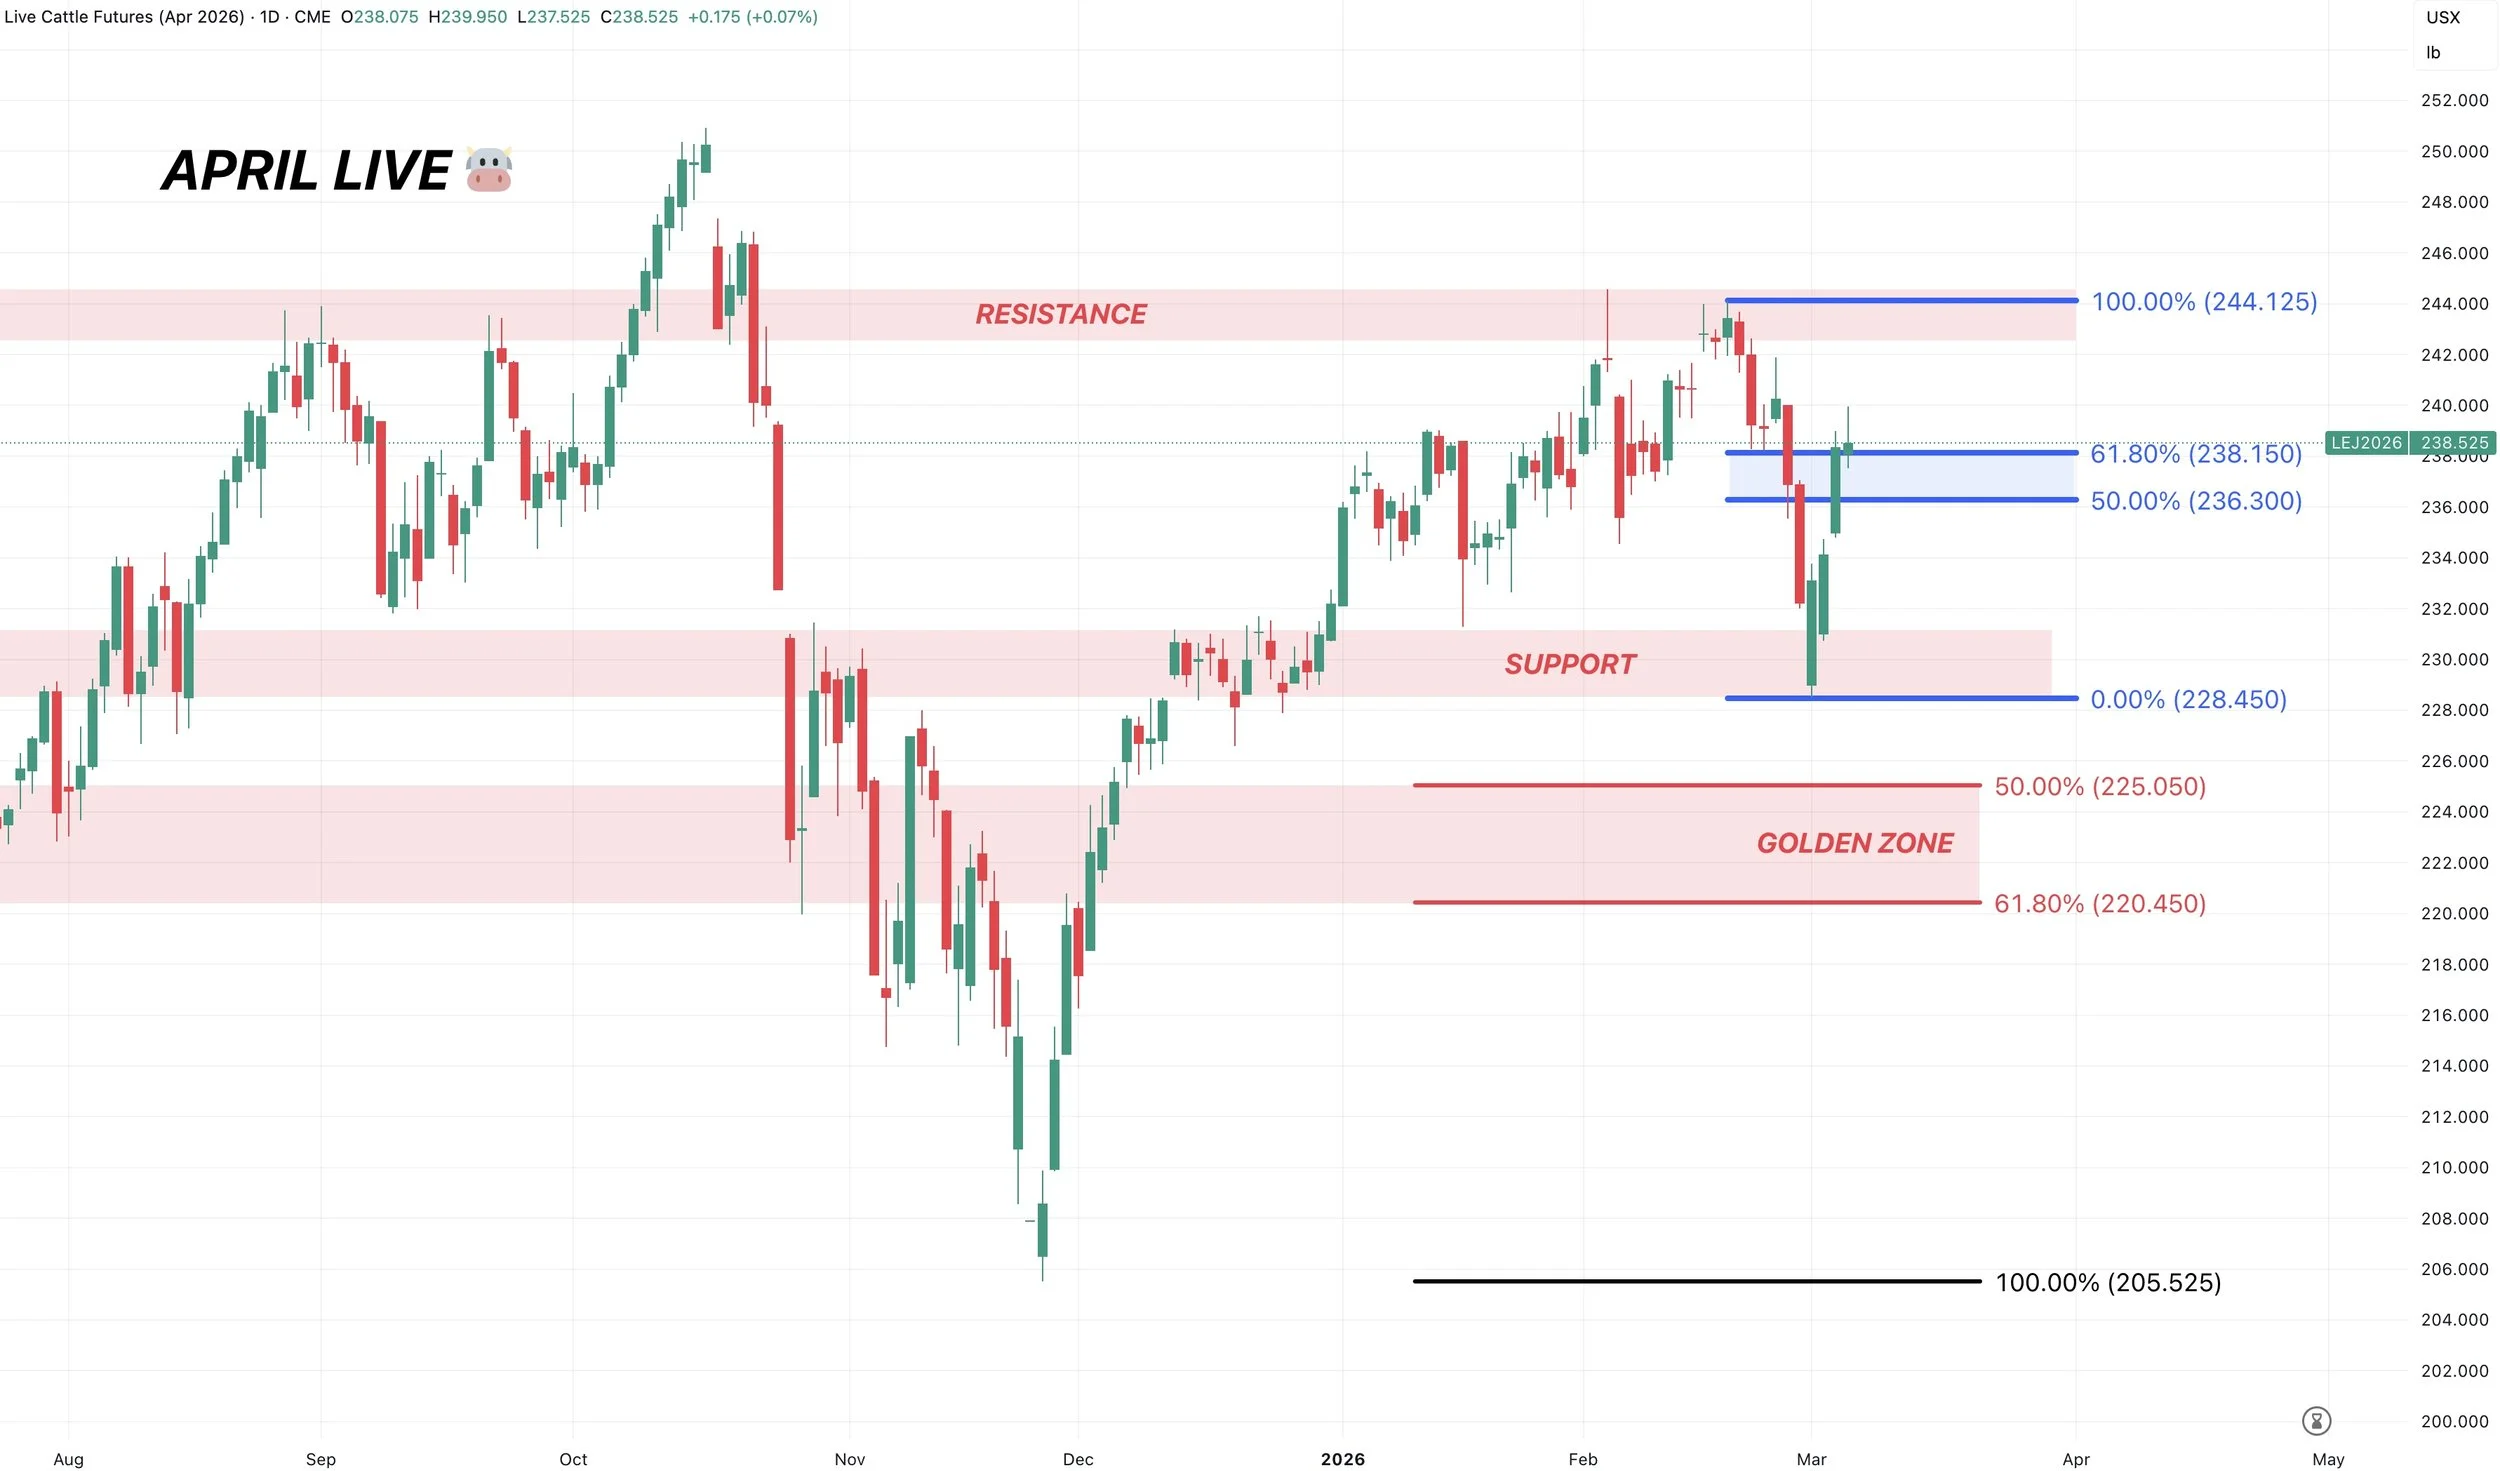
April Live
Exact same story in live cattle.
Clawed back 61.8% of the sell off.
This is an important level.
Want to Talk?
Our phones are open 24/7 for you guys if you ever need anything or want to discuss your operation.
Jeremey, Lauren & Office: (806)484-1214
Sebastian: (605)280-1186
Email: sfrost@dailymarketminute.com
Hedge Account
Interested in a hedge account? Use the link below to set up an account or give us a call.
Recent Signals
March 3rd, 2026: 🌽
Old crop & new crop corn sell signal & hedge alert.
Feb 26th, 2026: 🌱
Old crop & new crop beans sell signal & hedge alert.
Feb 19th, 2026: 🌾
KC wheat sell signal & hedge alert.
Feb 6th, 2026: 🌽 🌱
Old crop corn & soybean sell signal & hedge alert.
Feb 4th, 2026: 🌱
Soybean sell signal & hedge alert.
Nov 17th, 2025: 🌱
Soybean sell signal & hedge alert.