
MARKET UPDATE
*My video software had some issues today so I apologize for the later update
You can scroll to read the usual update as well. As the written version is the exact same as the video.
Timestamps for video:
Overview: 0:00min
Corn: 7:15min
Corn Charts: 9:40min
Beans: 12:15min
Bean Charts: 14:45min
Wheat Charts: 15:50min
Cattle Charts: 17:25min
Want to talk?
Office: (806)484-1214
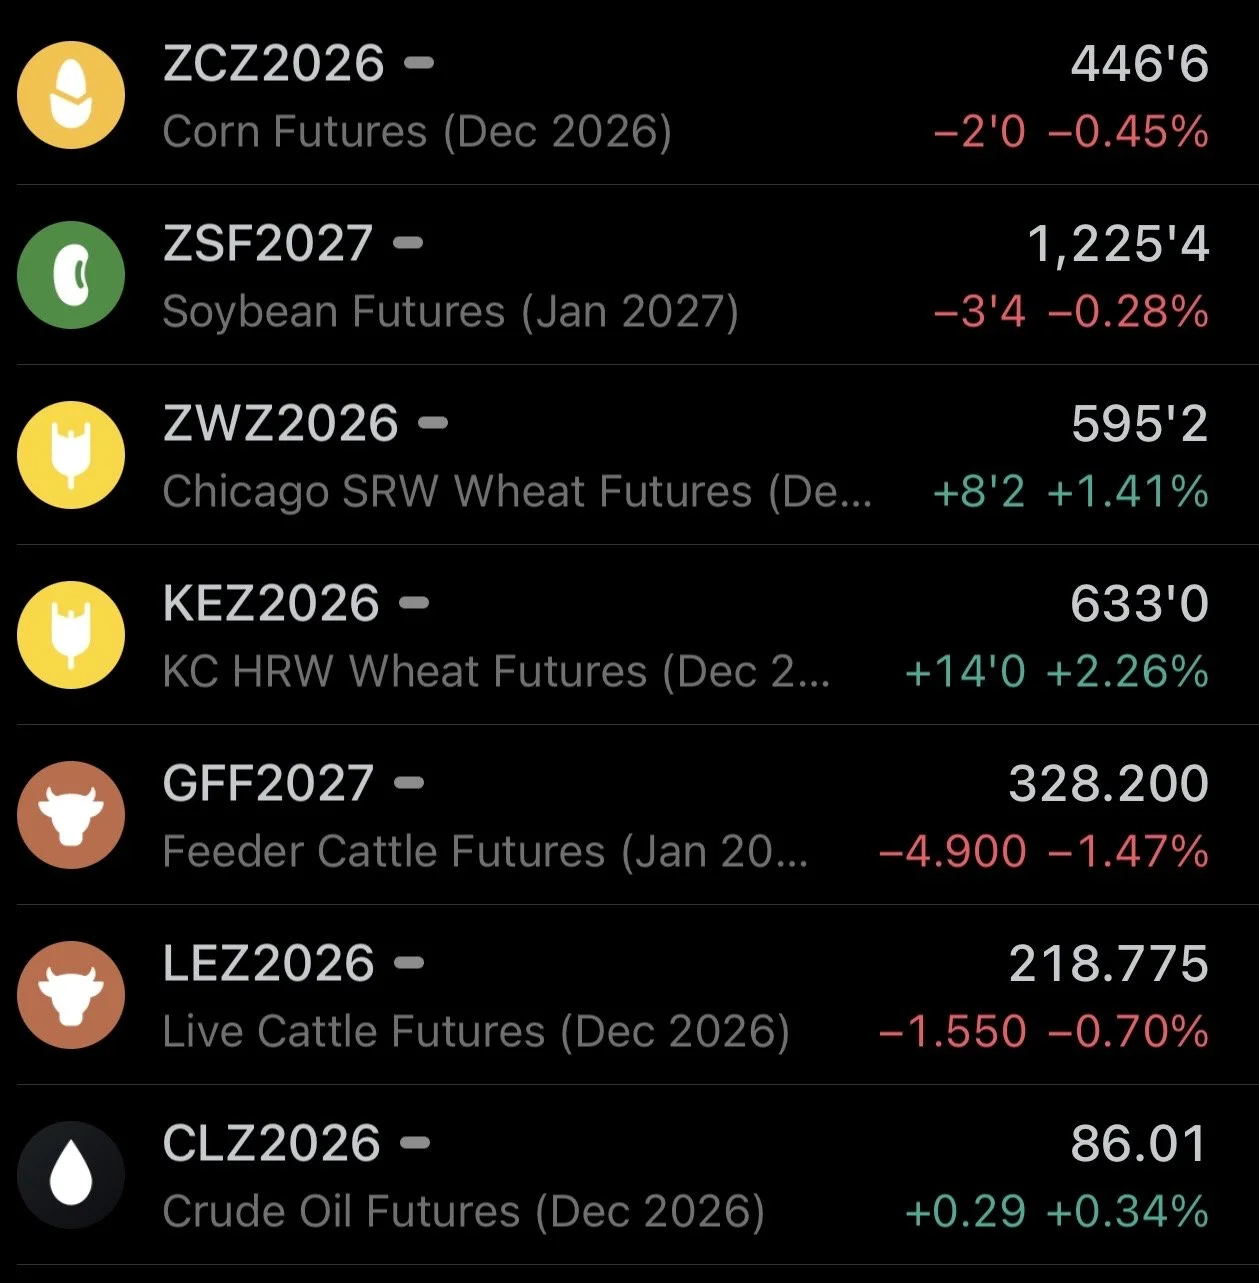
Futures Prices Close
Overview
The markets were mixed today with wheat finally leading the way higher. As there were some war headlines over in the Black Sea.
Meanwhile, corn and soybeans traded slightly lower after failing to hold on to the early gains. As both were trading higher at one point.
So not the best closes in corn or soybeans.
Cattle took a sizeable hit today. Closing lower for the 2nd day in a row following the nice bounce last week.
Overall there isn’t a ton of fresh headlines hitting the market.
We do have options expiration for Dec options at the end of the week.
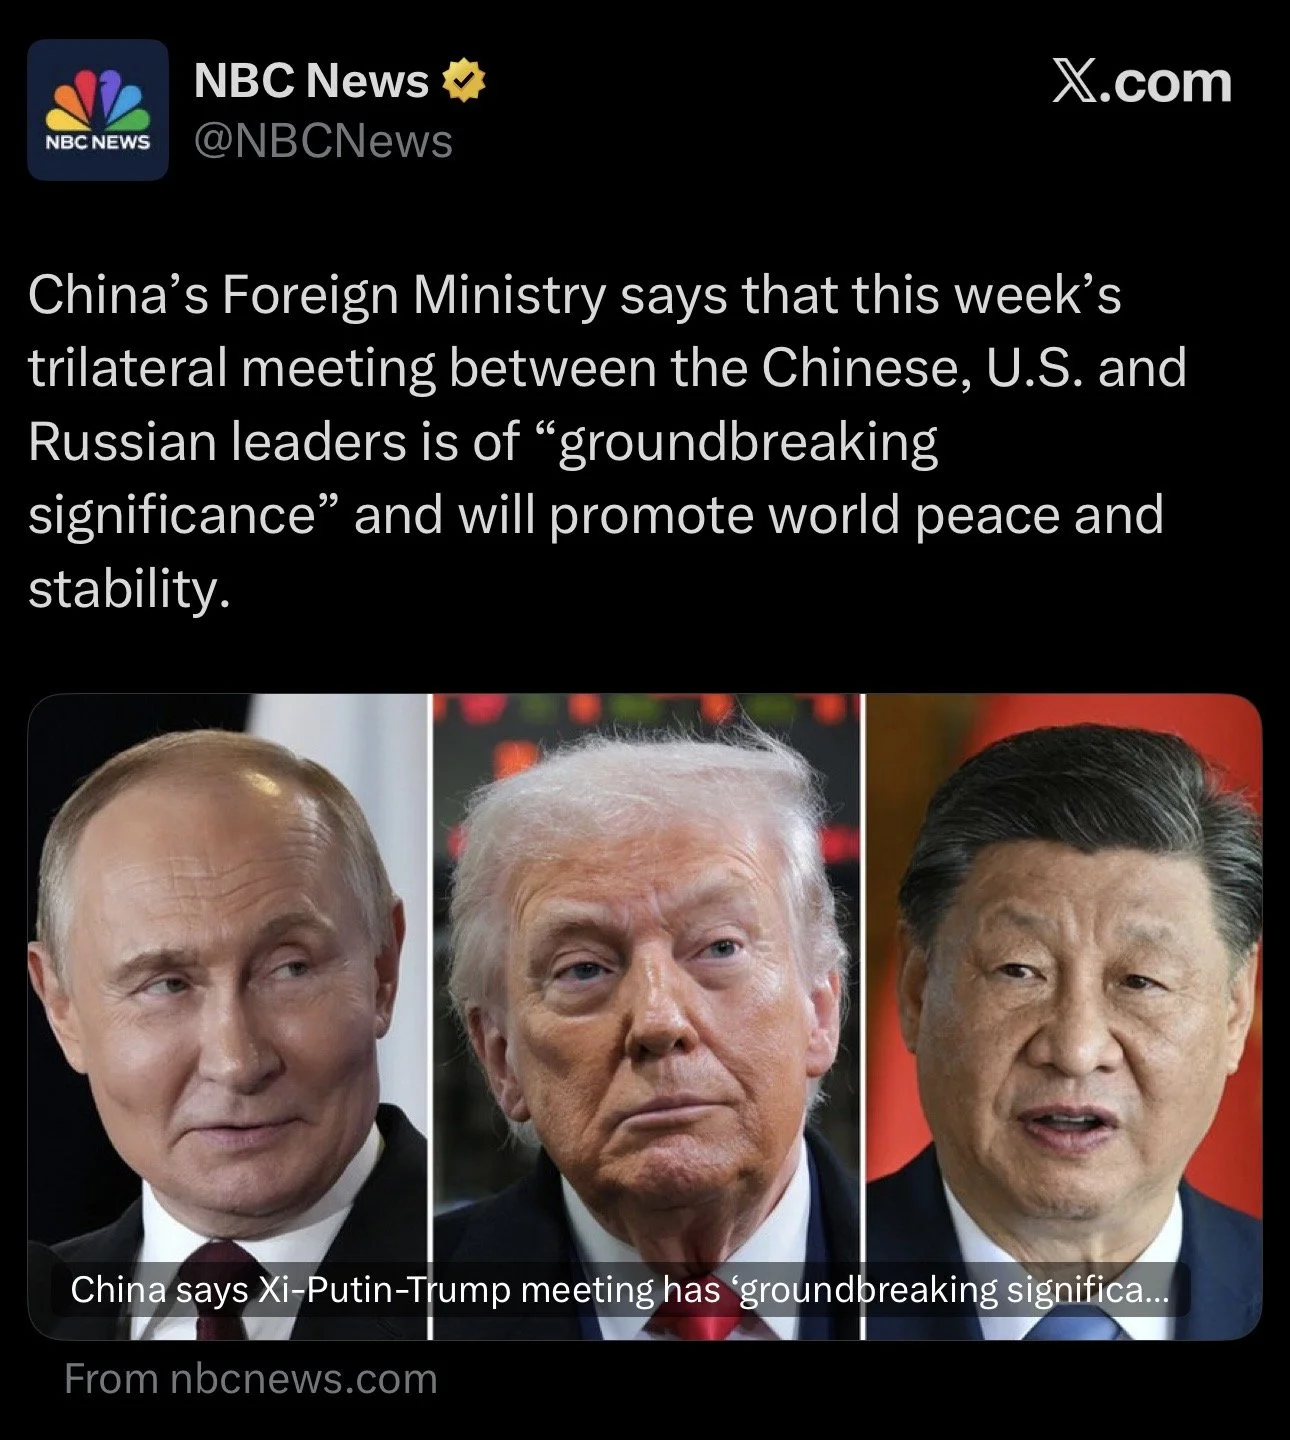
The only big headline coming up is the meeting between Trump and China that is scheduled for Thursday.
This is actually a trilateral meeting, so we have Trump, Putin, and China's president Xi all attending the meeting for three way talks.
Who knows if we'll get any extra details on China's ag purchases or not. As it does seem like they have some bigger issues they'll be discussing such as the wars.
But there will definitely be some tariff talk which could impact things.
China purchases of non-soybean ag products are on track for seven year lows despite the agreement to buy more, as they lag behind that goal. China has stated that they want to see tariffs reduced for them to meet the non-soybean purchase goals.
So we will have to see what comes from the meeting.
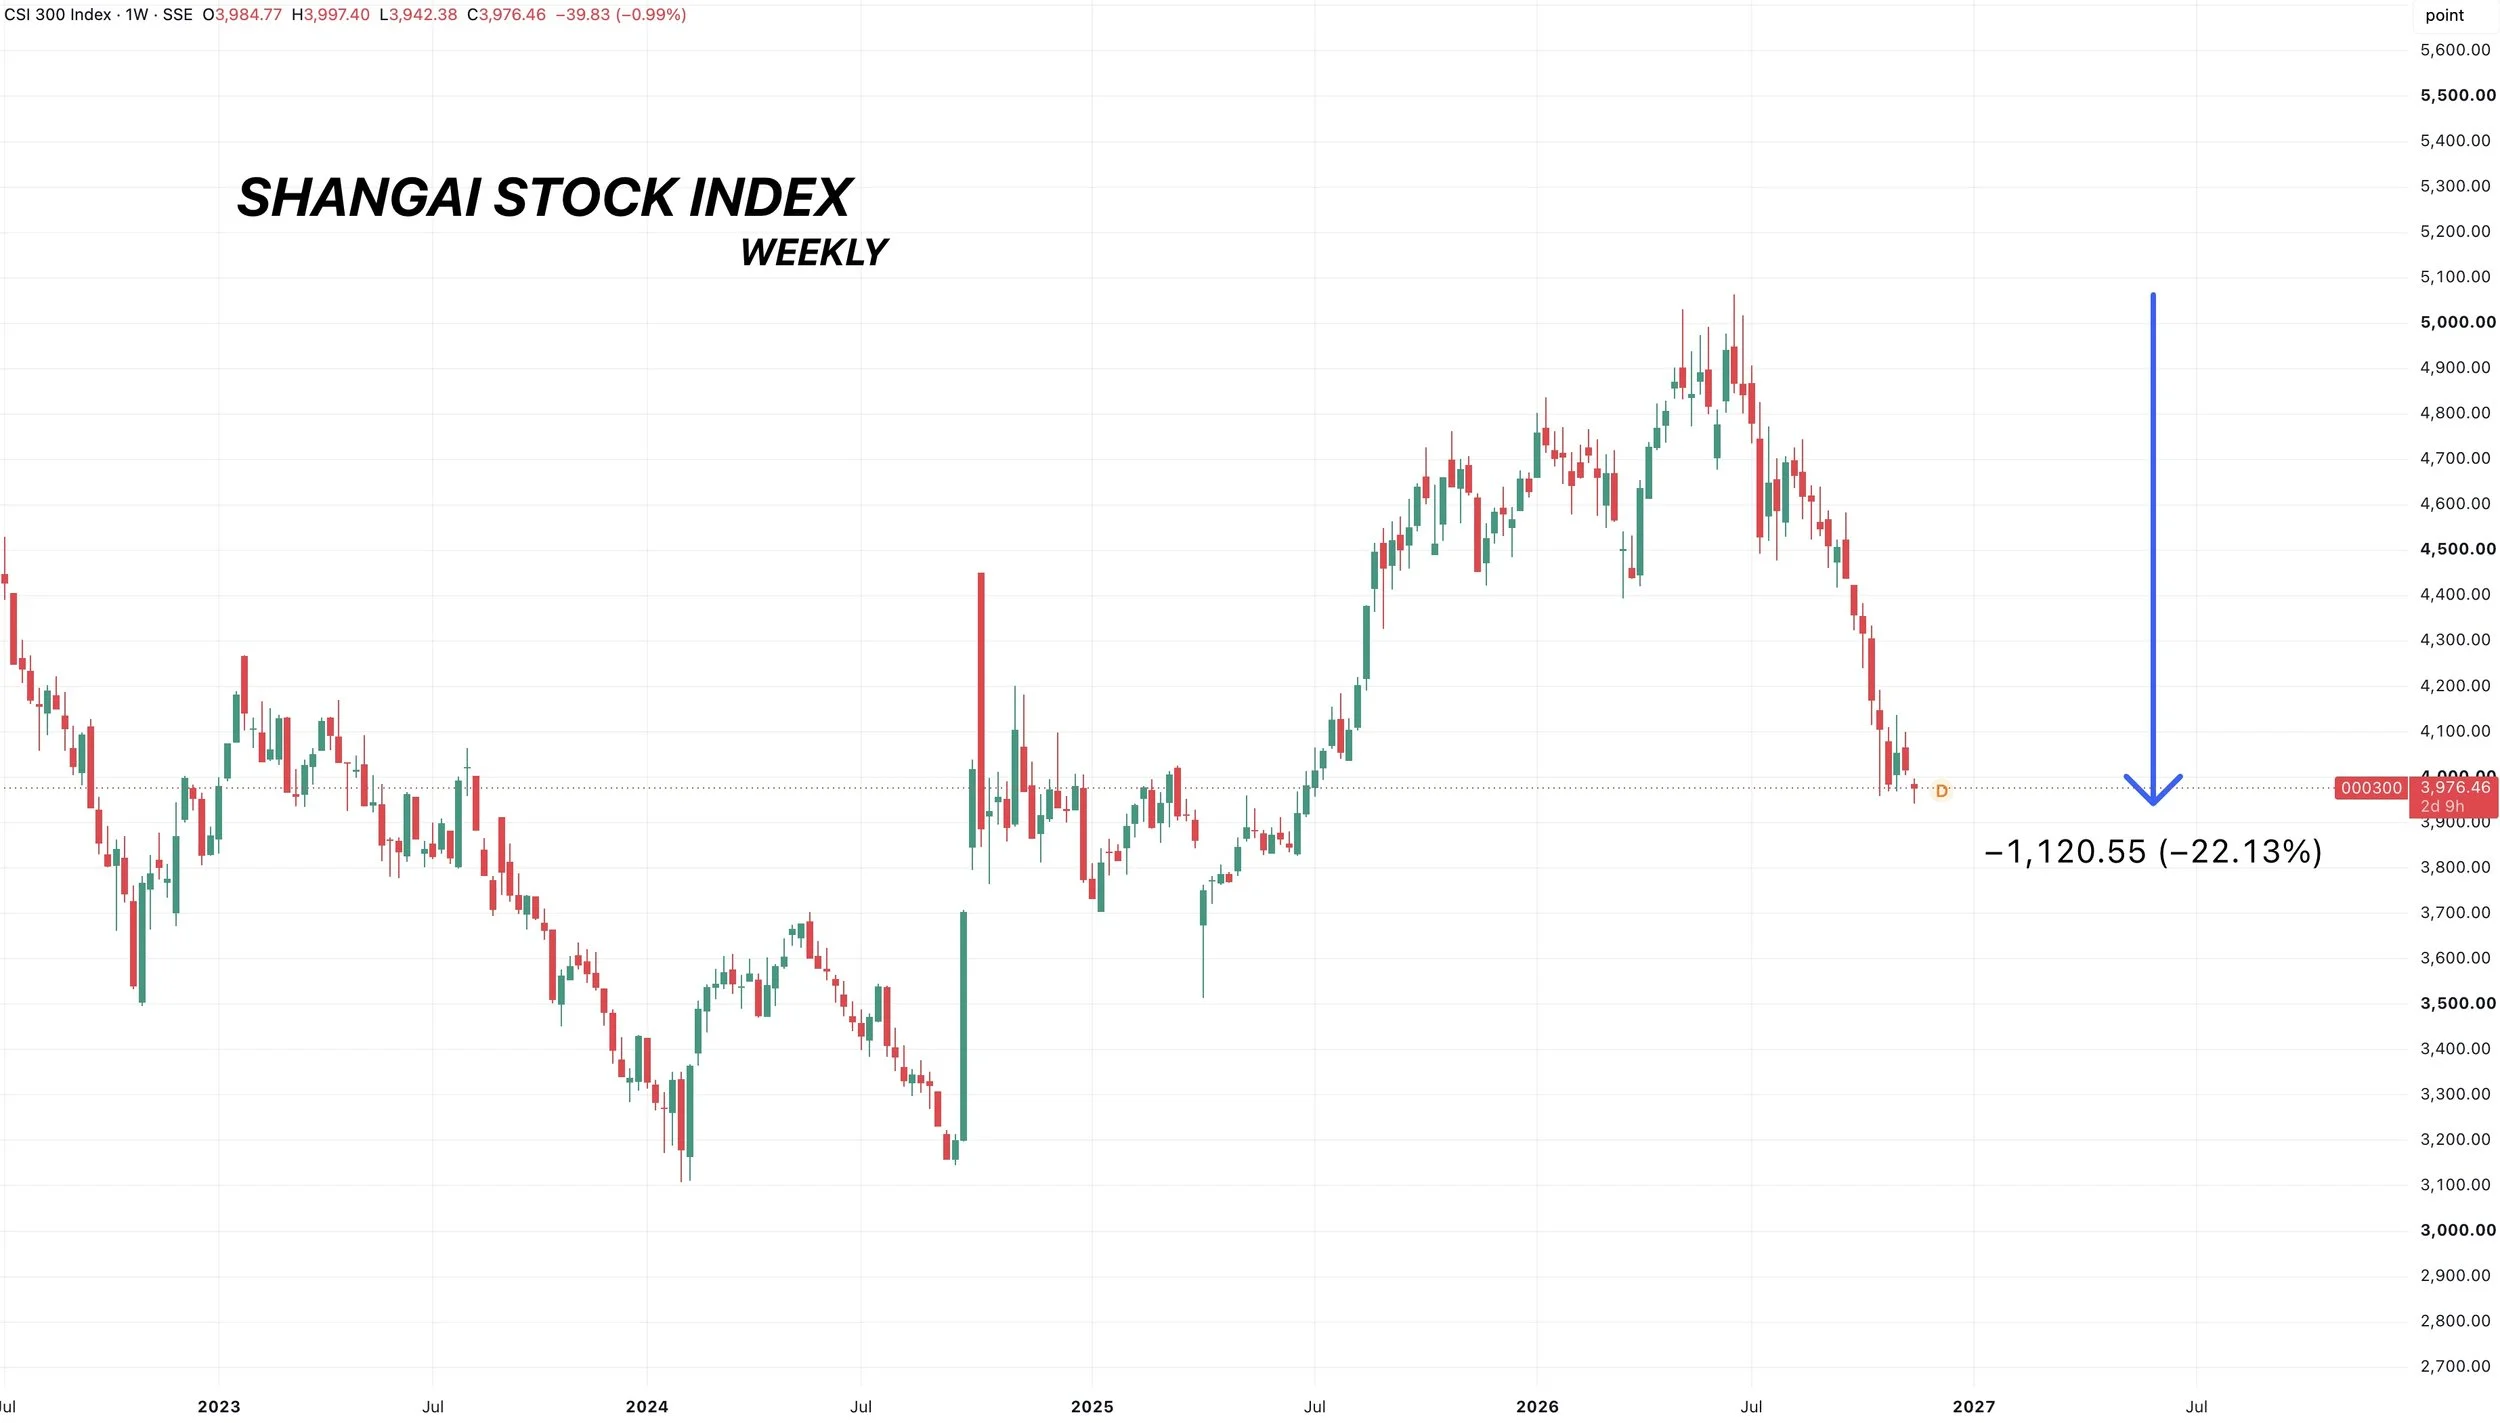
You do have China's stock market in a free fall.
It has traded lower in the last 14 of 15 weeks. Having one of it's worst losing streaks ever.
It's tanked over -20% off the summer highs.
So you would like to imagine that China wants to keep the US happy and do whatever they can to help protect their economy.
As for some other news.
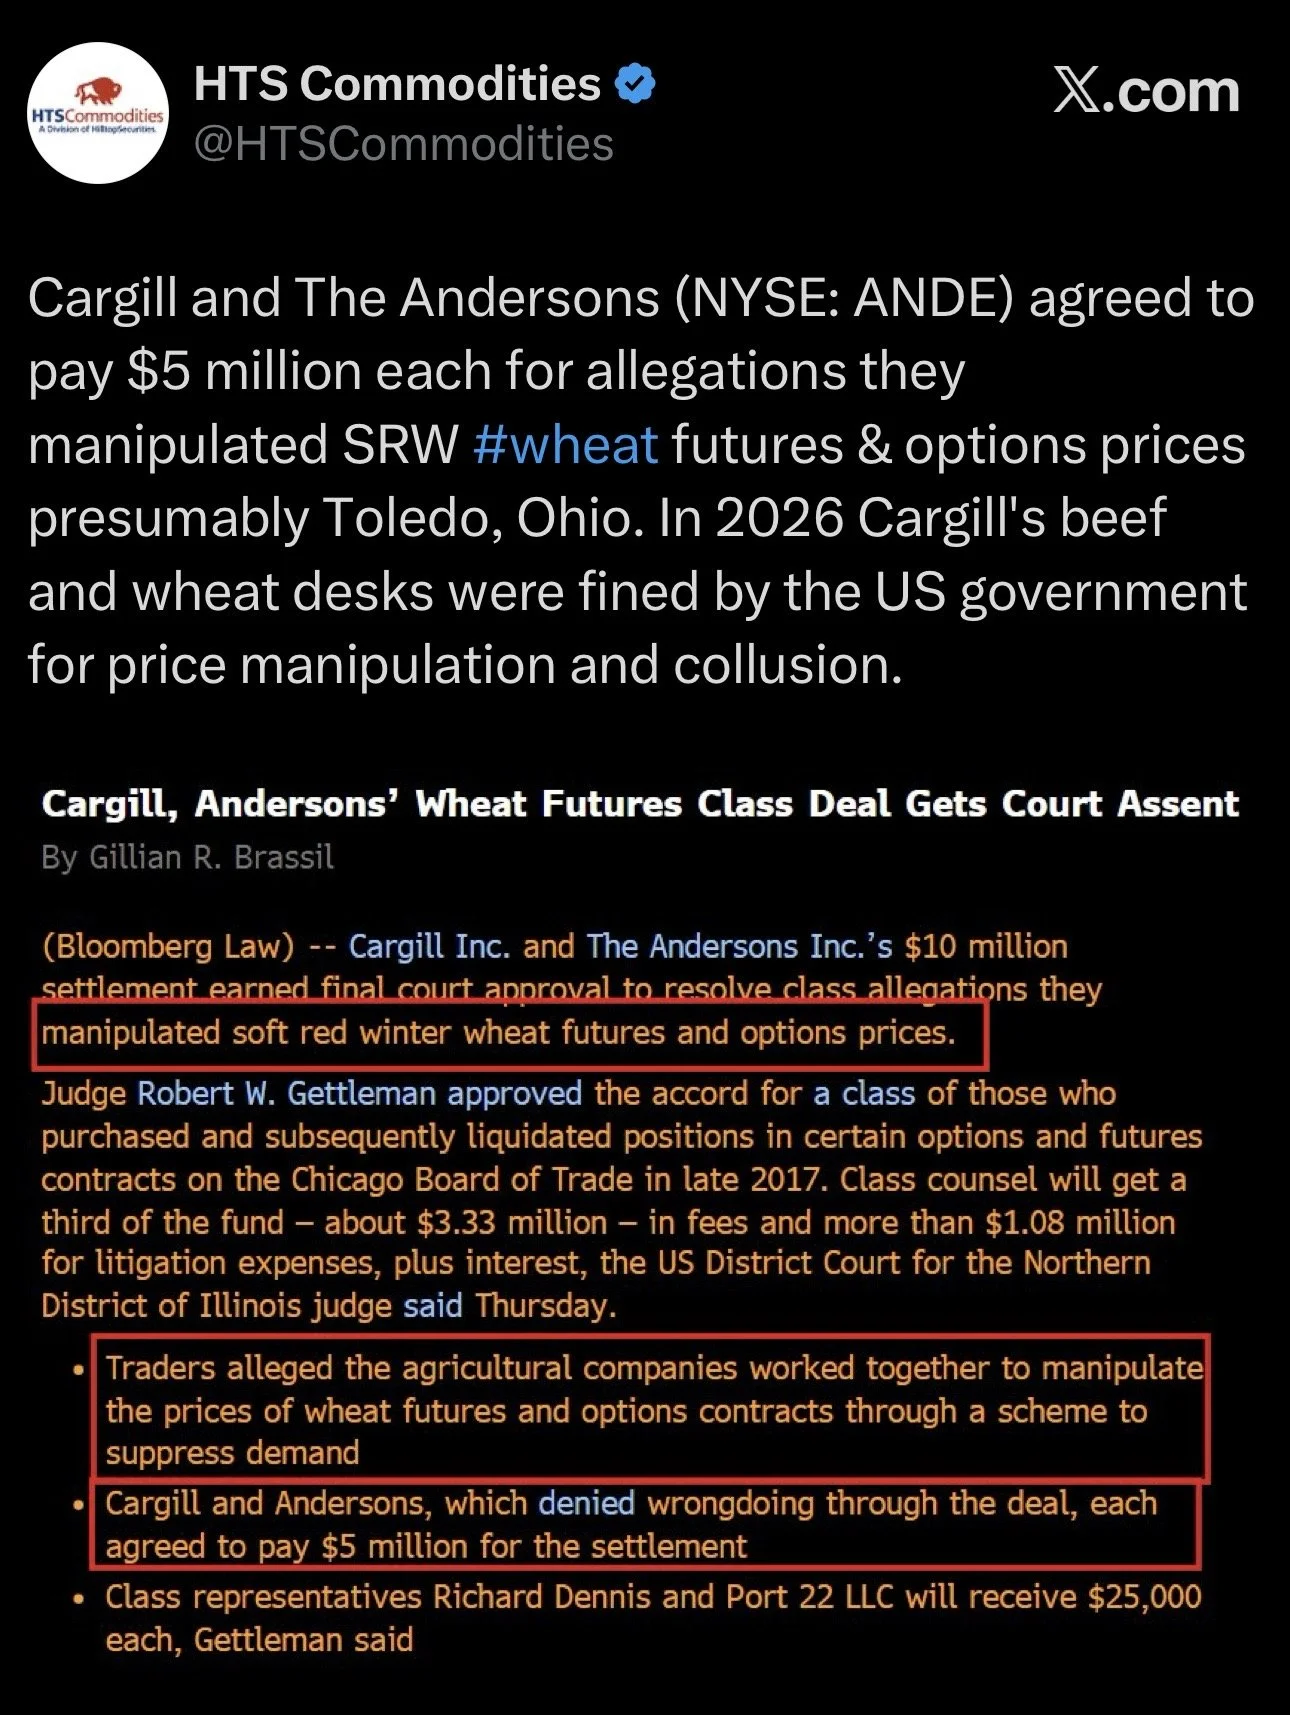
Cargill and the Andersons agreed to pay $5 million each for allegations that they manipulated the SRW futures and options prices.
So that was interesting..
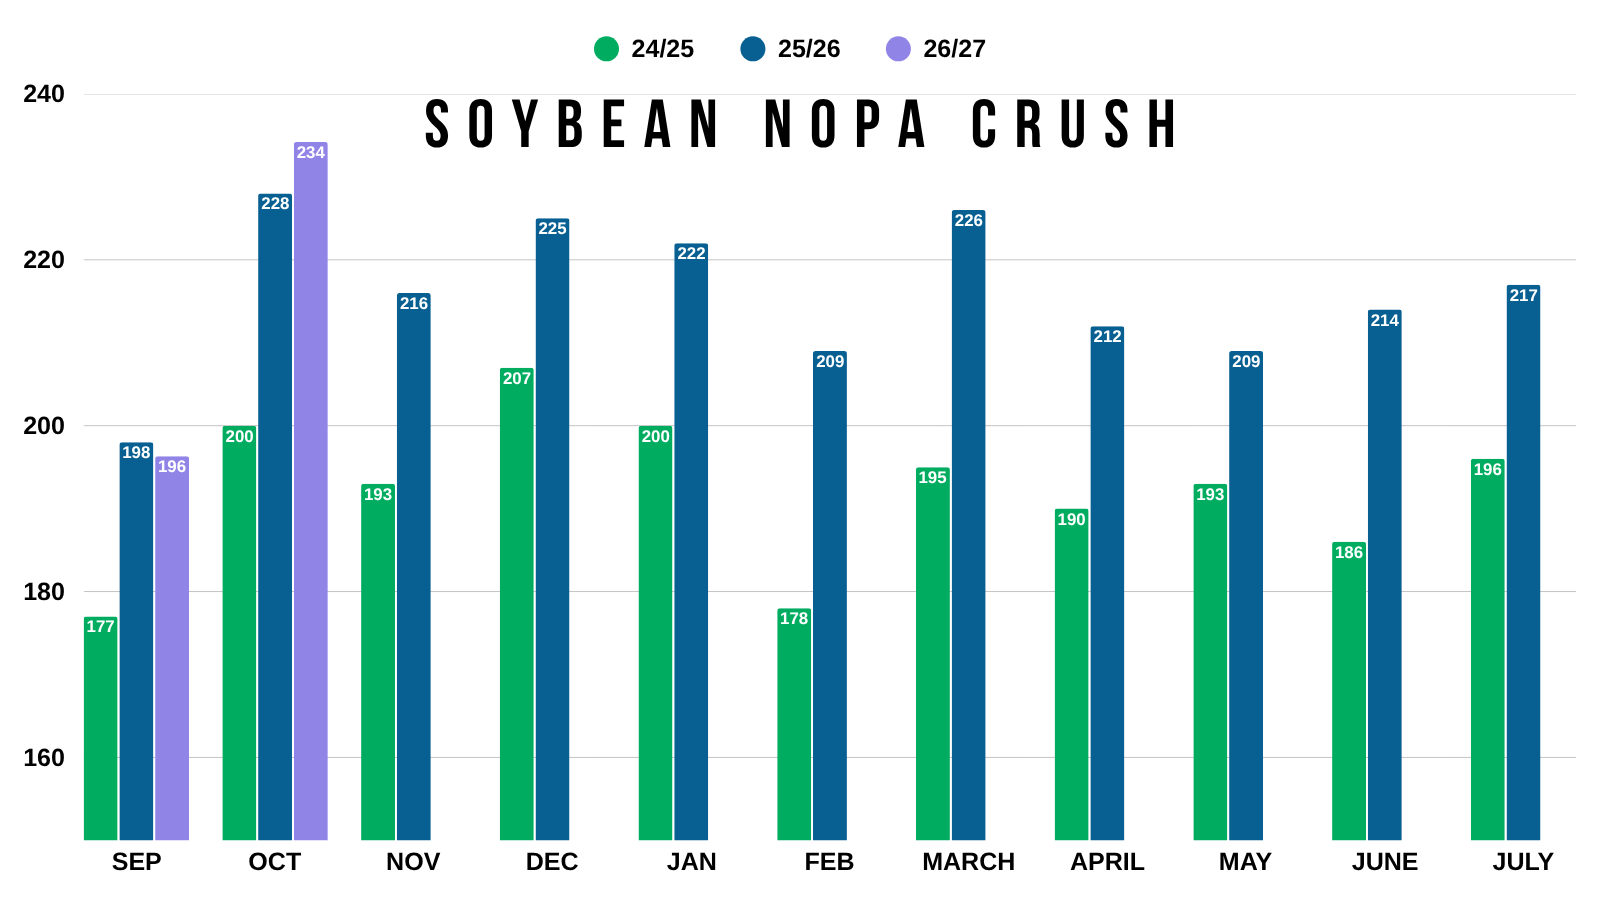
NOPA Crush Record
Massive report for soybean crush yesterday for October. As it came in at an all-time high and shattered expectations.
This was almost +20% higher than last month.
We had a pretty slow start with the harvest delays, as the previous month's crush was actually below last year's number, so this was great to see.
Crush isn’t going anywhere and I would expect us to continue to see record type of numbers.
Export Inspections
Wheat:
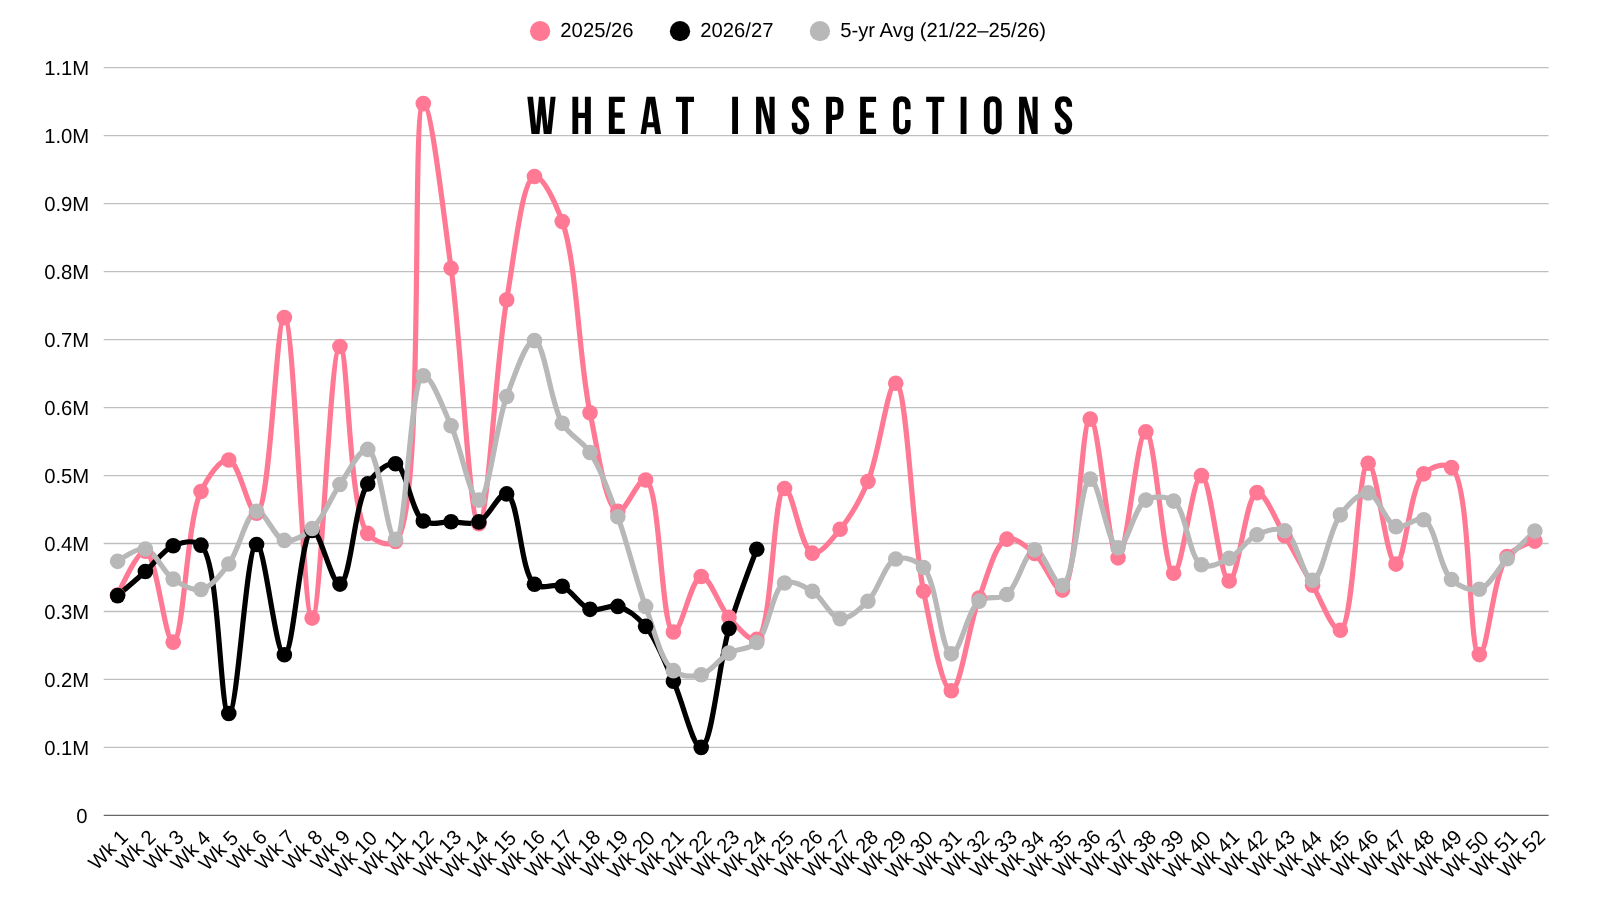
Great export inspections for wheat finally, which was a nice surprise.
As all wheat inspections came in at 9-week highs.
Despite the nice bump, we do still trail last year by -34%, as wheat demand continues to be very poor.
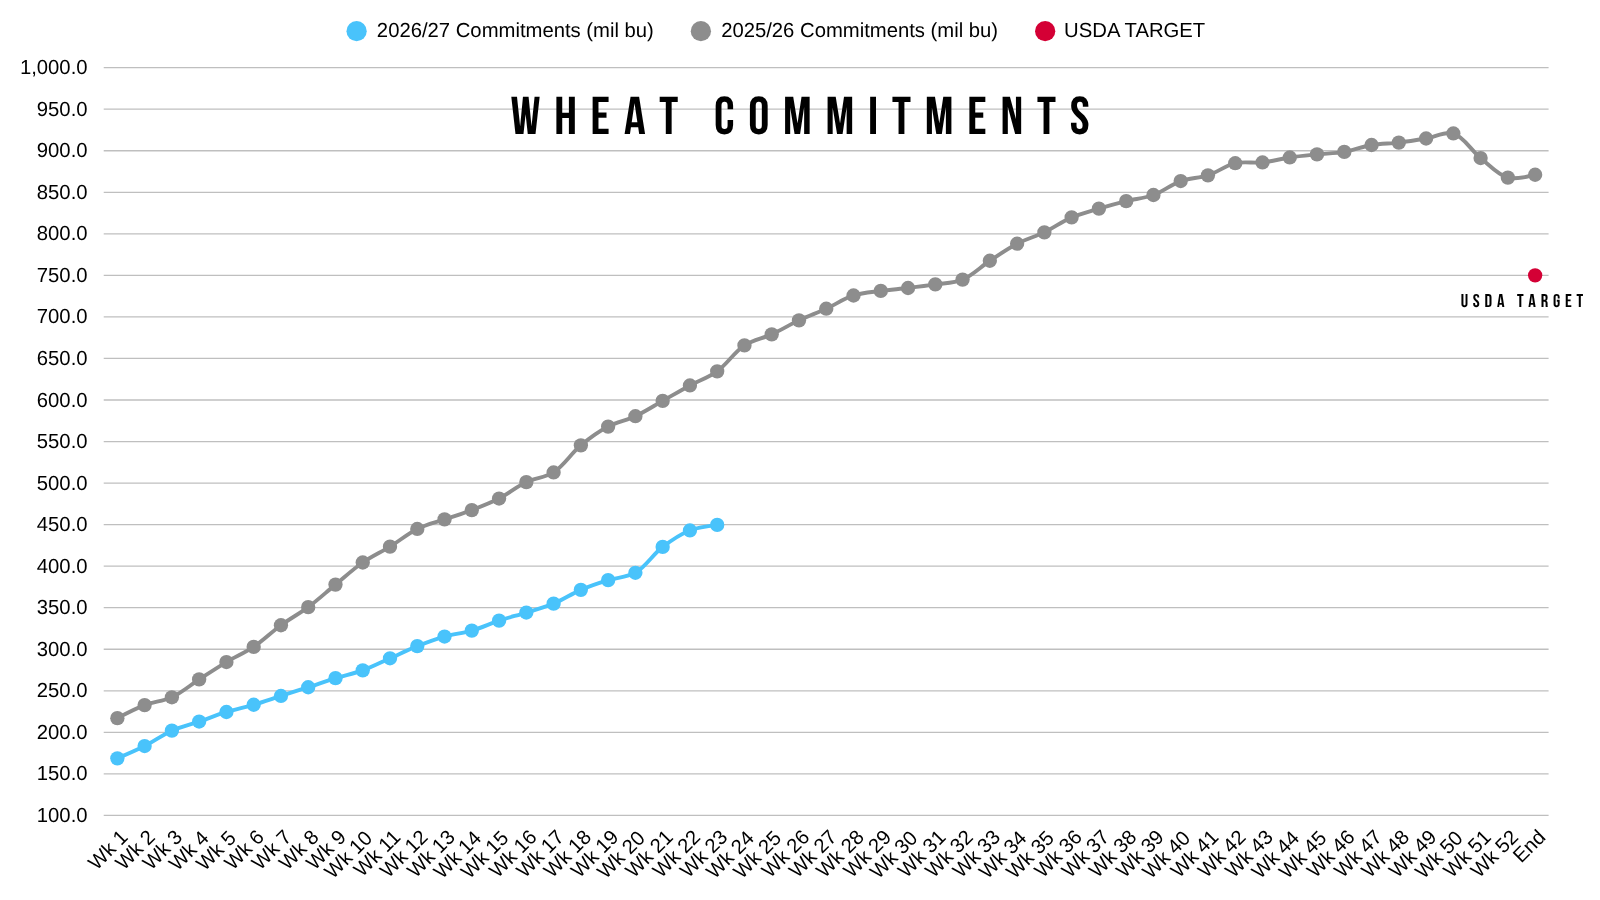
Meanwhile the USDA projects exports to be down -17% vs last year.
Corn:
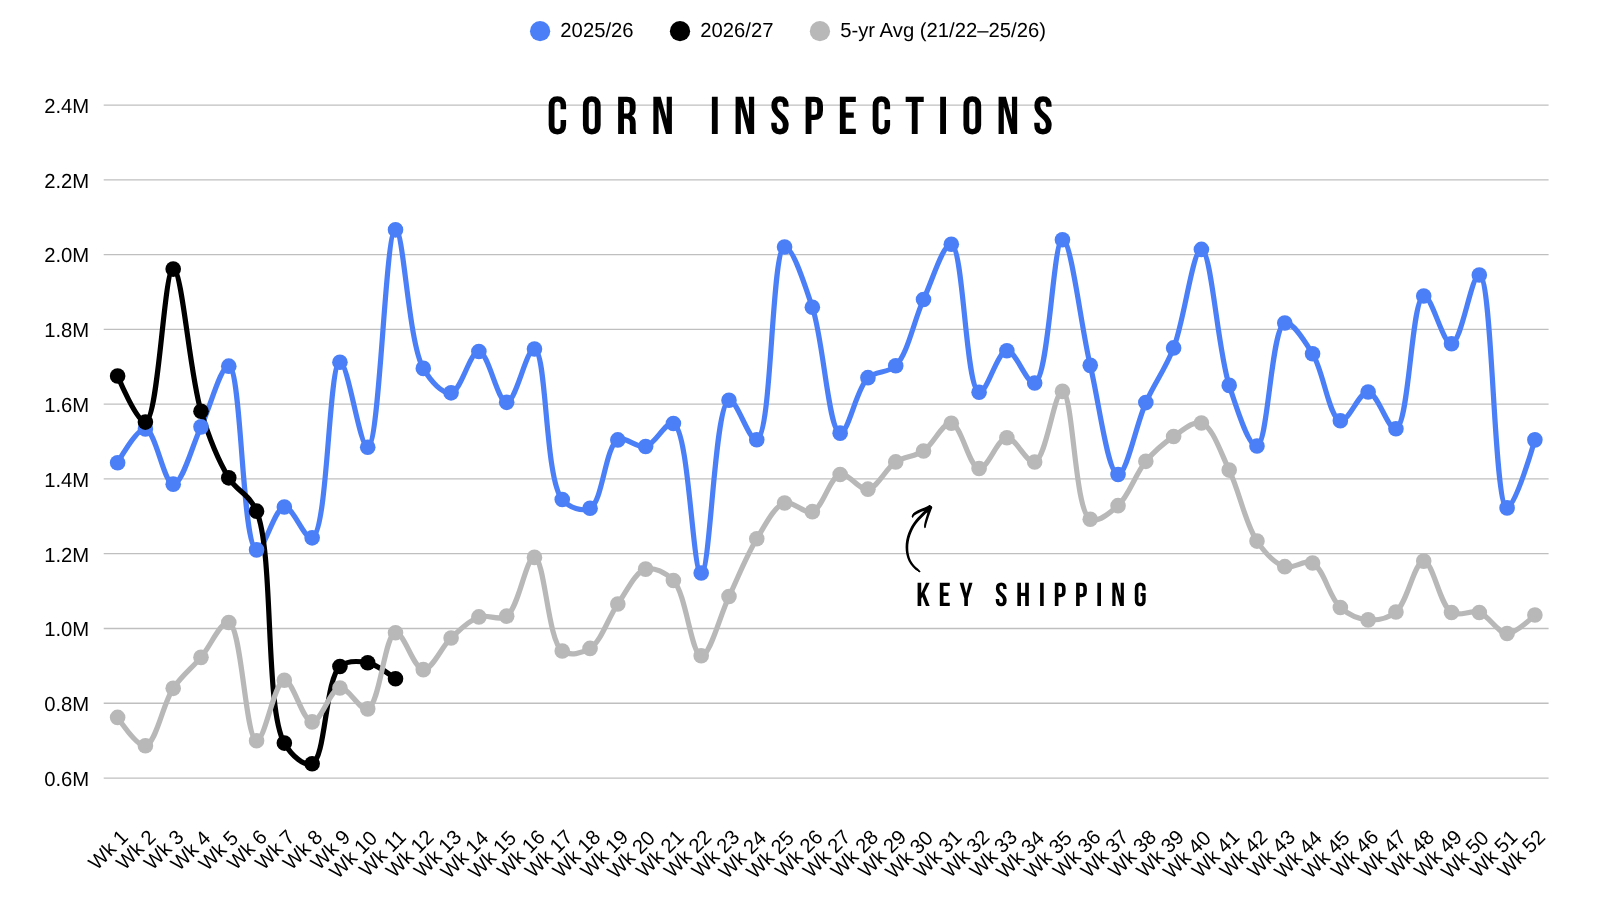
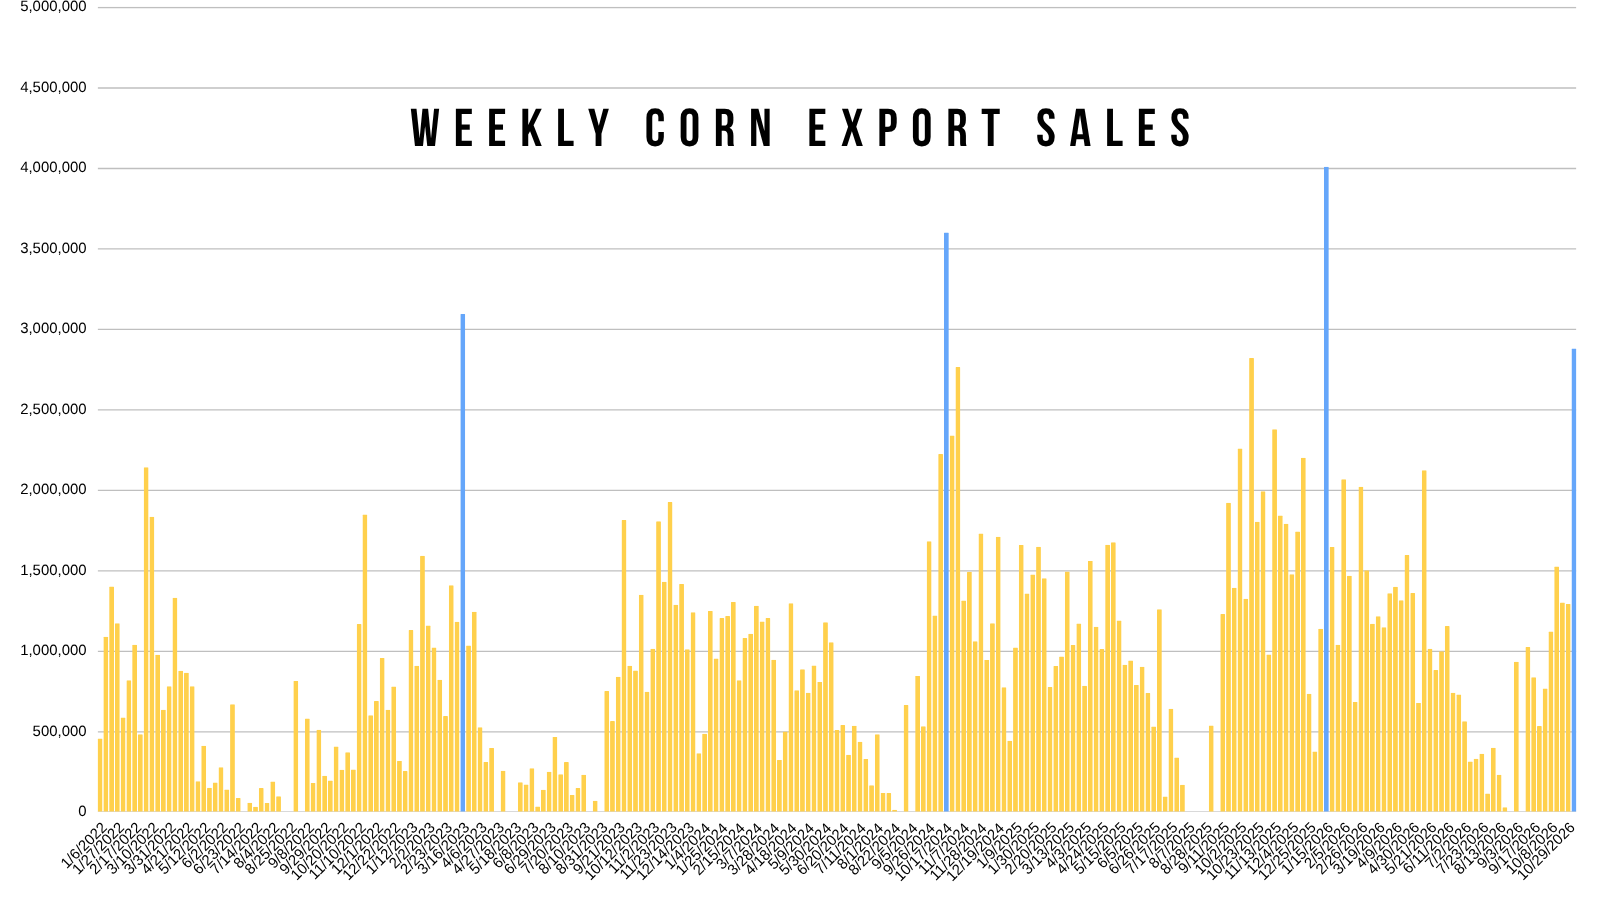
Corn inspections still trail last year by -21%.
Currently, the USDA only has exports dropping by -4% vs last year.
Some argue this is a concern. Which it could be down the road, but it's still early.
For now, we have plenty of time to improve. And as we've stated countless times, it is not surprising the see us start slower than last year.
Last year we started on a record pace because soybeans were awful at the start. Last year was a record and front loaded. Now soybeans have a good start this year. You can’t ship record amounts of both at the same time, so naturally we should see less corn business until we get into the key corn demand window and once soybean season slows down.
But we will need to see demand improve. It's just too early to say it's a major concern yet.
Weekly export sales were massive last week as we mentioned, which was a good step in the right direction.
They were the 5th largest in the last 5 years.
We've also been seeing a lot of flash sales, such as that record sale to Mexico a few weeks ago. Which was the largest flash sale since 2022.
So I would say it feels like we are finding demand down here as prices have reached a point where we should. We certainly aren’t losing demand at these price levels.
Soybeans:
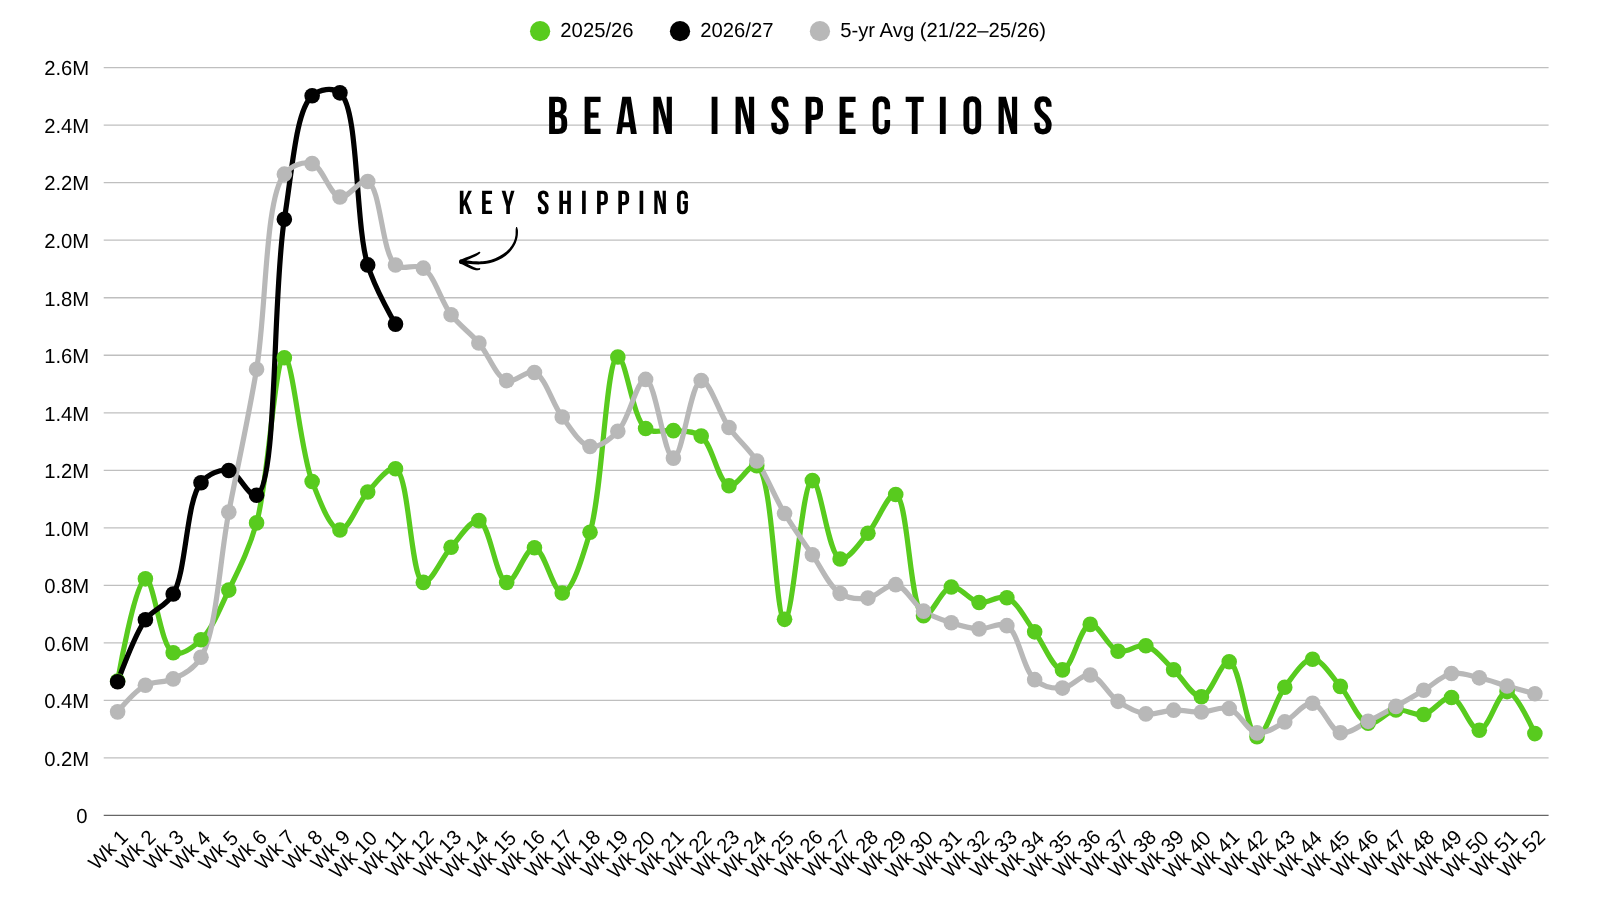
Soybean inspections are up +57% vs last year.
Export sales are up nearly +80% vs last year.
Yet the USDA only has exports up +14% vs last year. So it does feel like there is some room for the USDA to bump soybean exports further.
Since everyone seems to agree yield might be higher for soybeans, I would assume any small yeild adjustment higher is going to be met with more demand to offset it.
But again, look at how soybeans had a much better start to inspections this year vs last year like they seasonally do. Then go look at the corn inspections chart again. As they both give a good visual on the key shipping windows and why corn isn’t a huge concern yet.
We're in beans key shipping window where as corn is not.
The Funds
Corn:
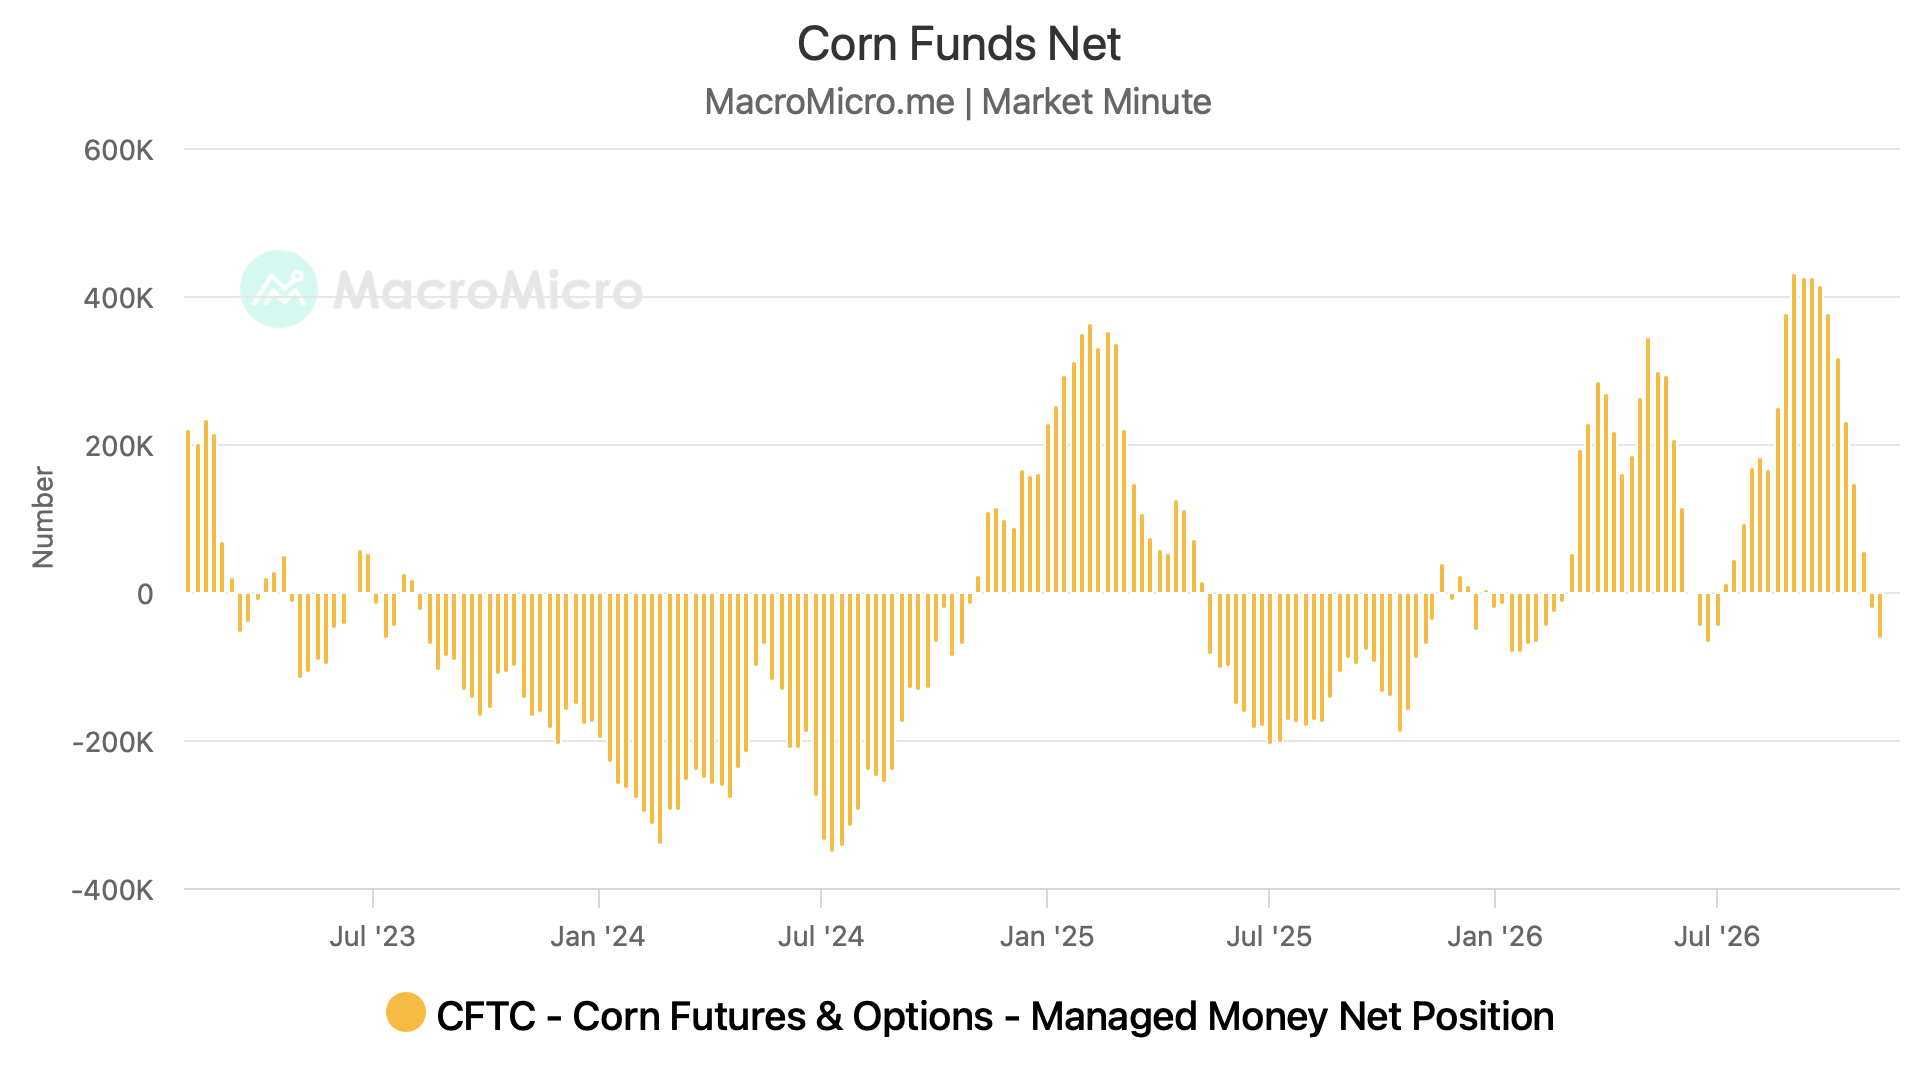
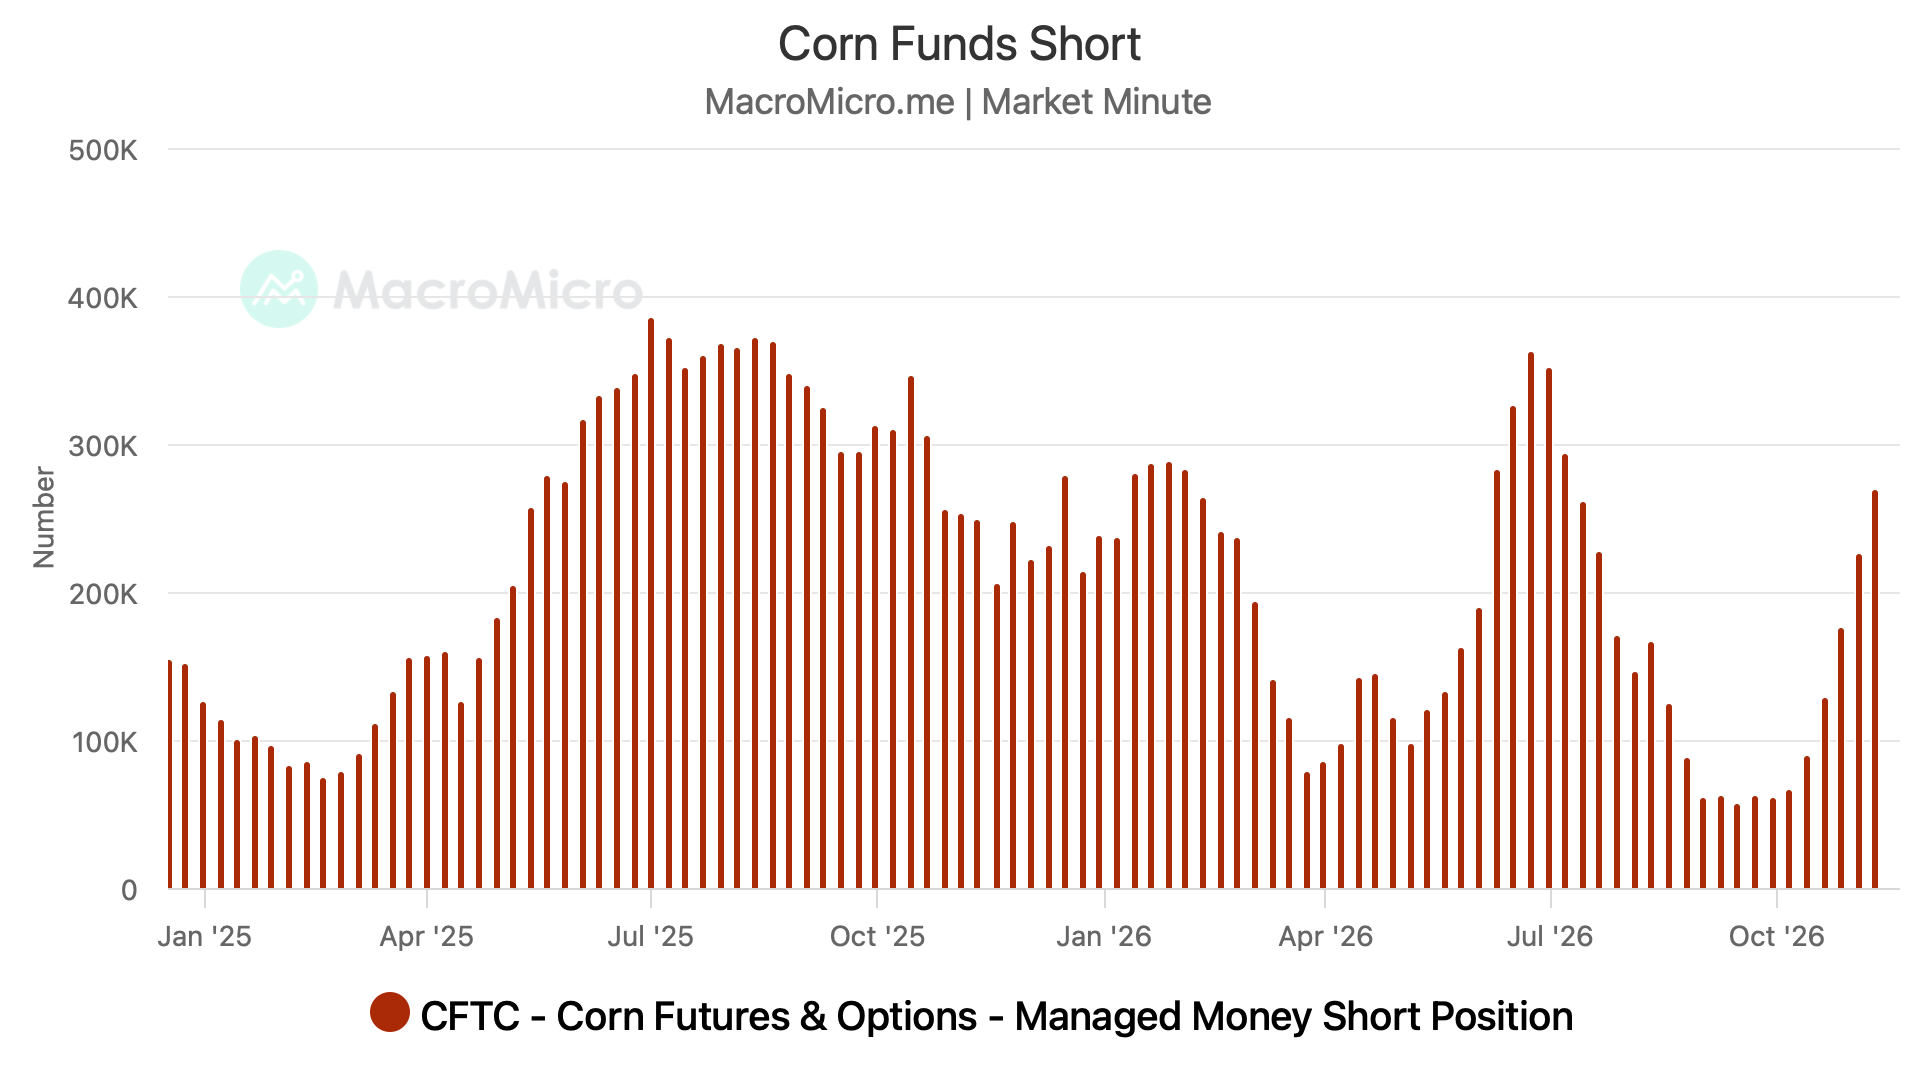
We got an update on the funds yesterday. As the data was delayed with the holiday last week.
The funds just got short corn a week or two ago. And they are now short around -60k contracts of corn.
Considering corn is so far off it's highs, and how hard we sold off. Yet the funds are not that short, I view as somewhat of a friendly sign from here.
I mean, what more reason would they have to get mega short from here? We already sold off. And they aren’t that short.
I'll get into some reasons as to why I think corn is undervalued down here in the corn section.
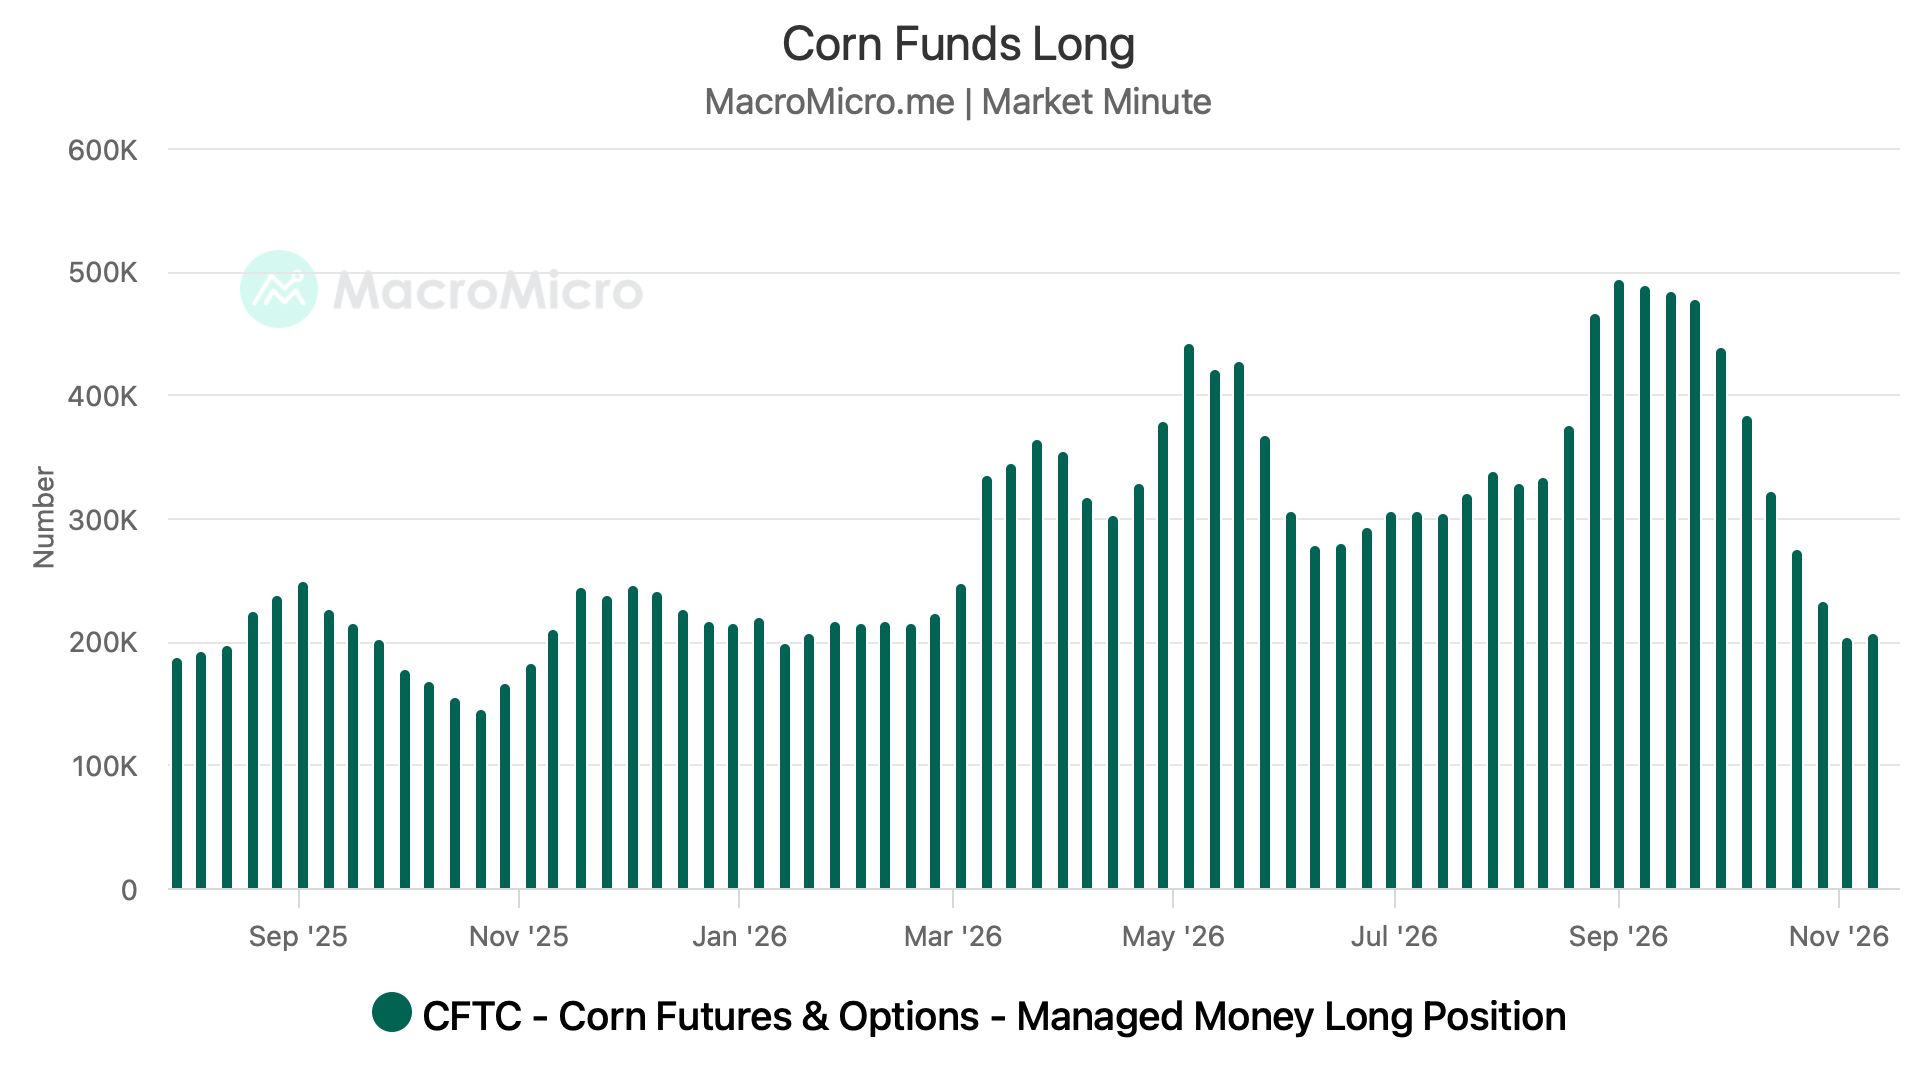
The funds long position in corn actually did increase for the first time on this entire sell off. Although it was small.
But this is potentially a friendly sign. As this is the first time corn has seen any buying interest at all. As this was the first time longs didn’t decrease.
However, the new short positions offset the new long positions. So their net position still got shorter.
Soybeans:
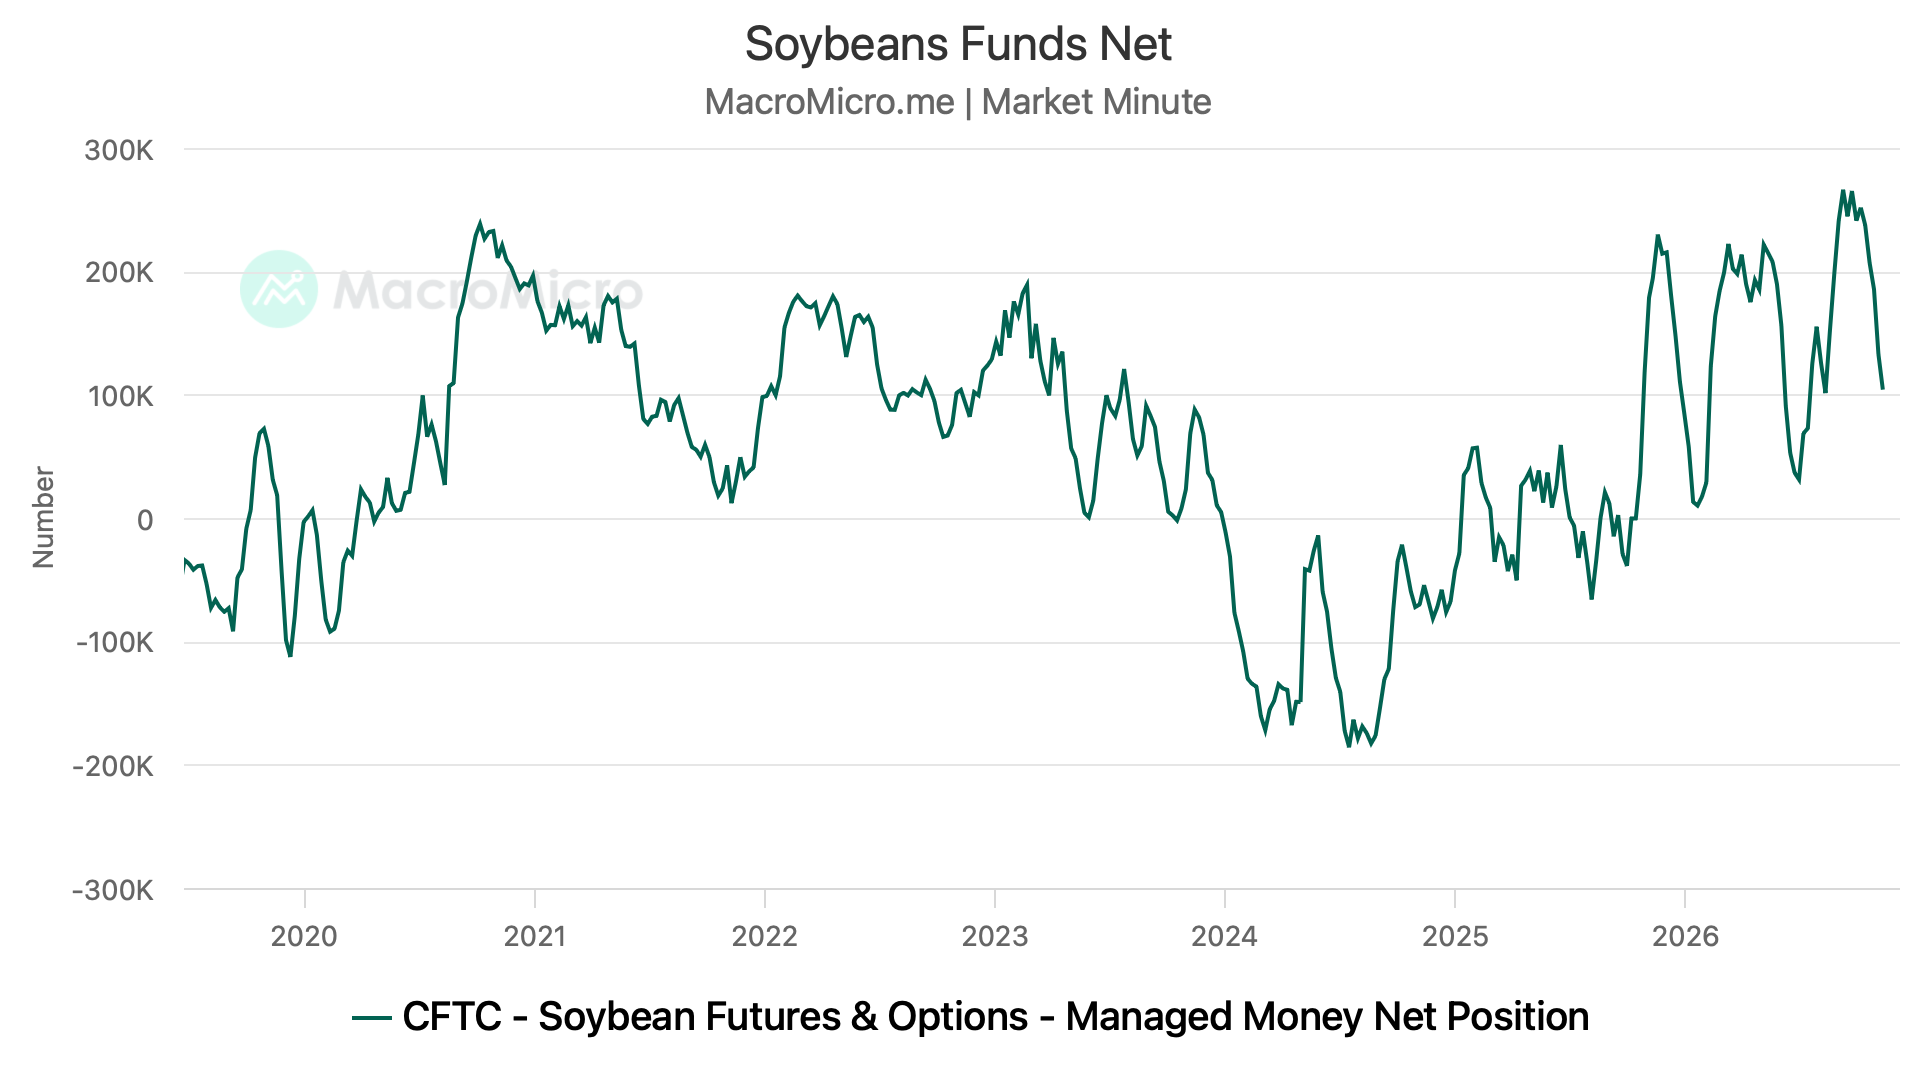
The funds are still long a decent amount of soybeans despite the break in prices the last month or two.
I still don’t think the funds have much of a reason to sell out of soybeans until they get more insight as to how the Brazil weather season shakes out.
As I would have to imagine they at least want to see what happens down there.
More on this later in todays update.
Cattle:
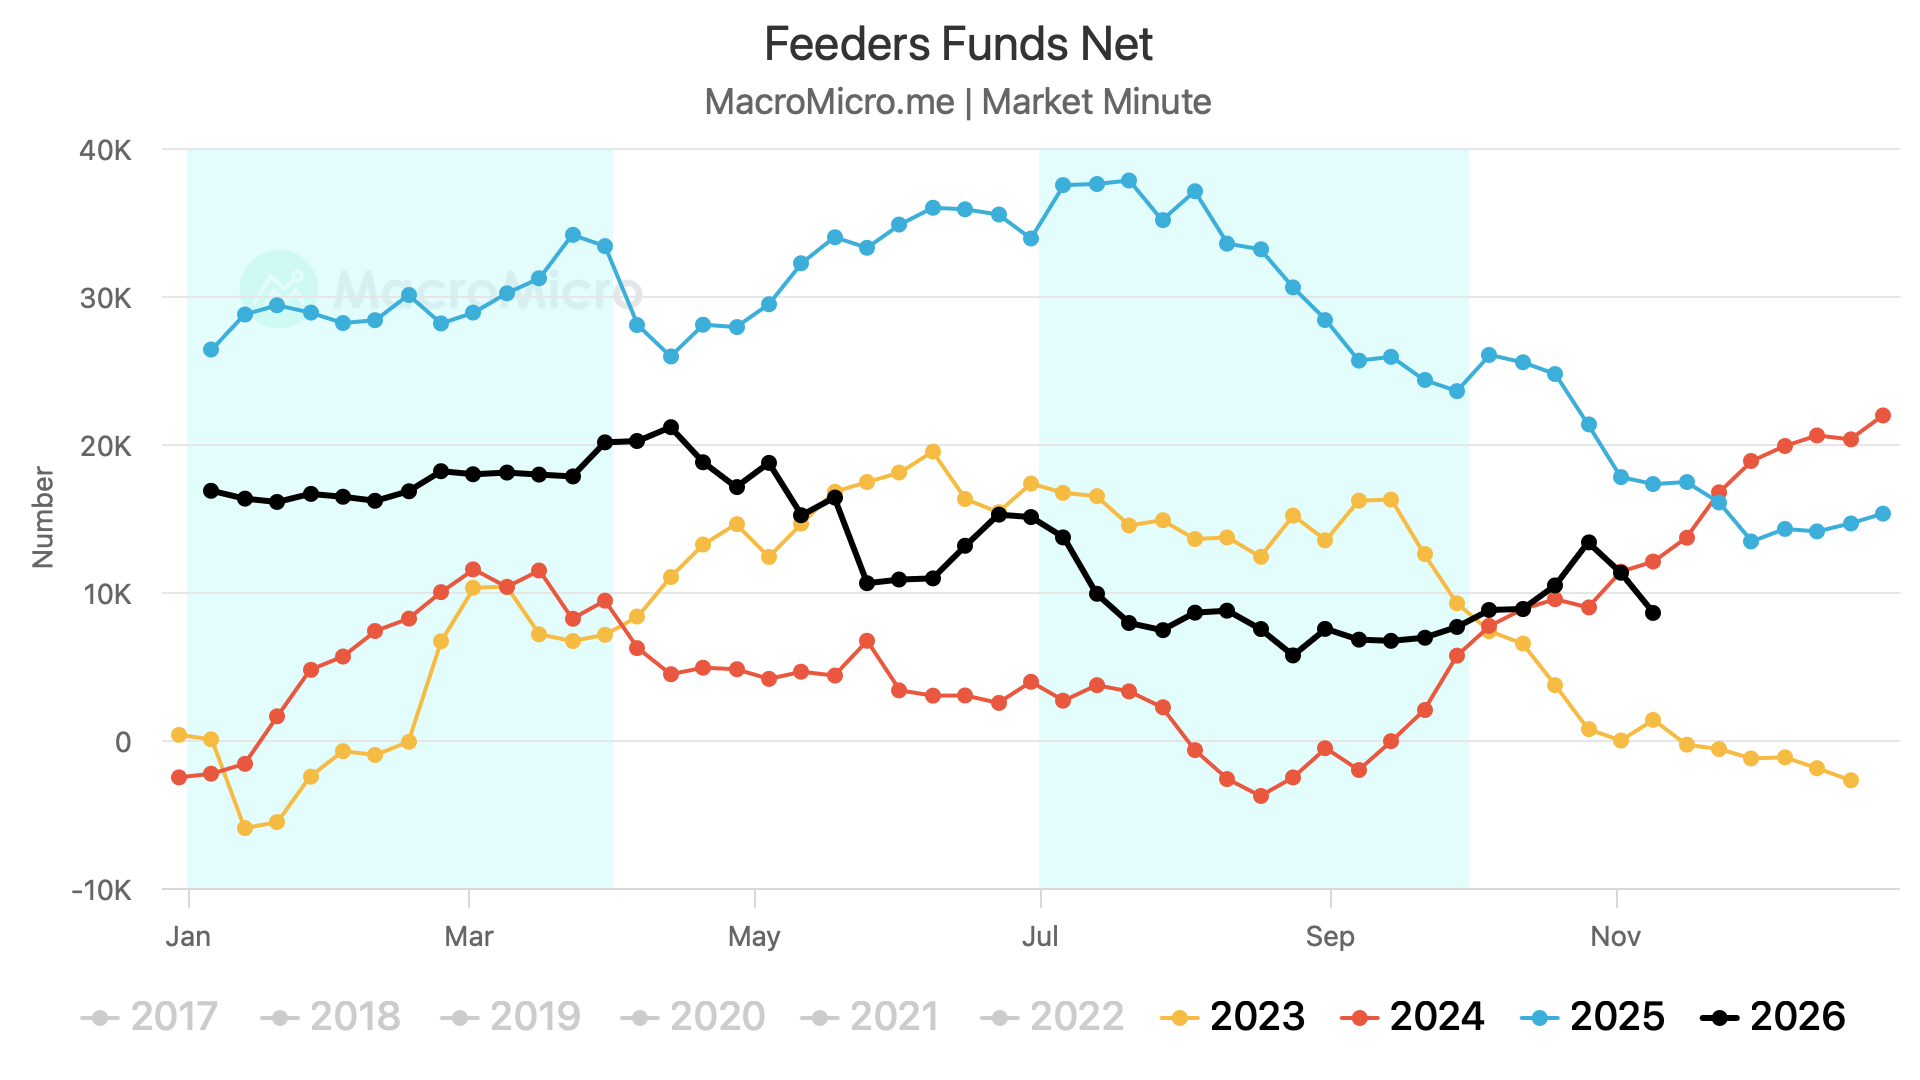
The funds just started to sell cattle again for the 2nd week in a row, after being pretty consistent buyers since August.
The funds now hold their smallest position in feeders for the time of year since 2023.
USDA Dollar Surging
One last thing I wanted to note before we get into today's main takeways is the dollar.
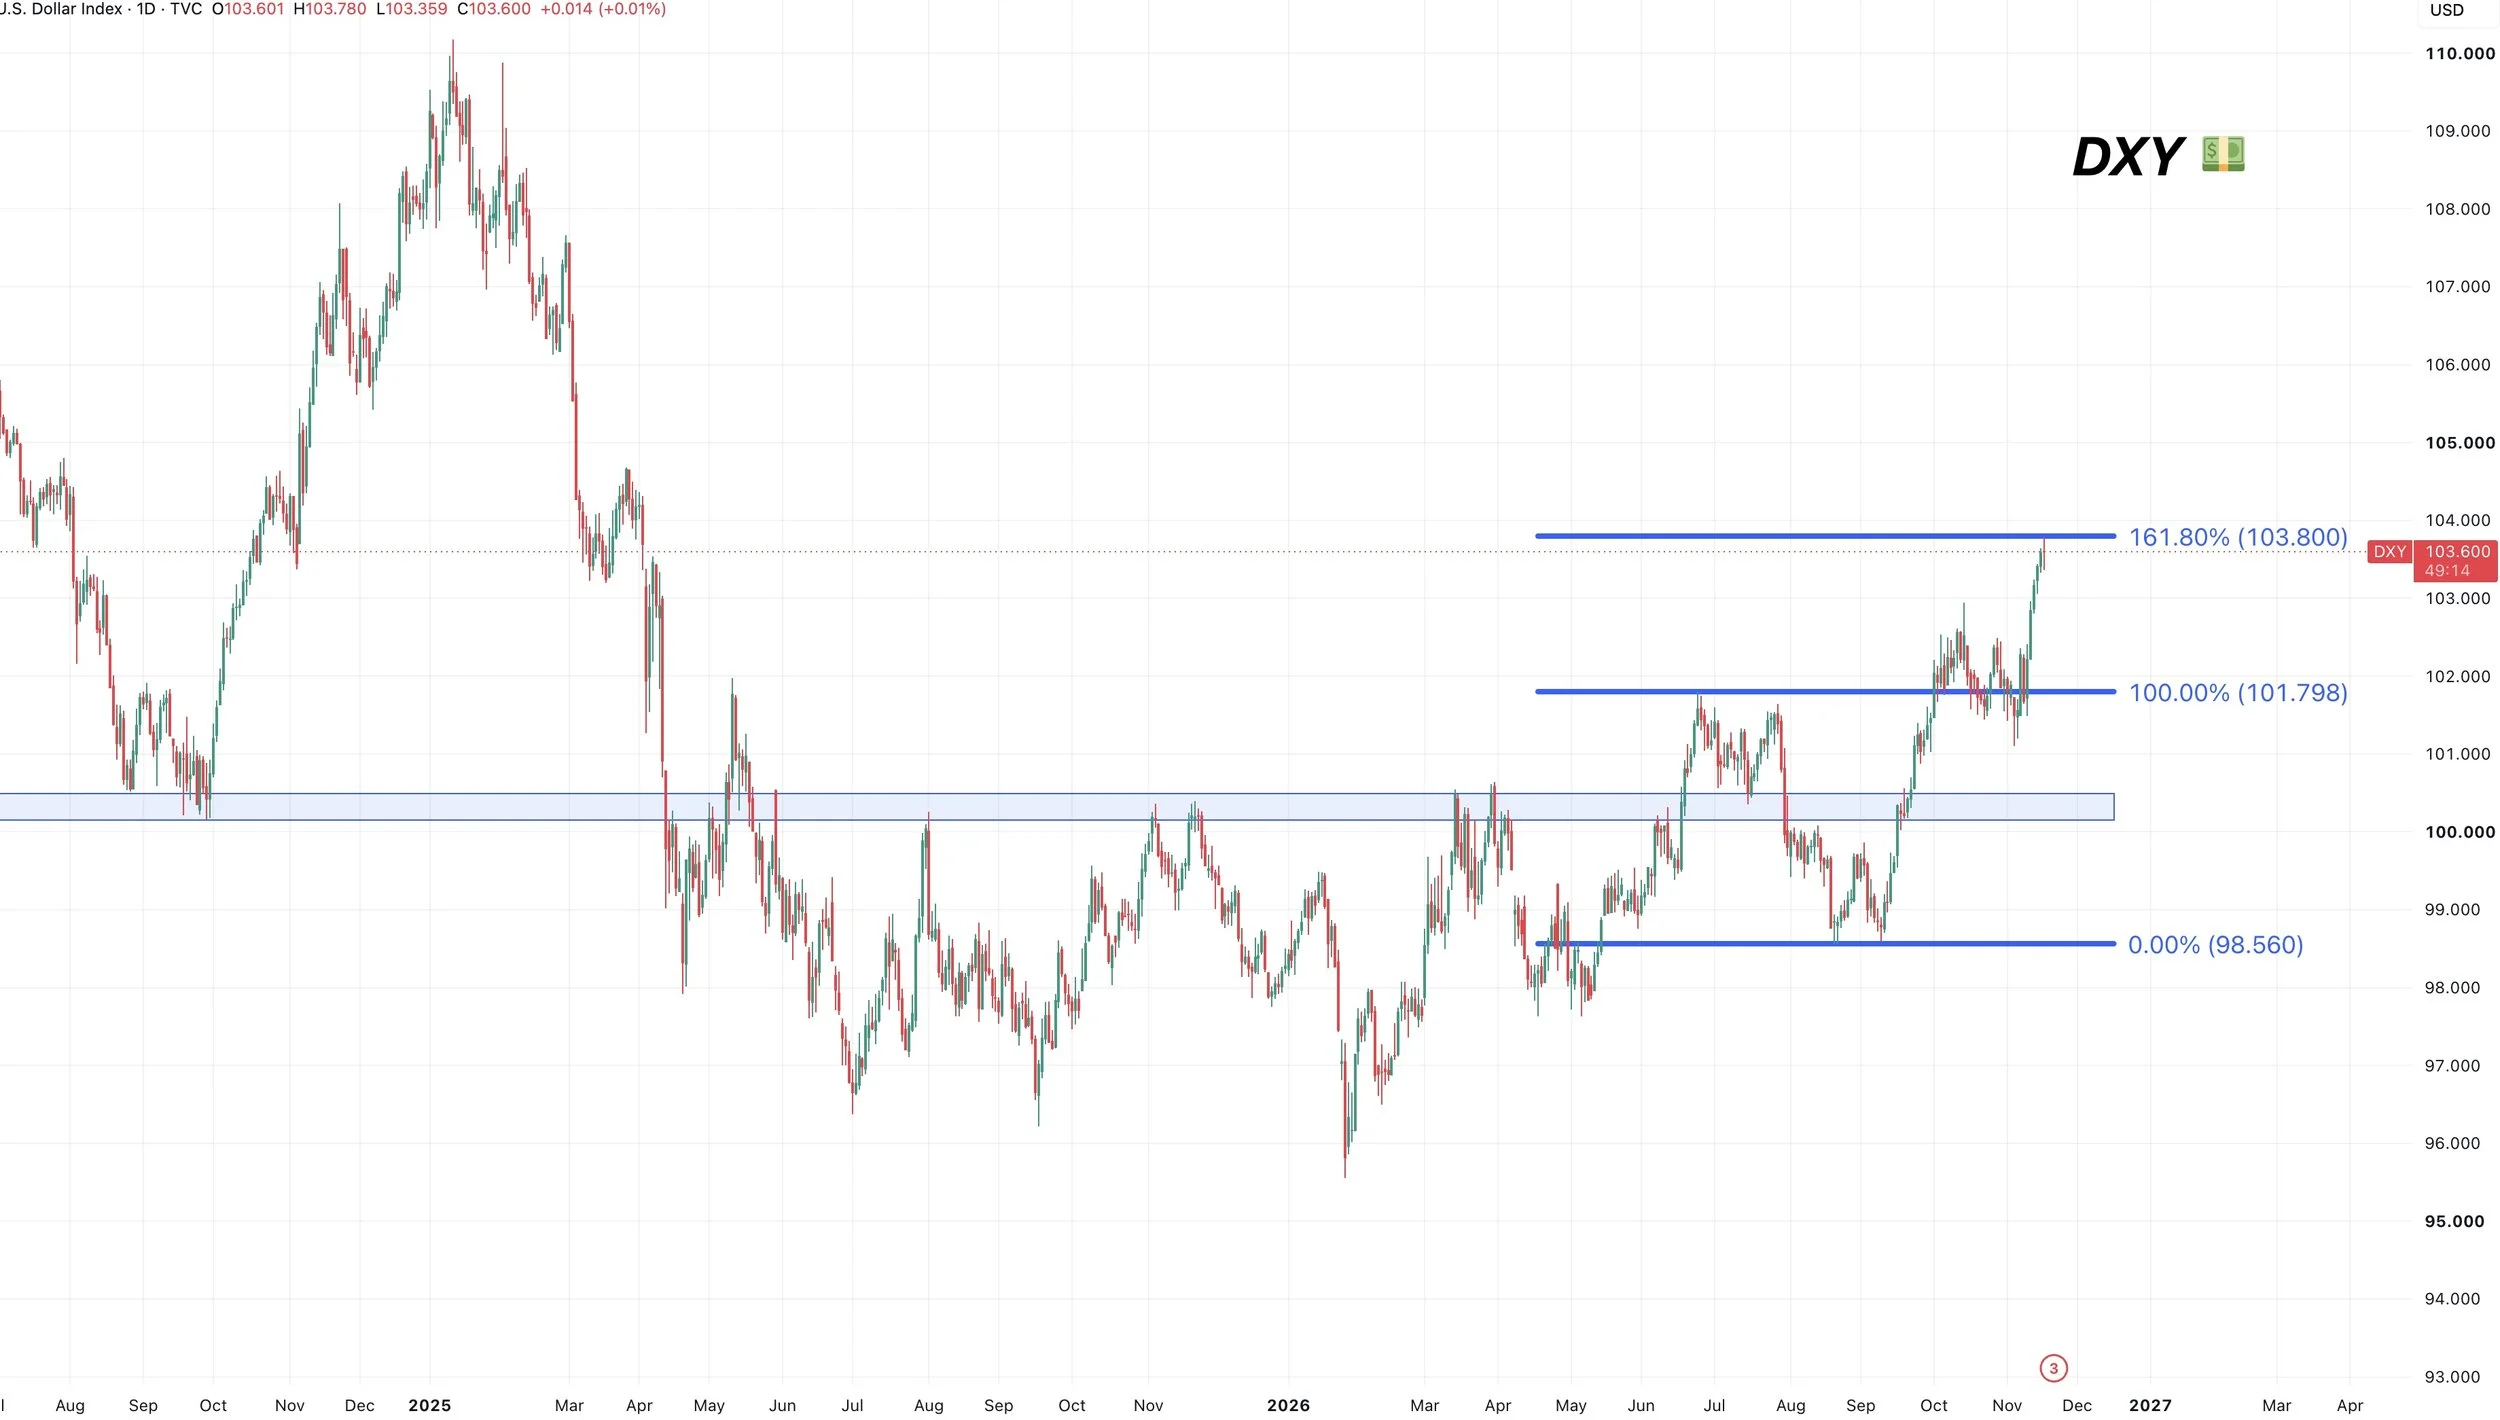
It's been soaring. It's up over +5% since September. As it has been running on the idea of more rate hikes.
Hitting 19 month highs, as it's at it's highest level since April of 2025.
There is no day to day correlation between grains and the dollar, but a higher dollar makes it that much harder to stay competitive on exports, so it's negative.
If we do some simple technical analysis, the dollar did perfectly hit the golden fib extension today. So it may be time for it to take a breather soon. But I guess we'll see.
If it starts to cool off, it would be friendly for demand.
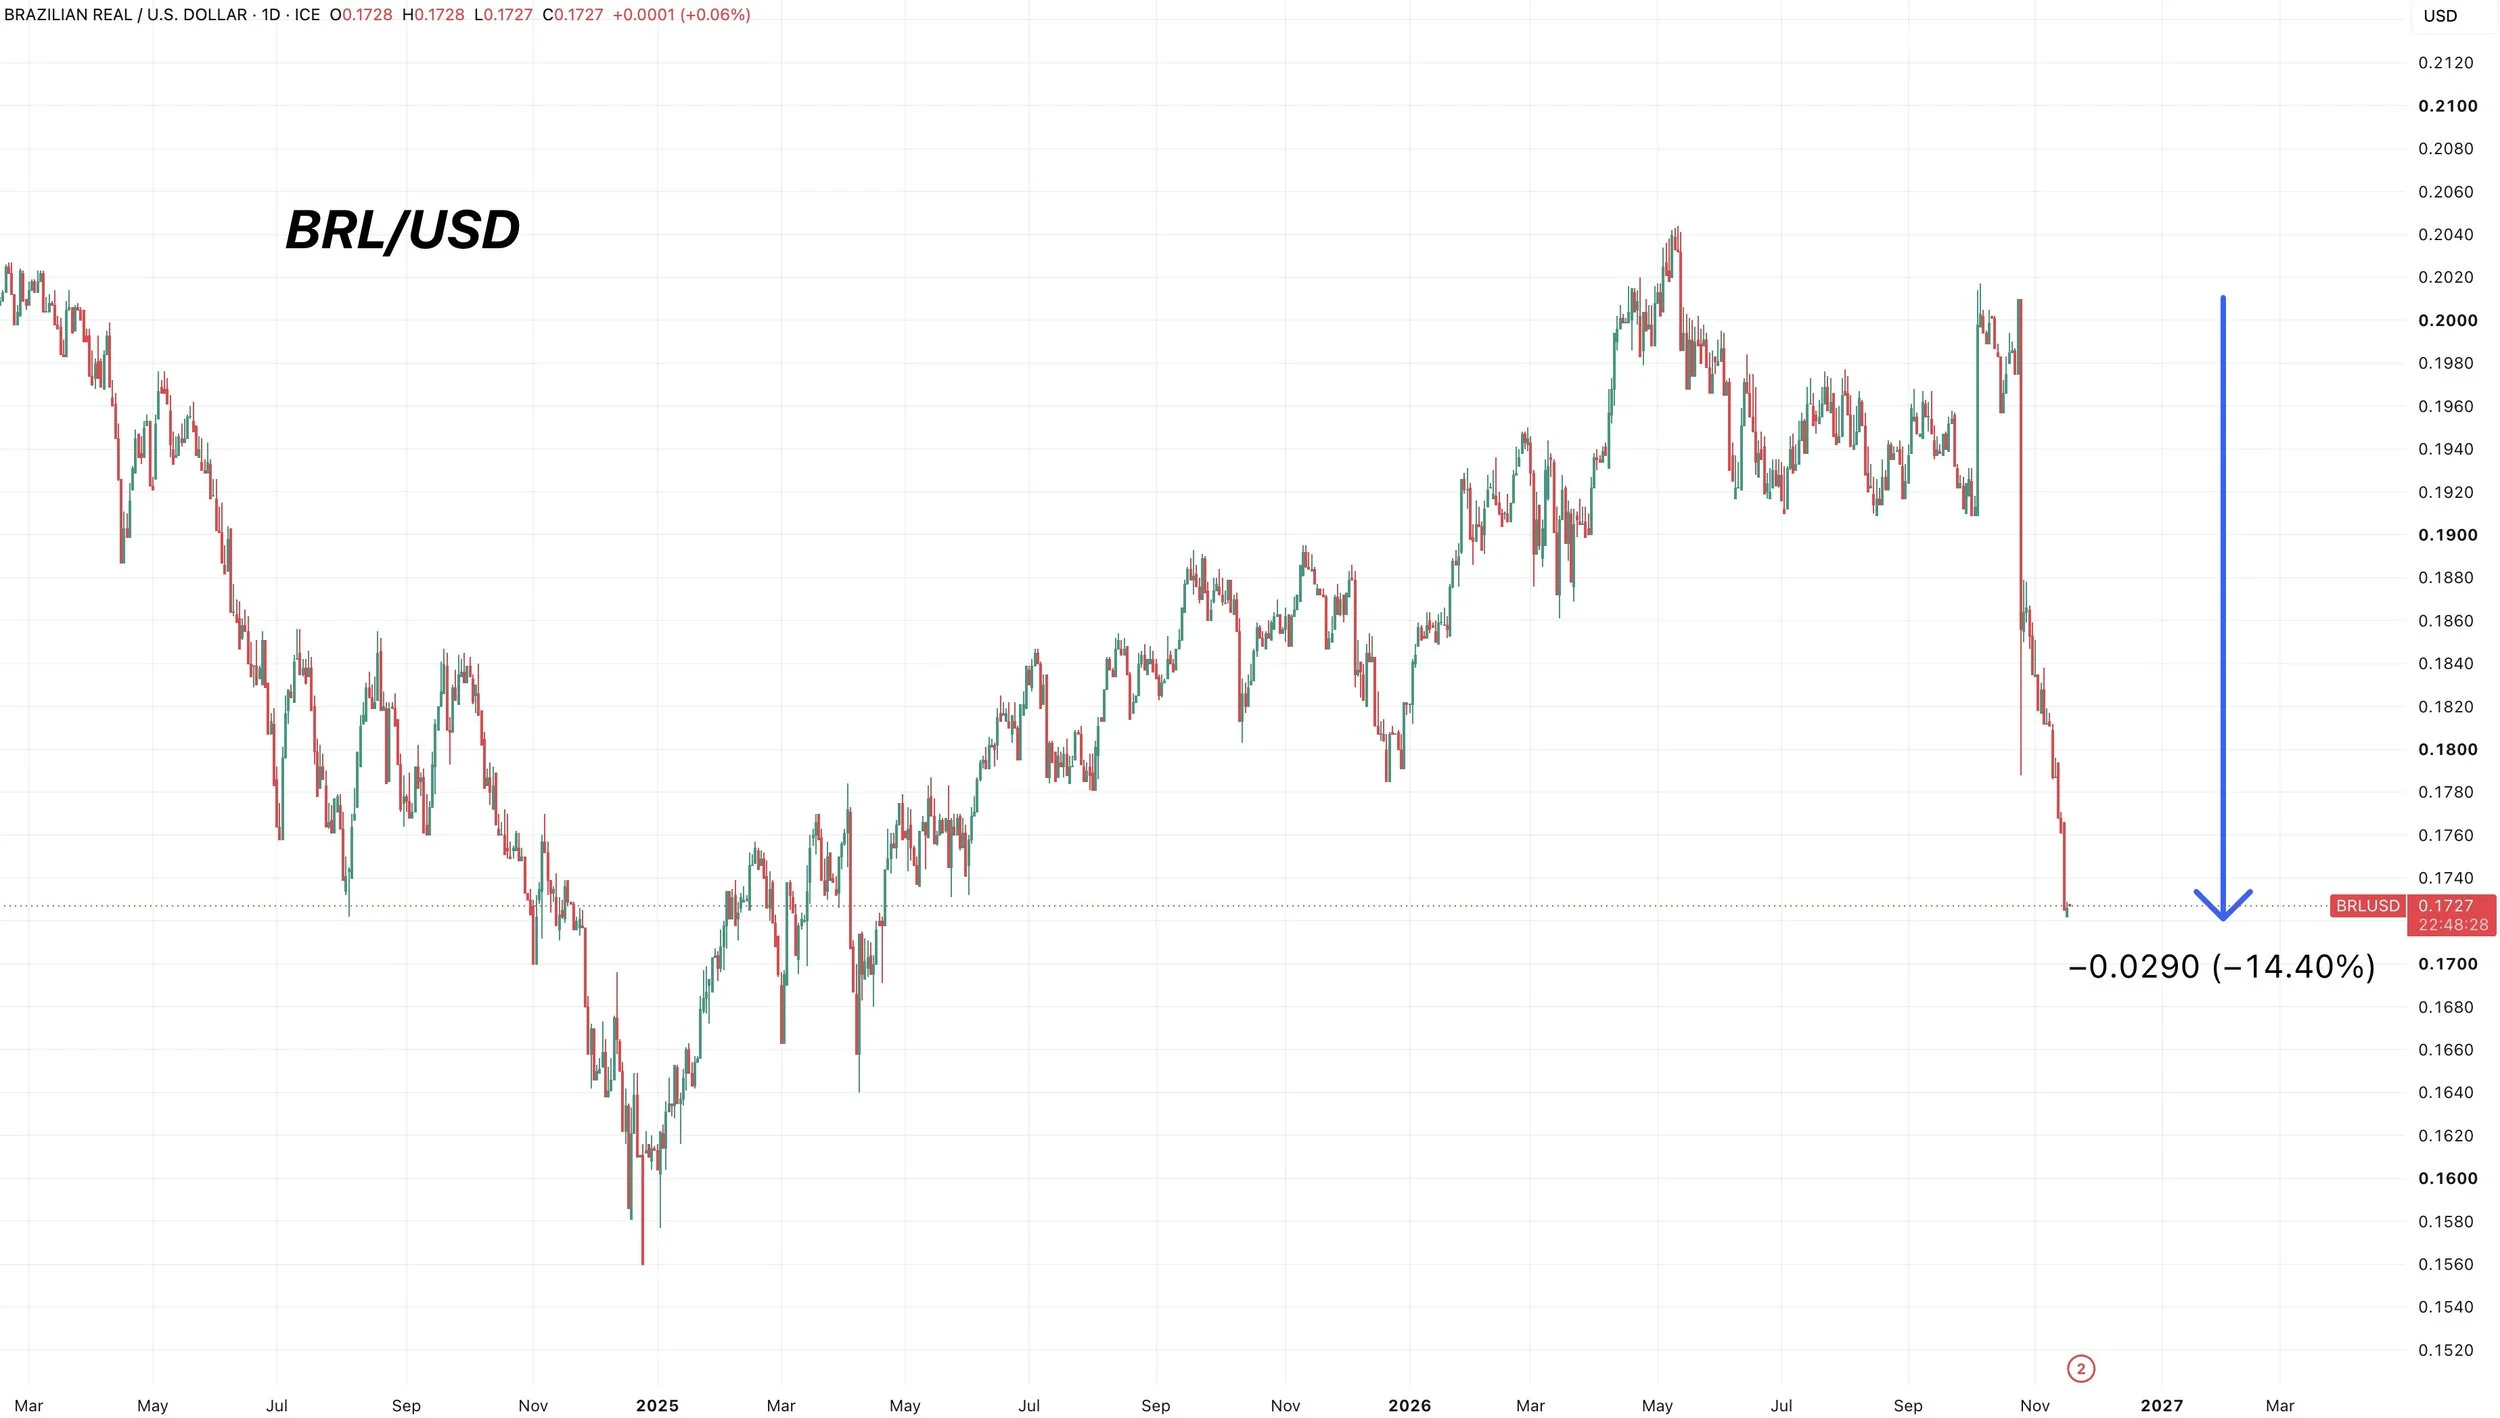
With the dollar rallying, we are seeing the Brazilian Real continue to fall vs the dollar.
It has now taken out the lows from the Brazil election and posted new lows for the year.
It's down about 14% off those highs.
This is viewed as a negative because Brazil farmers get paid more for their product, which entices sales. This also makes Brazil soybeans and corn more competitive vs the US.
But we have seen China buy a buttload of soybeans already, and they should live up to that goal regardless. I'd say the concern would be more so for the non-China buyers.
Today's Main Takeaways
Corn
Fundamentals:
I am going to keep today's main takeaways on the shorter side today as fundamentally I don’t have much new from our last few updates.
If you'd like some more fundamental break downs check out my last few updates.
Last Friday: Click Here
Last Tuesday: Click Here
Is Corn Undervalued?
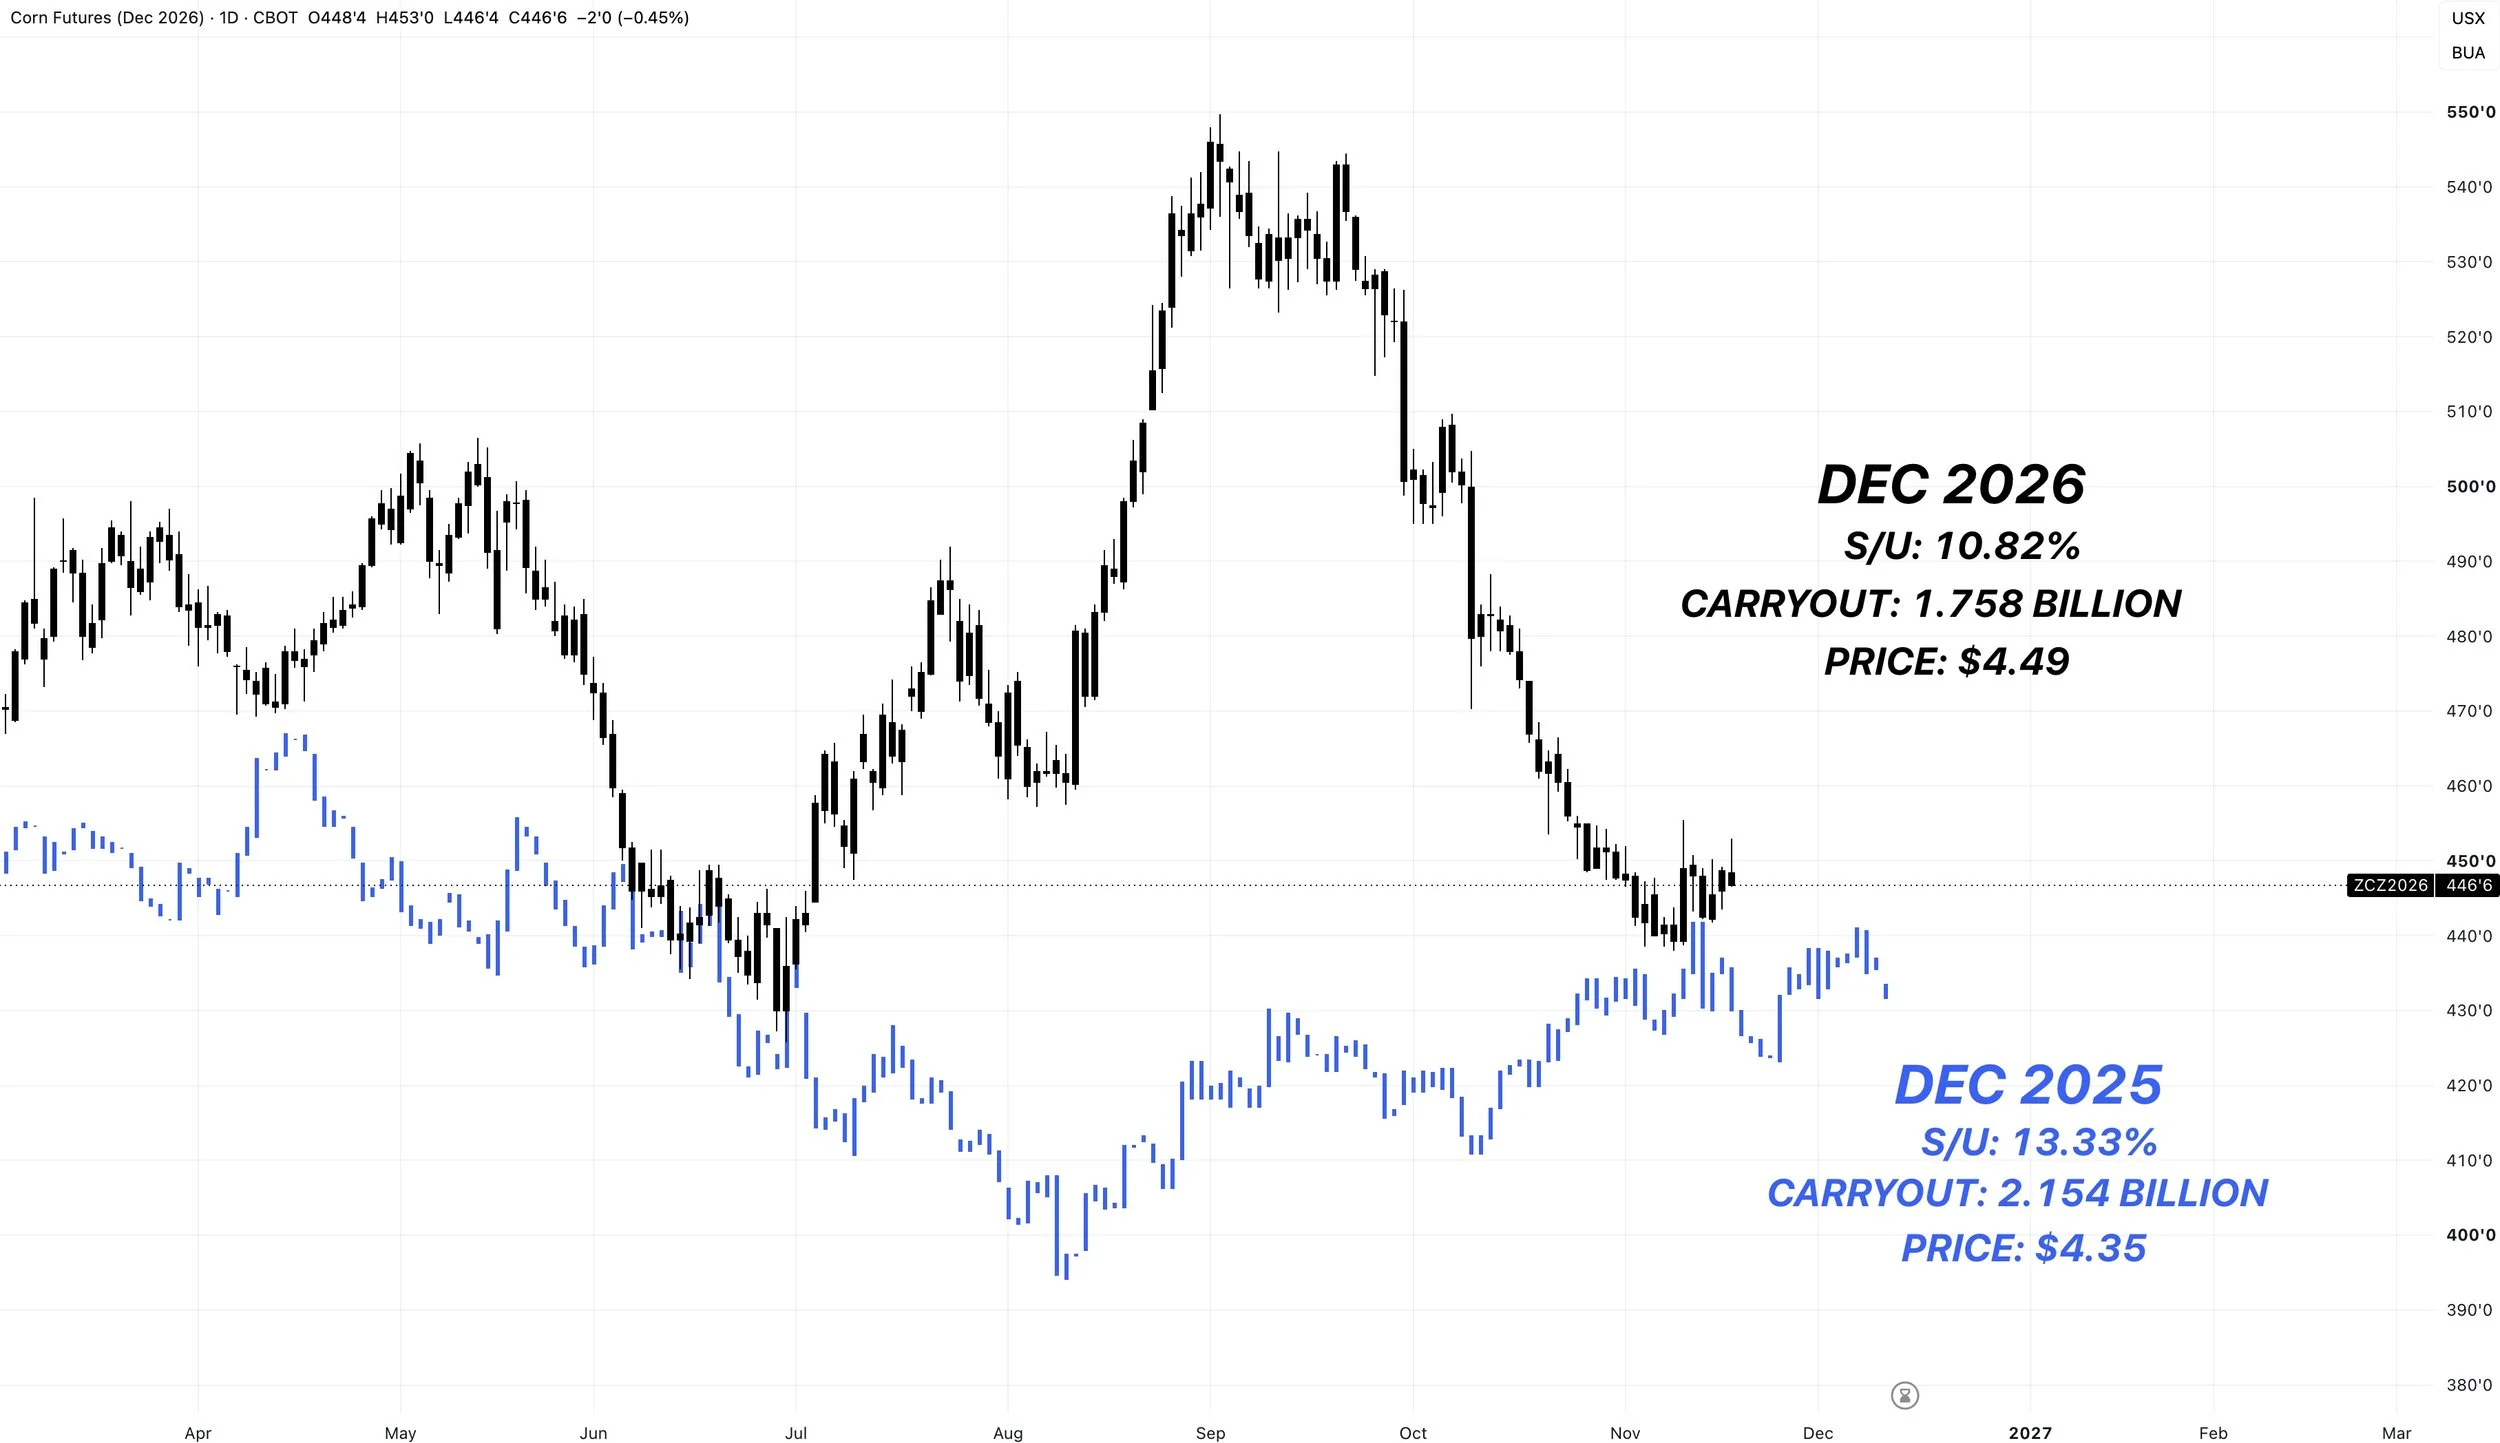
Here is one simple way to look at whether it feels like the corn market is undervalued or not here. Let's simply compare it to last year.
I shared this last week as well as on social media, but I think it sums it up pretty well.
On Today's Date:
Dec-25
Stocks to Use: 13.33%
Carryout: 2.154 billion bu
Price: $4.35
Dec-26
Stocks to Use: 10.82%
Carryout: 1.758 billion bu
Price: $4.47
Difference vs Last Year
Stocks to Use: -2.51%
Carryout: -396 million
Price: +12 cents
So you are telling me that we have a drastically more bullish situation compared to last year at this time.. and prices are only +12 cents higher?
When comparing the two, I would argue it seems like we are undervalued down here.
Canaries in the coal mines?
I am sure you have heard of the saying "canaries in the coal mine".
Essentially this saying means that something is warning the market. In this case, I am talking about basis and spreads.
As often times what happens is we see:
Basis firms. Then spreads firm. Then futures follow.
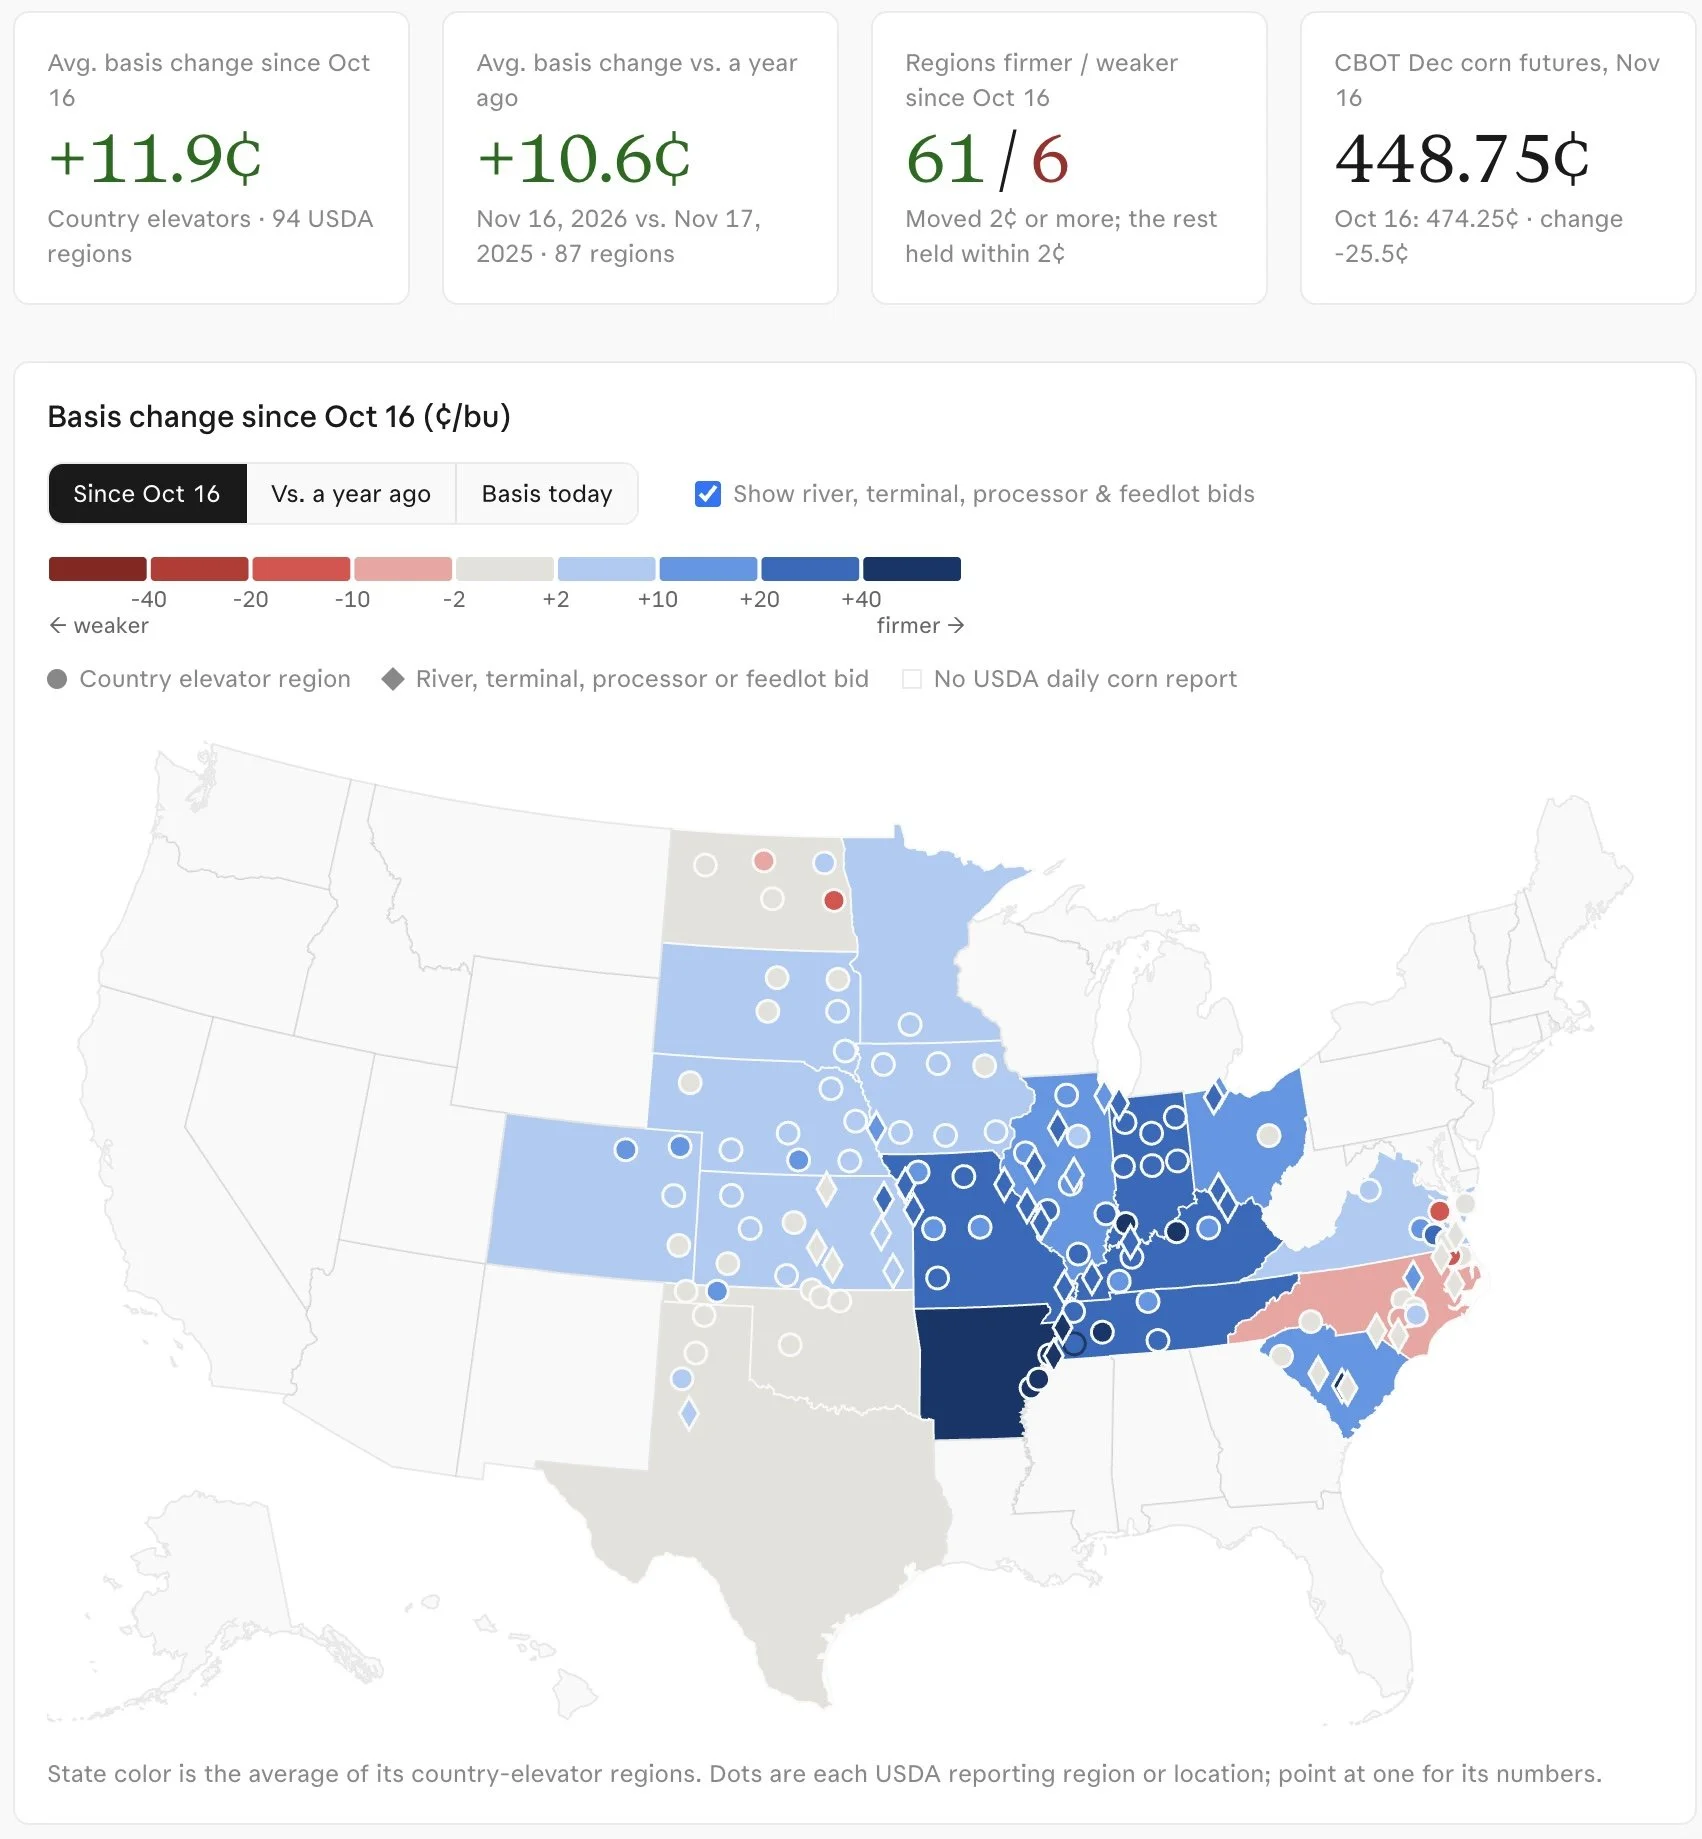
So far, we have been seeing basis improve in areas.
Of course that's just naturally what happens after harvest but still a good sign and something to be aware of.
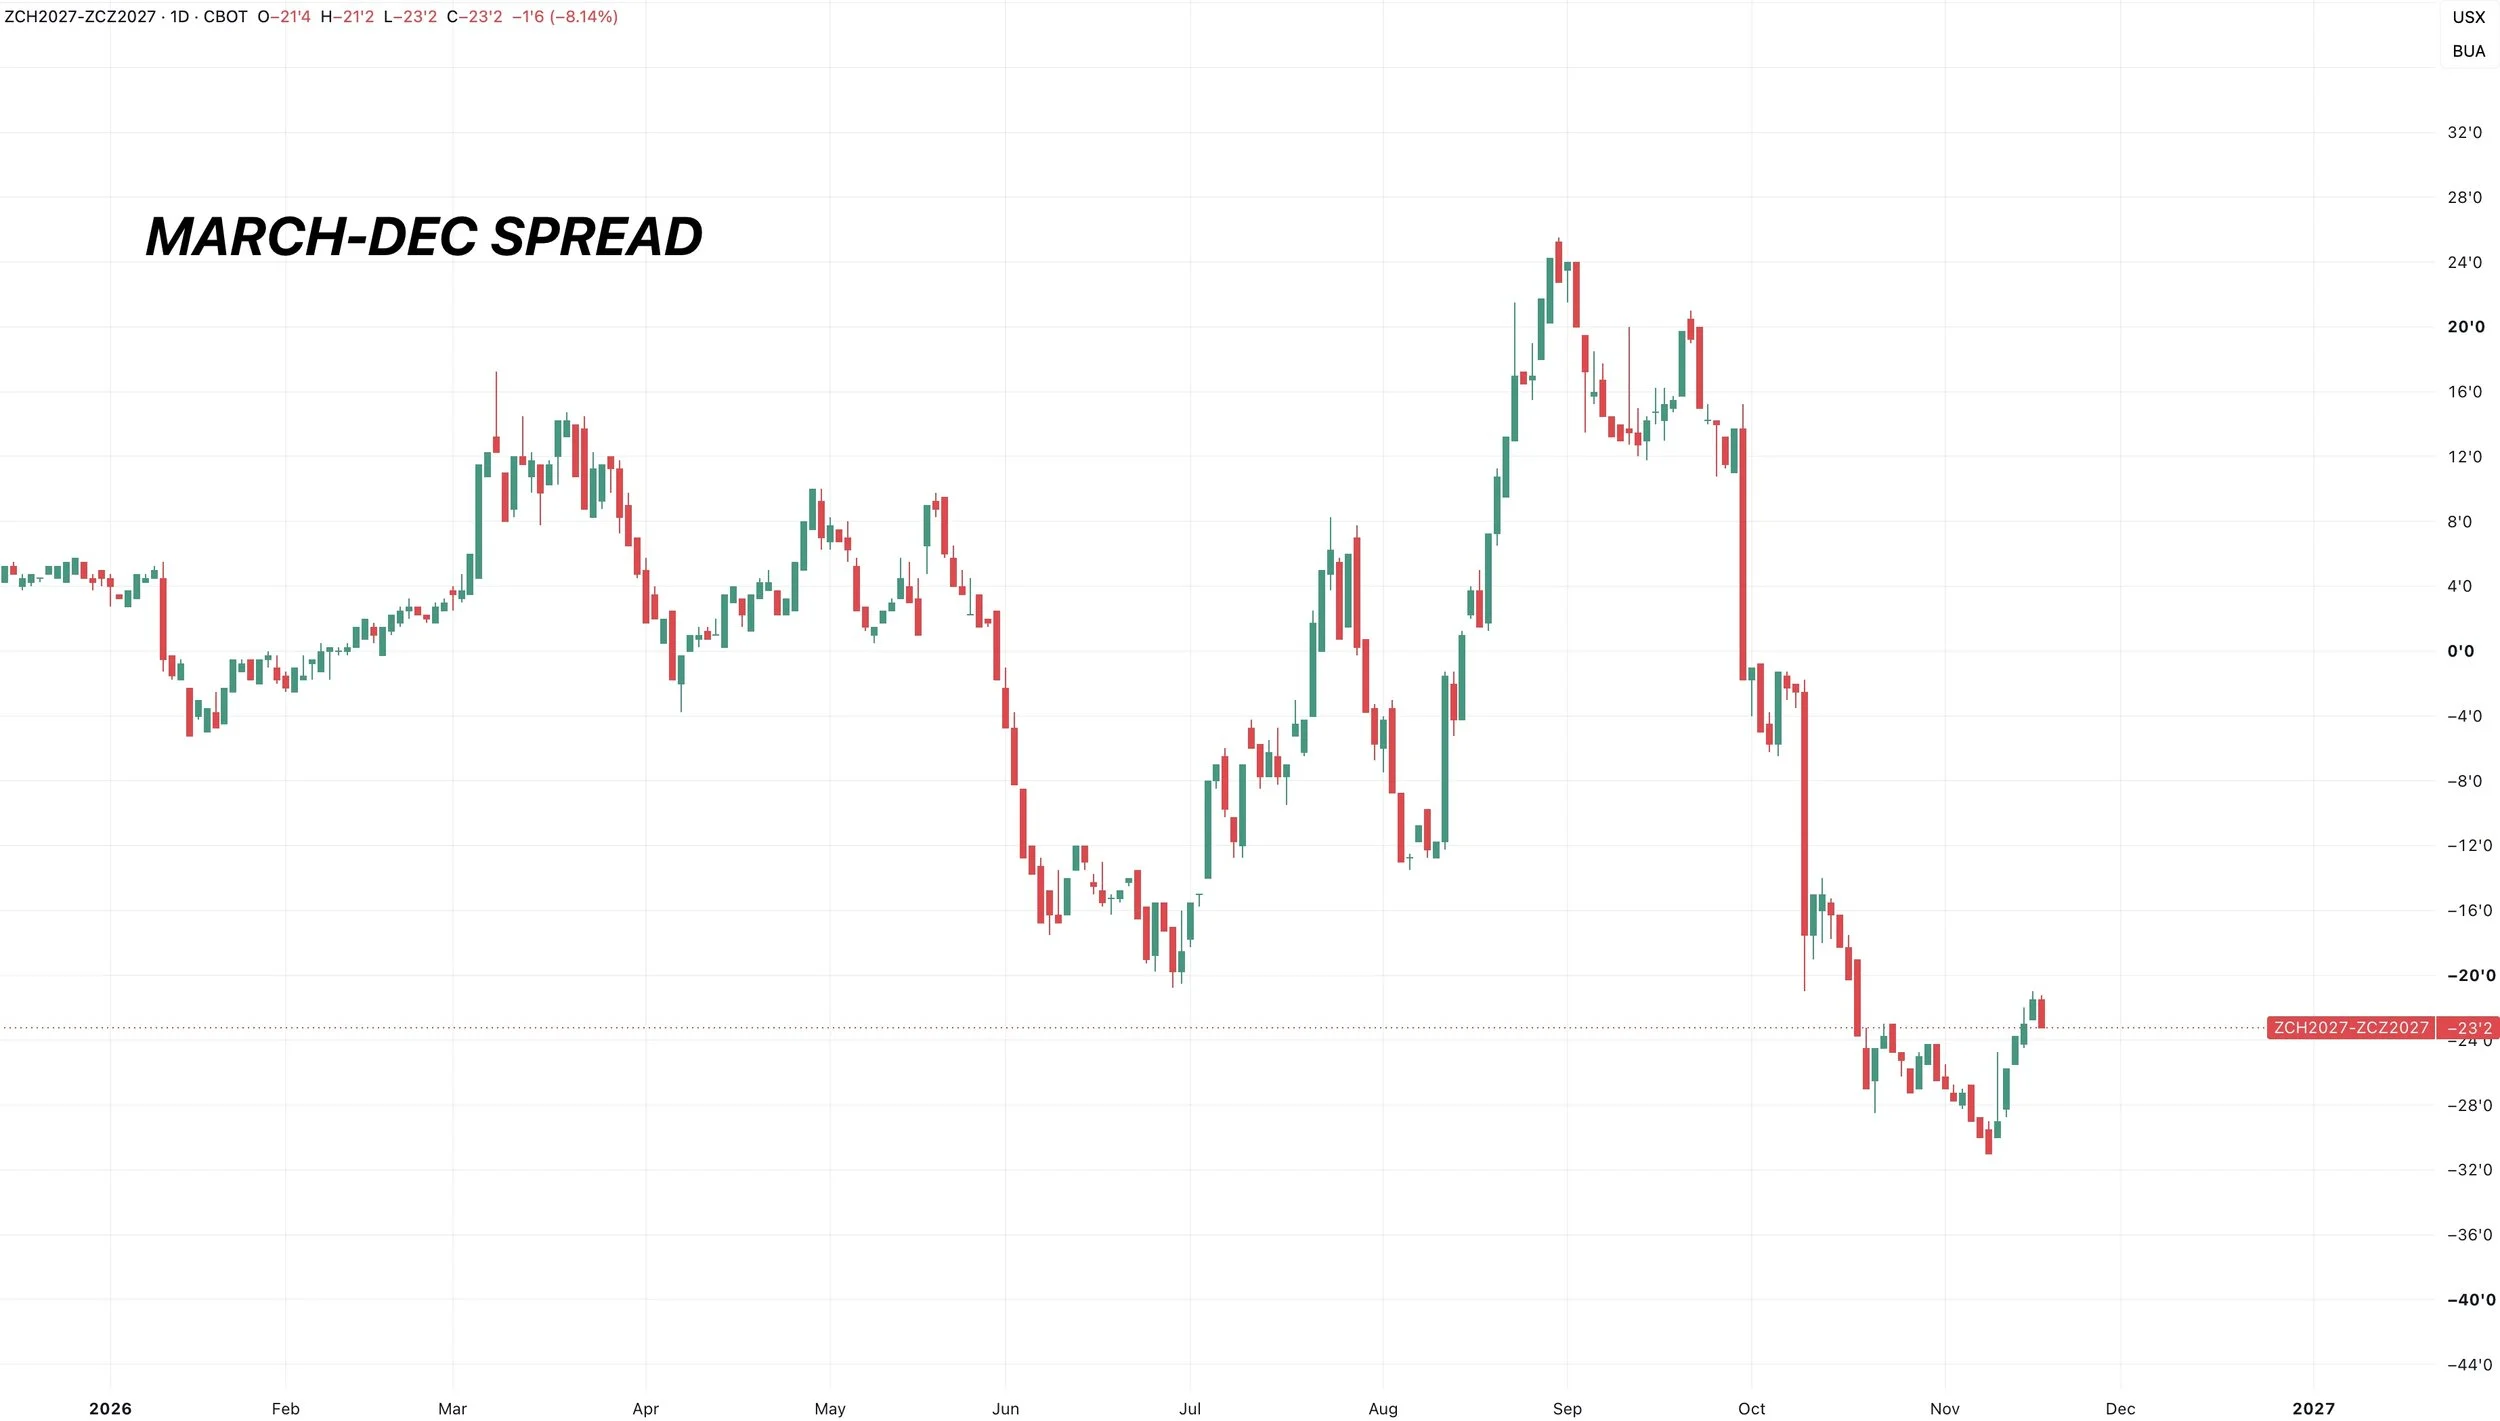
We've also been seeing the spreads start to firm up.
The corn spreads traded lower today, but they had traded higher for 5 days in a row before today. Even on the days where corn traded lower.
If we continue to see these firm, it's a bullish sign. So far they have been positive as of late.
As often times basis and spreads can be a hint of what is to come.
You also have the fact that farmer selling should be very minimal the rest of the year.
We just priced in a lot of bearishness in a very short period of time.
Spreads might have to some incentiving.
We want to continue to see these firm. So far an encouraging start.
Seasonal Data:
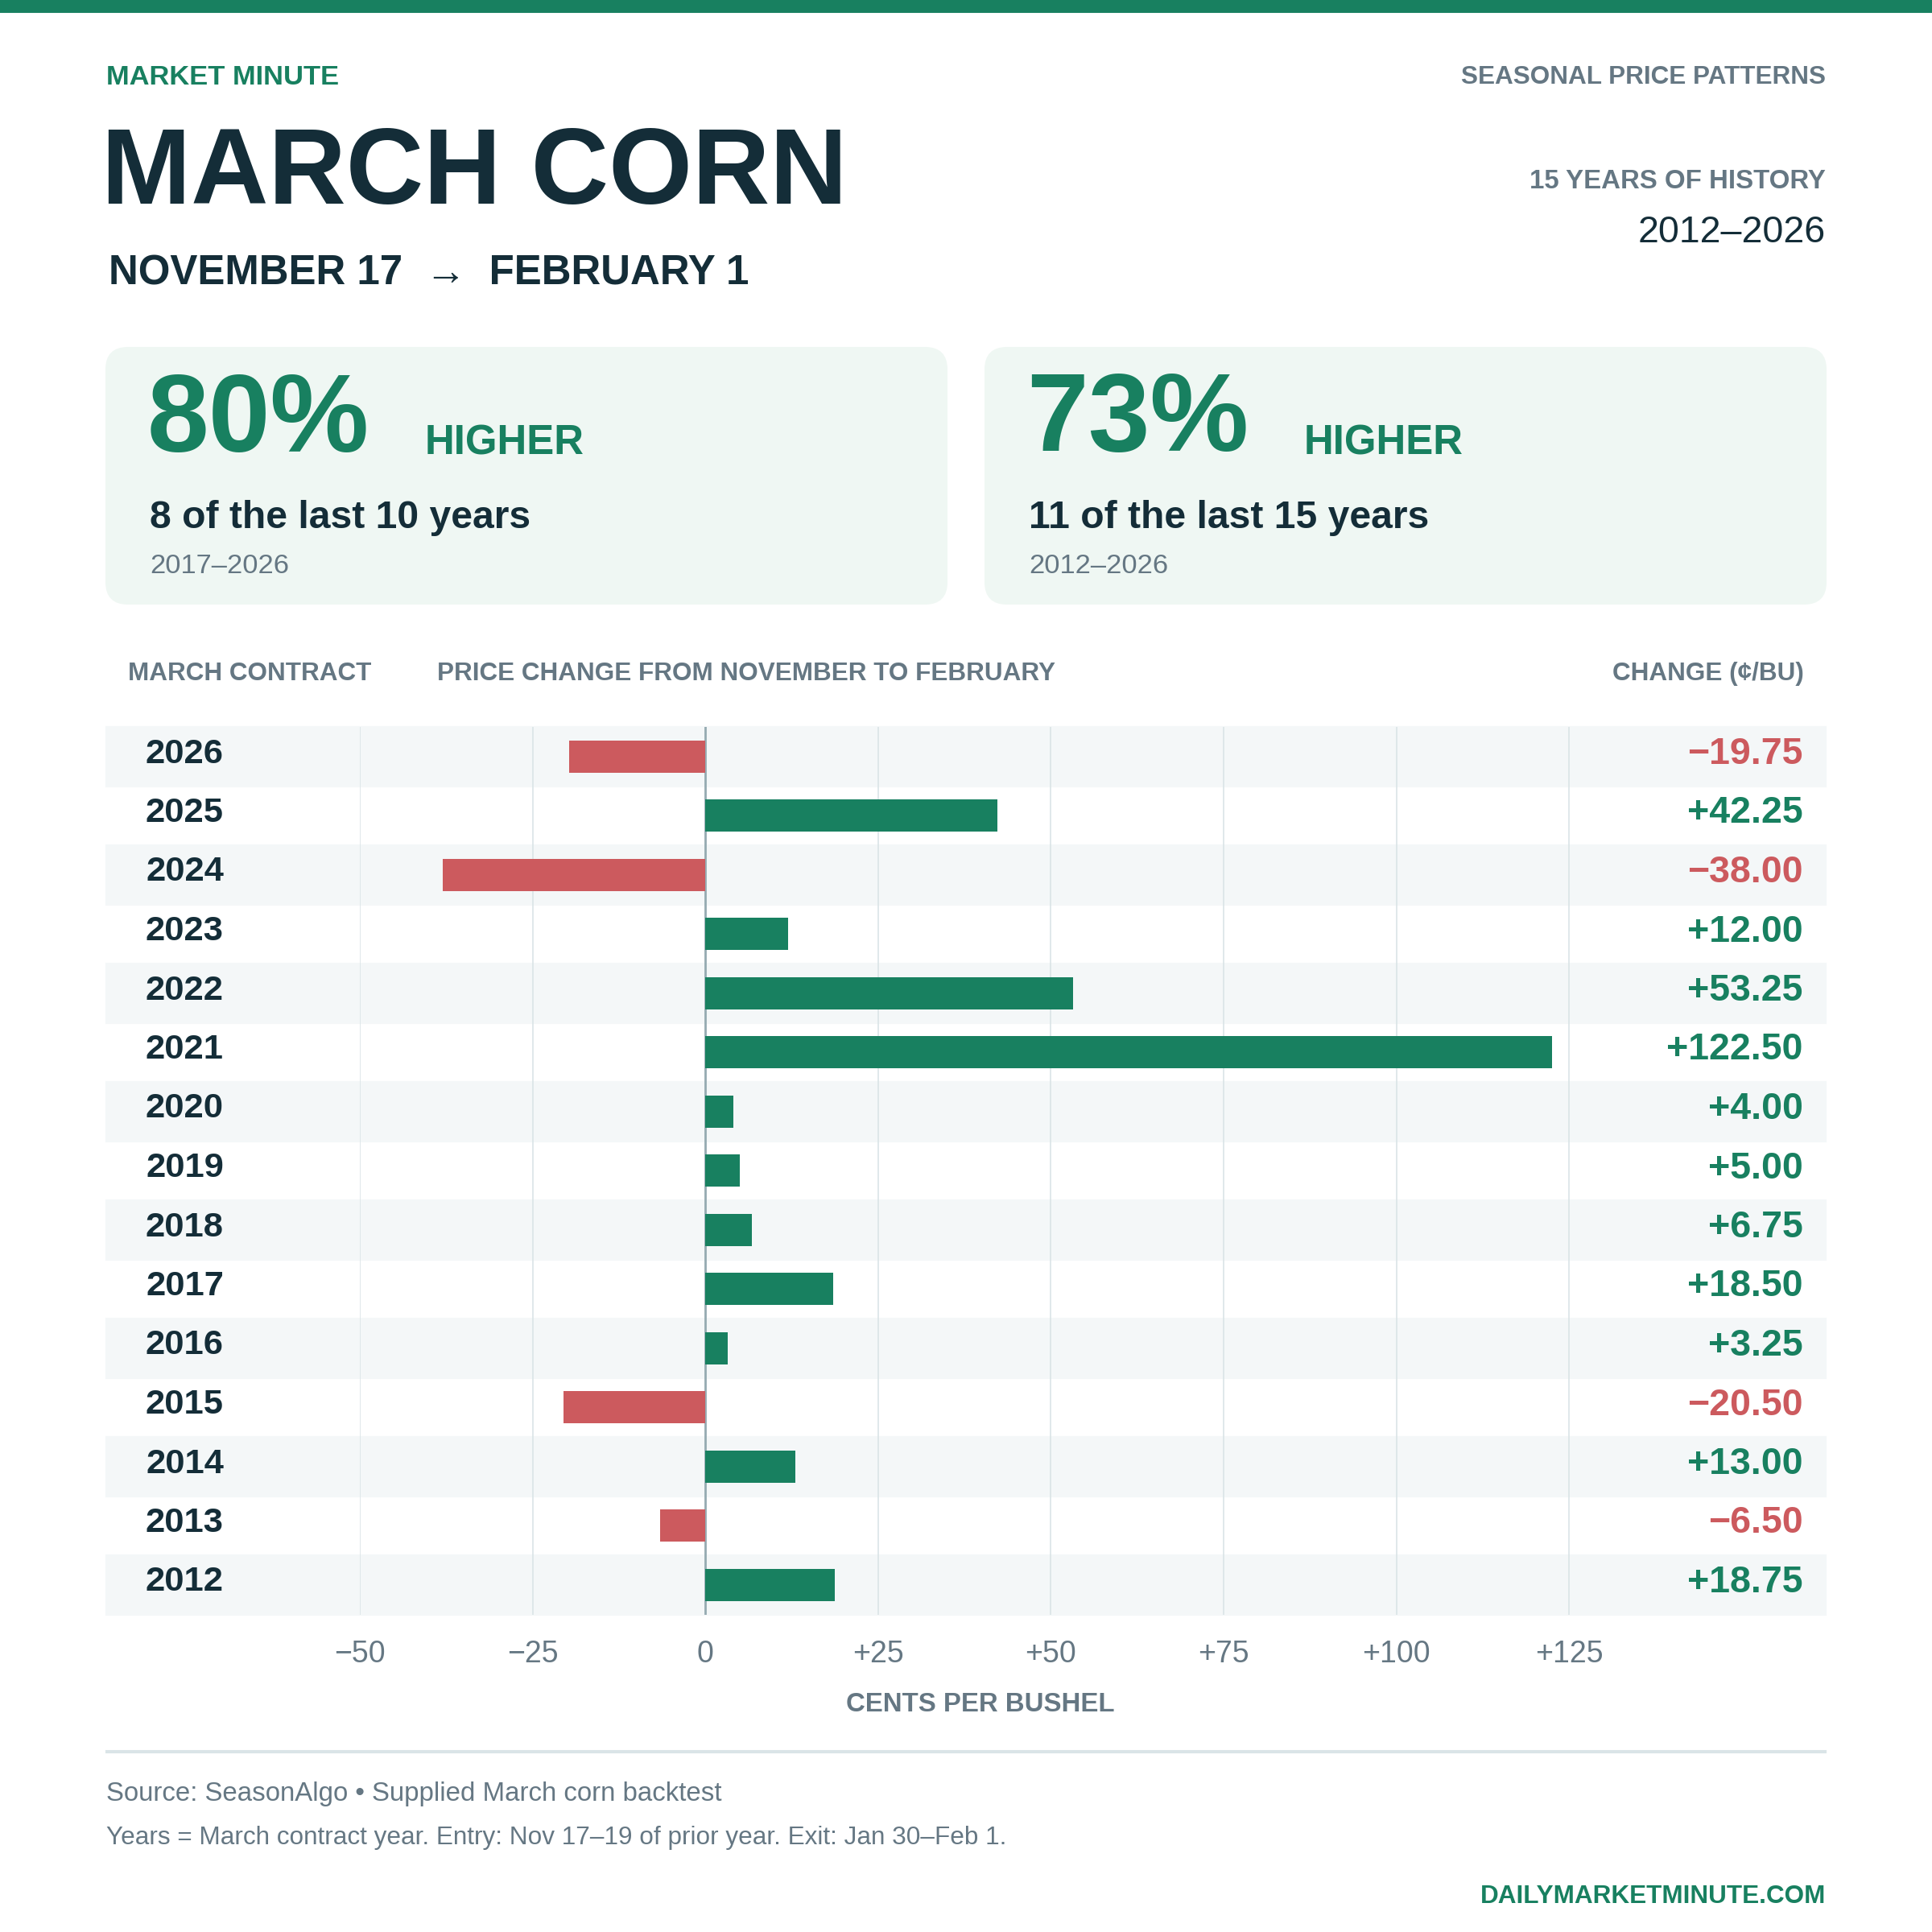
Here is some interesting seasonal data.
Corn does tend to head higher into the early part of the year.
From today's date by February 1st, March corn has traded higher in the last 8 of 10 years.
Higher in the last 11 of 15 years.
Dec Corn Chart:
Bullish Divergence:
Not only does it simply feel like we are undervalued and finding demand, along with some friendly signs from the spreads.
But the charts are starting to paint some signs of life as well.
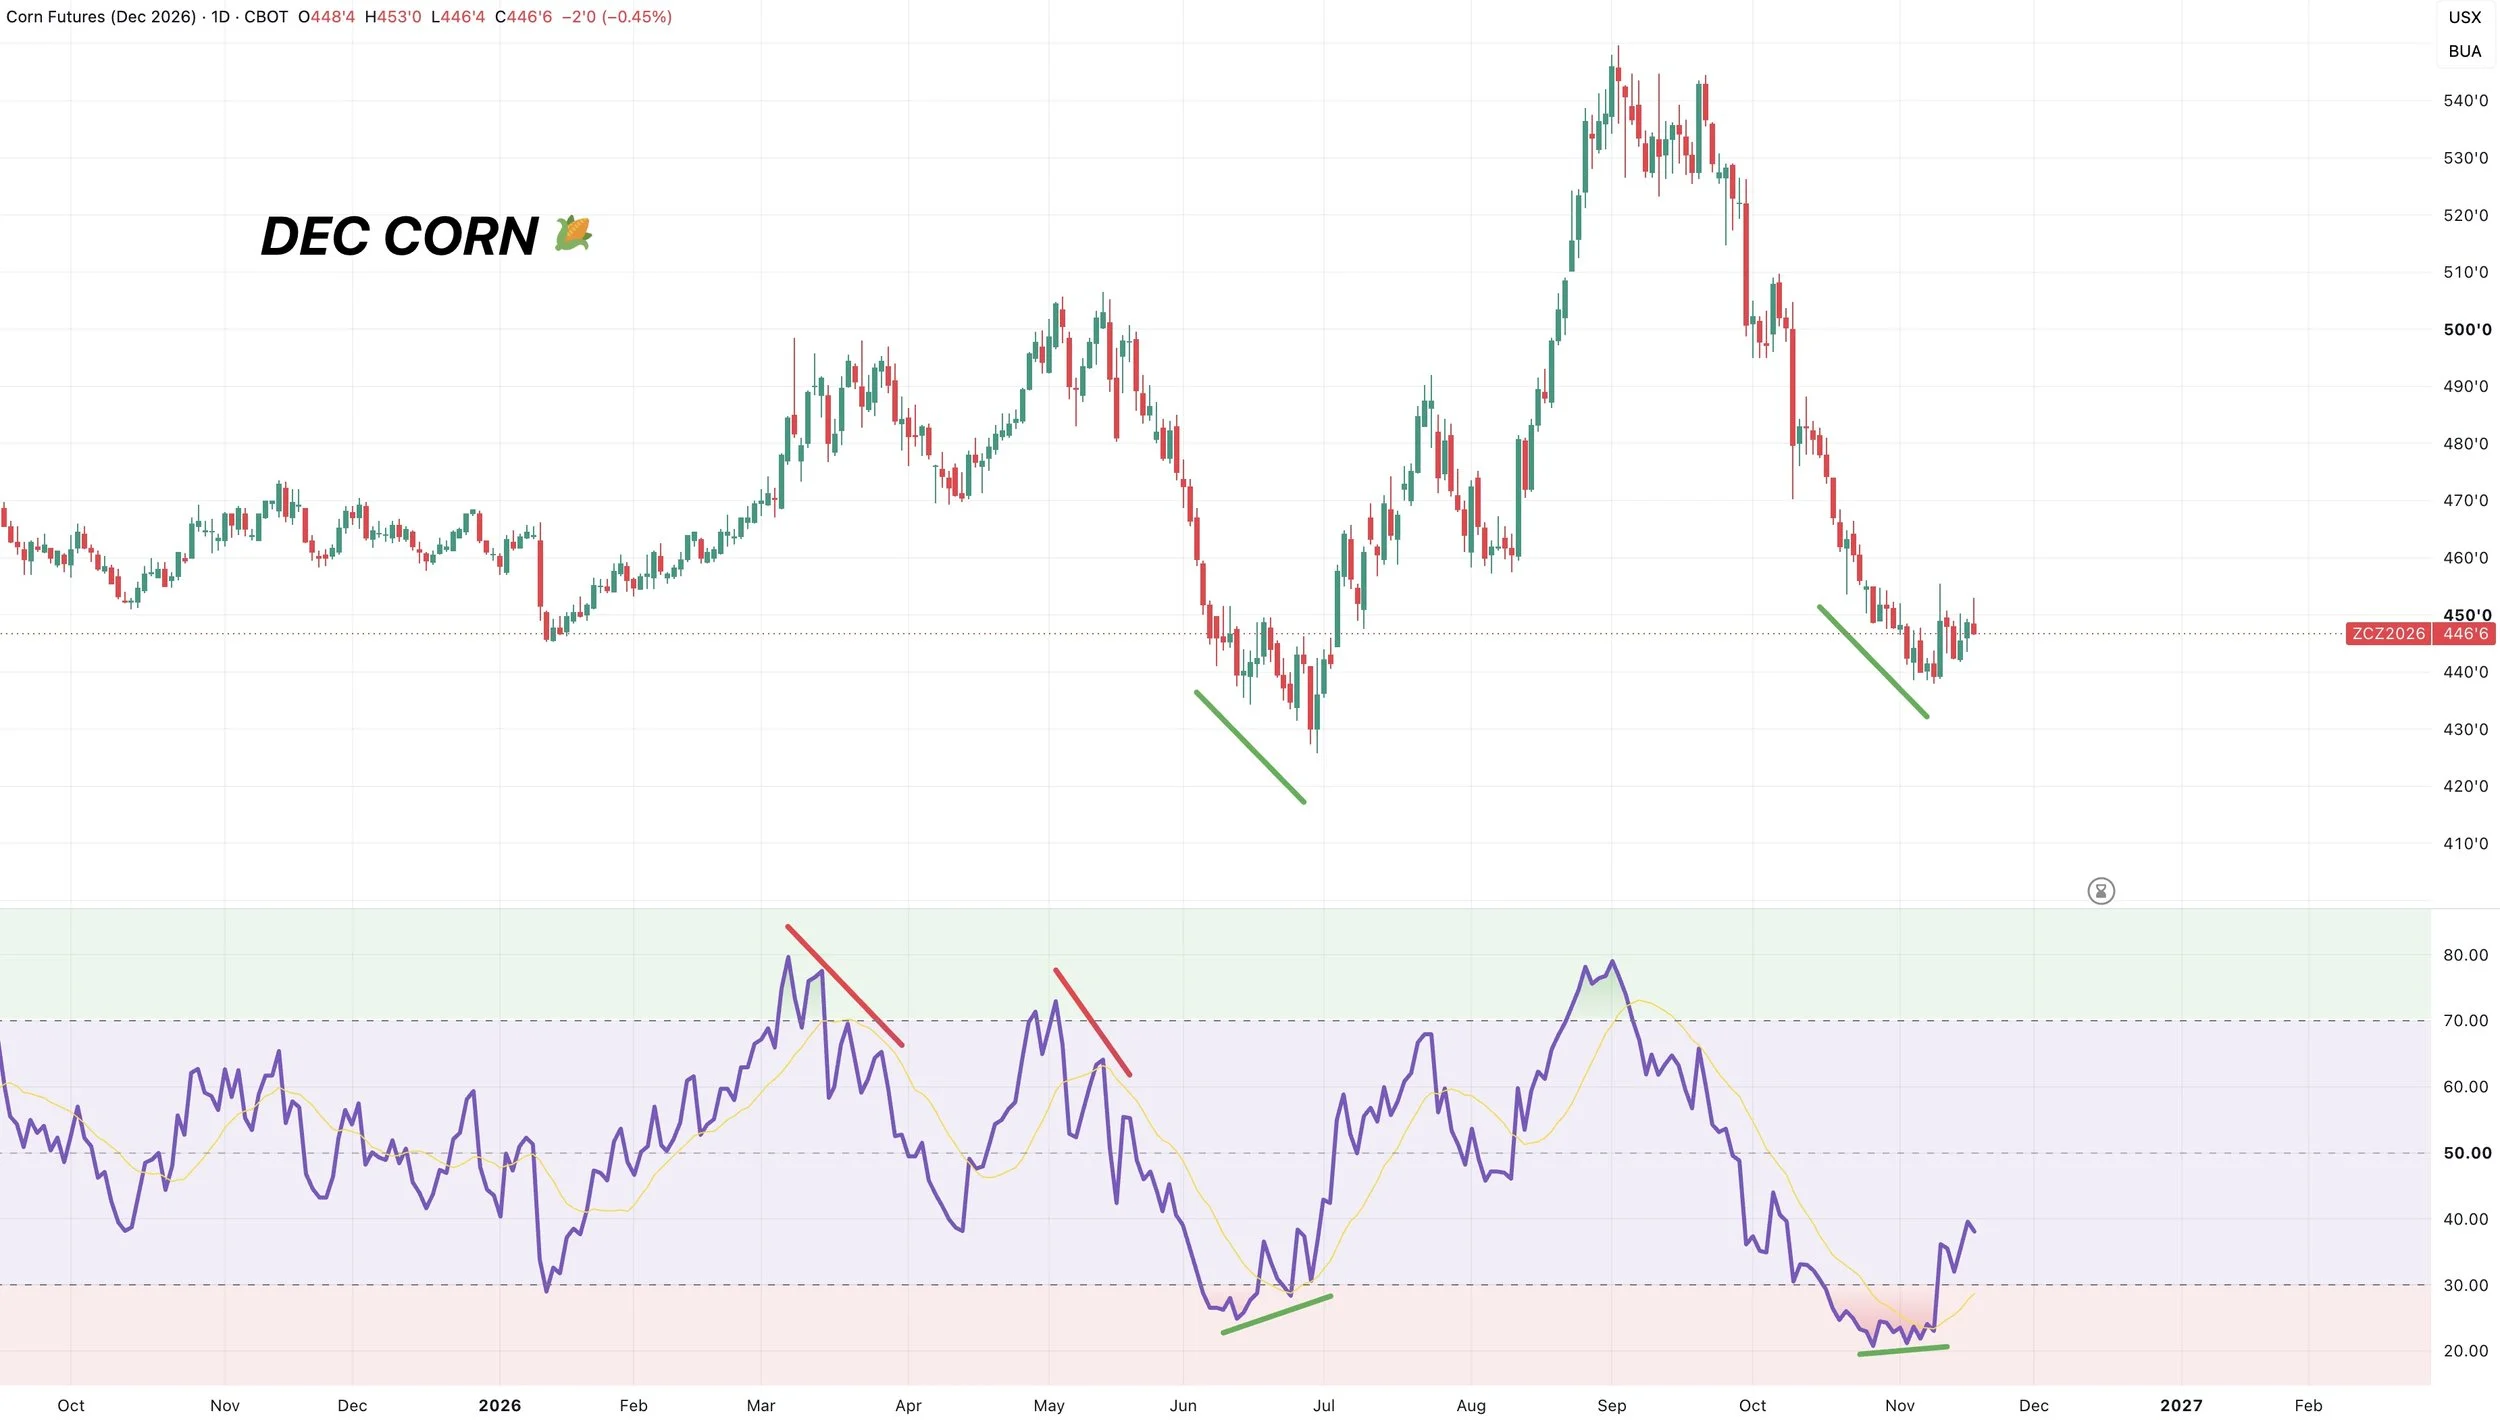
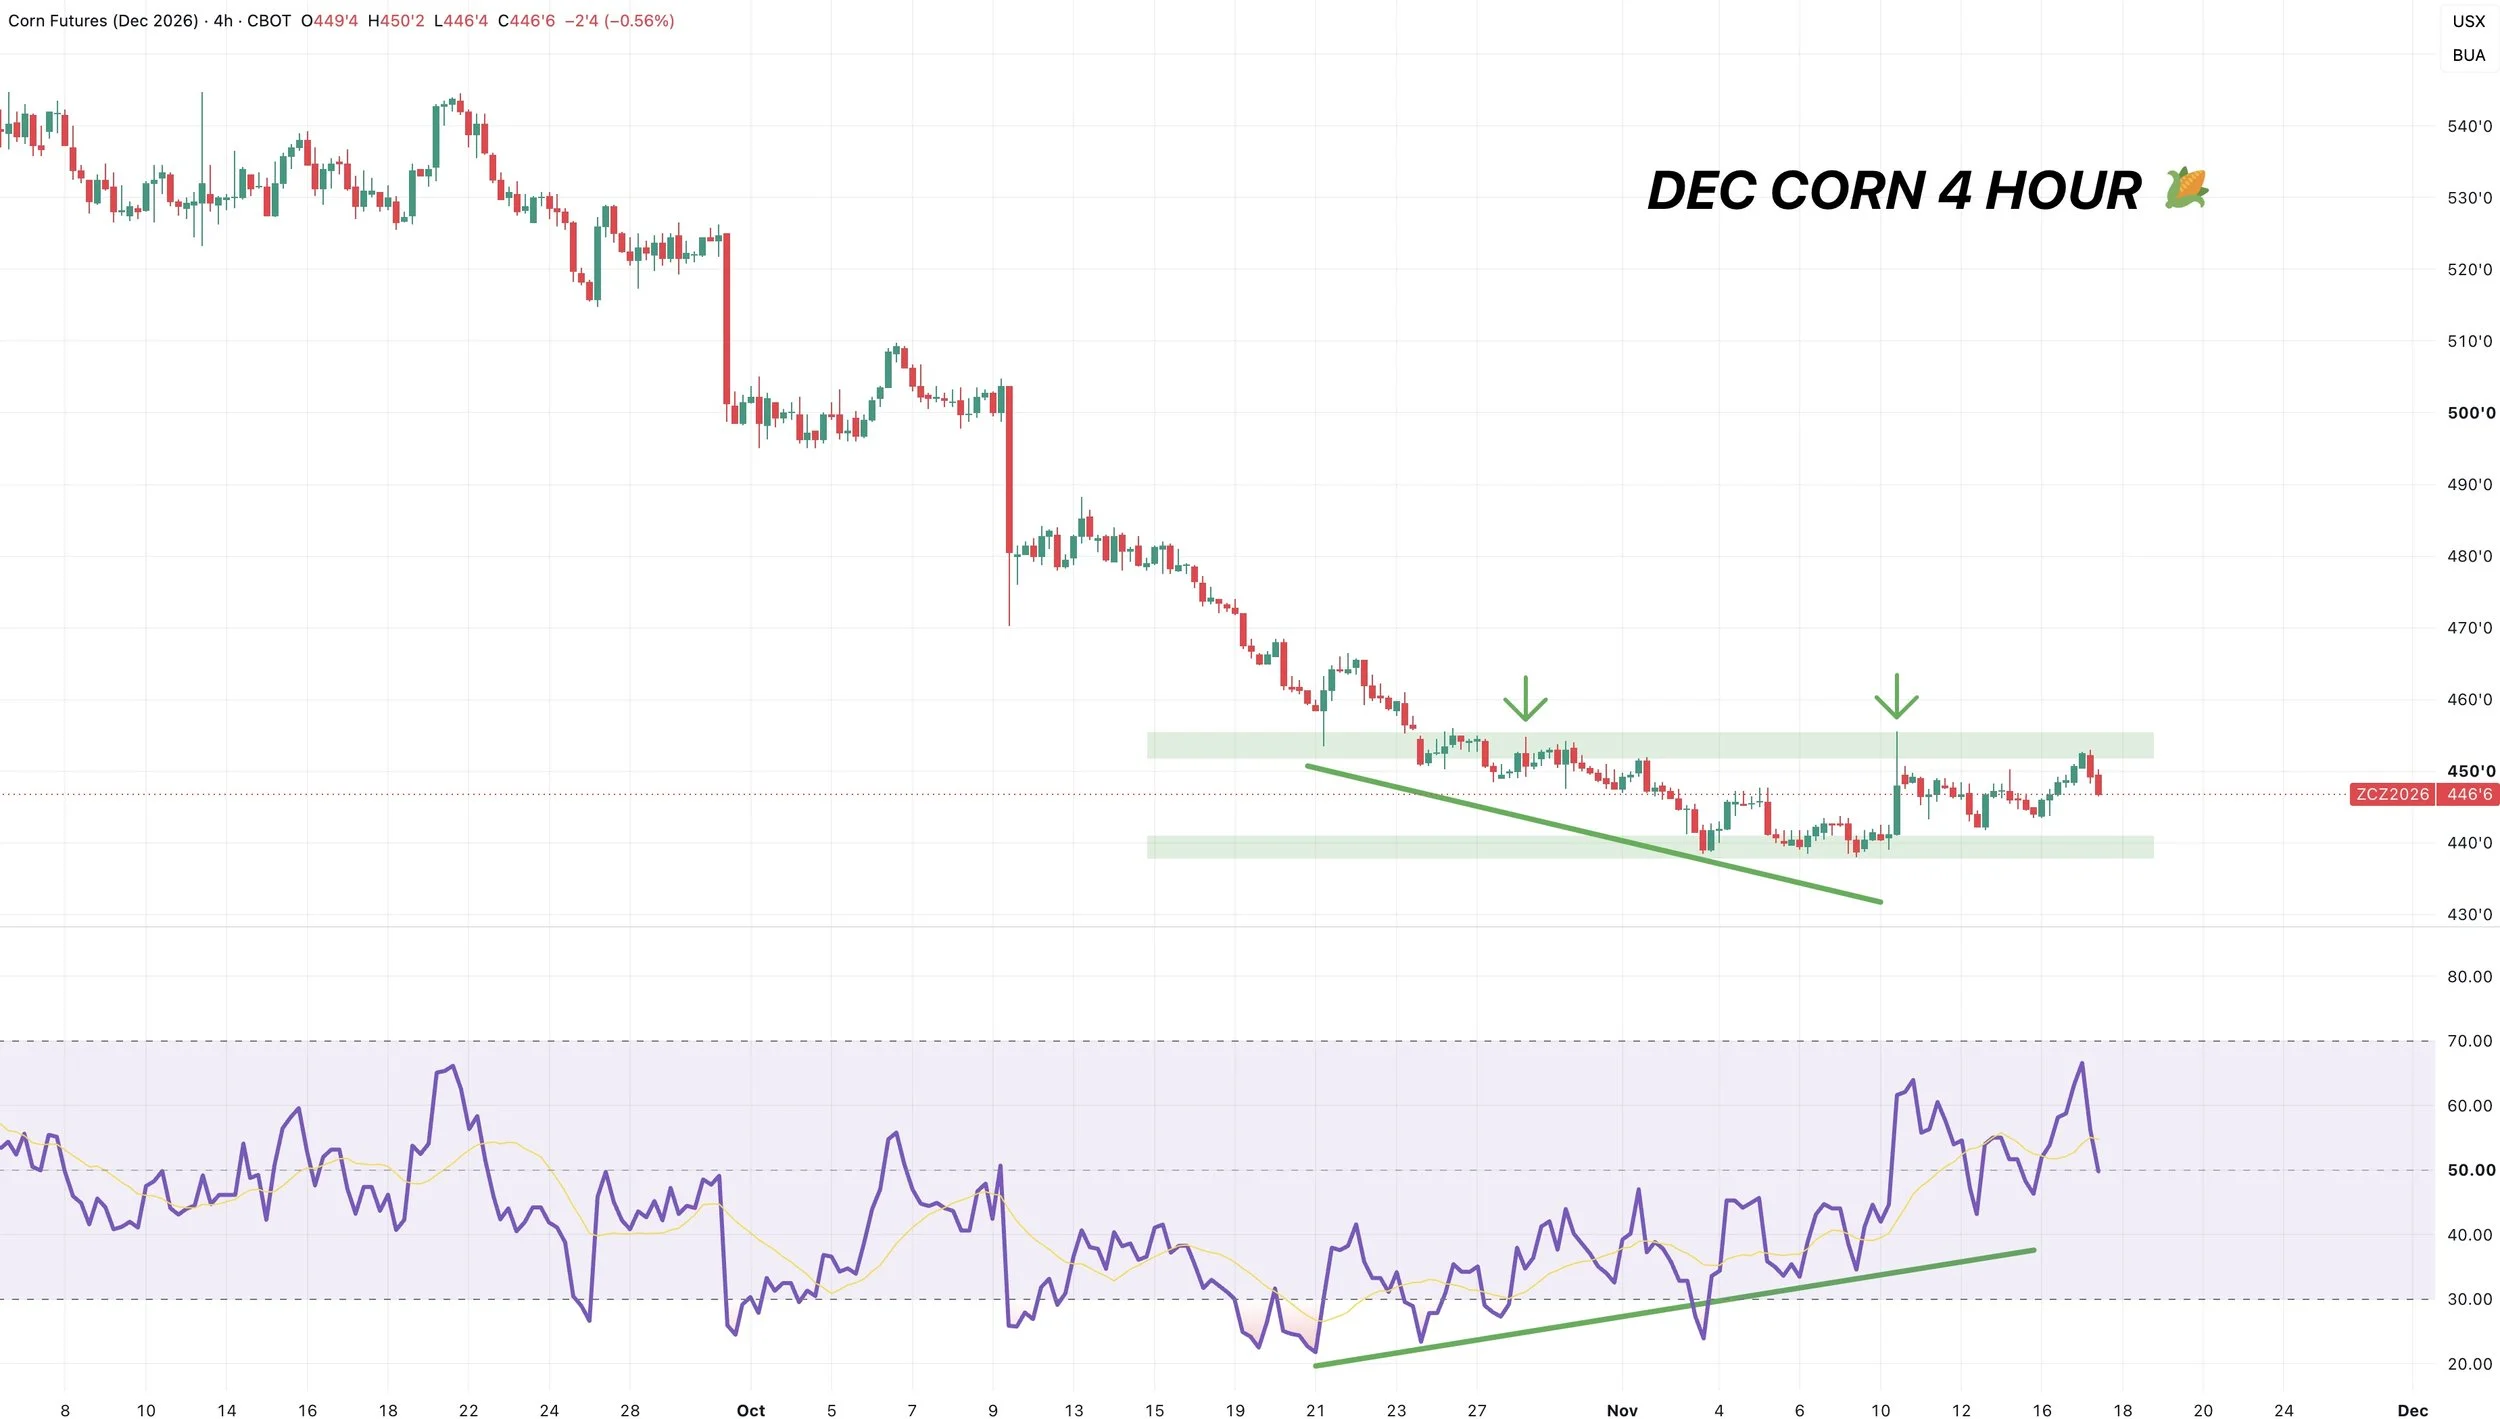
We just printed bullish divergence on the RSI.
Prices were grinding lower. The RSI failed to follow prices lower. A sign of sellers getting tired.
The last time we saw this was those June lows.
Nothing is ever a guaranteed bottom. But this is the best sign of life you have had yet.
RSI divergence has actually marked plenty of turning points for this market this year.
Bearish divergence marked the March and May highs. While bullish divergence marked the June lows.
MACD:
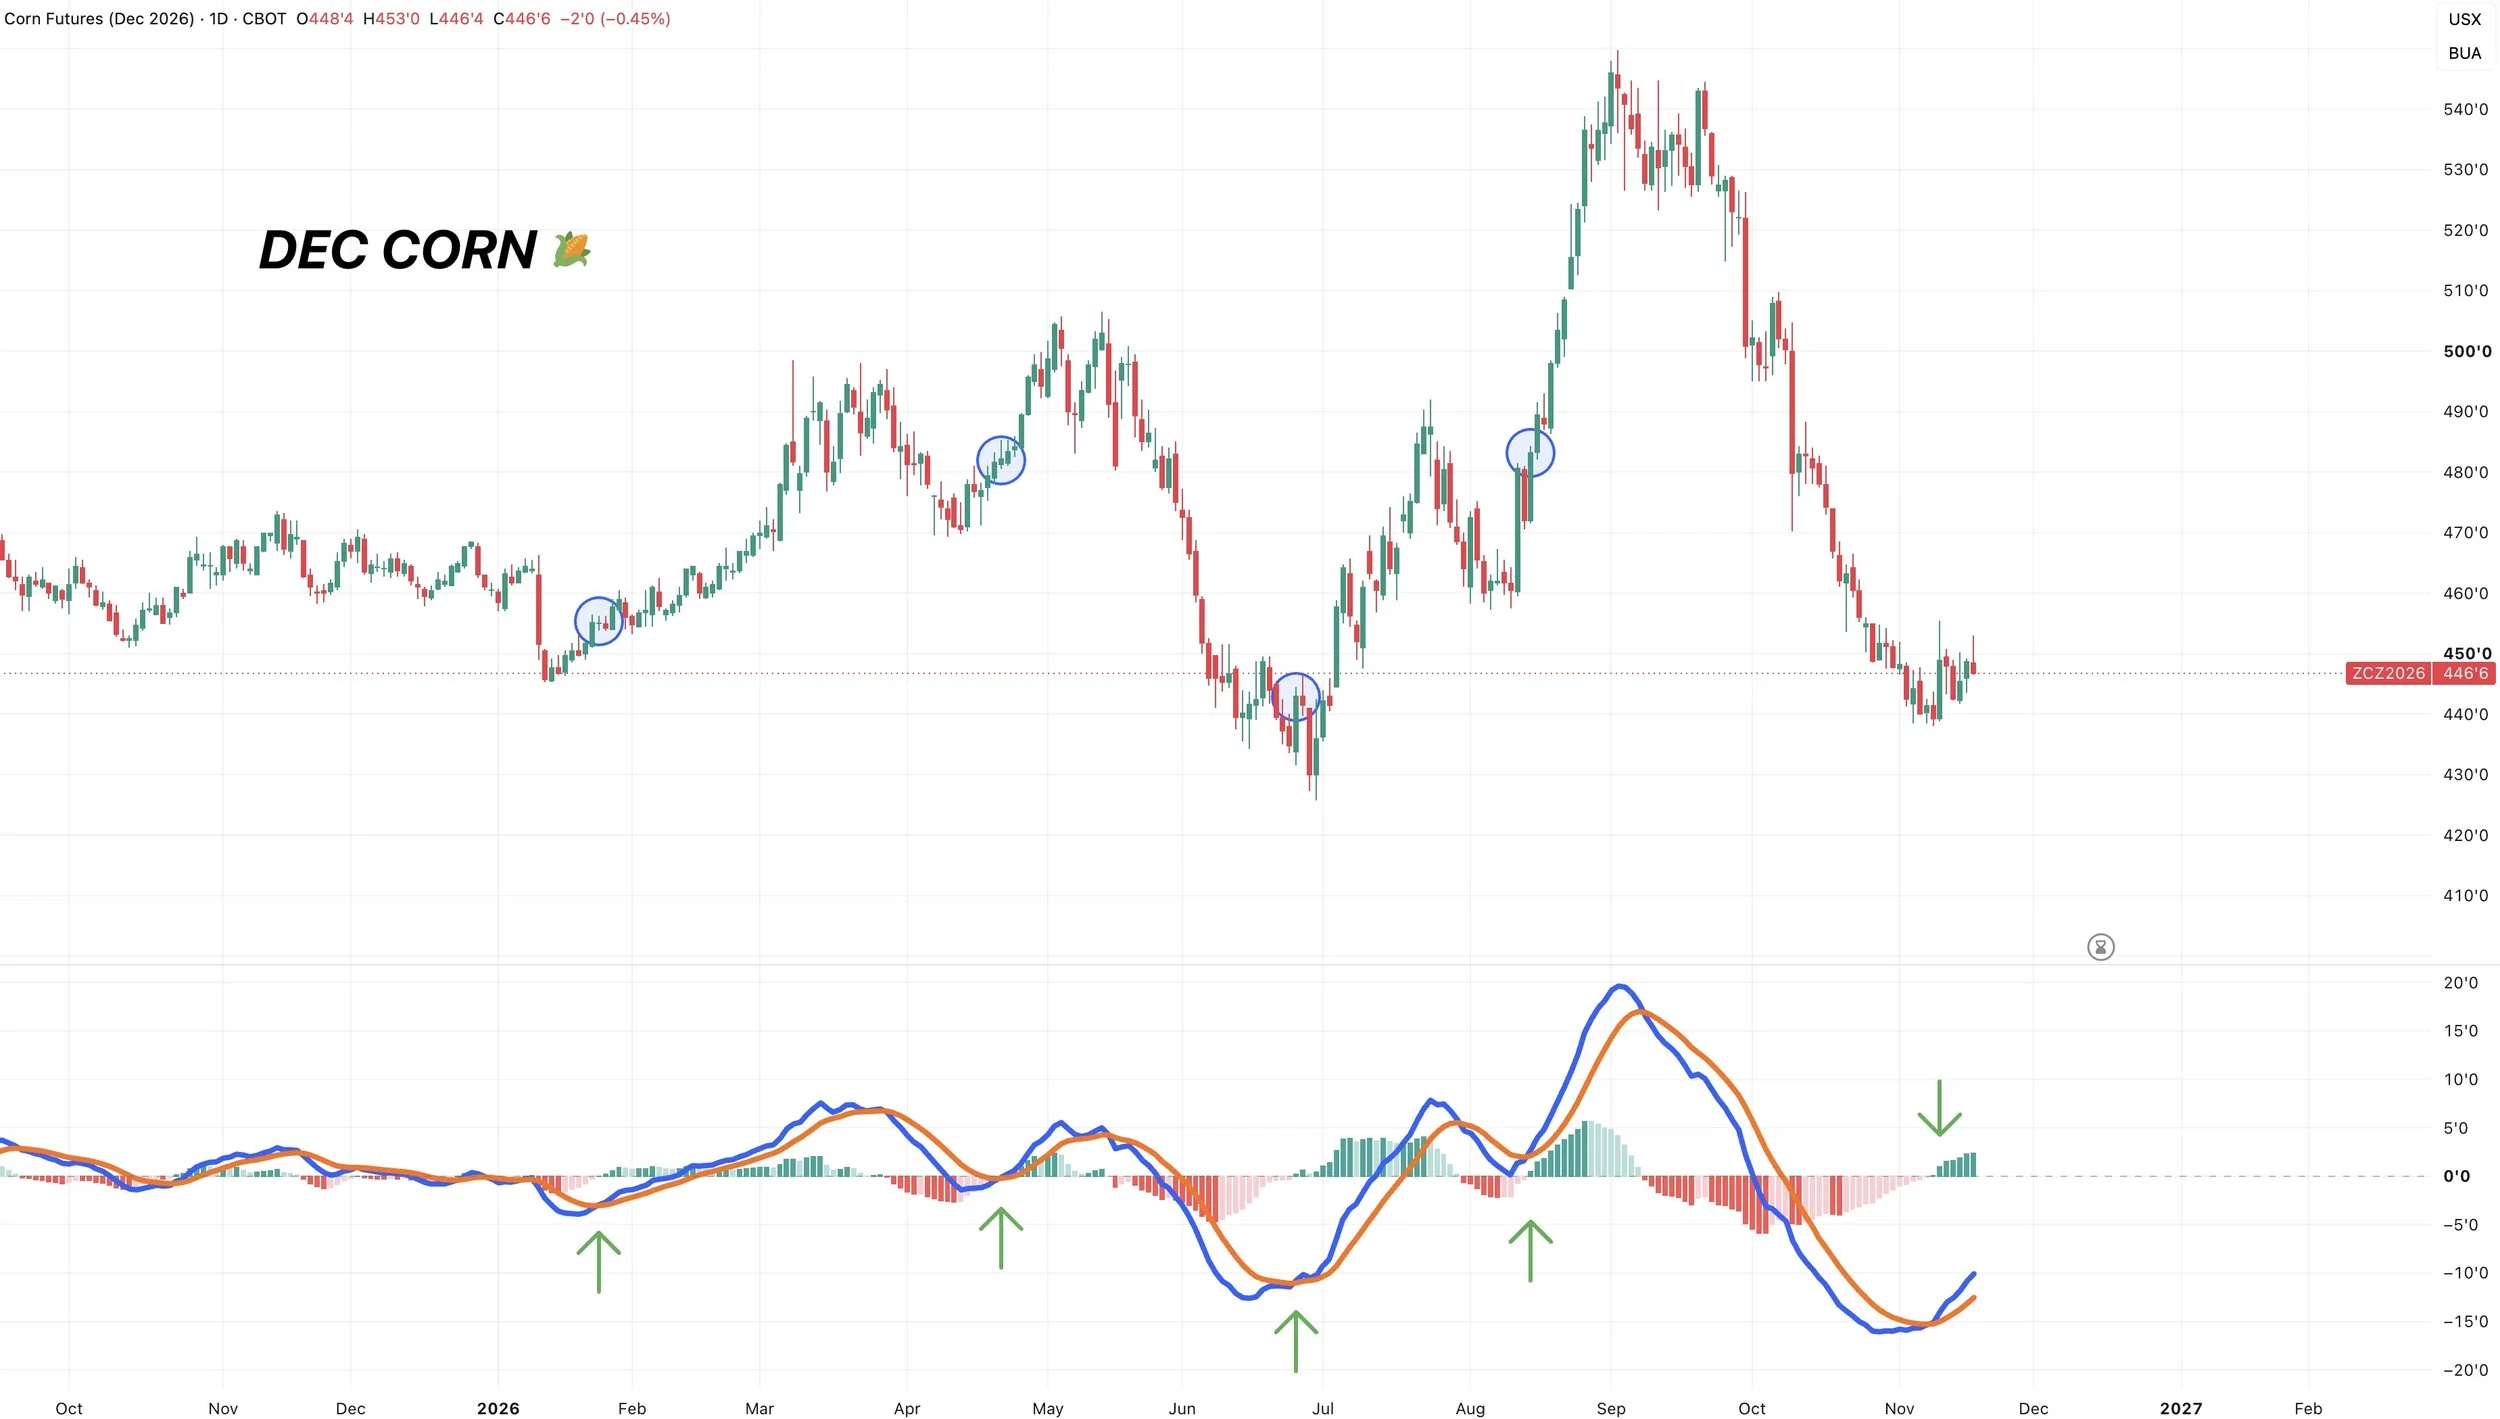
We also just had the MACD cross bullish last week.
It's only crossed bullish 4 times this year.
So far.. each one has at least resulted in a bounce if not a sizeable rally.
If you notice, this corn market has rarely just traded sideways this year. All year long we've either been trending higher or trending lower.
It's been a momentum market.
So the MACD has been pretty accurate given it signals where momentum is.
Bollinger Bands:
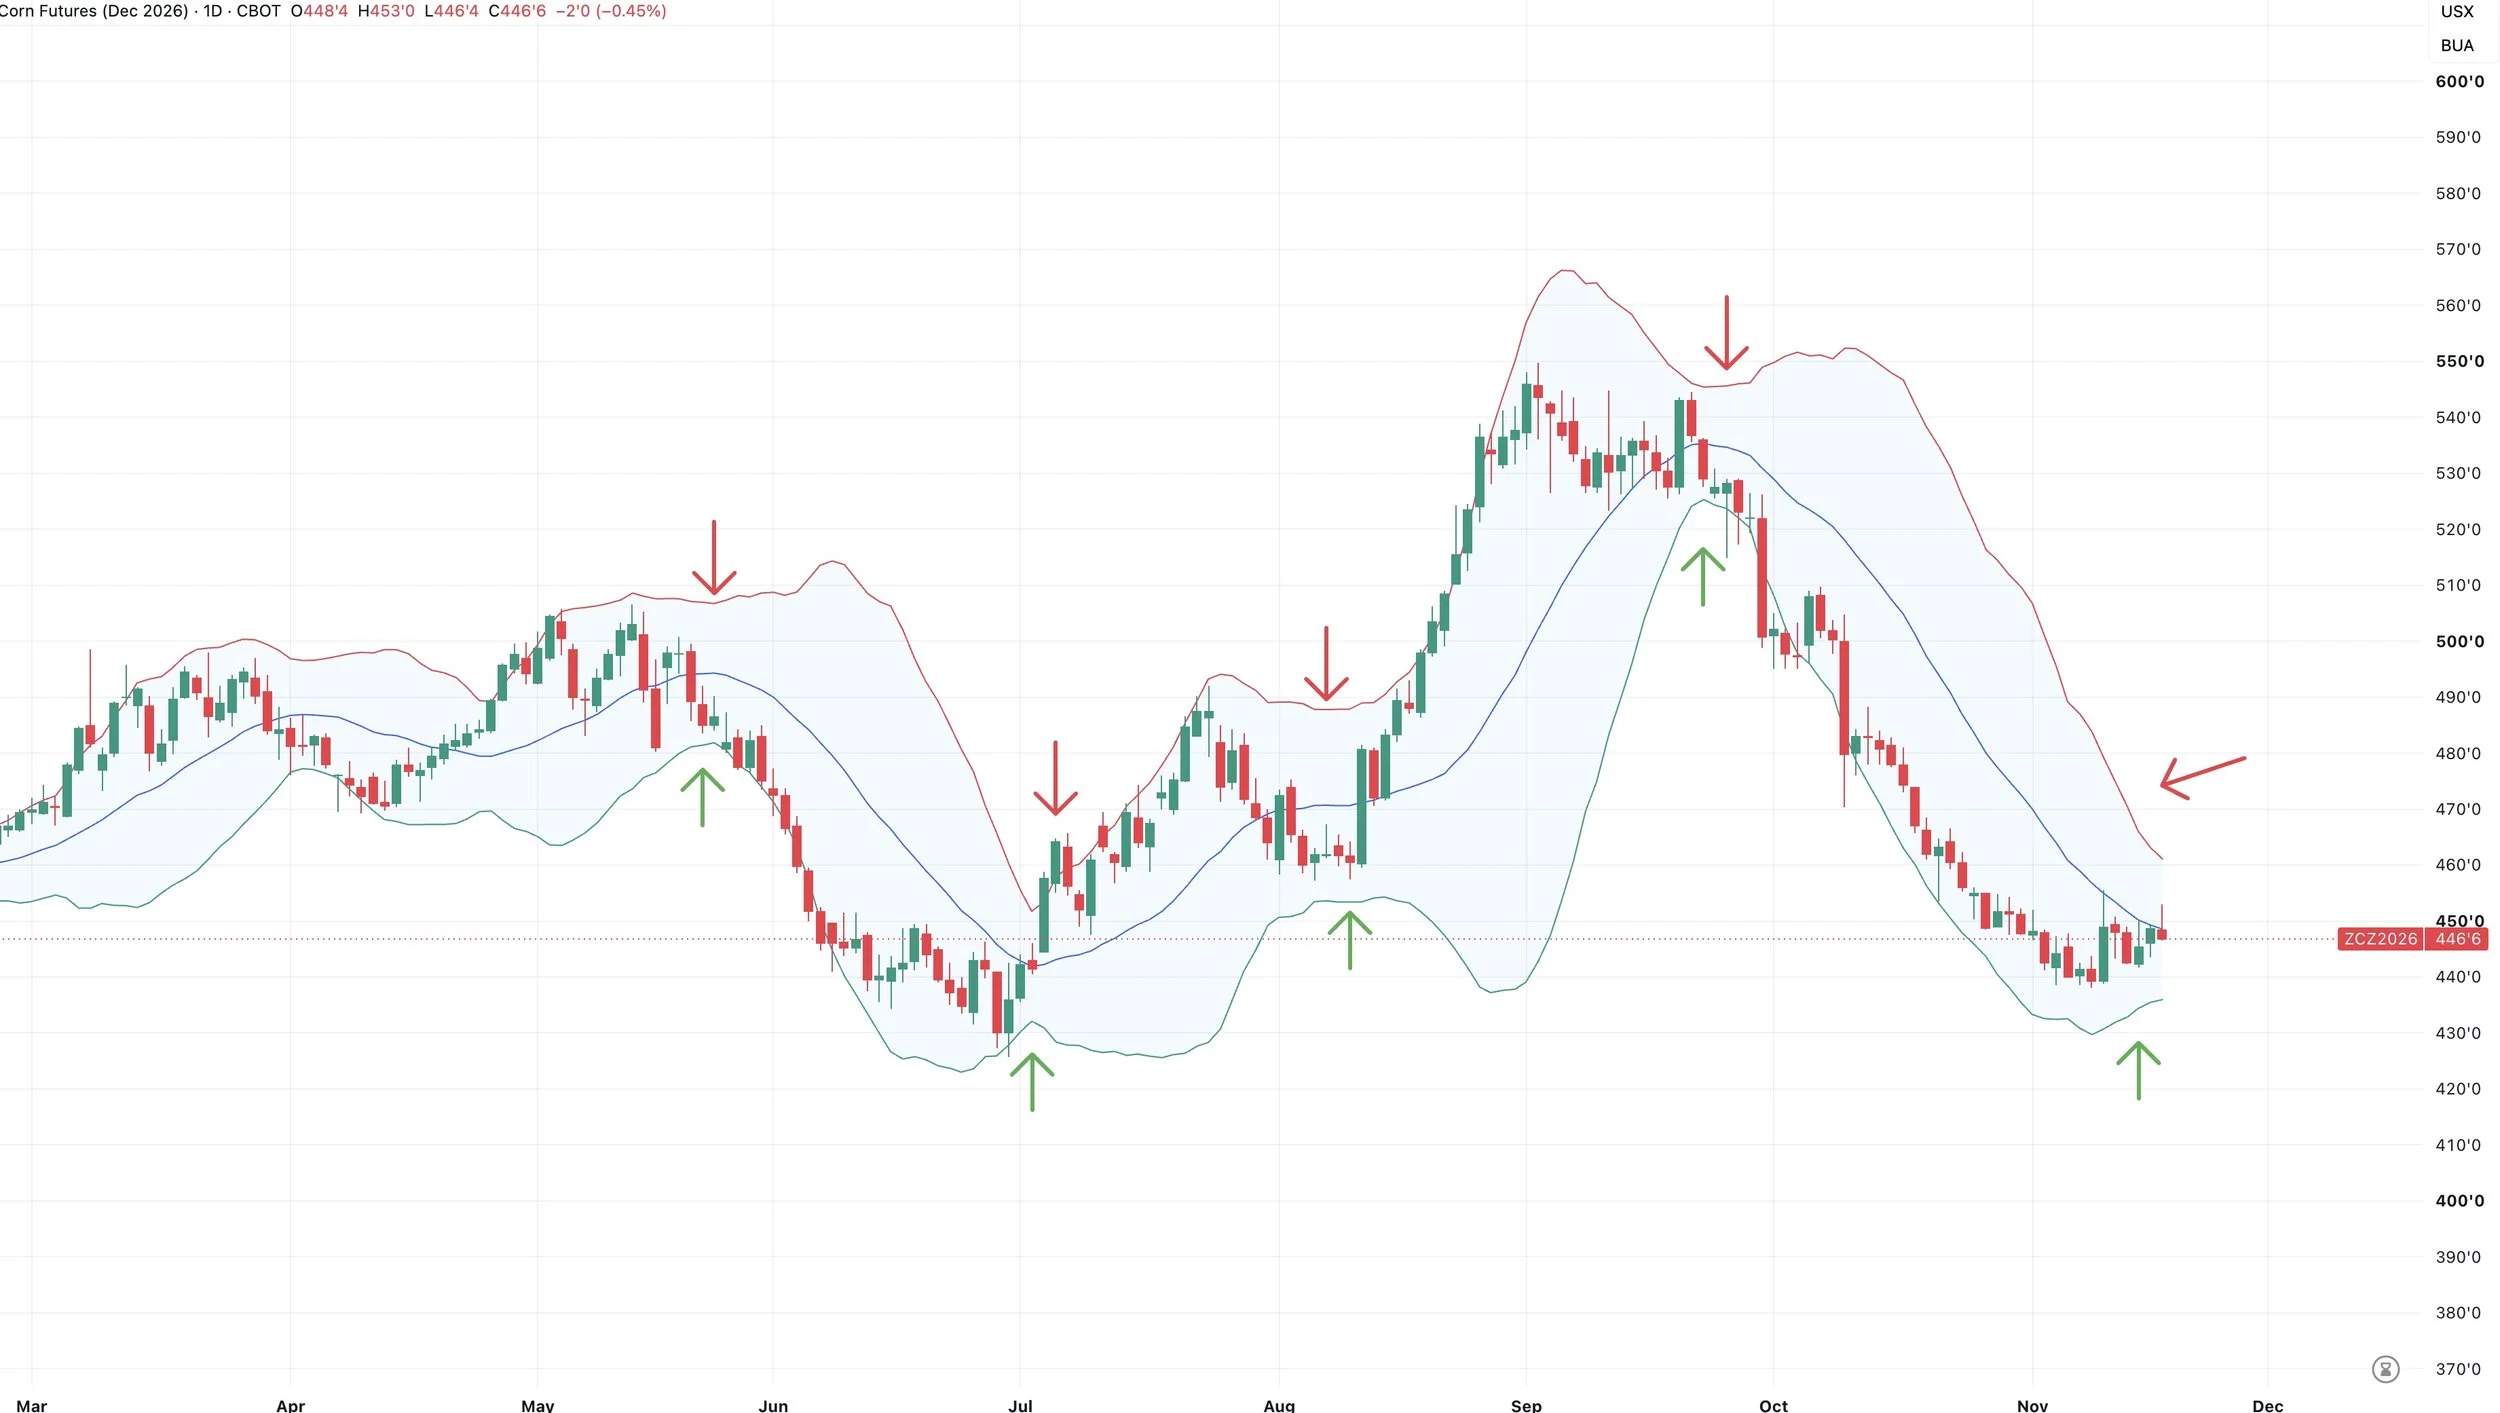
I talked about these bands last week.
When they tighten and squeeze together, it signals a larger move is brewing.
Then on big moves, they expand.
We have started seeing them squeeze together for the first time since before that October sell off.
As the bottom band has finally started to curl higher while the top one also moves lower.
When they squeeze, it tells us volatility is declining. Period of low volatility set the stage for bigger moves.
We saw the bands squeeze before the July and August rally, and then again before the big sell off.
The bands do not tell you the direction, but given I think we are undervalued. I would say higher.
4-Hour Chart: Resistance & Range Bound
Corn is finally stablizing for the first time in months.
But we need to break above those USDA day highs to get confirmation we are ready for the next leg higher.
As right now, we are essentially trapped in a sideways range. As we are still inside the range from the USDA report.
First Potential Target: March Corn
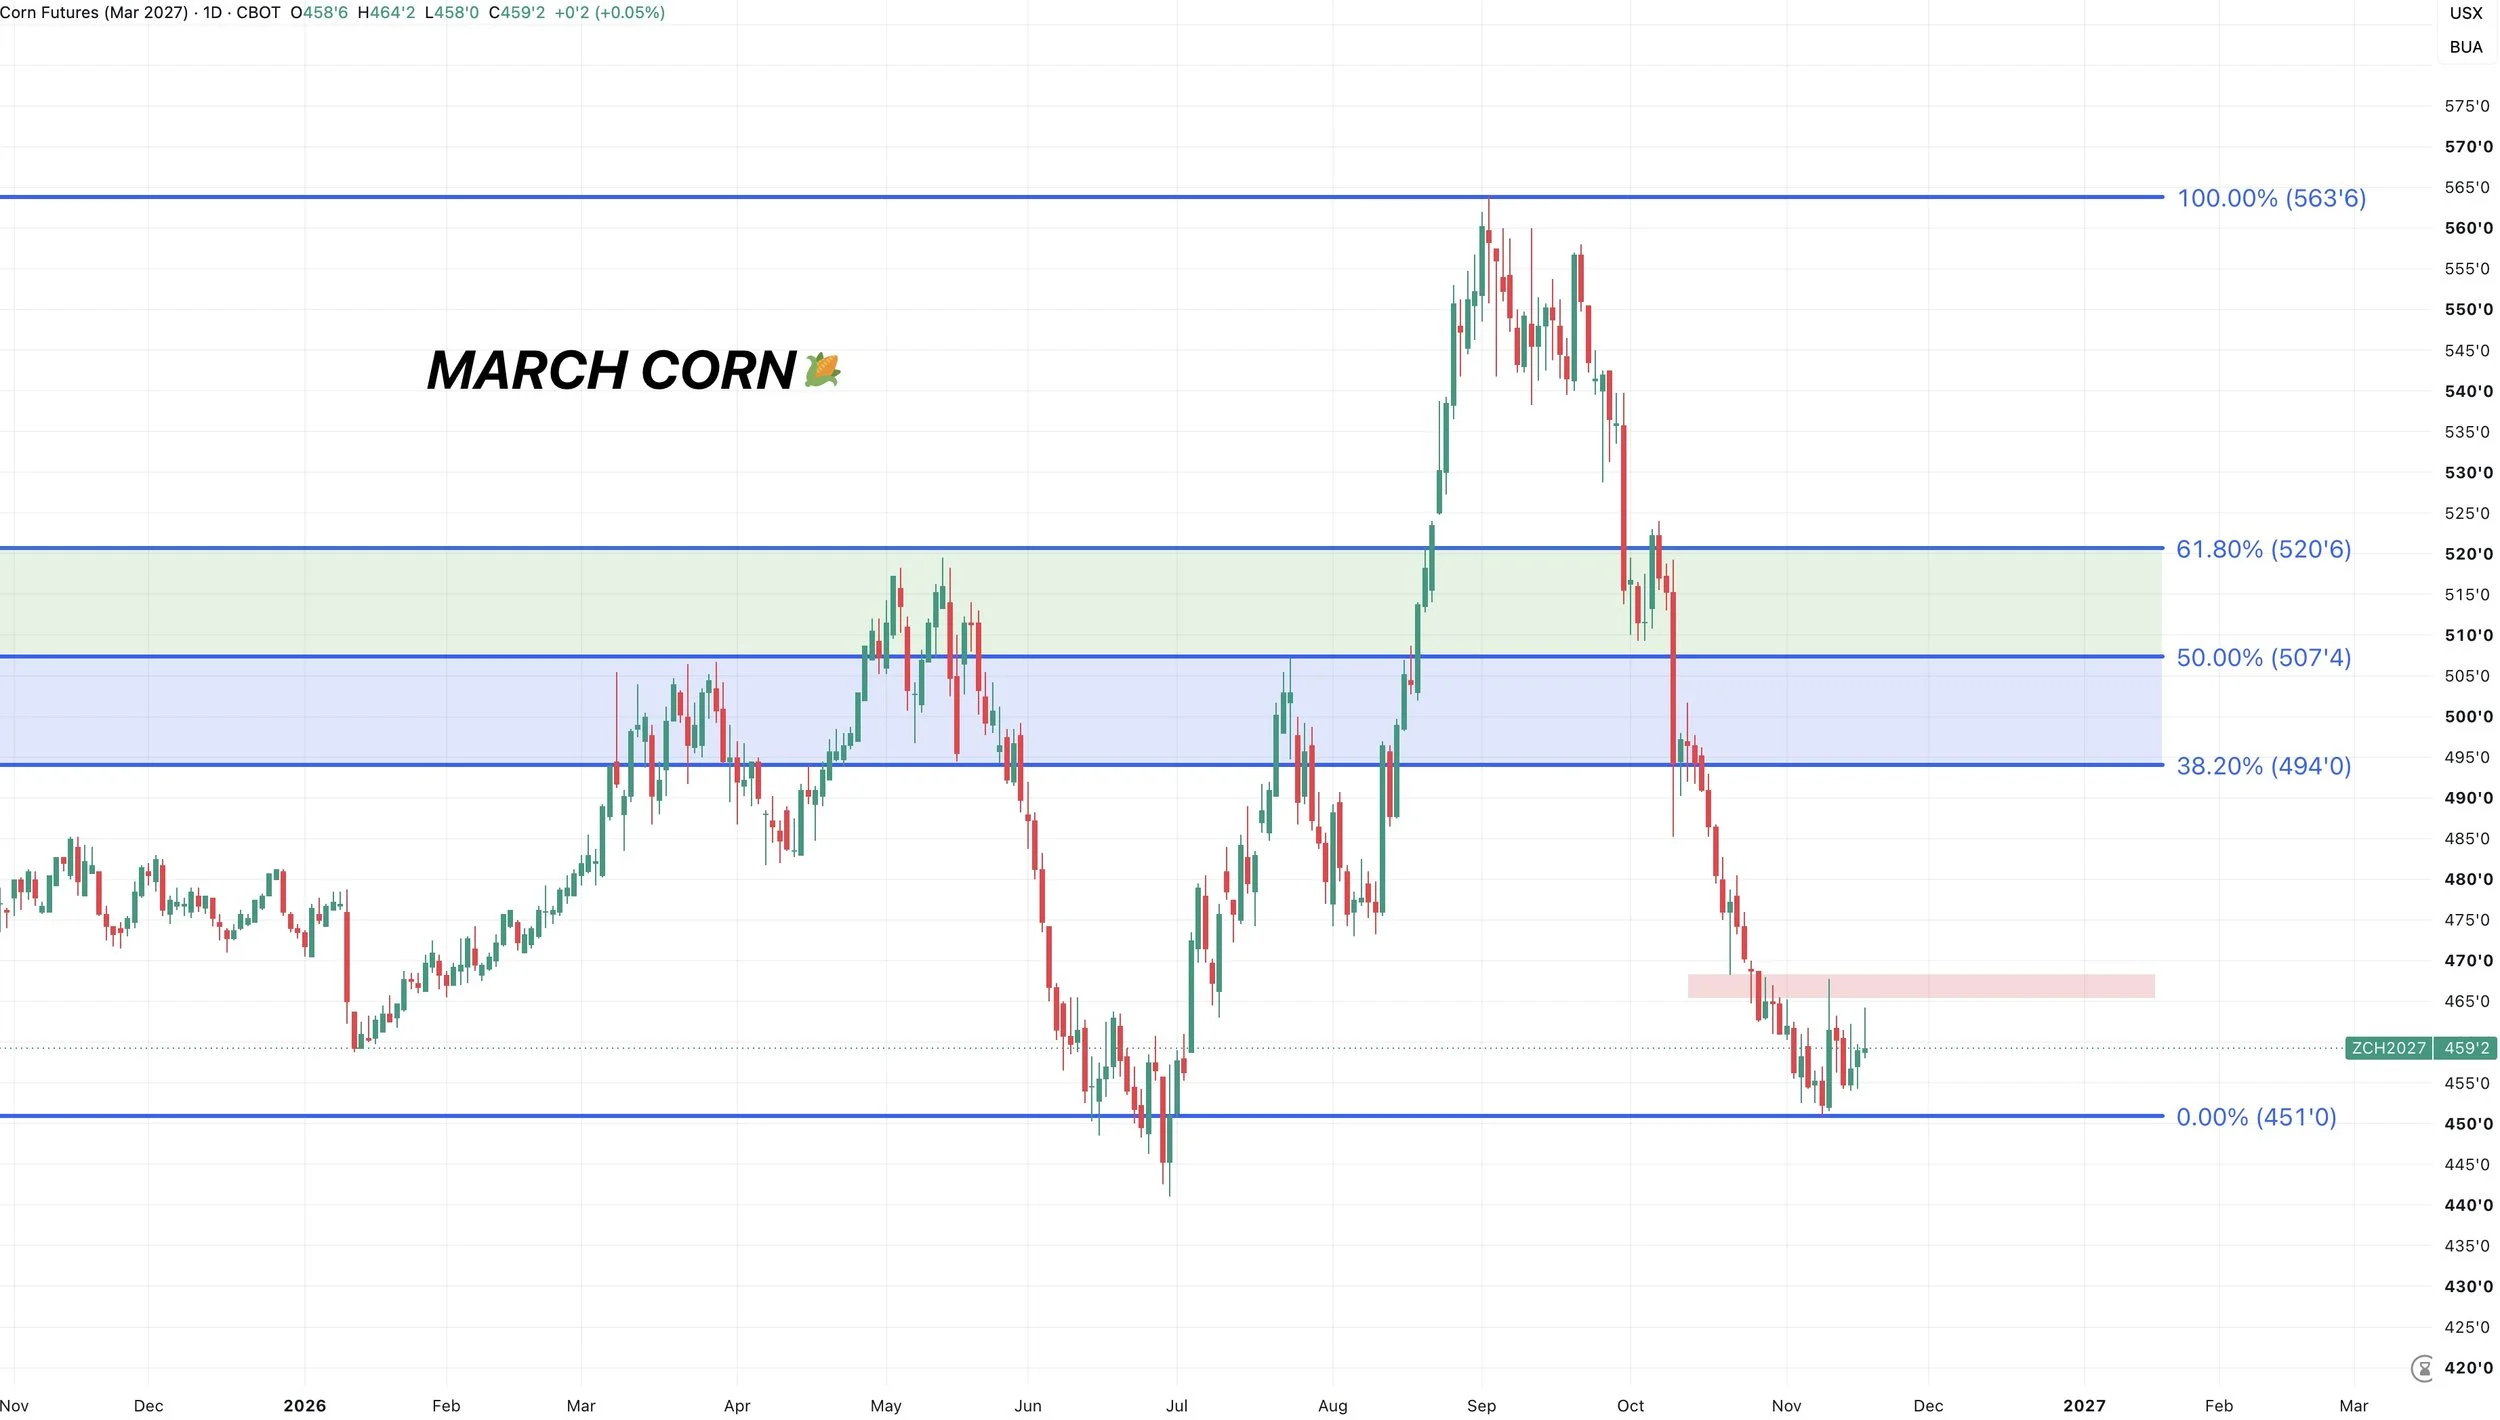
We want to be as patient as possible in corn.
Targets are subject to change as we watch the chart unfold.
If we have found a bottom, the first real point of interest I have my eyes on for now is the $4.94 to $5.07 range.
Which is 38.2-50% of the entire sell off and the highs from spring.
Soybeans
Fundamentals:
Like in corn, not much new that we haven’t already covered in our last few updates. So it's more of the same.
The biggest thing is of course going to be Brazil.
Some areas of now been getting too much rain down South, which could be a problem. But so far the market doesn’t have any weather premium built into it.
But the question still remains, will they see any issues or not?
I can’t answer that. The seasonal outlook still calls for some extremes in the north and the south.
Wet down south and dry up north.
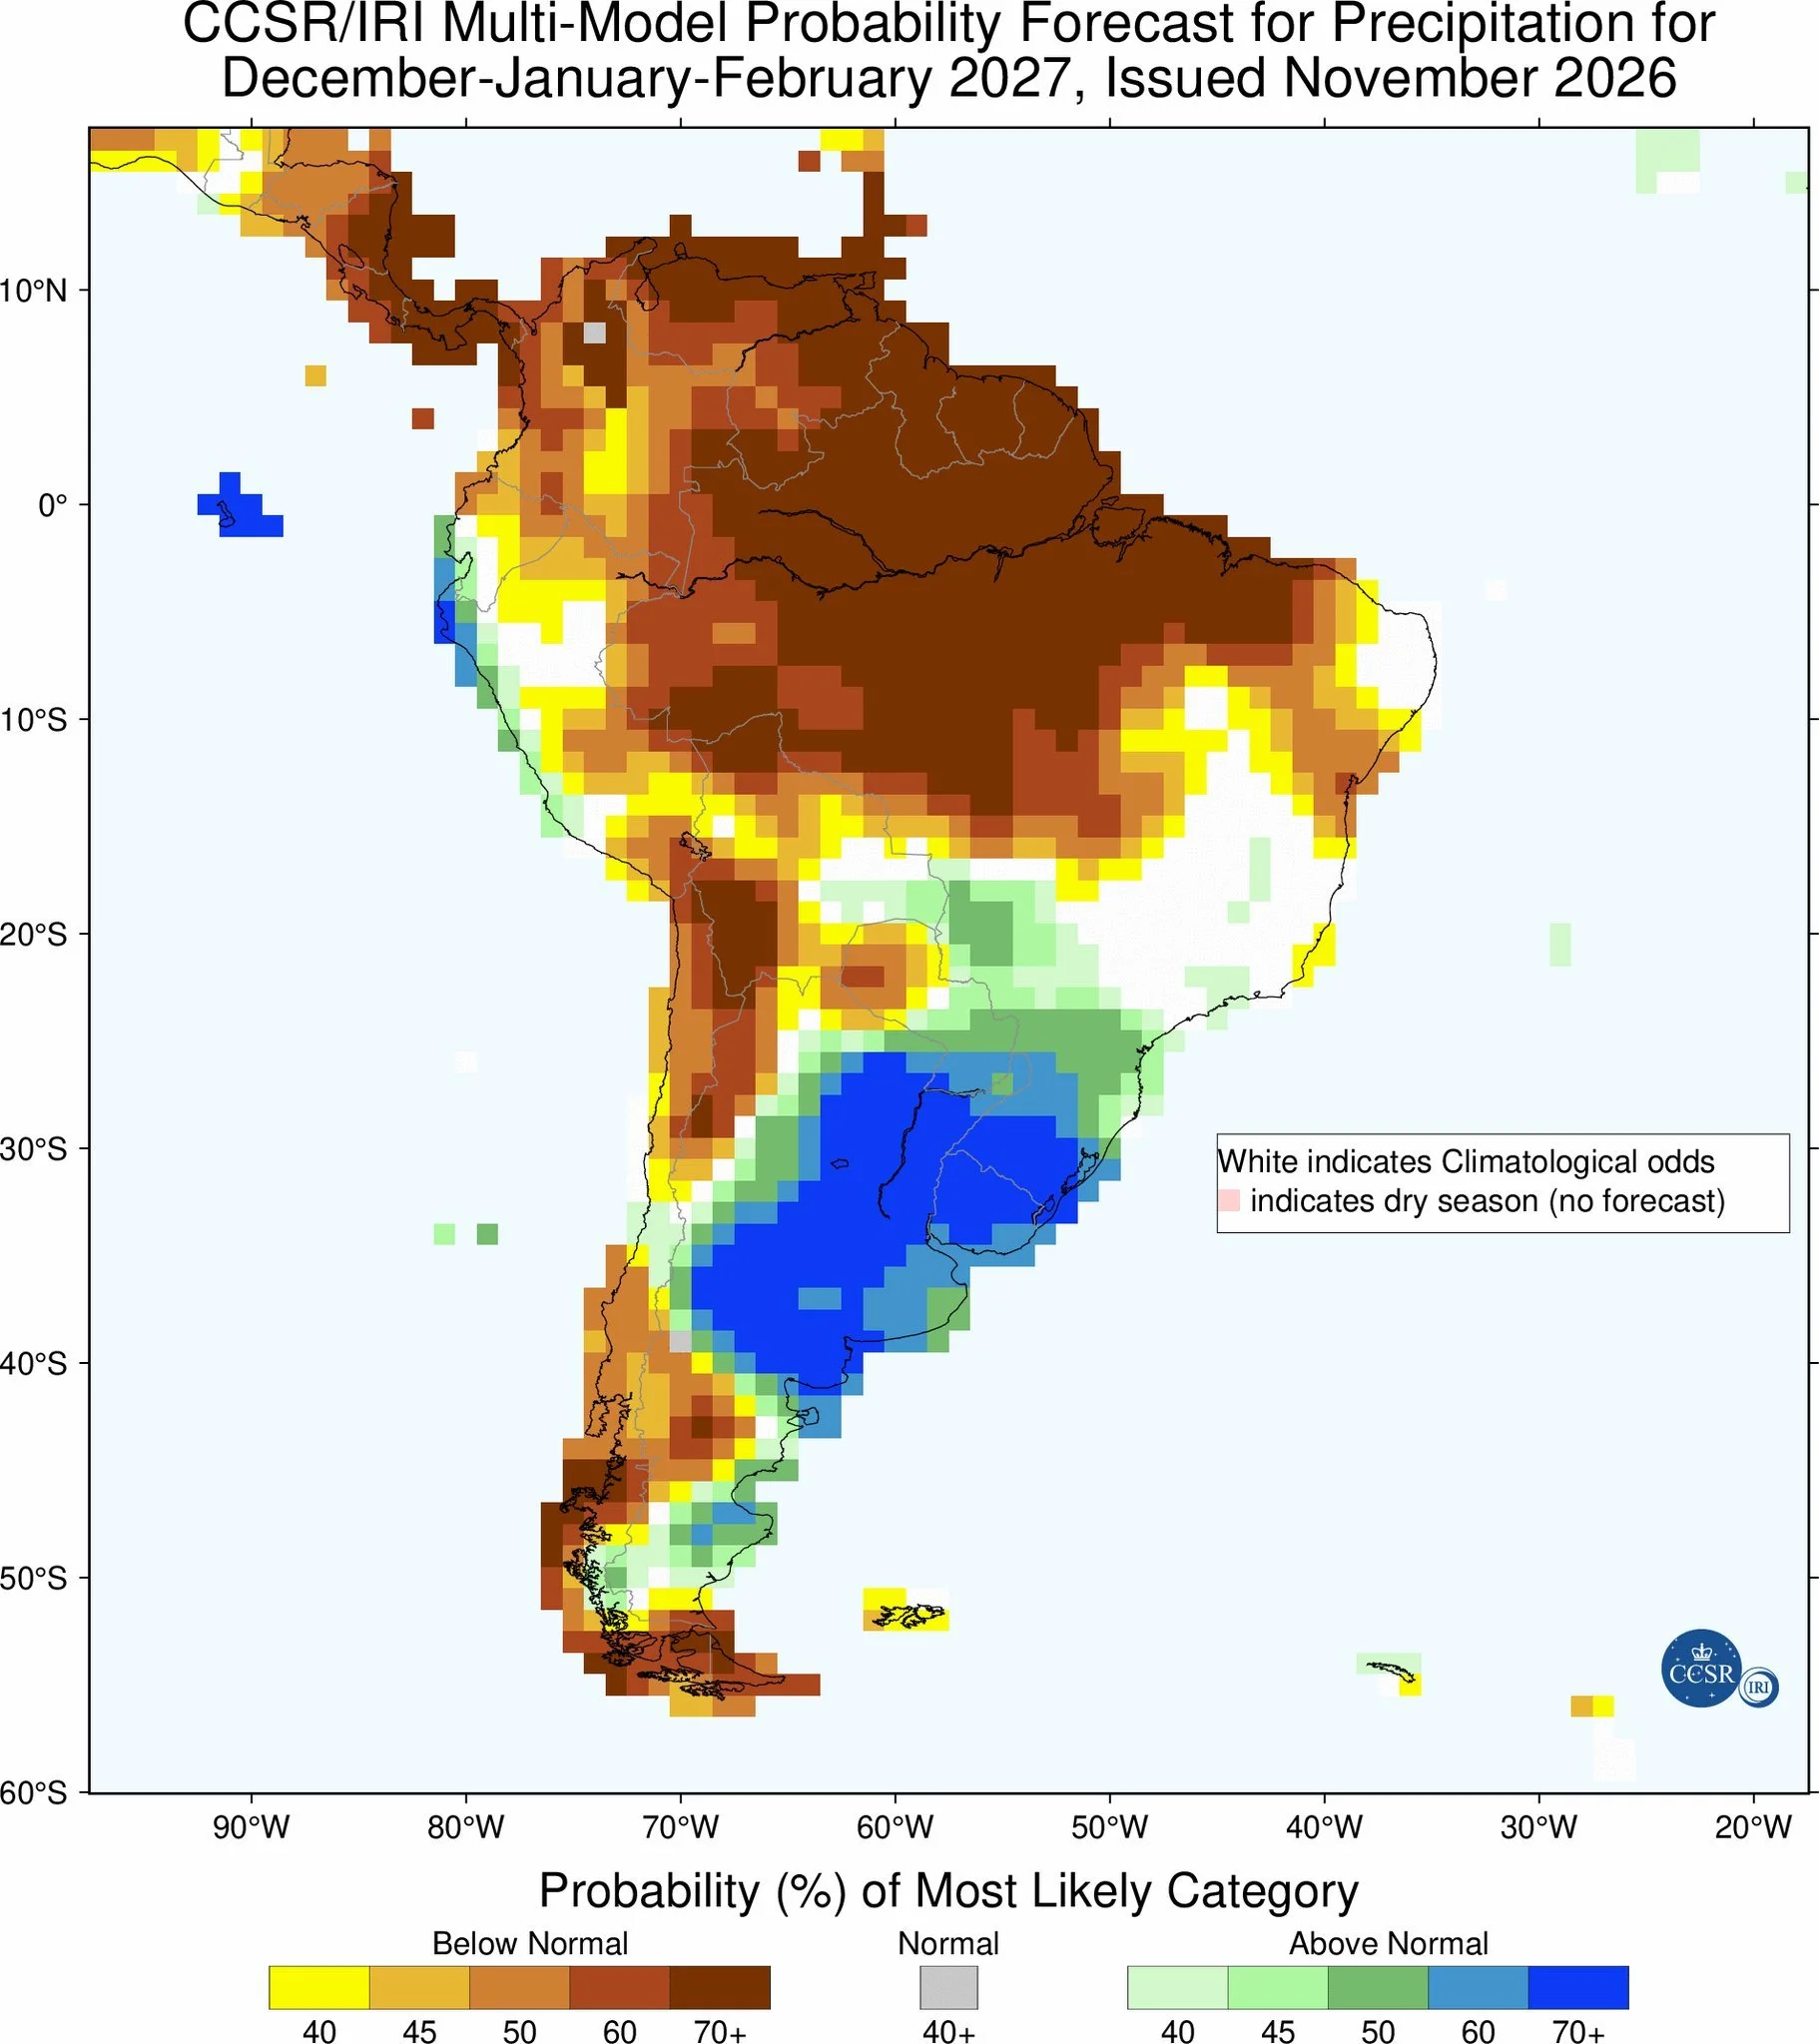
The only thing we do know is that the world cannot afford an issue in Brazil.
As we've talked about countless times, what do you think happens to the world balance sheet if Brazil is unable to perform?
We already have a record US and Brazil crop.
Yet this is not enough for the world balance sheet to grow.
Which is why Brazil's growing season is such a massive wild card.
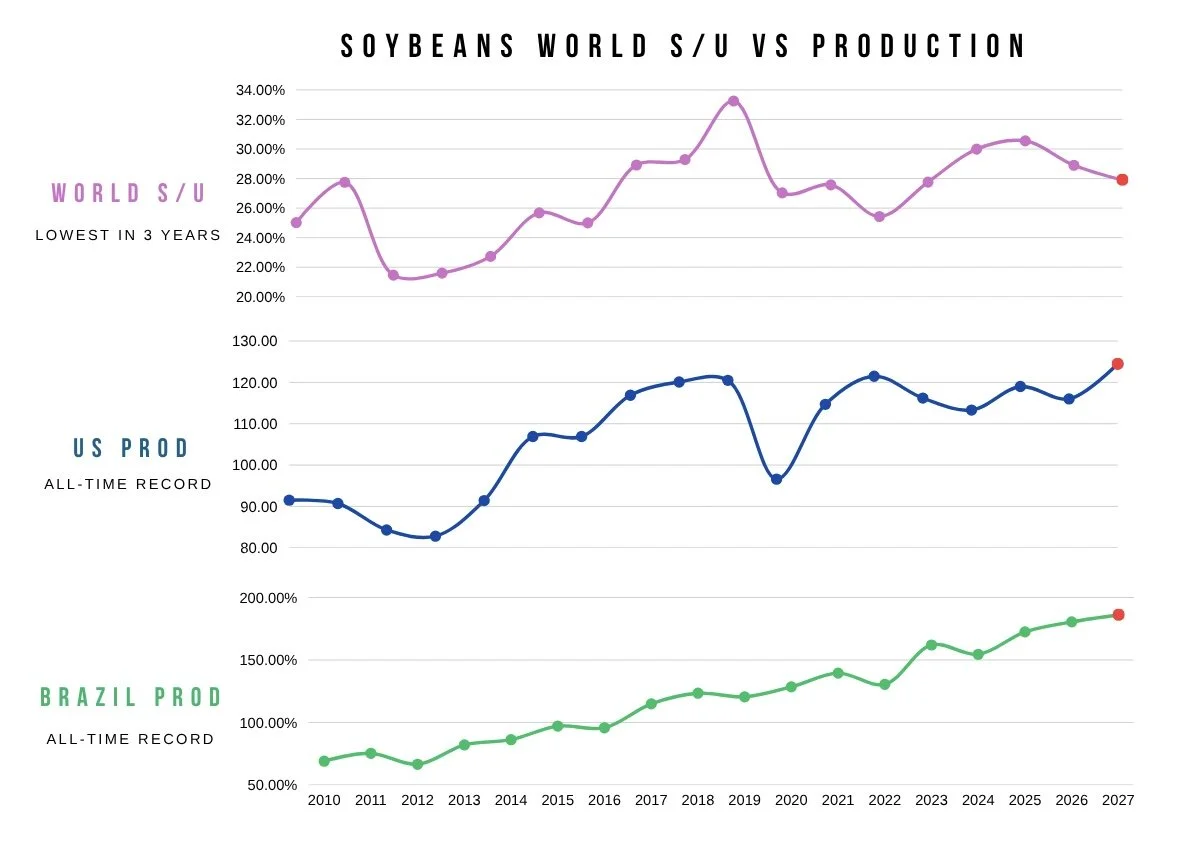
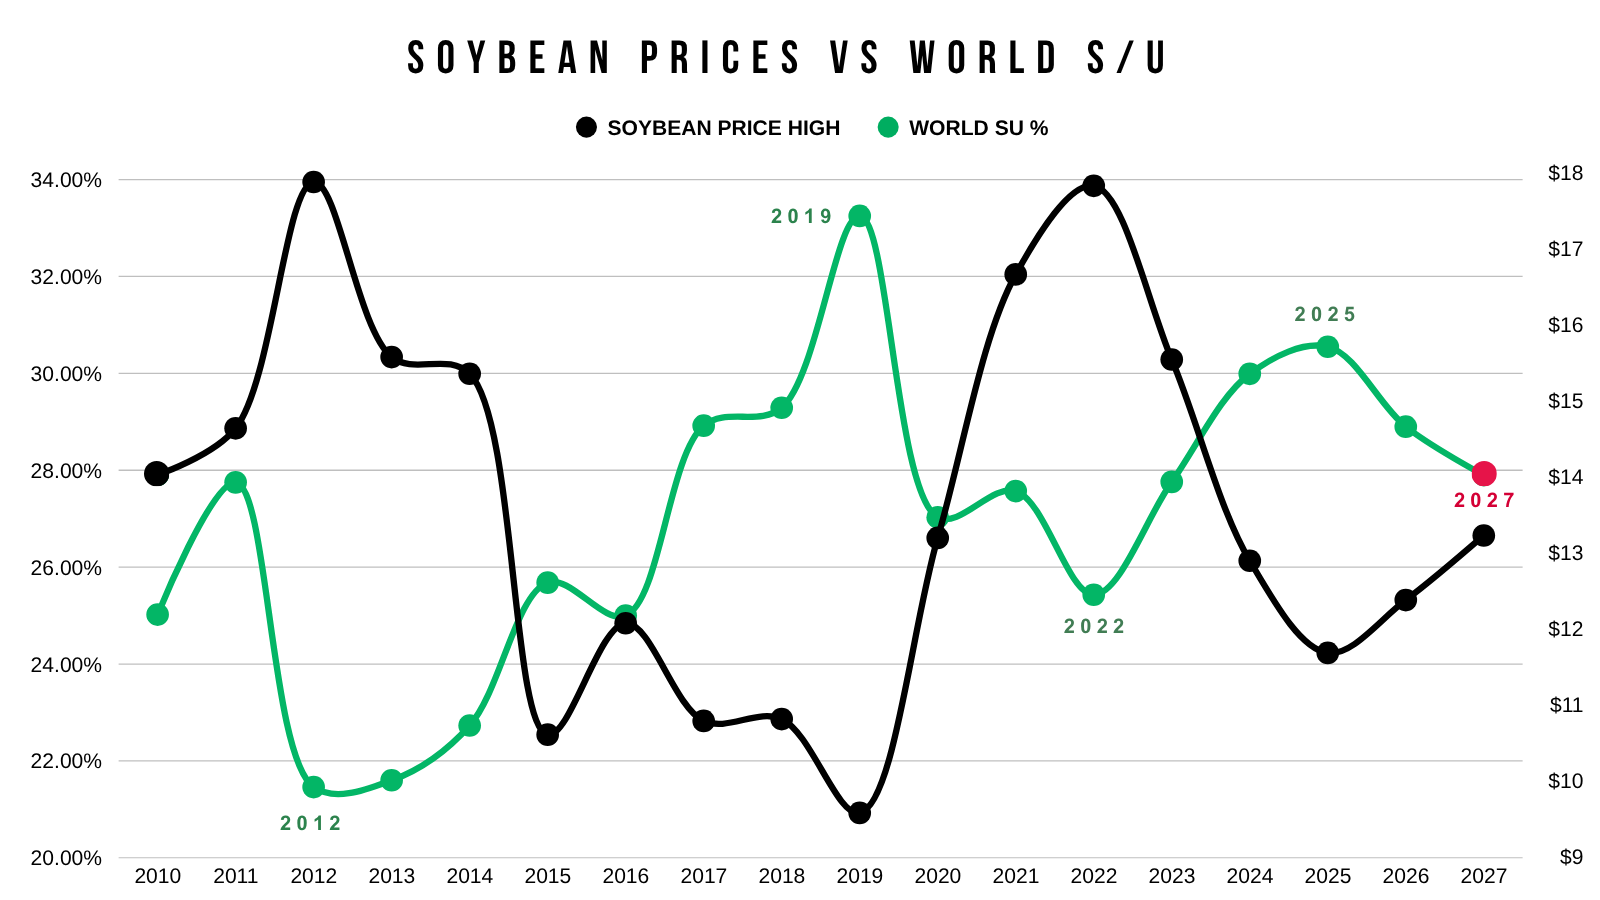
I have shown this chart a thousand times this year.
World stocks to use vs soybean prices.
You can’t ask for a more clear correlation between something.
If prices sucked, it's because the world had a loose balance sheet.
If prices were high, it's because the world had a tight balance sheet.
It's at 3-year lows. Thus prices are at 3-year highs.
Even with record production across the world.
As simple as it is, what happens if Brazil could put beans over $14 or below $12.
The next 2 months are going to be key.
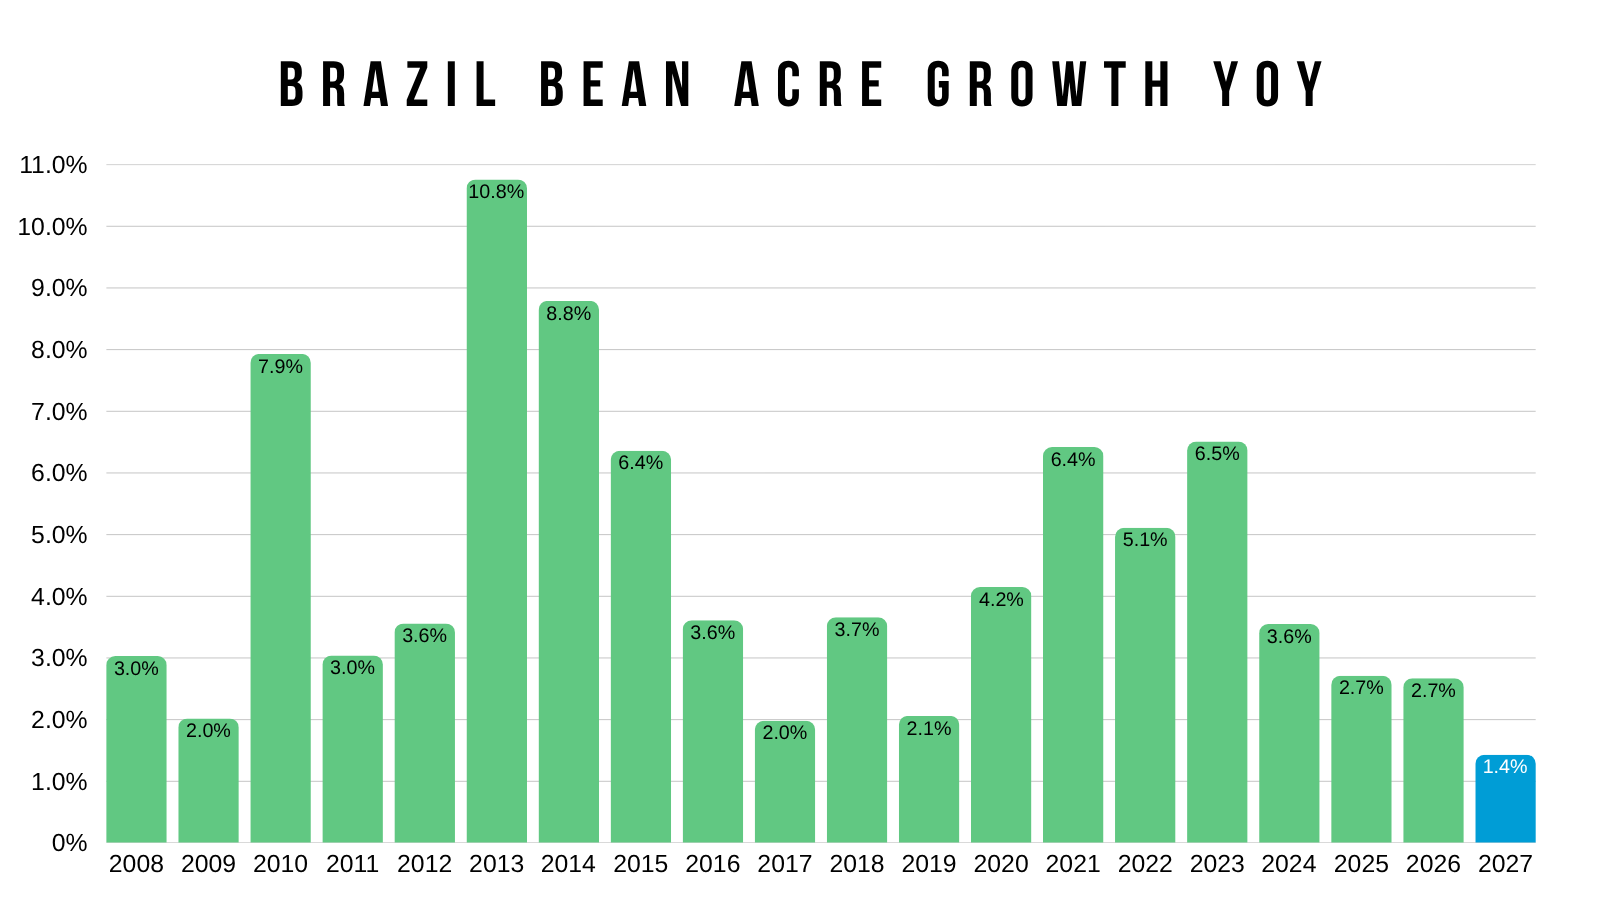
Let's also not forget that soybean acres down in Brazil are projected to see their smallest growth in at least the last 20 years according to CONAB.
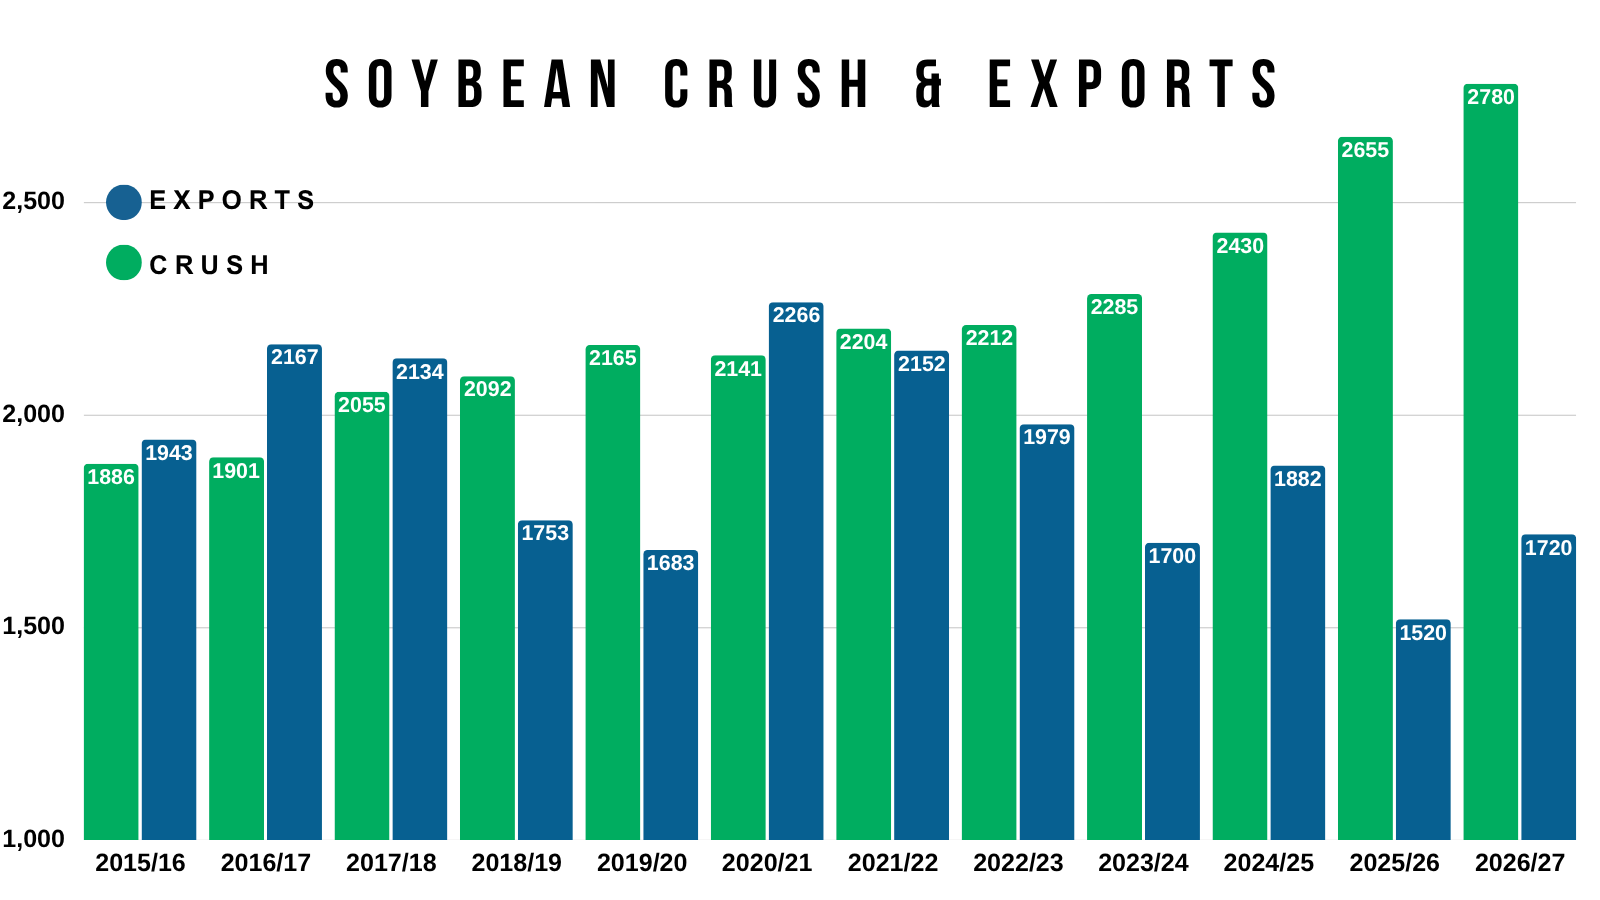
As for the US side of things, demand is still king in soybeans.
Crush is phenomenal. An all-time record.
At the same time, exports have improved dramatically.
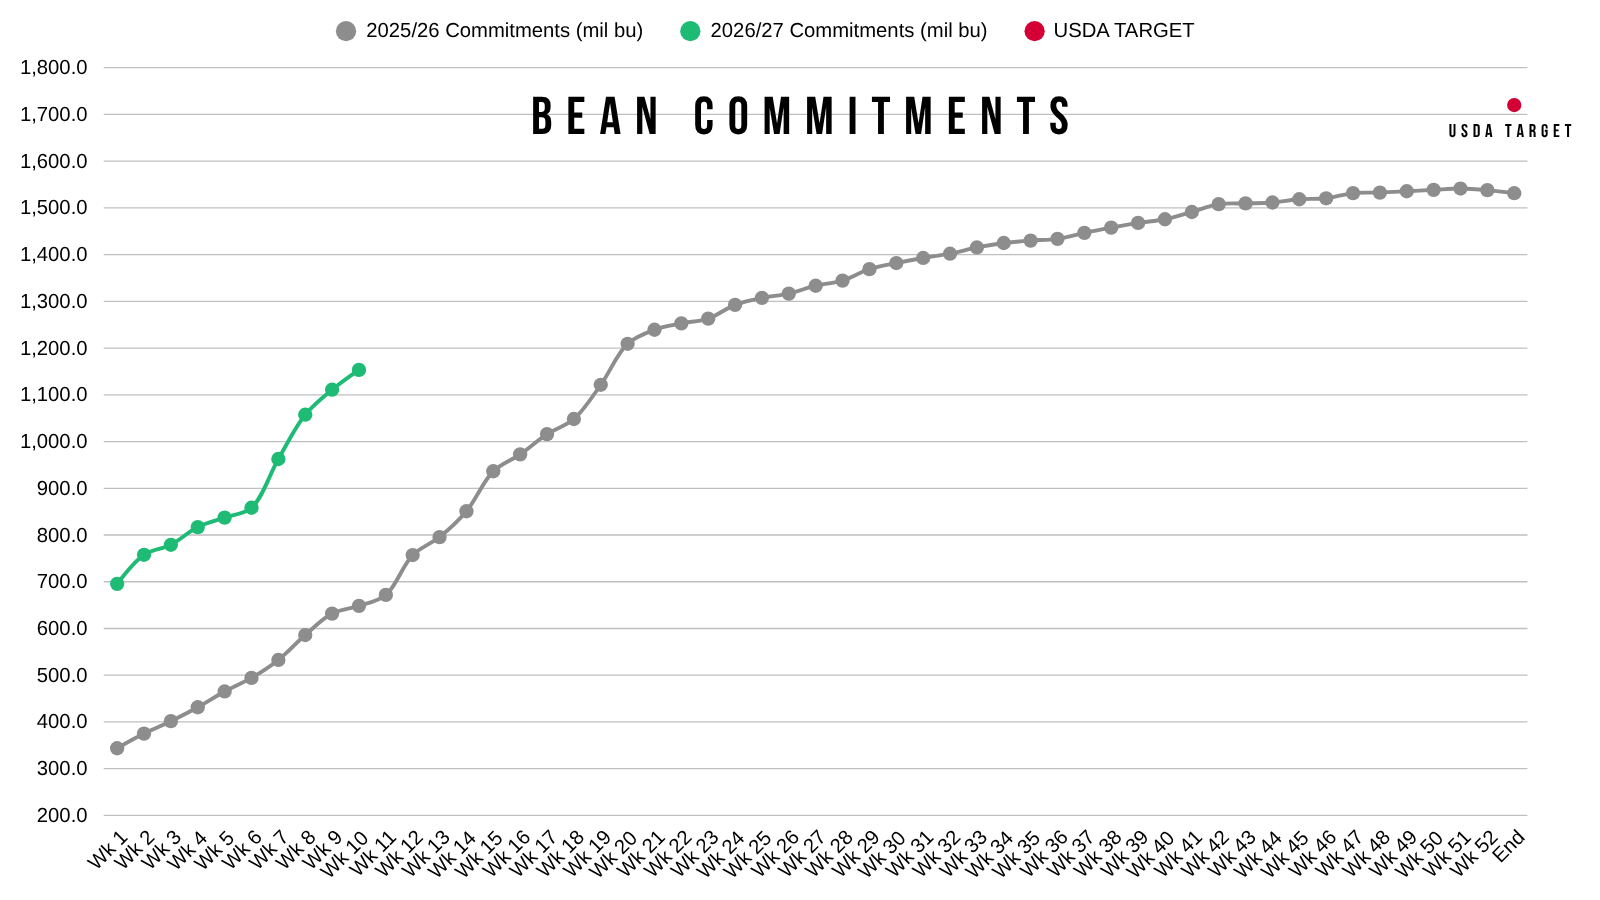
The USDA has them up +200 million bu vs last year. And that still might be too light.
Given we are running about +80% above last year when the USDA is only projecting a +14% increase as I mentioned.
Their number on the balance sheet probably needs to come up even further.
As I've said many times before..
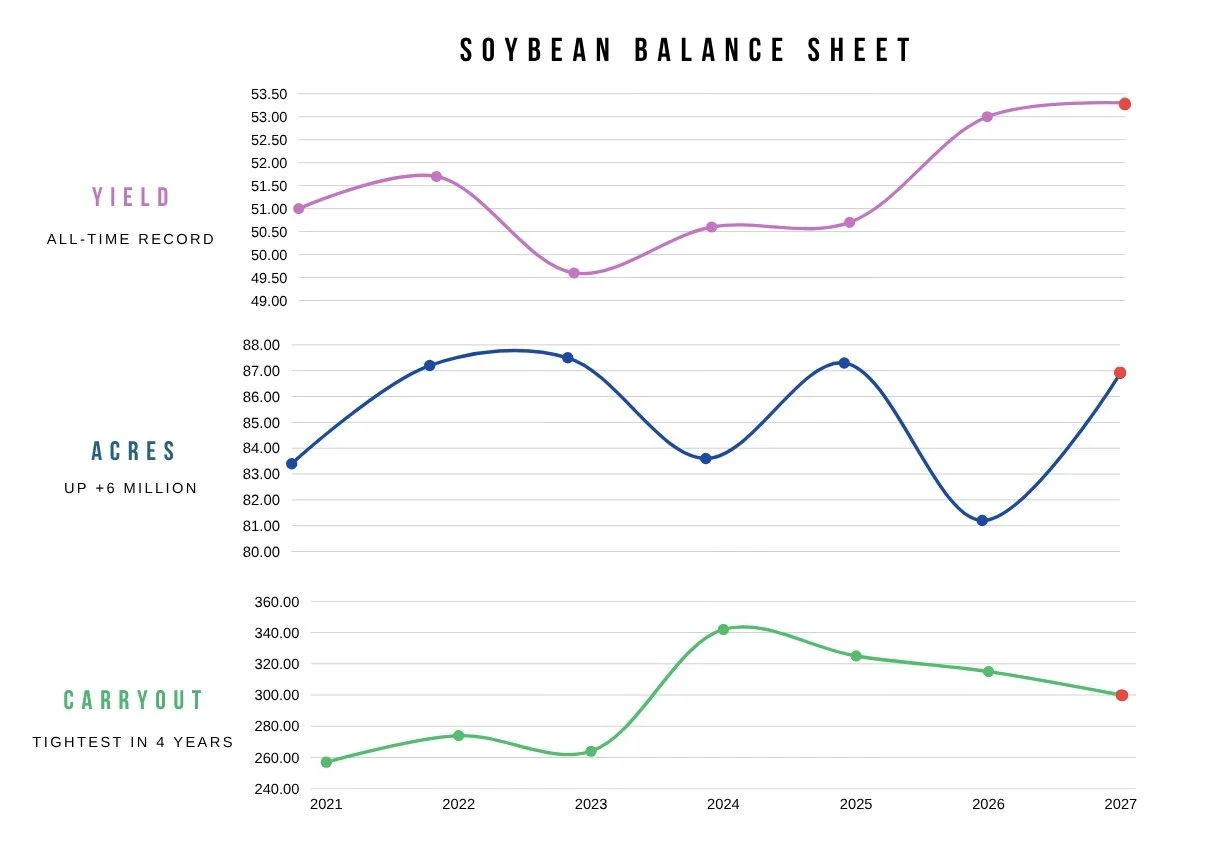
There is a reason we have a record yield.
A huge increase in acres vs last year.
Yet the tightest US balance sheet in several years.
Demand.
That goes for not only the US but the world.
Spreads & Basis:
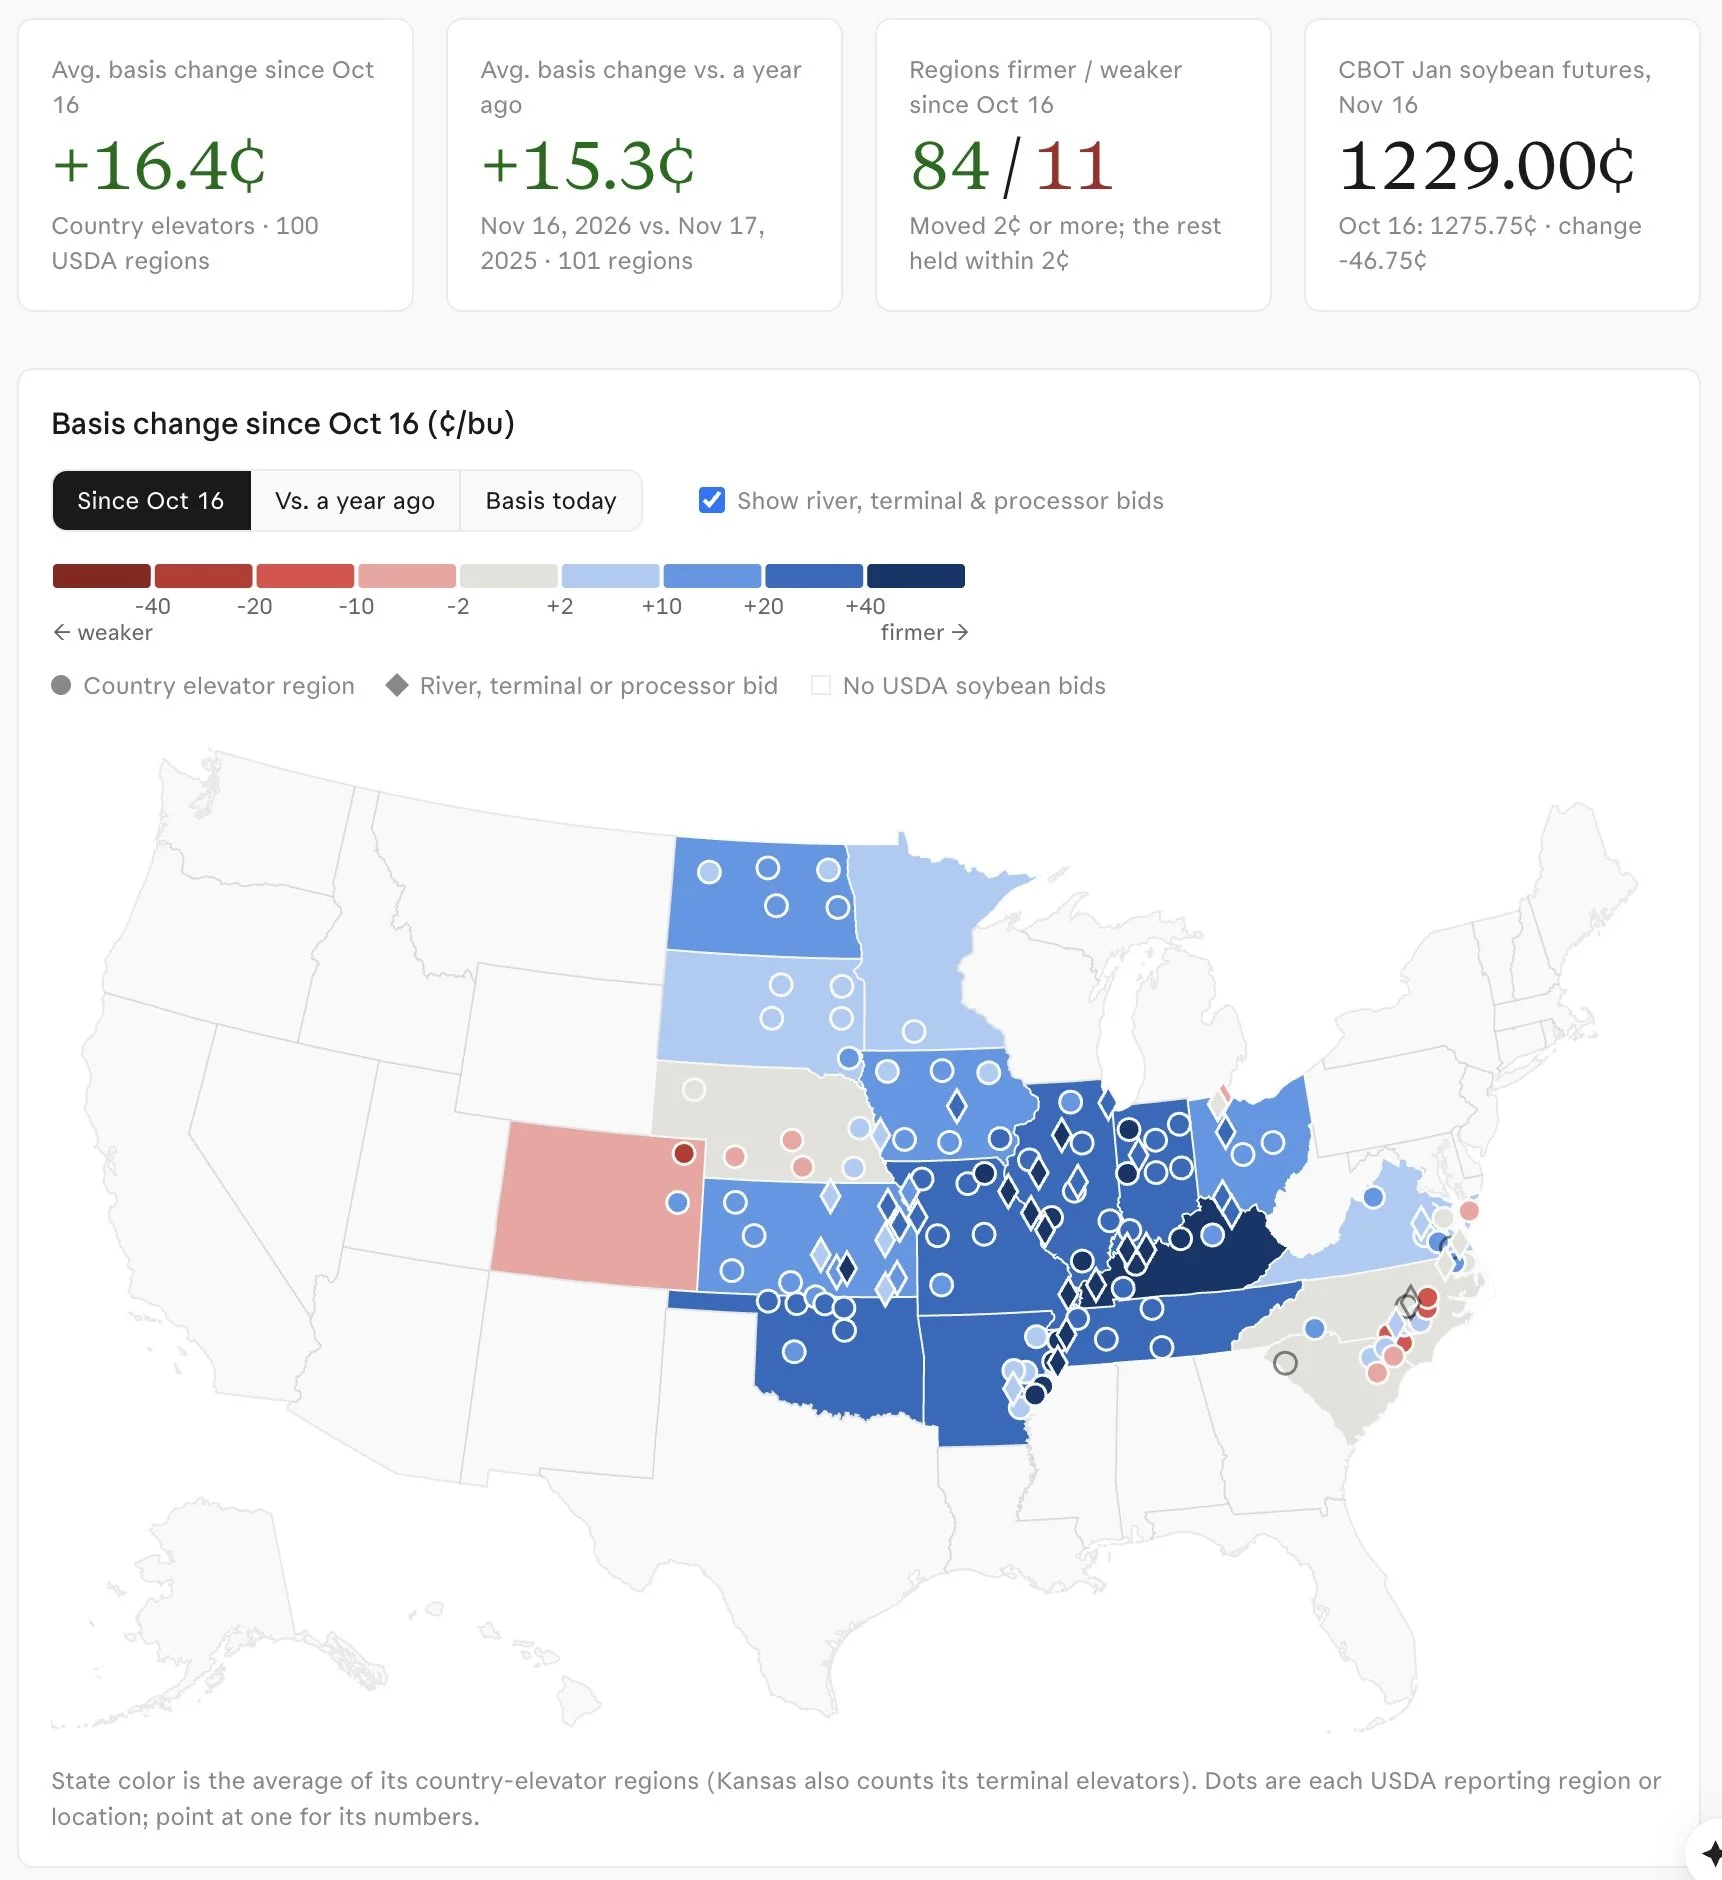
Like in corn, spreads and basis are giving some friendly signs as well.
We've seen basis improving.
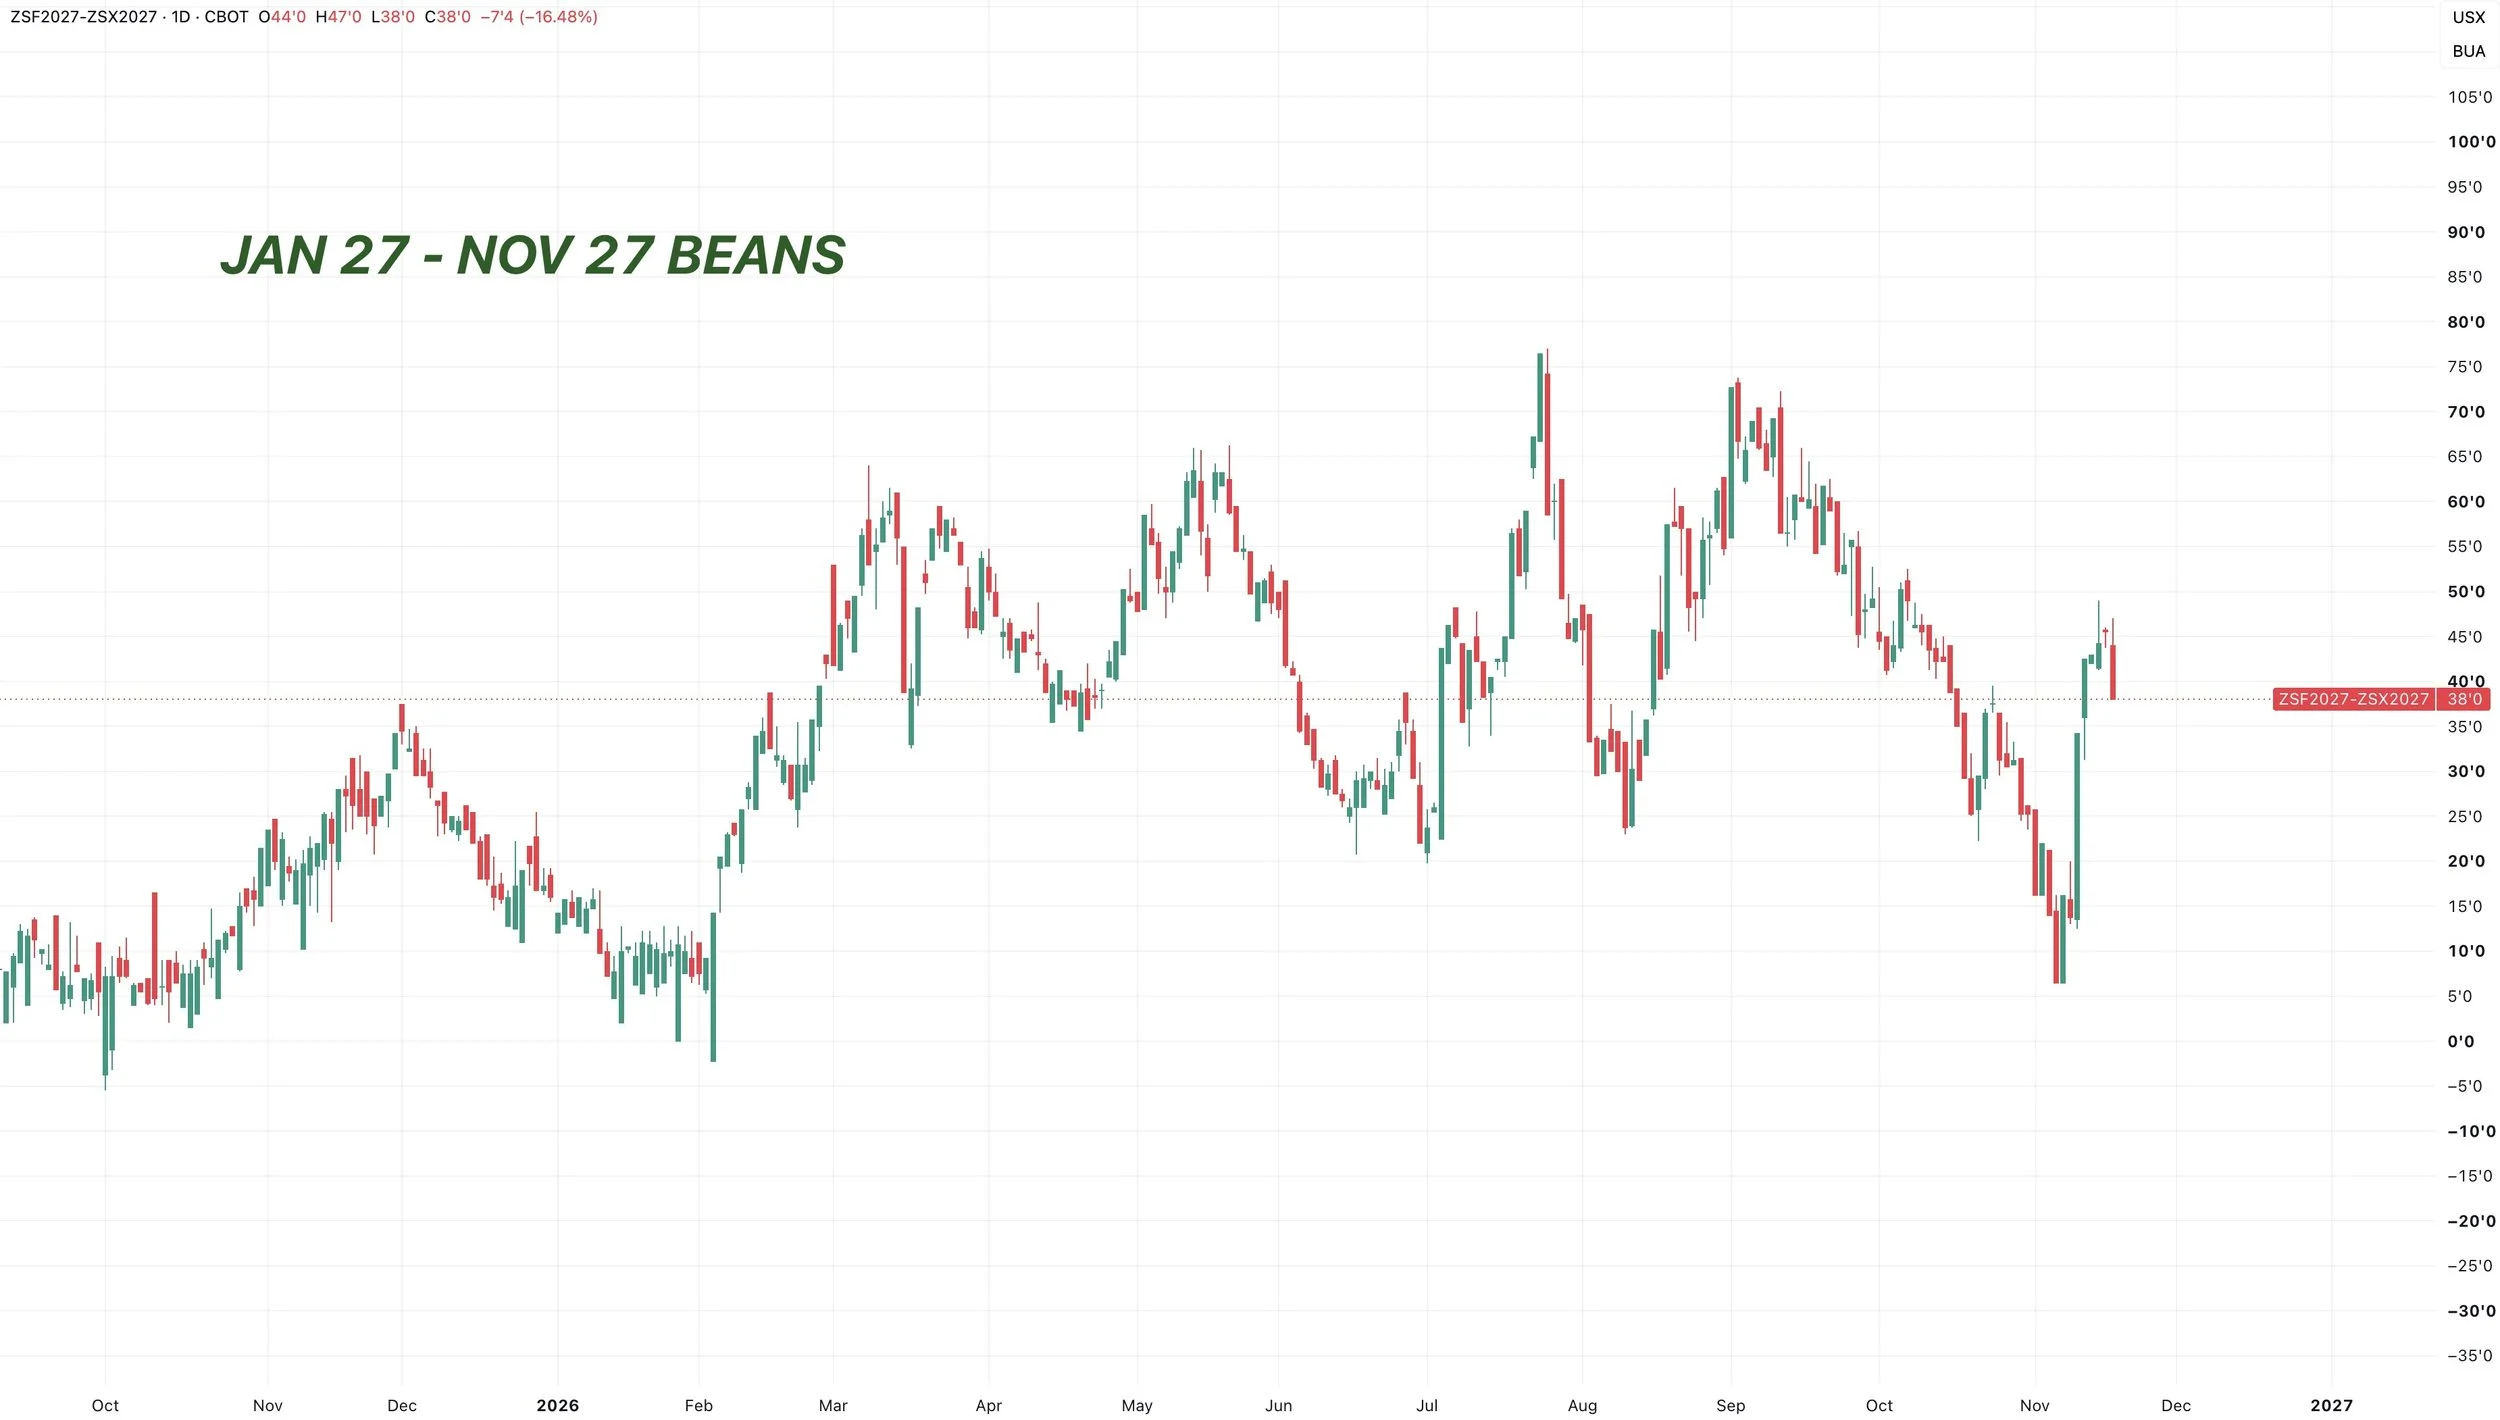
The spreads were lower today for soybeans too.
But are massively off those recent lows.
Jan was just at a 6 cent premium to Nov-27.
That premium is now at 38 cents.
Jan Beans Chart: 4-Hour
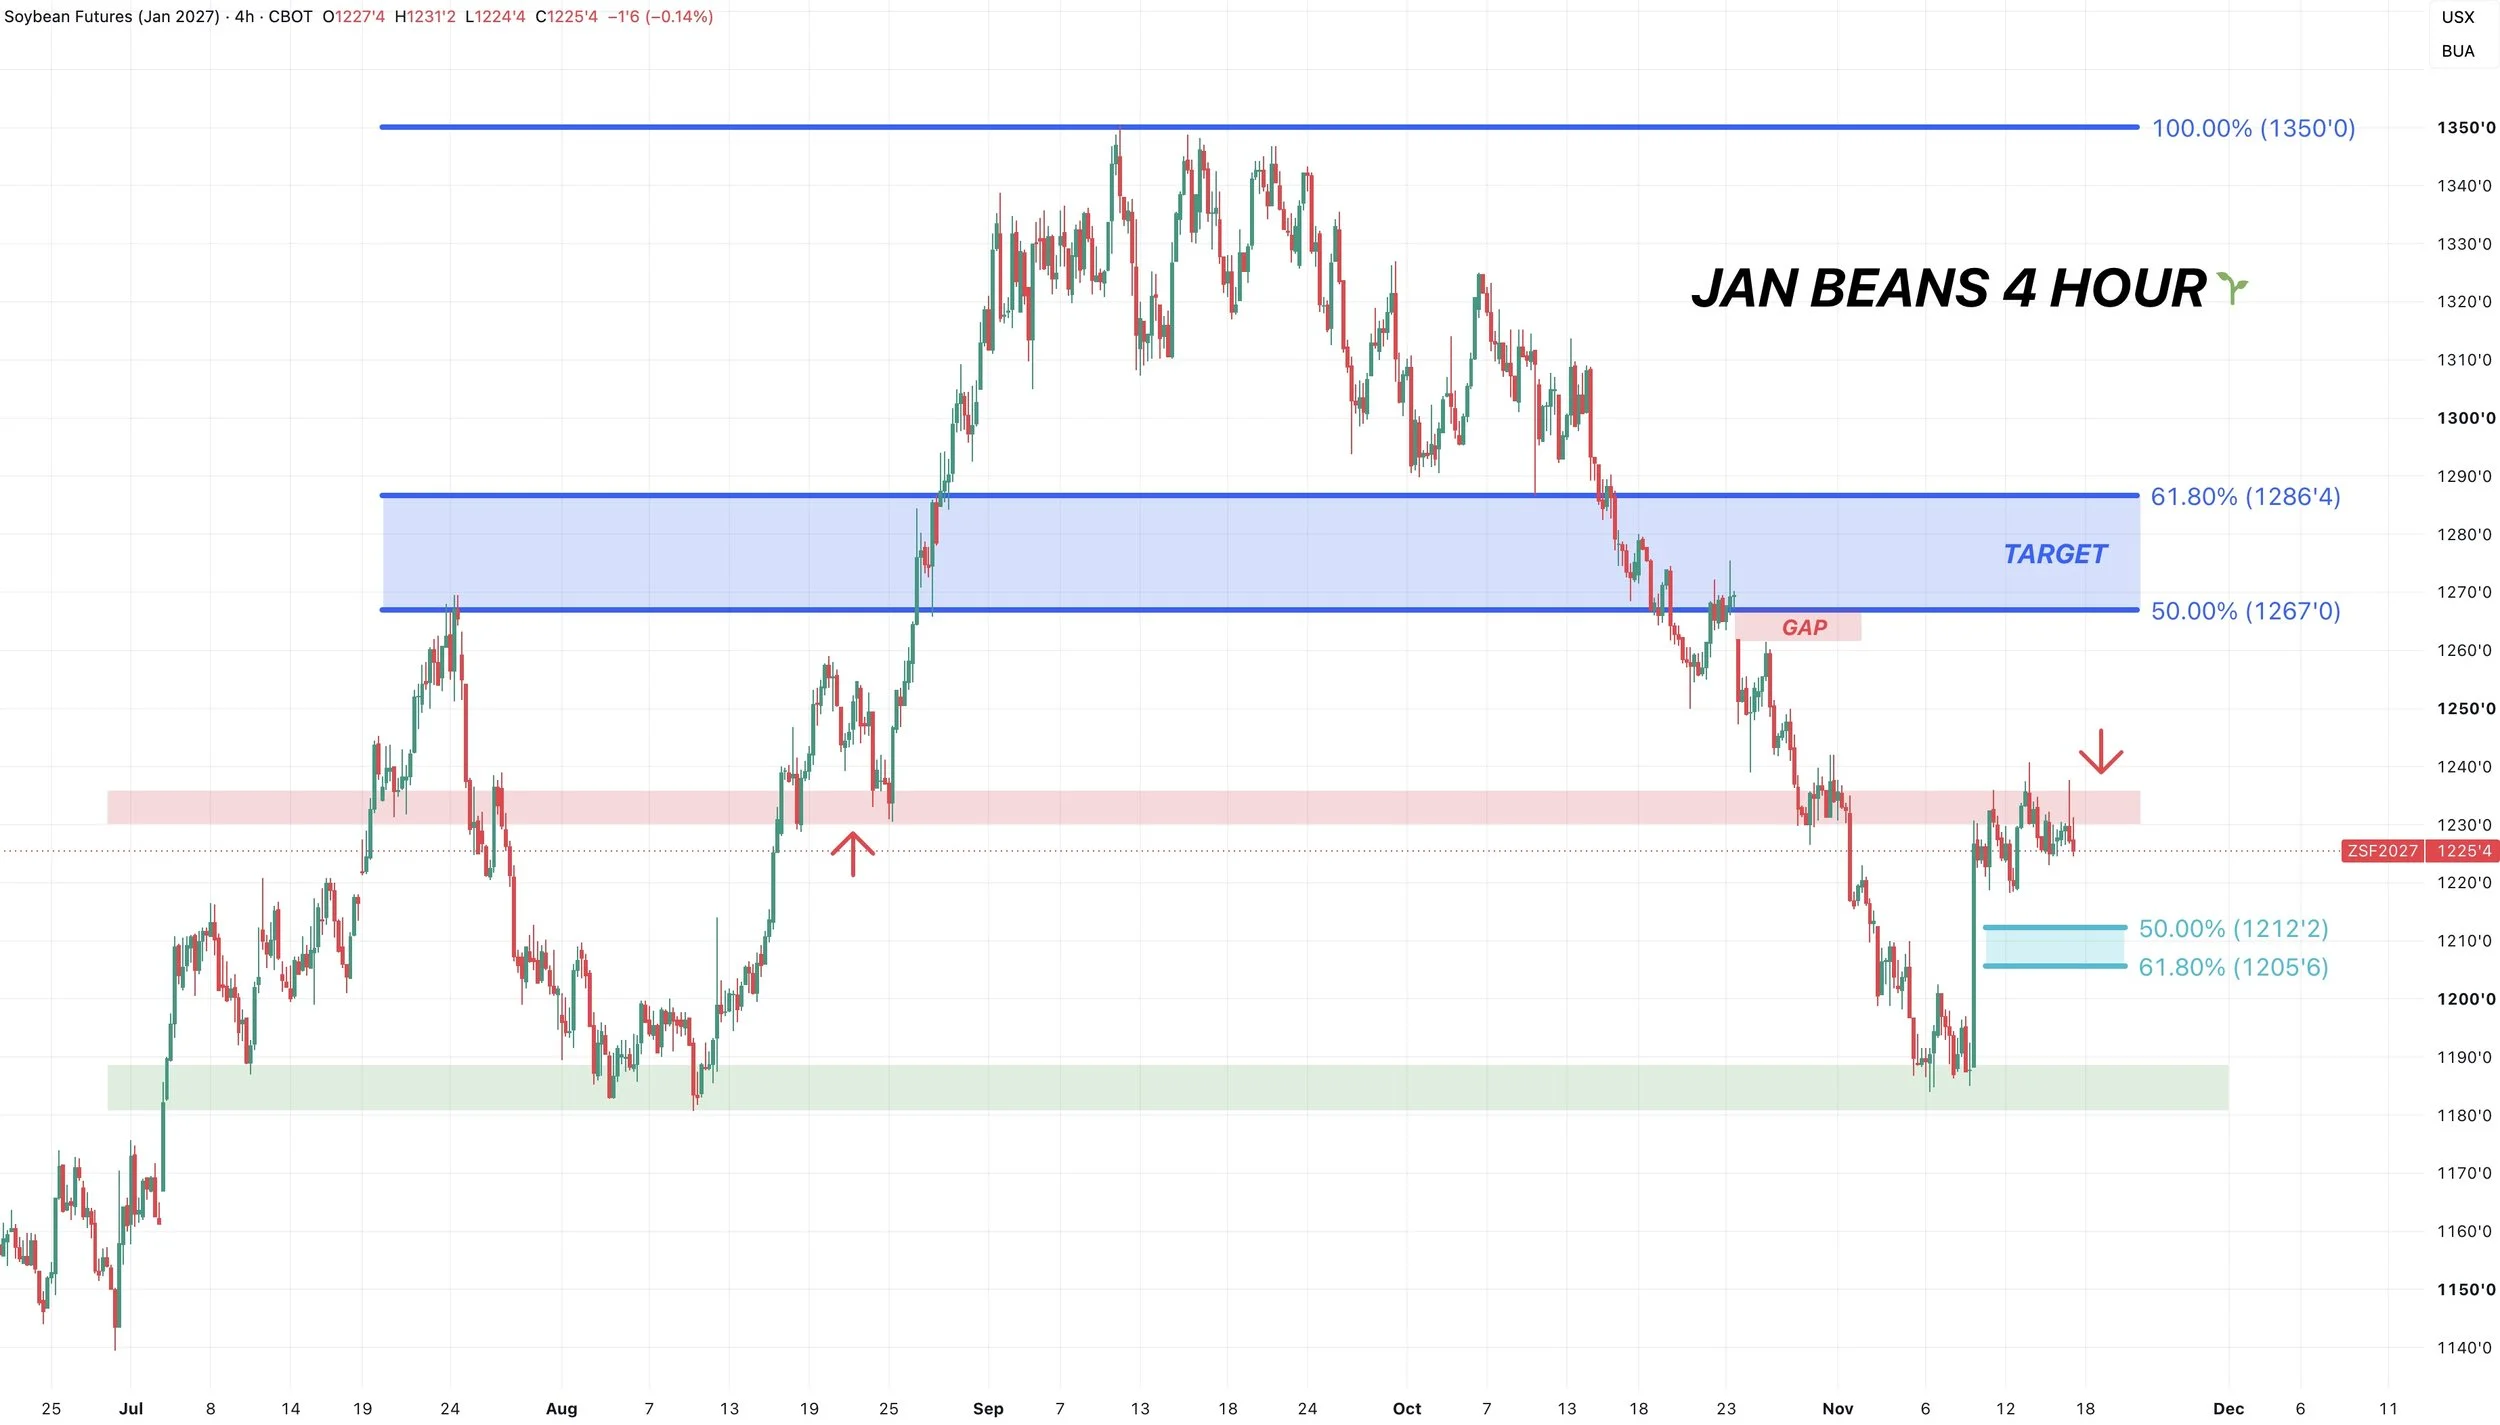
We continue to struggle at this $12.35 range.
If we continue to reject here and get a pullback, I am looking for a bounce in that $12.06 to $12.12 range. Which is the golden zone down to the lows.
To the upside, I have a short term target in that $12.65 area if we are able to bust above this $12.35 resistance.
That claws back half of the entire sell off.
That is the highs from July.
There is also an unfilled gap sitting right there as well.
That would be a spot I'd look at some possible target orders for those that need to move grain by the EOY.
Monthly Chart:
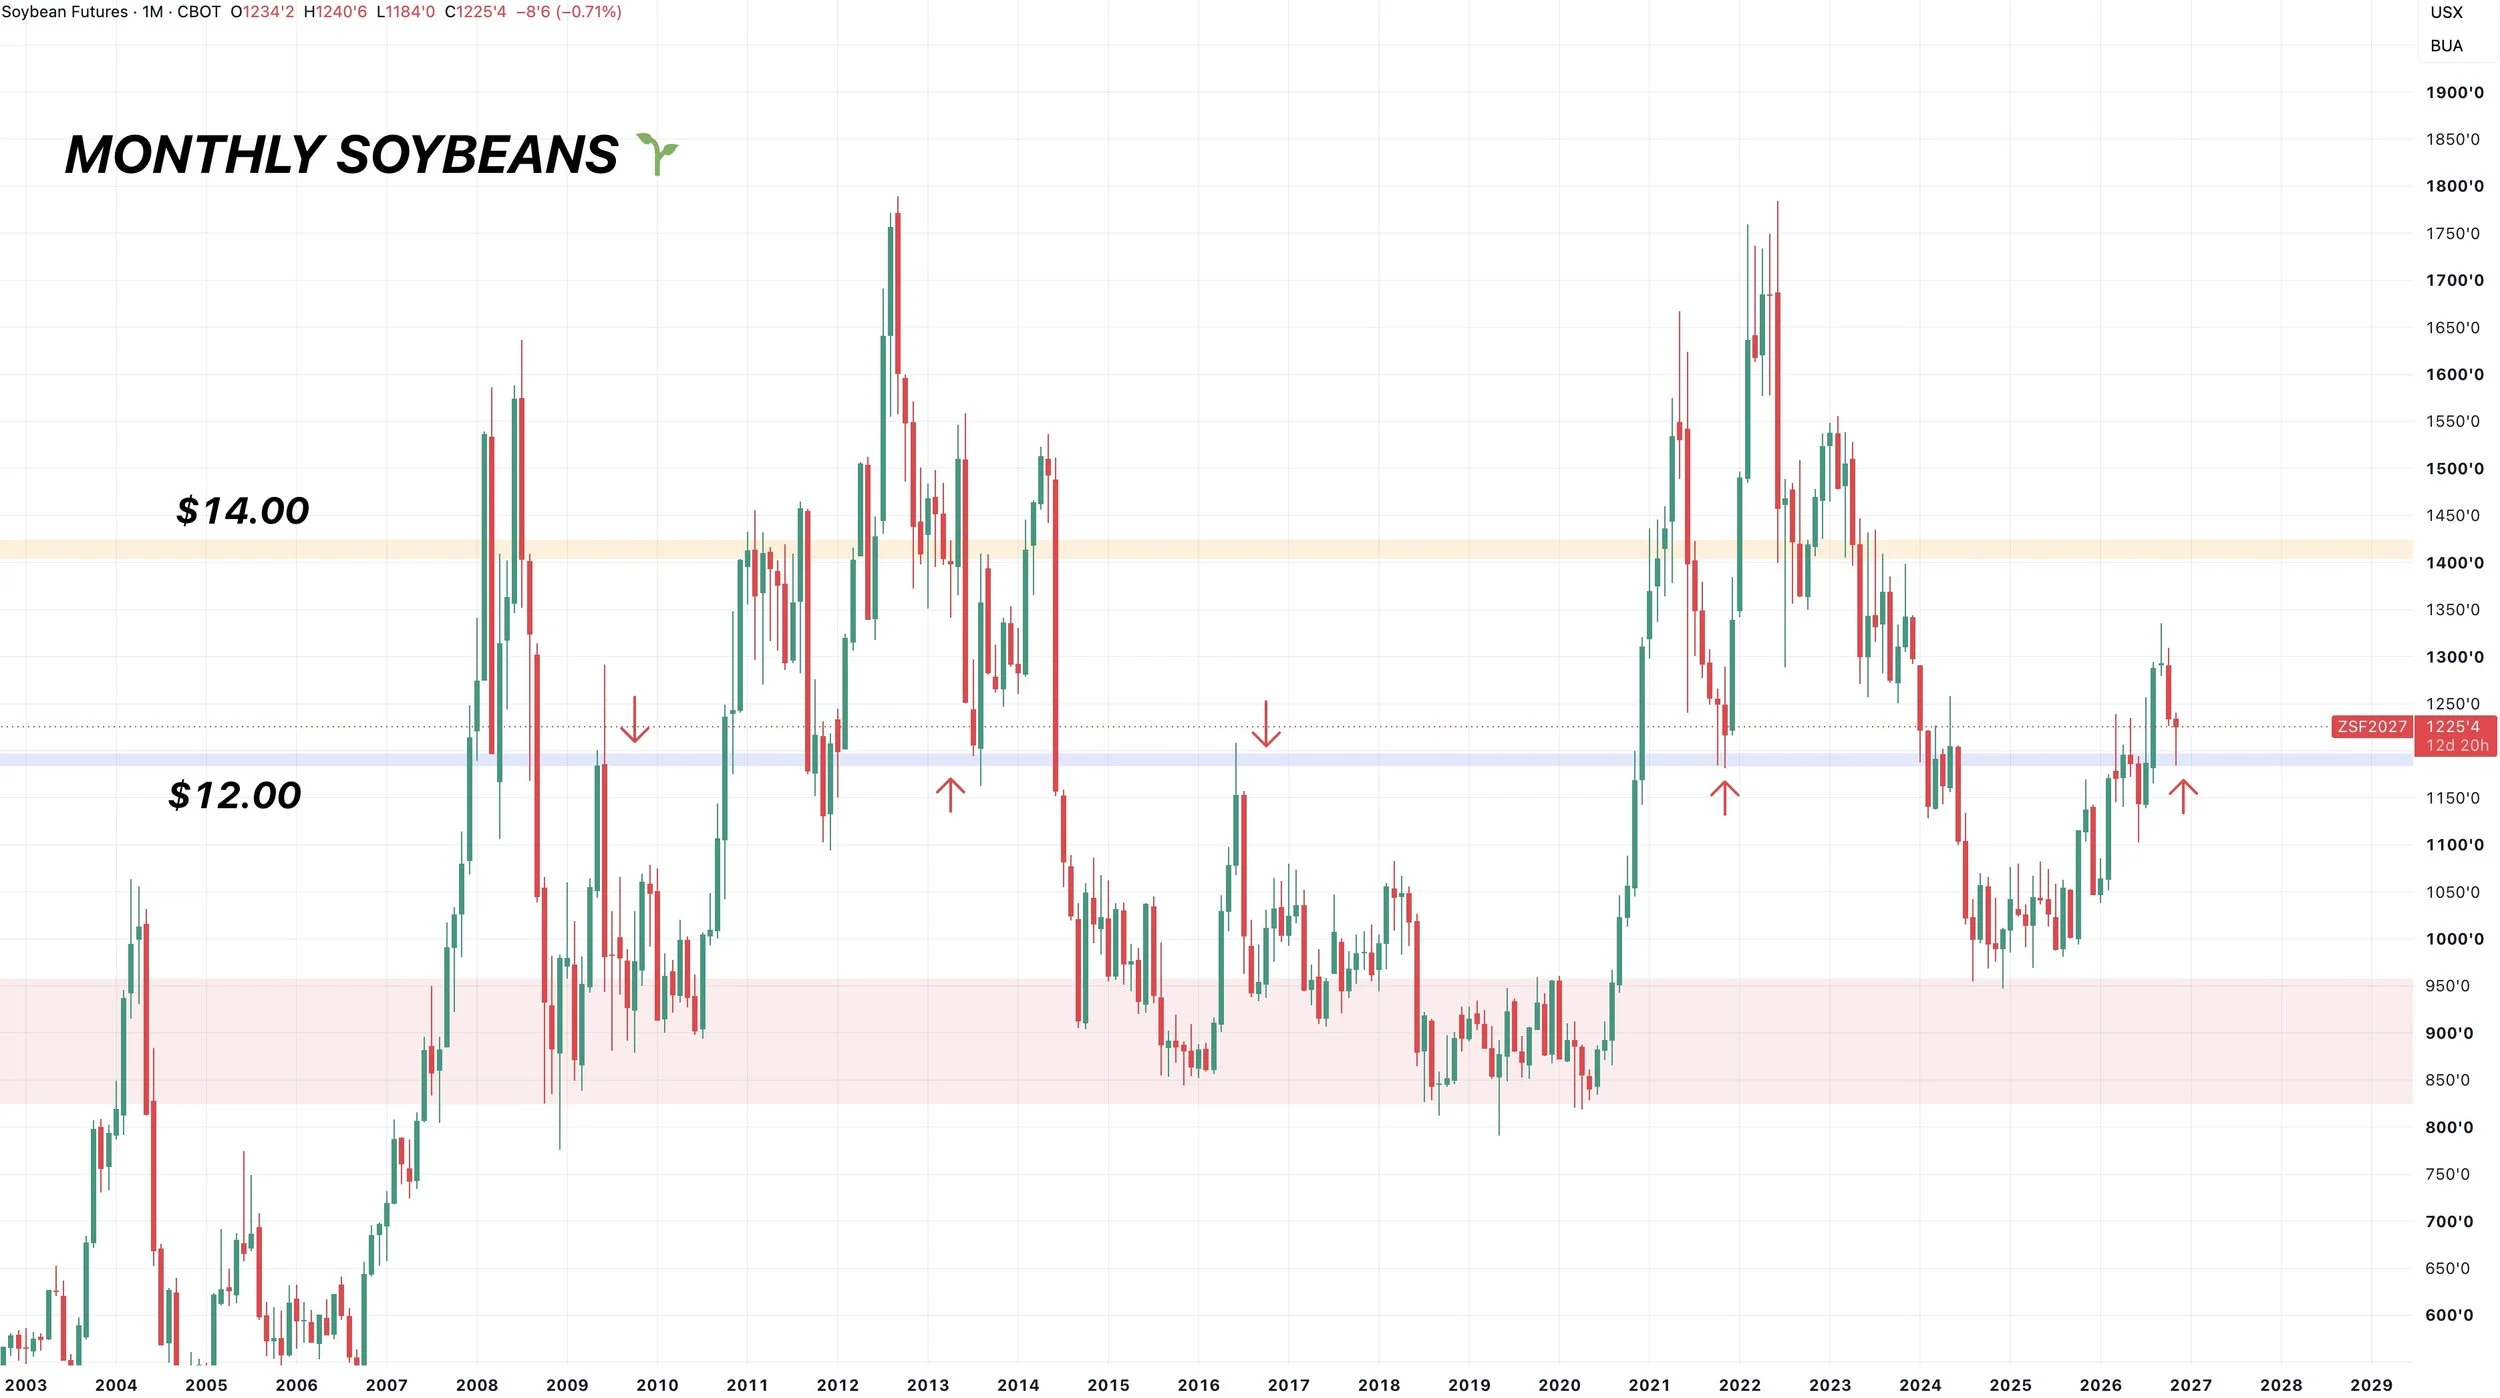
$12.00 has been a key spot for soybeans for years.
It's marked several tops and bottoms.
We once again did just bounce off that level this month.
Since it's resistance. Every monthly close above $12.00 has eventually resulted in $14.00 at some point.
If we failed to do so this time, it would be a first.
Wheat
Dec KC Chart:
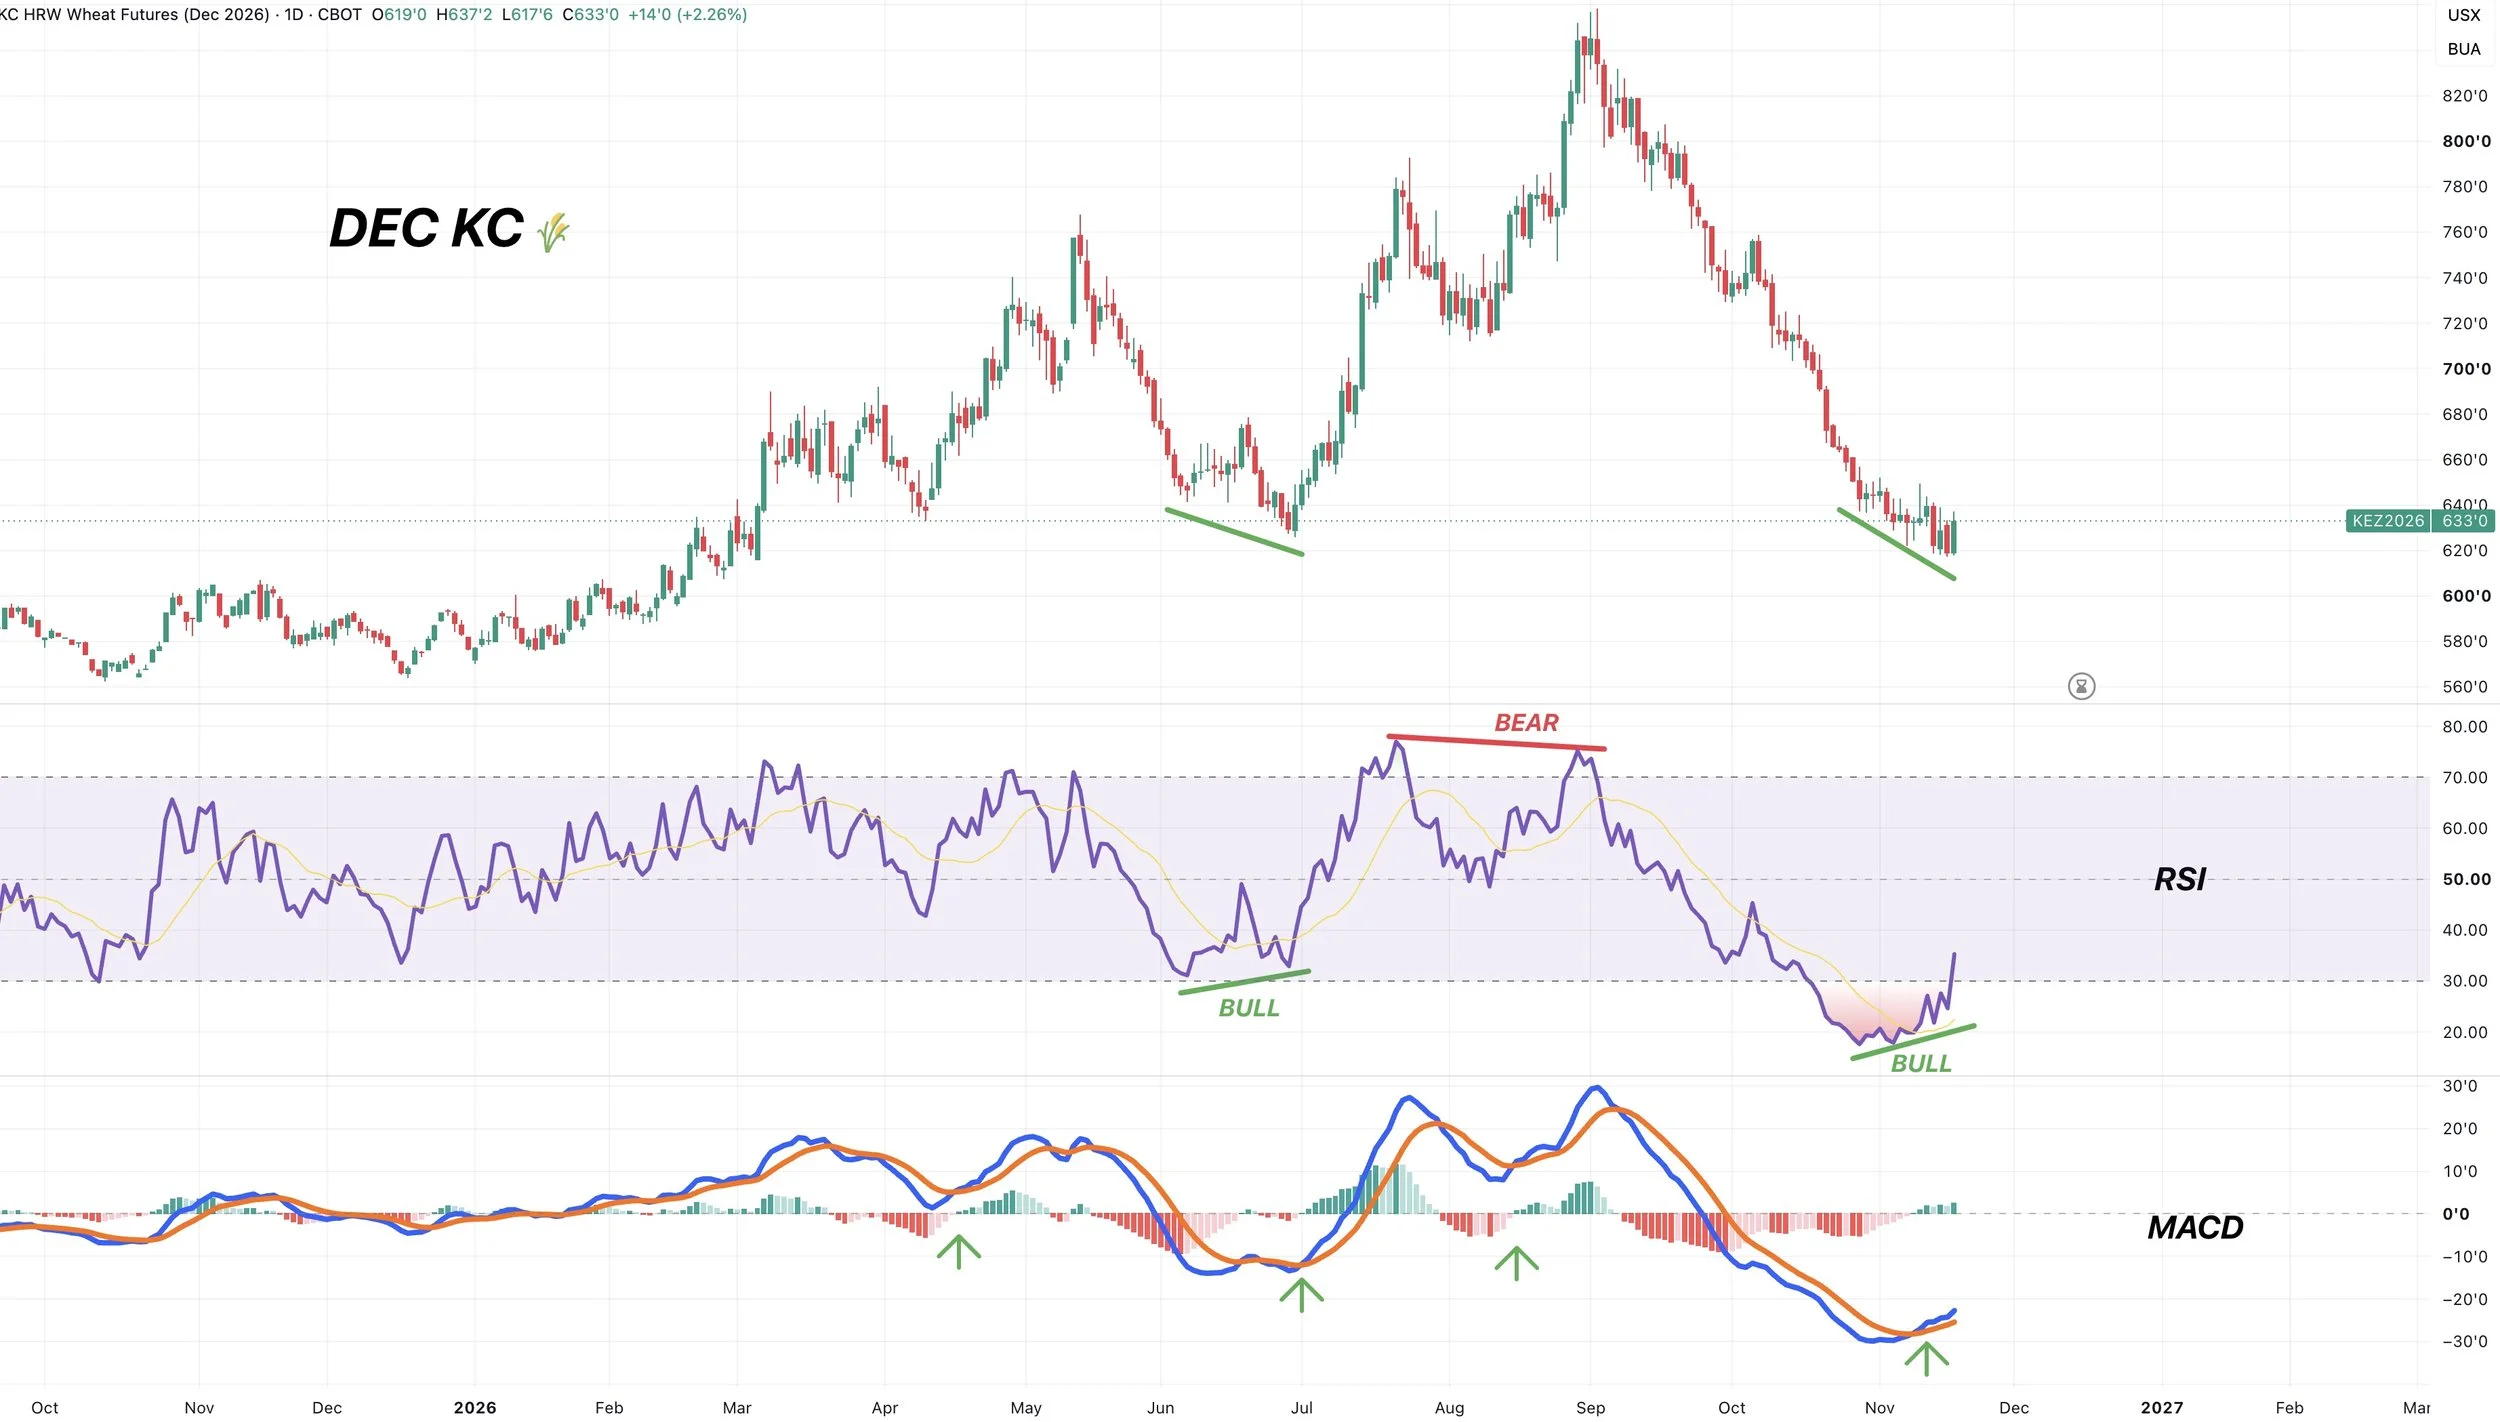
The lack of demand has been a big negative for wheat. And the market just doesn’t care about the Black Sea news.
Then you have the thought that we are going to be getting a lot more acres this year. Which hasn’t helped spark interest in this market.
However, the charts are still showing some signs of life down here.
RSI & MACD:
You still have bullish divergence on the RSI that has been building. And it's some pretty clear divergence. Just look at how high the RSI is vs prices.
This is the first time with confirmed bullish divergence since the June lows. Meanwhile, bearish divergence marked the contract highs.
The MACD also crossed bullish. The last several have resulted in upside.
KC 4-Hour Chart: Breaking Out?
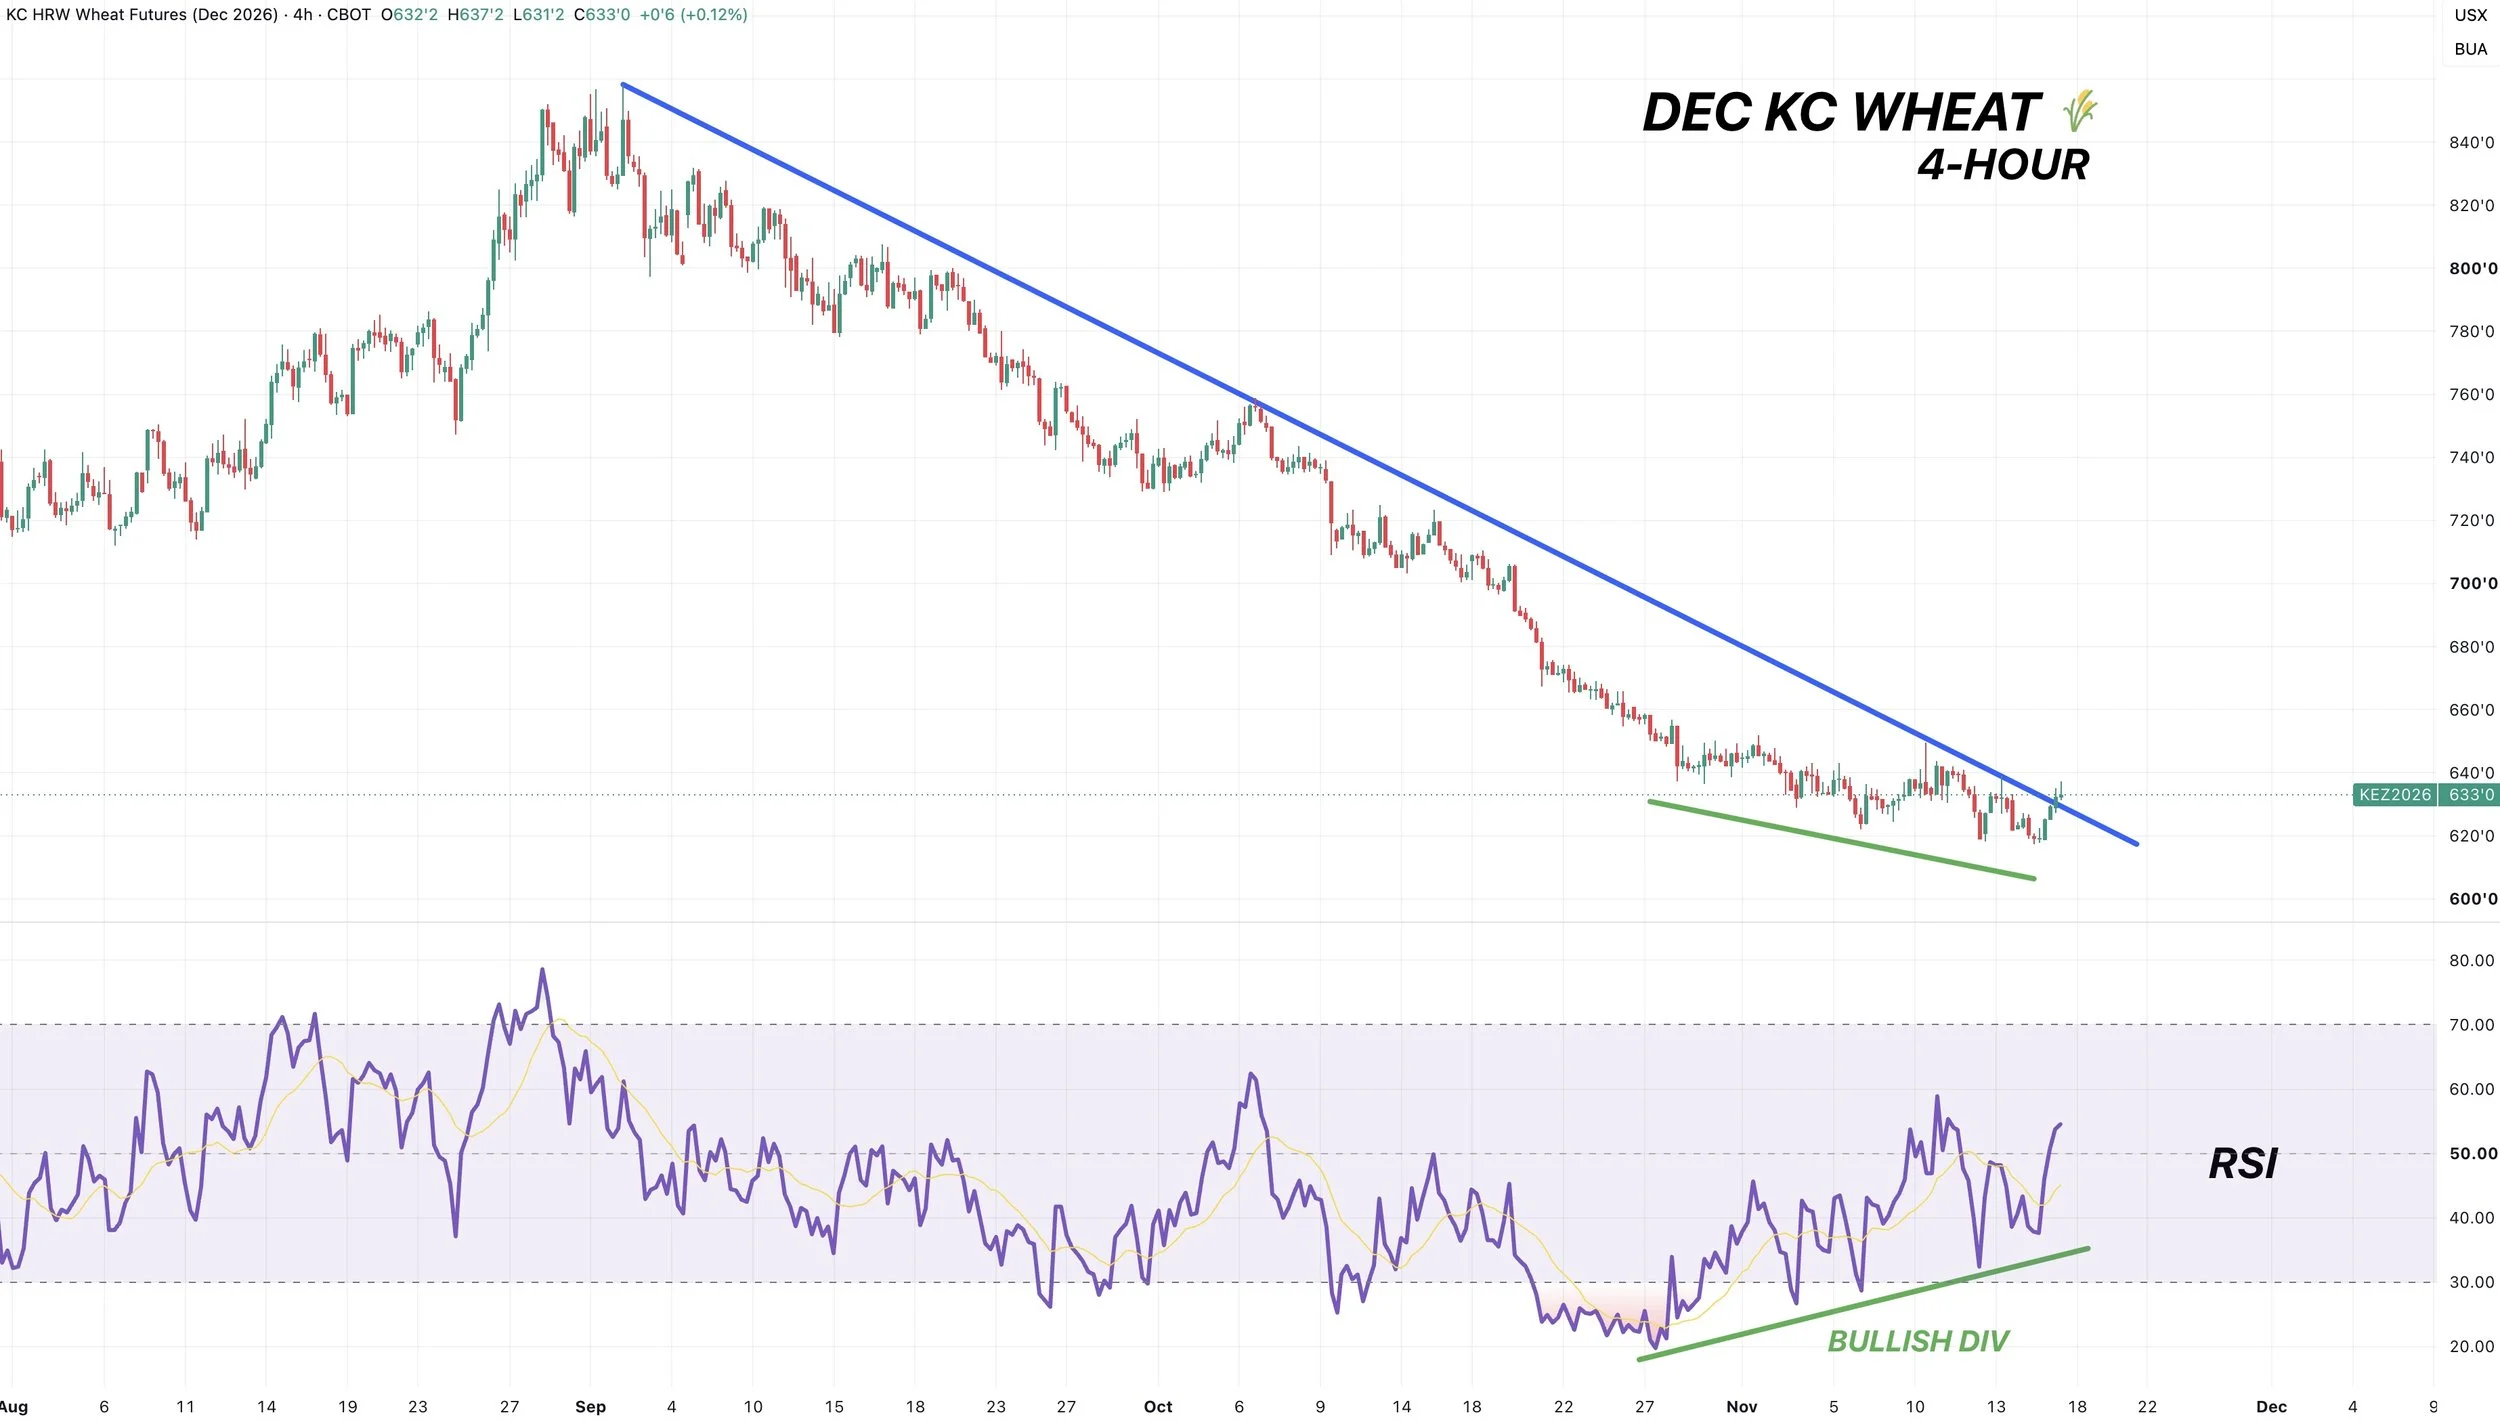
The 4-hour chart is pretty interesting.
We have that clear bullish divergence we've been building for the last 2 weeks.
We have a simple downward trend that has marked several rejections for this market. As we have continued to respect the downtrend.
Today we are poking out heads out of the downtrend for the first time on this entire sell off.
We'd like to see a little more follow through before getting overly excited, but this is the best sign of life we've had in a while.
To me, it feels like sellers are getting a little exhausted down here.
March MPLS:
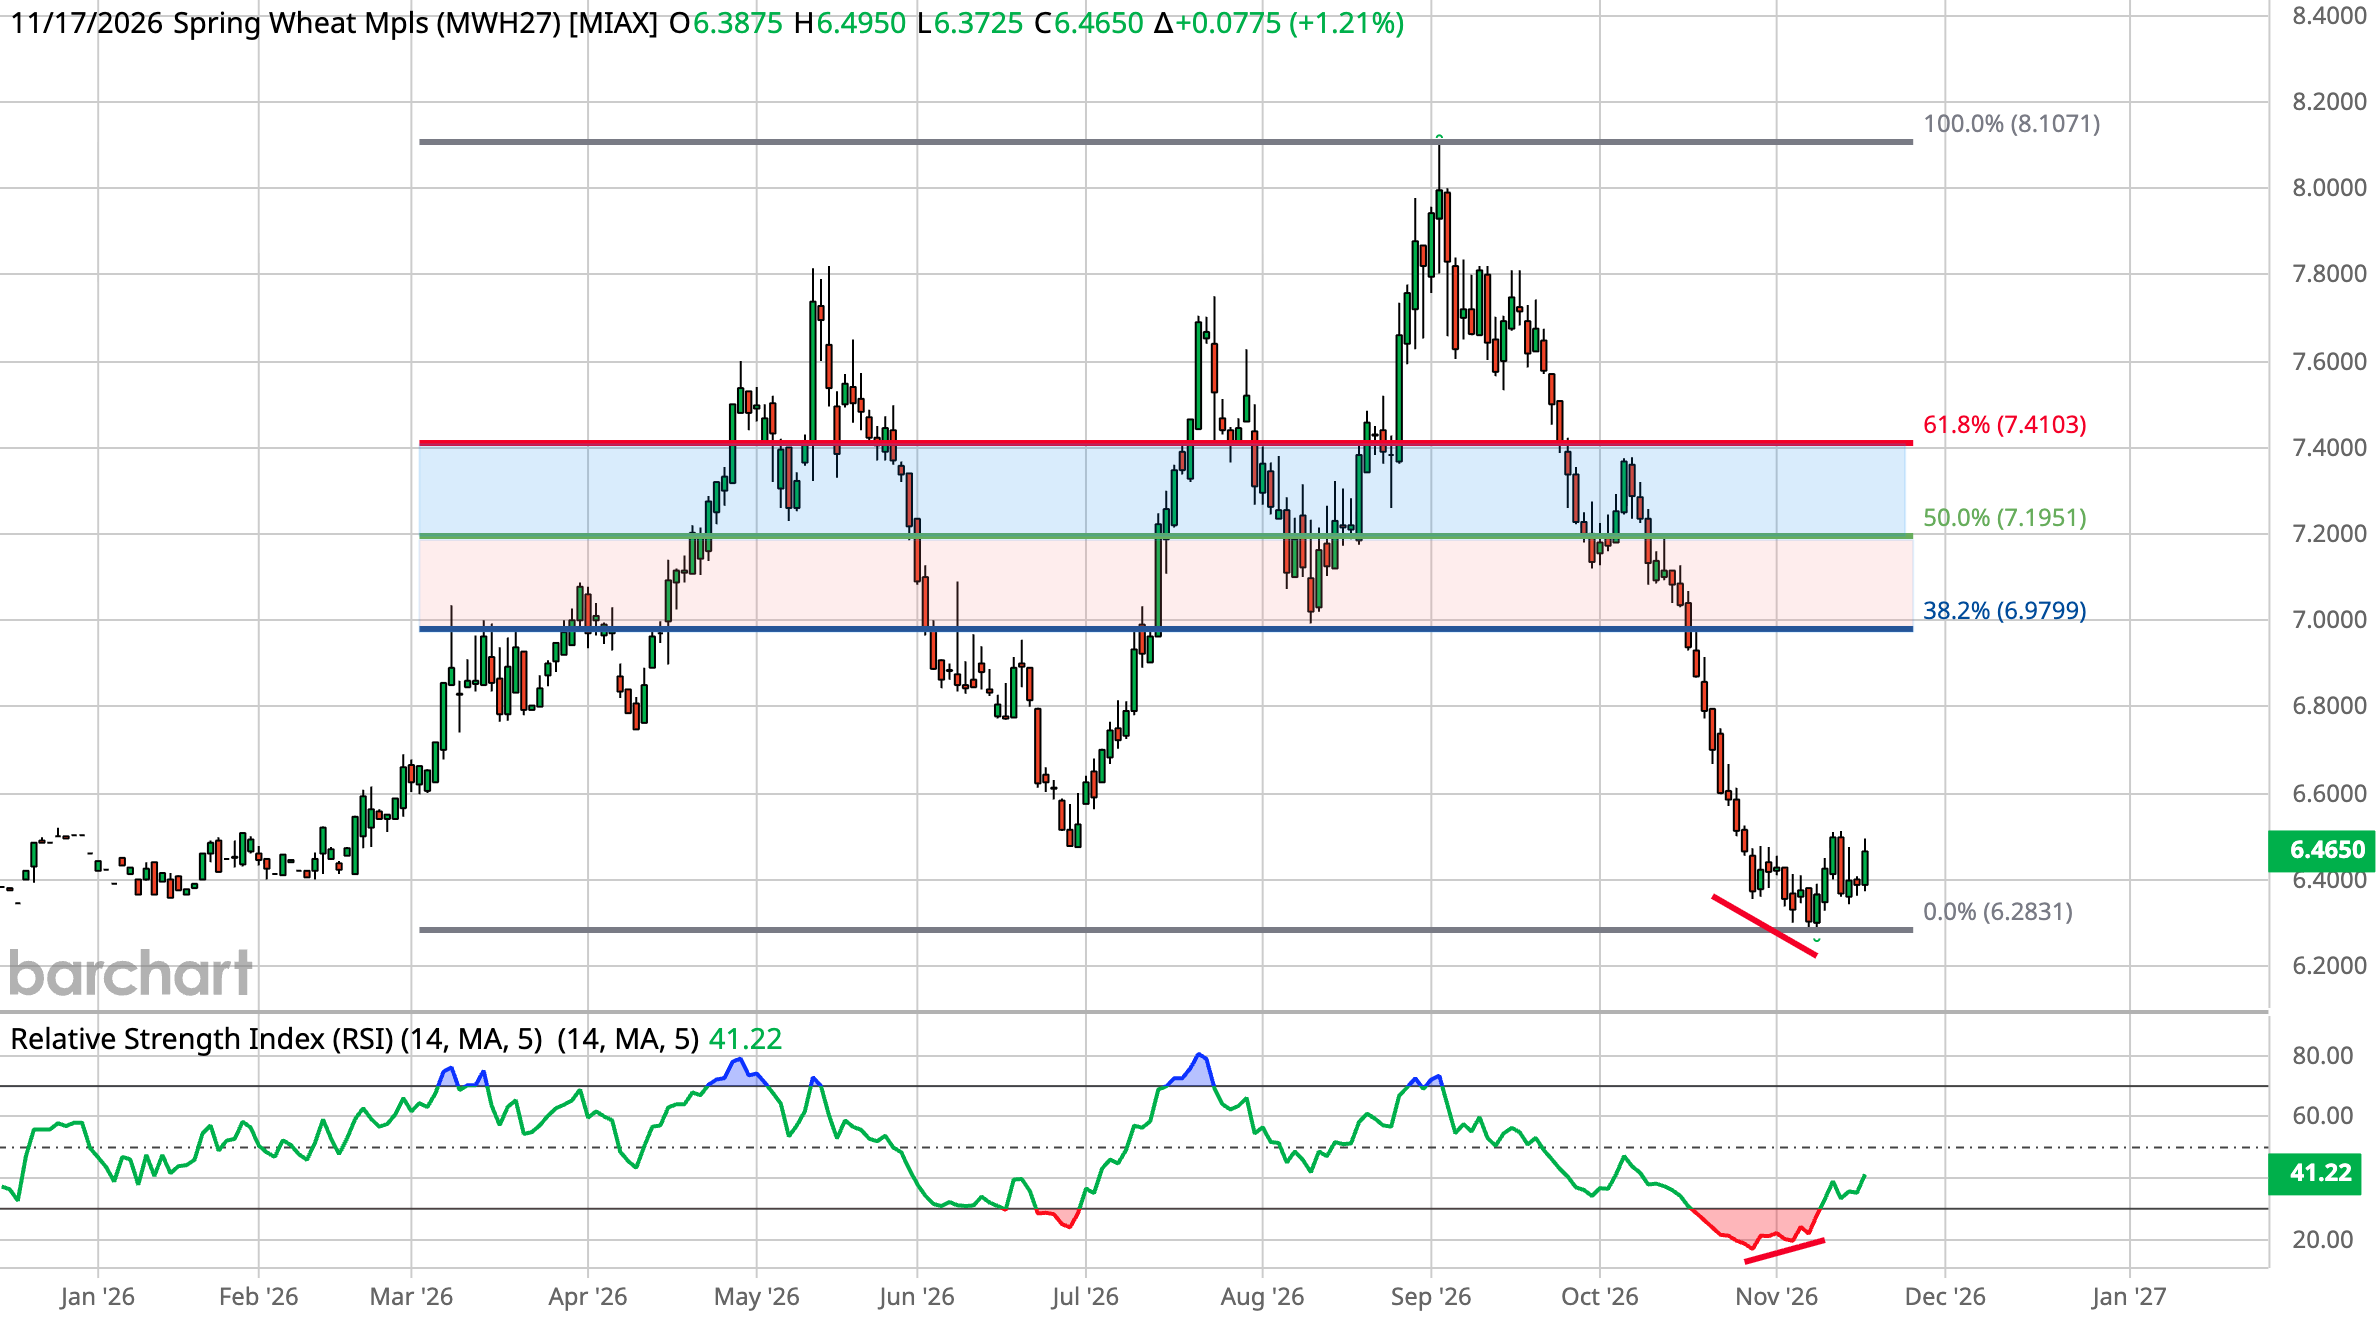
MPLS wheat is showing some signs of life as well.
We had bullish divergence on the RSI. Prices are starting to react higher.
The first retracement comes in at $6.97 which is also those lows from August.
So that is going to be an area of interest if it comes.
Cattle
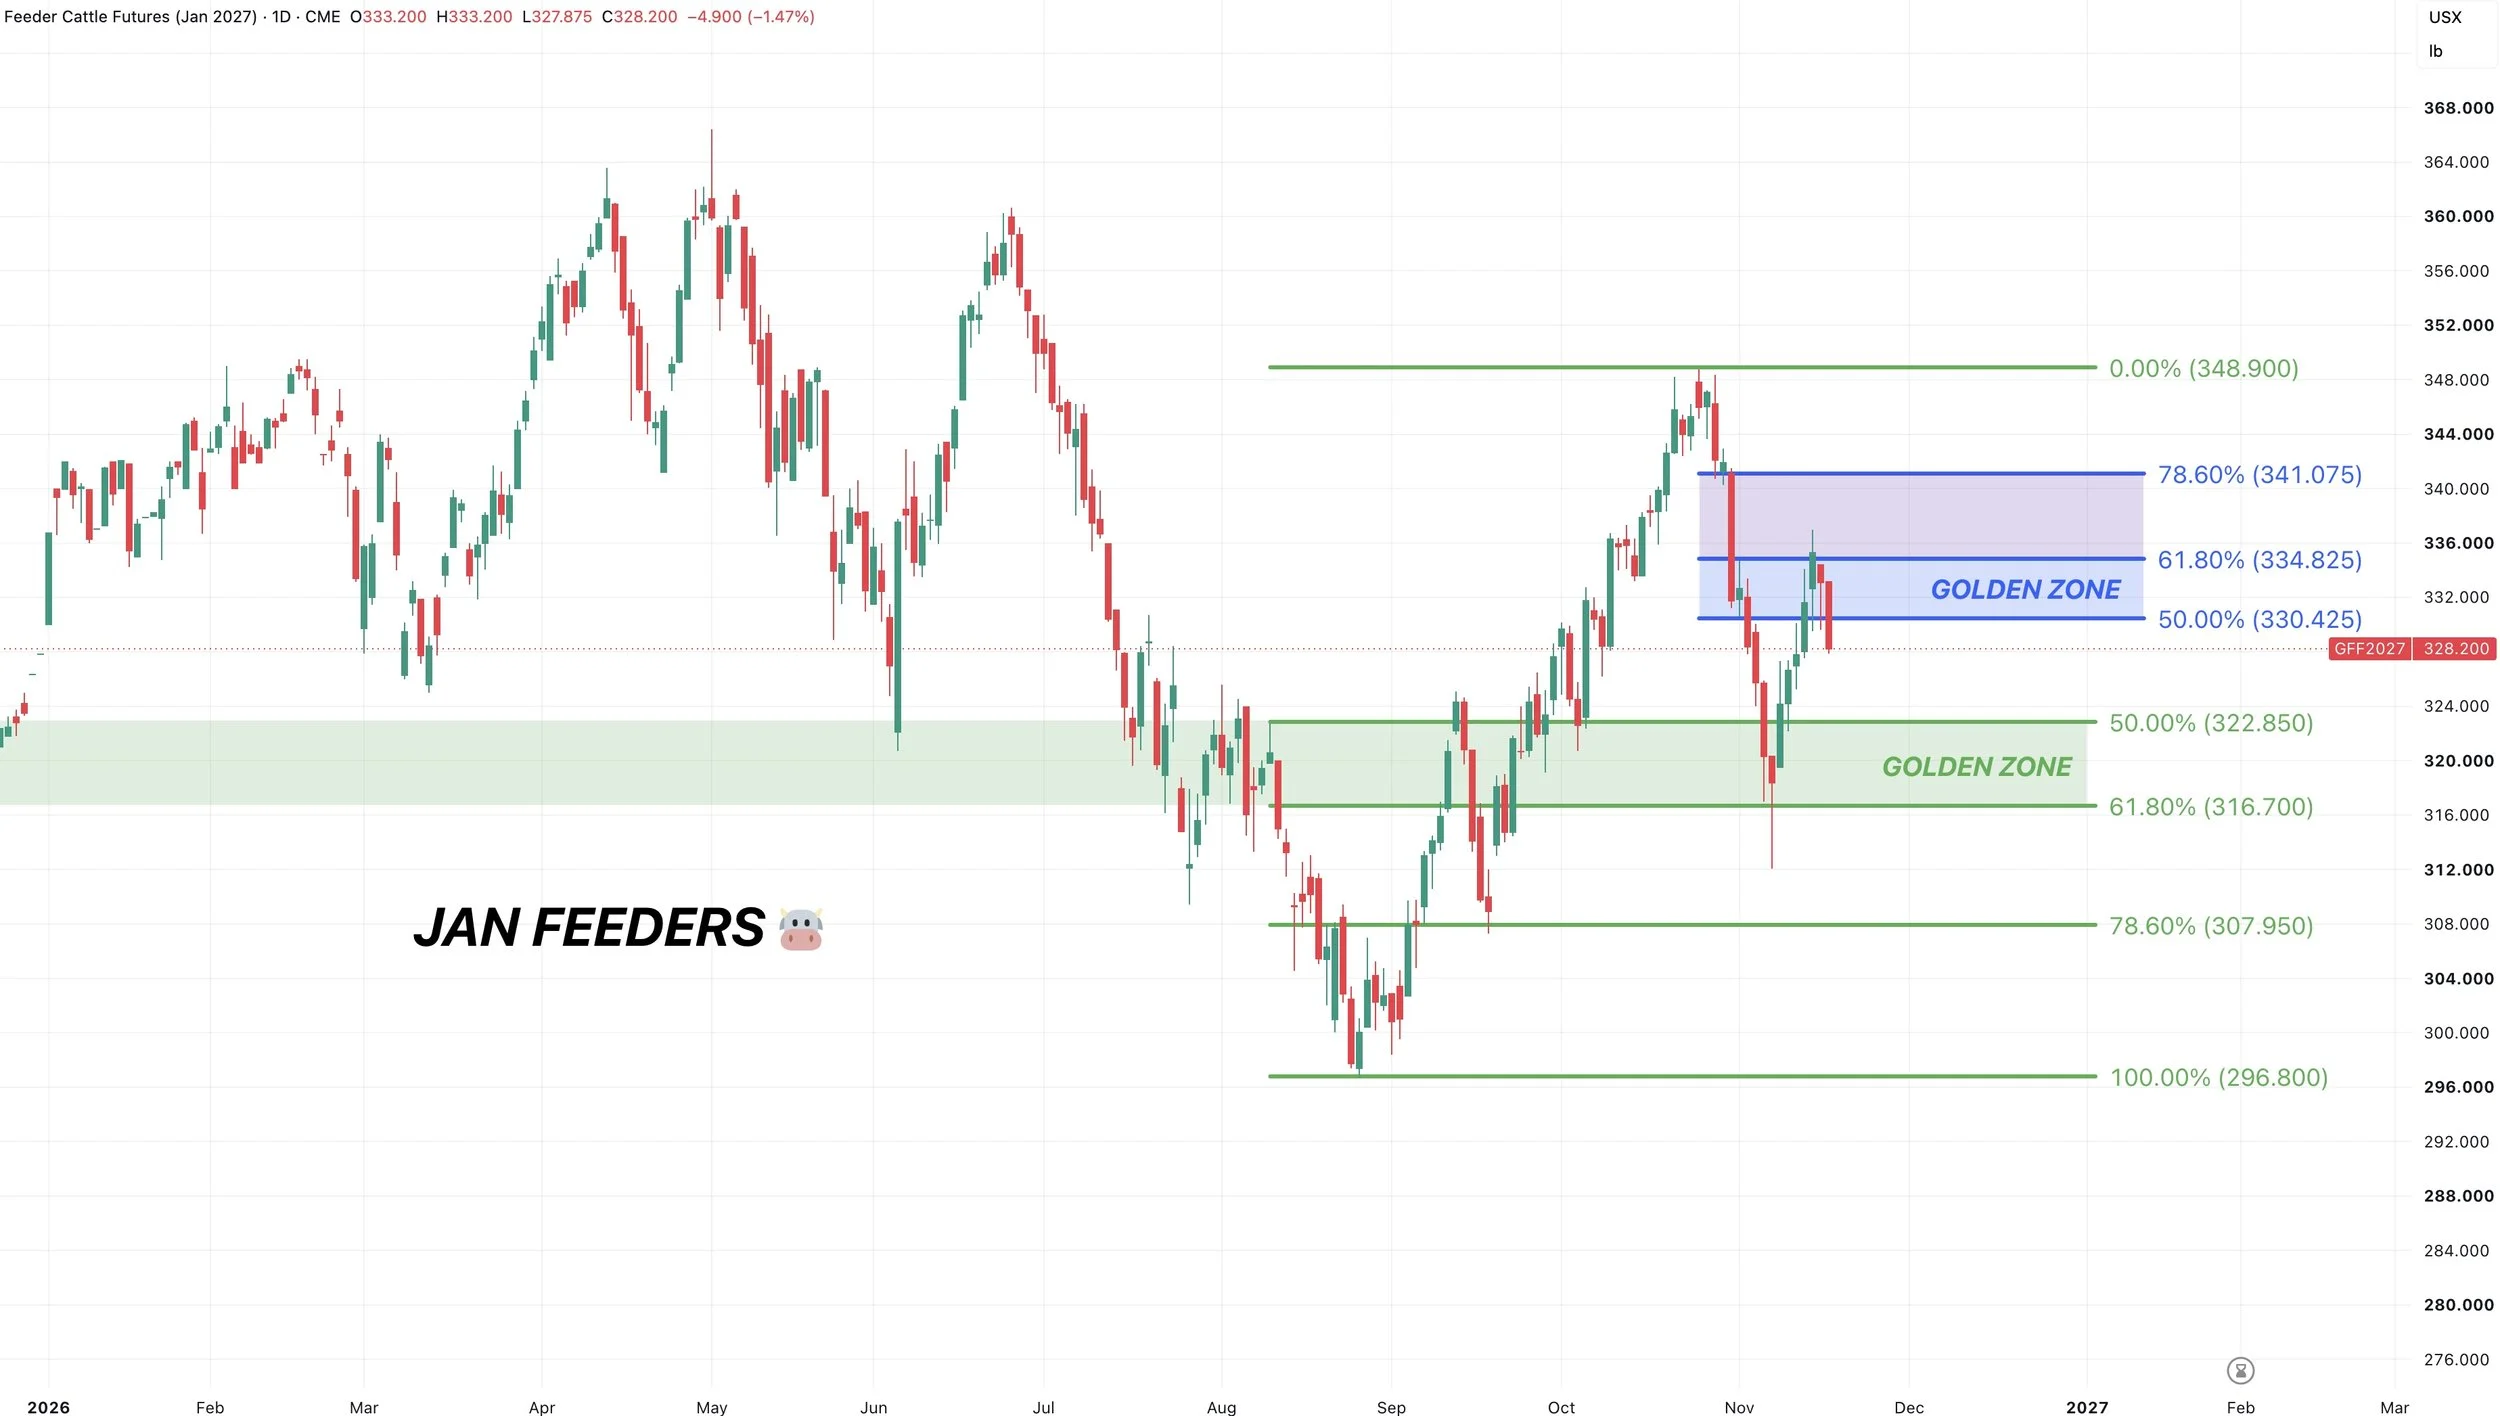
Jan Feeders:
We do have a cattle on feed report out later this week.
Currently cattle is rejecting right inside those target zones I have been vocal about defending.
Following our recent hedge alert last week and our hedge alert towards those Oct highs.
Feeders hit the 61.8% retracement of the entire sell off we just saw. So far we are seeing a rejection here.
If this is a dead cat bounce, this is a very common area to fail. So that is why we wanted to look at doing some protecting, especially if you did not protect the Oct highs.
It just makes sense to take some risk off the table at an area where relief bounces often tend to struggle.
Unless both feeders and live cattle break above their golden zones, I view this as a relief bounce as I've been mentioning. As I overall think the cattle market is in a broader down trend until we are proven otherwise.
Dec Live Chart:
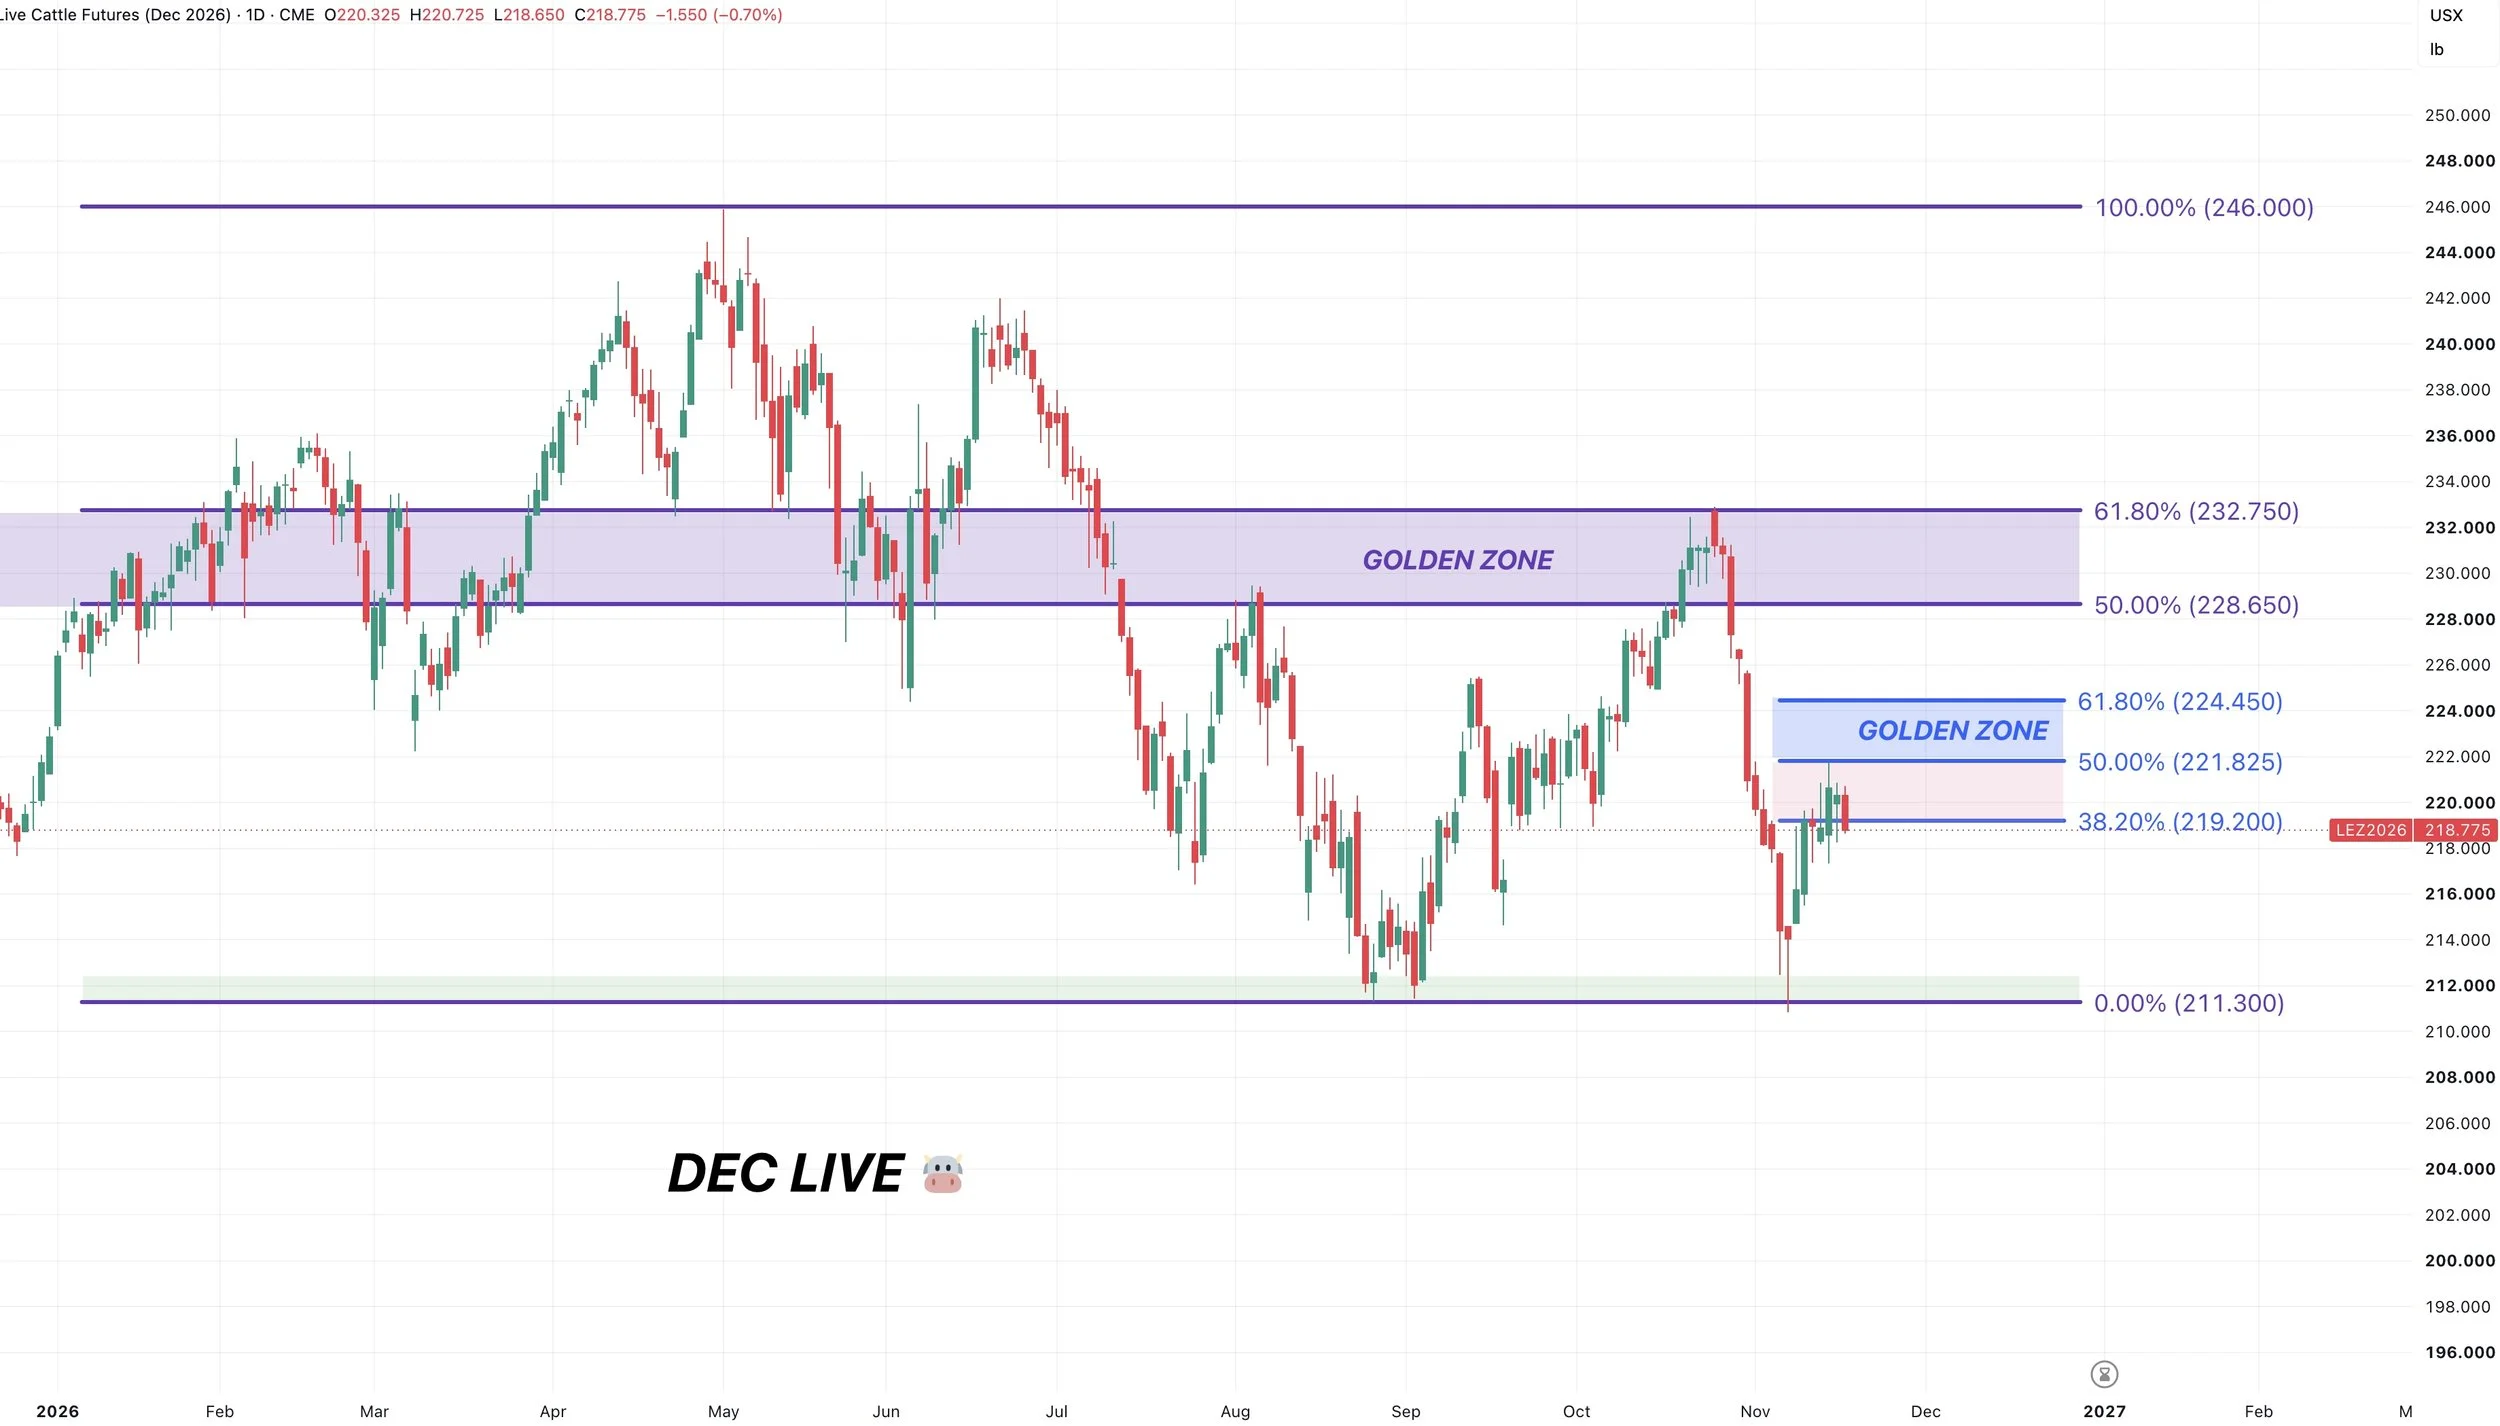
In live cattle, we sit exactly a set of fibs lower than we do in feeders. Which is exactly what we saw happen on the last rally.
Feeders hit the 61.8%.
Live hit the 50%.
So far both are rejecting there.
Again, unless both live and feeders break above those golden zones. I think the rallies should be rewarded and treated as relief rallies until something tells us otherwise.
Want to Talk?
Our phones are open 24/7 for you guys if you ever need anything or want to discuss your operation.
Jeremey & Office: (806)484-1214
Sebastian: (605)280-1186
Email: sfrost@dailymarketminute.com
Hedge Account
Interested in a hedge account? Use the link below to set up an account or give us a call.