
SOYBEANS AT DECISION POINT
MARKET UPDATE
You can scroll to read the usual update as well. As the written version is the exact same as the video.
Timestamps for video:
Overview & News: 0:00min
Corn Charts: 5:50min
Bean Charts: 7:30min
Wheat Charts: 10:10min
Cattle Charts: 11:50min
Want to talk about your situation?
(605)295-3100
Futures Prices Close
Overview
*I had surgery yesterday so today’s update is going to be briefer than usual and mostly the charts*
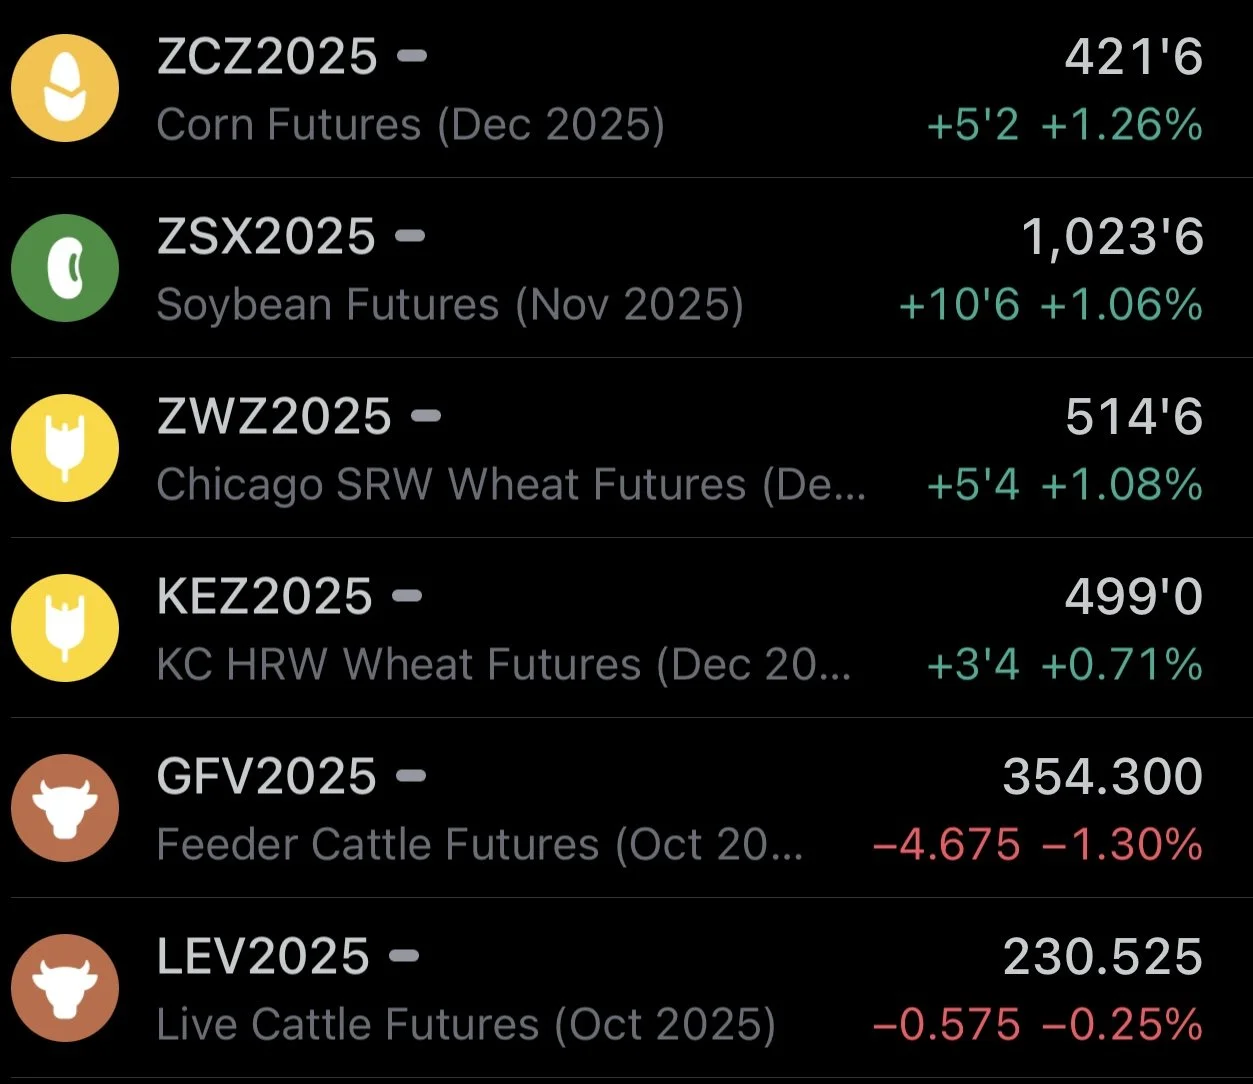
Grains higher for the 2nd day in a row following the recent sell off, meanwhile the cattle market takes another decent hit today.
What got into grains yesterday?
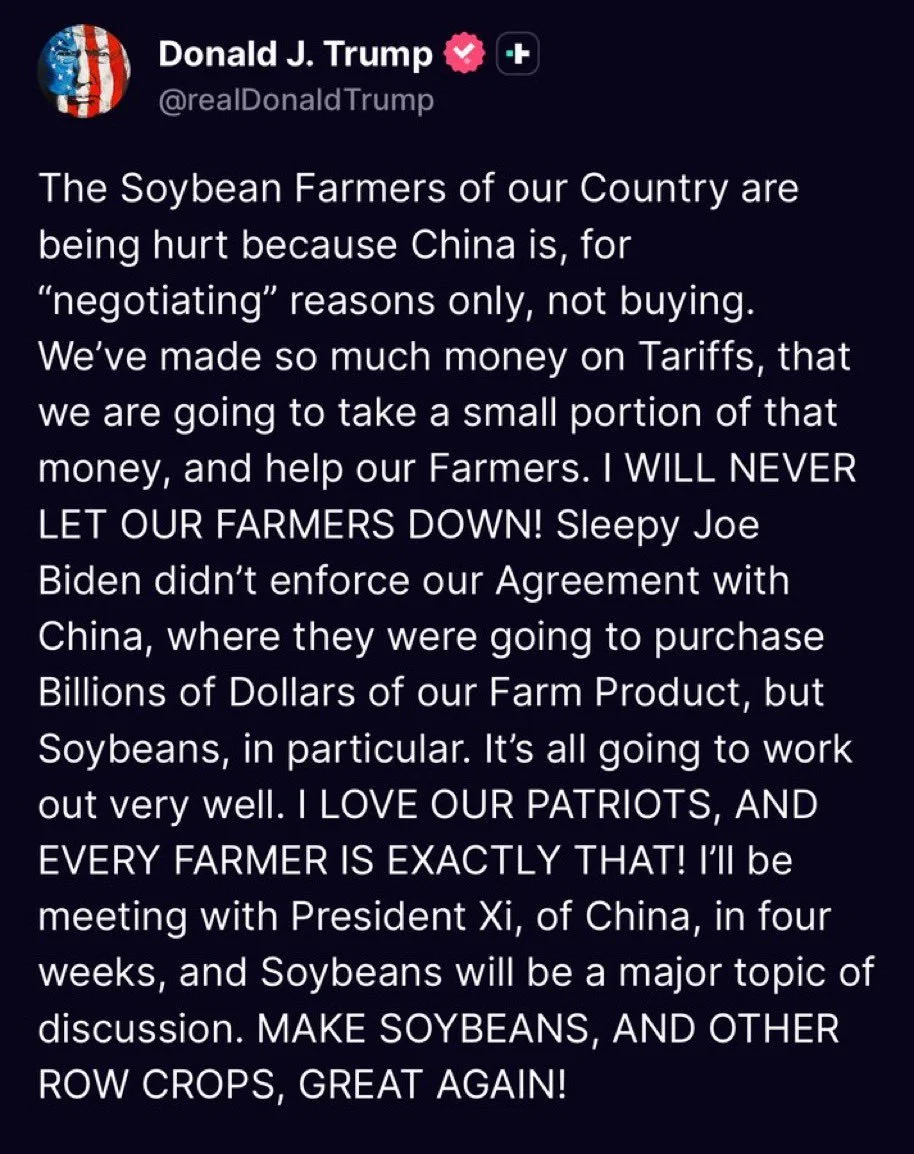
We talked about this in yesterday’s audio, but Trump basically made a statement saying he will be meeting with China's President in 4 weeks.
He said soybeans will be a major topic of focus in this meeting.
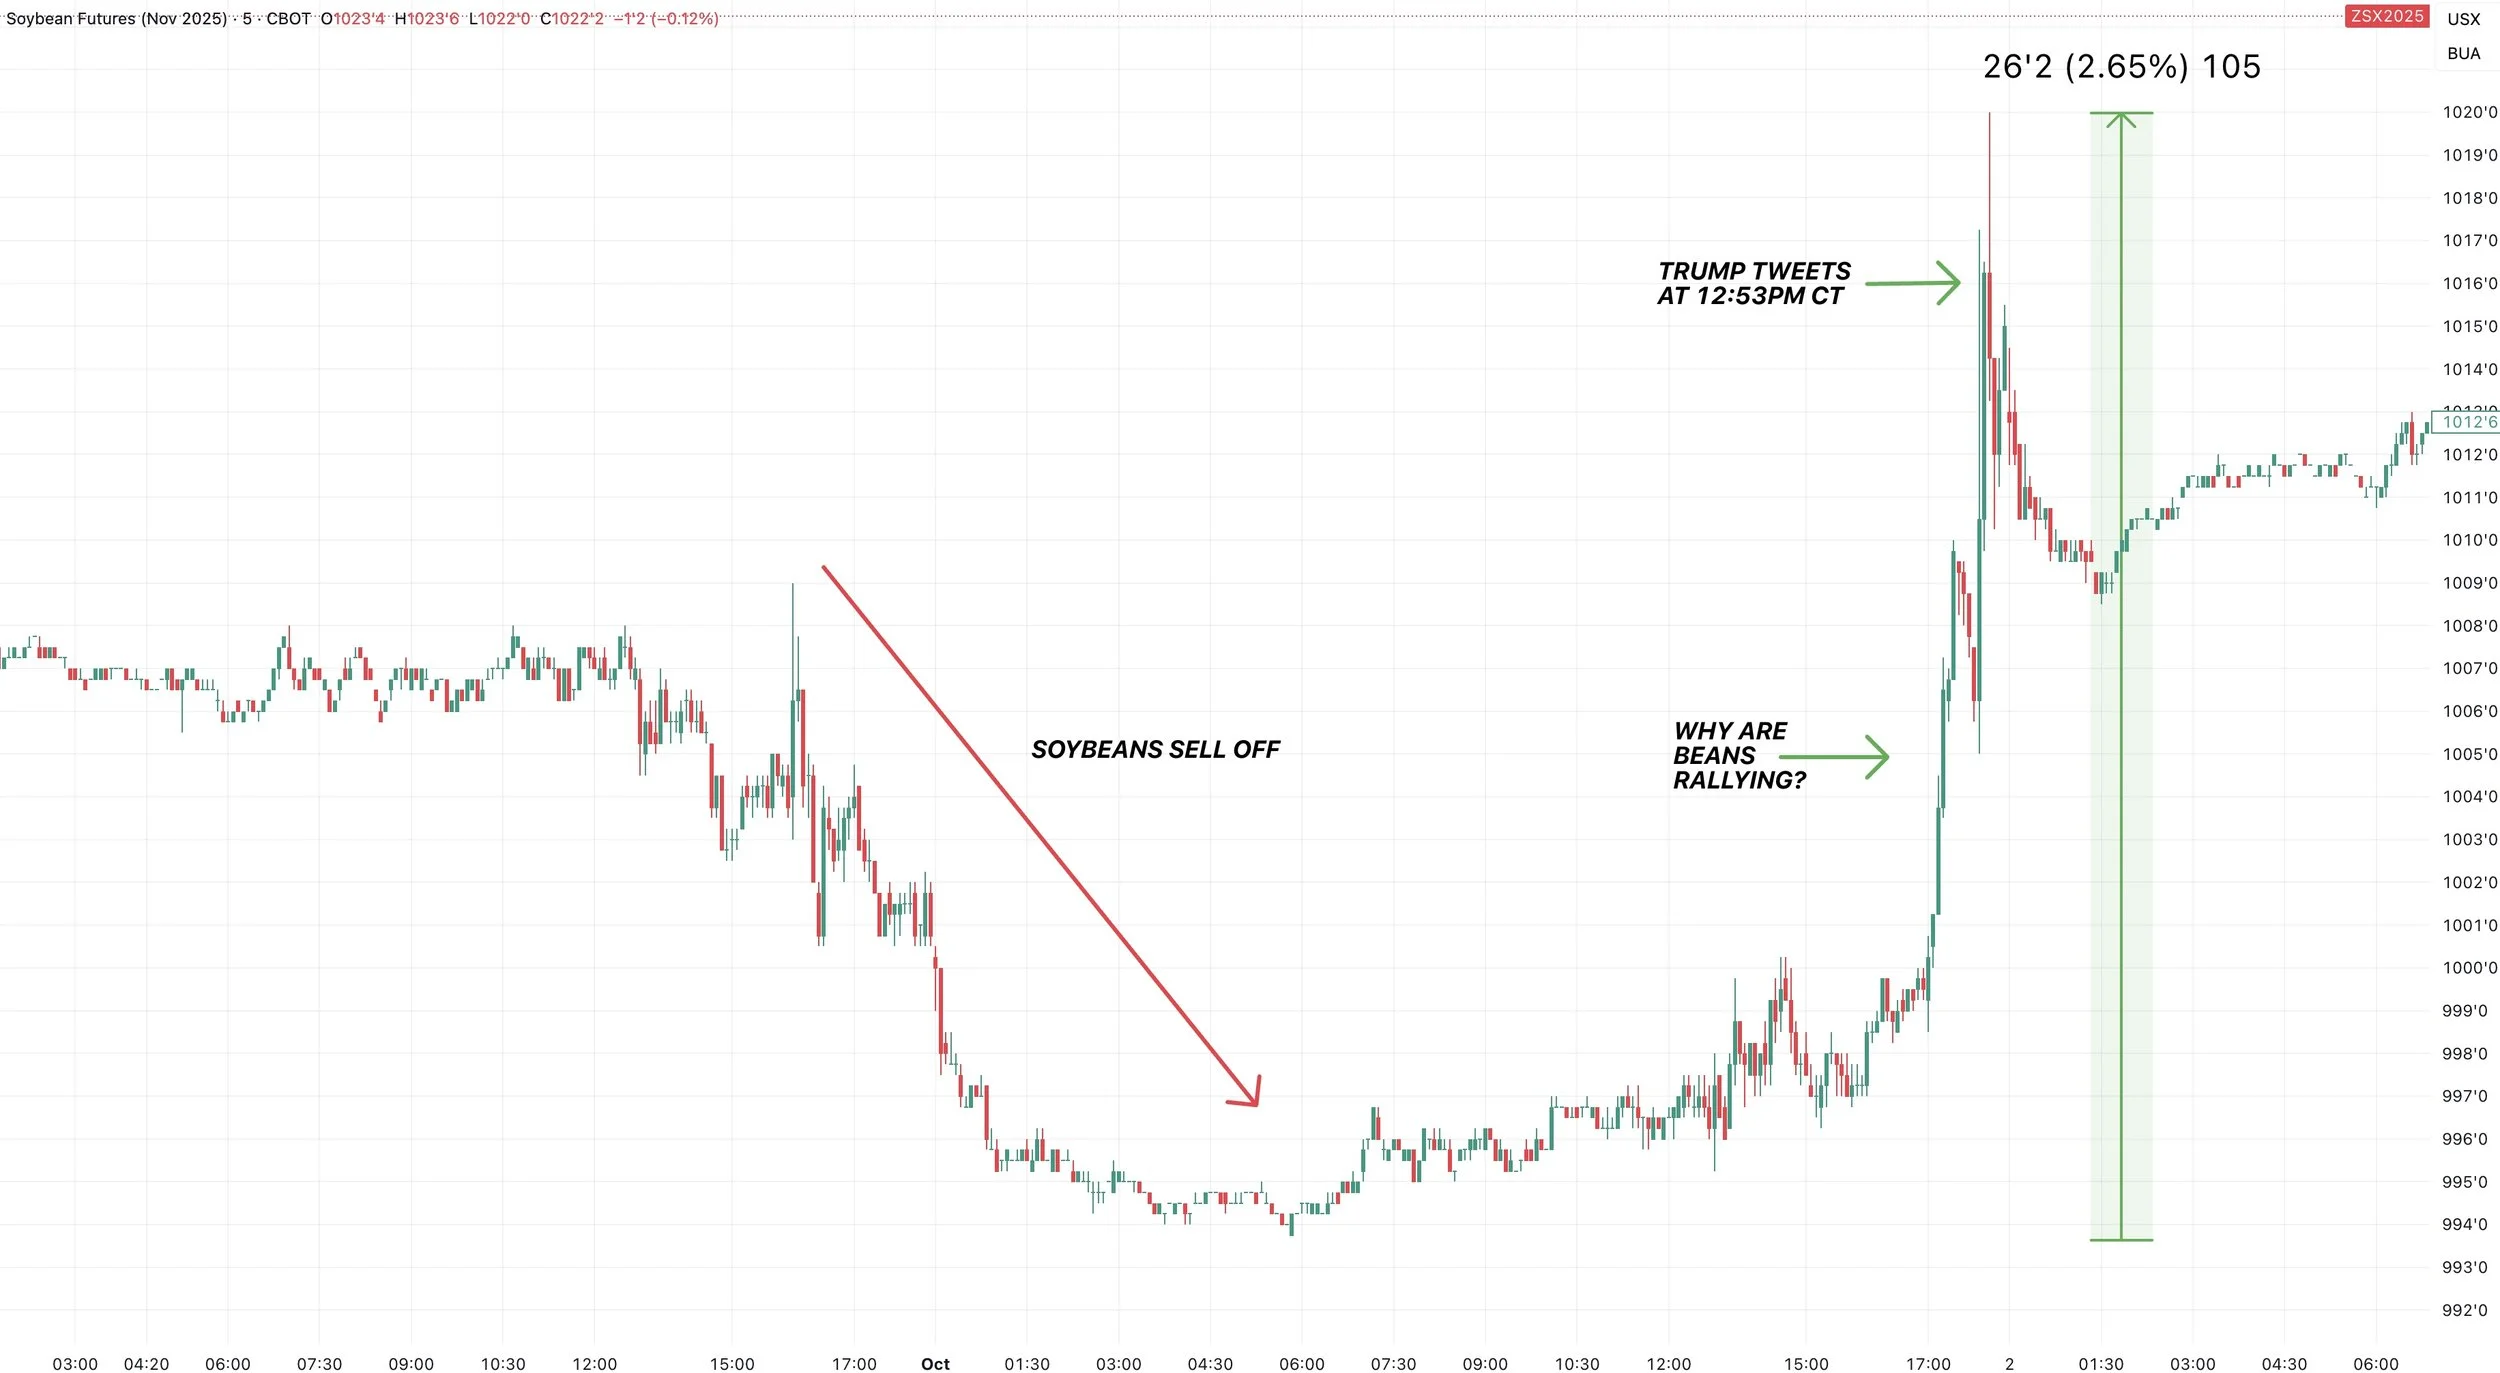
Soybeans were down hard early yesterday.
Then about an hour before he made his statement, soybeans started rallying hard out of absolutely nowhere.
So there was definitely some insider trading going on somewhere. Someone always knows something.
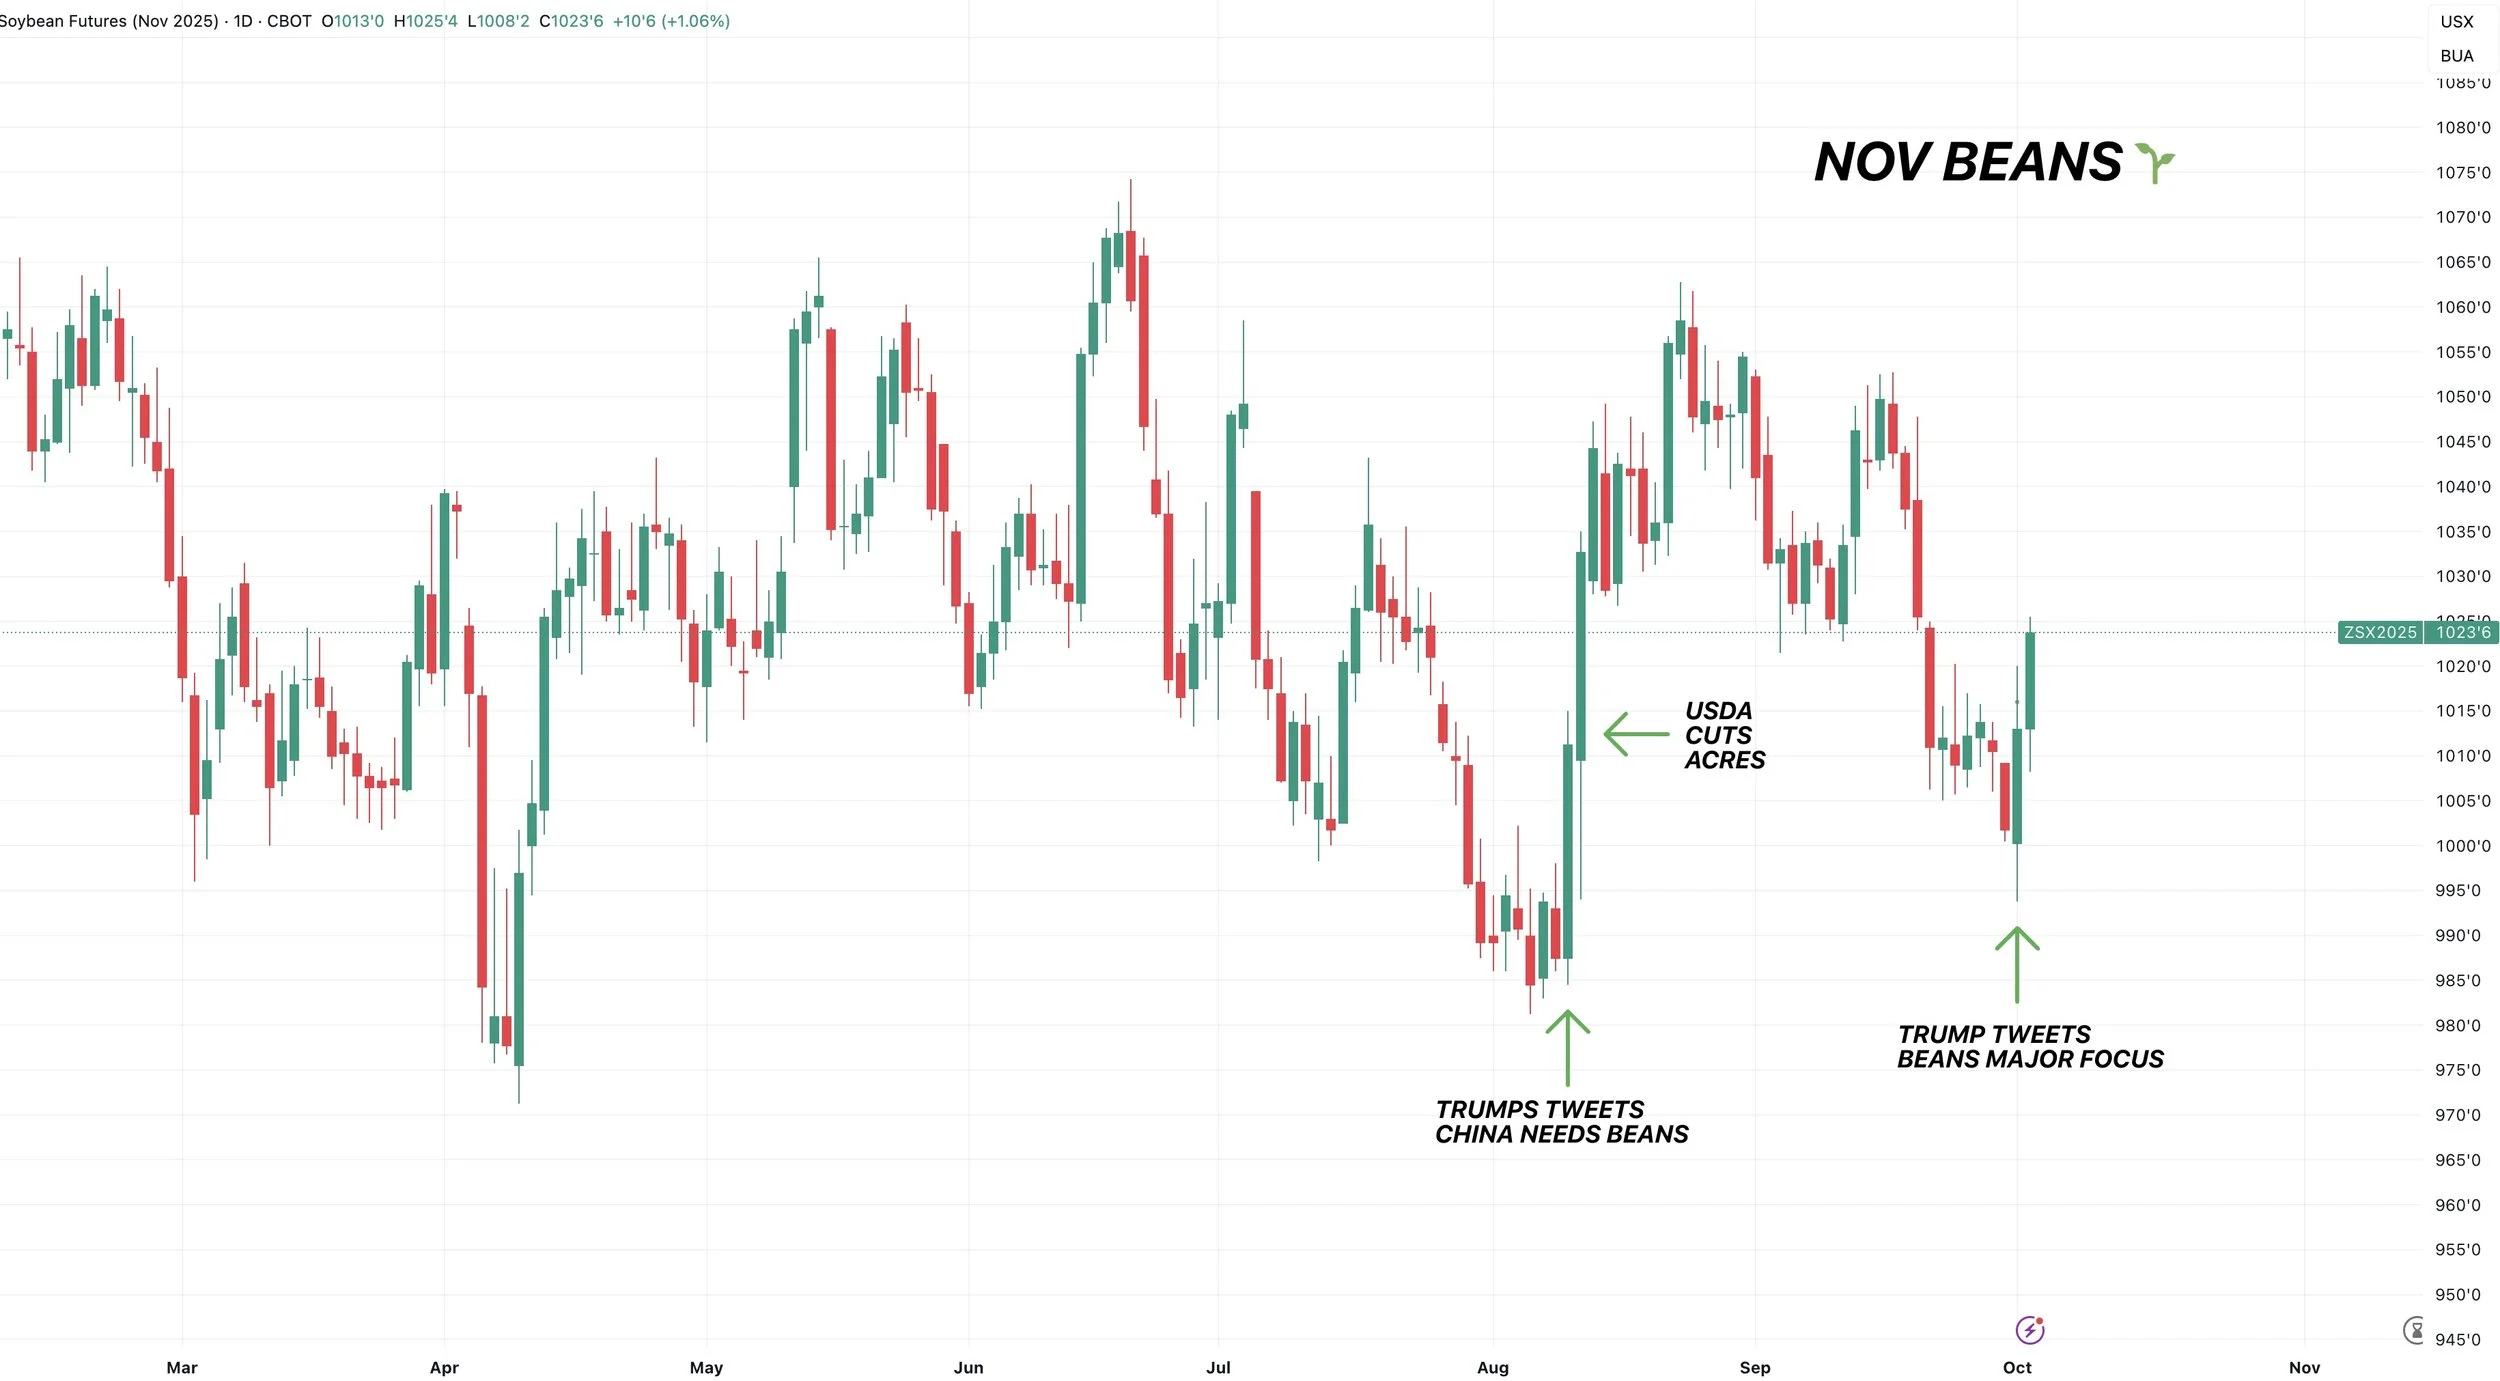
Here is a time line of the soybean chart from yesterday. We rallied +26 cents off the lows because of one simple tweet.
This is the 2nd time Trump has posted about soybeans since he stepped into office, and the first time since August 10th.
Here is his tweet from August 10th.
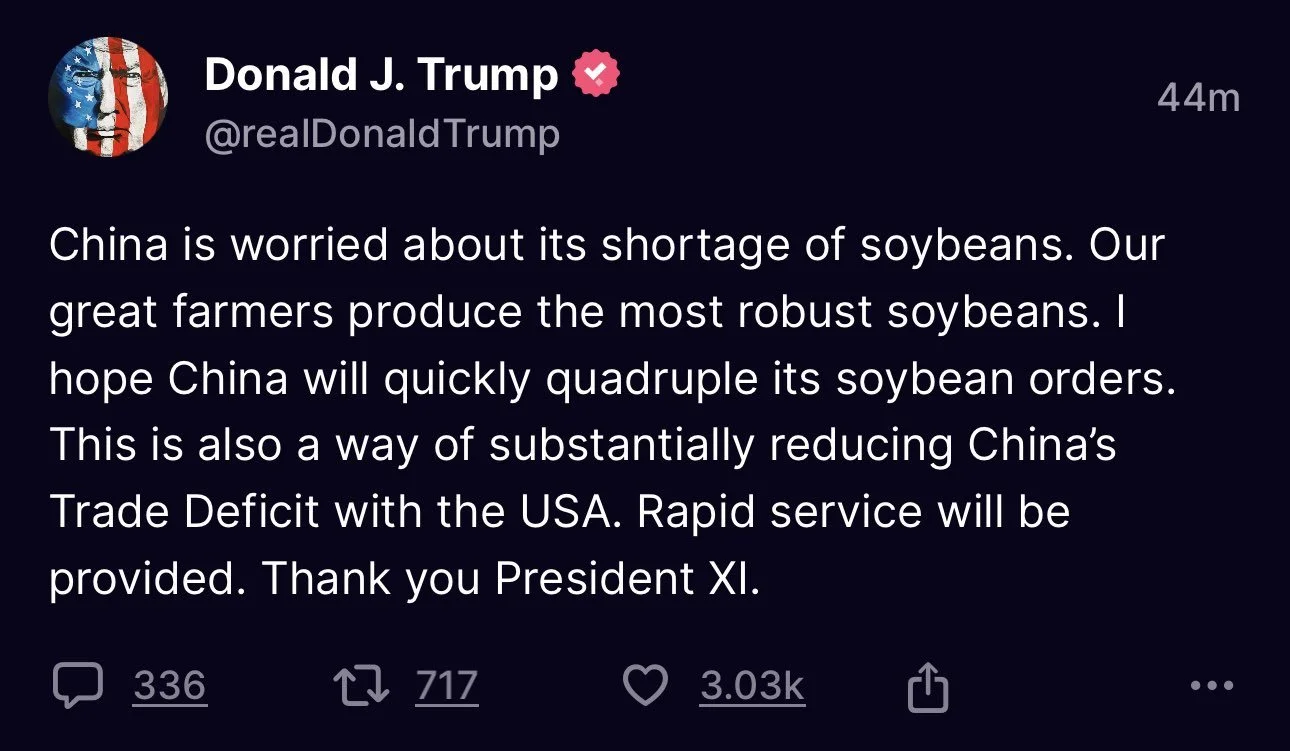
What happened last time he tweeted about soybeans?
It did happen to mark the exact local bottom. As he said China was worried about their shortage of beans.
As we then went on an +80 cent rally.
Could we see a same situation play out..?
It's possible, BUT last time we also had a very bullish USDA report the day after the tweet, which added even more fuel to the fire. That is when bean acres fell.
The market gets excited about these statements, but in reality, these statements alone do not make a real fundamental change.
It is a nice change of sentiment, but it still doesn’t really move the needle until something is actually materially changed.
If that meeting is in 4 weeks, that puts us into November.
We probably won’t see any major purchases before that.
So there is the potential that we have to wait until December to January before we make any meaningful sales to China.
The problem with that is that when January rolls around, it is no longer our prime time shipping window. China puts it's focus on Brazil's crop.

Government Shutdown
The other big news is that the Government is now shutdown.
This is the first government shutdown since 2018.
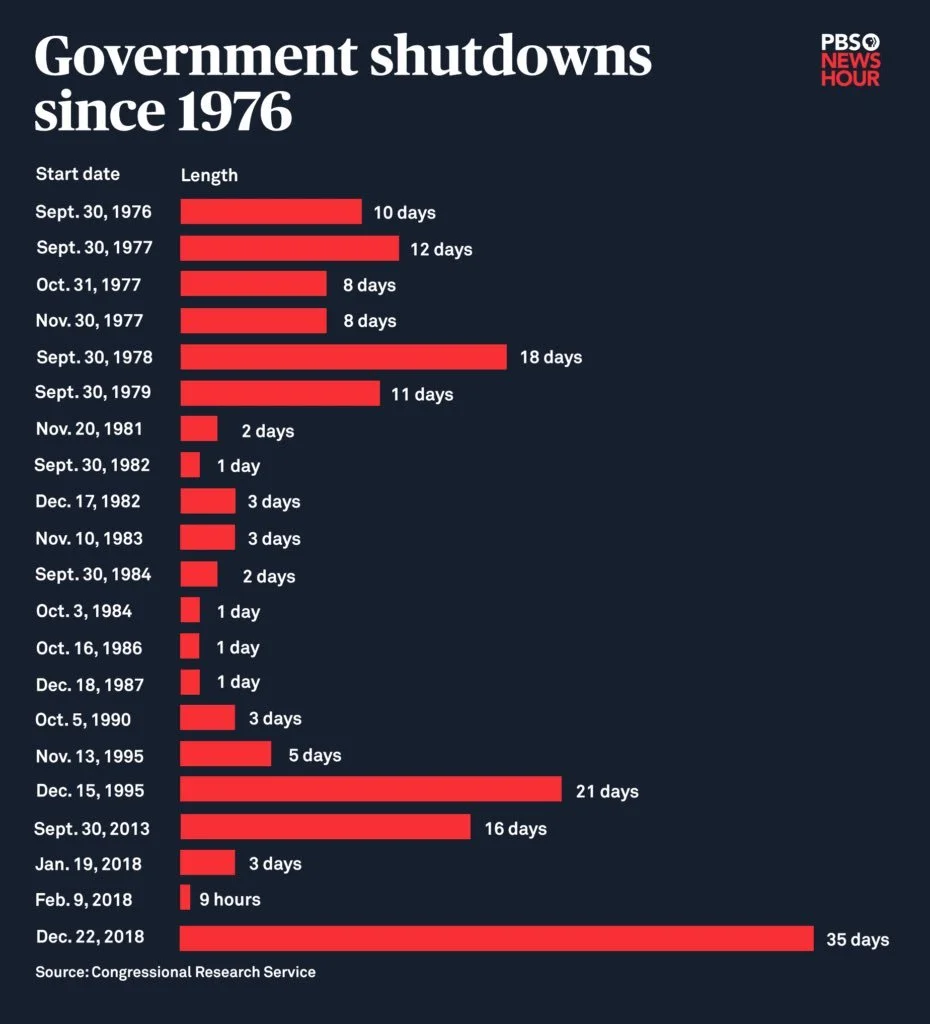
Last time we were shut down for about a month. From Dec 22nd, 2018, to January 25th, 2019.
Here are the last shutdowns and how long they lasted.
The last one was the longest ever at 35 days.
What does this mean?
It means we will not have any new data to work with. No export sales. So even if China magically started buying our grain we wouldn’t know.
There are rumors that China might be "secretly" buying our soybeans. Because it wouldn’t be reported if they did. China did this last time back in 2018 as well. When we were also in a trade war. But again this is just a rumor and zero facts to back it up.
We also won’t get crop conditions. We won’t be getting any data that the government typically releases. This includes next week’s USDA report.
The USDA announced that its WASDE report, which was scheduled for Oct 9th, has now been suspended until further notice.
It is not guaranteed that we will not get the USDA report, but it does not seem very likely.
This is an important report because the market wants to know the size of the crops and how the USDA was going to implement that extra +200 million bushels of beginning stocks we just saw in the quarterly stocks report.
It looks like we are going to have to wait until November to see what the USDA thinks about the size of these crops.
If we do not get next week's report, that leaves us with just the November report and then the January report.
The betting markets are expecting this shutdown to last for 13 days. Which would miss that USDA report.

Record Corn Exports & Poor Bean Exports
Since the goverement is shut down, we did not get actual export sales data.
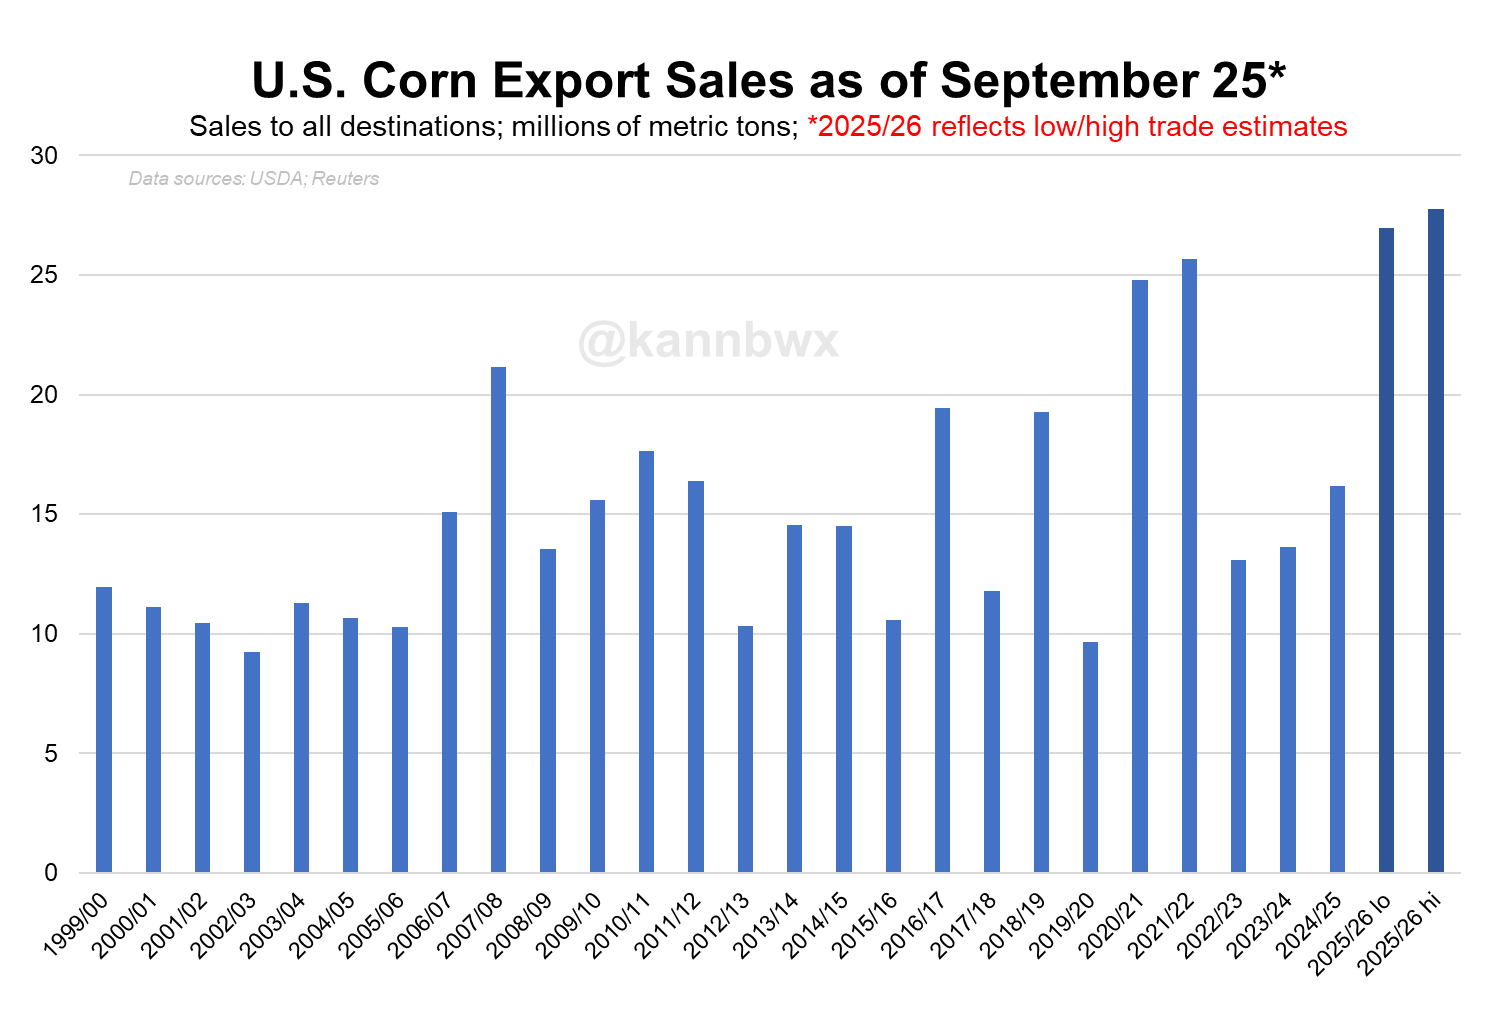
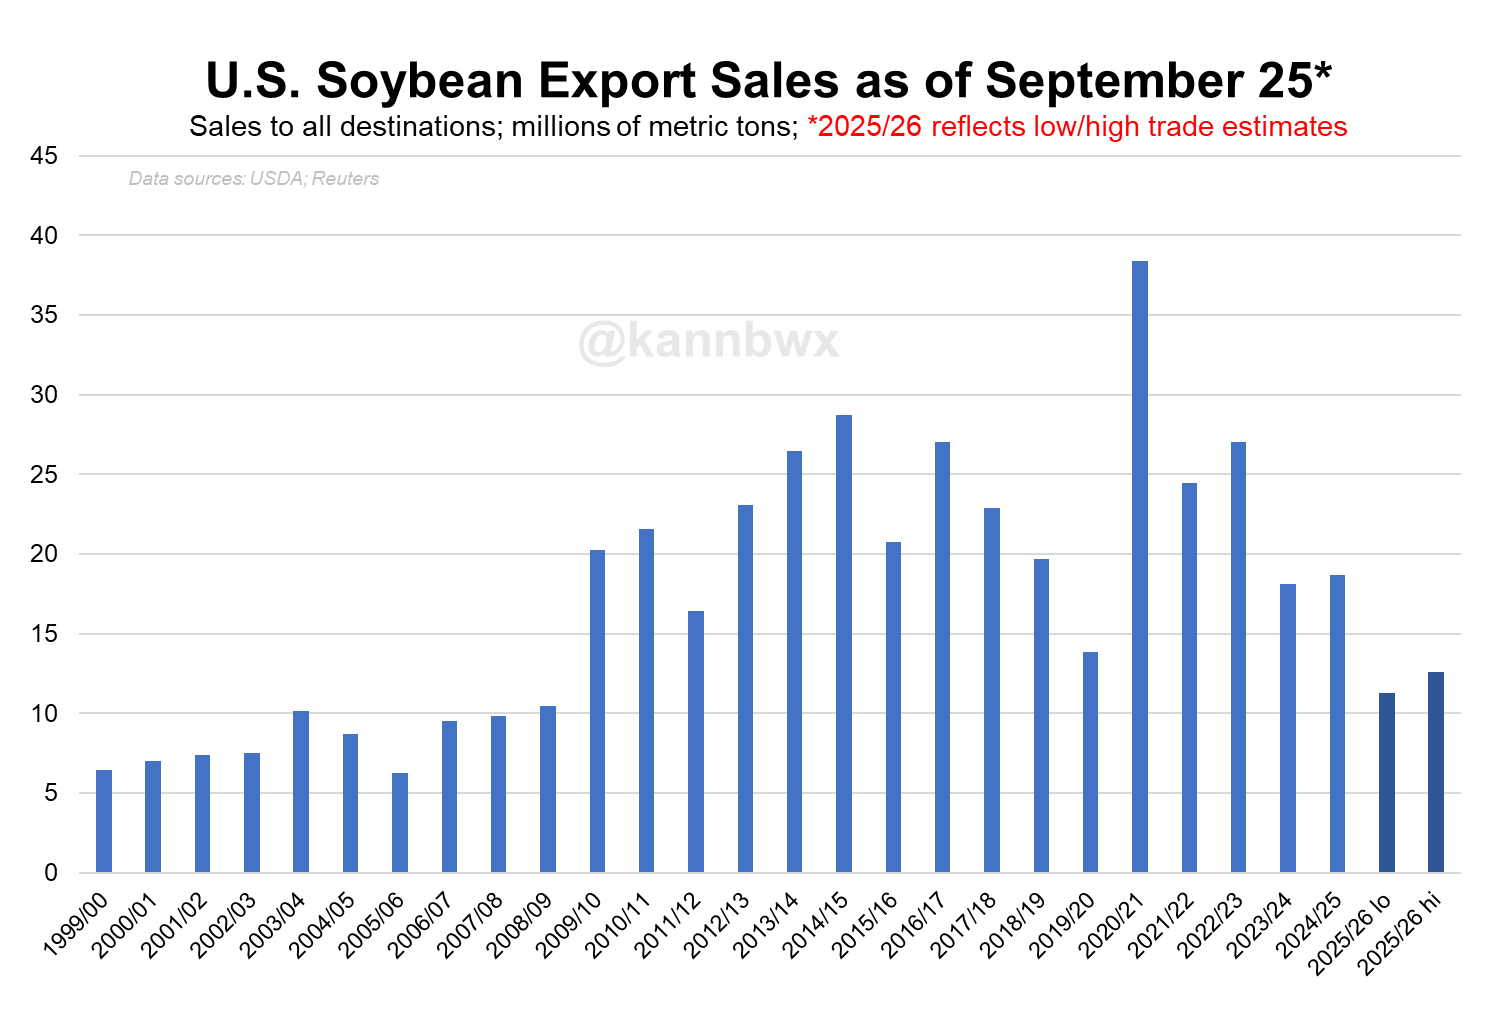
However, here are two great charts from Karen Braun.
In these charts, she adds where exports would be if they had came in at the high end of the trade estimates or the low end of the estimates.
For corn, we are looking at record exports no matter how you slice it.
For soybeans, even if they would’ve came in on the high end we are still looking at one of the worst export books in decades. Even worse than the last trade war.
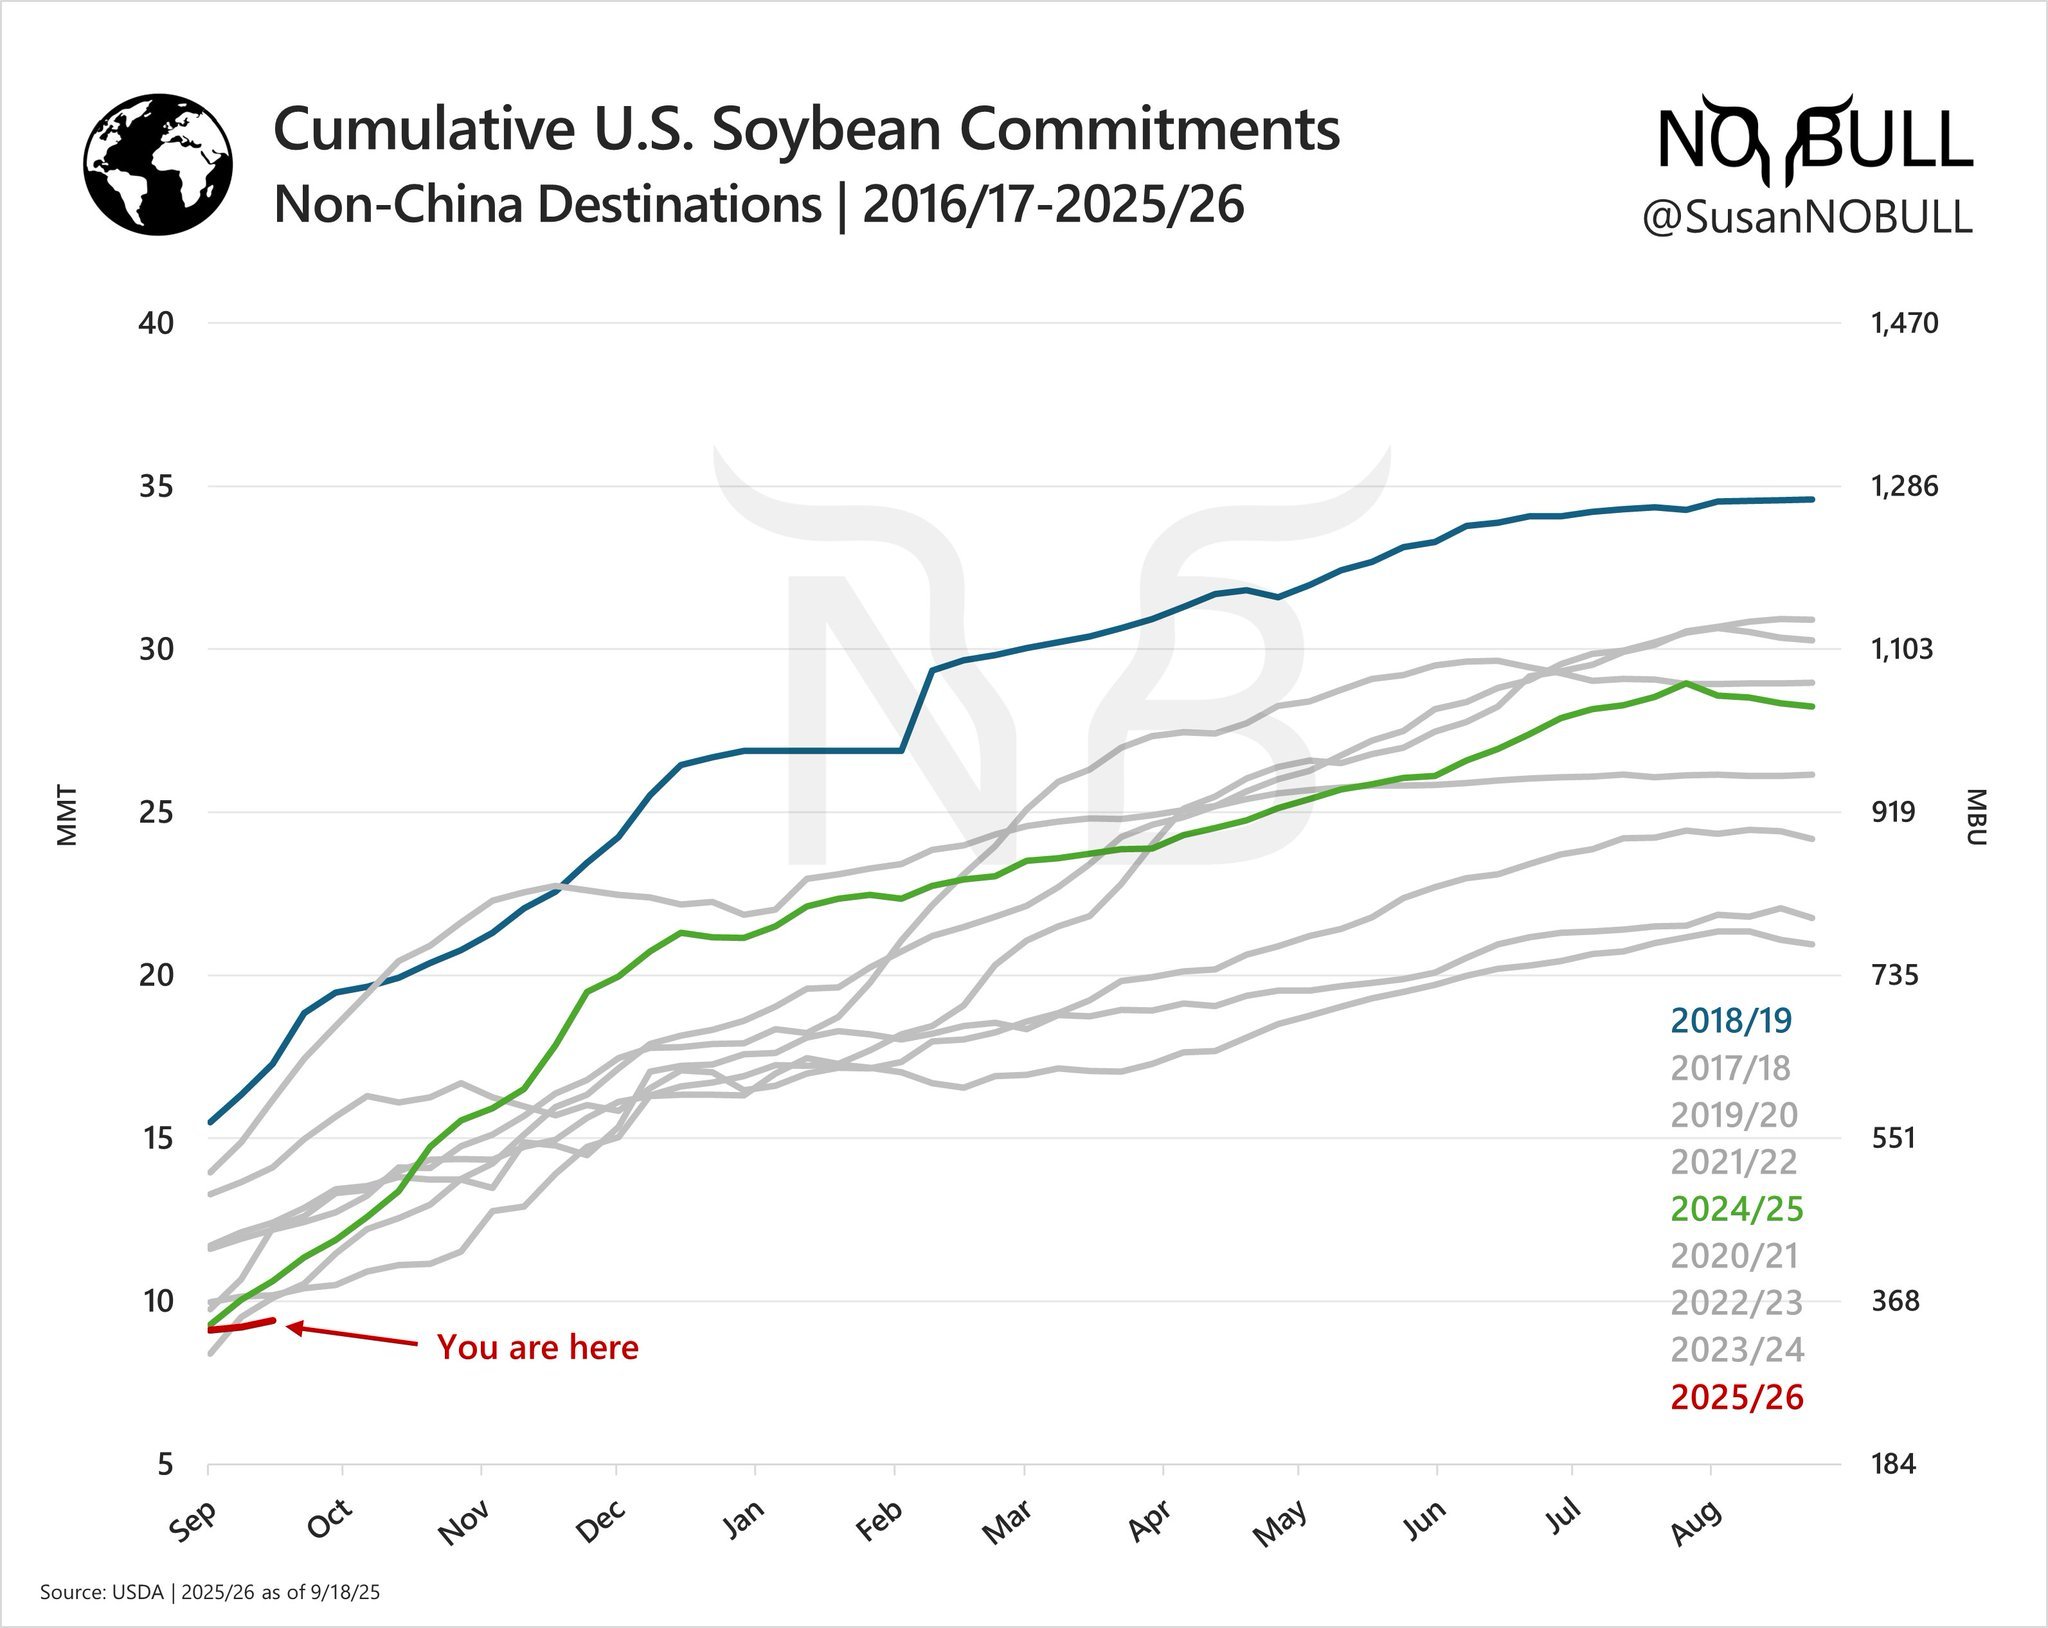
Here is a nice chart from Susan at NoBull Ag.
This chart shows exports to non-China destinations for this year, last year, and last trade war.
Last trade war, other countries showed up to help fill in the absence of China.
It is still very early, but so far this year, we are lagging behind in a big way.
Trump Exploring Bailout
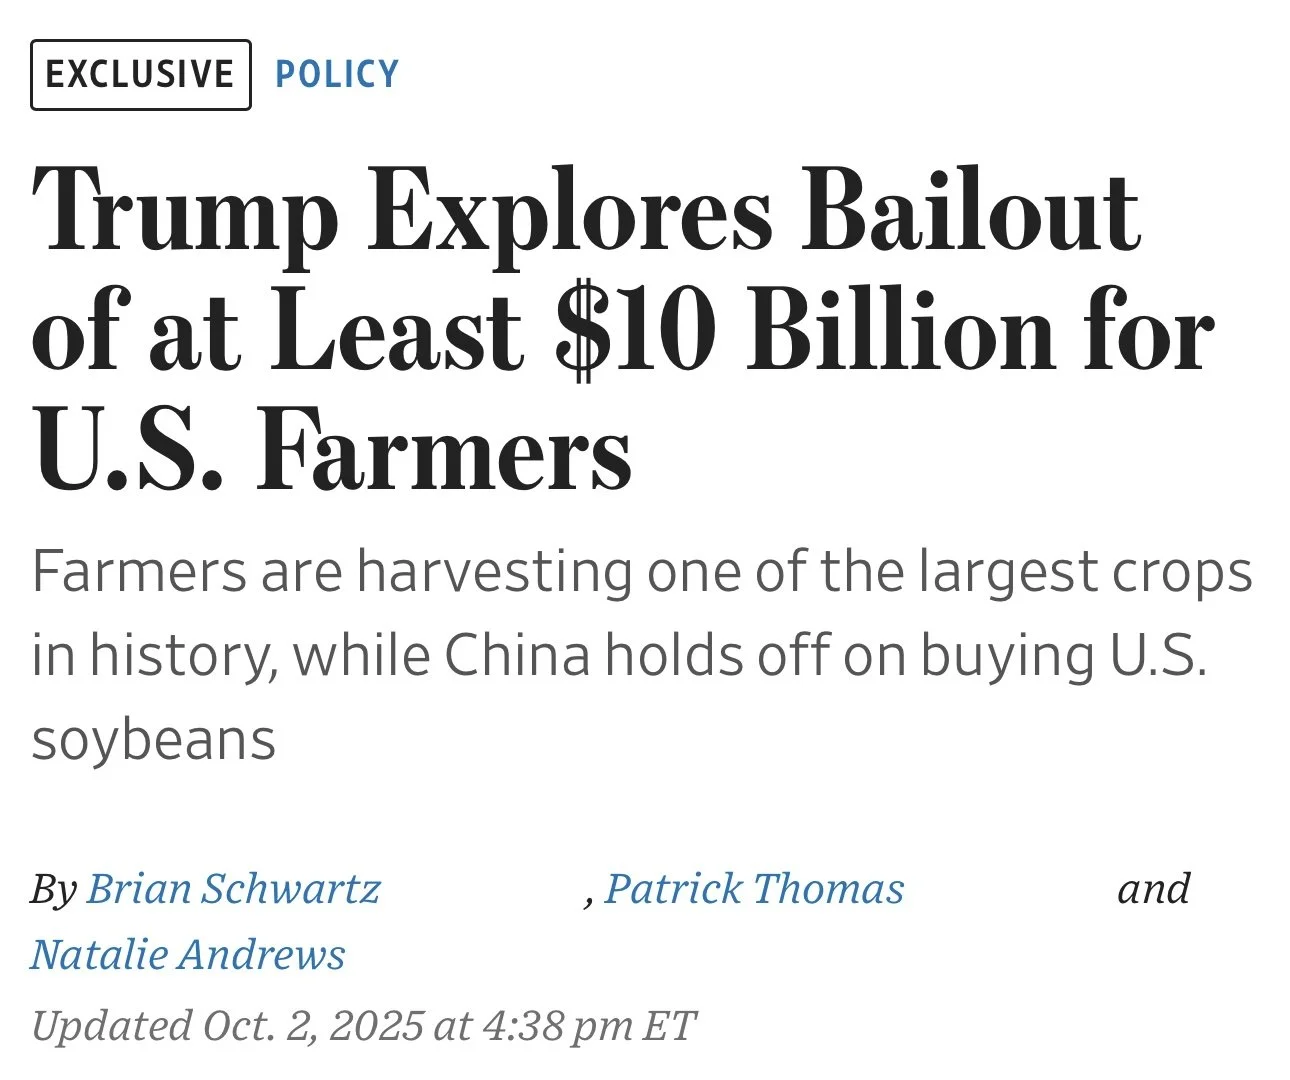
Today Wall Street Journal posted an article titled:
"Trump Explores Bailout of at Least $10 Billion for US Farmers"
The article went on to say that farmers are harvesting one of the largest crops in history while China holds off on buying US soybeans.
It said Trump is considering this $10 billion aid as the ag sector warns of economic fallout from his far-reaching tariffs.
The President and his team are weighing using tariff revenue to fund much of the aid, adding that the distribution of the money could start in the coming months.
This news does kind of make it seem like we won't be getting a trade really soon, but at least they are well aware of the situation.
Technicals:
Corn
We bounced right in that golden zone retracement right where we wanted to see us bounce.
$4.07 is the level to watch to the downside. If we break below that, odds favor us going and testing those lows.
This box is where the market decides if this is simply a small correction or if we are going back to test the lows. So bouncing here is a great sign.
First upside target is still $4.35 which is 50% of the Feb highs.

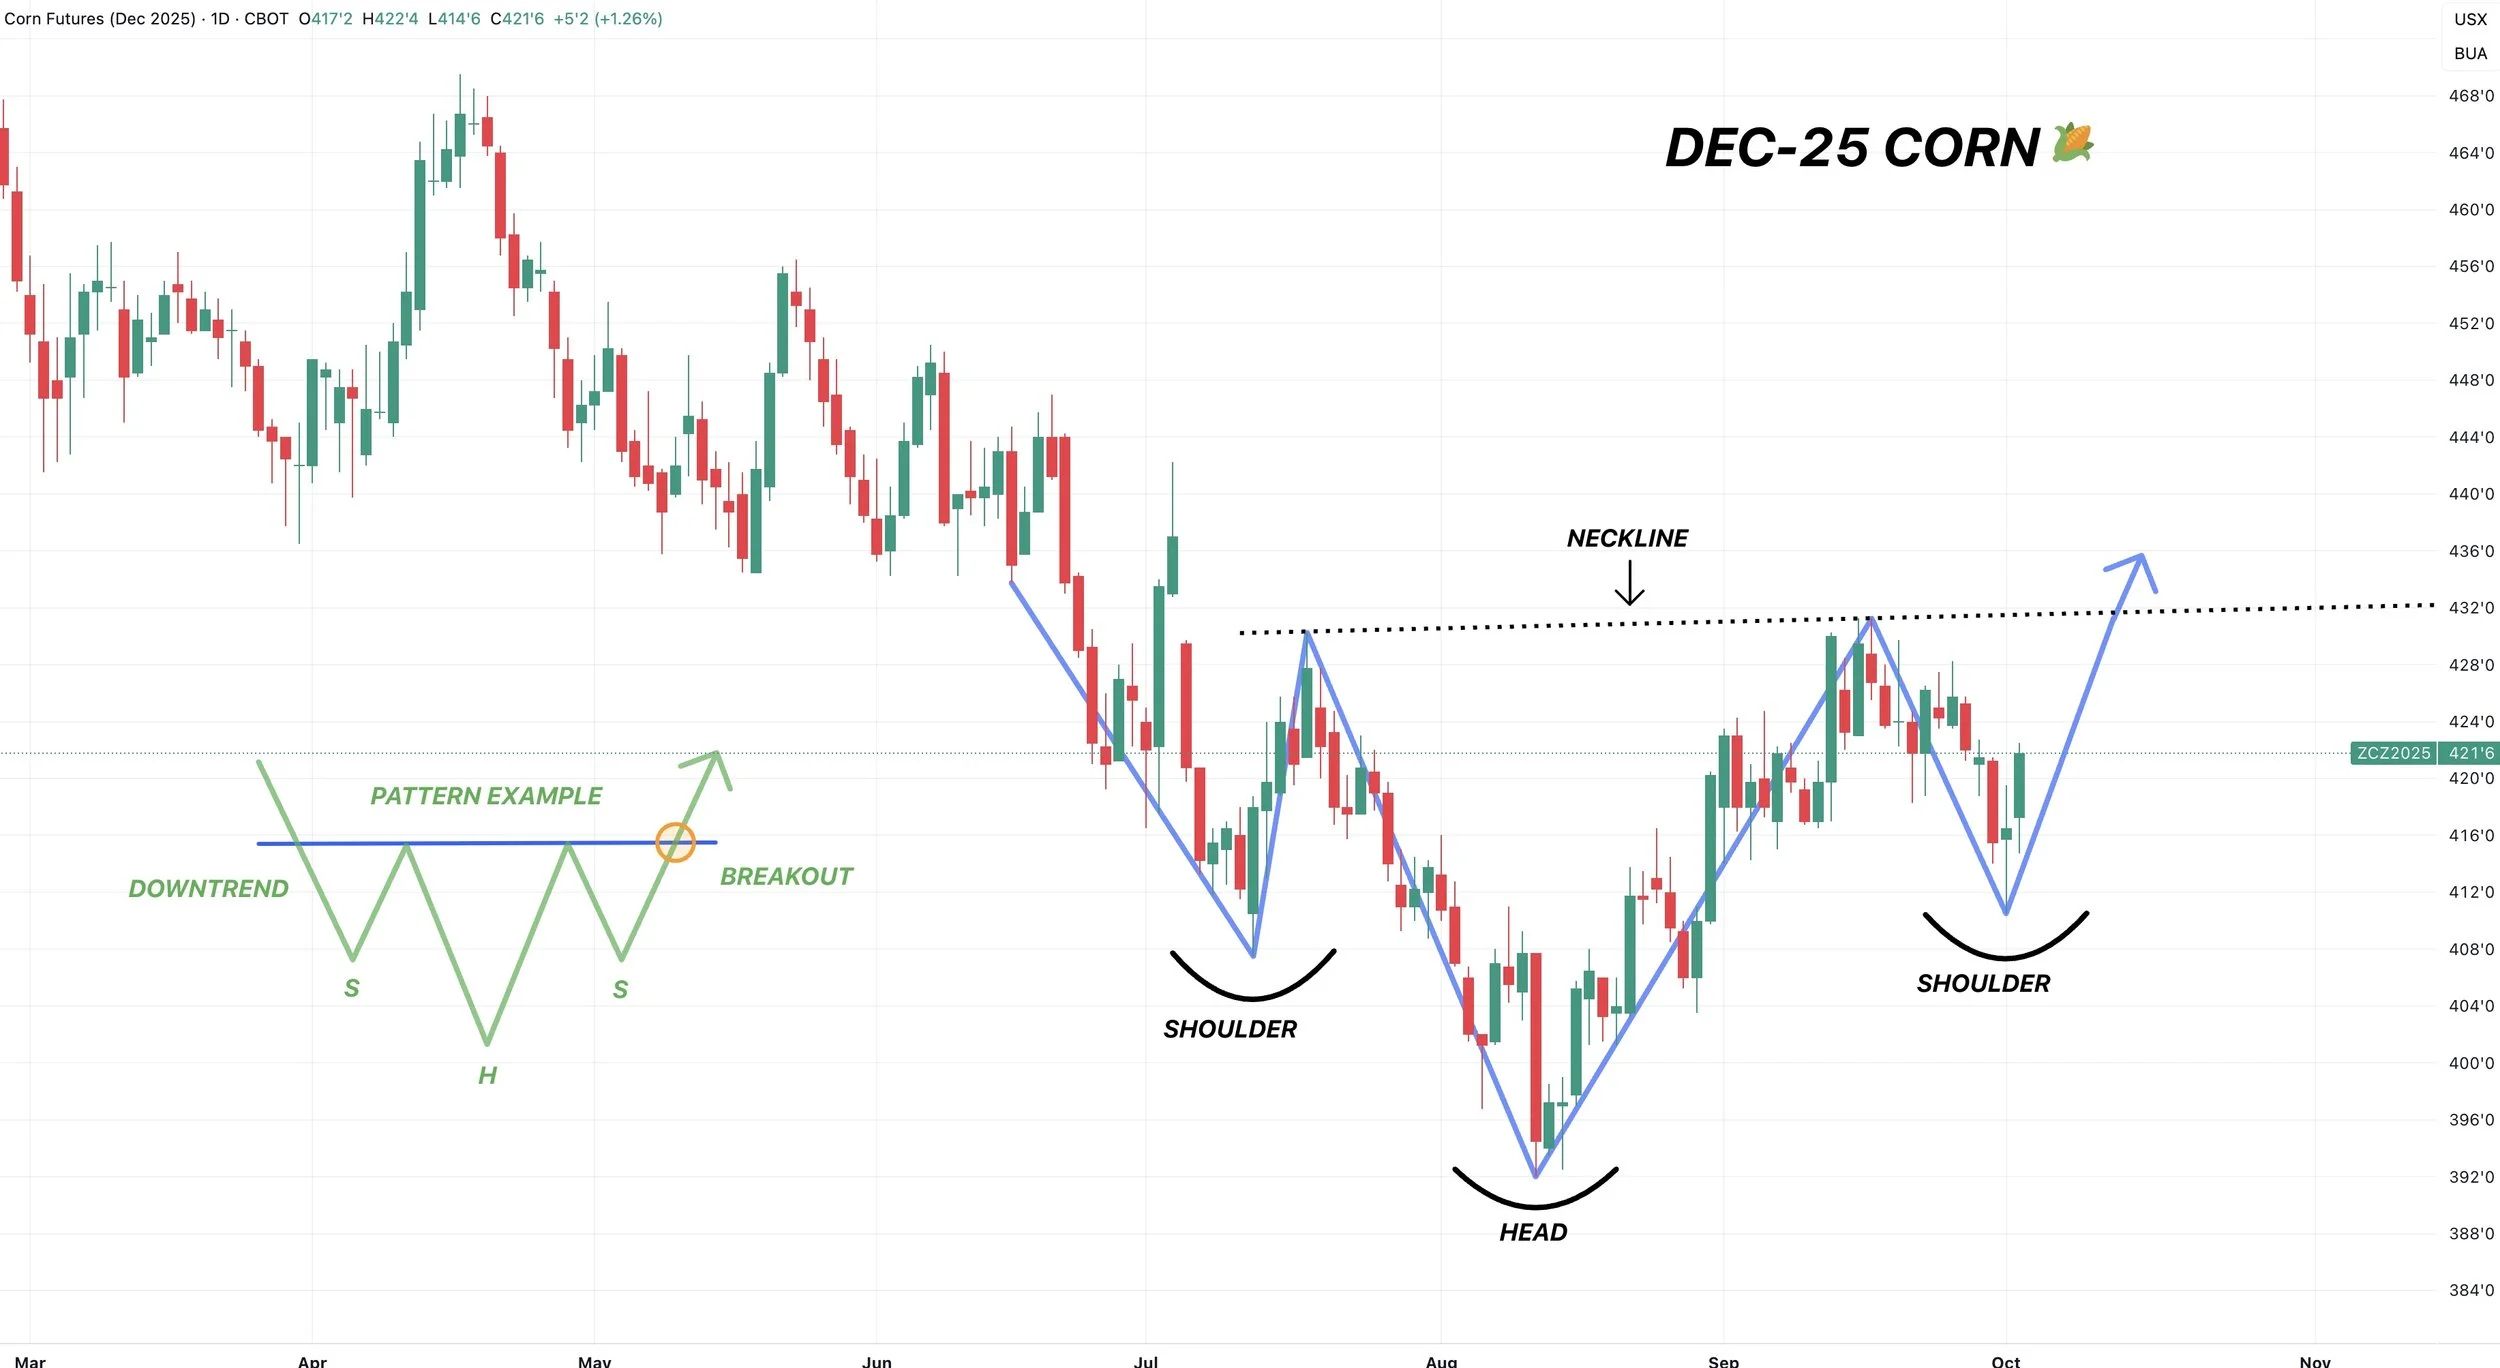
Here is a pretty interesting chart.
We have a potential inverse head & shoulders pattern forming here.
This is viewed as a bullish pattern if it plays out.
To get confirmation of a breakout, you need a break above that neckline.
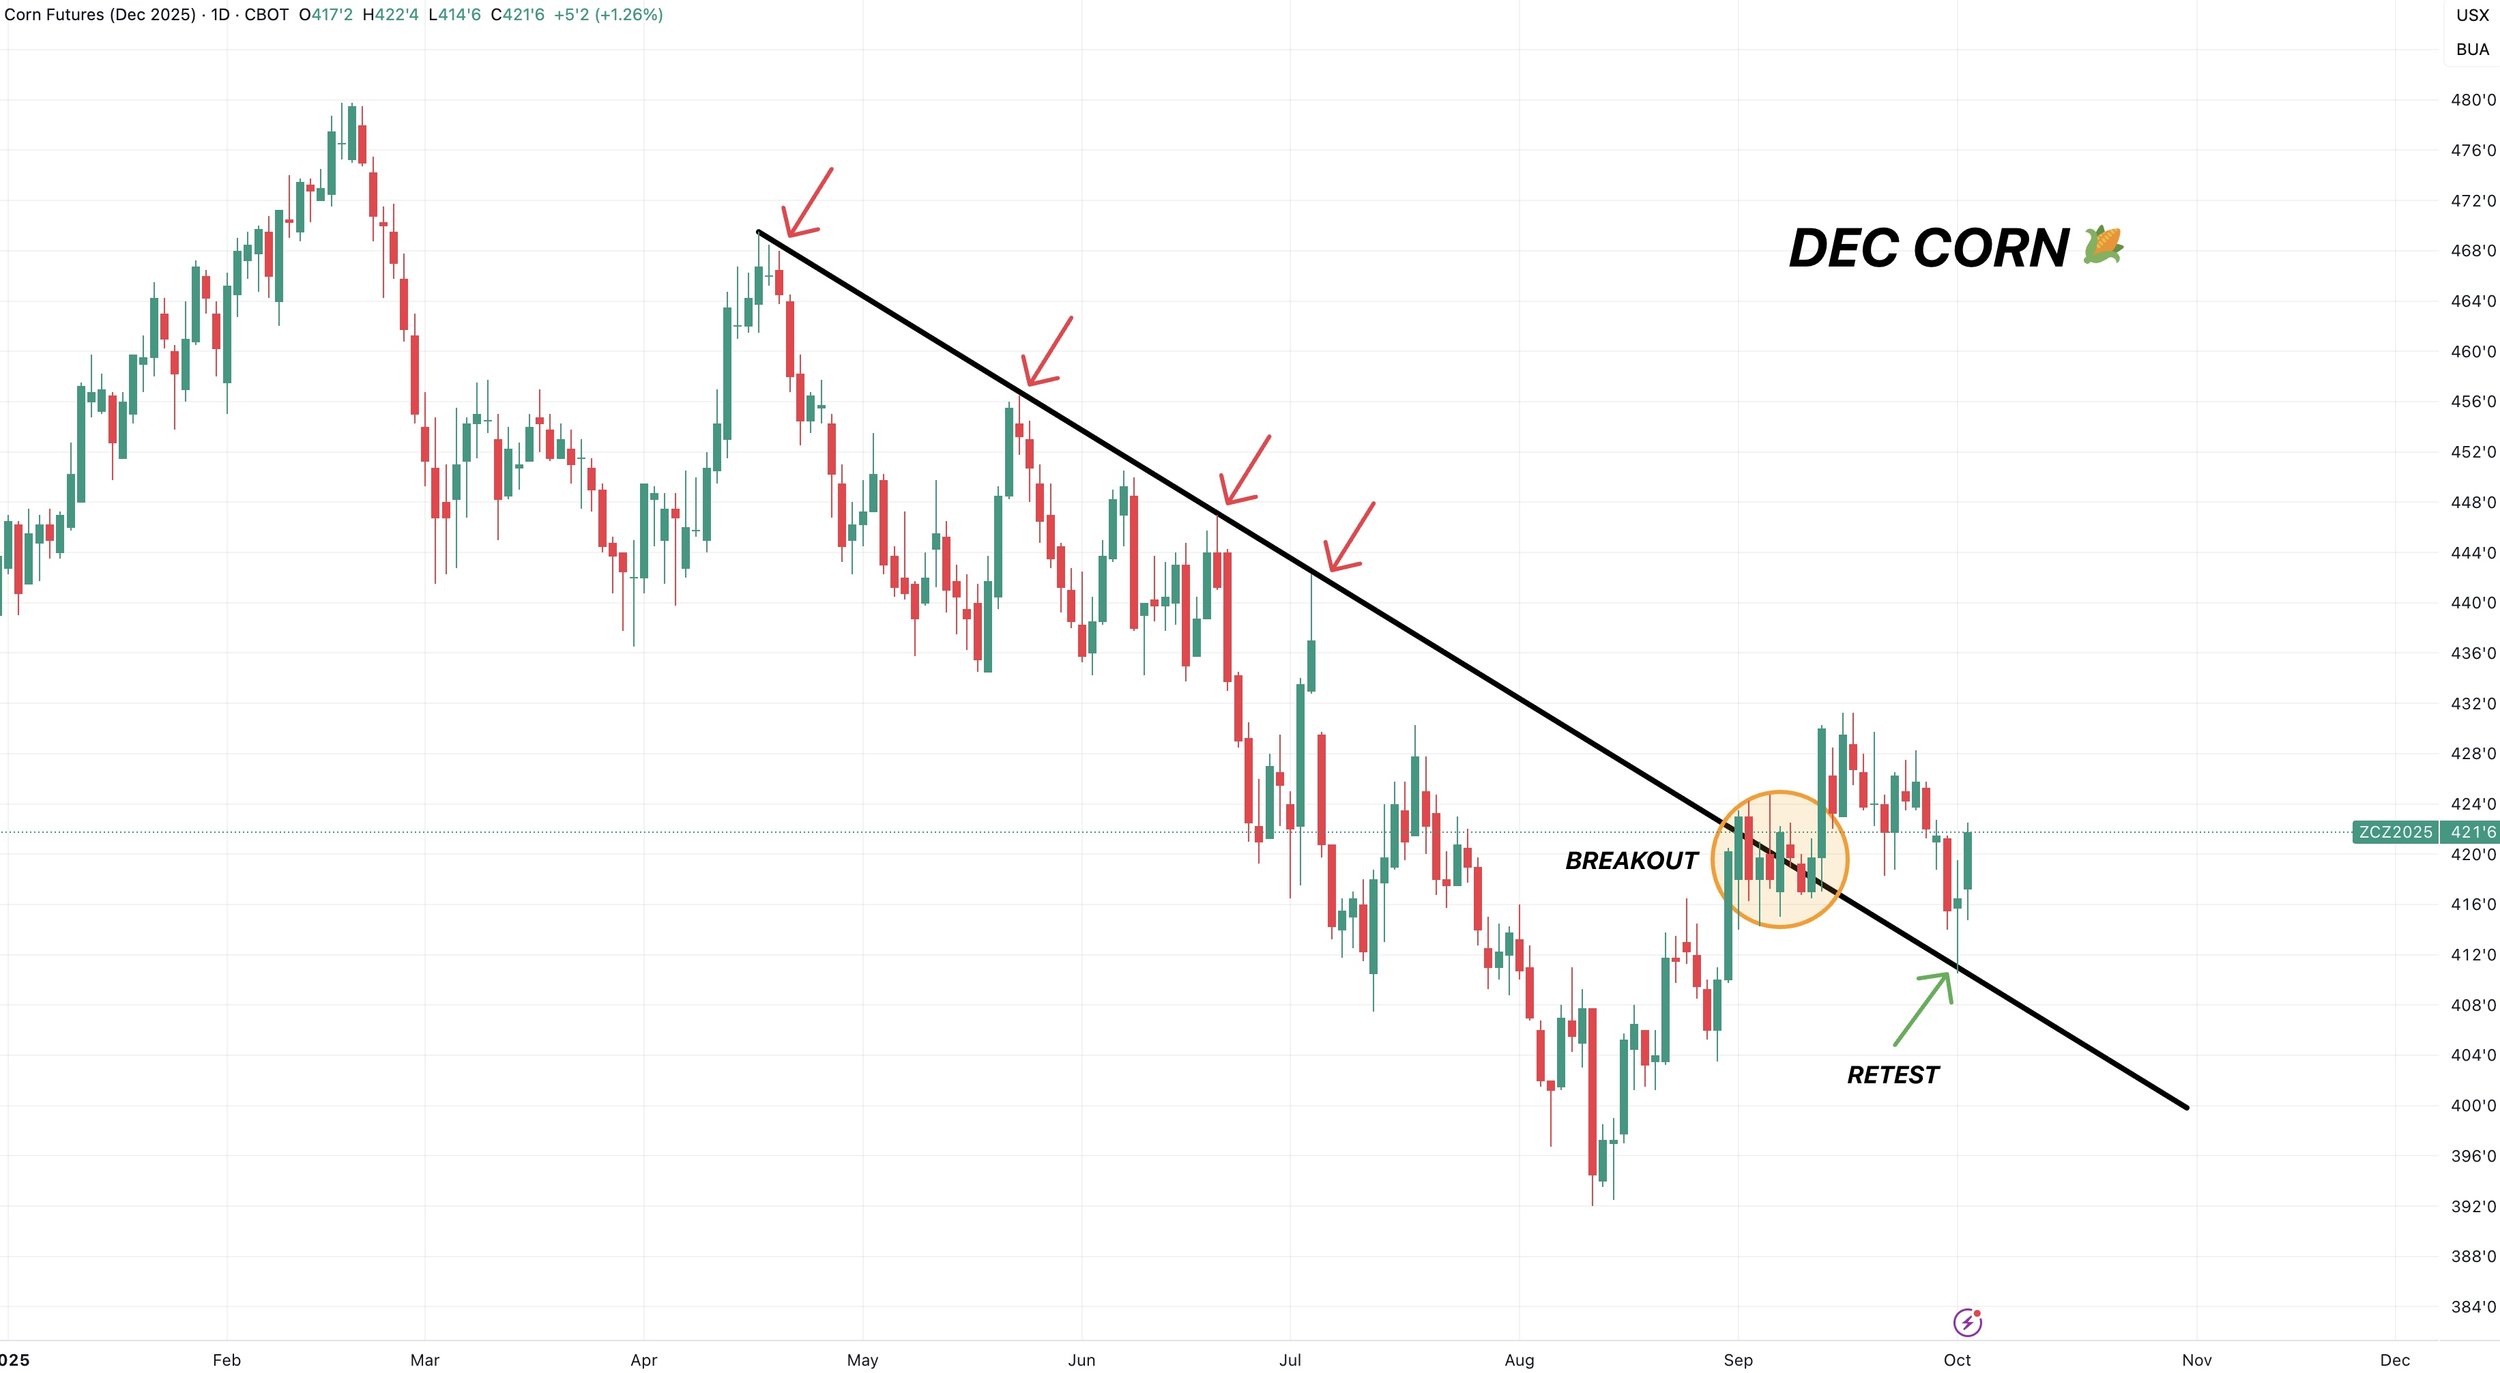
Remember that simple trendline that marked every top in this market since April?
We got the breakout a few weeks ago.
On the recent sell off, we almost perfectly back tested it before bouncing higher.
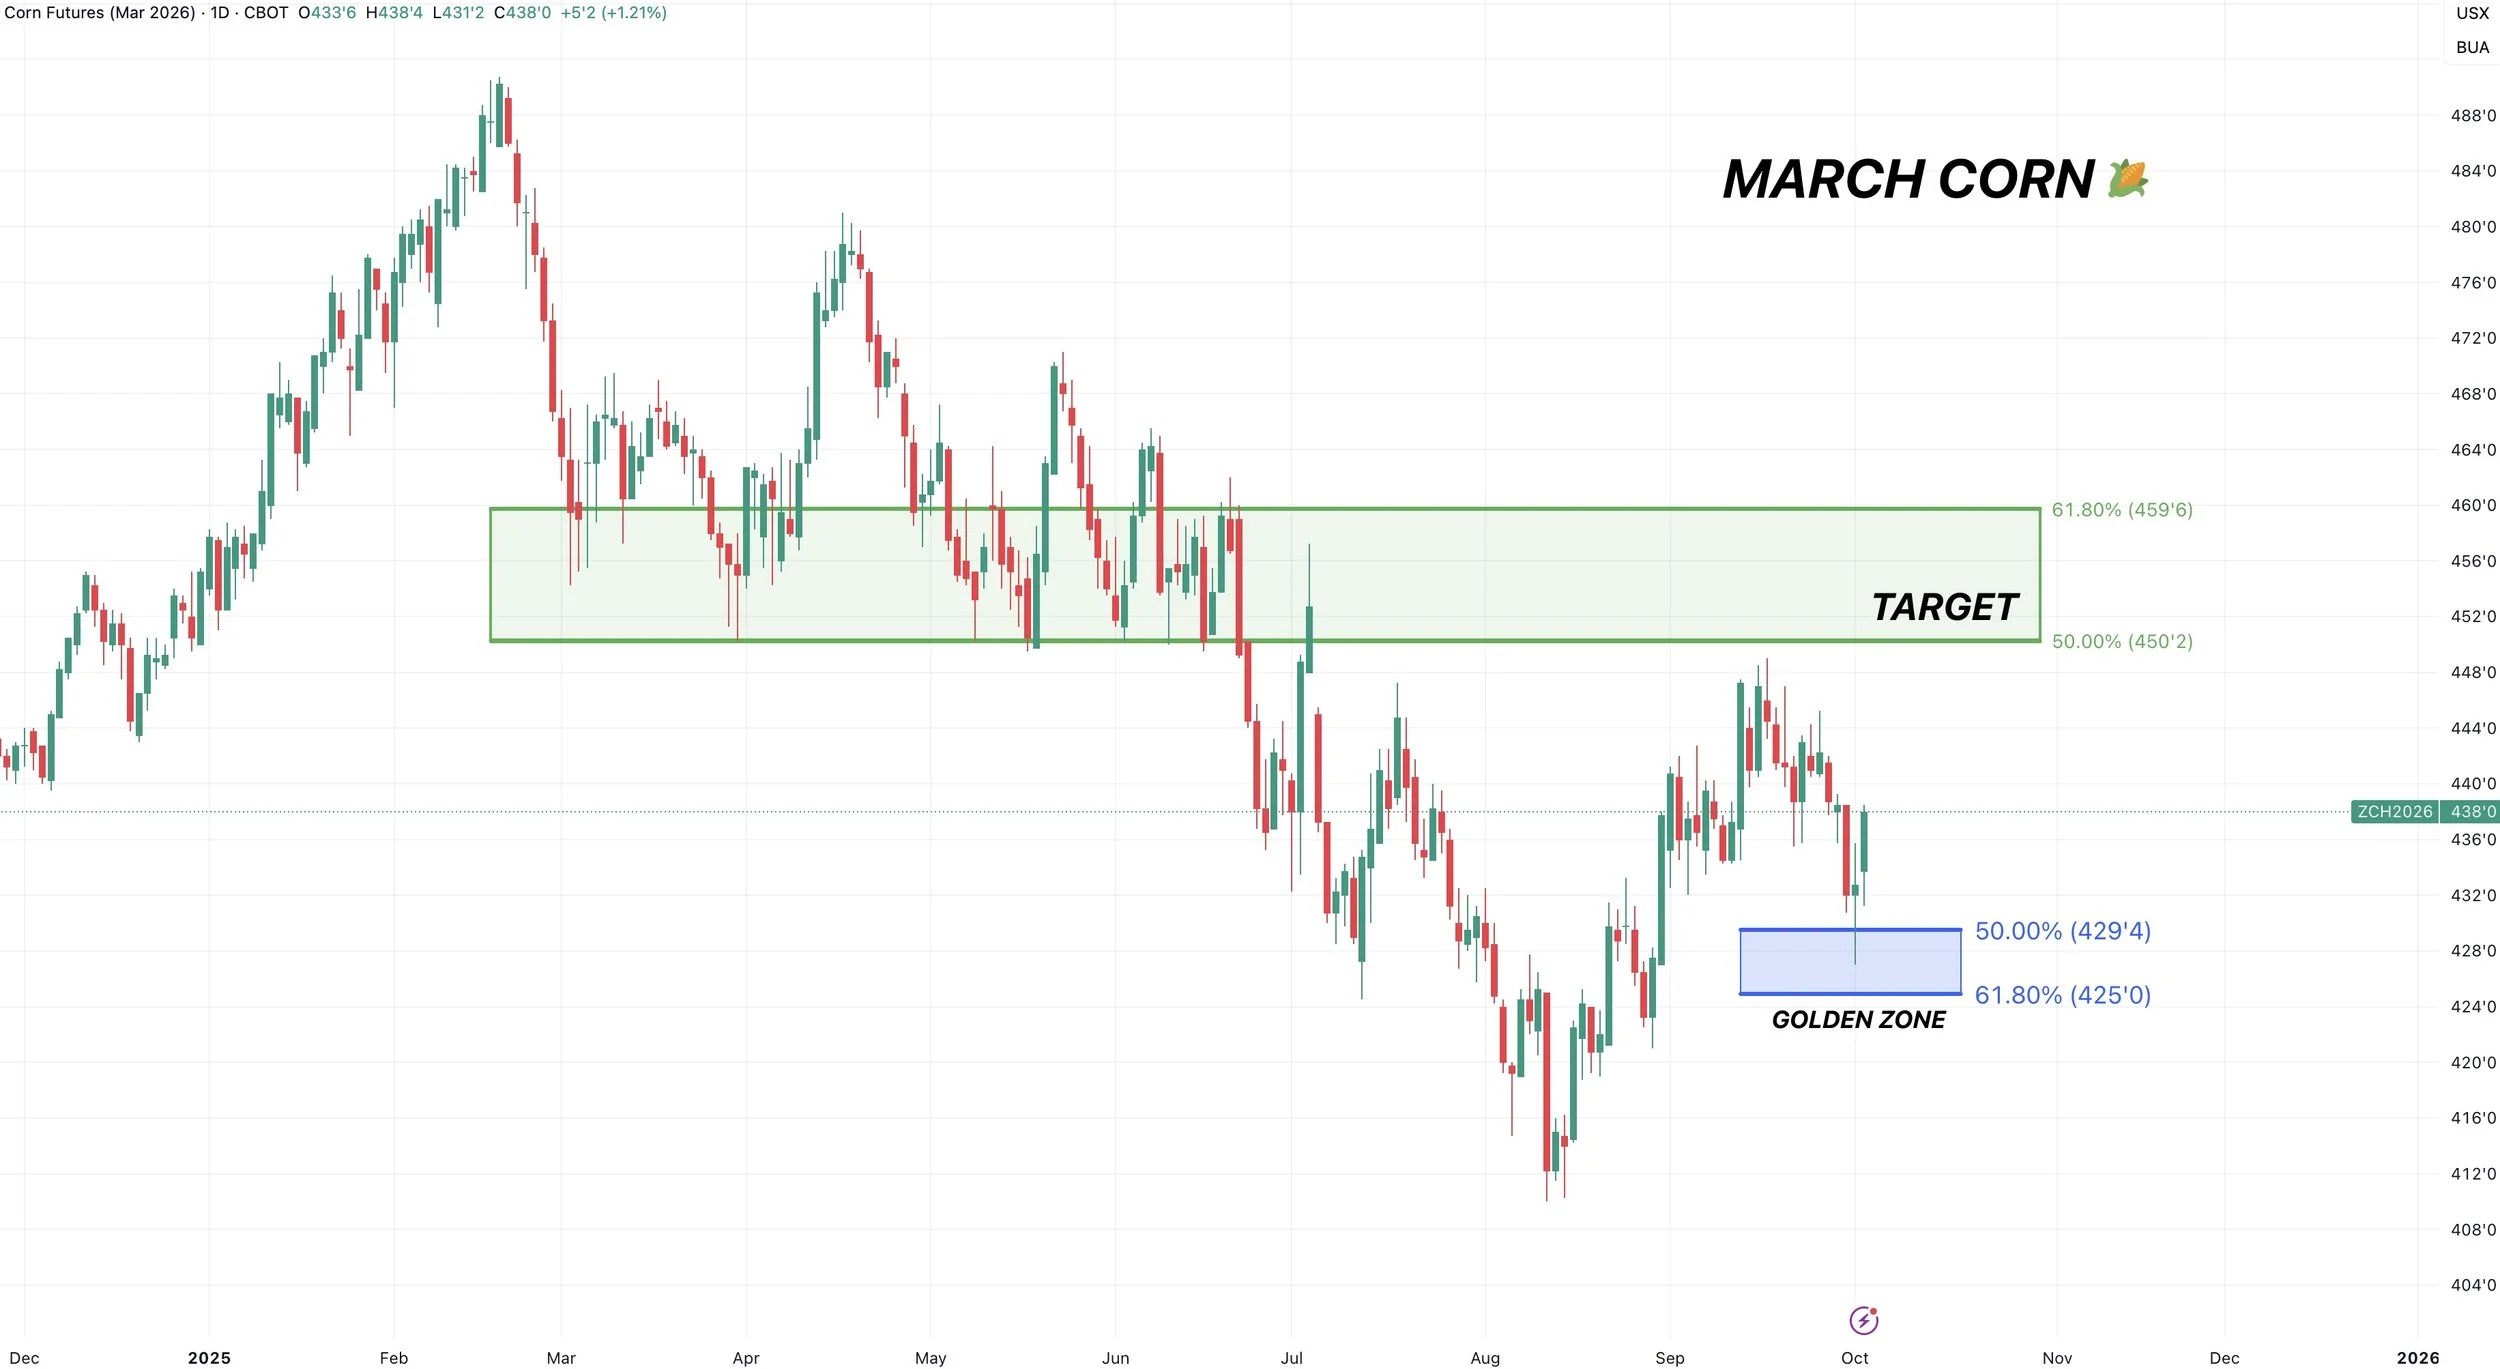
If you have a JFM delivery time frame, here is March corn.
That first target is $4.50 to $4.60
To the downside we need to hold $4.25
Soybeans
Trump threw this market a life wraft
We are now +30 cents off of yesterday’s lows.
Now what?
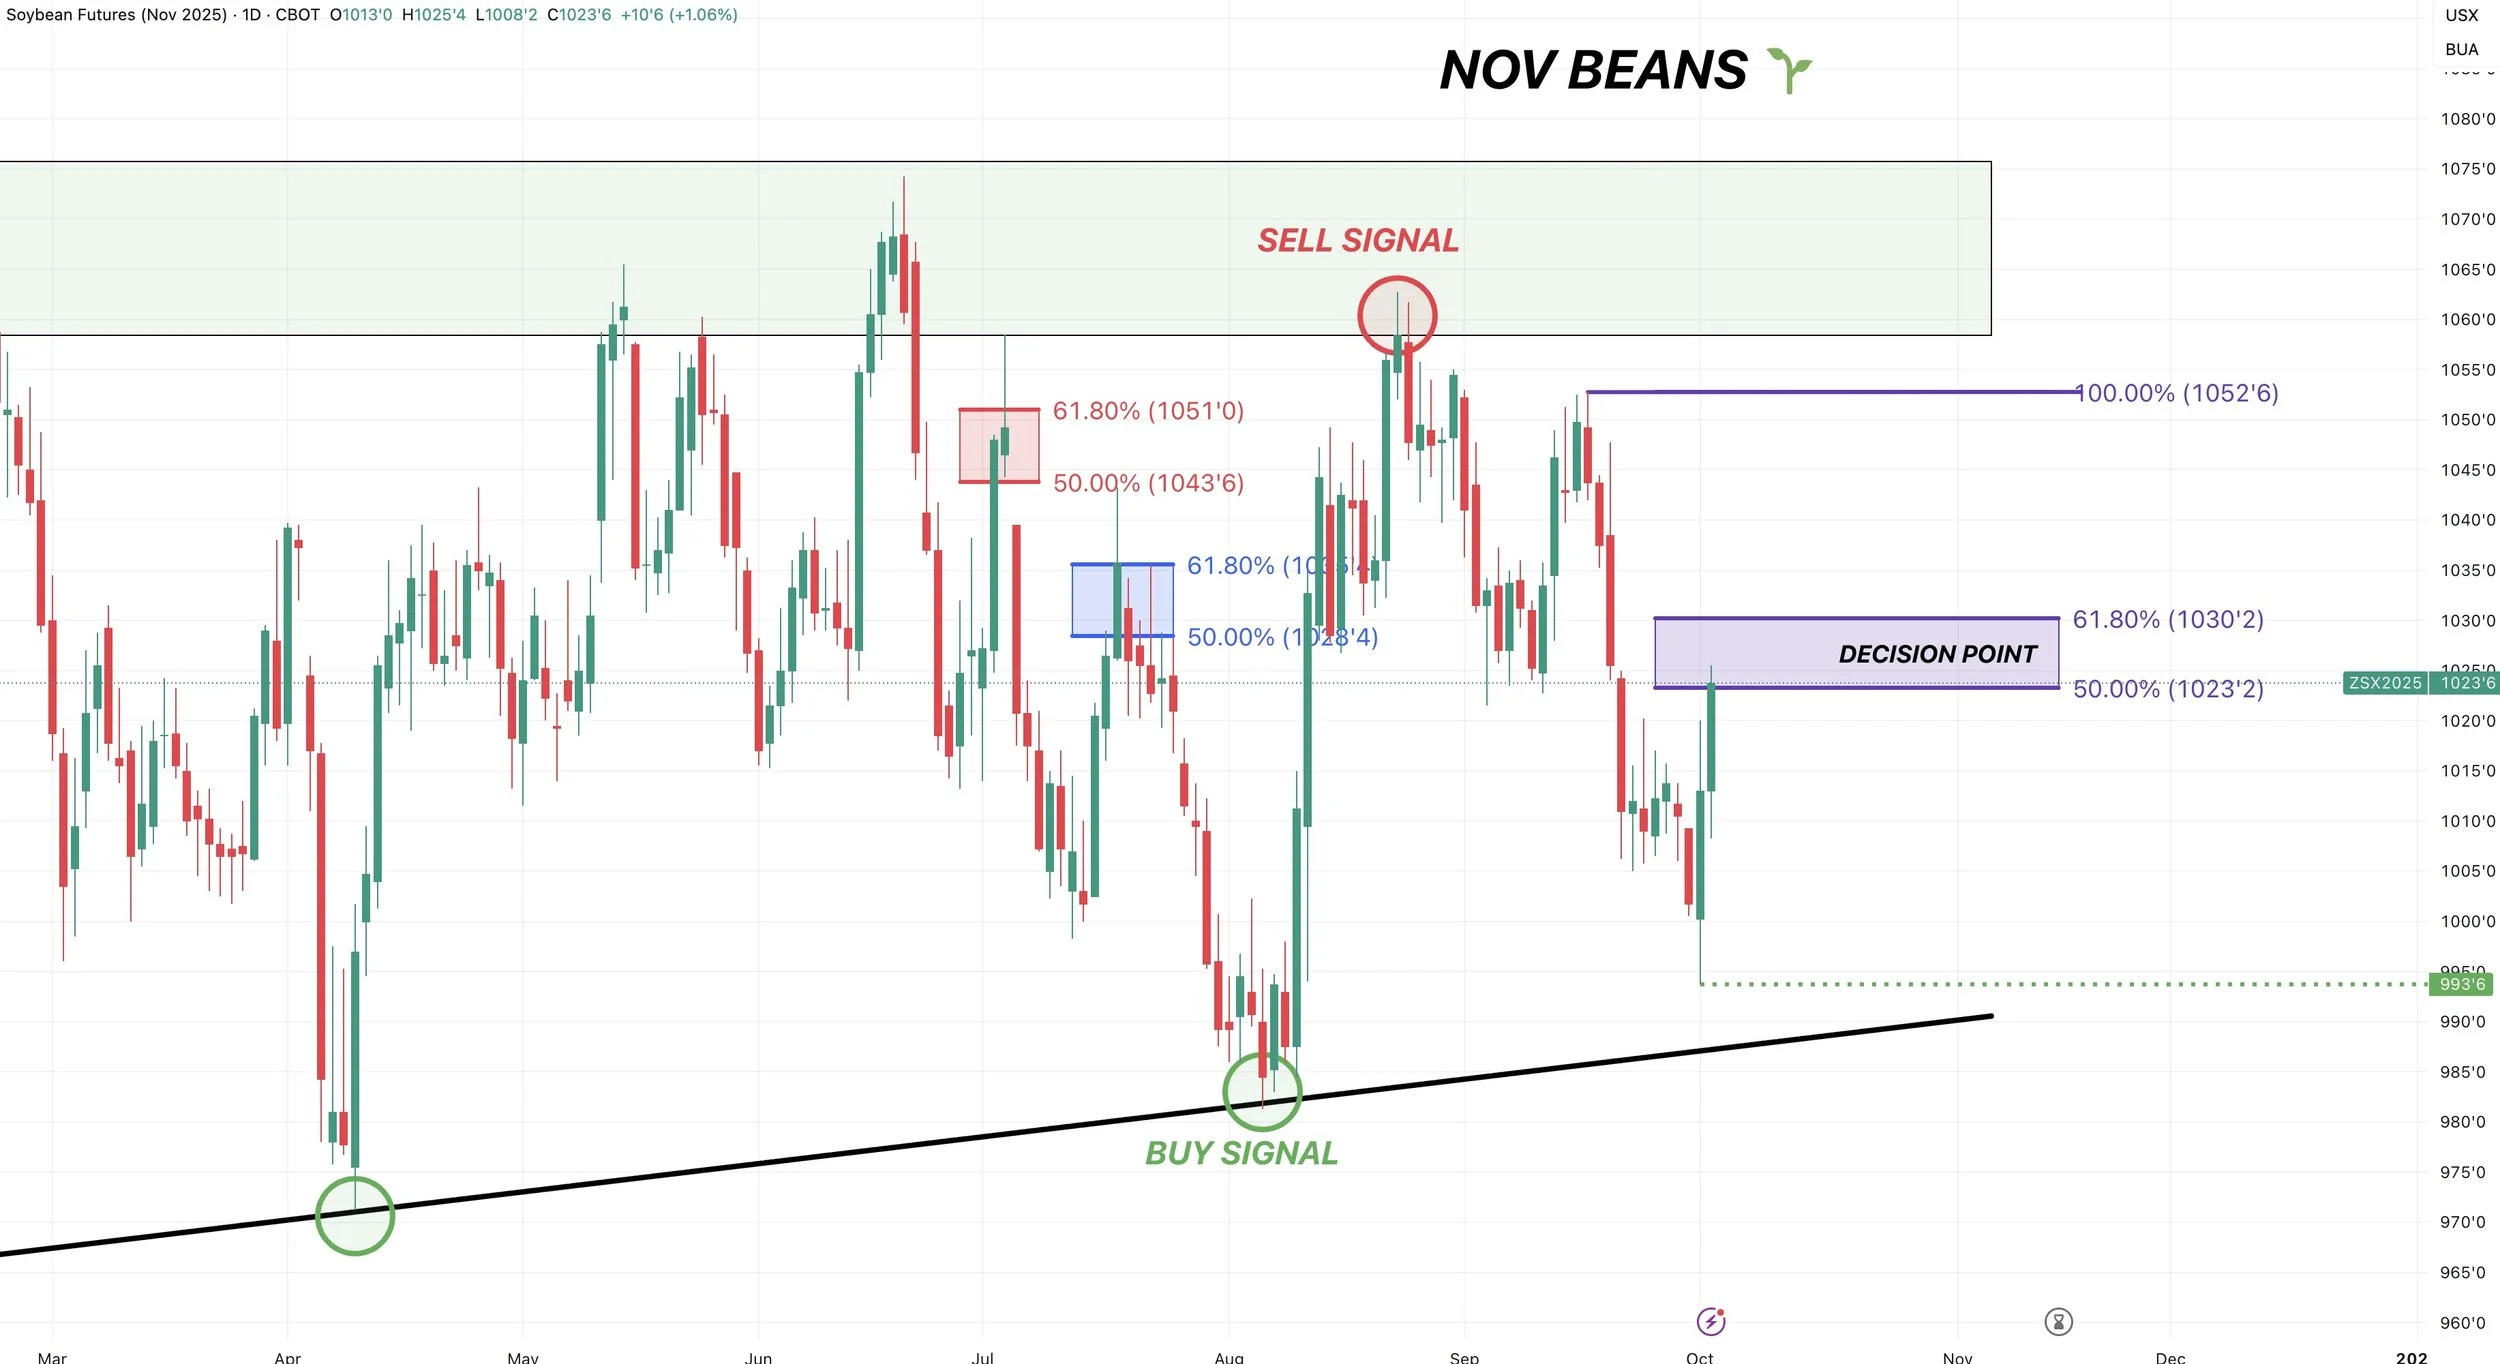
We are right back in a big decision area. As we have reclaimed 50% of the recent sell off.
Bulls need to break above the 61.8% level at $10.30 to be confident this market is done bleeding.
If you look at the summer sell offs, each one of them rejected the 61.8% level.
That is the most common spot for a rejection to take place before heading lower.
So this bounce is viewed as nothing more than a relief bounce unless we break above that level. If we break above that level the fun might be able to start.
Another reason why we need to break above that level is this chart.
On the summer sell off from the June highs, we saw a 5-wave move lower. Which I outlined on the chart.
So far on this sell off, we have only seen 4-waves.
Often times, the markets move in 5-waves, higher or lower.
So there is a real possibility that this is just a bounce before making one last leg lower.
We need to break above the purple box to say that this scenario likely won’t happen.

The 100-day and 200-day MA's are also sitting right by the 61.8% level.
These can often act as support or resistance.
I outlined times where the market bounced or rejected off of these.
So that is a big area to crawl above.

When you take a big picture look at soybeans, we have virtually traded sideways for over a year now.
Consolidating in a pretty small range historically speaking.
Between $9.60 and $10.80
This is the one of the longest and smallest ranges we have ever seen.
When a market coils like this, it will eventually break out.
If we break above $10.80 the sky is the limit. If you notice.. this market rarely trades in the $11.00's.
On the other hand, if we simply can’t get anything done with China, the lows during the last trade war came in around $8.30.
Personally, I think we've found our long term lows here at $9.60.
We are finding support exactly where we found resistance during the trade war.

Wheat
Dec Wheat:
There is a reason they say "trade wheat, sleep on the street".
Despite wheat continuing to do what wheat always does, this is still probably my favorite chart in the grains despite not having a major fundamental factor or catalyst.
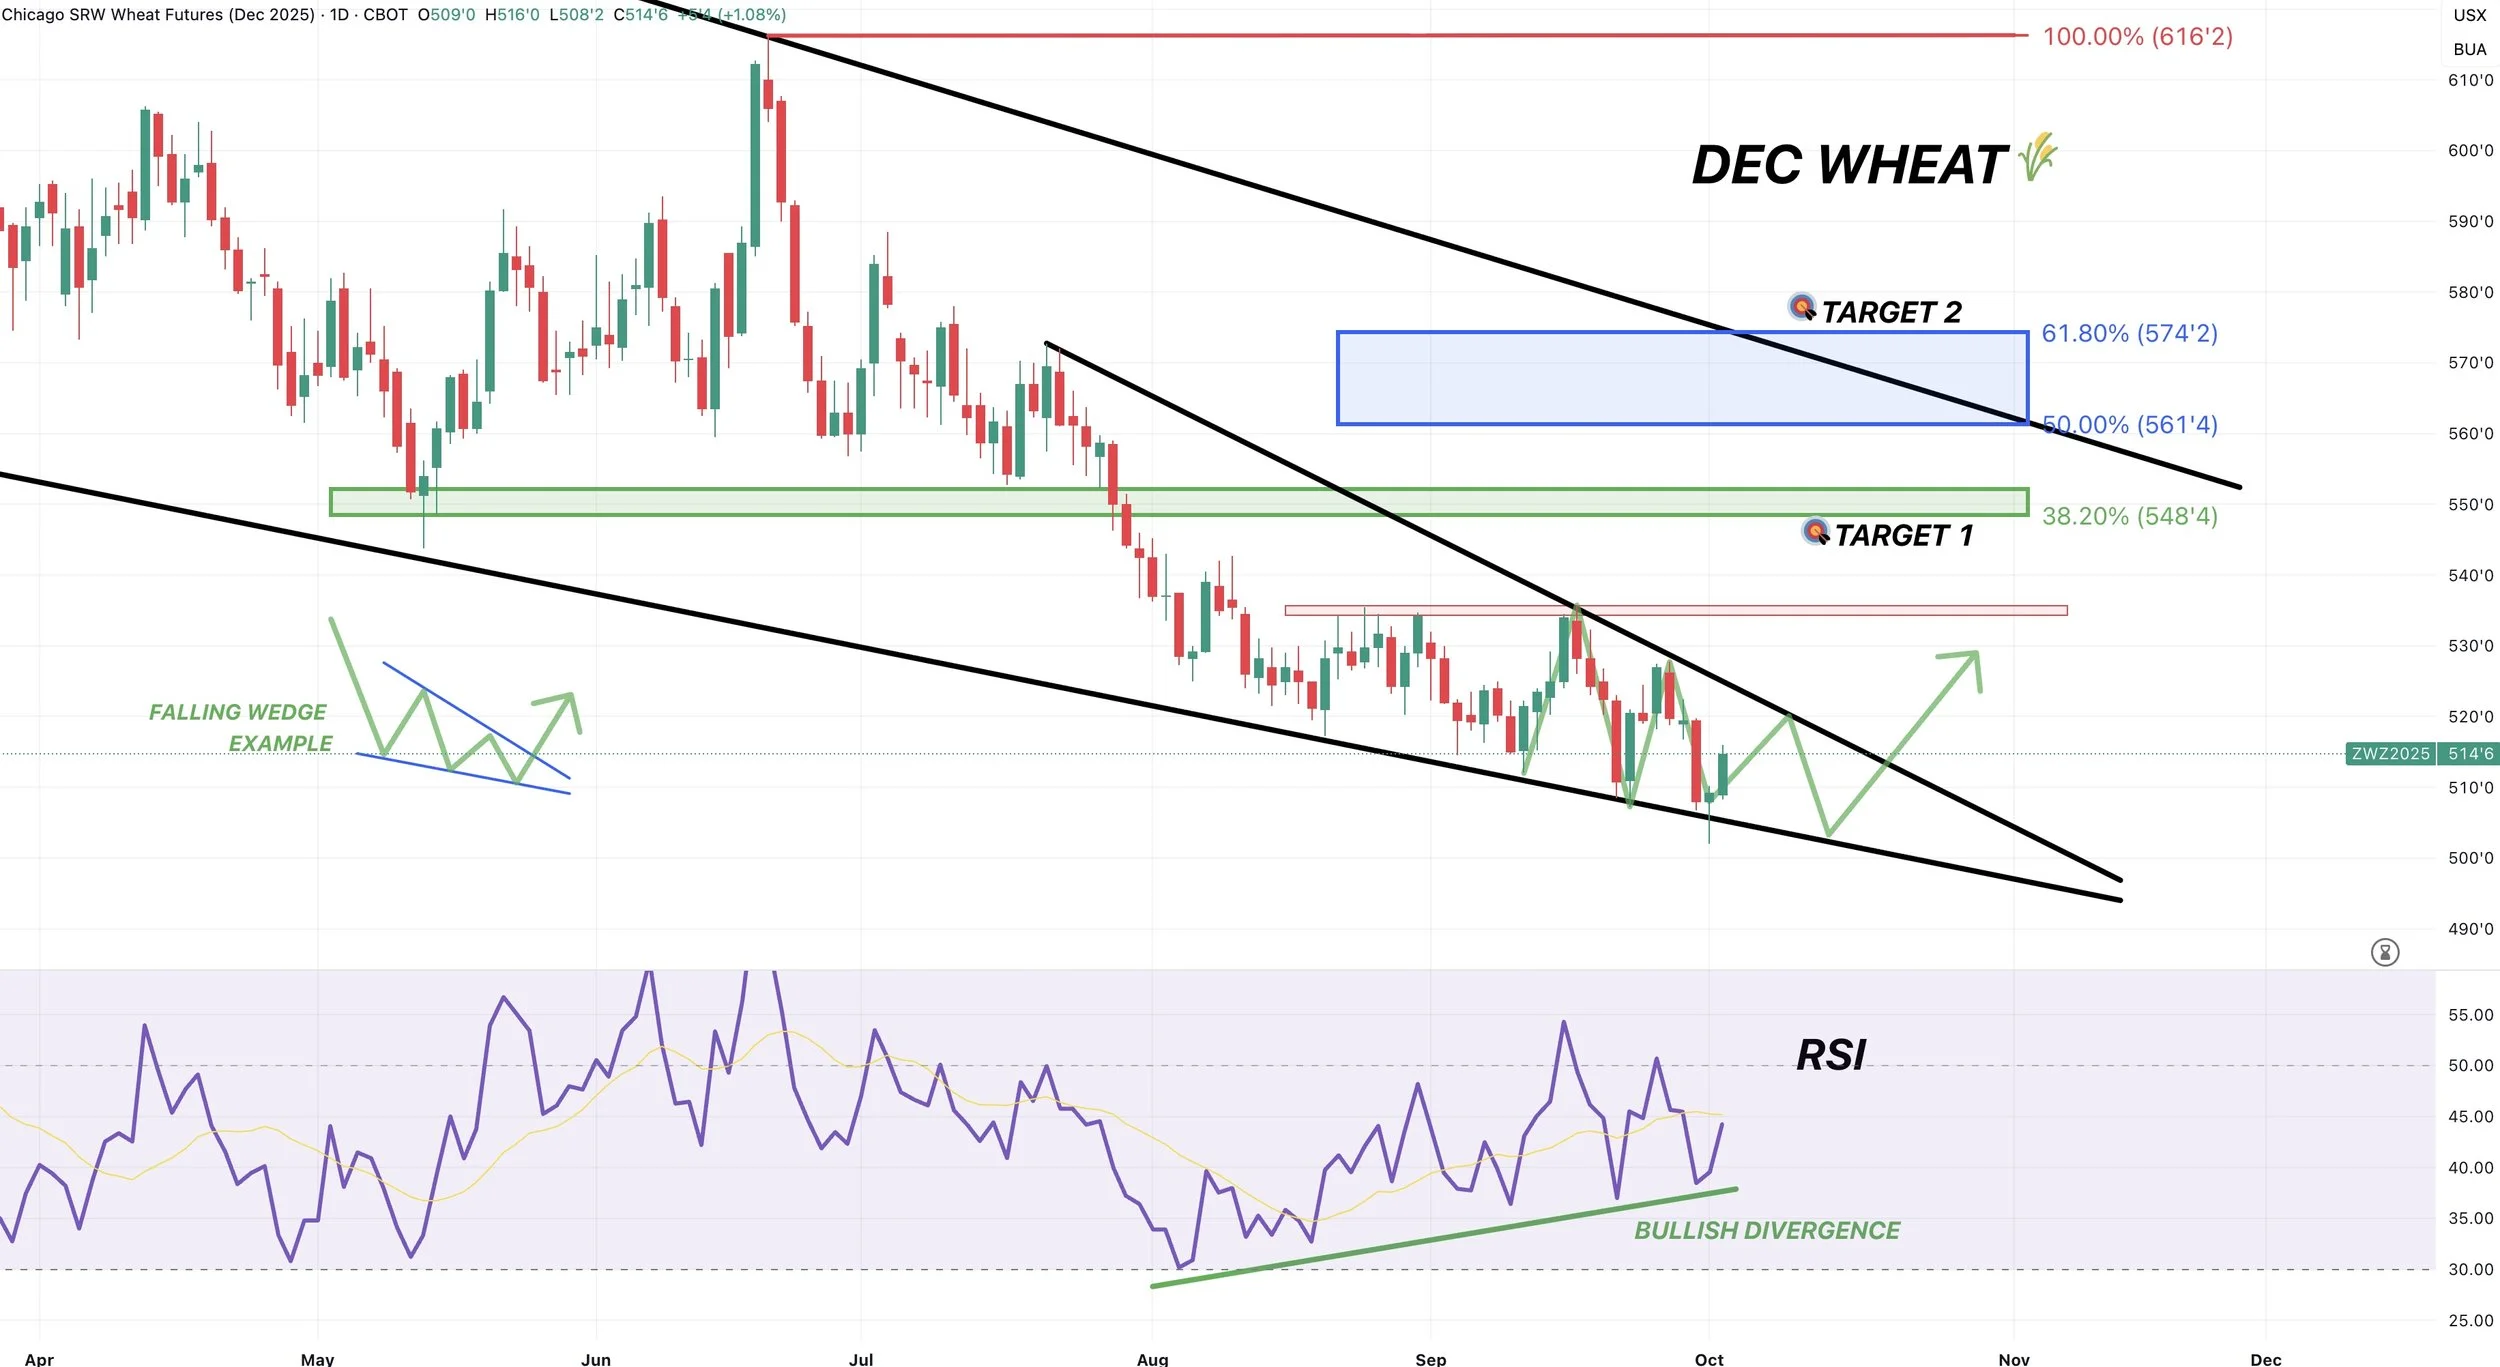
We continue to grind lower and are still coiling up in this falling wedge pattern that is getting smaller and smaller.
At some point, I would imagine it would lead to breakout even though that hasn’t been the case yet.
First point of interest is $5.48

The wheat market has been showing bullish divergence since the end of August.
For over a month now, prices continue to trickle lower, meanwhile the RSI posts a new high.
This isn’t seen as a bearish sign.
Continuous Wheat Chart:
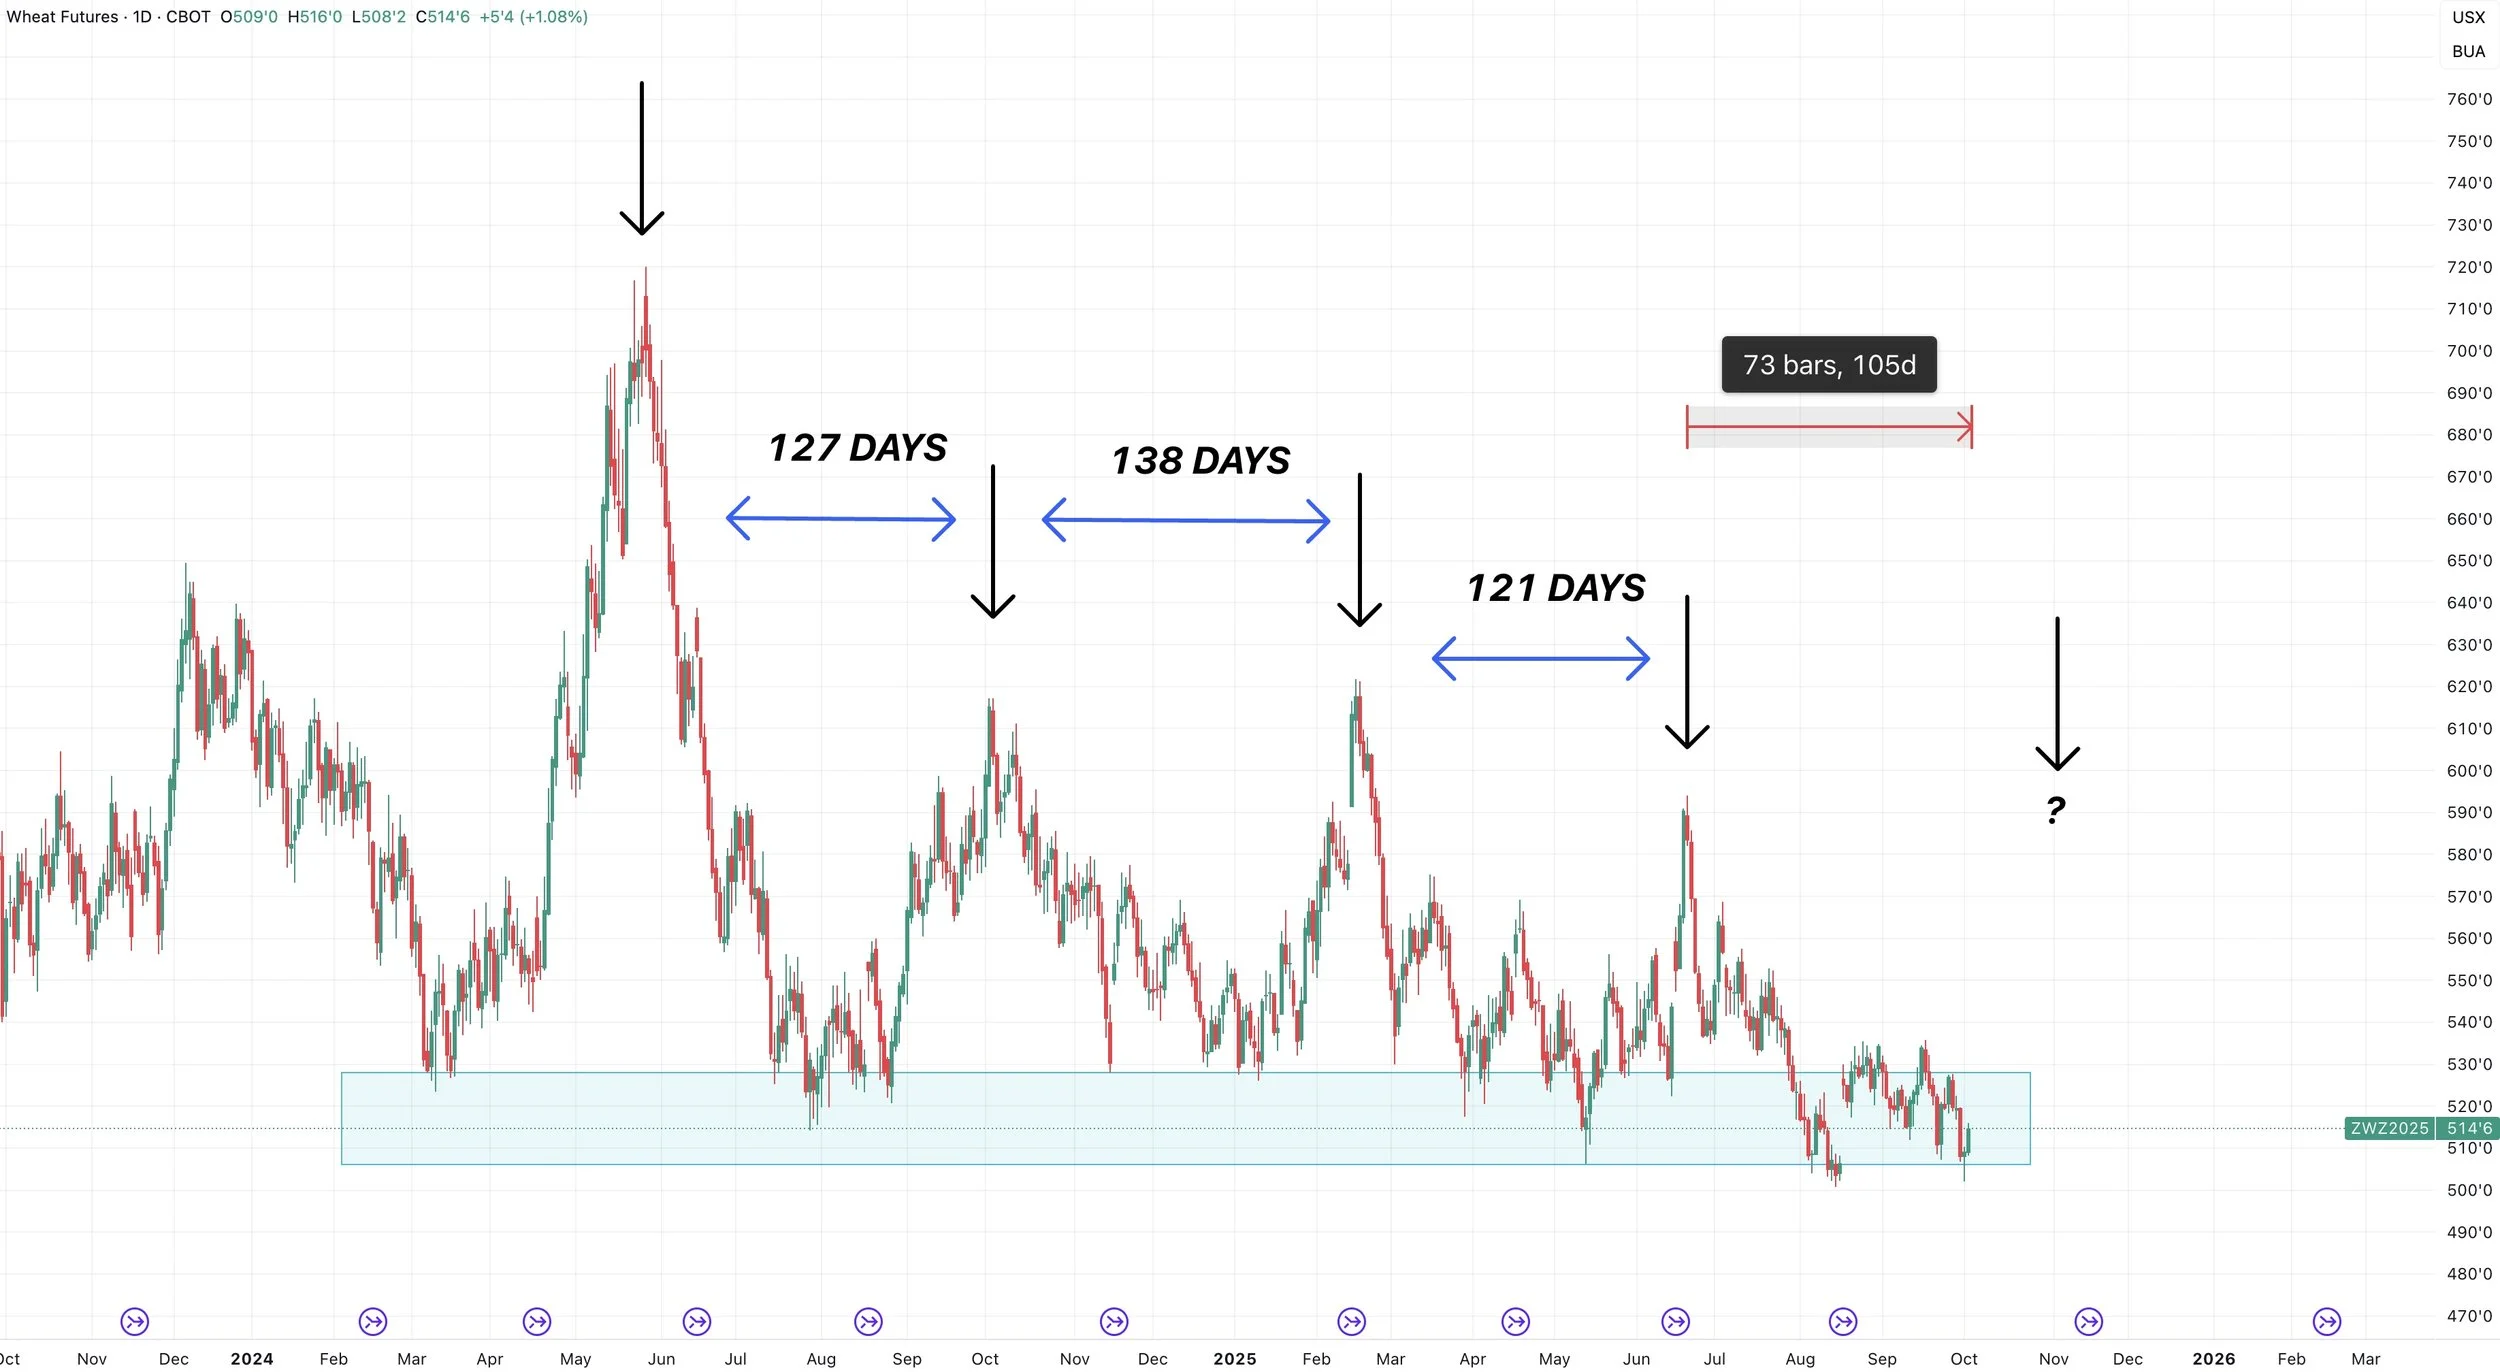
Here is the continuous chart.
We are still holding this general area of support despite posting contract lows. That is because the contracts switch and there is a carry in the market.
But every 4 or so months for the past two years, the wheat market has provided an opportunity.
That does not mean we "have" to get another one.
However, it has been 105 days since the last one.
The average distance between the last 3 were roughly 130 days.
The wheat market often times does absolutely nothing but grind lower for months. But when it decides to turn it around it can run fast. However, that opportunity usually does not last very long.
Dec KC Wheat Chart:
KC coiling in this falling wedge pattern as well.
Like Chicago, I think we eventually get the breakout.

Cattle
Today, there was a rumor that the border will re-open to Mexican feeder cattle imports into the USA in November. So perhaps that was a reason for the weakness today, but I haven’t seen any verified evidence that this is happening. Along with that today was some technical weakness.
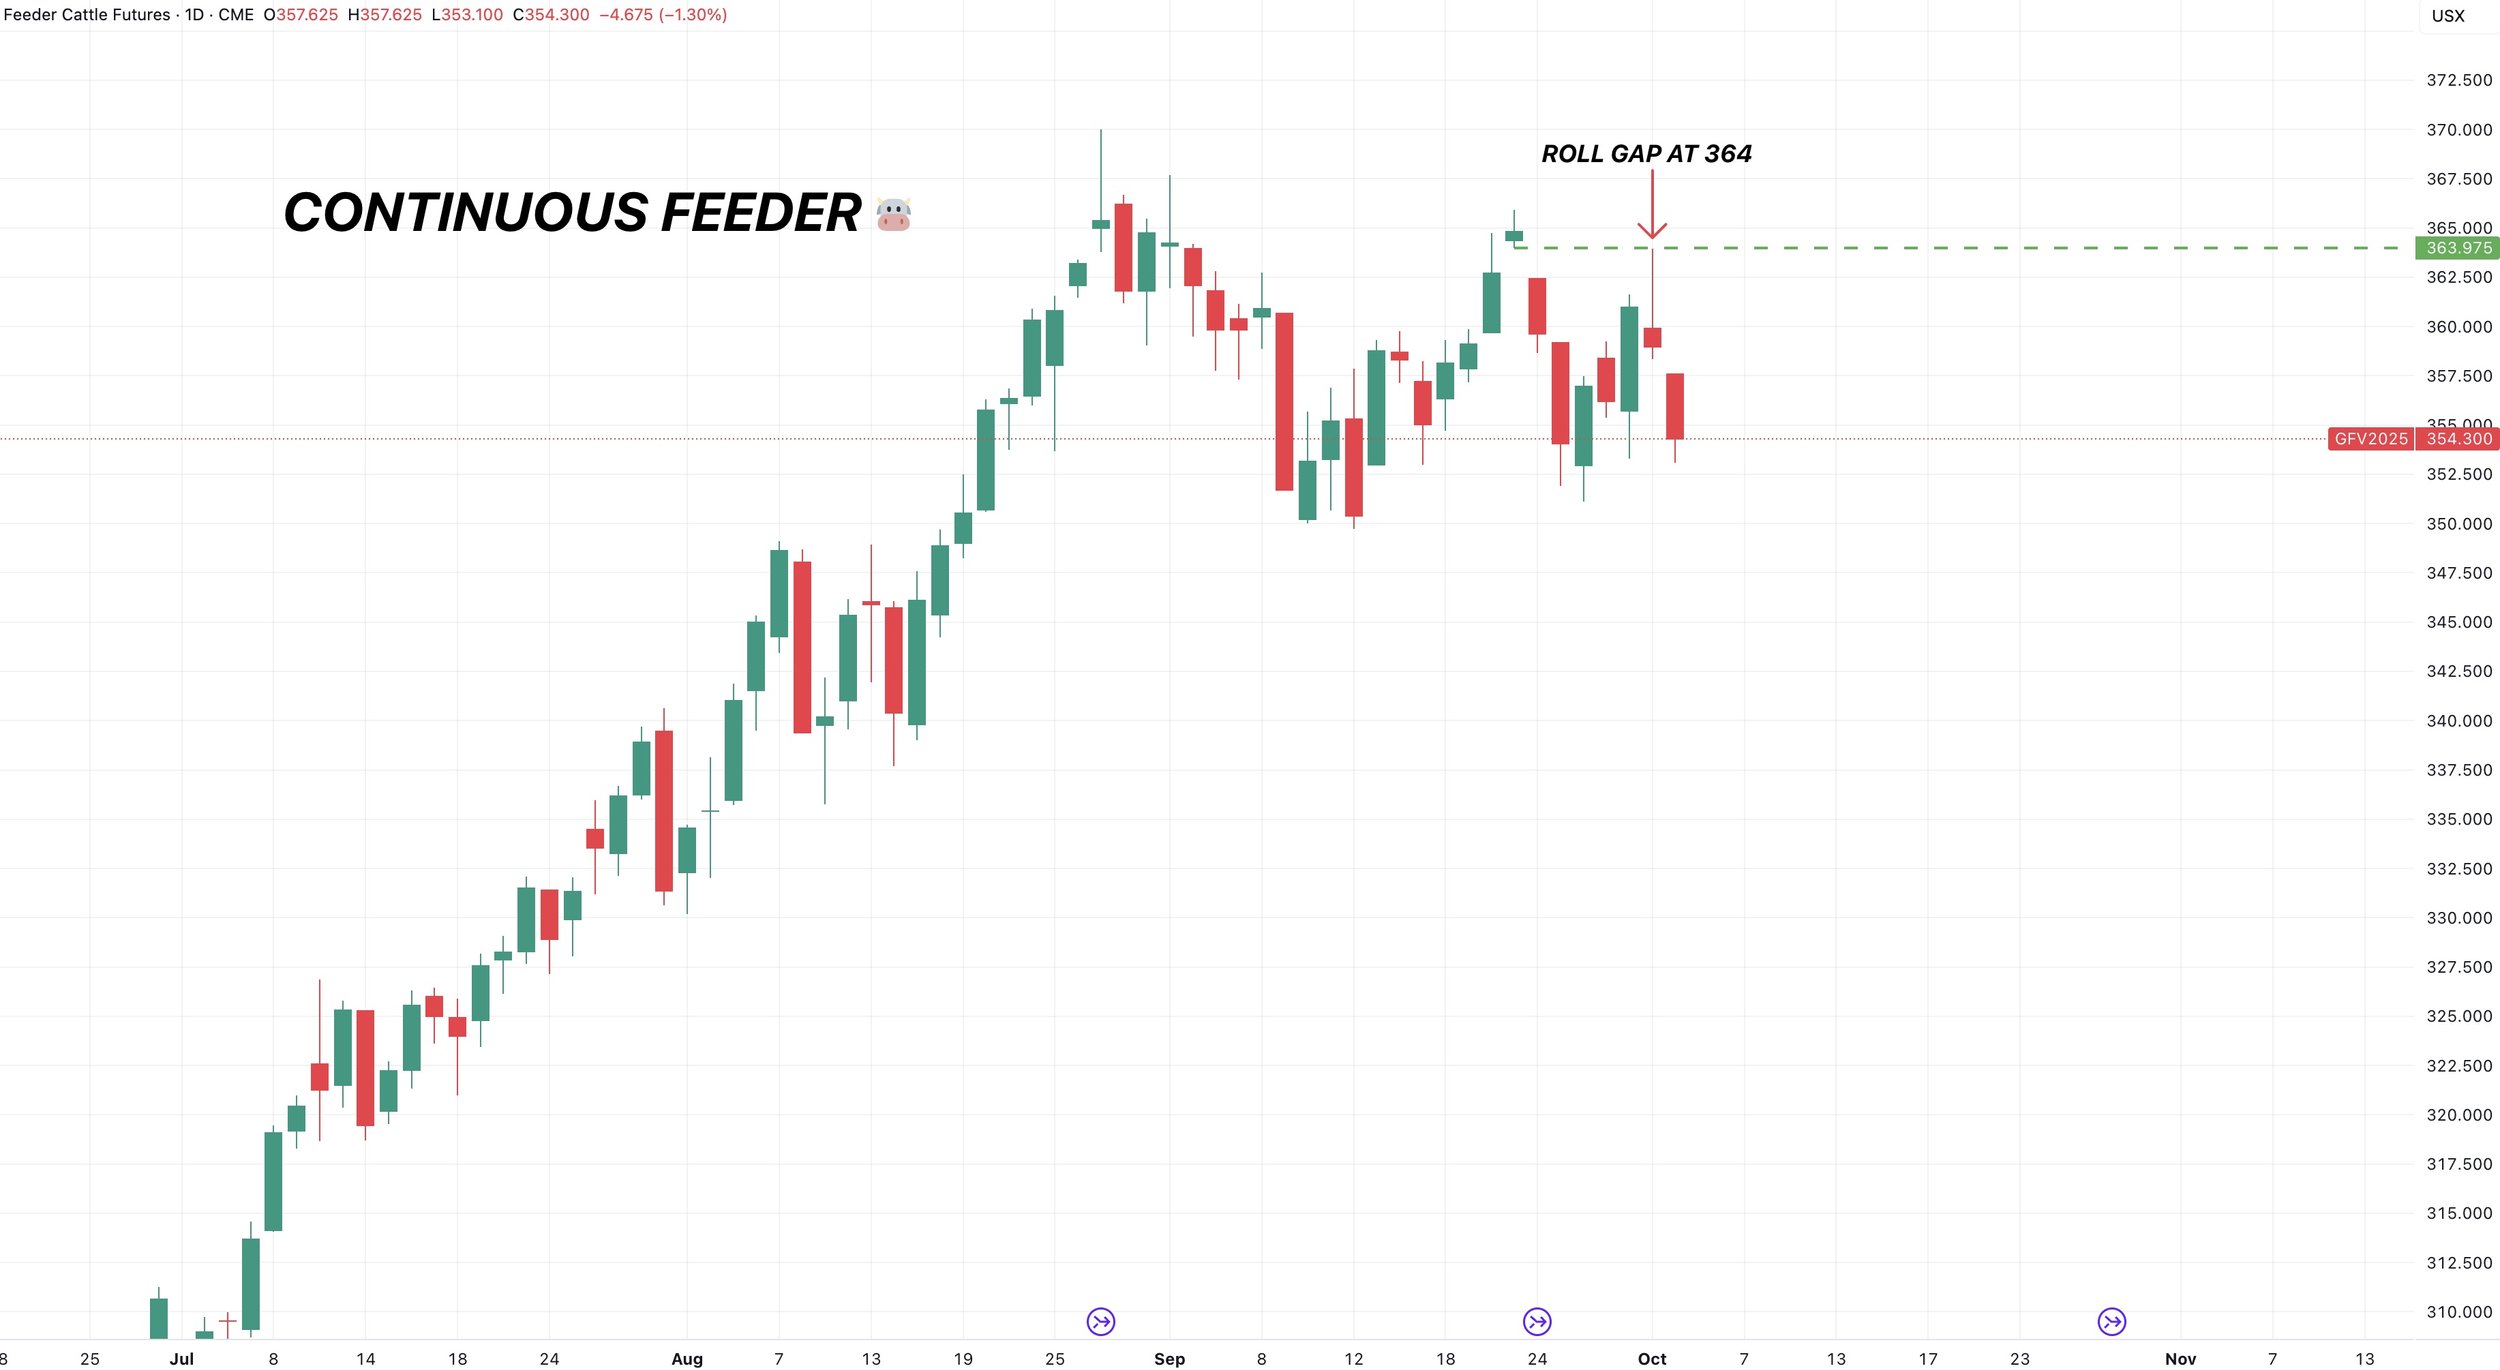
Continous Feeder Chart:
Earlier this week I mentioned that the 364 level would be the level to watch.
That is because when contracts switched, we left a roll gap at 364.
Interestingly enough, on yesterday's early pop higher we perfectly filled that gap before heading lower.
That is not ideal price action for bulls.
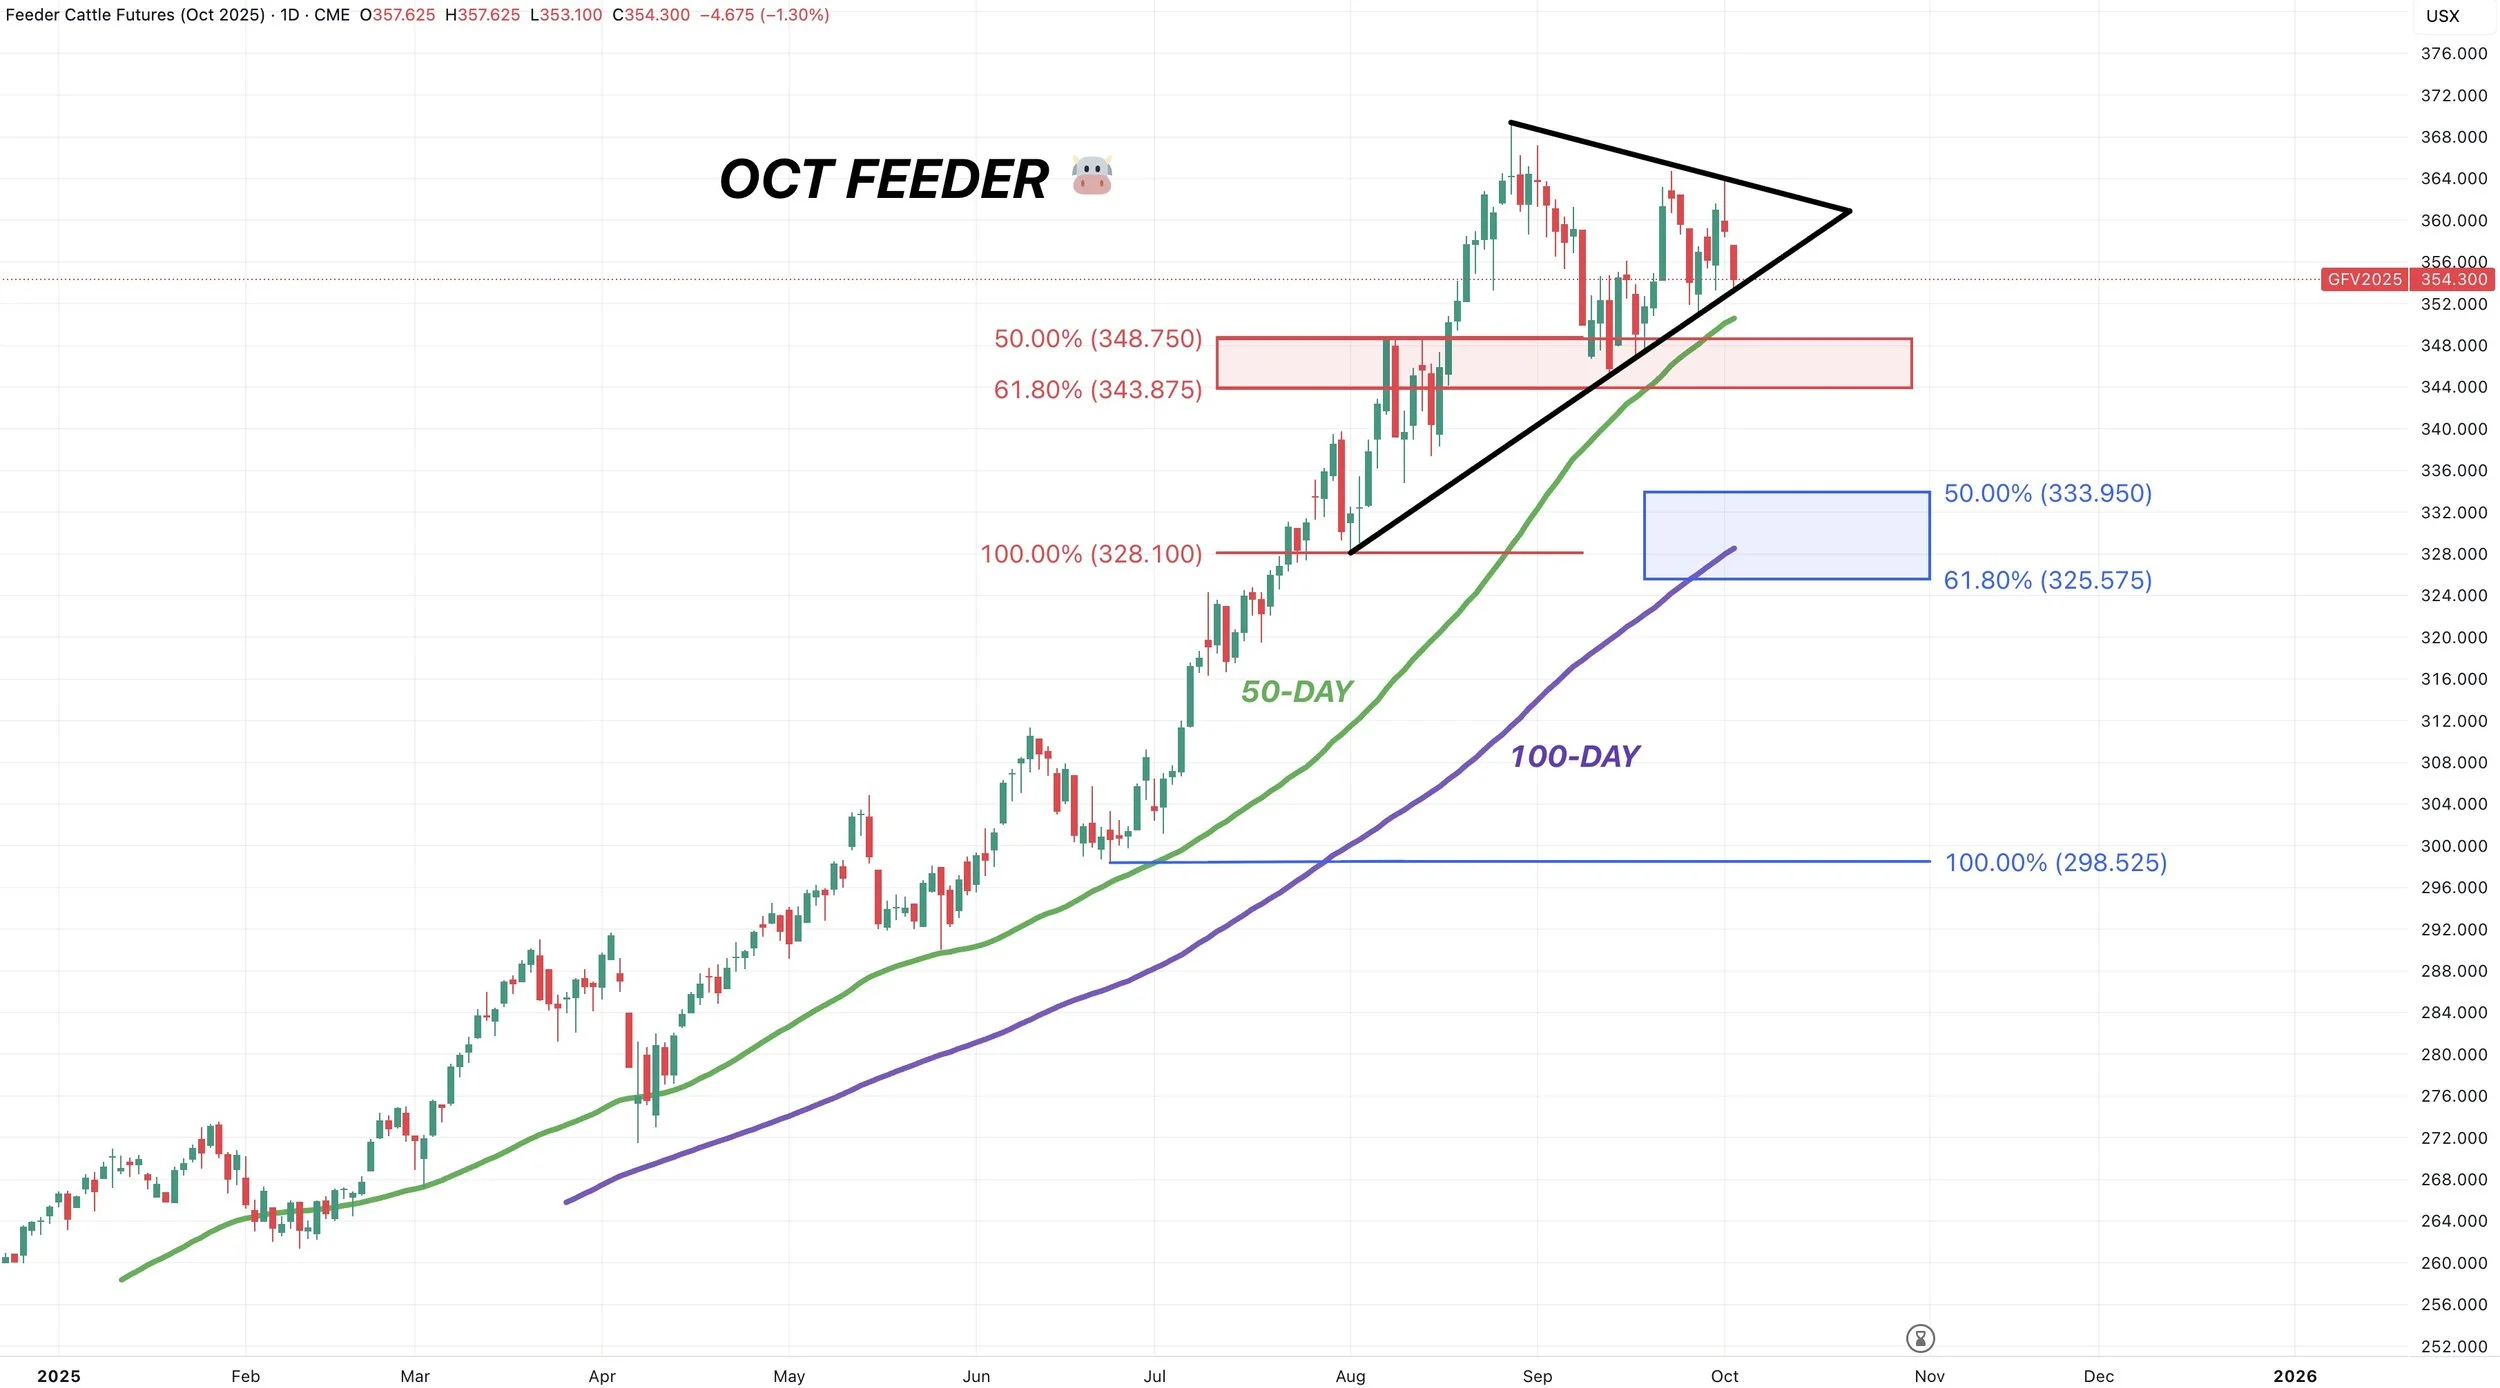
Oct Feeder Chart:
We are sitting in somewhat of a wedge pattern here.
Waiting to see which way we get the breakout.
Bust above we likely post new highs.
Break below then we have support at the red box. However, if the red box fails, I think we could easily fall down to the blue box. Which is the golden zone from the entire rally since June.
That is where I'd look at some re-ownership strategies.
But until then, I still like protecting the downside.

Here is feeder with the 50 and 100-day MA's added.
The 50-day has acted as a floor this entire year.
If we break below that, we could easily drop down to the 100-day which aligns right with that golden zone.
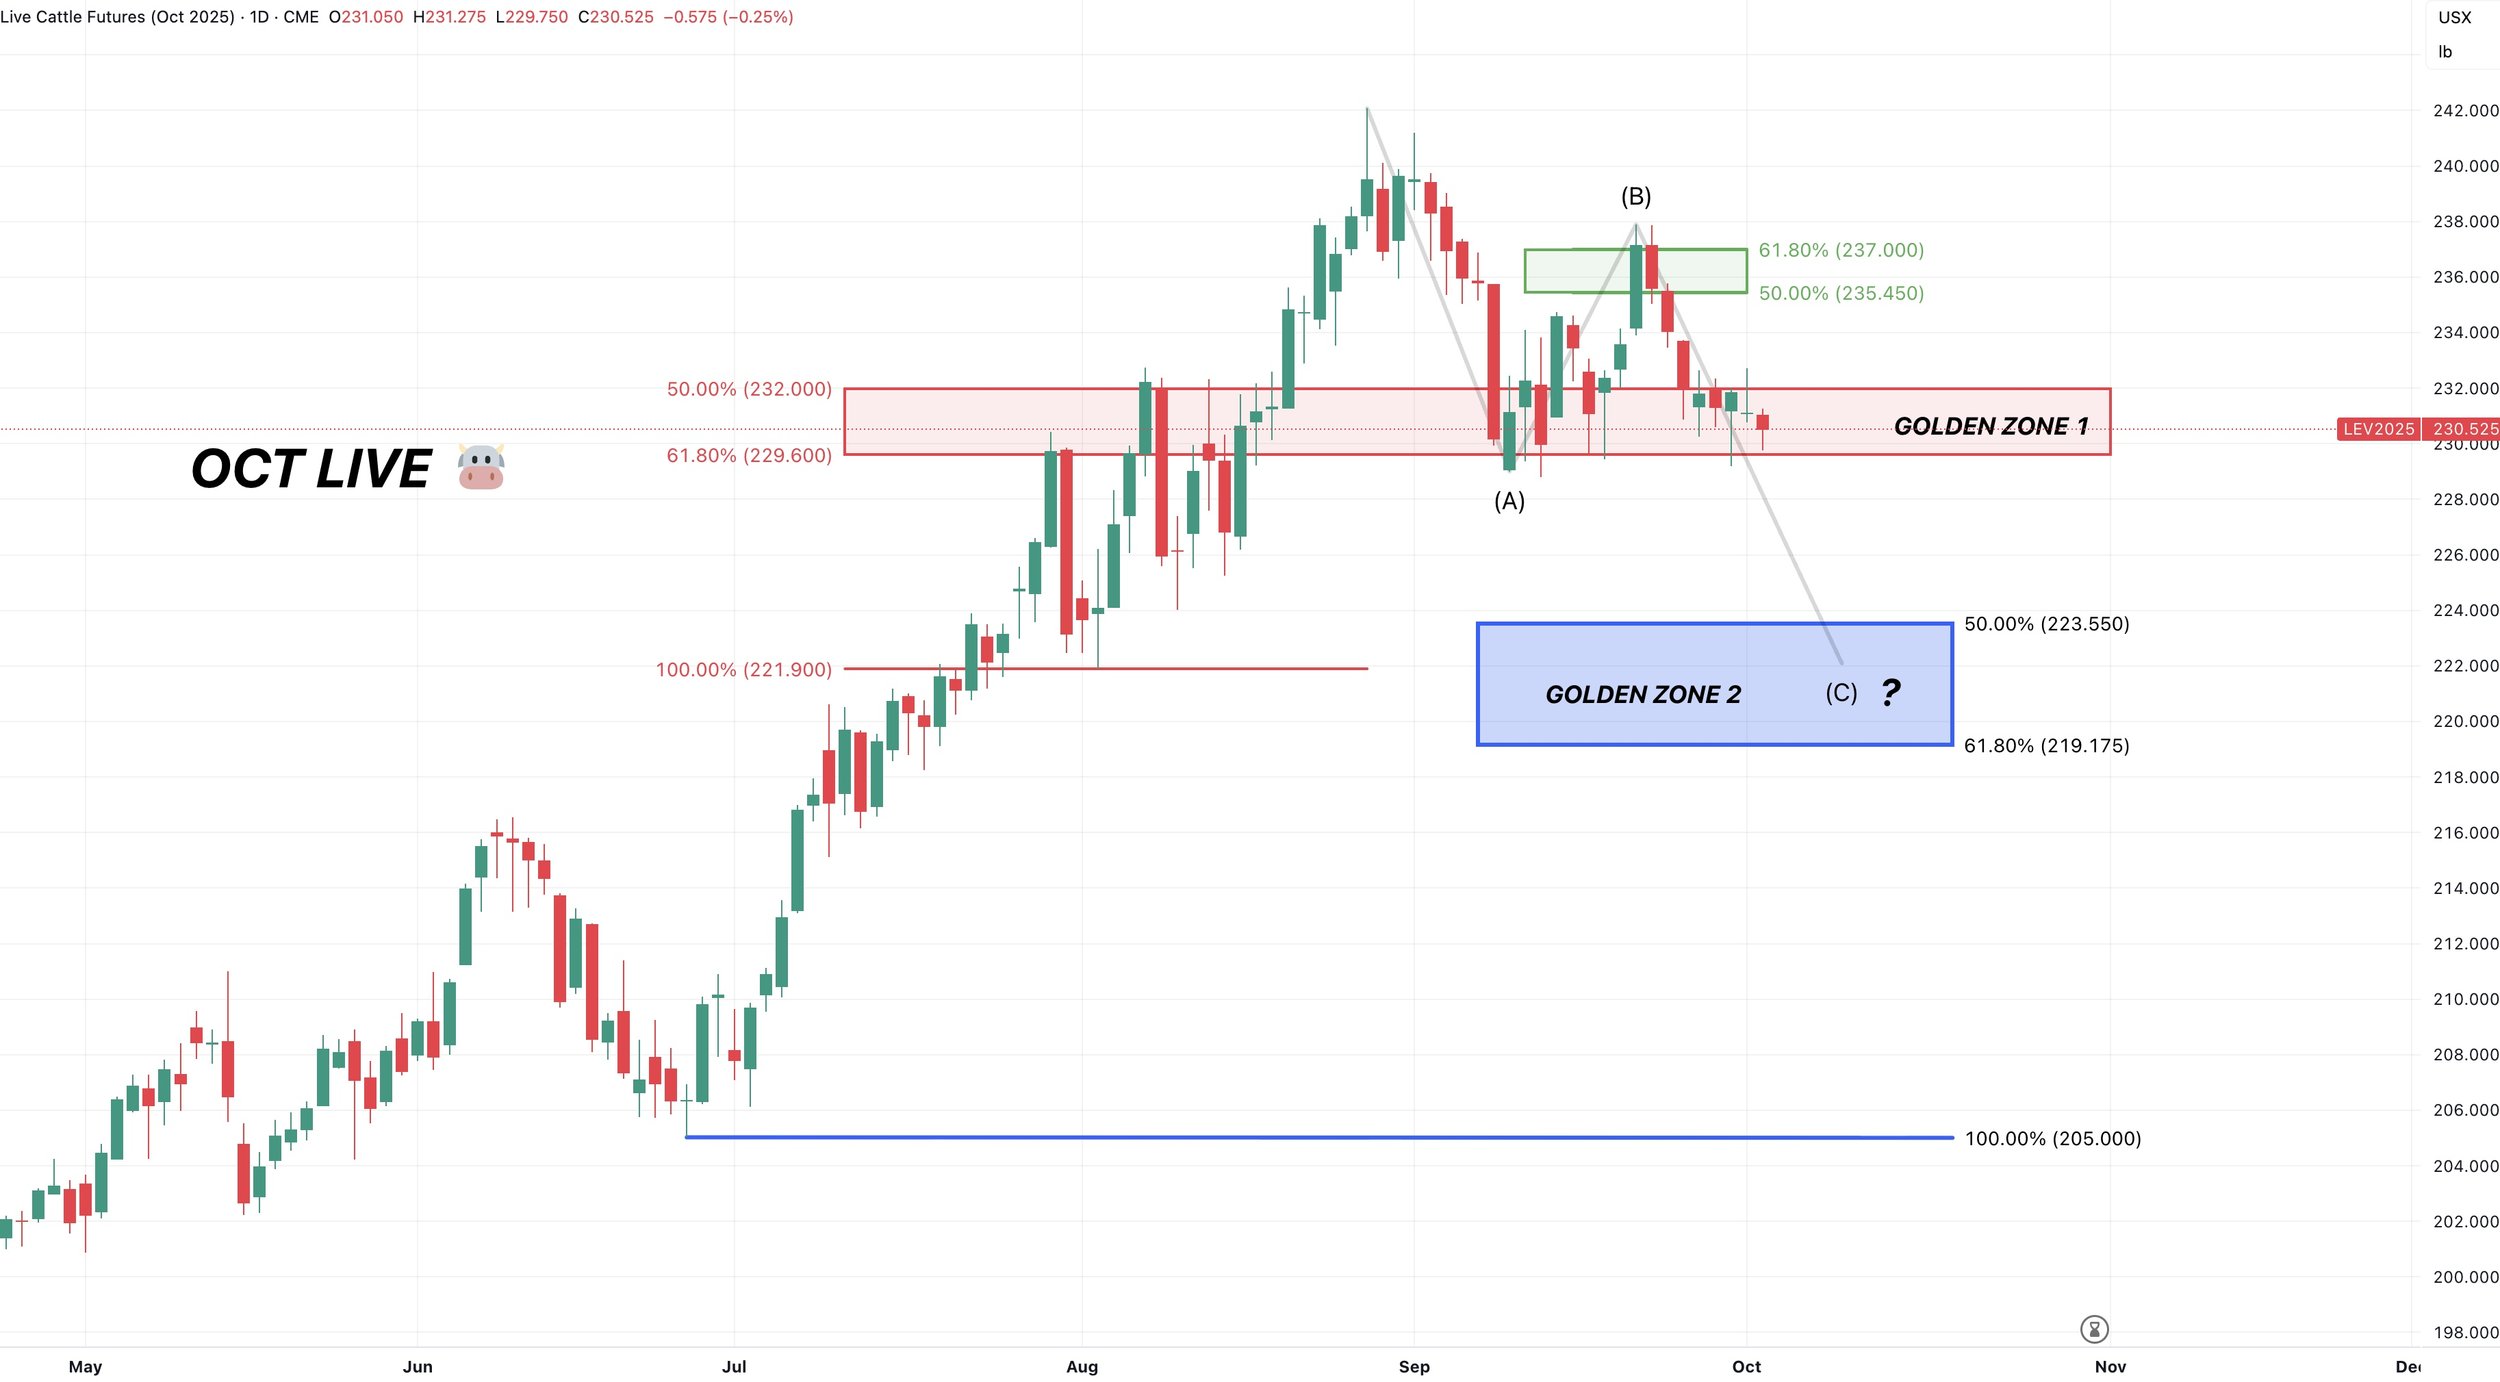
Oct Live:
Live cattle looks a lot worse than feeder.
We are at some pretty crucial support here. The 61.8% level since the start of the rally from August 1st.
If we break below here, the next point of interest is going to be that blue box. Which is the golden zone retracement of the entire rally since June.
Dec Live Cattle:
Here is Dec live with the 50 and 100-day MA's.
The 50-day has acted as major support.
Today we closed below it.
Unless we reverse out of here fast, it could spark a leg down towards the 100-day which also happens to be that golden zone retracement of this entire rally since June.

Past Sell or Protection Signals
Aug 22nd: 🌱
Soybean sell signal & hedge alert.
July 31st: 🐮
Cattle sell signal & hedge alert.
July 10th: 🐮
Cattle sell signal & hedge alert.
CLICK HERE TO VIEW
June 5th: 🐮
Cattle sell signal & hedge alert.
June 2nd: 🌾
MPLS wheat sell signal.
April 10th: 🌽
Old crop corn sell signal.
March 19th: 🐮
Cattle hedge & sell signal.
Feb 18th: 🌽 🌾
Old crop KC wheat & old crop corn signal.
Jan 23rd: 🌽 🌱
Corn & beans old crop sell signal.
CLICK HERE TO VIEW
Jan 15th: 🌽 🌱
Corn & beans hedge alert/sell signal.
Jan 2nd: 🐮
Cattle hedge alert at new all-time highs & target.
Dec 11th: 🌽
Corn sell signal at $4.51 200-day MA
CLICK HERE TO VIEW
Oct 2nd: 🌾
Wheat sell signal at $6.12 target
Sep 30th: 🌽
Corn protection signal at $4.23-26
Sep 27th: 🌱
Soybean sell & protection signal at $10.65
Sep 13th: 🌾
Wheat sell signal at $5.98
May 22nd: 🌾
Wheat sell signal when wheat traded +$7.00
Want to Talk?
Our phones are open 24/7 for you guys if you ever need anything or want to discuss your operation.
Hedge Account
Interested in a hedge account? Use the link below to set up an account or shoot Jeremey a call at (605)295-3100.