
HAS MARKET PRICED IN ENOUGH WEATHER PREMIUM?
AUDIO COMMENTARY
Great price action in the grains
Where to take profit on corn buy signal
Has market priced in enough weather premium?
Could SA give more demand later this year?
There are areas that have issues with fertilizer
Make sales that make you money
Don’t put all your eggs in one basket
Is 2008 type of action possible?
Find a way to get comfortable. Making smaller sales, having put protection, and having courage calls
Are acres higher or lower vs March?
What will money flow decide to do?
Know your breakeven and using tools to enhance profits
Corn nearing relief targets (charts below)*
Wheat at resistance (chart below)*
Chart breakdowns & targets below*
Listen to today’s audio below
Want to talk?
Office: (806)484-1214
CORN, BEANS & WHEAT CHARTS
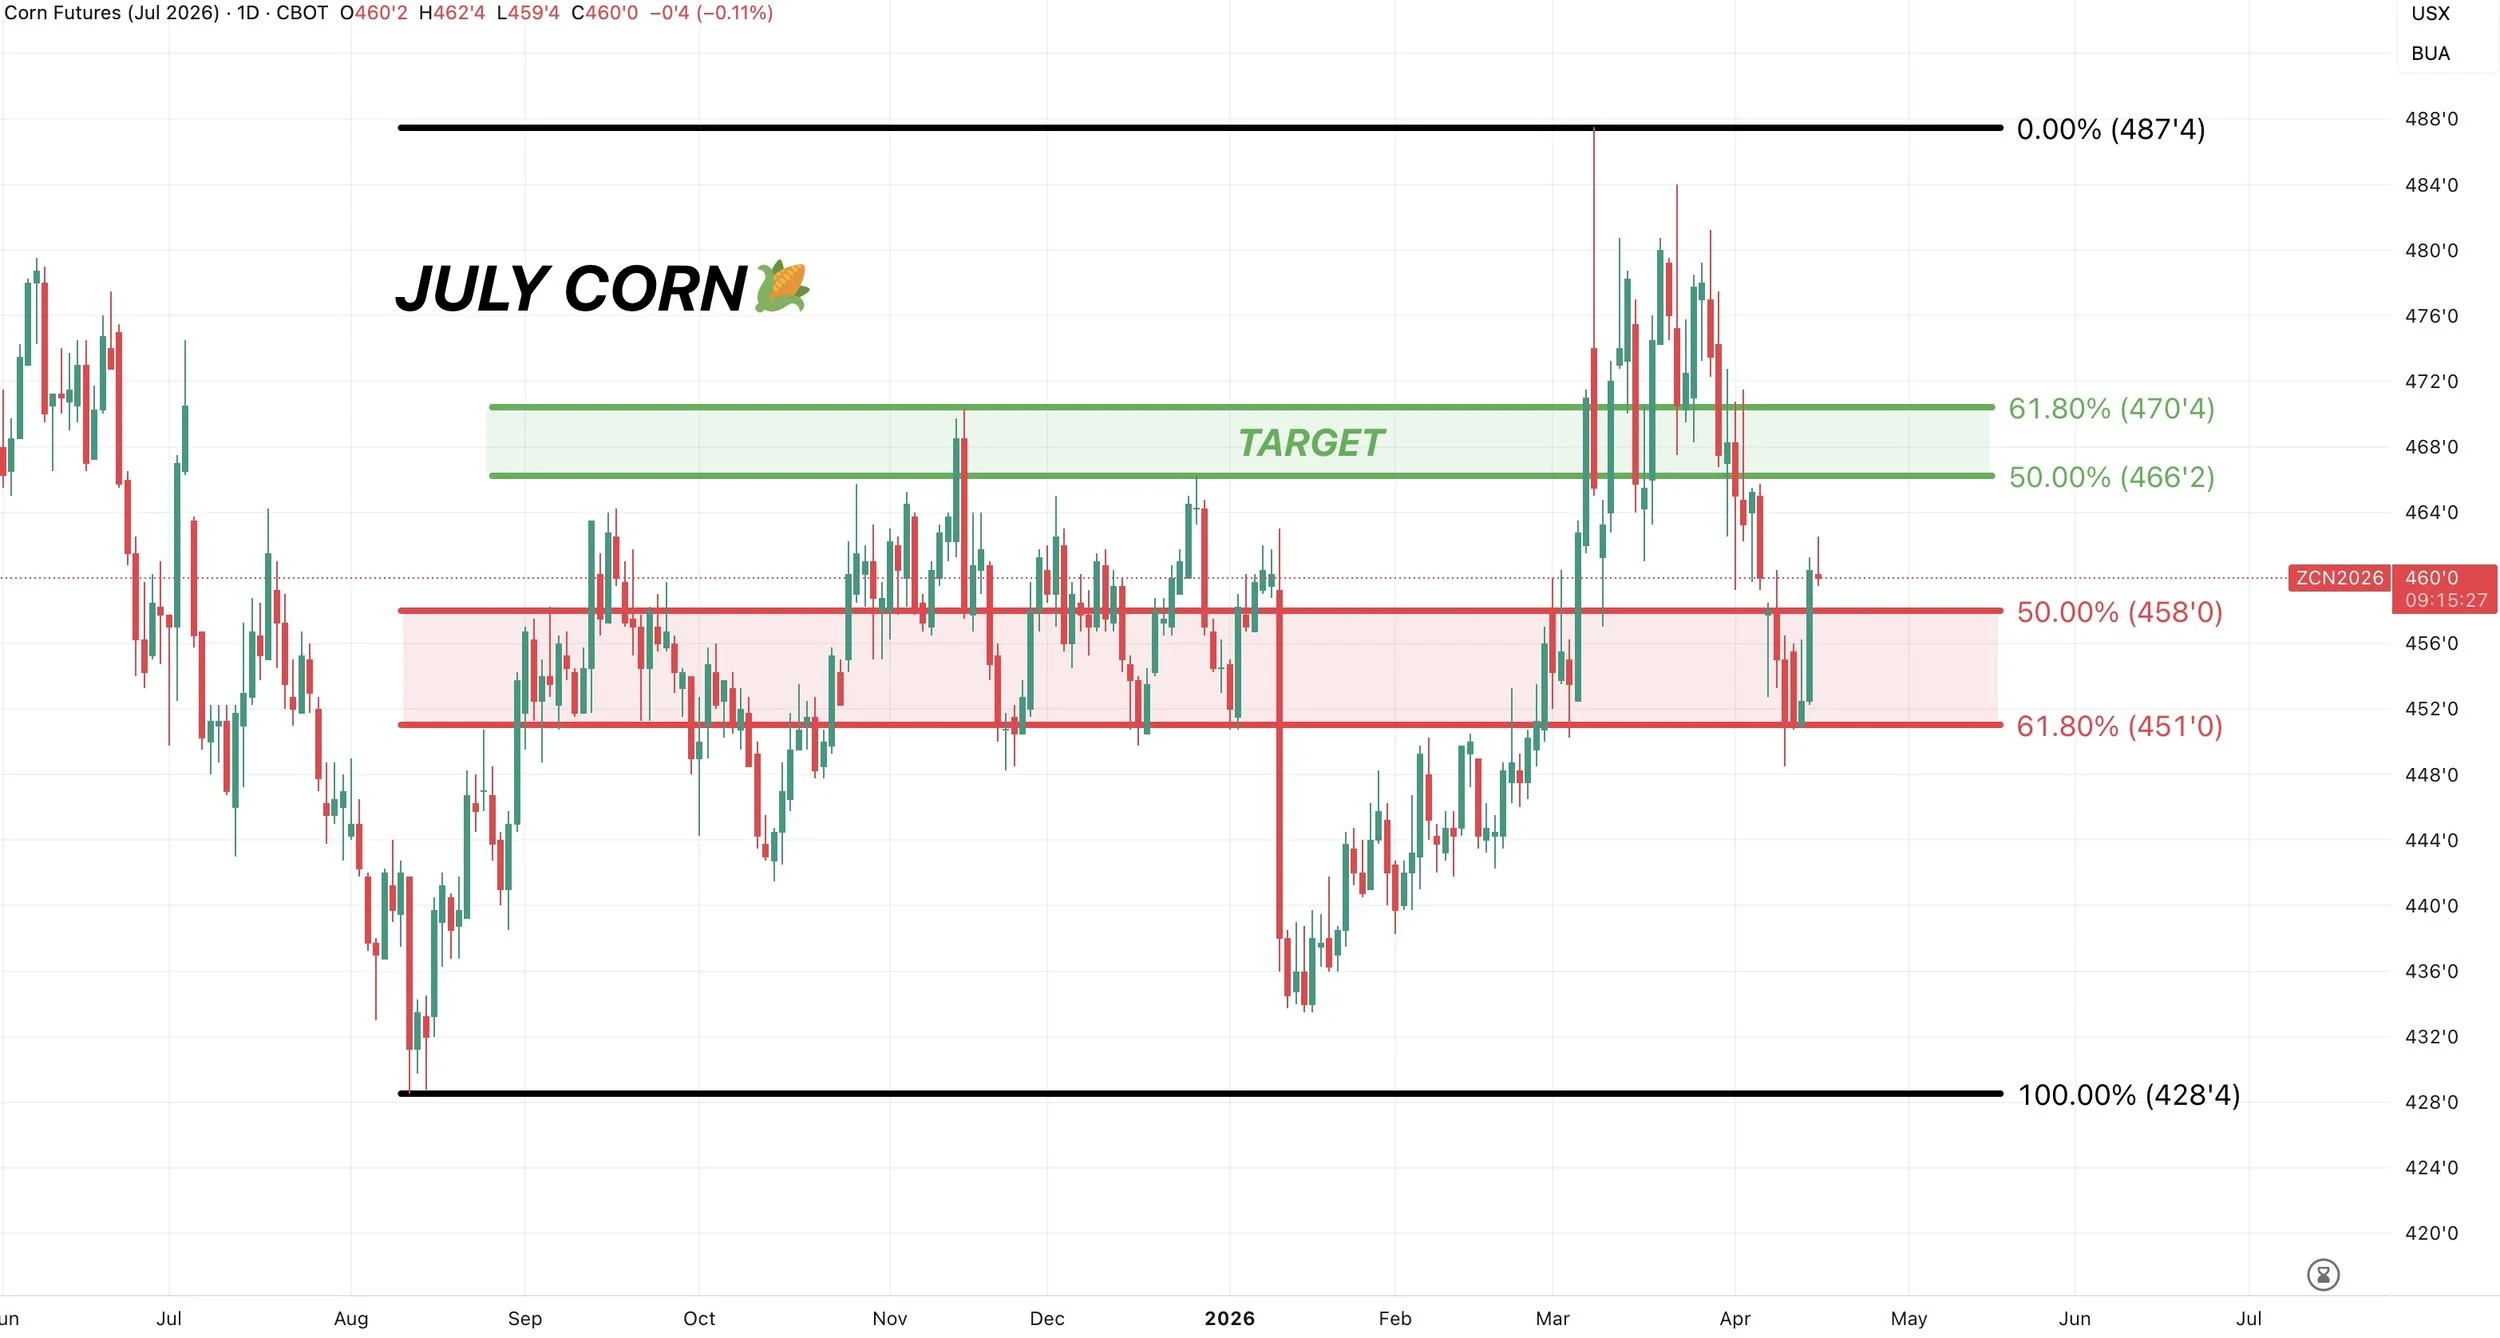
July Corn 🌽
Picture perfect bounce at the 61.8% level from the recent highs all the way down to the contract lows. Which also happened to be key support from fall.
That is still the must hold level, but has held nicely so far. Bouncing right where we needed.
A typical relief bounce claws back 50-61.8% of the sell off.
Which would take you to $4.65 to $4.70
That same area is that old resistance from fall.
That is where we want to take risk off the table if it comes.
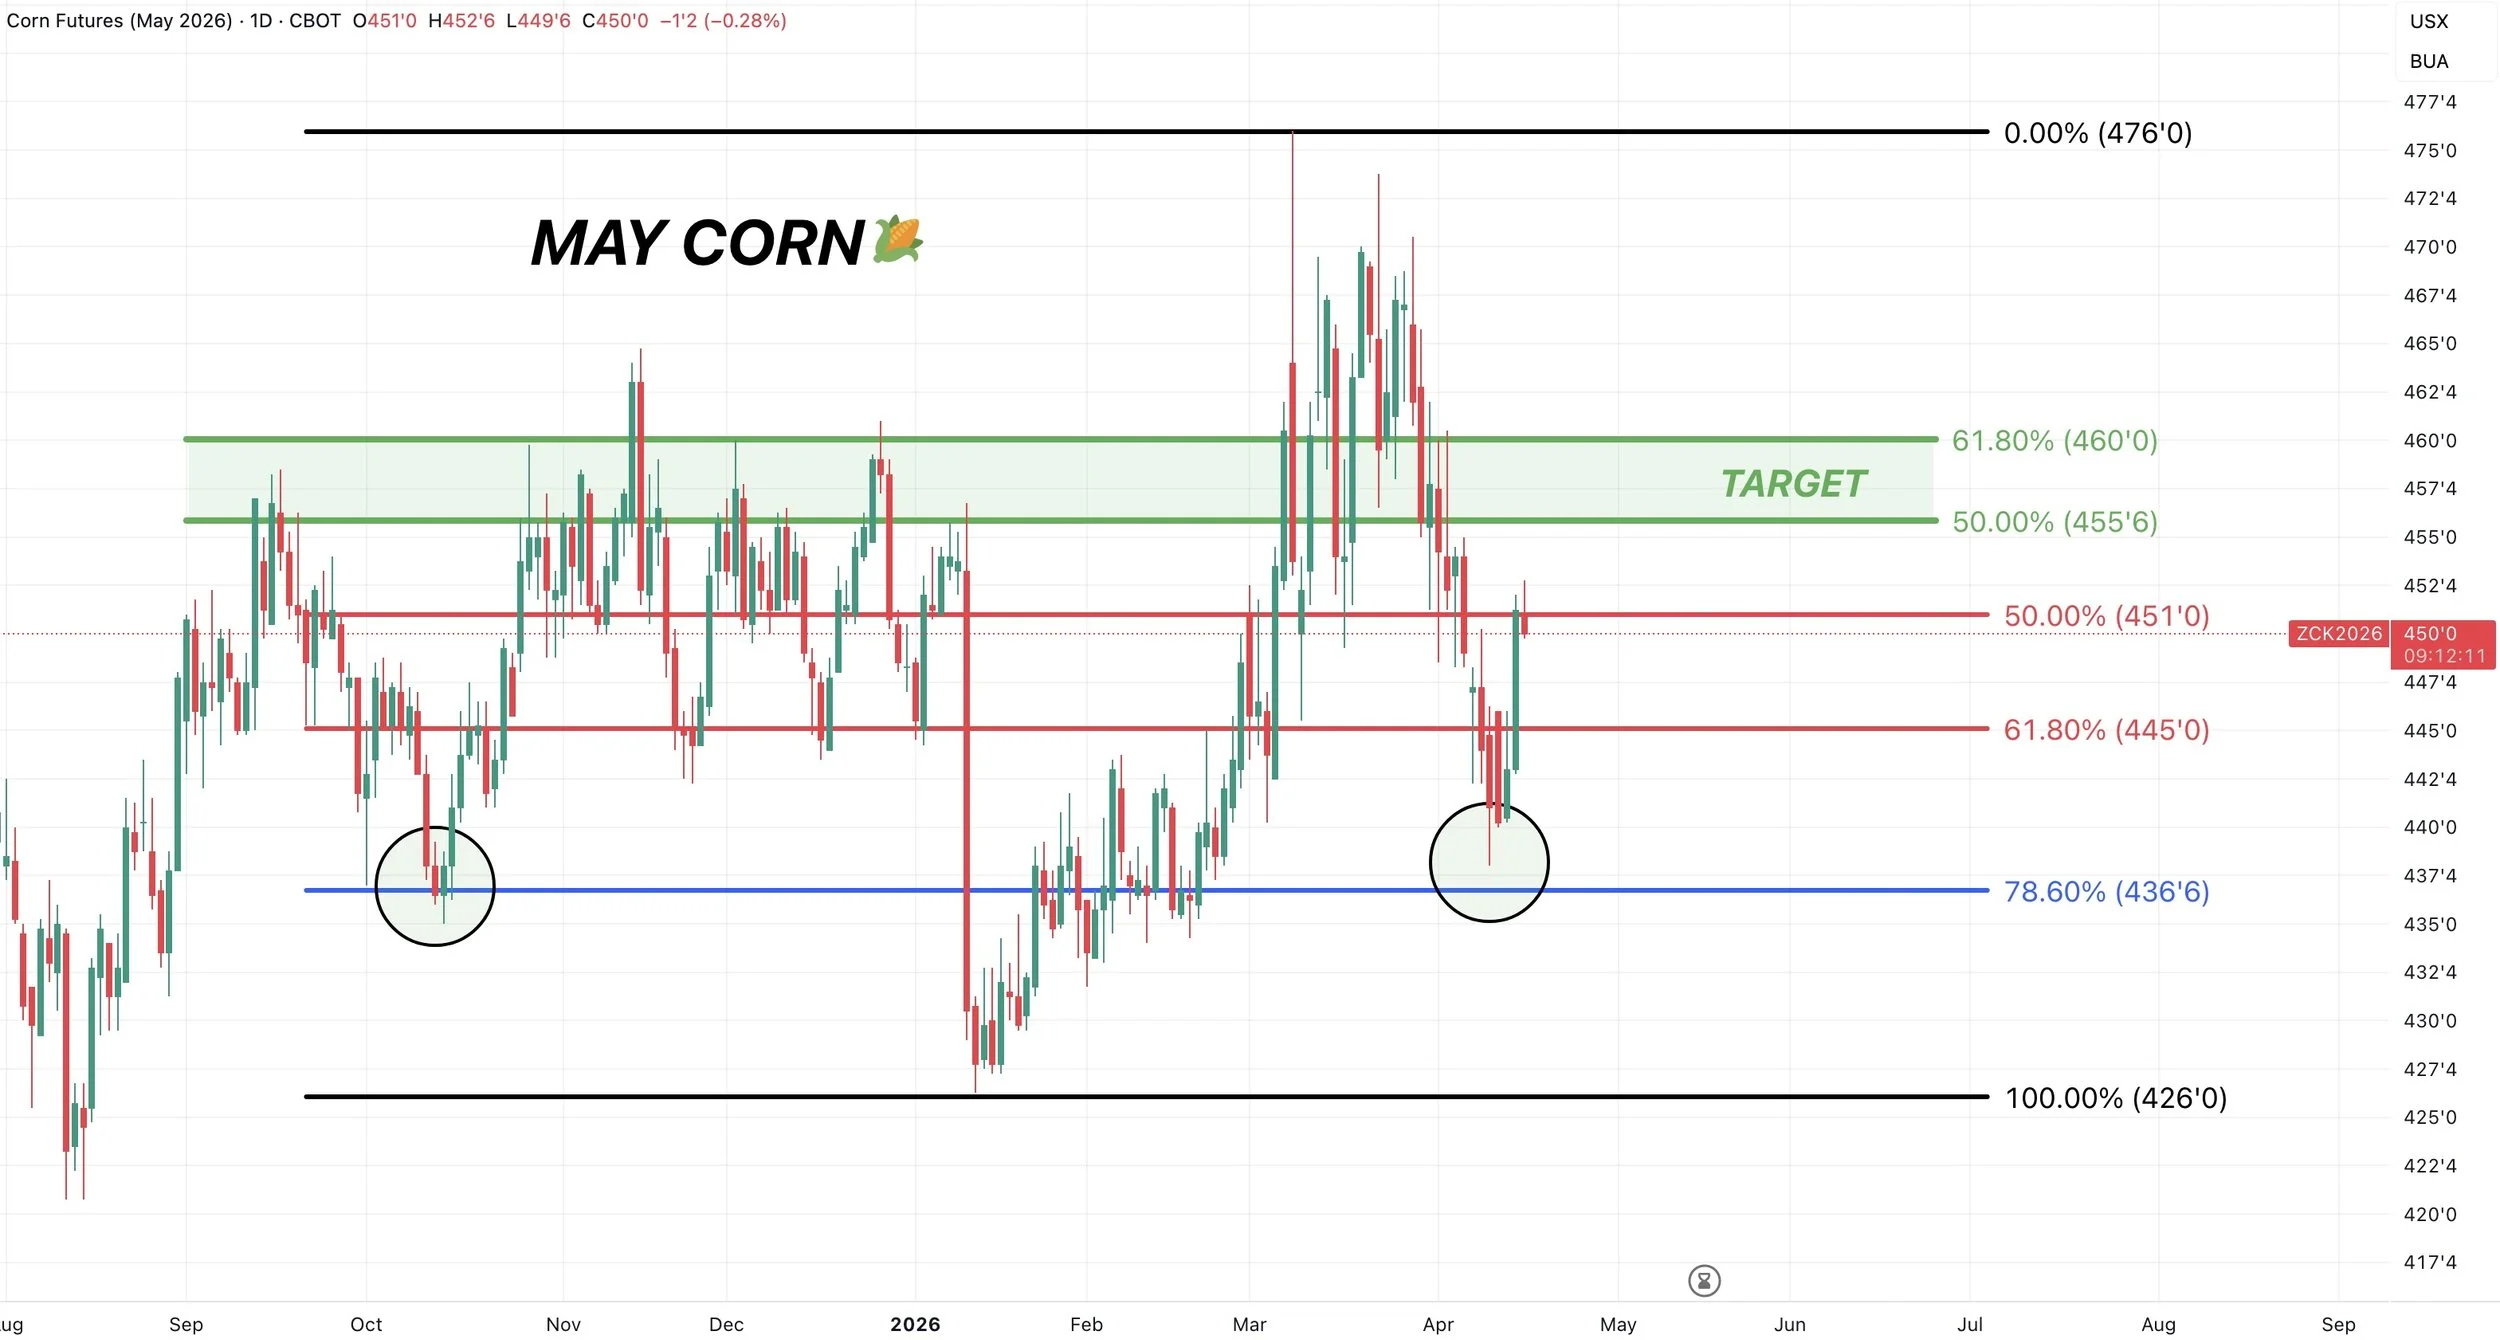
May Corn 🌽
We held that last line of support before contract lows.
A normal relief bounce would take you to $4.55 to $4.60. Which is also that resistance from fall.
That is where we want to de-risk.
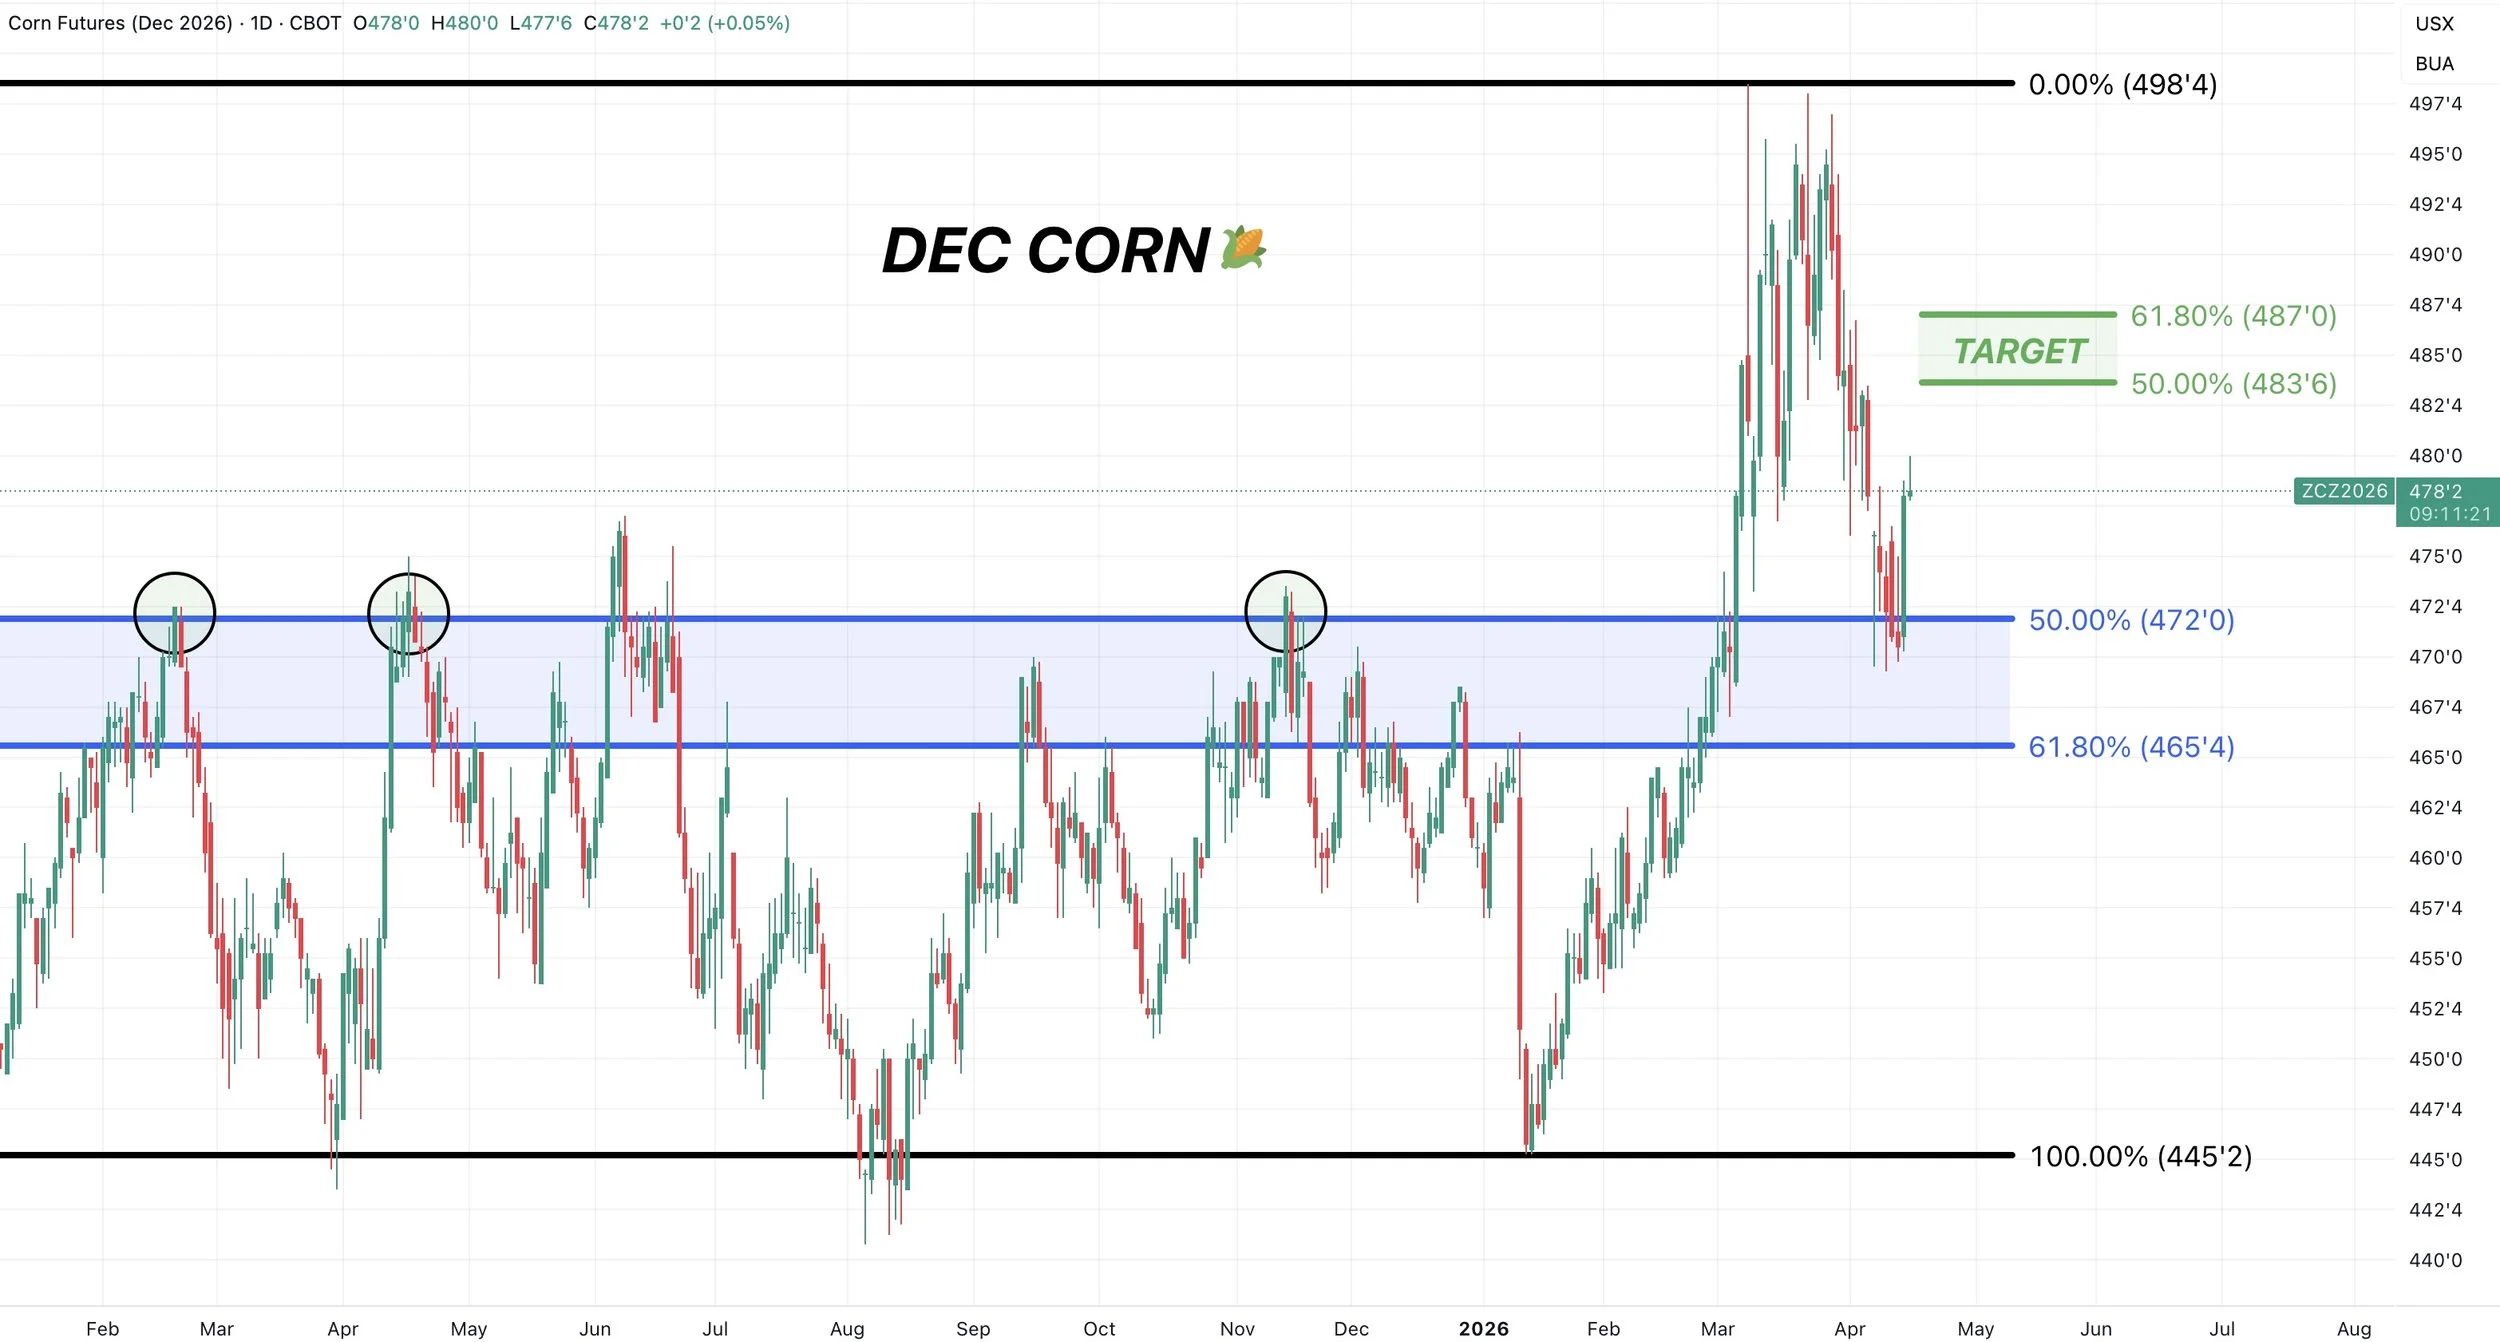
Dec Corn 🌽
Bouncing right off the 50% retracemet of this entire rally.
The same spot where this market failed to break through on several rally attempts over the last year.
Turning old resistance into support. Exactly where we needed.
A usual relief bounce takes you to $4.84 to $4.87. That is the golden zone.
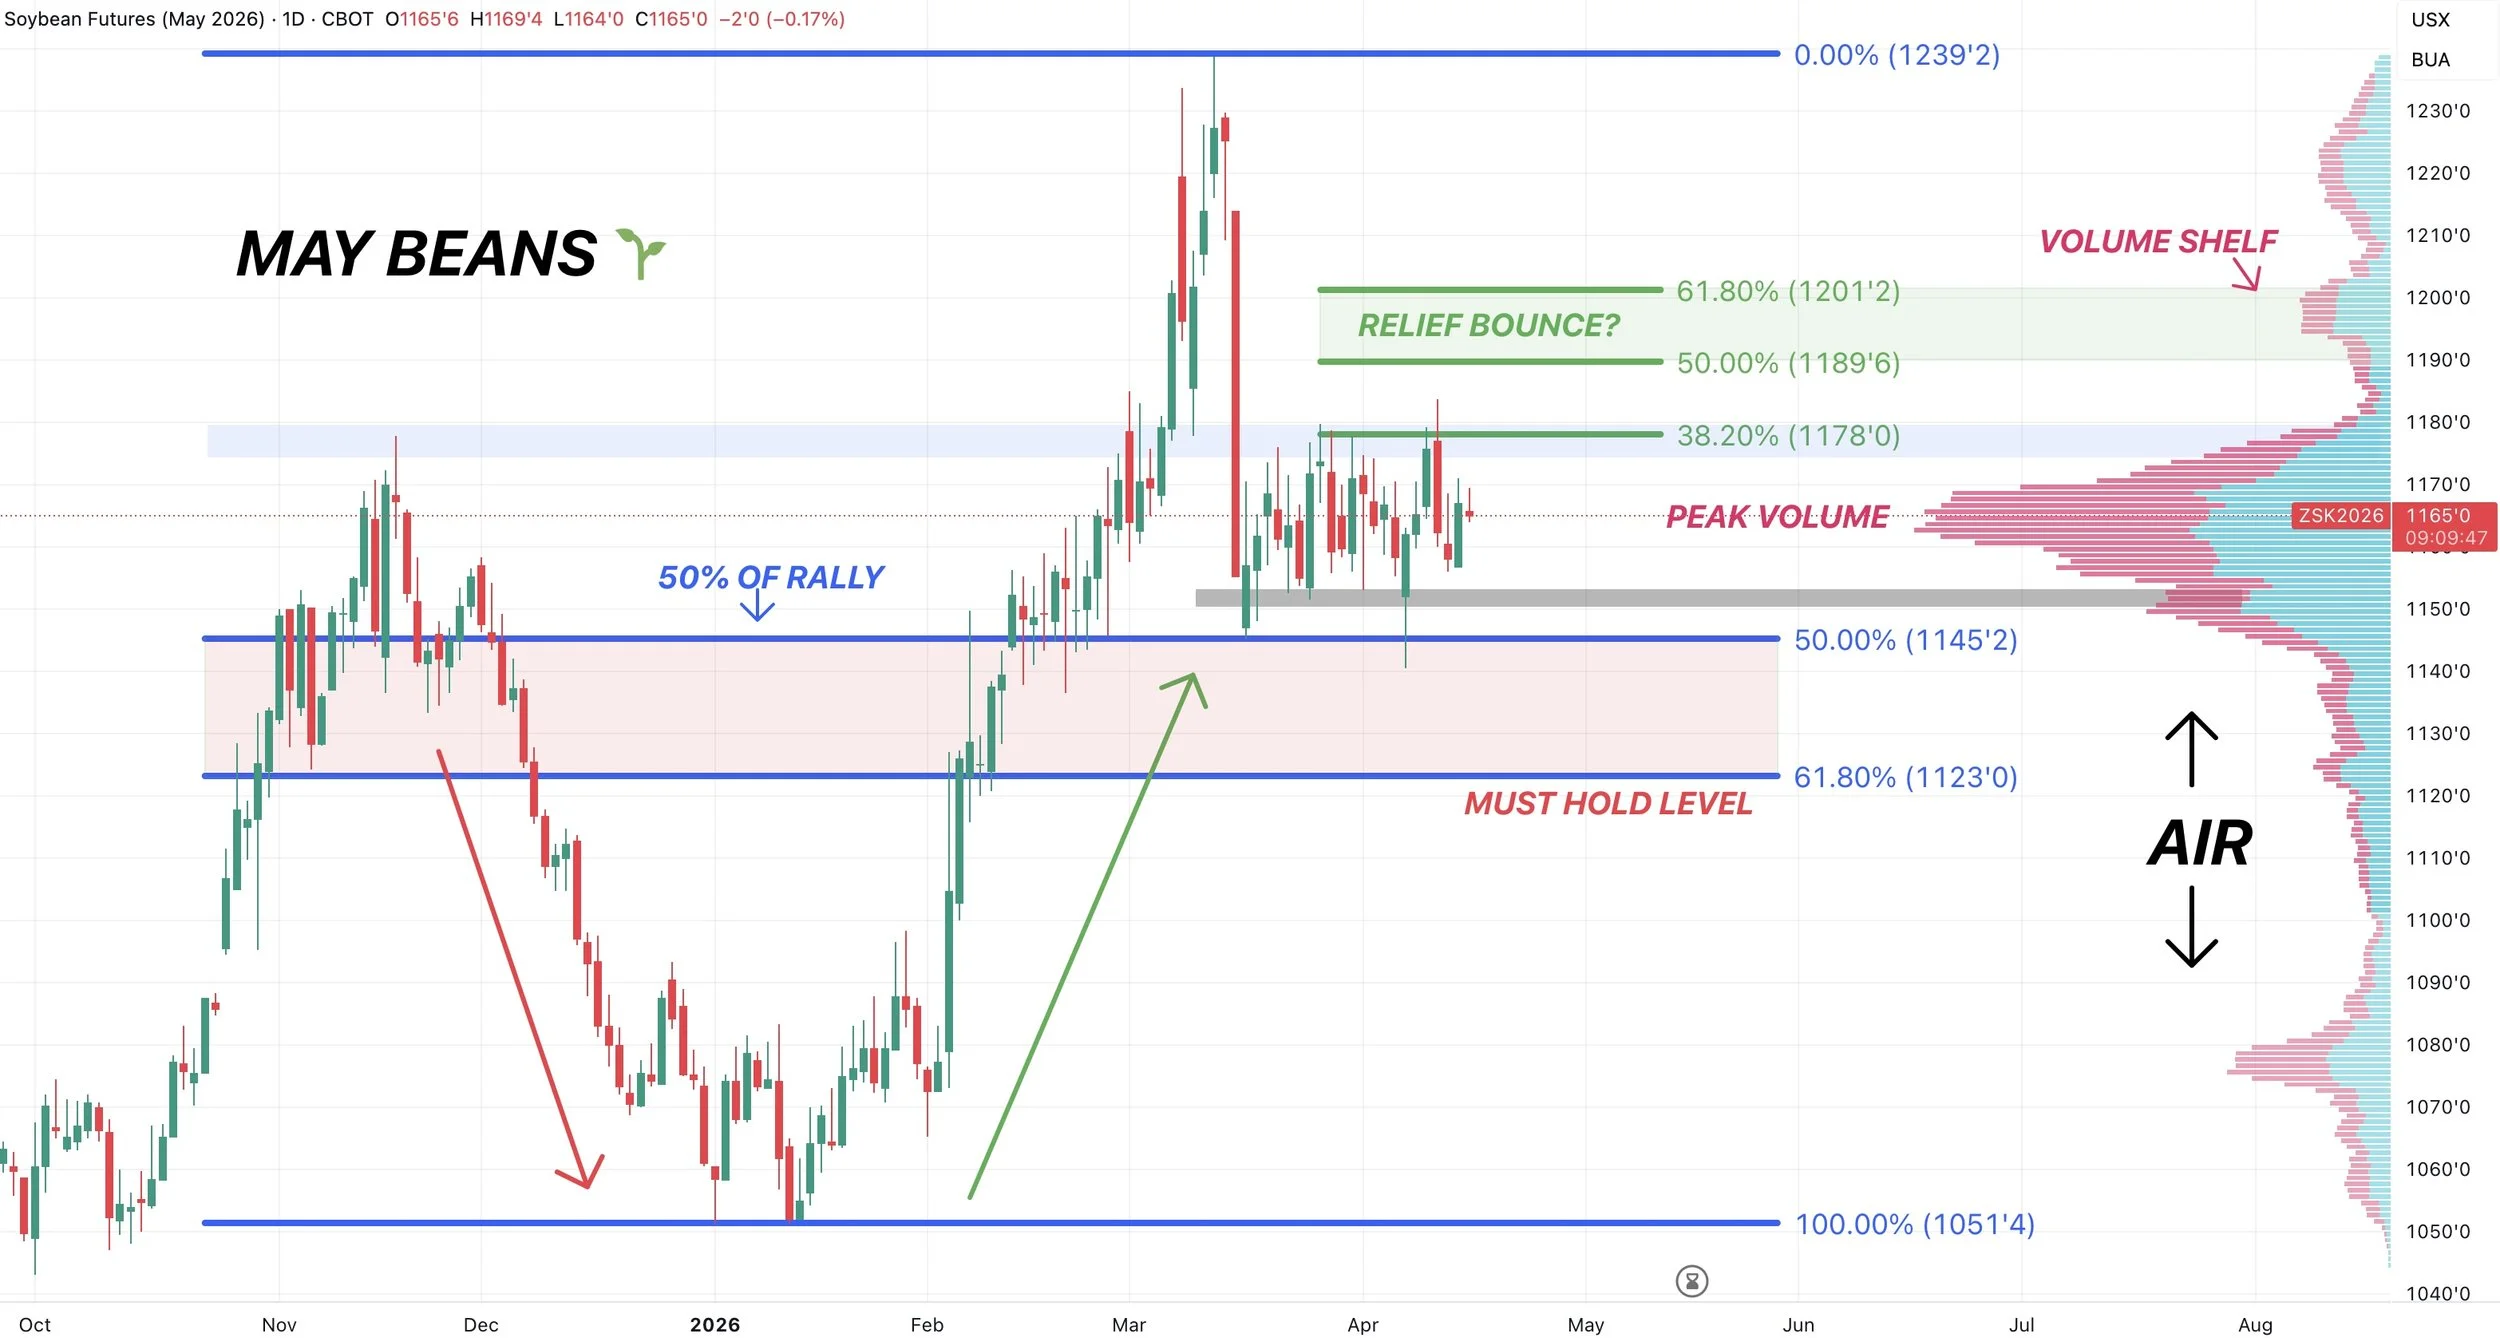
May Beans 🌱
Right back to no mans land.
We held key support.
Still need to hold $11.50
If we can get the break out, we are eyeing $11.90 to $12.00 to take some risk off the table.
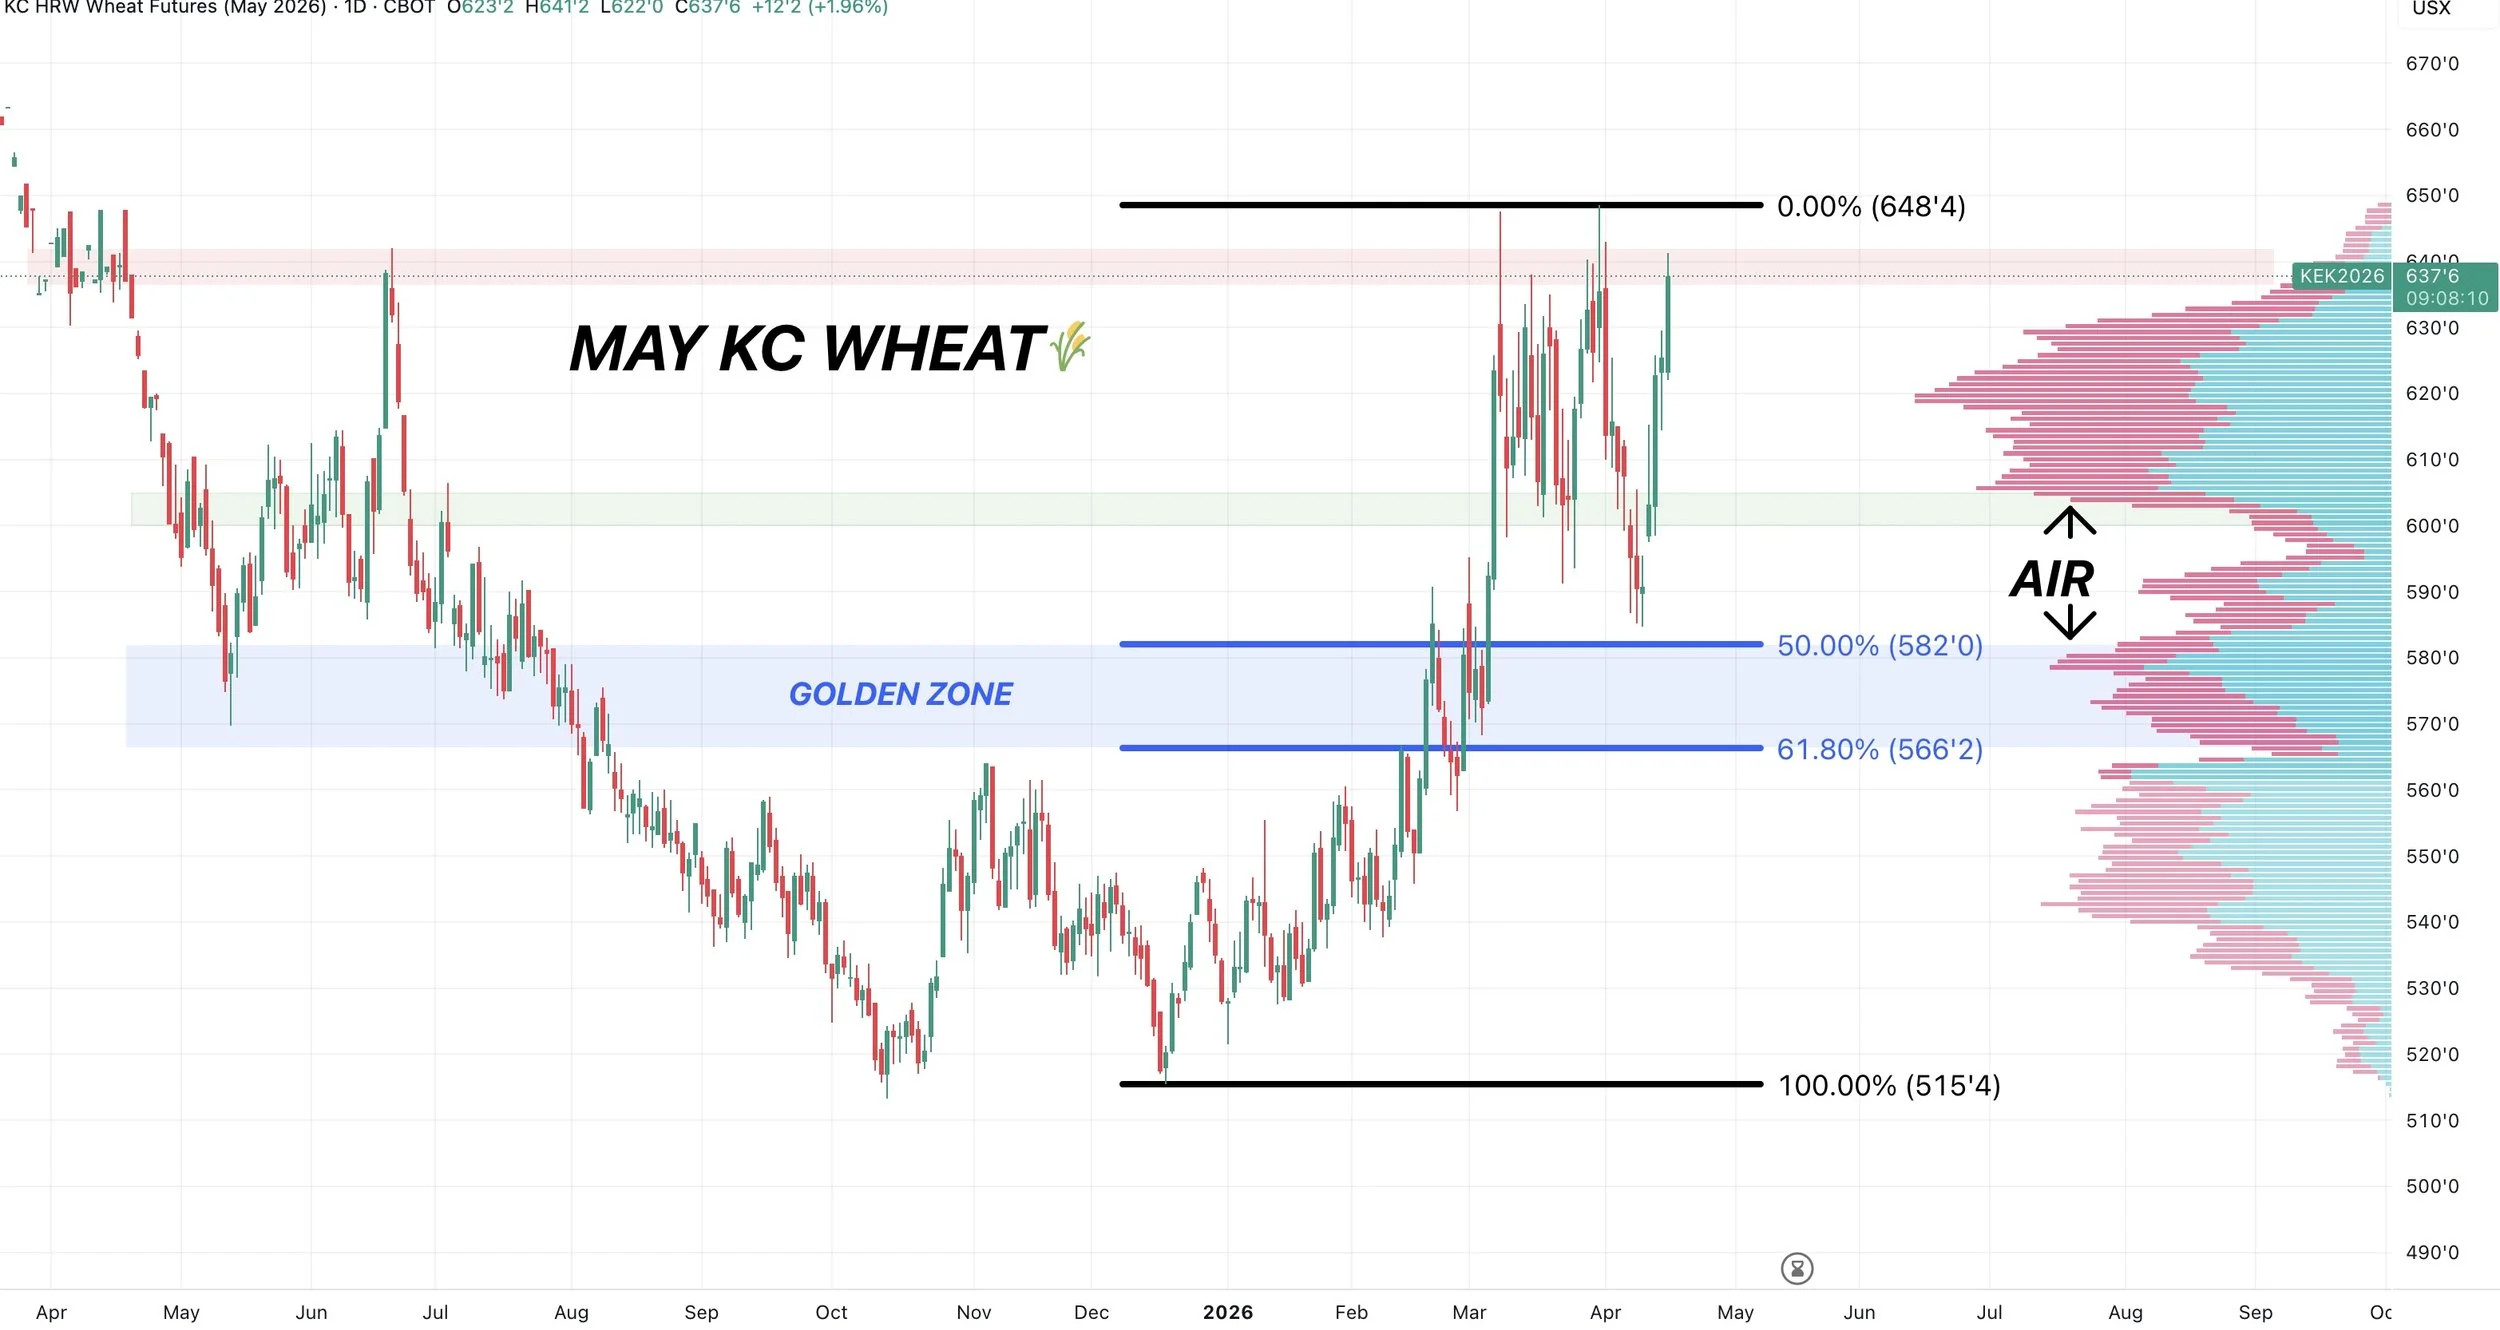
May KC Wheat 🌾
Right back at those highs where this market failed on 3 separate occasions.
Clearly this is resistance, so if you haven’t rewarded this rally at all it probably makes sense to do so to some sort of extent.
If we can break above this highs, the door higher is wide open. Could easily lead to a nice leg higher.
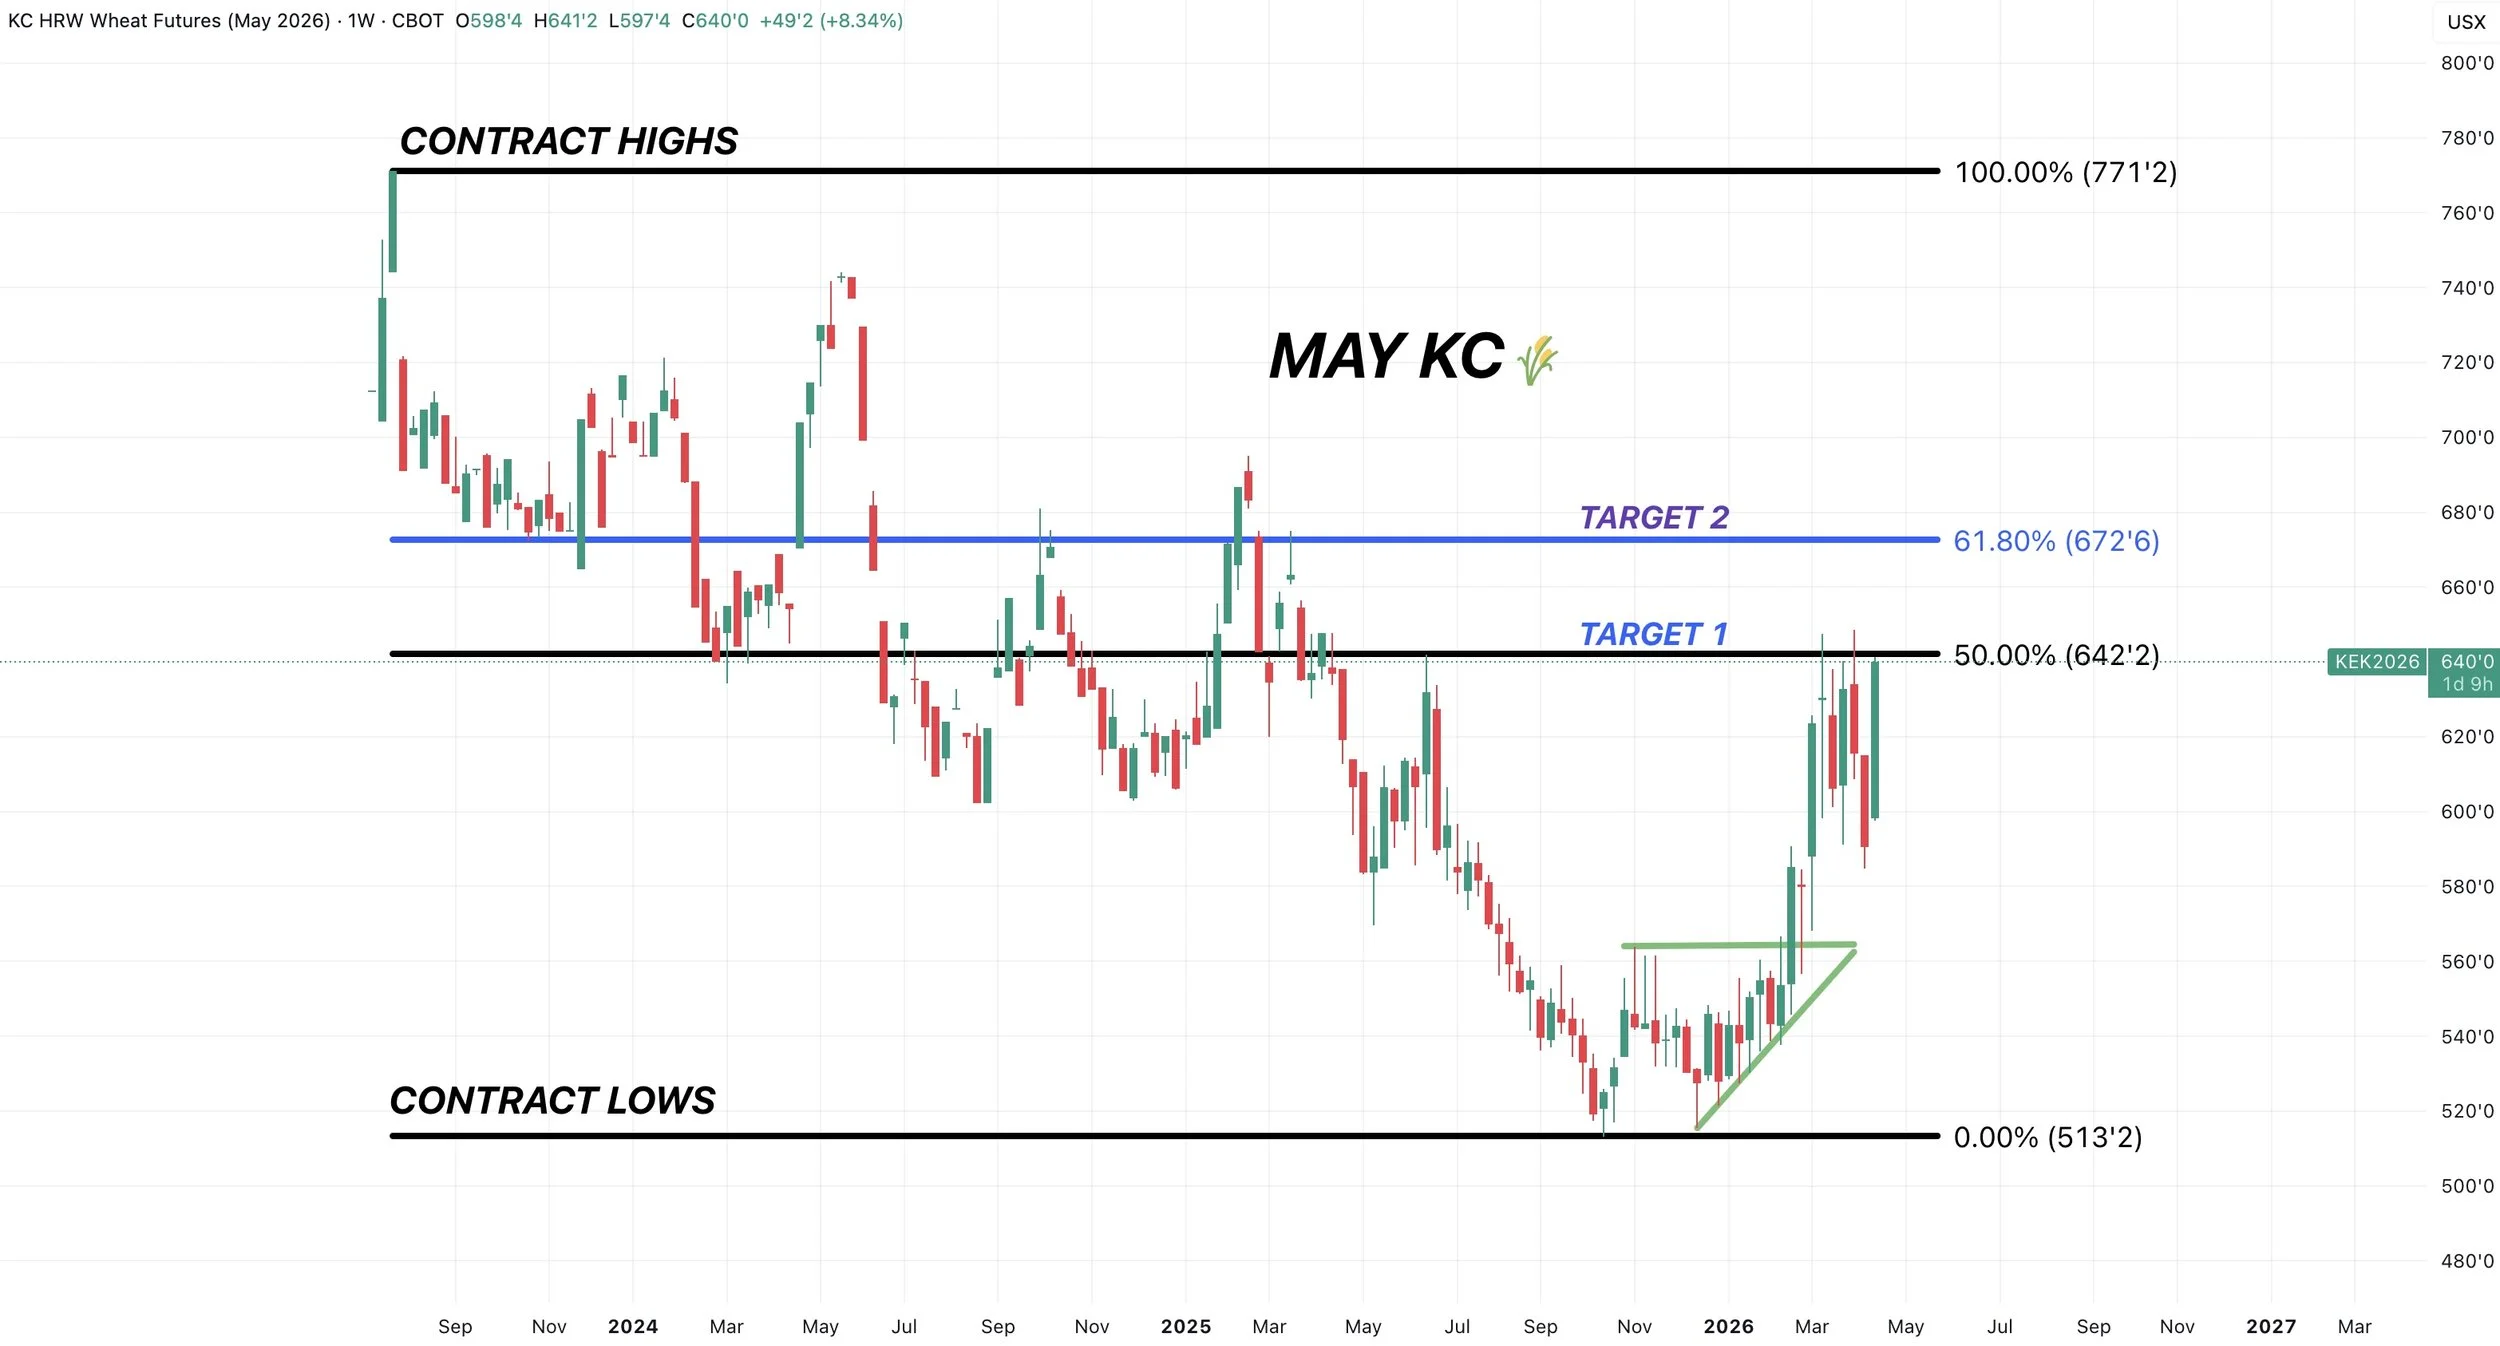
Here is the weekly chart.
We failed after clawing back 50% of the contract highs from contract lows.
The 61.8% level comes in at $6.72
So that is the next target.
Want to Talk?
Our phones are open 24/7 for you guys if you ever need anything or want to discuss your operation.
Jeremey & Office: (806)484-1214
Sebastian: (605)280-1186
Email: sfrost@dailymarketminute.com
Hedge Account
Interested in a hedge account? Use the link below to set up an account or give us a call.
Recent Signals
April 10th, 2026: 🌽
Corn buy signal.
March 19th, 2026: 🌱
New crop soybeans signal & hedge alert.
CLICK HERE TO VIEW
March 9th, 2026: 🌱
Soybeans signal & hedge alert. Sent via text.
March 6th, 2026: 🌽 🌾
Corn & wheat sell signal & hedge alert.
March 3rd, 2026: 🌽
Old crop & new crop corn sell signal & hedge alert.
Feb 26th, 2026: 🌱
Old crop & new crop beans sell signal & hedge alert.
Feb 19th, 2026: 🌾
KC wheat sell signal & hedge alert.
Feb 6th, 2026: 🌽 🌱
Old crop corn & soybean sell signal & hedge alert.
Feb 4th, 2026: 🌱
Soybean sell signal & hedge alert.
Nov 17th, 2025: 🌱
Soybean sell signal & hedge alert.