
CHART BREAKDOWNS
MARKET UPDATE
You can scroll to read the usual update as well. As the written version is the exact same as the video.
Timestamps for video:
Corn Charts: 0:35min
Bean Charts: 4:55min
Wheat Charts: 8:15min
Cattle Charts: 10:50min
Want to talk?
Office: (806)484-1214
Futures Prices Close
Overview
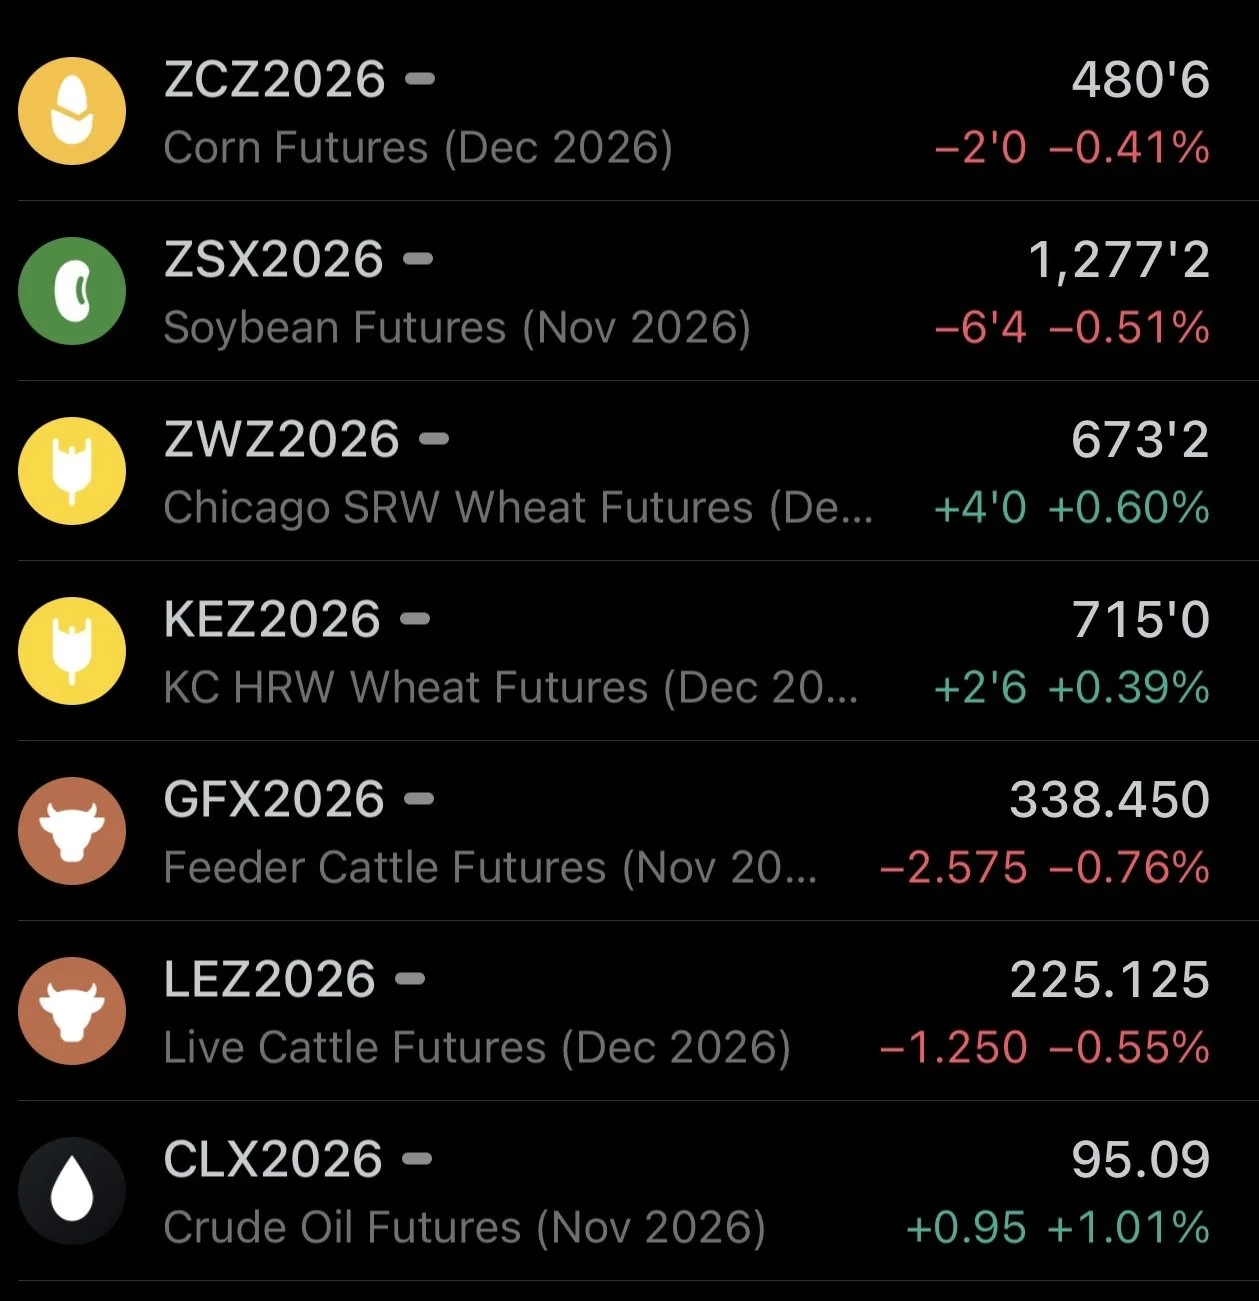
Grains and cattle both on the weaker side today with wheat being the only one to end the day higher as it closed nicely off it's early lows.
Corn continues to digest the USDA report. As we've been stuck in sideways range all week long.
Soybeans continue to grind lower despite seeing our first flash sale of soybeans to China today since that China meeting.
It was overalll a pretty quiet news day for the market.
Today we are just going to be diving into the charts and things we're watching here, as I'll have a more fundamental deep dive later this week.
So let's dive right in.
Today's Main Takeaways
Corn
Charts
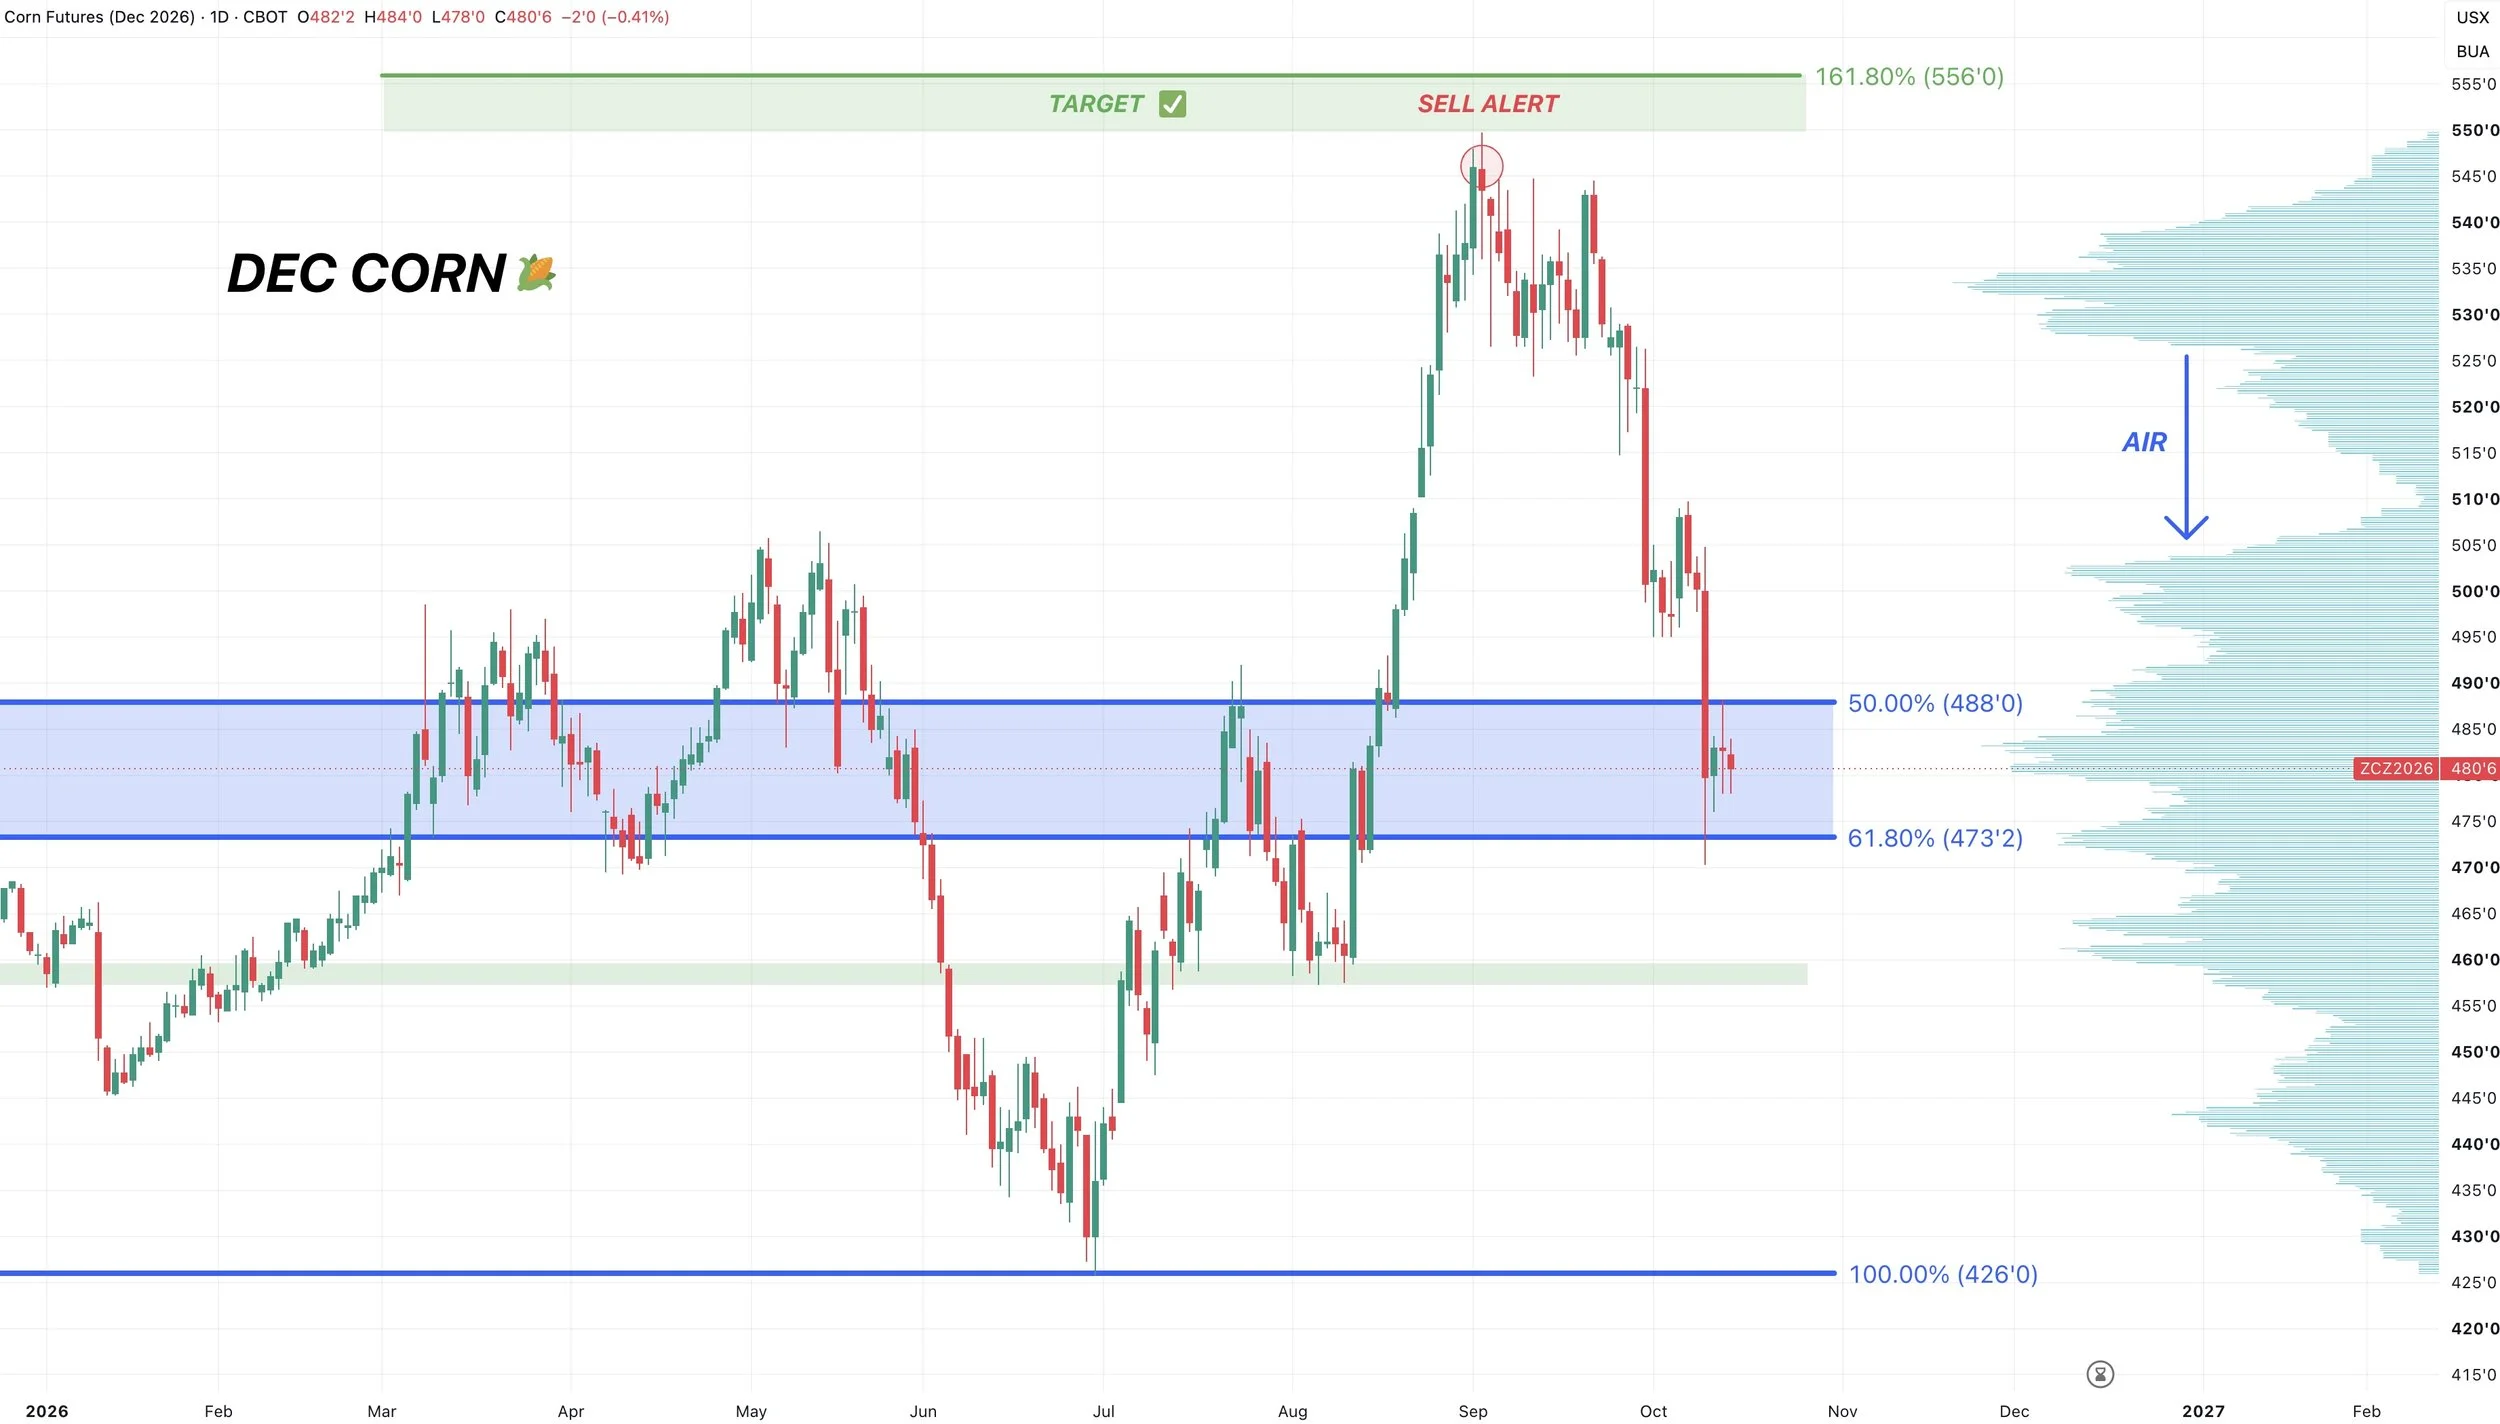
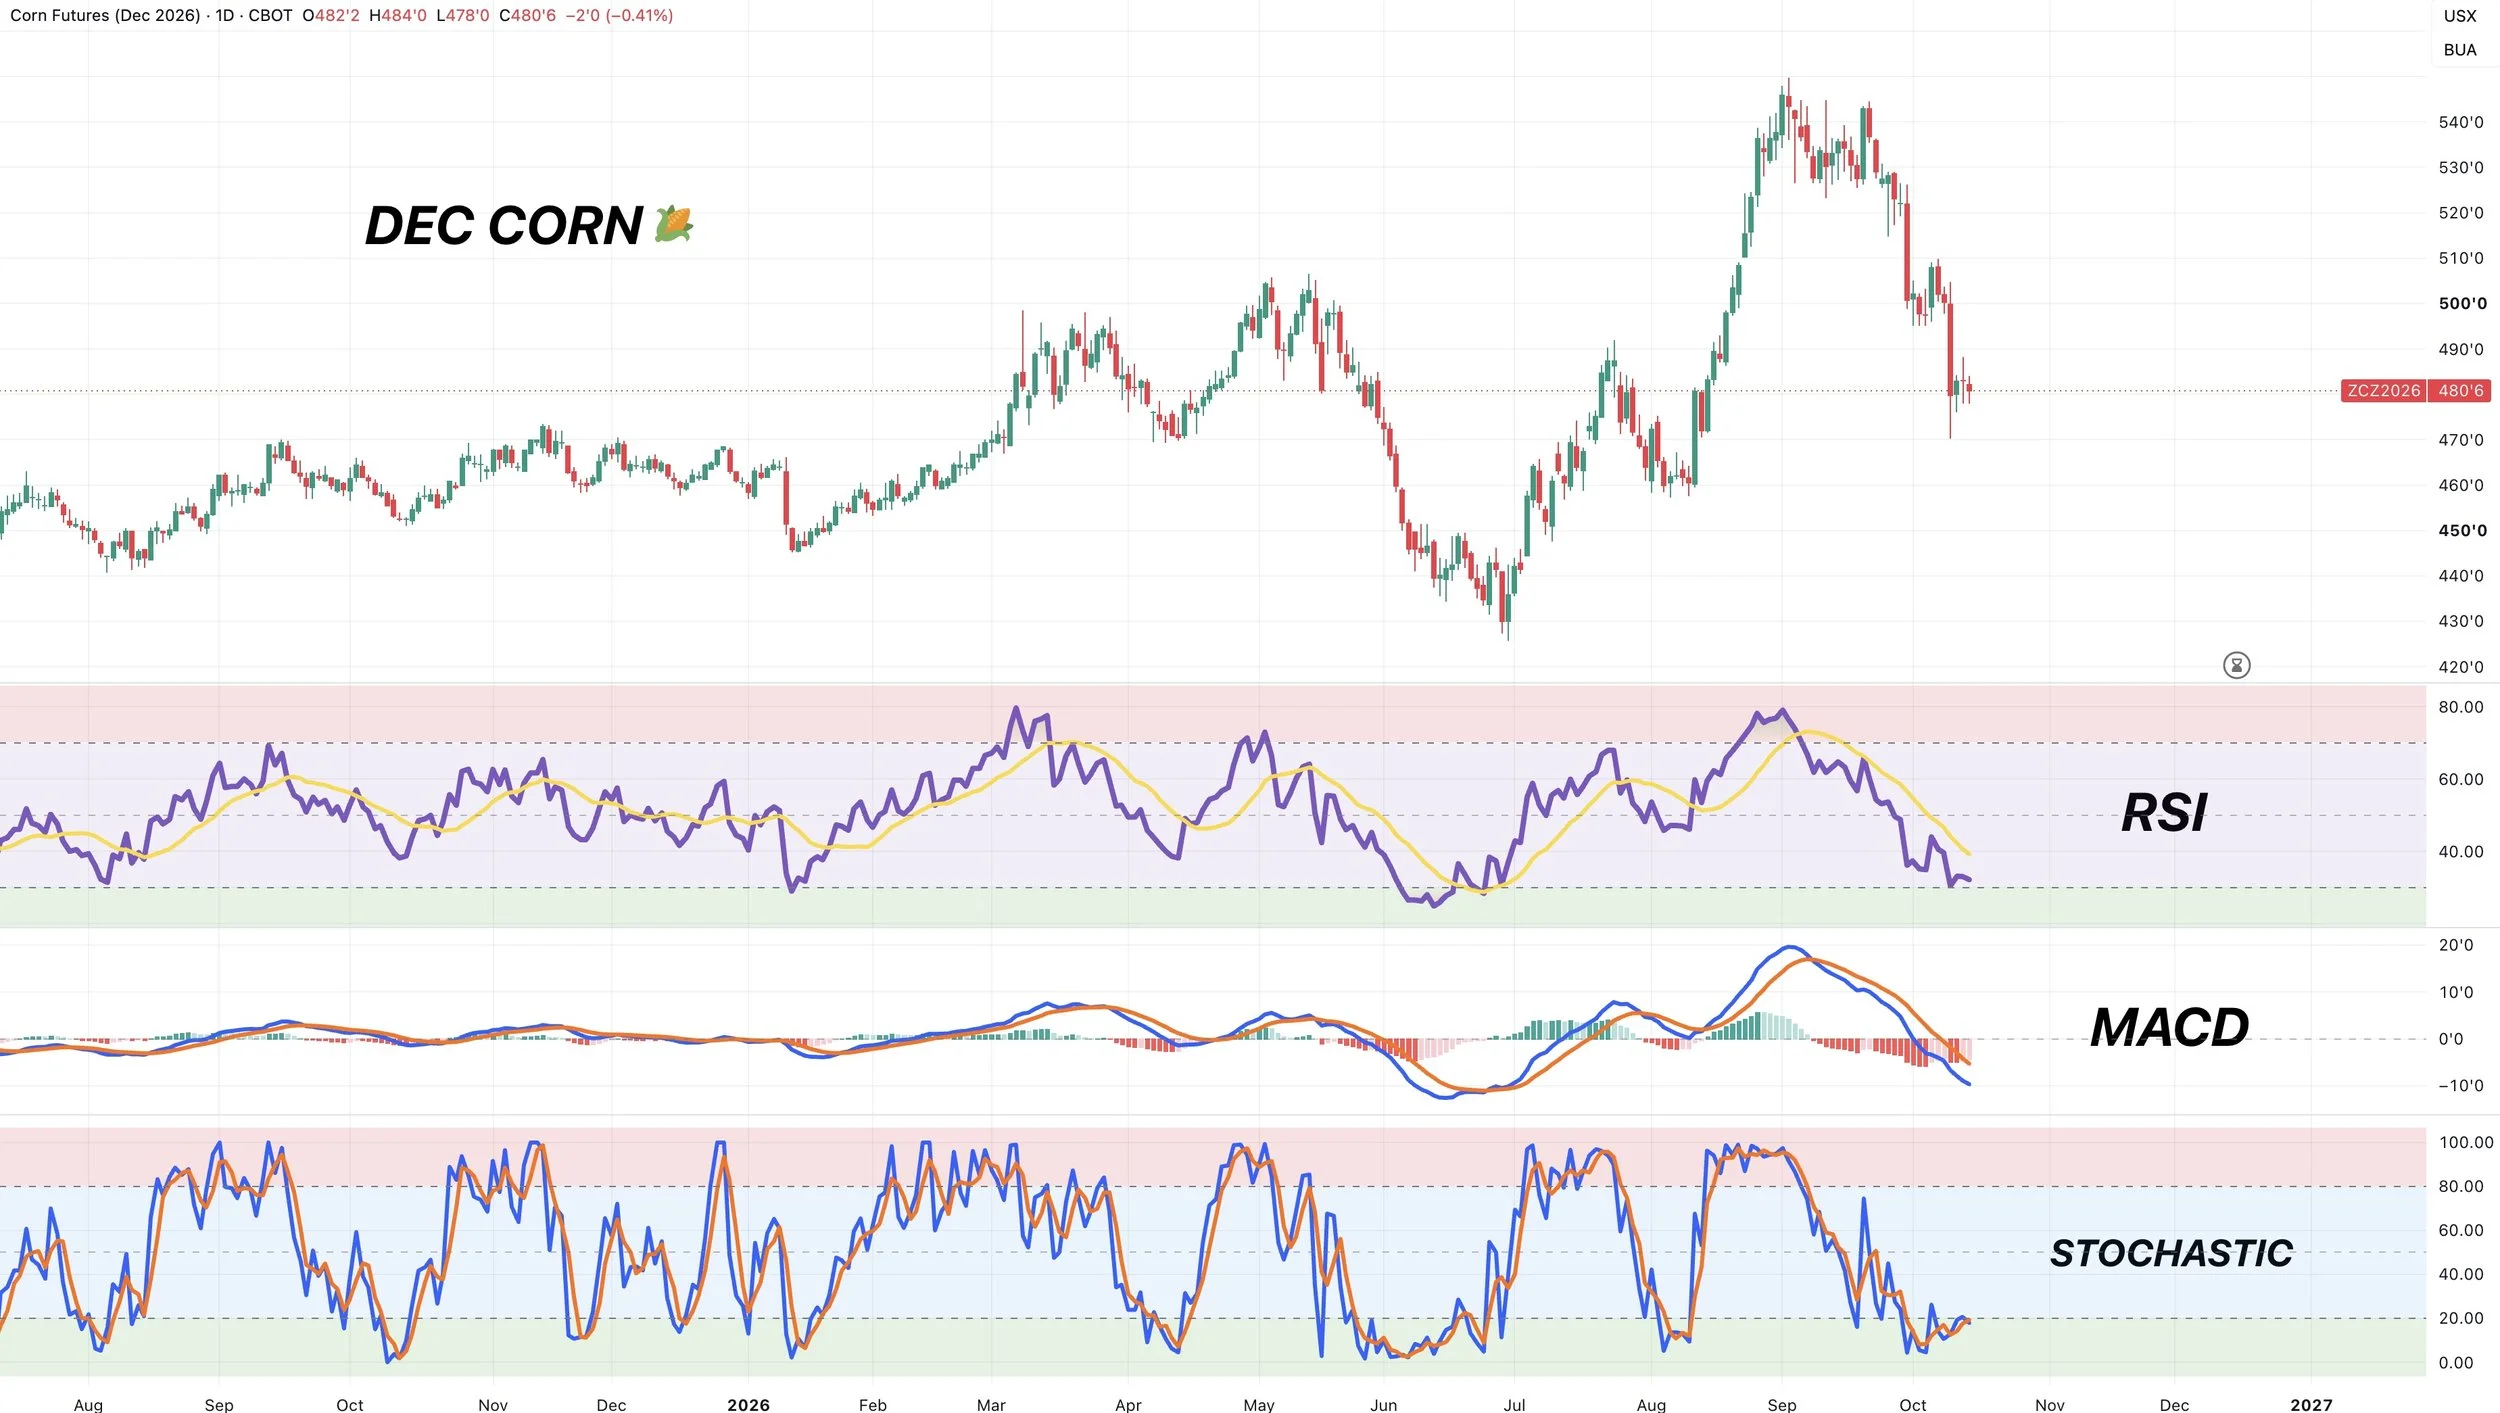
Dec Corn Chart: Contract Lows Golden Fib
Sideways action this week thus far.
If corn is going to carve out some lows, we want to see it happen here.
We have given back 61.8% of the entire rally off contract lows.
Which is the most common retracement level.
Prior Key S/R:
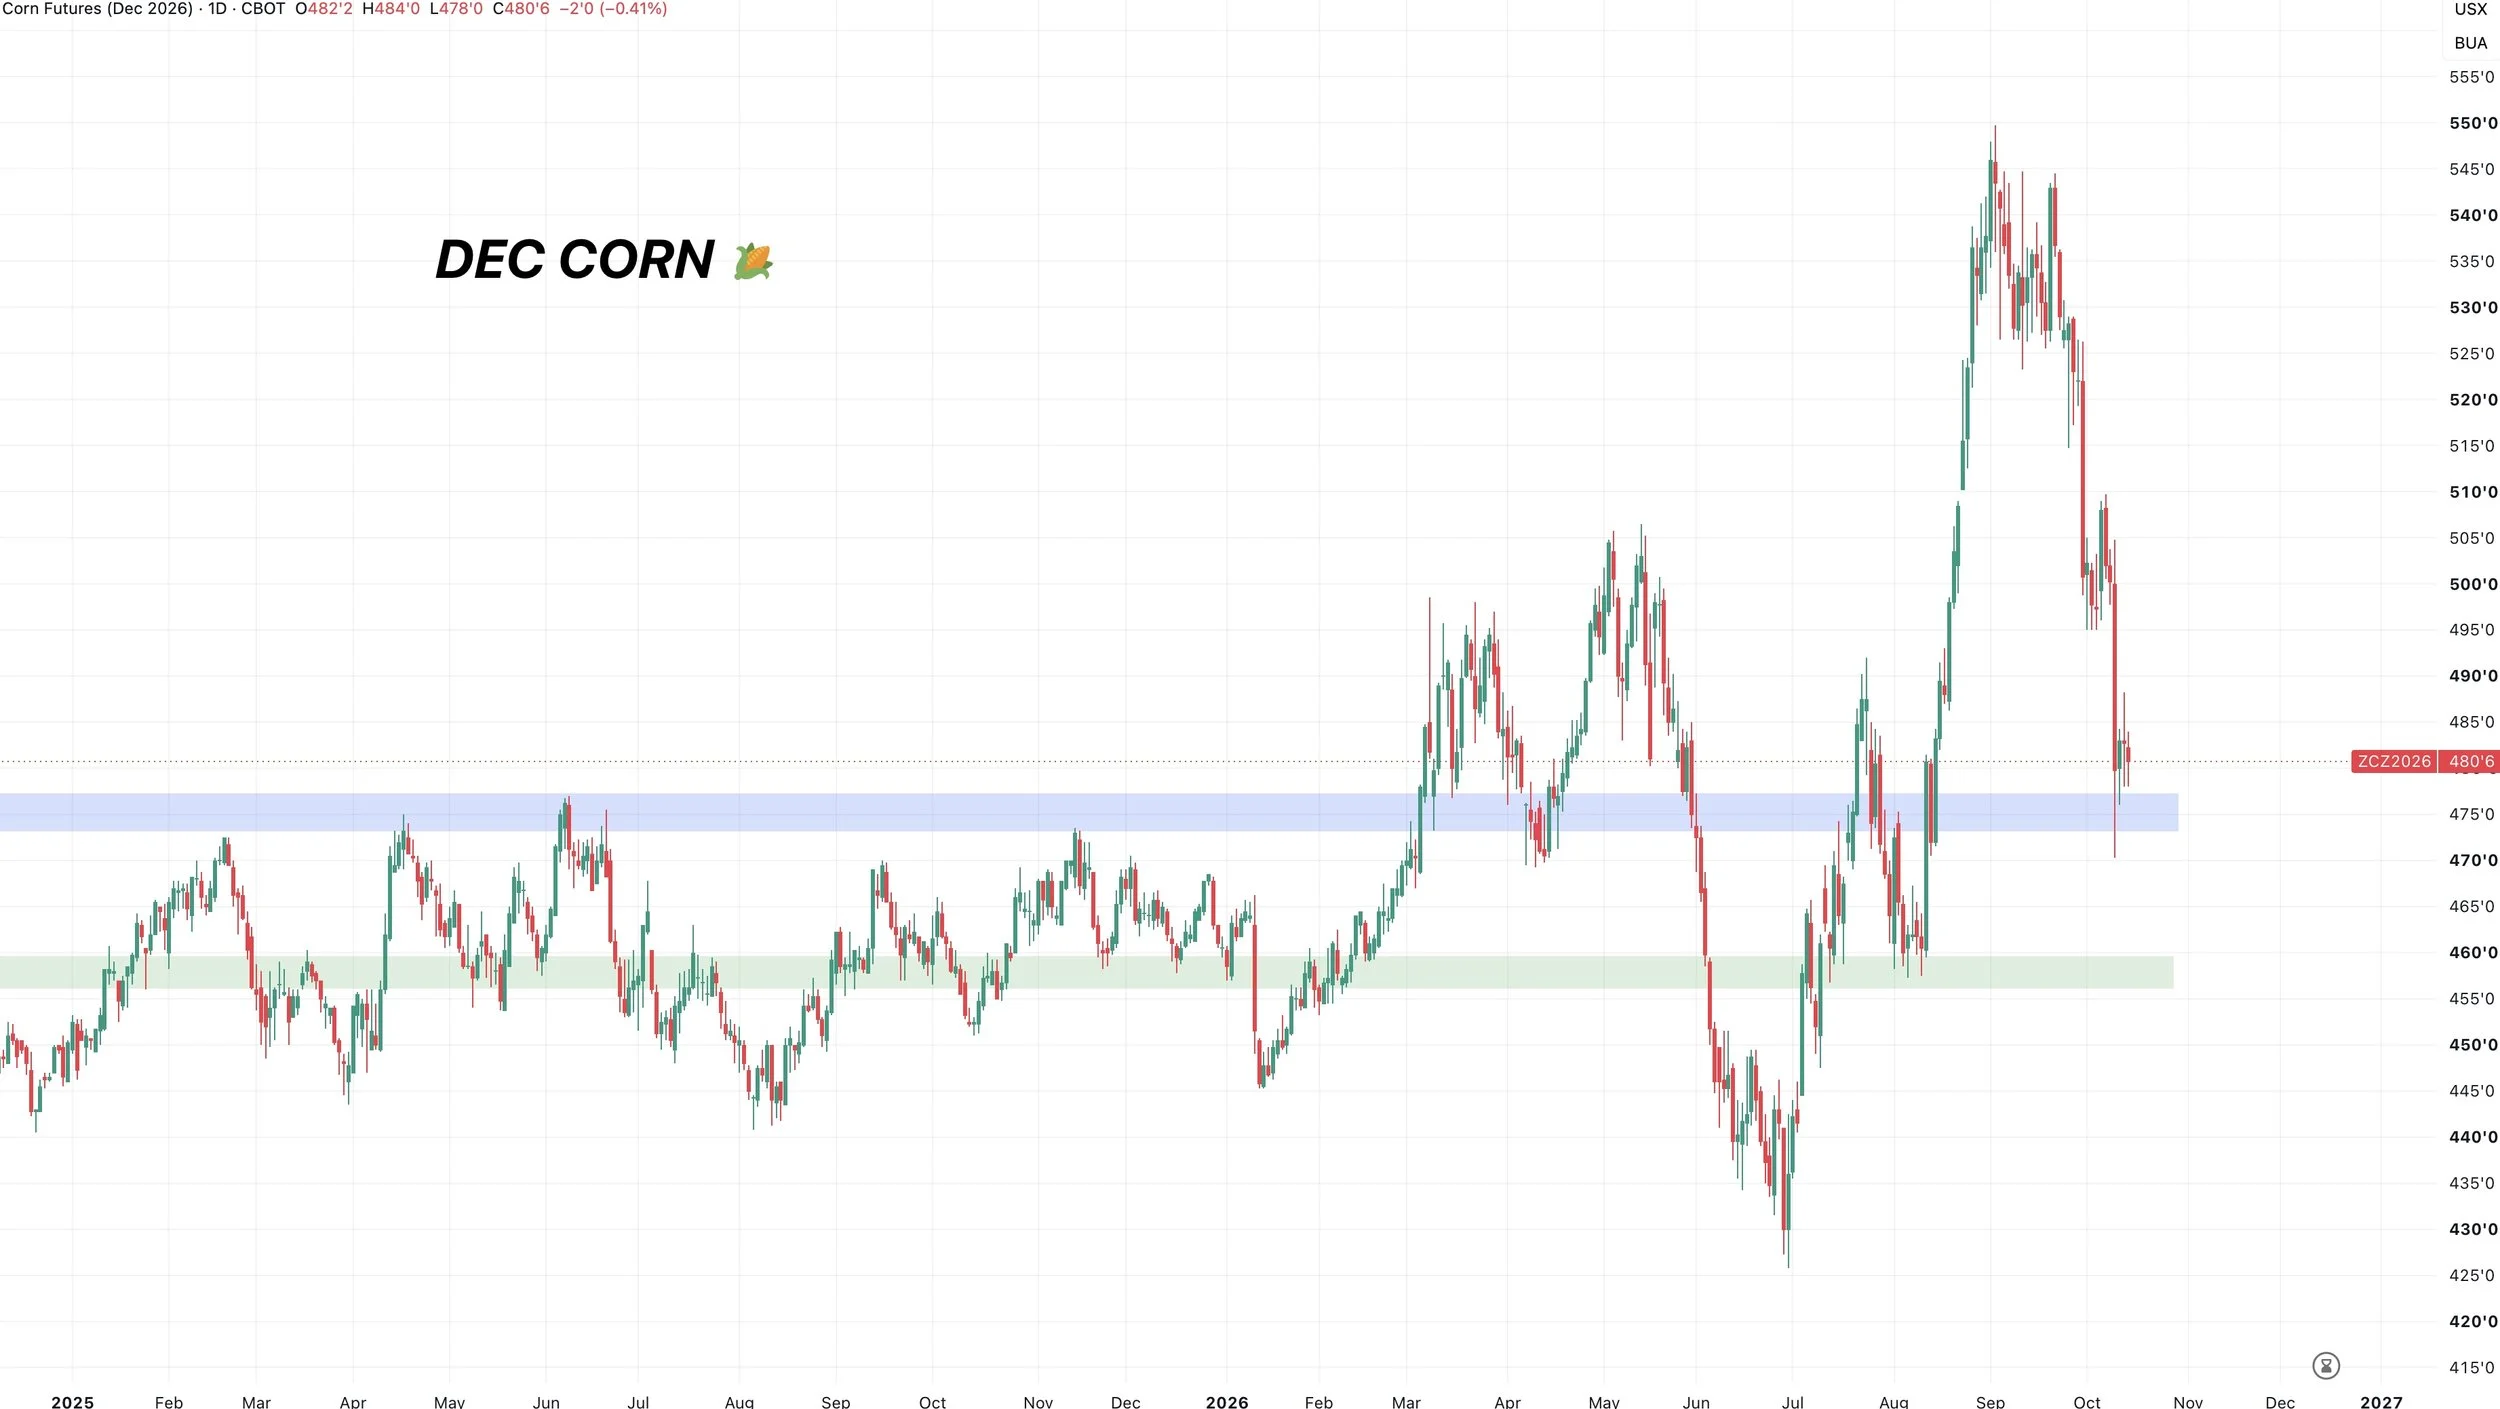
Not only is this the golden retracement.
This same level has been massive support and resistance countless times.
It was corn's ceiling all through out 2025. It was the lows from April.
So this would be a spot where we'd expect us to carve out some lows.
Stopping the bleeding in this area makes perfect sense.
Altough this is a point of interest for the correction to end, you do have to keep in mind that failure to hold this support will of course open the door to further downside.
When you break support, it opens the flood gates lower.
But you don’t get bearish at support.
I'll have some upside targets once it feels like we've put in a bottom.
200-Day MA:
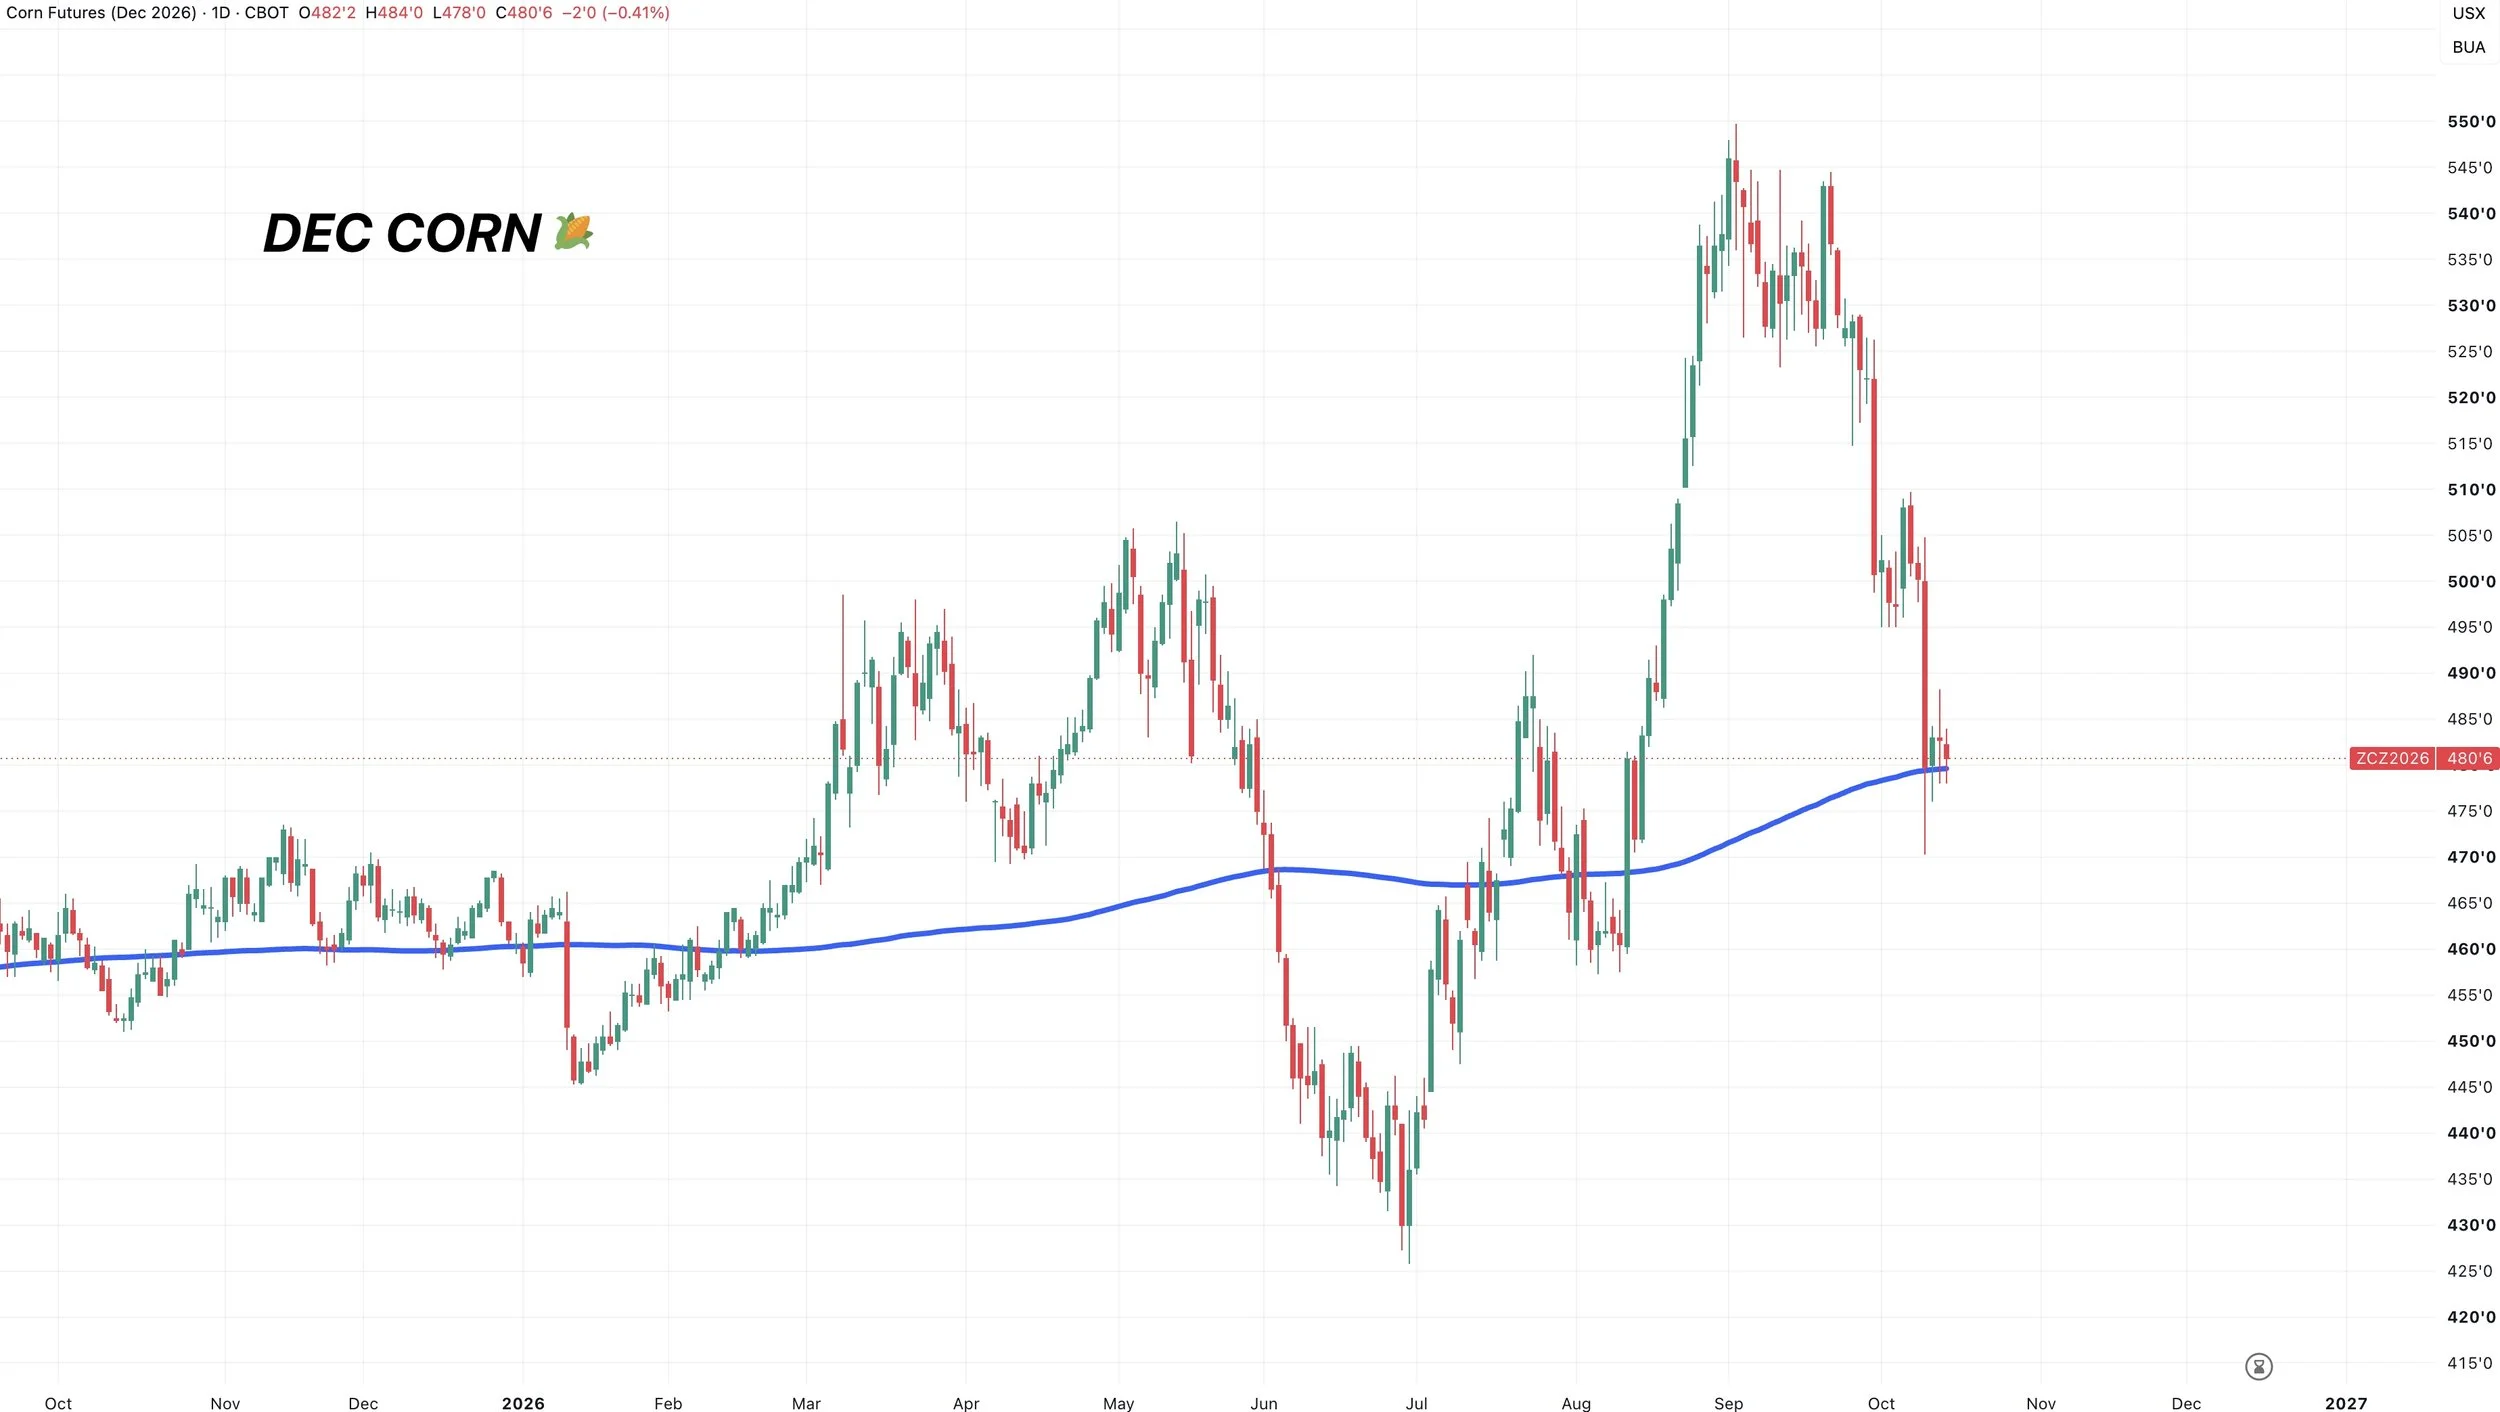
One thing I am watching is the 200-day MA.
When a market is in a bullish trend, it's typically above the 200-day.
When it's in a bearish trend, it's typically below the 200-day.
Right now we are sitting right at it. So this would something else that could provide support if this market is still holding a bullish bias.
Being able to consistently stay above this would be a good sign. As this is something the funds pay attention to.
Staying below all major moving averages isn’t going to help incentive them to be big buyers.
Indicators:
We don’t have bullish divergence or anything on the RSI.
The MACD is still curling lower.
We don’t have any confirmation of a true bottom until the price action tells us more.
However, the stochastics are bottomed out which you usuallly need to see to get some major lows. Which we now have.
We're also getting pretty sold on the RSI.
So corn is clearly oversold down here.
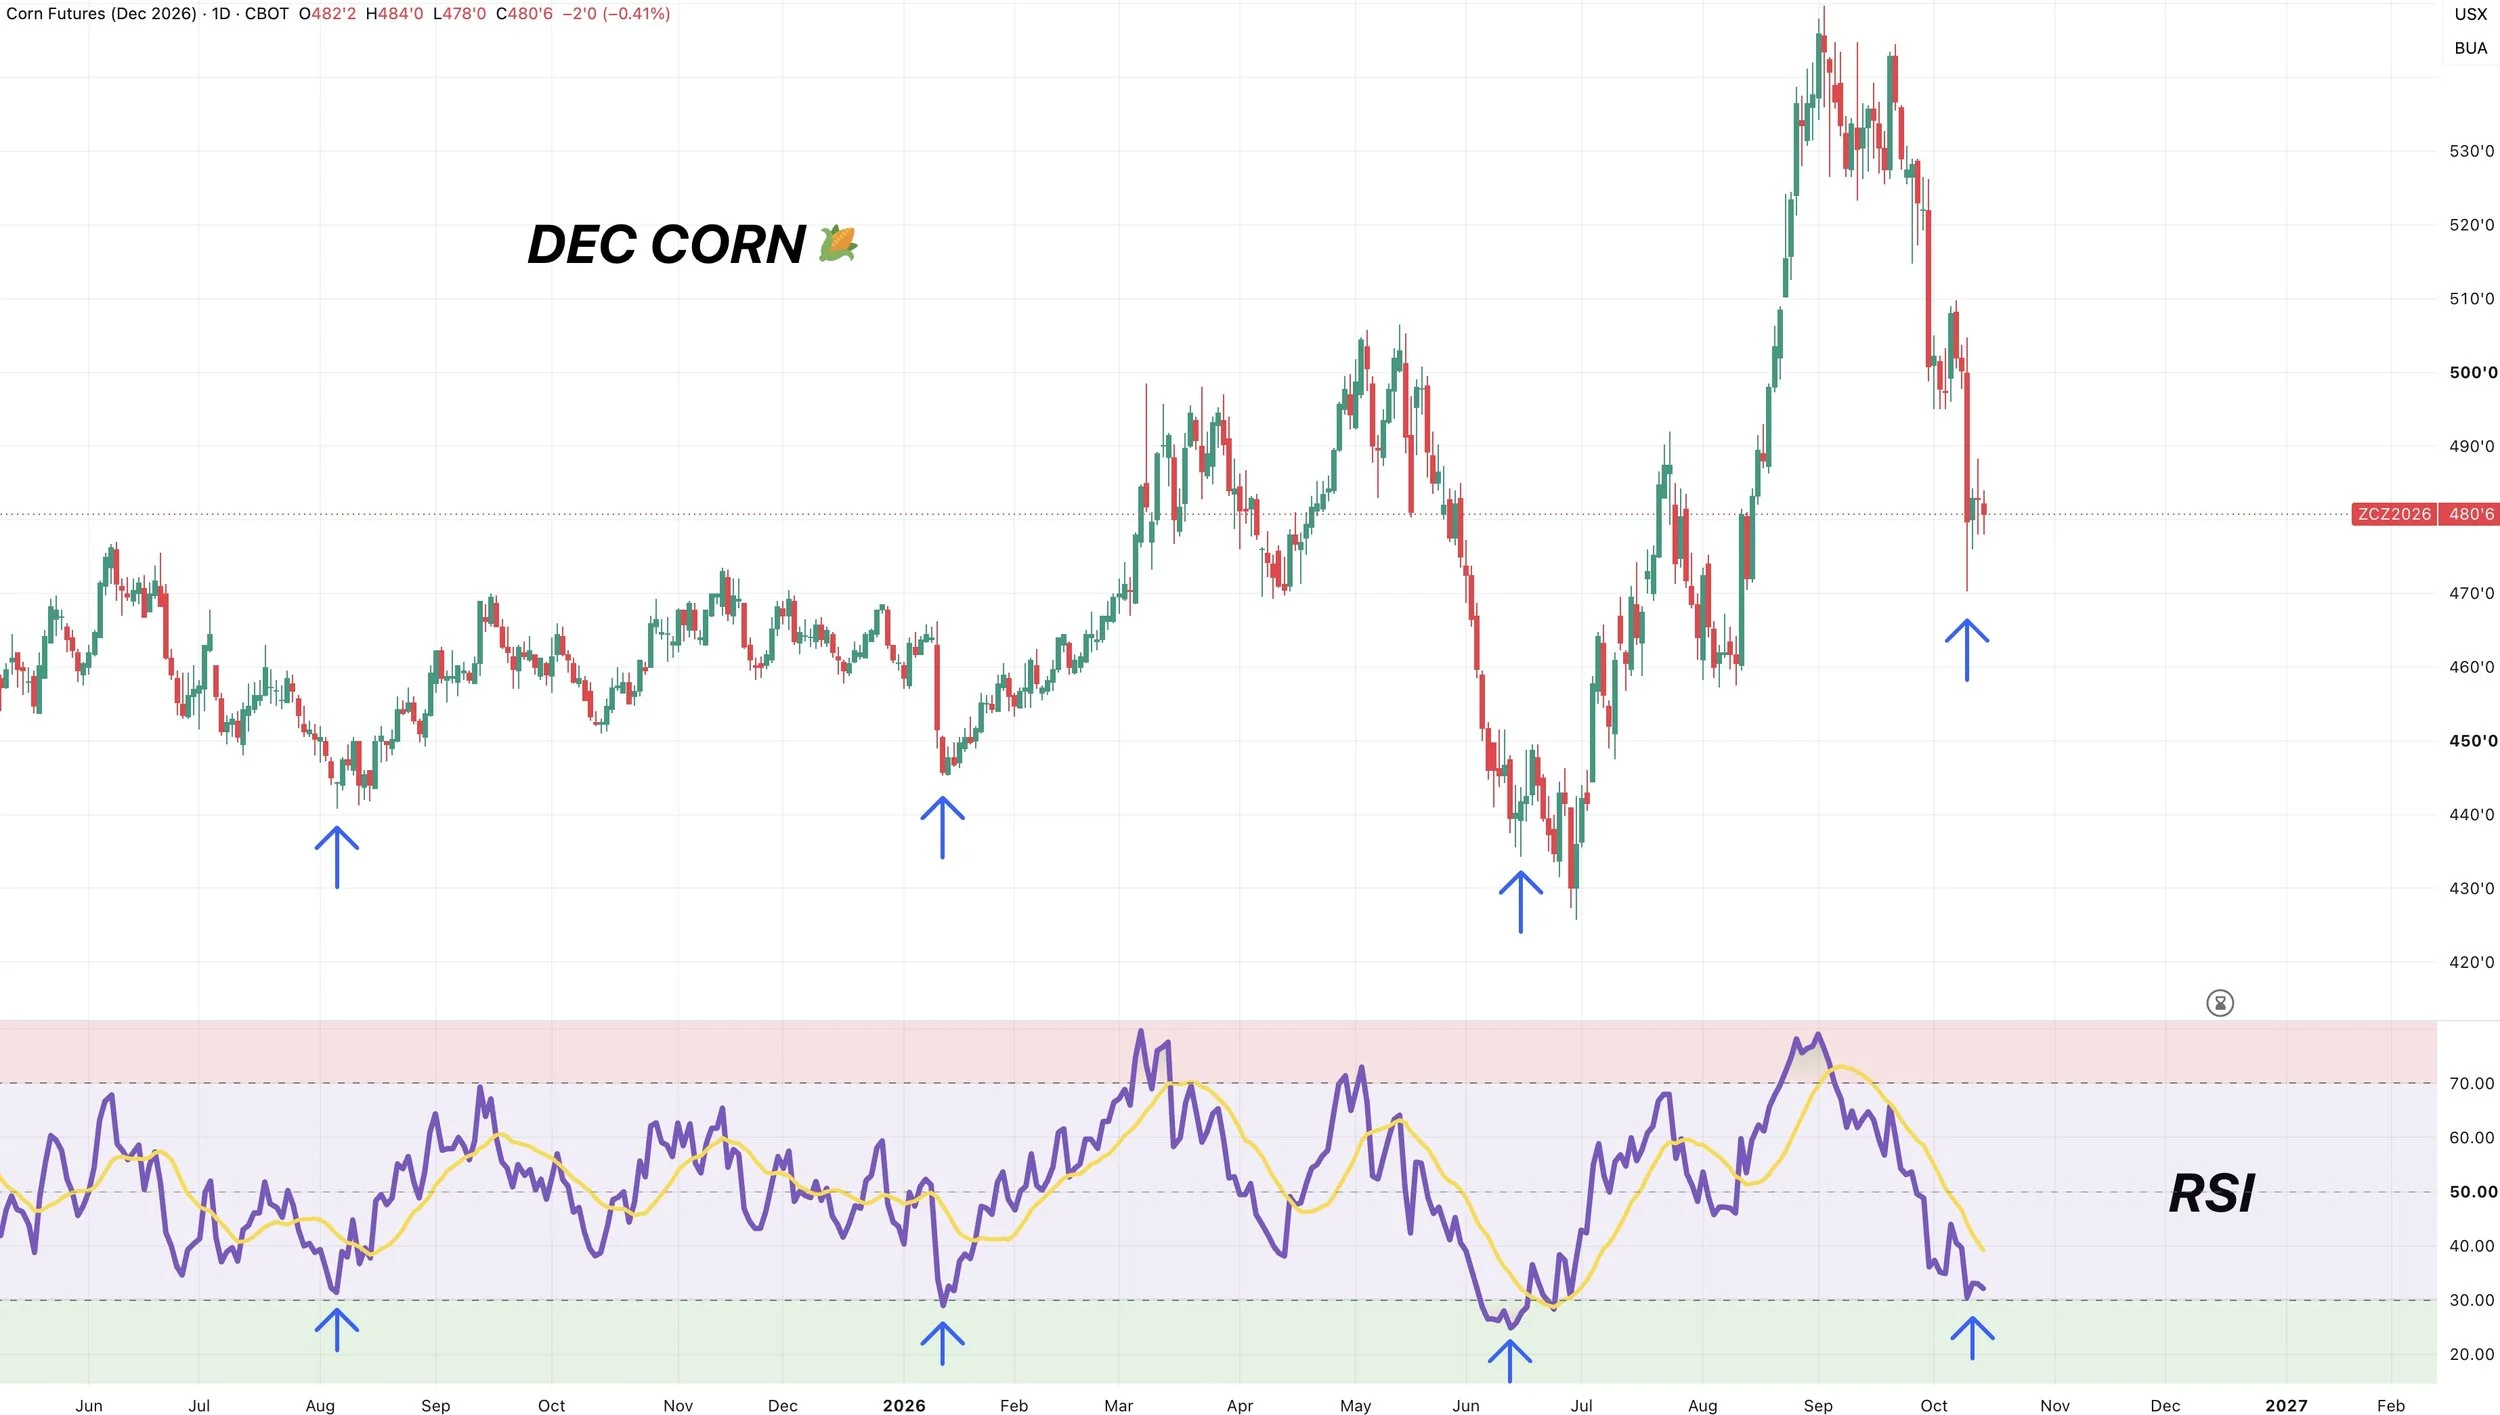
But what happened the last time we were this oversold?
How Oversold?:
The RSI is the most oversold it's been since the June lows.
We've only been this oversold in Dec corn 4 times on this contract.
Each time we were this oversold a bottom closely followed.
Are Sellers Exhausted?:
As I've mentioned before.
Often times markets do tend to bottom on bad news and top on good news.
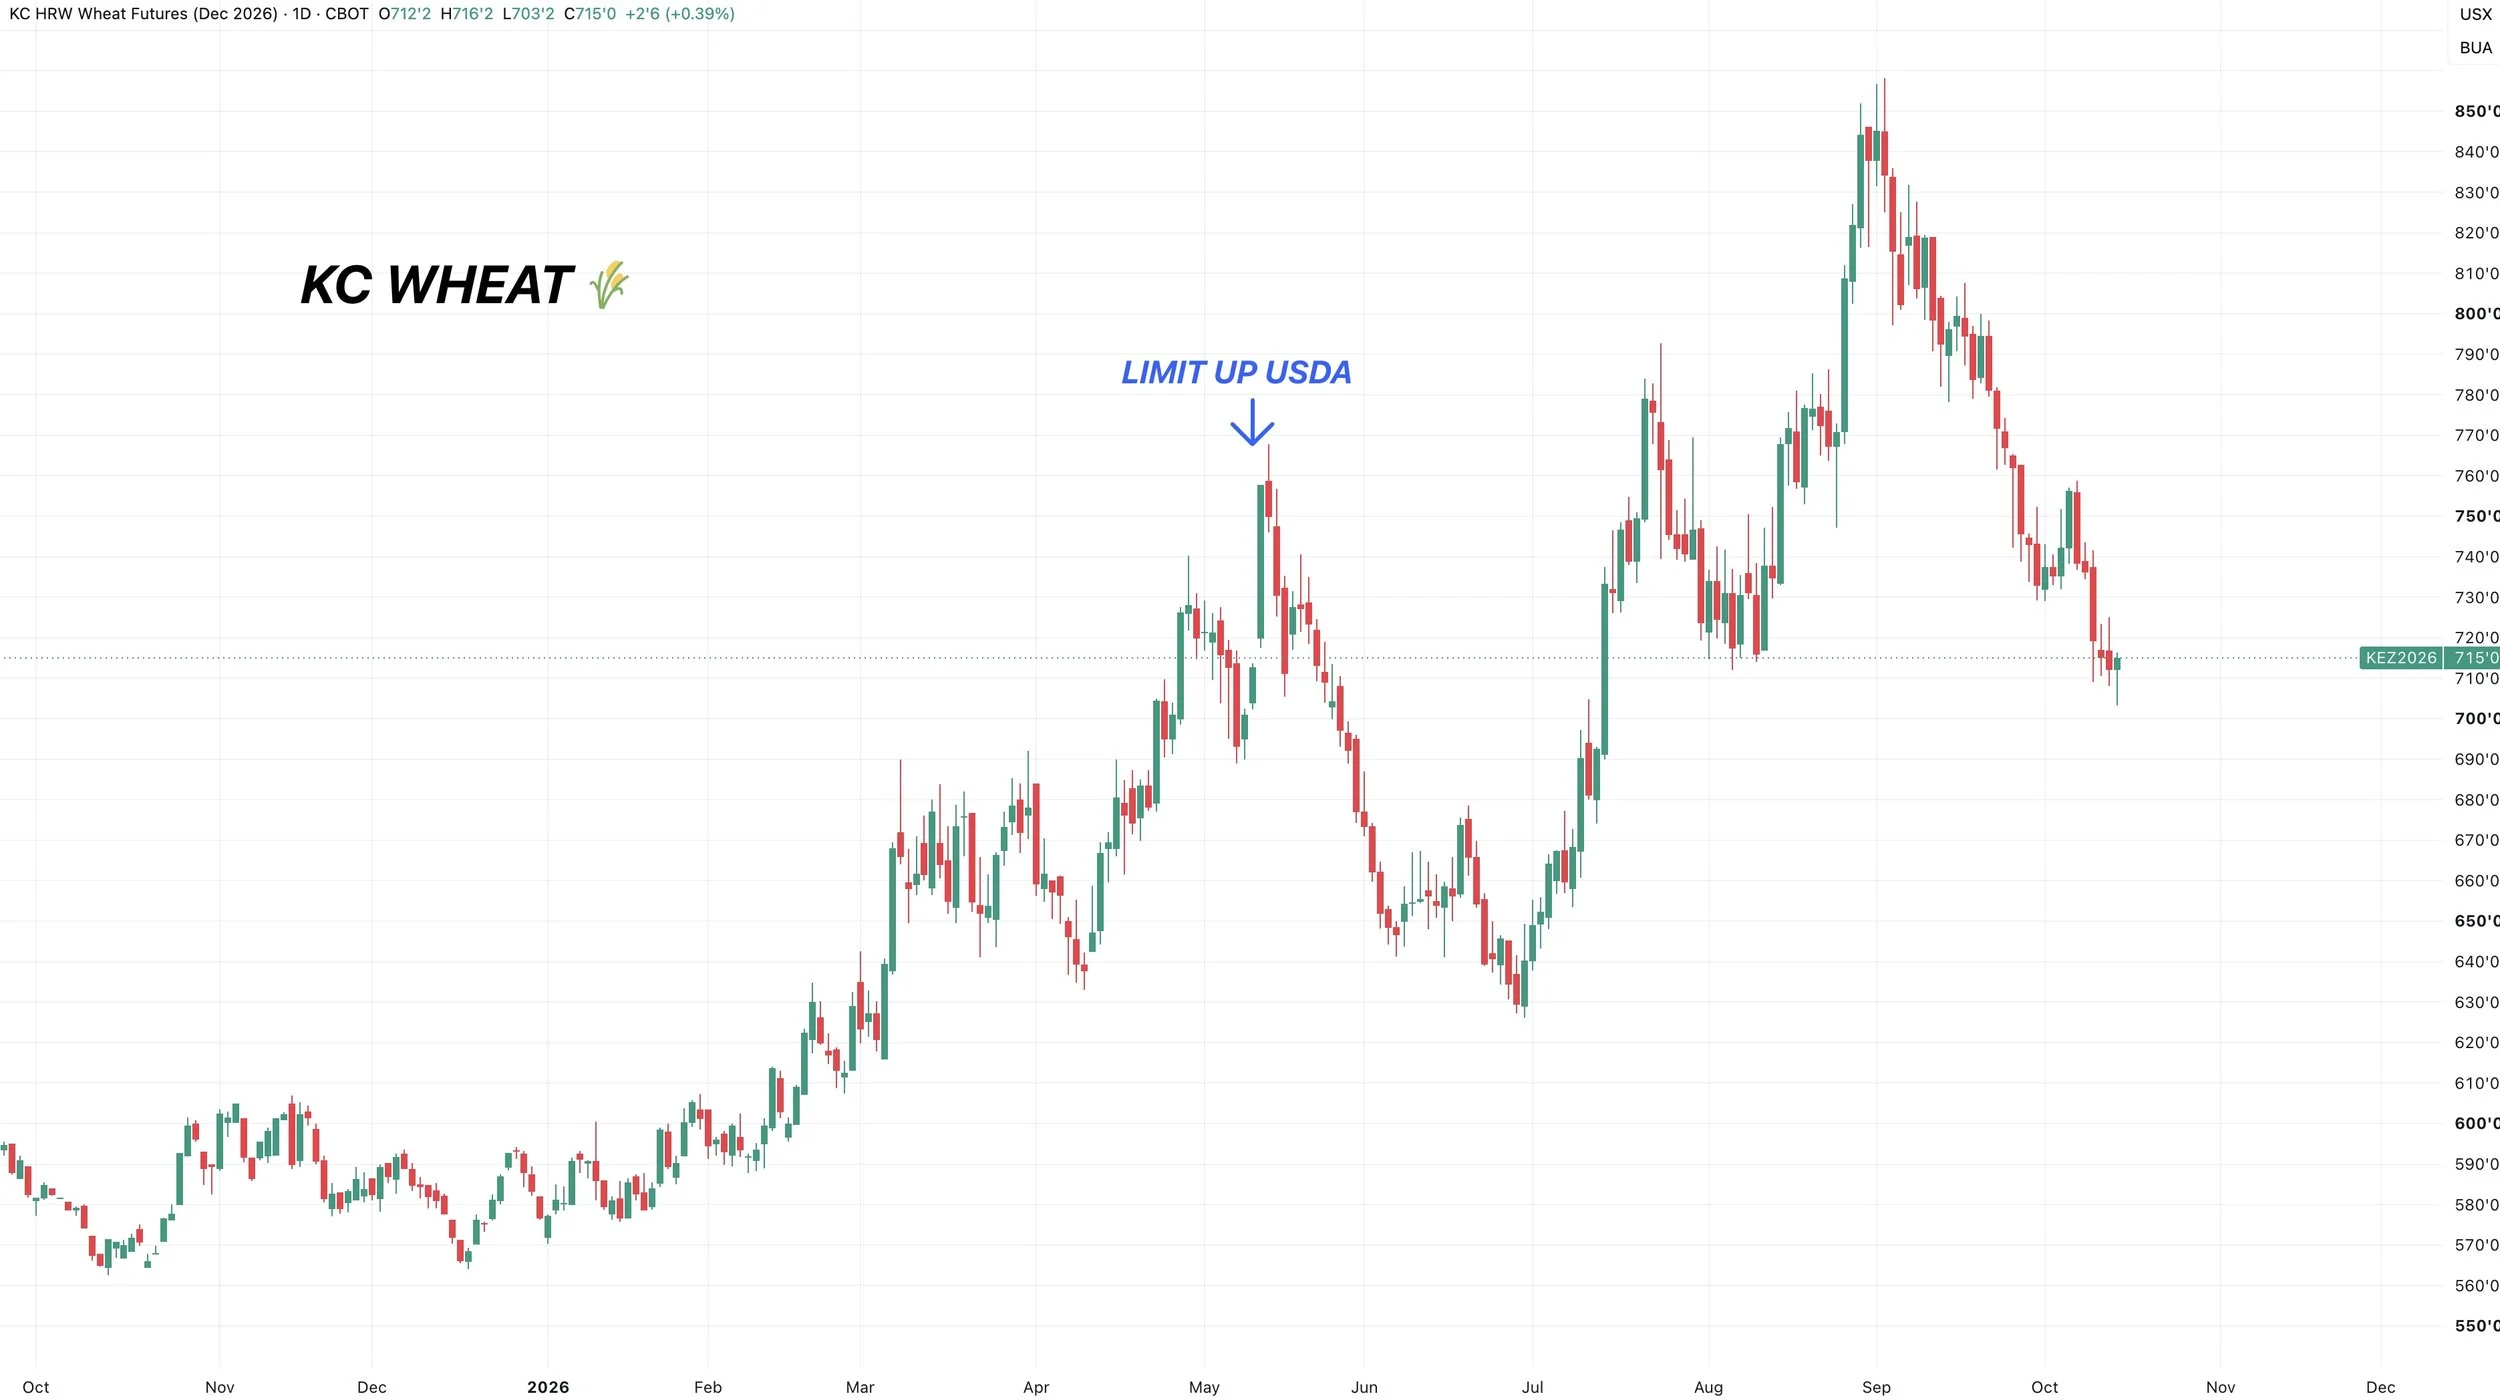
Example A)
A perfect example would be this. Wheat topped after being limit up after that May USDA report.
Example B)
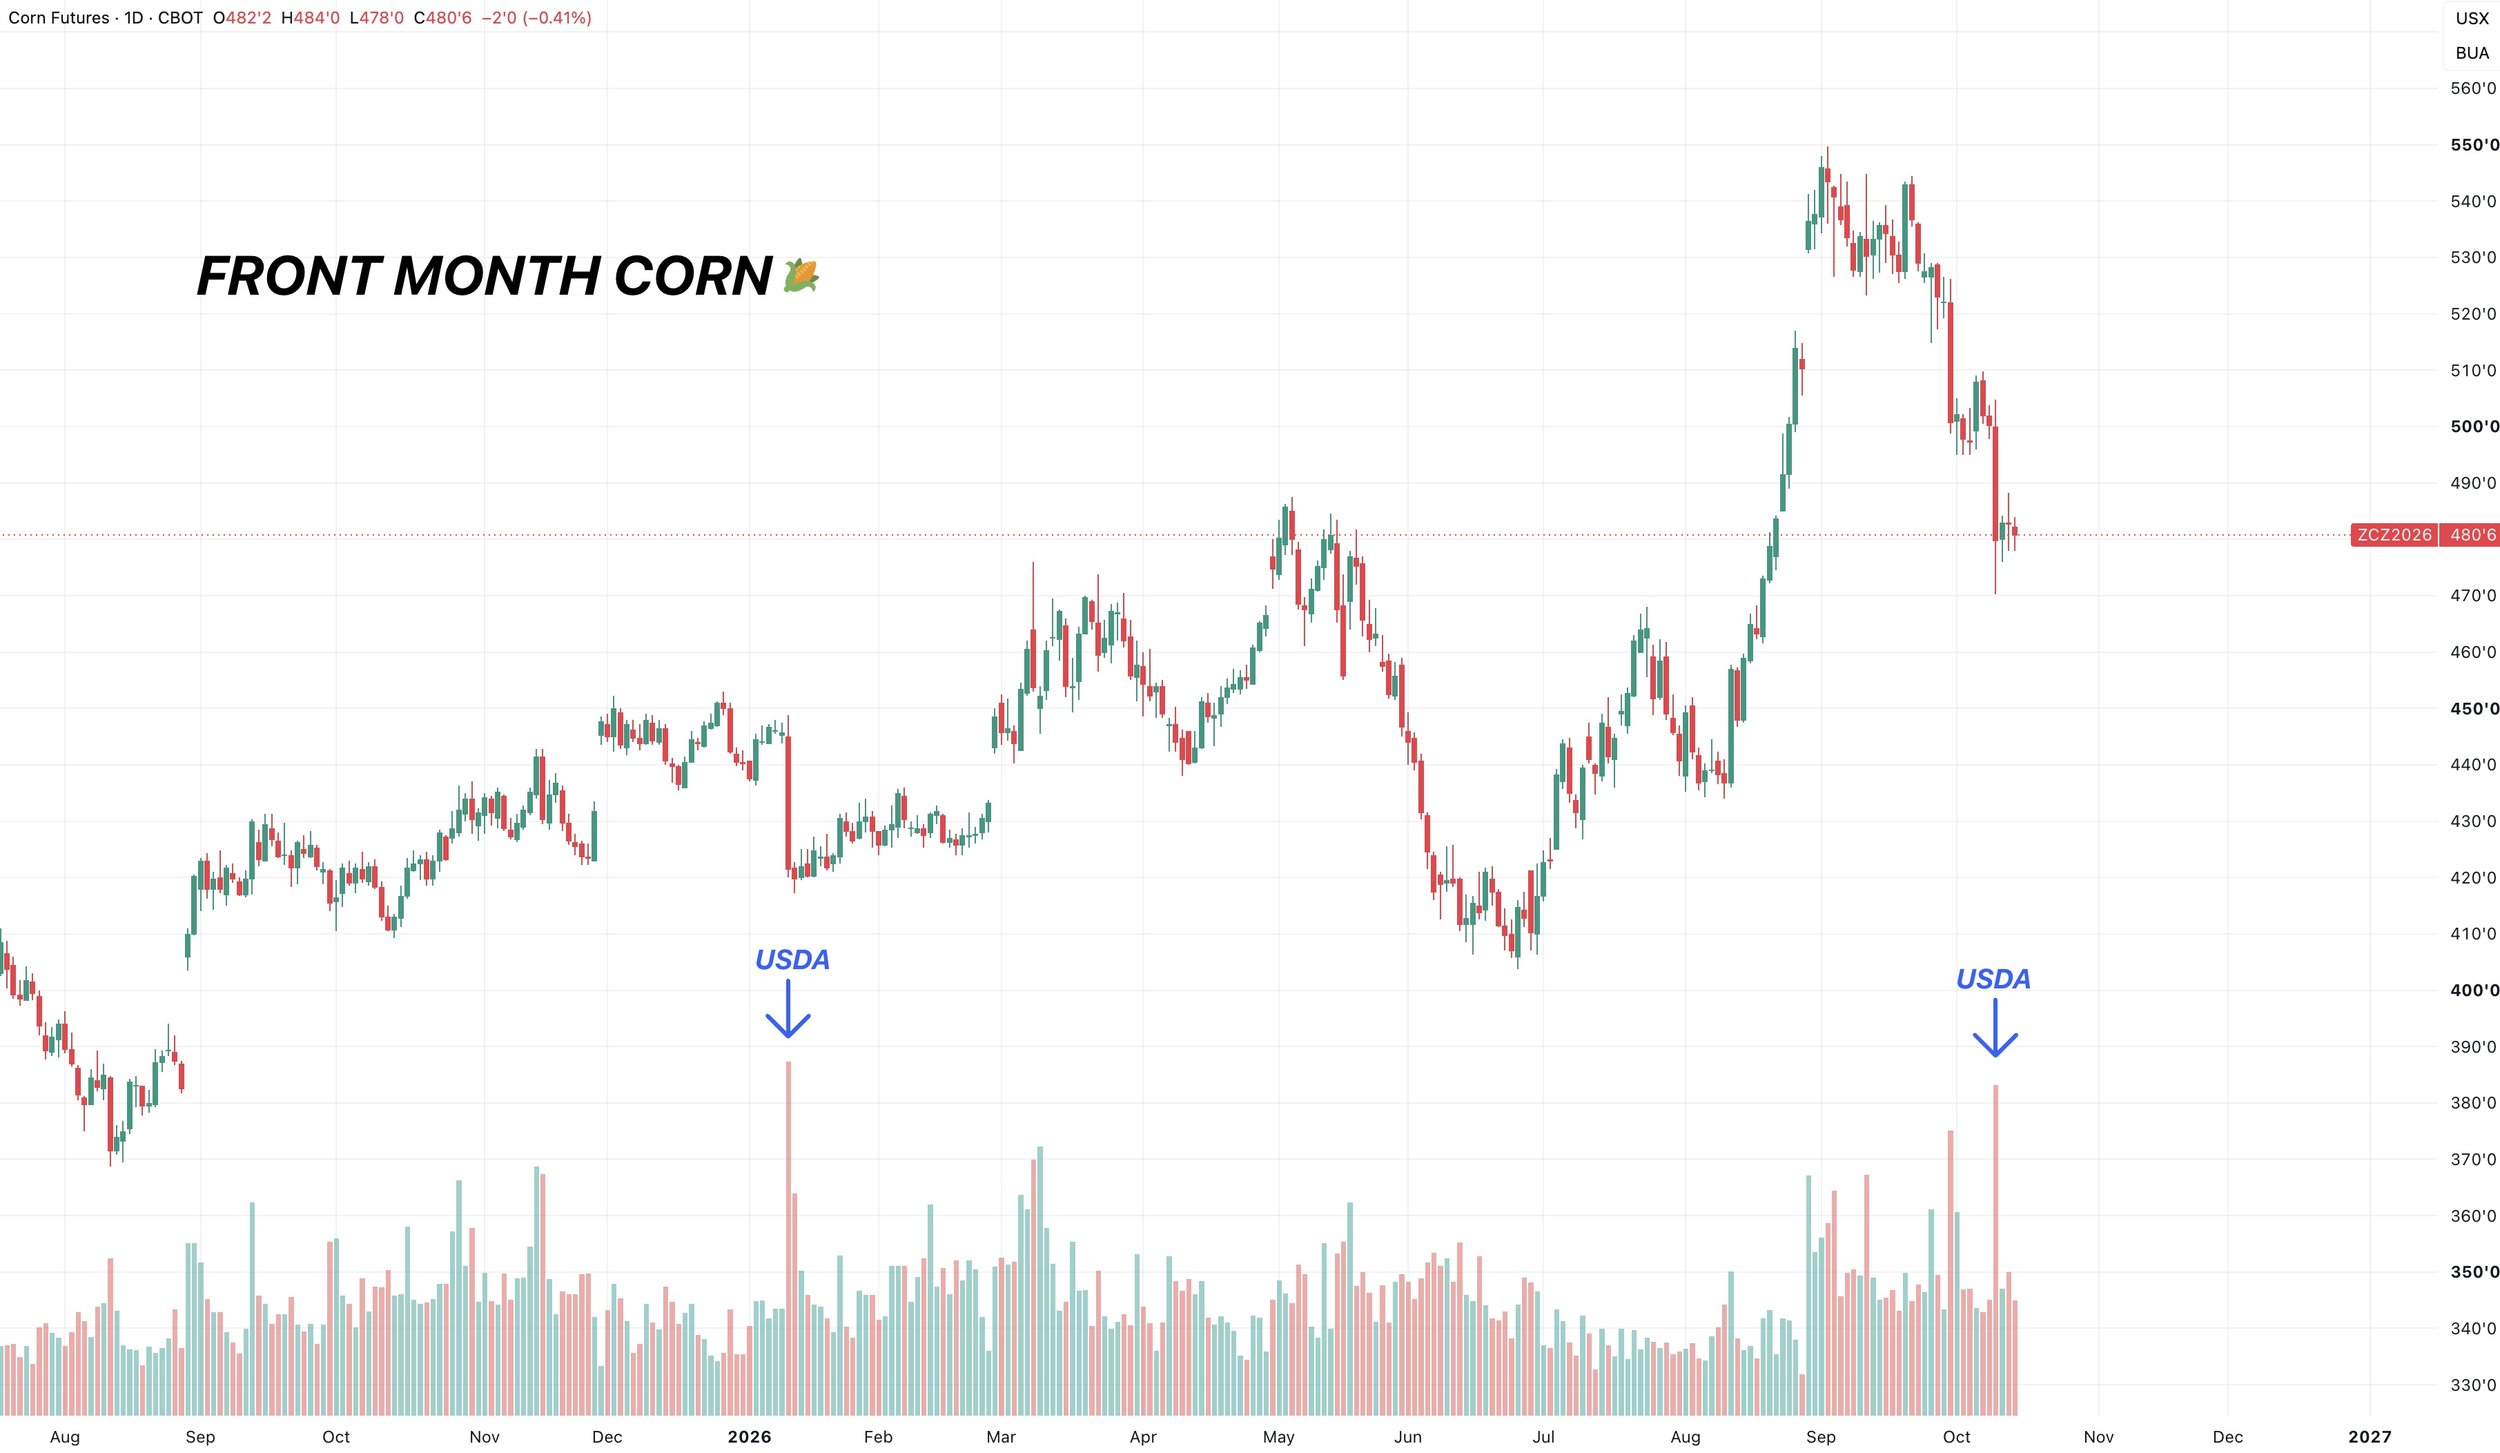
When was the last time we had this bearish of WASDE report for corn?
That would be back in January.
We bottomed on that report.
This doesn’t mean we have definitively put in our bottom here.
But corn was already -50 cents off the highs going into this October report. So we've priced in plenty of bearishness into this market already.
Look at the volume on the chart at the bottom. The report last week had the most volume for a day since the January report.
Those two days stand out drastically when you look at the volume.
High volume doesn’t always mean a bottom. But after a big sell off, bad news can cause people to throw in the towel. That rush of selling is often called capitulation. Which can help exhaust the selling and set a bottom.
The key is what happens after high volume. Does the move accelerate or stabilize? Can sellers push corn lower or did the report flush out the sellers?
Since corn was already down -50 cents going into this report, we then sold off on the report and had massive volume, and now prices have stabilized since then. I'd argue it adds more confidence that we could be forming a bottom.
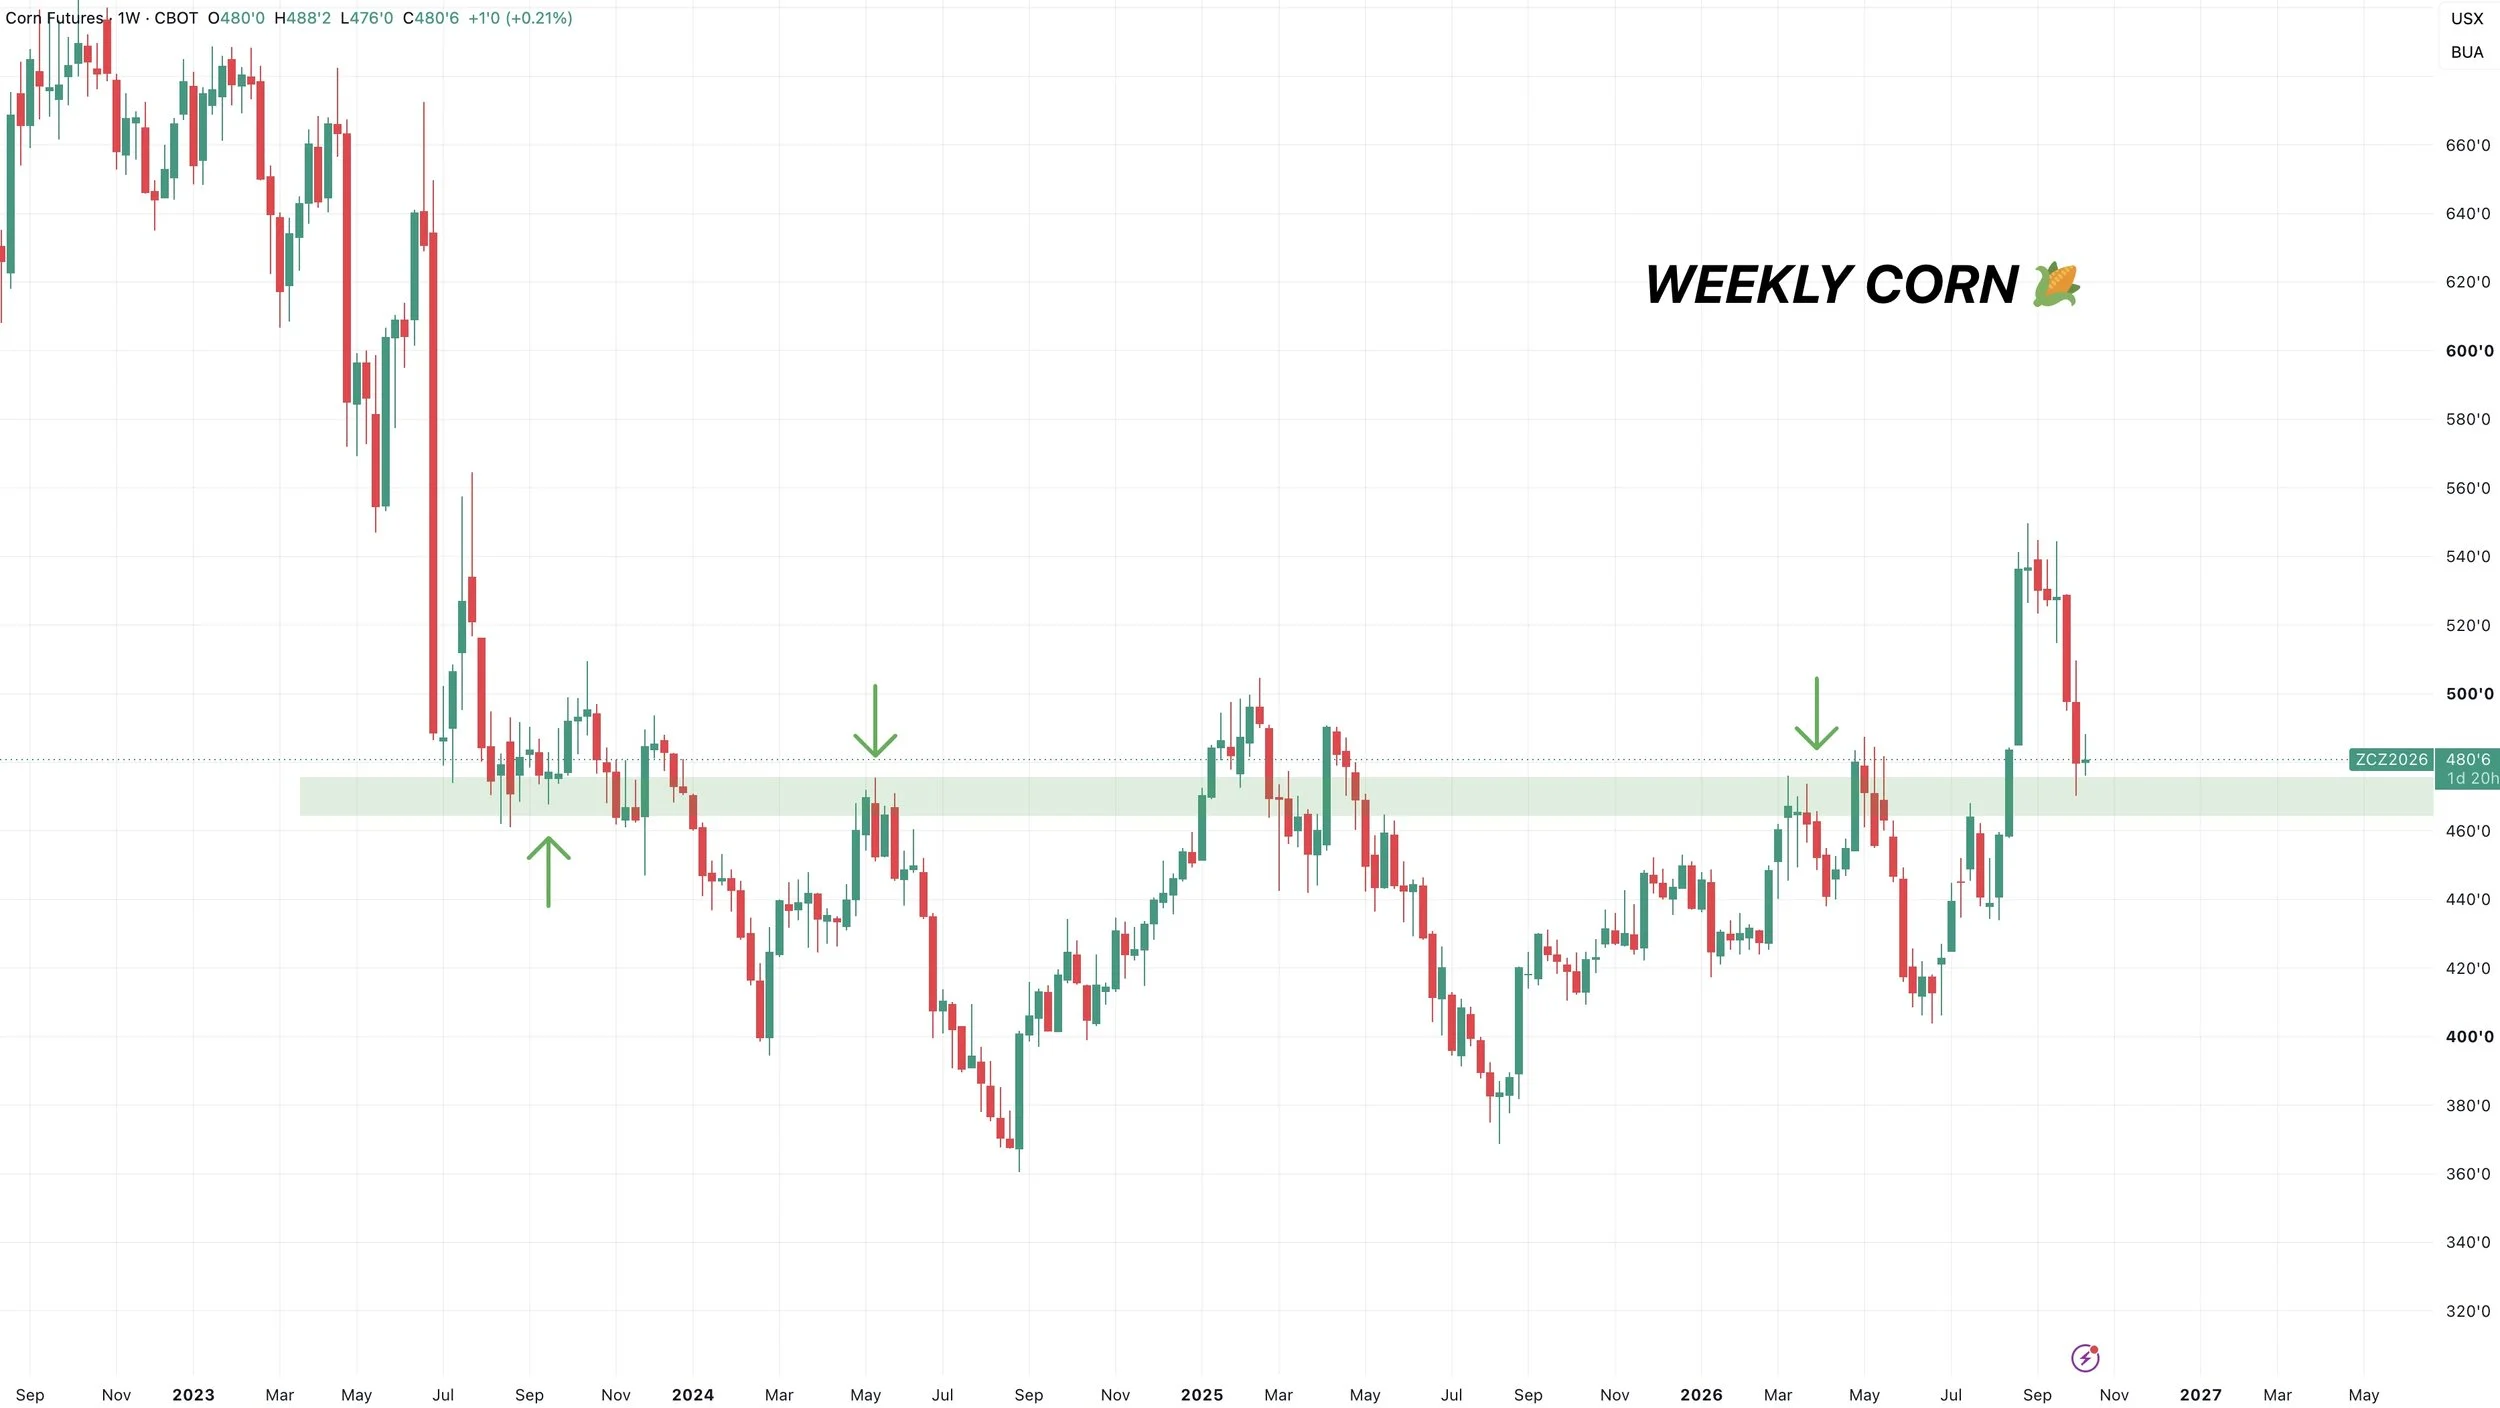
Weekly Chart:
The recent pull back was nasty no doubt.
But big picture, the structure in corn still isn’t bearish despite the sell off.
If you zoom out, we are still simply just re-testing the upper end of the old range we had been trapped in for the last few years.
Which isn’t something I'd view as bearish long term until we start to break down back into that old range.
Soybeans
Charts
Nov Beans Chart:
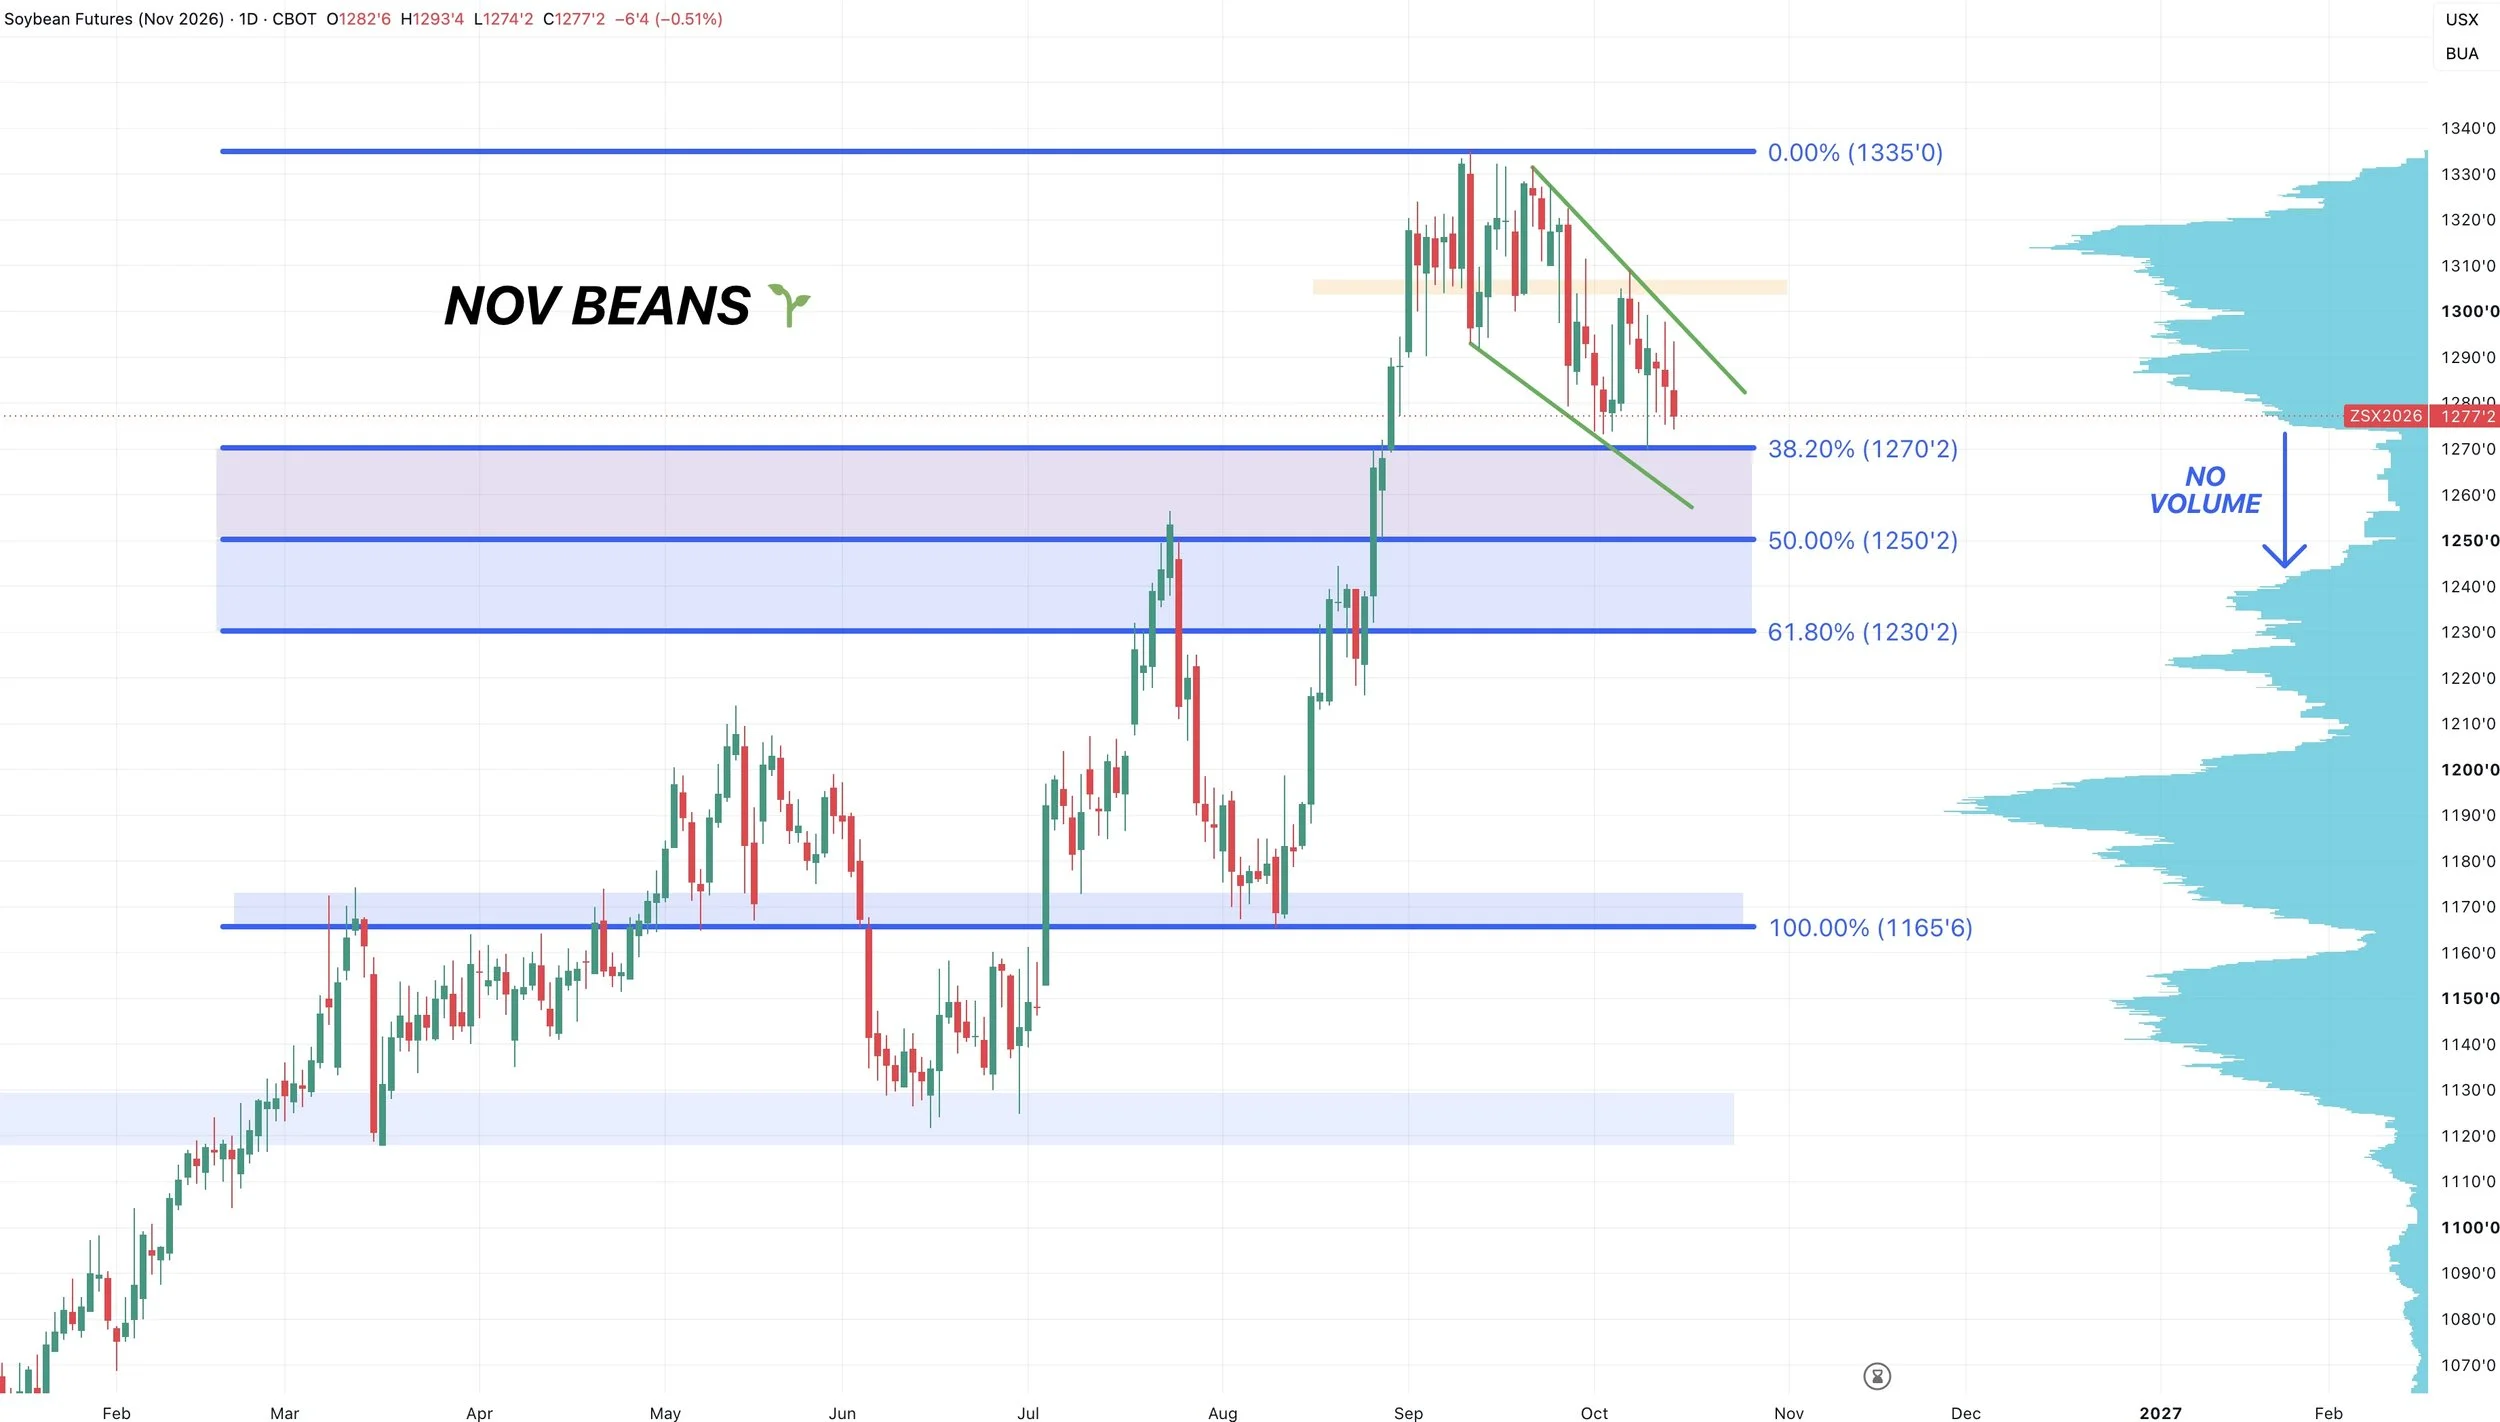
Soybeans continue to grind lower.
There are two types of price action.
There is implusive and corrective.
Impulsive moves are strong and decisive. Impulsive moves suggest buyers or sellers are in control.
Corrective price action is choppy and overlapping. And usually suggests a simple pause in the trend.
In this case for soybeans, this pullback looks corrective rather than impulsive.
An impulsive move would be what we saw back in August.
Now this pull back is choppy and overlapping, which suggests it's merely a pause in the trend following an impulsive move.
A corrective move keeps the door open for another leg higher down the road.
But what should we watch on the chart?
We have a wedge pattern in place. This doesn’t mean anything right now until it breaks. If you get a break to the upside, it would look solid.
On the other hand, we want to continue to hold this 38.2% retracement at $12.70
If we cannot do so, there is a massive volume gap lower towards the 50-61.8% levels. Which would re-test those old highs from July.
So bulls, that's the level you want to defend short term. As there is zero support beneath here.
4-Hour Chart: Range Bound
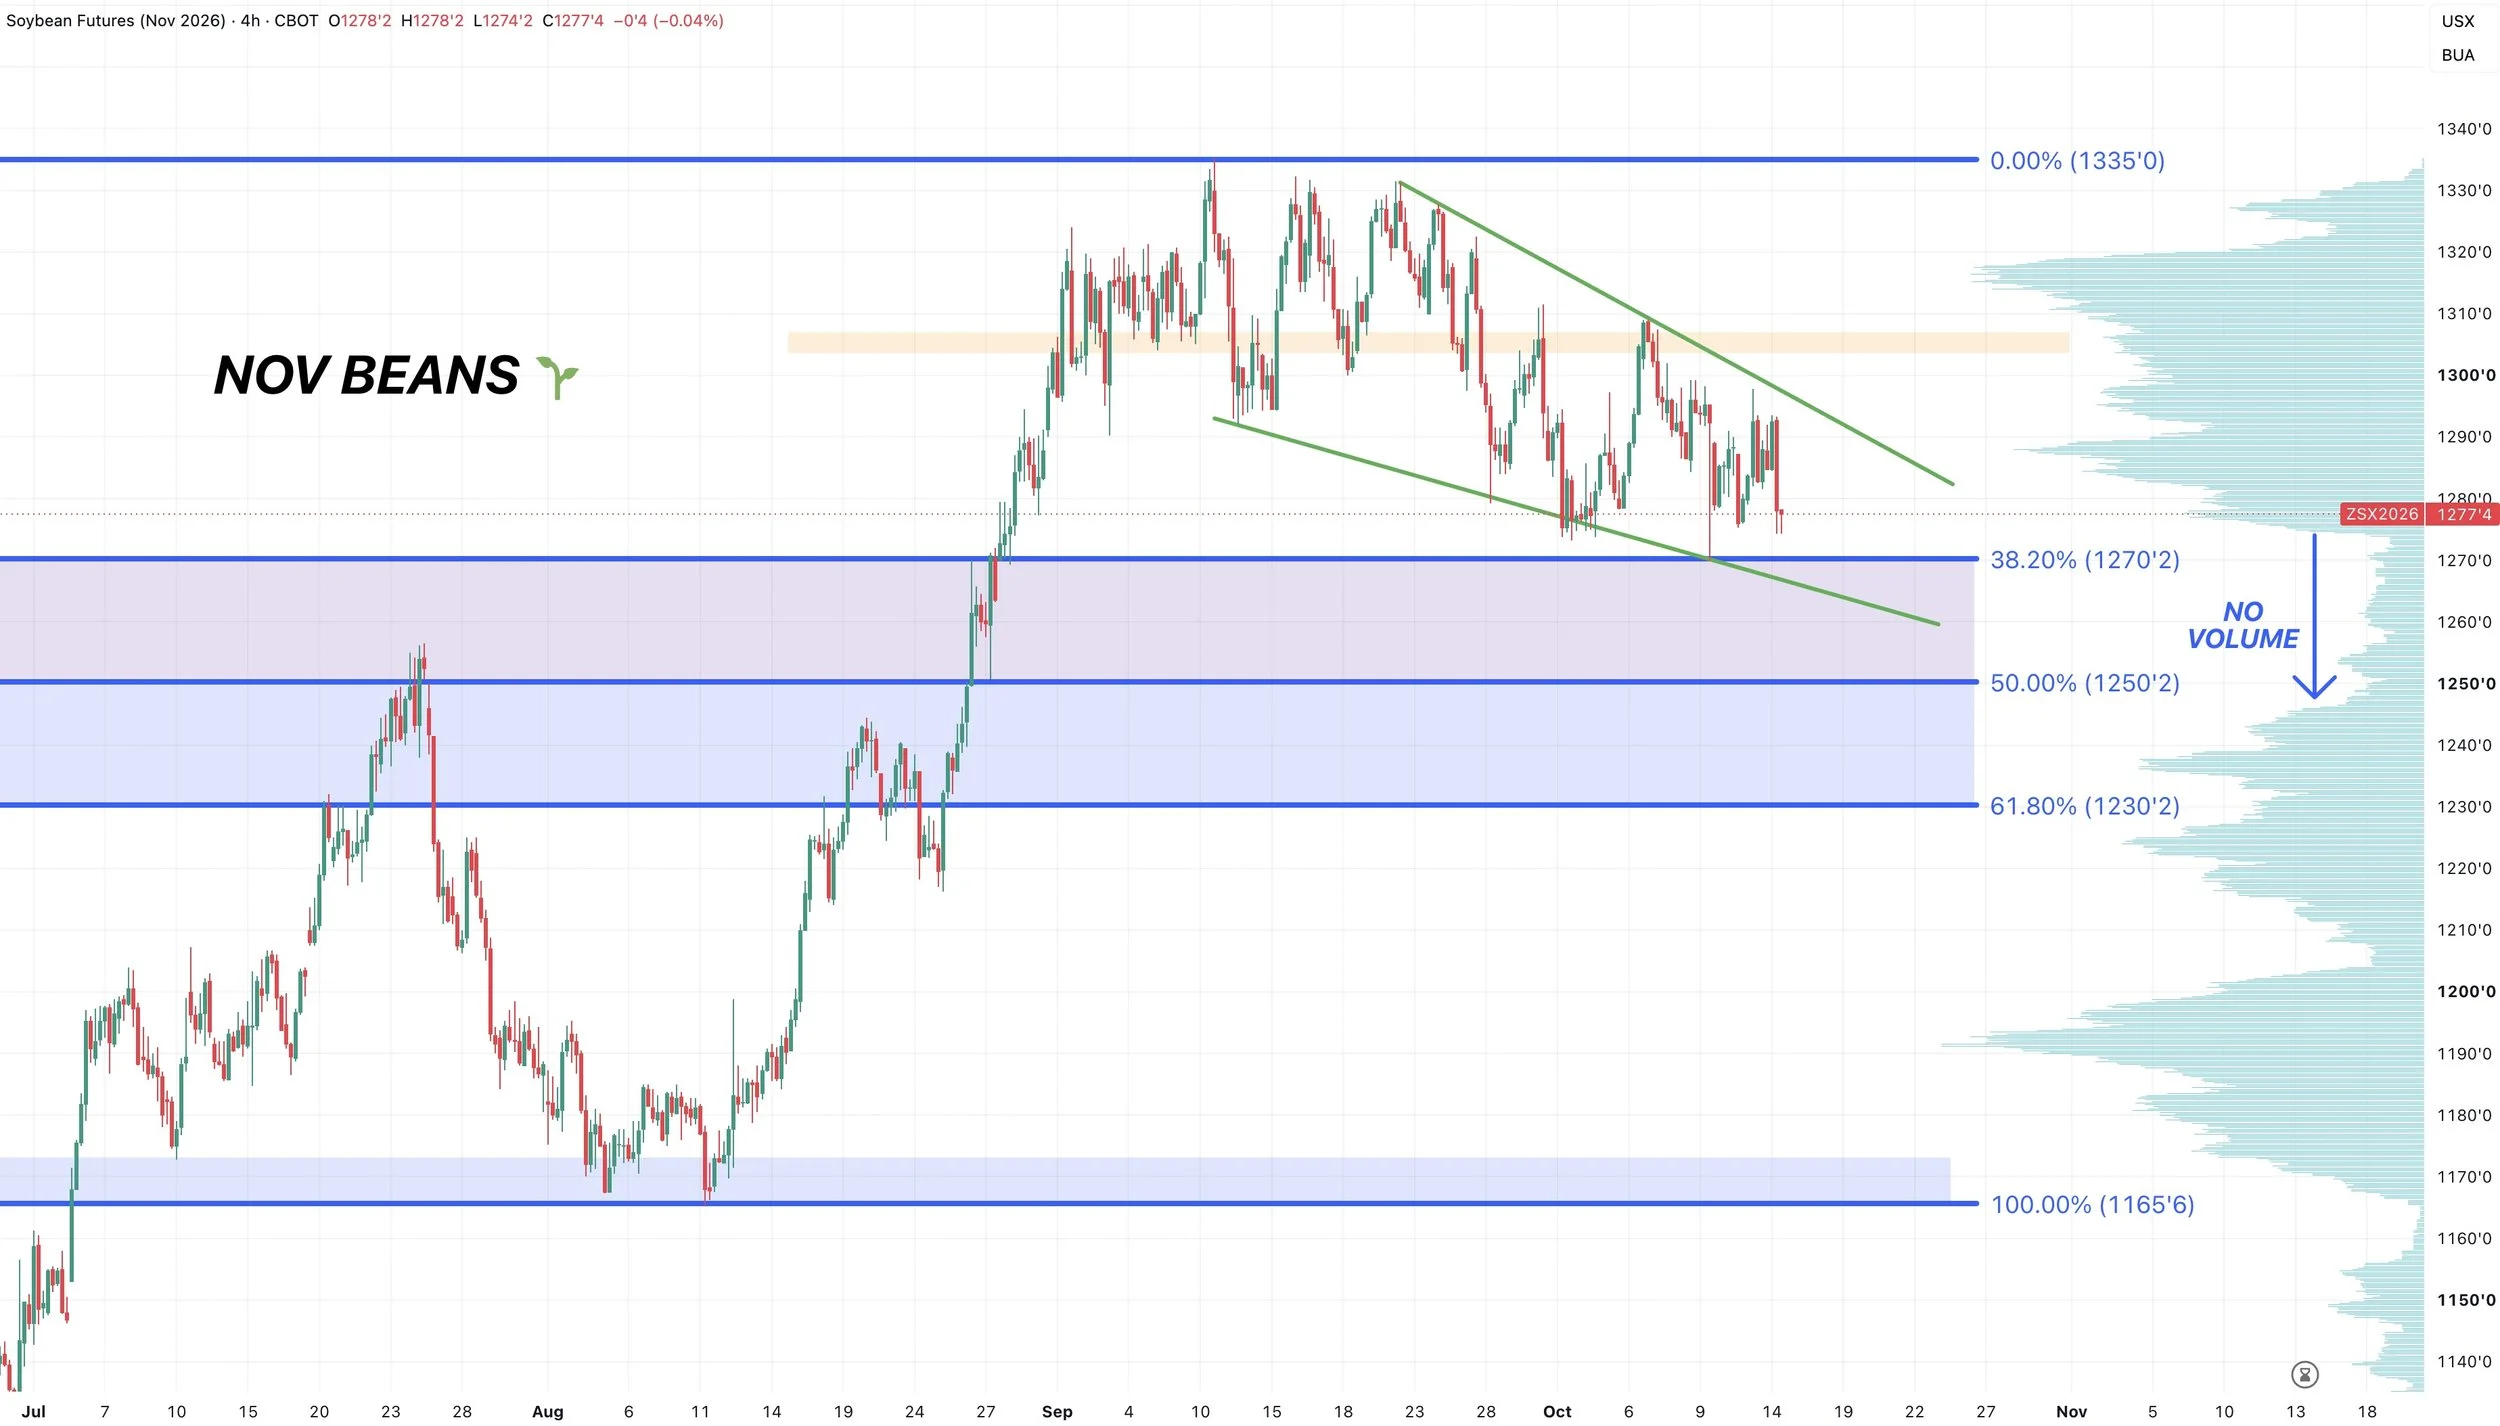
Here is the 4-hour chart for another visual.
We are essentially in no man's land here.
We were in the old sideways range for weeks earlier this month.
We broke below, and we've now re-tested that prior support twice. Rejecting both times.
So that is the clear level we need to break above to be more confident we've found a bottom.
Until we do that, we are range bound between that resistance and our recent lows from last week.
Whichever we break first likely decides the next direction.
Since we had a sell alert near that $13.20 level, I will have my next upside target out once I'm more confident we've put in some lows.
Inverse Soybeans:
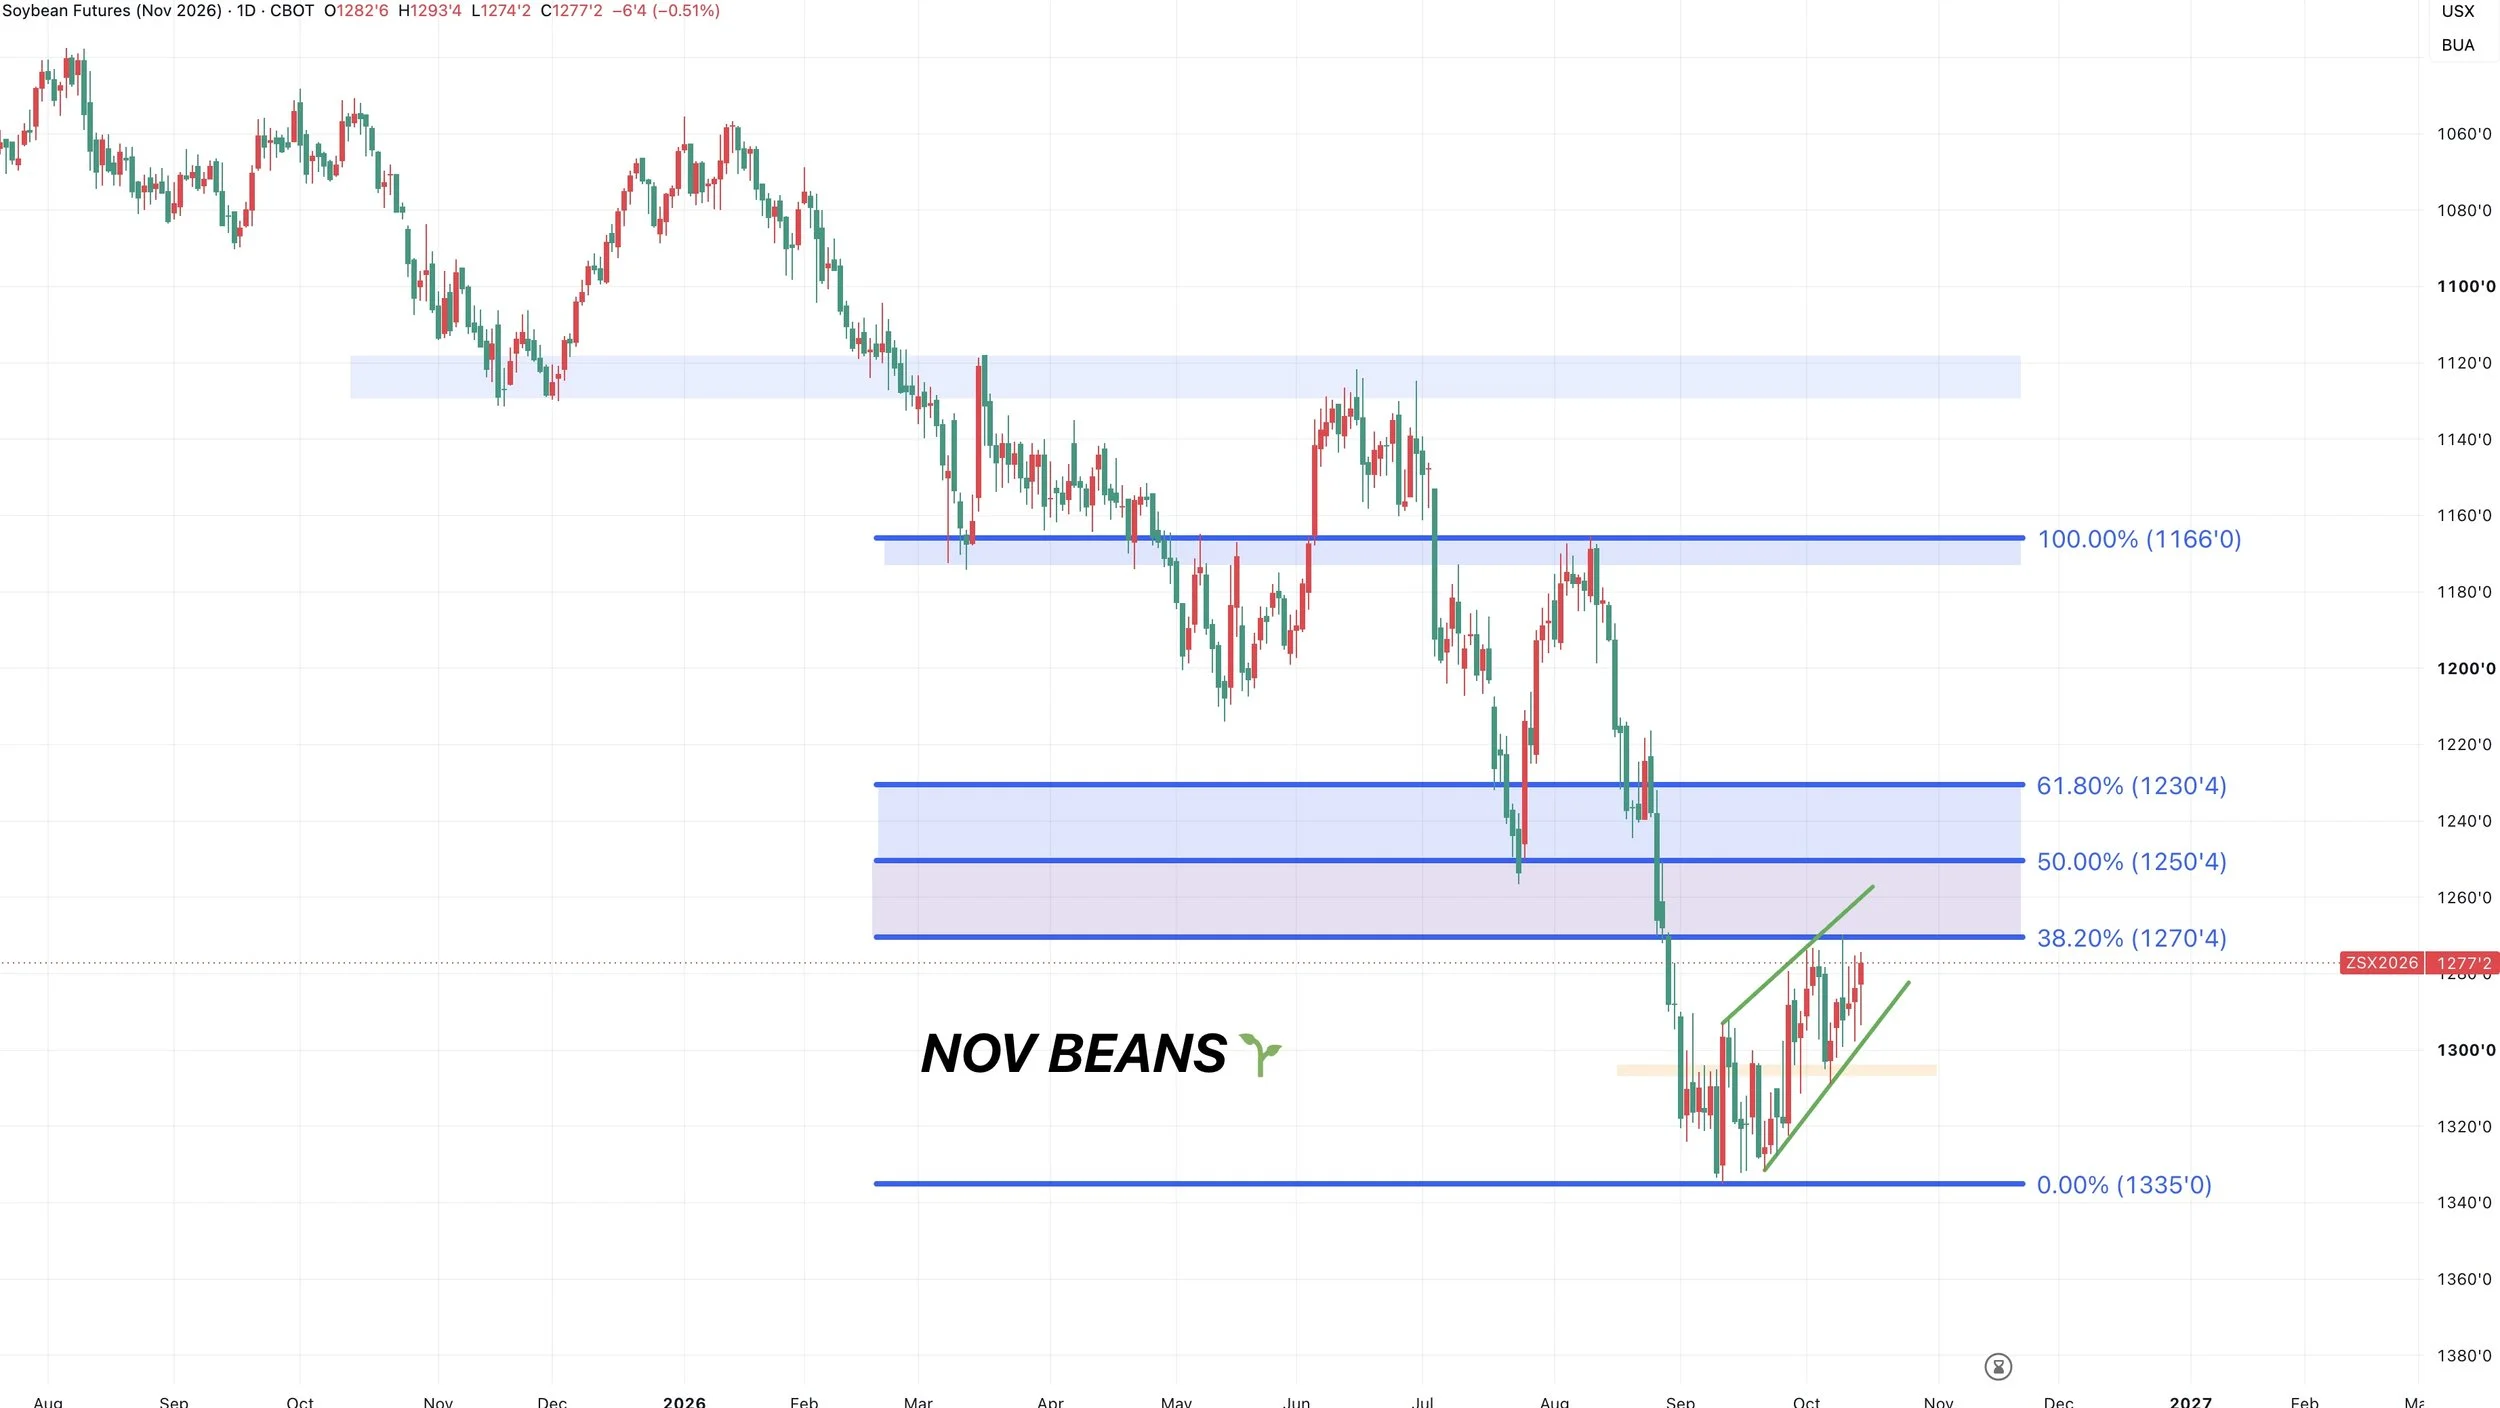
Here is another interesting chart.
This is the inverse soybean chart. Meaning it's literally just flipped upside down.
Sometimes an inverse chart can simply give you another perspective on things, and make you see things you didn’t see before.
Does this chart look bullish to you?
This thing could rally a decent amount and would still be in a complete downtrend.
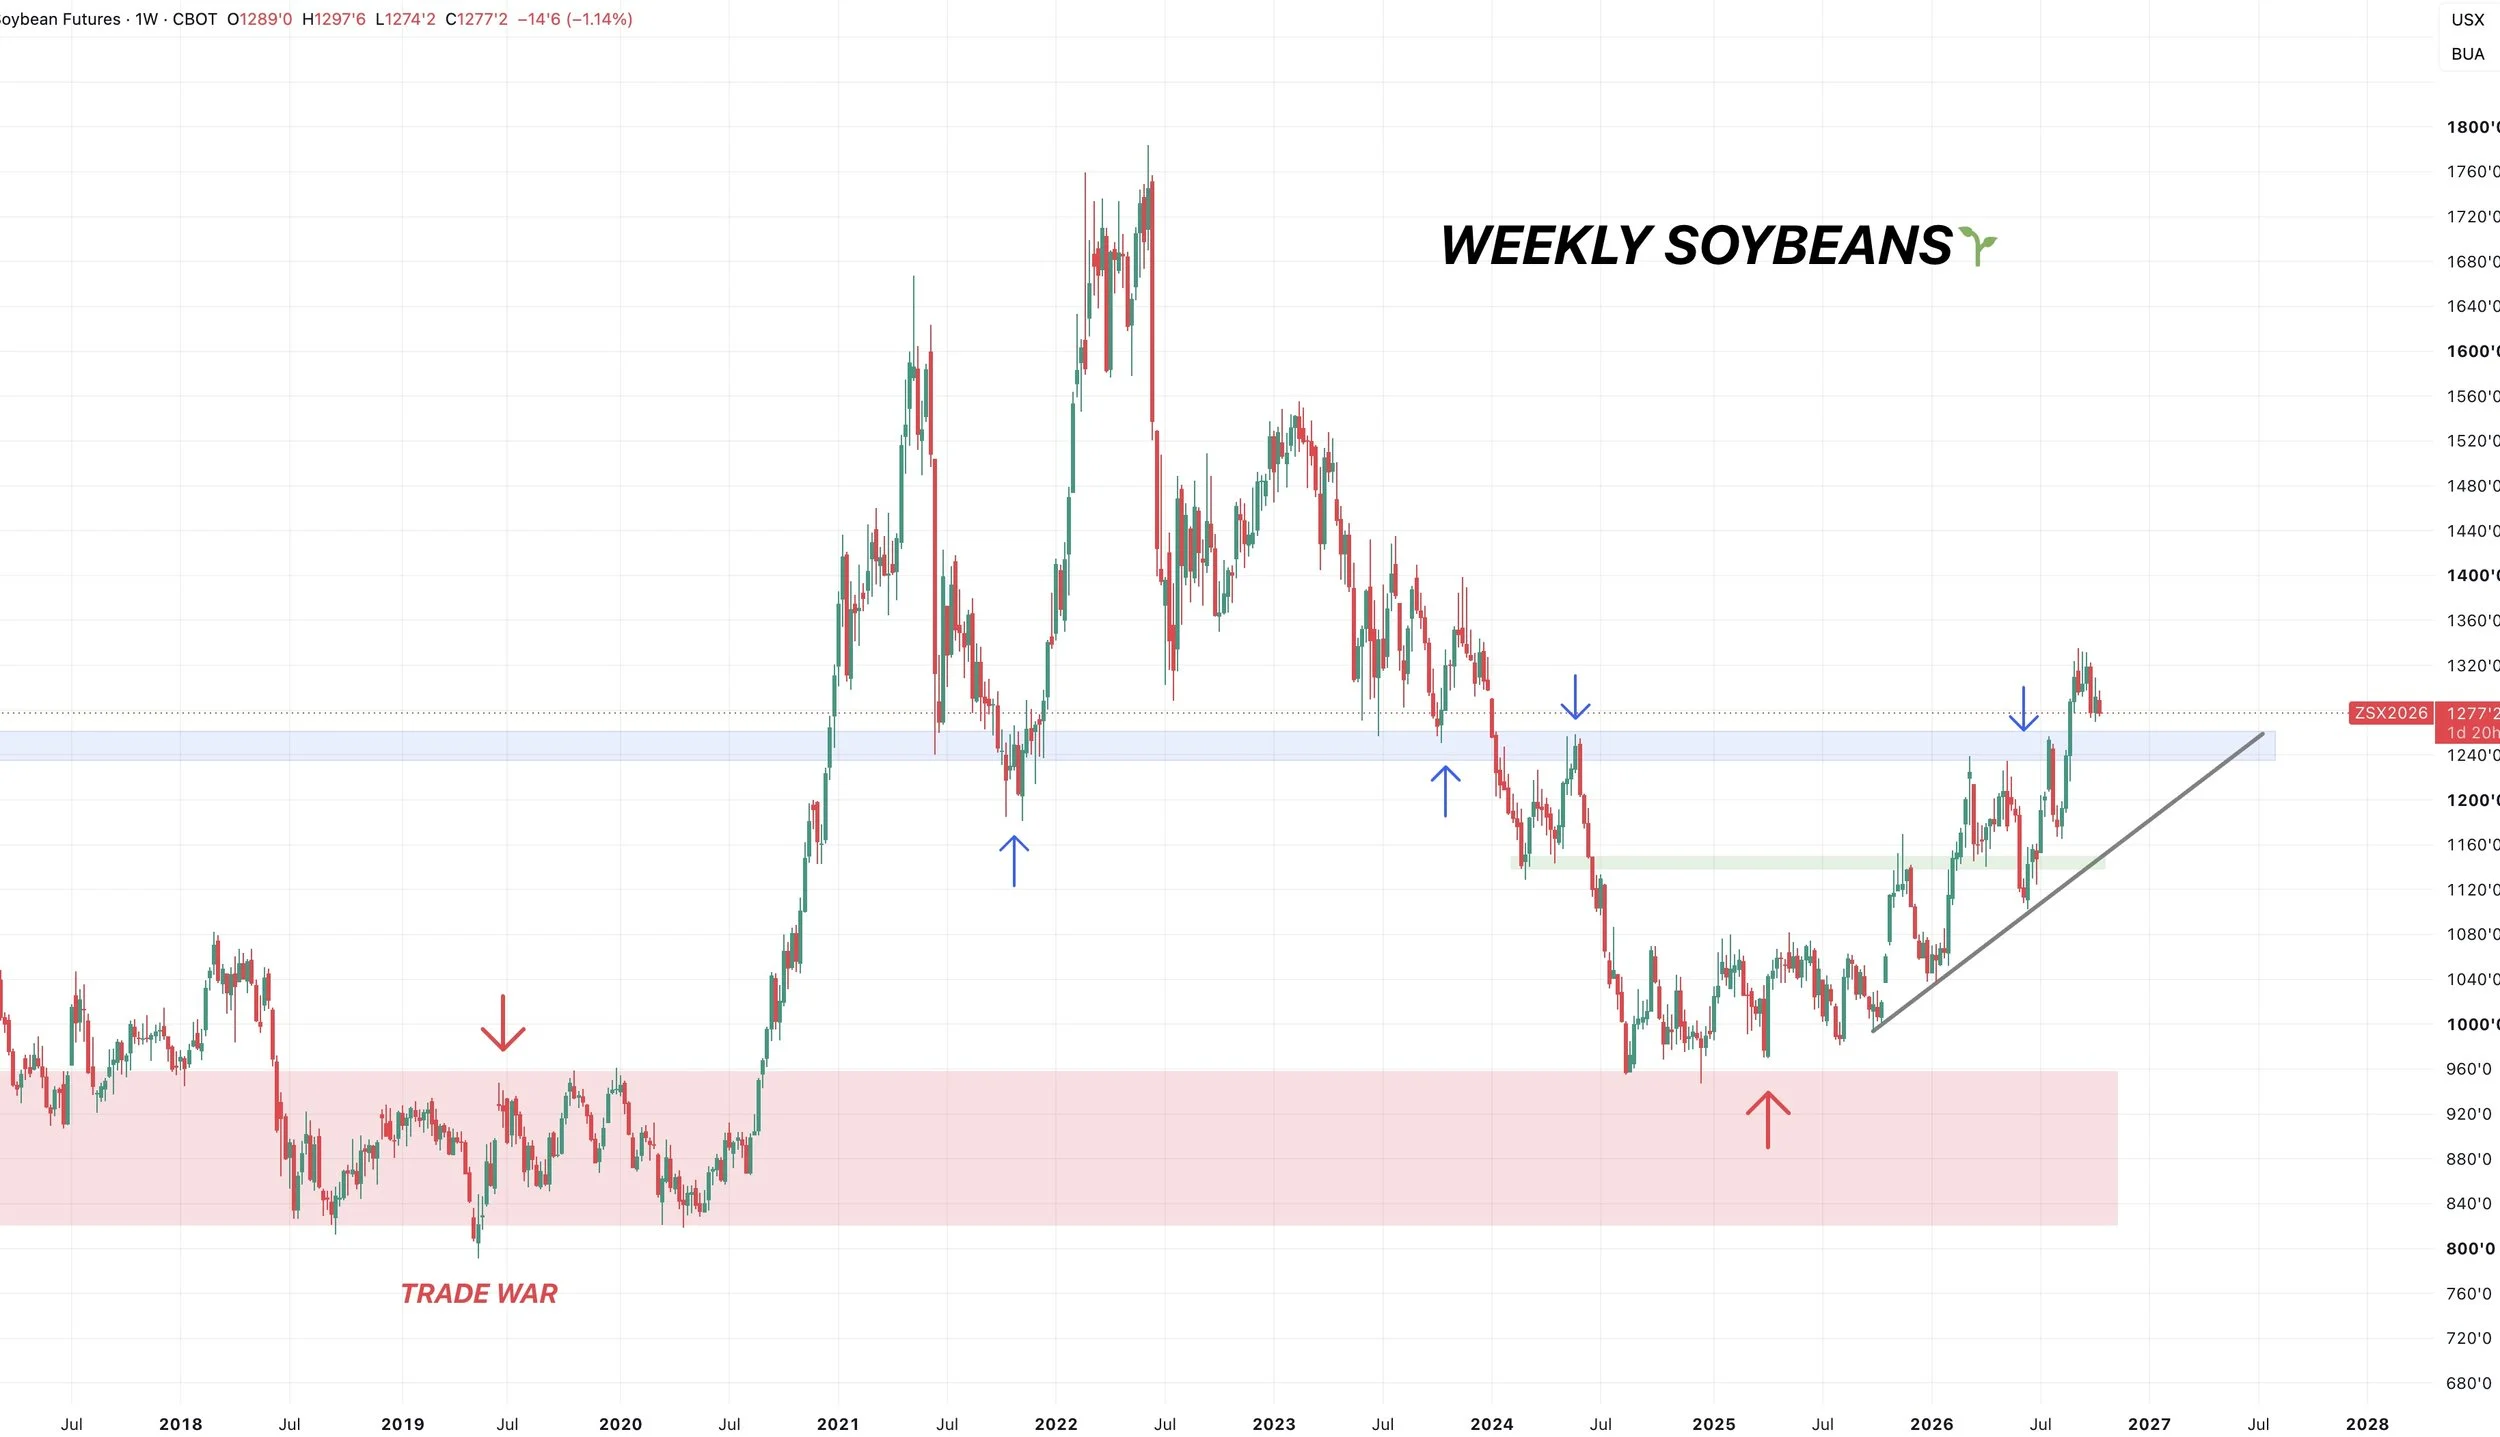
Weekly Chart:
The weekly chart for soybeans is anything but bearish.
Clear breakout last month through some huge resistance.
The trend is clearly higher.
There is plenty of potential upside.
Even a -40 cent drop from here would be a clean re-test of the prior highs.
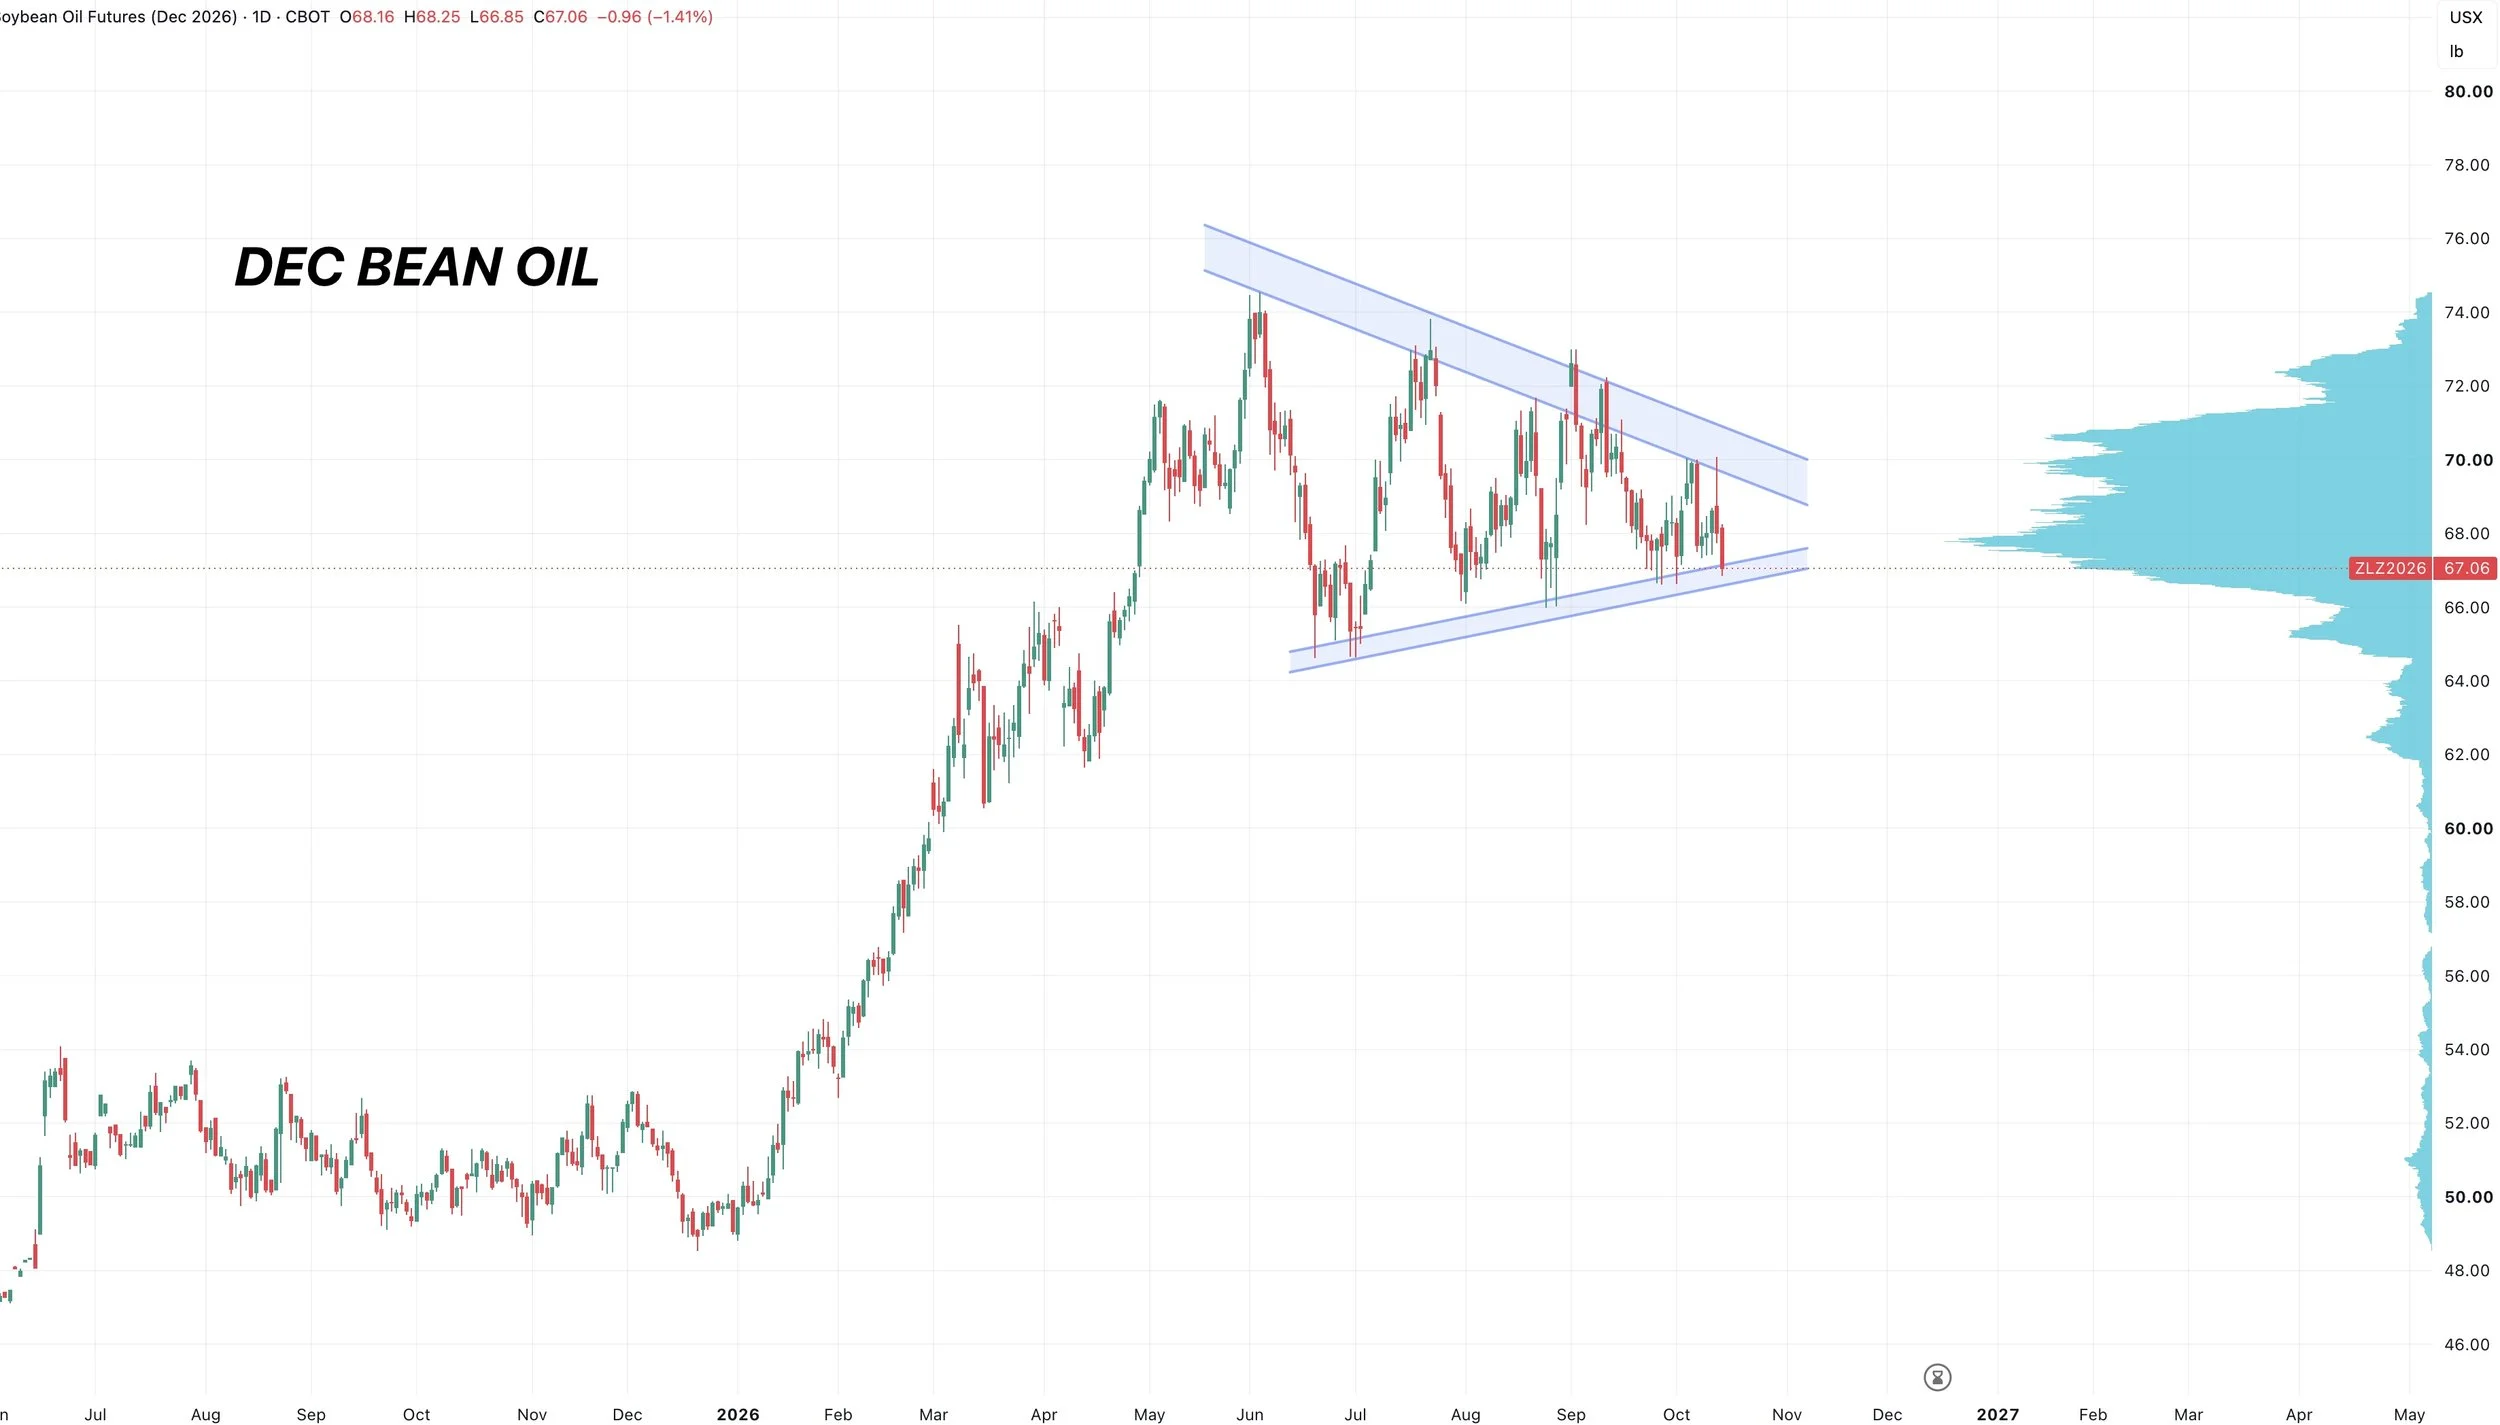
Bean Oil: Wedge Coiling
Bean oil has been coiling up in a pretty massive wedge pattern.
It looks like it's going to make a decision which way it'll break soon.
As I've said all year long, bean oil is one reason for the big fund length in the soy complex.
Unless bean oil starts to break down, I don’t see a major reason for the funds to completely jump ship.
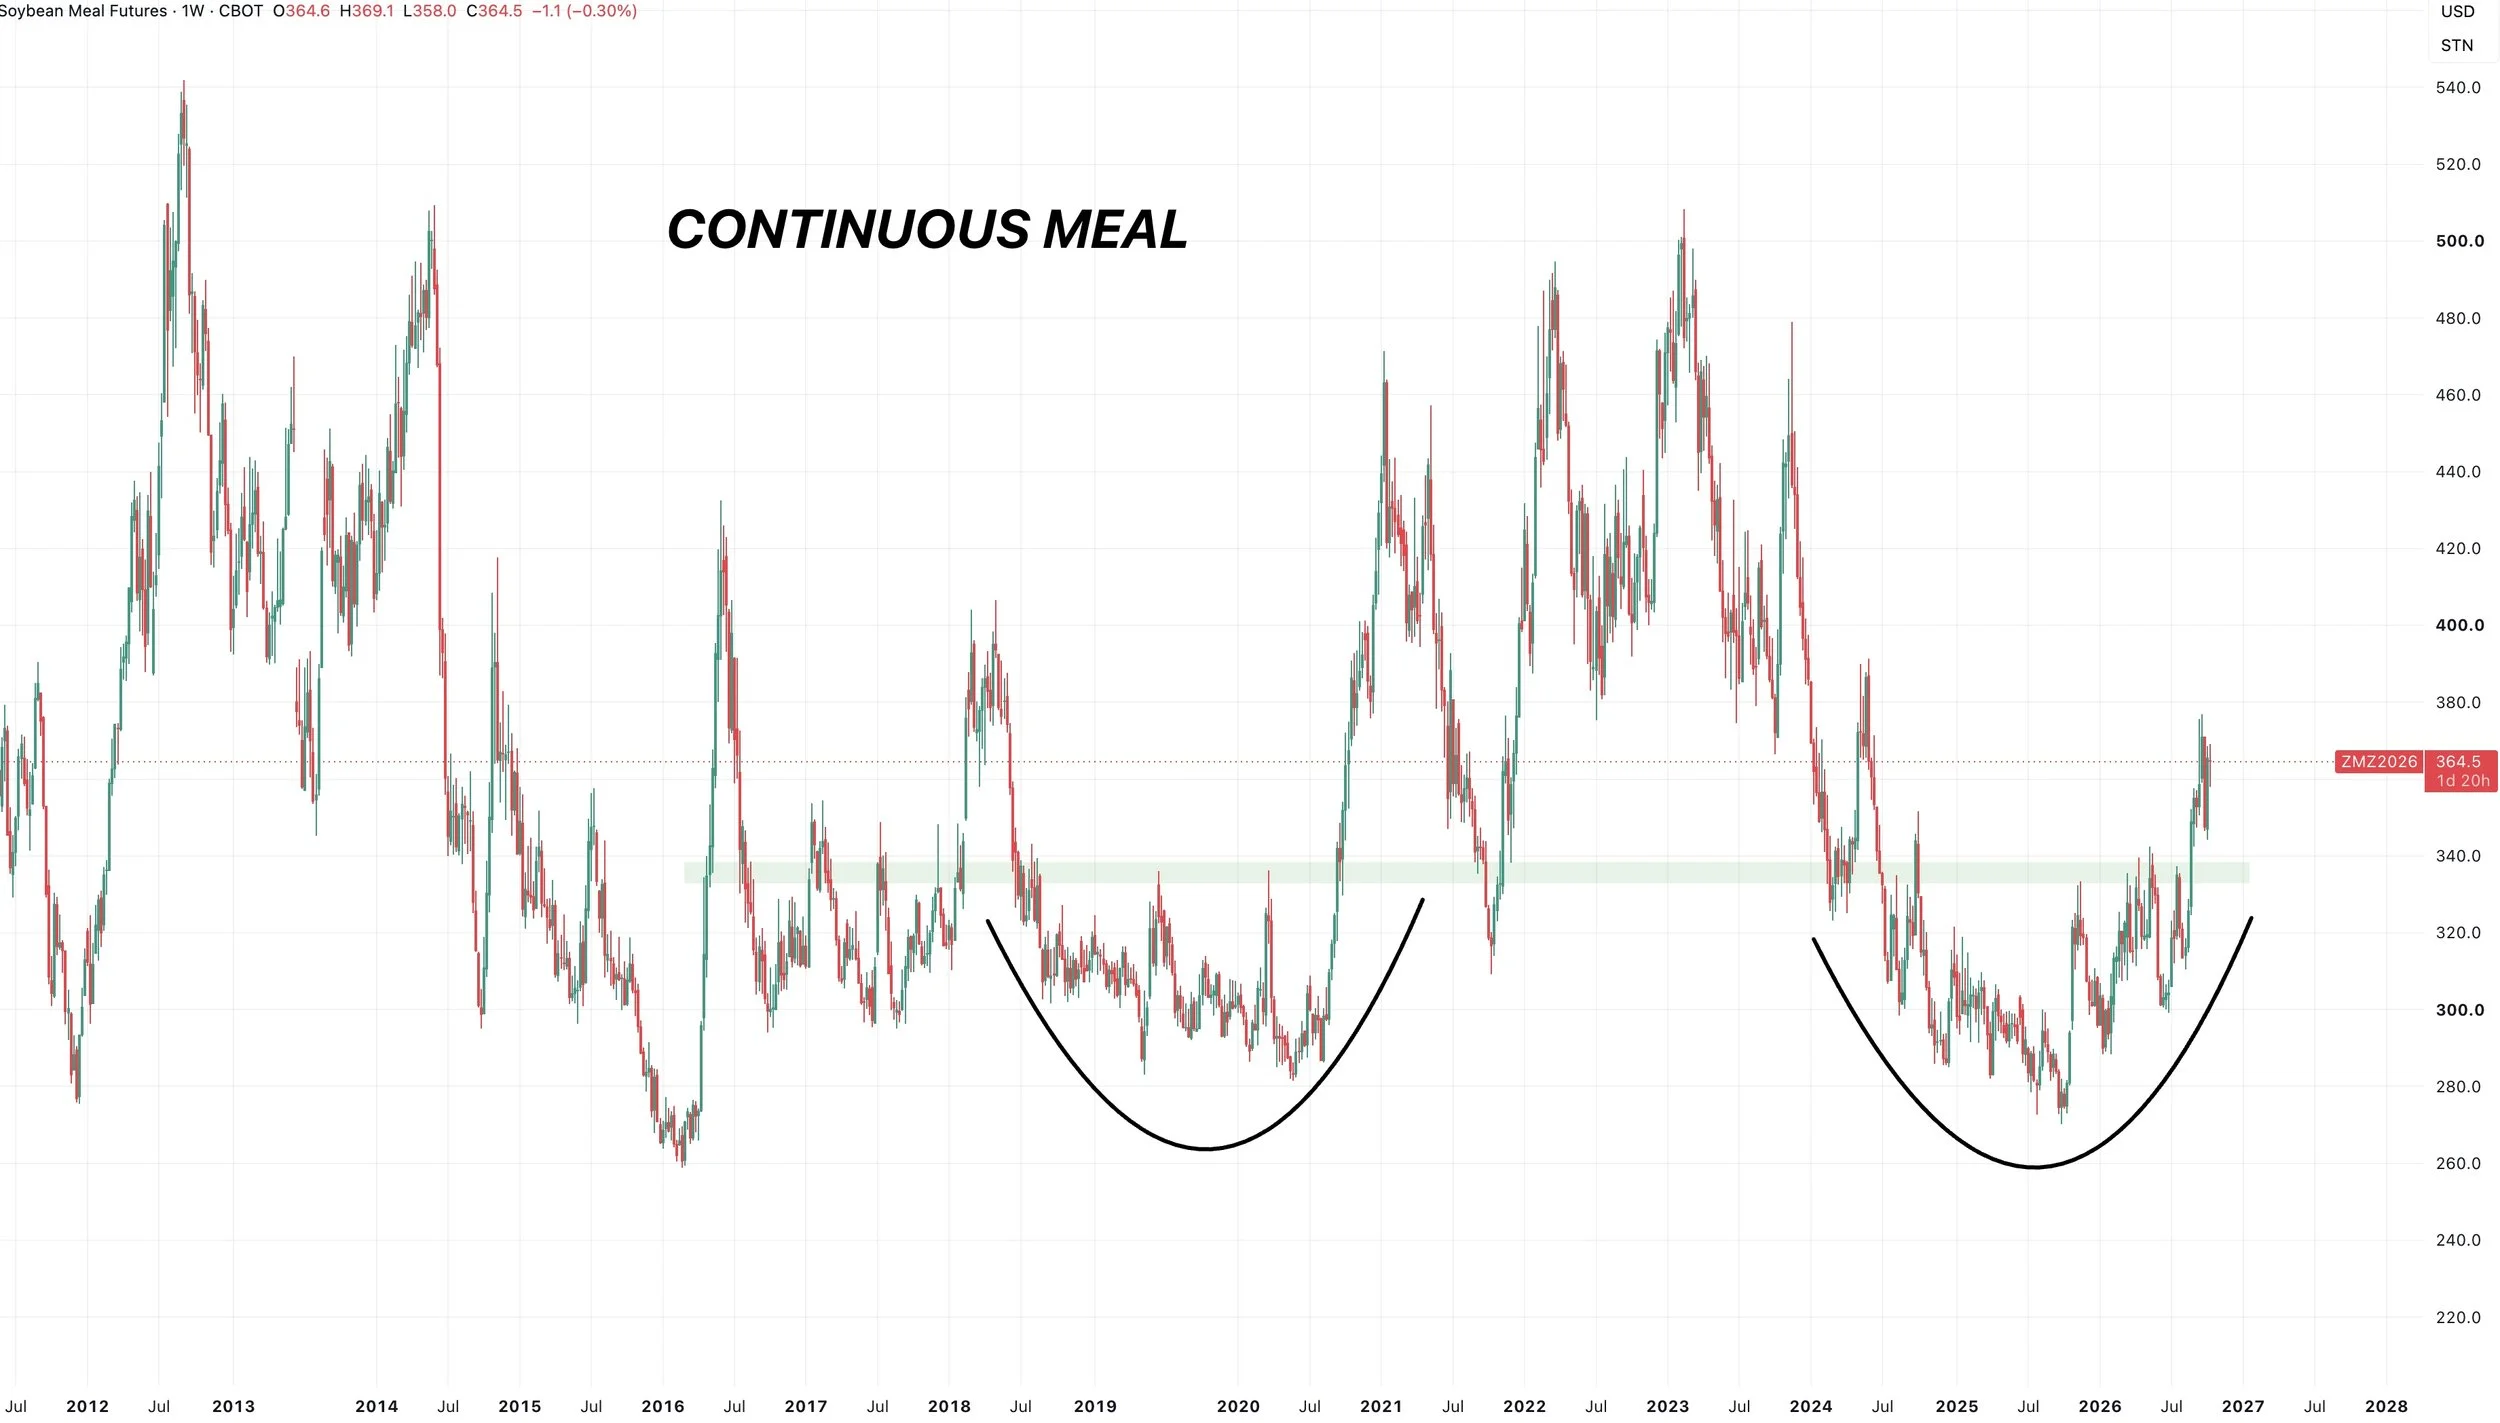
Meal Multi-Year Breakout:
Meal just broke out to multi-year highs not too long ago.
This isn’t bearish for the soybean complex either.
Wheat
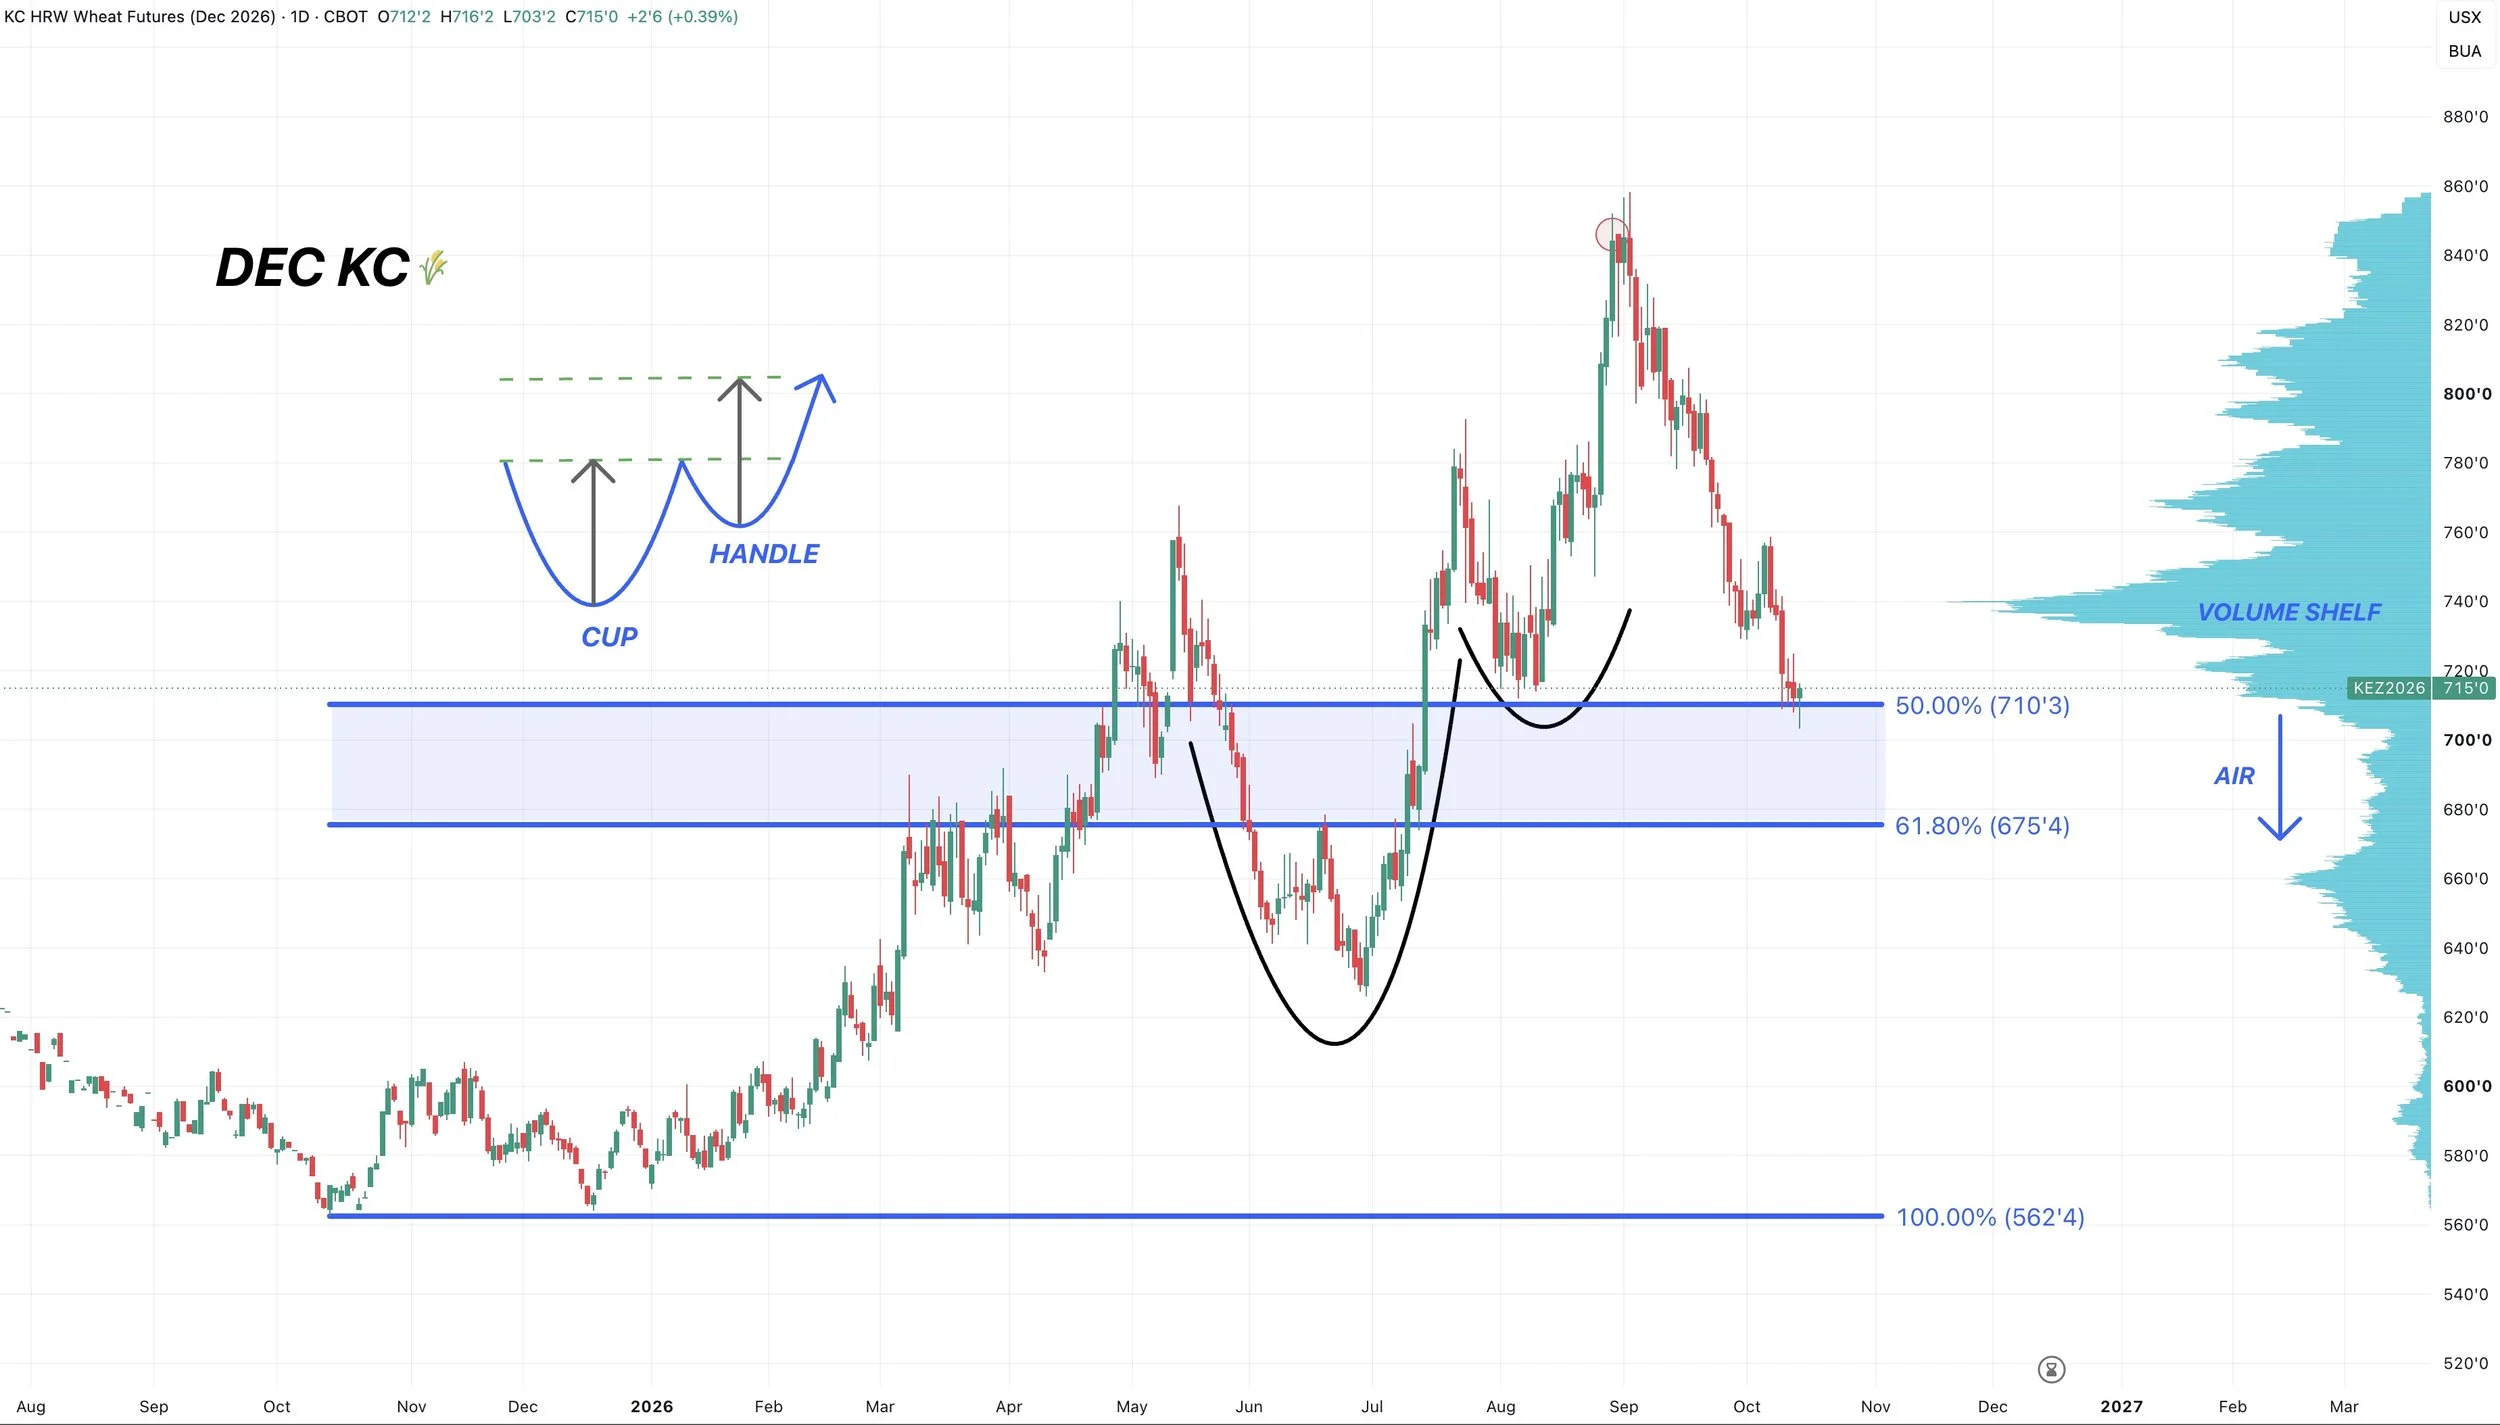
Dec KC Chart:
KC is still at a pretty big spot here.
We've given back 61.8% of the entire rally from June.
If bulls are going to get a bounce, we'd like to see it happen right about now.
Because if you notice, there is virtually zero volume holding up this market below this support level.
We had a nice close today, but need to continue to hold here.
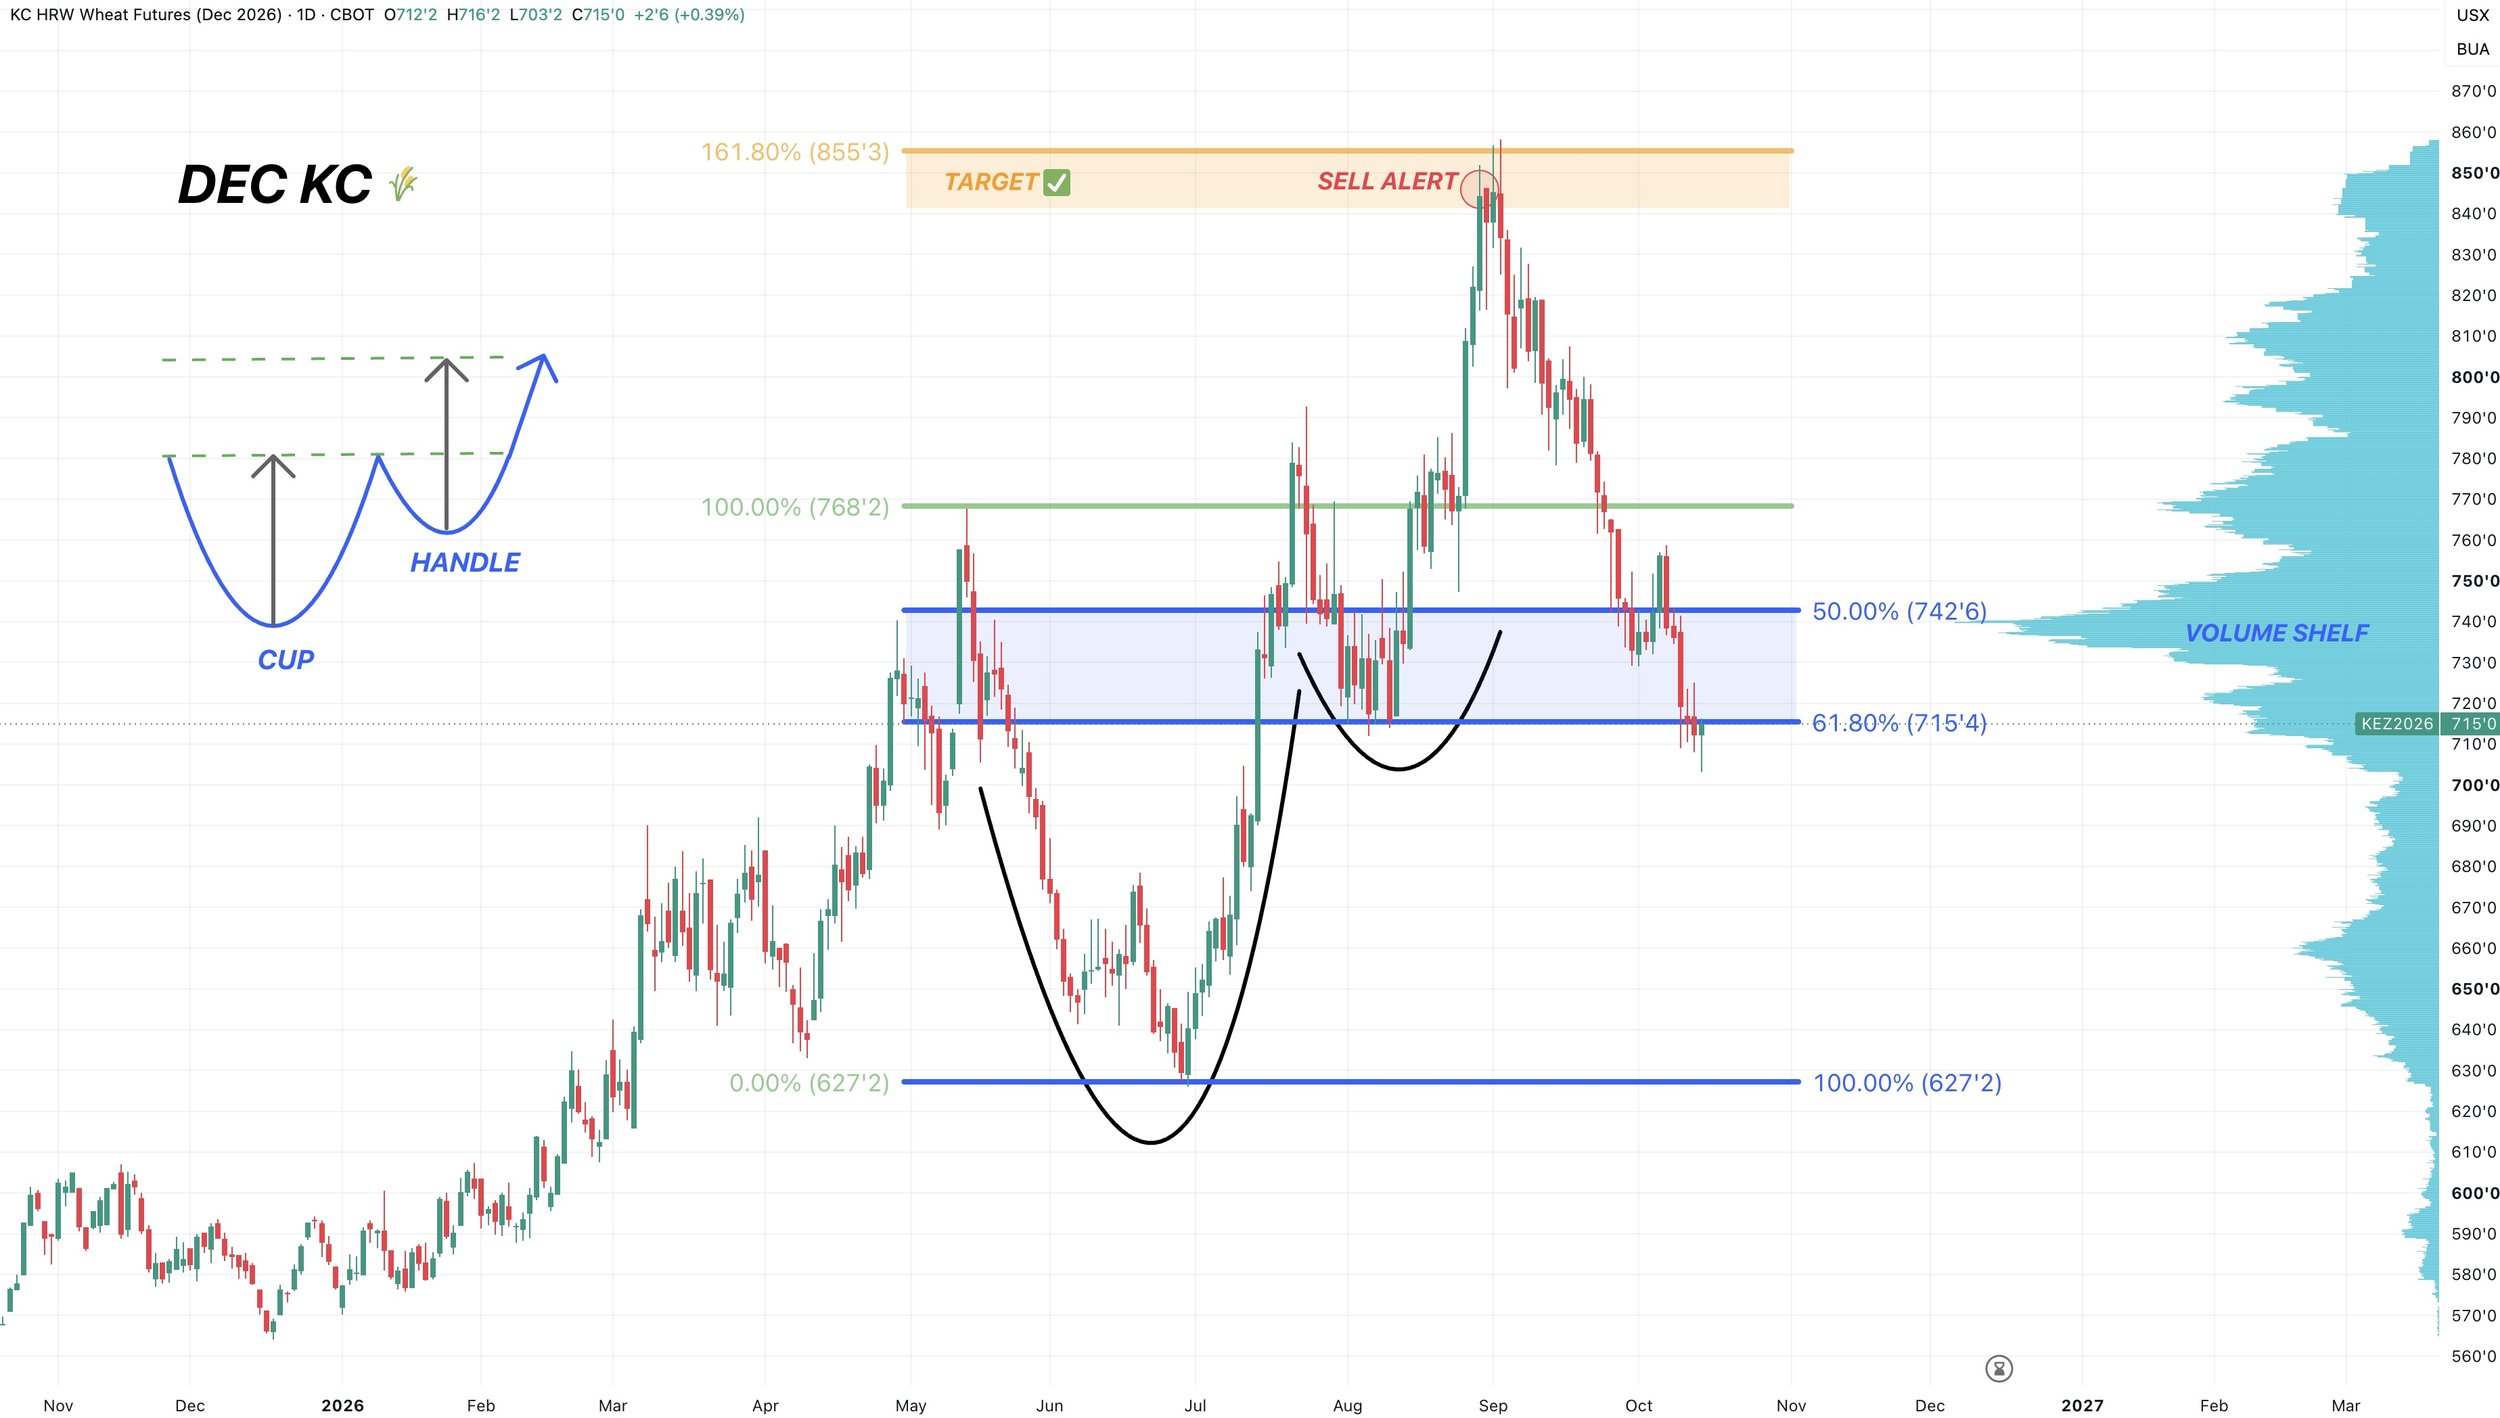
If you are unable to hold this support, then what?
Well you could head towards the 61.8% retracement from contract highs all the way down to the contract lows.
Which is also where volume picks back up and was some prior resistance.
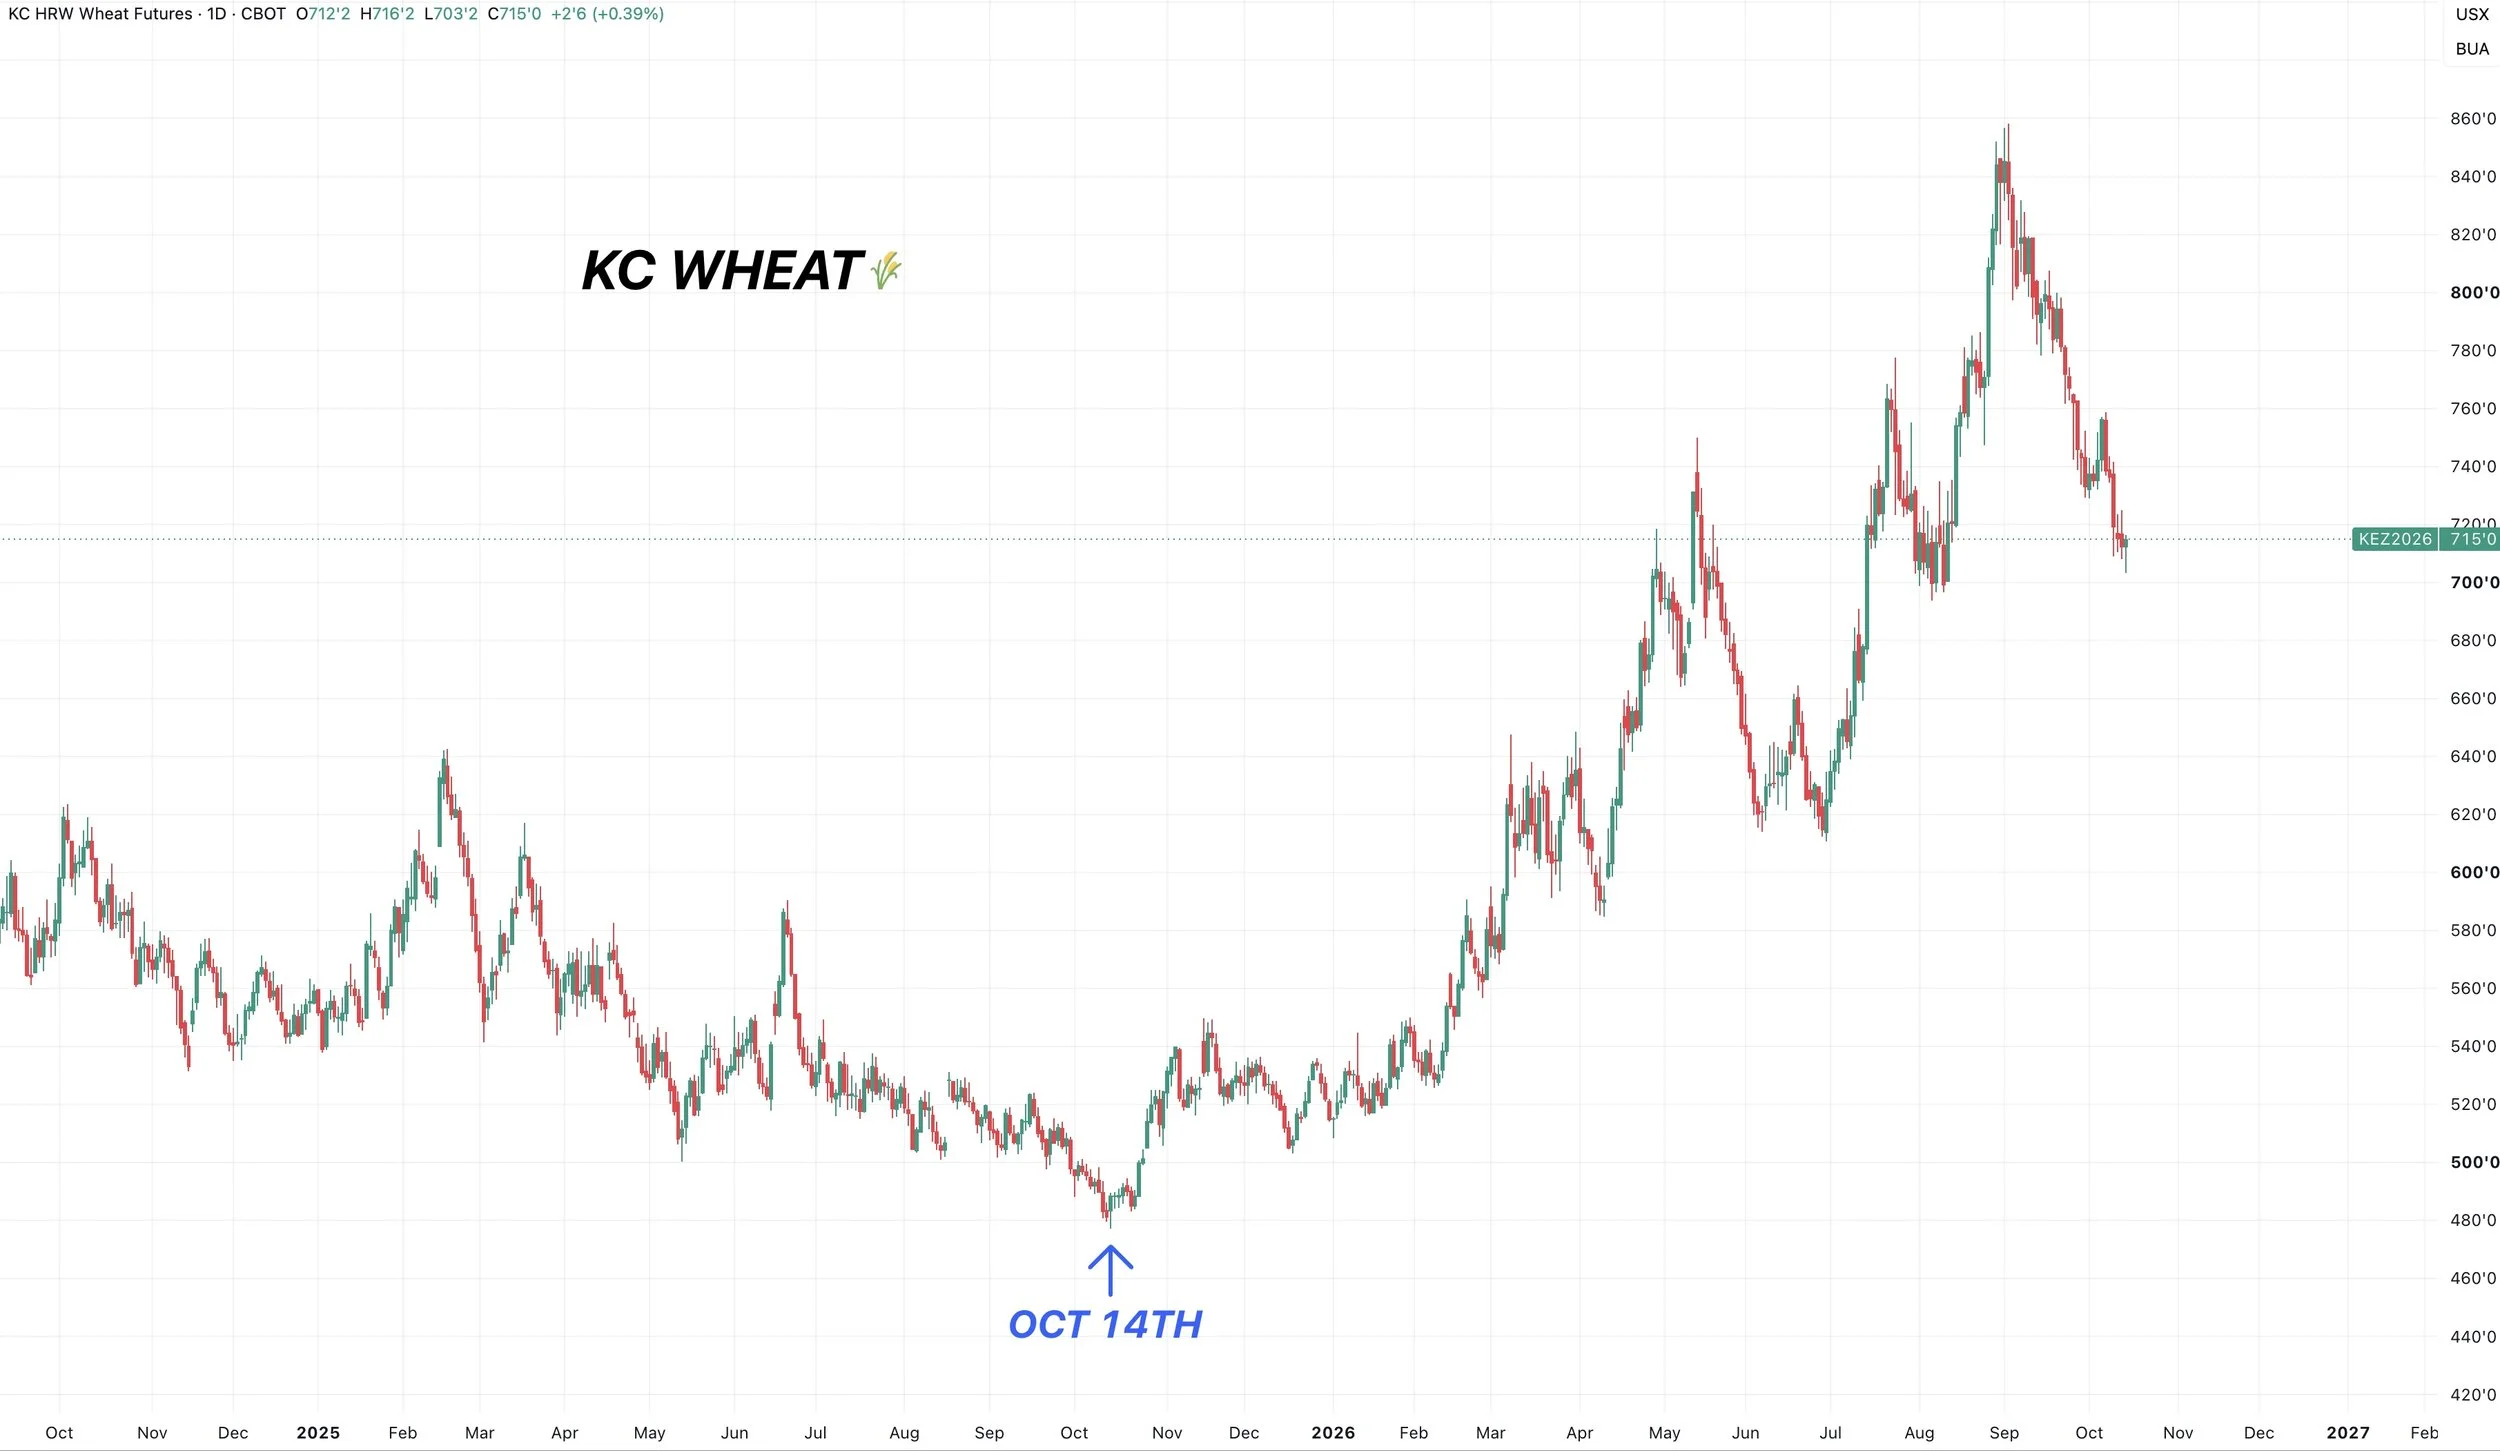
Something interesting to note is that wheat did post it's bottom last year on October 14th.
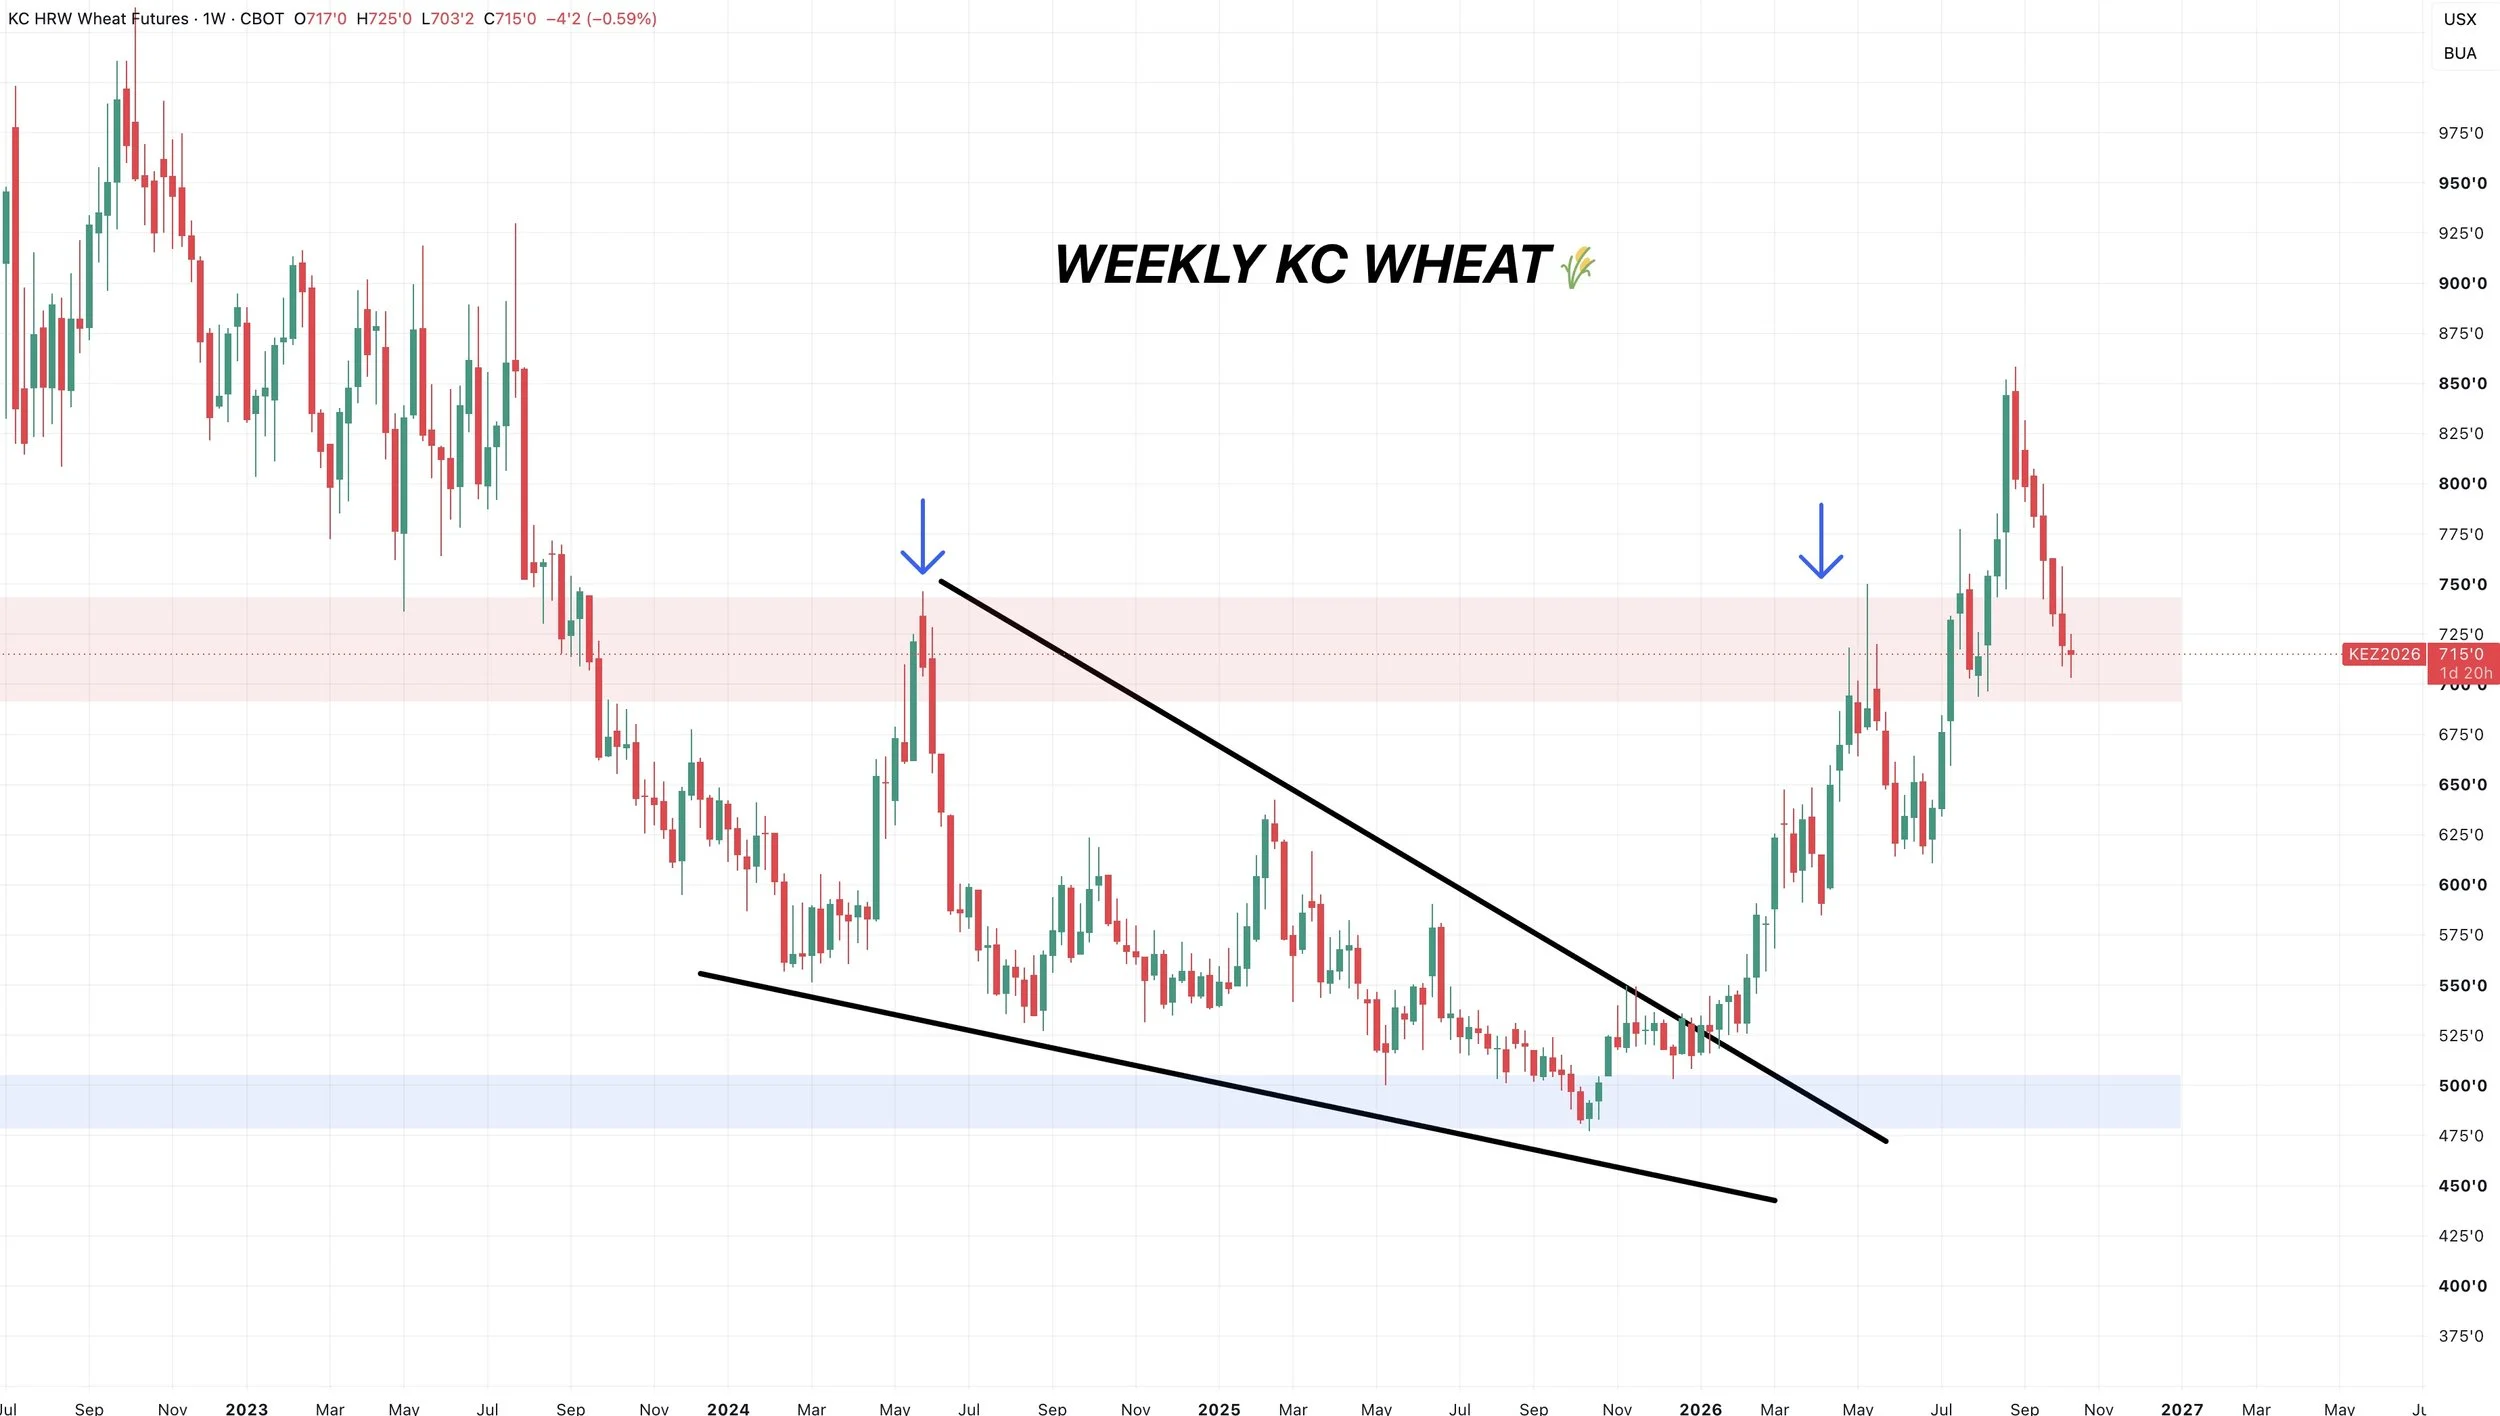
Weekly KC Chart:
For now, this pull back is still just a simple re-test of the prior highs.
So despite the nasty pull back, the structure in wheat is not broken and the trend is clearly higher for now.
This market was trading under $5.00 at this time last year.
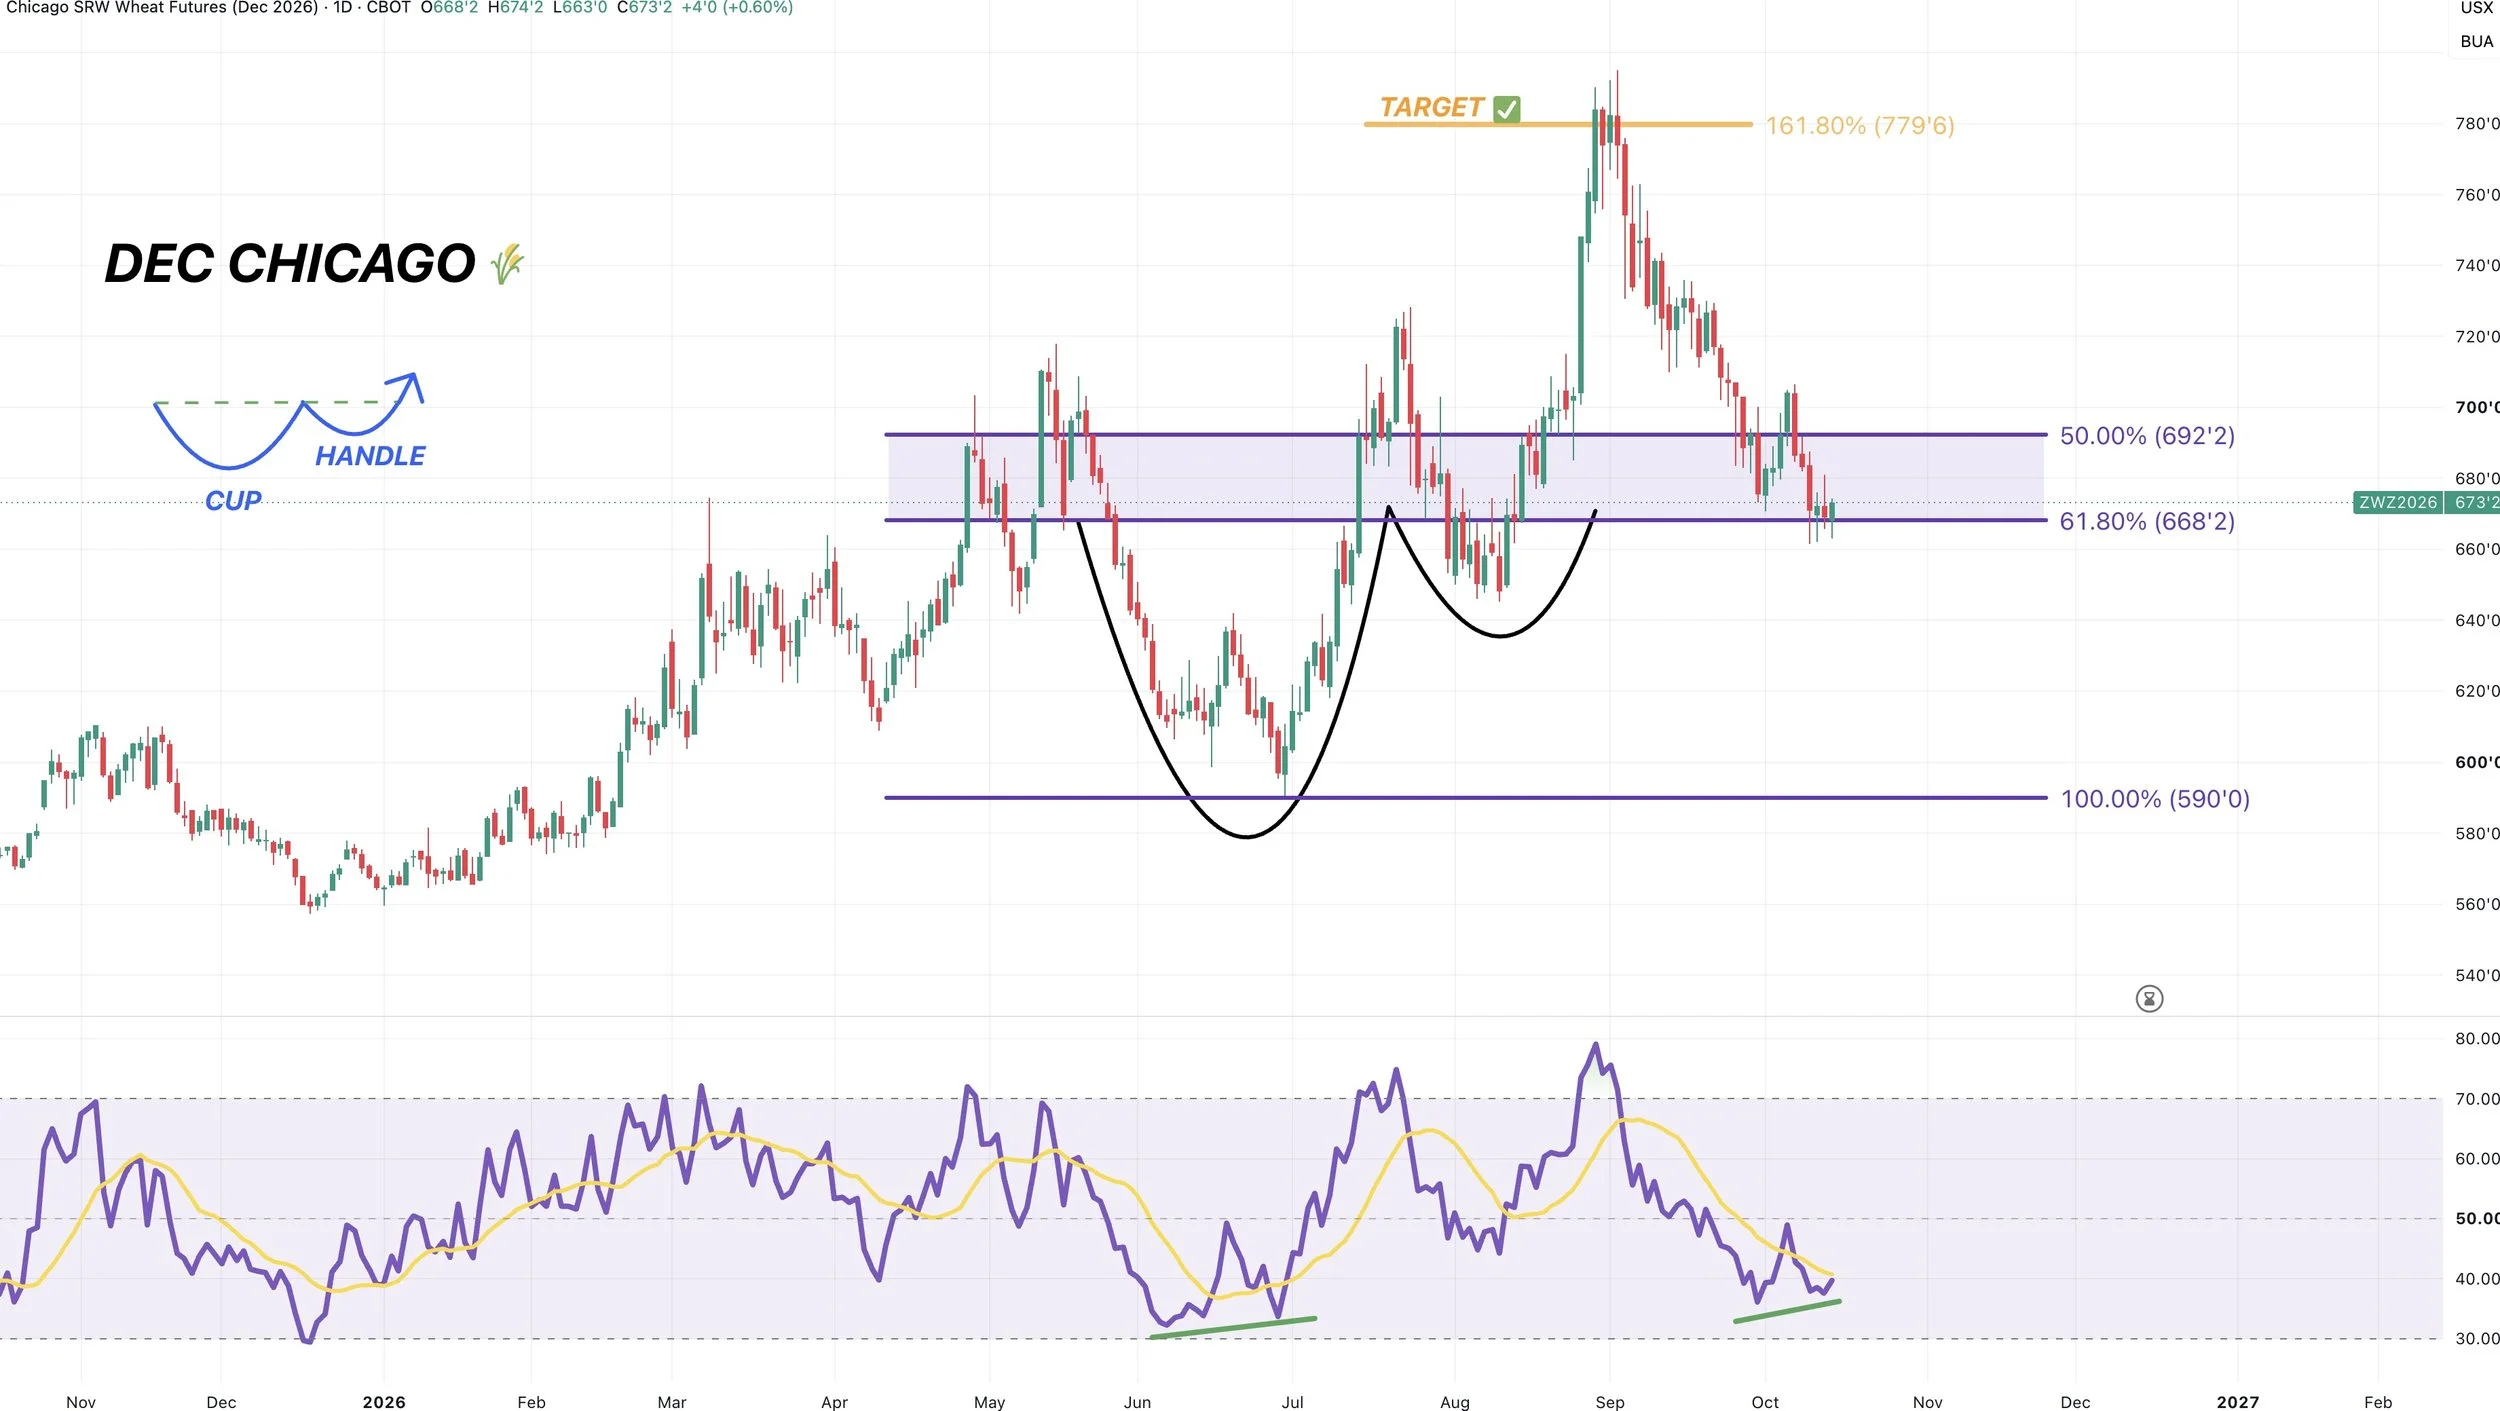
Dec Chicago Wheat Chart:
Also sitting at a pretty key spot.
We've given back 61.8% of the entire rally from June.
Not only that, but Chicago wheat is showing some potential bullish divergence on the RSI forming.
Prices made new lows, yet the RSI has not. Which can often be a sign of downside momentum getting weaker.
We need the RSI and prices to bounce here to confirm the bullish divergence.
We do not have a confirmation of a bottom yet, but it's potentially a good sign for the wheat market.
As the last time we had bullish divergence it marked the June lows.
The set up does look pretty similar to those June lows as well. We had a rally, we then sold off, we then got a mini pop, before selling off one last time and posting bullish divergence.
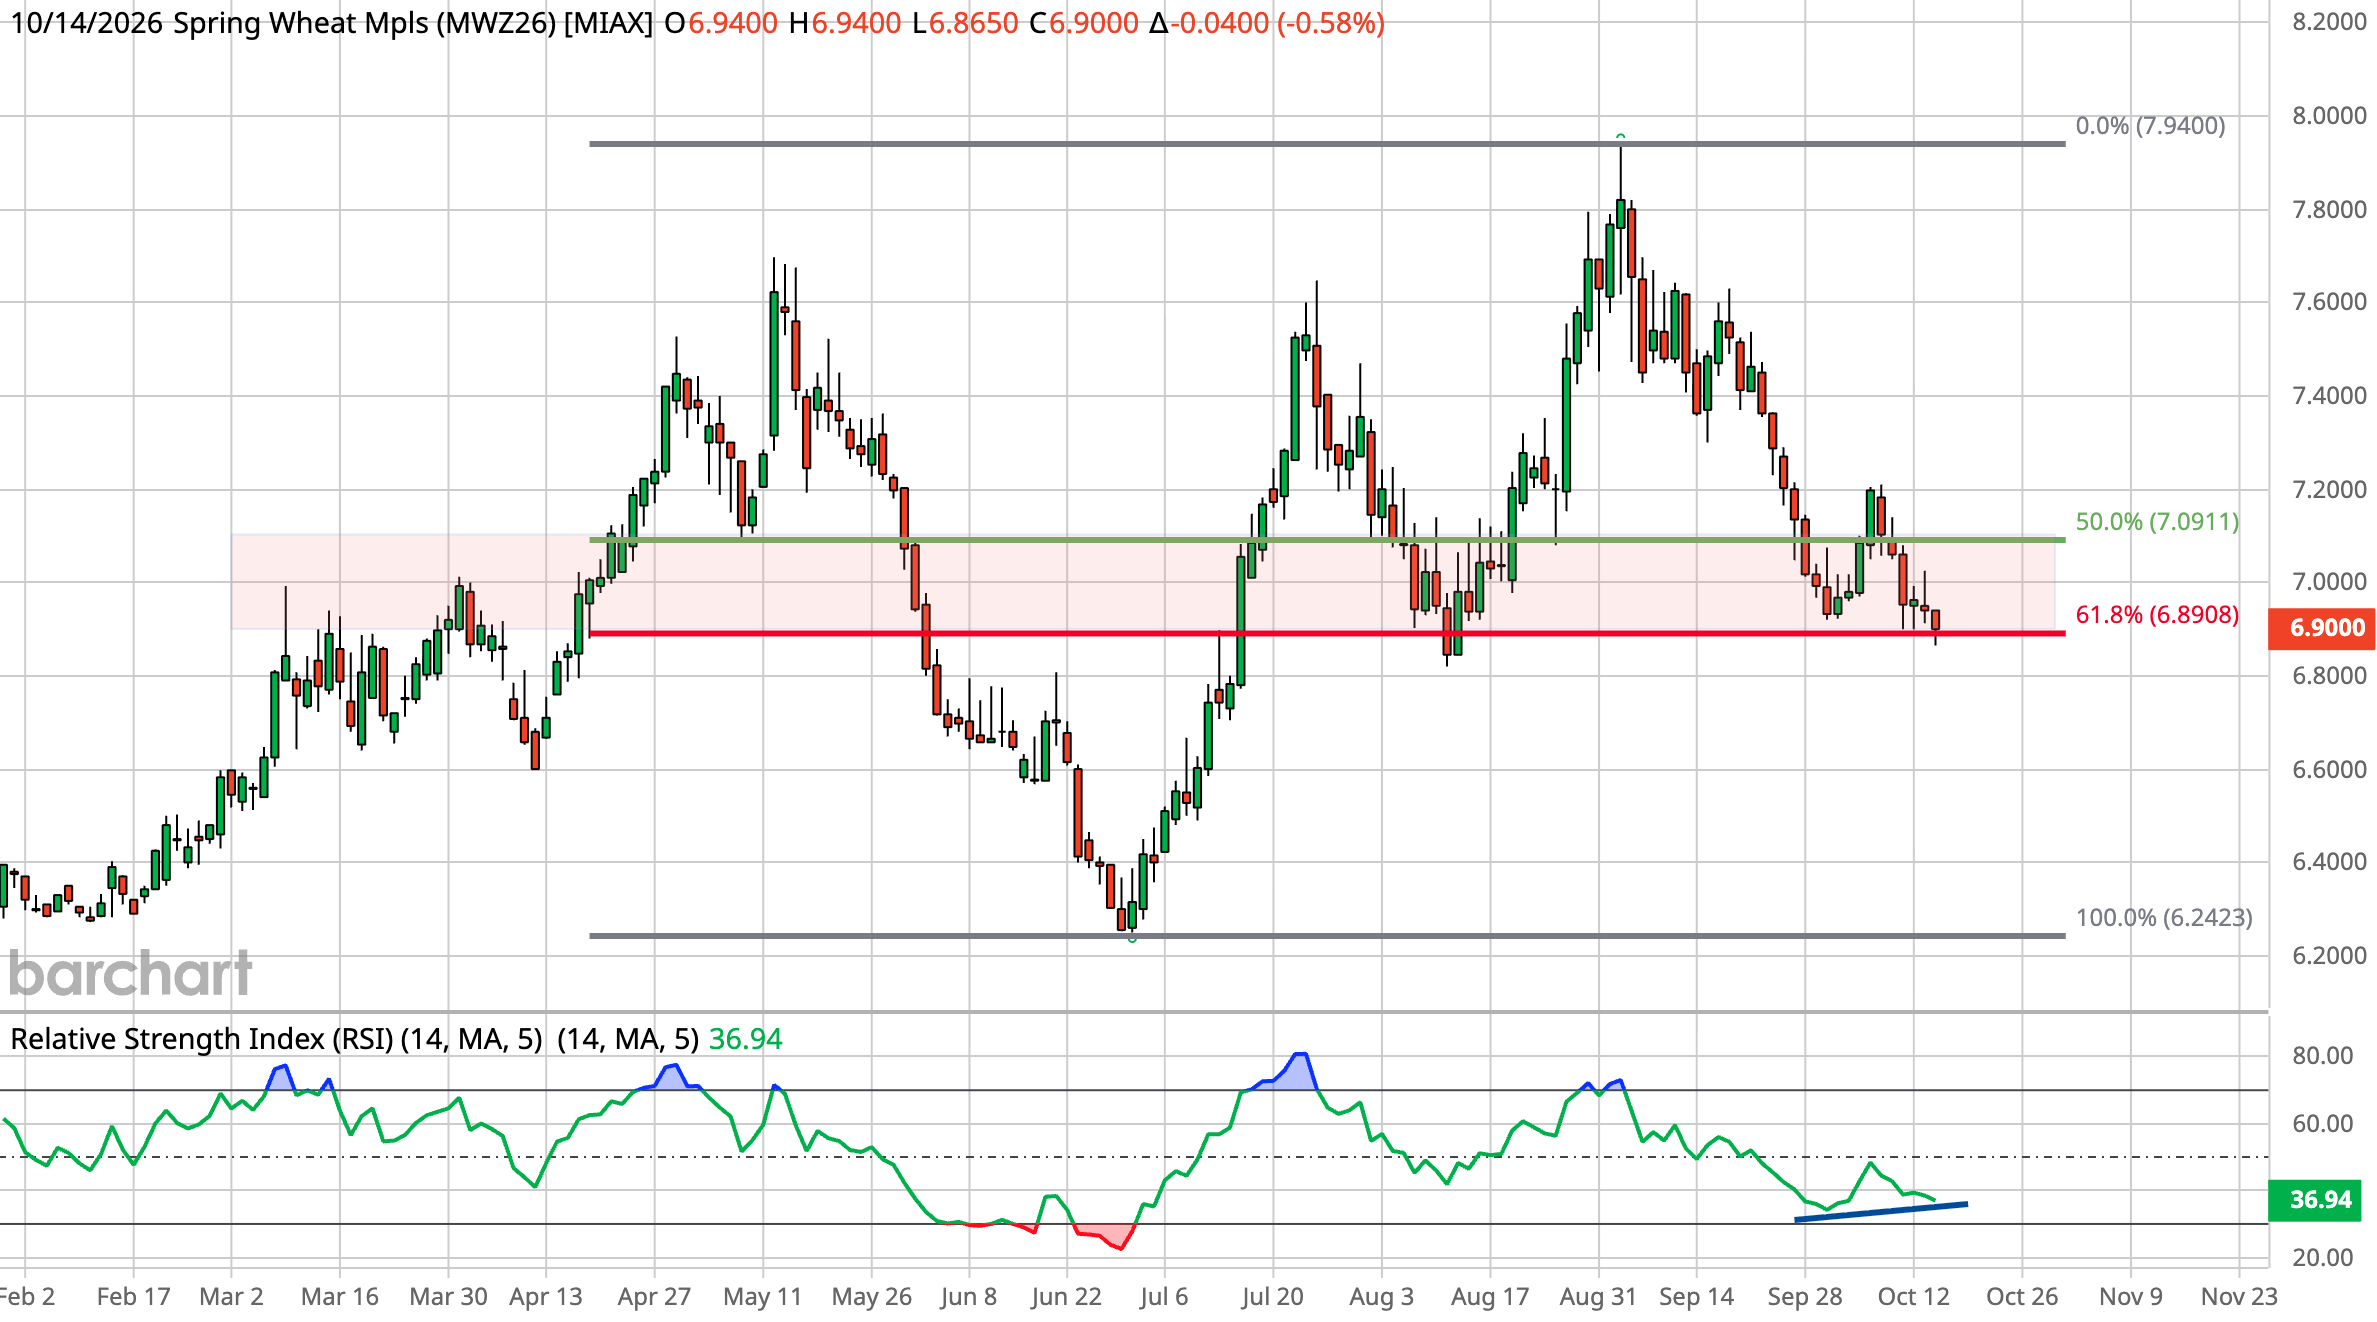
MPLS Wheat Chart:
Similar set up as Chicago.
Also sitting right at the 61.8% level. A level corrections often end.
This same spot lines up with plenty of prior support.
We are also showing potential bullish divergence on the RSI.
So like in the rest of the wheat classes, this would be a spot we'd expect us to find some life.
However, we need to bounce soon or there is definitely some air to the downside.
Cattle
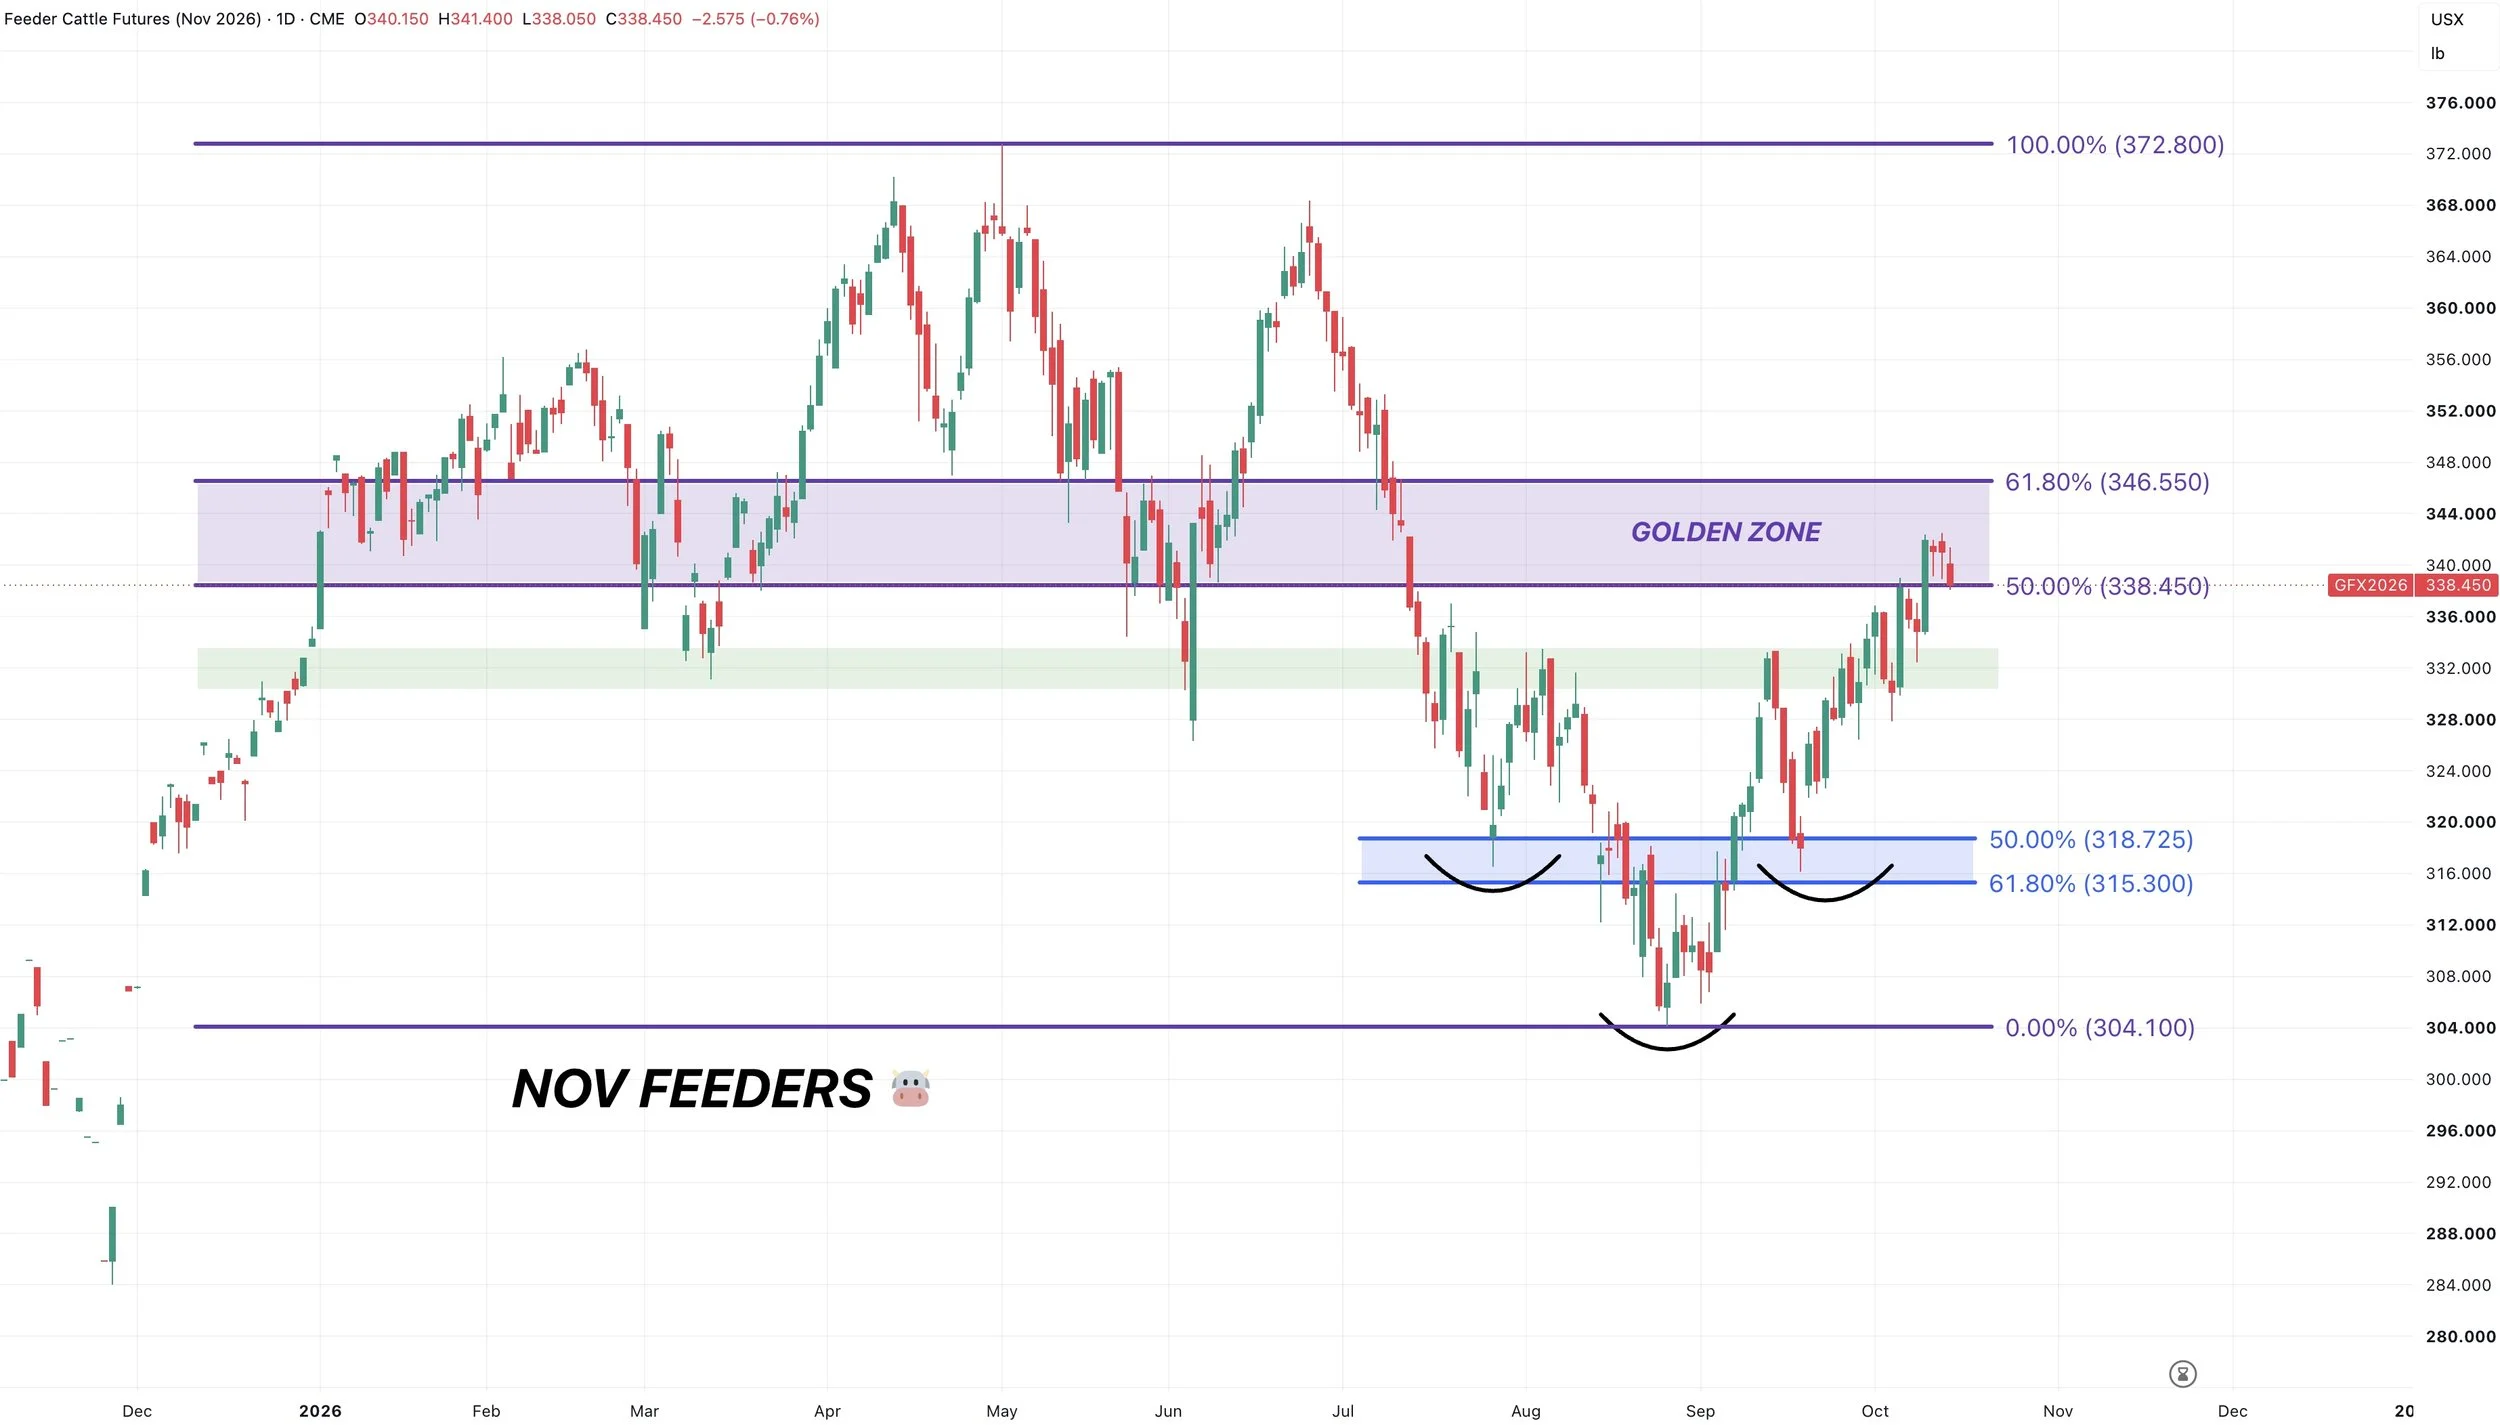
Nov Feeders Chart: at Target Zone
We are seeing a little bit of resistance up inside this target zone.
Which is the golden zone up to the May highs.
If this is simply a relief bounce inside a broader downward trend, this would be a very common area for this market to fail.
So I do like managing my risk up here.
RSI: Bearish Divergence
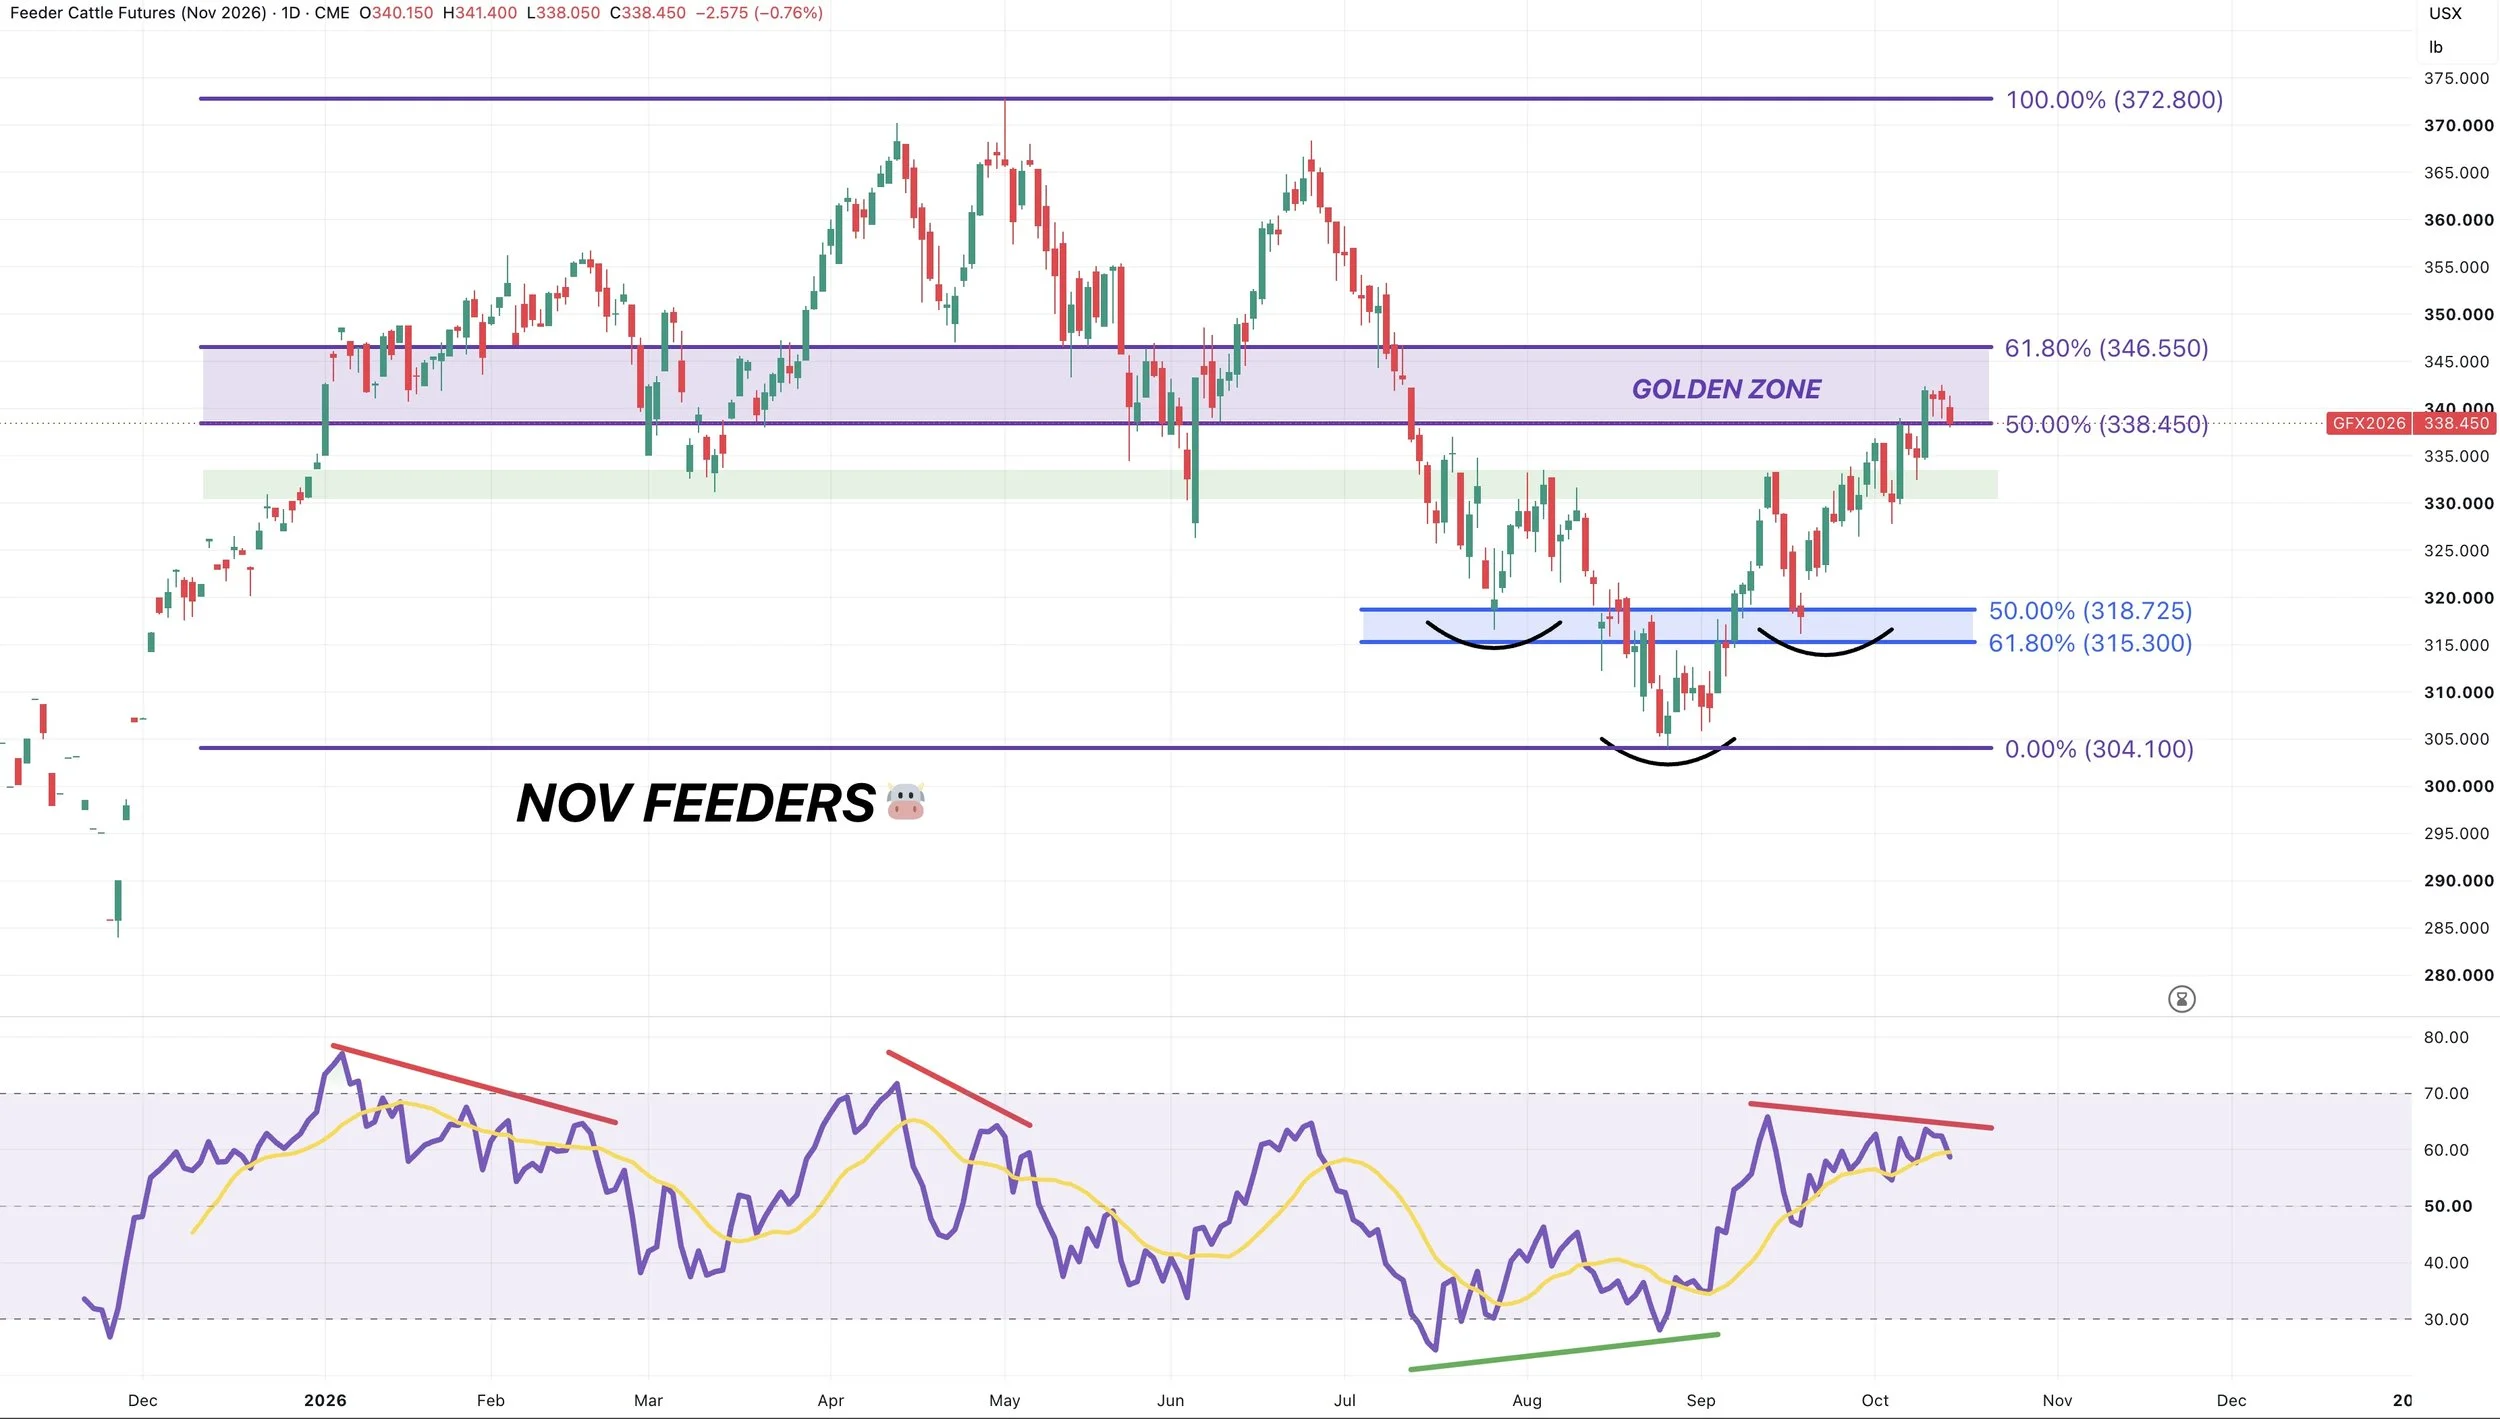
We also have bearish divergence on the RSI which gives us another reason to be cautious here.
Prices made new highs. The RSI did not.
This often is a warning sign that upside momentum is getting weaker.
RSI divergence has been a pretty good indicator for the cattle market.
There was bearish divergence before the February pull back.
Bearish divergence marked the May highs.
Bullish divergence marked the August lows.
Now we have some bearish divergence.
Dec Live Chart: Target Zone & Bearish Divergence
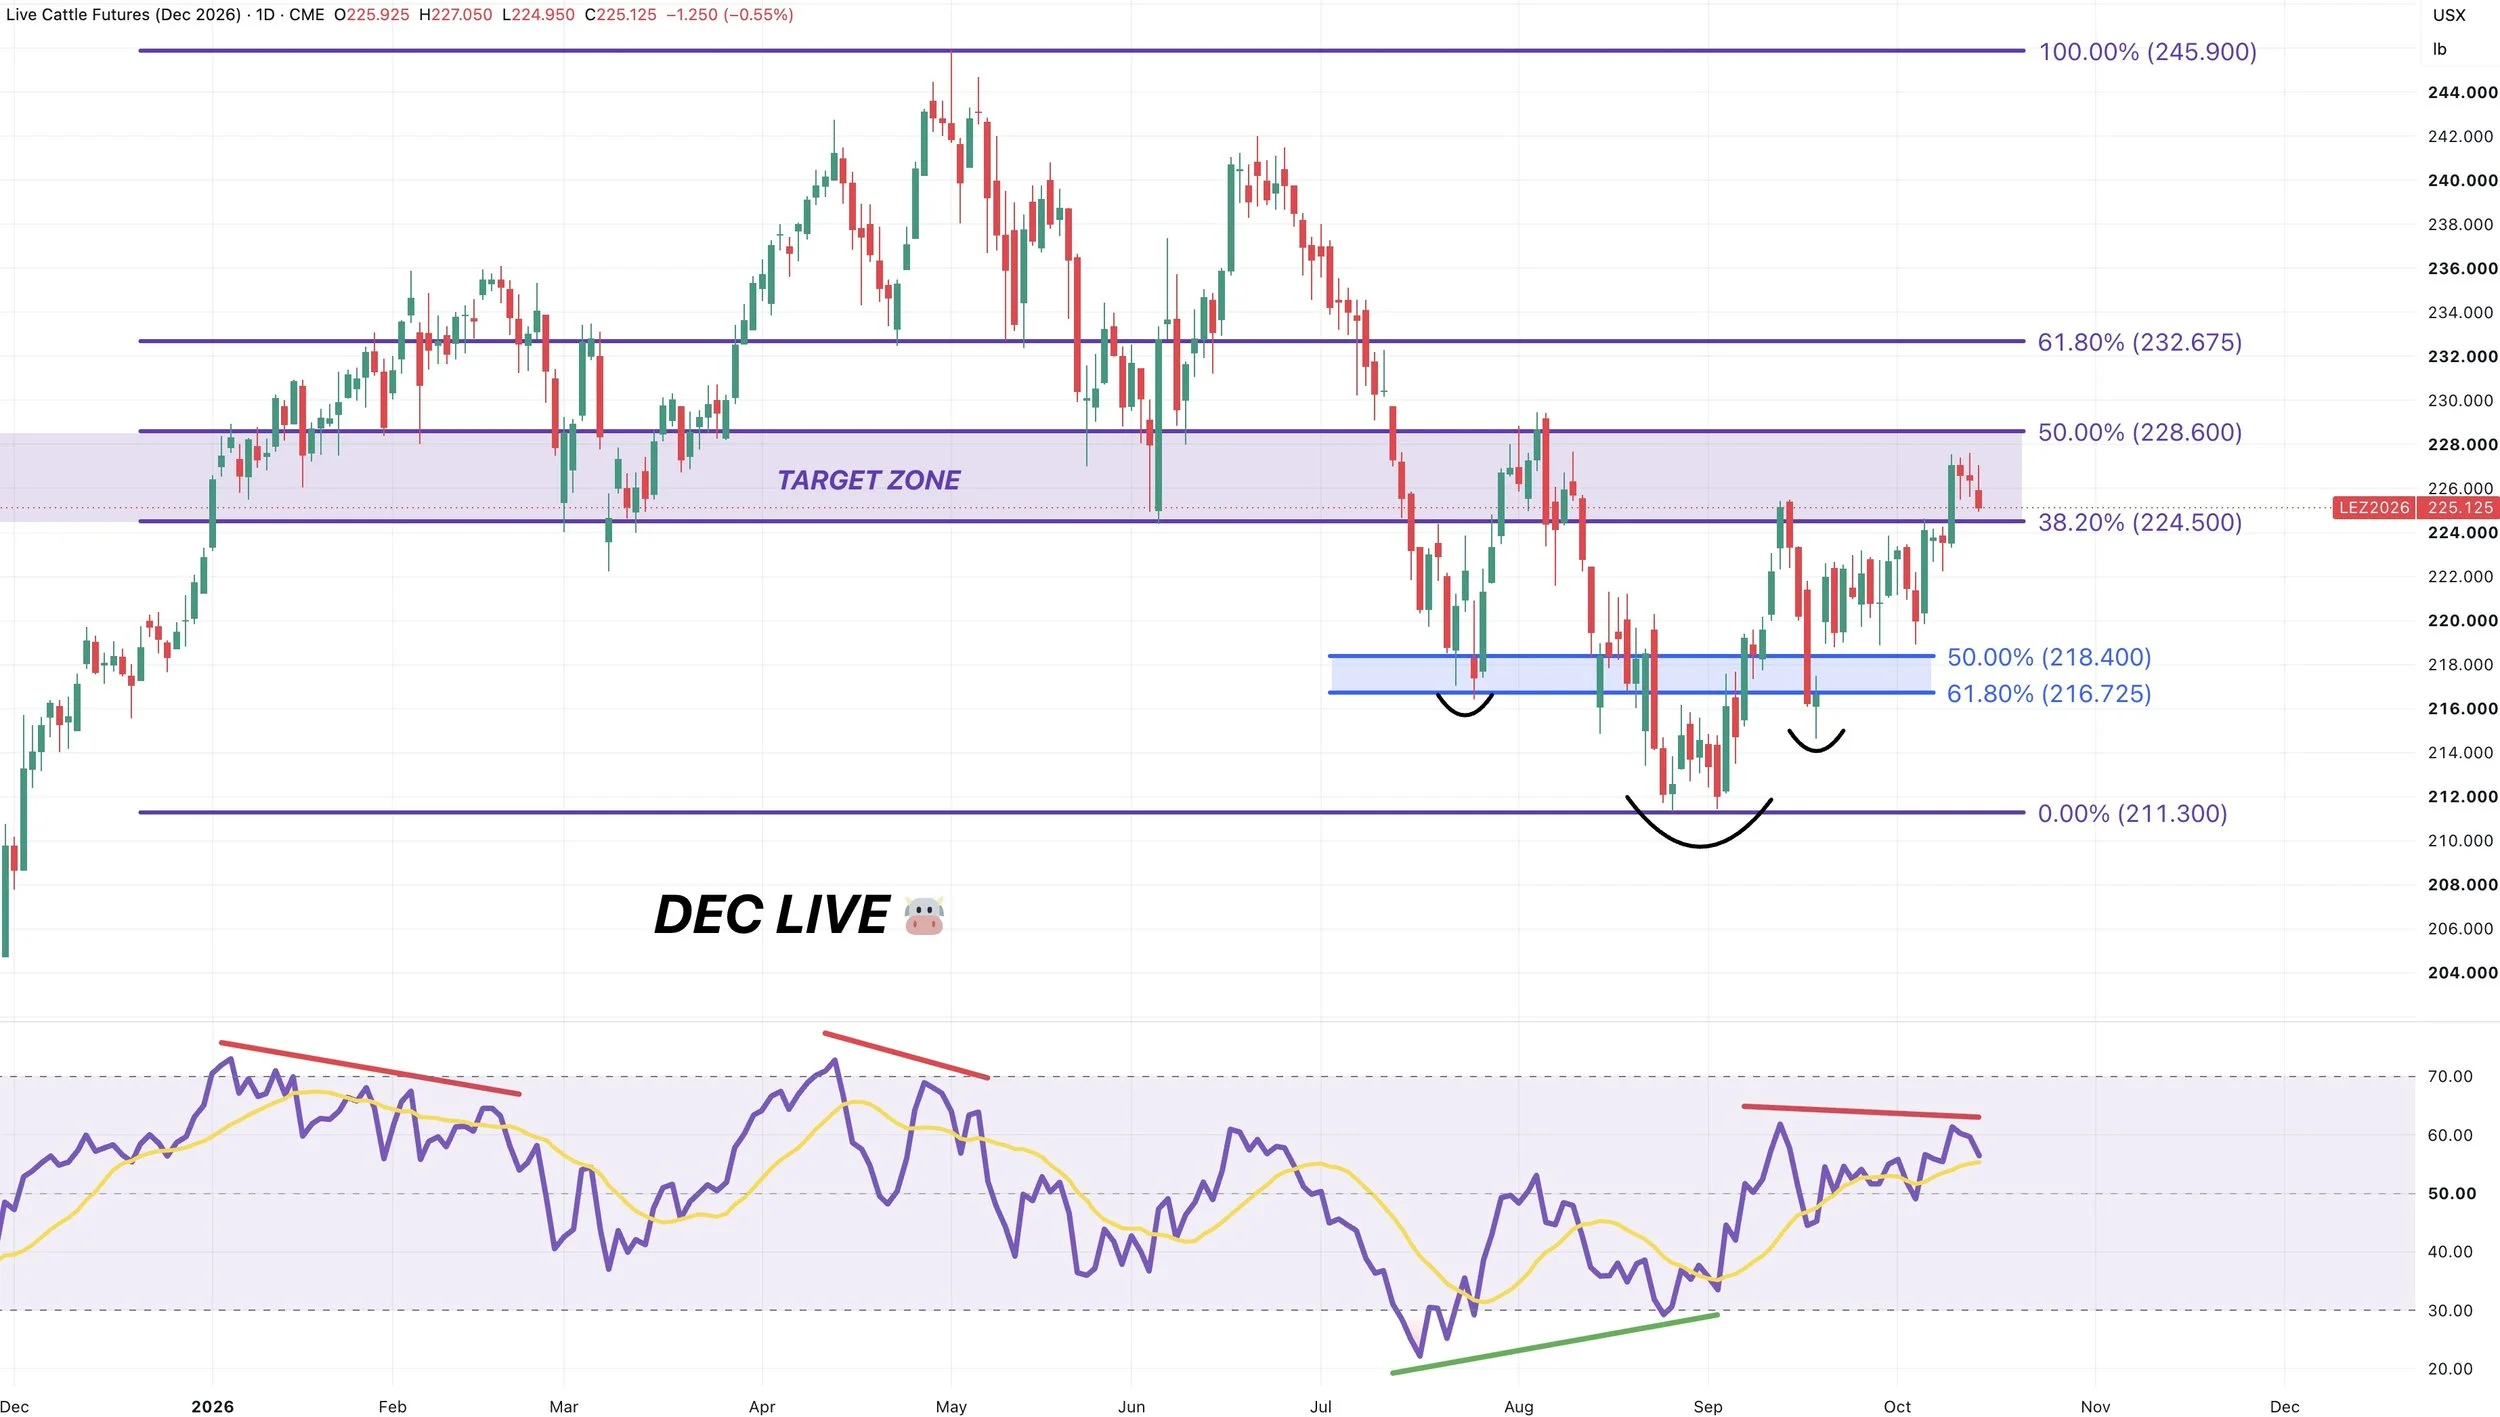
Live cattle has been weaker than feeders this entire rally.
So the target box for live cattle is a set of fibs lower than it is for feeders.
Being the 38.2% to 50% retracements up to the May highs, rather than the 50% to 61.8% levels like in feeders.
But like in feeders, we are showing some weakness up in this target box. So we like doing some risk management up here.
Like in feeders, we also have some bearish divergence on the RSI. Which again, has been a pretty consistent read for cattle this year.
Want to Talk?
Our phones are open 24/7 for you guys if you ever need anything or want to discuss your operation.
Jeremey & Office: (806)484-1214
Sebastian: (605)280-1186
Email: sfrost@dailymarketminute.com
Hedge Account
Interested in a hedge account? Use the link below to set up an account or give us a call.