
YIELD, ACRES & GETTING COMFORTABLE
AUDIO COMMENTARY
Cattle sitting at resistance zones
Be prepared for downside management in cattle
Corn is still completely sideways since USDA
Soybeans broke some key support
There is risk of a better soybean yield
Not near the horror stories in beans as corn
Wheat is still over $2.00 higher than 1 year ago
Follow a risk management plan if you are re-owning. Don’t just blindly buy
No response from the USDA on our questions
Most surveys in Nebraska say lower
Digging into some acre numbers
What actually pushed Nebraska yield up?
Could harvested acres be off?
Still believe yield “should” come down
Extreme swing in Mother Nature
What scenario make you the most upset?
If you can’t afford lower prices or wait it out
What are your exact needs for YOUR situation?
Ways to get yourself more comfortable
Illinois corn data PDF below audio*
Where is bean bottom? Chart below*
Listen to today’s audio below
Want to talk?
Office: (806)484-1214
ILLINOIS CORN DATA
Here is the data Jeremey mentioned in the audio that he put together on Illinois.
This PDF has a lot of data about the crop. Such as the weather and it’s impacts it may have had, and why Illinois may be overstated.
SOYBEAN CHARTS
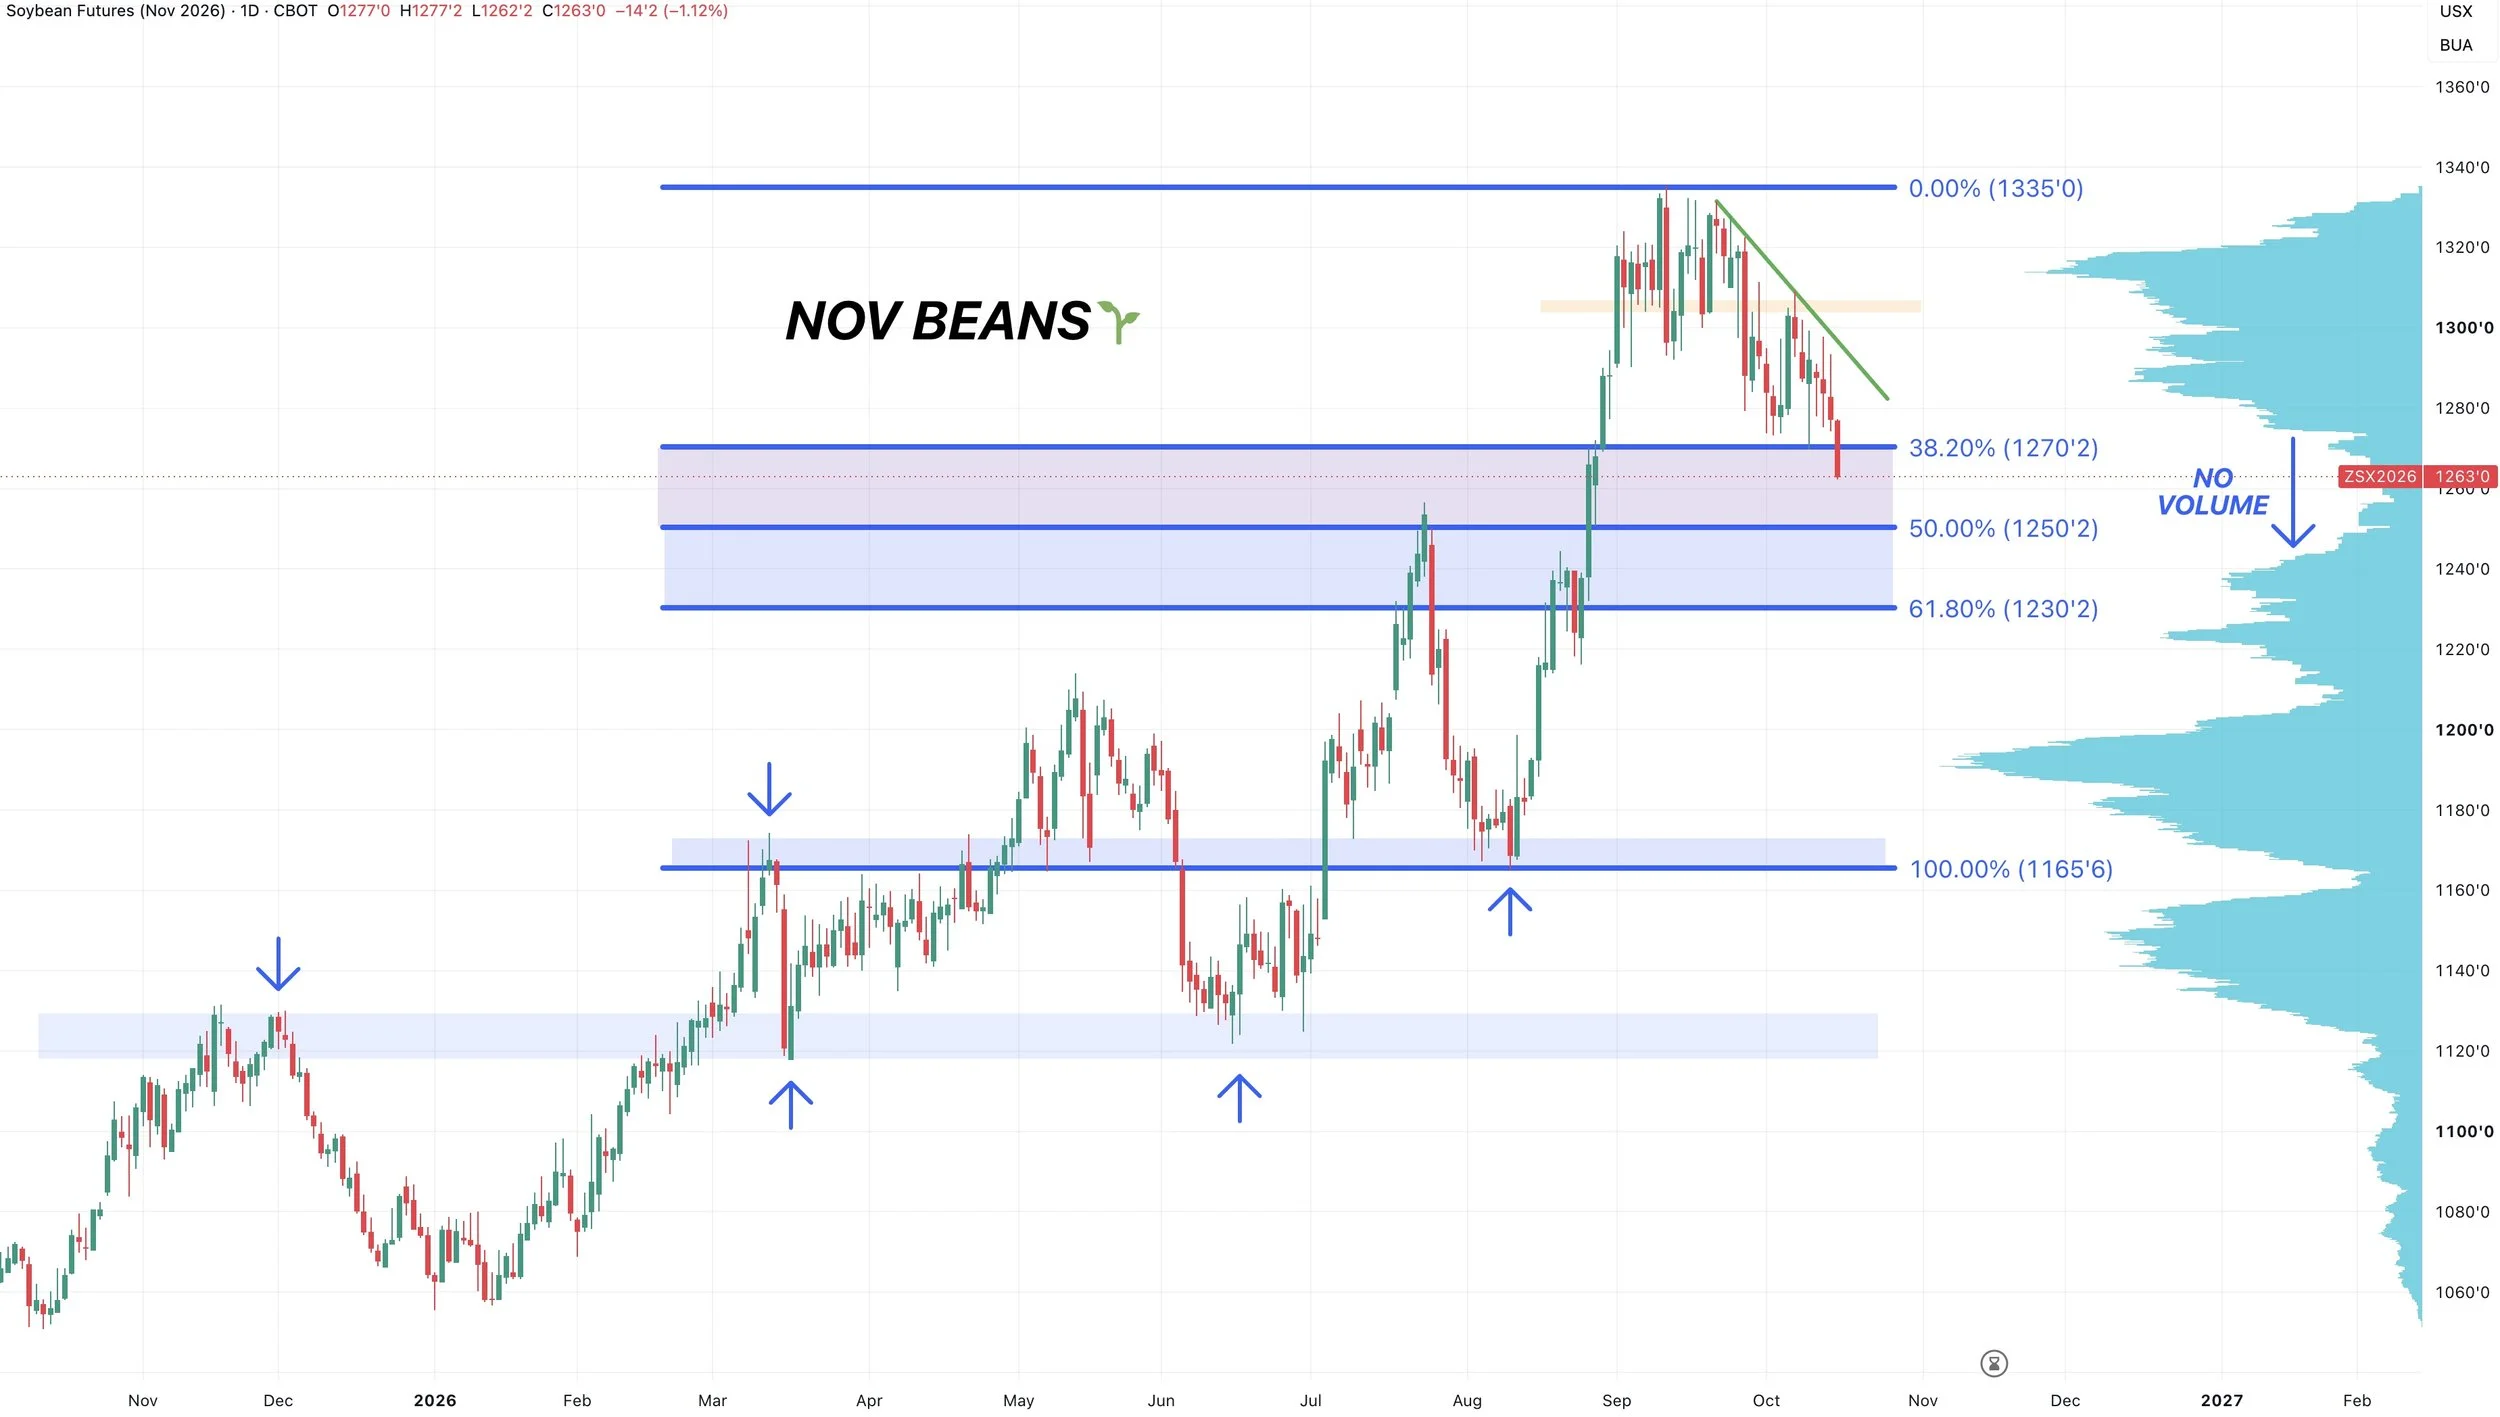
Nov Beans 🌱
No real changes to corn or wheat from yesterday’s update.
However soybeans are breaking that support we talked about.
Like we talked about for weeks, below this level there is a big volume gap to the downside. Meaning there is no volume or support to catch this market. Which is a risk.
If we are unable to reclaim that support asap, there is downside risk from here.
Where could we drop to?
Volume picks back up towards the 50-61.8% retracements down to the June lows.
Those levels would also be a perfect re-test of the July highs.
Turning that old resistance into new support. Which is something soybeans do pretty frequently.
The August lows came at the March highs.
The March and June lows came in at the November highs from last year.
So that golden zone would be where we’d expect a bottom if we are unable to reclaim the lost support.
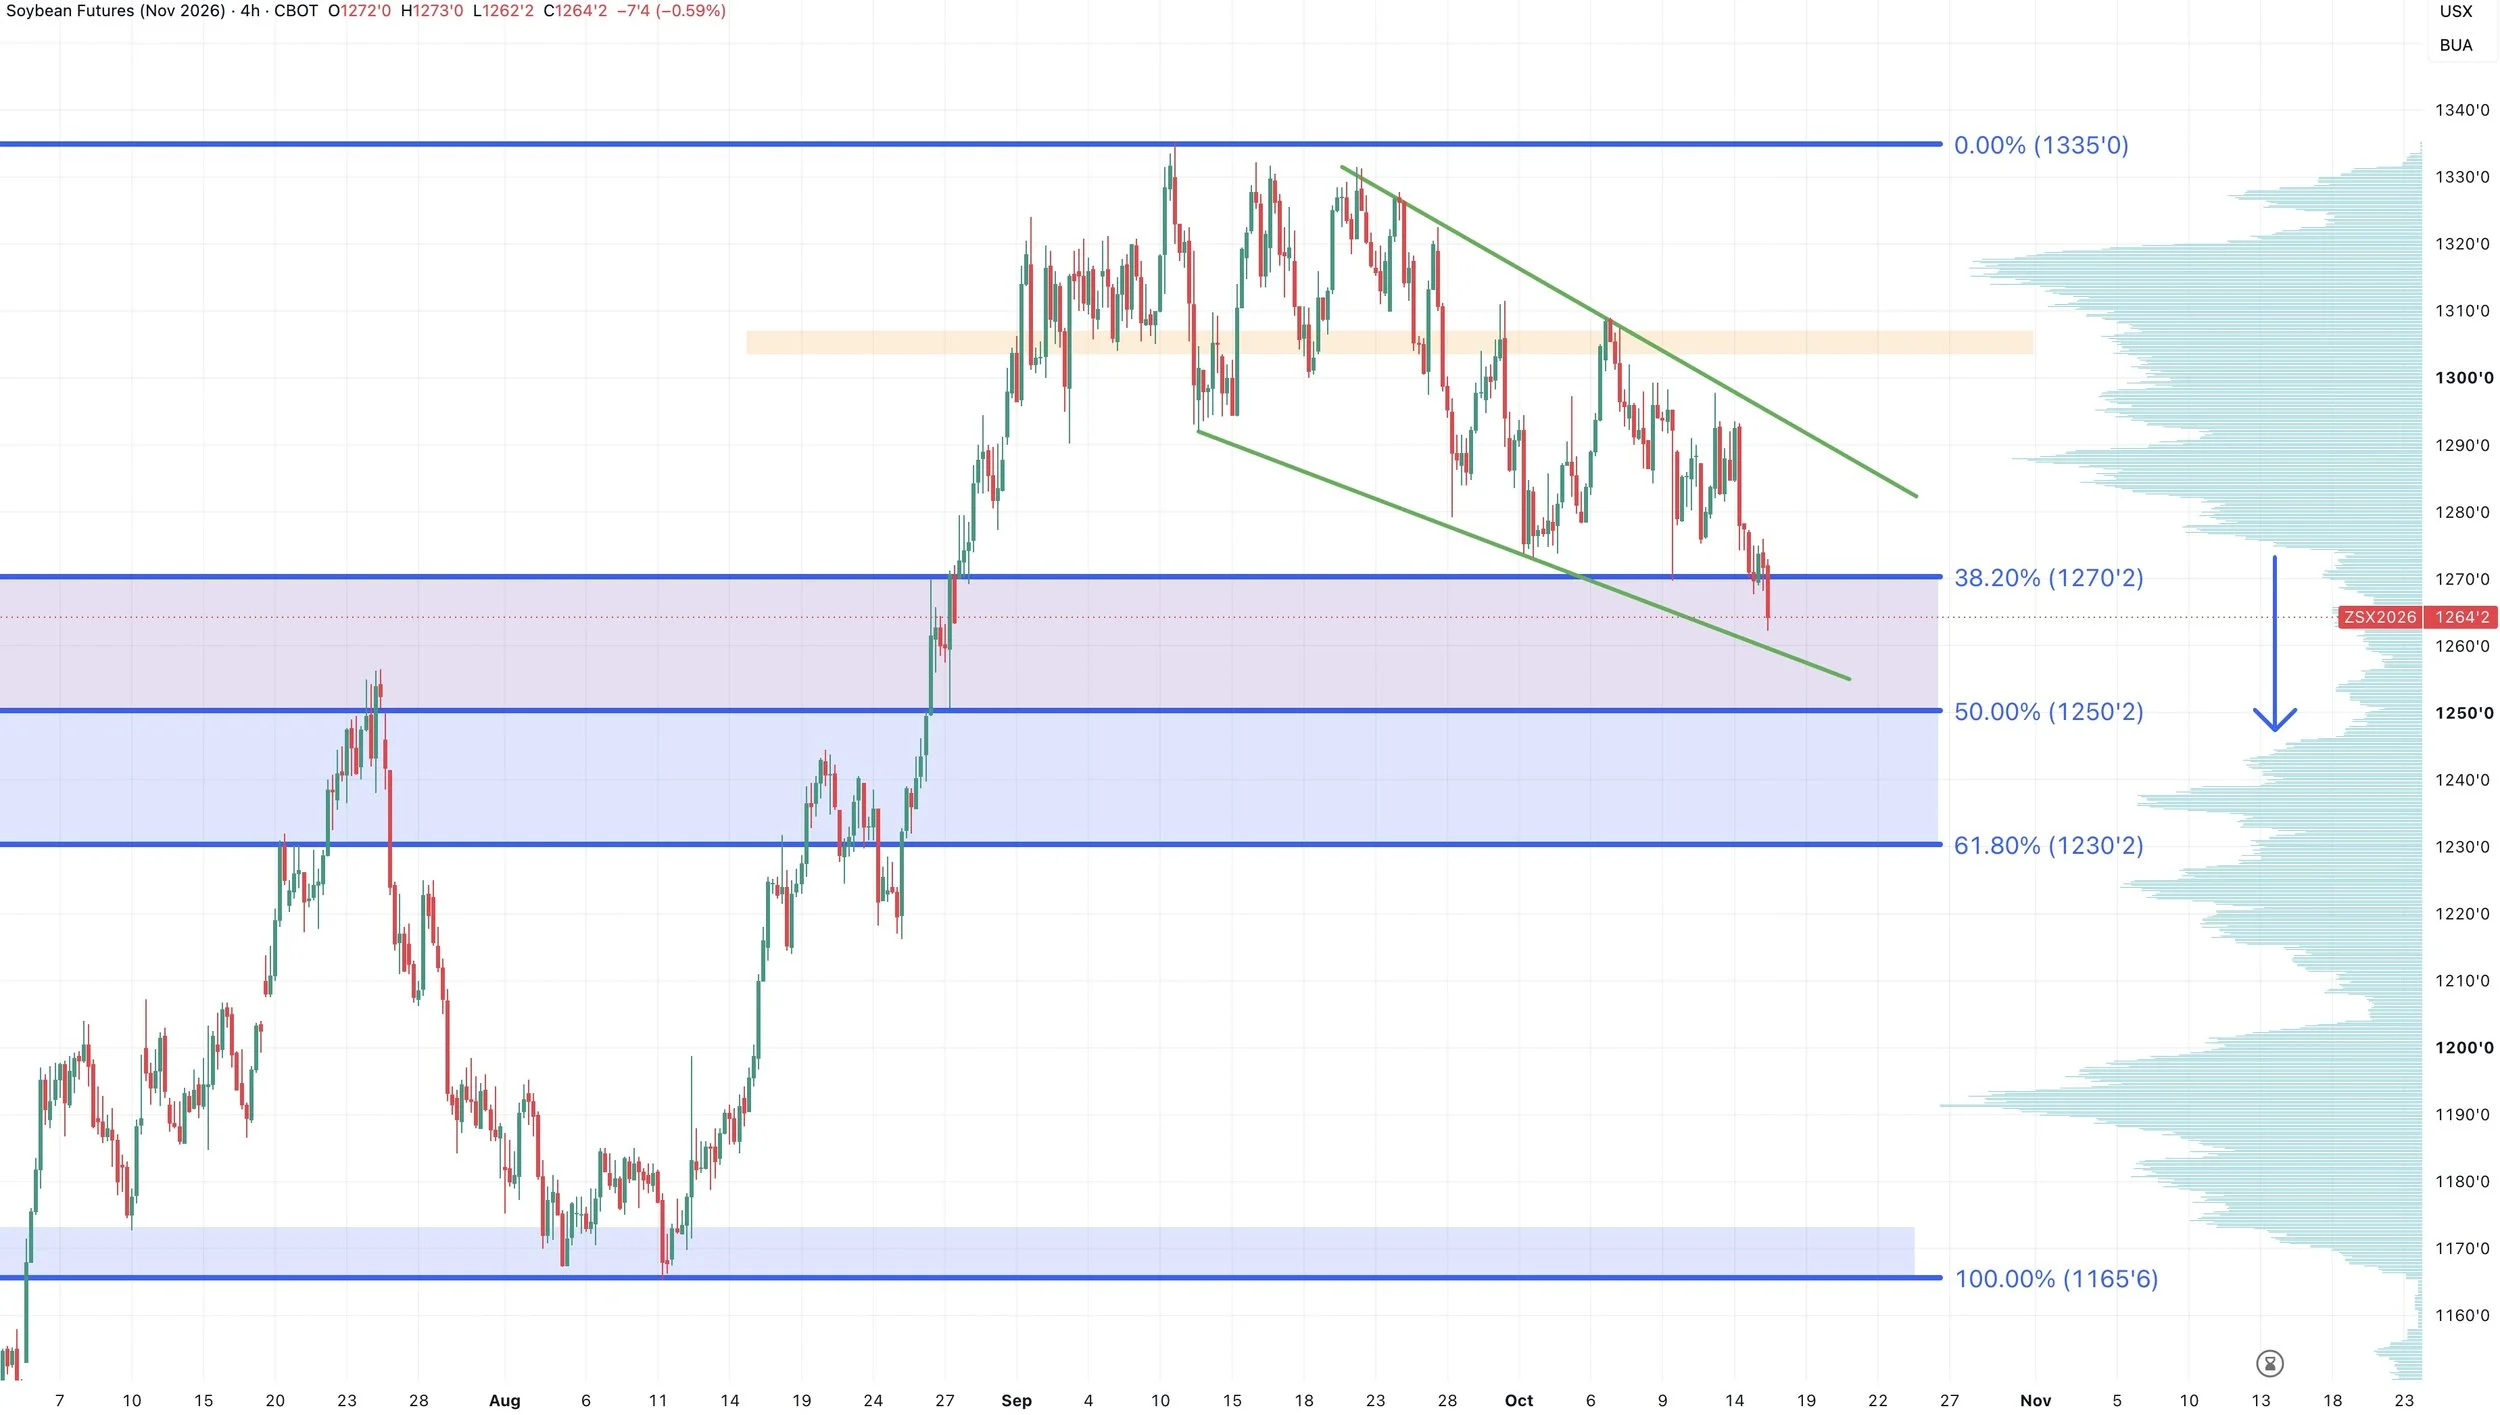
Here is the 4-hour chart for some more visuals.
There is definitely some downside air and risk to the downside from here unless we reverse back above this support fast.
One thing to watch is that downtrend and this wedge pattern. If you are able to break out of the wedge that would be one sign of a bottom.
Want to Talk?
Our phones are open 24/7 for you guys if you ever need anything or want to discuss your operation.
Jeremey & Office: (806)484-1214
Sebastian: (605)280-1186
Email: sfrost@dailymarketminute.com
Hedge Account
Interested in a hedge account? Use the link below to set up an account or give us a call.