
CORN & WHEAT LOCAL BOTTOM?
MARKET UPDATE
You can scroll to read the usual update as well. As the written version is the exact same as the video.
Timestamps for video:
Overview: 0:00min
Corn: 2:45min
Beans: 10:30min
Wheat: 12:00min
Cattle: 14:45min
Want to talk?
Office: (806)484-1214
Futures Prices Close
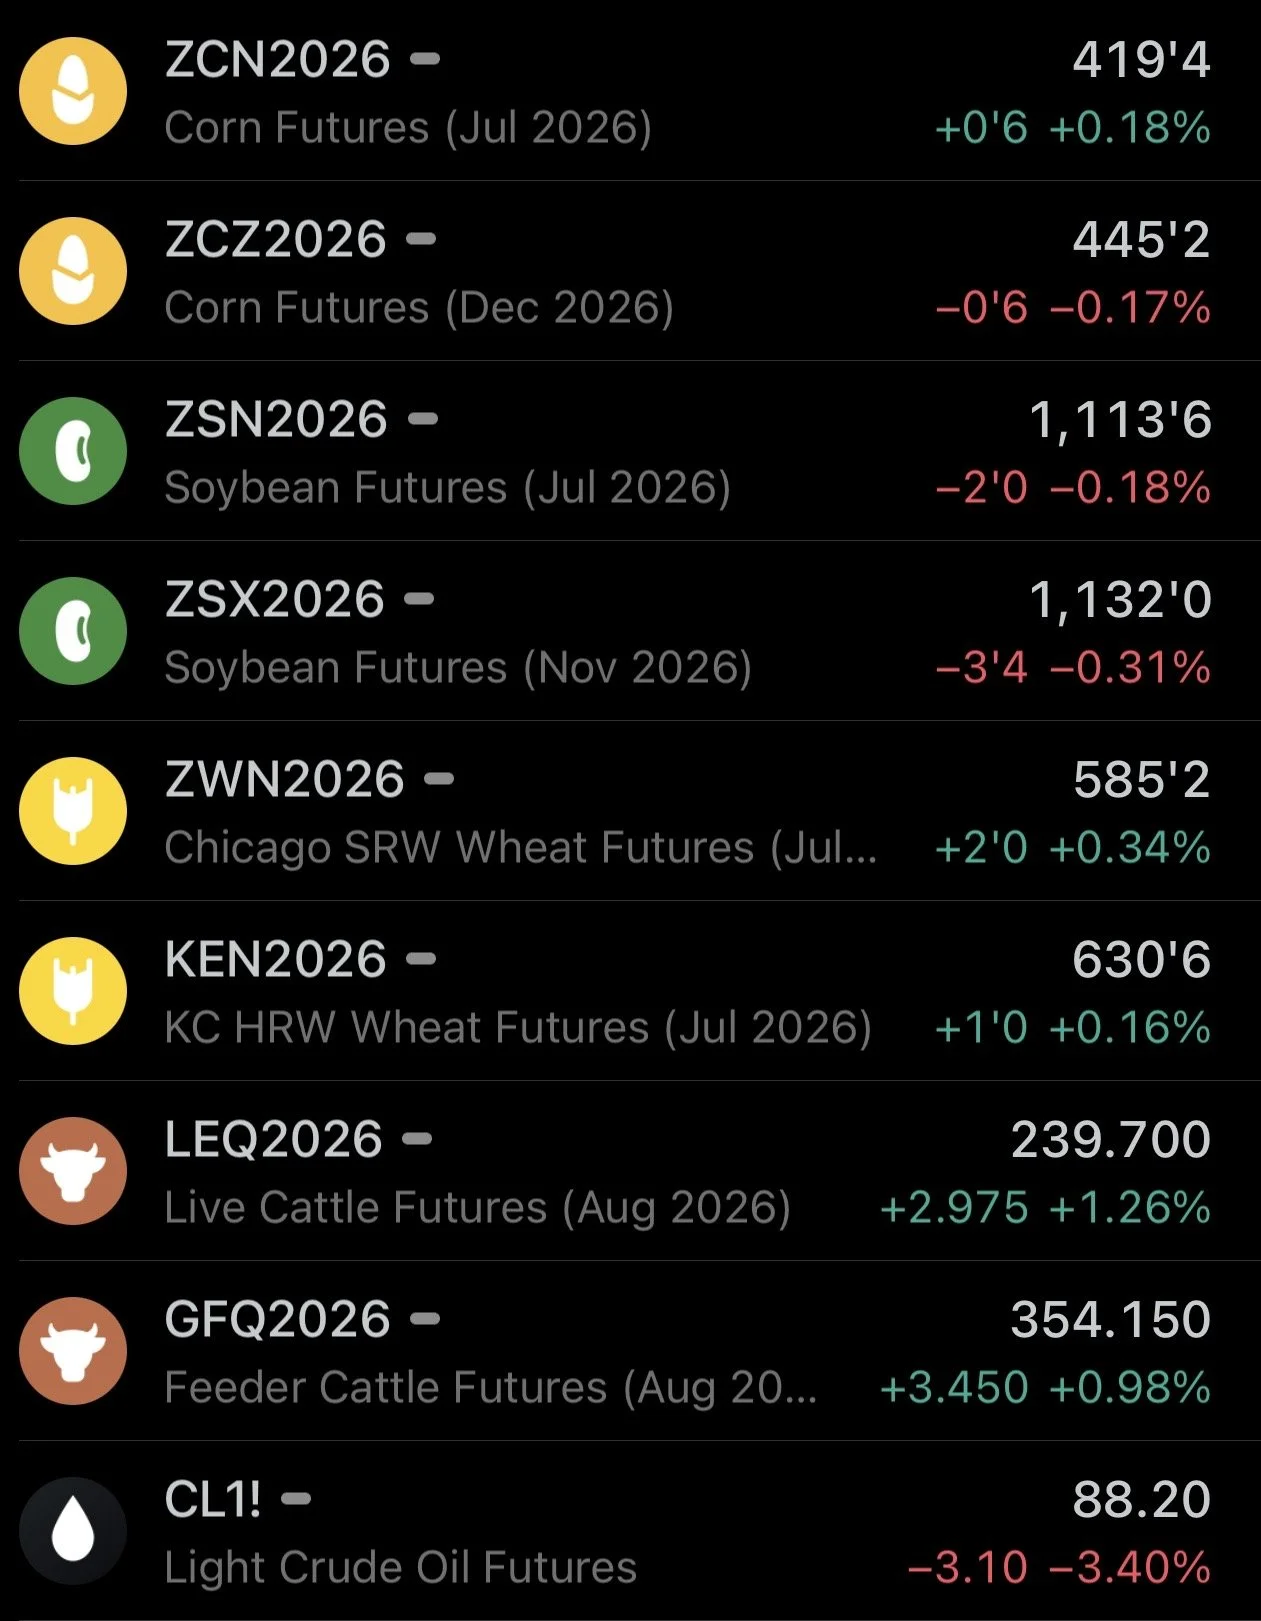
Overview
Grains mixed, with wheat slightly higher and soybeans slightly lower.
It does look like corn and wheat are trying to bounce.
As we put together are first day higher in weeks yesterday. Until yesterday, wheat had traded lower 12 days in a row. With corn lower 6 days in a row.
The markets are still struggling to find any fresh news or a catalyst to get behind.
Planting is over and the market's focus has shifted to weather and crop conditions.
We saw our 2nd round of crop conditions yesterday.
The trade was expecting some improvements, but instead corn remained unchanged and soybeans dropped -1%.
Corn Ratings (G/E)
Today: 67%
Trade Est: 69%
Last Week: 67%
Last Year: 71%
5-Year Avg: 69%
The crop isn’t "amazing" but it's definitely not a concern here or bad enough to get the market excited. As they are just slightly below average.

Soybean Ratings (G/E)
Today: 65%
Trade Est: 68%
Last Week: 66%
Last Year: 68%
5-Year Avg: 66%
Same story here. The ratings aren’t great but aren’t bad either. Sitting right around average.

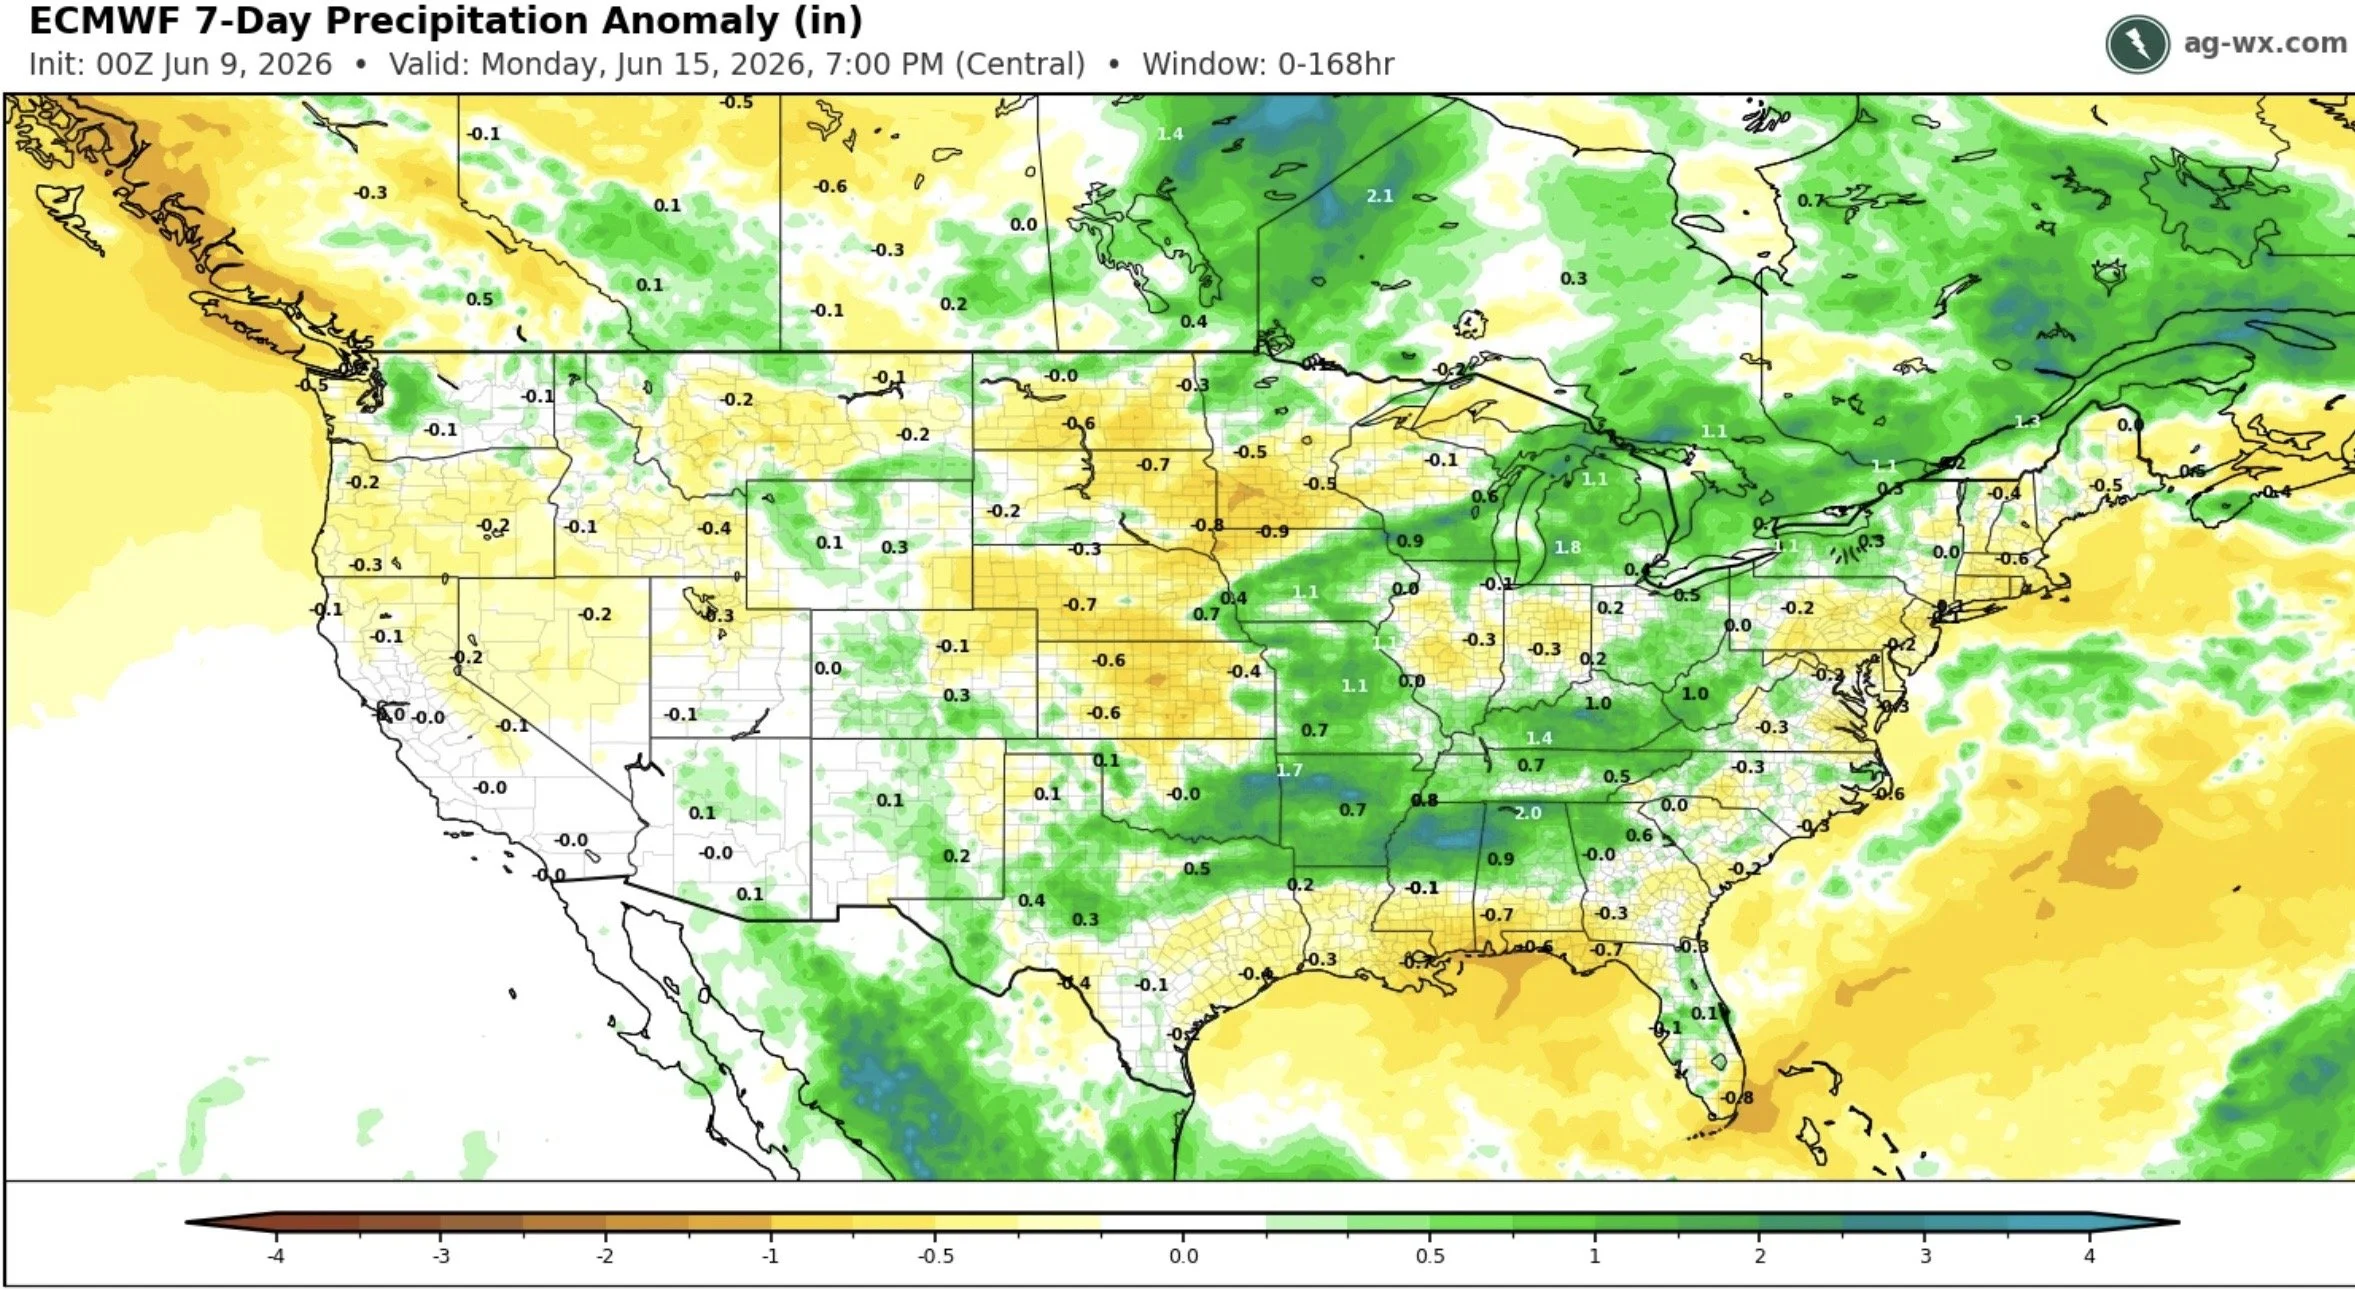
Here are the forecast for the next week.
Plenty of rain in the corn belt overall.
Rain in the middle of June isn’t bullish, so still zero weather concerns for now.
USDA Preview
We've got a USDA report out on Thursday.
Everyone is a lot more interested in the acres and stocks report at the end of the month. Where we will get the updated acres.
But how big of a market mover is this report usually?
Here is July corn's price changes for the day of this report over the last 20 years.
We've only moved double digits twice over the last 14 years.
So it's not usually a big mover.
Something to note is that corn has managed to trade higher the last 8 of 9 years on the day of this report.

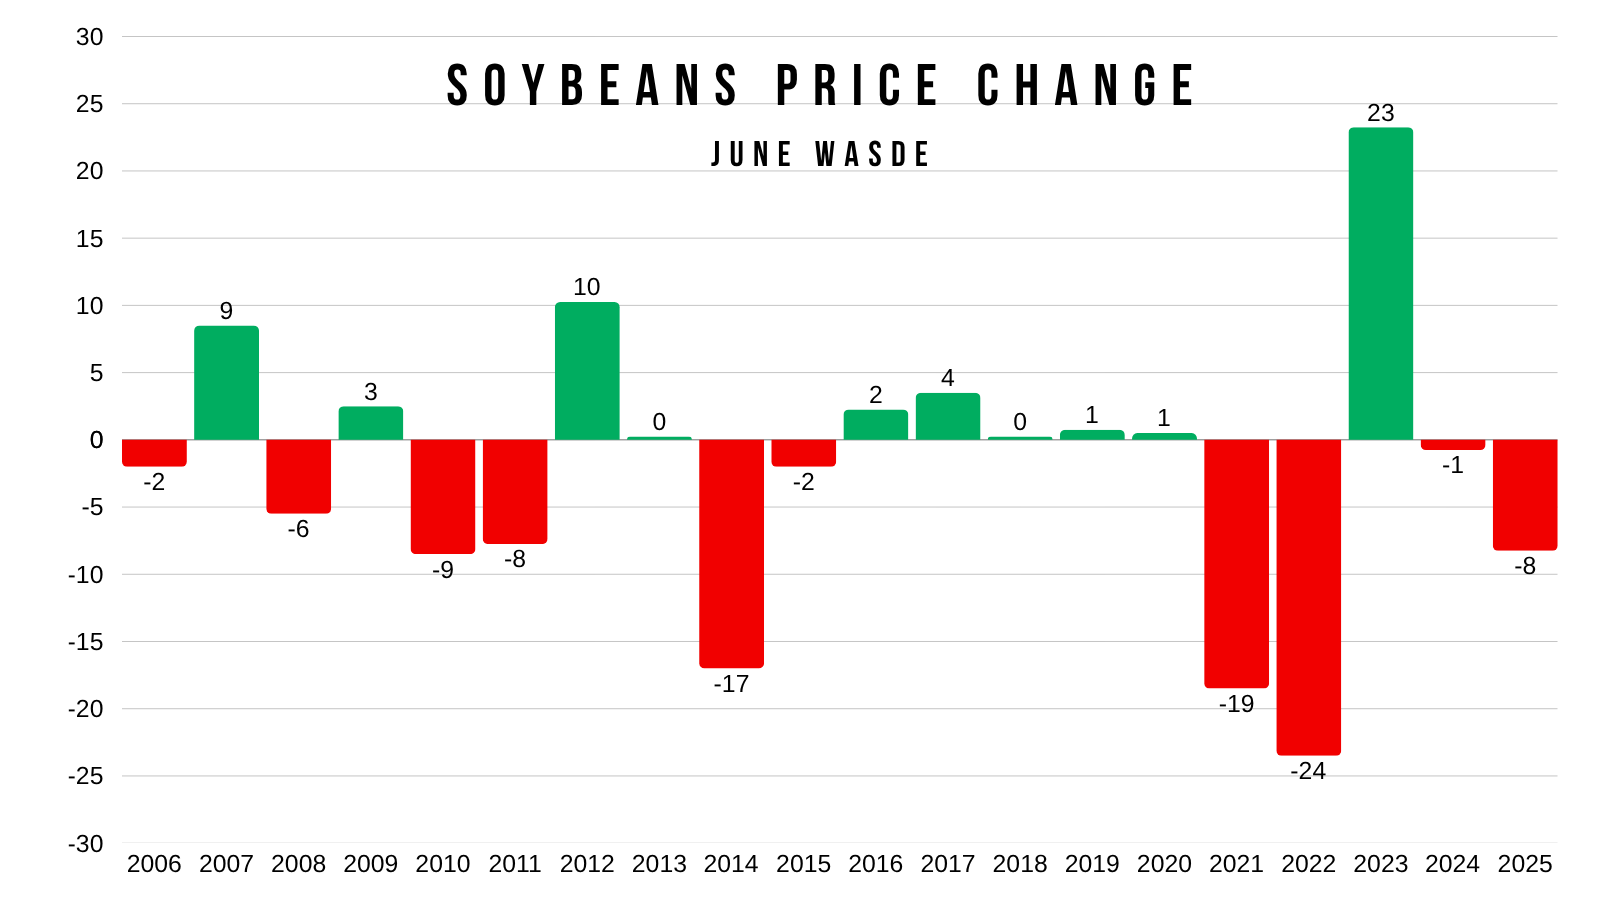
Here is July soybeans for the day of this report.
Sometimes it can move the market, but there are several years where soybeans moved less than a nickel.
Such as 6 years straight from 2015 to 2020.
So again, also not usually some major market mover.
In the last 20 years, beans have only moved 20 cents twice. In back to back years.
Here is the pre-report estimates.
The trade is also not expecting very big changes. As they are basically expecting carryout to remain unchanged across everything.
New Crop Corn Carryout
Average Guess: 1.942
Range Guess: 1.471 to 2.119
May USDA: 1.957
New Crop Soybean Carryout
Average Guess: 0.314
Range Guess: 0.266 to 0.399
May USDA: 0.310
New Crop Wheat Carryout
Average Guess: 0.760
Range Guess: 0.704 to 0.804
May USDA: 0.762

Today's Main Takeaways
Corn
When do we typically post our lowest price of the year?
Does it ever happen in June?
Here is the data for the last 20 years.
The lows are dominated by August and September.
We've only posted our lowest price of the year in June one time.
Is corn due for a bounce? Yes.
However, the data says the overall risk is still lower. So this will be a bounce that will be look to be rewarded.

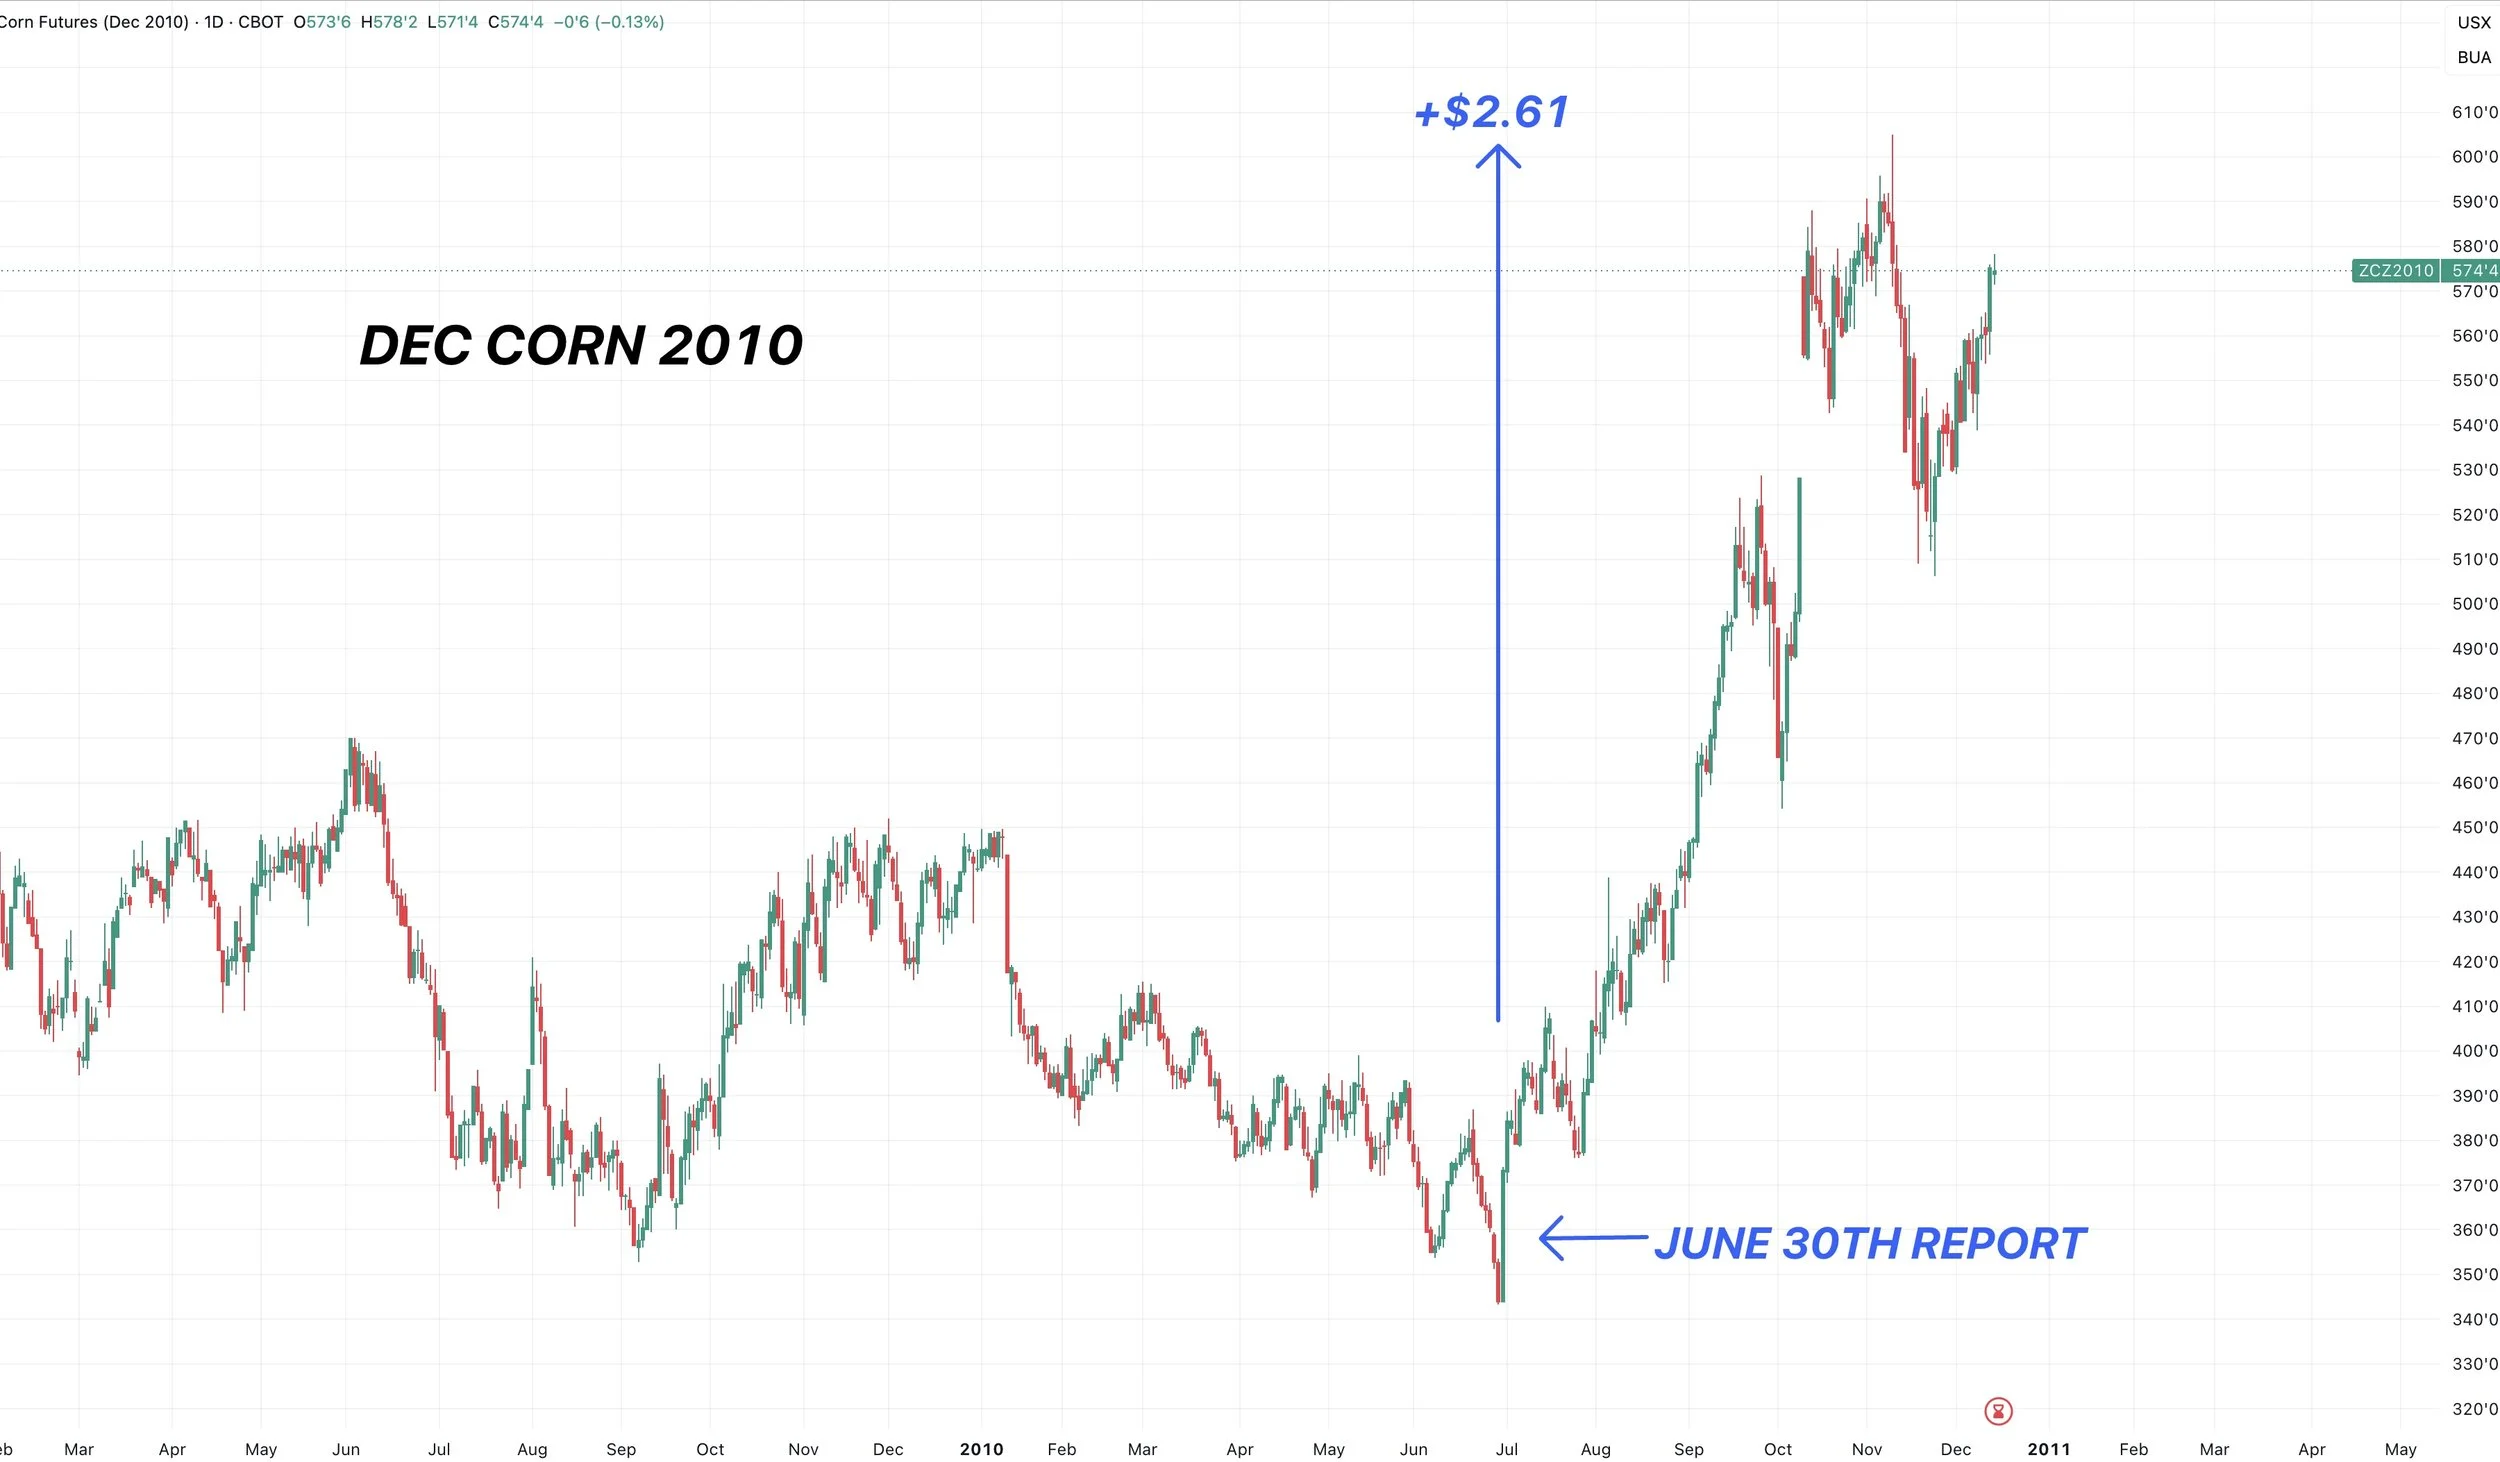
The only year we ever bottomed in June was 2010.
Where we bottomed on the day of the USDA acreage and stocks report on June 30th.
As it provided a massive bullish surprise that ultimately led to the market rallying from $3.40 in June to $6.00 by October.
The point is, June lows are very uncommon unless it happens in some anomaly year such as this one.
If we look at the last 10 years of data, it becomes even more defined.
As August and September dominate even heavier.
Over the last 10 years, it's came in August or September 70% of the time.
Coming in August 40% of the time, and September 30% of the time.
Something I found interesting when looking at the years where we continued to fall into the end of the year, both occured during summer weather scare years (2023 and 2017).

I've shown this multiple times the last month or two.
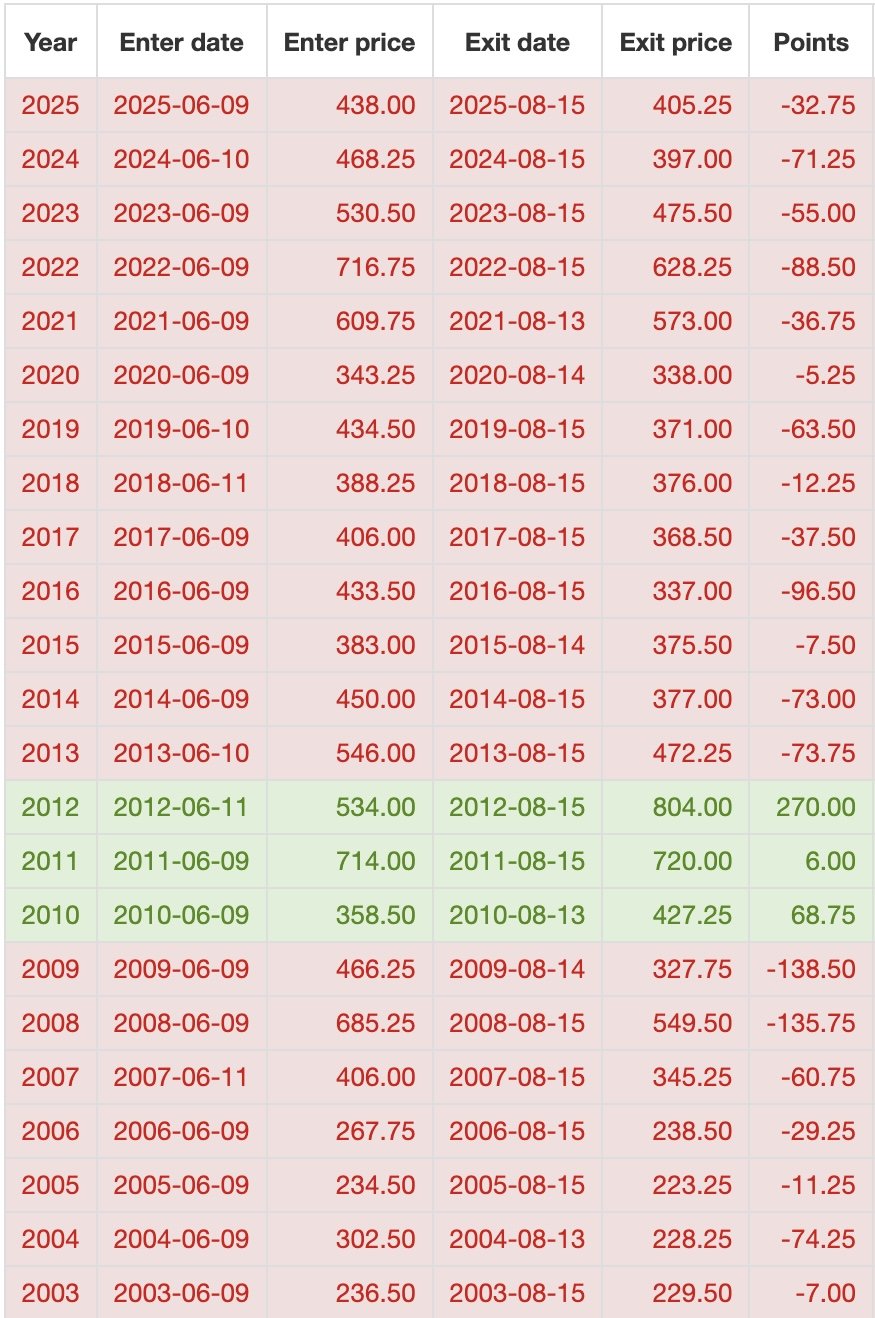
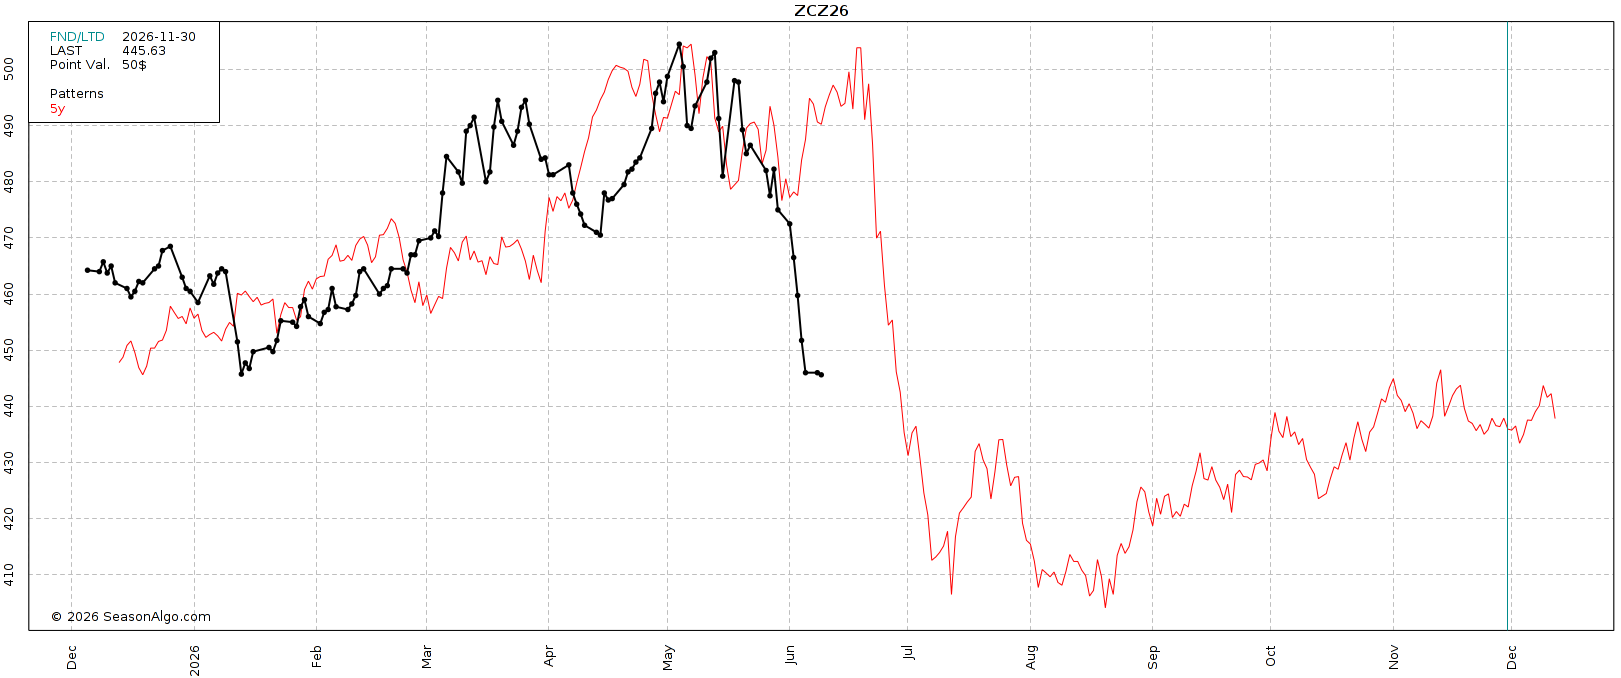
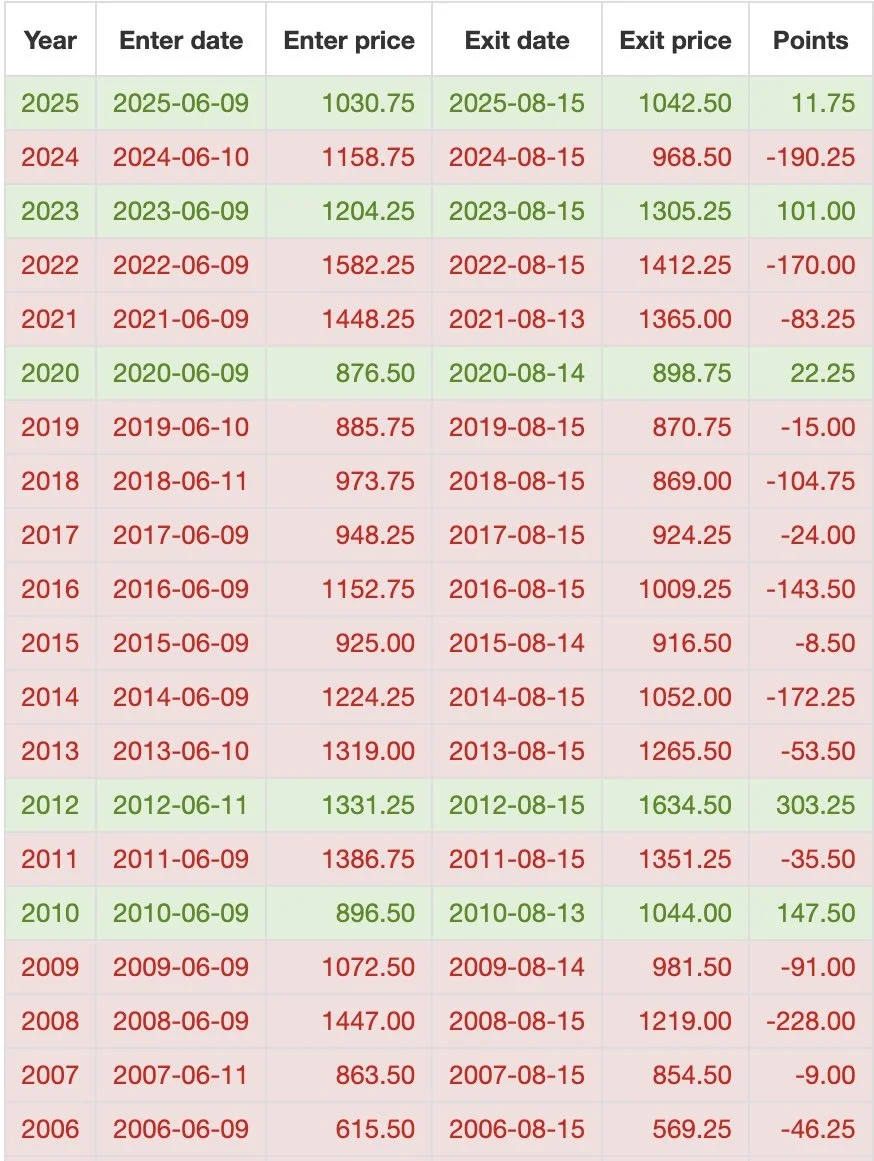
Here is the updated seasonal data from today by August 15th.
Lower the last 13 years in a row.
Lower 20 of 23 years.
That is a strong seasonal tendency you can’t ignore.
This doesn’t mean we cannot bounce first, it simply means if we get a bounce, we will more than likely post new lows by August.
So a bounce will probably want to be protected if it comes.
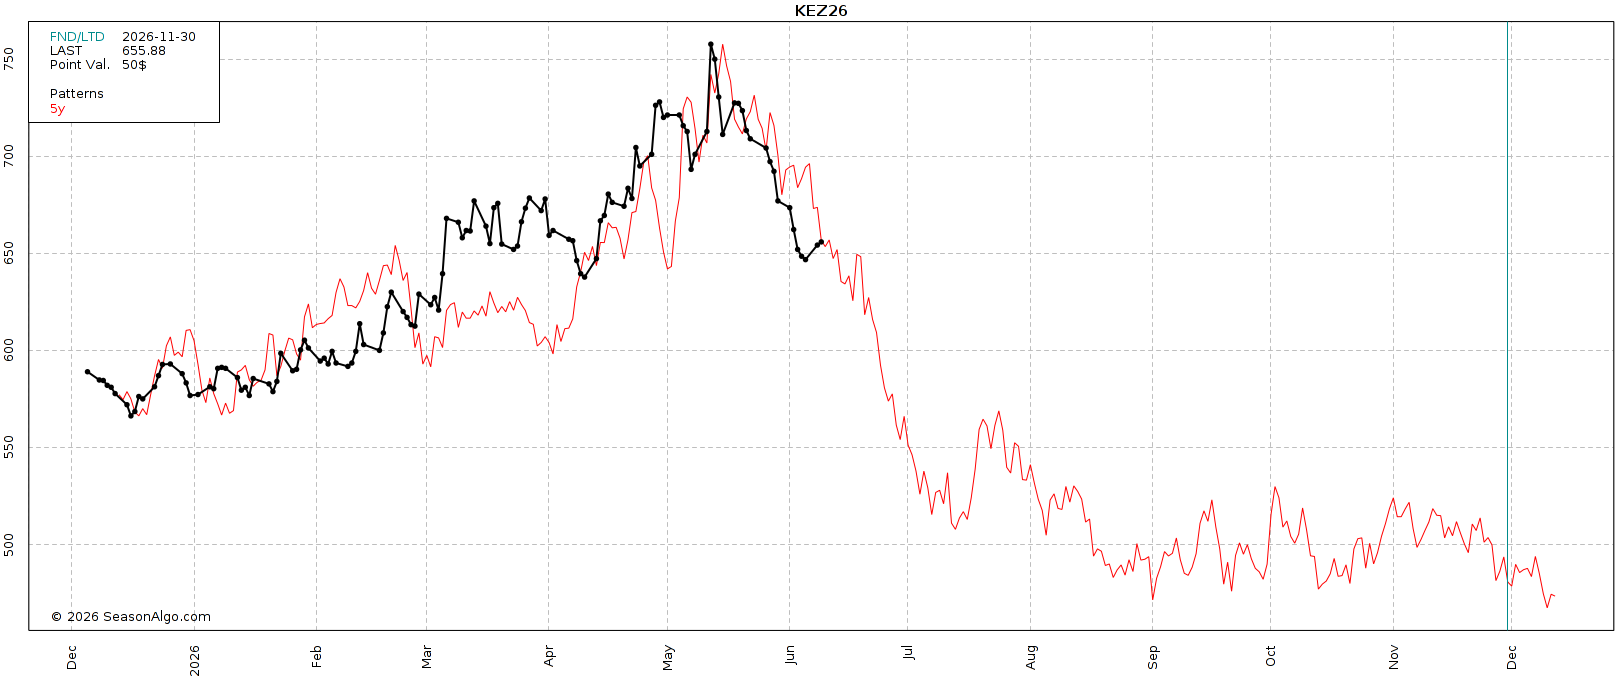
Below is the seasonal sell offs over the last decade for Dec corn.
They vary from year to year, but on average it has been around a 20-25% drawdown.
So far, Dec corn has already fallen 13% off it's highs.
Which means corn has already fallen over half of what we usually do in the entire seasonal sell off in just a few weeks. It's only June 9th. That seasonal pressure usually lasts until August to September.
This could mean two things:
A) This sell off is likely over done short term. As we just went through half of what the usual multi-month sell off brings in just two weeks. Meaning we are oversold.
B) The data would suggest that this might not be a true bottom, as we typically fall further by the time harvest rolls around.

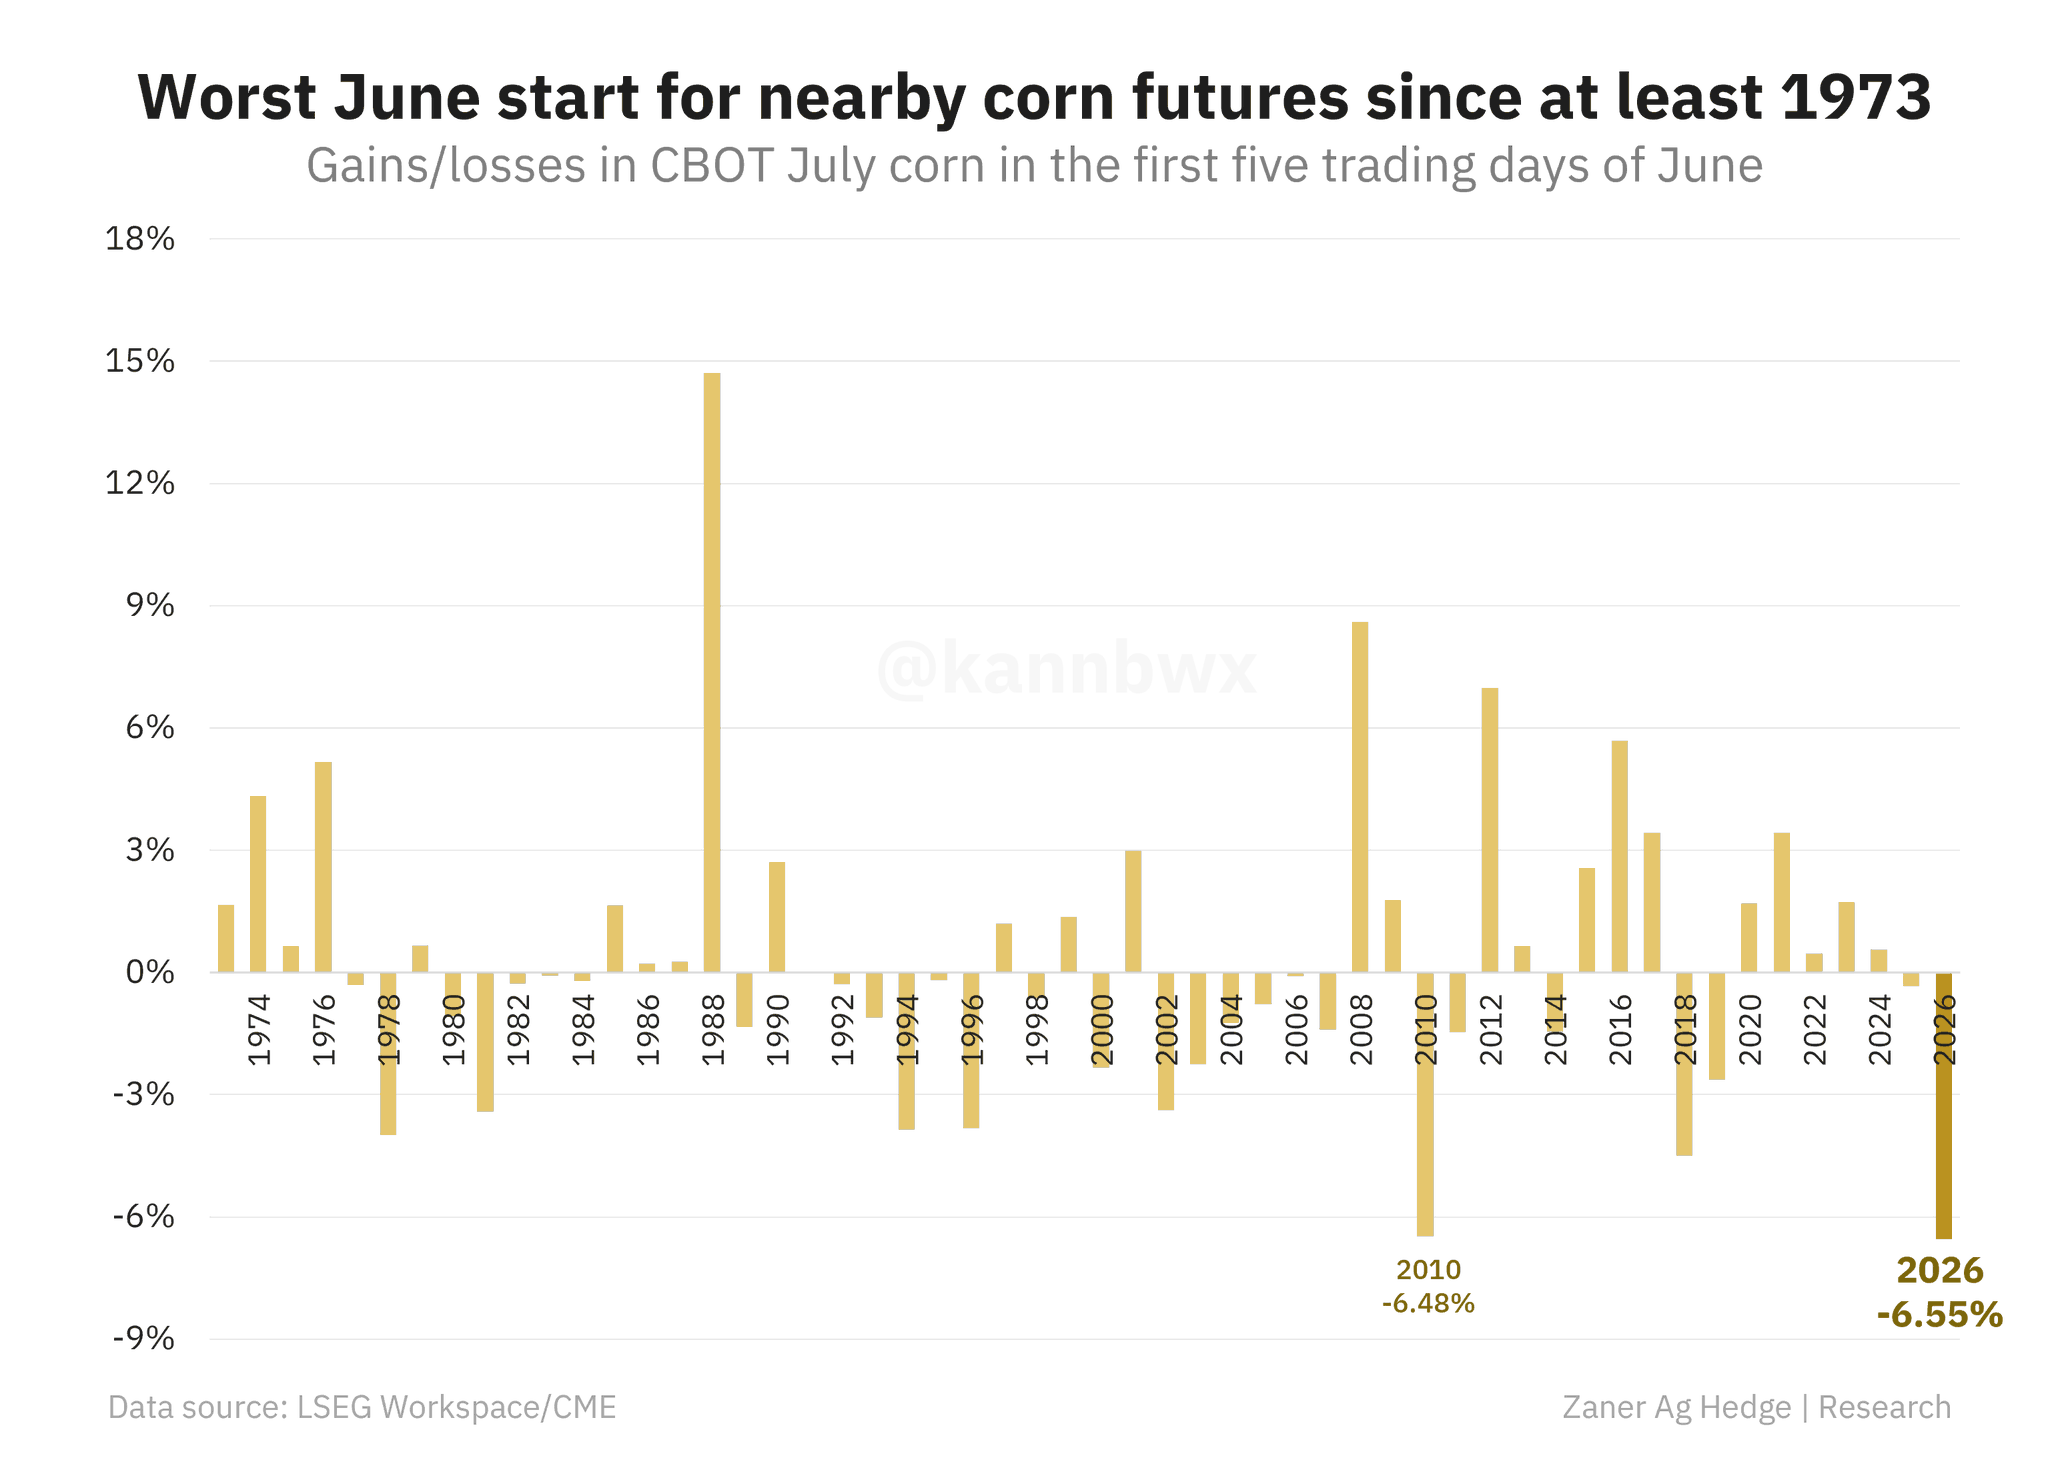
Here is a good chart from Karen Braun (@kannbwx on X).
This was the worst start to June ever for the corn market.
The 2nd worst was 2010.. maybe that's a coincidence.. maybe it's not. As that’s the only year we bottomed in June.
I guess we'll have to wait and see if we a bullish acre report like we did then. But that's impossible to know.
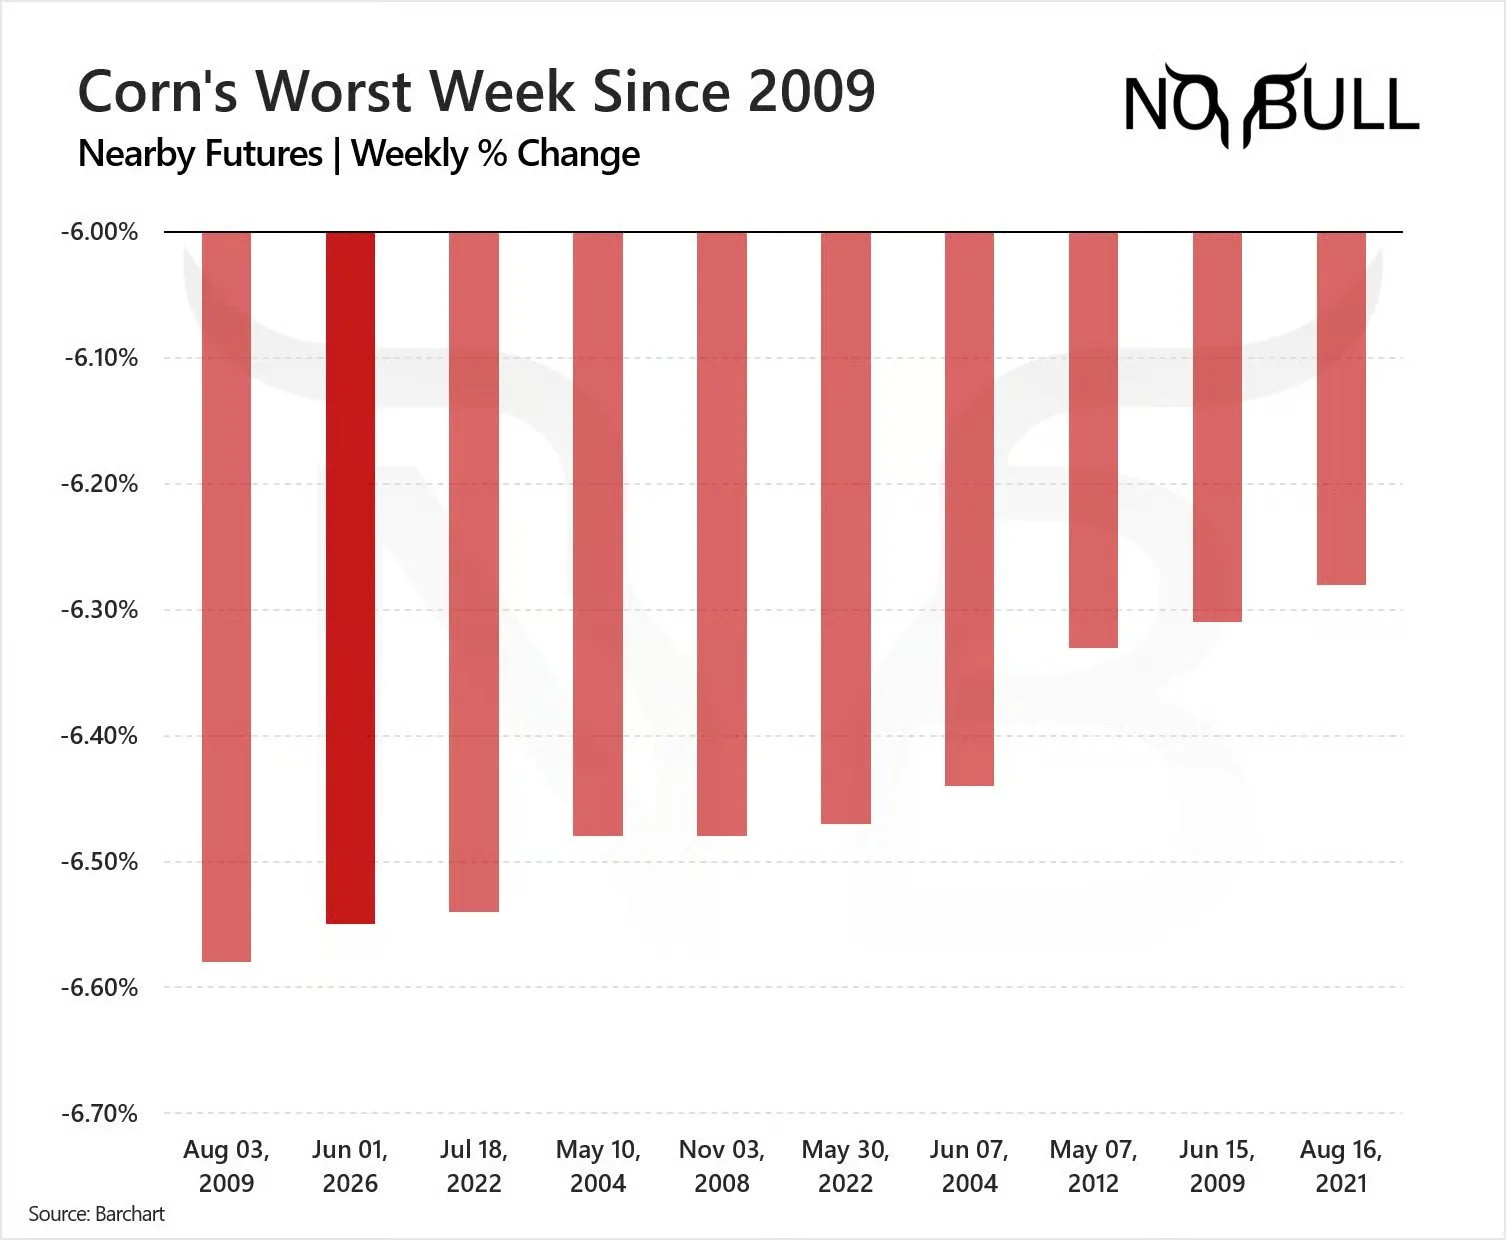
Here is another good chart.
This one is from Susan of NoBull Ag (@susannobull on X).
Last week was corn's worst week since 2009.
So the point is, this downside move in corn is probably overdone, given we fell this hard this fast.
The funds have sold plenty of corn.
Fundamentally, nothing has changed since those highs aside from weather remaining unthreatening.
And the funds went from mega long to a more neutral position.
If we look at the funds positioning over the years, they have tended to stop hitting the sell button around the start of July over the last few years.
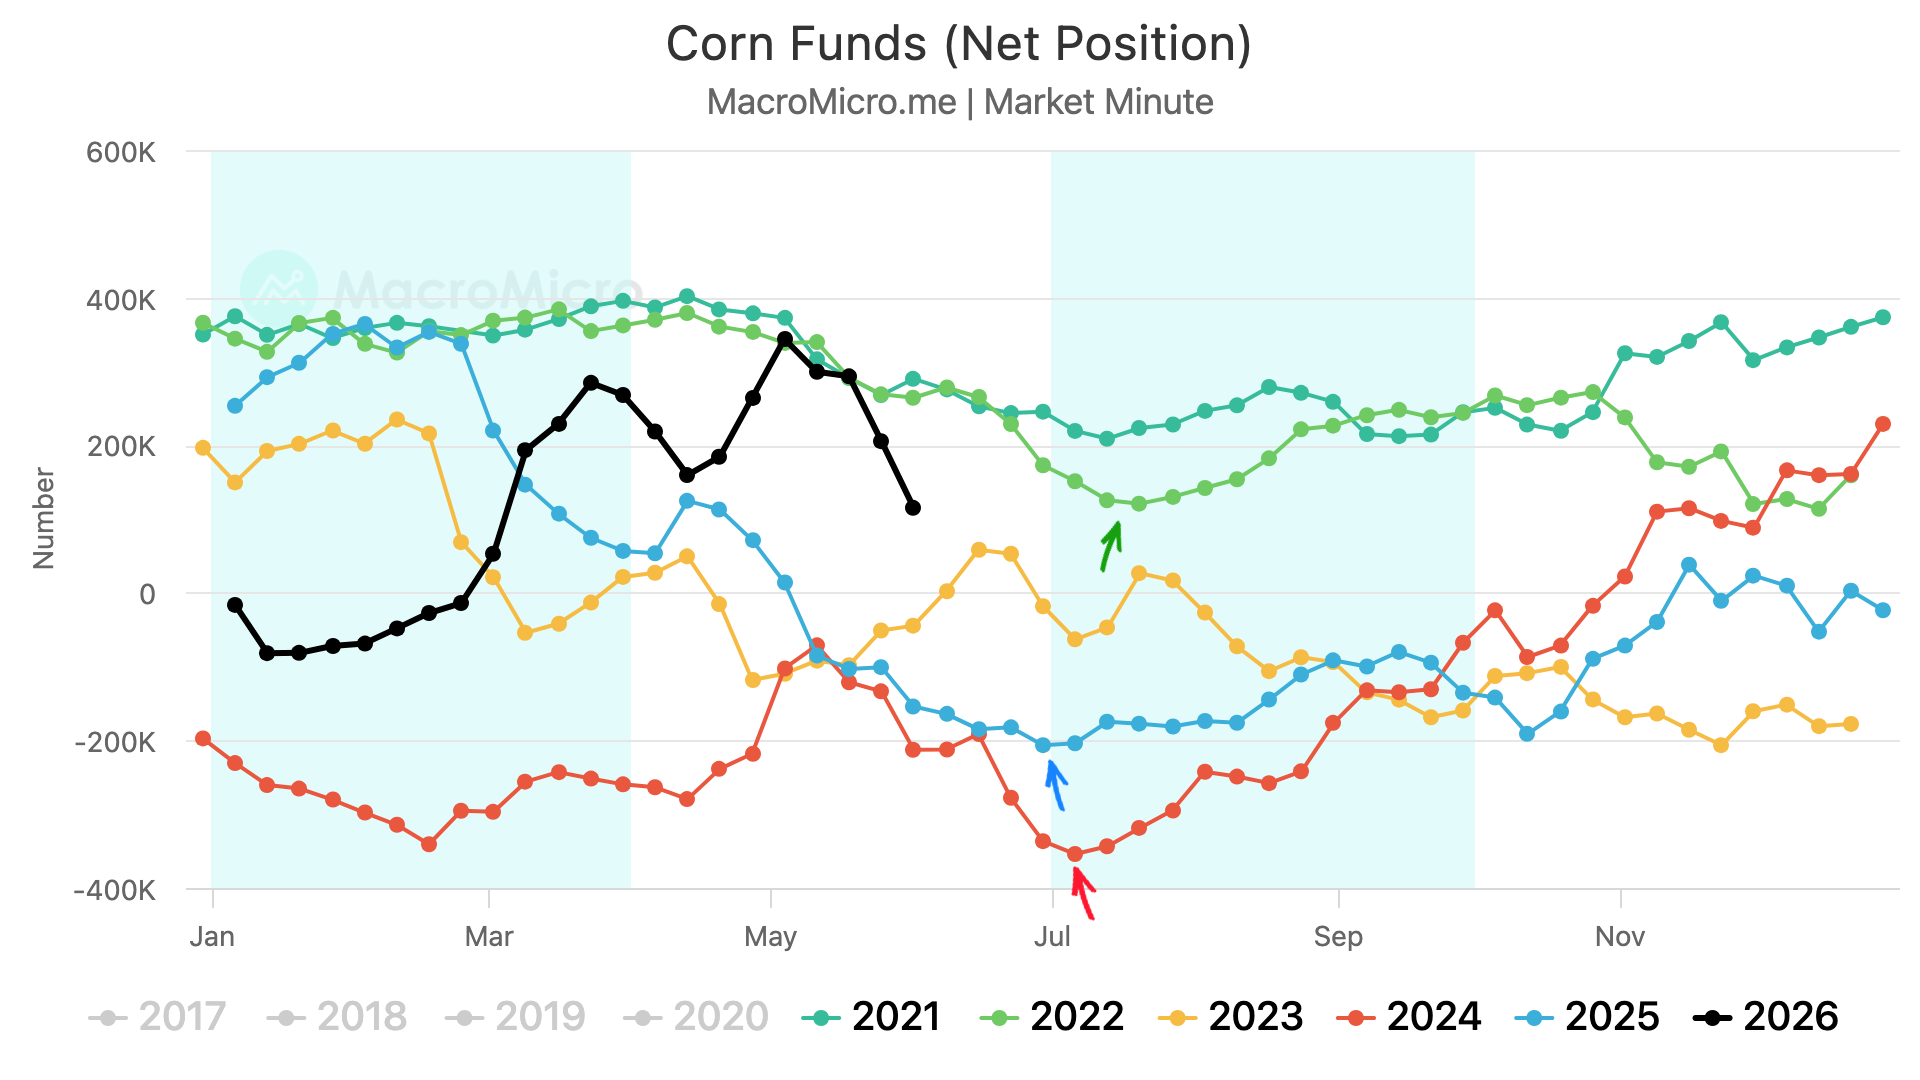
Which also lines up with the 5-year seasonal pattern.
We typically falll hard going to July, but then the pressure lightens up.
Before carving out a real bottom in August.
Bottom Line:
Yesterday there was rumors that China said they aren’t looking to buy our grain until around September.
As we've talked about for a long time, that is when it logically makes the most sense for them to buy.
They will buy eventually.
It just probably doesn’t happen until harvest.
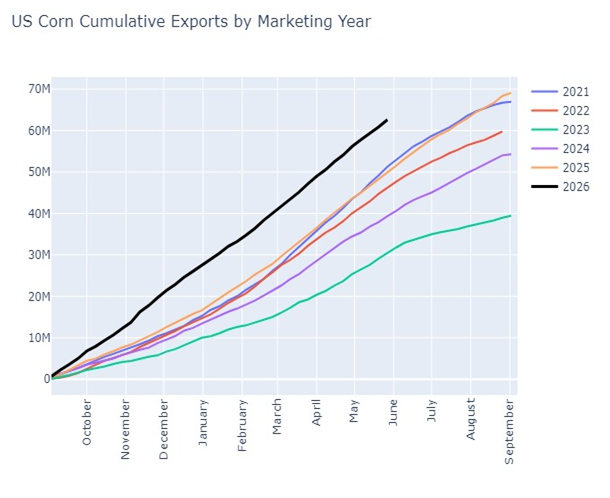
But ask yourself what happens when China buys.. and demand is already the best it's ever been without them?
China could absolutely flip this market right around later this year.
Chart Credit Robert Mcclure (@mcclure_trades on X)
That along with the inflation and fertilizer story is why I remain bullish on corn LONG term heading into next year.
The crop still isn’t made.
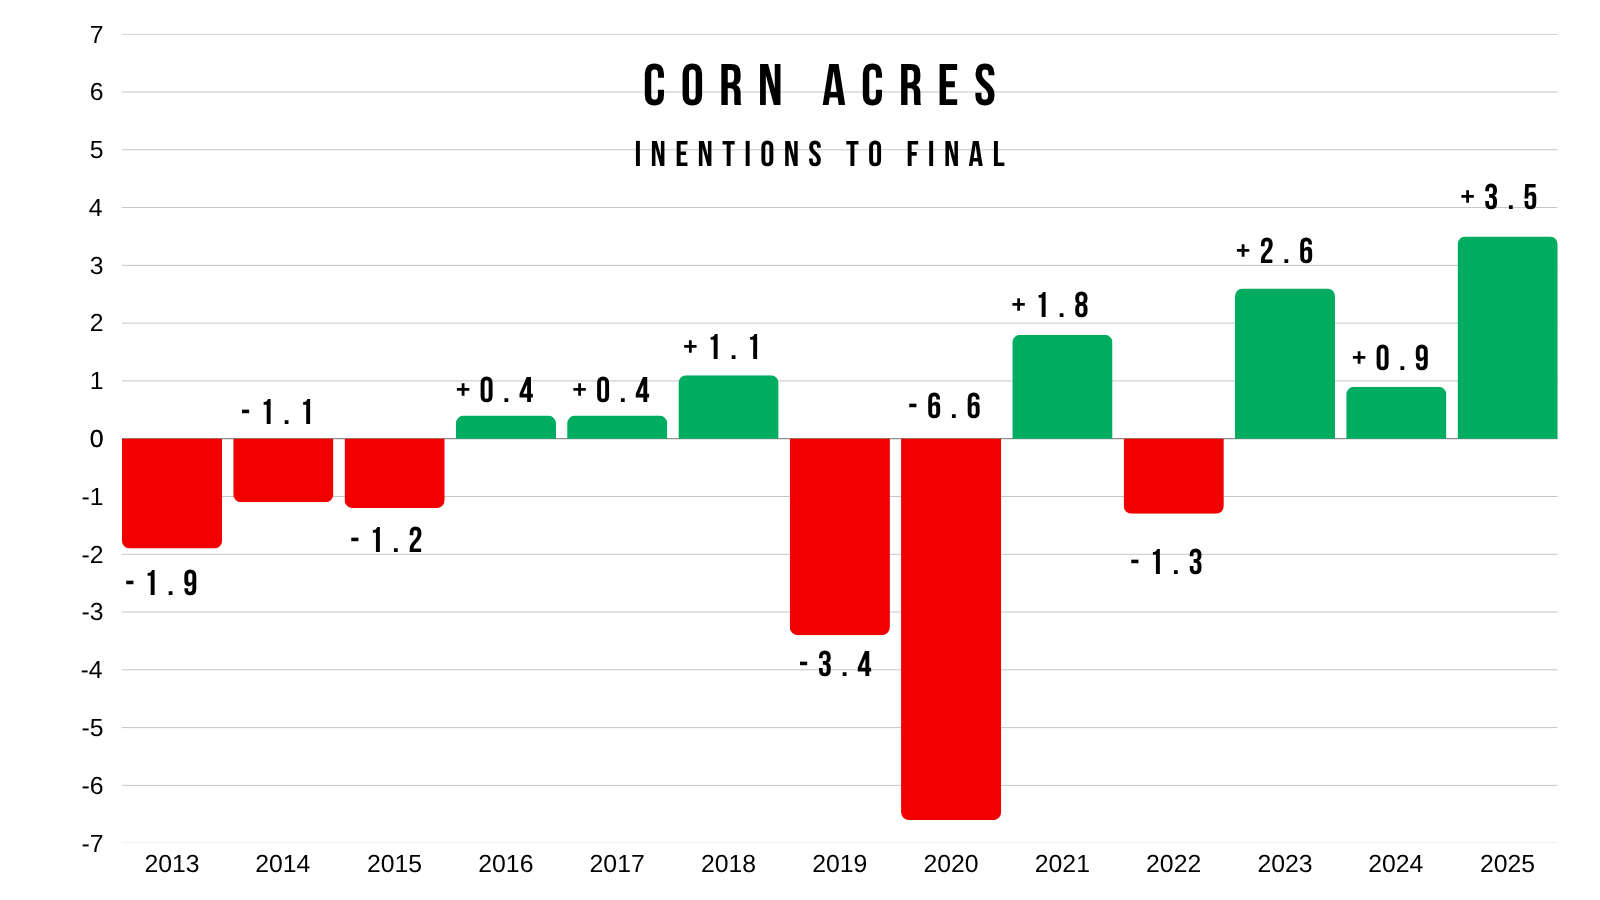
We still have no idea how these acres will turn out, but I imagine corn loses a few when it's all said and done.
Not to mention the fertilizer issue, but the USDA's initial estimate hasn’t come within 1 million of the final number in years.
Short term, there isn’t a real fundamental reason to rally hard without that rally eventually being sold. Unless weather turns bullish or China steps in now. But neither of those seem that probable today.
Corn Charts
Where could the harvest lows be?
First, let's look at the front month chart.
Currently, we are at some major support.
We've given back 61.8% of the entire rally since last year's harvest lows. The most common retracement level.
If you notice, there isn’t much support beneath this level.
So bulls would like to see us find some life here, and it would make sense to do just that.

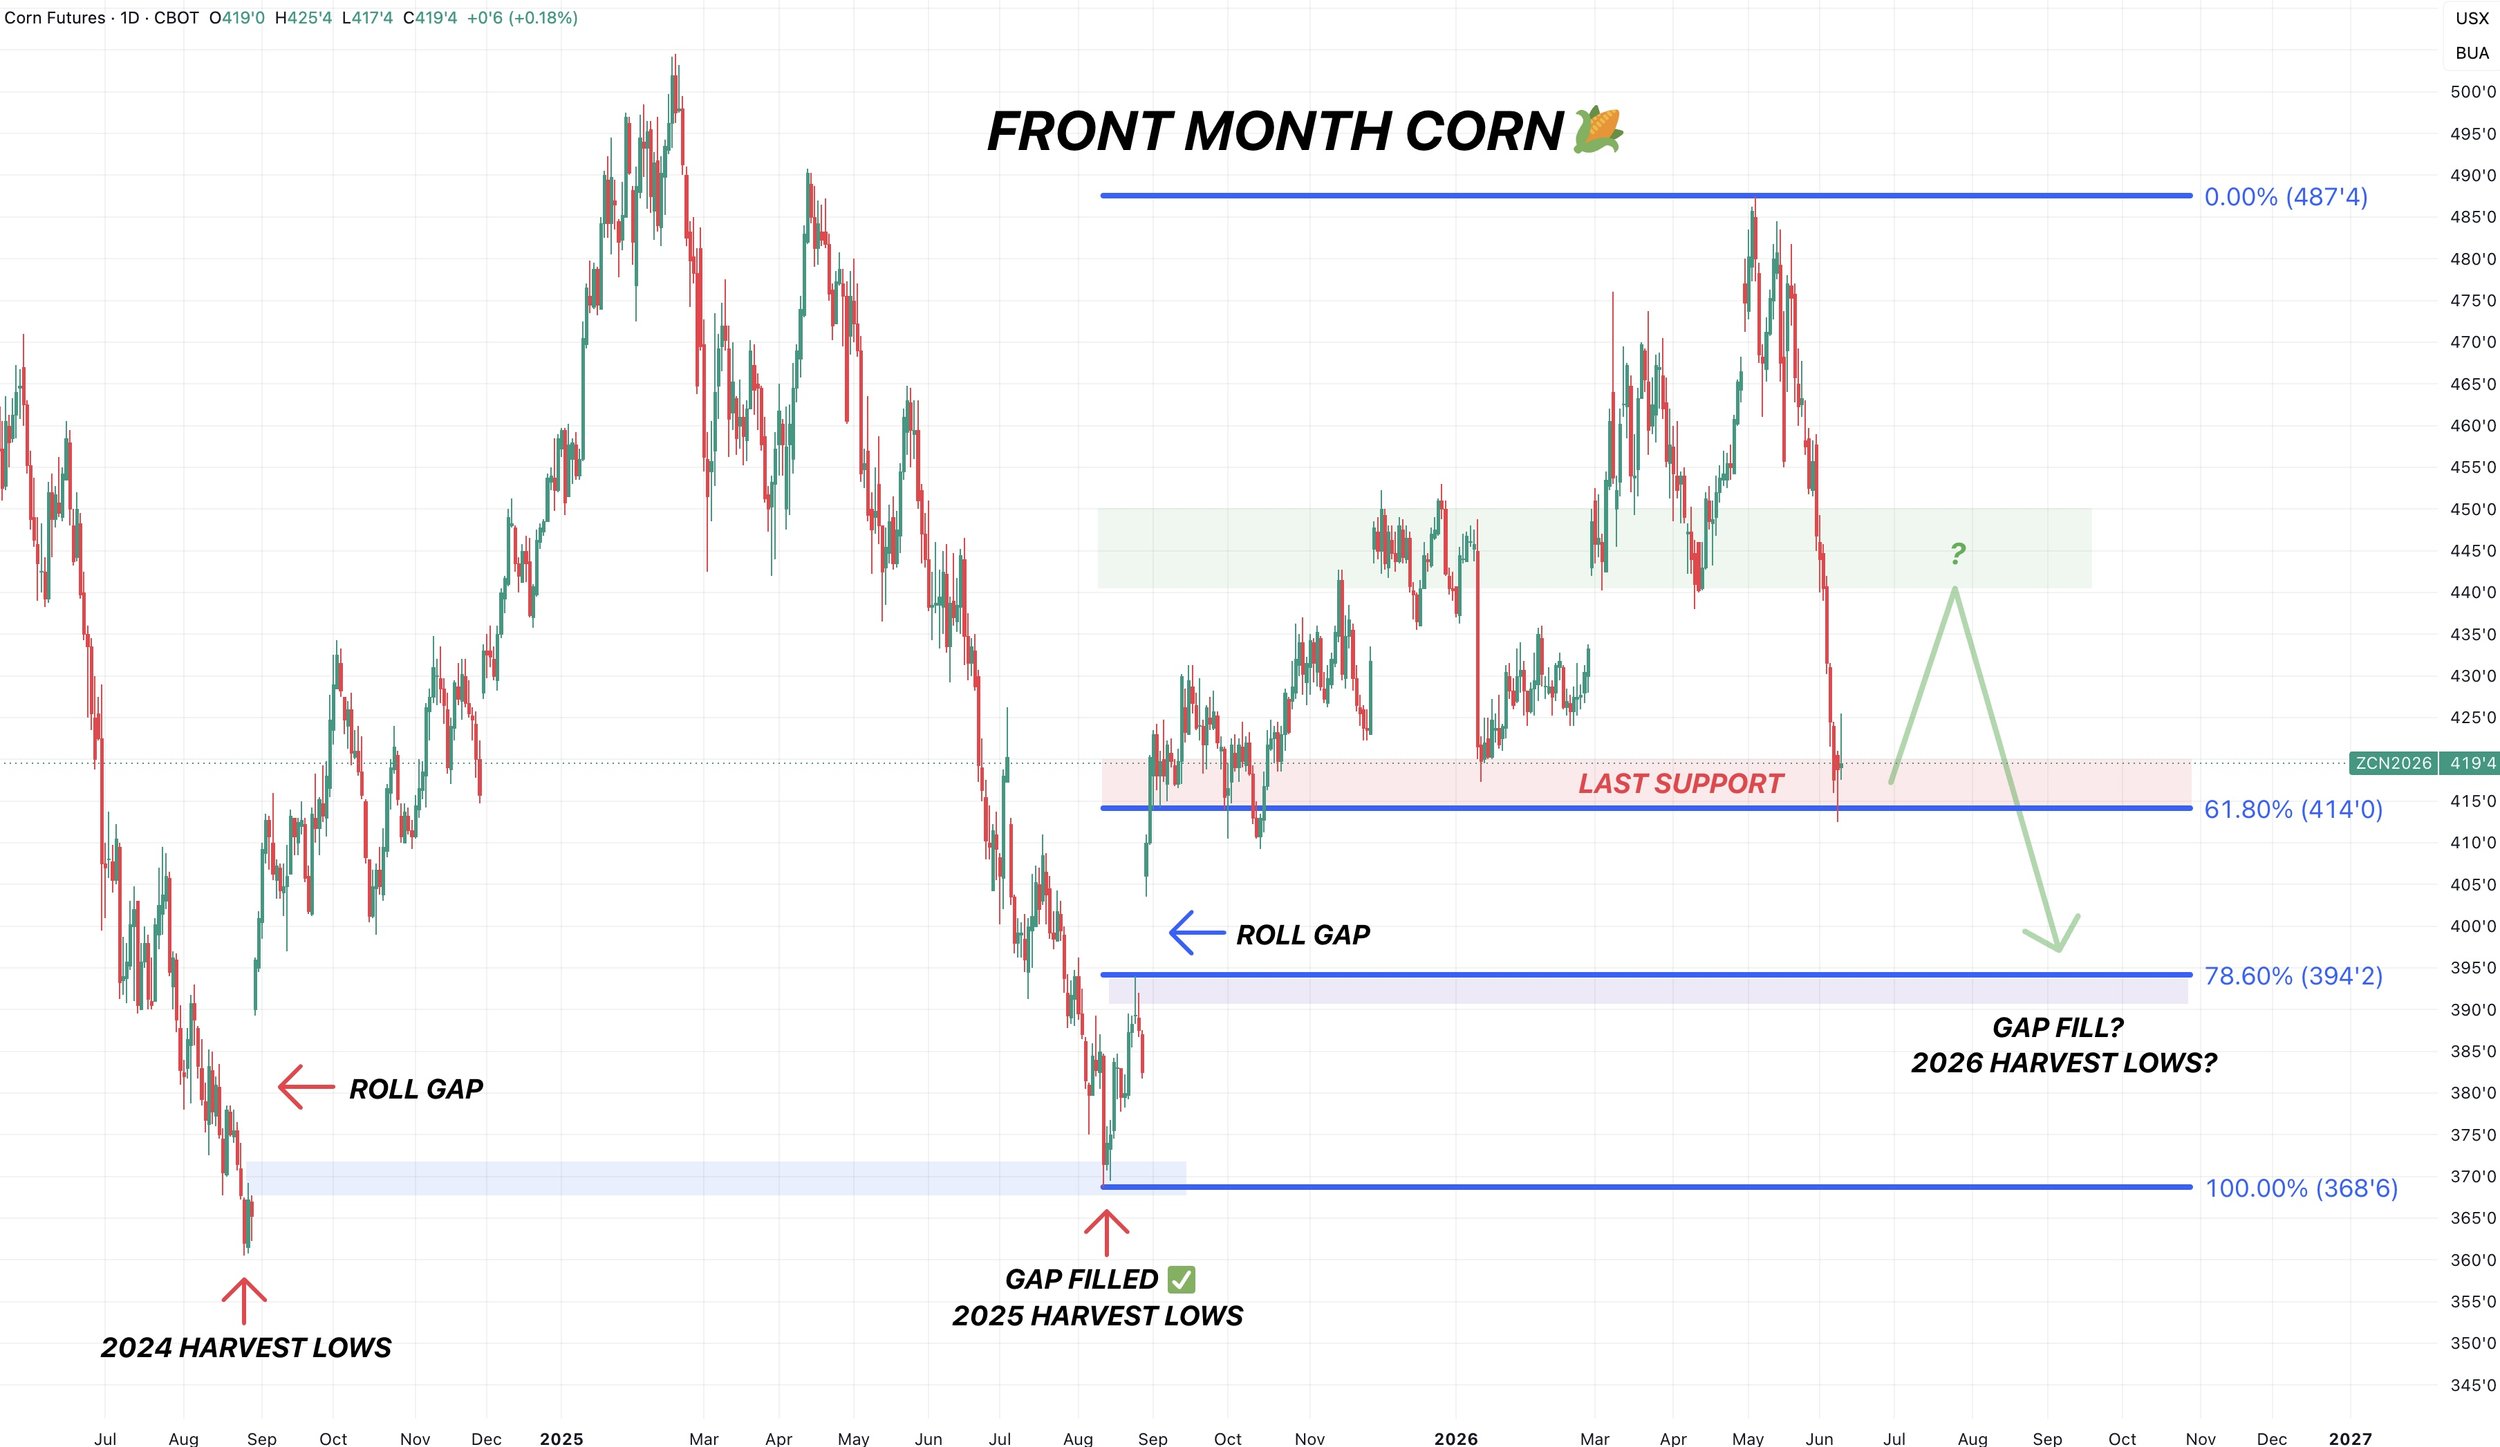
As for where could the actual harvest lows be, here is the front month chart once again.
In 2024, we left a roll gap after posting the harvest lows.
That gap was at $3.68
In 2025, we posted our harvest lows at $3.68. Perfectly filling that gap.
In 2025, we then left another roll gap, this time at $3.94
That $3.94 level is also the next retracement level (78.6% retracement down to the harvest lows) if we break this 61.8% level we are currently sitting at.
So that is going to be an area of interest and where I could possibly see us posting our lows.
But as mentioned, bouncing here first would make sense.
I outlined the rough possible path I could see playing out.
We will come back to chart.
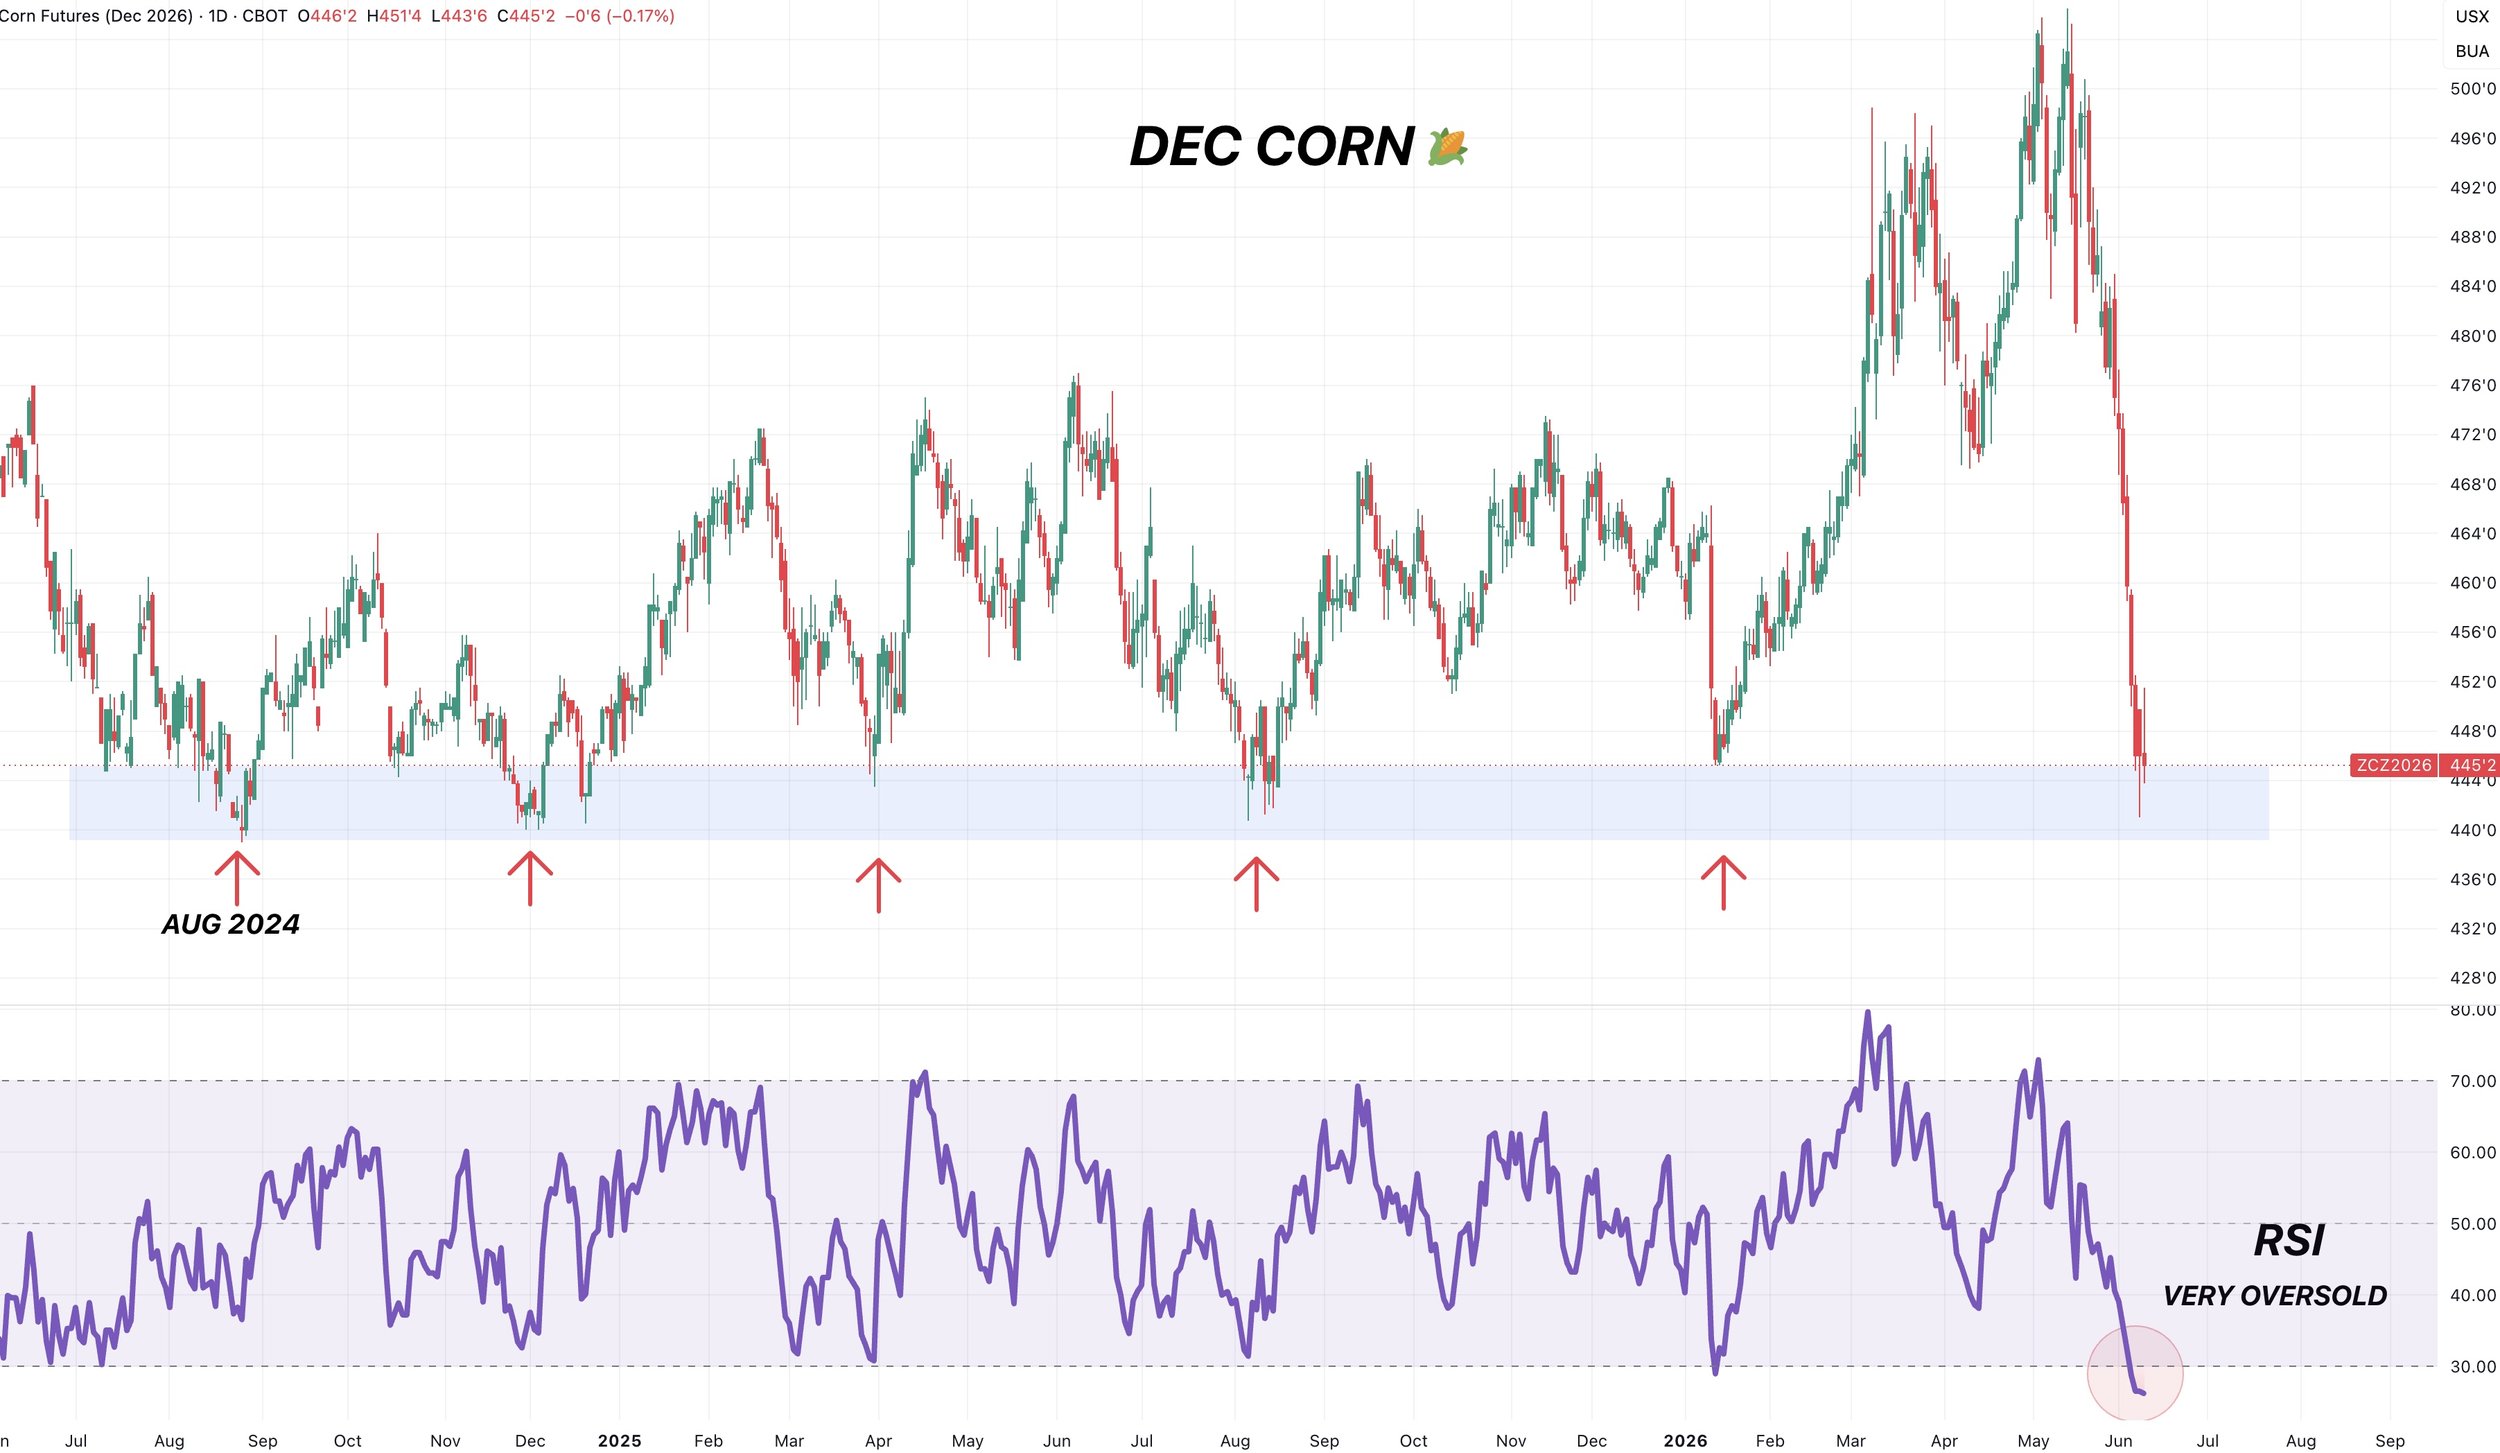
Dec Corn Chart: 2 Year Support
Dec corn is currently sitting at support it's held for 2 years, since August of 2024.
If we are going to find a temporary bottom, this would be the spot we'd like to see it happen.
We're also entering extreme oversold territory right at this massive level of support.
More reason to think we could bounce here.
As this is the most oversold this contract has ever been.
Where should we look to reward?
As always, targets do not have to hit. However, they are there so you know it's time to de-risk if they do.
If we've found a bottom, I would want to reward a move towards $4.65 to $4.75. Which is 20-30 cents higher than today.
That would claw back 38.2% to 50% of the entire sell off.
That same area has been key support and resistance several times.
Normally we look at the golden zone, which is the 50% to 61.8% retracements. However, given that this sell off was so deep, the relief bounce may not be as high.

July Corn Chart:
At contract lows.
Running out of time on this chart.
However, if we manage to claw back into that $4.40 to $4.50 range that would be an area to de-risk.
Which reclaims 38.2% to 50% of the entire sell off.

Front Month Corn Chart:
If we look at this chart, the area to de-risk is also going to be around that $4.40 to $4.50 range.
That is the 38.2% to 50% retracements of the sell off.
It's also prior support and resistance.
The overall trend in this market is still lower given we broke some major support and that uptrend we had held from the harvest lows last year.
So if we bounce, it's reasonable to think that this bounce will be viewed as simply a corrective bounce before ultimately heading lower.
As the trend in this market is lower for now unless something changes. Such as China or an overly bullish acre report at the end of the month.

Soybeans
Not much on soybeans today as there hasn’t been much new.
Domestically, demand is phenomenal.
Crush margins are still through the roof.
Export demand isn’t off the charts good, but should see a nice improvement vs last year given that China should be buying a good amount of new crop soybeans.
Last year, they didn’t start buying until harvest, so perhaps they wait a while once again.

There is the potentially lingering impact of acres ultimately coming in higher like I think they could.
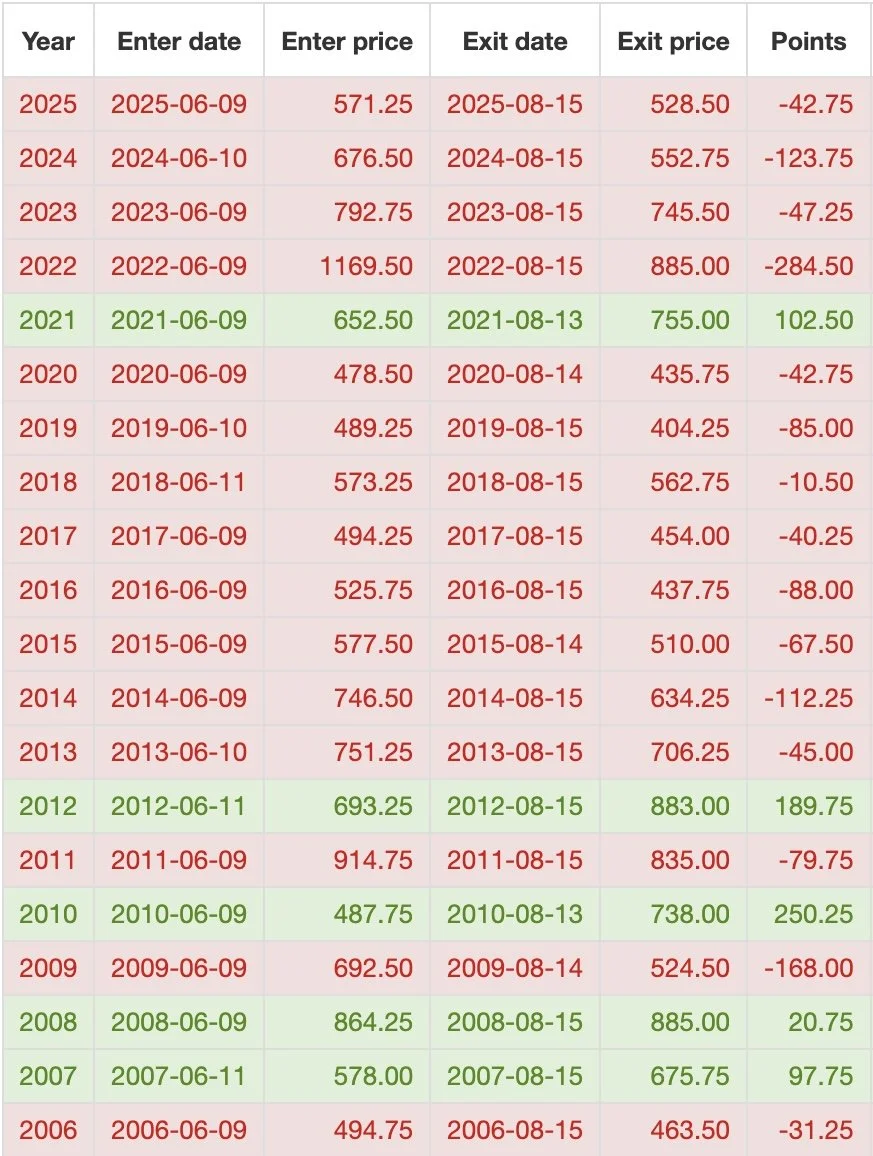
Like corn, soybeans do also have a seasonal tendency to be lower by mid-August.
Again, doesn’t mean you can’t bounce first. But means we are usually lower by then.
Here is the data from today by August 15th.
We've been lower the last 15 of 20 years.
Although last year was one of those years we were not.
And 3 of them came within the last 6 years.
July Beans Chart:
We broke major support, and there was some air below like we had talked about for a long time if it broke.
$10.95 gives back 61.8% of the entire rally off contract lows.
It's also resistance from last year.
That is going to be our must hold level and point of interest.

Nov Beans Chart:
We had that $12.09 sell signal and hedge alert.
I'll have the next target once I feel like we've found a bottom.
For now, bulls simply want to hold those March lows. Which is also resistance from last fall.
If we break below that level, there is plenty of air to the downside still.

Wheat
Nothing too new on wheat today either.
The biggest thing we are going to look at today is the charts, as we are at an important spot where it would make sense to find some life.
Seasonally, this is the time of year we see weakness like we've talked about a long time.
From today by August 15th, wheat has actually been lower the last 12 of 13 years.
So if we are able to put together a sizeable bounce here soon, this is something we have to keep in mind over the next few months.
The US crop is the worst ever, but that's already well known.
For now, we simply lack a reason to go tremendously higher given the bulk of the bull story from the US crop scare has been priced in, and there isn’t any major weather concerns anywhere else in the world.
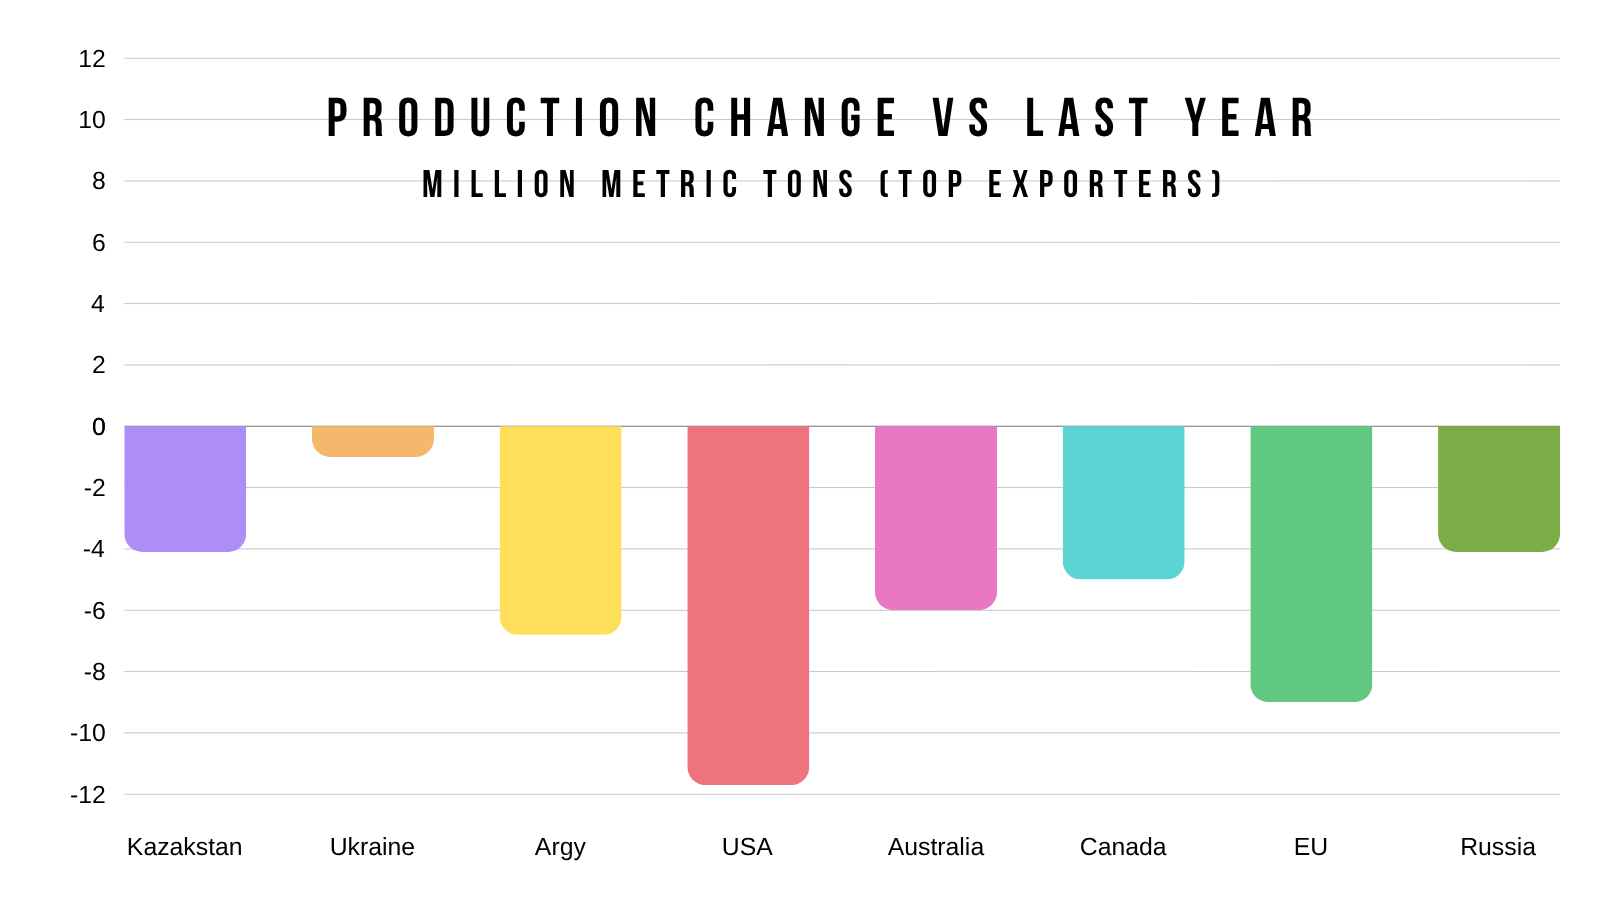
We do know that the USDA is already expecting every single major exporter of wheat to produce less wheat than they did last year.
I'd have to imagine this continues to be a theme over the next year or so.
Which is why long term, I still see a friendly path for wheat with the fertilizer story and how it's going to impact countries around the world.
We'll dive more into this story over the coming months. As for right now, it doesn’t matter.
Corn vs Wheat Chart:
Here is the corn vs wheat price action.
They've tracked very very closely the last several months. Almost identical.
So if we want the corn market to find some life, a good start would be for the wheat market to stop falling apart.
As often times, wheat is the market that can lead the rest.

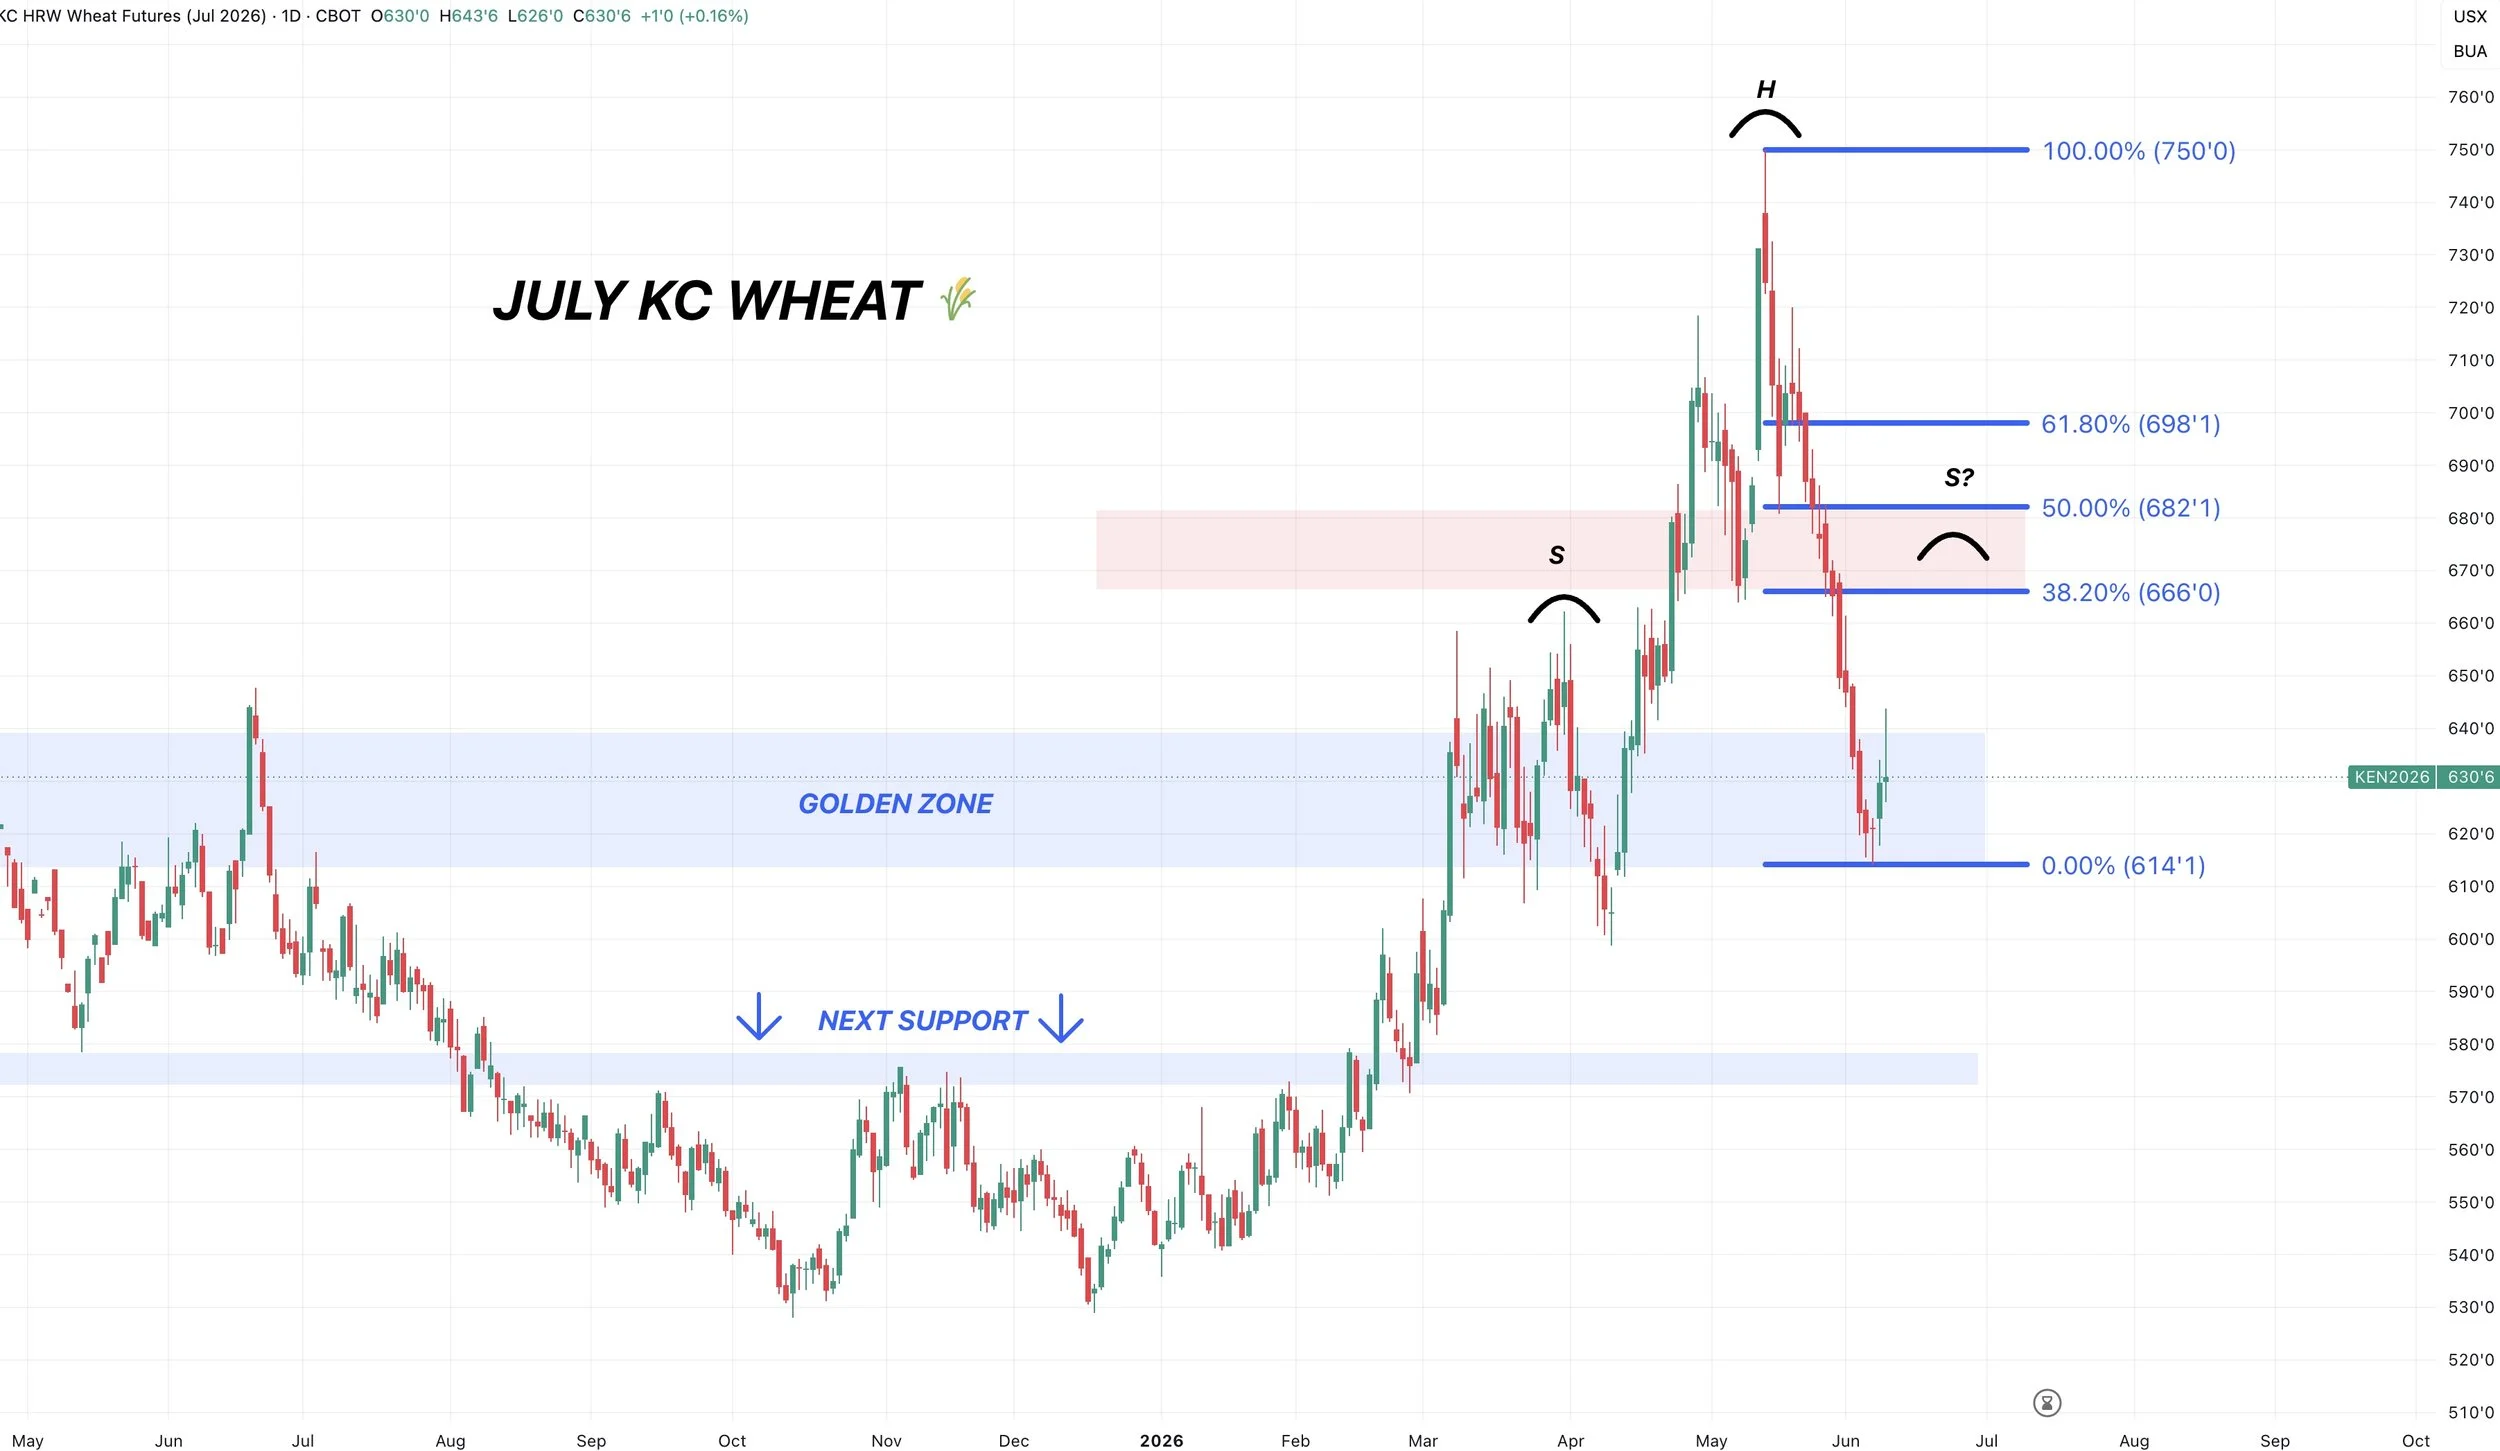
July KC Chart:
We are finally seeing a little bit of life in this market.
Exactly where we need to.
As we gave back 61.8% of the entire rally from contract highs to contract lows. That is the most common retracement level.
If we are going to bounce, it has to be here. This is where we should expect a bounce.
However, it's still absolutely a must hold level.. If we break below this level, it opens the door down to $5.75.
That is the next retracement level. 78.6% of the contract lows.
It's also the next area of high volume, as there just simply isn’t much support at all beneath this current level.

If we look at the 4 hour chart, we had been in a very very steep decline and downtrend for weeks now.
Finally poking our head above getting our first sign of life right at key support. So that's a good start.

If this is the local bottom, where could the bounce take us?
Similar to what we talked about in corn, most often times we will refer to the golden zone (50% to 61.8% retracements).
However, in a sell off of this magnitude, it would be more reasonable to see us crawl into the 38.2% to 50% retracements of the sell off.
If we came up to the 38.2% level, that would also rechallenge some old resistance, and could possibly turn into a head and shoulders pattern.
So that $6.65 level is the area I am currently eyeing for now.
Cattle
They continue to find new cases of screwworm.
They have found cases in dogs, a goat, but I believe only a few cases have actually been found in cattle.
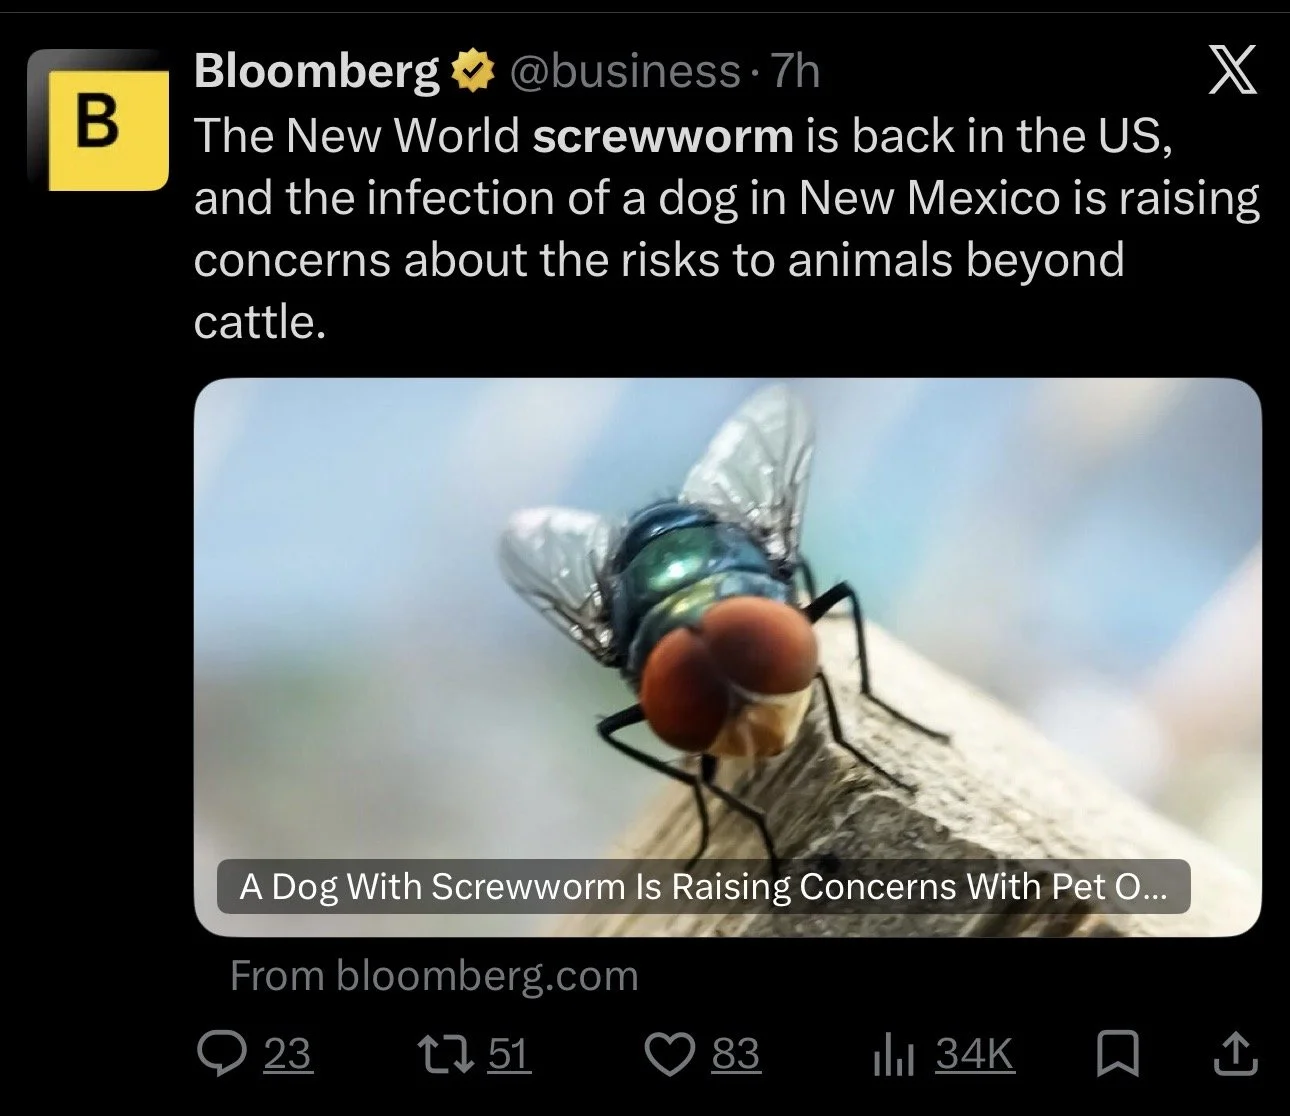
Overall, it is treatable.
In the grand scheme of things, it shouldn’t really impact actual supply and demand dramatically.
The market's initial thought might’ve been, "what if this reduces supply?"
But since it's treatable, it shouldn’t significantly reduce supply. If that was the case, we should’ve already heard about it happening in Mexico.
The issue is the baby calves, it’s not going to kill a cow unless you don’t check up on them and leave it untreated. As it's manageable.
The big question is the transportation issues. Is this going to cause any restrictions?
We are seeing some fund liquidation. As open interest has come way down. Meaning that it could be a sign that the funds are no longer completely interested in owning cattle like they had been.
If you were the funds, and knew you had this headline risk every single day, would you want to be overly long?
Then you have the fact that the most recent COF did show placements well above a year ago for the first time in a long time.
So to me I feel like there is plenty of downside risk in this market especially longer term. Altough I don’t think screwworm should have a real impact, I don’t see why it would be another reason for the funds to be more long.
We like having downside protection at these levels. However, straight up puts are expensive. So you could consider some sort of options strategy such as buying a put and then selling a call to pay for it.
Call us if you have any questions or want to put together a strategy.
Office Line: (806)484-1214
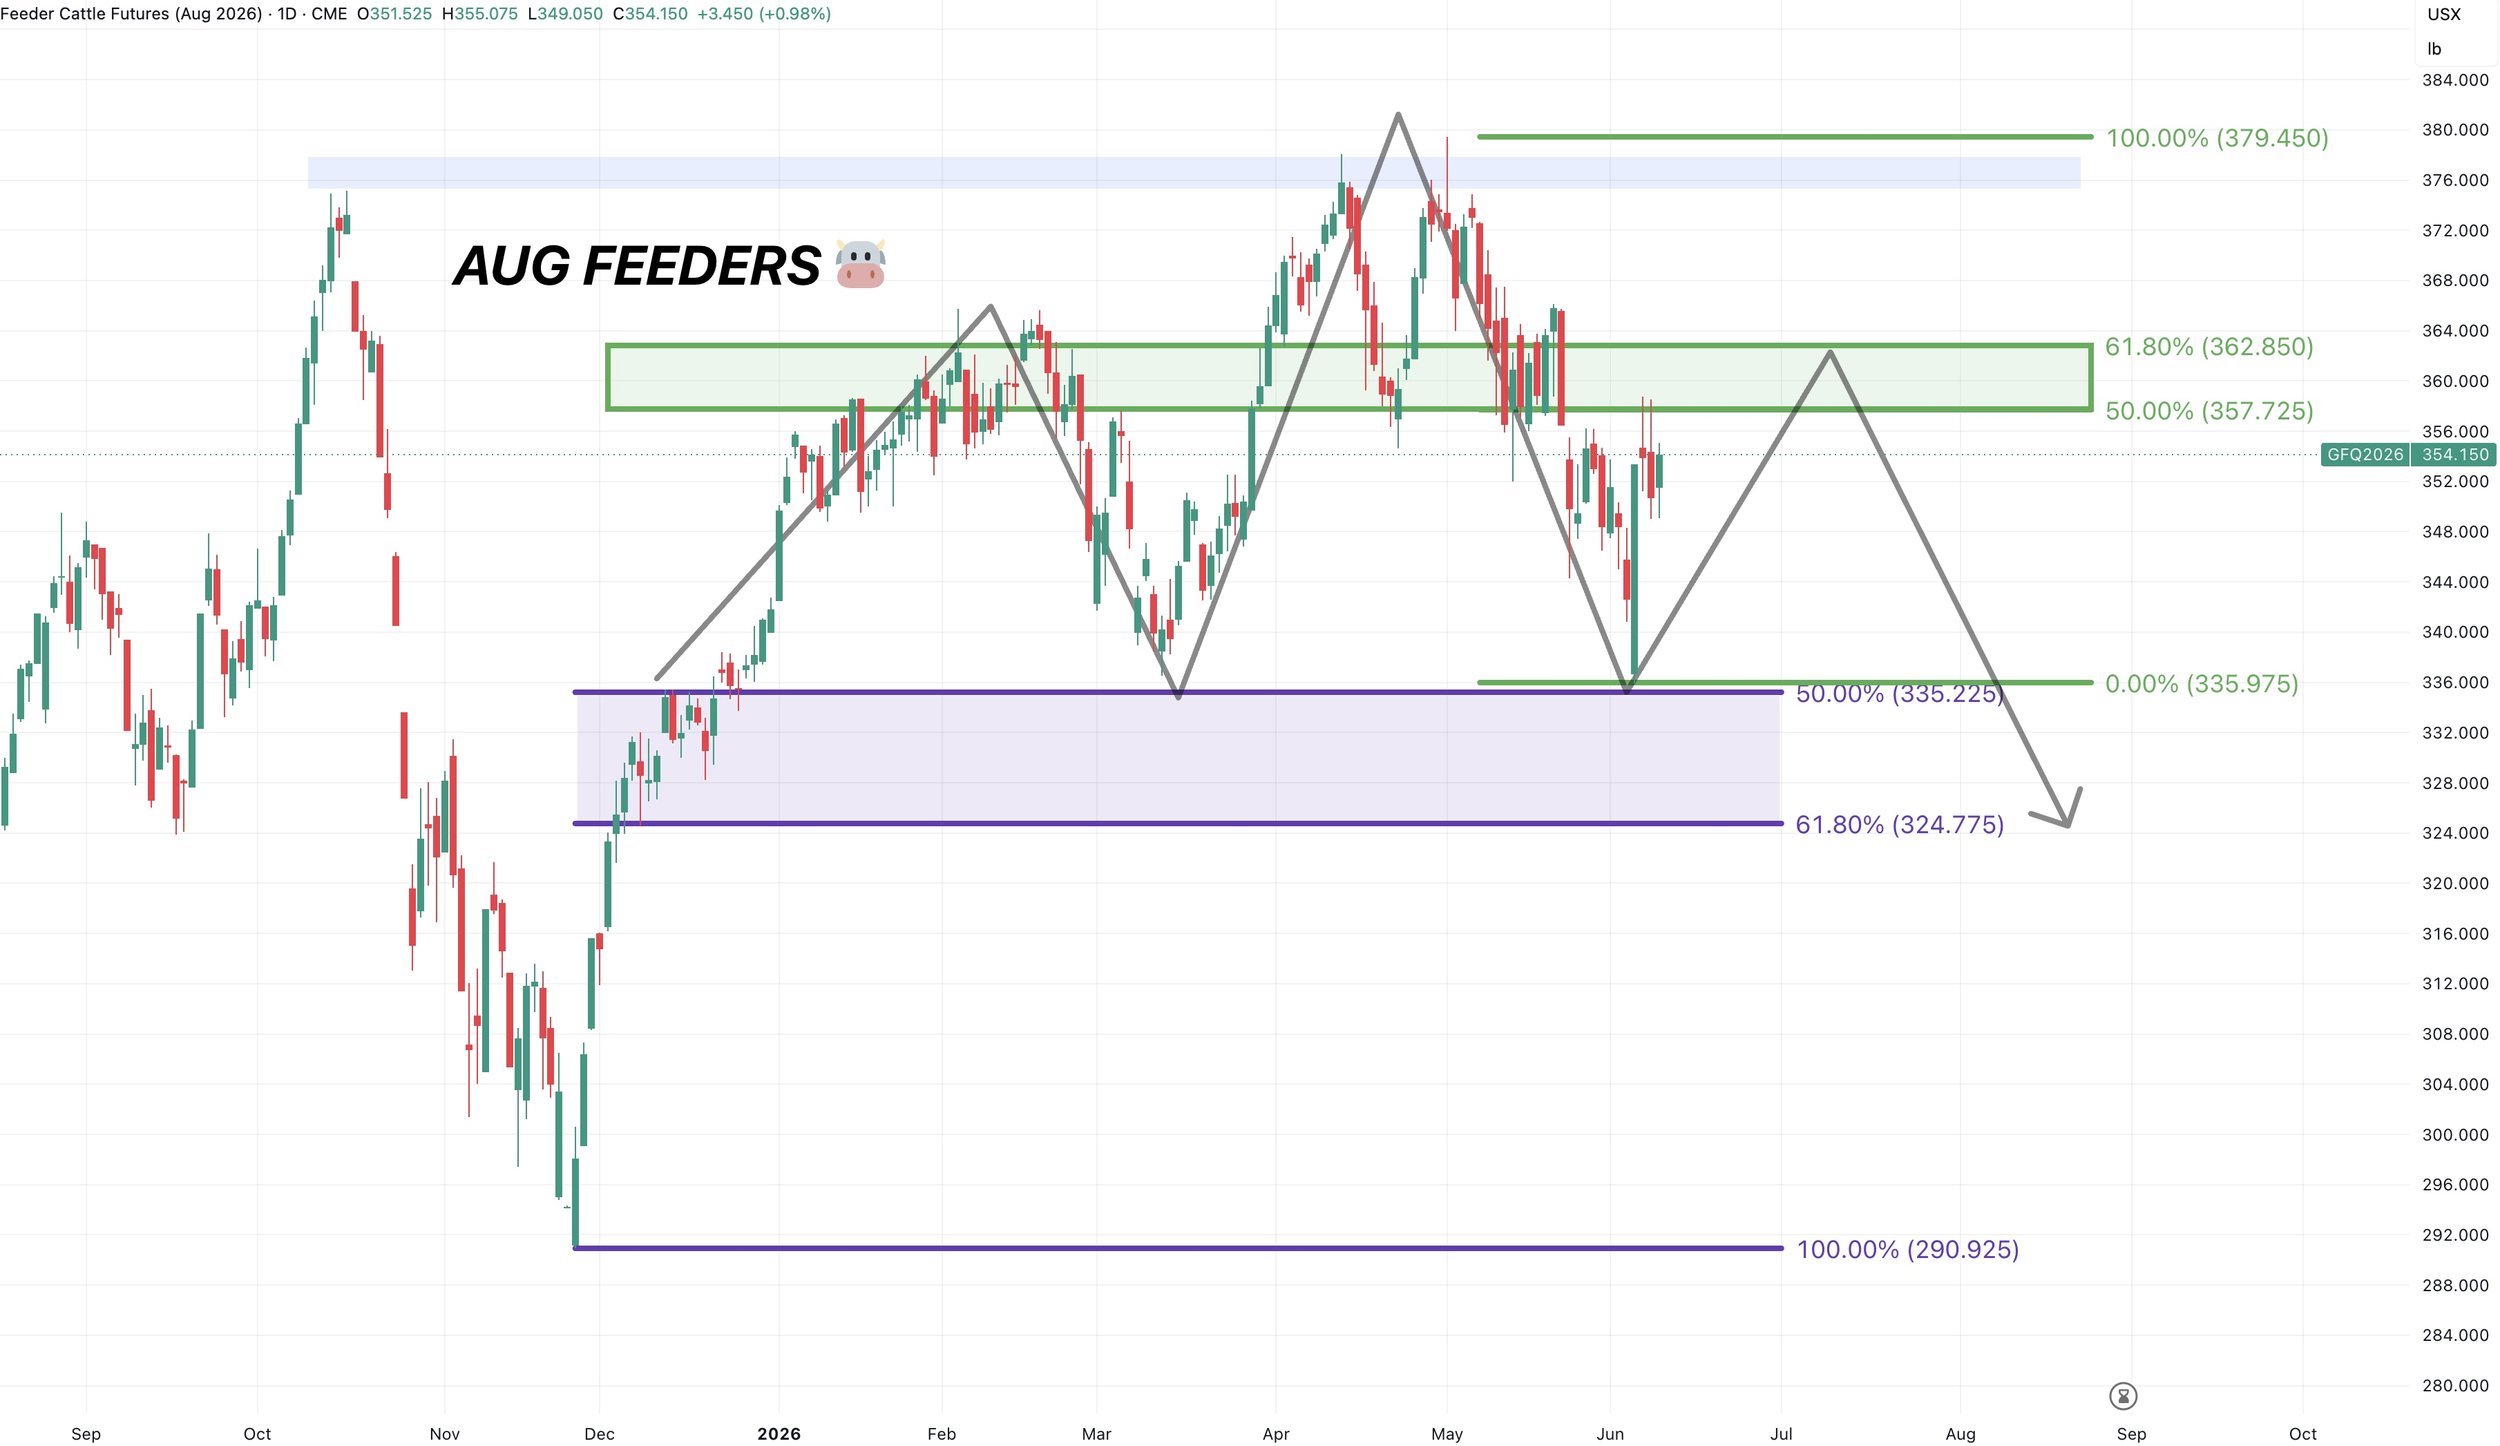
Aug Feeders Chart:
Whether we push a little higher first or not, this is still a potential scenario I am watching.
As we always talk about, the most common relief bounce claws back 50-61.8% of the sell off.
In this case, that same level happens to be that prior resistance from earlier this year.
Which could easily set up a head and shoulders pattern.
So I am viewing this bounce as corrective unless we break above the green box.
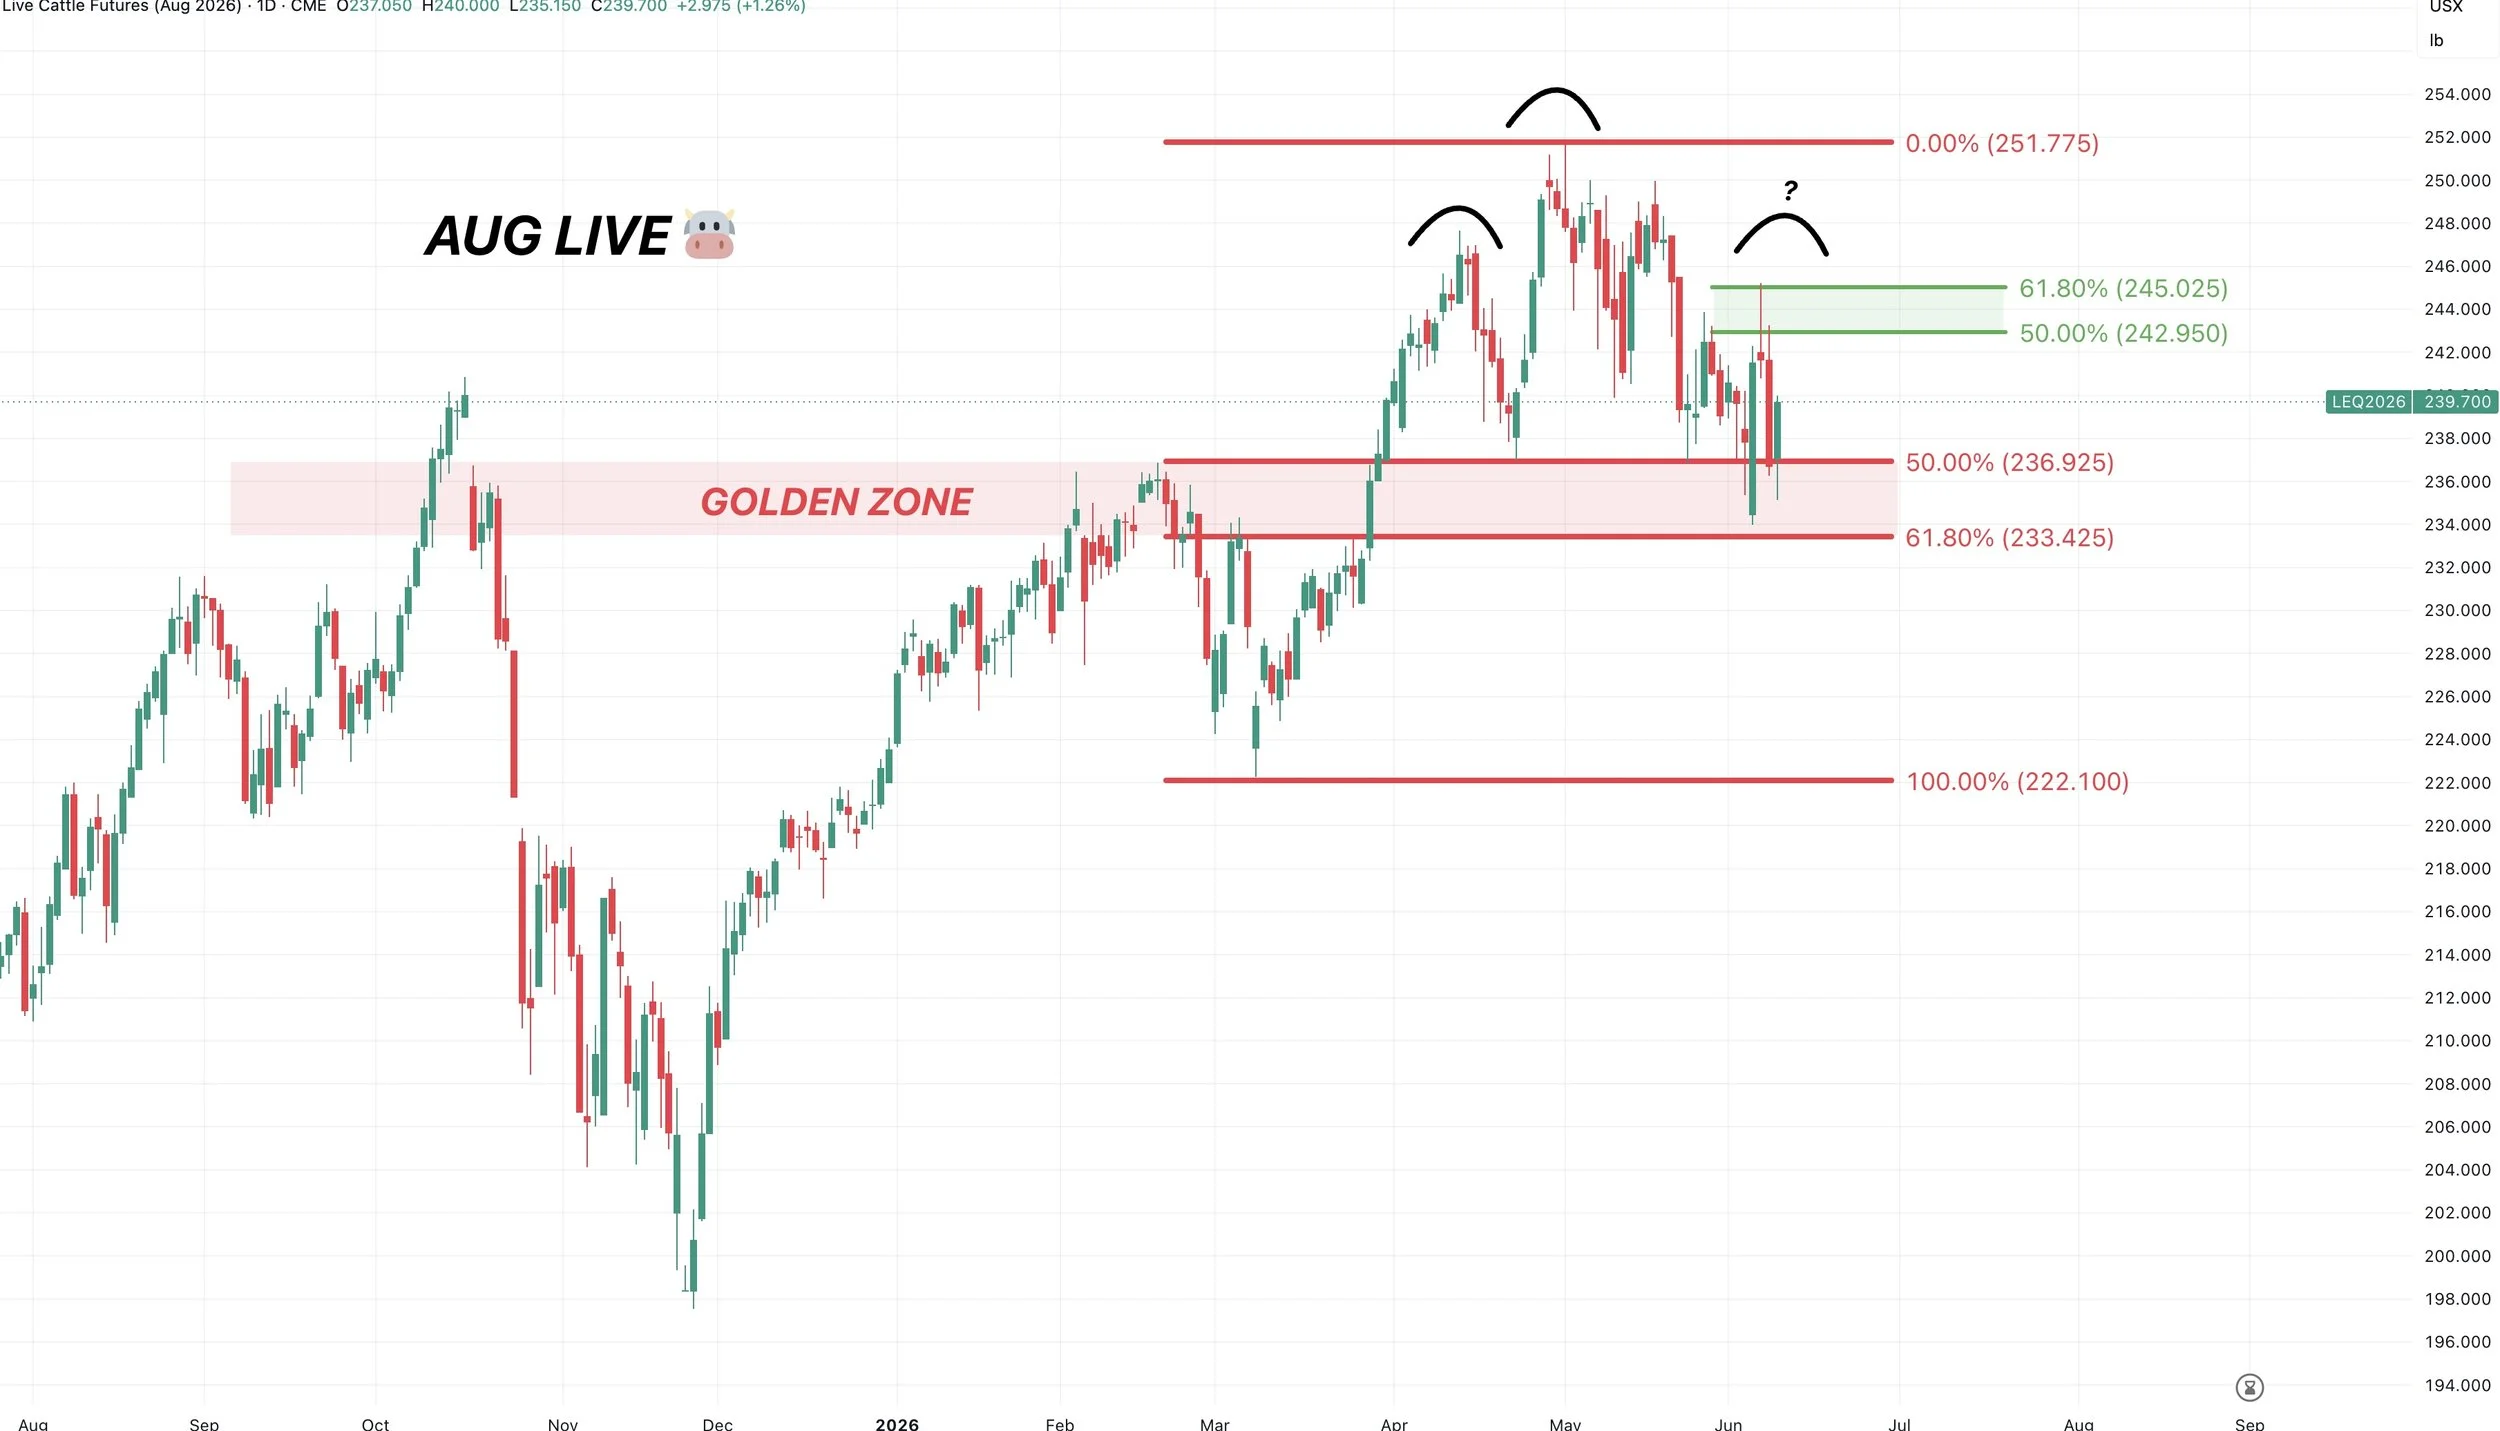
August Live Chart:
Same exact set up here in live cattle as we have in feeder cattle.
We went right into that golden zone before rejecting. This bounce is viewed as a relief bounce unless we break above that box.
The warning sign is the recent lows. Which gave back 61.8% of the rally from March.
If we break below that level it wouldn’t be a good sign, and open the door lower.
Want to Talk?
Our phones are open 24/7 for you guys if you ever need anything or want to discuss your operation.
Jeremey & Office: (806)484-1214
Sebastian: (605)280-1186
Email: sfrost@dailymarketminute.com
Hedge Account
Interested in a hedge account? Use the link below to set up an account or give us a call.
Recent Signals
May 27th, 2026: 🌽
Corn conditional buy signal.
CLICK HERE TO VIEW
May 13th, 2026: 🌱
Soybean sell signal & hedge alert.
CLICK HERE TO VIEW
April 28th, 2026: 🌾
KC wheat specific signal.
CLICK HERE TO VIEW
April 27th, 2026: 🌽
Corn catch up sell signal.
CLICK HERE TO VIEW
April 10th, 2026: 🌽
Corn buy signal.
CLICK HERE TO VIEW
March 19th, 2026: 🌱
New crop soybeans signal & hedge alert.
CLICK HERE TO VIEW
March 9th, 2026: 🌱
Soybeans signal & hedge alert. Sent via text.
CLICK HERE TO VIEW
March 6th, 2026: 🌽 🌾
Corn & wheat sell signal & hedge alert.
CLICK HERE TO VIEW
March 3rd, 2026: 🌽
Old crop & new crop corn sell signal & hedge alert.
CLICK HERE TO VIEW
Feb 26th, 2026: 🌱
Old crop & new crop beans sell signal & hedge alert.
CLICK HERE TO VIEW
Feb 19th, 2026: 🌾
KC wheat sell signal & hedge alert.
CLICK HERE TO VIEW
Feb 6th, 2026: 🌽 🌱
Old crop corn & soybean sell signal & hedge alert.
CLICK HERE TO VIEW
Feb 4th, 2026: 🌱
Soybean sell signal & hedge alert.
CLICK HERE TO VIEW
Nov 17th, 2025: 🌱
Soybean sell signal & hedge alert.