
BREAKING DOWN THE USDA
ROUND TABLE DISCUSSION
This is our first time doing this style of update, so bear with us as we will look to improve and learn in the future. This video was a learning experience so we apologize that it’s not perfect.
We attached the slides & charts from the video if you scroll down as well.
Want to talk?
Office: (806)484-1214
CHART BREAKDOWNS & SLIDES
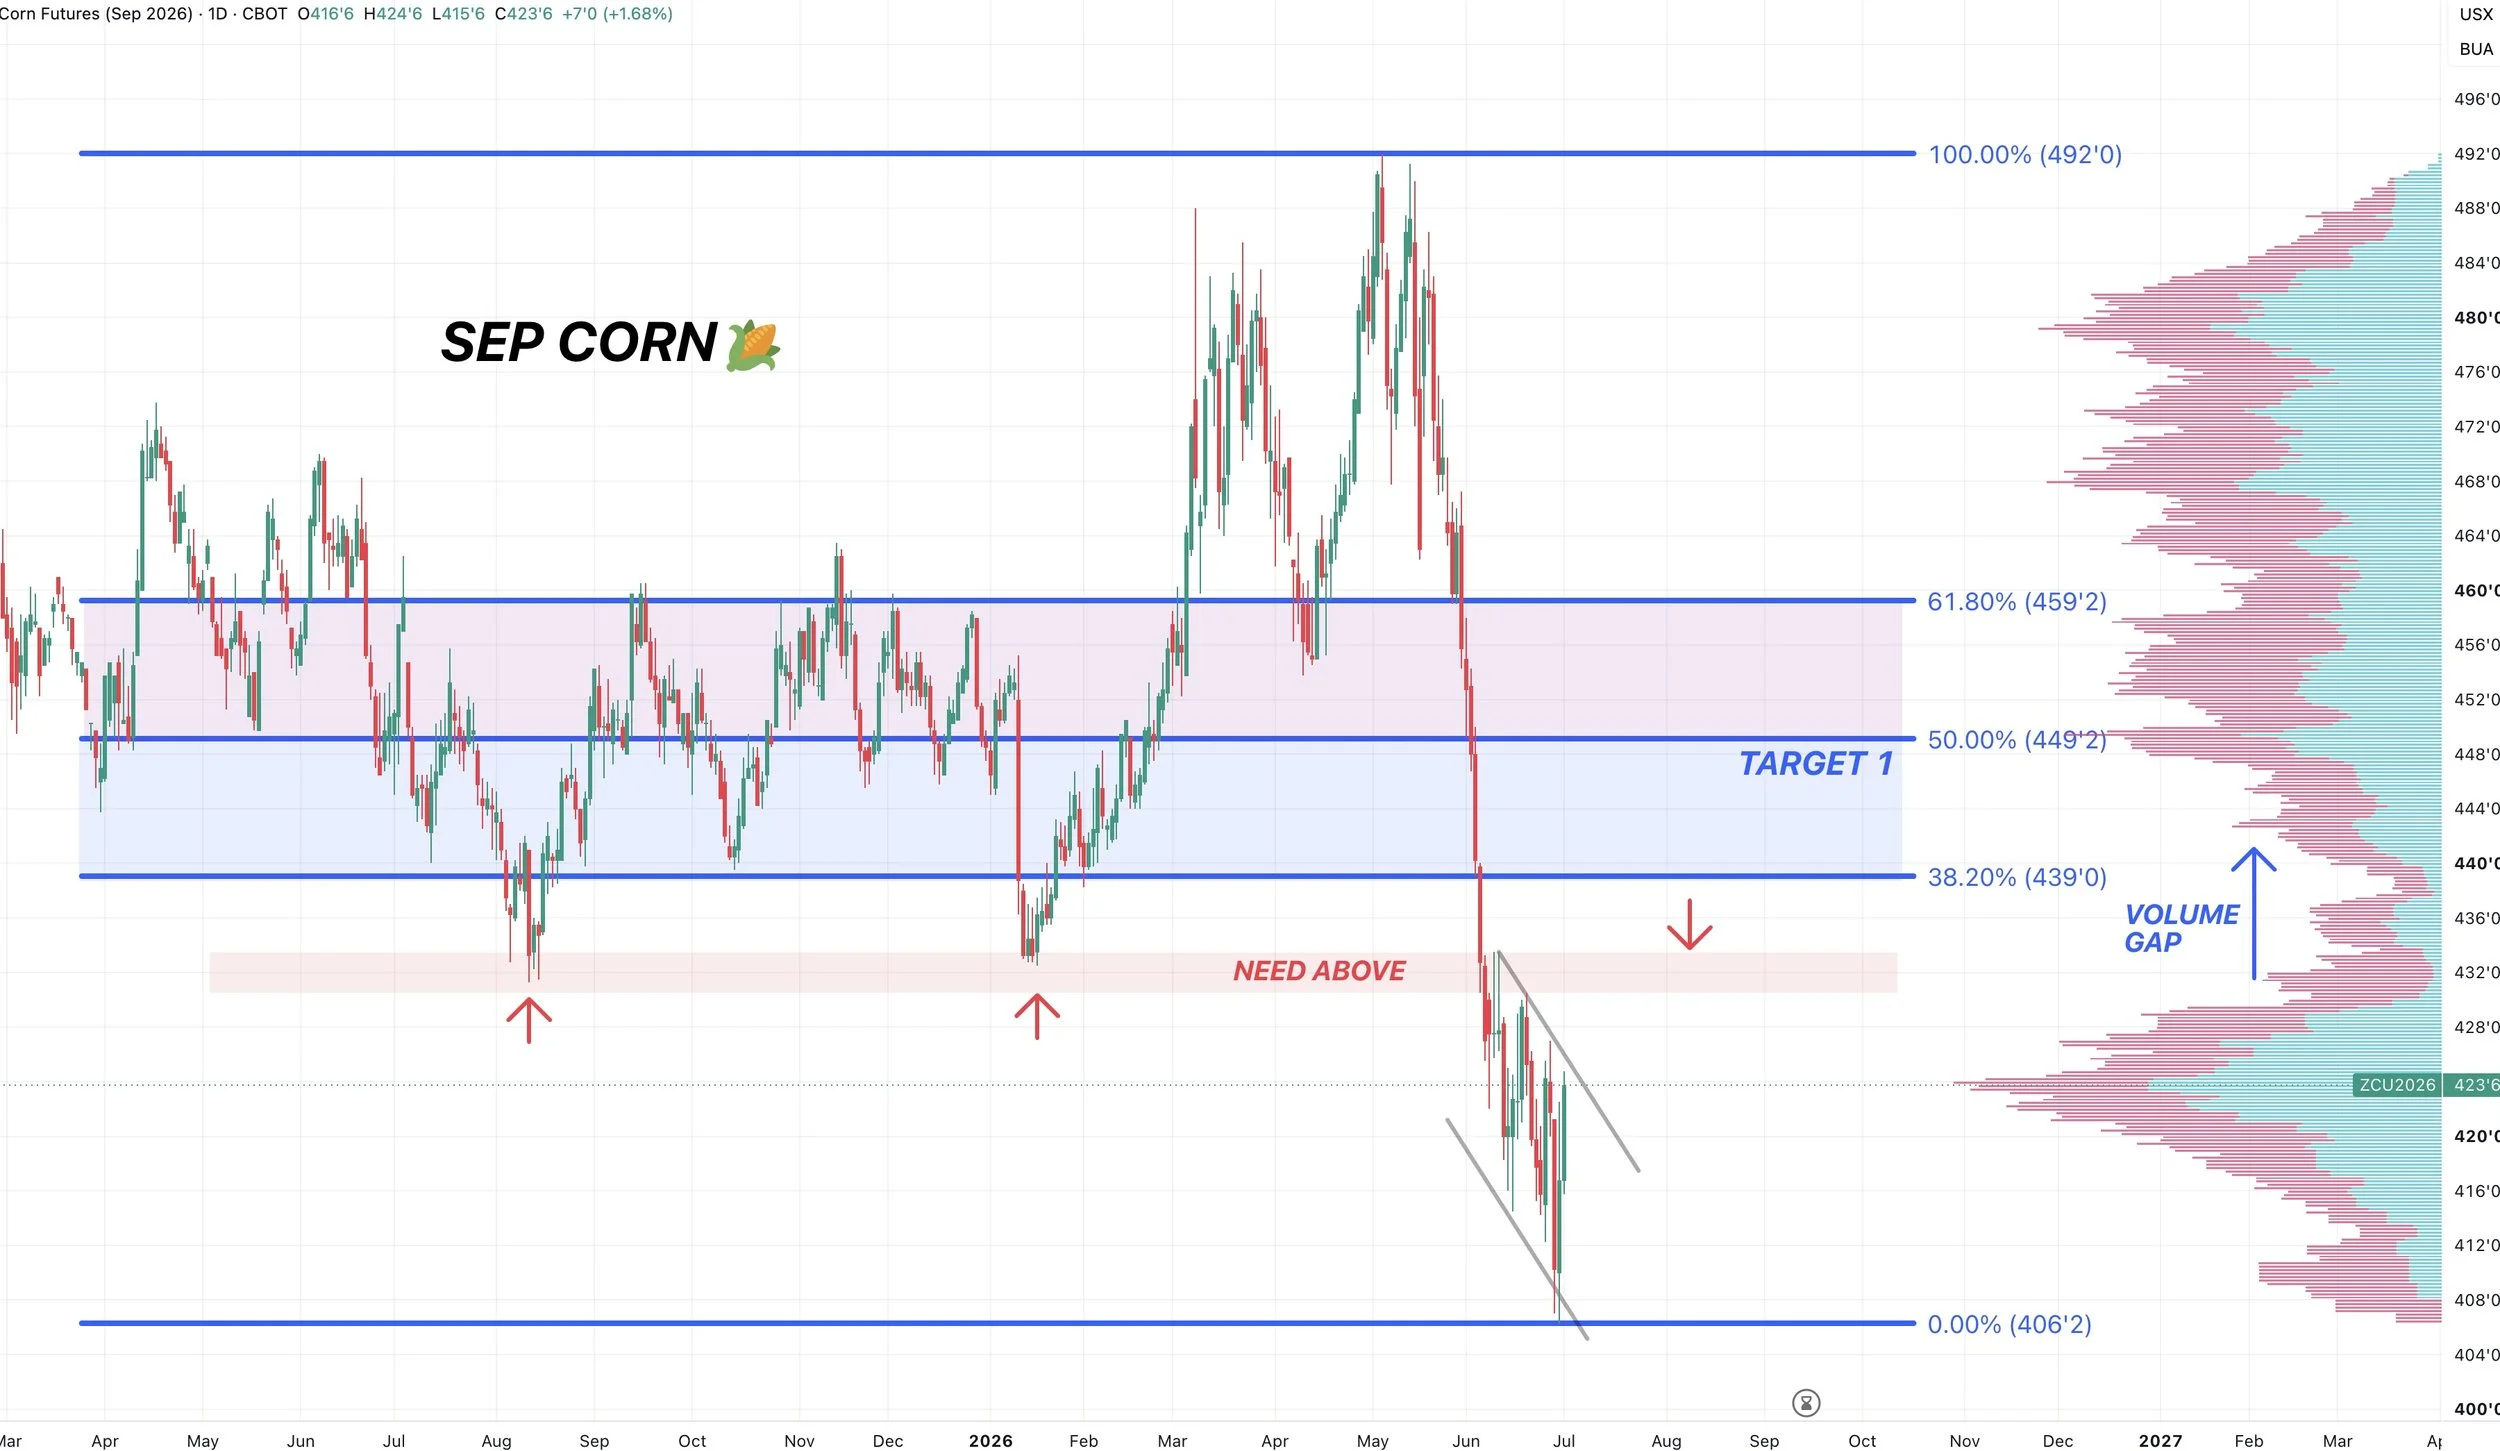
Sep Corn 🌽
Sitting in a downward channel.
Would be nice to see us get a break out from the channel.
For confirmation we’ve put in some local lows, we want to see a close above that $4.33 range.
That’s the recent highs, it’s also prior support.
If we can do that, we have a volume gap to the upside.
We want to protect a rally into the $4.40 to $4.50 range. $4.50 claws back half the sell off.
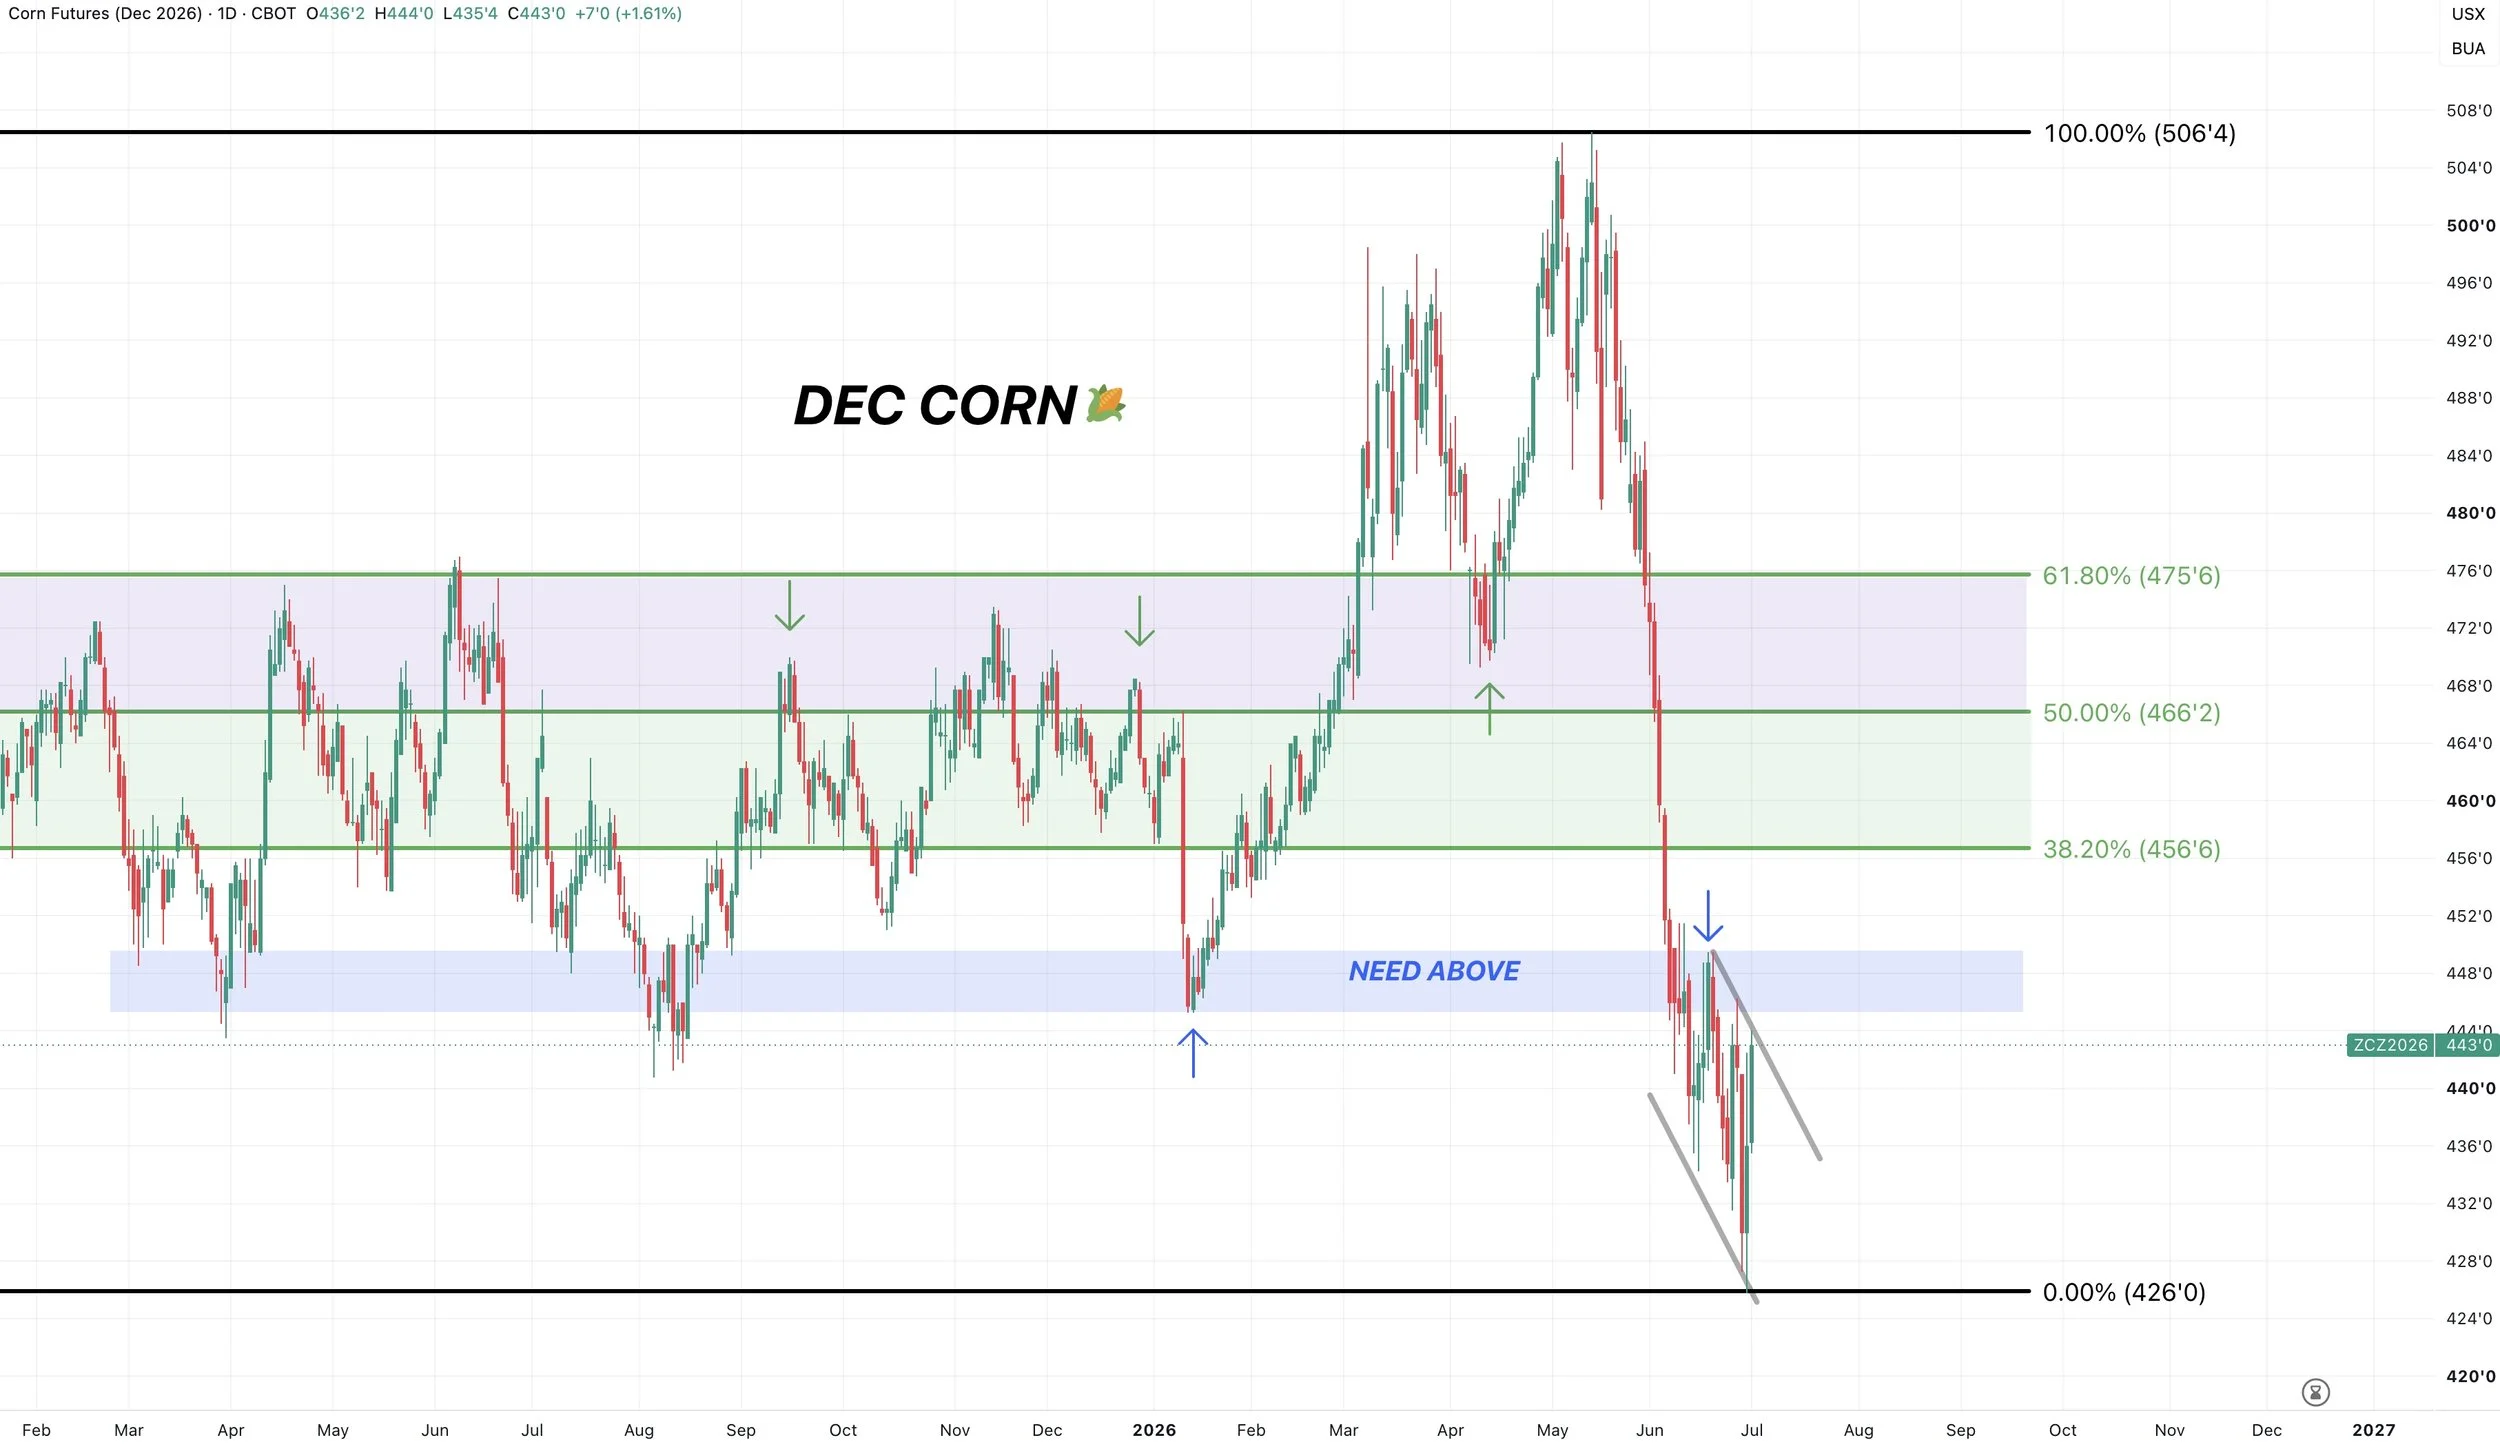
Dec Corn 🌽
Similar set up here.
We have a downward channel in place.
We need to break above $4.50 to claim we’ve put in a local bottom.
That $4.60 to $4.70 range is going to be a point of interest and a spot to defend.
$4.66 claws back half the sell off.
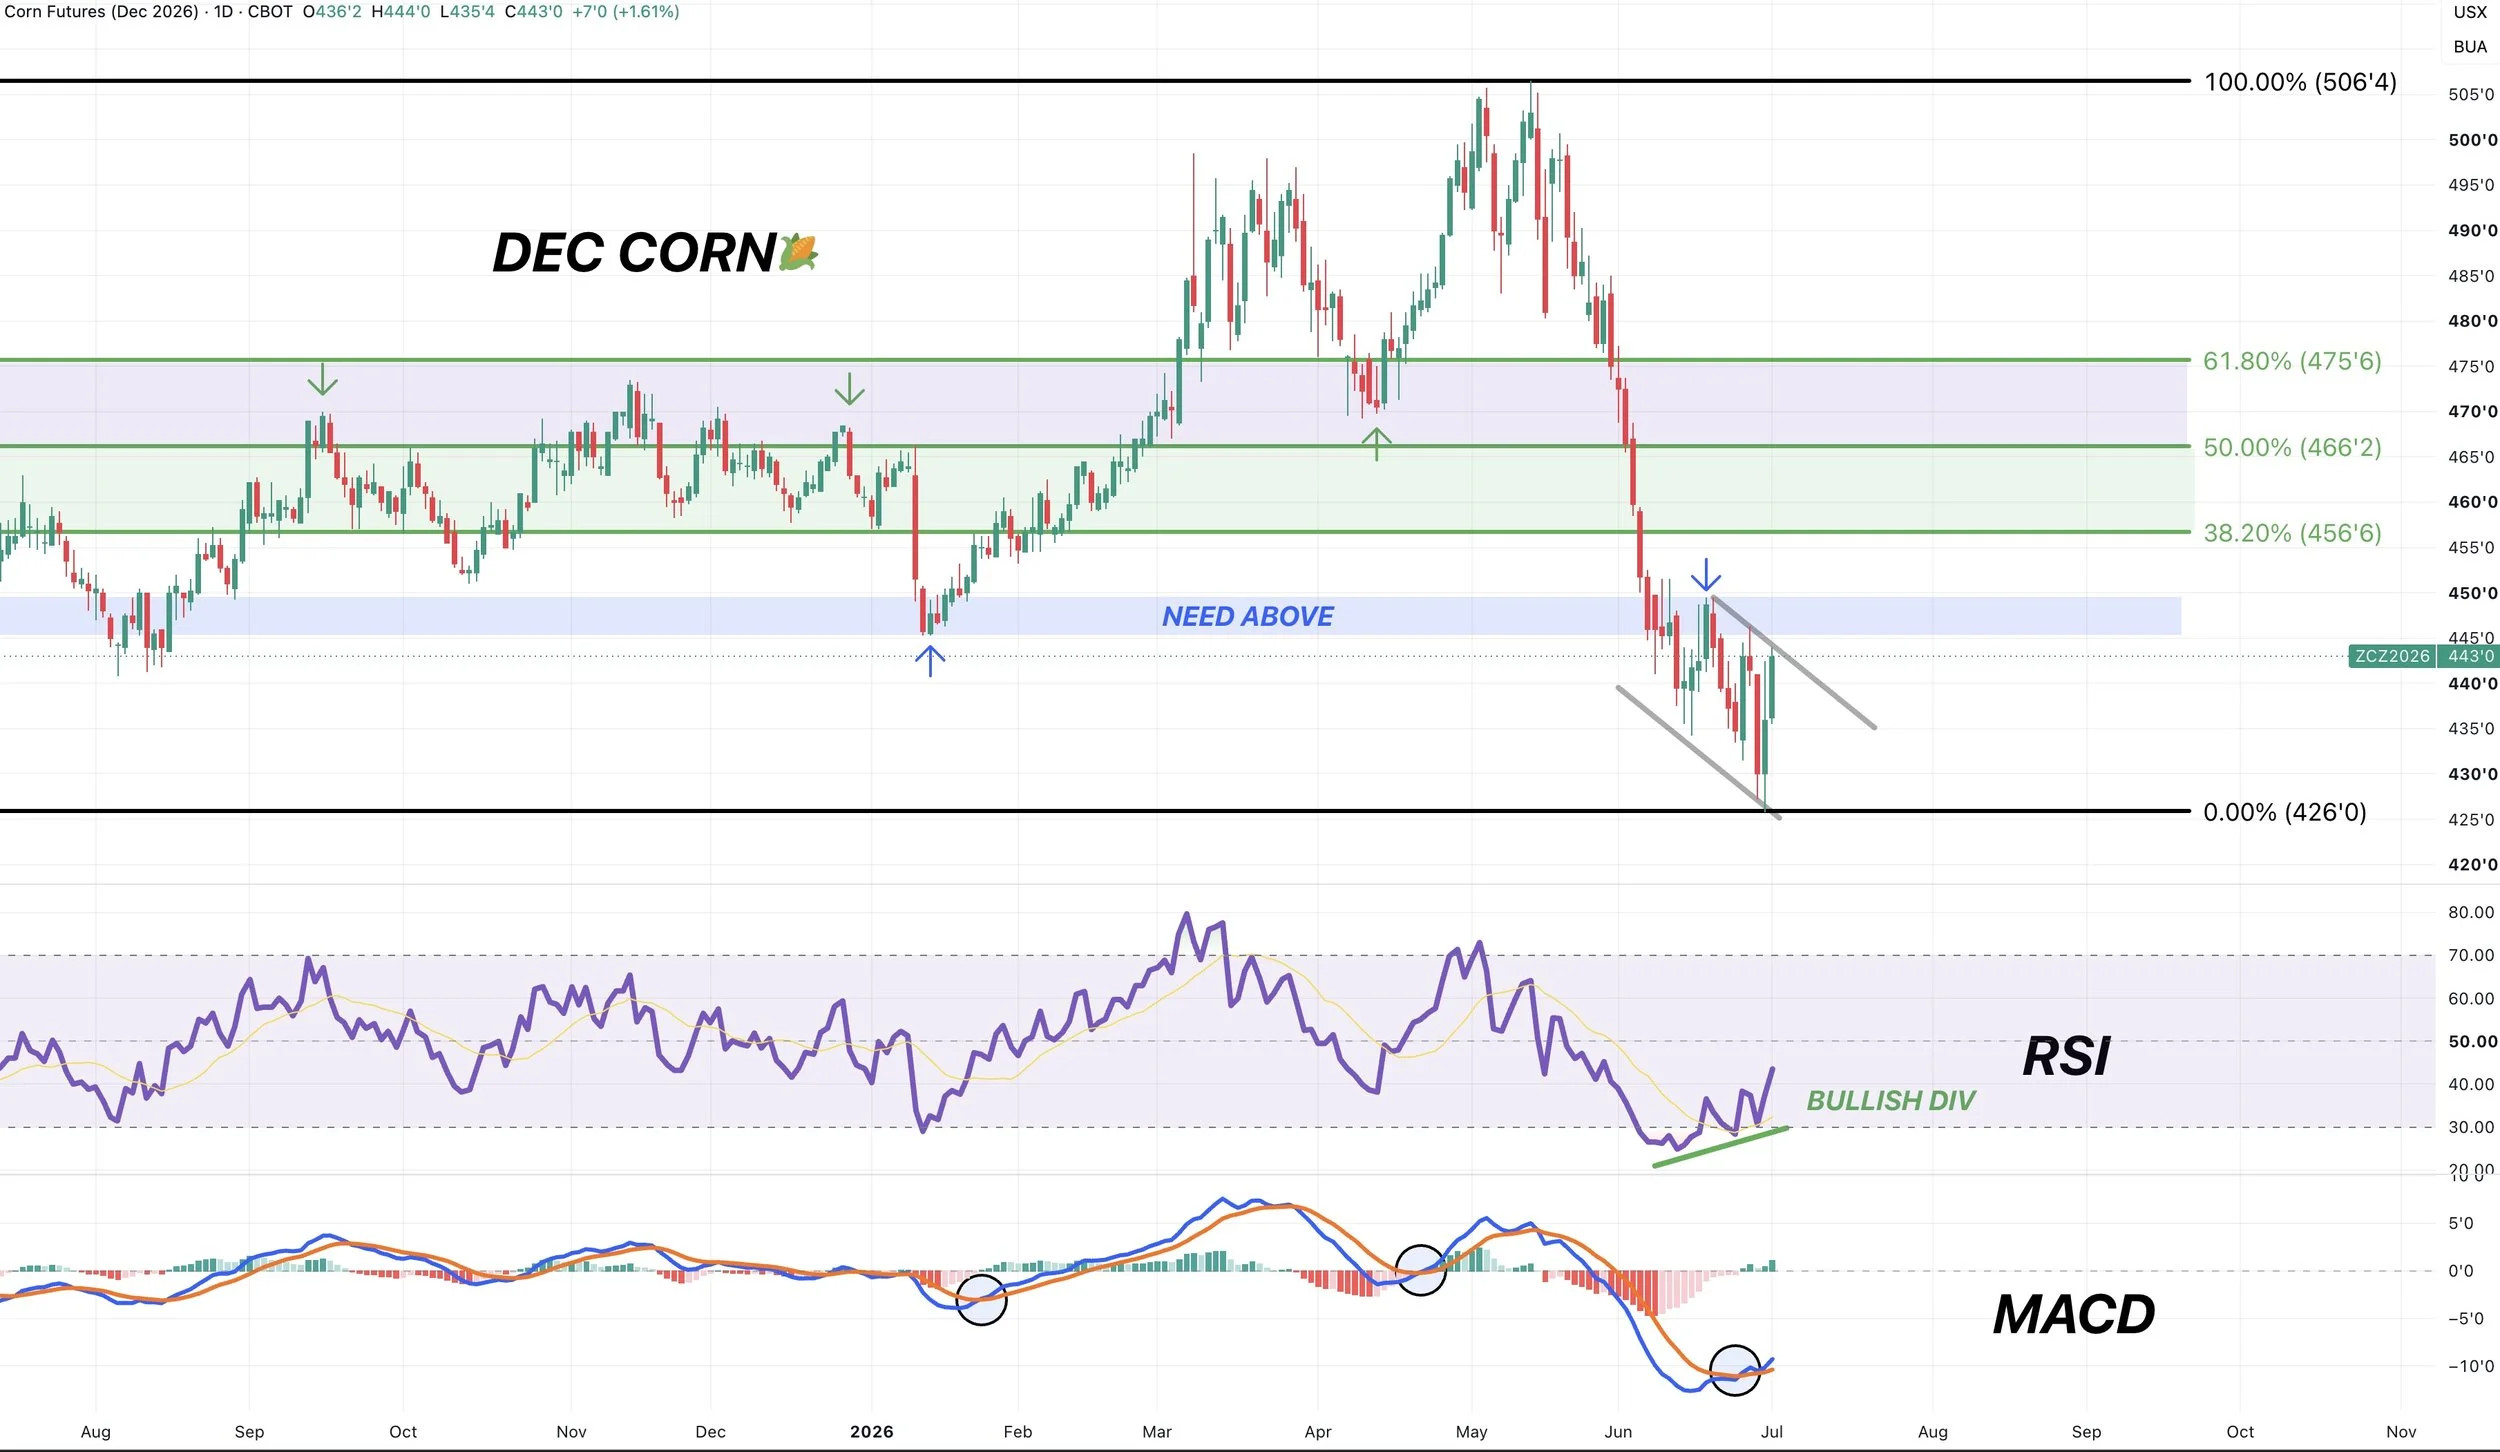
The indicators are painting a friendly story.
We still have bullish divergence like we’ve been talking about for the last week or so.
Which tells us downside momentum could be getting tired.
At the same time, the MACD momentum indicator flipped bullish for the first time since April as well.
All positive signs of a possible bottom. But again, need above $4.50 for confirmation.
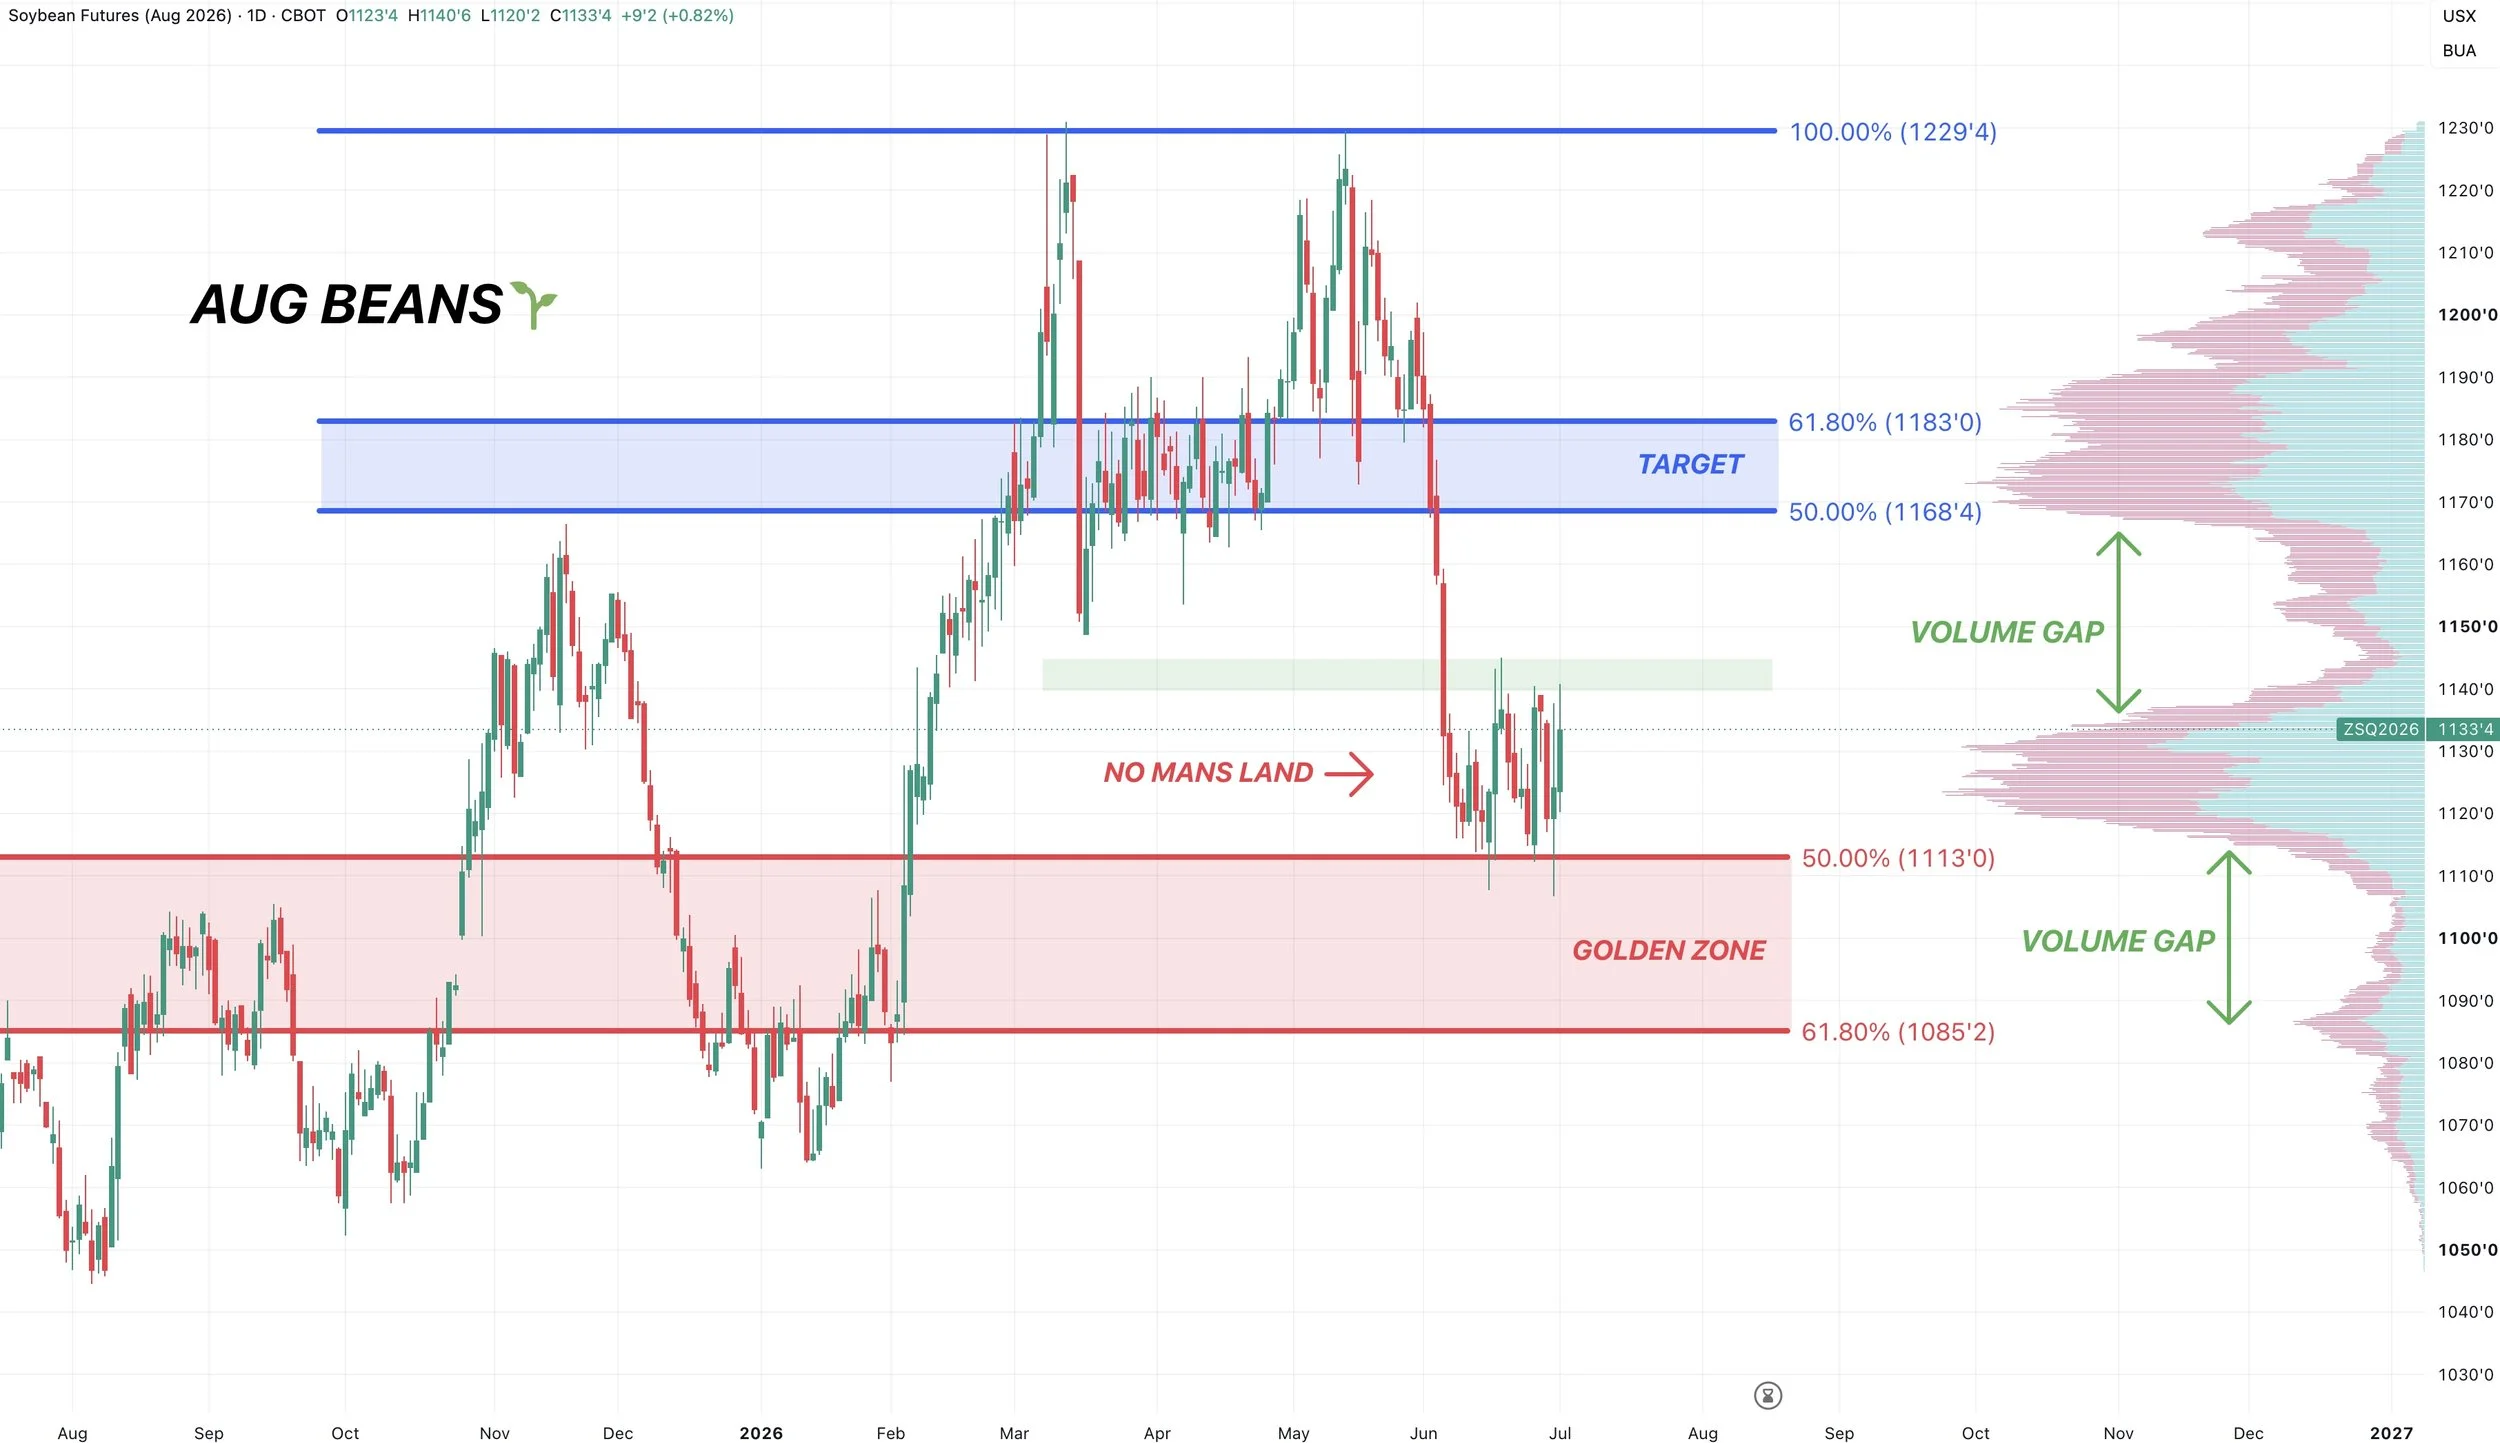
Aug Beans 🌱
Essentially in no mans land here.
Trapped at a massive volume shelf, bouncing between the recent highs and lows.
We have volume gaps to the upside and downside. So whatever direction we break out of from here, could be an accelerated move.
Break above the recent highs and we have room to run. Break below the recent lows and we have some air to the downside.
Like in corn, the indicators are telling a friendly story. Which has my bias leaning higher.
We have bullihs divergence on the RSI. As prices made new lows while the RSI did not.
The MACD flipped bullish for the first time since April.
The last two times this happened we went on a rally.

Nov Beans 🌱
Very similar set up as August beans.
Trapped between the recent highs and lows at this massive volume shelf.
If we can break above the recent highs, we should run to $11.70 to $11.80

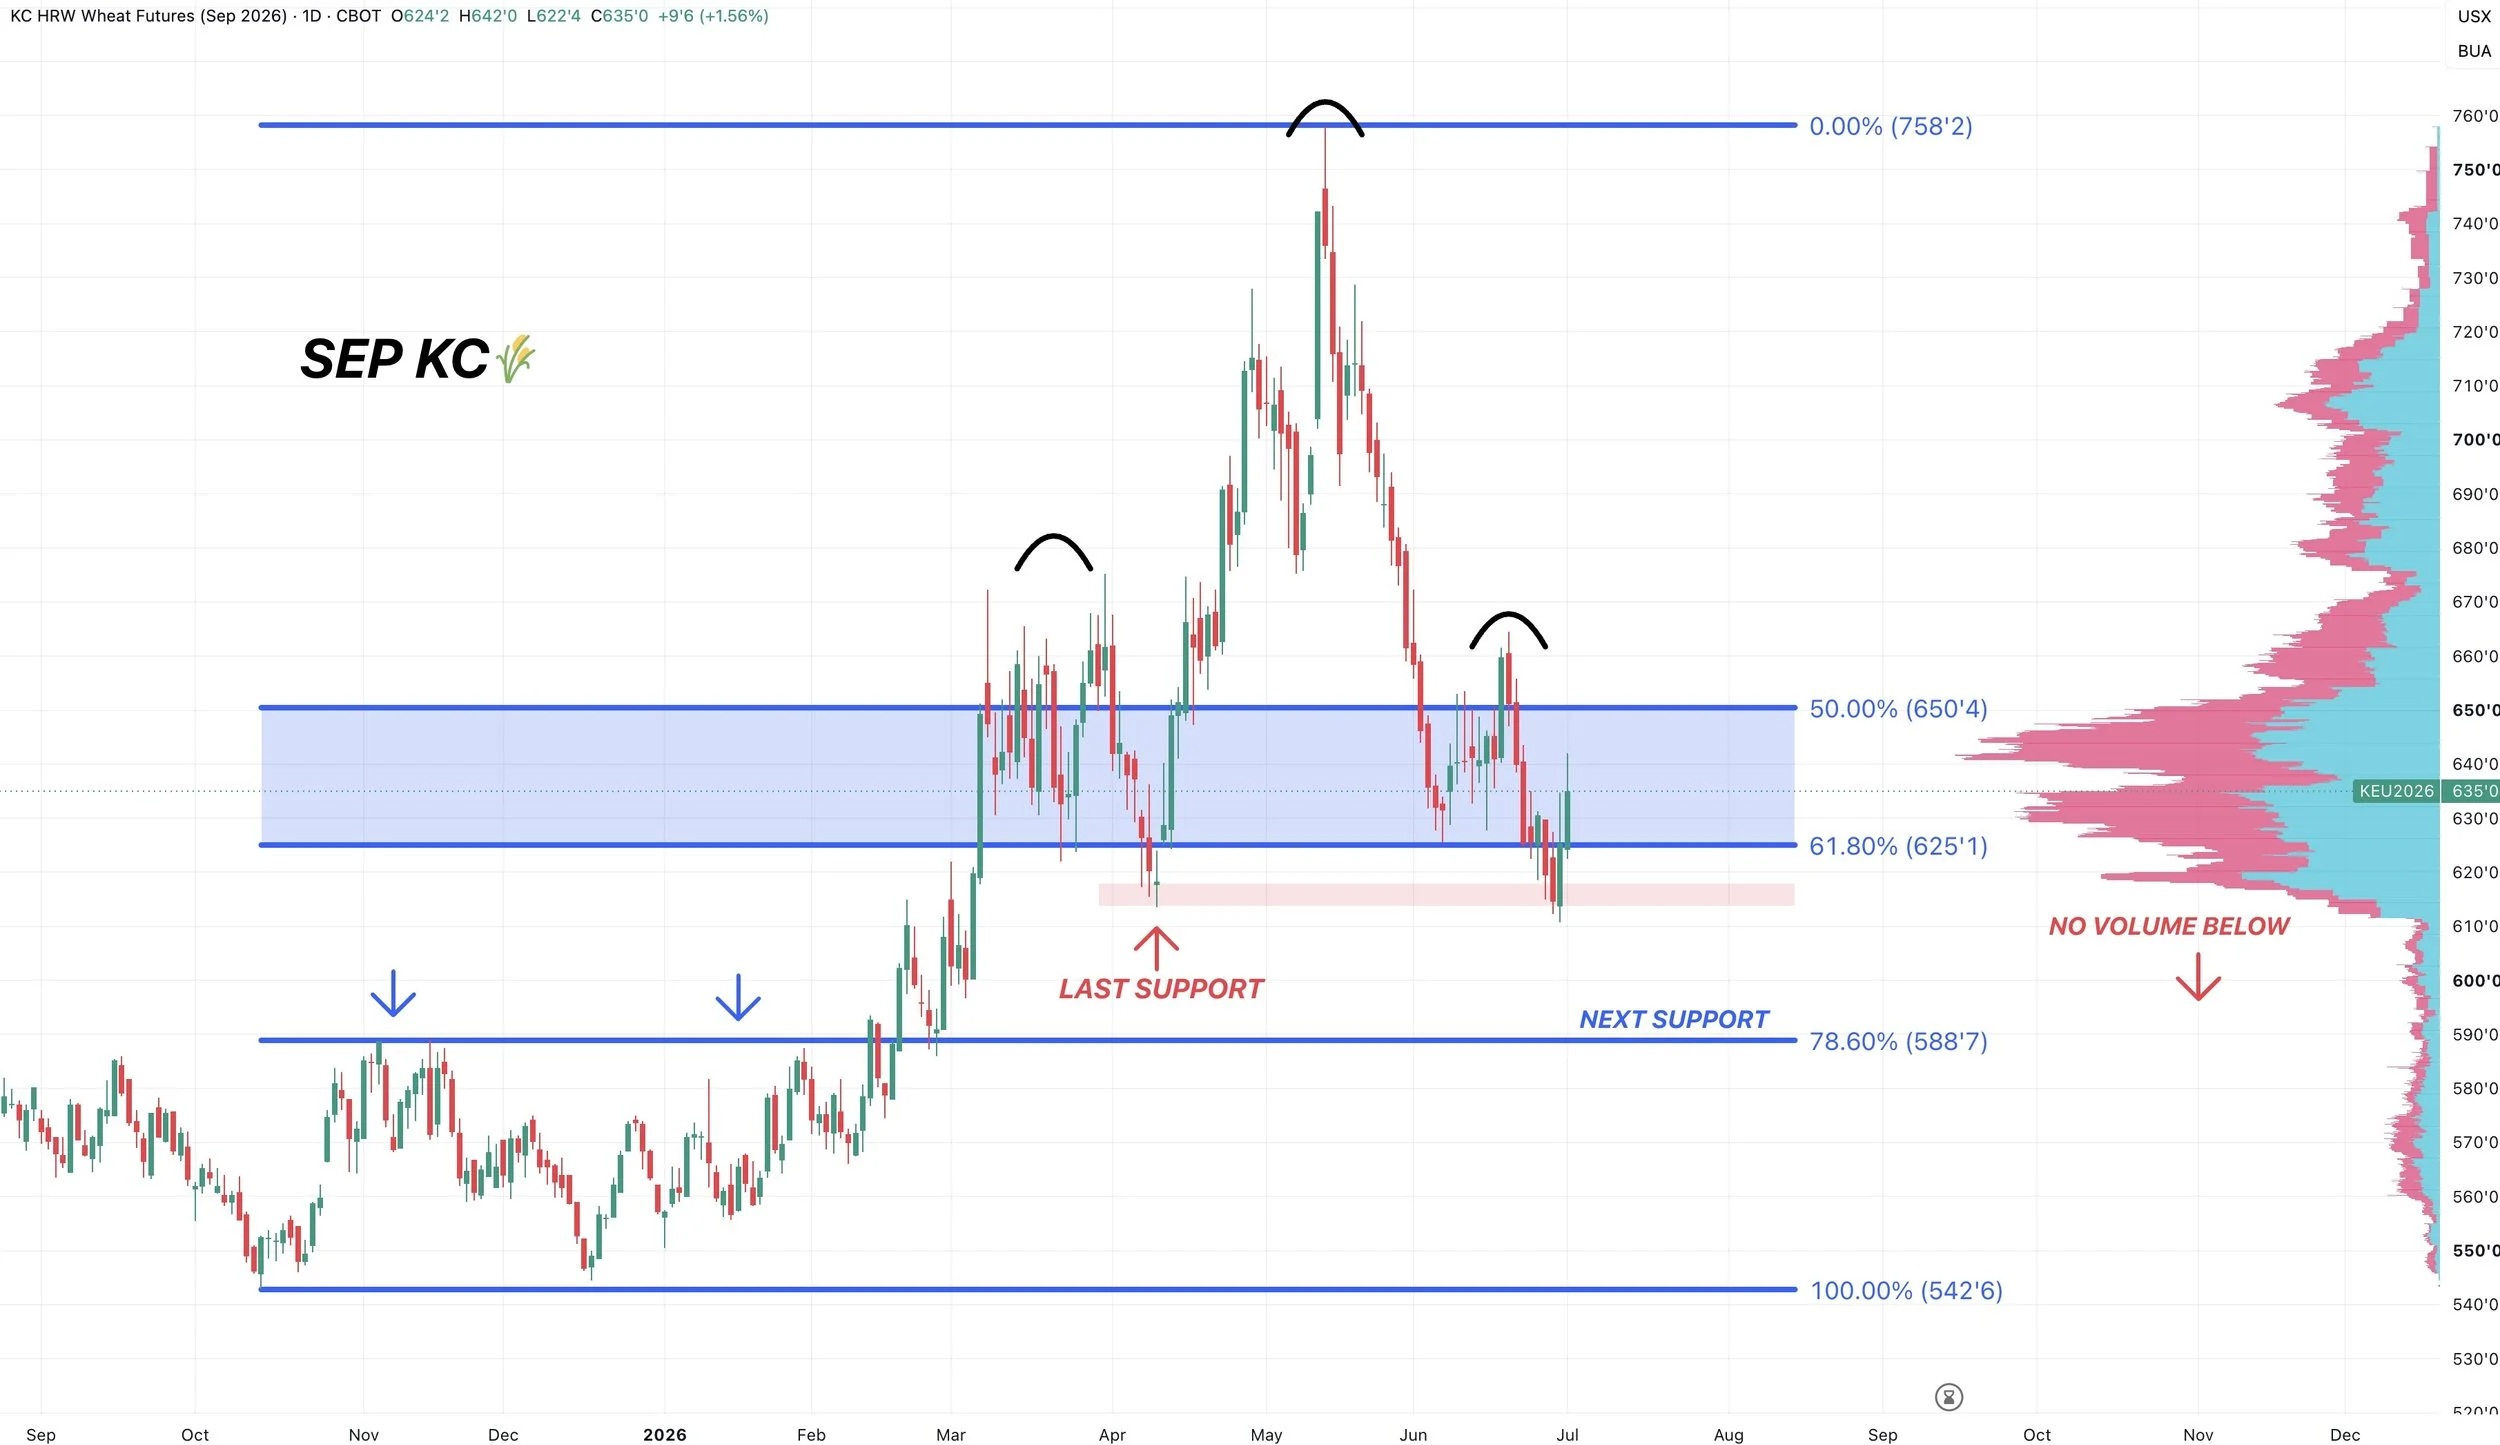
Sep KC Wheat 🌾
We bounced at our very last line of support. Which was those April lows.
We need to continue to hold that level or we could fall to $5.88.
That’s the next retracement level (78.6% of the contract highs to contract lows).
We have zero volume or support beneath this level. So we must hold the recent lows.
SLIDES FROM VIDEO
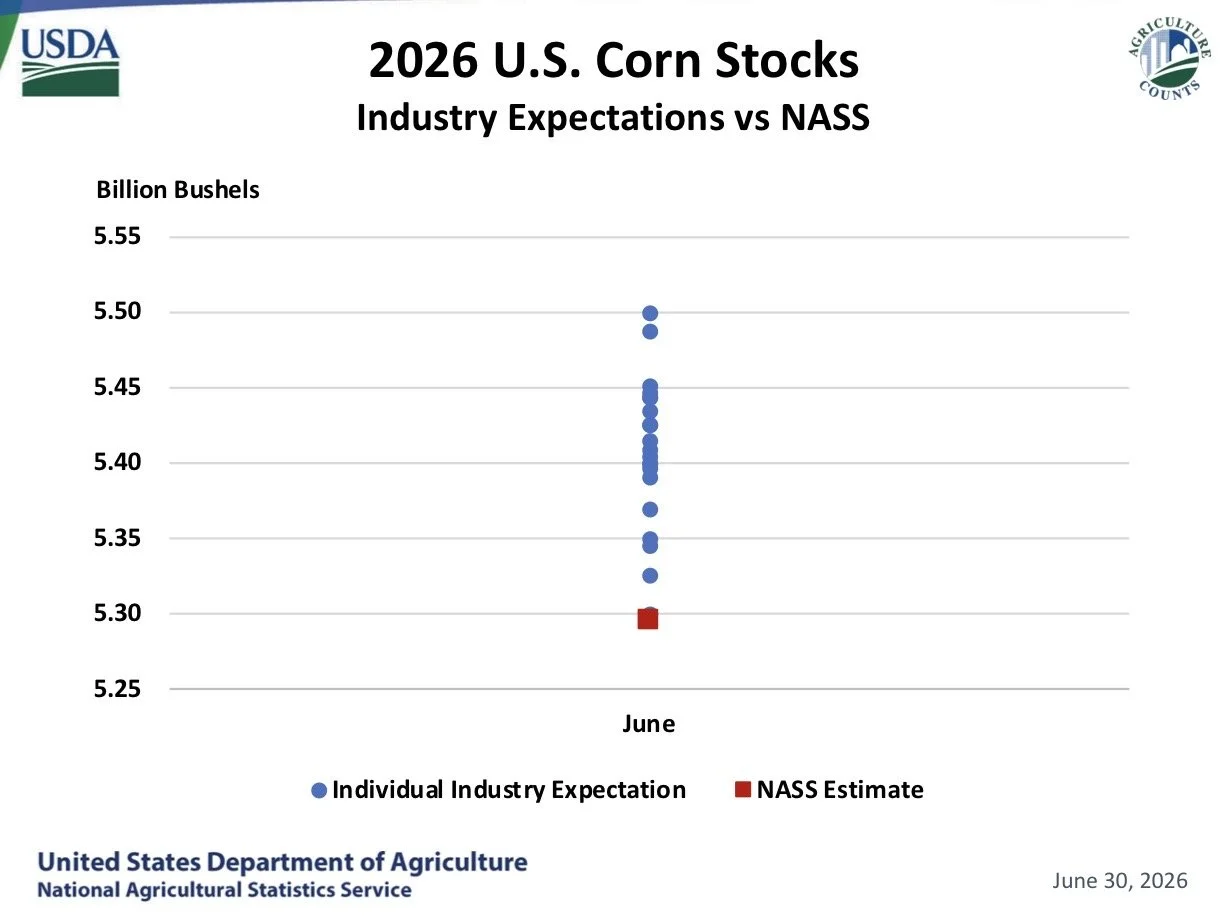
Corn Stocks vs Estimates:
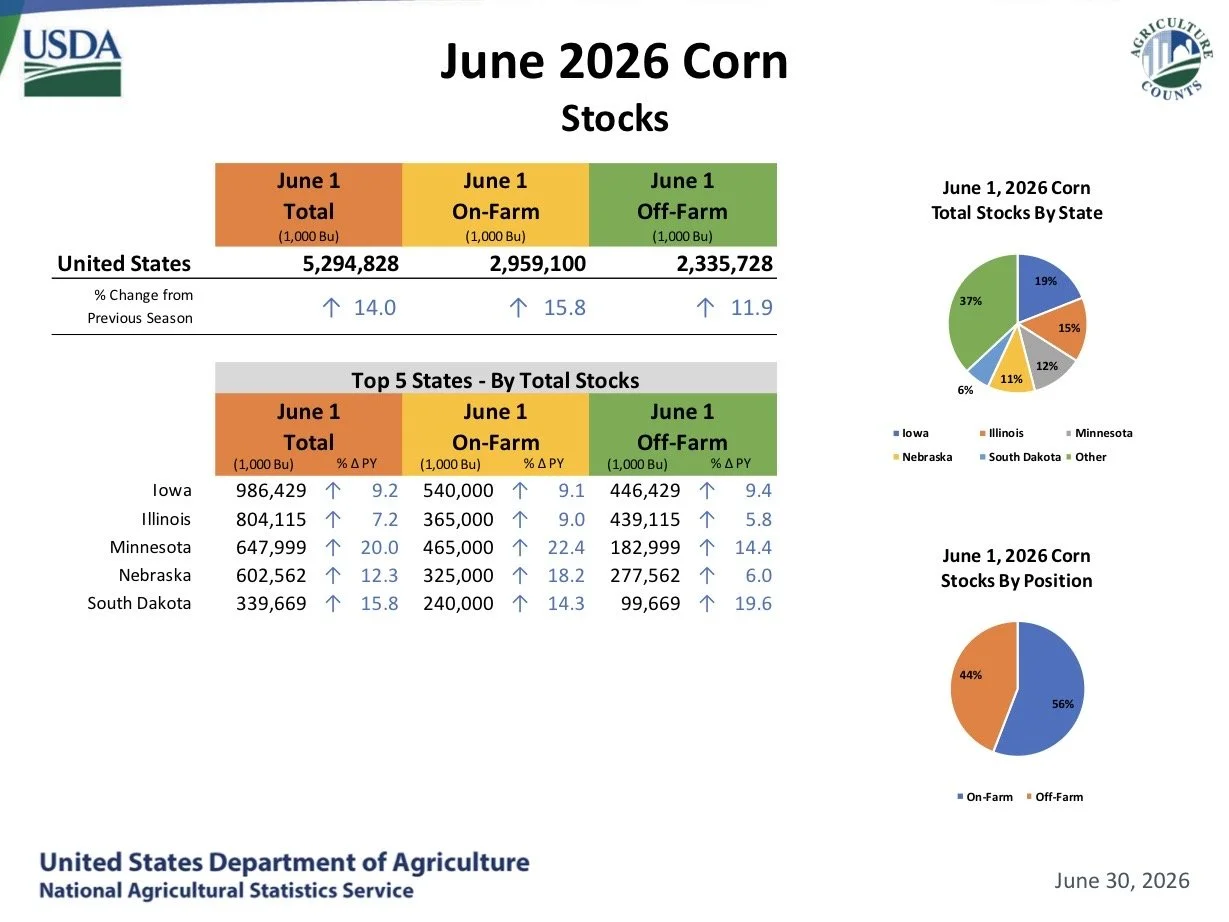
USDA Corn Stocks:
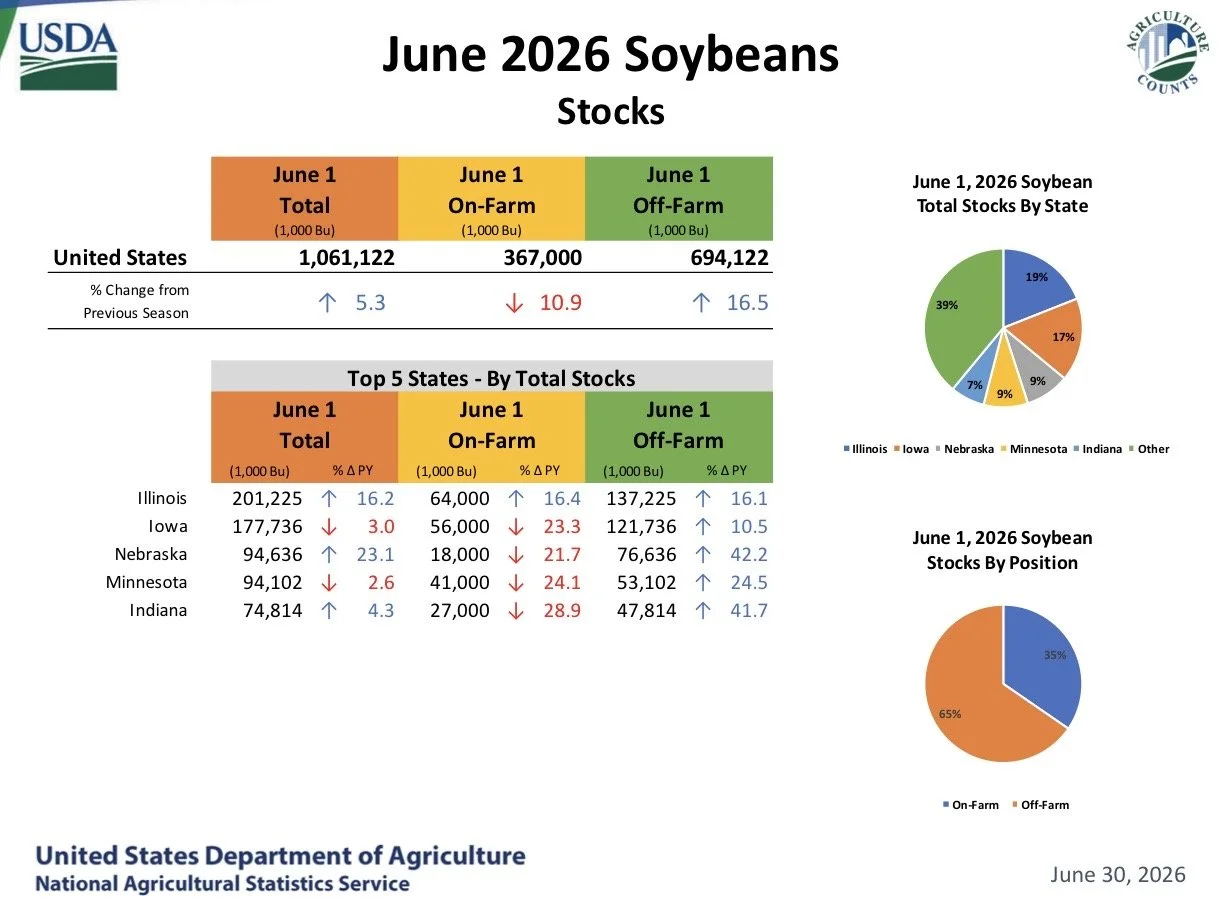
USDA Soybean Stocks:
USDA Wheat Stocks:
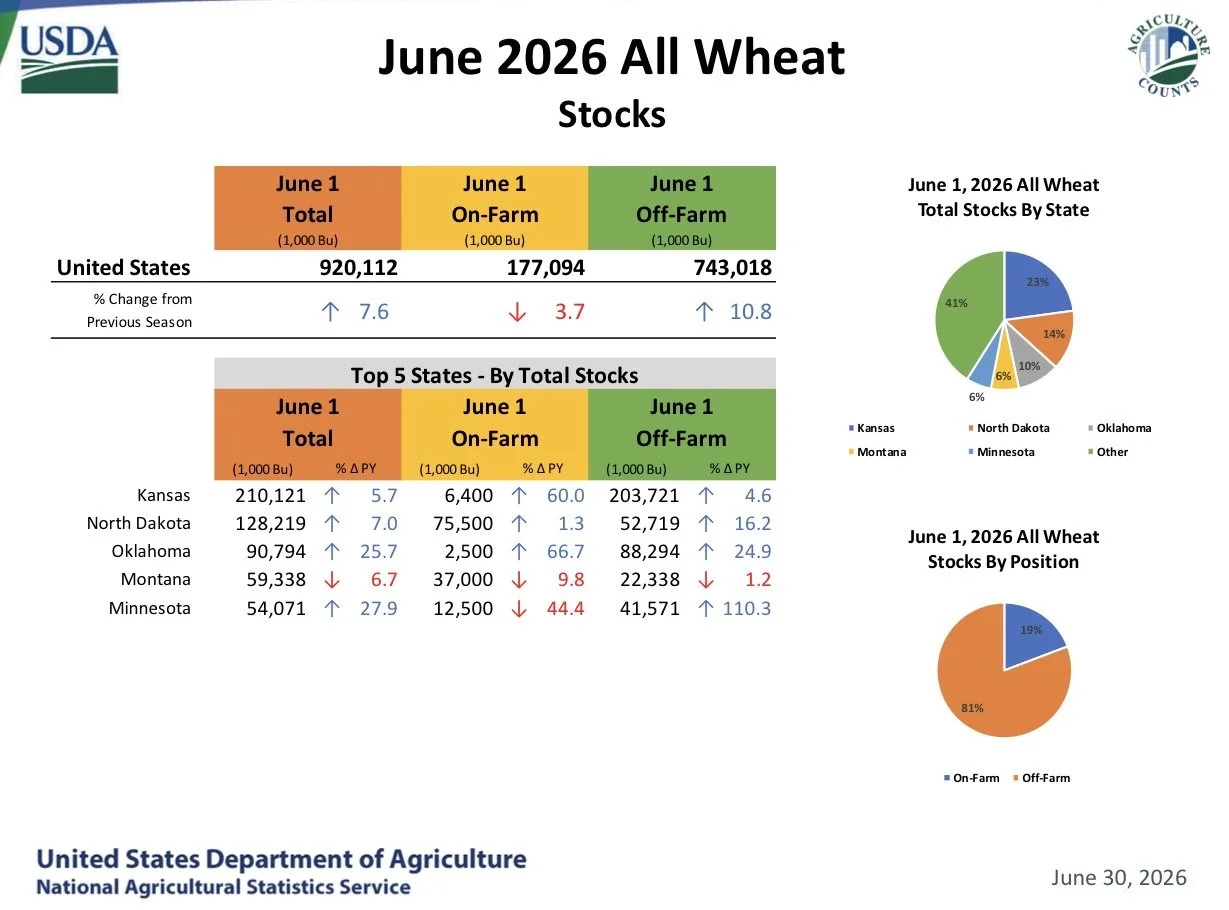
On Farm vs Off Farm Stocks:

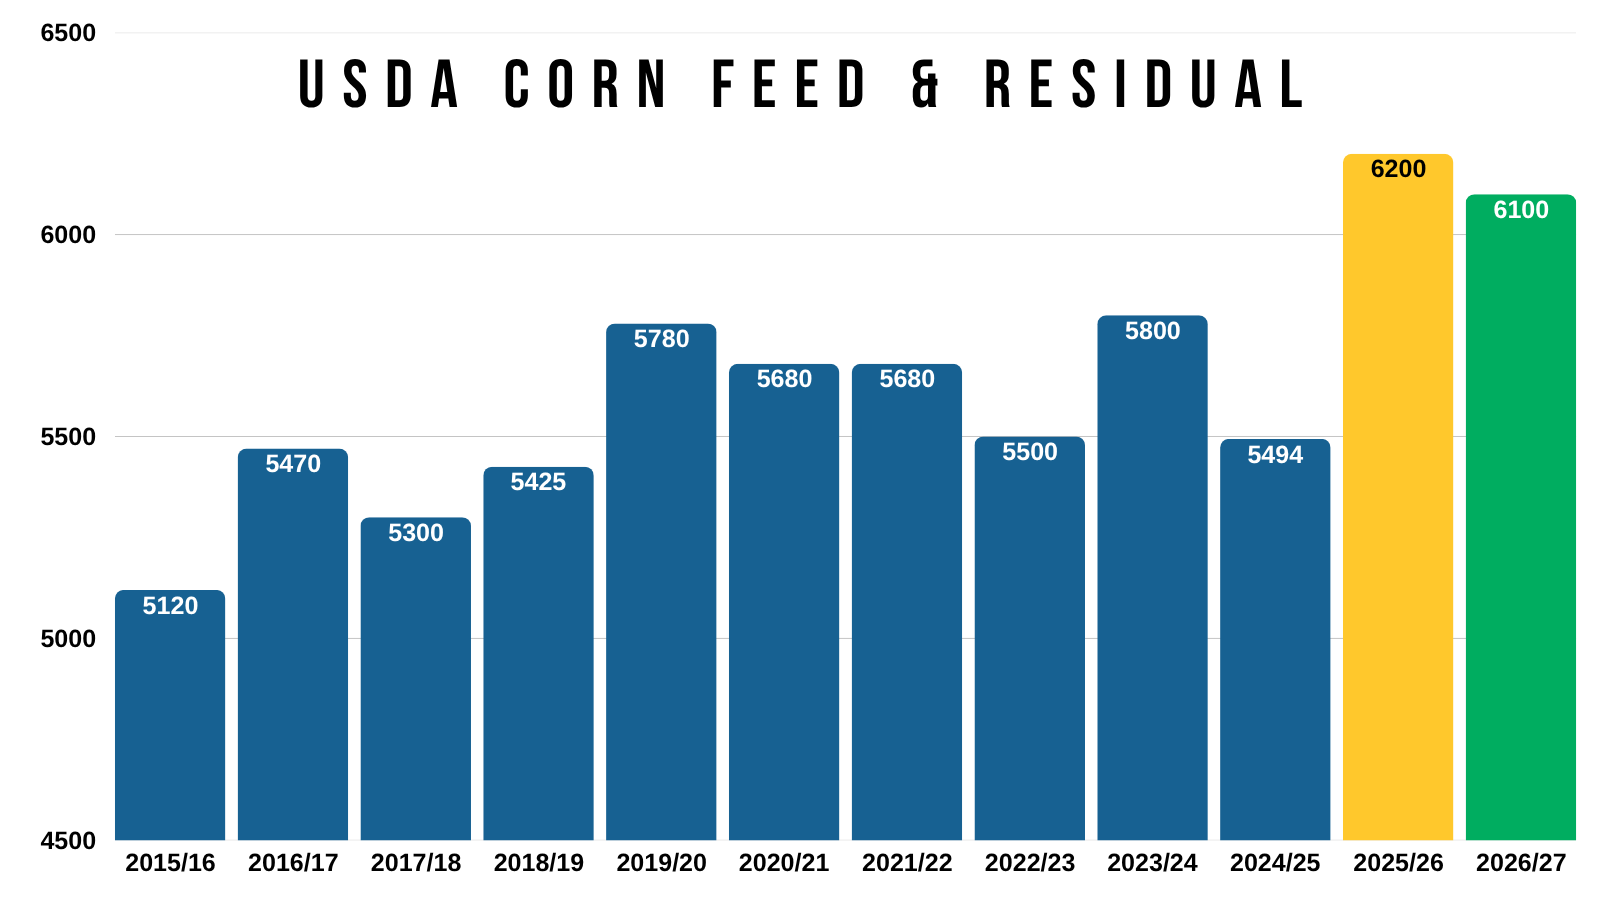
Corn USDA Feed & Residual:
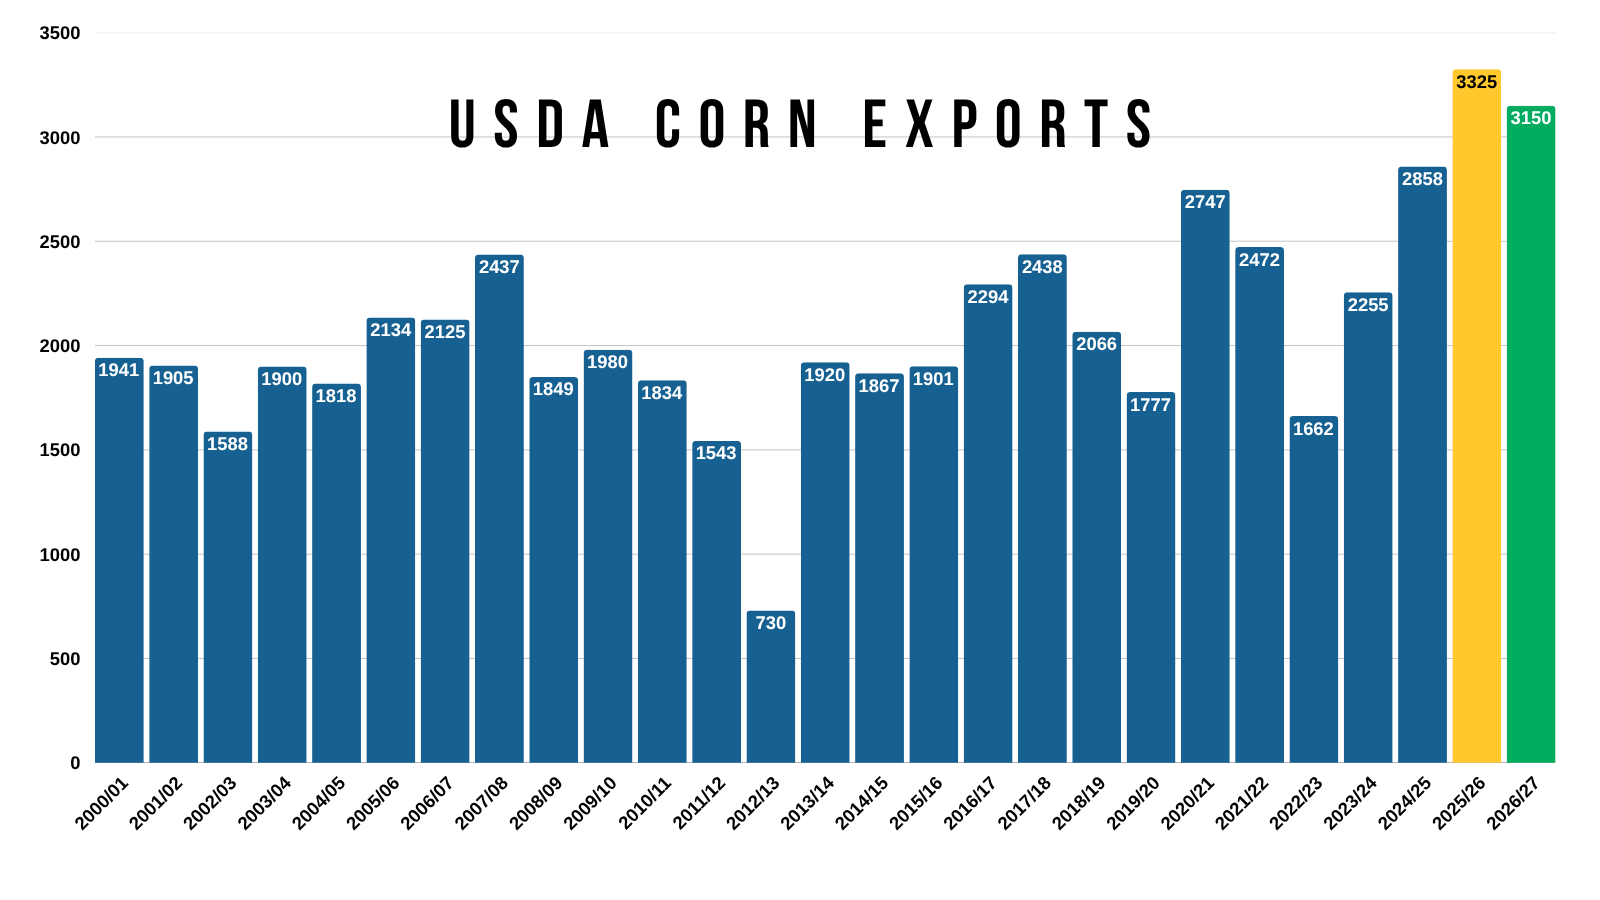
Corn USDA Exports:
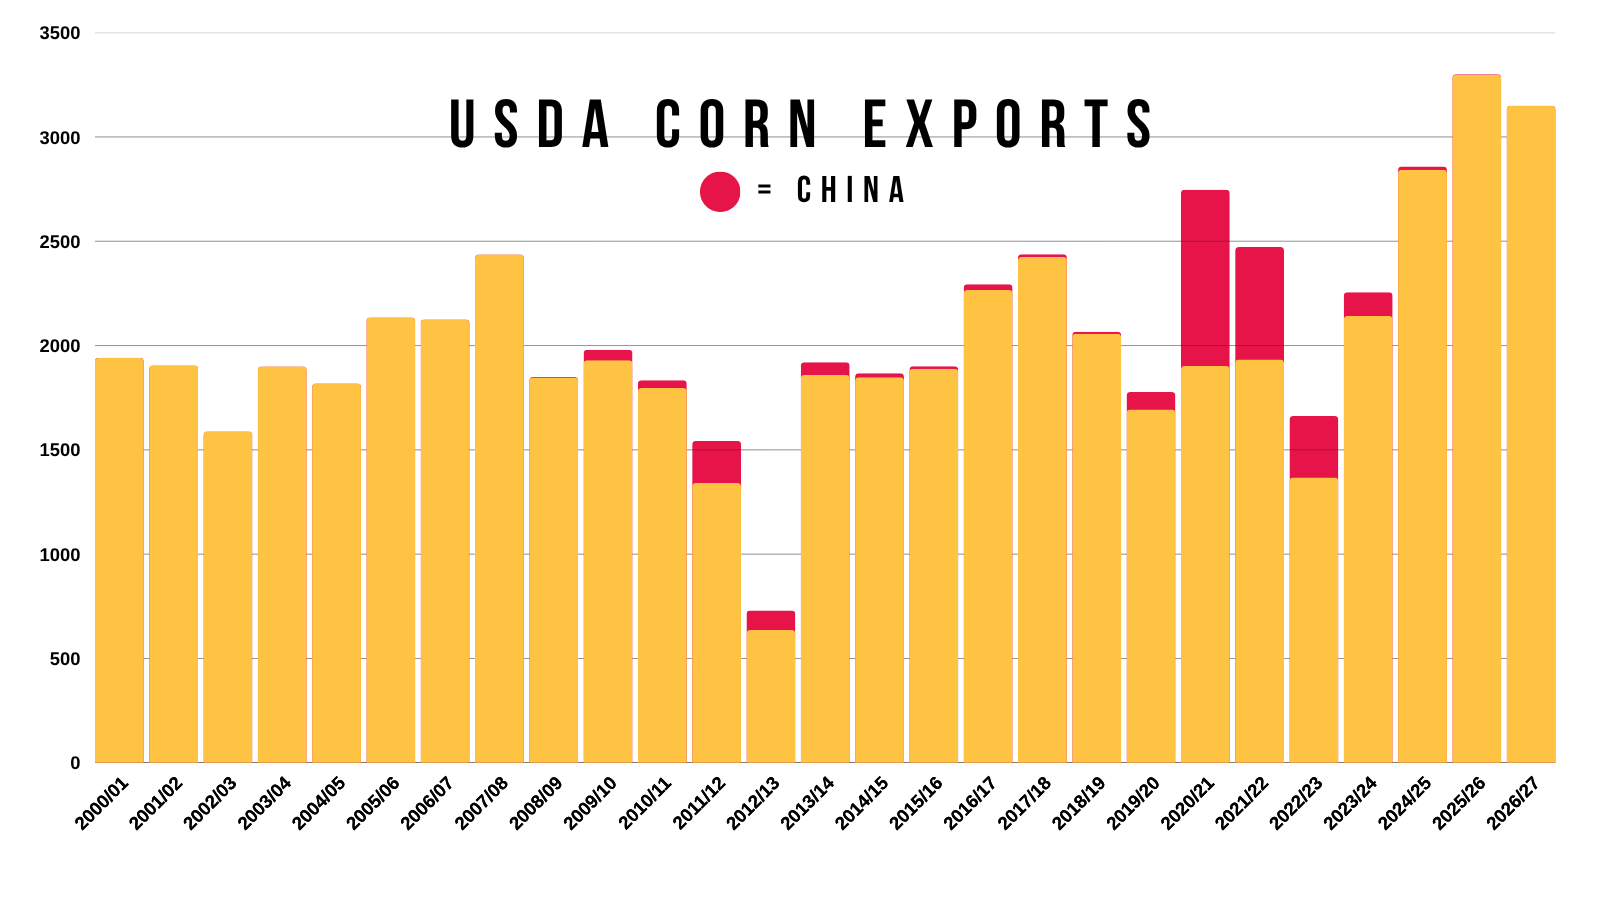
Corn USDA Exports (China + Non-China):
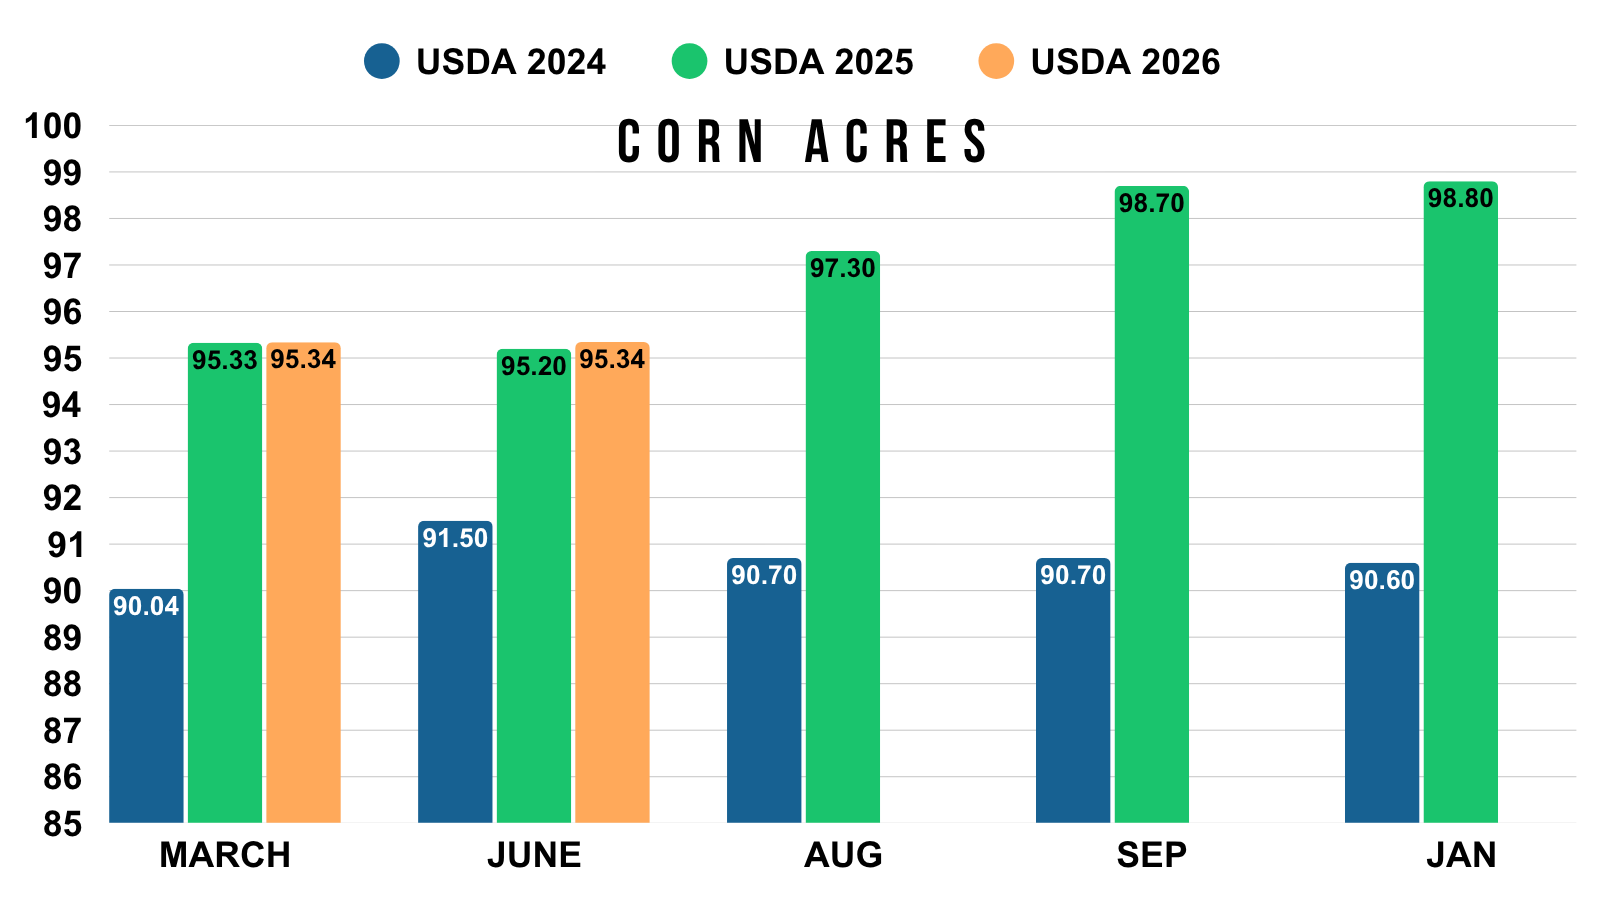
Corn Acres (Monthly Changes):
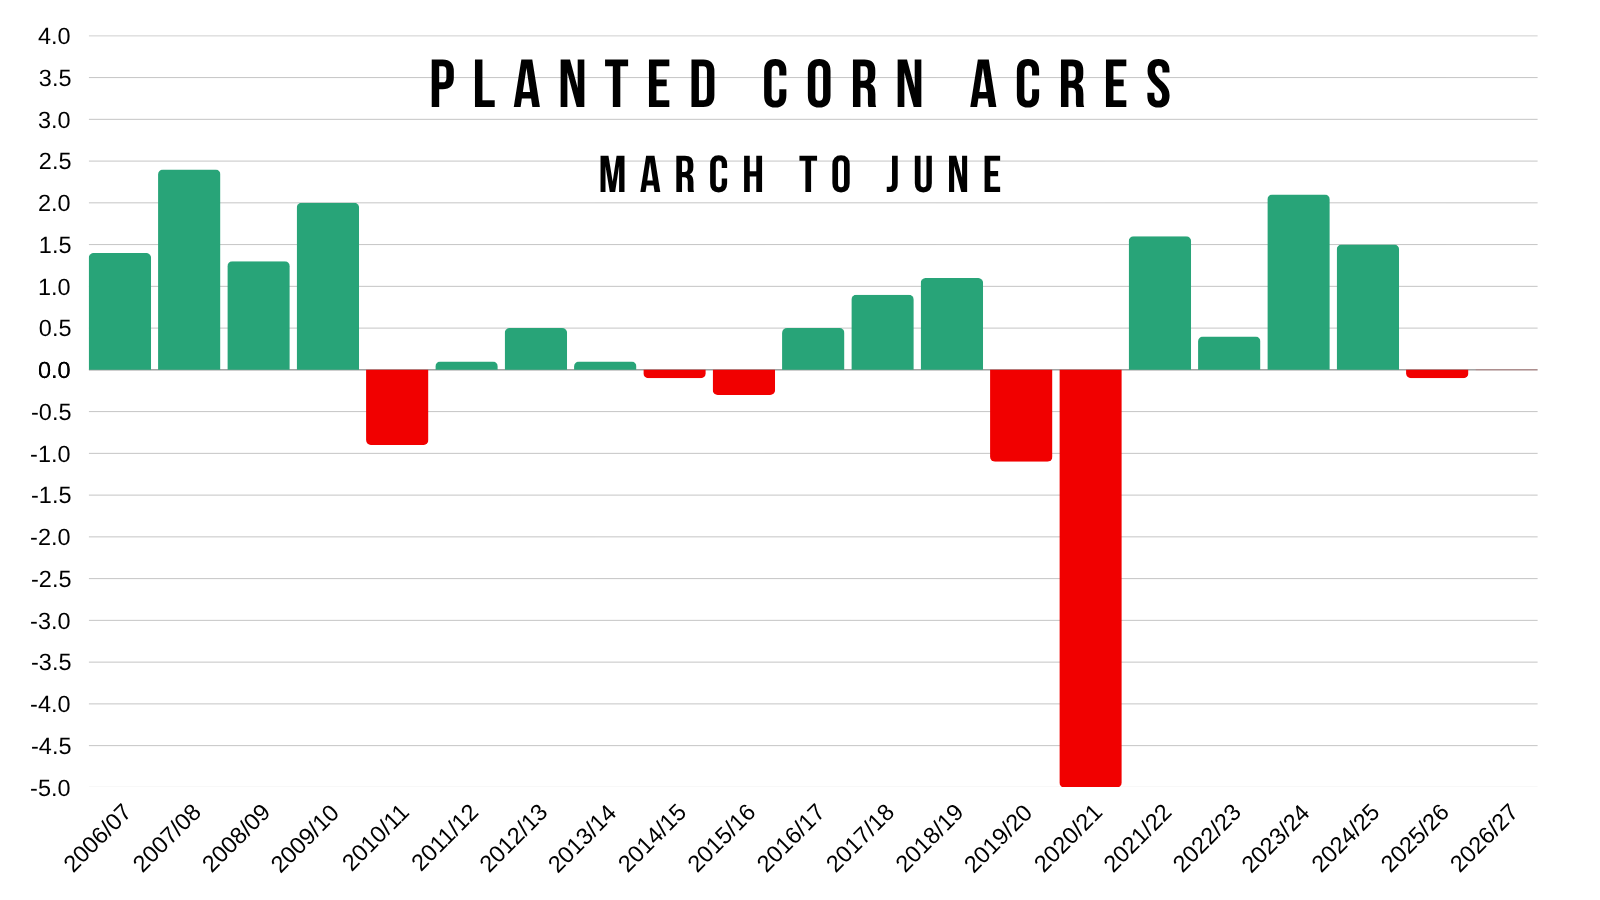
Corn Acres March to June:
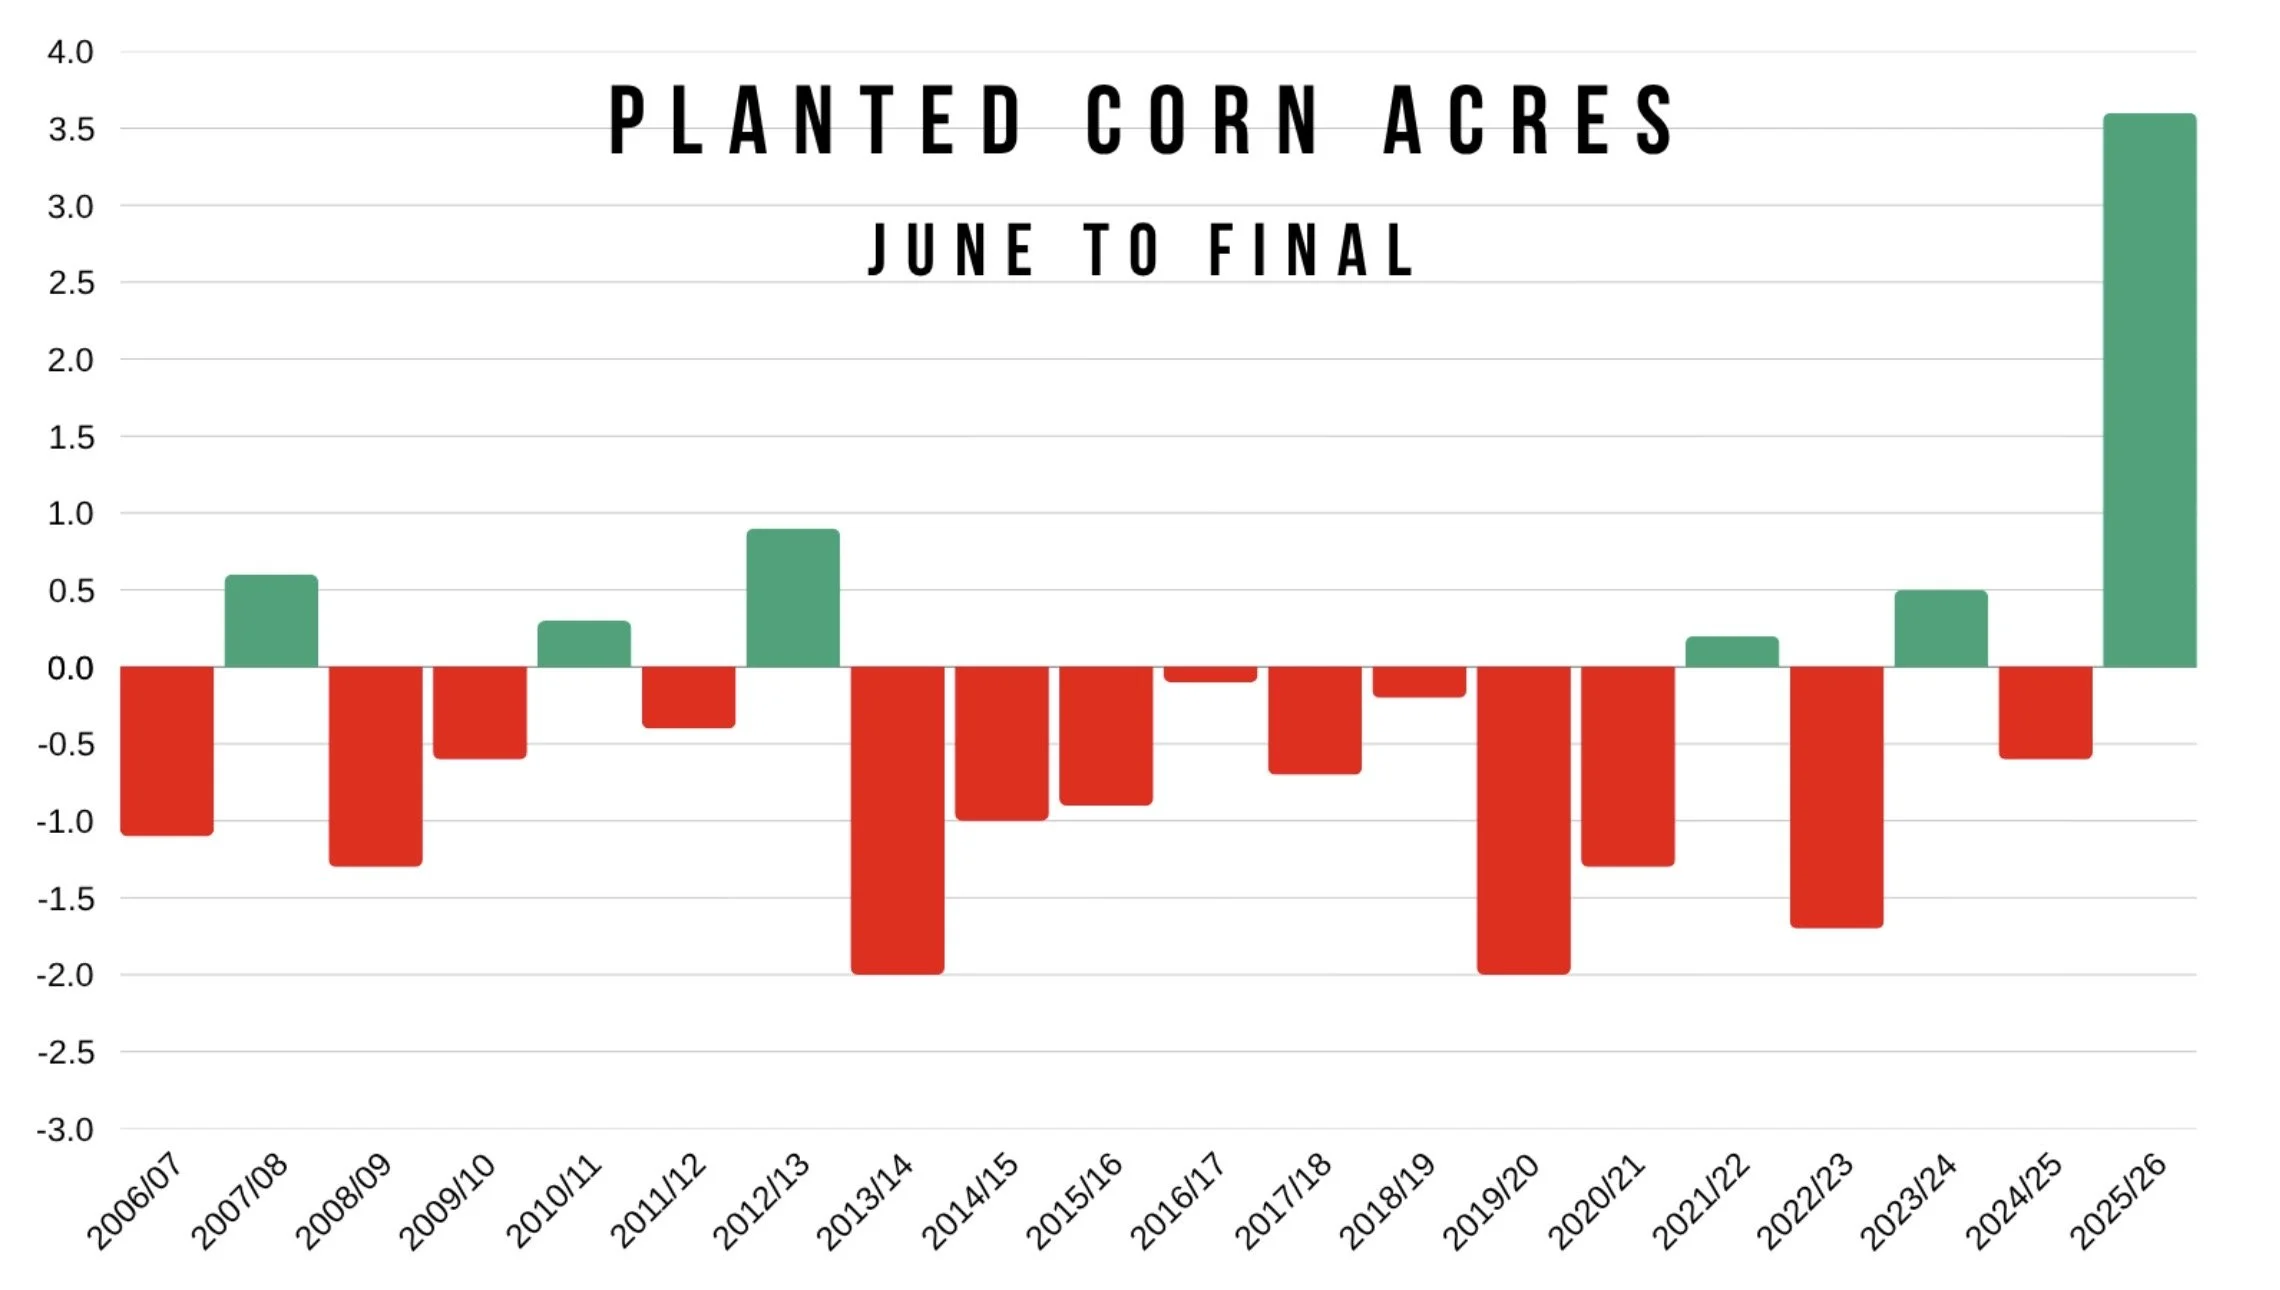
Corn Acres June to Final:
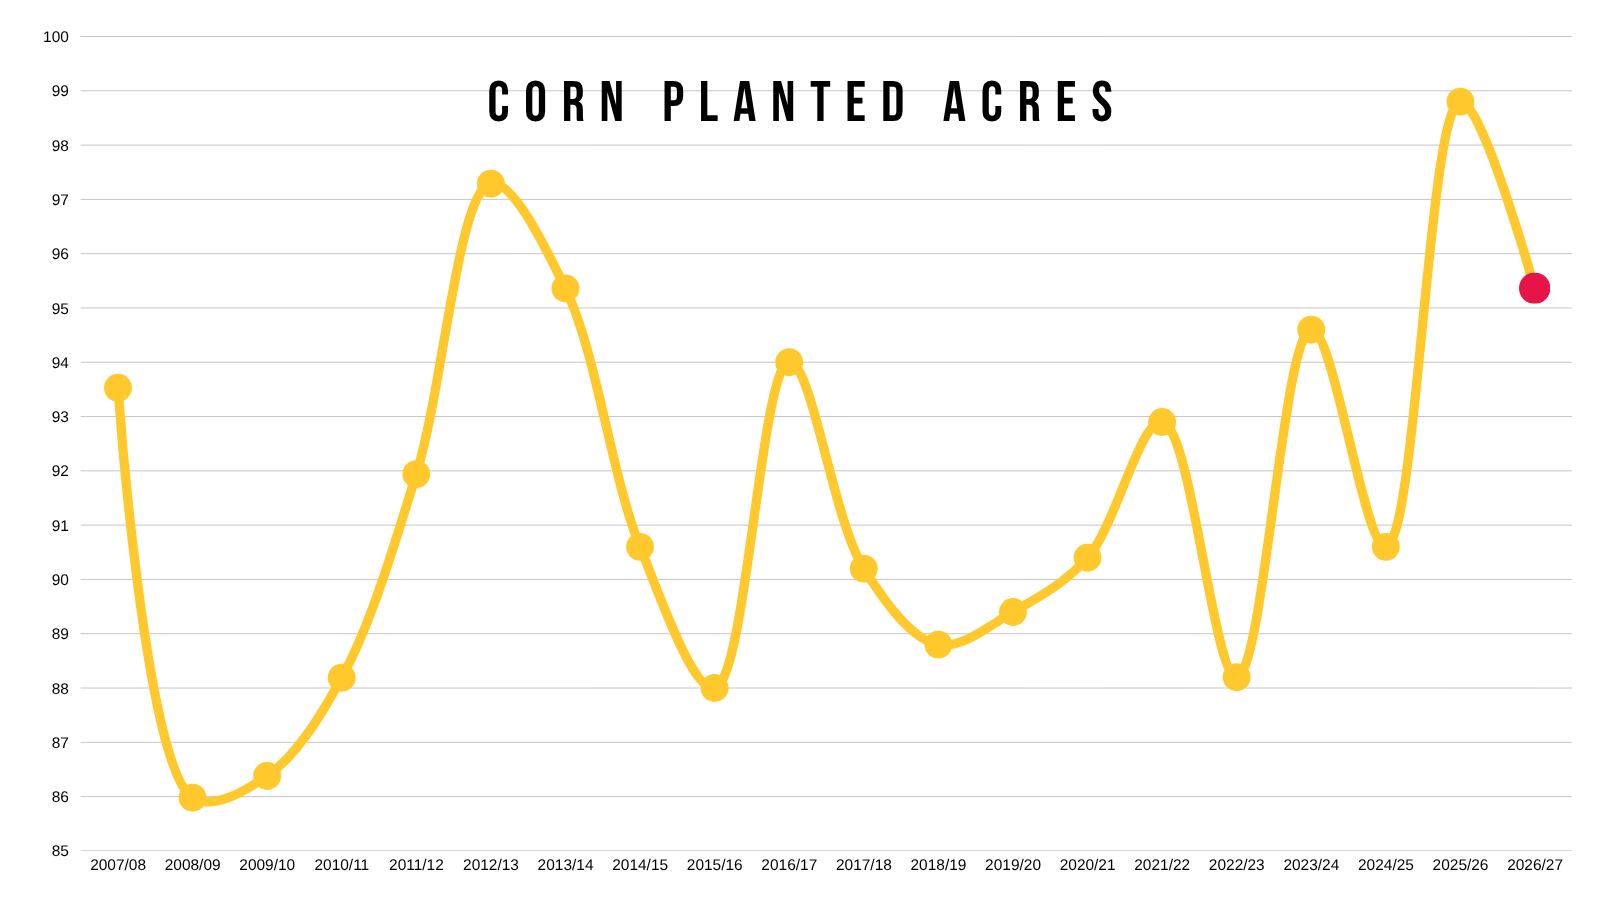
Corn Planted Acres Visual:
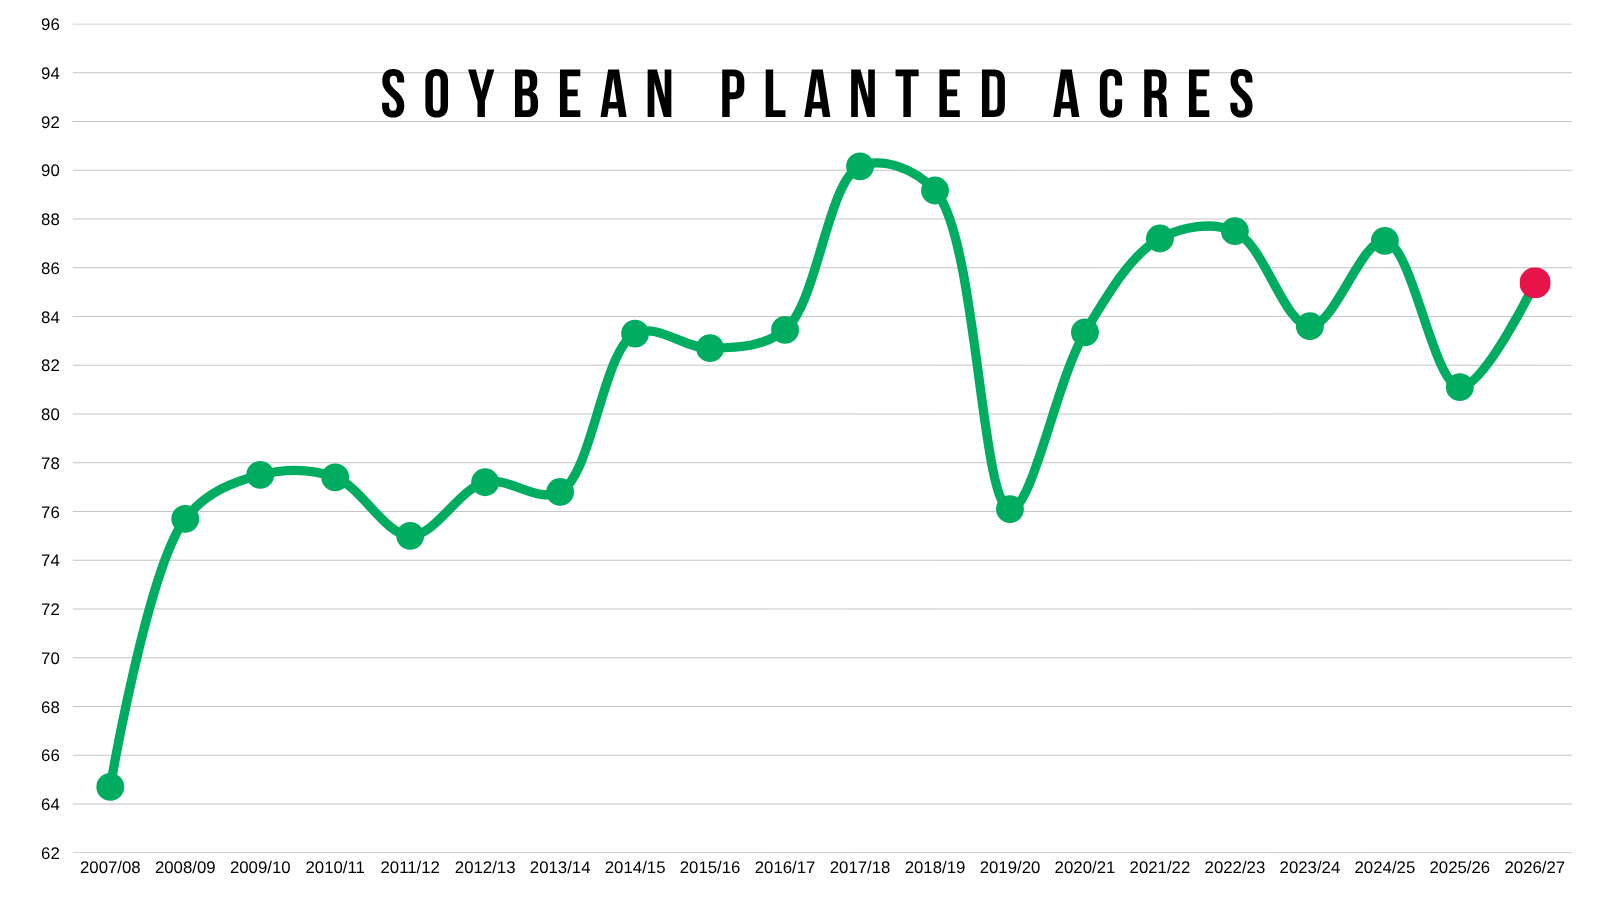
Soybean Planted Acres Visual:
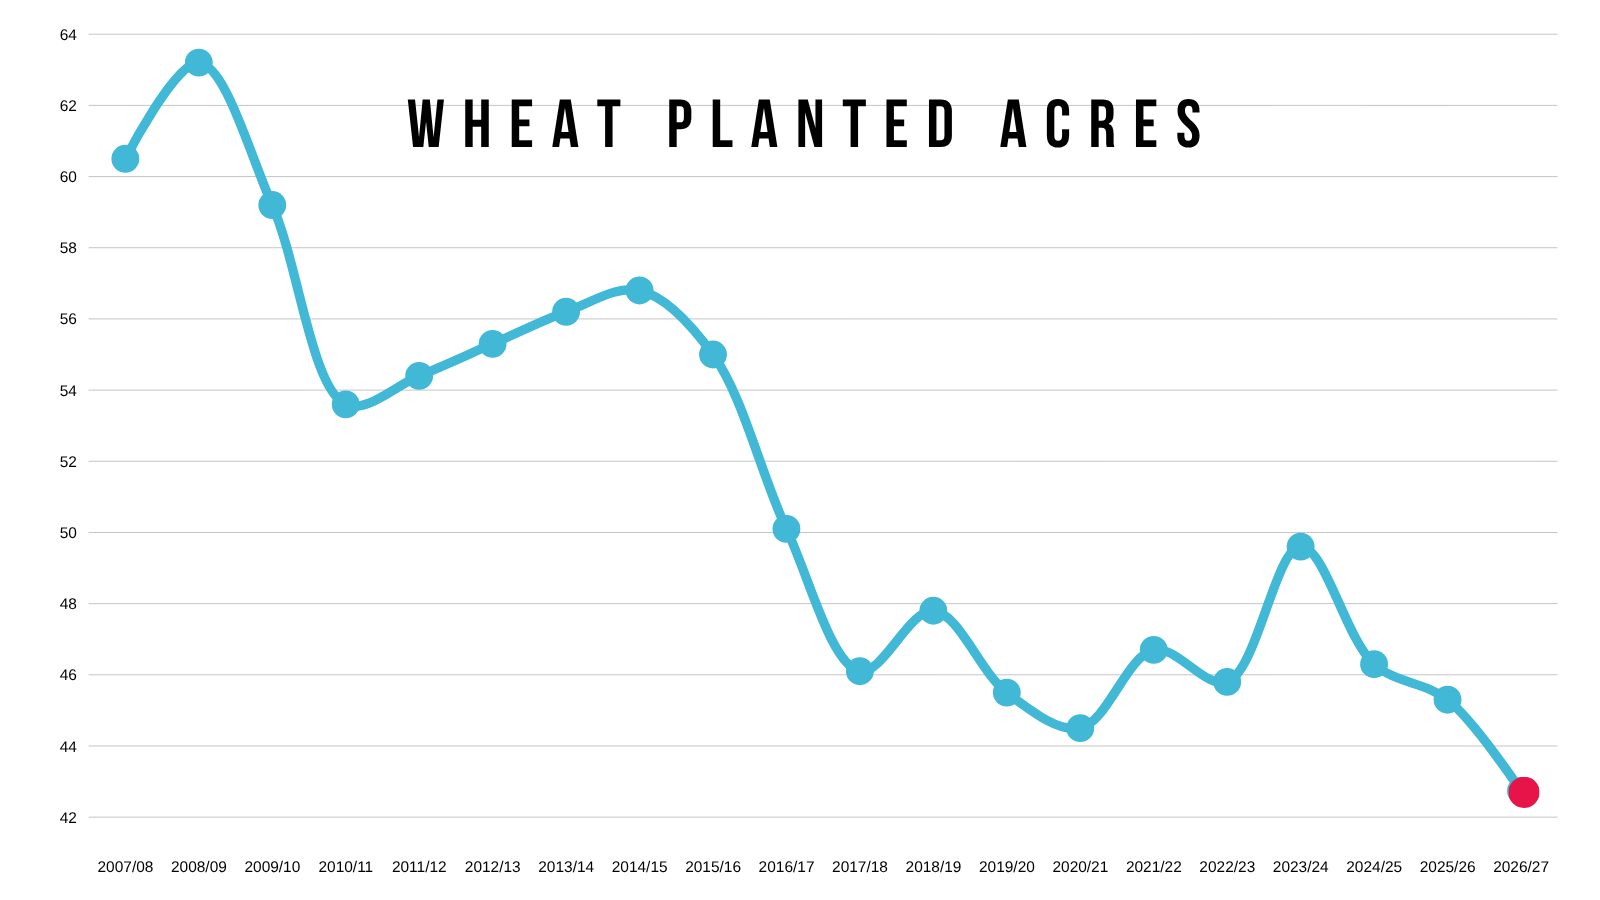
Wheat Planted Acres Visual:
Want to Talk?
Our phones are open 24/7 for you guys if you ever need anything or want to discuss your operation.
Jeremey & Office: (806)484-1214
Sebastian: (605)280-1186
Email: sfrost@dailymarketminute.com
Hedge Account
Interested in a hedge account? Use the link below to set up an account or give us a call.