
BORING USDA. EYES ON JUNE 30TH
MARKET UPDATE
You can scroll to read the usual update as well. As the written version is the exact same as the video.
Timestamps for video:
Overview & USDA: 0:00min
Corn: 4:00min
Beans: 11:35min
Wheat: 14:00min
Cattle: 15:50min
Want to talk?
Office: (806)484-1214
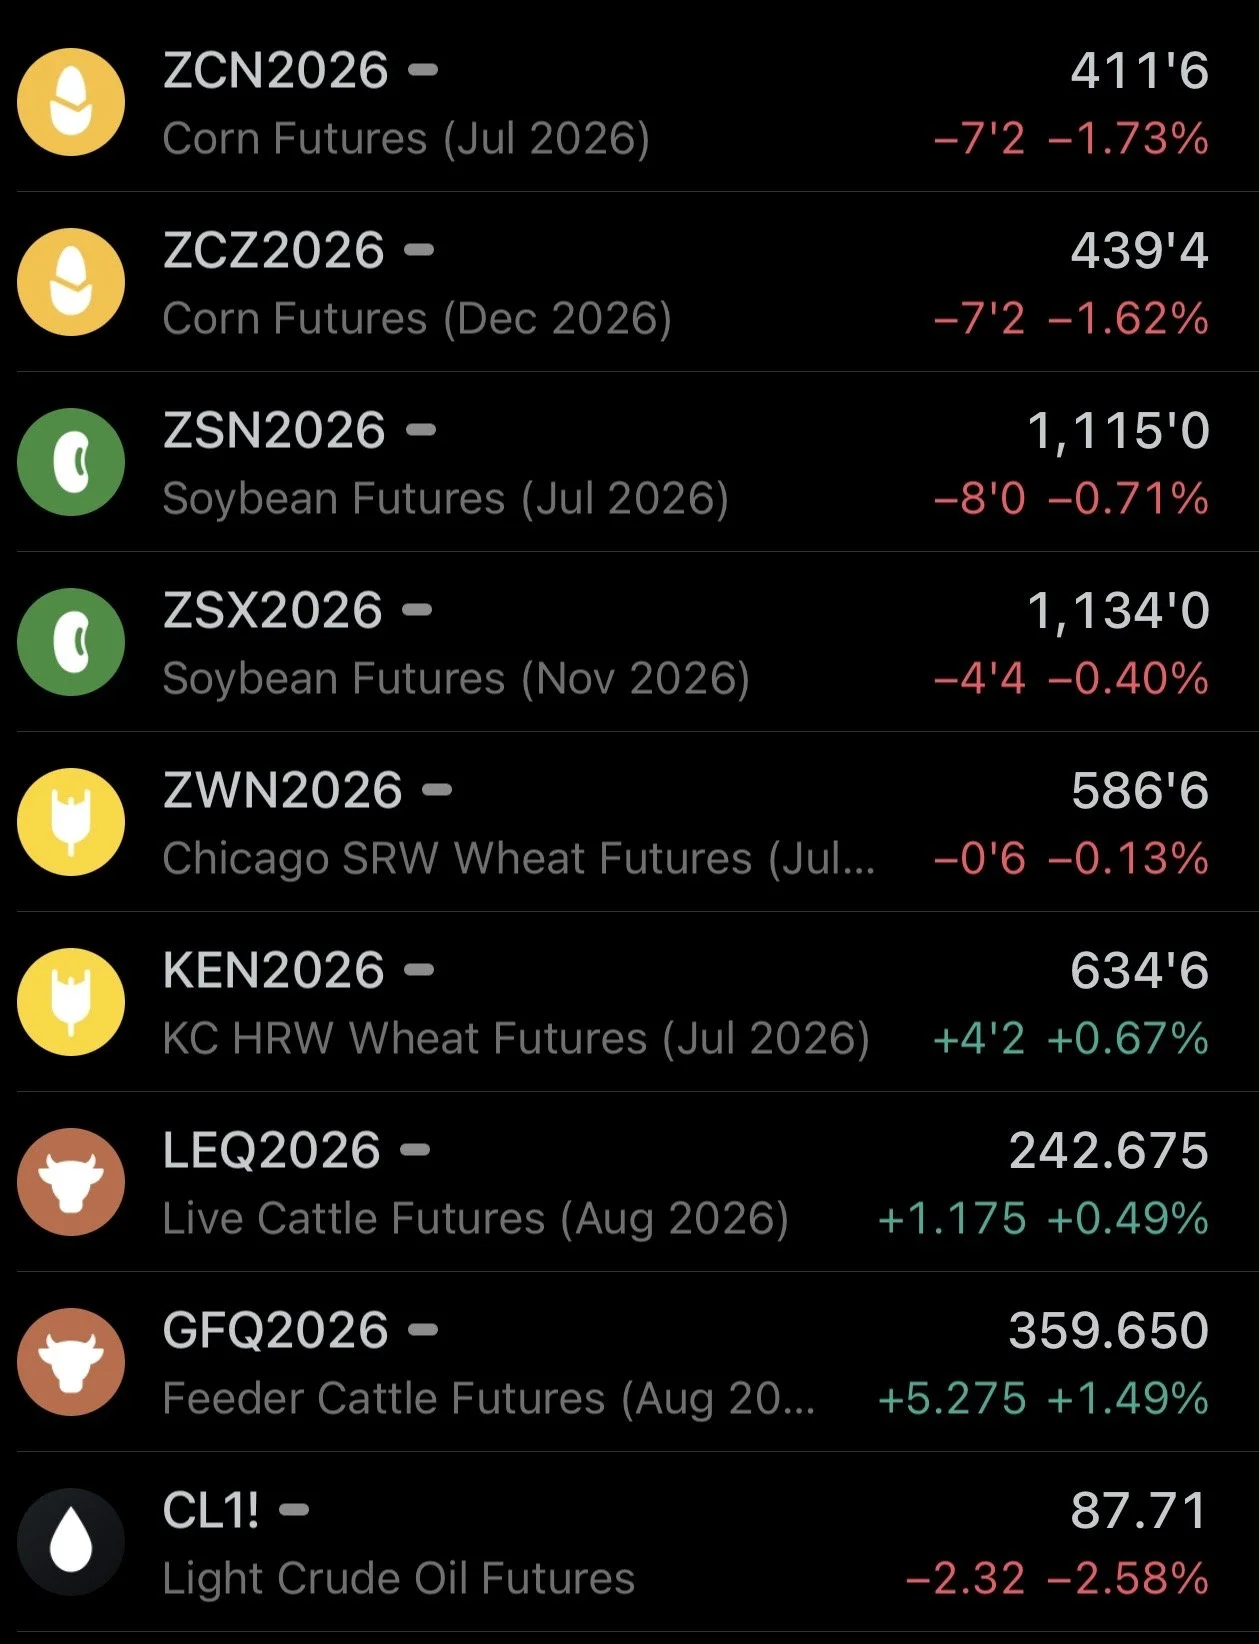
Futures Prices Close
Overview
Corn and soybeans hit hard today, meanwhile the wheat market tried to hang in there while cattle caught a bid.
Today we had the June WASDE report.
Overall it was a complete non-event, despite the poor price action.
It wasn’t even a major negative reaction after the report. We kind of just drifted lower as the day went.
USDA Recap
If we look at the numbers, it didn’t provide any major changes as expected. Especially for the US balance sheets.
This report usually isn’t a market mover.
The market will have more interest in the June 30th stocks and acres report at the end of the month. That report can tend to be one of the bigger ones of the year. So that is really going to be the next big thing that can move the market.
That report won’t give us final acres, but it'll be our first update we'll get since March.
Corn and soybeans came in right in line with the trade estimates for both old crop and new crop, while new crop wheat did come in a little lower than the trade was expecting.

The South America numbers were the bigger changes in the report.
South America Corn:
The USDA bumped Argentina's corn crop, but that was expected.
Brazil corn however came in a good amount higher than the trade was expecting.
South America Beans:
Argentina soybeans came in higher than expected.
Brazil soybeans were unchanged.

World Numbers:
World corn ended up coming in higher than expected with the big South America crops.
So this was a bearish item for corn. But the market often tends to not care too much about the world corn numbers, given the world stocks to use is at 14-year lows.
World soybeans and wheat were basically unchanged from last month.

Balance Sheet Changes
Old Crop Corn:
They lowered ethanol demand by 25 milllion bushels.
At the same time they raised exports by 25 million bushels.
Resulting in a complete wash on the balance sheet.
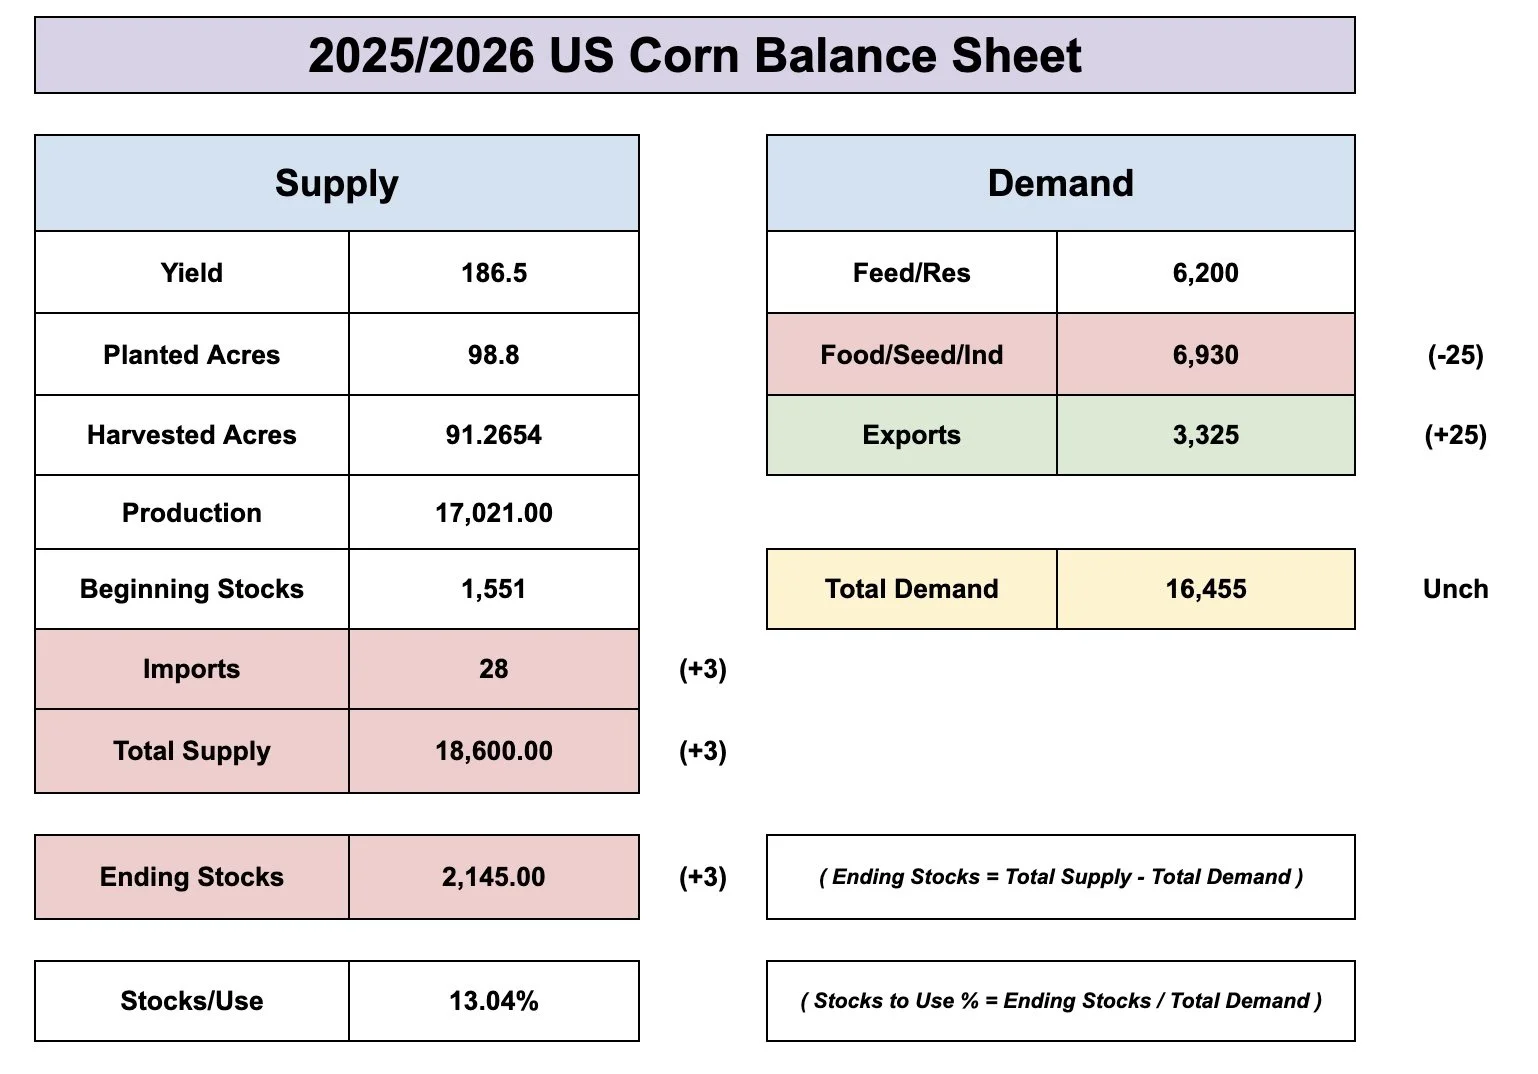
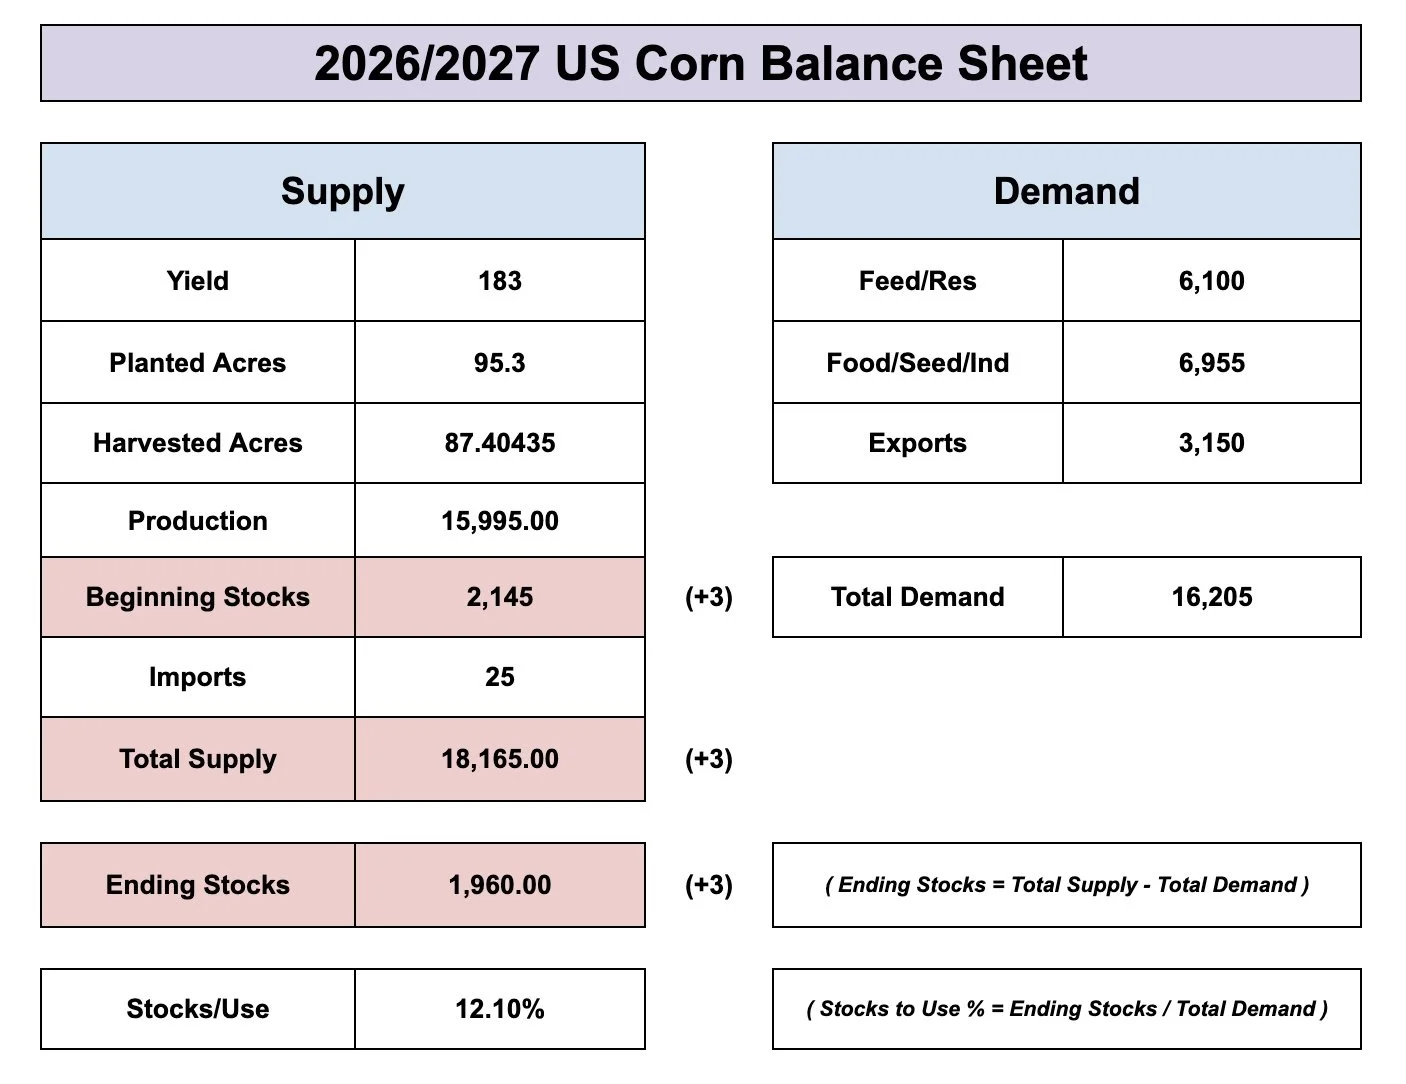
New Crop Corn:
No changes here.
We had a minuscule 3 million bushel increase from the beginning stocks.
We'll go over some balance sheet scenarios in the corn section.
Old Crop Soybeans:
They dropped our exports by 20 million bushels.
They also raised our crush demand by 20 million bushels.
So another complete wash on the balance sheet as it remains unchanged.
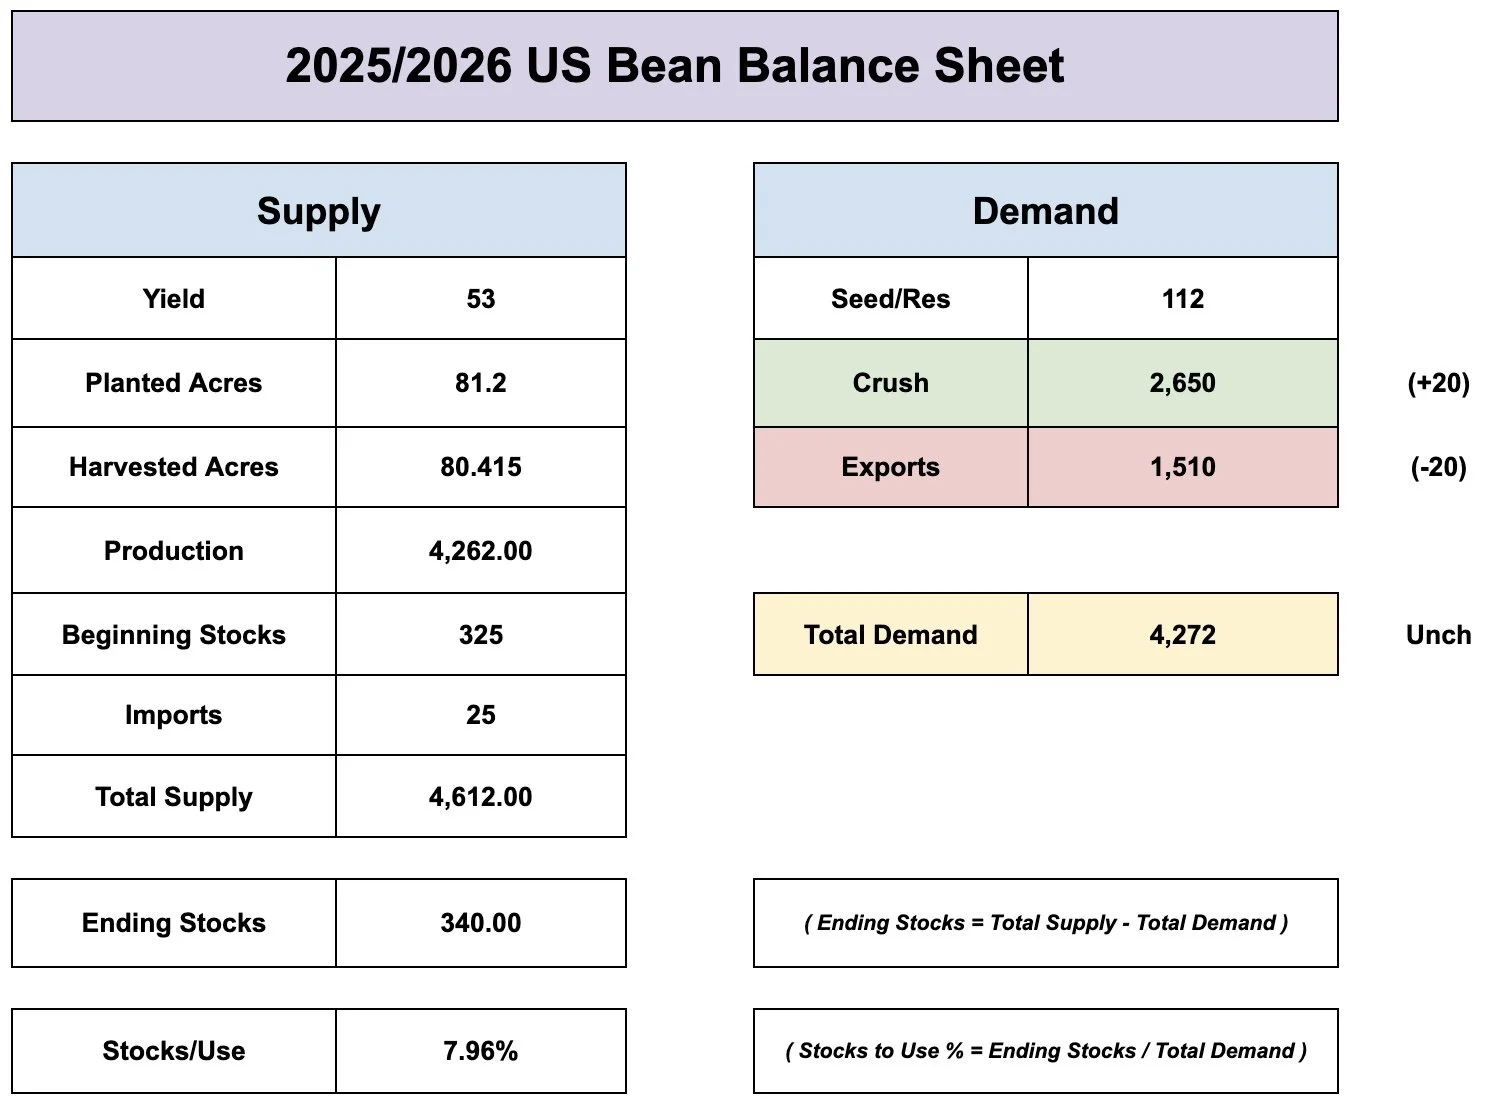
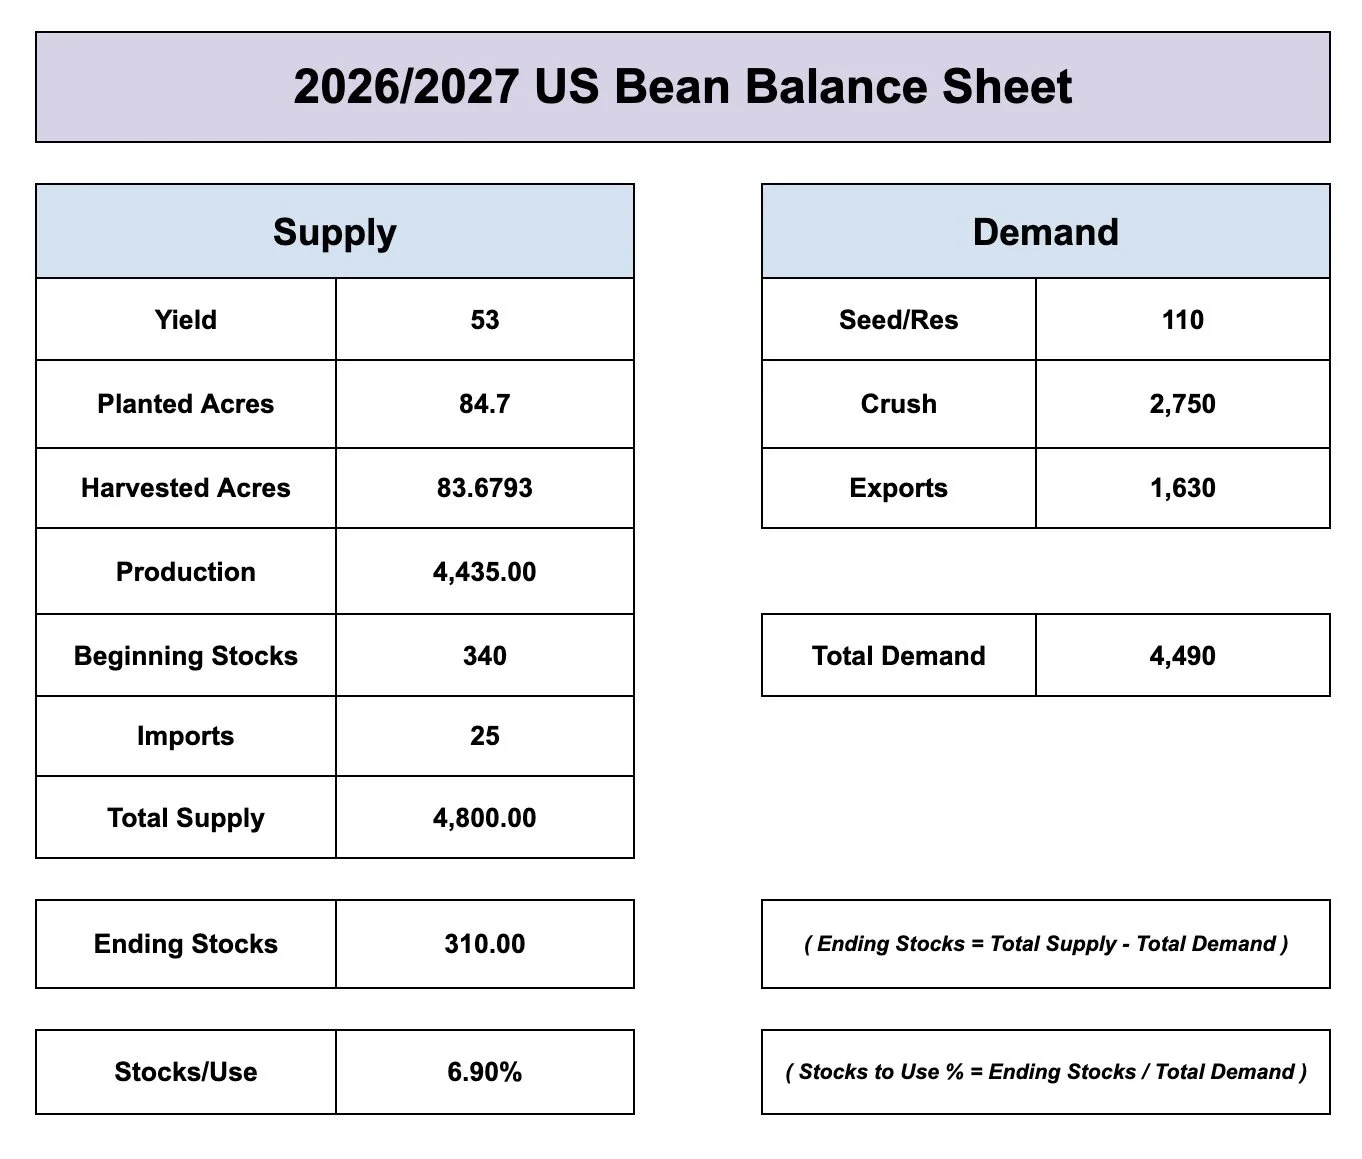
New Crop Soybeans:
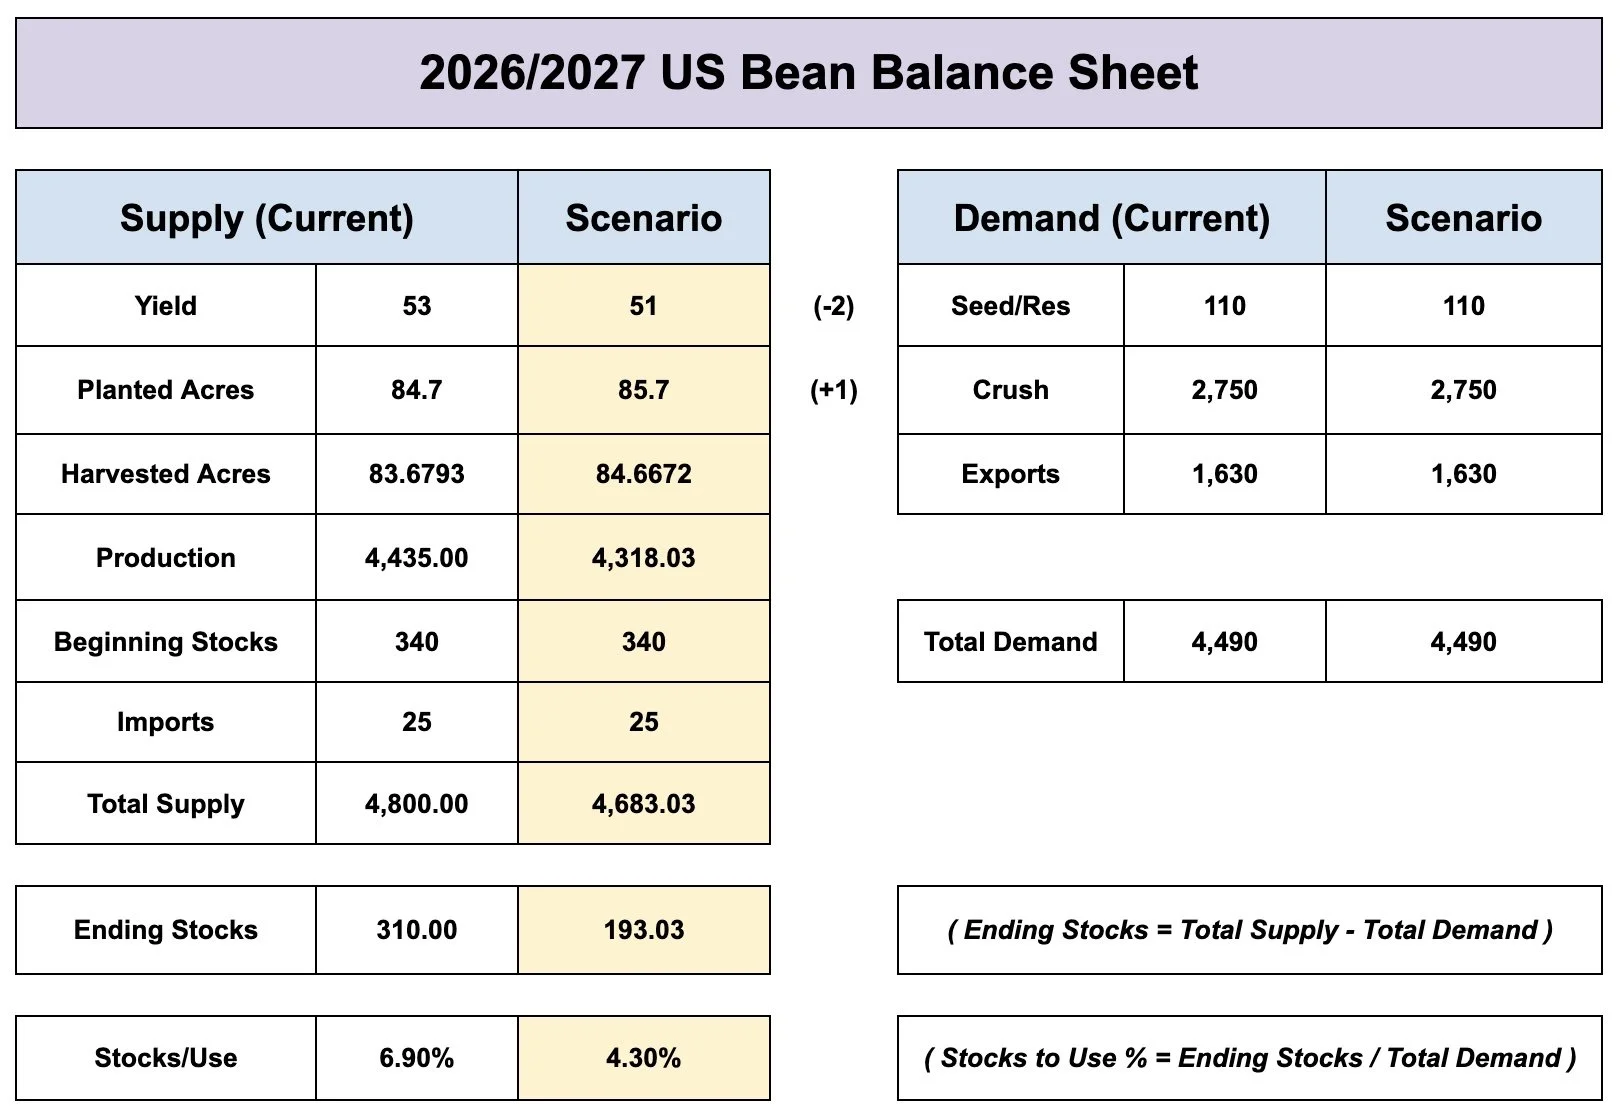
Not a single change was made.
Still looking at a carryout of 310 million.
Old Crop Wheat:
No changes at all.
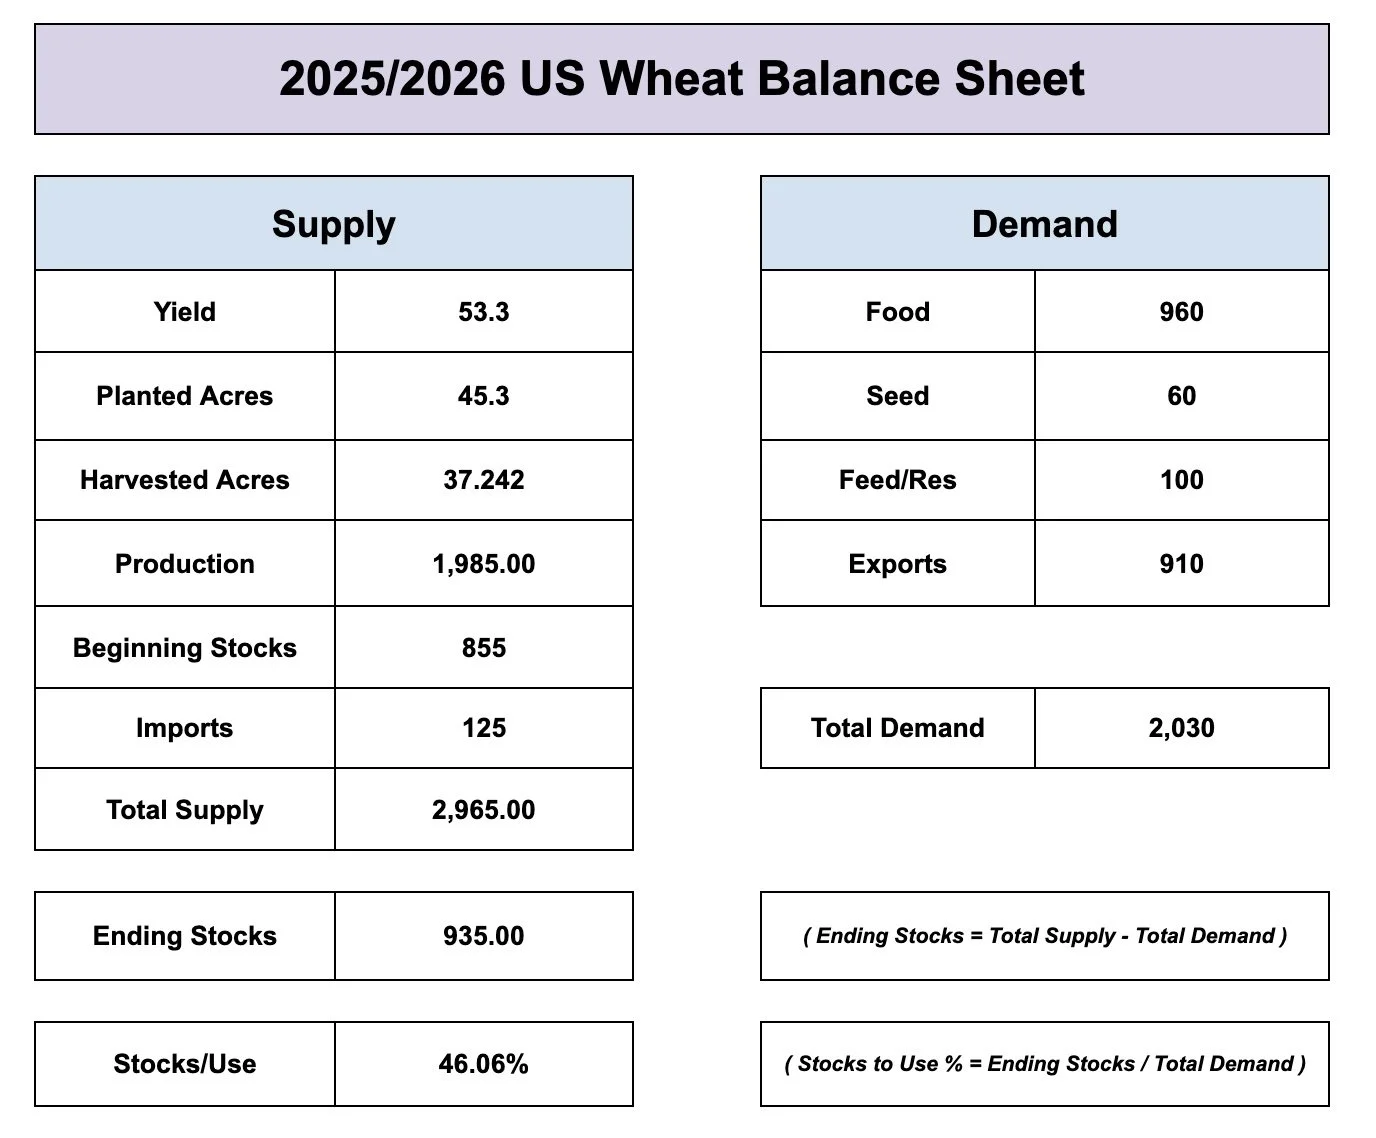
New Crop Wheat:
This was the only real change made on any of the US balance sheets.
They dropped yield by 0.5 bpa, down to 47 bpa.
As a result production and carryout dropped by 18 million bushels.

They ended up cutting winter wheat yield again by 0.8 bpa, down to 46.8 bpa.
That would be the lowest yield in 11 years.

War Headlines & Crude Pressure
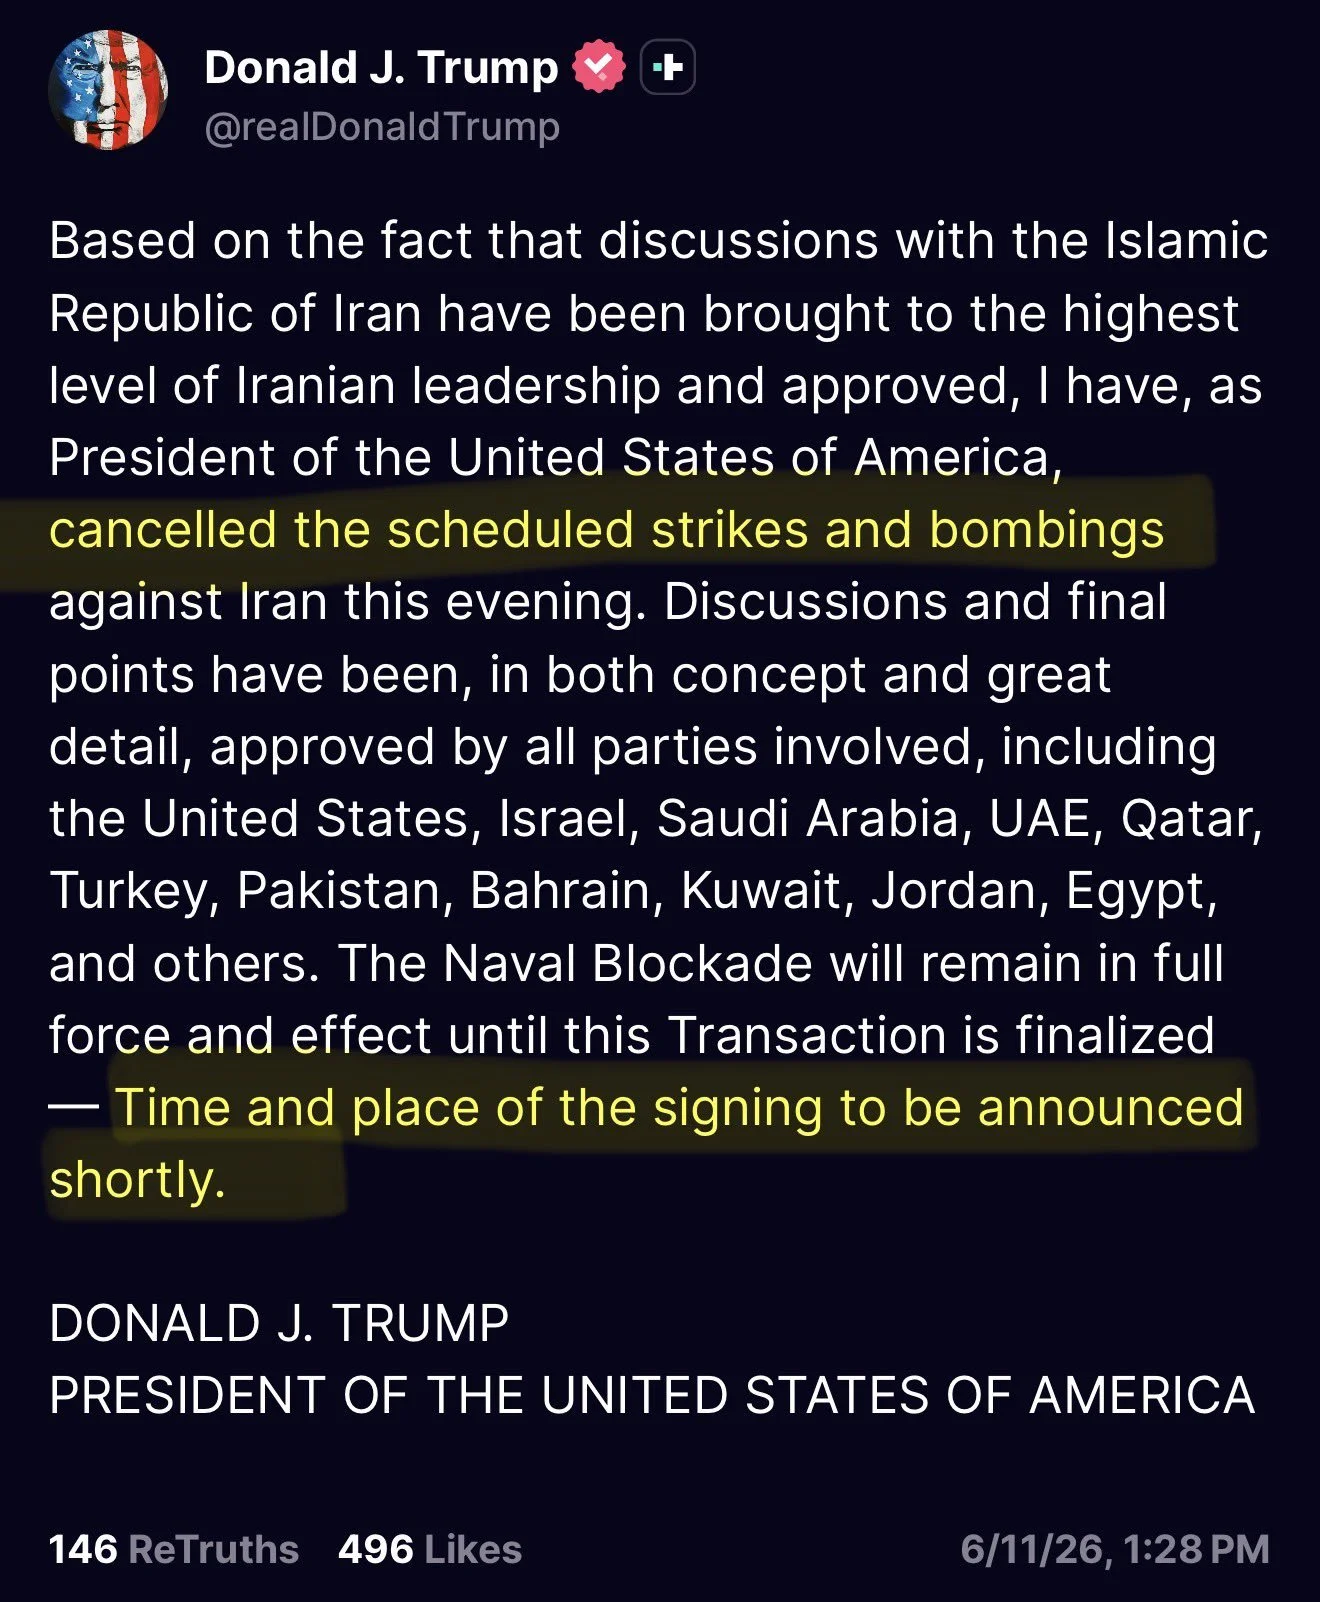
War headlines continue to be all over the place.
The last few days and even this morning Trump was saying he was going to bomb Iran tonight.
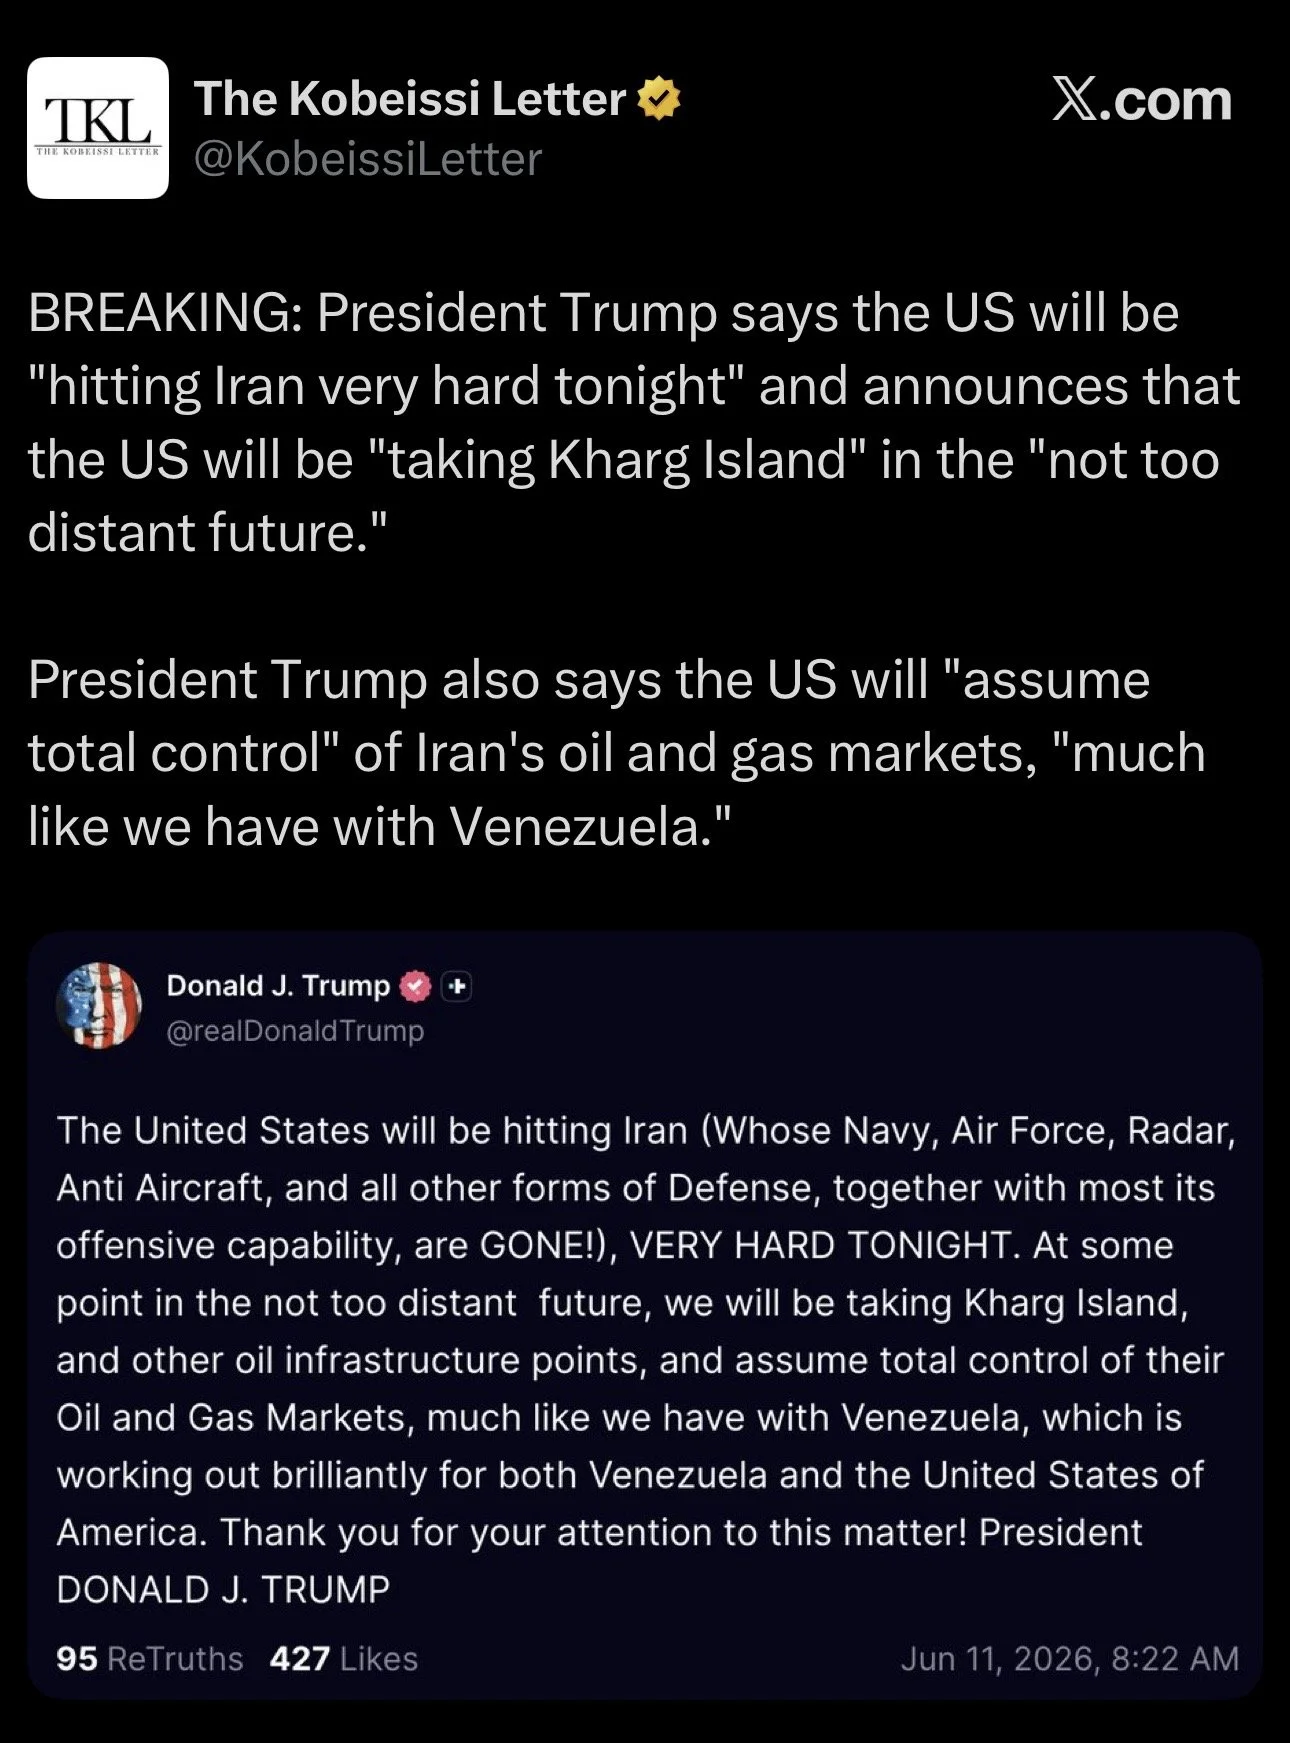
This afternoon he then announced he was cancelling the strikes that were scheduled for tonight, and instead he claims that:
"Discussions and final points have been approved by all parties"
"Time and place of the signing of the deal to be announced shortly"
As a result we saw crude oil take a hit, which added even further pressure on the grains today.
SpaceX Causing Funds to Sell?
I am sure there are a thousand other reasons the funds jumped ship when they did.
You have good weather. No signs of China. We had already priced in plenty of bullish items.
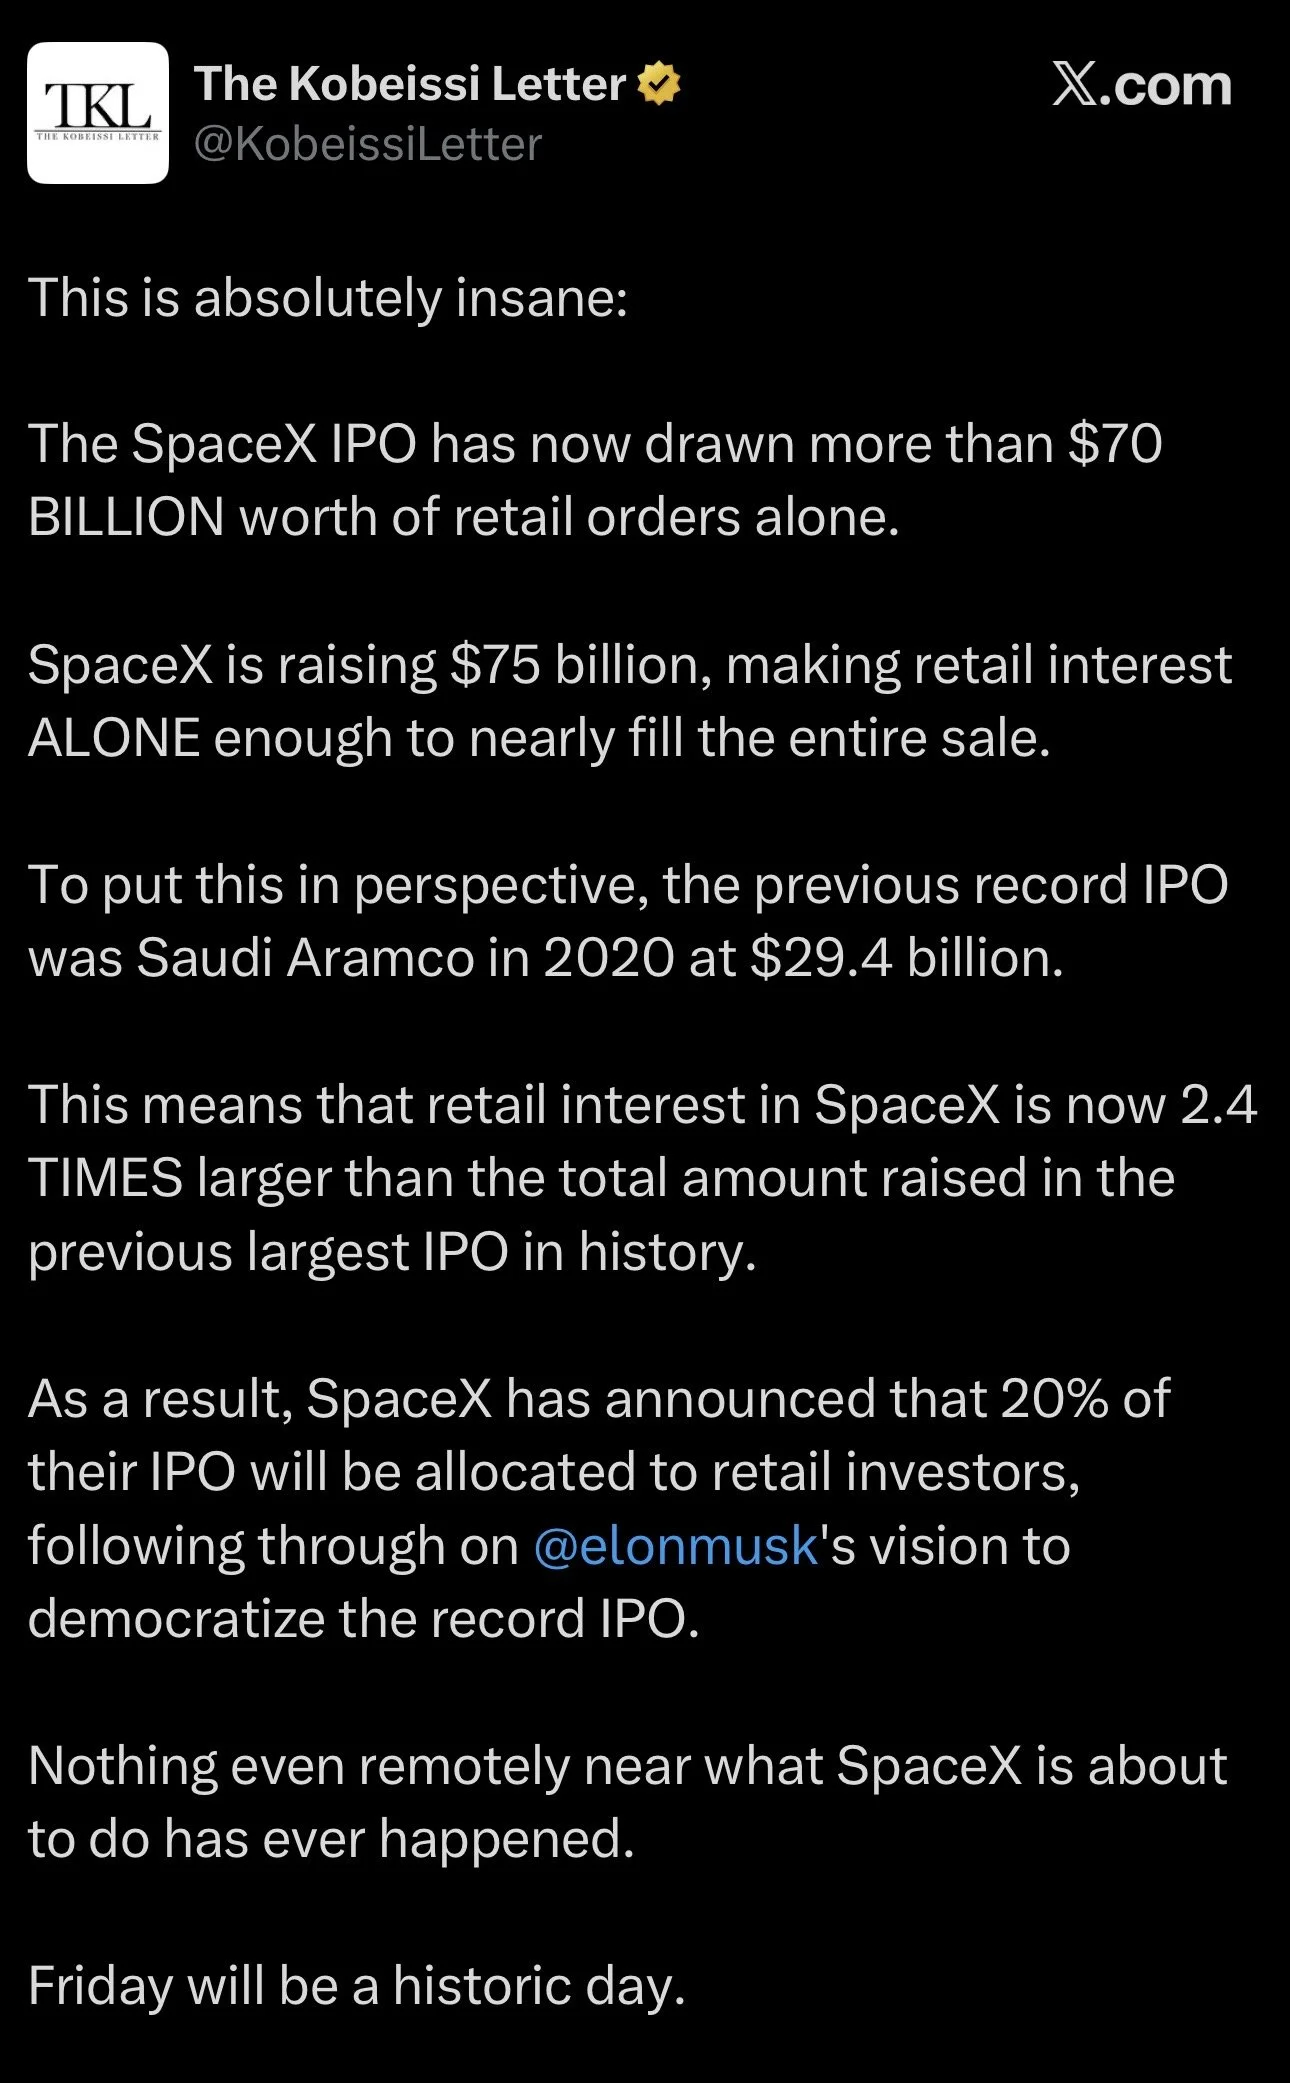
However, one more reason for the funds liquidating like they have could have been tied to the SpaceX IPO.
Their IPO filing became public on May 20th.
That was coincidentally when the sell off in the grains started.
So funds could have been dumping their grain positions to free up some captial for the SpaceX IPO.
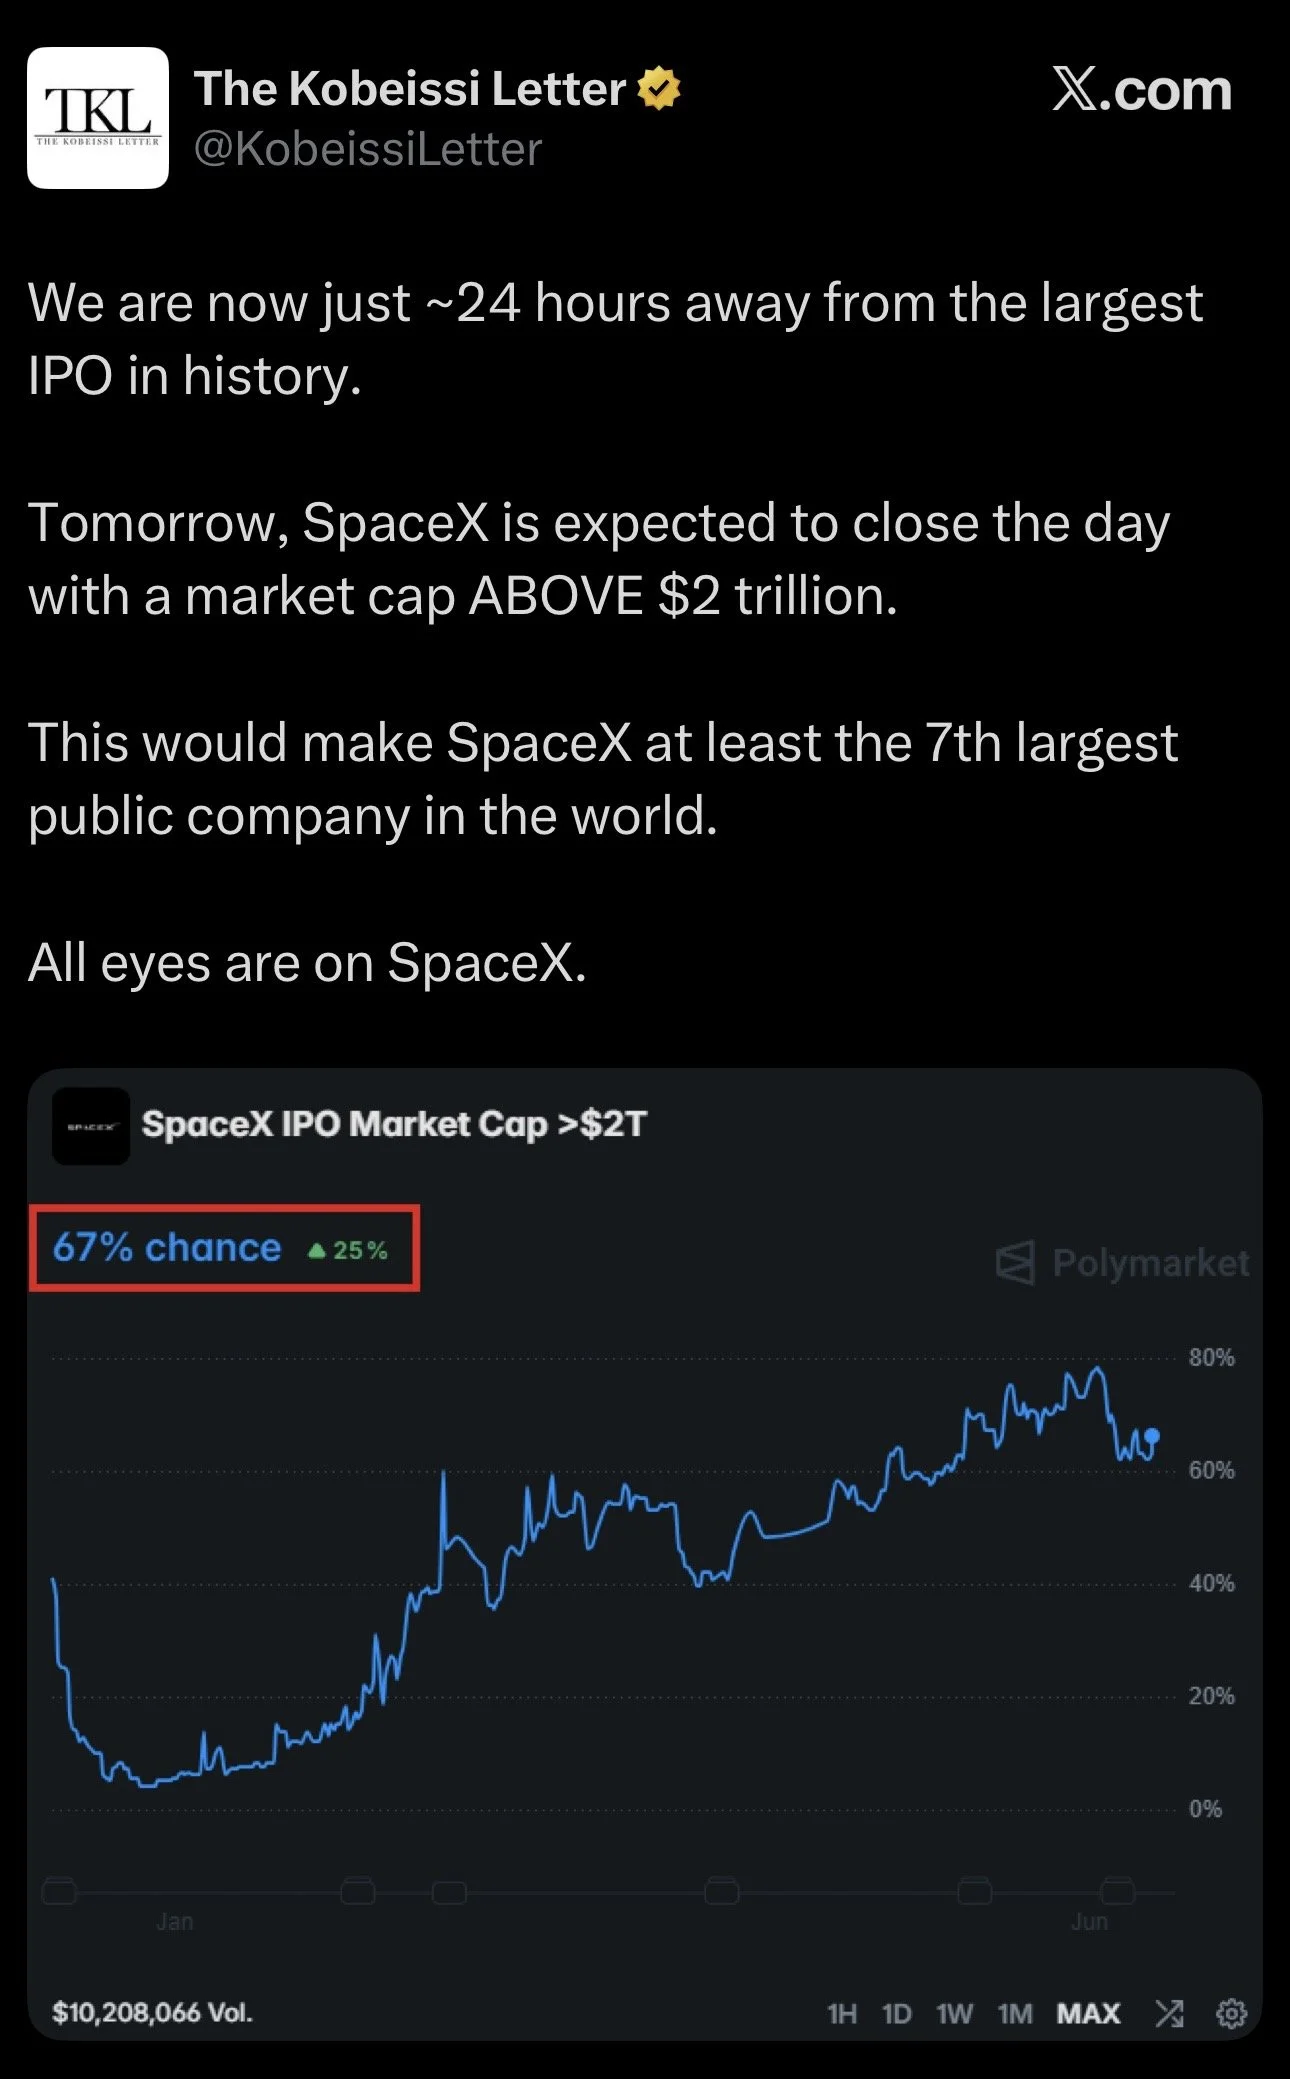
They IPO tomorrow at a value of $2 trillion. So you can see why this might’ve stole some capital from other places.
Even stocks and crypto have been taking a hit recently leading into this IPO.
Today's Main Takeaways
Corn
Weather still remains favorable for now, with zero concerns.
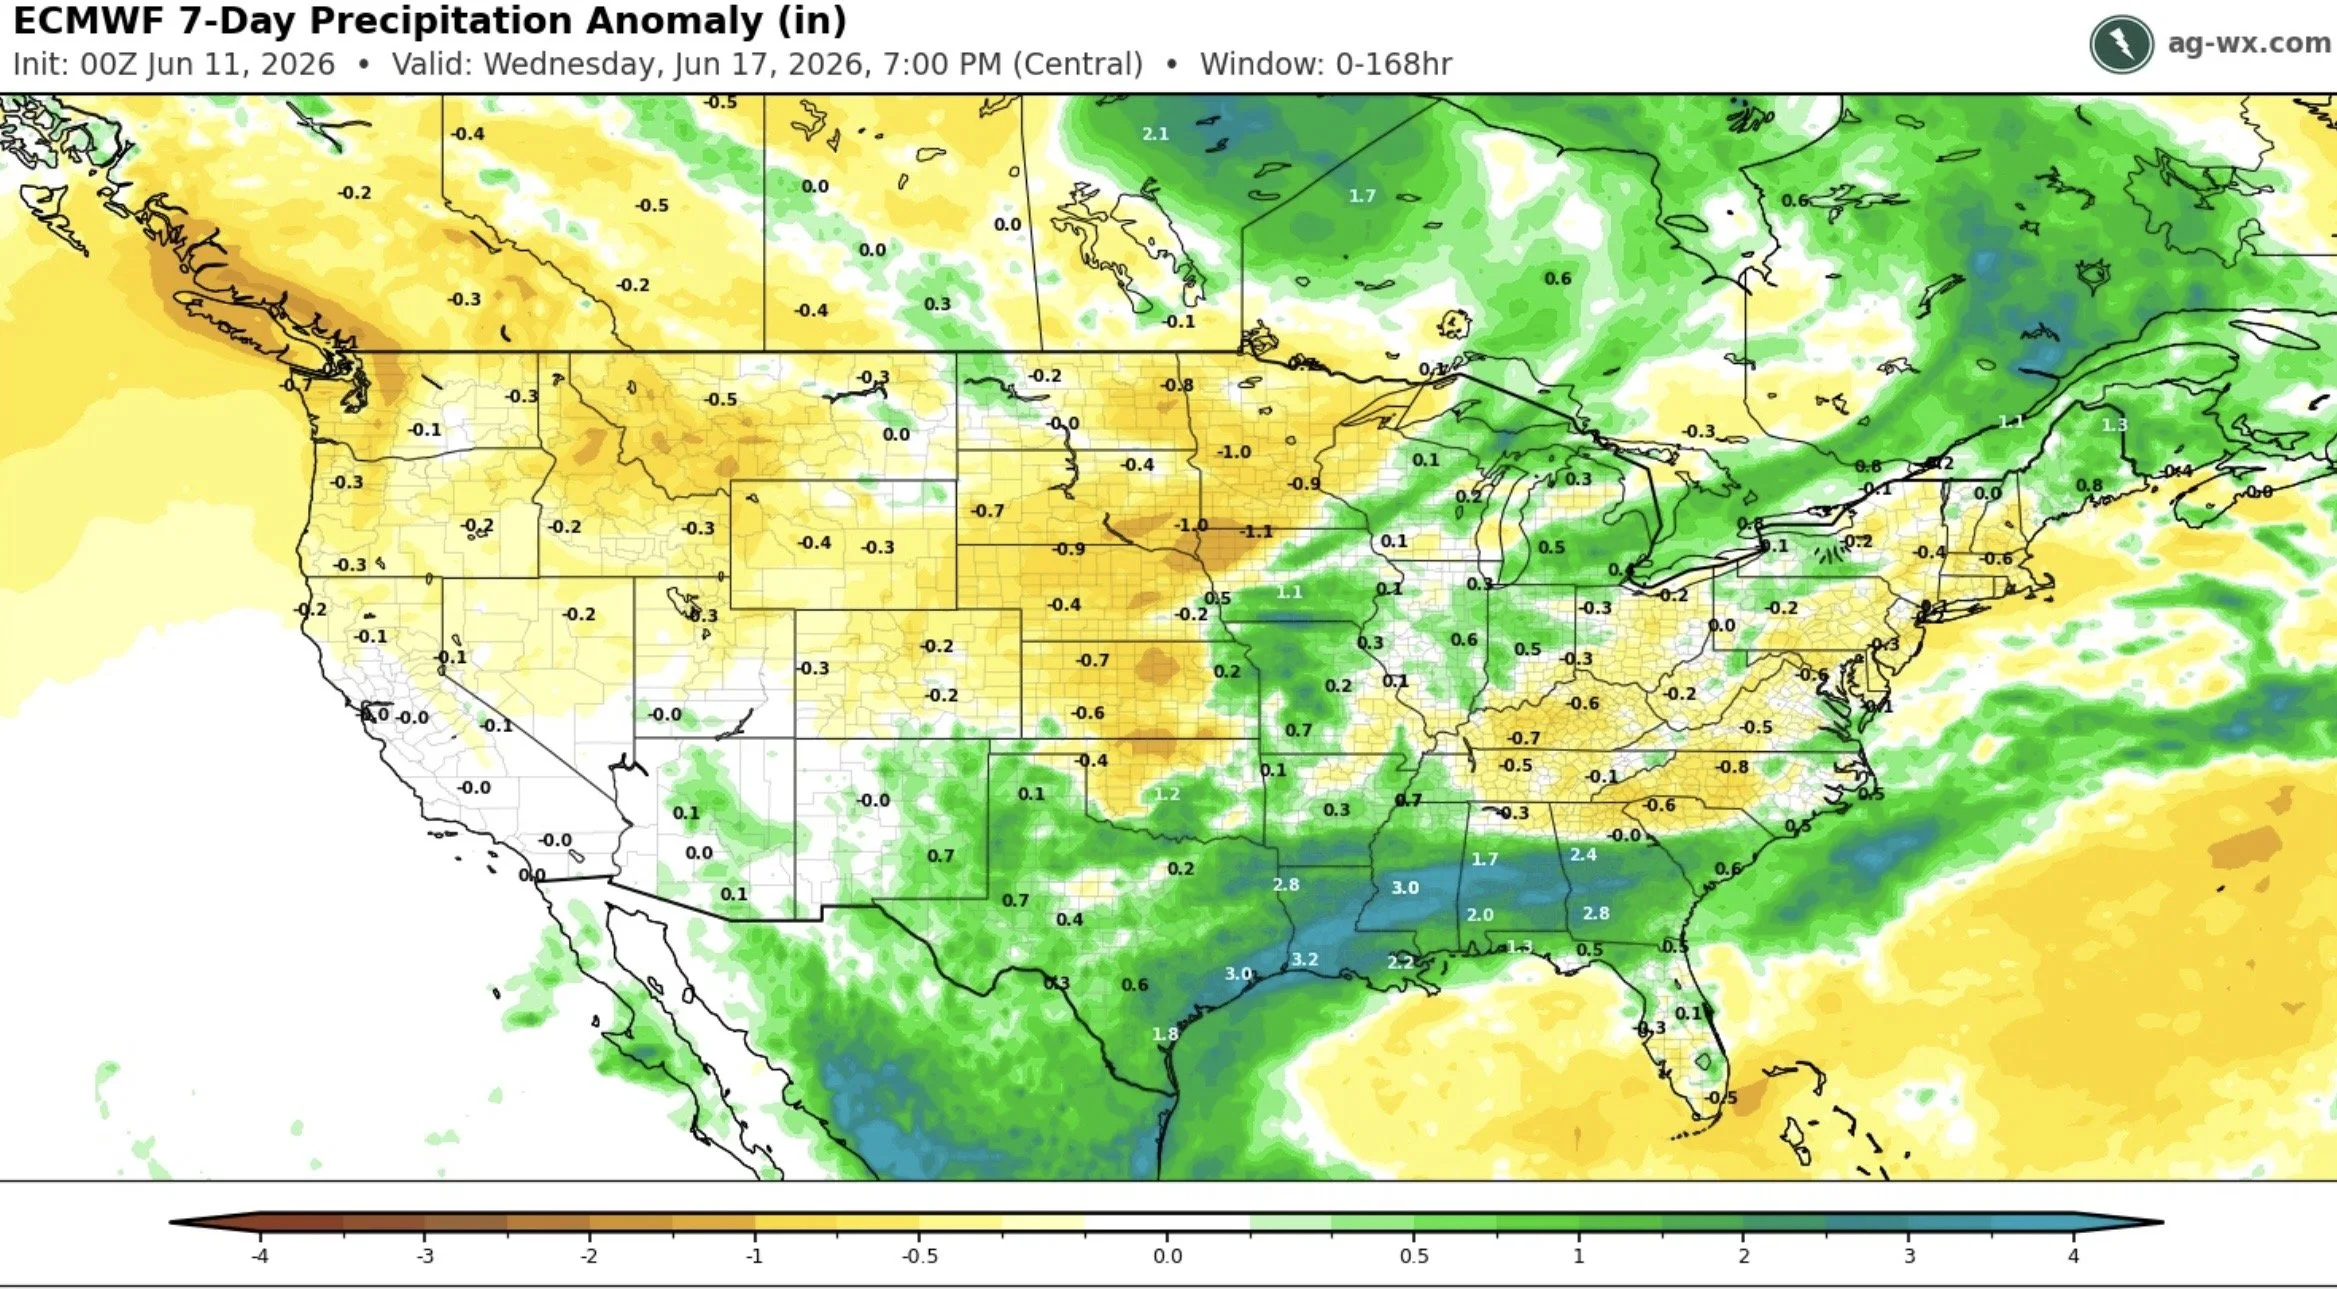
You could argue some places have been too wet, and the crop's not perfect.
Even if that has any impact on production, it's not going to matter to the market until months down the road.
Rain in the middle of June will always be viewed as bearish.
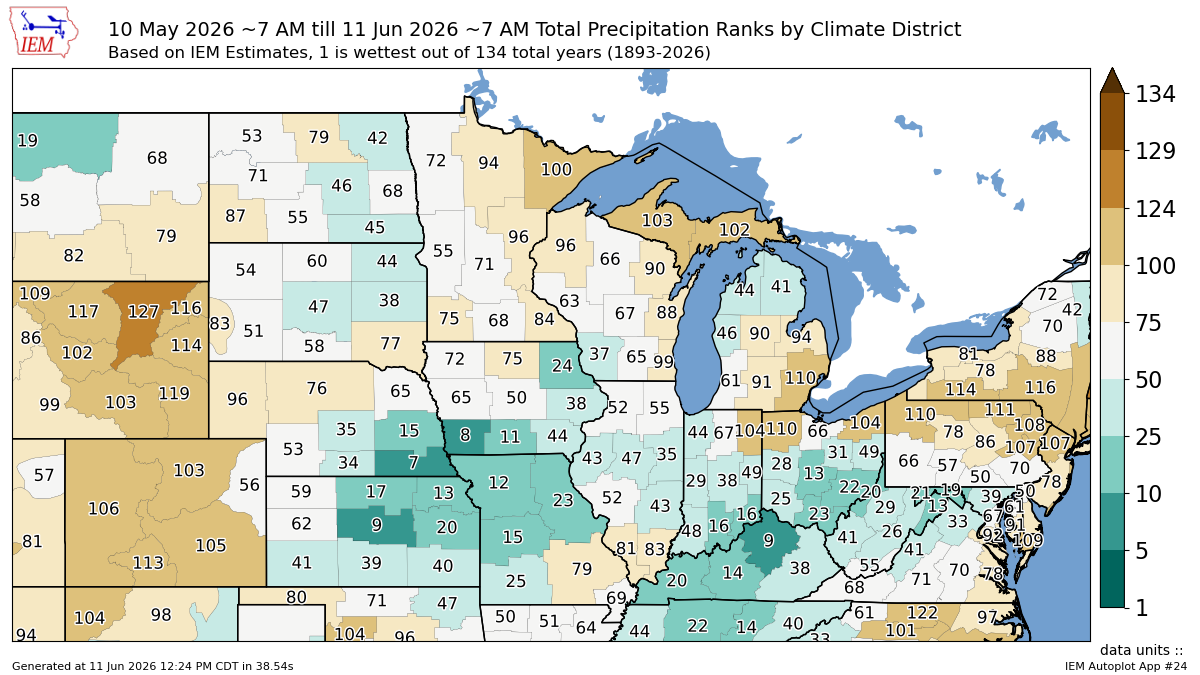
Here is precip rankings from the last month.
It's hard to get a weather scare when plenty of the corn belt comfortably had a lot of rain.
Now let's go over some potential ways the balance sheet could change for new crop. How big of an impact does a change in acres or yield make?
I personally think acres will come in smaller than they are today when it's all said and done.
Last year we had record acres.
95.3 million would still be the 3rd most acres ever.
Are we really only going to lose 3.5 million acres given the natural rotation and the fertilizer situation we didn’t have last year?
The USDA's initial survey probably didn’t capture the full impact of fertilizer prices either as it was back in early March. Although it's up for debate as to how many actually didn’t have their needs covered.

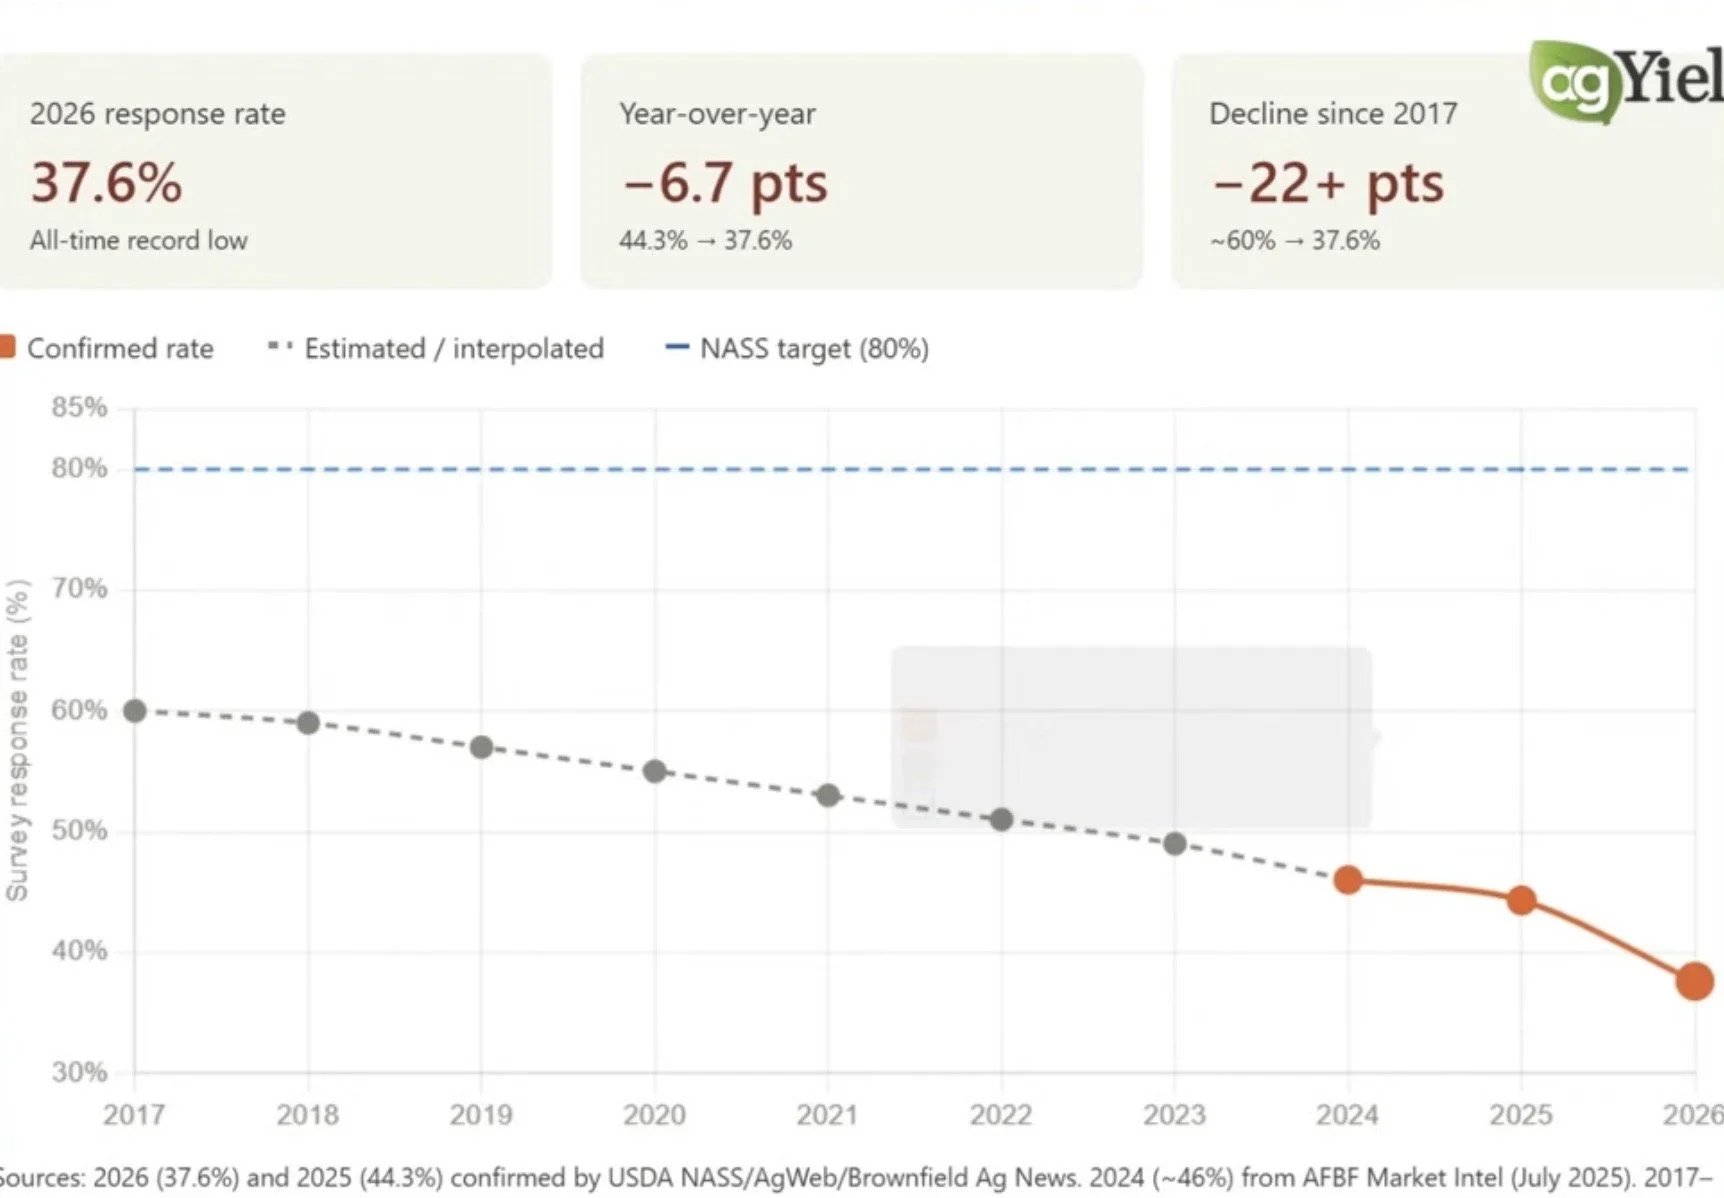
Look at the response rate from the survey.
It was the lowest ever.
Back in 2017 we had a 60% rate. This year it was less than 38%.
There is a reason the USDA was off by 3 million acres last year.
Maybe we don’t even find out in this June report at the end of the month.
Last year in the June acre report, they had 95 million. They bumped it to 97 in August. We ended at 98.8 million by January.
Chart Credit: Ag Yield
Acres don’t have to come down, but it's something the market has yet to price in if it happens.
What happens to the balance sheet if we lose another 1-2 million acres?
Even with a 183 yield, losing acres alone could cut into that new crop balance sheet in a big way.
If acres are too high, it would take a big yield for the balance sheet to not tighten up.
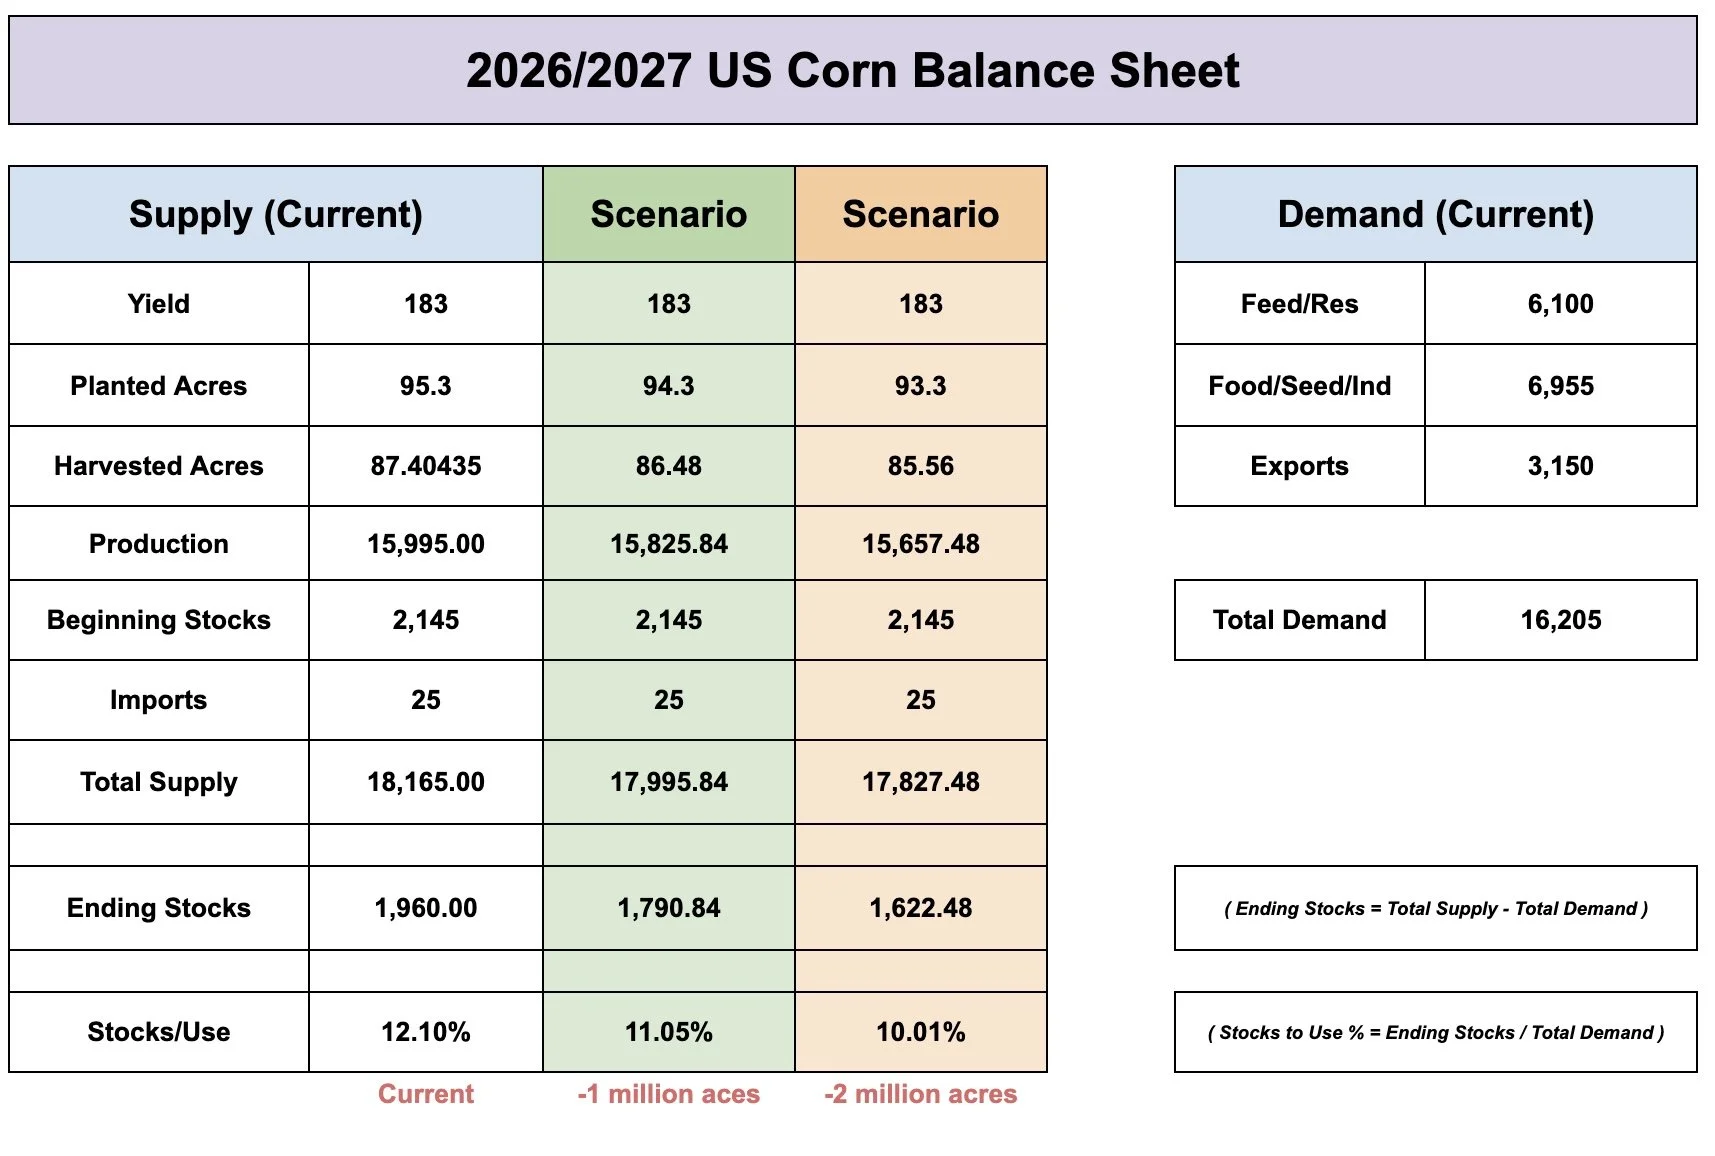
If you throw in a below 183 yield, then it tightens things up even further.
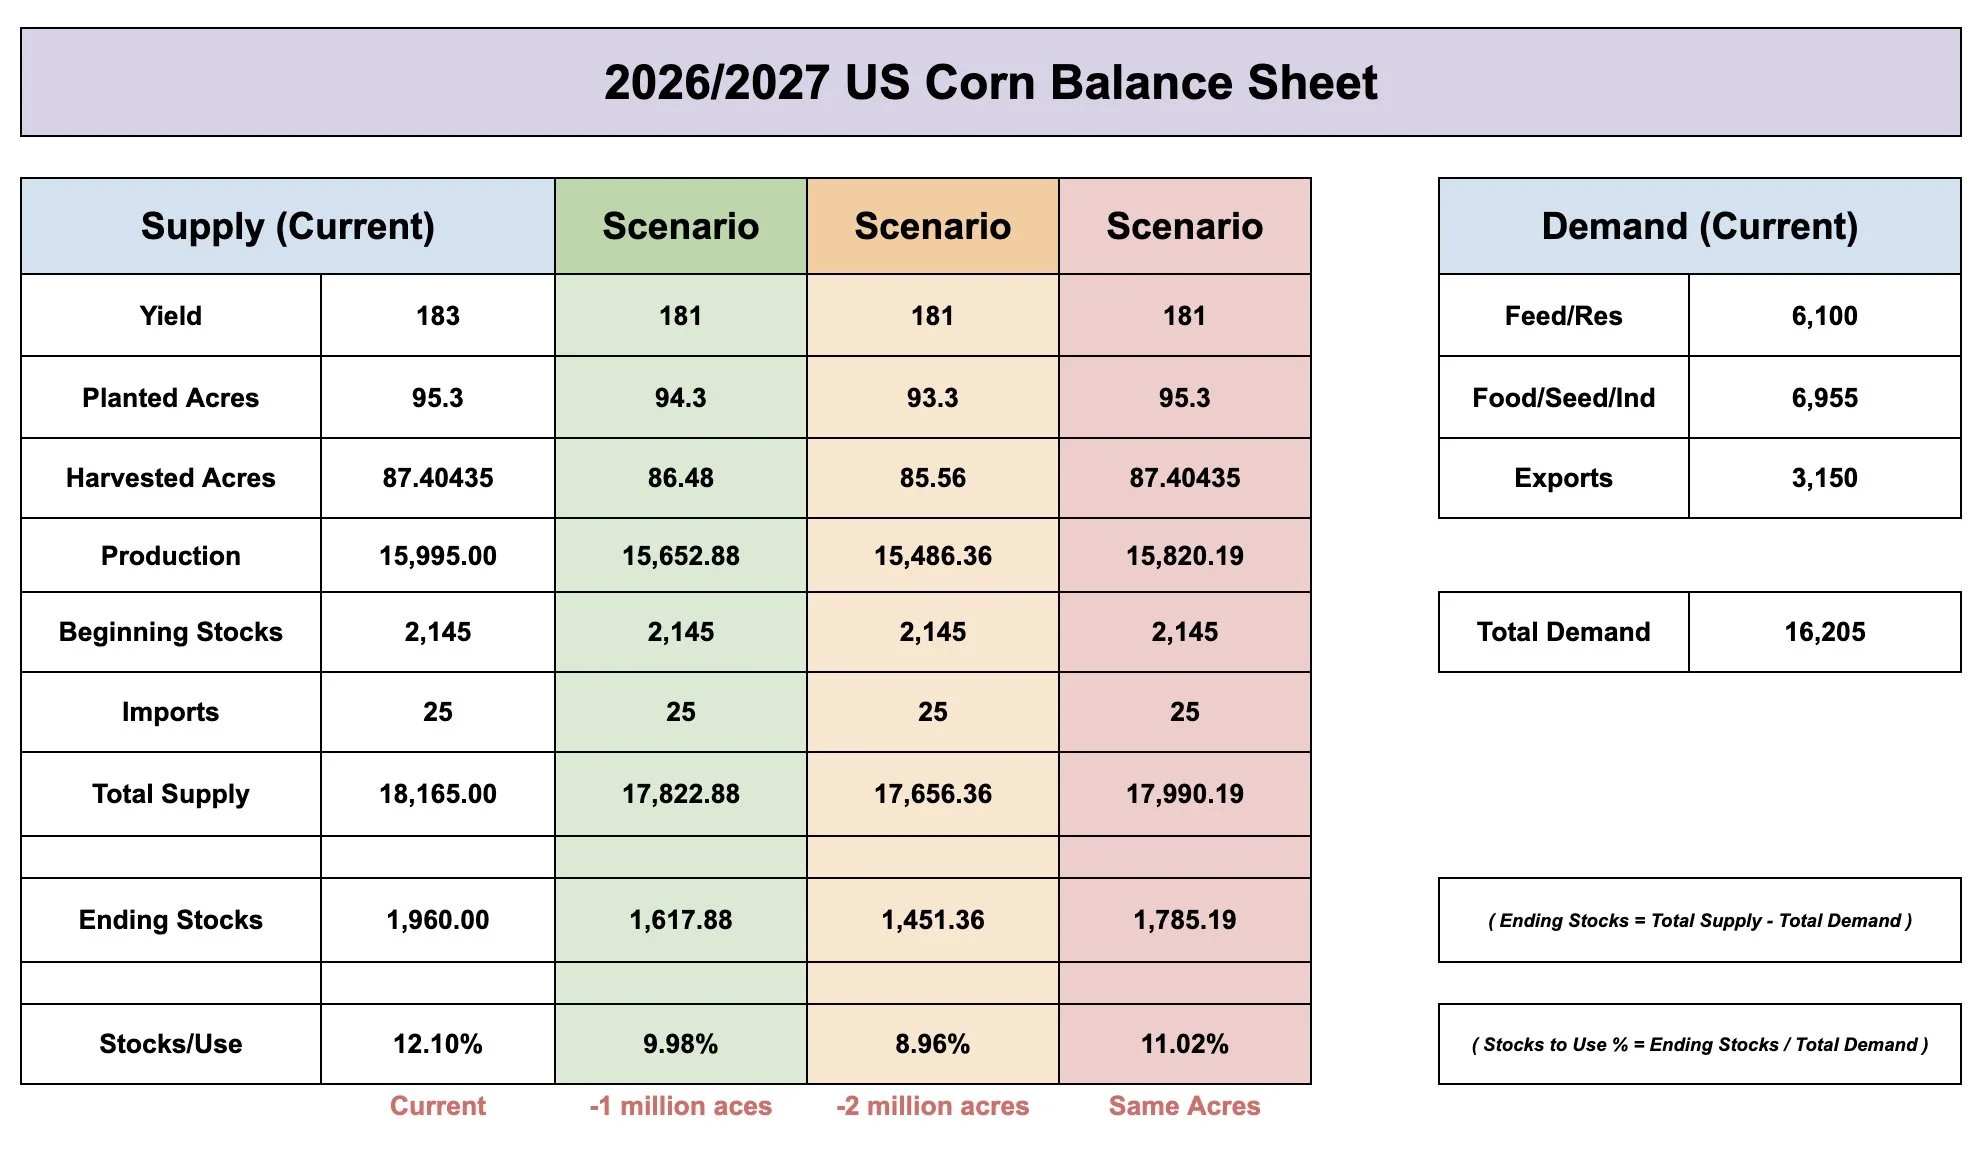
Here is both of those previous scenarios but with a 181 yield instead.
Before touching demand, things get pretty tight.
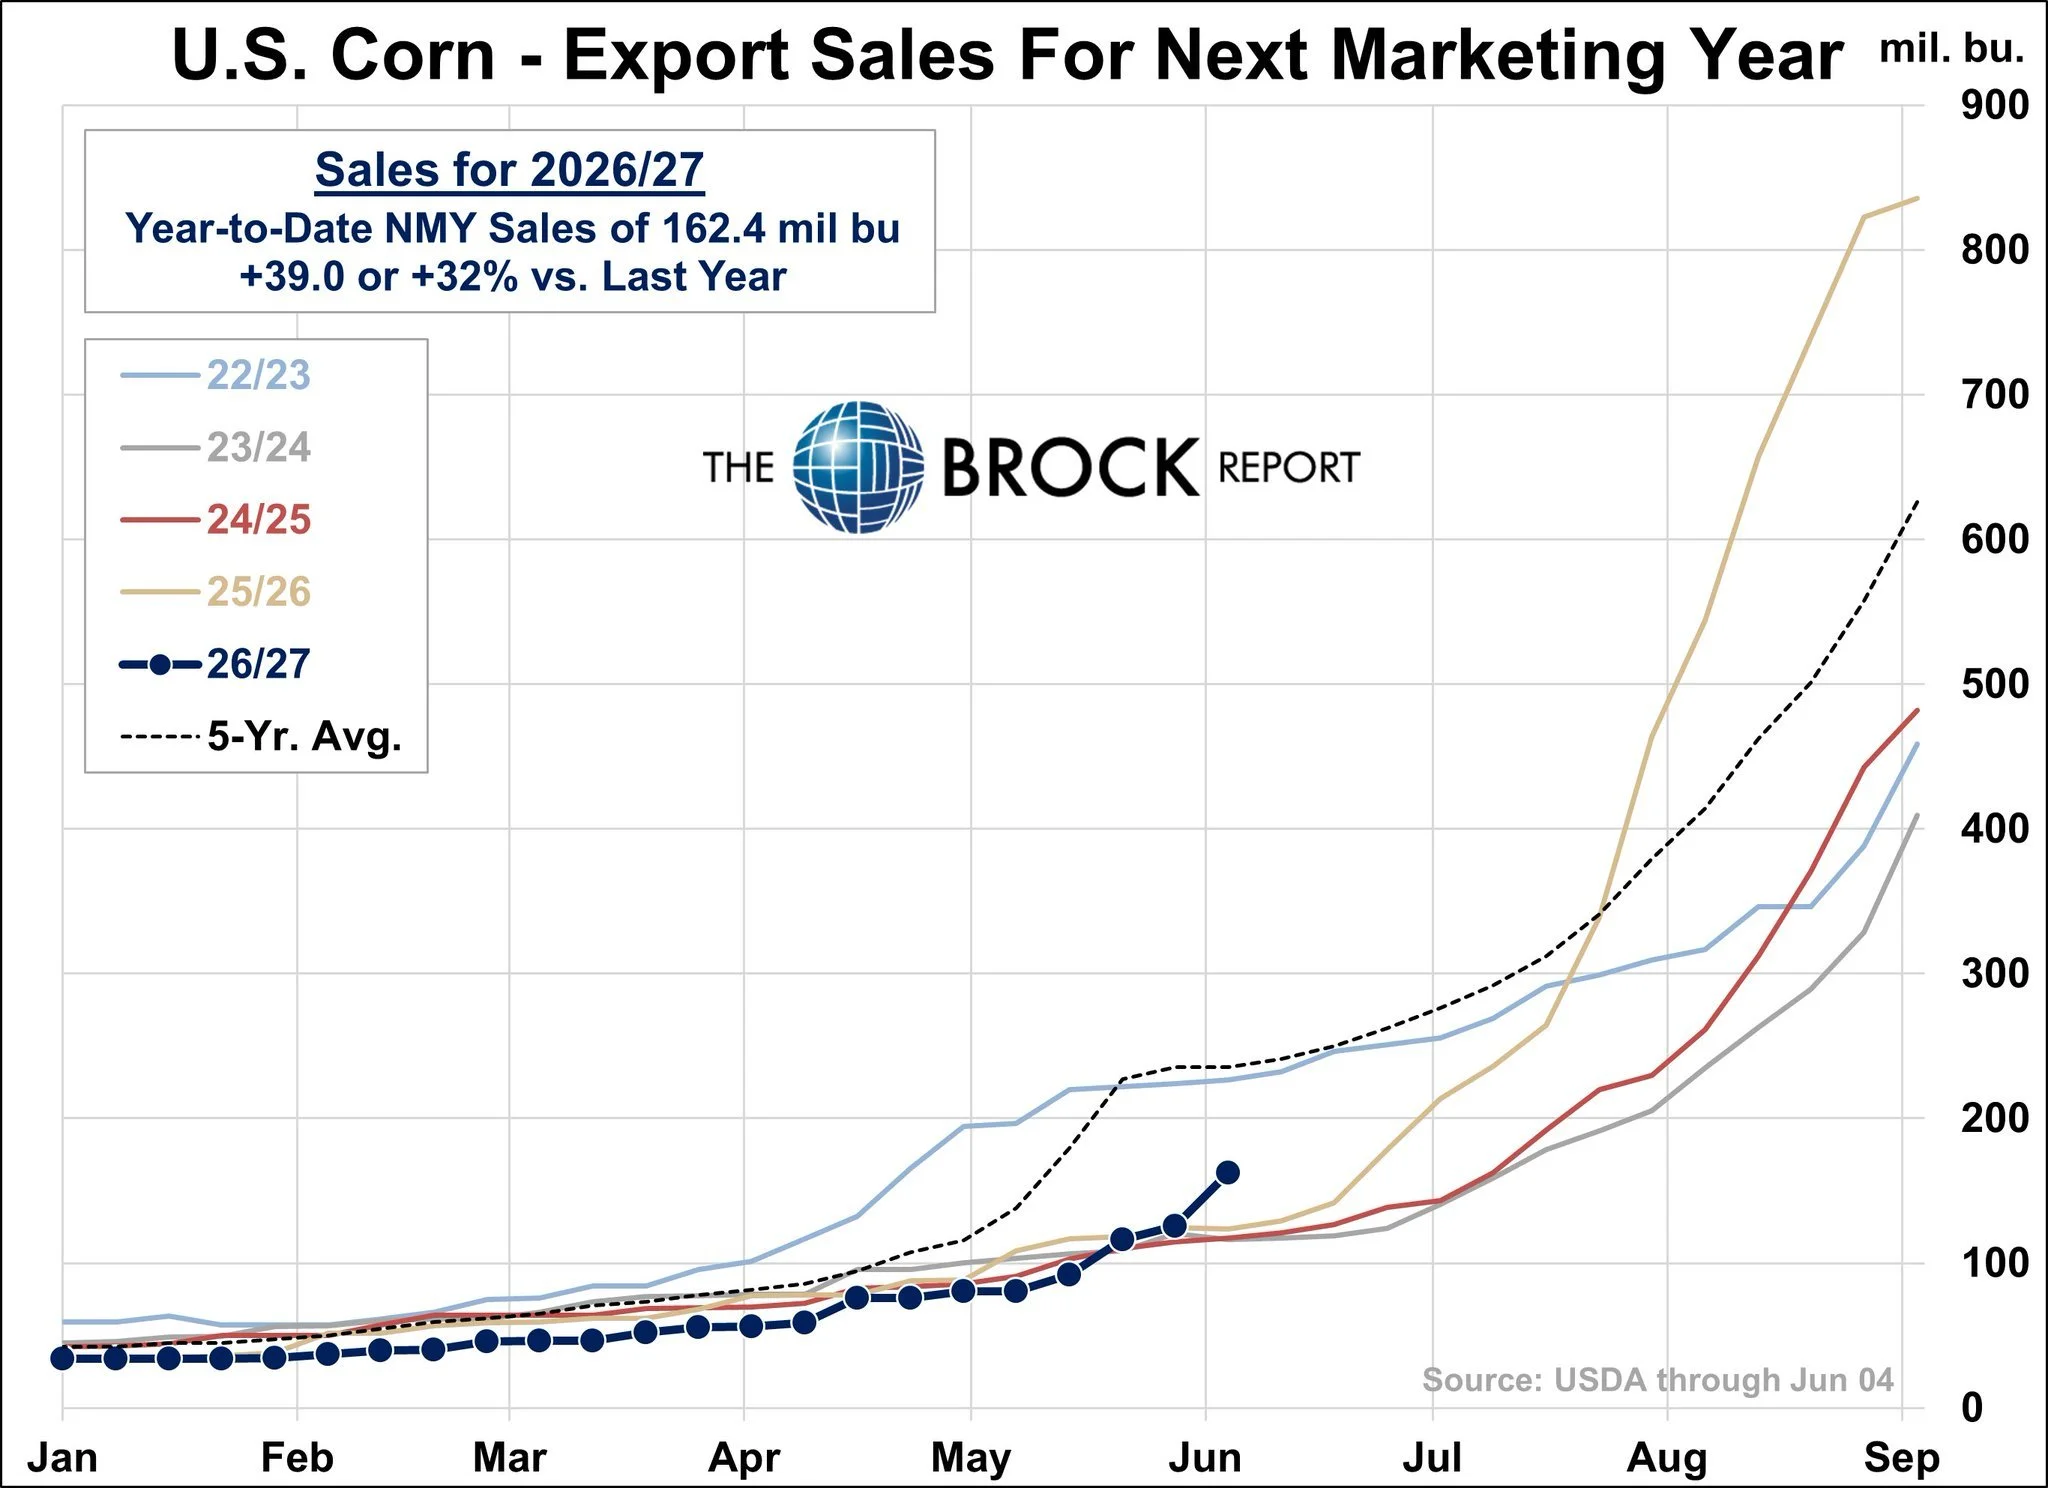
In the current balance sheet, the USDA also says export demand will be worse than last year.

I'm not sure that argument is really justified.
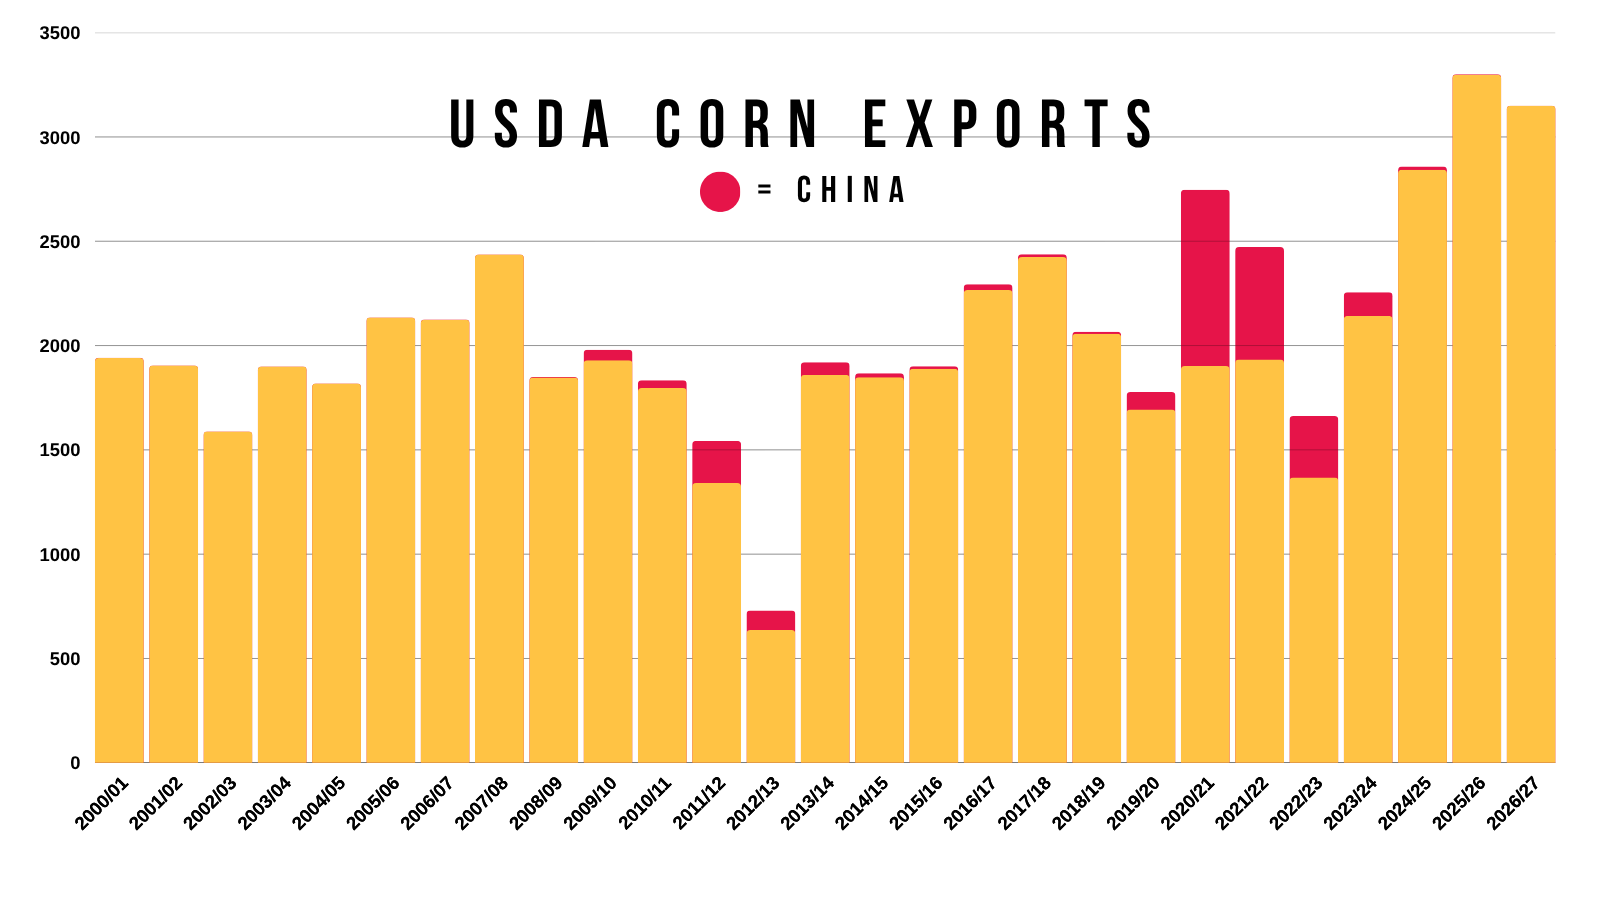
Here is a great chart from Dave Brock (@drbrock37 on X).
This shows our new crop corn exports.
It's very early, but right now we are running +32% better than we were this this year.
What happens if acres come down, or yield isn’t perfect, and China ends up buying corn later this year?
Right now the market is focused on the negatives, as it should be.
Weather is fine.
The funds are puking.
Seasonally, we still head lower from here.
But you can’t tell me that China couldn’t flip the story on it's head later this year or next year.
China isn’t stupid. They are strategic.
They will buy when they feel like they are getting a deal and when prices have gotten cheap enough for them. Logically, that would be around harvest.
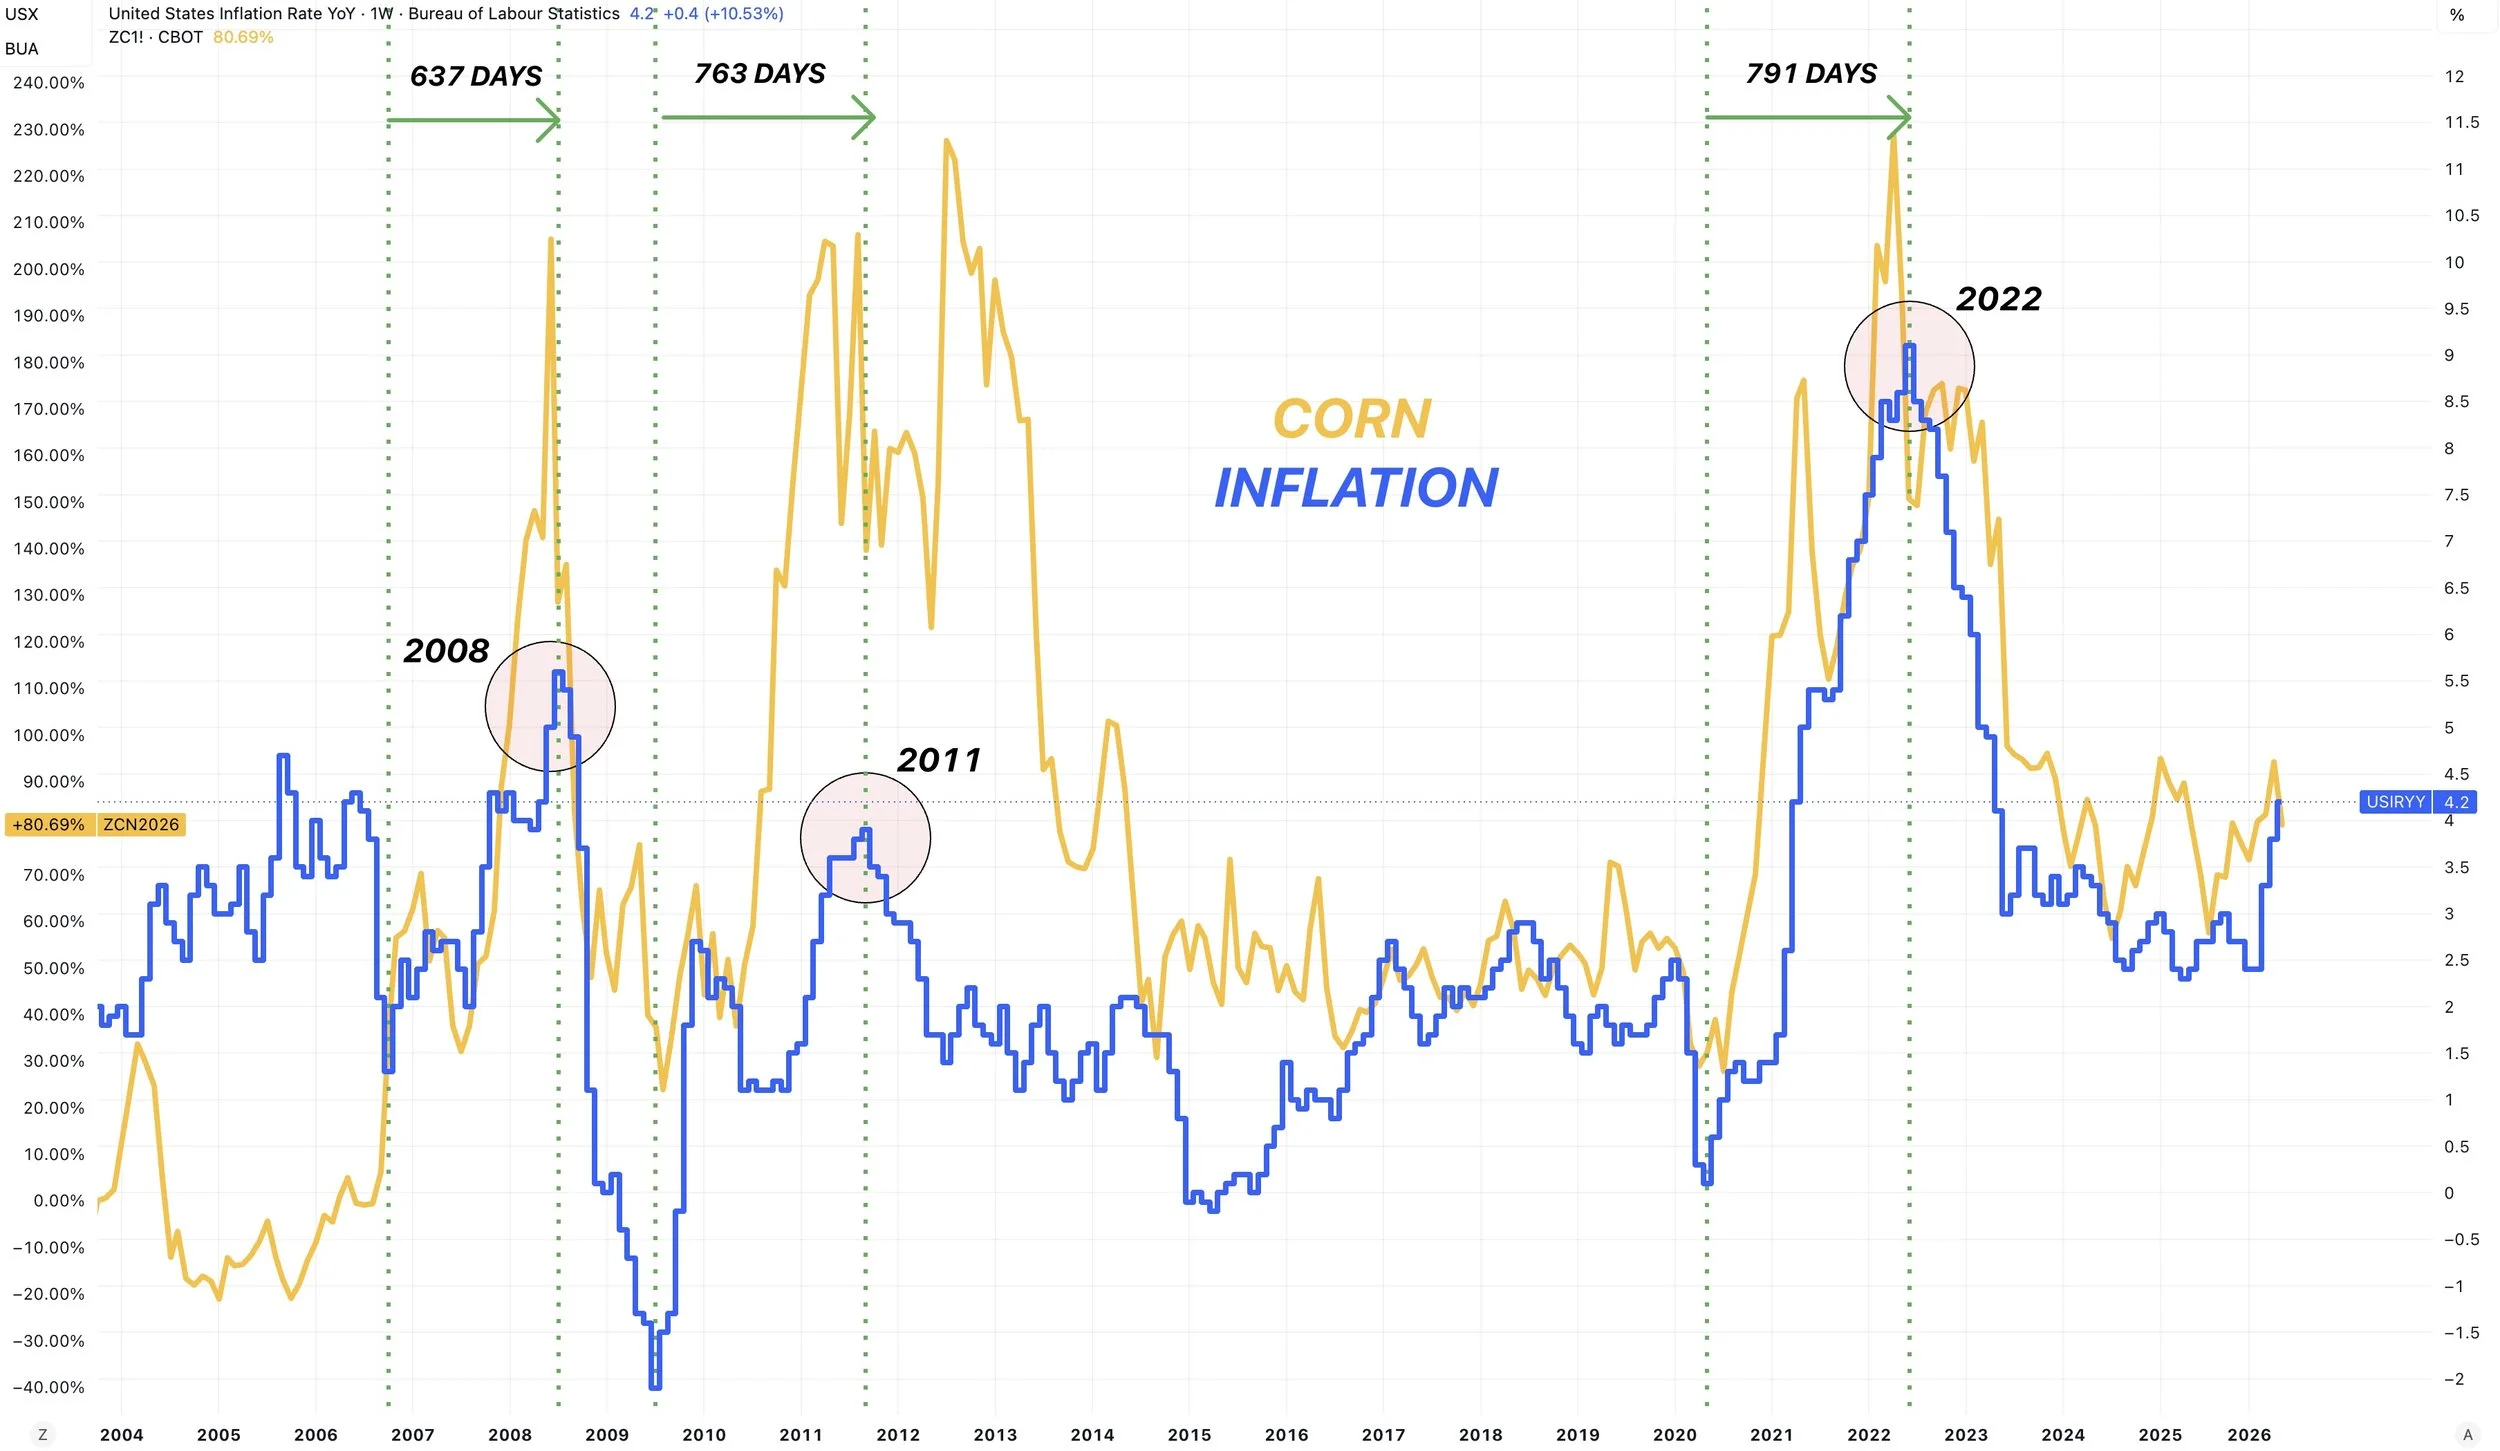
Inflation numbers came in yesterday.
Inflation rate is at 4.2% now.
Up from 2.4% at the start of the year. As it continues to creep higher.
As I've talked about countless times, if inflation continues higher, you'd have to imagine the grains follow suite.
It's the one common theme across higher grain prices.
We aren’t there yet, but we've seen a decent jump.
So that is another potential reason to think long term grains in general have a story over the next year or two if this jump in inflation were to continue.
Something I noticed on this chart is that once inflation bottomed, we saw a spike 2 years later.
2006 it bottomed, 2008 it topped.
2009 it bottomed, 2011 it topped.
2020 it bottomed, 2022 it topped.
If inflation continues to run, and this pattern holds true, it would put us in 2027 to 2028.
So what would the next 1-2 years potentially have in common with years where prices were much higher? Inflation and China buying.
Which is why I see long term potential in corn.
However.. the problem is none of this matters today.
All of these are factors that could several months to have an impact on our market.
How often do we post our lowest price of the year in June?
Almost never.
The one and only time was 2010, when we had a mega bullish June 30th acres and stocks report that sparked a bull run.
Outside of that, it's never happened.
Short term we lack a catalyst or reason to go higher outside of the fact that we're very oversold.

We are almost always lower by harvest time, whether we put together a nice rally before hand or not.
So unless we somehow get a weather scare that shakes things up. We get China stepping in before harvest. Or we get a mega bullish June 30th report. Odds favor us ultimately being lower over the next 1-2 months.
Seasonals are not in our favor here.
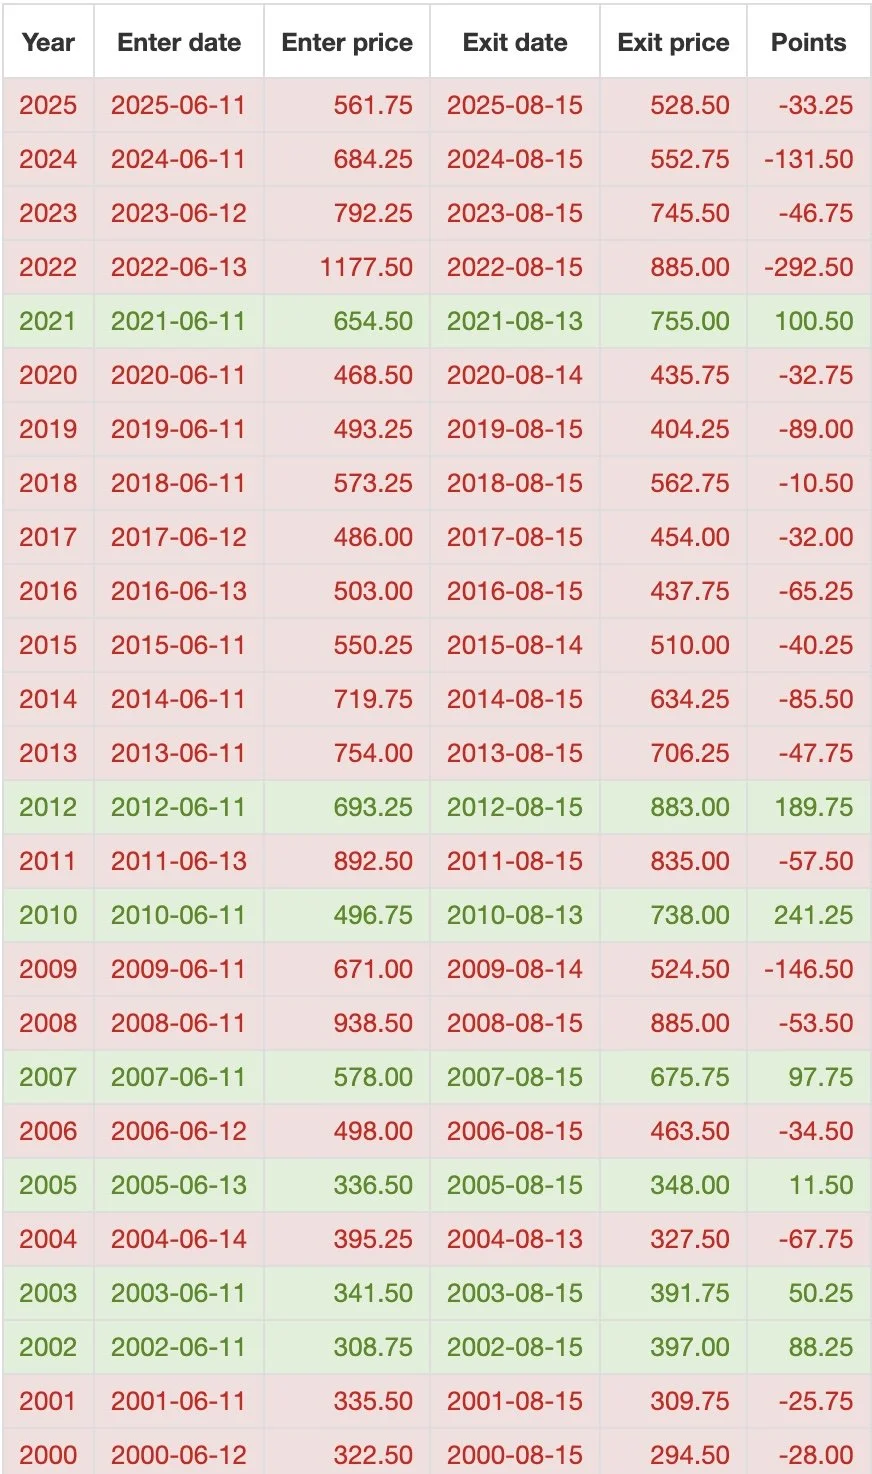
Here is historical data from today by August 15th. Lower every year since 2015.

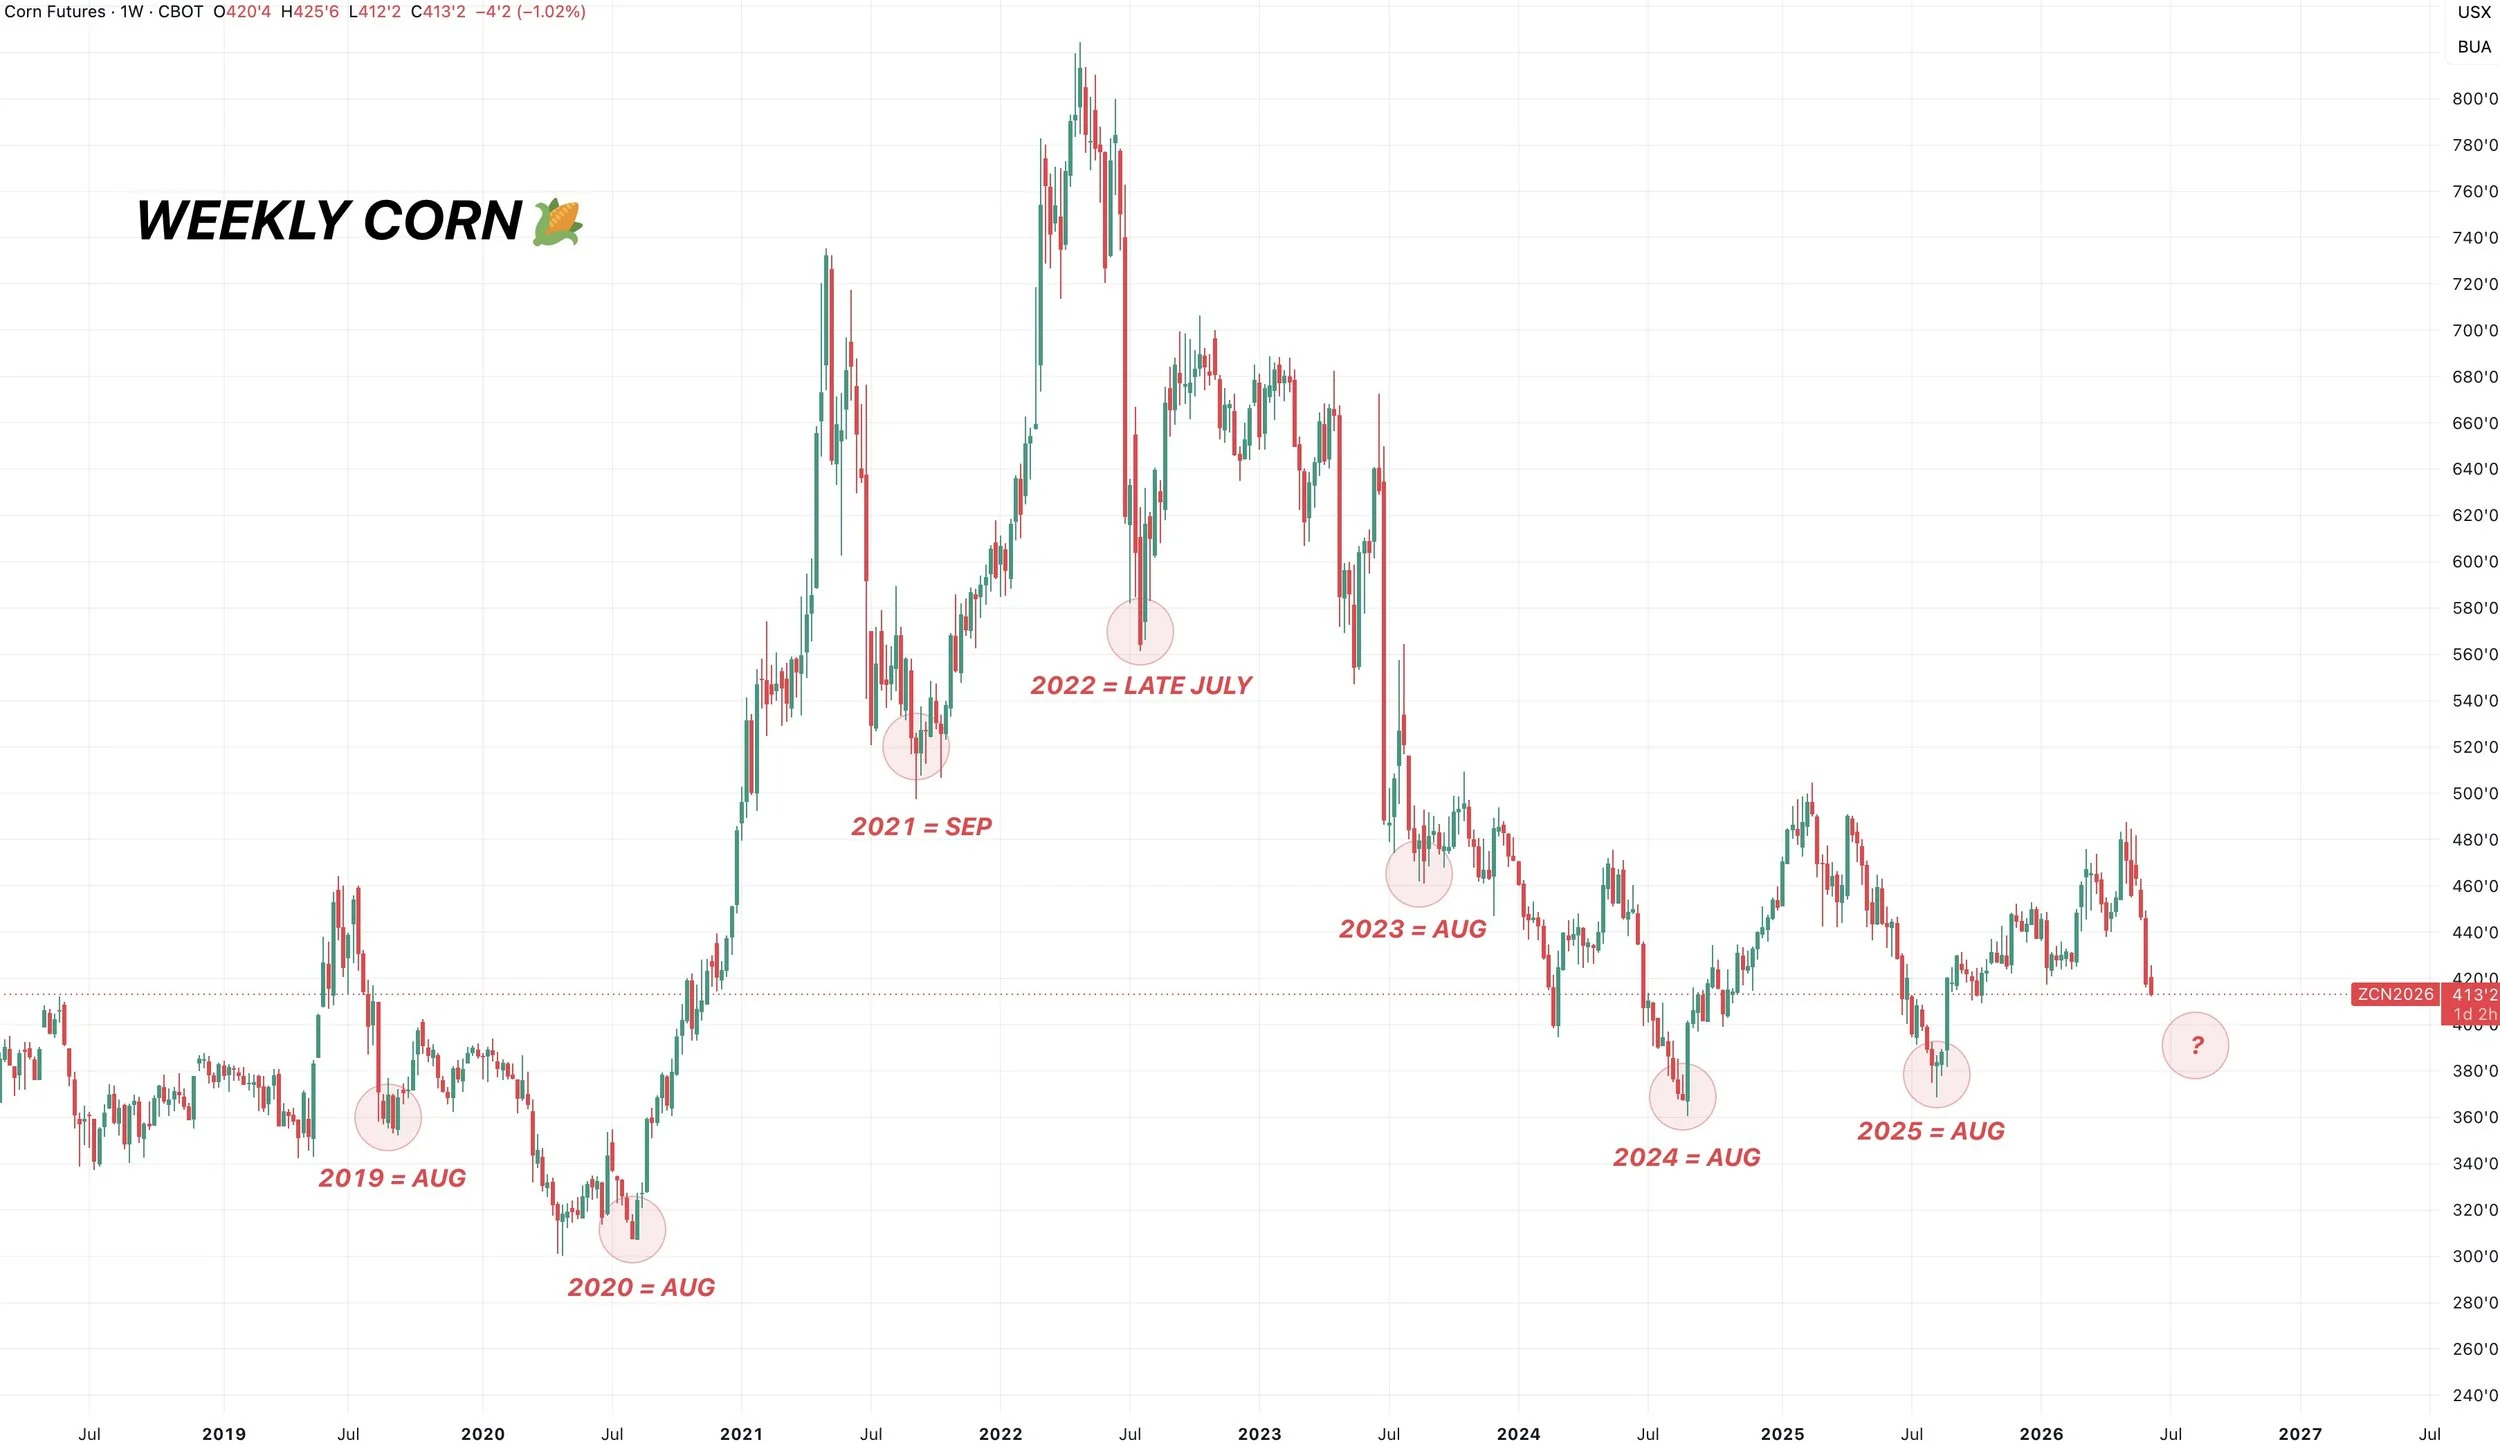
Just take a look at the price action from the last several years.
We have a common theme of bottoming around August.
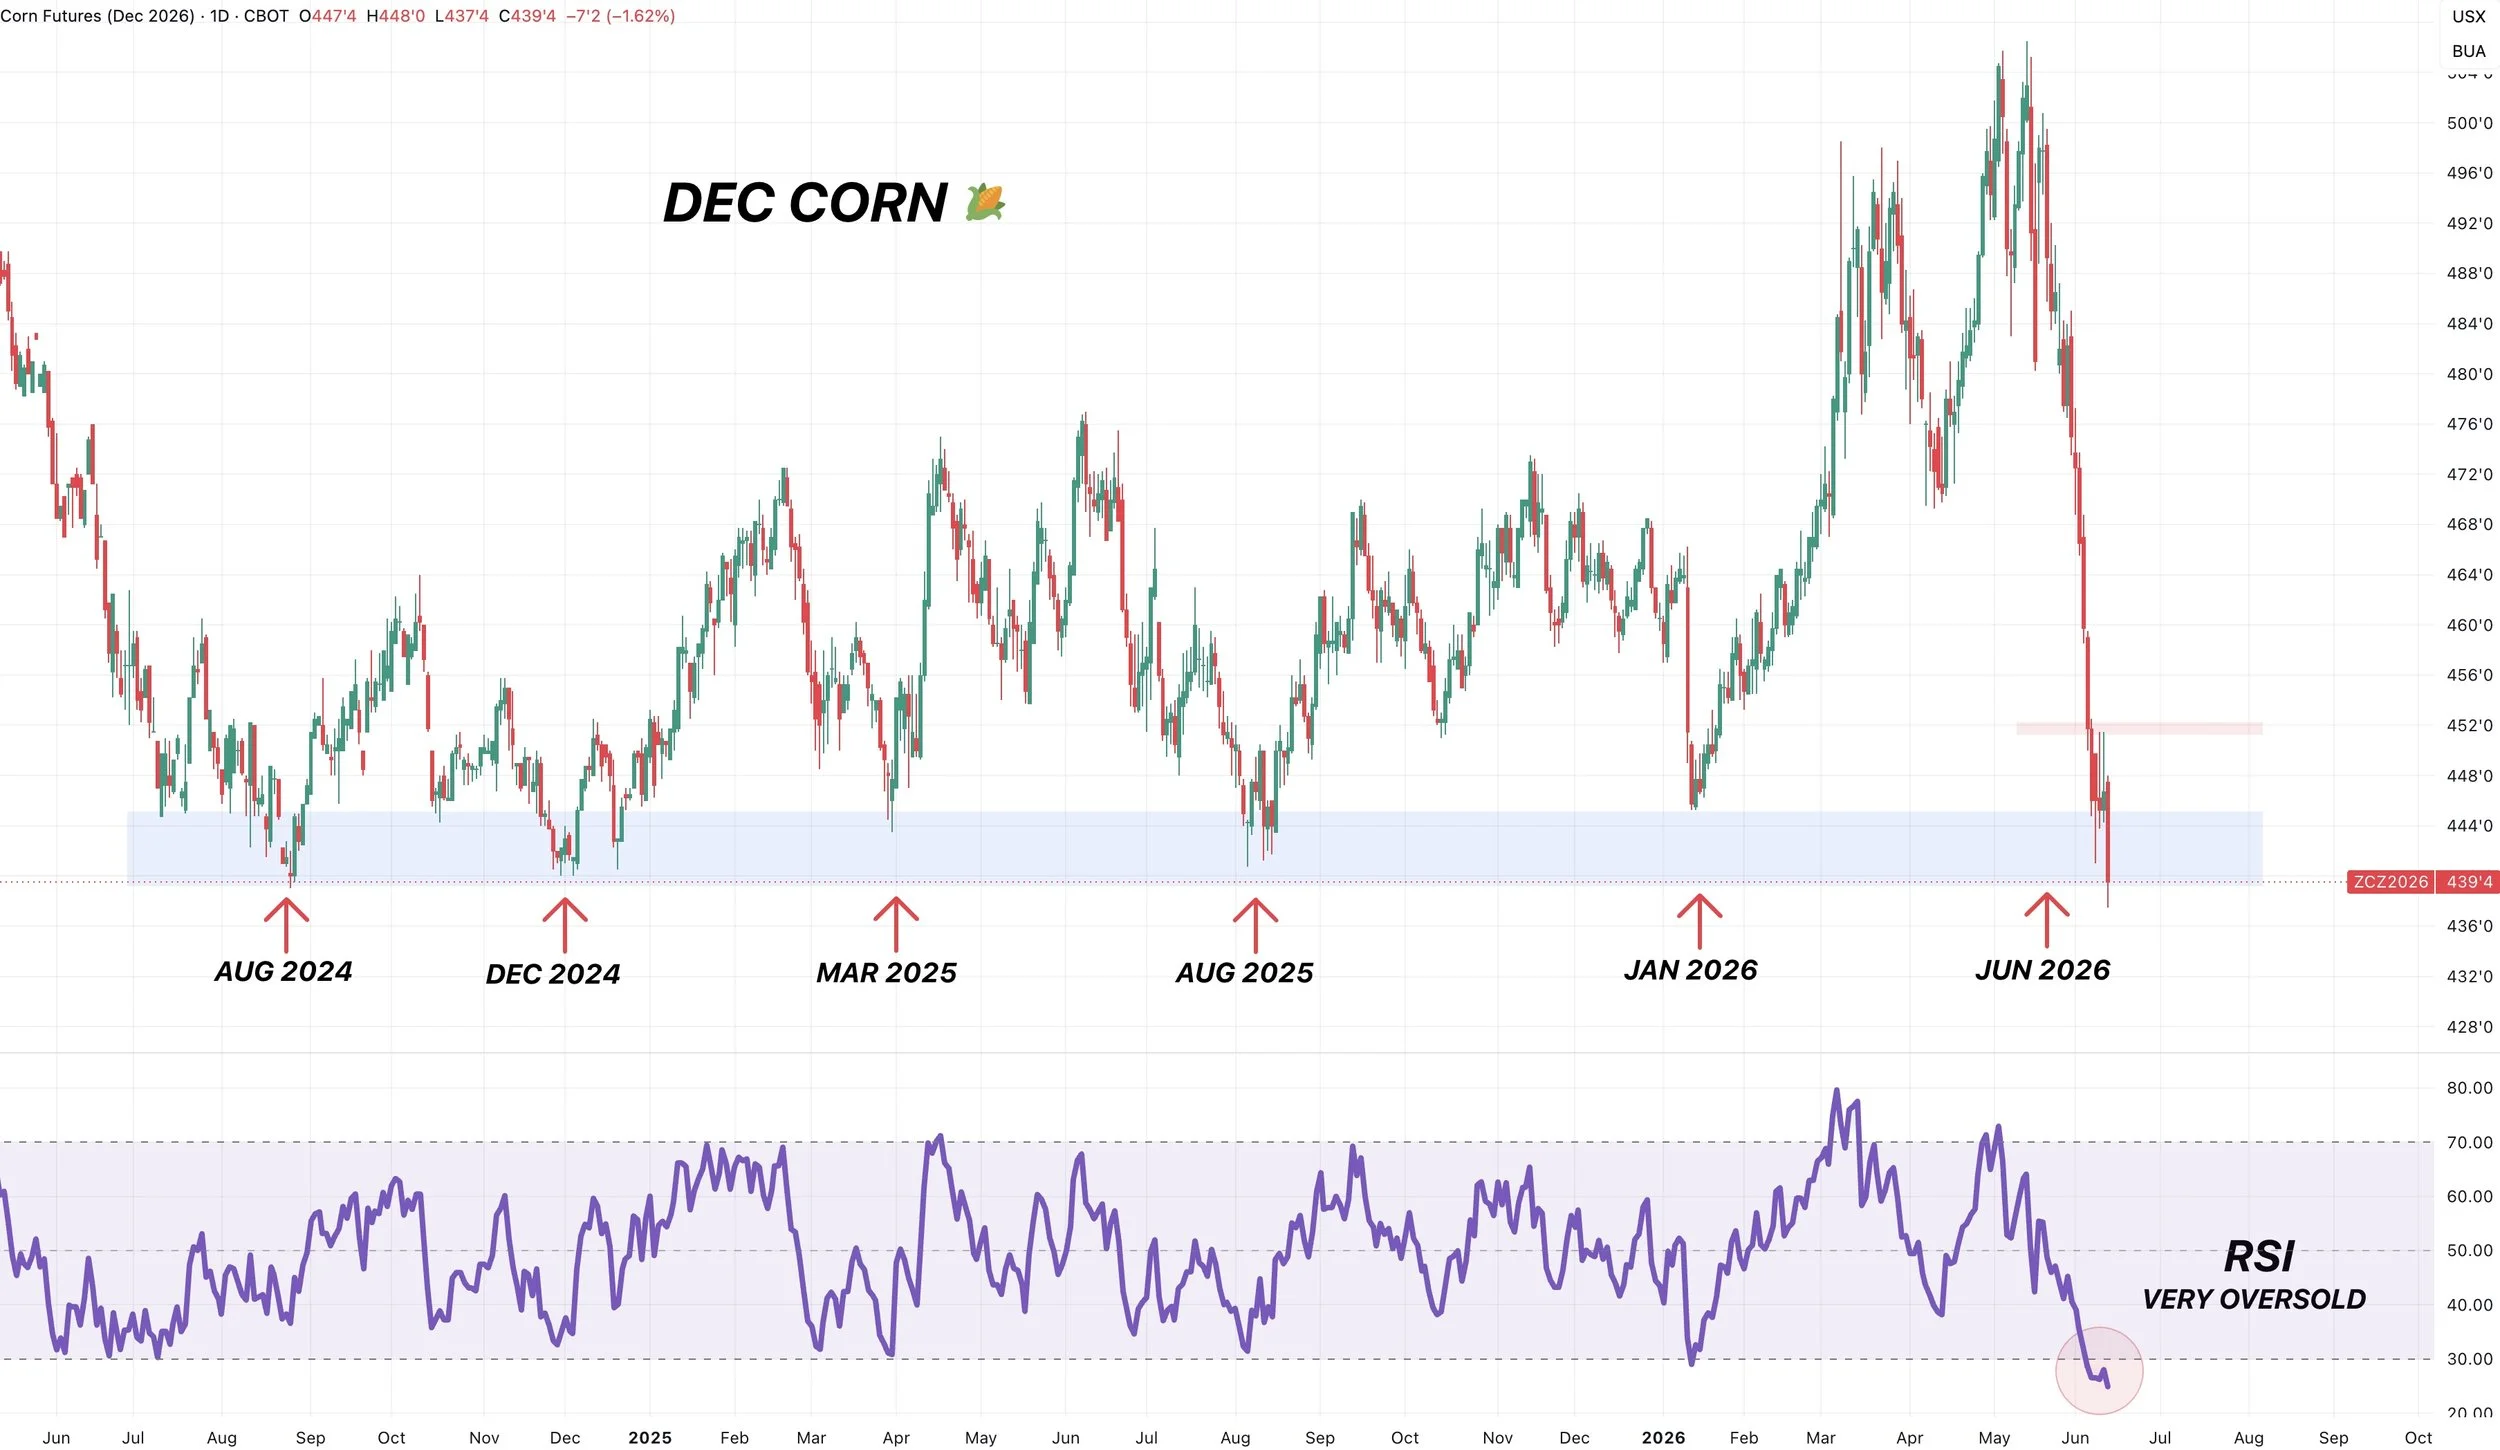
Dec Corn Chart:
Dec posted a new contract low today.
However, we did end up closing above the previous contract low.
Bulls want to bounce pretty much right now, or we simply have no support beneath us. If we can’t bounce here, it would be disappointing.
We've held this support for 2 years now.
Breaking below clearly wouldn’t be great. Because below here there isn’t any volume or anything to catch this market.
We're still very very oversold.
If we can manage to hold here, maybe we can put together some sort of bounce. But need to hold here.
Front Month Chart:
July and Sep corn both posted new lows today, sitting at contract lows.
So let's look at the front month chart.
On this one, we also want to bounce pretty much right now. As there isn’t much support below here.
We don’t have to bounce, but I could still see us getting a bounce before heading lower into July and August.
Like I've talked about:
Our 2025 harvest lows came at $3.68. Which is the exact gap we left in 2024.
We currently have a gap from 2025 sitting at $3.94. That is also the next retracement level down to last year's harvest lows.
So seeing our harvest lows there would make sense to me.
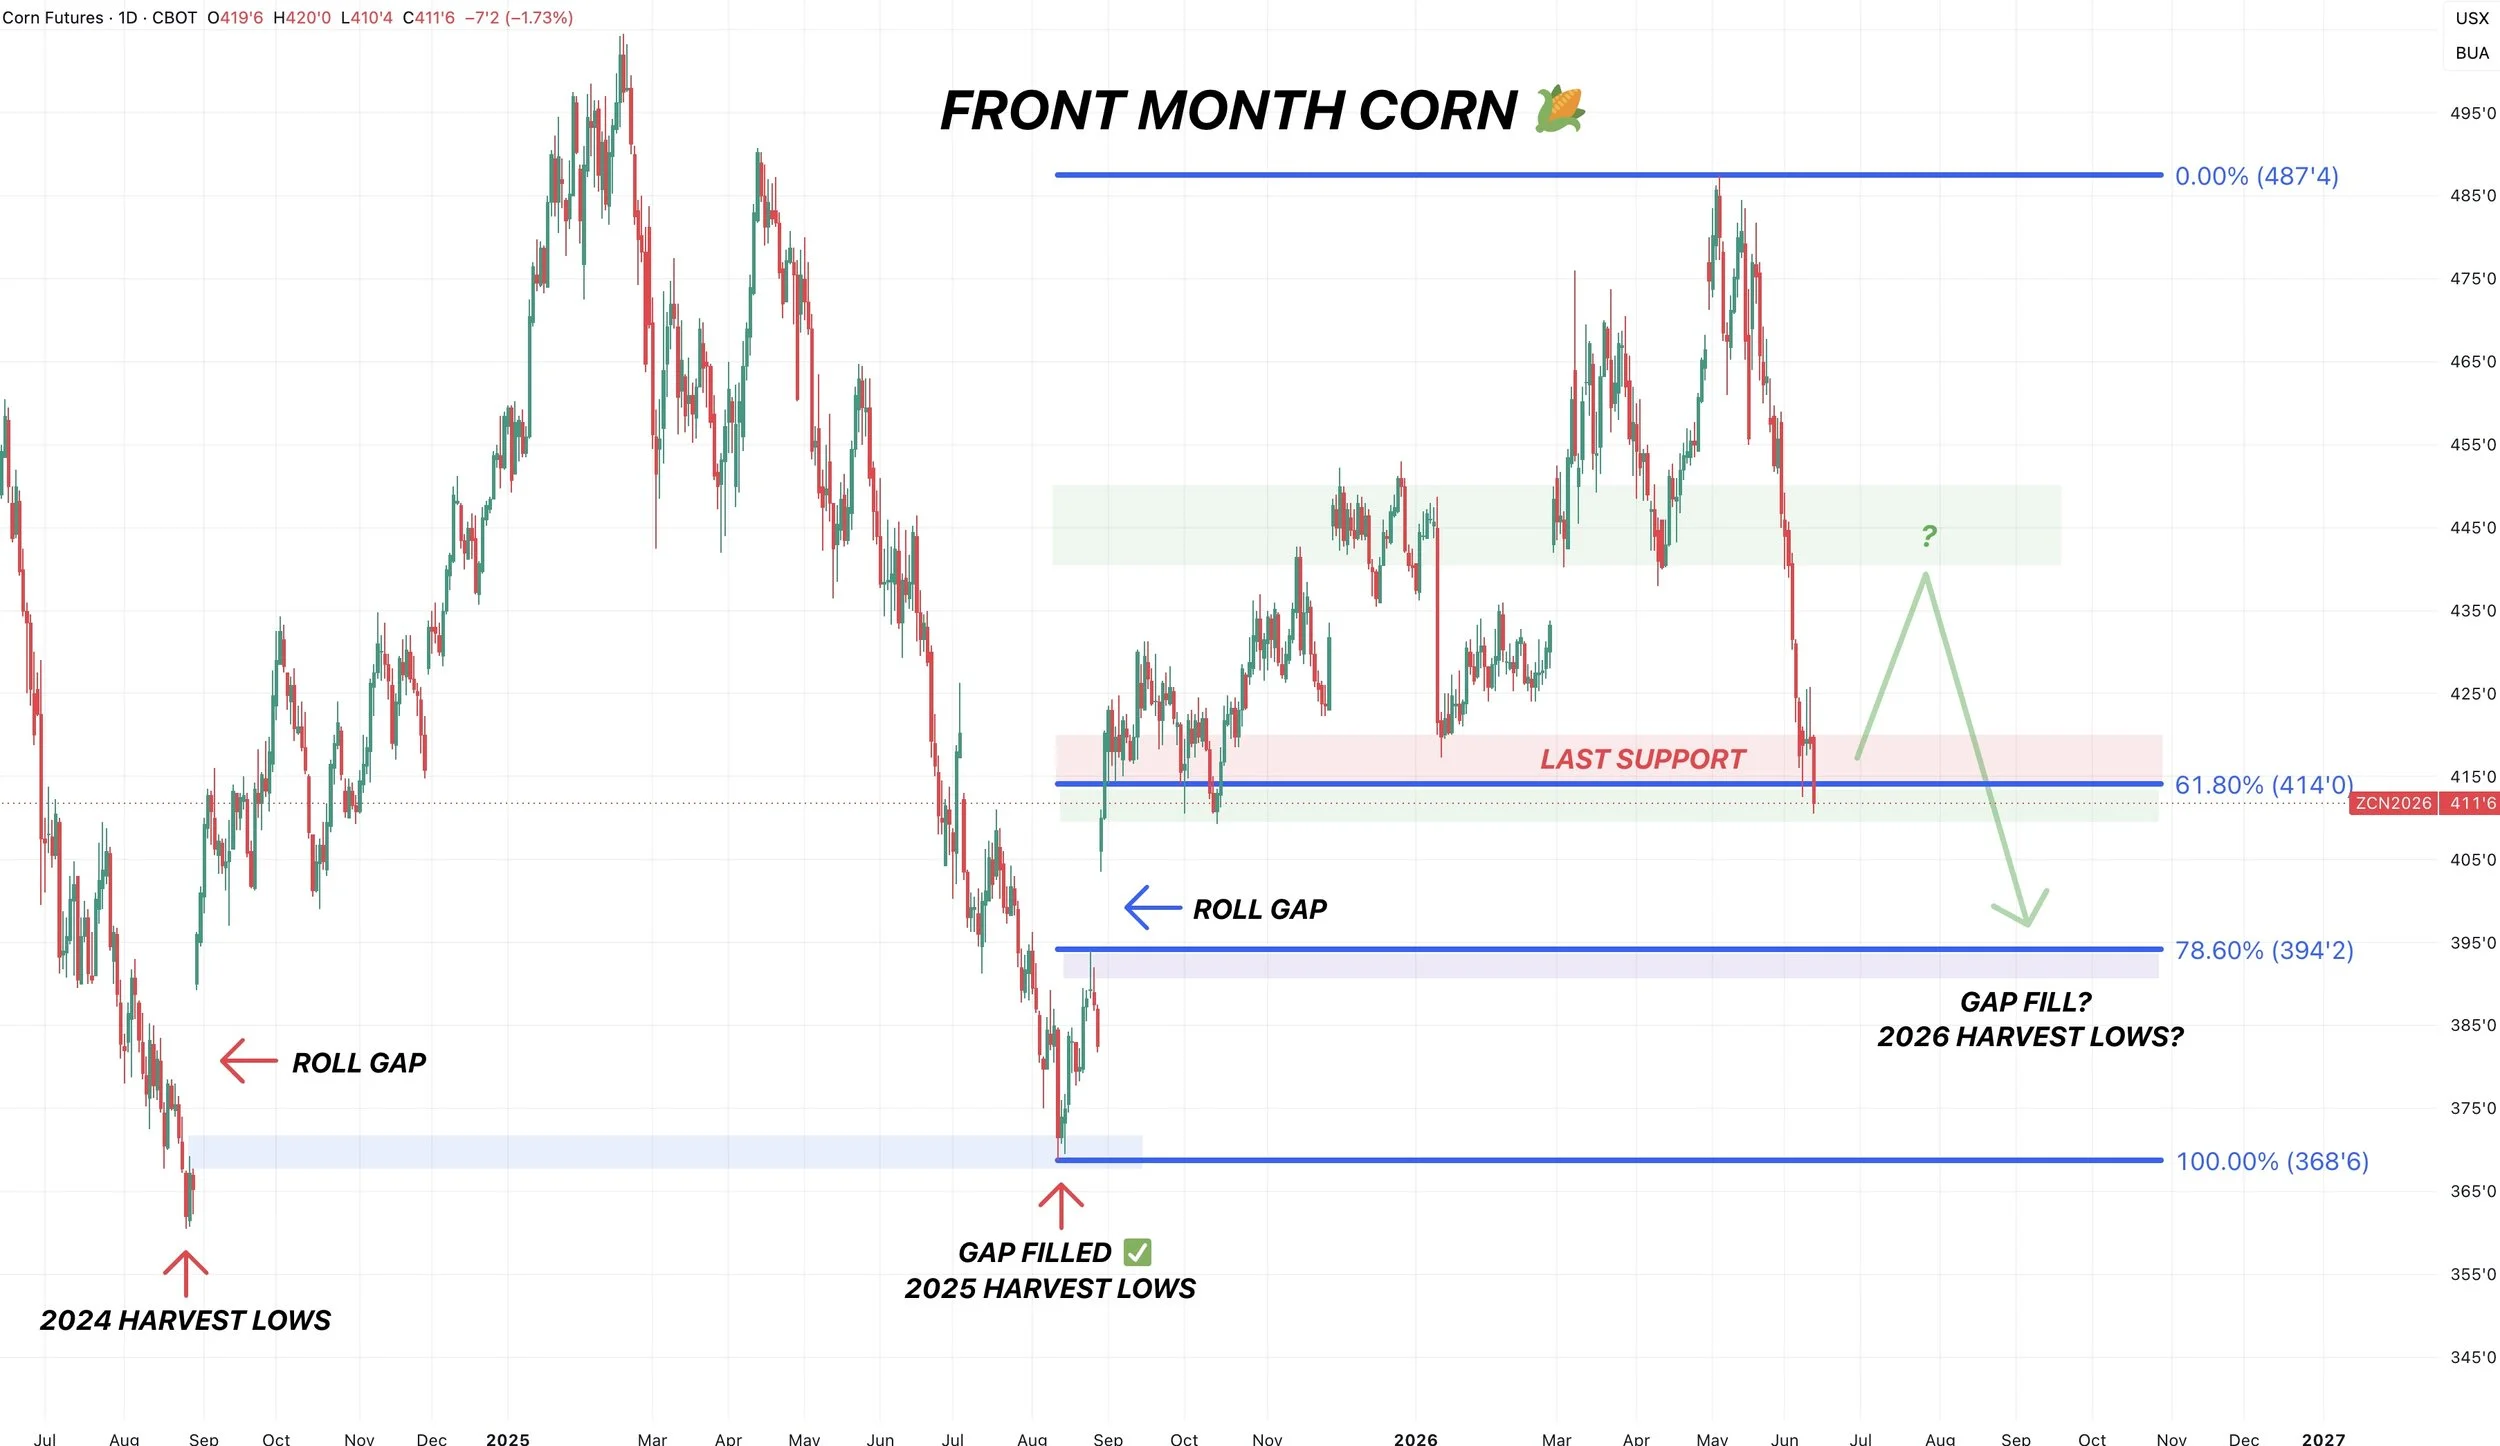
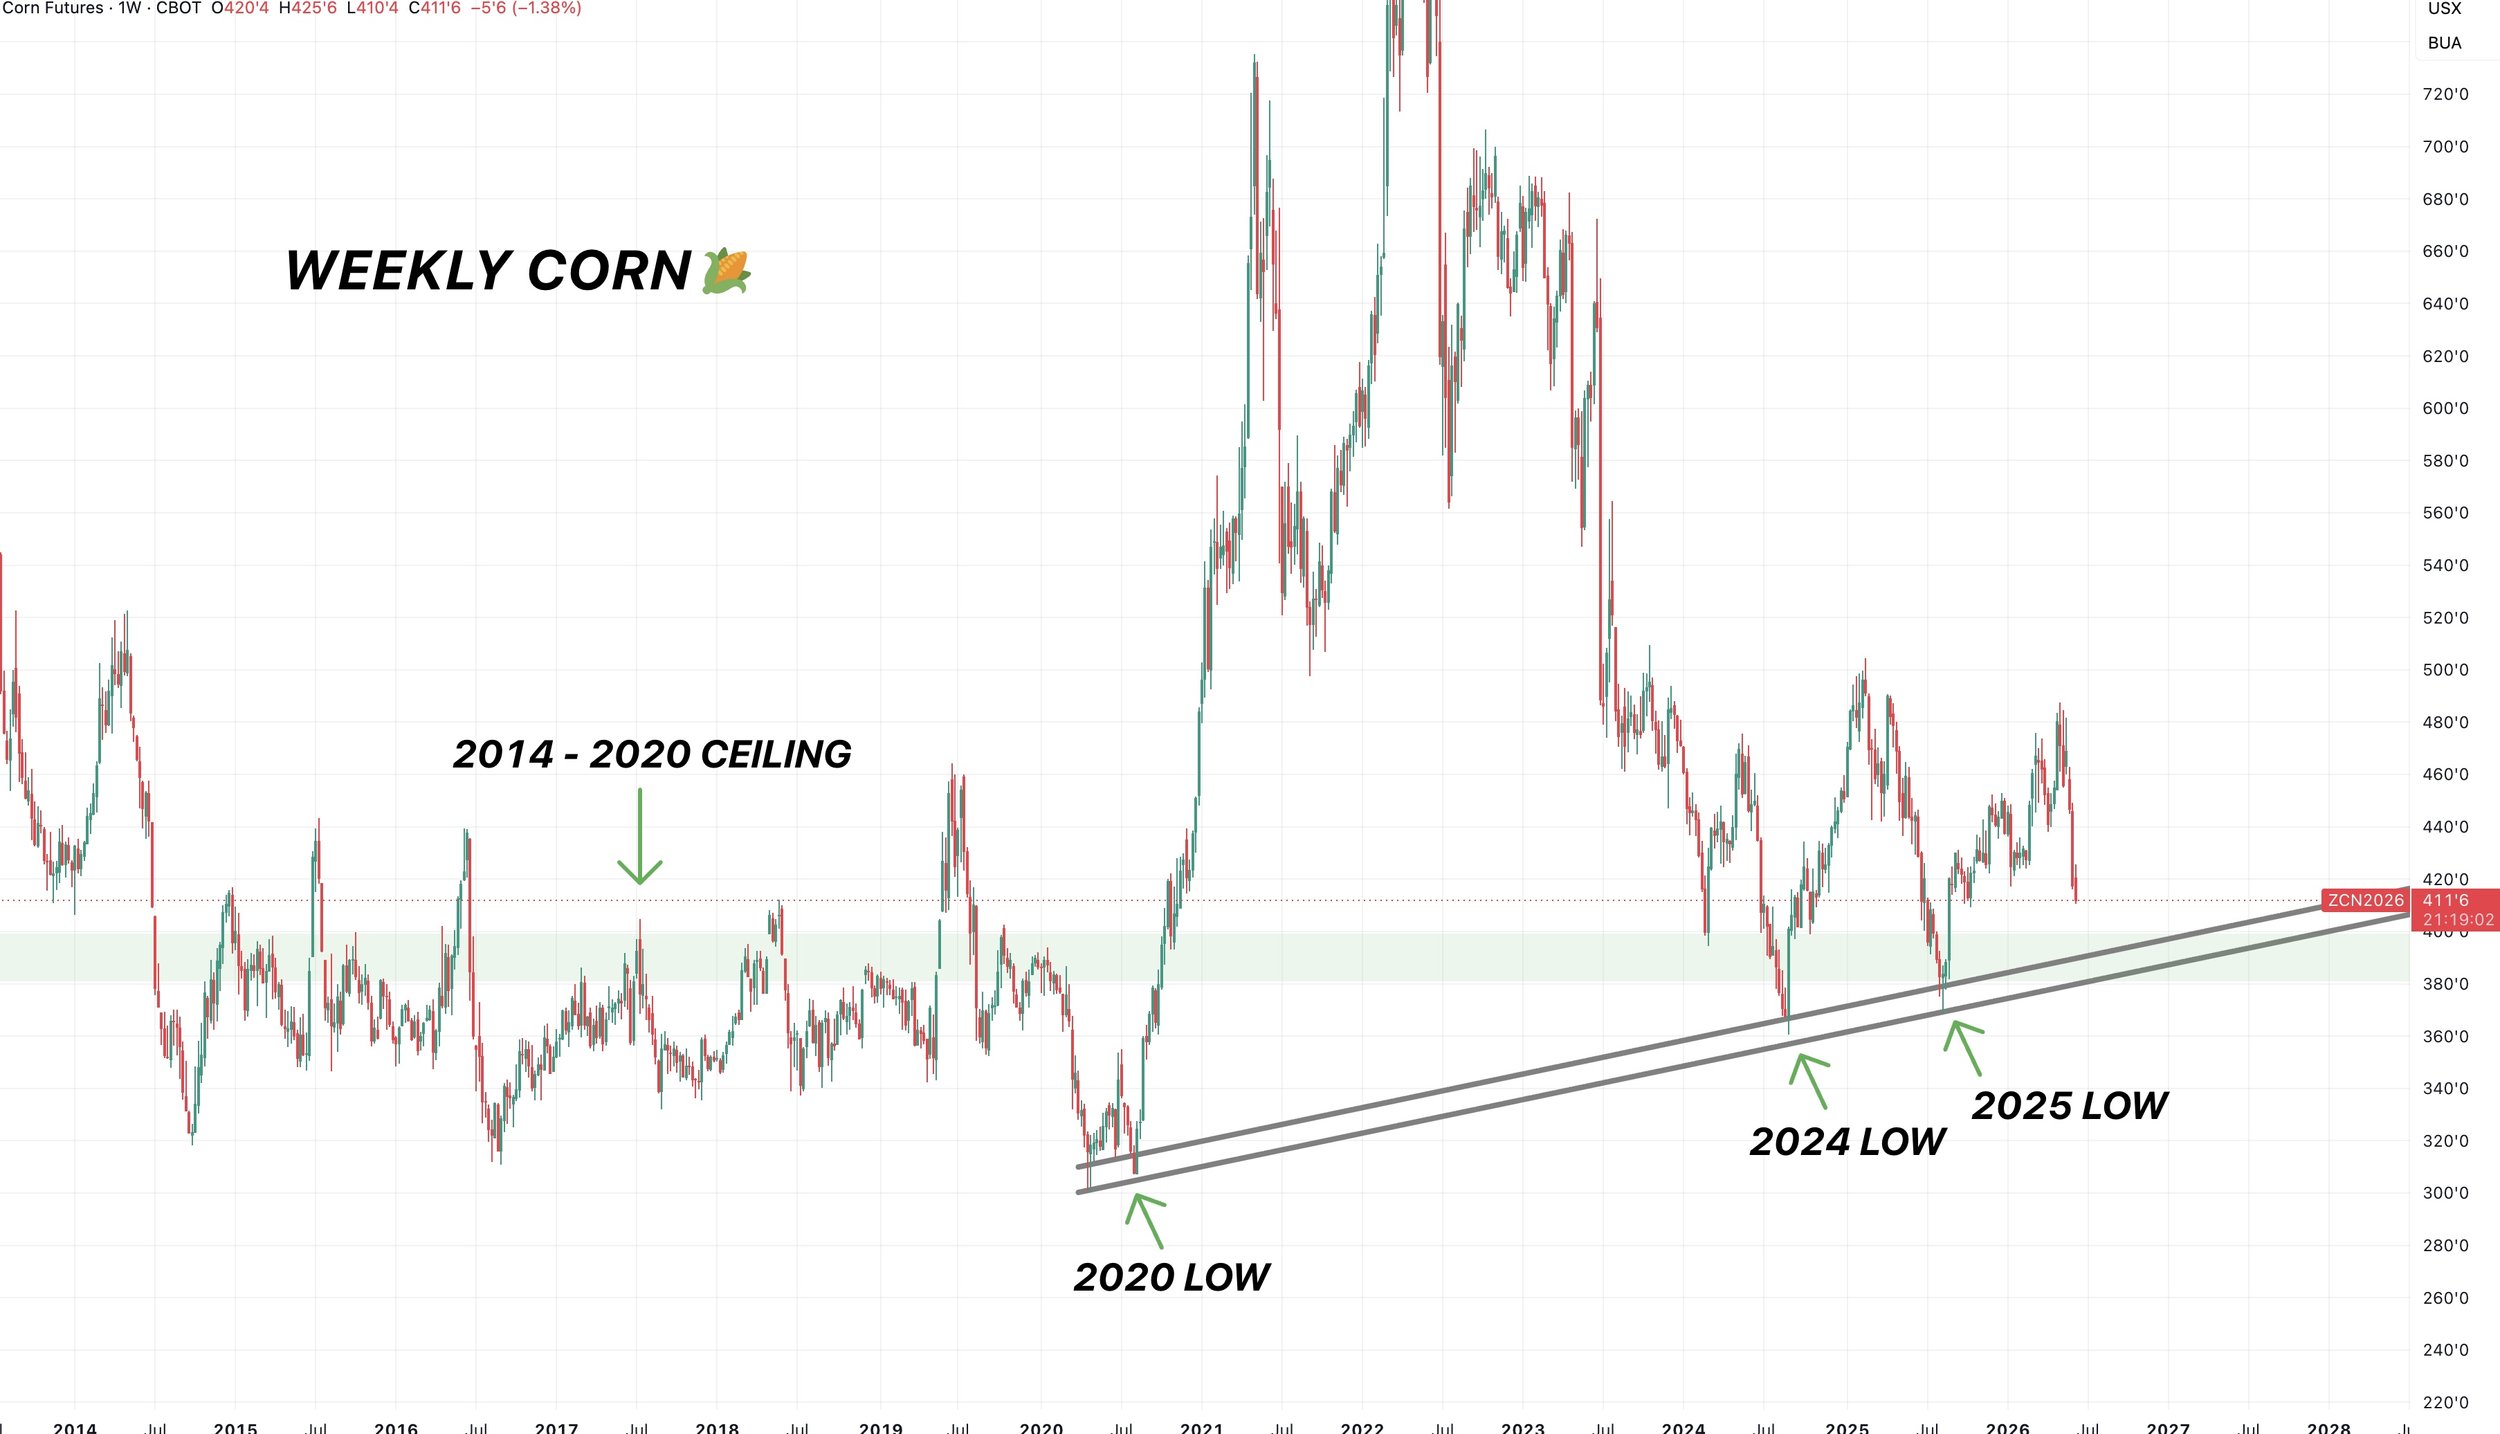
That same area would be trendline support around $3.80 to $3.90
Our ceiling from 2014 to 2020 was also around $4.00
So I think that $3.80 to $4.00 range is roughly going to be our long term floor.
I have a hard time seeing us getting lower than last year.
Soybeans
The USDA didn’t provide anything new for bulls or bears to chew on.
They did however once again lower the old crop exports, so that has to make you wonder if they continue to drop them. Given that our exports are behind.
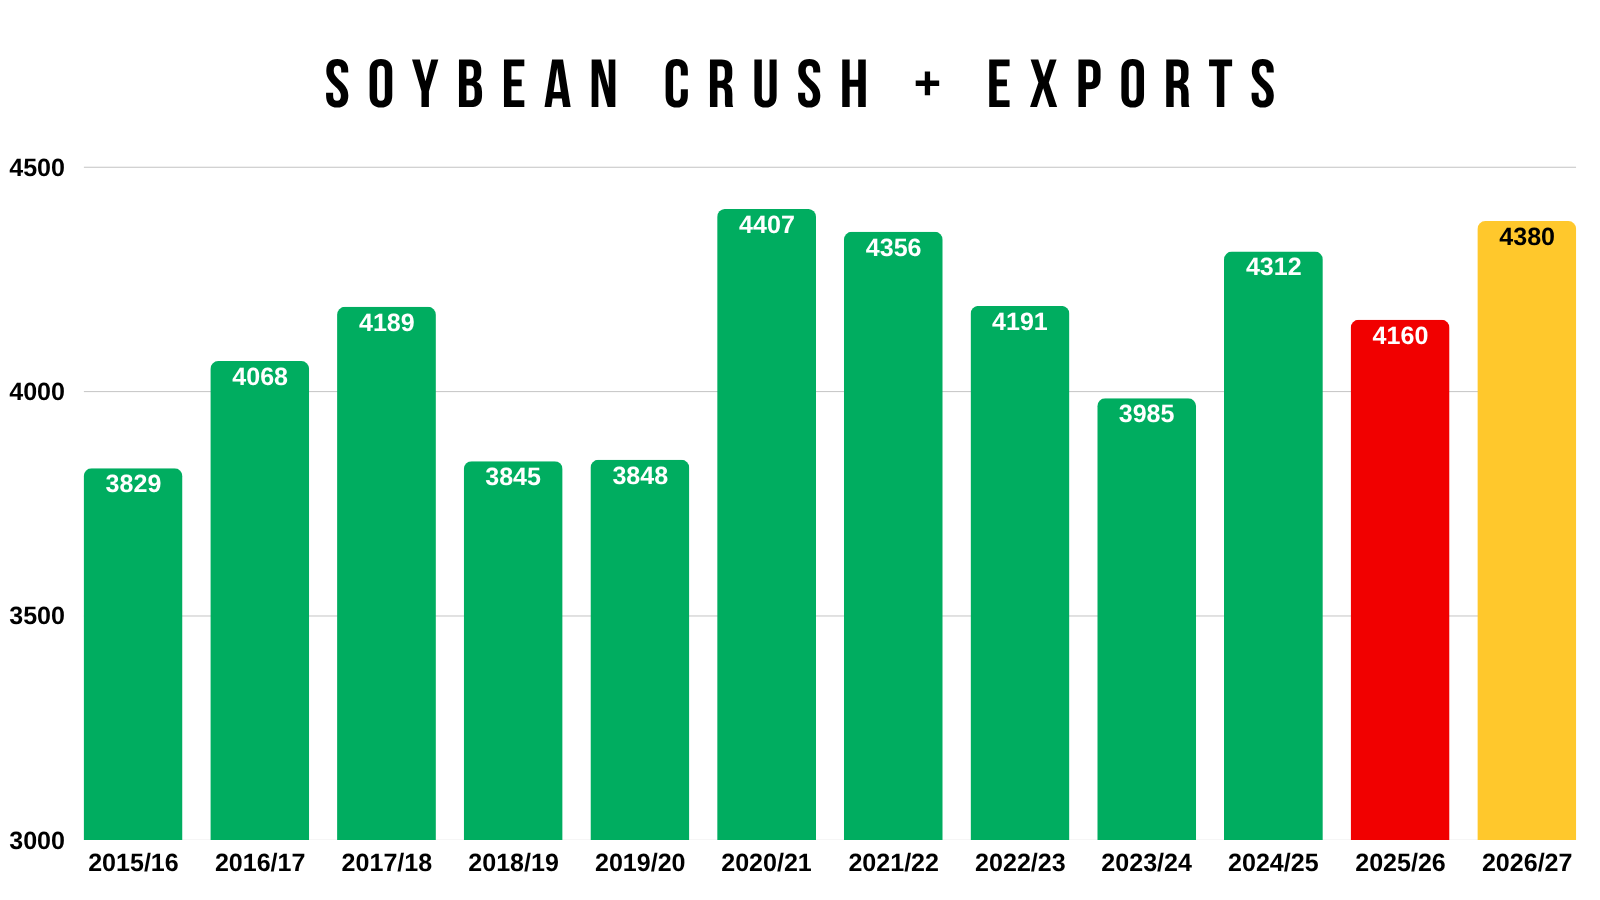
But crush demand has been phenomenal.
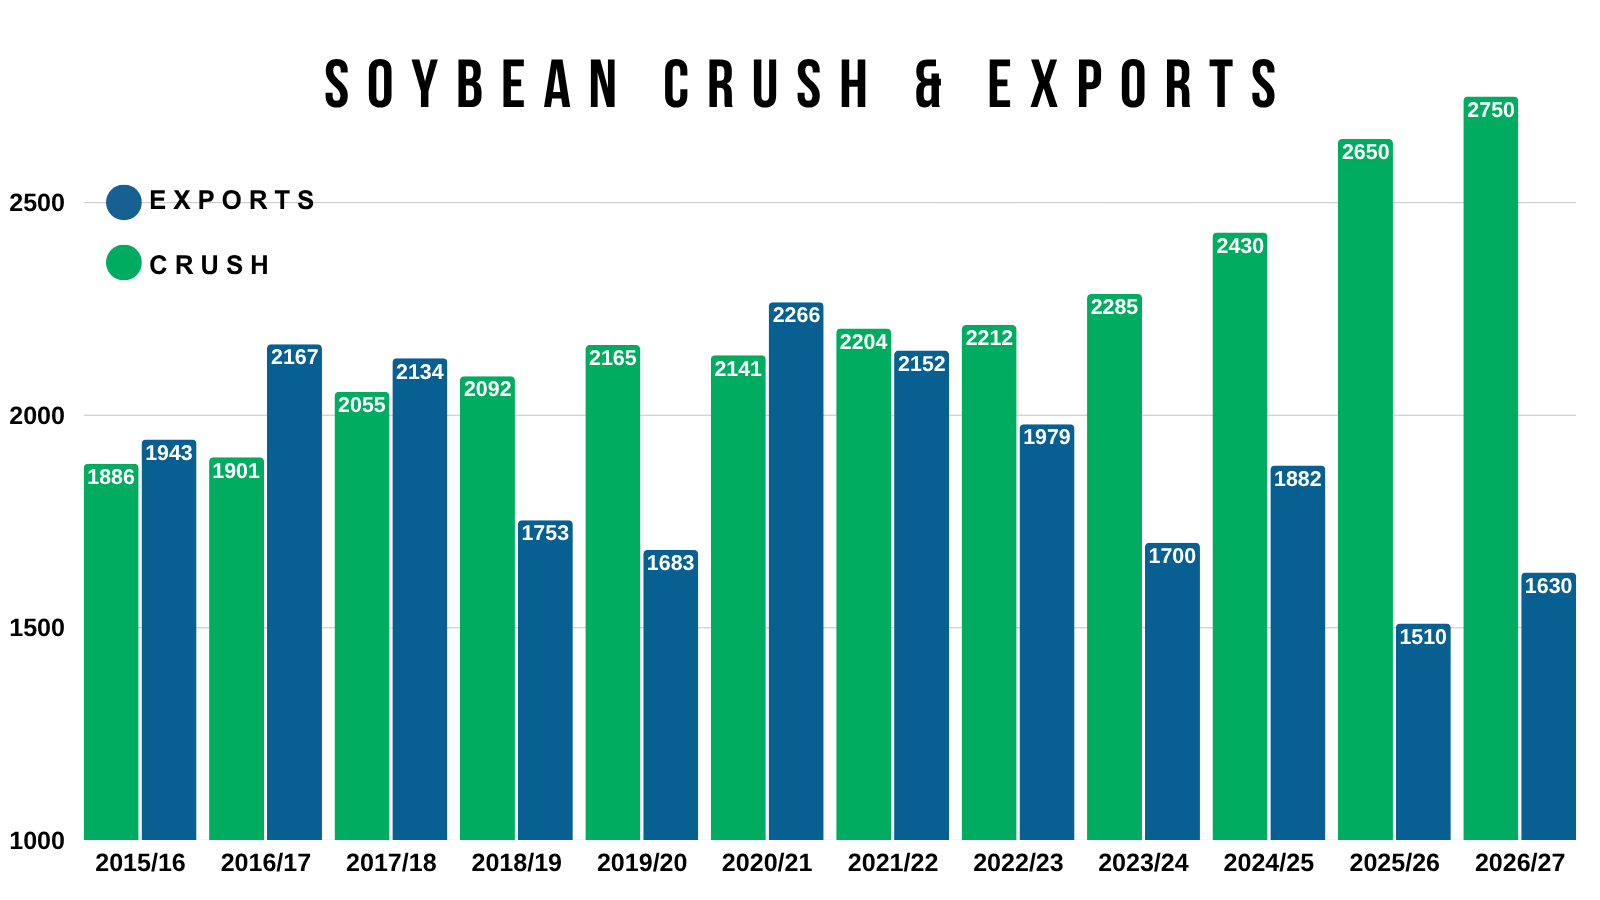
Crush demand has actually been making up for the awful exports.
Because when you combine our crush demand and export demand, it's almost the best it's ever been despite the poor exports.
If corn acres are too high, it would make sense for soybean acres to be too low.
How does more acres change the balance sheet?
Let's just say acres get bumped up by 1 million.
Without changing anything else, that raises your carryout from 310 to 360 million.
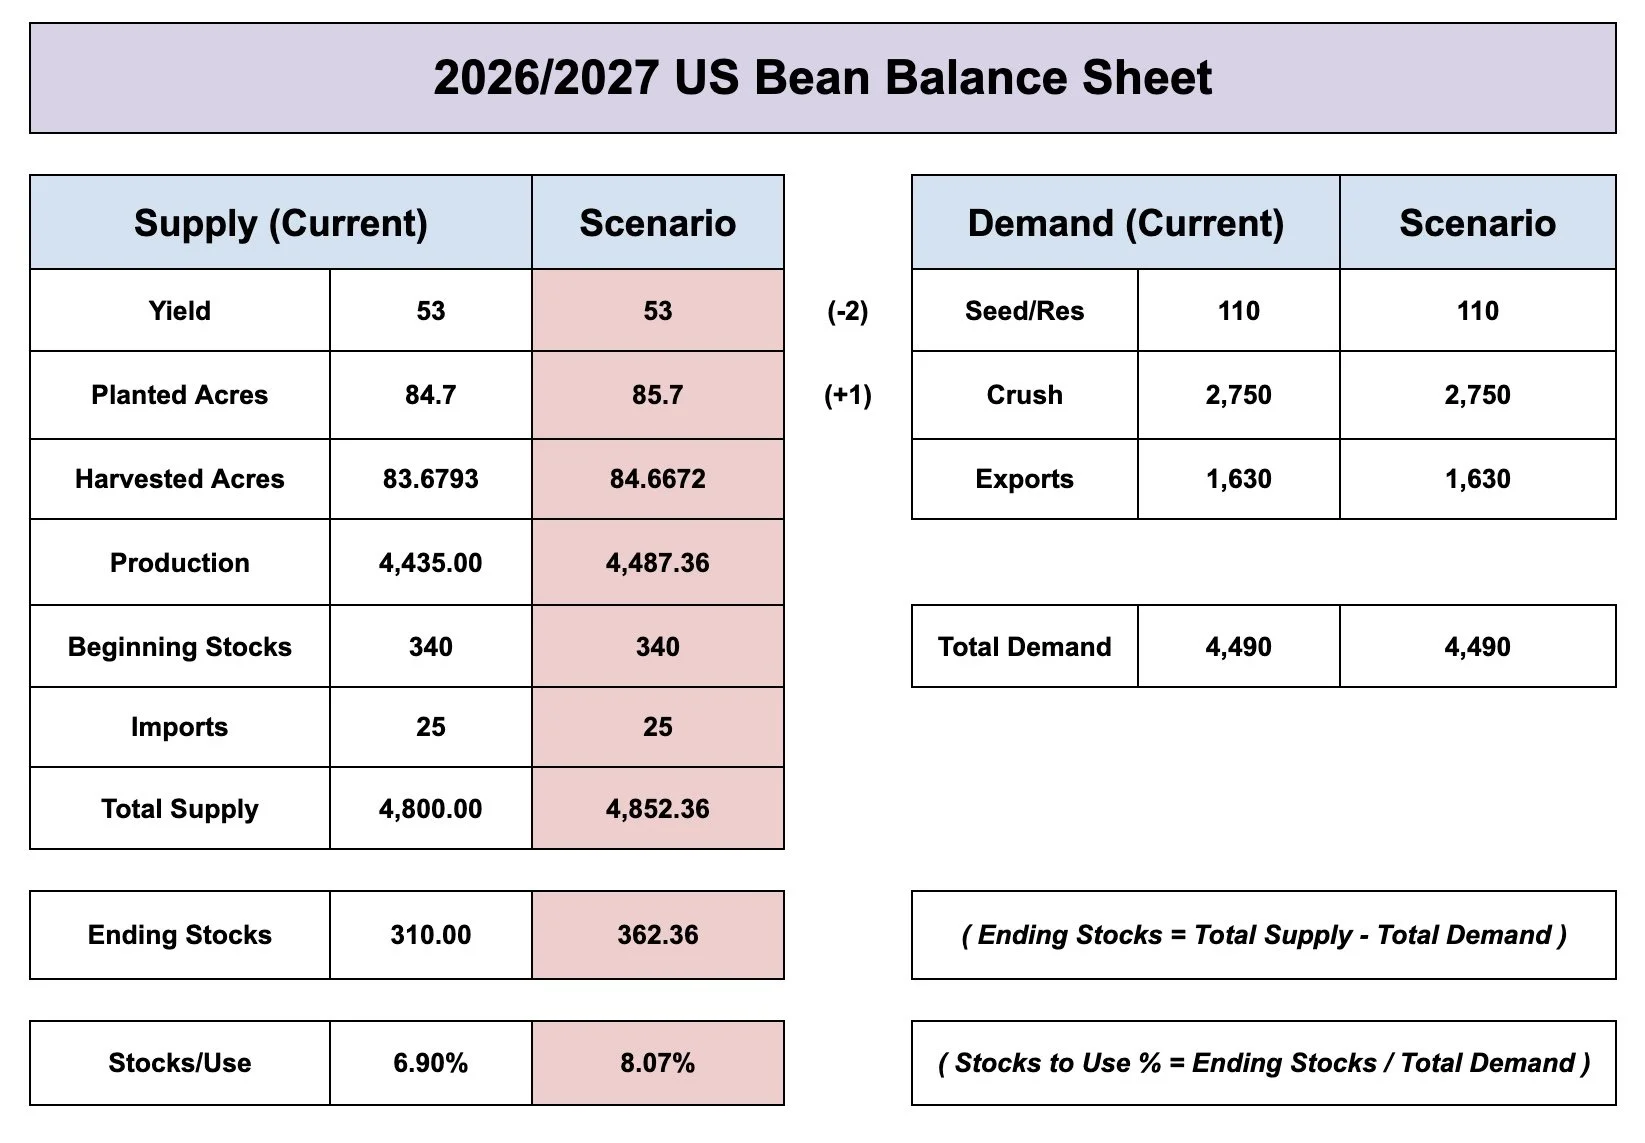
Which wouldn’t be bullish, but it's right about on par with where we've been the last several years in a row now.
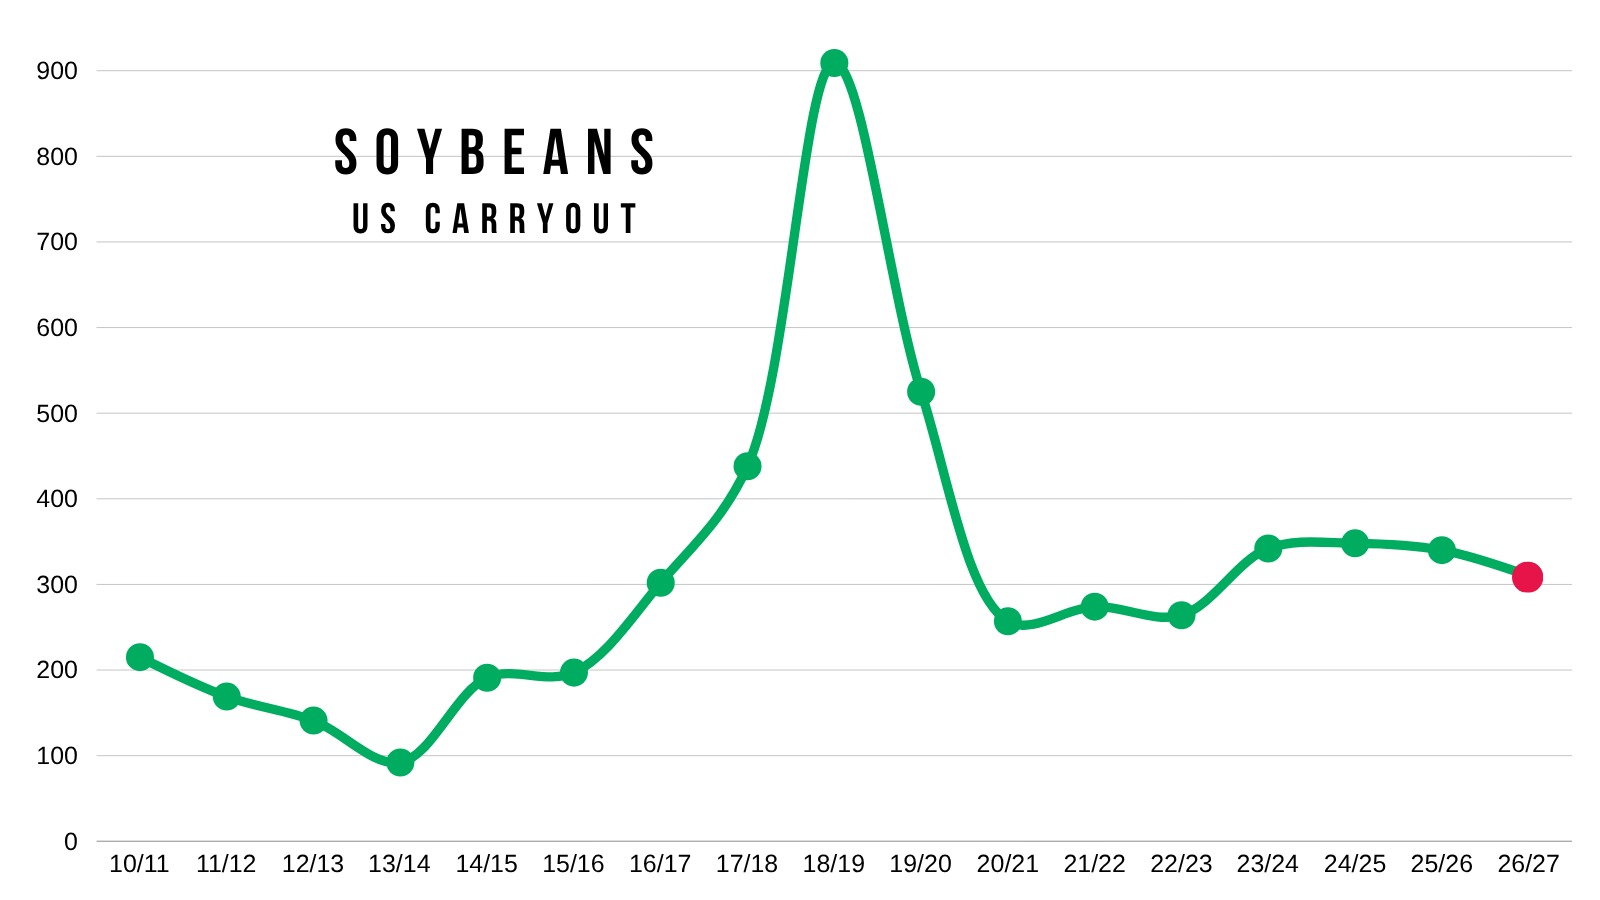
But that figure also uses a 53 bpa yield.
What if yield isn’t another record?
Let's just say acres come up 1 million, while at the same time our yield drops to 51 bpa instead.
That creates a very tight situation for soybeans.
Who knows where yield will come in. But it can have a massive impact on things.
So there really isn’t this giant amount of wiggle room. Which offers potential down the road.
It doesn’t have to happen, but that's your path to a tight situation in beans. All it would take is a sub par yield.
The issue is similar to corn. Right now, aside from being oversold, we fundamentally don’t have anything screaming prices need to go higher right now.
China will be buying new crop soybeans. The probelm is that it doesn’t have to happen as soon as we'd like. And the amount is already known, unlike in corn.
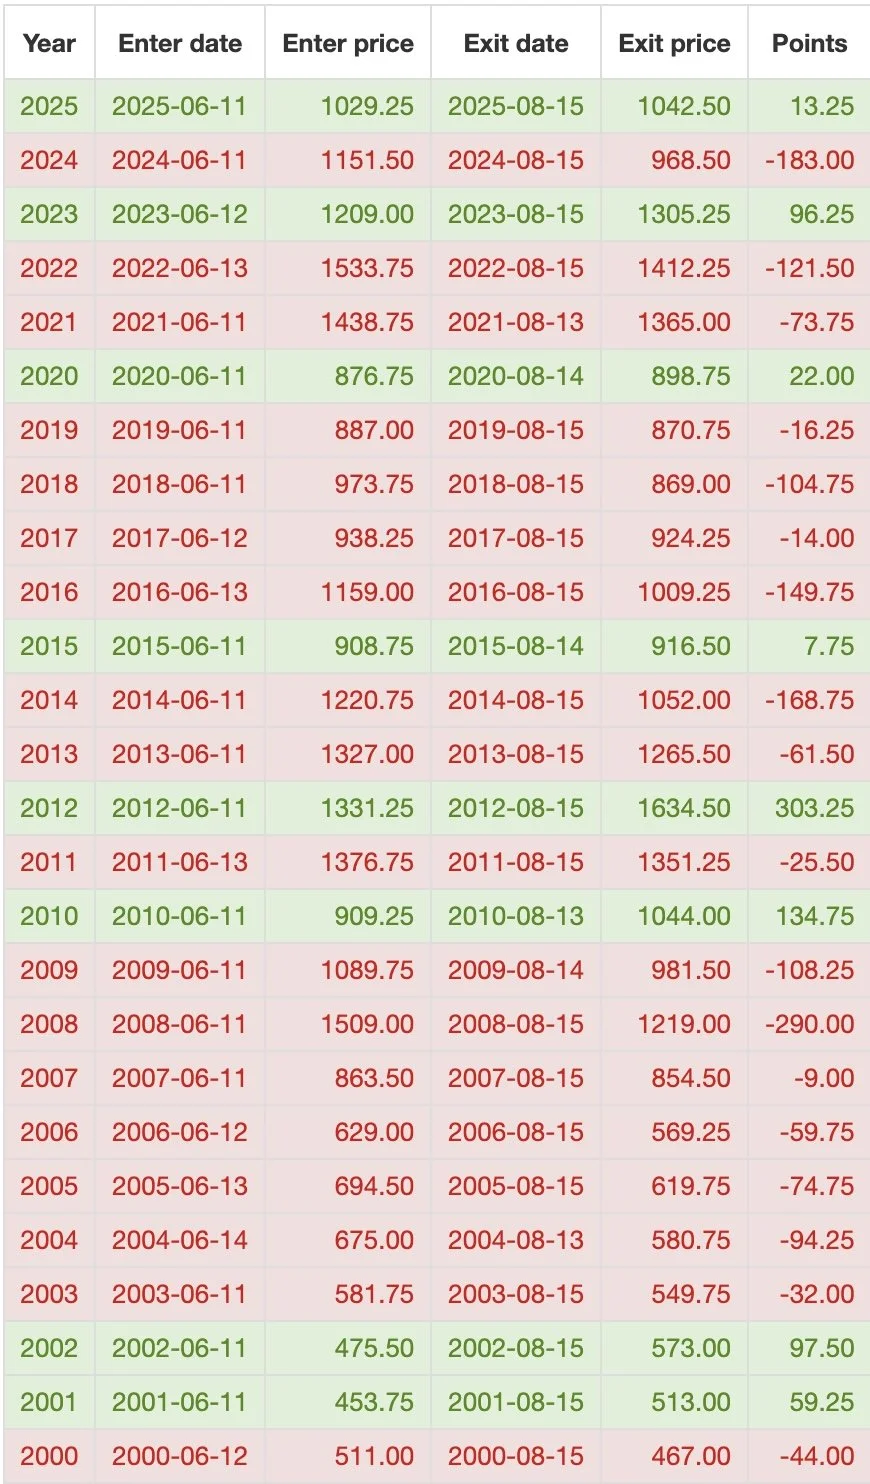
Seasonals aren’t our friend here either. As we are typically lower by August 70% of the time. Although it did not happen last year.
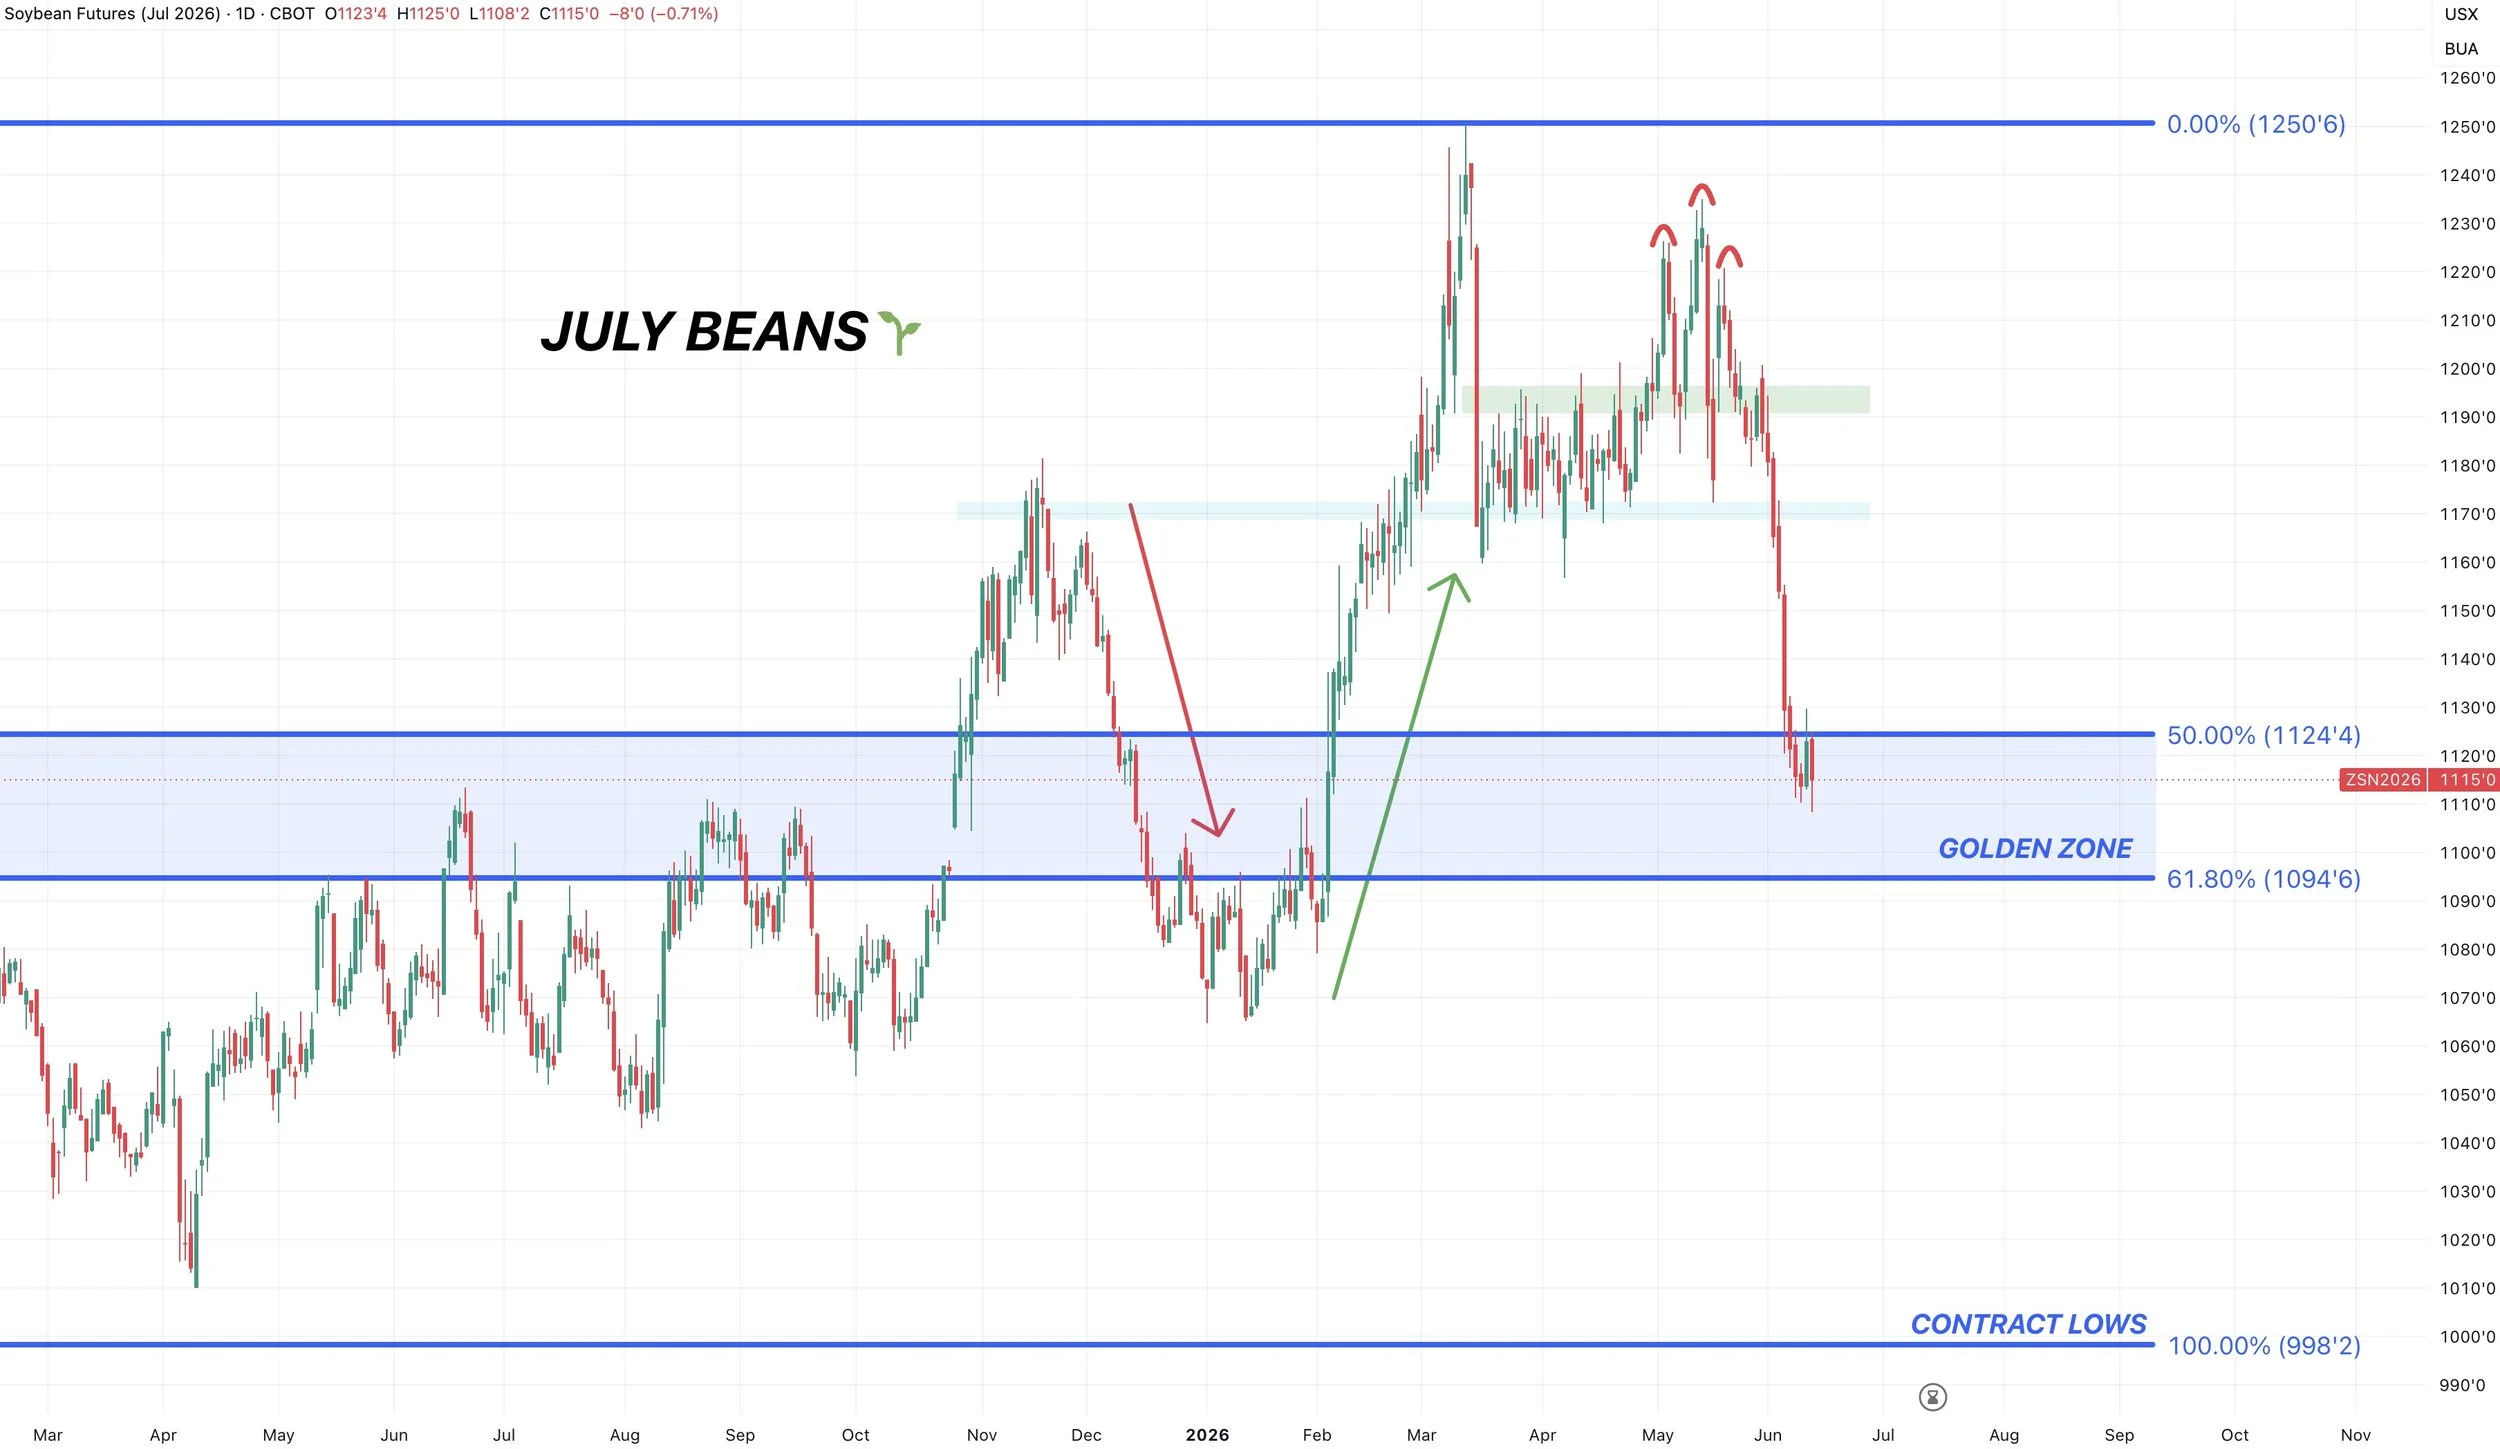
July Beans Chart:
Bulls focus right now is holding that $10.95 level.
That gives back 61.8% of the entire rally from contract lows.
If you lose that level, it would be a bad sign.
That same area is prior resistance from last year.
Nov Beans Chart:
Bulls simply want to hold those March lows. Which is also resistance from last fall.
If we break below that level, there is plenty of air to the downside.

Wheat
The wheat market was the only one that received a material change today in the report.
We saw the USDA adjust heavily in May, which resulted in that limit up day.
They once again lowered yield in this report, but the bigger question is going to be abandonment acres. Do we see even more later on? As that can make a big impact.
Currently the big production countries such as Russia aren’t having any issues, and there is an ample amount of supply globally for now.
Seasonally, we tend to struggle here as I've talked about many times.
By August 15th, we've been lower 12 of 13 years.
So if we get a good bounce here, keep that in mind. As odds favor it not lasting.
Short term we lack a catalyst. But like corn, I think there will still be a story over the next year or so given the fertilizer and inflation situation.
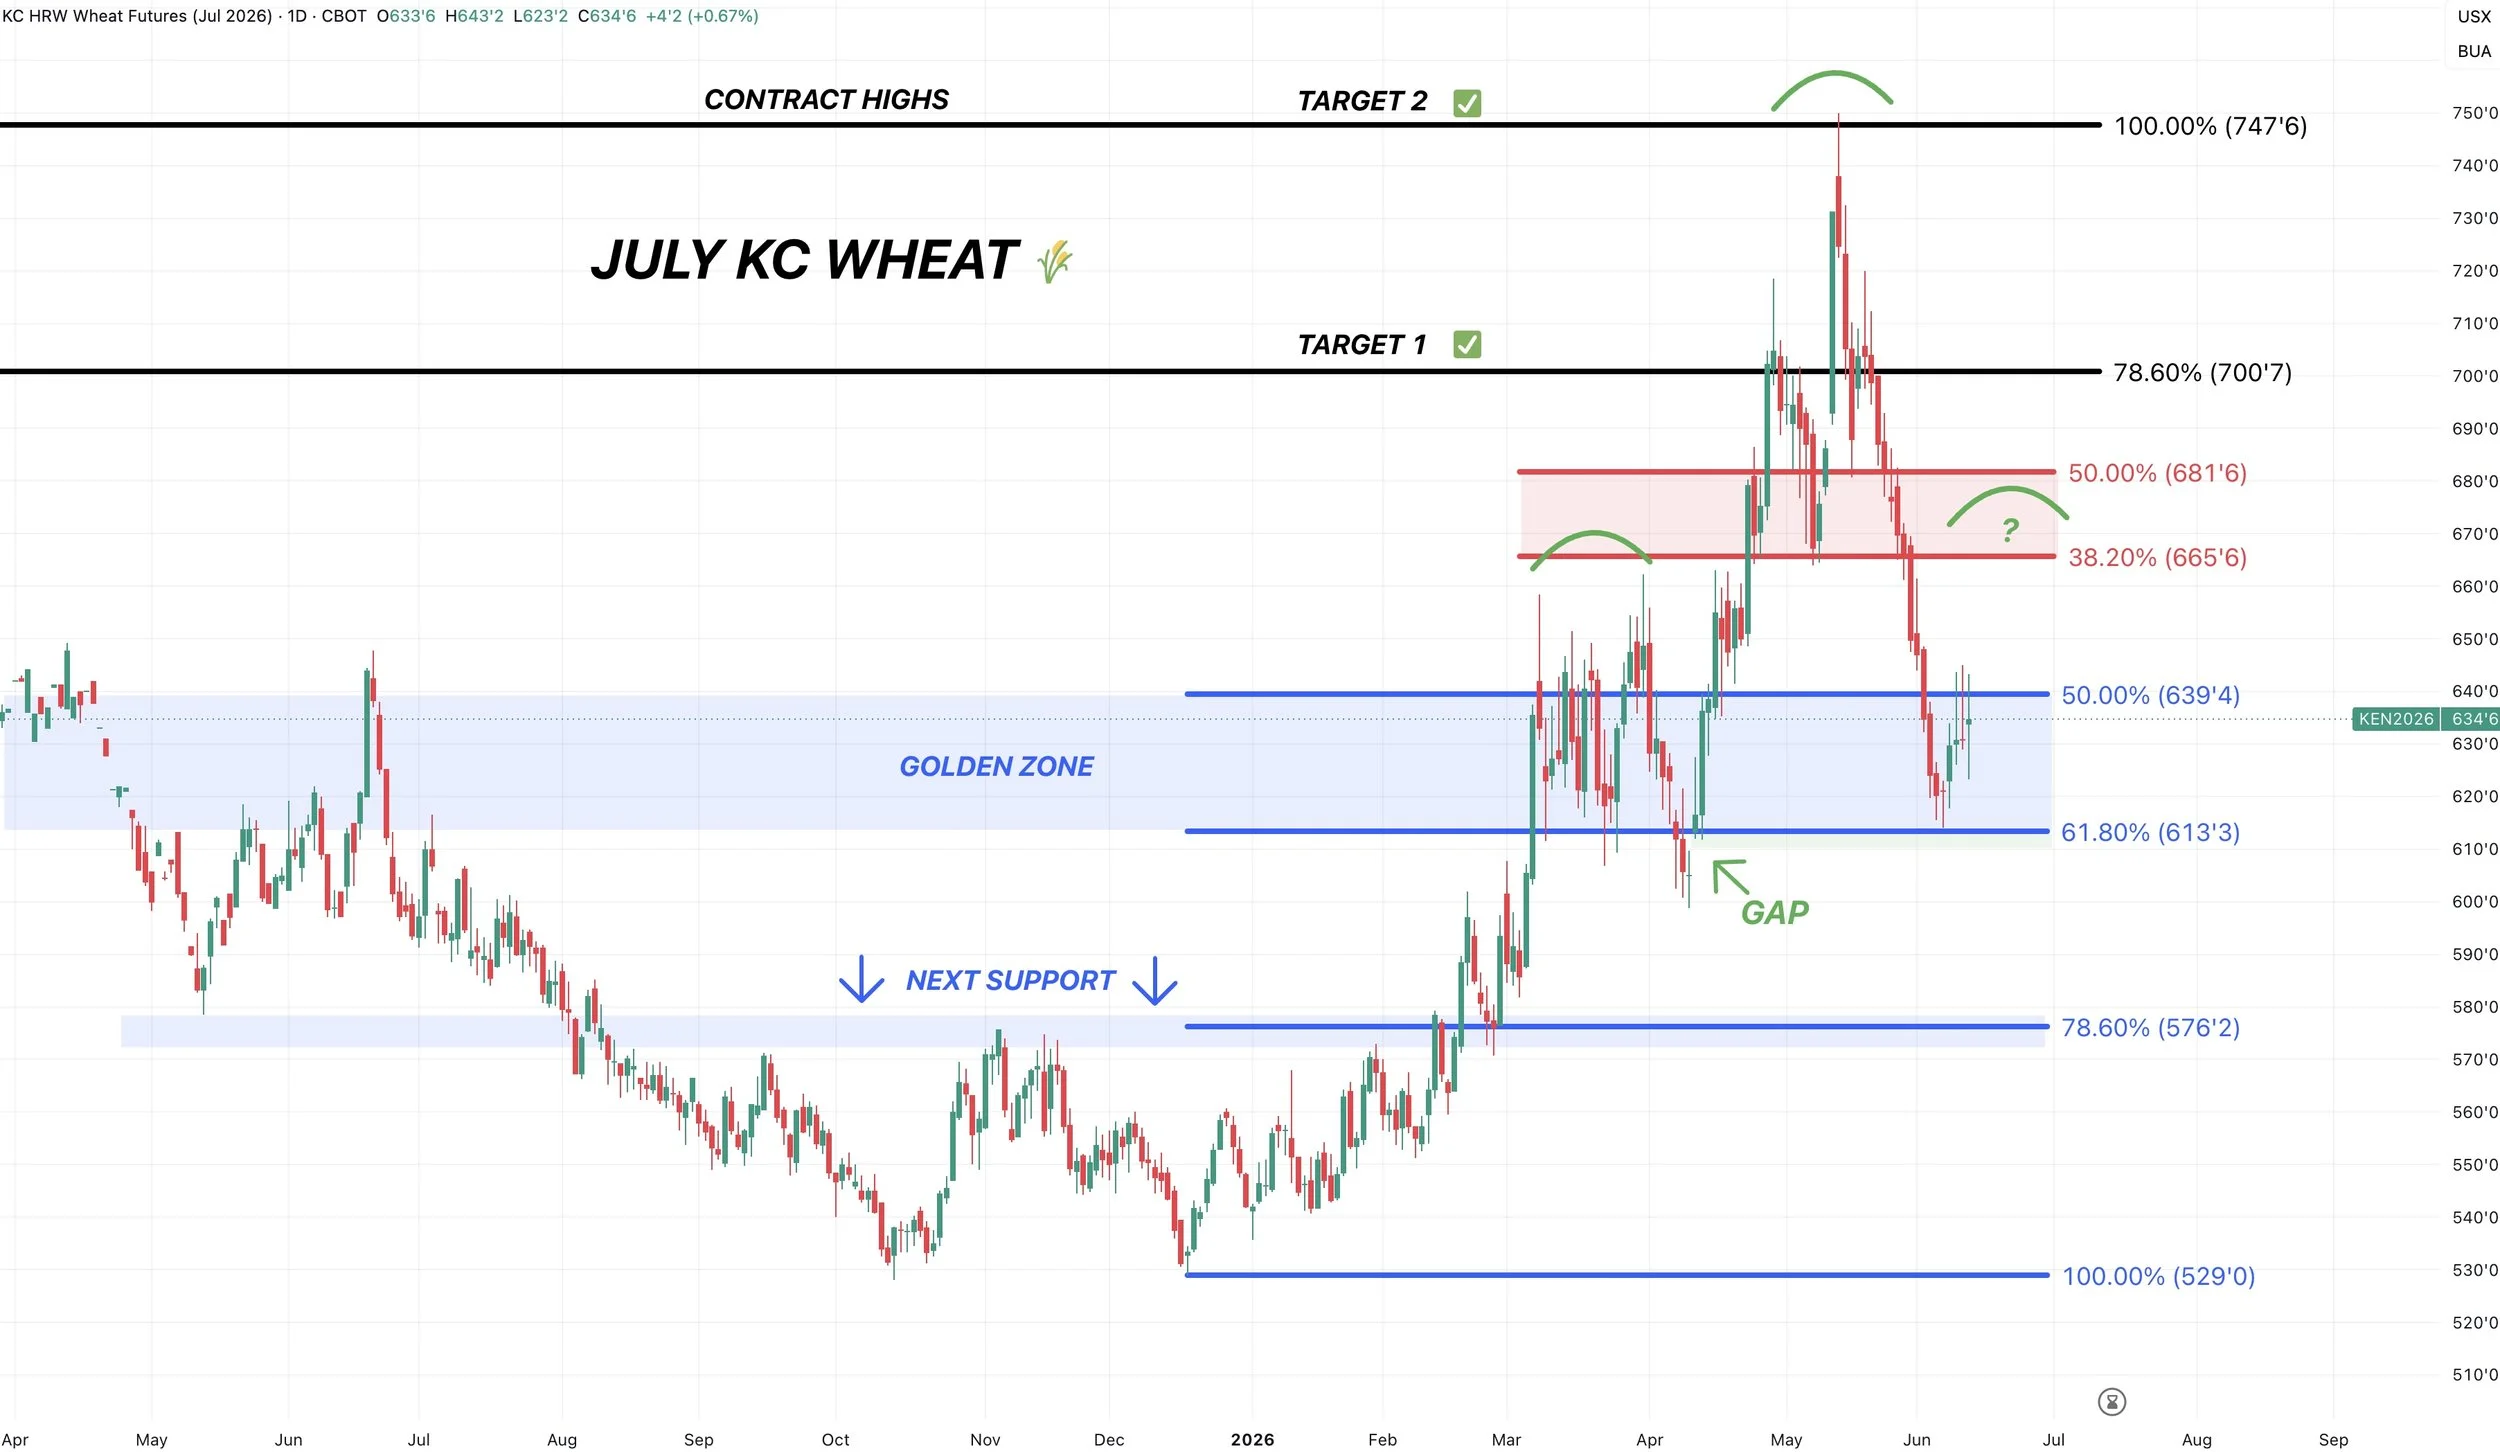
July KC Chart:
July KC is the chart that's providing the most optimism here.
We held key support. Exactly where we needed to.
Bouncing off that 61.8% retracement from contract highs to contract lows. The most common level.
So finding some life here makes sense.
If we can crawl back 38.2% to 50% of this sell off, it could potentially set up a head and shoulders pattern. So that is going to an area to watch if we actually get a real bounce here.
Normally the golden zone is more common (50% to 61.8%) but given the size of the sell off, the lower set of level is more reasonable.
If we can’t bounce, and we fail to hold this 61.8% level at $6.13 we probably fall down to $5.75. Which is the next level of support and next retracement level.
As there is simply zero support until then.
Cattle
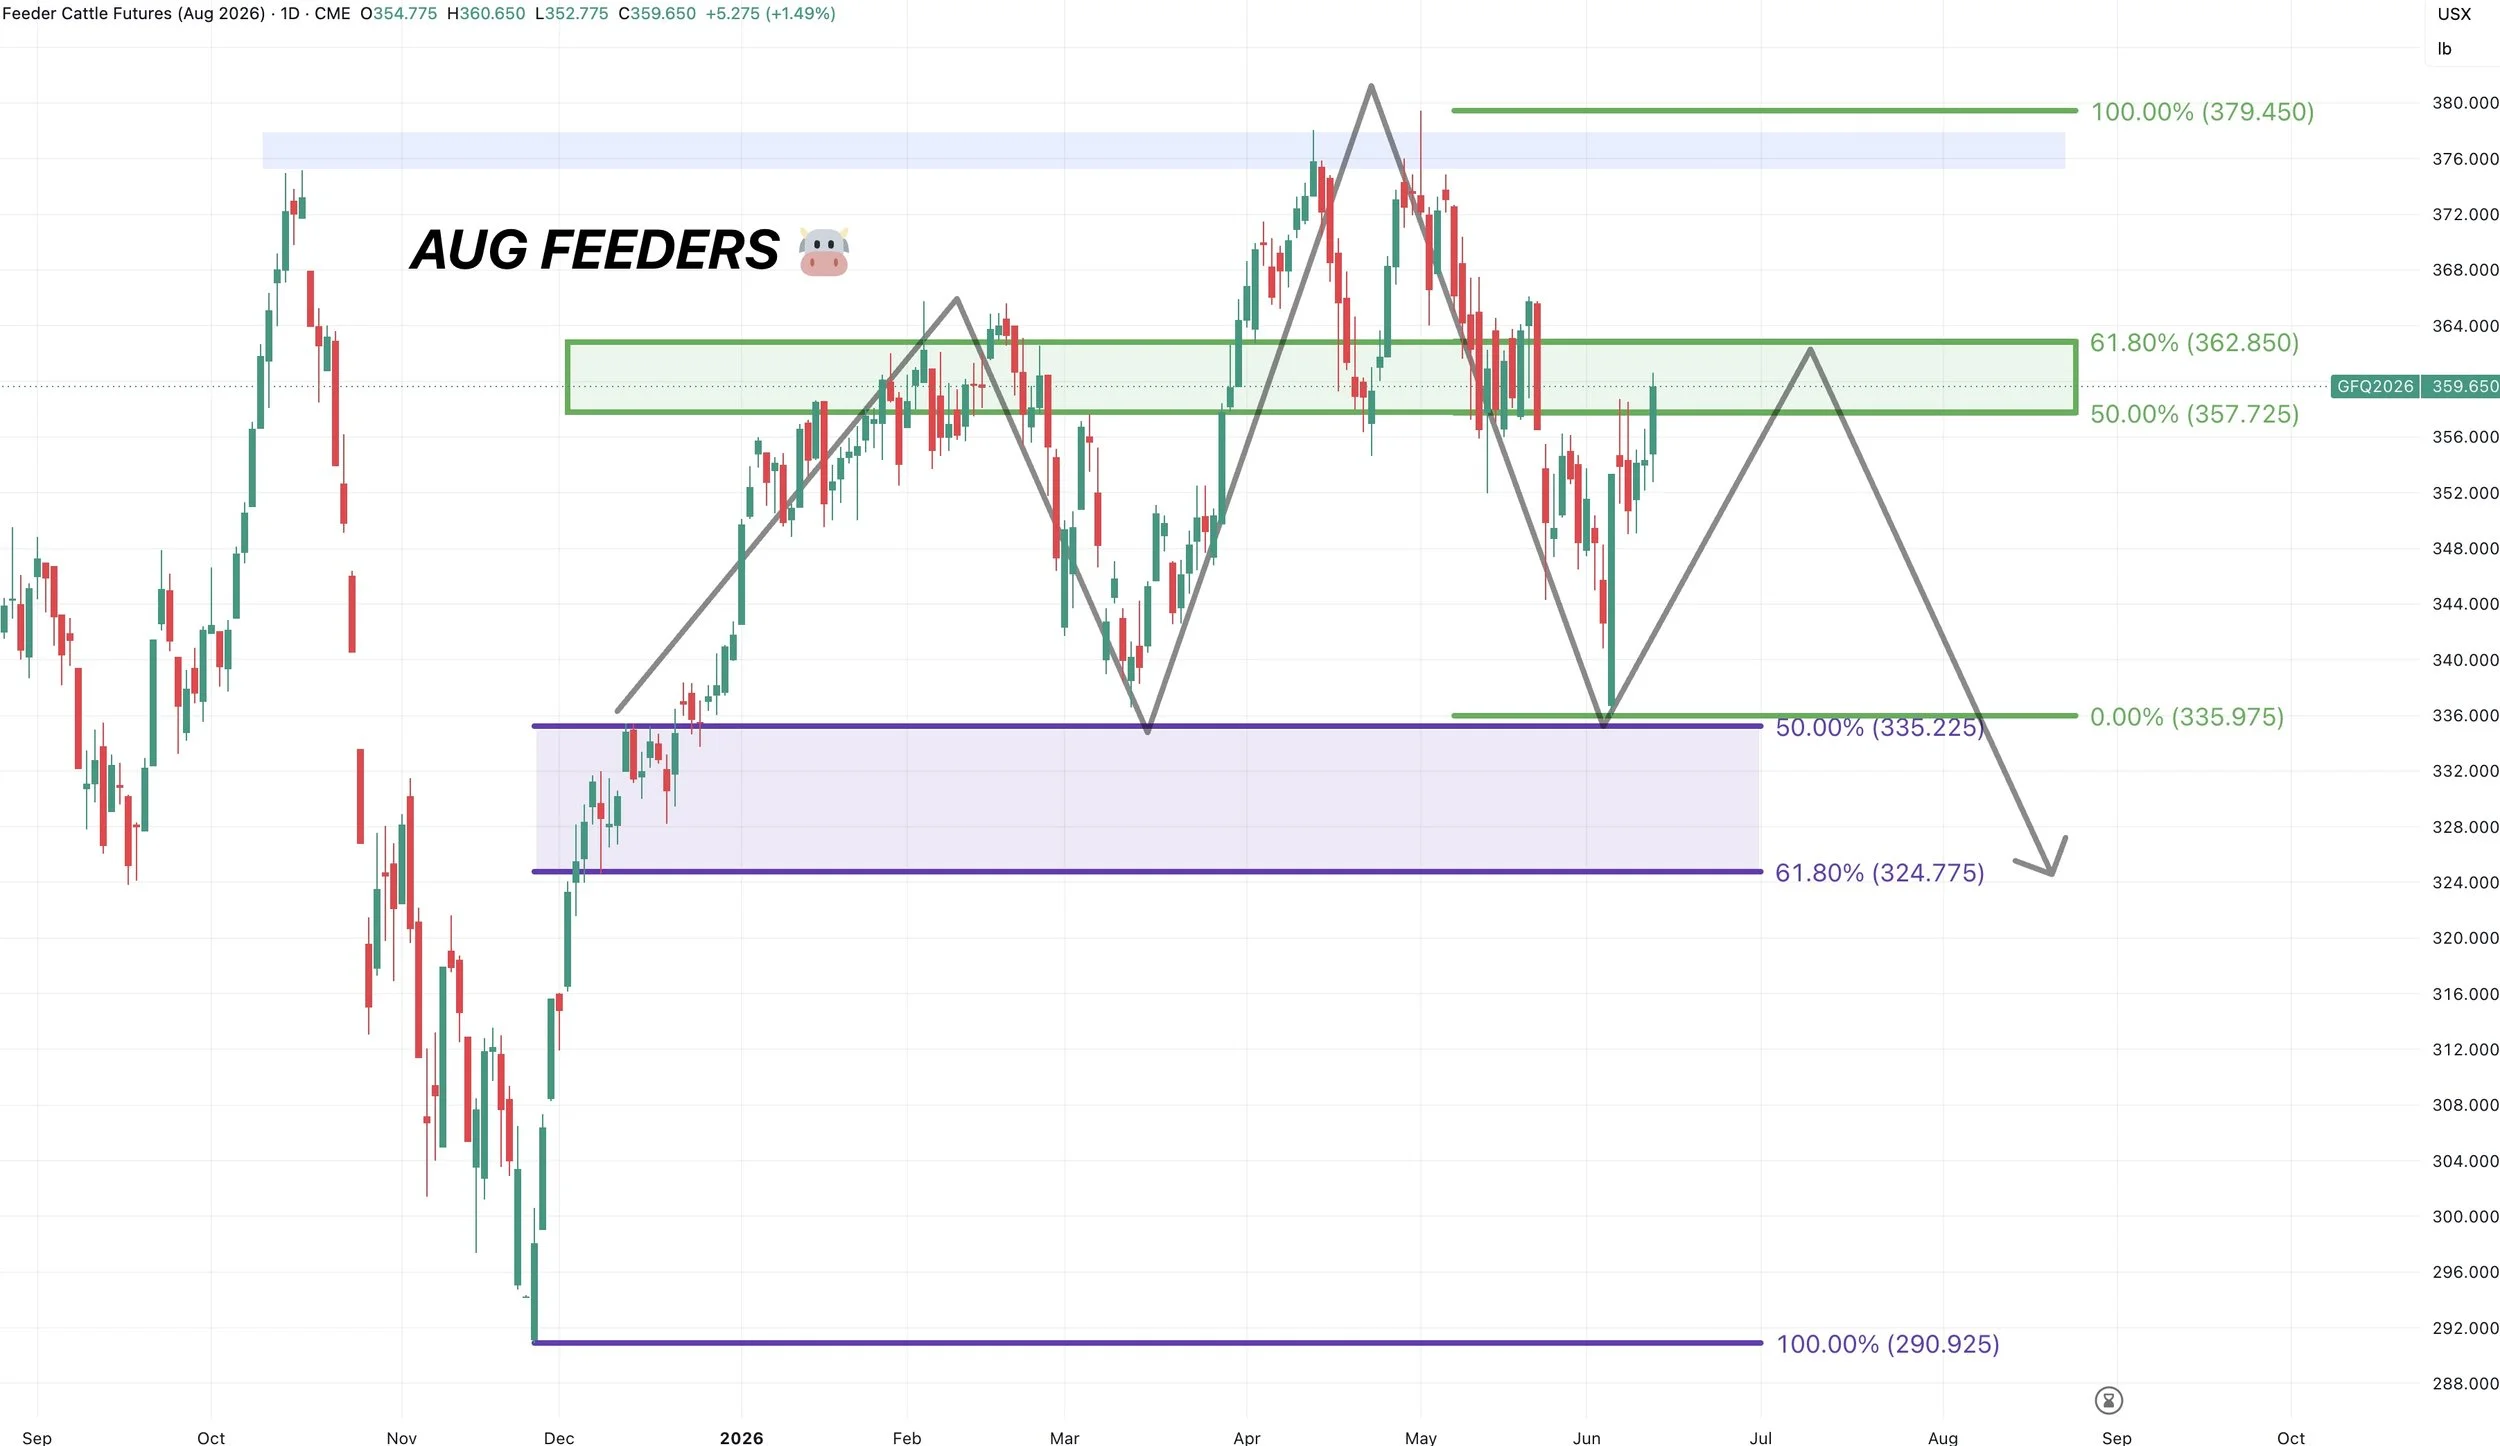
Aug Feeders Chart:
This is the area we want to defend here.
We're firmly in the golden zone. As we've reclaimed 50% to 61.8% of the sell off.
This is the most common spot for a bounce to fail.
If we break above the box, then it suggests we can go challenge the highs. But until we do so, this is viewed as a relief bounce.
I am still watching for this potential head and shoulders pattern as well. As the left shoulder lines right up with the golden zone.
August Live Chart:
Also crawling into the golden zone.
This bounce is viewed as a relief bounce unless we break above that box.
The warning sign is the recent lows. Which gave back 61.8% of the rally from March.
If we break below that level it wouldn’t be a good sign, and open the door lower.

Want to Talk?
Our phones are open 24/7 for you guys if you ever need anything or want to discuss your operation.
Jeremey & Office: (806)484-1214
Sebastian: (605)280-1186
Email: sfrost@dailymarketminute.com
Hedge Account
Interested in a hedge account? Use the link below to set up an account or give us a call.
Recent Signals
May 27th, 2026: 🌽
Corn conditional buy signal.
CLICK HERE TO VIEW
May 13th, 2026: 🌱
Soybean sell signal & hedge alert.
CLICK HERE TO VIEW
April 28th, 2026: 🌾
KC wheat specific signal.
CLICK HERE TO VIEW
April 27th, 2026: 🌽
Corn catch up sell signal.
CLICK HERE TO VIEW
April 10th, 2026: 🌽
Corn buy signal.
CLICK HERE TO VIEW
March 19th, 2026: 🌱
New crop soybeans signal & hedge alert.
CLICK HERE TO VIEW
March 9th, 2026: 🌱
Soybeans signal & hedge alert. Sent via text.
CLICK HERE TO VIEW
March 6th, 2026: 🌽 🌾
Corn & wheat sell signal & hedge alert.
CLICK HERE TO VIEW
March 3rd, 2026: 🌽
Old crop & new crop corn sell signal & hedge alert.
CLICK HERE TO VIEW
Feb 26th, 2026: 🌱
Old crop & new crop beans sell signal & hedge alert.
CLICK HERE TO VIEW
Feb 19th, 2026: 🌾
KC wheat sell signal & hedge alert.
CLICK HERE TO VIEW
Feb 6th, 2026: 🌽 🌱
Old crop corn & soybean sell signal & hedge alert.
CLICK HERE TO VIEW
Feb 4th, 2026: 🌱
Soybean sell signal & hedge alert.
CLICK HERE TO VIEW
Nov 17th, 2025: 🌱
Soybean sell signal & hedge alert.